2015 CAHPS ® Child Medicaid Member Satisfaction Survey Executive Summary June 2015 Oklahoma Health Care Authority (Medicaid) This document was developed through funding provided by the grant program outlined under the Catalog of Federal Domestic Assistance Number 93.609 from the U.S. Department of Health and Human Services, Centers for Medicare & Medicaid Services. However, these contents do not necessarily represent the policy or views of the U.S. Department of Health and Human Services, and you should not assume endorsement by the Federal Government.

Welcome message from author
This document is posted to help you gain knowledge. Please leave a comment to let me know what you think about it! Share it to your friends and learn new things together.
Transcript

2015 CAHPS® Child Medicaid
Member Satisfaction Survey
Executive Summary
June 2015
Oklahoma Health Care Authority (Medicaid)
This document was developed through funding provided by the grant program outlined under the Catalog
of Federal Domestic Assistance Number 93.609 from the U.S. Department of Health and Human
Services, Centers for Medicare & Medicaid Services. However, these contents do not necessarily
represent the policy or views of the U.S. Department of Health and Human Services, and you should not
assume endorsement by the Federal Government.

2
Table of Contents
2015 CAHPS® 5.0H Child Medicaid Member Satisfaction Survey Results
June 2015 2
3
3
4
5
6
7
8
15
20
Executive Summary . . . . . . . . . . . . . . . . . . . . . . . . . . . . . . . . . . . . . . . . . . . . . . . . . . . . . . . . . .
Background and Protocol . . . . . . . . . . . . . . . . . . . . . . . . . . . . . . . . . . . . . . . . . . . . . . . . . . . . . . . . . . . .
Disposition Summary. . . . . . . . . . . . . . . . . . . . . . . . . . . . . . . . . . . . . . . . . . . . . . . . . . . . . . .
Summary of Key Measures . . . . . . . . . . . . . . . . . . . . . . . . . . . . . . . . . . . . . . . . . . . . . . . . . .
Scoring for NCQA Accreditation . . . . . . . . . . . . . . . . . . . . . . . . . . . . . . . . . . . . . . . . . . . . . . .
Comparison to Quality Compass®. . . . . . . . . . . . . . . . . . . . . . . . . . . . . . . . . . . . . . . . . . . . . .
Key Driver Analysis . . . . . . . . . . . . . . . . . . . . . . . . . . . . . . . . . . . . . . . . . . . . . . . . . . . . . . . .
Demographics . . . . . . . . . . . . . . . . . . . . . . . . . . . . . . . . . . . . . . . . . . . . . . . . . . . . . . . . . . . . .
Supplemental Questions . . . . . . . . . . . . . . . . . . . . . . . . . . . . . . . . . . . . . . . . . . . . . . . . . . . . . .20
3
Background
• CAHPS® measures health care consumers' satisfaction with the quality of care and customer service provided by their
health plan. Plans which are collecting HEDIS® (Healthcare Effectiveness Data and Information Set) data for NCQA
accreditation are required to field the CAHPS® survey among their eligible populations.
Protocol
• For CAHPS® results to be considered in HEDIS® results, the CAHPS® 5.0H survey must be fielded by an NCQA
(National Committee for Quality Assurance)-certified survey vendor using an NCQA-approved protocol of administration
in order to ensure that results are collected in a standardized way and can be compared across plans. Standard NCQA
protocols for administering CAHPS® 5.0H include a mixed-mode mail/telephone protocol and a mail-only protocol.
• Oklahoma Health Care Authority (Medicaid) chose the mail/telephone protocol. This protocol included mailing a
questionnaire with a cover letter. For those selected members who did not respond to the first questionnaire, a second
questionnaire with a cover letter encouraging participation was sent. Thank you/reminder postcards were mailed after
each survey mailing. If a selected member still did not respond to the questionnaires, at least four telephone calls were
made to complete the survey using trained telephone interviewers.
• NCQA originally designed this protocol with the goal of achieving a total response rate of at least 45%. In 2014, the
average response rate for all Child Medicaid plans reporting to NCQA was 28%, which is lower than the 2013 average
(29%).
• In February, 1980 Oklahoma Health Care Authority (Medicaid) members were randomly selected to participate in the
2015 CAHPS® 5.0H Child Medicaid Survey. This report is compiled from the responses of the 473 Oklahoma Health
Care Authority (Medicaid) members who responded to the survey (24% response rate).
Executive Summary Background and Protocol
2015 CAHPS® 5.0H Child Medicaid Member Satisfaction Survey Results
June 2015 3

4
Executive Summary Disposition Summary
• A response rate is calculated for those members who were eligible and able to respond. According to NCQA protocol,
ineligible members include those who are deceased, do not meet eligible criteria, have a language barrier, or are either
mentally or physically incapacitated. Non-responders include those members who have refused to participate in the survey,
could not be reached due to a bad address or telephone number, or members that reached a maximum attempt threshold
and were unable to be contacted during the survey time period.
• The table below shows the total number of members in the sample that fell into each of the various disposition categories.
• Ineligible surveys are subtracted from the sample size when computing a response rate (see below):
Completed mail and telephone surveys = Response Rate
Sample size - Ineligible surveys
• Using the final figures from Oklahoma Health Care Authority (Medicaid)’s Child Medicaid survey, the numerator and
denominator used to compute the response rate are presented below:
Oklahoma Health Care Authority (Medicaid)
2015 Disposition Summary Ineligible Number Non-response Number
Deceased (M20/T20) 0 Bad address/phone (M23/T23) 156
Does not meet criteria (M21/T21) 22 Refusal (M32/T32) 0
Language barrier (M22/T22) 0 Maximum attempts made (M33/T33) 1329
Mentally/physically incapacitated (M24/T24) 0
Total Ineligible 22 Total Non-response 1485
Mail completes (267) + Phone completes (206) =
473 = Response Rate = 24%
Total Sample (1980) - Total Ineligible (22) 1958
2015 CAHPS® 5.0H Child Medicaid Member Satisfaction Survey Results
June 2015 4
5
Executive Summary Summary of Key Measures
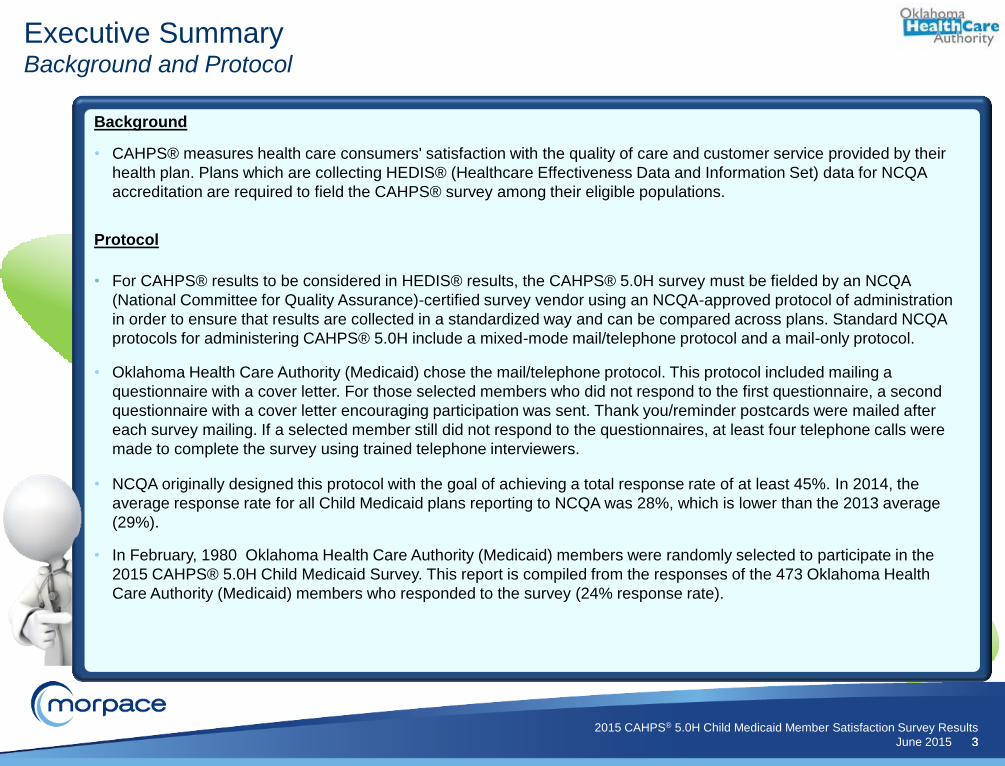
• For purposes of reporting the CAHPS®
results, the National Committee for Quality
Assurance (NCQA) uses 5 composite
measures and four rating questions from the
survey.
• Each of the composite measures is the
average of 2 - 4 questions on the survey,
depending on the measure, while each rating
score is based on a single question.
CAHPS® scores are most commonly shown
using Summary Rate scores (percentage of
positive responses).
Oklahoma Health Care Authority (Medicaid)
Composite Measures 2015
Getting Care Quickly 91%
Shared Decision Making 79%
How Well Doctors Communicate 95%
Getting Needed Care 89%
Customer Service 88%
Overall Rating Measures
Health Care 84%
Personal Doctor 86%
Specialist 90%
Health Plan 85%
Health Promotion & Education 75%
Coordination of Care 80%
Sample Size 1980
# of Completes 473
Response Rate 24%
2015 CAHPS® 5.0H Child Medicaid Member Satisfaction Survey Results
June 2015 5

6
2015 NCQA National Accreditation Comparisons*
Below 25th
Nat'l 25th Nat'l 50th Nat'l 75th Nat'l 90th Nat'l
Accreditation
Points 0.33 0.65 1.11 1.43 1.63
Composite Scores Unadjusted
Approximate
Percentile
Threshold
Approximate
Score
Getting Care Quickly 2.616 50th 2.54 2.61 2.66 2.69 1.11
How Well Doctors Communicate 2.735 75th 2.63 2.68 2.72 2.75 1.43
Getting Needed Care 2.554 75th 2.42 2.47 2.53 2.58 1.43
Customer Service 2.534 50th 2.50 2.53 2.58 2.63 1.11
Overall Ratings Scores
Q13 Health Care 2.538 50th 2.49 2.52 2.57 2.59 1.11
Q26 Personal Doctor 2.595 25th 2.58 2.62 2.65 2.69 0.65
Q30 Specialist*** 0.000 NA 2.53 2.59 2.62 2.66 NA
Accreditation
Points 0.65 1.30 2.21 2.86 3.25
Q36 Health Plan 2.582 50th 2.51 2.57 2.62 2.67 2.21
Estimated Overall
CAHPS® Score: 9.05
Executive Summary Scoring for NCQA Accreditation
NOTE: NCQA begins their calculation with an unadjusted raw score showing six digits after the decimal and then compares the adjusted score to their benchmarks and thresholds (also calculated to
the sixth decimal place). For 2015, this is the first year NCQA is no longer using an adjusted score. This report displays accreditation points and scores with only two digits after the decimal.
Therefore, the estimated overall CAHPS® score may differ from the sum of the individual scores due to rounding and could differ slightly from official scores provided by NCQA. The CAHPS®
measures account for 13 points towards accreditation.
*Data Source: NCQA Memorandum of January 30, 2015. Subject: 2015 Accreditation Benchmarks and Thresholds.
*** Not reportable due to insufficient sample size.
2015 CAHPS® 5.0H Child Medicaid Member Satisfaction Survey Results
June 2015 6

7
Executive Summary Comparison to Quality Compass®
= Plan score falls on 90th or below 95th Percentile
= Plan score falls on 75th or below 90th Percentile
= Plan score falls on 50th or below 75th Percentile
= Plan score falls on 25th or below 50th Percentile
= Plan score falls on 10th or below 25th Percentile
= Plan score falls on 5th or below 10th Percentile
Oklahoma
Health Care
Authority
(Medicaid)
2014 Child Medicaid Quality Compass® Comparisons*
5th Nat’l 10th Nat’l 25th Nat'l 50th Nat'l 75th Nat'l 90th Nat'l 95th Nat'l
Composite Scores % % % % % % %
Getting Care Quickly (% Always and Usually) 91.34% 80.19 83.34 87.67 90.59 92.45 93.81 94.04
Shared Decision Making (% Yes) 79.43% NA NA NA NA NA NA NA
How Well Doctors Communicate (% Always and Usually) 95.25% 88.40 89.71 91.96 93.25 94.67 95.61 95.96
Getting Needed Care (% Always and Usually) 89.21% 77.49 79.05 82.62 85.44 87.90 90.71 91.28
Customer Service (% Always and Usually) 88.46% 83.24 84.38 85.98 88.13 89.91 91.03 91.91
Overall Ratings Scores
Q13 Health Care (% 8, 9, and 10) 84.14% 79.64 80.94 82.63 84.70 86.65 88.85 89.67
Q26 Personal Doctor (% 8, 9, and 10) 86.17% 83.17 84.38 85.89 87.84 89.43 90.93 91.46
Q30 Specialist (% 8, 9, and 10) 89.89% 78.66 80.69 83.06 85.01 87.36 89.50 91.52
Q36 Health Plan (% 8, 9, and 10) 84.65% 77.60 78.63 81.85 84.83 87.45 88.66 91.28
2015 CAHPS® 5.0H Child Medicaid Member Satisfaction Survey Results
June 2015 7
*Data Source: 2014 Child Medicaid Quality Compass®. Scores above based
on 94 plans who qualified and chose to publicly report their scores. = Plan score falls on or above 95th Percentile
= Plan score falls below 5th Percentile
NA = Comparison data not available from NCQA.

8
Executive Summary Key Driver Recommendations
A Key Driver Analysis is conducted to understand the impact that different aspects of plan service and provider care
have on members' overall satisfaction with their health plan, their personal doctor, their specialist, and health care in
general. Two specific scores are assessed both individually and in relation to each other. These are:
1. The relative importance of the individual issues (Correlation to overall measures).
2. The current levels of performance on each issue (Percentile group from Quality Compass®)
The key drivers for the health plan and health care are shown below:
High Priority for Improvement
(High correlation/Relatively low performance) Health Plan Health Care
Q33 - Treated You with Courtesy and Respect Q33 - Treated You with Courtesy and Respect
Q19 - Show Respect for What You Had to Say
Continue to Target Efforts
(High correlation/Relatively high performance) Health Plan Health Care
Q32 - Got Information or Help Needed Q14 - Easy to Get Care Believed Necessary for Child
Q28 - Easy to Get Appointment for Child with Specialist
Q22 - Spend Enough Time with Child
2015 CAHPS® 5.0H Child Medicaid Member Satisfaction Survey Results
June 2015 8

9
Q36. Rating of Health Plan
Sample
Size
Health
Plan's
Score
Plan’s
Percentile
Range
117 90.60% 10th
117 86.32% 75th
355 92.11% 50th
331 92.75% 90th
332 95.78% 25th
333 96.40% 90th
332 96.08% 75th
335 91.64% 50th
201 91.04% 25th
95 86.32% 75th
133 75.94% 25th
132 93.94% NA
133 68.42% NA
0.58
0.41
0.36
0.34
0.27
0.26
0.23
0.23
0.17
0.12
0.07
0.01
0.01
0.0 0.5 1.0
Q33. Treated You with Courtesy and Respect
Q32. Got Information or Help Needed
Q14. Easy to Get Care Believed Necessary forChild
Q22. Spend Enough Time with Child
Q19. Show Respect for What You Had to Say
Q17. Explain Things in a Way You CouldUnderstand
Q18. Listen Carefully to You
Q6. Getting Appointment for Child as Soon asNeeded
Q4. Getting Care for Child as Soon as Needed
Q28. Easy to Get Appointment for Child withSpecialist
Q12. Asked Preference for Medicine
Q10. Discussed Reasons to Take Medicine
Q11. Discussed Reasons Not to Take Medicine
Executive Summary Key Driver Analysis – Health Plan
High Priority for Improvement
(High Correlation/
Lower Quality Compass® Group
Q33 - Treated You with Courtesy and Respect
Continue to Target Efforts
(High Correlation/
Higher Quality Compass® Group
Q32 - Got Information or Help Needed
"Health Plan's Score" is the percent of respondents that answered "Always", "Usually"; “Yes”.
Use caution when reviewing scores with sample sizes less than 25.
2015 CAHPS® 5.0H Child Medicaid Member Satisfaction Survey Results
June 2015 9
Legend:
95th = Plan score falls on or above 95th Percentile
90th = Plan score falls on 90th or below 95th Percentile
75th = Plan score falls on 75th or below 90th Percentile
50th = Plan score falls on 50th or below 75th Percentile
25th = Plan score falls on 25th or below 50th Percentile
10th = Plan score falls on 10th or below 25th Percentile
5th = Plan score falls on 5th or below 10th Percentile
Below 5th = Plan score falls below 5th Percentile

10
Q13. Rating of Health Care
Sample
Size
Health
Plan's
Score
Plan’s
Percentile
Range
117 90.60% 10th
355 92.11% 50th
95 86.32% 75th
332 95.78% 25th
331 92.75% 90th
333 96.40% 90th
117 86.32% 75th
335 91.64% 50th
332 96.08% 75th
133 75.94% 25th
201 91.04% 25th
132 93.94% NA
133 68.42% NA
Executive Summary Key Driver Analysis – Health Care
"Health Plan's Score" is the percent of respondents that answered "Always", "Usually"; “Yes”.
High Priority for Improvement
(High Correlation/
Lower Quality Compass® Group
Q33 - Treated You with Courtesy and Respect
Q19 - Show Respect for What You Had to Say
Continue to Target Efforts
(High Correlation/
Higher Quality Compass® Group
Q14 - Easy to Get Care Believed Necessary for Child
Q28 - Easy to Get Appointment for Child with
Specialist
Q22 - Spend Enough Time with Child
Use caution when reviewing scores with sample sizes less than 25.
2015 CAHPS® 5.0H Child Medicaid Member Satisfaction Survey Results
June 2015 10
0.49
0.48
0.47
0.42
0.41
0.39
0.38
0.35
0.32
0.22
0.16
0.09
0.05
0.0 0.5 1.0
Q33. Treated You with Courtesy and Respect
Q14. Easy to Get Care Believed Necessary forChild
Q28. Easy to Get Appointment for Child withSpecialist
Q19. Show Respect for What You Had to Say
Q22. Spend Enough Time with Child
Q17. Explain Things in a Way You CouldUnderstand
Q32. Got Information or Help Needed
Q6. Getting Appointment for Child as Soon asNeeded
Q18. Listen Carefully to You
Q12. Asked Preference for Medicine
Q4. Getting Care for Child as Soon as Needed
Q10. Discussed Reasons to Take Medicine
Q11. Discussed Reasons Not to Take Medicine
Legend:
95th = Plan score falls on or above 95th Percentile
90th = Plan score falls on 90th or below 95th Percentile
75th = Plan score falls on 75th or below 90th Percentile
50th = Plan score falls on 50th or below 75th Percentile
25th = Plan score falls on 25th or below 50th Percentile
10th = Plan score falls on 10th or below 25th Percentile
5th = Plan score falls on 5th or below 10th Percentile
Below 5th = Plan score falls below 5th Percentile

11
Q30. Rating of Specialist
Health
Plan's
Score
Plan’s
Percentile
Range
86.32% 75th
75.94% 25th
92.11% 50th
68.42% NA
92.75% 90th
96.40% 90th
95.78% 25th
90.60% 10th
91.64% 50th
96.08% 75th
93.94% NA
91.04% 25th
86.32% 75th
0.53
0.43
0.39
0.28
0.20
0.19
0.19
0.15
0.15
0.13
0.10
0.10
0.00
0.0 0.5 1.0
Q28. Easy to Get Appointment for Child with Specialist
Q12. Asked Preference for Medicine
Q14. Easy to Get Care Believed Necessary for Child
Q11. Discussed Reasons Not to Take Medicine
Q22. Spend Enough Time with Child
Q17. Explain Things in a Way You Could Understand
Q19. Show Respect for What You Had to Say
Q33. Treated You with Courtesy and Respect
Q6. Getting Appointment for Child as Soon as Needed
Q18. Listen Carefully to You
Q10. Discussed Reasons to Take Medicine
Q4. Getting Care for Child as Soon as Needed
Q32. Got Information or Help Needed
Q26. Rating of Personal Doctor
Health
Plan's
Score
Plan’s
Percentile
Range
96.08% 75th
95.78% 25th
92.75% 90th
96.40% 90th
92.11% 50th
86.32% 75th
86.32% 75th
91.64% 50th
90.60% 10th
75.94% 25th
91.04% 25th
68.42% NA
93.94% NA
0.62
0.62
0.59
0.51
0.36
0.34
0.34
0.29
0.28
0.23
0.11
0.05
0.04
0.0 0.5 1.0
Q18. Listen Carefully to You
Q19. Show Respect for What You Had to Say
Q22. Spend Enough Time with Child
Q17. Explain Things in a Way You Could Understand
Q14. Easy to Get Care Believed Necessary for Child
Q28. Easy to Get Appointment for Child with Specialist
Q32. Got Information or Help Needed
Q6. Getting Appointment for Child as Soon as Needed
Q33. Treated You with Courtesy and Respect
Q12. Asked Preference for Medicine
Q4. Getting Care for Child as Soon as Needed
Q11. Discussed Reasons Not to Take Medicine
Q10. Discussed Reasons to Take Medicine
Executive Summary Key Driver Analysis – Doctor and Specialist
"Health Plan's Score" is the percent of respondents that answered "Always", "Usually"; “Yes”.
2015 CAHPS® 5.0H Child Medicaid Member Satisfaction Survey Results
June 2015 11

12
• Ease of obtaining care, tests, or treatment you needed
through your health plan
– Include a supplemental question on the CAHPS® survey to identify
the type of care, test or treatment for which the member has a
problem obtaining.
– Review complaints received by Customer Service regarding inability
to receive care, tests or treatments.
– Evaluate pre-certification, authorization, and appeals processes. Of
even more importance is to evaluate the manner in which the policies
and procedures are delivered to the member, whether the delivery of
the information is directly to the member or through their provider.
Members may be hearing that they cannot receive the care, tests, or
treatment, but are not hearing why.
– When care or treatment is denied, care should be taken to ensure
that the message is understood by both the provider and the
member.
Executive Summary Action Plans for Improving CAHPS® Scores Morpace has consulted with numerous clients on ways to improve CAHPS® scores. Even though each health plan is unique and
faces different challenges, many of the improvement strategies discussed on the next few pages can be applied by most plans with
appropriate modifications.
In addition to the strategies suggested below, we suggest reviewing AHRQ’s CAHPS® Improvement Guide, an online resource
located on the Agency for Healthcare Research and Quality website at:
www.cahps.ahrq.gov/quality-improvement/index.html
• Ease of obtaining appointment with specialist
– Review panel of specialists to assure that there are an adequate
number of specialists and that they are disbursed geographically to
meet the needs of your members.
– Conduct an Access to Care survey with either or both of 2 audiences:
physician’s office and/or among members.
– Conduct a CG-CAHPS survey including specialists in the sample to
identify the specialists with whom members are having a problem
obtaining an appointment.
– Include supplemental questions on the CAHPS® survey to determine
whether the difficulty is in obtaining the initial consult or subsequent
appointments.
– Include a supplemental question on the CAHPS® survey to determine
with which type of specialist members have difficulty making an
appointment.
– Utilize Provider Relations staff to question PCP office staff when
making a regular visit to determine with which types of specialists
they have the most problems scheduling appointments.
– Develop materials to promote your specialist network and encourage
the PCPs to develop new referral patterns that align with the network.
2015 CAHPS® 5.0H Child Medicaid Member Satisfaction Survey Results
June 2015 12
Getting Needed Care Getting Needed Care
13
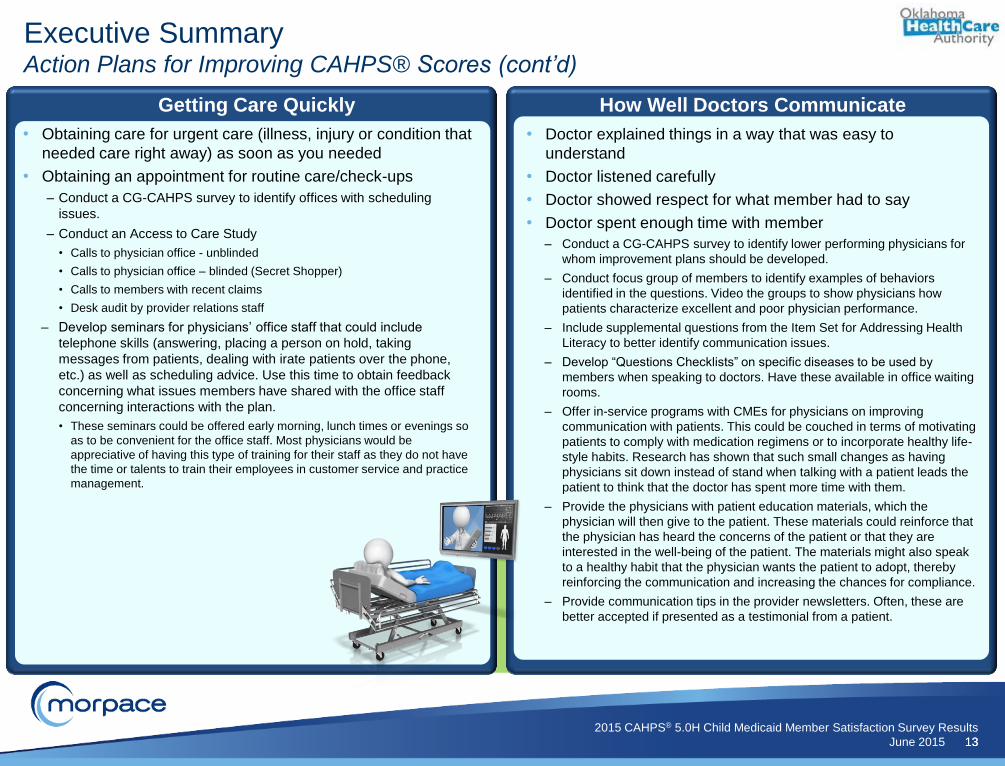
• Doctor explained things in a way that was easy to
understand
• Doctor listened carefully
• Doctor showed respect for what member had to say
• Doctor spent enough time with member
– Conduct a CG-CAHPS survey to identify lower performing physicians for
whom improvement plans should be developed.
– Conduct focus group of members to identify examples of behaviors
identified in the questions. Video the groups to show physicians how
patients characterize excellent and poor physician performance.
– Include supplemental questions from the Item Set for Addressing Health
Literacy to better identify communication issues.
– Develop “Questions Checklists” on specific diseases to be used by
members when speaking to doctors. Have these available in office waiting
rooms.
– Offer in-service programs with CMEs for physicians on improving
communication with patients. This could be couched in terms of motivating
patients to comply with medication regimens or to incorporate healthy life-
style habits. Research has shown that such small changes as having
physicians sit down instead of stand when talking with a patient leads the
patient to think that the doctor has spent more time with them.
– Provide the physicians with patient education materials, which the
physician will then give to the patient. These materials could reinforce that
the physician has heard the concerns of the patient or that they are
interested in the well-being of the patient. The materials might also speak
to a healthy habit that the physician wants the patient to adopt, thereby
reinforcing the communication and increasing the chances for compliance.
– Provide communication tips in the provider newsletters. Often, these are
better accepted if presented as a testimonial from a patient.
Executive Summary Action Plans for Improving CAHPS® Scores (cont’d)
• Obtaining care for urgent care (illness, injury or condition that
needed care right away) as soon as you needed
• Obtaining an appointment for routine care/check-ups
– Conduct a CG-CAHPS survey to identify offices with scheduling
issues.
– Conduct an Access to Care Study
• Calls to physician office - unblinded
• Calls to physician office – blinded (Secret Shopper)
• Calls to members with recent claims
• Desk audit by provider relations staff
– Develop seminars for physicians’ office staff that could include
telephone skills (answering, placing a person on hold, taking
messages from patients, dealing with irate patients over the phone,
etc.) as well as scheduling advice. Use this time to obtain feedback
concerning what issues members have shared with the office staff
concerning interactions with the plan.
• These seminars could be offered early morning, lunch times or evenings so
as to be convenient for the office staff. Most physicians would be
appreciative of having this type of training for their staff as they do not have
the time or talents to train their employees in customer service and practice
management.
2015 CAHPS® 5.0H Child Medicaid Member Satisfaction Survey Results
June 2015 13
Getting Care Quickly How Well Doctors Communicate

14
• Customer service gave the information or help needed
• Customer service treated member with courtesy and respect
– Conduct Call Center Satisfaction Survey. Implement a short IVR
survey to members within days of their calling customer service to
explore/assess their recent experience.
– At the end of each Customer Service call, have your representative
enter/post the reason for the call. At the end of a month, synthesize the
information to discern the major reasons for a call. Have the customer
service representatives and other appropriate staff discuss ways to
address the reason for the majority of the calls and design
interventions so that the reason for the call no longer exists.
Executive Summary Action Plans for Improving CAHPS® Scores (cont’d)
• Doctor talked about reasons you might want to take a
medicine
• Doctor talked about reasons you might not want to take a
medicine
• Doctor asked you what you thought was best
– Conduct a CG-CAHPS survey and include the Shared Decision
Making Composite as supplemental questions.
– Develop patient education materials on common medicines described
for your members explaining pros and cons of each
medicine. Examples: asthma medications, high blood pressure
medications, statins.
– Develop audio recordings and/or videos of patient/doctor
dialogues/vignettes on common medications. Distribute to provider
panel via podcast or other method.
2015 CAHPS® 5.0H Child Medicaid Member Satisfaction Survey Results
June 2015 14
Shared Decision Making Health Plan Customer Service

15
1 yr and under 10%
2-5 28%
6-9 20%
10-14 23%
15-18 19%
Male 53%
Female 47%
Executive Summary Demographics
CHILD’S MENTAL/EMOTIONAL HEALTH STATUS
Data shown are self reported.
CHILD’S HEALTH STATUS
Excellent/Very good 79%
Good 18%
Fair/Poor 3%
17%
70%
15%
3%
1%
25%
8%
0% 20% 40% 60% 80%
Hispanic or Latino
White
Black or African-American
Asian
Native Hawaiian or other Pacific Islander
American Indian or Alaska Native
Other
CHILD’S RACE / ETHNICITY CHILD’S GENDER CHILD’S AGE
Excellent/ Very good
76%
Good 17%
Fair/Poor 6%
2015 CAHPS® 5.0H Child Medicaid Member Satisfaction Survey Results
June 2015 15

16
Executive Summary Child Demographics
2015
2014
Quality
Compass®
Q37. Child's Health Status
Excellent/Very good 79% 76%
Good 18% 19%
Fair/Poor 3% 4%
Q38. Child's Mental/Emotional Health Status
Excellent/Very good 76% 75%
Good 17% 17%
Fair/Poor 6% 9%
Q39. Child's Age
1 yr and under 10% NA
2-5 28% NA
6-9 20% NA
10-14 23% NA
15-18 19% NA
Q40. Child's Gender
Male 53% 52%
Female 47% 48%
Q41/42. Child's Race/Ethnicity
Hispanic or Latino 17% 30%
White 70% 46%
Black or African-American 15% 21%
Asian 3% 5%
Native Hawaiian or other Pacific Islander 1% 1%
American Indian or Alaska Native 25% 2%
Other 8% 11%
Data shown are self reported.
2015 CAHPS® 5.0H Child Medicaid Member Satisfaction Survey Results
June 2015 16
NA = Data not available

17
Executive Summary Respondent Demographics
2015 2014 Quality
Compass®
Q7. Number of Times Going to Doctor's Office/Clinic for Care
None 22% 25%
1 time 22% 26%
2 times 22% 22%
3 times 16% 13%
4 times 7% 6%
5-9 times 10% 6%
10 or more times 2% 2%
Q16. Number of Times Visited Personal Doctor to Get Care
None 19% 21%
1 time 29% 32%
2 times 24% 23%
3 times 14% 12%
4 times 7% 6%
5-9 times 7% 6%
10 or more times 1% 1%
Q43. Respondent's Age
Under 18 2% 7%
18 to 24 10% 8%
25 to 34 32% 33%
35 to 44 28% 30%
45 to 54 16% 14%
55 to 64 8% 5%
65 or older 4% 2%
Q44. Respondent's Gender
Male 14% 12%
Female 86% 88%
Q45. Respondent's Education
Did not graduate high school 17% 22%
High school graduate or GED 32% 34%
Some college or 2-year degree 36% 32%
4-year college graduate 10% 8%
More than 4-year college degree 4% 4% Data shown are self reported.
2015 CAHPS® 5.0H Child Medicaid Member Satisfaction Survey Results
June 2015 17

18
Executive Summary General Knowledge about Demographic Differences
Note: If a health plan’s population differs from Quality Compass® in any of the demographic groups, these differences could account for the plan’s
score when compared to Quality Compass® . For example, if a plan’s population rates themselves in better health than the Quality Compass®
population, this could impact a plan’s score positively. Conversely, if a plan’s population rates themselves in poorer health than the Quality
Compass® population, the plan’s scores could be negatively impacted.
2015 CAHPS® 5.0H Child Medicaid Member Satisfaction Survey Results
June 2015 18
The commentary below is based on generally recognized industry knowledge per various published sources:
Age Older respondents tend to be more satisfied than younger respondents.
Health Status People who rate their health status as ‘Excellent’ or ‘Very good’ tend to be more satisfied than people who rate
their health status lower.
Education More educated respondents tend to be less satisfied.
Race and ethnicity effects are independent of education and income. Lower income generally predicts lower satisfaction with coverage
and care.
Race
Whites give the highest ratings to both rating and composite questions. In general, Asian/Pacific Islanders and
American Indian/Alaska Natives give the lowest ratings.
Growing evidence that lower satisfaction ratings from Asian Americans are partially attributable to cultural
differences in their response tendencies. Therefore, their lower scores might not reflect an accurate comparison of
their experience with health care.
Ethnicity Hispanics tend to give lower ratings than non-Hispanics. Non-English speaking Hispanics tend to give lower
ratings than English-speaking Hispanics.
19
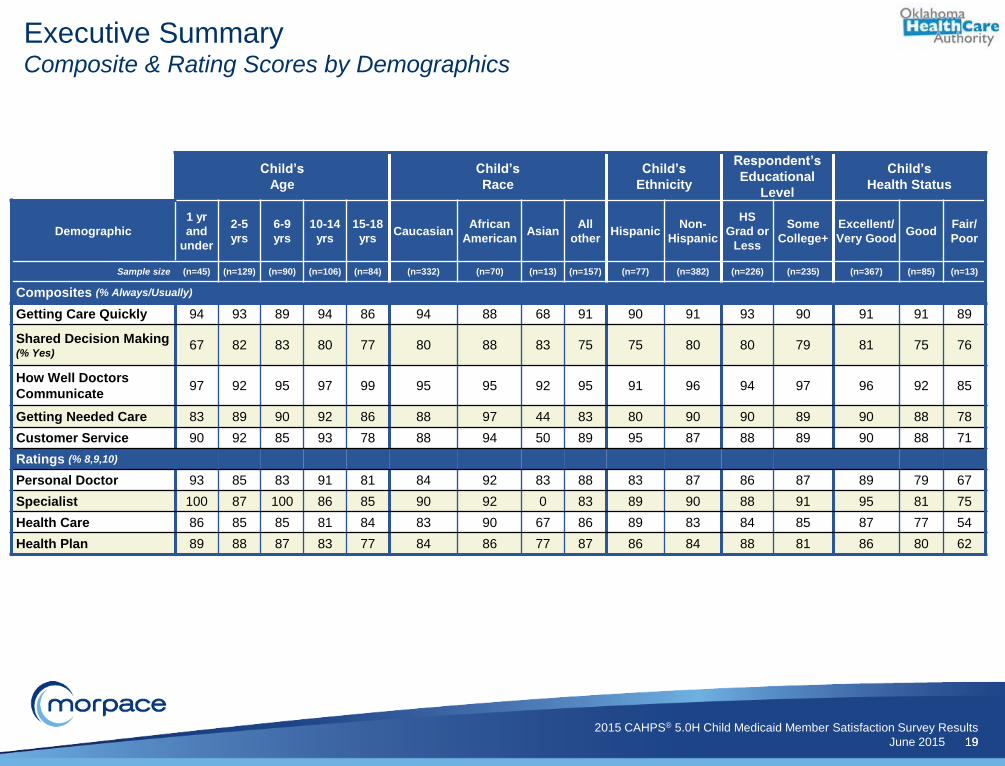
Executive Summary Composite & Rating Scores by Demographics
Child’s
Age
Child’s
Race
Child’s
Ethnicity
Respondent’s
Educational
Level
Child’s
Health Status
Demographic
1 yr
and
under
2-5
yrs
6-9
yrs
10-14
yrs
15-18
yrs Caucasian
African
American Asian
All
other Hispanic
Non-
Hispanic
HS
Grad or
Less
Some
College+
Excellent/
Very Good Good
Fair/
Poor
Sample size (n=45) (n=129) (n=90) (n=106) (n=84) (n=332) (n=70) (n=13) (n=157) (n=77) (n=382) (n=226) (n=235) (n=367) (n=85) (n=13)
Composites (% Always/Usually)
Getting Care Quickly 94 93 89 94 86 94 88 68 91 90 91 93 90 91 91 89
Shared Decision Making (% Yes)
67 82 83 80 77 80 88 83 75 75 80 80 79 81 75 76
How Well Doctors
Communicate 97 92 95 97 99 95 95 92 95 91 96 94 97 96 92 85
Getting Needed Care 83 89 90 92 86 88 97 44 83 80 90 90 89 90 88 78
Customer Service 90 92 85 93 78 88 94 50 89 95 87 88 89 90 88 71
Ratings (% 8,9,10)
Personal Doctor 93 85 83 91 81 84 92 83 88 83 87 86 87 89 79 67
Specialist 100 87 100 86 85 90 92 0 83 89 90 88 91 95 81 75
Health Care 86 85 85 81 84 83 90 67 86 89 83 84 85 87 77 54
Health Plan 89 88 87 83 77 84 86 77 87 86 84 88 81 86 80 62
2015 CAHPS® 5.0H Child Medicaid Member Satisfaction Survey Results
June 2015 19

2015 Child Medicaid CAHPS® Results
Legend:
% Always / Usually
or % Yes
Summary Mean(1-3)
Sample Size
Getting Care Quickly 91 2.62 (376)
Getting care for child as soon as needed 91 2.64 (201)
Getting appointment for child as soon as needed 92 2.59 (335)
79 NA (133)
Discussed reasons to take medicine 94 NA (132)
Discussed reasons not to take medicine 68 NA (133)
Asked preference for medicine 76 NA (133)
How Well Doctors Communicate 95 2.74 (333)
Explain things in a way you could understand 96 2.75 (333)
Listen carefully to you 96 2.77 (332)
Show respect for what you had to say 96 2.78 (332)
Spend enough time with child 93 2.65 (331)
Getting Needed Care 89 2.55 (363)
Easy to get care believed necessary for child 92 2.57 (355)
Easy to get appointment for child with specialist 86 2.54 (95)
Customer Service 88 2.53 (117)
Got information or help needed 86 2.48 (117)
Treated you with courtesy and respect 91 2.59 (117)
Other Measures
Health Promotion and Education (% No, Yes) 75 2.49 (353)
Coordination of Care 80 2.34 (150)
Legend:
Ratings % 8-10
Health Care 84 2.54 (353)
Personal Doctor 86 2.60 (405)
Specialist 90 2.69 (89)
Health Plan 85 2.58 (469)
Percents may not add to 100% due to rounding
NA = Means are not calculated for the Shared Decision Making composite.
Shared Decision Making ( % No, Yes)
Oklahoma Health Care Authority (Medicaid)
9
9
8
21
6
32
24
5
4
4
4
7
11
8
14
12
14
9
26
20
21
18
24
17
18
15
14
21
23
27
19
24
25
22
26
70
73
67
79
94
68
76
78
78
81
82
72
66
65
67
65
62
68
75
54
Never / Sometimes
Usually Always
0-3 4-5 6-7 8-10
1
1
2
1
3
5
3
5
12
8
4
9
84
86
90
85
M150004

2015 Percentile Mean 5th 10th 25th 50th 75th 90th 95th
Getting Care Quickly (% Always/Usually) 91.34 50th 89.46 80.19 83.34 87.67 90.59 92.45 93.81 94.04
Q4 Getting care for child as soon as needed 91.04 25th 90.66 82.24 84.04 88.61 91.60 93.96 95.62 96.00
Q6 Getting appointment for child as soon as needed 91.64 50th 88.35 78.69 82.02 86.29 89.20 91.73 93.04 93.90
Shared Decision Making (% Yes) 79.43 NA NA NA NA NA NA NA NA NA
Q10 Discussed reasons to take medicine 93.94 NA NA NA NA NA NA NA NA NA
Q11 Discussed reasons not to take medicine 68.42 NA NA NA NA NA NA NA NA NA
Q12 Asked preference for medicine 75.94 25th 77.23 70.18 71.88 74.53 77.17 80.42 82.21 83.89
How Well Doctors Communicate (% Always/Usually) 95.25 75th 92.98 88.40 89.71 91.96 93.25 94.67 95.61 95.96
Q17 Explain things in a way you could understand 96.40 90th 93.54 88.84 90.42 91.68 93.86 95.63 96.35 97.10
Q18 Listen carefully to you 96.08 75th 94.48 90.52 91.88 93.57 94.86 95.88 96.50 97.30
Q19 Show respect for what you had to say 95.78 25th 95.61 92.95 93.77 94.68 95.87 96.64 97.61 97.88
Q22 Spend enough time with child 92.75 90th 88.29 80.90 82.71 86.45 88.66 91.24 92.38 93.30
Getting Needed Care (% Always/Usually) 89.21 75th 84.97 77.49 79.05 82.62 85.44 87.90 90.71 91.28
Q14 Easy to get care believed necessary for child 92.11 50th 89.54 82.10 84.14 87.94 90.09 92.38 93.57 94.41
Q28 Easy to get appointment for child with specialist 86.32 75th 81.89 74.68 75.52 78.52 82.51 84.52 88.89 89.57
Customer Service (% Always/Usually) 88.46 50th 87.89 83.24 84.38 85.98 88.13 89.91 91.03 91.91
Q32 Got information or help needed 86.32 75th 82.55 76.78 77.45 79.93 82.84 85.37 86.89 88.12
Q33 Treated you with courtesy and respect 90.60 10th 93.22 89.29 90.32 91.71 93.44 94.86 95.83 96.47
Q13 Rating of Health Care (% 8, 9, 10) 84.14 25th 84.70 79.64 80.94 82.63 84.70 86.65 88.85 89.67
Q26 Rating of Personal Doctor (% 8, 9, 10) 86.17 25th 87.63 83.17 84.38 85.89 87.84 89.43 90.93 91.46
Q30 Rating of Specialist (% 8, 9, 10) 89.89 90th 85.02 78.66 80.69 83.06 85.01 87.36 89.50 91.52
Q36 Rating of Health Plan (% 8, 9, 10) 84.65 25th 84.49 77.60 78.63 81.85 84.83 87.45 88.66 91.28
Q8 Health Promotion and Education (% Yes) 74.50 50th 71.74 65.33 67.66 69.19 71.48 74.62 76.50 77.82
Q25 Coordination of Care (% Always/Usually ) 80.00 25th 81.03 73.56 75.44 77.60 81.82 84.12 86.31 87.65
NA = Comparison data not available from NCQA
The 2014 Child Medicaid Quality Compass® consists of 94 plans who publicly and non-publicly reported their scores (All Lines of Business excluding PPOs).
Plan Comparison to 2014 Child Medicaid Quality Compass®
2014 Child Medicaid Quality Compass®Oklahoma Health
Care Authority (Medicaid)
Oklahoma Health Care Authority (Medicaid)
Child Medicaid Survey Questions
Legend
= Plan score falls on 90th or below 95th Percentile
= Plan score falls on 75th or below 90th Percentile
= Plan score falls on 50th or below 75th Percentile
= Plan score falls on 25th or below 50th Percentile
= Plan score falls on 10th or below 25th Percentile
= Plan score falls on 5th or below 10th Percentile
= Plan score falls on or above 95th Percentile
= Plan score falls below 5th Percentile
M150004

Total(%)
1 Yrand Less
(%)2 - 5 (%)
6 - 9(%)
10 - 14(%)
15 - 18(%)
High/ Low Diff(%)
(n=473) (n=45) (n=129) (n=90) (n=106) (n=84)
Getting Care Quickly (% Always/Usually) 91 94 93 89 94 86 8
Q4 Getting care for child as soon as needed 91 93 95 88 93 85 10
Q6 Getting appointment for child as soon as needed 92 95 91 90 95 88 7
Shared Decision Making (% Yes) 79 67 82 83 80 77 16
Q10 Discussed reasons to take medicine 94 77 94 100 97 93 23
Q11 Discussed reasons not to take medicine 68 62 72 59 70 70 13
Q12 Asked preference for medicine 76 62 81 91 73 67 29
How Well Doctors Communicate (% Always/Usually) 95 97 92 95 97 99 7
Q17 Explain things in a way you could understand 96 98 95 98 96 98 3
Q18 Listen carefully to you 96 98 93 93 99 100 7
Q19 Show respect for what you had to say 96 95 92 98 97 98 6
Q22 Spend enough time with child 93 98 88 90 95 98 10
Getting Needed Care (% Always/Usually) 89 83 89 90 92 86 9
Q14 Easy to get care believed necessary for child 92 86 93 91 94 91 8
Q28 Easy to get appointment for child with specialist 86 80 85 88 91 80 11
Customer Service (% Always/Usually) 88 90 92 85 93 78 15
Q32 Got information or help needed 86 93 89 79 96 72 24
Q33 Treated you with courtesy and respect 91 87 95 92 91 83 12
Q13 Rating of Health Care (% 8, 9, 10) 84 86 85 85 81 84 5
Q26 Rating of Personal Doctor (% 8, 9, 10) 86 93 85 83 91 81 12
Q30 Rating of Specialist (% 8, 9, 10) 90 100 87 100 86 85 15
Q36 Rating of Health Plan (% 8, 9, 10) 85 89 88 87 83 77 12
Q8 Health Promotion and Education (% Yes) 75 86 75 65 73 79 21
Q25 Coordination of Care (% Always/Usually ) 80 94 76 82 80 75 19
"High/Low Diff" is the percentage point difference between the largest and smallest score across the demographic categories for that specific measure.
"High/Low Diff" column may not be exact due to rounding. Use caution when reviewing scores with sample sizes less than 20.
2015 Child Medicaid Demographic Profile - Child's Age
Oklahoma Health Care Authority (Medicaid)
Oklahoma Health Care Authority (Medicaid)
Child Medicaid Survey Questions
Sample Size
M150004

Total(%)
Caucasian(%)
African American
(%)Asian
(%)All other
(%)
High/Low Diff(%)
(n=473) (n=332) (n=70) (n=13) (n=157)
Getting Care Quickly (% Always/Usually) 91 94 88 68 91 26
Q4 Getting care for child as soon as needed 91 94 89 67 89 27
Q6 Getting appointment for child as soon as needed 92 94 88 70 92 24
Shared Decision Making (% Yes) 79 80 88 83 75 13
Q10 Discussed reasons to take medicine 94 94 100 100 92 8
Q11 Discussed reasons not to take medicine 68 70 82 50 61 32
Q12 Asked preference for medicine 76 75 82 100 71 29
How Well Doctors Communicate (% Always/Usually) 95 95 95 92 95 3
Q17 Explain things in a way you could understand 96 97 94 89 98 9
Q18 Listen carefully to you 96 96 96 100 97 4
Q19 Show respect for what you had to say 96 95 98 100 95 5
Q22 Spend enough time with child 93 93 94 78 92 16
Getting Needed Care (% Always/Usually) 89 88 97 44 83 53
Q14 Easy to get care believed necessary for child 92 92 94 89 92 5
Q28 Easy to get appointment for child with specialist 86 85 100 0 75 100
Customer Service (% Always/Usually) 88 88 94 50 89 44
Q32 Got information or help needed 86 85 92 50 89 42
Q33 Treated you with courtesy and respect 91 91 96 50 89 46
Q13 Rating of Health Care (% 8, 9, 10) 84 83 90 67 86 23
Q26 Rating of Personal Doctor (% 8, 9, 10) 86 84 92 83 88 9
Q30 Rating of Specialist (% 8, 9, 10) 90 90 92 0 83 92
Q36 Rating of Health Plan (% 8, 9, 10) 85 84 86 77 87 10
Q8 Health Promotion and Education (% Yes) 75 72 82 78 72 10
Q25 Coordination of Care (% Always/Usually ) 80 81 67 50 90 40
"High/Low Diff" is the percentage point difference between the largest and smallest score across the demographic categories for that specific measure."High/Low Diff" column may not be exact due to rounding. Use caution when reviewing scores with sample sizes less than 20.
2015 Child Medicaid Demographic Profile - Child's Race (1 of 2)
Oklahoma Health Care Authority (Medicaid)
Oklahoma Health Care Authority (Medicaid)
Child Medicaid Survey Questions
Sample Size
M150004

Total(%)
Caucasian(%)
Non-Caucasian
(%)
High/Low Diff(%)
(n=473) (n=332) (n=125)
Getting Care Quickly (% Always/Usually) 91 94 85 9
Q4 Getting care for child as soon as needed 91 94 85 9
Q6 Getting appointment for child as soon as needed 92 94 85 9
Shared Decision Making (% Yes) 79 80 77 3
Q10 Discussed reasons to take medicine 94 94 93 1
Q11 Discussed reasons not to take medicine 68 70 60 10
Q12 Asked preference for medicine 76 75 77 2
How Well Doctors Communicate (% Always/Usually) 95 95 95 0
Q17 Explain things in a way you could understand 96 97 94 3
Q18 Listen carefully to you 96 96 95 1
Q19 Show respect for what you had to say 96 95 98 3
Q22 Spend enough time with child 93 93 91 2
Getting Needed Care (% Always/Usually) 89 88 92 4
Q14 Easy to get care believed necessary for child 92 92 93 1
Q28 Easy to get appointment for child with specialist 86 85 91 6
Customer Service (% Always/Usually) 88 88 89 1
Q32 Got information or help needed 86 85 89 4
Q33 Treated you with courtesy and respect 91 91 89 2
Q13 Rating of Health Care (% 8, 9, 10) 84 83 86 3
Q26 Rating of Personal Doctor (% 8, 9, 10) 86 84 91 7
Q30 Rating of Specialist (% 8, 9, 10) 90 90 90 0
Q36 Rating of Health Plan (% 8, 9, 10) 85 84 86 2
Q8 Health Promotion and Education (% Yes) 75 72 82 10
Q25 Coordination of Care (% Always/Usually ) 80 81 78 3
"High/Low Diff" is the percentage point difference between the largest and smallest score across the demographic categories for that specific measure.
"High/Low Diff" column may not be exact due to rounding. Use caution when reviewing scores with sample sizes less than 20.
2015 Child Medicaid Demographic Profile - Child's Race (2 of 2)
Oklahoma Health Care Authority (Medicaid)
Oklahoma Health Care Authority (Medicaid)
Child Medicaid Survey Questions
Sample Size
M150004

Total(%)
Hispanic(%)
Non-Hispanic
(%)
High/Low Diff(%)
(n=473) (n=77) (n=382)
Getting Care Quickly (% Always/Usually) 91 90 91 1
Q4 Getting care for child as soon as needed 91 86 92 6
Q6 Getting appointment for child as soon as needed 92 93 91 2
Shared Decision Making (% Yes) 79 75 80 5
Q10 Discussed reasons to take medicine 94 82 96 14
Q11 Discussed reasons not to take medicine 68 71 68 3
Q12 Asked preference for medicine 76 71 77 6
How Well Doctors Communicate (% Always/Usually) 95 91 96 5
Q17 Explain things in a way you could understand 96 96 97 1
Q18 Listen carefully to you 96 92 97 5
Q19 Show respect for what you had to say 96 92 97 5
Q22 Spend enough time with child 93 84 95 11
Getting Needed Care (% Always/Usually) 89 80 90 10
Q14 Easy to get care believed necessary for child 92 88 93 5
Q28 Easy to get appointment for child with specialist 86 73 88 15
Customer Service (% Always/Usually) 88 95 87 8
Q32 Got information or help needed 86 95 85 10
Q33 Treated you with courtesy and respect 91 95 90 5
Q13 Rating of Health Care (% 8, 9, 10) 84 89 83 6
Q26 Rating of Personal Doctor (% 8, 9, 10) 86 83 87 4
Q30 Rating of Specialist (% 8, 9, 10) 90 89 90 1
Q36 Rating of Health Plan (% 8, 9, 10) 85 86 84 2
Q8 Health Promotion and Education (% Yes) 75 67 75 8
Q25 Coordination of Care (% Always/Usually ) 80 74 81 7
"High/Low Diff" is the percentage point difference between the largest and smallest score across the demographic categories for that specific measure."High/Low Diff" column may not be exact due to rounding. Use caution when reviewing scores with sample sizes less than 20.
2015 Child Medicaid Demographic Profile - Child's Ethnicity
Oklahoma Health Care Authority (Medicaid)
Oklahoma Health Care Authority (Medicaid)
Child Medicaid Survey Questions
Sample Size
M150004
Total(%)
HS grad or less
(%)
Some college or more
(%)
High/Low Diff(%)
(n=473) (n=226) (n=235)
Getting Care Quickly (% Always/Usually) 91 93 90 3
Q4 Getting care for child as soon as needed 91 96 87 9
Q6 Getting appointment for child as soon as needed 92 91 92 1
Shared Decision Making (% Yes) 79 80 79 1
Q10 Discussed reasons to take medicine 94 91 96 5
Q11 Discussed reasons not to take medicine 68 72 66 6
Q12 Asked preference for medicine 76 77 76 1
How Well Doctors Communicate (% Always/Usually) 95 94 97 3
Q17 Explain things in a way you could understand 96 95 98 3
Q18 Listen carefully to you 96 95 97 2
Q19 Show respect for what you had to say 96 94 98 4
Q22 Spend enough time with child 93 91 95 4
Getting Needed Care (% Always/Usually) 89 90 89 1
Q14 Easy to get care believed necessary for child 92 92 92 0
Q28 Easy to get appointment for child with specialist 86 87 85 2
Customer Service (% Always/Usually) 88 88 89 1
Q32 Got information or help needed 86 84 89 5
Q33 Treated you with courtesy and respect 91 92 89 3
Q13 Rating of Health Care (% 8, 9, 10) 84 84 85 1
Q26 Rating of Personal Doctor (% 8, 9, 10) 86 86 87 1
Q30 Rating of Specialist (% 8, 9, 10) 90 88 91 3
Q36 Rating of Health Plan (% 8, 9, 10) 85 88 81 7
Q8 Health Promotion and Education (% Yes) 75 75 74 1
Q25 Coordination of Care (% Always/Usually ) 80 86 75 11
"High/Low Diff" is the percentage point difference between the largest and smallest score across the demographic categories for that specific measure."High/Low Diff" column may not be exact due to rounding. Use caution when reviewing scores with sample sizes less than 20.
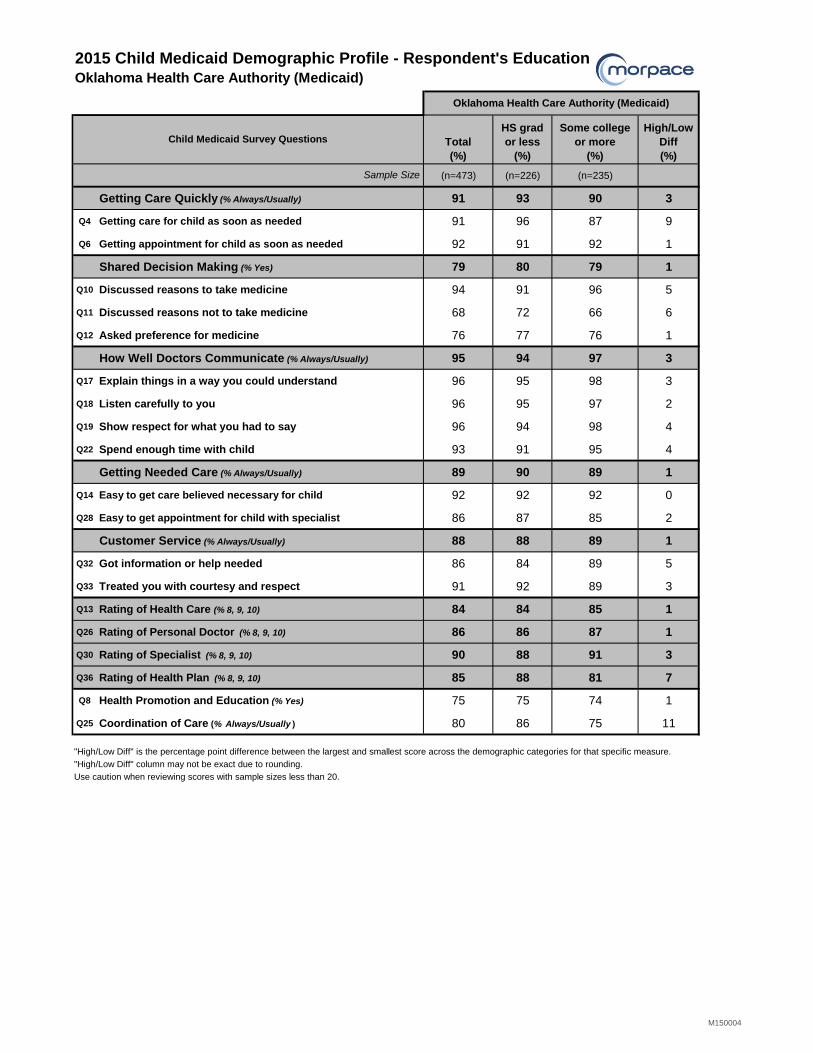
2015 Child Medicaid Demographic Profile - Respondent's Education
Oklahoma Health Care Authority (Medicaid)
Oklahoma Health Care Authority (Medicaid)
Child Medicaid Survey Questions
Sample Size
M150004
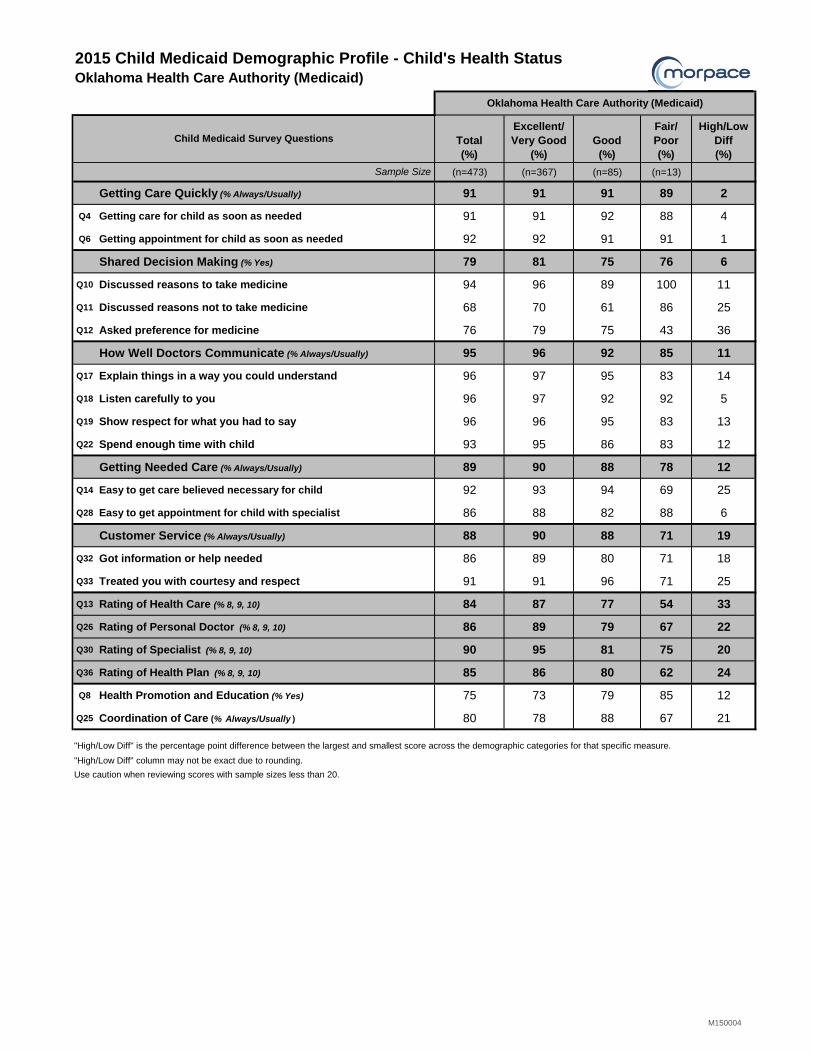
Total(%)
Excellent/Very Good
(%)Good(%)
Fair/Poor(%)
High/Low Diff(%)
(n=473) (n=367) (n=85) (n=13)
Getting Care Quickly (% Always/Usually) 91 91 91 89 2
Q4 Getting care for child as soon as needed 91 91 92 88 4
Q6 Getting appointment for child as soon as needed 92 92 91 91 1
Shared Decision Making (% Yes) 79 81 75 76 6
Q10 Discussed reasons to take medicine 94 96 89 100 11
Q11 Discussed reasons not to take medicine 68 70 61 86 25
Q12 Asked preference for medicine 76 79 75 43 36
How Well Doctors Communicate (% Always/Usually) 95 96 92 85 11
Q17 Explain things in a way you could understand 96 97 95 83 14
Q18 Listen carefully to you 96 97 92 92 5
Q19 Show respect for what you had to say 96 96 95 83 13
Q22 Spend enough time with child 93 95 86 83 12
Getting Needed Care (% Always/Usually) 89 90 88 78 12
Q14 Easy to get care believed necessary for child 92 93 94 69 25
Q28 Easy to get appointment for child with specialist 86 88 82 88 6
Customer Service (% Always/Usually) 88 90 88 71 19
Q32 Got information or help needed 86 89 80 71 18
Q33 Treated you with courtesy and respect 91 91 96 71 25
Q13 Rating of Health Care (% 8, 9, 10) 84 87 77 54 33
Q26 Rating of Personal Doctor (% 8, 9, 10) 86 89 79 67 22
Q30 Rating of Specialist (% 8, 9, 10) 90 95 81 75 20
Q36 Rating of Health Plan (% 8, 9, 10) 85 86 80 62 24
Q8 Health Promotion and Education (% Yes) 75 73 79 85 12
Q25 Coordination of Care (% Always/Usually ) 80 78 88 67 21
"High/Low Diff" is the percentage point difference between the largest and smallest score across the demographic categories for that specific measure.
"High/Low Diff" column may not be exact due to rounding.
Use caution when reviewing scores with sample sizes less than 20.
2015 Child Medicaid Demographic Profile - Child's Health Status
Oklahoma Health Care Authority (Medicaid)
Oklahoma Health Care Authority (Medicaid)
Child Medicaid Survey Questions
Sample Size
M150004

2015 CAHPS 5.0H Child Medicaid Member Satisfaction Survey
A
June 2015
M150004
TECHNICAL NOTES–Child Medicaid Survey
Composites
Composite scores are used to both facilitate aggregation of information from multiple specific questions and to enhance the communication of this important information to consumers. The composites are:
Getting Care Quickly Getting Needed Care Shared Decision Making Customer Service How Well Doctors Communicate
In 2009 one composite was deleted (Courteous and Helpful Office Staff) and one was added (Shared Decision Making). In 2013, the questions in the Shared Decision Making composite were changed; highlighting decisions on prescriptions rather than decisions about health care in general. These changes impacted trending for this composite and the individual measures. For HEDIS 2015, NCQA revised the Shared Decision Making composite. Question language and response options have been revised from a four-point scale (Not at all/A little/Some/A lot) to a two-point scale (Yes/No). This composite will not be trendable to 2014 data. See page I for new wording of these questions. In addition, in 2013, both questions in Getting Needed Care were modified. Also, the placement of the question regarding ease of getting care, tests and treatment through your health plan (Q27) was changed and is now Q14 and the reference to “through the health plan” was removed from the question. The Composite Summary Rate is used in reporting to Quality Compass
® and the Three-Point Score is used in
NCQA accreditation. See Summary Rate Scoring for an explanation of how the scores are calculated. See Page I for a listing of each of the questions in the composites, the response choices, and how each response is scored. Composite Mean
The composite mean that is calculated for Composite Measures is a mean of the individual means that make up that composite.
For example, the measure “Getting Care Quickly” comprises two individual measures: Q4 - How often did your child get care as soon as you thought he or she needed? Q6 - How often did your child get an appointment for a check-up or routine care at a doctor’s office or clinic as soon
as you thought your child needed? To calculate a composite mean or composite percent, first calculate the individual means or percents for Q4 and Q6. For example, if the individual means or percents are:
Mean for Q4 = 1.9 Percent for Q4 = 84% Mean for Q6 = 2.2 Percent for Q6 = 88%
Then, calculate the mean of those means or percents: Composite Mean = (1.9 + 2.2) / 2 = 2.05 Composite Percent = (84% + 88%)/2 = 86% Note that each question within a composite is weighted equally, regardless of the number of members responding to each question or to the relative importance of one question to another.
2015 CAHPS 5.0H Child Medicaid Member Satisfaction Survey
B
June 2015
M150004
Correlation
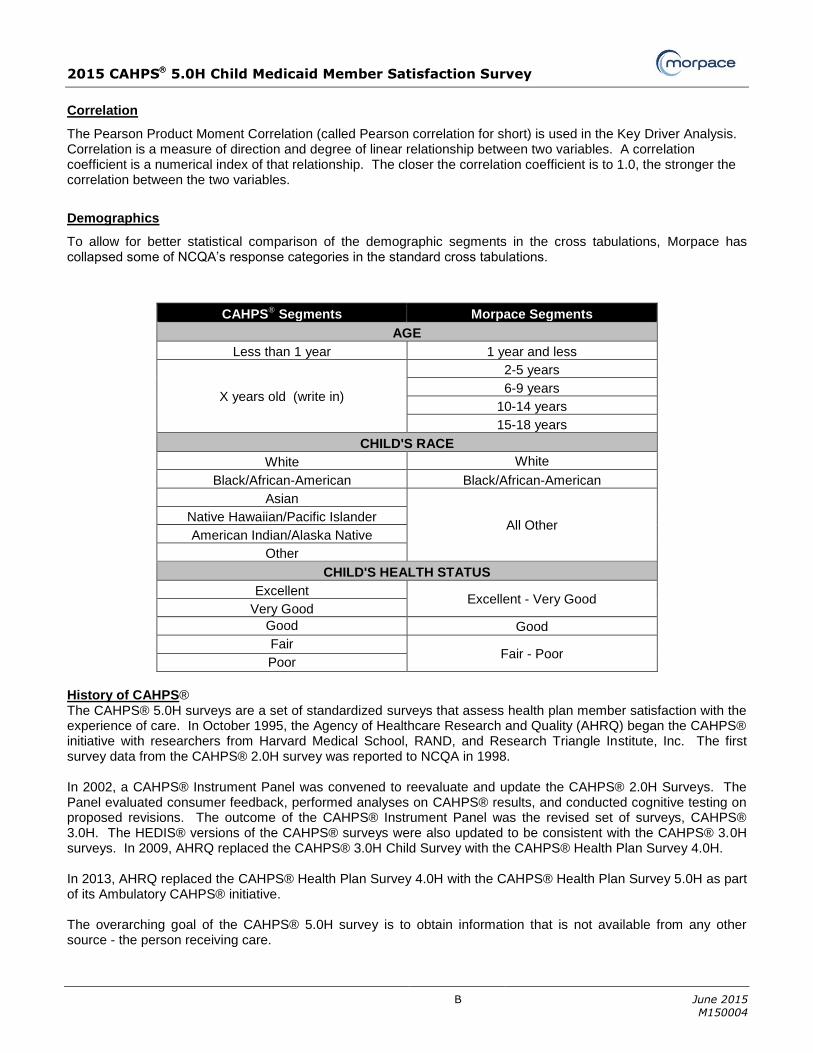
The Pearson Product Moment Correlation (called Pearson correlation for short) is used in the Key Driver Analysis. Correlation is a measure of direction and degree of linear relationship between two variables. A correlation coefficient is a numerical index of that relationship. The closer the correlation coefficient is to 1.0, the stronger the correlation between the two variables.
Demographics
To allow for better statistical comparison of the demographic segments in the cross tabulations, Morpace has collapsed some of NCQA’s response categories in the standard cross tabulations.
CAHPS® Segments Morpace Segments
AGE
Less than 1 year 1 year and less
X years old (write in)
2-5 years
6-9 years
10-14 years
15-18 years
CHILD'S RACE
White White
Black/African-American Black/African-American
Asian
All Other Native Hawaiian/Pacific Islander
American Indian/Alaska Native
Other
CHILD'S HEALTH STATUS
Excellent Excellent - Very Good
Very Good
Good Good
Fair Fair - Poor
Poor
History of CAHPS® The CAHPS® 5.0H surveys are a set of standardized surveys that assess health plan member satisfaction with the experience of care. In October 1995, the Agency of Healthcare Research and Quality (AHRQ) began the CAHPS® initiative with researchers from Harvard Medical School, RAND, and Research Triangle Institute, Inc. The first survey data from the CAHPS® 2.0H survey was reported to NCQA in 1998. In 2002, a CAHPS® Instrument Panel was convened to reevaluate and update the CAHPS® 2.0H Surveys. The Panel evaluated consumer feedback, performed analyses on CAHPS® results, and conducted cognitive testing on proposed revisions. The outcome of the CAHPS® Instrument Panel was the revised set of surveys, CAHPS® 3.0H. The HEDIS® versions of the CAHPS® surveys were also updated to be consistent with the CAHPS® 3.0H surveys. In 2009, AHRQ replaced the CAHPS® 3.0H Child Survey with the CAHPS® Health Plan Survey 4.0H. In 2013, AHRQ replaced the CAHPS® Health Plan Survey 4.0H with the CAHPS® Health Plan Survey 5.0H as part of its Ambulatory CAHPS® initiative. The overarching goal of the CAHPS® 5.0H survey is to obtain information that is not available from any other source - the person receiving care.
2015 CAHPS 5.0H Child Medicaid Member Satisfaction Survey
C
June 2015
M150004
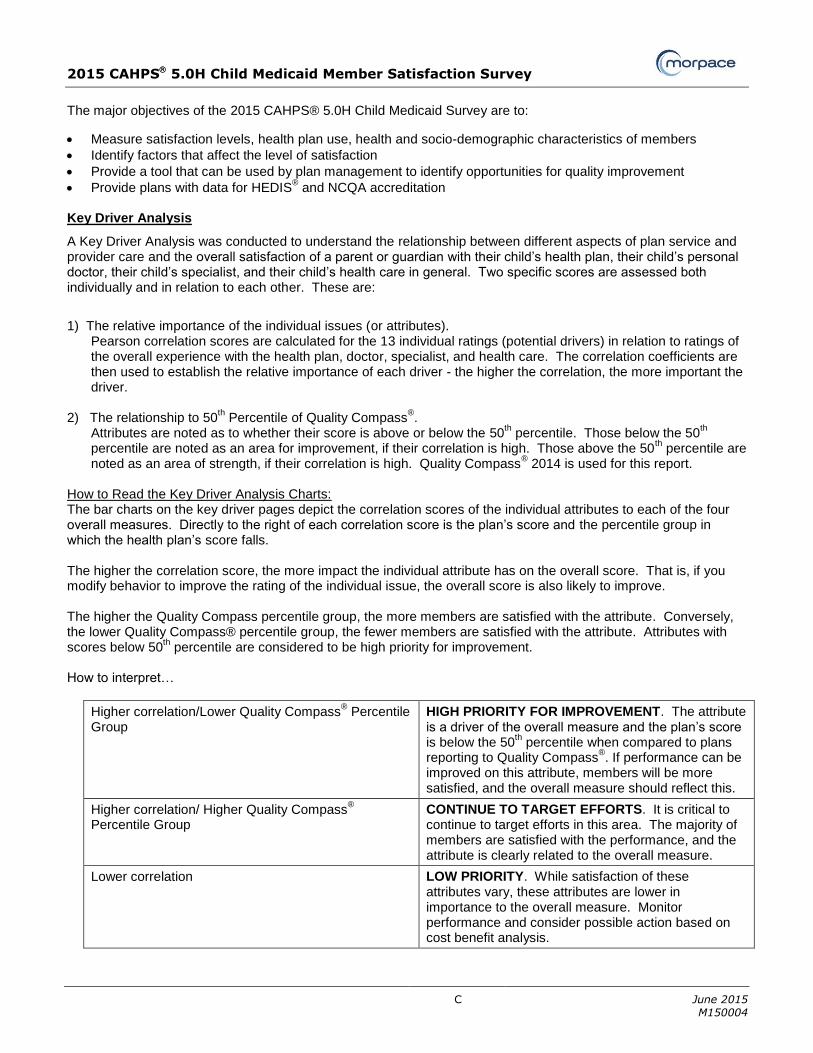
The major objectives of the 2015 CAHPS® 5.0H Child Medicaid Survey are to:
Measure satisfaction levels, health plan use, health and socio-demographic characteristics of members
Identify factors that affect the level of satisfaction
Provide a tool that can be used by plan management to identify opportunities for quality improvement
Provide plans with data for HEDIS® and NCQA accreditation
Key Driver Analysis
A Key Driver Analysis was conducted to understand the relationship between different aspects of plan service and provider care and the overall satisfaction of a parent or guardian with their child’s health plan, their child’s personal doctor, their child’s specialist, and their child’s health care in general. Two specific scores are assessed both individually and in relation to each other. These are:
1) The relative importance of the individual issues (or attributes).
Pearson correlation scores are calculated for the 13 individual ratings (potential drivers) in relation to ratings of the overall experience with the health plan, doctor, specialist, and health care. The correlation coefficients are then used to establish the relative importance of each driver - the higher the correlation, the more important the driver.
2) The relationship to 50
th Percentile of Quality Compass
®.
Attributes are noted as to whether their score is above or below the 50th percentile. Those below the 50
th
percentile are noted as an area for improvement, if their correlation is high. Those above the 50th percentile are
noted as an area of strength, if their correlation is high. Quality Compass® 2014 is used for this report.
How to Read the Key Driver Analysis Charts: The bar charts on the key driver pages depict the correlation scores of the individual attributes to each of the four overall measures. Directly to the right of each correlation score is the plan’s score and the percentile group in which the health plan’s score falls. The higher the correlation score, the more impact the individual attribute has on the overall score. That is, if you modify behavior to improve the rating of the individual issue, the overall score is also likely to improve. The higher the Quality Compass percentile group, the more members are satisfied with the attribute. Conversely, the lower Quality Compass® percentile group, the fewer members are satisfied with the attribute. Attributes with scores below 50
th percentile are considered to be high priority for improvement.
How to interpret…
Higher correlation/Lower Quality Compass® Percentile
Group HIGH PRIORITY FOR IMPROVEMENT. The attribute is a driver of the overall measure and the plan’s score is below the 50
th percentile when compared to plans
reporting to Quality Compass®. If performance can be
improved on this attribute, members will be more satisfied, and the overall measure should reflect this.
Higher correlation/ Higher Quality Compass®
Percentile Group CONTINUE TO TARGET EFFORTS. It is critical to continue to target efforts in this area. The majority of members are satisfied with the performance, and the attribute is clearly related to the overall measure.
Lower correlation LOW PRIORITY. While satisfaction of these attributes vary, these attributes are lower in importance to the overall measure. Monitor performance and consider possible action based on cost benefit analysis.

2015 CAHPS 5.0H Child Medicaid Member Satisfaction Survey
D
June 2015
M150004
Margin of Error The results presented in this report are obtained from a sample of the members of each plan; therefore, the estimates presented have a margin of error that should be considered. The following table shows the approximate margin of error for different combinations of sample sizes and the estimated proportions, using a 95% confidence level.
95% Confidence Interval for Sample Proportions Margin of Error
Number of
Valid Responses
Observed Proportion
90% | 10% 80% | 20% 70% | 30% 60% | 40% 50%
100 ±5.9% ±7.8% ±9.0% ±9.6% ±9.8%
200 ±4.2% ±5.5% ±6.4% ±6.8% ±6.9%
300 ±3.4% ±4.5% ±5.2% ±5.5% ±5.7%
400 ±2.9% ±3.9% ±4.5% ±4.8% ±4.9%
500 ±2.6% ±3.5% ±4.0% ±4.3% ±4.4%
Example of how to use this table: Assume that a plan obtains a rating of 50% for a given measure and the number of valid responses is 500. In this case we are 95% confident that the unknown population rating is between 45.6% and 54.4% (50%± 4.4%).
Assume that a plan obtains a rating of 70% for a given measure and the number of valid responses is 300. In this case we are 95% confident that the unknown population rating is between 64.8% and 75.2% (70%± 5.2%).
Percentiles
Percentiles displayed in this report are those provided in Quality Compass®. A percentile is a value on a scale of
one hundred that indicates the percent of the distribution that is equal to or below it. For example, if a plan’s score
falls in the 75th percentile compared to the Quality Compass®
that means 75% of plans represented in the Quality
Compass® have a score that is equal to or lower than it. Conversely, 25% of the plans in the Quality Compass
®
have a higher score. Quality Compass
® 2014
The Quality Compass® for the Child Medicaid database is compiled from performance data and member
satisfaction information from 94 Child Medicaid health plans who publicly reported their data to Quality Compass®.
Rating Questions
Responders are asked to rate four items (child’s personal physician, child’s specialist, child’s health care received, and overall experience with child’s health plan) from 0 to 10 with 0 being the worst and 10 being the best. Response Rate
Response rates are calculated according to the following NCQA method:
Final Response Rate = Completed surveys Plan’s total eligible sample* *Total eligible sample = Entire random sample – Ineligible
Ineligible are: deceased, does not meet eligible population criteria, language barrier, mentally or physically incapacitated.

2015 CAHPS 5.0H Child Medicaid Member Satisfaction Survey
E
June 2015
M150004
A survey is included in the analysis if the member answers one or more survey question and indicates that they meet the eligible population criteria.
SOURCE: Pages 63-64, Volume 3 HEDIS® 2015 Specifications for Survey Measures Sampling Criteria
The sample frame includes all current Medicaid health care members at the time the sample is drawn who are age 17 years and younger as of December 31 of the reporting year. Members must have been continuously enrolled in the health plan for the 6 months of the reporting year (allowing for no more than one gap of up to 45 days). The reporting year for the 2015 CAHPS® 5.0H surveys is January 1, 2014 to December 31, 2014. For each survey Morpace drew a random sample of enrollees making sure that only one child per household would be sampled. In 2015, NCQA required all plans to draw a base sample of 1,650 members. Scoring for NCQA Accreditation
The NCQA accreditation survey is based on 100 points with 33% of the results accounted for by HEDIS® measures and HEDIS®/CAHPS® 5.0H survey results. The HEDIS®/CAHPS® 5.0H survey results account for 13 of the 100 points. NCQA will calculate the Scoring for Accreditation on the General Population sample (also referred as the “CAHPS sample”).
Step 1: Convert responses to their score value. At the member level, the member’s response is recoded using a scale of 1-3 according to the following table.
CAHPS 5.0H Results Scoring Scale Based on Responses
Getting Needed Care (2 questions) Getting Care Quickly (2 questions) Never or Sometimes = 1 How Well Doctors Communicate (4 questions) Usually = 2 Customer Service (2 questions) Always = 3
Rating of Health Care 0, 1, 2, 3, 4, 5, 6 = 1 Rating of Personal Doctor 7, 8 = 2 Rating of Specialist 9, 10 = 3 Rating of Health Plan
Step 2: Calculate the mean for all members’ responses. For the composite measures, perform this calculation for each of the questions in the composite.
Step 3: Calculate the mean of the means for questions in that composite. The result of these calculations is the mean.
The CAHPS® survey represents a possible 13 points toward NCQA accreditation. Points are earned toward NCQA
accreditation by comparing the adjusted mean for each of the measures to the NCQA national benchmark (the 90th
percentile of national results) and to national thresholds (the 75th, 50th, 25th percentiles, and below the 25th percentile) for the same measure. NCQA does not publish the exact scores used in accreditation (calculated to the sixth decimal point). Therefore, Morpace cannot calculate the precise accreditation score. However, by adding up the individual composite and rating scores, an estimate of the overall accreditation score can be obtained.
For a composite’s score to be counted toward accreditation, an average of 100 responses for all questions within the composite must be obtained. If an average of 100 responses is not obtained, that measure is not counted and denoted with an “N/A”. The scoring is adjusted based on the number of reported measures according to the chart on the next page. If less than four of the measures qualify, no points are awarded from the survey.
2015 CAHPS 5.0H Child Medicaid Member Satisfaction Survey
F
June 2015
M150004
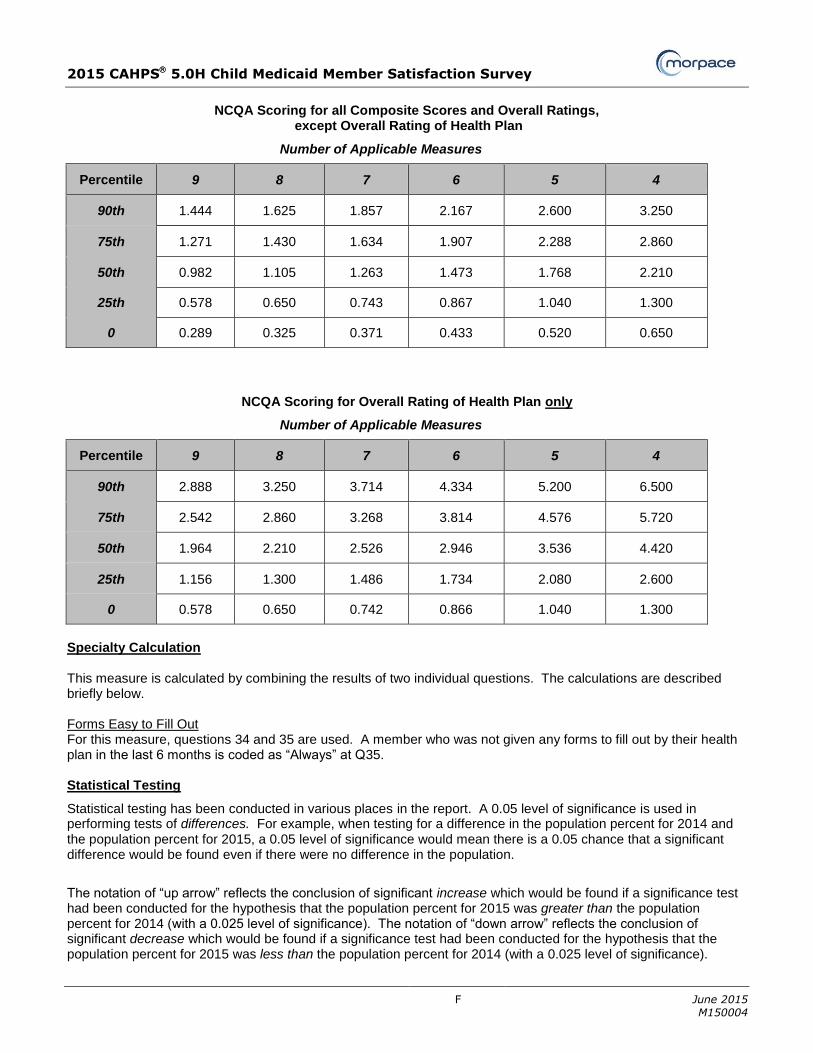
NCQA Scoring for all Composite Scores and Overall Ratings,
except Overall Rating of Health Plan
Number of Applicable Measures
Percentile 9 8 7 6 5 4
90th 1.444 1.625 1.857 2.167 2.600 3.250
75th 1.271 1.430 1.634 1.907 2.288 2.860
50th 0.982 1.105 1.263 1.473 1.768 2.210
25th 0.578 0.650 0.743 0.867 1.040 1.300
0 0.289 0.325 0.371 0.433 0.520 0.650
NCQA Scoring for Overall Rating of Health Plan only
Number of Applicable Measures
Percentile 9 8 7 6 5 4
90th 2.888 3.250 3.714 4.334 5.200 6.500
75th 2.542 2.860 3.268 3.814 4.576 5.720
50th 1.964 2.210 2.526 2.946 3.536 4.420
25th 1.156 1.300 1.486 1.734 2.080 2.600
0 0.578 0.650 0.742 0.866 1.040 1.300
Specialty Calculation This measure is calculated by combining the results of two individual questions. The calculations are described briefly below. Forms Easy to Fill Out For this measure, questions 34 and 35 are used. A member who was not given any forms to fill out by their health plan in the last 6 months is coded as “Always” at Q35. Statistical Testing
Statistical testing has been conducted in various places in the report. A 0.05 level of significance is used in performing tests of differences. For example, when testing for a difference in the population percent for 2014 and the population percent for 2015, a 0.05 level of significance would mean there is a 0.05 chance that a significant difference would be found even if there were no difference in the population.
The notation of “up arrow” reflects the conclusion of significant increase which would be found if a significance test had been conducted for the hypothesis that the population percent for 2015 was greater than the population percent for 2014 (with a 0.025 level of significance). The notation of “down arrow” reflects the conclusion of significant decrease which would be found if a significance test had been conducted for the hypothesis that the population percent for 2015 was less than the population percent for 2014 (with a 0.025 level of significance).

2015 CAHPS 5.0H Child Medicaid Member Satisfaction Survey
G
June 2015
M150004
Summary Rate Scoring
Summary rate scores are those scores used in comparing scores to Quality Compass® and in presenting data to the public. Summary Rates are calculated in the following manner:
CAHPS® 5.0H Measures Response = Summary Rate
Shared Decision Making (3 questions) Yes
Getting Care Quickly (2 questions) How Well Doctors Communicate (4 questions) Getting Needed Care (2 questions) Customer Service (2 questions)
Usually and Always
Rating of Personal Doctor Rating of Specialist Seen Most Often Rating of All Health Care Received Rating of Health Plan
8, 9, 10
Survey Administration Protocol and Timeline
NCQA has approved two options for survey administration of the CAHPS 5.0H survey: a 5-wave mail-only methodology or a mixed methodology (mail and telephone), which includes a 4-wave mail (two questionnaire mailings and two reminder postcards) with telephone follow-up of at least 3 attempts.
Mixed Methodology Tasks Time Frame
First questionnaire and cover letter sent to the member. 0 days
A postcard reminder is sent to non-responders 4-10 days after the 1st questionnaire. 4-10 days
A second questionnaire with replacement cover letter is sent to non-responders approximately 35 days after the mailing of the first questionnaire.
35 days
A second postcard reminder is sent to non-responders 4 to 10 days after mailing the second questionnaire.
39 – 45 days
Telephone calls by CATI are conducted for non-responders approximately 21 days after the mailing of the second questionnaire.
56 days
Telephone contact is made to all non-responders such that at least 3 calls are attempted at different times of day, on different days and in different weeks.
56 – 70 days
Telephone follow-up is completed approximately 14 days after initiation. 70 days
Mail-Only Methodology Tasks Time Frame
First questionnaire and cover letter sent to the member. 0 days
A postcard reminder is sent to non-responders 4-10 days after the 1st questionnaire. 4-10 days
A second questionnaire with replacement cover letter is sent to non-responders approximately 35 days after the mailing of the first questionnaire.
35 days
A second postcard reminder is sent to non-responders 4 to 10 days after mailing the second questionnaire.
39-45 days
A third questionnaire and cover letter is sent to non-responders approximately 25 days after mailing the second questionnaire.
60 days
Allow 21 days for the third questionnaire to be returned by the member. 81 days
SOURCE: Pages 59-60, Volume 3 HEDIS
® 2015 Specifications for Survey Measures
2015 CAHPS 5.0H Child Medicaid Member Satisfaction Survey
H
June 2015
M150004
The actual timeline followed for the 2015 survey was:
2/6 First questionnaire with cover letter sent to sample. 2/13 Postcard reminder sent to sample. 3/13 Second questionnaire and cover letter sent to non-responders. 3/20 Second postcard reminder sent to non-responders. 4/6 – 5/3 Contacted all non-responders via telephone – Up to 4 attempts were made at different
times of the day, different days of the week, and in different weeks. The text of the mailing pieces and the CATI (Computer Assisted Telephone Interviewing) script are prescribed by NCQA.
2015 CAHPS 5.0H Child Medicaid Member Satisfaction Survey
I
June 2015
M150004
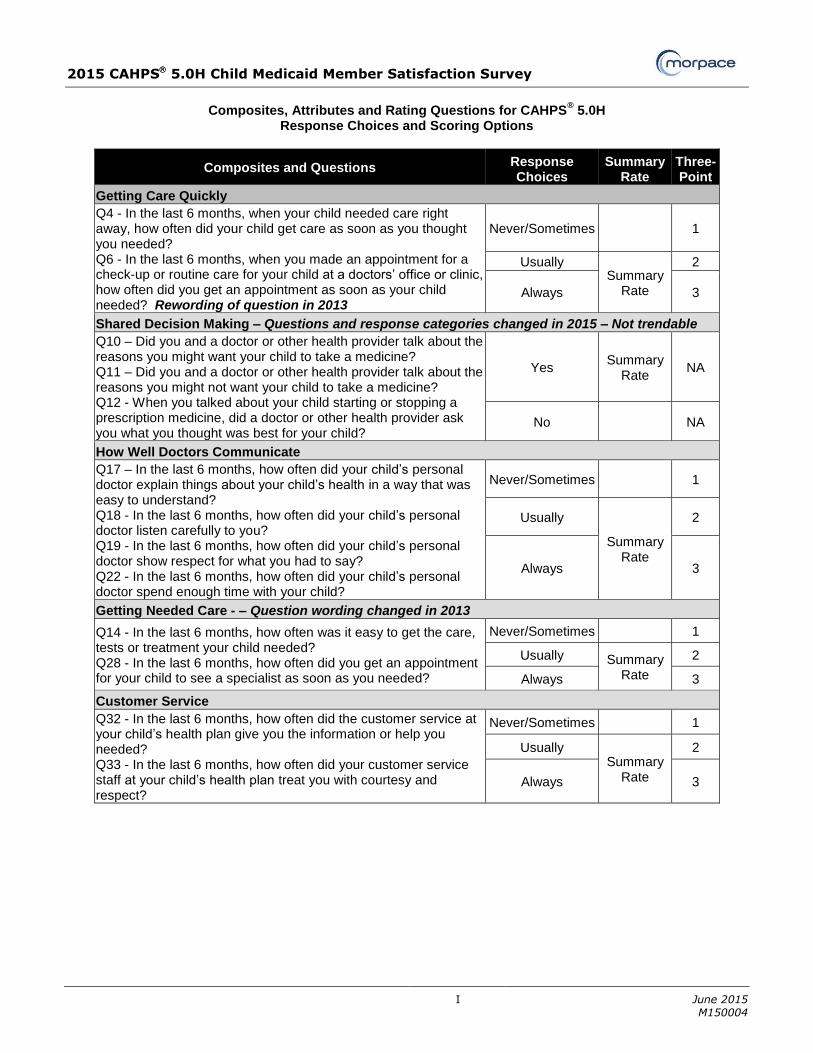
Composites, Attributes and Rating Questions for CAHPS
® 5.0H
Response Choices and Scoring Options
Composites and Questions Response Choices
Summary Rate
Three-Point
Getting Care Quickly
Q4 - In the last 6 months, when your child needed care right away, how often did your child get care as soon as you thought you needed? Q6 - In the last 6 months, when you made an appointment for a check-up or routine care for your child at a doctors’ office or clinic, how often did you get an appointment as soon as your child needed? Rewording of question in 2013
Never/Sometimes
1
Usually Summary
Rate
2
Always 3
Shared Decision Making – Questions and response categories changed in 2015 – Not trendable
Q10 – Did you and a doctor or other health provider talk about the reasons you might want your child to take a medicine? Q11 – Did you and a doctor or other health provider talk about the reasons you might not want your child to take a medicine? Q12 - When you talked about your child starting or stopping a prescription medicine, did a doctor or other health provider ask you what you thought was best for your child?
Yes Summary
Rate NA
No NA
How Well Doctors Communicate
Q17 – In the last 6 months, how often did your child’s personal doctor explain things about your child’s health in a way that was easy to understand? Q18 - In the last 6 months, how often did your child’s personal doctor listen carefully to you? Q19 - In the last 6 months, how often did your child’s personal doctor show respect for what you had to say? Q22 - In the last 6 months, how often did your child’s personal doctor spend enough time with your child?
Never/Sometimes 1
Usually
Summary Rate
2
Always 3
Getting Needed Care - – Question wording changed in 2013
Q14 - In the last 6 months, how often was it easy to get the care, tests or treatment your child needed? Q28 - In the last 6 months, how often did you get an appointment for your child to see a specialist as soon as you needed?
Never/Sometimes 1
Usually Summary Rate
2
Always 3
Customer Service
Q32 - In the last 6 months, how often did the customer service at your child’s health plan give you the information or help you needed? Q33 - In the last 6 months, how often did your customer service staff at your child’s health plan treat you with courtesy and respect?
Never/Sometimes 1
Usually Summary
Rate
2
Always 3
Related Documents