2015 ANNUAL REPORT iShares MSCI China Index ETF iShares FTSE A50 China Index ETF* (*This is a synthetic ETF) iShares S&P BSE SENSEX India Index ETF iShares MSCI AC Asia ex Japan Index ETF (formerly known as iShares MSCI Asia APEX 50 Index ETF) iShares MSCI Emerging Asia Index ETF iShares CSI 300 A-Share Index ETF* (*This is a synthetic ETF) iShares CSI A-Share Energy Index ETF* (*This is a synthetic ETF) iShares CSI A-Share Materials Index ETF* (*This is a synthetic ETF) iShares CSI A-Share Financials Index ETF* (*This is a synthetic ETF) iShares CSI A-Share Infrastructure Index ETF* (*This is a synthetic ETF) iShares CSI A-Share Consumer Discretionary Index ETF* (*This is a synthetic ETF) iShares CSI A-Share Consumer Staples Index ETF* (*This is a synthetic ETF) iShares RMB Bond Index ETF (Sub-funds of iShares Asia Trust) December 31, 2015

Welcome message from author
This document is posted to help you gain knowledge. Please leave a comment to let me know what you think about it! Share it to your friends and learn new things together.
Transcript
2015 AnnuAl RepoRt
iShares MSCI China Index etF
iShares FtSe A50 China Index etF* (*this is a synthetic etF)
iShares S&p BSe SenSeX India Index etF
iShares MSCI AC Asia ex Japan Index etF (formerly known as iShares MSCI Asia ApeX 50 Index etF)
iShares MSCI emerging Asia Index etF
iShares CSI 300 A-Share Index etF* (*this is a synthetic etF)
iShares CSI A-Share energy Index etF* (*this is a synthetic etF)
iShares CSI A-Share Materials Index etF* (*this is a synthetic etF)
iShares CSI A-Share Financials Index etF* (*this is a synthetic etF)
iShares CSI A-Share Infrastructure Index etF* (*this is a synthetic etF)
iShares CSI A-Share Consumer Discretionary Index etF* (*this is a synthetic etF)
iShares CSI A-Share Consumer Staples Index etF* (*this is a synthetic etF)
iShares RMB Bond Index etF
(Sub-funds of iShares Asia Trust)
December 31, 2015
2015 An
nu
Al R
ep
oR
t
D
ecem
ber 31, 2
015
1
iShares Asia TrustContents
Report of the Manager to the Unitholders . . . . . . . . . . . . . . . . . . . . . . . . . . . . . . . . . . . . . . . . . . . . . . . . . . . . . . . . . . . . . . . . . . . . . 3
Report of the Trustee to the Unitholders . . . . . . . . . . . . . . . . . . . . . . . . . . . . . . . . . . . . . . . . . . . . . . . . . . . . . . . . . . . . . . . . . . . . . 30
Statement of Responsibilities of the Manager and the Trustee . . . . . . . . . . . . . . . . . . . . . . . . . . . . . . . . . . . . . . . . . . . . . . . . . . . . 31
Independent Auditor’s Report . . . . . . . . . . . . . . . . . . . . . . . . . . . . . . . . . . . . . . . . . . . . . . . . . . . . . . . . . . . . . . . . . . . . . . . . . . . . . . 32
Statement of Financial Position . . . . . . . . . . . . . . . . . . . . . . . . . . . . . . . . . . . . . . . . . . . . . . . . . . . . . . . . . . . . . . . . . . . . . . . . . . . . 34
Statement of Comprehensive Income . . . . . . . . . . . . . . . . . . . . . . . . . . . . . . . . . . . . . . . . . . . . . . . . . . . . . . . . . . . . . . . . . . . . . . . . 43
Statement of Changes in Net Assets Attributable to Unitholders . . . . . . . . . . . . . . . . . . . . . . . . . . . . . . . . . . . . . . . . . . . . . . . . . . . 52
Statement of Cash Flows . . . . . . . . . . . . . . . . . . . . . . . . . . . . . . . . . . . . . . . . . . . . . . . . . . . . . . . . . . . . . . . . . . . . . . . . . . . . . . . . . 61
Notes to the Financial Statements . . . . . . . . . . . . . . . . . . . . . . . . . . . . . . . . . . . . . . . . . . . . . . . . . . . . . . . . . . . . . . . . . . . . . . . . . . 70
iShares MSCI China Index ETF . . . . . . . . . . . . . . . . . . . . . . . . . . . . . . . . . . . . . . . . . . . . . . . . . . . . . . . . . . . . . . . . . . . . . . . . . . . . 185
– Investment Portfolio (unaudited)
– Statement of Movements in Investment Portfolio (unaudited)
– Performance Record (unaudited)
iShares FTSE A50 China Index ETF* (*This is a synthetic ETF) . . . . . . . . . . . . . . . . . . . . . . . . . . . . . . . . . . . . . . . . . . . . . . . . . . . . 196
– Investment Portfolio (unaudited)
– Statement of Movements in Investment Portfolio (unaudited)
– Holdings of Collateral (unaudited)
– Performance Record (unaudited)
iShares S&P BSE SENSEX India Index ETF . . . . . . . . . . . . . . . . . . . . . . . . . . . . . . . . . . . . . . . . . . . . . . . . . . . . . . . . . . . . . . . . . . . 239
– Investment Portfolio (unaudited)
– Investment Portfolio of iShares BSE SENSEX Mauritius Company (unaudited)
– Statement of Movements in Investment Portfolio (unaudited)
– Performance Record (unaudited)
iShares MSCI AC Asia ex Japan Index ETF (formerly known as iShares MSCI Asia APEX 50 Index ETF) . . . . . . . . . . . . . . . . . . . . . 243
– Investment Portfolio (unaudited)
– Statement of Movements in Investment Portfolio (unaudited)
– Performance Record (unaudited)
iShares MSCI Emerging Asia Index ETF . . . . . . . . . . . . . . . . . . . . . . . . . . . . . . . . . . . . . . . . . . . . . . . . . . . . . . . . . . . . . . . . . . . . . 280
– Investment Portfolio (unaudited)
– Statement of Movements in Investment Portfolio (unaudited)
– Performance Record (unaudited)
iShares CSI 300 A-Share Index ETF* (*This is a synthetic ETF) . . . . . . . . . . . . . . . . . . . . . . . . . . . . . . . . . . . . . . . . . . . . . . . . . . . 302
– Investment Portfolio (unaudited)
– Statement of Movements in Investment Portfolio (unaudited)
– Holdings of Collateral (unaudited)
– Performance Record (unaudited)
iShares Asia TrustContents (continued)
iShares CSI A-Share Energy Index ETF* (*This is a synthetic ETF) . . . . . . . . . . . . . . . . . . . . . . . . . . . . . . . . . . . . . . . . . . . . . . . . . 337
– Investment Portfolio (unaudited)
– Statement of Movements in Investment Portfolio (unaudited)
– Holdings of Collateral (unaudited)
– Performance Record (unaudited)
iShares CSI A-Share Materials Index ETF* (*This is a synthetic ETF) . . . . . . . . . . . . . . . . . . . . . . . . . . . . . . . . . . . . . . . . . . . . . . . 342
– Investment Portfolio (unaudited)
– Statement of Movements in Investment Portfolio (unaudited)
– Holdings of Collateral (unaudited)
– Performance Record (unaudited)
iShares CSI A-Share Financials Index ETF* (*This is a synthetic ETF) . . . . . . . . . . . . . . . . . . . . . . . . . . . . . . . . . . . . . . . . . . . . . . . 352
– Investment Portfolio (unaudited)
– Statement of Movements in Investment Portfolio (unaudited)
– Holdings of Collateral (unaudited)
– Performance Record (unaudited)
iShares CSI A-Share Infrastructure Index ETF* (*This is a synthetic ETF) . . . . . . . . . . . . . . . . . . . . . . . . . . . . . . . . . . . . . . . . . . . . 361
– Investment Portfolio (unaudited)
– Statement of Movements in Investment Portfolio (unaudited)
– Holdings of Collateral (unaudited)
– Performance Record (unaudited)
iShares CSI A-Share Consumer Discretionary Index ETF* (*This is a synthetic ETF) . . . . . . . . . . . . . . . . . . . . . . . . . . . . . . . . . . . . 371
– Investment Portfolio (unaudited)
– Statement of Movements in Investment Portfolio (unaudited)
– Holdings of Collateral (unaudited)
– Performance Record (unaudited)
iShares CSI A-Share Consumer Staples Index ETF* (*This is a synthetic ETF) . . . . . . . . . . . . . . . . . . . . . . . . . . . . . . . . . . . . . . . . 379
– Investment Portfolio (unaudited)
– Statement of Movements in Investment Portfolio (unaudited)
– Holdings of Collateral (unaudited)
– Performance Record (unaudited)
iShares RMB Bond Index ETF . . . . . . . . . . . . . . . . . . . . . . . . . . . . . . . . . . . . . . . . . . . . . . . . . . . . . . . . . . . . . . . . . . . . . . . . . . . . . 387
– Investment Portfolio (unaudited)
– Statement of Movements in Investment Portfolio (unaudited)
– Performance Record (unaudited)
Management and Administration . . . . . . . . . . . . . . . . . . . . . . . . . . . . . . . . . . . . . . . . . . . . . . . . . . . . . . . . . . . . . . . . . . . . . . . . . . 397
3
RepoRT of The MAnAgeR To The UniTholdeRSiShares MSCI China Index ETF(a Sub-Fund of iShares Asia Trust)
IntroductionThe iShares MSCI China Index ETF (the “MSCI China ETF”) (the “Sub-Fund”), a sub-fund of the iShares Asia Trust (the “Trust”), was launched on 23rd November 2001 and commenced trading under the stock code 2801 on The Stock Exchange of Hong Kong Limited (the “SEHK”) on 28th November 2001 . The MSCI China ETF is a Hong Kong unit trust authorized under the Securities and Futures Ordinance (Cap . 571) of Hong Kong . The MSCI China ETF is benchmarked against the MSCI China Index . The Manager of the MSCI China ETF is BlackRock Asset Management North Asia Limited (the “Manager”) and the trustee is HSBC Institutional Trust Services (Asia) Limited (the “Trustee”) .
As of 31st December 2015, the MSCI China ETF invests in Chinese securities (H-shares, Red Chips and P Chips) listed on the SEHK and B-shares of Chinese securities listed on the Shanghai Stock Exchange and the Shenzhen Stock Exchange . Under the PRC Corporate Income Tax Law, the MSCI China ETF may be liable to pay PRC tax on the capital gains realized in the trading of these securities . However, no provision was made for taxation from such gains in the financial statements as the Manager believes that the MSCI China ETF can sustain a position for not filing a tax return based on the existing tax regulations and that the enforcement of such PRC tax on capital gains is not probable .
Fund PerformanceThe MSCI China ETF seeks to provide investment results, before fees and expenses, that closely correspond to the performance of the MSCI China Index in Hong Kong dollar (“HK$”) terms . As at 31st December 2015, the net asset value, applicable to primary market creations and redemptions (“Dealing NAV”) per unit of the MSCI China ETF was HK$18 .88, and there were 127,800,000 units outstanding . The total size of the Sub-Fund was approximately HK$2 .4 billion .
A summary of the performance of the MSCI China ETF(a) is given below .
Total Return(b) in HK$ (as at 31st December) 2015 2014 2013 2012 2011 2010 2009 2008
Since Inception(f)
MSCI China Index(c) -7 .88% 7 .98% 3 .68% 22 .50% -18 .48% 4 .89% 62 .37% -51 .12% 12 .46%
MSCI China ETF NAV-to-NAV(d) -8.18% 7.33% 3.06% 21.46% -18.87% 3.96% 59.16% -51.19% 11.50%
MSCI China ETF Market-to-Market (MKT)(e) -7 .28% 6 .98% 2 .43% 21 .88% -18 .99% 4 .50% 56 .86% -50 .64% 11 .29%
The MSCI China Index is a free-float adjusted market capitalization-weighted index that is compiled and published by MSCI Inc . It is designed to track the equity market performance of Chinese securities (H-shares, Red Chips and P Chips) listed on the SEHK and B-shares of Chinese securities listed on the Shanghai Stock Exchange and the Shenzhen Stock Exchange . The difference in performance between the MSCI China Index and the MSCI China ETF is mainly attributed to fees and expenses, and security misweights .
Fund ActivitiesThe average daily trading volume for the MSCI China ETF during the year was reported by Bloomberg to be approximately 803,138 units . As at 31st December 2015, the MSCI China ETF comprised 127,800,000 outstanding units .
In accordance with the Dividend Announcement on 24th November 2015, a final distribution of HK$0 .69 was declared . The ex-dividend date for the MSCI China ETF was 14th December 2015 and the record date was 15th December 2015 . The distribution was paid on 28th December 2015 .
(a) PastperformancefiguresshownarenotindicativeofthefutureperformanceoftheSub-Fund.(b) Totalreturnrepresentstheratethataninvestorwouldhaveearned(orlost)onaninvestment,assumingreinvestmentofalldividendsand
distributions.Calculatedasat31stDecember.(c) Aninvestorcannotinvestdirectlyinanindexandtheindexperformancereturnsdonotreflectmanagementfees,transactioncostsorother
expenses,whichwouldreduceperformancereturnsoftheSub-Fund.(d) UnitsintheSub-FundareissuedandredeemedatNAV.Therefore,theSub-FunddoesnotpublishabidpriceandtheSub-Fund’sreturnshavebeen
calculatedfromNAV.(e) Marketreturnsarecalculatedusinghistoricalmarketclosingprices(whenNAVisnormallydeterminedfortheSub-Fund),anddonotrepresentthe
returnsyouwouldreceiveifyoutradedunitsatothertimes.(f) Thisistheannualizedreturnsincefundinception.TheSub-Fundinceptiondateis23rdNovember2001.
Source:BlackRock,MorganStanleyCapitalInternational(MSCI)andWMCompany/Reuters
RepoRT of The MAnAgeR To The UniTholdeRSiShares MSCI China Index ETF(a Sub-Fund of iShares Asia Trust)
Index ActivitiesThe MSCI China Index underwent four regular reviews during the year . As at 31st December 2015, the MSCI China ETF held all constituents in the MSCI China Index .
MSCI Inc . has announced a change in the index methodology of its MSCI Global Investable Market Indexes (“MSCI GIMI”) . Effective from 1st December 2015, MSCI Inc . will enhance the coverage of the MSCI GIMI by including companies traded outside the country of classification (i .e . foreign listed companies) as eligible for inclusion in the MSCI GIMI . Such foreign listed companies will be included where they represent a material proportion of the index market capitalization and may include depositary receipts such as American Depositary Receipts (“ADRs”) . As such, MSCI China ETF may invest in such foreign listed companies, including ADRs, as part of its investment strategy and to meet its investment objective .
5
RepoRT of The MAnAgeR To The UniTholdeRSiShares FTSE A50 China Index ETF* (*This is a synthetic ETF)(a Sub-Fund of iShares Asia Trust)
IntroductionThe iShares FTSE A50 China Index ETF* (*This is a synthetic ETF) (the “A50 China ETF”) (the “Sub-Fund”), a sub-fund of the iShares Asia Trust (the “Trust”), was launched on 15th November 2004 and commenced trading under the stock code 2823 on The Stock Exchange of Hong Kong Limited (the “SEHK”) on 18th November 2004 . The A50 China ETF is a unit trust authorized under the Securities and Futures Ordinance (Cap . 571) of Hong Kong . The A50 China ETF is benchmarked against the FTSE China A50 Index (the “A50 Index”) . The Manager of the A50 China ETF is BlackRock Asset Management North Asia Limited (the “Manager”) and the trustee is HSBC Institutional Trust Services (Asia) Limited (the “Trustee”) .
The A50 China ETF may invest in a combination of A-Shares, physical A-Share exchange traded funds (“Physical A-Share ETFs”), as well as derivative instruments . These derivative instruments, referred to as China A-Share Access Products (“CAAPs”) are linked to A-Shares or an A-Share index and are intended to provide economic performance equivalent to holding the underlying A-Shares or the A-Share index . The CAAPs are issued by one or more Qualified Foreign Institutional Investors (“QFIIs”) or their affiliates (together, “CAAP Issuers”) . The Manager expanded its investment universe to include direct investments in A-Shares on behalf of the A50 China ETF through QFII quota, Renminbi Qualified Foreign Institutional Investor (“RQFII”) quota and through Stock Connect on 2nd August 2013, 1st September 2014 and 14th November 2014 respectively .
With effect from 19th August 2013, the A50 China ETF may invest up to 10% of its net asset value (“NAV”) in Physical A Share ETFs for cash management and contingency purposes . During the year and as of 31st December 2015, the A50 China ETF did not invest into any Physical A-Share ETFs .
With effect from 31st October 2011, the Manager is required to obtain collateral that represents at least 100% of the A50 China ETF’s gross total counterparty risk exposure so that there shall be no uncollateralized counterparty risk . Further, where collateral is taken in the nature of equity securities, the market value of the equity collateral should represent at least 120% of the related gross counterparty exposure . Where non-equity collateral is taken, a prudent haircut policy shall be adopted . Where the A50 China ETF is not fully collateralized due to circumstances beyond the control of the Manager, the Manager will procure such additional collateral to be delivered to the A50 China ETF as soon as practicable to comply with the above collateral requirements .
Under the general taxing provision of the PRC corporate tax law, which came into effect on 1st January 2008, a non-PRC tax resident enterprise, e .g ., QFII or RQFII, is subject to 10% withholding tax on PRC sourced interest income, dividends and capital gains provided that the non-PRC tax resident enterprise does not have its central management and control in the PRC or a PRC tax establishment . In practice, however, and prior to the recent release of Caishui [2014] No . 79 (“Circular 79”), the PRC tax authorities have not actively enforced taxation on capital gains arising from the sale of A-Shares by non-PRC tax resident enterprises, notwithstanding the fact the PRC State Council continued to not provide any specific income tax exemption on capital gains tax under PRC Corporate Income Tax Law .
On 14th November 2014, via the release of Circular 79 by the Ministry of Finance (“MOF”) in the PRC, the China Securities Regulatory Commission (“CSRC”), and the State Administration of Taxation (“SAT”) acting with State Council’s approval, a temporary exemption was provided to QFIIs/RQFIIs from tax on capital gains derived from the trading of A-Shares on or after 17th November 2014 . However, Circular 79 did also state that any gains realized prior to 17th November 2014 would be subject to tax in accordance with law .
Pursuant to Circular 79, the Manager realigned the provisioning policy of the A50 China ETF in respect of its underlying PRC investments in CAAPs and direct A-Shares . To date, the Manager is in the process of settling the withheld capital gains tax (“CGT”) amounts attributable to the CAAPs invested in by the A50 China ETF . Depending on whether the withheld provision of the A50 China ETF is greater or less than the amount of CGT attributable, there could be material adjustments to the net asset value (“NAV”) of the A50 China ETF, be it positive or negative . With respect to the A50 China ETF’s direct investments in A-Shares via its QFII and RQFII quotas, the A50 China ETF filed for relief under the respective Double Tax Agreement (“DTA”) with the PRC tax authorities and was subsequently approved . As such, a positive yet immaterial adjustment was made to the NAV of the A50 China ETF on 29th October 2015 to reflect the true-up between tax settlement and provision .
For further detail regarding these adjustments, please refer to the iShares Asia Trust Announcement released by the Manager on 24th November 2015 and 30th October 2015 .
Investors should note that there is an amount of realized gains on CAAPs for which a tax provision has not been made since inception of the A50 China ETF to 1st January 2008 . Should the PRC tax authorities require further provision to reflect any CGT shortfall on gains realized prior to 1st January 2008, it may significantly impact the NAV of the A50 China ETF .
RepoRT of The MAnAgeR To The UniTholdeRSiShares FTSE A50 China Index ETF* (*This is a synthetic ETF)(a Sub-Fund of iShares Asia Trust)
IntroductionWith respect to the A50 China ETF gains realized prior to 17th November 2014, in respect of its investments in CAAPs, the A50 China ETF will continue to maintain this provision . To date, the Manager is in the process of settling the withheld CGT amounts attributable to the CAAPs invested in by the A50 China ETF, and depending on whether the withheld provision of the A50 China ETF is greater or less than the amount of CGT attributable, there could be material adjustments to the net asset value of the A50 China ETF, be it positive or negative . As at 31st December 2015, approximately HK$753 million (2014: HK$916 million) has been withheld by certain CAAP Issuers on realized gains .
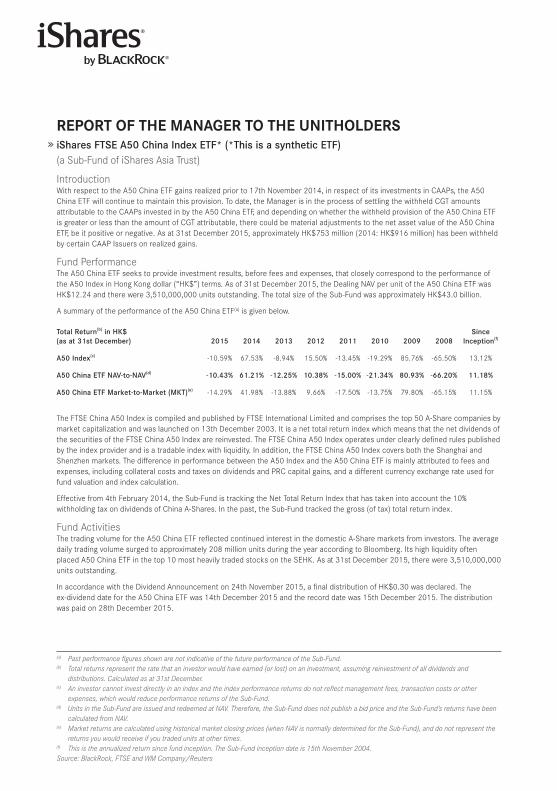
Fund PerformanceThe A50 China ETF seeks to provide investment results, before fees and expenses, that closely correspond to the performance of the A50 Index in Hong Kong dollar (“HK$”) terms . As of 31st December 2015, the Dealing NAV per unit of the A50 China ETF was HK$12 .24 and there were 3,510,000,000 units outstanding . The total size of the Sub-Fund was approximately HK$43 .0 billion .
A summary of the performance of the A50 China ETF(a) is given below .
Total Return(b) in HK$ (as at 31st December) 2015 2014 2013 2012 2011 2010 2009 2008
Since Inception(f)
A50 Index(c) -10 .59% 67 .53% -8 .94% 15 .50% -13 .45% -19 .29% 85 .76% -65 .50% 13 .12%
A50 China ETF NAV-to-NAV(d) -10.43% 61.21% -12.25% 10.38% -15.00% -21.34% 80.93% -66.20% 11.18%
A50 China ETF Market-to-Market (MKT)(e) -14 .29% 41 .98% -13 .88% 9 .66% -17 .50% -13 .75% 79 .80% -65 .15% 11 .15%
The FTSE China A50 Index is compiled and published by FTSE International Limited and comprises the top 50 A-Share companies by market capitalization and was launched on 13th December 2003 . It is a net total return index which means that the net dividends of the securities of the FTSE China A50 Index are reinvested . The FTSE China A50 Index operates under clearly defined rules published by the index provider and is a tradable index with liquidity . In addition, the FTSE China A50 Index covers both the Shanghai and Shenzhen markets . The difference in performance between the A50 Index and the A50 China ETF is mainly attributed to fees and expenses, including collateral costs and taxes on dividends and PRC capital gains, and a different currency exchange rate used for fund valuation and index calculation .
Effective from 4th February 2014, the Sub-Fund is tracking the Net Total Return Index that has taken into account the 10% withholding tax on dividends of China A-Shares . In the past, the Sub-Fund tracked the gross (of tax) total return index .
Fund ActivitiesThe trading volume for the A50 China ETF reflected continued interest in the domestic A-Share markets from investors . The average daily trading volume surged to approximately 208 million units during the year according to Bloomberg . Its high liquidity often placed A50 China ETF in the top 10 most heavily traded stocks on the SEHK . As at 31st December 2015, there were 3,510,000,000 units outstanding .
In accordance with the Dividend Announcement on 24th November 2015, a final distribution of HK$0 .30 was declared . The ex-dividend date for the A50 China ETF was 14th December 2015 and the record date was 15th December 2015 . The distribution was paid on 28th December 2015 .
(a) PastperformancefiguresshownarenotindicativeofthefutureperformanceoftheSub-Fund.(b) Totalreturnsrepresenttheratethataninvestorwouldhaveearned(orlost)onaninvestment,assumingreinvestmentofalldividendsand
distributions.Calculatedasat31stDecember.(c) Aninvestorcannotinvestdirectlyinanindexandtheindexperformancereturnsdonotreflectmanagementfees,transactioncostsorother
expenses,whichwouldreduceperformancereturnsoftheSub-Fund.(d) UnitsintheSub-FundareissuedandredeemedatNAV.Therefore,theSub-FunddoesnotpublishabidpriceandtheSub-Fund’sreturnshavebeen
calculatedfromNAV.(e) Marketreturnsarecalculatedusinghistoricalmarketclosingprices(whenNAVisnormallydeterminedfortheSub-Fund),anddonotrepresentthe
returnsyouwouldreceiveifyoutradedunitsatothertimes.(f) Thisistheannualizedreturnsincefundinception.TheSub-Fundinceptiondateis15thNovember2004.Source:BlackRock,FTSEandWMCompany/Reuters
7
RepoRT of The MAnAgeR To The UniTholdeRSiShares FTSE A50 China Index ETF* (*This is a synthetic ETF)(a Sub-Fund of iShares Asia Trust)
Index ActivitiesThe A50 Index underwent four regular quarterly reviews during the year . As at 31st December 2015, the A50 China ETF had exposure to all* of the constituents in the FTSE China A50 Index .
* The A50 China ETF held all the constituents comprising the FTSE China A50 Index, in which all the constituent were held both directly in listed equities and indirectly through CAAPs .
RepoRT of The MAnAgeR To The UniTholdeRSiShares S﹠P BSE SENSEX India Index ETF(a Sub-Fund of iShares Asia Trust)
IntroductionThe iShares S&P BSE SENSEX India Index ETF (the “SENSEX India ETF”) (the “Sub-Fund”), a sub-fund of the iShares Asia Trust (the “Trust”), was launched on 31st October 2006 and commenced trading under the stock code 2836 on The Stock Exchange of Hong Kong Limited (the “SEHK”) on 2nd November 2006 . The SENSEX India ETF is a Hong Kong unit trust authorized under the Securities and Futures Ordinance (Cap . 571) of Hong Kong . The SENSEX India ETF is benchmarked against the S&P BSE SENSEX Index (the “SENSEX Index”) . The Manager of the SENSEX India ETF is BlackRock Asset Management North Asia Limited (the “Manager”) and the trustee is HSBC Institutional Trust Services (Asia) Limited (the “Trustee”) .
Until June 2009, the SENSEX India ETF invested solely in derivative instruments . These derivative instruments, referred to as India Access Products (“IAPs”) were linked to the underlying Indian shares and were intended to provide economic performance equivalent to holding the underlying Indian shares . On 10th June 2009, the Manager announced its intention to restructure the SENSEX India ETF to allow it to invest directly in Indian securities in addition to IAPs . The restructuring involved the establishment of iShares BSE SENSEX Mauritius Company, a wholly owned subsidiary of the SENSEX India ETF incorporated in Mauritius (the “Mauritius Subsidiary”), to invest in Indian securities and/or IAPs . The restructure was completed on 22nd June 2009 .
Following the restructure: (a) the underlying investments of the Mauritius Subsidiary, together with the direct investments made by the SENSEX India ETF, must in aggregate comply with the SENSEX India ETF’s investment restrictions; (b) the SENSEX India ETF will not incur additional fees and expenses as a result of the establishment of the Mauritius Subsidiary as the Manager will rebate to the SENSEX India ETF the amount of ordinary fees and expenses incurred by the Mauritius Subsidiary (other than IAP commissions); and (c) the various reports required to be prepared for the SENSEX India ETF will be prepared in a single entity form as the Mauritius Subsidiary is no longer consolidated to SENSEX India ETF and is accounted for at fair value through profit or loss .
Following the restructure, the SENSEX India ETF may invest up to 15% of its net asset value in IAPs, with a maximum exposure to any single issuer of 10% of its net asset value . As indicated above, an IAP is a derivative instrument and is not the same as direct holding or investment in the underlying Indian shares .
India Tax Law ChangesThe President of India enacted the Finance Bill for 2012-13 on 28th May 2012 which contained key tax changes and clarifying amendments to the Indian Income Tax Act 1961 (the “Tax Act”) that essentially seek to bring into India taxation capital gains arising from the transfers of Indian securities both indirectly, via the indirect transfers thereof (retrospectively and prospectively), and directly via the introduction of general anti-avoidance rules (“GAAR”) . With the enactment of the 2015-16 Finance Act under the leadership of India’s Prime Minister, Mr . Modi, there was yet another deferral of the effective date of GAAR until 1st April 2017, but no detailed guidelines as to the implementation of GAAR have been issued as of yet, not even with the recently announced 2016-17 Finance Bill . As to the indirect transfer rules, though the 2015-16 Finance Act did provide some favourable threshold guidance, albeit prospective, as to the determination of whether a non-resident company derives the value of its shares substantially from assets located in India, in addition to an exemption from such rules to small shareholding (<5%) investors, it failed still to address all concerns to foreign investors . Uncertainties prevail as to the relevance and impact of indirect tax transfer rules to multi-tier fund structures, including the implications of possible retrospective enforcement . Though many of India’s actions since legislation of these rules seem to indicate that their indirect tax transfers rules are more broad-scoped than initially intended, India has still not provided sufficient clarity on such matters . More detailed guidelines and clarifications are much awaited .
As such, the returns of the SENSEX India ETF via its holdings in Indian investments may as a result be adversely impacted .
9
RepoRT of The MAnAgeR To The UniTholdeRSiShares S﹠P BSE SENSEX India Index ETF(a Sub-Fund of iShares Asia Trust)
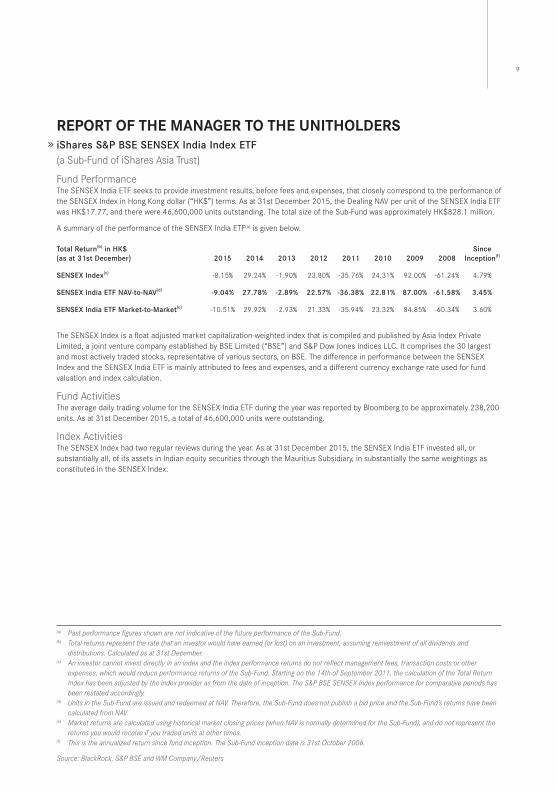
Fund PerformanceThe SENSEX India ETF seeks to provide investment results, before fees and expenses, that closely correspond to the performance of the SENSEX Index in Hong Kong dollar (“HK$”) terms . As at 31st December 2015, the Dealing NAV per unit of the SENSEX India ETF was HK$17 .77, and there were 46,600,000 units outstanding . The total size of the Sub-Fund was approximately HK$828 .1 million .
A summary of the performance of the SENSEX India ETF(a) is given below .
Total Return(b) in HK$ (as at 31st December) 2015 2014 2013 2012 2011 2010 2009 2008
Since Inception(f)
SENSEX Index(c) -8 .15% 29 .24% -1 .90% 23 .80% -35 .76% 24 .31% 92 .00% -61 .24% 4 .79%
SENSEX India ETF NAV-to-NAV(d) -9.04% 27.78% -2.89% 22.57% -36.38% 22.81% 87.00% -61.58% 3.45%
SENSEX India ETF Market-to-Market(e) -10 .51% 29 .92% -2 .93% 21 .33% -35 .94% 23 .32% 84 .85% -60 .34% 3 .60%
The SENSEX Index is a float adjusted market capitalization-weighted index that is compiled and published by Asia Index Private Limited, a joint venture company established by BSE Limited (“BSE”) and S&P Dow Jones Indices LLC . It comprises the 30 largest and most actively traded stocks, representative of various sectors, on BSE . The difference in performance between the SENSEX Index and the SENSEX India ETF is mainly attributed to fees and expenses, and a different currency exchange rate used for fund valuation and index calculation .
Fund ActivitiesThe average daily trading volume for the SENSEX India ETF during the year was reported by Bloomberg to be approximately 238,200 units . As at 31st December 2015, a total of 46,600,000 units were outstanding .
Index ActivitiesThe SENSEX Index had two regular reviews during the year . As at 31st December 2015, the SENSEX India ETF invested all, or substantially all, of its assets in Indian equity securities through the Mauritius Subsidiary, in substantially the same weightings as constituted in the SENSEX Index .
(a) PastperformancefiguresshownarenotindicativeofthefutureperformanceoftheSub-Fund.(b) Totalreturnsrepresenttheratethataninvestorwouldhaveearned(orlost)onaninvestment,assumingreinvestmentofalldividendsand
distributions.Calculatedasat31stDecember.(c) Aninvestorcannotinvestdirectlyinanindexandtheindexperformancereturnsdonotreflectmanagementfees,transactioncostsorother
expenses,whichwouldreduceperformancereturnsoftheSub-Fund.Startingonthe14thofSeptember2011,thecalculationoftheTotalReturnIndexhasbeenadjustedbytheindexproviderasfromthedateofinception.TheS&PBSESENSEXIndexperformanceforcomparativeperiodshasbeenrestatedaccordingly.
(d) UnitsintheSub-FundareissuedandredeemedatNAV.Therefore,theSub-FunddoesnotpublishabidpriceandtheSub-Fund’sreturnshavebeencalculatedfromNAV.
(e) Marketreturnsarecalculatedusinghistoricalmarketclosingprices(whenNAVisnormallydeterminedfortheSub-Fund),anddonotrepresentthereturnsyouwouldreceiveifyoutradedunitsatothertimes.
(f) Thisistheannualizedreturnsincefundinception.TheSub-Fundinceptiondateis31stOctober2006.
Source:BlackRock,S&PBSEandWMCompany/Reuters

RepoRT of The MAnAgeR To The UniTholdeRSiShares MSCI AC Asia ex Japan Index ETF(formerly known as iShares MSCI Asia APEX 50 Index ETF)(a Sub-Fund of iShares Asia Trust)
IntroductionThe iShares MSCI AC Asia ex Japan Index ETF (formerly known as iShares MSCI Asia APEX 50 Index ETF) (the “MSCI AC Asia ex Japan ETF (formerly known as MSCI Asia APEX 50 ETF)”) (the “Sub-Fund”), a sub-fund of the iShares Asia Trust (the “Trust”), was launched on 12th March 2009 and commenced trading under the stock code 3010 on The Stock Exchange of Hong Kong Limited (the “SEHK”) on 23rd April 2009 . The MSCI AC Asia ex Japan ETF (formerly known as MSCI Asia APEX 50 ETF) is a Hong Kong unit trust authorized under the Securities and Futures Ordinance (Cap . 571) of Hong Kong . The MSCI AC Asia ex Japan ETF (formerly known as MSCI Asia APEX 50 ETF) is benchmarked against the MSCI All Country Asia ex Japan Index, and, prior to 27th July 2015, MSCI Asia APEX 50 Index . The Manager of the MSCI AC Asia ex Japan ETF (formerly known as MSCI Asia APEX 50 ETF) is BlackRock Asset Management North Asia Limited (the “Manager”) and the trustee is HSBC Institutional Trust Services (Asia) Limited (the “Trustee”) .
From 27th July 2015, the name of iShares MSCI Asia APEX 50 Index ETF was changed to iShares MSCI AC Asia ex Japan Index ETF as a result of the change in underlying index . The underlying index was changed from MSCI Asia APEX 50 Index to MSCI All Country Asia ex Japan Index .
Fund PerformanceThe MSCI AC Asia ex Japan ETF (formerly known as MSCI Asia APEX 50 ETF) seeks to provide investment results, before fees and expenses, that closely correspond to the performance of the MSCI All Country Asia ex Japan Index, and, prior to 27th July 2015, the MSCI Asia APEX 50 Index, in Hong Kong dollar (“HK$”) terms . As at 31st December 2015, the Dealing NAV per unit of the MSCI AC Asia ex Japan ETF (formerly known as MSCI Asia APEX 50 ETF) was HK$38 .32, and there were 2,400,000 units outstanding . The total size of the Sub-Fund was approximately HK$92 .0 million .
A summary of the performance of the MSCI AC Asia ex Japan ETF (formerly known as MSCI Asia APEX 50 ETF)(a) is given below .
Total Return(b) in HK$ (as at 31st December) 2015 2014 2013 2012 2011 2010 2009 Since Inception
MSCI All Country Asia ex Japan Index(c) -7 .20% N/A N/A N/A N/A N/A N/A 13 .26%(g)
MSCI Asia APEX 50 Index(c) N/A 4.41% 6.34% 24.90% -12.71% 15.70% 79.62%(f) N/A
MSCI AC Asia ex Japan ETF(formerly known as MSCI Asia APEX 50 ETF) NAV-to-NAV(d) -8 .10% 3 .88% 5 .51% 24 .25% -13 .45% 15 .13% 78 .15%(f) 9 .33%(g)
MSCI AC Asia ex Japan ETF(formerly known as MSCI Asia APEX 50 ETF) Market-to-Market (MKT)(e) -8 .41% 4 .20% 6 .01% 22 .48% -12 .57% 15 .42% 44 .05%(h) 12 .45%(i)
The MSCI All Country Asia ex Japan Index is a free-float adjusted market capitalisation-weighted index that is compiled and published by MSCI Inc . It is designed to capture the large and mid cap representation across two of three developed markets countries (excluding Japan) and eight emerging markets countries in Asia . The MSCI AC Asia ex Japan ETF (formerly known as MSCI Asia APEX 50 ETF) will track the total return version of the MSCI All Country Asia ex Japan Index, net of dividend withholding tax .
(a) PastperformancefiguresshownarenotindicativeofthefutureperformanceoftheSub-Fund.(b) Totalreturnsrepresenttheratethataninvestorwouldhaveearned(orlost)onaninvestment,assumingreinvestmentofalldividendsand
distributions.Calculatedasat31stDecember.(c) Aninvestorcannotinvestdirectlyinanindexandtheindexperformancereturnsdonotreflectmanagementfees,transactioncostsorother
expenses,whichwouldreduceperformancereturnsoftheSub-Fund.(d) UnitsintheSub-FundareissuedandredeemedatNAV.Therefore,theSub-FunddoesnotpublishabidpriceandtheSub-Fund’sreturnshavebeen
calculatedfromNAV.(e) Marketreturnsarecalculatedusinghistoricalmarketclosingprices(whenNAVisnormallydeterminedfortheSub-Fund),anddonotrepresentthe
returnsyouwouldreceiveifyoutradedunitsatothertimes.(f) Theperformanceshownfor2009coverstheperiodfromthedateofinceptionoftheSub-Fund(12thMarch2009)to31stDecember2009.(g) Thisistheannualizedreturnsincefundinception.TheSub-Fundwasestablishedon12thMarch2009andlistedon23rdApril2009.(h) ThisisthereturnsincelistingoftheSub-Fund(23rdApril2009).(i) Thisistheannualizedreturnsincefundinception.TheSub-Fundinceptiondateis12thMarch2009.
Source:BlackRock,MorganStanleyCapitalInternational(MSCI)andWMCompany/Reuters
11
RepoRT of The MAnAgeR To The UniTholdeRSiShares MSCI AC Asia ex Japan Index ETF(formerly known as iShares MSCI Asia APEX 50 Index ETF)(a Sub-Fund of iShares Asia Trust)
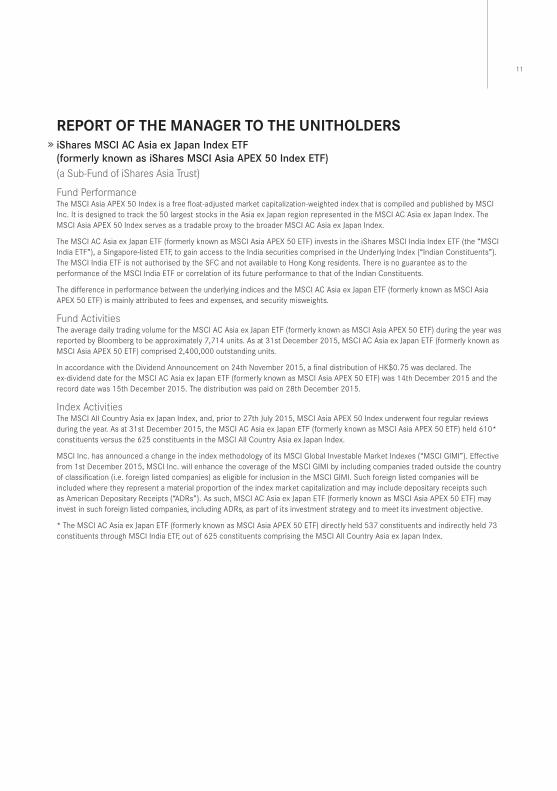
Fund PerformanceThe MSCI Asia APEX 50 Index is a free float-adjusted market capitalization-weighted index that is compiled and published by MSCI Inc . It is designed to track the 50 largest stocks in the Asia ex Japan region represented in the MSCI AC Asia ex Japan Index . The MSCI Asia APEX 50 Index serves as a tradable proxy to the broader MSCI AC Asia ex Japan Index .
The MSCI AC Asia ex Japan ETF (formerly known as MSCI Asia APEX 50 ETF) invests in the iShares MSCI India Index ETF (the “MSCI India ETF”), a Singapore-listed ETF, to gain access to the India securities comprised in the Underlying Index (“Indian Constituents”) . The MSCI India ETF is not authorised by the SFC and not available to Hong Kong residents . There is no guarantee as to the performance of the MSCI India ETF or correlation of its future performance to that of the Indian Constituents .
The difference in performance between the underlying indices and the MSCI AC Asia ex Japan ETF (formerly known as MSCI Asia APEX 50 ETF) is mainly attributed to fees and expenses, and security misweights .
Fund ActivitiesThe average daily trading volume for the MSCI AC Asia ex Japan ETF (formerly known as MSCI Asia APEX 50 ETF) during the year was reported by Bloomberg to be approximately 7,714 units . As at 31st December 2015, MSCI AC Asia ex Japan ETF (formerly known as MSCI Asia APEX 50 ETF) comprised 2,400,000 outstanding units .
In accordance with the Dividend Announcement on 24th November 2015, a final distribution of HK$0 .75 was declared . The ex-dividend date for the MSCI AC Asia ex Japan ETF (formerly known as MSCI Asia APEX 50 ETF) was 14th December 2015 and the record date was 15th December 2015 . The distribution was paid on 28th December 2015 .
Index ActivitiesThe MSCI All Country Asia ex Japan Index, and, prior to 27th July 2015, MSCI Asia APEX 50 Index underwent four regular reviews during the year . As at 31st December 2015, the MSCI AC Asia ex Japan ETF (formerly known as MSCI Asia APEX 50 ETF) held 610* constituents versus the 625 constituents in the MSCI All Country Asia ex Japan Index .
MSCI Inc . has announced a change in the index methodology of its MSCI Global Investable Market Indexes (“MSCI GIMI”) . Effective from 1st December 2015, MSCI Inc . will enhance the coverage of the MSCI GIMI by including companies traded outside the country of classification (i .e . foreign listed companies) as eligible for inclusion in the MSCI GIMI . Such foreign listed companies will be included where they represent a material proportion of the index market capitalization and may include depositary receipts such as American Depositary Receipts (“ADRs”) . As such, MSCI AC Asia ex Japan ETF (formerly known as MSCI Asia APEX 50 ETF) may invest in such foreign listed companies, including ADRs, as part of its investment strategy and to meet its investment objective .
* The MSCI AC Asia ex Japan ETF (formerly known as MSCI Asia APEX 50 ETF) directly held 537 constituents and indirectly held 73 constituents through MSCI India ETF, out of 625 constituents comprising the MSCI All Country Asia ex Japan Index .
RepoRT of The MAnAgeR To The UniTholdeRSiShares MSCI Emerging Asia Index ETF(a Sub-Fund of iShares Asia Trust)
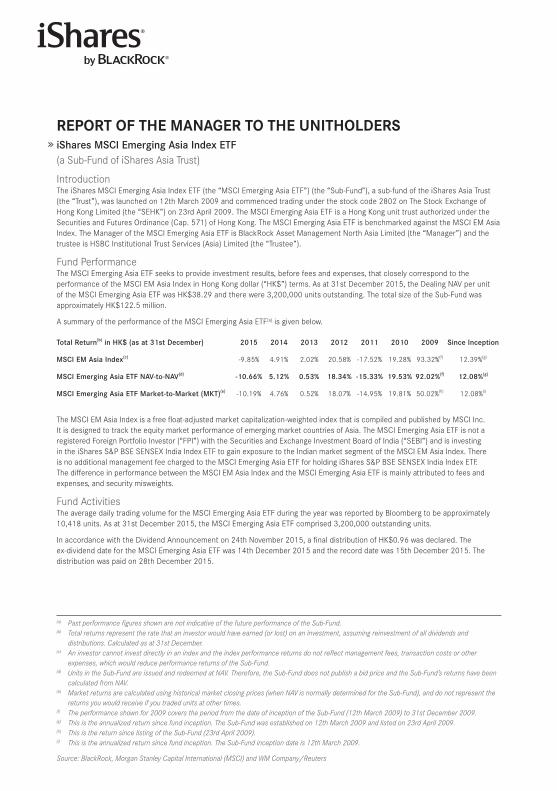
IntroductionThe iShares MSCI Emerging Asia Index ETF (the “MSCI Emerging Asia ETF”) (the “Sub-Fund”), a sub-fund of the iShares Asia Trust (the “Trust”), was launched on 12th March 2009 and commenced trading under the stock code 2802 on The Stock Exchange of Hong Kong Limited (the “SEHK”) on 23rd April 2009 . The MSCI Emerging Asia ETF is a Hong Kong unit trust authorized under the Securities and Futures Ordinance (Cap . 571) of Hong Kong . The MSCI Emerging Asia ETF is benchmarked against the MSCI EM Asia Index . The Manager of the MSCI Emerging Asia ETF is BlackRock Asset Management North Asia Limited (the “Manager”) and the trustee is HSBC Institutional Trust Services (Asia) Limited (the “Trustee”) .
Fund PerformanceThe MSCI Emerging Asia ETF seeks to provide investment results, before fees and expenses, that closely correspond to the performance of the MSCI EM Asia Index in Hong Kong dollar (“HK$”) terms . As at 31st December 2015, the Dealing NAV per unit of the MSCI Emerging Asia ETF was HK$38 .29 and there were 3,200,000 units outstanding . The total size of the Sub-Fund was approximately HK$122 .5 million .
A summary of the performance of the MSCI Emerging Asia ETF(a) is given below .
Total Return(b) in HK$ (as at 31st December) 2015 2014 2013 2012 2011 2010 2009 Since Inception
MSCI EM Asia Index(c) -9 .85% 4 .91% 2 .02% 20 .58% -17 .52% 19 .28% 93 .32%(f) 12 .39%(g)
MSCI Emerging Asia ETF NAV-to-NAV(d) -10.66% 5.12% 0.53% 18.34% -15.33% 19.53% 92.02%(f) 12.08%(g)
MSCI Emerging Asia ETF Market-to-Market (MKT)(e) -10 .19% 4 .76% 0 .52% 18 .07% -14 .95% 19 .81% 50 .02%(h) 12 .08%(i)
The MSCI EM Asia Index is a free float-adjusted market capitalization-weighted index that is compiled and published by MSCI Inc . It is designed to track the equity market performance of emerging market countries of Asia . The MSCI Emerging Asia ETF is not a registered Foreign Portfolio Investor (“FPI”) with the Securities and Exchange Investment Board of India (“SEBI”) and is investing in the iShares S&P BSE SENSEX India Index ETF to gain exposure to the Indian market segment of the MSCI EM Asia Index . There is no additional management fee charged to the MSCI Emerging Asia ETF for holding iShares S&P BSE SENSEX India Index ETF . The difference in performance between the MSCI EM Asia Index and the MSCI Emerging Asia ETF is mainly attributed to fees and expenses, and security misweights .
Fund ActivitiesThe average daily trading volume for the MSCI Emerging Asia ETF during the year was reported by Bloomberg to be approximately 10,418 units . As at 31st December 2015, the MSCI Emerging Asia ETF comprised 3,200,000 outstanding units .
In accordance with the Dividend Announcement on 24th November 2015, a final distribution of HK$0 .96 was declared . The ex-dividend date for the MSCI Emerging Asia ETF was 14th December 2015 and the record date was 15th December 2015 . The distribution was paid on 28th December 2015 .
(a) PastperformancefiguresshownarenotindicativeofthefutureperformanceoftheSub-Fund.(b) Totalreturnsrepresenttheratethataninvestorwouldhaveearned(orlost)onaninvestment,assumingreinvestmentofalldividendsand
distributions.Calculatedasat31stDecember.(c) Aninvestorcannotinvestdirectlyinanindexandtheindexperformancereturnsdonotreflectmanagementfees,transactioncostsorother
expenses,whichwouldreduceperformancereturnsoftheSub-Fund.(d) UnitsintheSub-FundareissuedandredeemedatNAV.Therefore,theSub-FunddoesnotpublishabidpriceandtheSub-Fund’sreturnshavebeen
calculatedfromNAV.(e) Marketreturnsarecalculatedusinghistoricalmarketclosingprices(whenNAVisnormallydeterminedfortheSub-Fund),anddonotrepresentthe
returnsyouwouldreceiveifyoutradedunitsatothertimes.(f) Theperformanceshownfor2009coverstheperiodfromthedateofinceptionoftheSub-Fund(12thMarch2009)to31stDecember2009.(g) Thisistheannualizedreturnsincefundinception.TheSub-Fundwasestablishedon12thMarch2009andlistedon23rdApril2009.(h) ThisisthereturnsincelistingoftheSub-Fund(23rdApril2009).(i) Thisistheannualizedreturnsincefundinception.TheSub-Fundinceptiondateis12thMarch2009.
Source:BlackRock,MorganStanleyCapitalInternational(MSCI)andWMCompany/Reuters
13
RepoRT of The MAnAgeR To The UniTholdeRSiShares MSCI Emerging Asia Index ETF(a Sub-Fund of iShares Asia Trust)
Index ActivitiesThe MSCI EM Asia Index underwent four regular reviews during the year . As at 31st December 2015, the MSCI Emerging Asia ETF held 361* constituents versus the 554 constituents in the MSCI EM Asia Index .
MSCI Inc . has announced a change in the index methodology of its MSCI Global Investable Market Indexes (“MSCI GIMI”) . Effective from 1st December 2015, MSCI Inc . will enhance the coverage of the MSCI GIMI by including companies traded outside the country of classification (i .e . foreign listed companies) as eligible for inclusion in the MSCI GIMI . Such foreign listed companies will be included where they represent a material proportion of the index market capitalization and may include depositary receipts such as American Depositary Receipts (“ADRs”) . As such, MSCI Emerging Asia ETF may invest in such foreign listed companies, including ADRs, as part of its investment strategy and to meet its investment objective .
*The MSCI Emerging Asia ETF directly held 333 constituents and indirectly held 28 constituents through SENSEX India ETF, out of 554 constituents comprising the MSCI EM Asia Index .
RepoRT of The MAnAgeR To The UniTholdeRSiShares CSI 300 A-Share Index ETF* (*This is a synthetic ETF)(a Sub-Fund of iShares Asia Trust)
IntroductionThe iShares CSI 300 A-Share Index ETF* (*This is a synthetic ETF) (the “CSI 300 A-Share ETF”) (the “Sub-Fund”), a sub-fund of the iShares Asia Trust (the “Trust”), was launched on 12th November 2009 and commenced trading under the stock code 2846 on The Stock Exchange of Hong Kong Limited (the “SEHK”) on 18th November 2009 . The CSI 300 A-Share ETF is a Hong Kong unit trust authorized under the Securities and Futures Ordinance (Cap . 571) of Hong Kong . The CSI 300 A-Share ETF is benchmarked against the CSI 300 Index . The Manager of the CSI 300 A-Share ETF is BlackRock Asset Management North Asia Limited (the “Manager”) and the trustee is HSBC Institutional Trust Services (Asia) Limited (the “Trustee”) .
The CSI 300 A-Share ETF can invest solely in China A-Share Access Products (“CAAPs”) or a combination of the iShares CSI Sector Index Funds and CAAPs linked to the sectors of the CSI 300 Index in roughly the same proportions as those sectors represent in the CSI 300 Index (subject to a maximum deviation from each sector weight of 3%) . CAAPs are derivative instruments linking to A-Shares and are intended to provide economic performance equivalent to holding the underlying A-Shares . iShares CSI Sector Index Funds also invests in CAAPs . The CSI 300 A-Share ETF does not invest in or hold A-Shares directly . The CAAPs are issued by one or more Qualified Foreign Institutional Investors (“QFIIs”) or their affiliates (together, “CAAP Issuers”) . The Manager shall ensure that neither the CSI 300 A-Share ETF nor unitholders of the CSI 300 A-Share ETF will suffer any increase in the overall total of initial charges, management fee, or any other costs and charges payable to the Manager as a result of the CSI 300 A-Share ETF’s investment in the iShares CSI Sector Index Funds . As at 31st December 2015, the CSI 300 A-Share ETF invests in CAAPs only .
With effect from 31st October 2011, the Manager is required to obtain collateral that represents at least 100% of the CSI 300 A-Share ETF’s gross total counterparty risk exposure so that there shall be no uncollateralized counterparty risk . Further, where collateral is taken in the nature of equity securities, the market value of the equity collateral should represent at least 120% of the related gross counterparty exposure . Where non-equity collateral is taken, a prudent haircut policy shall be adopted . Where the CSI 300 A-Share ETF is not fully collateralized due to circumstances beyond the control of the Manager, the Manager will procure such additional collateral to be delivered to the CSI 300 A-Share ETF as soon as practicable to comply with the above collateral requirements .
Under the general taxing provision of the PRC corporate tax law, which came into effect on 1st January 2008, a non-PRC tax resident enterprise, e .g ., QFII or RQFII, is subject to 10% withholding tax on PRC sourced interest income, dividends and capital gains, provided that the non-PRC tax resident enterprise does not have its central management and control in the PRC or a PRC tax establishment . In practice, however, and prior to the recent release of Caishui [2014] No . 79 (“Circular 79”), the PRC tax authorities have not actively enforced taxation on capital gains arising from the sale of A-Shares by non-PRC tax resident enterprises, notwithstanding the fact the PRC State Council continued to not provide any specific income tax exemption on capital gains tax under PRC Corporate Income Tax Law .
On 14th November 2014, via the release of Circular 79 by the Ministry of Finance (“MOF”) in the PRC, the China Securities Regulatory Commission (“CSRC”), and the State Administration of Taxation (“SAT”) acting with State Council’s approval, a temporary exemption was provided to QFIIs/RQFIIs from tax on capital gains derived from the trading of A-Shares on or after 17th November 2014 . However, Circular 79 did also state that any gains realized prior to 17th November 2014 would be subject to tax in accordance with law .
Pursuant to Circular 79, the Manager realigned the provisioning policy of the CSI 300 A-Share ETF in respect of its underlying PRC investments in CAAP . To date, the Manager is in the process of settling the withheld CGT amounts attributable to the CAAPs invested in by the CSI 300 A-Share ETF . Depending on whether the withheld provision of the CSI 300 A-Share ETF is greater or less than the amount of CGT attributable, there could be material adjustments to the net asset value (“NAV”) of the CSI 300 A-Share ETF, be it positive or negative .
For further detail regarding these adjustments, please refer to the iShares Asia Trust Announcement released by the Manager on 24th November 2015 and 30th October 2015 .
With respect to the CSI 300 A-Share ETF gains realized prior to 17th November 2014, in respect of its investments in CAAPs, the CSI 300 A-Share ETF will continue to maintain this provision . To date, the Manager is in the process of settling the withheld CGT amounts attributable to the CAAPs invested in by the CSI 300 A-Share ETF, and depending on whether the withheld provision of the CSI 300 A-Share ETF is greater or less than the amount of CGT attributable, there could be material adjustments to the net asset value of the CSI 300 A-Share ETF, be it positive or negative . As at 31st December 2015, approximately HK$4 .5 million (2014: HK$7 .0 million) has been withheld by certain CAAP Issuers on realized gains .

15
RepoRT of The MAnAgeR To The UniTholdeRSiShares CSI 300 A-Share Index ETF* (*This is a synthetic ETF)(a Sub-Fund of iShares Asia Trust)
Fund PerformanceThe CSI 300 A-Share ETF seeks to provide investment results, before fees and expenses, that closely correspond to the performance of the CSI 300 Index in Hong Kong dollar (“HK$”) terms . As at 31st December 2015, the Dealing NAV per unit of the CSI 300 A-Share ETF was HK$29 .25, and there were 10,000,000 units outstanding . The total size of the Sub-Fund was approximately HK$292 .5 million .
A summary of the performance of the CSI 300 A-Share ETF(a) is given below .
Total Return(b) in HK$ (as at 31st December) 2015 2014 2013 2012 2011 2010 2009(f) Since Inception(g)
CSI 300 Index(c) 0 .79% 54 .92% -2 .54% 10 .70% -20 .55% -8 .16% 2 .21% 3 .18%
CSI 300 A-Share ETF NAV-to-NAV(d) 0.34% 51.18% -6.62% 1.56% -24.65% -4.63% 2.37% 0.12%
CSI 300 A-Share ETF Market-to-Market (MKT)(e) -3 .25% 38 .99% -10 .74% 8 .36% -28 .81% -2 .44% 2 .15% 0 .93%
The CSI 300 Index is a free-float market capitalization-weighted index that is compiled and published by China Securities Index Co ., Ltd (“CSI”) since 31st December 2004 . The index universe of CSI 300 Index includes all the A Shares listed on the Shanghai Stock Exchange (the Main Board) and the Shenzhen Stock Exchange (the Main Board, the SME Board (Small and Medium Enterprise Board) and ChiNext (the board mainly for hi-tech companies)) satisfying the criteria prescribed by CSI . The difference in performance between the CSI 300 Index and the CSI 300 A-Share ETF is mainly attributed to fees and expenses, including collateral costs and taxes on dividends and PRC capital gains, and a different currency exchange rate used for fund valuation and index calculation .
Effective from 4th February 2014, the Sub-Fund is tracking the Net Total Return Index that has taken into account the 10% withholding tax on dividends of China A-Shares . In the past, the Sub-Fund tracked the gross (of tax) total return index .
Fund ActivitiesThe average daily trading volume for the CSI 300 A-Share ETF during the year was reported by Bloomberg to be approximately 80,712 units . As at 31st December 2015, the CSI 300 A-Share ETF comprised 10,000,000 outstanding units .
In accordance with the Dividend Announcement on 24th November 2015, a final distribution of HK$0 .44 was declared . The ex-dividend date for the CSI 300 A-Share ETF was 14th December 2015 and the record date was 15th December 2015 . The distribution was paid on 28th December 2015 .
Index ActivitiesThe CSI 300 Index underwent two regular reviews during the year . As at 31st December 2015, the CSI 300 A-Share ETF held all constituents in the CSI 300 Index indirectly .
(a) PastperformancefiguresshownarenotindicativeofthefutureperformanceoftheSub-Fund.(b) Totalreturnsrepresenttheratethataninvestorwouldhaveearned(orlost)onaninvestment,assumingreinvestmentofalldividendsand
distributions.Calculatedasat31stDecember.(c) Aninvestorcannotinvestdirectlyinanindexandtheindexperformancereturnsdonotreflectmanagementfees,transactioncostsorother
expenses,whichwouldreduceperformancereturnsoftheSub-Fund.(d) UnitsintheSub-FundareissuedandredeemedatNAV.Therefore,theSub-FunddoesnotpublishabidpriceandtheSub-Fund’sreturnshavebeen
calculatedfromNAV.(e) Marketreturnsarecalculatedusinghistoricalmarketclosingprices(whenNAVisnormallydeterminedfortheSub-Fund),anddonotrepresentthe
returnsyouwouldreceiveifyoutradedunitsatothertimes.(f) Theperformanceshownfor2009coverstheperiodfromthedateofinceptionoftheSub-Fund(12thNovember2009)to31stDecember2009.(g) Thisistheannualizedreturnsincefundinception.TheSub-Fundwasestablishedon12thNovember2009andlistedon18thNovember2009.
Source:BlackRock,ChinaSecuritiesIndexCoLtd(CSI)andWMCompany/Reuters
RepoRT of The MAnAgeR To The UniTholdeRSiShares CSI A-Share Energy Index ETF* (*This is a synthetic ETF)(a Sub-Fund of iShares Asia Trust)
IntroductionThe iShares CSI A-Share Energy Index ETF* (*This is a synthetic ETF) (the “CSI A-Share Energy ETF”) (the “Sub-Fund”), a sub-fund of the iShares Asia Trust (the “Trust”), was launched on 12th November 2009 and commenced trading under the stock code 3050 on The Stock Exchange of Hong Kong Limited (the “SEHK”) on 18th November 2009 . The CSI A-Share Energy ETF is a Hong Kong unit trust authorized under the Securities and Futures Ordinance (Cap . 571) of Hong Kong . The CSI A-Share Energy ETF is benchmarked against the CSI 300 Energy Index . The Manager of the CSI A-Share Energy ETF is BlackRock Asset Management North Asia Limited (the “Manager”) and the trustee is HSBC Institutional Trust Services (Asia) Limited (the “Trustee”) .
The CSI A-Share Energy ETF invests in derivative instruments . These derivative instruments, referred to as China A-Share Access Products (“CAAPs”) are linked to A-Shares and are intended to provide economic performance equivalent to holding the underlying A-Shares . The CSI A-Share Energy ETF does not invest in or hold A-Shares directly . The CAAPs are issued by one or more Qualified Foreign Institutional Investors (“QFIIs”) or their affiliates (together, “CAAP Issuers”) .
With effect from 31st October 2011, the Manager is required to obtain collateral that represents at least 100% of the CSI A-Share Energy ETF’s gross total counterparty risk exposure so that there shall be no uncollateralized counterparty risk . Further, where collateral is taken in the nature of equity securities, the market value of the equity collateral should represent at least 120% of the related gross counterparty exposure . Where non-equity collateral is taken, a prudent haircut policy shall be adopted . Where the CSI A-Share Energy ETF is not fully collateralized due to circumstances beyond the control of the Manager, the Manager will procure such additional collateral to be delivered to the CSI A-Share Energy ETF as soon as practicable to comply with the above collateral requirements .
Under the general taxing provision of the PRC corporate tax law, which came into effect on 1st January 2008, a non-PRC tax resident enterprise, e .g ., QFII or RQFII, is subject to 10% withholding tax on PRC sourced interest income, dividends and capital gains, provided that the non-PRC tax resident enterprise does not have its central management and control in the PRC or a PRC tax establishment . In practice, however, and prior to the recent release of Caishui [2014] No . 79 (“Circular 79”), the PRC tax authorities have not actively enforced taxation on capital gains arising from the sale of A-Shares by non-PRC tax resident enterprises, notwithstanding the fact the PRC State Council continued to not provide any specific income tax exemption on capital gains tax under PRC Corporate Income Tax Law .
On 14th November 2014, via the release of Circular 79 by the Ministry of Finance (“MOF”) in the PRC, the China Securities Regulatory Commission (“CSRC”), and the State Administration of Taxation (“SAT”) acting with State Council’s approval, a temporary exemption was provided to QFIIs/RQFIIs from tax on capital gains derived from the trading of A-Shares on or after 17th November 2014 . However, Circular 79 did also state that any gains realized prior to 17th November 2014 would be subject to tax in accordance with law .
Pursuant to Circular 79, the Manager realigned the provisioning policy of the CSI A-Share Energy ETF in respect of its underlying PRC investments in CAAP . To date, the Manager is in the process of settling the withheld CGT amounts attributable to the CAAPs invested in by the CSI A-Share Energy ETF . Depending on whether the withheld provision of the CSI A-Share Energy ETF is greater or less than the amount of CGT attributable, there could be material adjustments to the net asset value (“NAV”) of the CSI A-Share Energy ETF, be it positive or negative .
For further detail regarding these adjustments, please refer to the iShares Asia Trust Announcement released by the Manager on 24th November 2015 and 30th October 2015 .
With respect to the CSI A-Share Energy ETF gains realized prior to 17th November 2014, in respect of its investments in CAAPs, the CSI A-Share Energy ETF will continue to maintain this provision . To date, the Manager is in the process of settling the withheld CGT amounts attributable to the CAAPs invested in by the CSI A-Share Energy ETF, and depending on whether the withheld provision of the CSI A-Share Energy ETF is greater or less than the amount of CGT attributable, there could be material adjustments to the net asset value of the CSI A-Share Energy ETF, be it positive or negative . As at 31st December 2015, approximately HK$1 .2 million (2014: HK$1 .4 million) has been withheld by certain CAAP Issuers on realized gains .
17
RepoRT of The MAnAgeR To The UniTholdeRSiShares CSI A-Share Energy Index ETF* (*This is a synthetic ETF)(a Sub-Fund of iShares Asia Trust)
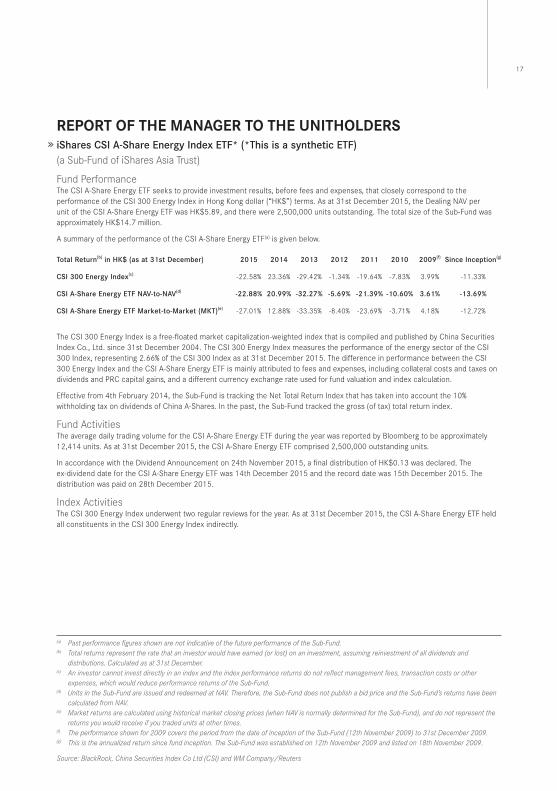
Fund PerformanceThe CSI A-Share Energy ETF seeks to provide investment results, before fees and expenses, that closely correspond to the performance of the CSI 300 Energy Index in Hong Kong dollar (“HK$”) terms . As at 31st December 2015, the Dealing NAV per unit of the CSI A-Share Energy ETF was HK$5 .89, and there were 2,500,000 units outstanding . The total size of the Sub-Fund was approximately HK$14 .7 million .
A summary of the performance of the CSI A-Share Energy ETF(a) is given below .
Total Return(b) in HK$ (as at 31st December) 2015 2014 2013 2012 2011 2010 2009(f) Since Inception(g)
CSI 300 Energy Index(c) -22 .58% 23 .36% -29 .42% -1 .34% -19 .64% -7 .83% 3 .99% -11 .33%
CSI A-Share Energy ETF NAV-to-NAV(d) -22.88% 20.99% -32.27% -5.69% -21.39% -10.60% 3.61% -13.69%
CSI A-Share Energy ETF Market-to-Market (MKT)(e) -27 .01% 12 .88% -33 .35% -8 .40% -23 .69% -3 .71% 4 .18% -12 .72%
The CSI 300 Energy Index is a free-floated market capitalization-weighted index that is compiled and published by China Securities Index Co ., Ltd . since 31st December 2004 . The CSI 300 Energy Index measures the performance of the energy sector of the CSI 300 Index, representing 2 .66% of the CSI 300 Index as at 31st December 2015 . The difference in performance between the CSI 300 Energy Index and the CSI A-Share Energy ETF is mainly attributed to fees and expenses, including collateral costs and taxes on dividends and PRC capital gains, and a different currency exchange rate used for fund valuation and index calculation .
Effective from 4th February 2014, the Sub-Fund is tracking the Net Total Return Index that has taken into account the 10% withholding tax on dividends of China A-Shares . In the past, the Sub-Fund tracked the gross (of tax) total return index .
Fund ActivitiesThe average daily trading volume for the CSI A-Share Energy ETF during the year was reported by Bloomberg to be approximately 12,414 units . As at 31st December 2015, the CSI A-Share Energy ETF comprised 2,500,000 outstanding units .
In accordance with the Dividend Announcement on 24th November 2015, a final distribution of HK$0 .13 was declared . The ex-dividend date for the CSI A-Share Energy ETF was 14th December 2015 and the record date was 15th December 2015 . The distribution was paid on 28th December 2015 .
Index ActivitiesThe CSI 300 Energy Index underwent two regular reviews for the year . As at 31st December 2015, the CSI A-Share Energy ETF held all constituents in the CSI 300 Energy Index indirectly .
(a) PastperformancefiguresshownarenotindicativeofthefutureperformanceoftheSub-Fund.(b) Totalreturnsrepresenttheratethataninvestorwouldhaveearned(orlost)onaninvestment,assumingreinvestmentofalldividendsand
distributions.Calculatedasat31stDecember.(c) Aninvestorcannotinvestdirectlyinanindexandtheindexperformancereturnsdonotreflectmanagementfees,transactioncostsorother
expenses,whichwouldreduceperformancereturnsoftheSub-Fund.(d) UnitsintheSub-FundareissuedandredeemedatNAV.Therefore,theSub-FunddoesnotpublishabidpriceandtheSub-Fund’sreturnshavebeen
calculatedfromNAV.(e) Marketreturnsarecalculatedusinghistoricalmarketclosingprices(whenNAVisnormallydeterminedfortheSub-Fund),anddonotrepresentthe
returnsyouwouldreceiveifyoutradedunitsatothertimes.(f) Theperformanceshownfor2009coverstheperiodfromthedateofinceptionoftheSub-Fund(12thNovember2009)to31stDecember2009.(g) Thisistheannualizedreturnsincefundinception.TheSub-Fundwasestablishedon12thNovember2009andlistedon18thNovember2009.
Source:BlackRock,ChinaSecuritiesIndexCoLtd(CSI)andWMCompany/Reuters

RepoRT of The MAnAgeR To The UniTholdeRSiShares CSI A-Share Materials Index ETF* (*This is a synthetic ETF)(a Sub-Fund of iShares Asia Trust)
IntroductionThe iShares CSI A-Share Materials Index ETF* (*This is a synthetic ETF) (the “CSI A-Share Materials ETF”) (the “Sub-Fund”), a sub-fund of the iShares Asia Trust (the “Trust”), was launched on 12th November 2009 and commenced trading under the stock code 3039 on The Stock Exchange of Hong Kong Limited (the “SEHK”) on 18th November 2009 . The CSI A-Share Materials ETF is a Hong Kong unit trust authorized under the Securities and Futures Ordinance (Cap . 571) of Hong Kong . The CSI A-Share Materials ETF is benchmarked against the CSI 300 Materials Index . The Manager of the CSI A-Share Materials ETF is BlackRock Asset Management North Asia Limited (the “Manager”) and the trustee is HSBC Institutional Trust Services (Asia) Limited (the “Trustee”) .
The CSI A-Share Materials ETF invests in derivative instruments . These derivative instruments, referred to as China A-Share Access Products (“CAAPs”) are linked to A-Shares and are intended to provide economic performance equivalent to holding the underlying A-Shares . The CSI A-Share Materials ETF does not invest in or hold A-Shares directly . The CAAPs are issued by one or more Qualified Foreign Institutional Investors (“QFIIs”) or their affiliates (together, “CAAP Issuers”) .
With effect from 31st October 2011, the Manager is required to obtain collateral that represents at least 100% of the CSI A-Share Materials ETF’s gross total counterparty risk exposure so that there shall be no uncollateralized counterparty risk . Further, where collateral is taken in the nature of equity securities, the market value of the equity collateral should represent at least 120% of the related gross counterparty exposure . Where non-equity collateral is taken, a prudent haircut policy shall be adopted . Where the CSI A-Share Materials ETF is not fully collateralized due to circumstances beyond the control of the Manager, the Manager will procure such additional collateral to be delivered to the CSI A-Share Materials ETF as soon as practicable to comply with the above collateral requirements .
Under the general taxing provision of the PRC corporate tax law, which came into effect on 1st January 2008, a non-PRC tax resident enterprise, e .g ., QFII or RQFII, is subject to 10% withholding tax on PRC sourced interest income, dividends and capital gains, provided that the non-PRC tax resident enterprise does not have its central management and control in the PRC or a PRC tax establishment . In practice, however, and prior to the recent release of Caishui [2014] No . 79 (“Circular 79”), the PRC tax authorities have not actively enforced taxation on capital gains arising from the sale of A-Shares by non-PRC tax resident enterprises, notwithstanding the fact the PRC State Council continued to not provide any specific income tax exemption on capital gains tax under PRC Corporate Income Tax Law .
On 14th November 2014, via the release of Circular 79 by the Ministry of Finance (“MOF”) in the PRC, the China Securities Regulatory Commission (“CSRC”), and the State Administration of Taxation (“SAT”) acting with State Council’s approval, a temporary exemption was provided to QFIIs/RQFIIs from tax on capital gains derived from the trading of A-Shares on or after 17th November 2014 . However, Circular 79 did also state that any gains realized prior to 17th November 2014 would be subject to tax in accordance with law .
Pursuant to Circular 79, the Manager realigned the provisioning policy of the CSI A-Share Materials ETF in respect of its underlying PRC investments in CAAP . To date, the Manager is in the process of settling the withheld CGT amounts attributable to the CAAPs invested in by the CSI A-Share Materials ETF . Depending on whether the withheld provision of CSI A-Share Materials ETF is greater or less than the amount of CGT attributable, there could be material adjustments to the net asset value (“NAV”) of the CSI A-Share Materials ETF, be it positive or negative .
For further detail regarding these adjustments, please refer to the iShares Asia Trust Announcement released by the Manager on 30th October 2015 .
With respect to the CSI A-Share Materials ETF gains realized prior to 17th November 2014, in respect of its investment in CAAPs, the CSI A-Share Materials ETF will continue to maintain this provision . To date, the Manager is in the process of settling the withheld CGT amounts attributable to the CAAPs invested in by the CSI A-Share Materials ETF, and depending on whether the withheld provision of the CSI A-Share Materials ETF is greater or less than the amount of CGT attributable, there could be material adjustments to the net asset value of the CSI A-Share Materials ETF, be it positive or negative . As at 31st December 2015, approximately HK$3 .5 million (2014: HK$4 .9 million) has been withheld by certain CAAP Issuers on realized gains .

19
RepoRT of The MAnAgeR To The UniTholdeRSiShares CSI A-Share Materials Index ETF* (*This is a synthetic ETF)(a Sub-Fund of iShares Asia Trust)
Fund PerformanceThe CSI A-Share Materials ETF seeks to provide investment results, before fees and expenses, that closely correspond to the performance of the CSI 300 Materials Index in Hong Kong dollar (“HK$”) terms . As at 31st December 2015, the Dealing NAV per unit of the CSI A-Share Materials ETF was HK$10 .13 and there were 1,000,000 units outstanding . The total size of the Sub-Fund was approximately HK$10 .1 million .
A summary of the performance of the CSI A-Share Materials ETF(a) is given below .
Total Return(b) in HK$ (as at 31st December) 2015 2014 2013 2012 2011 2010 2009(f) Since Inception(g)
CSI 300 Materials Index(c) -7 .01% 41 .05% -25 .97% 7 .97% -34 .21% 1 .87% 4 .23% -5 .53%
CSI A-Share Materials ETF NAV-to-NAV(d) 4.09% 37.41% -28.73% 2.45% -35.61% -0.91% 3.93% -6.39%
CSI A-Share Materials ETF Market-to-Market (MKT)(e) -3 .03% 29 .07% -30 .76% 0 .37% -37 .08% 7 .28% 3 .84% -5 .81%
The CSI 300 Materials Index is a free-float market capitalization-weighted index that is compiled and published by China Securities Index Co, Ltd . since 31st December 2004 . The CSI 300 Materials Index measures the performance of the materials sector of the CSI 300 Index, representing 5 .45% of the CSI 300 Index as at 31st December 2015 . The difference in performance between the CSI 300 Materials Index and the CSI A-Share Materials ETF is mainly attributed to fees and expenses, including collateral costs and taxes on dividends and PRC capital gains, and a different currency exchange rate used for fund valuation and index calculation .
Effective from 4th February 2014, the Sub-Fund is tracking the Net Total Return Index that has taken into account the 10% withholding tax on dividends of China A-Shares . In the past, the Sub-Fund tracked the gross (of tax) total return index .
Fund ActivitiesThe average daily trading volume for the CSI A-Share Materials ETF during the year was reported by Bloomberg to be approximately 8,838 units . As at 31st December 2015, the CSI A-Share Materials ETF comprised 1,000,000 outstanding units .
In accordance with the Dividend Announcement on 24th November 2015, a final distribution of HK$0 .09 was declared . The ex-dividend date for the CSI A-Share Materials ETF was 14th December 2015 and the record date was 15th December 2015 . The distribution was paid on 28th December 2015 .
Index ActivitiesThe CSI 300 Materials Index underwent two regular reviews during the year . As at 31st December 2015, the CSI A-Share Materials ETF held all constituents in the CSI 300 Materials Index indirectly .
(a) PastperformancefiguresshownarenotindicativeofthefutureperformanceoftheSub-Fund.(b) Totalreturnsrepresenttheratethataninvestorwouldhaveearned(orlost)onaninvestment,assumingreinvestmentofalldividendsand
distributions.Calculatedasat31stDecember.(c) Aninvestorcannotinvestdirectlyinanindexandtheindexperformancereturnsdonotreflectmanagementfees,transactioncostsorother
expenses,whichwouldreduceperformancereturnsoftheSub-Fund.(d) UnitsintheSub-FundareissuedandredeemedatNAV.Therefore,theSub-FunddoesnotpublishabidpriceandtheSub-Fund’sreturnshavebeen
calculatedfromNAV.(e) Marketreturnsarecalculatedusinghistoricalmarketclosingprices(whenNAVisnormallydeterminedfortheSub-Fund),anddonotrepresentthe
returnsyouwouldreceiveifyoutradedunitsatothertimes.(f) Theperformanceshownfor2009coverstheperiodfromthedateofinceptionoftheSub-Fund(12thNovember2009)to31stDecember2009.(g) Thisistheannualizedreturnsincefundinception.TheSub-Fundwasestablishedon12thNovember2009andlistedon18thNovember2009.
Source:BlackRock,ChinaSecuritiesIndexCoLtd(CSI)andWMCompany/Reuters
RepoRT of The MAnAgeR To The UniTholdeRSiShares CSI A-Share Financials Index ETF* (*This is a synthetic ETF)(a Sub-Fund of iShares Asia Trust)
IntroductionThe iShares CSI A-Share Financials Index ETF* (*This is a synthetic ETF) (the “CSI A-Share Financials ETF”) (the “Sub-Fund”), a sub-fund of the iShares Asia Trust (the “Trust”), was launched on 12th November 2009 and commenced trading under the stock code 2829 on The Stock Exchange of Hong Kong Limited (the “SEHK”) on 18th November 2009 . The CSI A-Share Financials ETF is a Hong Kong unit trust authorized under the Securities and Futures Ordinance (Cap . 571) of Hong Kong . The CSI A-Share Financials ETF is benchmarked against the CSI 300 Financials Index . The Manager of the CSI A-Share Financials ETF is BlackRock Asset Management North Asia Limited (the “Manager”) and the trustee is HSBC Institutional Trust Services (Asia) Limited (the “Trustee”) .
The CSI A-Share Financials ETF invests in derivative instruments . These derivative instruments, referred to as China A-Share Access Products (“CAAPs”) are linked to A-Shares and are intended to provide economic performance equivalent to holding the underlying A-Shares . The CSI A-Share Financials ETF does not invest in or hold A-Shares directly . The CAAPs are issued by one or more Qualified Foreign Institutional Investors (“QFIIs”) or their affiliates (together, “CAAP Issuers”) .
With effect from 31st October 2011, the Manager is required to obtain collateral that represents at least 100% of the CSI A-Share Financials ETF’s gross total counterparty risk exposure so that there shall be no uncollateralized counterparty risk . Further, where collateral is taken in the nature of equity securities, the market value of the equity collateral should represent at least 120% of the related gross counterparty exposure . Where non-equity collateral is taken, a prudent haircut policy shall be adopted . Where the CSI A-Share Financials ETF is not fully collateralized due to circumstances beyond the control of the Manager, the Manager will procure such additional collateral to be delivered to the CSI A-Share Financials ETF as soon as practicable to comply with the above collateral requirements .
Under the general taxing provision of the PRC corporate tax law, which came into effect on 1st January 2008, a non-PRC tax resident enterprise, e .g ., QFII or RQFII, is subject to 10% withholding tax on PRC sourced interest income, dividends and capital gains, provided that the non-PRC tax resident enterprise does not have its central management and control in the PRC or a PRC tax establishment . In practice, however, and prior to the recent release of Caishui [2014] No . 79 (“Circular 79”), the PRC tax authorities have not actively enforced taxation on capital gains arising from the sale of A-Shares by non-PRC tax resident enterprises, notwithstanding the fact the PRC State Council continued to not provide any specific income tax exemption on capital gains tax under PRC Corporate Income Tax Law .
On 14th November 2014, via the release of Circular 79 by the Ministry of Finance (“MOF”) in the PRC, the China Securities Regulatory Commission (“CSRC”), and the State Administration of Taxation (“SAT”) acting with State Council’s approval, a temporary exemption was provided to QFIIs/RQFIIs from tax on capital gains derived from the trading of A-Shares on or after 17th November 2014 . However, Circular 79 did also state that any gains realized prior to 17th November 2014 would be subject to tax in accordance with law .
Pursuant to Circular 79, the Manager realigned the provisioning policy of the CSI A-Share Financials ETF in respect of its underlying PRC investments in CAAP . To date, the Manager is in the process of settling the withheld CGT amounts attributable to the CAAPs invested in by the CSI A-Share Financials ETF . Depending on whether the withheld provision of CSI A-Share Financials ETF is greater or less than the amount of CGT attributable, there could be material adjustments to the net asset value (“NAV”) of the CSI A-Share Financials ETF, be it positive or negative .
For further detail regarding these adjustments, please refer to the iShares Asia Trust Announcement released by the Manager on 24th November 2015 and 30th October 2015 .
With respect to the CSI A-Share Financials ETF gains realized prior to 17th November 2014, in respect of its investments in CAAPs, the CSI A-Share Financials ETF will continue to maintain this provision . To date, the Manager is in the process of settling the withheld CGT amounts attributable to the CAAPs invested in by the CSI A-Share Financials ETF, and depending on whether the withheld provision of the CSI A-Share Financials ETF is greater or less than the amount of CGT attributable, there could be material adjustments to the net asset value of the CSI A-Share Financials ETF, be it positive or negative . As at 31st December 2015, approximately HK$4 .8 million (2014: HK$5 .0 million) has been withheld by certain CAAP Issuers on realized gains .
21
RepoRT of The MAnAgeR To The UniTholdeRSiShares CSI A-Share Financials Index ETF* (*This is a synthetic ETF)(a Sub-Fund of iShares Asia Trust)
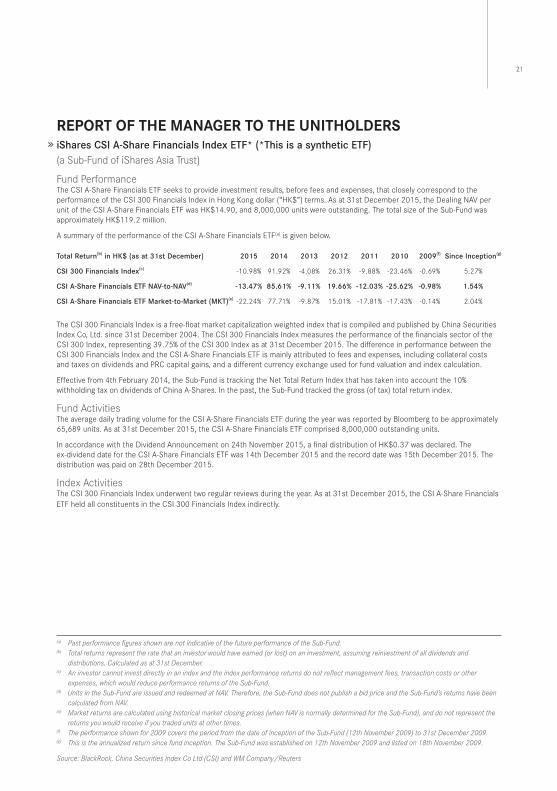
Fund PerformanceThe CSI A-Share Financials ETF seeks to provide investment results, before fees and expenses, that closely correspond to the performance of the CSI 300 Financials Index in Hong Kong dollar (“HK$”) terms . As at 31st December 2015, the Dealing NAV per unit of the CSI A-Share Financials ETF was HK$14 .90, and 8,000,000 units were outstanding . The total size of the Sub-Fund was approximately HK$119 .2 million .
A summary of the performance of the CSI A-Share Financials ETF(a) is given below .
Total Return(b) in HK$ (as at 31st December) 2015 2014 2013 2012 2011 2010 2009(f) Since Inception(g)
CSI 300 Financials Index(c) -10 .98% 91 .92% -4 .08% 26 .31% -9 .88% -23 .46% -0 .69% 5 .27%
CSI A-Share Financials ETF NAV-to-NAV(d) -13.47% 85.61% -9.11% 19.66% -12.03% -25.62% -0.98% 1.54%
CSI A-Share Financials ETF Market-to-Market (MKT)(e) -22 .24% 77 .71% -9 .87% 15 .01% -17 .81% -17 .43% -0 .14% 2 .04%
The CSI 300 Financials Index is a free-float market capitalization weighted index that is compiled and published by China Securities Index Co, Ltd . since 31st December 2004 . The CSI 300 Financials Index measures the performance of the financials sector of the CSI 300 Index, representing 39 .75% of the CSI 300 Index as at 31st December 2015 . The difference in performance between the CSI 300 Financials Index and the CSI A-Share Financials ETF is mainly attributed to fees and expenses, including collateral costs and taxes on dividends and PRC capital gains, and a different currency exchange used for fund valuation and index calculation .
Effective from 4th February 2014, the Sub-Fund is tracking the Net Total Return Index that has taken into account the 10% withholding tax on dividends of China A-Shares . In the past, the Sub-Fund tracked the gross (of tax) total return index .
Fund ActivitiesThe average daily trading volume for the CSI A-Share Financials ETF during the year was reported by Bloomberg to be approximately 65,689 units . As at 31st December 2015, the CSI A-Share Financials ETF comprised 8,000,000 outstanding units .
In accordance with the Dividend Announcement on 24th November 2015, a final distribution of HK$0 .37 was declared . The ex-dividend date for the CSI A-Share Financials ETF was 14th December 2015 and the record date was 15th December 2015 . The distribution was paid on 28th December 2015 .
Index ActivitiesThe CSI 300 Financials Index underwent two regular reviews during the year . As at 31st December 2015, the CSI A-Share Financials ETF held all constituents in the CSI 300 Financials Index indirectly .
(a) PastperformancefiguresshownarenotindicativeofthefutureperformanceoftheSub-Fund.(b) Totalreturnsrepresenttheratethataninvestorwouldhaveearned(orlost)onaninvestment,assumingreinvestmentofalldividendsand
distributions.Calculatedasat31stDecember.(c) Aninvestorcannotinvestdirectlyinanindexandtheindexperformancereturnsdonotreflectmanagementfees,transactioncostsorother
expenses,whichwouldreduceperformancereturnsoftheSub-Fund.(d) UnitsintheSub-FundareissuedandredeemedatNAV.Therefore,theSub-FunddoesnotpublishabidpriceandtheSub-Fund’sreturnshavebeen
calculatedfromNAV.(e) Marketreturnsarecalculatedusinghistoricalmarketclosingprices(whenNAVisnormallydeterminedfortheSub-Fund),anddonotrepresentthe
returnsyouwouldreceiveifyoutradedunitsatothertimes.(f) Theperformanceshownfor2009coverstheperiodfromthedateofinceptionoftheSub-Fund(12thNovember2009)to31stDecember2009.(g) Thisistheannualizedreturnsincefundinception.TheSub-Fundwasestablishedon12thNovember2009andlistedon18thNovember2009.
Source:BlackRock,ChinaSecuritiesIndexCoLtd(CSI)andWMCompany/Reuters

RepoRT of The MAnAgeR To The UniTholdeRSiShares CSI A-Share Infrastructure Index ETF* (*This is a synthetic ETF)(a Sub-Fund of iShares Asia Trust)
IntroductionThe iShares CSI A-Share Infrastructure Index ETF* (*This is a synthetic ETF) (the “CSI A-Share Infrastructure ETF”) (the “Sub-Fund”), a sub-fund of the iShares Asia Trust (the “Trust”), was launched on 12th November 2009 and commenced trading under the stock code 3006 on The Stock Exchange of Hong Kong Limited (the “SEHK”) on 18th November 2009 . The CSI A-Share Infrastructure ETF is a Hong Kong unit trust authorized under the Securities and Futures Ordinance (Cap . 571) of Hong Kong . The CSI A-Share Infrastructure ETF is benchmarked against the CSI 300 Infrastructure Index . The Manager of the CSI A-Share Infrastructure ETF is BlackRock Asset Management North Asia Limited (the “Manager”) and the trustee is HSBC Institutional Trust Services (Asia) Limited (the “Trustee”) .
The CSI A-Share Infrastructure ETF invests in derivative instruments . These derivative instruments, referred to as China A-Share Access Products (“CAAPs”) are linked to A-Shares and are intended to provide economic performance equivalent to holding the underlying A-Shares . The CSI A-Share Infrastructure ETF does not invest in or hold A-Shares directly . The CAAPs are issued by one or more Qualified Foreign Institutional Investors (“QFIIs”) or their affiliates (together, “CAAP Issuers”) .
With effect from 31st October 2011, the Manager is required to obtain collateral that represents at least 100% of the CSI A-Share Infrastructure ETF’s gross total counterparty risk exposure so that there shall be no uncollateralized counterparty risk . Further, where collateral is taken in the nature of equity securities, the market value of the equity collateral should represent at least 120% of the related gross counterparty exposure . Where non-equity collateral is taken, a prudent haircut policy shall be adopted . Where the CSI A-Share Infrastructure ETF is not fully collateralized due to circumstances beyond the control of the Manager, the Manager will procure such additional collateral to be delivered to the CSI A-Share Infrastructure ETF as soon as practicable to comply with the above collateral requirements .
Under the general taxing provision of the PRC corporate tax law, which came into effect on 1st January 2008, a non-PRC tax resident enterprise, e .g ., QFII or RQFII, is subject to 10% withholding tax on PRC sourced interest income, dividends and capital gains, provided that the non-PRC tax resident enterprise does not have its central management and control in the PRC or a PRC tax establishment . In practice, however, and prior to the recent release of Caishui [2014] No . 79 (“Circular 79”), the PRC tax authorities have not actively enforced taxation on capital gains arising from the sale of A-Shares by non-PRC tax resident enterprises, notwithstanding the fact the PRC State Council continued to not provide any specific income tax exemption on capital gains tax under PRC Corporate Income Tax Law .
On 14th November 2014, via the release of Circular 79 by the Ministry of Finance (“MOF”) in the PRC, the China Securities Regulatory Commission (“CSRC”), and the State Administration of Taxation (“SAT”) acting with State Council’s approval, a temporary exemption was provided to QFIIs/RQFIIs from tax on capital gains derived from the trading of A-Shares on or after 17th November 2014 . However, Circular 79 did also state that any gains realized prior to 17th November 2014 would be subject to tax in accordance with law .
Pursuant to Circular 79, the Manager realigned the provisioning policy of the CSI A-Share Infrastructure ETF in respect of its underlying PRC investments in CAAP . To date, the Manager is in the process of settling the withheld CGT amounts attributable to the CAAPs invested in by the CSI A-Share Infrastructure ETF . Depending on whether the withheld provision of CSI A-Share Infrastructure ETF is greater or less than the amount of CGT attributable, there could be material adjustments to the net asset value (“NAV”) of the CSI A-Share Infrastructure ETF, be it positive or negative .
For further detail regarding these adjustments, please refer to the iShares Asia Trust Announcement released by the Manager on 24th November 2015 and 30th October 2015 .
With respect to the CSI A-Share Infrastructure ETF gains realized prior to 17th November 2014, in respect of its investments in CAAPs, the CSI A-Share Infrastructure ETF will continue to maintain this provision . To date, the Manager is in the process of settling the withheld CGT amounts attributable to the CAAPs invested in by the CSI A-Share Infrastructure ETF, and depending on whether the withheld provision of the CSI A-Share Infrastructure ETF is greater or less than the amount of CGT attributable, there could be material adjustments to the net asset value of the CSI A-Share Infrastructure ETF, be it positive or negative . As at 31st December 2015, approximately HK$1 .1 million (2014: HK$1 .1 million) has been withheld by certain CAAP Issuers on realized gains .
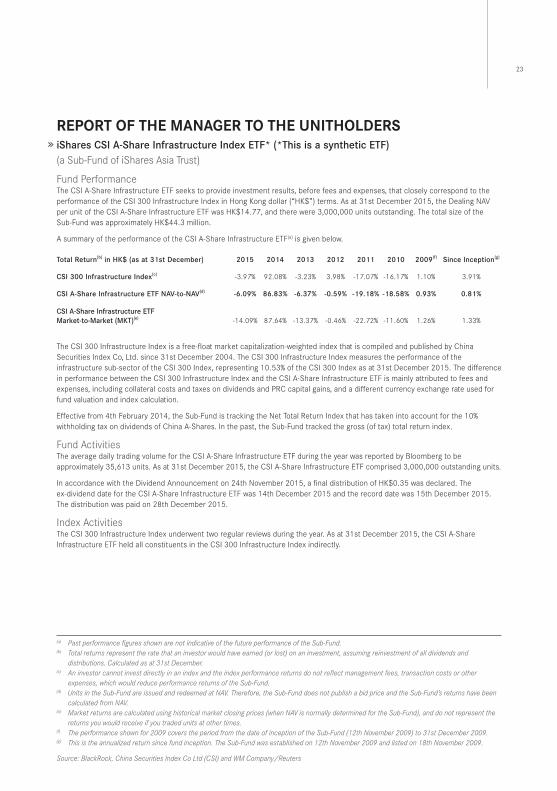
23
RepoRT of The MAnAgeR To The UniTholdeRSiShares CSI A-Share Infrastructure Index ETF* (*This is a synthetic ETF)(a Sub-Fund of iShares Asia Trust)
Fund PerformanceThe CSI A-Share Infrastructure ETF seeks to provide investment results, before fees and expenses, that closely correspond to the performance of the CSI 300 Infrastructure Index in Hong Kong dollar (“HK$”) terms . As at 31st December 2015, the Dealing NAV per unit of the CSI A-Share Infrastructure ETF was HK$14 .77, and there were 3,000,000 units outstanding . The total size of the Sub-Fund was approximately HK$44 .3 million .
A summary of the performance of the CSI A-Share Infrastructure ETF(a) is given below .
Total Return(b) in HK$ (as at 31st December) 2015 2014 2013 2012 2011 2010 2009(f) Since Inception(g)
CSI 300 Infrastructure Index(c) -3 .97% 92 .08% -3 .23% 3 .98% -17 .07% -16 .17% 1 .10% 3 .91%
CSI A-Share Infrastructure ETF NAV-to-NAV(d) -6.09% 86.83% -6.37% -0.59% -19.18% -18.58% 0.93% 0.81%
CSI A-Share Infrastructure ETF Market-to-Market (MKT)(e) -14 .09% 87 .64% -13 .37% -0 .46% -22 .72% -11 .60% 1 .26% 1 .33%
The CSI 300 Infrastructure Index is a free-float market capitalization-weighted index that is compiled and published by China Securities Index Co, Ltd . since 31st December 2004 . The CSI 300 Infrastructure Index measures the performance of the infrastructure sub-sector of the CSI 300 Index, representing 10 .53% of the CSI 300 Index as at 31st December 2015 . The difference in performance between the CSI 300 Infrastructure Index and the CSI A-Share Infrastructure ETF is mainly attributed to fees and expenses, including collateral costs and taxes on dividends and PRC capital gains, and a different currency exchange rate used for fund valuation and index calculation .
Effective from 4th February 2014, the Sub-Fund is tracking the Net Total Return Index that has taken into account for the 10% withholding tax on dividends of China A-Shares . In the past, the Sub-Fund tracked the gross (of tax) total return index .
Fund ActivitiesThe average daily trading volume for the CSI A-Share Infrastructure ETF during the year was reported by Bloomberg to be approximately 35,613 units . As at 31st December 2015, the CSI A-Share Infrastructure ETF comprised 3,000,000 outstanding units .
In accordance with the Dividend Announcement on 24th November 2015, a final distribution of HK$0 .35 was declared . The ex-dividend date for the CSI A-Share Infrastructure ETF was 14th December 2015 and the record date was 15th December 2015 . The distribution was paid on 28th December 2015 .
Index ActivitiesThe CSI 300 Infrastructure Index underwent two regular reviews during the year . As at 31st December 2015, the CSI A-Share Infrastructure ETF held all constituents in the CSI 300 Infrastructure Index indirectly .
(a) PastperformancefiguresshownarenotindicativeofthefutureperformanceoftheSub-Fund.(b) Totalreturnsrepresenttheratethataninvestorwouldhaveearned(orlost)onaninvestment,assumingreinvestmentofalldividendsand
distributions.Calculatedasat31stDecember.(c) Aninvestorcannotinvestdirectlyinanindexandtheindexperformancereturnsdonotreflectmanagementfees,transactioncostsorother
expenses,whichwouldreduceperformancereturnsoftheSub-Fund.(d) UnitsintheSub-FundareissuedandredeemedatNAV.Therefore,theSub-FunddoesnotpublishabidpriceandtheSub-Fund’sreturnshavebeen
calculatedfromNAV.(e) Marketreturnsarecalculatedusinghistoricalmarketclosingprices(whenNAVisnormallydeterminedfortheSub-Fund),anddonotrepresentthe
returnsyouwouldreceiveifyoutradedunitsatothertimes.(f) Theperformanceshownfor2009coverstheperiodfromthedateofinceptionoftheSub-Fund(12thNovember2009)to31stDecember2009.(g) Thisistheannualizedreturnsincefundinception.TheSub-Fundwasestablishedon12thNovember2009andlistedon18thNovember2009.
Source:BlackRock,ChinaSecuritiesIndexCoLtd(CSI)andWMCompany/Reuters
RepoRT of The MAnAgeR To The UniTholdeRSiShares CSI A-Share Consumer Discretionary Index ETF* (*This is a synthetic ETF)(a Sub-Fund of iShares Asia Trust)
IntroductionThe iShares CSI A-Share Consumer Discretionary Index ETF* (*This is a synthetic ETF) (the “CSI A-Share Consumer Discretionary ETF”) (the “Sub-Fund”), a sub-fund of the iShares Asia Trust (the “Trust”), was launched on 15th July 2010 and commenced trading under the stock code 3001 on The Stock Exchange of Hong Kong Limited (the “SEHK”) on 20th July 2010 . The CSI A-Share Consumer Discretionary ETF is a Hong Kong unit trust authorized under the Securities and Futures Ordinance (Cap . 571) of Hong Kong . The CSI A-Share Consumer Discretionary ETF is benchmarked against the CSI 300 Consumer Discretionary Index . The Manager of the CSI A-Share Consumer Discretionary ETF is BlackRock Asset Management North Asia Limited (the “Manager”) and the trustee is HSBC Institutional Trust Services (Asia) Limited (the “Trustee”) .
The CSI A-Share Consumer Discretionary ETF invests in derivative instruments . These derivative instruments, referred to as China A-Share Access Products (“CAAPs”) are linked to A-Shares and are intended to provide economic performance equivalent to holding the underlying A-Shares . The CSI A-Share Consumer Discretionary ETF does not invest in or hold A-Shares directly . The CAAPs are issued by one or more Qualified Foreign Institutional Investors (“QFIIs”) or their affiliates (together, “CAAP Issuers”) .
With effect from 31st October 2011, the Manager is required to obtain collateral that represents at least 100% of the CSI A-Share Consumer Discretionary ETF’s gross total counterparty risk exposure so that there shall be no uncollateralized counterparty risk . Further, where collateral is taken in the nature of equity securities, the market value of the equity collateral should represent at least 120% of the related gross counterparty exposure . Where non-equity collateral is taken, a prudent haircut policy shall be adopted . Where the CSI A-Share Consumer Discretionary ETF is not fully collateralized due to circumstances beyond the control of the Manager, the Manager will procure such additional collateral to be delivered to the CSI A-Share Consumer Discretionary ETF as soon as practicable to comply with the above collateral requirements .
Under the general taxing provision of the PRC corporate tax law, which came into effect on 1st January 2008, a non-PRC tax resident enterprise, e .g ., QFII or RQFII, is subject to 10% withholding tax on PRC sourced interest income, dividends and capital gains, provided that the non-PRC tax resident enterprise does not have its central management and control in the PRC or a PRC tax establishment . In practice, however, and prior to the recent release of Caishui [2014] No . 79 (“Circular 79”), the PRC tax authorities have not actively enforced taxation on capital gains arising from the sale of A-Shares by non-PRC tax resident enterprises, notwithstanding the fact the PRC State Council continued to not provide any specific income tax exemption on capital gains tax under PRC Corporate Income Tax Law .
On 14th November 2014, via the release of Circular 79 by the Ministry of Finance (“MOF”) in the PRC, the China Securities Regulatory Commission (“CSRC”), and the State Administration of Taxation (“SAT”) acting with State Council’s approval, a temporary exemption was provided to QFIIs/RQFIIs from tax on capital gains derived from the trading of A-Shares on or after 17th November 2014 . However, Circular 79 did also state that any gains realized prior to 17th November 2014 would be subject to tax in accordance with law .
Pursuant to Circular 79, the Manager realigned the provisioning policy of the CSI A-Share Consumer Discretionary ETF in respect of its underlying PRC investments in CAAP . To date, the Manager is in the process of settling the withheld CGT amounts attributable to the CAAPs invested in by the CSI A-Share Consumer Discretionary ETF . Depending on whether the withheld provision of CSI A-Share Consumer Discretionary ETF is greater or less than the amount of CGT attributable, there could be material adjustments to the net asset value (“NAV”) of the CSI A-Share Consumer Discretionary ETF, be it positive or negative .
For further detail regarding these adjustments, please refer to the iShares Asia Trust Announcement released by the Manager on 24th November 2015 and 30th October 2015 .
With respect to the CSI A-Share Consumer Discretionary ETF gains realized prior to 17th November 2014, in respect of its investments in CAAPs, the CSI A-Share Consumer Discretionary ETF will continue to maintain this provision . To date, the Manager is in the process of settling the withheld CGT amounts attributable to the CAAPs invested in by the CSI A-Share Consumer Discretionary ETF, and depending on whether the withheld provision of the CSI A-Share Consumer Discretionary ETF is greater or less than the amount of CGT attributable, there could be material adjustments to the net asset value of the CSI A-Share Consumer Discretionary ETF, be it positive or negative . As at 31st December 2015, approximately HK$4 .7 million (2014: HK$5 .6 million) has been withheld by certain CAAP Issuers on realized gains .
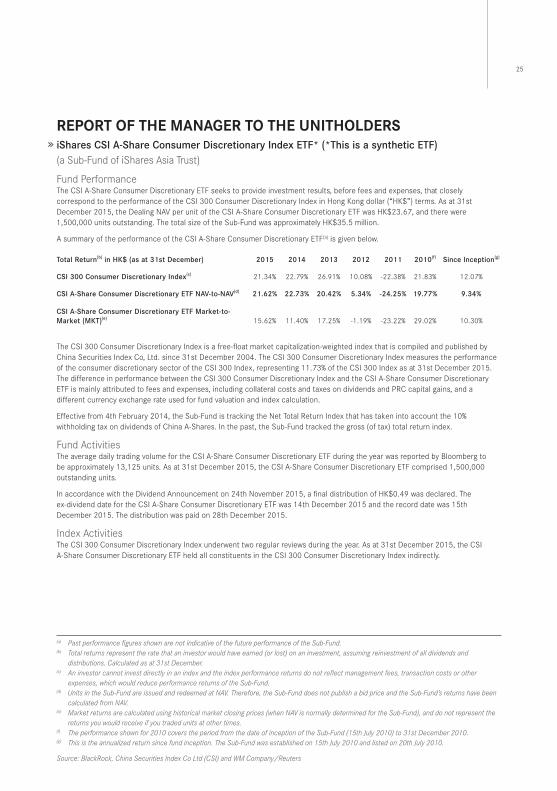
25
RepoRT of The MAnAgeR To The UniTholdeRSiShares CSI A-Share Consumer Discretionary Index ETF* (*This is a synthetic ETF)(a Sub-Fund of iShares Asia Trust)
Fund PerformanceThe CSI A-Share Consumer Discretionary ETF seeks to provide investment results, before fees and expenses, that closely correspond to the performance of the CSI 300 Consumer Discretionary Index in Hong Kong dollar (“HK$”) terms . As at 31st December 2015, the Dealing NAV per unit of the CSI A-Share Consumer Discretionary ETF was HK$23 .67, and there were 1,500,000 units outstanding . The total size of the Sub-Fund was approximately HK$35 .5 million .
A summary of the performance of the CSI A-Share Consumer Discretionary ETF(a) is given below .
Total Return(b) in HK$ (as at 31st December) 2015 2014 2013 2012 2011 2010(f) Since Inception(g)
CSI 300 Consumer Discretionary Index(c) 21 .34% 22 .79% 26 .91% 10 .08% -22 .38% 21 .83% 12 .07%
CSI A-Share Consumer Discretionary ETF NAV-to-NAV(d) 21.62% 22.73% 20.42% 5.34% -24.25% 19.77% 9.34%
CSI A-Share Consumer Discretionary ETF Market-to-Market (MKT)(e) 15 .62% 11 .40% 17 .25% -1 .19% -23 .22% 29 .02% 10 .30%
The CSI 300 Consumer Discretionary Index is a free-float market capitalization-weighted index that is compiled and published by China Securities Index Co, Ltd . since 31st December 2004 . The CSI 300 Consumer Discretionary Index measures the performance of the consumer discretionary sector of the CSI 300 Index, representing 11 .73% of the CSI 300 Index as at 31st December 2015 . The difference in performance between the CSI 300 Consumer Discretionary Index and the CSI A-Share Consumer Discretionary ETF is mainly attributed to fees and expenses, including collateral costs and taxes on dividends and PRC capital gains, and a different currency exchange rate used for fund valuation and index calculation .
Effective from 4th February 2014, the Sub-Fund is tracking the Net Total Return Index that has taken into account the 10% withholding tax on dividends of China A-Shares . In the past, the Sub-Fund tracked the gross (of tax) total return index .
Fund ActivitiesThe average daily trading volume for the CSI A-Share Consumer Discretionary ETF during the year was reported by Bloomberg to be approximately 13,125 units . As at 31st December 2015, the CSI A-Share Consumer Discretionary ETF comprised 1,500,000 outstanding units .
In accordance with the Dividend Announcement on 24th November 2015, a final distribution of HK$0 .49 was declared . The ex-dividend date for the CSI A-Share Consumer Discretionary ETF was 14th December 2015 and the record date was 15th December 2015 . The distribution was paid on 28th December 2015 .
Index ActivitiesThe CSI 300 Consumer Discretionary Index underwent two regular reviews during the year . As at 31st December 2015, the CSI A-Share Consumer Discretionary ETF held all constituents in the CSI 300 Consumer Discretionary Index indirectly .
(a) PastperformancefiguresshownarenotindicativeofthefutureperformanceoftheSub-Fund.(b) Totalreturnsrepresenttheratethataninvestorwouldhaveearned(orlost)onaninvestment,assumingreinvestmentofalldividendsand
distributions.Calculatedasat31stDecember.(c) Aninvestorcannotinvestdirectlyinanindexandtheindexperformancereturnsdonotreflectmanagementfees,transactioncostsorother
expenses,whichwouldreduceperformancereturnsoftheSub-Fund.(d) UnitsintheSub-FundareissuedandredeemedatNAV.Therefore,theSub-FunddoesnotpublishabidpriceandtheSub-Fund’sreturnshavebeen
calculatedfromNAV.(e) Marketreturnsarecalculatedusinghistoricalmarketclosingprices(whenNAVisnormallydeterminedfortheSub-Fund),anddonotrepresentthe
returnsyouwouldreceiveifyoutradedunitsatothertimes.(f) Theperformanceshownfor2010coverstheperiodfromthedateofinceptionoftheSub-Fund(15thJuly2010)to31stDecember2010.(g) Thisistheannualizedreturnsincefundinception.TheSub-Fundwasestablishedon15thJuly2010andlistedon20thJuly2010.
Source:BlackRock,ChinaSecuritiesIndexCoLtd(CSI)andWMCompany/Reuters
RepoRT of The MAnAgeR To The UniTholdeRSiShares CSI A-Share Consumer Staples Index ETF* (*This is a synthetic ETF)(a Sub-Fund of iShares Asia Trust)
IntroductionThe iShares CSI A-Share Consumer Staples Index ETF* (*This is a synthetic ETF) (the “CSI A-Share Consumer Staples ETF”) (the “Sub-Fund”), a sub-fund of the iShares Asia Trust (the “Trust”), was launched on 15th July 2010 and commenced trading under the stock code 2841 on The Stock Exchange of Hong Kong Limited (the “SEHK”) on 20th July 2010 . The CSI A-Share Consumer Staples ETF is a Hong Kong unit trust authorized under the Securities and Futures Ordinance (Cap . 571) of Hong Kong . The CSI A-Share Consumer Staples ETF is benchmarked against the CSI 300 Consumer Staples Index . The Manager of the CSI A-Share Consumer Staples ETF is BlackRock Asset Management North Asia Limited (the “Manager”) and the trustee is HSBC Institutional Trust Services (Asia) Limited (the “Trustee”) .
The CSI A-Share Consumer Staples ETF invests in derivative instruments . These derivative instruments, referred to as China A-Share Access Products (“CAAPs”) are linked to A-Shares and are intended to provide economic performance equivalent to holding the underlying A-Shares . The CSI A-Share Consumer Staples ETF does not invest in or hold A-Shares directly . The CAAPs are issued by one or more Qualified Foreign Institutional Investors (“QFIIs”) or their affiliates (together, “CAAP Issuers”) .
With effect from 31st October 2011, the Manager is required to obtain collateral that represents at least 100% of the CSI A-Share Consumer Staples ETF’s gross total counterparty risk exposure so that there shall be no uncollateralized counterparty risk . Further, where collateral is taken in the nature of equity securities, the market value of the equity collateral should represent at least 120% of the related gross counterparty exposure . Where non-equity collateral is taken, a prudent haircut policy shall be adopted . Where the CSI A-Share Consumer Staples ETF is not fully collateralized due to circumstances beyond the control of the Manager, the Manager will procure such additional collateral to be delivered to the CSI A-Share Consumer Staples ETF as soon as practicable to comply with the above collateral requirements .
Under the general taxing provision of the PRC corporate tax law, which came into effect on 1st January 2008, a non-PRC tax resident enterprise, e .g ., QFII or RQFII, is subject to 10% withholding tax on PRC sourced interest income, dividends and capital gains, provided that the non-PRC tax resident enterprise does not have its central management and control in the PRC or a PRC tax establishment . In practice, however, and prior to the recent release of Caishui [2014] No . 79 (“Circular 79”), the PRC tax authorities have not actively enforced taxation on capital gains arising from the sale of A-Shares by non-PRC tax resident enterprises, notwithstanding the fact the PRC State Council continued to not provide any specific income tax exemption on capital gains tax under PRC Corporate Income Tax Law .
On 14th November 2014, via the release of Circular 79 by the Ministry of Finance (“MOF”) in the PRC, the China Securities Regulatory Commission (“CSRC”), and the State Administration of Taxation (“SAT”) acting with State Council’s approval, a temporary exemption was provided to QFIIs/RQFIIs from tax on capital gains derived from the trading of A-Shares on or after 17th November 2014 . However, Circular 79 did also state that any gains realized prior to 17th November 2014 would be subject to tax in accordance with law .
Pursuant to Circular 79, the Manager realigned the provisioning policy of the CSI A-Share Consumer Staples ETF in respect of its underlying PRC investments in CAAP . To date, the Manager is in the process of settling the withheld CGT amounts attributable to the CAAPs invested in by the CSI A-Share Consumer Staples ETF . Depending on whether the withheld provision of CSI A-Share Consumer Staples ETF is greater or less than the amount of CGT attributable, there could be material adjustments to the net asset value (“NAV”) of the CSI A-Share Consumer Staples ETF, be it positive or negative .
For further detail regarding these adjustments, please refer to the iShares Asia Trust Announcement released by the Manager on 24th November 2015 and 30th October 2015 .
With respect to the CSI A-Share Consumer Staples ETF gains realized prior to 17th November 2014, in respect of its investments in CAAPs, the CSI A-Share Consumer Staples ETF will continue to maintain this provision . To date, the Manager is in the process of settling the withheld CGT amounts attributable to the CAAPs invested in by the CSI A-Share Consumer Staples ETF, and depending on whether the withheld provision of the CSI A-Share Consumer Staples ETF is greater or less than the amount of CGT attributable, there could be material adjustments to the net asset value of the CSI A-Share Consumer Staples ETF, be it positive or negative . As at 31st December 2015, approximately HK$14 .4 million (2014: HK$18 .3 million) has been withheld by certain CAAP Issuers on realized gains .
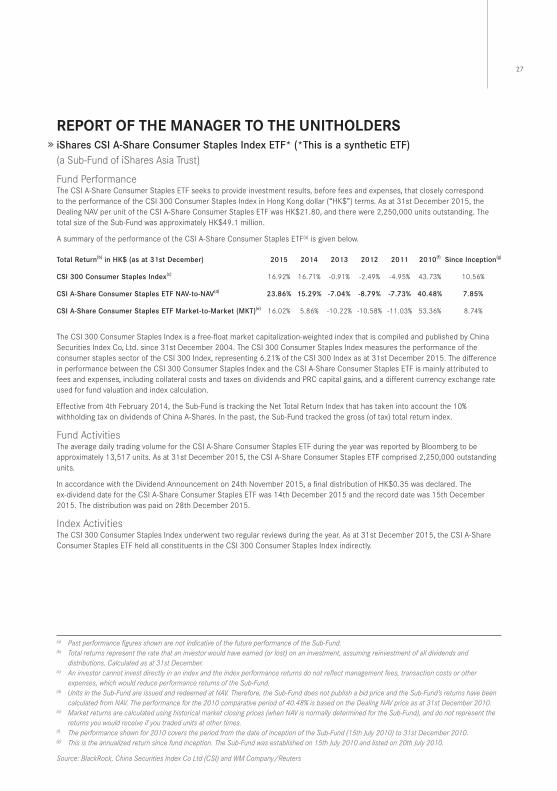
27
RepoRT of The MAnAgeR To The UniTholdeRSiShares CSI A-Share Consumer Staples Index ETF* (*This is a synthetic ETF)(a Sub-Fund of iShares Asia Trust)
Fund PerformanceThe CSI A-Share Consumer Staples ETF seeks to provide investment results, before fees and expenses, that closely correspond to the performance of the CSI 300 Consumer Staples Index in Hong Kong dollar (“HK$”) terms . As at 31st December 2015, the Dealing NAV per unit of the CSI A-Share Consumer Staples ETF was HK$21 .80, and there were 2,250,000 units outstanding . The total size of the Sub-Fund was approximately HK$49 .1 million .
A summary of the performance of the CSI A-Share Consumer Staples ETF(a) is given below .
Total Return(b) in HK$ (as at 31st December) 2015 2014 2013 2012 2011 2010(f) Since Inception(g)
CSI 300 Consumer Staples Index(c) 16 .92% 16 .71% -0 .91% -2 .49% -4 .95% 43 .73% 10 .56%
CSI A-Share Consumer Staples ETF NAV-to-NAV(d) 23.86% 15.29% -7.04% -8.79% -7.73% 40.48% 7.85%
CSI A-Share Consumer Staples ETF Market-to-Market (MKT)(e) 16 .02% 5 .86% -10 .22% -10 .58% -11 .03% 53 .36% 8 .74%
The CSI 300 Consumer Staples Index is a free-float market capitalization-weighted index that is compiled and published by China Securities Index Co, Ltd . since 31st December 2004 . The CSI 300 Consumer Staples Index measures the performance of the consumer staples sector of the CSI 300 Index, representing 6 .21% of the CSI 300 Index as at 31st December 2015 . The difference in performance between the CSI 300 Consumer Staples Index and the CSI A-Share Consumer Staples ETF is mainly attributed to fees and expenses, including collateral costs and taxes on dividends and PRC capital gains, and a different currency exchange rate used for fund valuation and index calculation .
Effective from 4th February 2014, the Sub-Fund is tracking the Net Total Return Index that has taken into account the 10% withholding tax on dividends of China A-Shares . In the past, the Sub-Fund tracked the gross (of tax) total return index .
Fund ActivitiesThe average daily trading volume for the CSI A-Share Consumer Staples ETF during the year was reported by Bloomberg to be approximately 13,517 units . As at 31st December 2015, the CSI A-Share Consumer Staples ETF comprised 2,250,000 outstanding units .
In accordance with the Dividend Announcement on 24th November 2015, a final distribution of HK$0 .35 was declared . The ex-dividend date for the CSI A-Share Consumer Staples ETF was 14th December 2015 and the record date was 15th December 2015 . The distribution was paid on 28th December 2015 .
Index ActivitiesThe CSI 300 Consumer Staples Index underwent two regular reviews during the year . As at 31st December 2015, the CSI A-Share Consumer Staples ETF held all constituents in the CSI 300 Consumer Staples Index indirectly .
(a) PastperformancefiguresshownarenotindicativeofthefutureperformanceoftheSub-Fund.(b) Totalreturnsrepresenttheratethataninvestorwouldhaveearned(orlost)onaninvestment,assumingreinvestmentofalldividendsand
distributions.Calculatedasat31stDecember.(c) Aninvestorcannotinvestdirectlyinanindexandtheindexperformancereturnsdonotreflectmanagementfees,transactioncostsorother
expenses,whichwouldreduceperformancereturnsoftheSub-Fund.(d) UnitsintheSub-FundareissuedandredeemedatNAV.Therefore,theSub-FunddoesnotpublishabidpriceandtheSub-Fund’sreturnshavebeen
calculatedfromNAV.Theperformanceforthe2010comparativeperiodof40.48%isbasedontheDealingNAVpriceasat31stDecember2010.(e) Marketreturnsarecalculatedusinghistoricalmarketclosingprices(whenNAVisnormallydeterminedfortheSub-Fund),anddonotrepresentthe
returnsyouwouldreceiveifyoutradedunitsatothertimes.(f) Theperformanceshownfor2010coverstheperiodfromthedateofinceptionoftheSub-Fund(15thJuly2010)to31stDecember2010.(g) Thisistheannualizedreturnsincefundinception.TheSub-Fundwasestablishedon15thJuly2010andlistedon20thJuly2010.
Source:BlackRock,ChinaSecuritiesIndexCoLtd(CSI)andWMCompany/Reuters
RepoRT of The MAnAgeR To The UniTholdeRSiShares RMB Bond Index ETF(a Sub-Fund of iShares Asia Trust)
IntroductionThe iShares RMB Bond Index ETF (the “RMB Bond Index ETF”) (the “Sub-Fund”), a sub-fund of the iShares Asia Trust (the “Trust”), was launched on 13th June 2013 and commenced trading under the stock codes 83139 for the RMB counter and 3139 for the HKD counter on The Stock Exchange of Hong Kong Limited (the “SEHK”) on 18th June 2013 . The RMB Bond Index ETF is a Hong Kong unit trust authorized under the Securities and Futures Ordinance (Cap . 571) of Hong Kong . The RMB Bond Index ETF is benchmarked against the Citi RMB Bond Capped Index . The Manager of the RMB Bond Index ETF is BlackRock Asset Management North Asia Limited (the “Manager”) and the trustee is HSBC Institutional Trust Services (Asia) Limited (the “Trustee”) .
The RMB Bond Index ETF invests in Renminbi (“RMB”) denominated and settled bonds that are issued outside the PRC . Whilst the below investment grade and non-rated sector constituents have been capped at a weighting of 30% of the Citi RMB Bond Capped Index at every month end, since the Manager will be adopting a representative sampling strategy with the ability to overweight on its holdings, it is possible that the RMB Bond Index ETF will invest in more than 30% of its NAV in below investment grade and non-rated bonds . Further, where there are market conditions beyond the control of the Manager including the credit rating downgrade of a bond or a bond issuer losing its credit rating status, the percentage holdings of below investment grade and non-rated bonds may also increase . Notwithstanding the foregoing, at every month end, the Manager will seek to limit the amount of overall holdings in below investment grade and non-rated sector bonds to a maximum of 30% of the NAV of the RMB Bond Index ETF within a reasonable period of time taking into account the interests of Unitholders .
While the application and enforcement of PRC capital gains tax with respect to the RMB Bond Index ETF remains subject to clarification, to the extent that such taxes are imposed on any capital gains of the RMB Bond Index ETF relating to companies being, or deemed to be, headquartered, listed, or managed in the PRC, the RMB Bond Index ETF’s net asset value or returns would be adversely impacted . The RMB Bond Index ETF may also be subject to business, stamp, and/or other taxes imposed in the PRC . However, the RMB Bond Index ETF does not currently intend to make any provision for these tax uncertainties .
Fund PerformanceThe RMB Bond Index ETF seeks to provide investment results, before fees and expenses that closely correspond to the performance of the Citi RMB Bond Capped Index in RMB terms . As at 31st December 2015, the Dealing NAV per unit of the RMB Bond Index ETF was RMB34 .02, and there were 2,633,618 units outstanding . The total size of the Sub-Fund was approximately RMB89 .6 million .
A summary of the performance of the RMB Bond Index ETF(a) is given below .
Total Return(b) in RMB (as at 31st December) 2015 2014 2013 Since Inception
Citi RMB Bond Capped Index(c) 3 .16% 3 .09% 0 .97%(f) 2 .89%(g)
RMB Bond Index ETF NAV-to-NAV(d) 2.54% 2.61% 0.72%(f) 2.37%(g)
RMB Bond Index ETF Market-to-Market (MKT)(e) 1 .50% 1 .23% 2 .47%(h) 2 .30%(i)
(a) PastperformancefiguresshownarenotindicativeofthefutureperformanceoftheSub-Fund.(b) Totalreturnrepresentstheratethataninvestorwouldhaveearned(orlost)onaninvestment,assumingreinvestmentofalldividendsand
distributions.Calculatedasat31stDecember.(c) Aninvestorcannotinvestdirectlyinanindexandtheindexperformancereturnsdonotreflectmanagementfees,transactioncostsorother
expenses,whichwouldreduceperformancereturnsoftheSub-Fund.(d) UnitsintheSub-FundareissuedandredeemedatNAV.Therefore,theSub-Fund’sreturnshavebeencalculatedfromNAV.(e) Marketreturnsarecalculatedusinghistoricalmarketclosingprices(whenNAVisnormallydeterminedfortheSub-Fund),anddonotrepresentthe
returnsyouwouldreceiveifyoutradedunitsatothertimes.(f) Theperformanceshownfor2013coverstheperiodfromthedateofinceptionoftheSub-Fund(13thJune2013)to31stDecember2013.(g) Thisistheannualizedreturnsincefundinception.TheSub-Fundwasestablishedon13thJune2013andlistedon18thJune2013.(h) ThisisthereturnsincelistingoftheSub-Fund(18thJune2013).(i) ThisistheannualizedreturnsincelistingoftheSub-Fund(18thJune2013).
Source:BlackRock,CitigroupIndexLLC
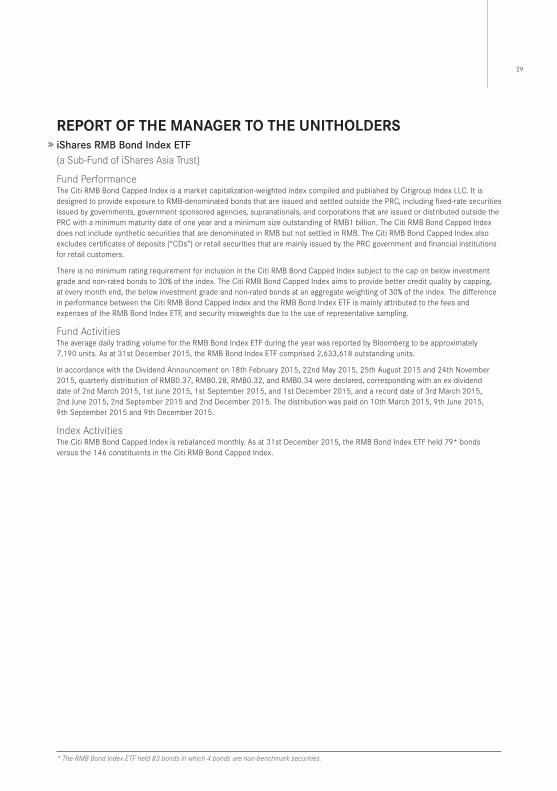
29
RepoRT of The MAnAgeR To The UniTholdeRSiShares RMB Bond Index ETF(a Sub-Fund of iShares Asia Trust)
Fund PerformanceThe Citi RMB Bond Capped Index is a market capitalization-weighted index compiled and published by Citigroup Index LLC . It is designed to provide exposure to RMB-denominated bonds that are issued and settled outside the PRC, including fixed-rate securities issued by governments, government sponsored agencies, supranationals, and corporations that are issued or distributed outside the PRC with a minimum maturity date of one year and a minimum size outstanding of RMB1 billion . The Citi RMB Bond Capped Index does not include synthetic securities that are denominated in RMB but not settled in RMB . The Citi RMB Bond Capped Index also excludes certificates of deposits (“CDs”) or retail securities that are mainly issued by the PRC government and financial institutions for retail customers .
There is no minimum rating requirement for inclusion in the Citi RMB Bond Capped Index subject to the cap on below investment grade and non-rated bonds to 30% of the index . The Citi RMB Bond Capped Index aims to provide better credit quality by capping, at every month end, the below investment grade and non-rated bonds at an aggregate weighting of 30% of the index . The difference in performance between the Citi RMB Bond Capped Index and the RMB Bond Index ETF is mainly attributed to the fees and expenses of the RMB Bond Index ETF, and security misweights due to the use of representative sampling .
Fund ActivitiesThe average daily trading volume for the RMB Bond Index ETF during the year was reported by Bloomberg to be approximately 7,190 units . As at 31st December 2015, the RMB Bond Index ETF comprised 2,633,618 outstanding units .
In accordance with the Dividend Announcement on 18th February 2015, 22nd May 2015, 25th August 2015 and 24th November 2015, quarterly distribution of RMB0 .37, RMB0 .28, RMB0 .32, and RMB0 .34 were declared, corresponding with an ex-dividend date of 2nd March 2015, 1st June 2015, 1st September 2015, and 1st December 2015, and a record date of 3rd March 2015, 2nd June 2015, 2nd September 2015 and 2nd December 2015 . The distribution was paid on 10th March 2015, 9th June 2015, 9th September 2015 and 9th December 2015 .
Index ActivitiesThe Citi RMB Bond Capped Index is rebalanced monthly . As at 31st December 2015, the RMB Bond Index ETF held 79* bonds versus the 146 constituents in the Citi RMB Bond Capped Index .
*TheRMBBondIndexETFheld83bondsinwhich4bondsarenon-benchmarksecurities.
RepoRT of The TRUSTee To The UniTholdeRSiShares Asia TrustWe hereby confirm that, in our opinion, the Manager of the iShares MSCI China Index ETF, iShares FTSE A50 China Index ETF* (*this is a synthetic ETF), iShares S&P BSE SENSEX India Index ETF, iShares MSCI AC Asia ex Japan Index ETF (formerly known as iShares MSCI Asia APEX 50 Index ETF), iShares MSCI Emerging Asia Index ETF, iShares CSI 300 A-Share Index ETF* (*this is a synthetic ETF), iShares CSI A-Share Energy Index ETF* (*this is a synthetic ETF), iShares CSI A-Share Materials Index ETF* (*this is a synthetic ETF), iShares CSI A-Share Financials Index ETF* (*this is a synthetic ETF), iShares CSI A-Share Infrastructure Index ETF* (*this is a synthetic ETF), iShares CSI A-Share Consumer Discretionary Index ETF* (*this is a synthetic ETF), iShares CSI A-Share Consumer Staples Index ETF* (*this is a synthetic ETF) and iShares RMB Bond Index ETF (the “Sub-Funds”) has, in all material respects, managed the Sub-Funds in accordance with the provisions of the Trust Deed dated 16th November 2001, as amended, for the year ended 31st December 2015 .
HSBC Institutional Trust Services (Asia) Limited
21st April 2016
31
Statement of Responsibilities of the Manager and the TrusteeiShares Asia TrustManager’s ResponsibilitiesThe Manager of the iShares MSCI China Index ETF, iShares FTSE A50 China Index ETF* (*This is a synthetic ETF), iShares S&P BSE SENSEX India Index ETF, iShares MSCI AC Asia ex Japan Index ETF (formerly known as iShares MSCI Asia APEX 50 Index ETF), iShares MSCI Emerging Asia Index ETF, iShares CSI 300 A-Share Index ETF* (*This is a synthetic ETF), iShares CSI A-Share Energy Index ETF* (*This is a synthetic ETF), iShares CSI A-Share Materials Index ETF* (*This is a synthetic ETF), iShares CSI A-Share Financials Index ETF* (*This is a synthetic ETF), iShares CSI A-Share Infrastructure Index ETF* (*This is a synthetic ETF), iShares CSI A-Share Consumer Discretionary Index ETF* (*This is a synthetic ETF), iShares CSI A-Share Consumer Staples Index ETF* (*This is a synthetic ETF) and iShares RMB Bond Index ETF (the Sub-Funds of iShares Asia Trust) (the “Sub-Funds”) is required by the Code on Unit Trusts and Mutual Funds issued by the Securities and Futures Commission of Hong Kong and the Trust Deed dated 16th November 2001, as amended (the “Trust Deed”), to prepare financial statements for each annual accounting period which give a true and fair view of the financial position of the Sub-Funds at the end of that period and of the transactions for the period then ended . In preparing these financial statements the Manager is required to:
– select suitable accounting policies and then apply them consistently;
– make judgments and estimates that are prudent and reasonable; and
– prepare the financial statements on the basis that the Sub-Funds will continue in operation unless it is inappropriate to presume this .
The Manager is also required to manage the Sub-Funds in accordance with the Trust Deed and take reasonable steps for the prevention and detection of fraud and other irregularities in relation to the Sub-Funds .
iShares Asia Trust (the “Trust”) is an umbrella unit trust governed by its Trust Deed . As at 31st December 2015, the Trust has established thirteen sub-funds, namely iShares MSCI China Index ETF, iShares FTSE A50 China Index ETF* (*This is a synthetic ETF), iShares S&P BSE SENSEX India Index ETF, iShares MSCI AC Asia ex Japan Index ETF (formerly known as iShares MSCI Asia APEX 50 Index ETF), iShares MSCI Emerging Asia Index ETF, iShares CSI 300 A-Share Index ETF* (*This is a synthetic ETF), iShares CSI A-Share Energy Index ETF* (*This is a synthetic ETF), iShares CSI A-Share Materials Index ETF* (*This is a synthetic ETF), iShares CSI A-Share Financials Index ETF* (*This is a synthetic ETF), iShares CSI A-Share Infrastructure Index ETF* (*This is a synthetic ETF), iShares CSI A-Share Consumer Discretionary Index ETF* (*This is a synthetic ETF), iShares CSI A-Share Consumer Staples Index ETF* (*This is a synthetic ETF) and iShares RMB Bond Index ETF .
Trustee’s ResponsibilitiesThe Trustee of the Sub-Funds is required to:
– ensure that the Sub-Funds in all material respects are managed in accordance with the Trust Deed and that the investment and borrowing powers are complied with;
– satisfy itself that sufficient accounting and other records have been maintained;
– safeguard the property of the Sub-Funds and rights attaching thereto; and
– report to the Unitholders for each annual accounting period should the Manager not managing the Sub-Funds in accordance of the Trust Deed .
independent Auditor’s ReportTo The Unitholders of iShares Asia Trust (The “Trust”)
Report on the Financial StatementsWe have audited the financial statements of iShares MSCI China Index ETF, iShares FTSE A50 China Index ETF* (*This is a synthetic ETF), iShares S&P BSE SENSEX India Index ETF, iShares MSCI AC Asia ex Japan Index ETF (formerly known as iShares MSCI Asia APEX 50 Index ETF), iShares MSCI Emerging Asia Index ETF, iShares CSI 300 A-Share Index ETF* (*This is a synthetic ETF), iShares CSI A-Share Energy Index ETF* (*This is a synthetic ETF), iShares CSI A-Share Materials Index ETF* (*This is a synthetic ETF), iShares CSI A-Share Financials Index ETF* (*This is a synthetic ETF), iShares CSI A-Share Infrastructure Index ETF* (*This is a synthetic ETF), iShares CSI A-Share Consumer Discretionary Index ETF* (*This is a synthetic ETF), iShares CSI A-Share Consumer Staples Index ETF* (*This is a synthetic ETF) and iShares RMB Bond Index ETF (each a separate sub-fund of iShares Asia Trust and referred to individually or collectively as the “Sub-Funds”) set out on pages 34 to 184, which comprise the Statements of Financial Position as at 31st December 2015, and the Statements of Comprehensive Income, Statements of Changes in Net Assets Attributable to Unitholders and Statements of Cash Flows for the year then ended, and a summary of significant accounting policies and other explanatory information .
Management’s Responsibility for the Financial StatementsThe Trustee and the Manager (the “Management”) of the Sub-Funds are responsible for the preparation of financial statements that give a true and fair view in accordance with International Financial Reporting Standards, and are responsible for ensuring that the financial statements have been properly prepared in accordance with the relevant disclosure provisions of the Trust Deed dated 16th November 2001, as amended (the “Trust Deed”), and Appendix E of the Code on Unit Trusts and Mutual Funds issued by the Securities and Futures Commission of Hong Kong (the “SFC Code”), and for such internal control as the Management determines is necessary to enable the preparation of financial statements that are free from material misstatement, whether due to fraud or error .
Auditor’s ResponsibilityOur responsibility is to express an opinion on these financial statements based on our audit . We conducted our audit in accordance with International Standards on Auditing . Those standards require that we comply with ethical requirements and plan and perform the audit to obtain reasonable assurance about whether the financial statements are free from material misstatement . We are also required to assess whether the financial statements of the Sub-Funds have been properly prepared, in all material respects, in accordance with the relevant disclosure provisions of the Trust Deed and the SFC Code .
An audit involves performing procedures to obtain audit evidence about the amounts and disclosures in the financial statements . The procedures selected depend on the auditor’s judgment, including the assessment of the risks of material misstatement of the financial statements, whether due to fraud or error . In making those risk assessments, the auditor considers internal control relevant to the Sub-Funds’ preparation of financial statements that give a true and fair view in order to design audit procedures that are appropriate in the circumstances, but not for the purpose of expressing an opinion on the effectiveness of the Sub-Funds’ internal control . An audit also includes evaluating the appropriateness of accounting policies used and the reasonableness of accounting estimates made by the Management, as well as evaluating the overall presentation of the financial statements .
We believe that the audit evidence we have obtained is sufficient and appropriate to provide a basis for our audit opinion .
OpinionIn our opinion, the financial statements give a true and fair view of the financial position of each of the Sub-Funds as at 31st December 2015, and of each of their financial transactions and cash flows for the year then ended in accordance with International Financial Reporting Standards .
Emphasis of MatterWe draw attention to Note 3 to the financial statements which indicates that the Management considers that the effective date of enforcement of PRC tax on gains on A-Shares and the extent to which individual Qualified Foreign Institutional Investors (“QFIIs”) may benefit from tax treaties are uncertain and the Management has exercised significant judgment in their assessment of the required provision and amounts withheld by QFIIs or their affiliates for the iShares FTSE A50 China Index ETF* (*This is a synthetic ETF), iShares CSI 300 A-Share Index ETF* (*This is a synthetic ETF), iShares CSI A-Share Energy Index ETF* (*This is a synthetic ETF), iShares CSI A-Share Materials Index ETF* (*This is a synthetic ETF), iShares CSI A-Share Financials Index ETF* (*This is a synthetic ETF), iShares CSI A-Share Infrastructure Index ETF* (*This is a synthetic ETF), iShares CSI A-Share Consumer Discretionary Index ETF* (*This is a synthetic ETF) and iShares CSI A-Share Consumer Staples Index ETF* (*This is a synthetic ETF) as at 31st December 2015 . Our opinion is not qualified in respect of this matter .
33
independent Auditor’s ReportTo The Unitholders of iShares Asia Trust (The “Trust”)
Report on Other Legal and Regulatory RequirementsIn our opinion, the financial statements have been properly prepared, in all material respects, in accordance with the relevant disclosure provisions of the Trust Deed and the SFC Code .
Other MattersThis report, including the opinion, has been prepared for and only for you, as a body, and for no other purpose . We do not assume responsibility towards or accept liability to any other person for the contents of this report .
PricewaterhouseCoopers Certified Public Accountants Hong Kong, 21st April 2016
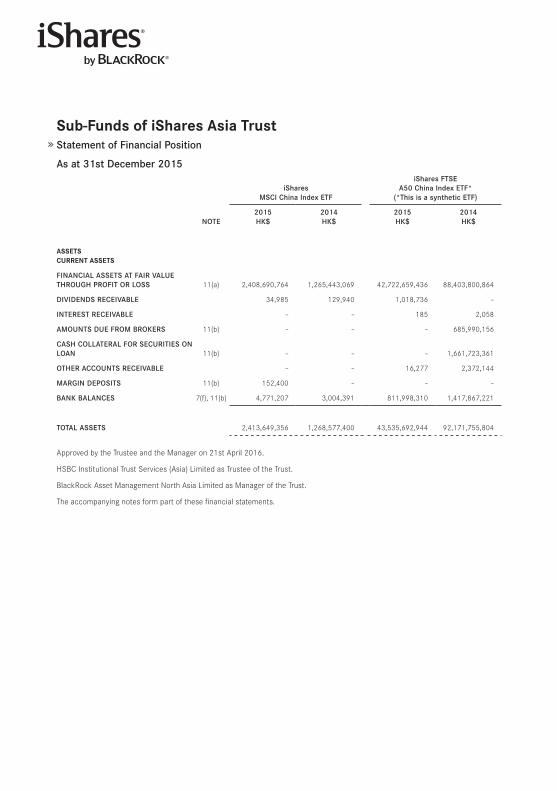
Sub-funds of iShares Asia TrustStatement of Financial Position
As at 31st December 2015
iSharesMSCI China Index ETF
iShares FTSEA50 China Index ETF*
(*This is a synthetic ETF)
NoTE2015HK$
2014HK$
2015HK$
2014HK$
ASSeTSCURRenT ASSeTS
FINANCIAl ASSETS AT FAIR VAlUE THRoUgH PRoFIT oR loSS 11(a) 2,408,690,764 1,265,443,069 42,722,659,436 88,403,800,864
DIVIDENDS RECEIVABlE 34,985 129,940 1,018,736 –
INTEREST RECEIVABlE – – 185 2,058
AMoUNTS DUE FRoM BRoKERS 11(b) – – – 685,990,156
CASH CollATERAl FoR SECURITIES oN loAN 11(b) – – – 1,661,723,361
oTHER ACCoUNTS RECEIVABlE – – 16,277 2,372,144
MARgIN DEPoSITS 11(b) 152,400 – – –
BANK BAlANCES 7(f), 11(b) 4,771,207 3,004,391 811,998,310 1,417,867,221
ToTAl ASSETS 2,413,649,356 1,268,577,400 43,535,692,944 92,171,755,804
Approved by the Trustee and the Manager on 21st April 2016 .
HSBC Institutional Trust Services (Asia) Limited as Trustee of the Trust .
BlackRock Asset Management North Asia Limited as Manager of the Trust .
The accompanying notes form part of these financial statements .
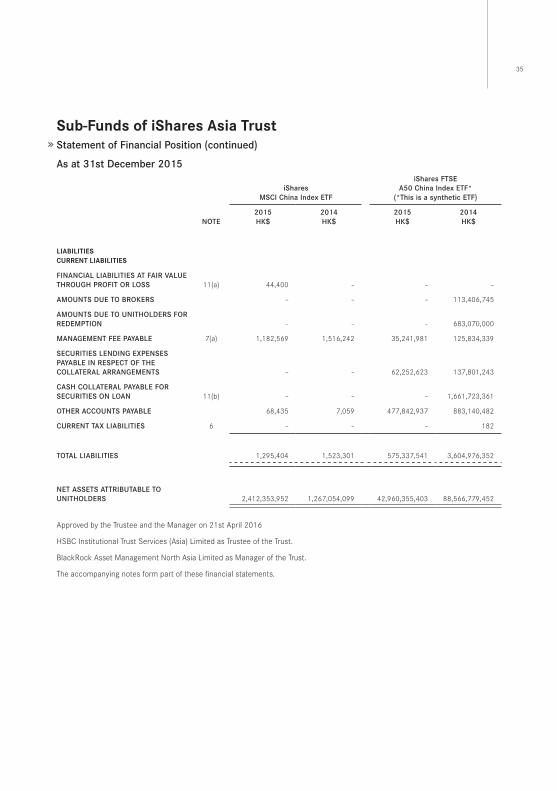
35
Sub-funds of iShares Asia TrustStatement of Financial Position (continued)
As at 31st December 2015
iSharesMSCI China Index ETF
iShares FTSEA50 China Index ETF*
(*This is a synthetic ETF)
NoTE2015HK$
2014HK$
2015HK$
2014HK$
liABiliTieSCURRenT liABiliTieS
FINANCIAl lIABIlITIES AT FAIR VAlUE THRoUgH PRoFIT oR loSS 11(a) 44,400 – – –
AMoUNTS DUE To BRoKERS – – – 113,406,745
AMoUNTS DUE To UNITHolDERS FoR REDEMPTIoN – – – 683,070,000
MANAgEMENT FEE PAyABlE 7(a) 1,182,569 1,516,242 35,241,981 125,834,339
SECURITIES lENDINg EXPENSES PAyABlE IN RESPECT oF THE CollATERAl ARRANgEMENTS – – 62,252,623 137,801,243
CASH CollATERAl PAyABlE FoR SECURITIES oN loAN 11(b) – – – 1,661,723,361
oTHER ACCoUNTS PAyABlE 68,435 7,059 477,842,937 883,140,482
CURRENT TAX lIABIlITIES 6 – – – 182
ToTAl lIABIlITIES 1,295,404 1,523,301 575,337,541 3,604,976,352
NET ASSETS ATTRIBUTABlE To UNITHolDERS 2,412,353,952 1,267,054,099 42,960,355,403 88,566,779,452
Approved by the Trustee and the Manager on 21st April 2016
HSBC Institutional Trust Services (Asia) Limited as Trustee of the Trust .
BlackRock Asset Management North Asia Limited as Manager of the Trust .
The accompanying notes form part of these financial statements .
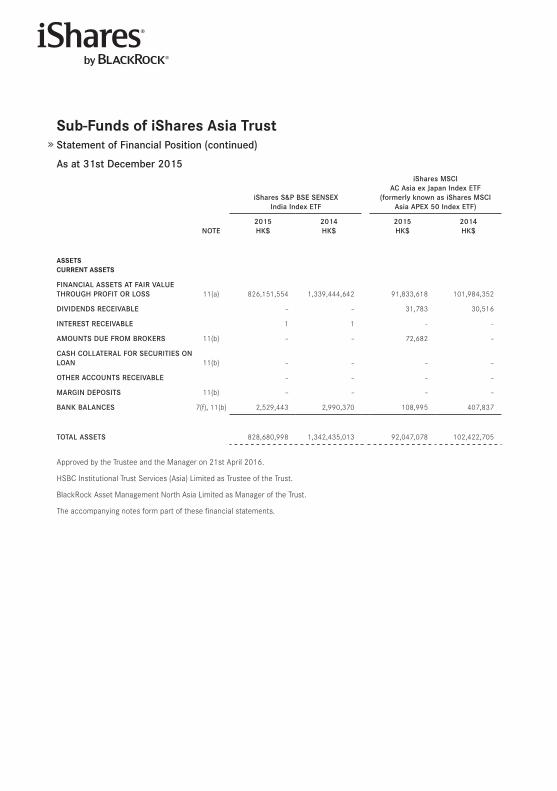
Sub-funds of iShares Asia TrustStatement of Financial Position (continued)
As at 31st December 2015
iShares S﹠P BSE SENSEXIndia Index ETF
iShares MSCI AC Asia ex Japan Index ETF
(formerly known as iShares MSCIAsia APEX 50 Index ETF)
NoTE2015HK$
2014HK$
2015HK$
2014HK$
ASSeTSCURRenT ASSeTS
FINANCIAl ASSETS AT FAIR VAlUE THRoUgH PRoFIT oR loSS 11(a) 826,151,554 1,339,444,642 91,833,618 101,984,352
DIVIDENDS RECEIVABlE – – 31,783 30,516
INTEREST RECEIVABlE 1 1 – –
AMoUNTS DUE FRoM BRoKERS 11(b) – – 72,682 –
CASH CollATERAl FoR SECURITIES oN loAN 11(b) – – – –
oTHER ACCoUNTS RECEIVABlE – – – –
MARgIN DEPoSITS 11(b) – – – –
BANK BAlANCES 7(f), 11(b) 2,529,443 2,990,370 108,995 407,837
ToTAl ASSETS 828,680,998 1,342,435,013 92,047,078 102,422,705
Approved by the Trustee and the Manager on 21st April 2016 .
HSBC Institutional Trust Services (Asia) Limited as Trustee of the Trust .
BlackRock Asset Management North Asia Limited as Manager of the Trust .
The accompanying notes form part of these financial statements .
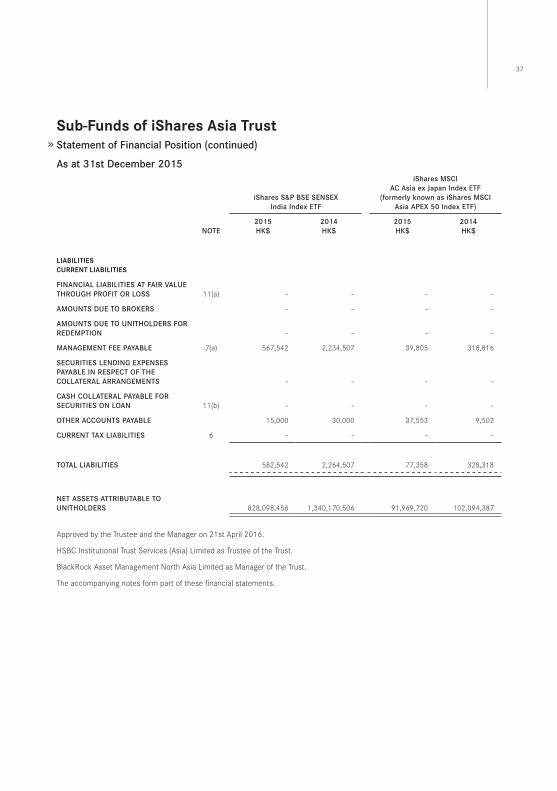
37
Sub-funds of iShares Asia TrustStatement of Financial Position (continued)
As at 31st December 2015
iShares S﹠P BSE SENSEXIndia Index ETF
iShares MSCI AC Asia ex Japan Index ETF
(formerly known as iShares MSCIAsia APEX 50 Index ETF)
NoTE2015HK$
2014HK$
2015HK$
2014HK$
liABiliTieSCURRenT liABiliTieS
FINANCIAl lIABIlITIES AT FAIR VAlUE THRoUgH PRoFIT oR loSS 11(a) – – – –
AMoUNTS DUE To BRoKERS – – – –
AMoUNTS DUE To UNITHolDERS FoR REDEMPTIoN – – – –
MANAgEMENT FEE PAyABlE 7(a) 567,542 2,234,507 39,805 318,816
SECURITIES lENDINg EXPENSES PAyABlE IN RESPECT oF THE CollATERAl ARRANgEMENTS – – – –
CASH CollATERAl PAyABlE FoR SECURITIES oN loAN 11(b) – – – –
oTHER ACCoUNTS PAyABlE 15,000 30,000 37,553 9,502
CURRENT TAX lIABIlITIES 6 – – – –
ToTAl lIABIlITIES 582,542 2,264,507 77,358 328,318
NET ASSETS ATTRIBUTABlE To UNITHolDERS 828,098,456 1,340,170,506 91,969,720 102,094,387
Approved by the Trustee and the Manager on 21st April 2016 .
HSBC Institutional Trust Services (Asia) Limited as Trustee of the Trust .
BlackRock Asset Management North Asia Limited as Manager of the Trust .
The accompanying notes form part of these financial statements .
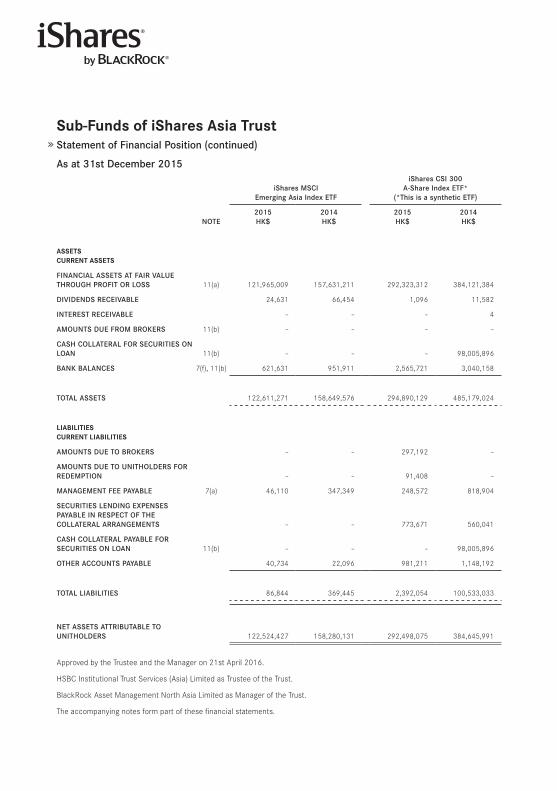
Sub-funds of iShares Asia TrustStatement of Financial Position (continued)
As at 31st December 2015
iShares MSCIEmerging Asia Index ETF
iShares CSI 300 A-Share Index ETF*
(*This is a synthetic ETF)
NoTE2015HK$
2014HK$
2015HK$
2014HK$
ASSeTSCURRenT ASSeTS
FINANCIAl ASSETS AT FAIR VAlUE THRoUgH PRoFIT oR loSS 11(a) 121,965,009 157,631,211 292,323,312 384,121,384
DIVIDENDS RECEIVABlE 24,631 66,454 1,096 11,582
INTEREST RECEIVABlE – – – 4
AMoUNTS DUE FRoM BRoKERS 11(b) – – – –
CASH CollATERAl FoR SECURITIES oN loAN 11(b) – – – 98,005,896
BANK BAlANCES 7(f), 11(b) 621,631 951,911 2,565,721 3,040,158
ToTAl ASSETS 122,611,271 158,649,576 294,890,129 485,179,024
liABiliTieSCURRenT liABiliTieS
AMoUNTS DUE To BRoKERS – – 297,192 –
AMoUNTS DUE To UNITHolDERS FoR REDEMPTIoN – – 91,408 –
MANAgEMENT FEE PAyABlE 7(a) 46,110 347,349 248,572 818,904
SECURITIES lENDINg EXPENSES PAyABlE IN RESPECT oF THE CollATERAl ARRANgEMENTS – – 773,671 560,041
CASH CollATERAl PAyABlE FoR SECURITIES oN loAN 11(b) – – – 98,005,896
oTHER ACCoUNTS PAyABlE 40,734 22,096 981,211 1,148,192
ToTAl lIABIlITIES 86,844 369,445 2,392,054 100,533,033
NET ASSETS ATTRIBUTABlE To UNITHolDERS 122,524,427 158,280,131 292,498,075 384,645,991
Approved by the Trustee and the Manager on 21st April 2016 .
HSBC Institutional Trust Services (Asia) Limited as Trustee of the Trust .
BlackRock Asset Management North Asia Limited as Manager of the Trust .
The accompanying notes form part of these financial statements .
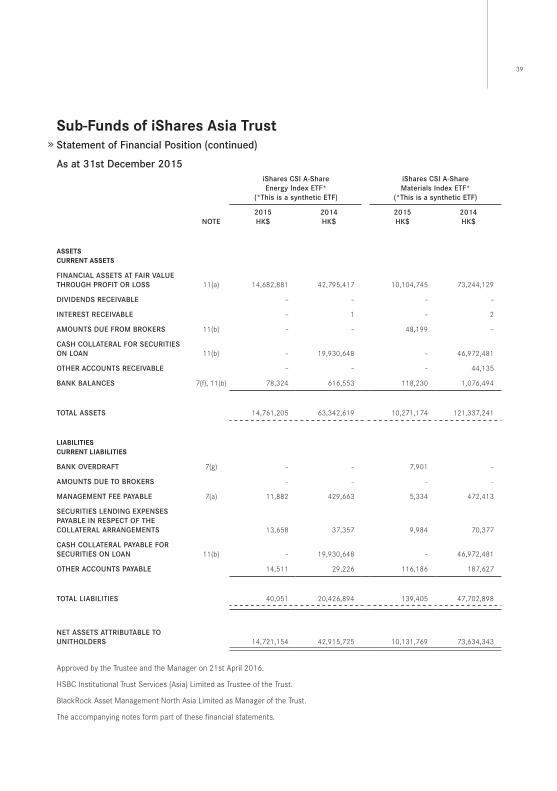
39
Sub-funds of iShares Asia TrustStatement of Financial Position (continued)
As at 31st December 2015iShares CSI A-Share Energy Index ETF*
(*This is a synthetic ETF)
iShares CSI A-Share Materials Index ETF*
(*This is a synthetic ETF)
NoTE2015HK$
2014HK$
2015HK$
2014HK$
ASSeTSCURRenT ASSeTS
FINANCIAl ASSETS AT FAIR VAlUE THRoUgH PRoFIT oR loSS 11(a) 14,682,881 42,795,417 10,104,745 73,244,129
DIVIDENDS RECEIVABlE – – – –
INTEREST RECEIVABlE – 1 – 2
AMoUNTS DUE FRoM BRoKERS 11(b) – – 48,199 –
CASH CollATERAl FoR SECURITIES oN loAN 11(b) – 19,930,648 – 46,972,481
oTHER ACCoUNTS RECEIVABlE – – – 44,135
BANK BAlANCES 7(f), 11(b) 78,324 616,553 118,230 1,076,494
ToTAl ASSETS 14,761,205 63,342,619 10,271,174 121,337,241
liABiliTieSCURRenT liABiliTieS
BANK oVERDRAFT 7(g) – – 7,901 –
AMoUNTS DUE To BRoKERS – – – –
MANAgEMENT FEE PAyABlE 7(a) 11,882 429,663 5,334 472,413
SECURITIES lENDINg EXPENSES PAyABlE IN RESPECT oF THE CollATERAl ARRANgEMENTS 13,658 37,357 9,984 70,377
CASH CollATERAl PAyABlE FoR SECURITIES oN loAN 11(b) – 19,930,648 – 46,972,481
oTHER ACCoUNTS PAyABlE 14,511 29,226 116,186 187,627
ToTAl lIABIlITIES 40,051 20,426,894 139,405 47,702,898
NET ASSETS ATTRIBUTABlE To UNITHolDERS 14,721,154 42,915,725 10,131,769 73,634,343
Approved by the Trustee and the Manager on 21st April 2016 .
HSBC Institutional Trust Services (Asia) Limited as Trustee of the Trust .
BlackRock Asset Management North Asia Limited as Manager of the Trust .
The accompanying notes form part of these financial statements .

Sub-funds of iShares Asia TrustStatement of Financial Position (continued)
As at 31st December 2015iShares CSI A-Share
Financials Index ETF* (*This is a synthetic ETF)
iShares CSI A-Share Infrastructure Index ETF* (*This is a synthetic ETF)
NoTE2015HK$
2014HK$
2015HK$
2014HK$
ASSeTSCURRenT ASSeTS
FINANCIAl ASSETS AT FAIR VAlUE THRoUgH PRoFIT oR loSS 11(a) 118,953,882 246,263,958 44,214,760 96,331,091
DIVIDENDS RECEIVABlE 2,122 8,865 – –
INTEREST RECEIVABlE – 3 – 1
AMoUNTS DUE FRoM BRoKERS 11(b) 56,601 – – 311,064
CASH CollATERAl FoR SECURITIES oN loAN 11(b) – 395,527 – 54,754,815
oTHER ACCoUNTS RECEIVABlE – – – –
BANK BAlANCES 7(f), 11(b) 1,066,450 1,880,443 239,325 799,620
ToTAl ASSETS 120,079,055 248,548,796 44,454,085 152,196,591
liABiliTieSCURRenT liABiliTieS
BANK oVERDRAFT 7(g) – – – –
AMoUNTS DUE To BRoKERS 316,208 – – 283,766
MANAgEMENT FEE PAyABlE 7(a) 101,389 668,171 35,339 486,395
SECURITIES lENDINg EXPENSES PAyABlE IN RESPECT oF THE CollATERAl ARRANgEMENTS 357,354 324,808 60,902 81,392
CASH CollATERAl PAyABlE FoR SECURITIES oN loAN 11(b) – 395,527 – 54,754,815
oTHER ACCoUNTS PAyABlE 106,104 142,415 62,741 79,451
ToTAl lIABIlITIES 881,055 1,530,921 158,982 55,685,819
NET ASSETS ATTRIBUTABlE To UNITHolDERS 119,198,000 247,017,875 44,295,103 96,510,772
Approved by the Trustee and the Manager on 21st April 2016 .
HSBC Institutional Trust Services (Asia) Limited as Trustee of the Trust .
BlackRock Asset Management North Asia Limited as Manager of the Trust .
The accompanying notes form part of these financial statements .
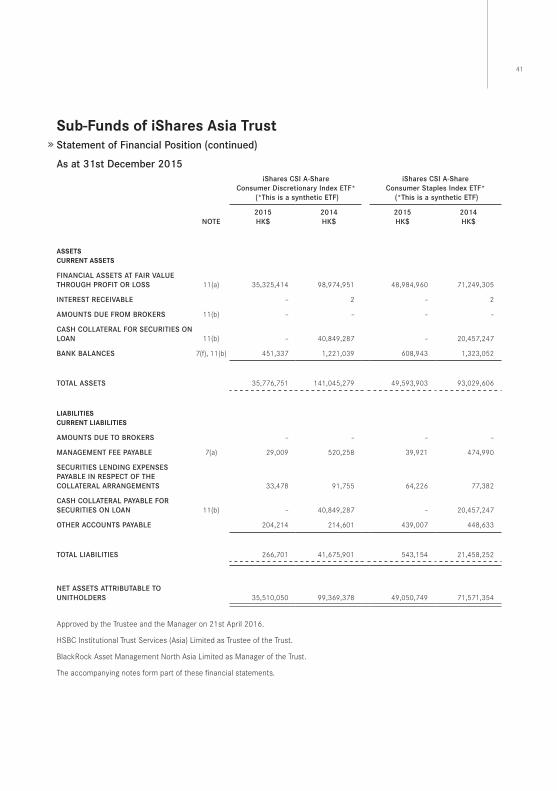
41
Sub-funds of iShares Asia TrustStatement of Financial Position (continued)
As at 31st December 2015iShares CSI A-Share
Consumer Discretionary Index ETF* (*This is a synthetic ETF)
iShares CSI A-ShareConsumer Staples Index ETF*
(*This is a synthetic ETF)
NoTE2015HK$
2014HK$
2015HK$
2014HK$
ASSeTSCURRenT ASSeTS
FINANCIAl ASSETS AT FAIR VAlUE THRoUgH PRoFIT oR loSS 11(a) 35,325,414 98,974,951 48,984,960 71,249,305
INTEREST RECEIVABlE – 2 – 2
AMoUNTS DUE FRoM BRoKERS 11(b) – – – –
CASH CollATERAl FoR SECURITIES oN loAN 11(b) – 40,849,287 – 20,457,247
BANK BAlANCES 7(f), 11(b) 451,337 1,221,039 608,943 1,323,052
ToTAl ASSETS 35,776,751 141,045,279 49,593,903 93,029,606
liABiliTieSCURRenT liABiliTieS
AMoUNTS DUE To BRoKERS – – – –
MANAgEMENT FEE PAyABlE 7(a) 29,009 520,258 39,921 474,990
SECURITIES lENDINg EXPENSES PAyABlE IN RESPECT oF THE CollATERAl ARRANgEMENTS 33,478 91,755 64,226 77,382
CASH CollATERAl PAyABlE FoR SECURITIES oN loAN 11(b) – 40,849,287 – 20,457,247
oTHER ACCoUNTS PAyABlE 204,214 214,601 439,007 448,633
ToTAl lIABIlITIES 266,701 41,675,901 543,154 21,458,252
NET ASSETS ATTRIBUTABlE To UNITHolDERS 35,510,050 99,369,378 49,050,749 71,571,354
Approved by the Trustee and the Manager on 21st April 2016 .
HSBC Institutional Trust Services (Asia) Limited as Trustee of the Trust .
BlackRock Asset Management North Asia Limited as Manager of the Trust .
The accompanying notes form part of these financial statements .
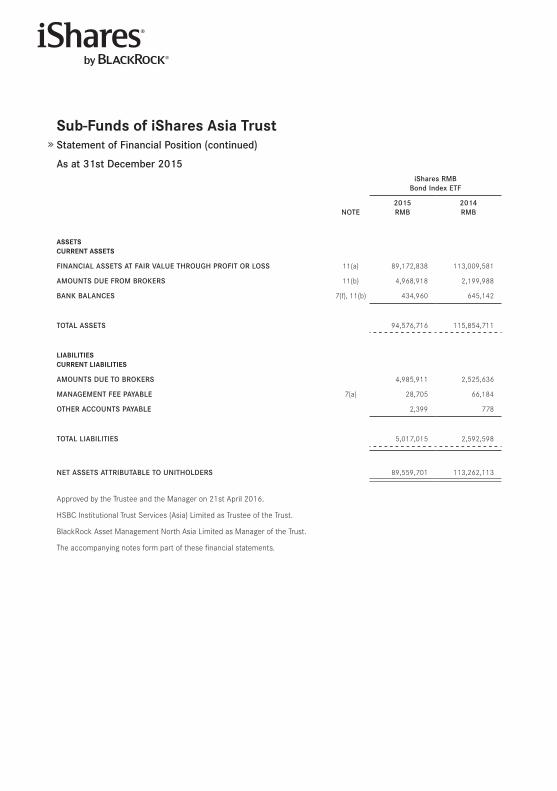
Sub-funds of iShares Asia TrustStatement of Financial Position (continued)
As at 31st December 2015iShares RMB
Bond Index ETF
NoTE2015RMB
2014RMB
ASSeTSCURRenT ASSeTS
FINANCIAl ASSETS AT FAIR VAlUE THRoUgH PRoFIT oR loSS 11(a) 89,172,838 113,009,581
AMoUNTS DUE FRoM BRoKERS 11(b) 4,968,918 2,199,988
BANK BAlANCES 7(f), 11(b) 434,960 645,142
ToTAl ASSETS 94,576,716 115,854,711
liABiliTieSCURRenT liABiliTieS
AMoUNTS DUE To BRoKERS 4,985,911 2,525,636
MANAgEMENT FEE PAyABlE 7(a) 28,705 66,184
oTHER ACCoUNTS PAyABlE 2,399 778
ToTAl lIABIlITIES 5,017,015 2,592,598
NET ASSETS ATTRIBUTABlE To UNITHolDERS 89,559,701 113,262,113
Approved by the Trustee and the Manager on 21st April 2016 .
HSBC Institutional Trust Services (Asia) Limited as Trustee of the Trust .
BlackRock Asset Management North Asia Limited as Manager of the Trust .
The accompanying notes form part of these financial statements .
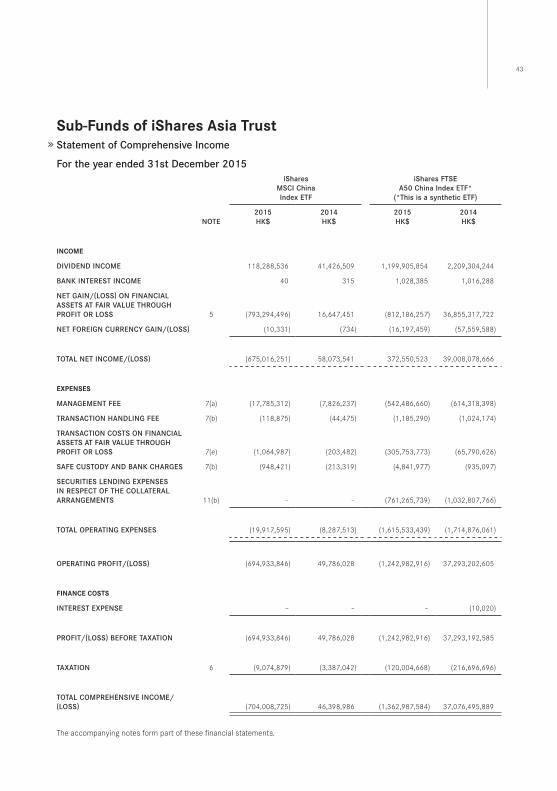
43
Sub-funds of iShares Asia TrustStatement of Comprehensive Income
For the year ended 31st December 2015iShares
MSCI ChinaIndex ETF
iShares FTSEA50 China Index ETF*
(*This is a synthetic ETF)
NoTE2015HK$
2014HK$
2015HK$
2014HK$
inCoMe
DIVIDEND INCoME 118,288,536 41,426,509 1,199,905,854 2,209,304,244
BANK INTEREST INCoME 40 315 1,028,385 1,016,288
NET gAIN/(loSS) oN FINANCIAl ASSETS AT FAIR VAlUE THRoUgH PRoFIT oR loSS 5 (793,294,496) 16,647,451 (812,186,257) 36,855,317,722
NET FoREIgN CURRENCy gAIN/(loSS) (10,331) (734) (16,197,459) (57,559,588)
ToTAl NET INCoME/(loSS) (675,016,251) 58,073,541 372,550,523 39,008,078,666
eXpenSeS
MANAgEMENT FEE 7(a) (17,785,312) (7,826,237) (542,486,660) (614,318,398)
TRANSACTIoN HANDlINg FEE 7(b) (118,875) (44,475) (1,185,290) (1,024,174)
TRANSACTIoN CoSTS oN FINANCIAl ASSETS AT FAIR VAlUE THRoUgH PRoFIT oR loSS 7(e) (1,064,987) (203,482) (305,753,773) (65,790,626)
SAFE CUSToDy AND BANK CHARgES 7(b) (948,421) (213,319) (4,841,977) (935,097)
SECURITIES lENDINg EXPENSES IN RESPECT oF THE CollATERAl ARRANgEMENTS 11(b) – – (761,265,739) (1,032,807,766)
ToTAl oPERATINg EXPENSES (19,917,595) (8,287,513) (1,615,533,439) (1,714,876,061)
oPERATINg PRoFIT/(loSS) (694,933,846) 49,786,028 (1,242,982,916) 37,293,202,605
finAnCe CoSTS
INTEREST EXPENSE – – – (10,020)
PRoFIT/(loSS) BEFoRE TAXATIoN (694,933,846) 49,786,028 (1,242,982,916) 37,293,192,585
TAXATIoN 6 (9,074,879) (3,387,042) (120,004,668) (216,696,696)
ToTAl CoMPREHENSIVE INCoME/(loSS) (704,008,725) 46,398,986 (1,362,987,584) 37,076,495,889
The accompanying notes form part of these financial statements .
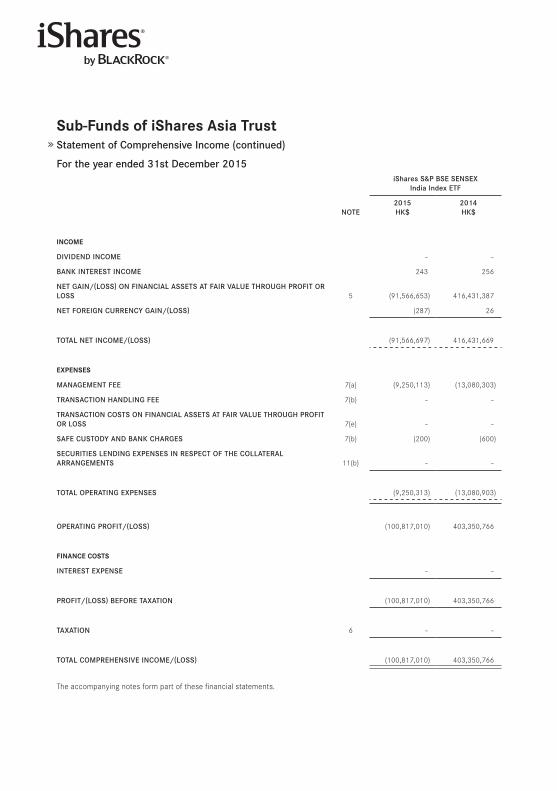
Sub-funds of iShares Asia TrustStatement of Comprehensive Income (continued)
For the year ended 31st December 2015iShares S﹠P BSE SENSEX
India Index ETF
NoTE2015HK$
2014HK$
inCoMe
DIVIDEND INCoME – –
BANK INTEREST INCoME 243 256
NET gAIN/(loSS) oN FINANCIAl ASSETS AT FAIR VAlUE THRoUgH PRoFIT oR loSS 5 (91,566,653) 416,431,387
NET FoREIgN CURRENCy gAIN/(loSS) (287) 26
ToTAl NET INCoME/(loSS) (91,566,697) 416,431,669
eXpenSeS
MANAgEMENT FEE 7(a) (9,250,113) (13,080,303)
TRANSACTIoN HANDlINg FEE 7(b) – –
TRANSACTIoN CoSTS oN FINANCIAl ASSETS AT FAIR VAlUE THRoUgH PRoFIT oR loSS 7(e) – –
SAFE CUSToDy AND BANK CHARgES 7(b) (200) (600)
SECURITIES lENDINg EXPENSES IN RESPECT oF THE CollATERAl ARRANgEMENTS 11(b) – –
ToTAl oPERATINg EXPENSES (9,250,313) (13,080,903)
oPERATINg PRoFIT/(loSS) (100,817,010) 403,350,766
finAnCe CoSTS
INTEREST EXPENSE – –
PRoFIT/(loSS) BEFoRE TAXATIoN (100,817,010) 403,350,766
TAXATIoN 6 – –
ToTAl CoMPREHENSIVE INCoME/(loSS) (100,817,010) 403,350,766
The accompanying notes form part of these financial statements .
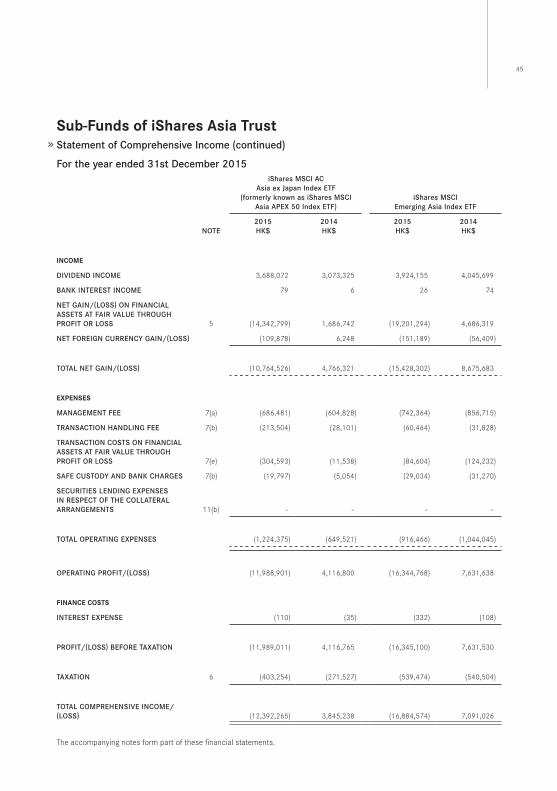
45
Sub-funds of iShares Asia TrustStatement of Comprehensive Income (continued)
For the year ended 31st December 2015iShares MSCI AC
Asia ex Japan Index ETF(formerly known as iShares MSCI
Asia APEX 50 Index ETF)iShares MSCI
Emerging Asia Index ETF
NoTE2015HK$
2014HK$
2015HK$
2014HK$
inCoMe
DIVIDEND INCoME 3,688,072 3,073,325 3,924,155 4,045,699
BANK INTEREST INCoME 79 6 26 74
NET gAIN/(loSS) oN FINANCIAl ASSETS AT FAIR VAlUE THRoUgH PRoFIT oR loSS 5 (14,342,799) 1,686,742 (19,201,294) 4,686,319
NET FoREIgN CURRENCy gAIN/(loSS) (109,878) 6,248 (151,189) (56,409)
ToTAl NET gAIN/(loSS) (10,764,526) 4,766,321 (15,428,302) 8,675,683
eXpenSeS
MANAgEMENT FEE 7(a) (686,481) (604,828) (742,364) (856,715)
TRANSACTIoN HANDlINg FEE 7(b) (213,504) (28,101) (60,464) (31,828)
TRANSACTIoN CoSTS oN FINANCIAl ASSETS AT FAIR VAlUE THRoUgH PRoFIT oR loSS 7(e) (304,593) (11,538) (84,604) (124,232)
SAFE CUSToDy AND BANK CHARgES 7(b) (19,797) (5,054) (29,034) (31,270)
SECURITIES lENDINg EXPENSES IN RESPECT oF THE CollATERAl ARRANgEMENTS 11(b) – – – –
ToTAl oPERATINg EXPENSES (1,224,375) (649,521) (916,466) (1,044,045)
oPERATINg PRoFIT/(loSS) (11,988,901) 4,116,800 (16,344,768) 7,631,638
finAnCe CoSTS
INTEREST EXPENSE (110) (35) (332) (108)
PRoFIT/(loSS) BEFoRE TAXATIoN (11,989,011) 4,116,765 (16,345,100) 7,631,530
TAXATIoN 6 (403,254) (271,527) (539,474) (540,504)
ToTAl CoMPREHENSIVE INCoME/(loSS) (12,392,265) 3,845,238 (16,884,574) 7,091,026
The accompanying notes form part of these financial statements .

Sub-funds of iShares Asia TrustStatement of Comprehensive Income (continued)
For the year ended 31st December 2015iShares CSI 300
A-Share Index ETF*(*This is a synthetic ETF)
NoTE2015HK$
2014HK$
inCoMe
DIVIDEND INCoME 6,200,922 12,183,589
BANK INTEREST INCoME 5,448 2,322
NET gAIN/(loSS) oN FINANCIAl ASSETS AT FAIR VAlUE THRoUgH PRoFIT oR loSS 5 30,715,166 142,071,059
NET FoREIgN CURRENCy gAIN/(loSS) (10,140) (10,580)
ToTAl NET gAIN/(loSS) 36,911,396 154,246,390
eXpenSeS
MANAgEMENT FEE 7(a) (3,680,437) (4,327,120)
TRANSACTIoN HANDlINg FEE 7(b) (462,174) (750,281)
TRANSACTIoN CoSTS oN FINANCIAl ASSETS AT FAIR VAlUE THRoUgH PRoFIT oR loSS 7(e) (1,015,509) (284,921)
SAFE CUSToDy AND BANK CHARgES 7(b) (4,300) (5,700)
SECURITIES lENDINg EXPENSES IN RESPECT oF THE CollATERAl ARRANgEMENTS 11(b) (6,283,098) (7,331,788)
ToTAl oPERATINg EXPENSES (11,445,518) (12,699,810)
oPERATINg PRoFIT/(loSS) 25,465,878 141,546,580
finAnCe CoSTS
INTEREST EXPENSE (32) –
PRoFIT/(loSS) BEFoRE TAXATIoN 25,465,846 141,546,580
TAXATIoN 6 (620,092) (1,218,359)
ToTAl CoMPREHENSIVE INCoME/(loSS) 24,845,754 140,328,221
The accompanying notes form part of these financial statements .
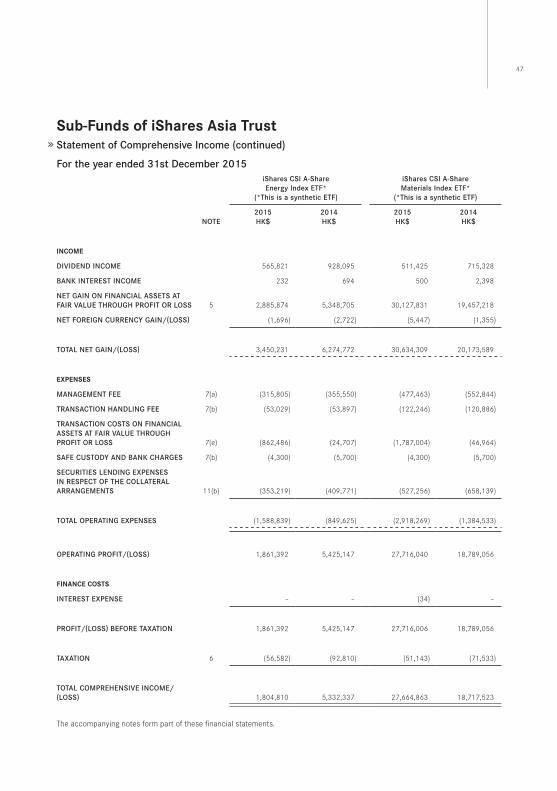
47
Sub-funds of iShares Asia TrustStatement of Comprehensive Income (continued)
For the year ended 31st December 2015iShares CSI A-Share Energy Index ETF*
(*This is a synthetic ETF)
iShares CSI A-Share Materials Index ETF*
(*This is a synthetic ETF)
NoTE2015HK$
2014HK$
2015HK$
2014HK$
inCoMe
DIVIDEND INCoME 565,821 928,095 511,425 715,328
BANK INTEREST INCoME 232 694 500 2,398
NET gAIN oN FINANCIAl ASSETS AT FAIR VAlUE THRoUgH PRoFIT oR loSS 5 2,885,874 5,348,705 30,127,831 19,457,218
NET FoREIgN CURRENCy gAIN/(loSS) (1,696) (2,722) (5,447) (1,355)
ToTAl NET gAIN/(loSS) 3,450,231 6,274,772 30,634,309 20,173,589
eXpenSeS
MANAgEMENT FEE 7(a) (315,805) (355,550) (477,463) (552,844)
TRANSACTIoN HANDlINg FEE 7(b) (53,029) (53,897) (122,246) (120,886)
TRANSACTIoN CoSTS oN FINANCIAl ASSETS AT FAIR VAlUE THRoUgH PRoFIT oR loSS 7(e) (862,486) (24,707) (1,787,004) (46,964)
SAFE CUSToDy AND BANK CHARgES 7(b) (4,300) (5,700) (4,300) (5,700)
SECURITIES lENDINg EXPENSES IN RESPECT oF THE CollATERAl ARRANgEMENTS 11(b) (353,219) (409,771) (527,256) (658,139)
ToTAl oPERATINg EXPENSES (1,588,839) (849,625) (2,918,269) (1,384,533)
oPERATINg PRoFIT/(loSS) 1,861,392 5,425,147 27,716,040 18,789,056
finAnCe CoSTS
INTEREST EXPENSE – – (34) –
PRoFIT/(loSS) BEFoRE TAXATIoN 1,861,392 5,425,147 27,716,006 18,789,056
TAXATIoN 6 (56,582) (92,810) (51,143) (71,533)
ToTAl CoMPREHENSIVE INCoME/(loSS) 1,804,810 5,332,337 27,664,863 18,717,523
The accompanying notes form part of these financial statements .
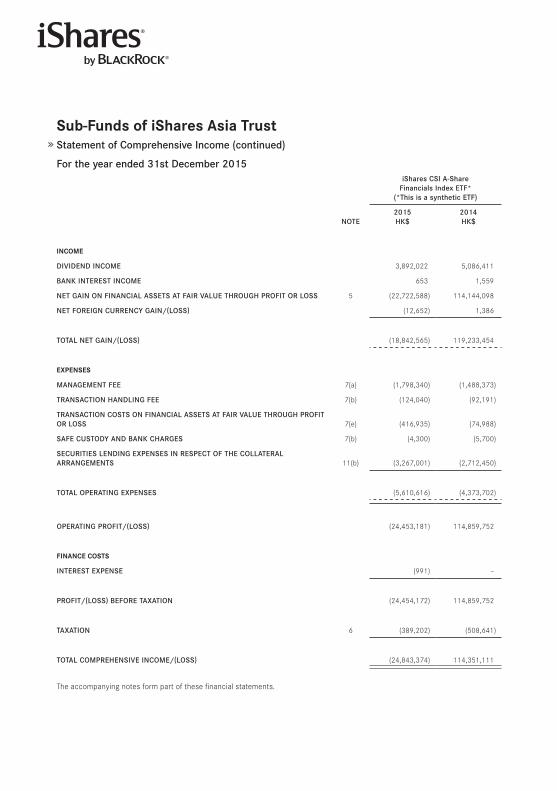
Sub-funds of iShares Asia TrustStatement of Comprehensive Income (continued)
For the year ended 31st December 2015iShares CSI A-Share
Financials Index ETF*(*This is a synthetic ETF)
NoTE2015HK$
2014HK$
inCoMe
DIVIDEND INCoME 3,892,022 5,086,411
BANK INTEREST INCoME 653 1,559
NET gAIN oN FINANCIAl ASSETS AT FAIR VAlUE THRoUgH PRoFIT oR loSS 5 (22,722,588) 114,144,098
NET FoREIgN CURRENCy gAIN/(loSS) (12,652) 1,386
ToTAl NET gAIN/(loSS) (18,842,565) 119,233,454
eXpenSeS
MANAgEMENT FEE 7(a) (1,798,340) (1,488,373)
TRANSACTIoN HANDlINg FEE 7(b) (124,040) (92,191)
TRANSACTIoN CoSTS oN FINANCIAl ASSETS AT FAIR VAlUE THRoUgH PRoFIT oR loSS 7(e) (416,935) (74,988)
SAFE CUSToDy AND BANK CHARgES 7(b) (4,300) (5,700)
SECURITIES lENDINg EXPENSES IN RESPECT oF THE CollATERAl ARRANgEMENTS 11(b) (3,267,001) (2,712,450)
ToTAl oPERATINg EXPENSES (5,610,616) (4,373,702)
oPERATINg PRoFIT/(loSS) (24,453,181) 114,859,752
finAnCe CoSTS
INTEREST EXPENSE (991) –
PRoFIT/(loSS) BEFoRE TAXATIoN (24,454,172) 114,859,752
TAXATIoN 6 (389,202) (508,641)
ToTAl CoMPREHENSIVE INCoME/(loSS) (24,843,374) 114,351,111
The accompanying notes form part of these financial statements .
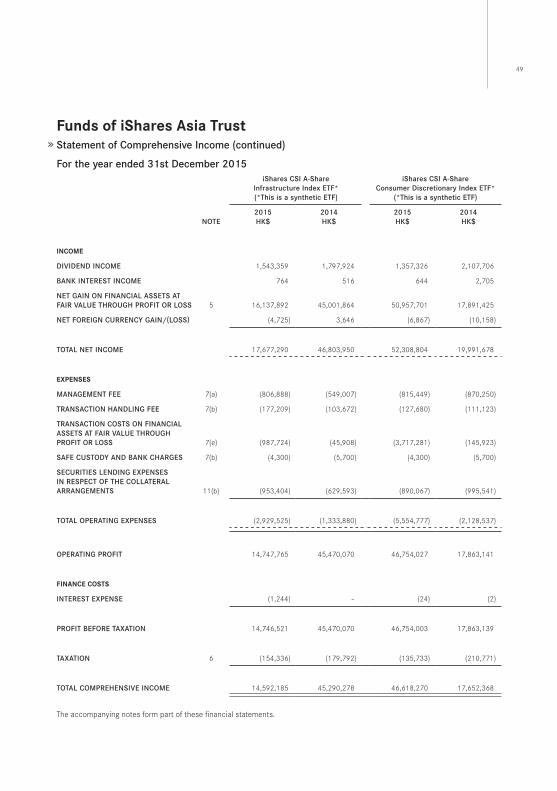
49
funds of iShares Asia TrustStatement of Comprehensive Income (continued)
For the year ended 31st December 2015iShares CSI A-Share
Infrastructure Index ETF*(*This is a synthetic ETF)
iShares CSI A-ShareConsumer Discretionary Index ETF*
(*This is a synthetic ETF)
NoTE2015HK$
2014HK$
2015HK$
2014HK$
inCoMe
DIVIDEND INCoME 1,543,359 1,797,924 1,357,326 2,107,706
BANK INTEREST INCoME 764 516 644 2,705
NET gAIN oN FINANCIAl ASSETS AT FAIR VAlUE THRoUgH PRoFIT oR loSS 5 16,137,892 45,001,864 50,957,701 17,891,425
NET FoREIgN CURRENCy gAIN/(loSS) (4,725) 3,646 (6,867) (10,158)
ToTAl NET INCoME 17,677,290 46,803,950 52,308,804 19,991,678
eXpenSeS
MANAgEMENT FEE 7(a) (806,888) (549,007) (815,449) (870,250)
TRANSACTIoN HANDlINg FEE 7(b) (177,209) (103,672) (127,680) (111,123)
TRANSACTIoN CoSTS oN FINANCIAl ASSETS AT FAIR VAlUE THRoUgH PRoFIT oR loSS 7(e) (987,724) (45,908) (3,717,281) (145,923)
SAFE CUSToDy AND BANK CHARgES 7(b) (4,300) (5,700) (4,300) (5,700)
SECURITIES lENDINg EXPENSES IN RESPECT oF THE CollATERAl ARRANgEMENTS 11(b) (953,404) (629,593) (890,067) (995,541)
ToTAl oPERATINg EXPENSES (2,929,525) (1,333,880) (5,554,777) (2,128,537)
oPERATINg PRoFIT 14,747,765 45,470,070 46,754,027 17,863,141
finAnCe CoSTS
INTEREST EXPENSE (1,244) – (24) (2)
PRoFIT BEFoRE TAXATIoN 14,746,521 45,470,070 46,754,003 17,863,139
TAXATIoN 6 (154,336) (179,792) (135,733) (210,771)
ToTAl CoMPREHENSIVE INCoME 14,592,185 45,290,278 46,618,270 17,652,368
The accompanying notes form part of these financial statements .

funds of iShares Asia TrustStatement of Comprehensive Income (continued)
For the year ended 31st December 2015iShares CSI A-Share
Consumer Staples Index ETF*(*This is a synthetic ETF)
NoTE2015HK$
2014HK$
inCoMe
DIVIDEND INCoME 1,234,304 1,441,009
BANK INTEREST INCoME 616 7,354
NET gAIN oN FINANCIAl ASSETS AT FAIR VAlUE THRoUgH PRoFIT oR loSS 5 20,400,057 9,896,288
NET FoREIgN CURRENCy gAIN/(loSS) (5,593) (2,985)
ToTAl NET INCoME 21,629,384 11,341,666
eXpenSeS
MANAgEMENT FEE 7(a) (653,817) (609,992)
TRANSACTIoN HANDlINg FEE 7(b) (80,000) (89,092)
TRANSACTIoN CoSTS oN FINANCIAl ASSETS AT FAIR VAlUE THRoUgH PRoFIT oR loSS 7(e) (224,697) (76,414)
SAFE CUSToDy AND BANK CHARgES 7(b) (4,300) (5,700)
SECURITIES lENDINg EXPENSES IN RESPECT oF THE CollATERAl ARRANgEMENTS 11(b) (838,782) (808,792)
ToTAl oPERATINg EXPENSES (1,801,596) (1,589,990)
oPERATINg PRoFIT 19,827,788 9,751,676
finAnCe CoSTS
INTEREST EXPENSE – –
PRoFIT BEFoRE TAXATIoN 19,827,788 9,751,676
TAXATIoN 6 (123,430) (144,101)
ToTAl CoMPREHENSIVE INCoME 19,704,358 9,607,575
The accompanying notes form part of these financial statements .
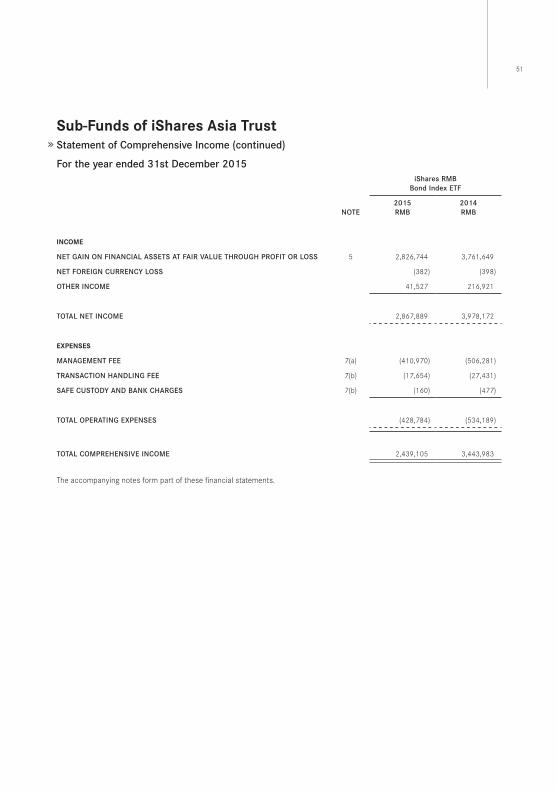
51
Sub-funds of iShares Asia TrustStatement of Comprehensive Income (continued)
For the year ended 31st December 2015iShares RMB
Bond Index ETF
NoTE2015RMB
2014RMB
inCoMe
NET gAIN oN FINANCIAl ASSETS AT FAIR VAlUE THRoUgH PRoFIT oR loSS 5 2,826,744 3,761,649
NET FoREIgN CURRENCy loSS (382) (398)
oTHER INCoME 41,527 216,921
ToTAl NET INCoME 2,867,889 3,978,172
eXpenSeS
MANAgEMENT FEE 7(a) (410,970) (506,281)
TRANSACTIoN HANDlINg FEE 7(b) (17,654) (27,431)
SAFE CUSToDy AND BANK CHARgES 7(b) (160) (477)
ToTAl oPERATINg EXPENSES (428,784) (534,189)
ToTAl CoMPREHENSIVE INCoME 2,439,105 3,443,983
The accompanying notes form part of these financial statements .
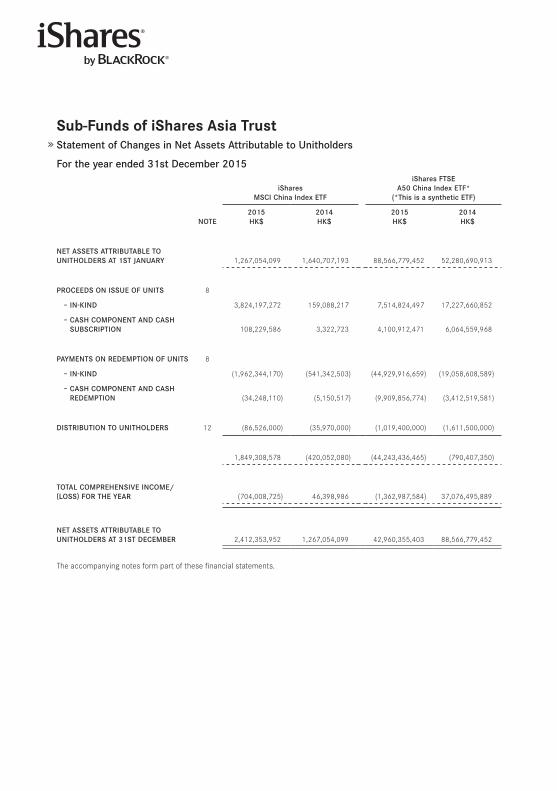
Sub-funds of iShares Asia TrustStatement of Changes in Net Assets Attributable to Unitholders
For the year ended 31st December 2015
iSharesMSCI China Index ETF
iShares FTSEA50 China Index ETF*
(*This is a synthetic ETF)
NoTE2015HK$
2014HK$
2015HK$
2014HK$
NET ASSETS ATTRIBUTABlE To UNITHolDERS AT 1ST JANUARy 1,267,054,099 1,640,707,193 88,566,779,452 52,280,690,913
PRoCEEDS oN ISSUE oF UNITS 8
– IN-KIND 3,824,197,272 159,088,217 7,514,824,497 17,227,660,852
– CASH CoMPoNENT AND CASH SUBSCRIPTIoN 108,229,586 3,322,723 4,100,912,471 6,064,559,968
PAyMENTS oN REDEMPTIoN oF UNITS 8
– IN-KIND (1,962,344,170) (541,342,503) (44,929,916,659) (19,058,608,589)
– CASH CoMPoNENT AND CASH REDEMPTIoN (34,248,110) (5,150,517) (9,909,856,774) (3,412,519,581)
DISTRIBUTIoN To UNITHolDERS 12 (86,526,000) (35,970,000) (1,019,400,000) (1,611,500,000)
1,849,308,578 (420,052,080) (44,243,436,465) (790,407,350)
ToTAl CoMPREHENSIVE INCoME/(loSS) FoR THE yEAR (704,008,725) 46,398,986 (1,362,987,584) 37,076,495,889
NET ASSETS ATTRIBUTABlE To UNITHolDERS AT 31ST DECEMBER 2,412,353,952 1,267,054,099 42,960,355,403 88,566,779,452
The accompanying notes form part of these financial statements .
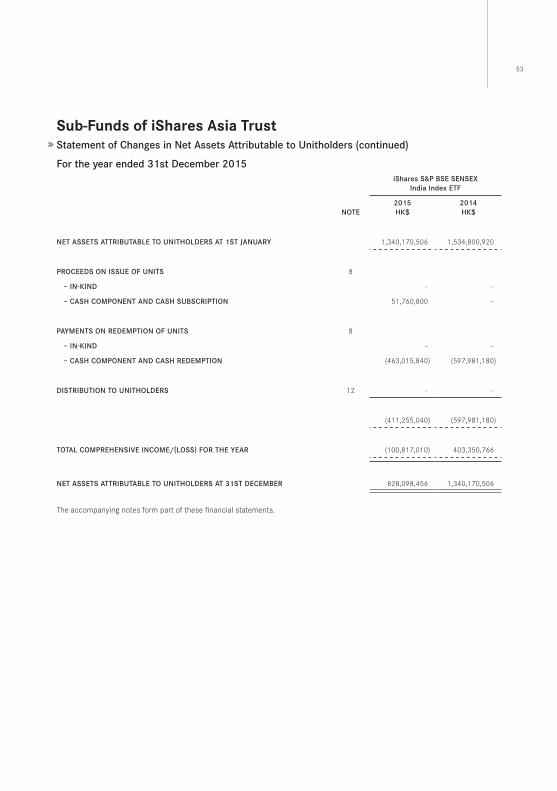
53
Sub-funds of iShares Asia TrustStatement of Changes in Net Assets Attributable to Unitholders (continued)
For the year ended 31st December 2015iShares S﹠P BSE SENSEX
India Index ETF
NoTE2015HK$
2014HK$
NET ASSETS ATTRIBUTABlE To UNITHolDERS AT 1ST JANUARy 1,340,170,506 1,534,800,920
PRoCEEDS oN ISSUE oF UNITS 8
– IN-KIND – –
– CASH CoMPoNENT AND CASH SUBSCRIPTIoN 51,760,800 –
PAyMENTS oN REDEMPTIoN oF UNITS 8
– IN-KIND – –
– CASH CoMPoNENT AND CASH REDEMPTIoN (463,015,840) (597,981,180)
DISTRIBUTIoN To UNITHolDERS 12 – –
(411,255,040) (597,981,180)
ToTAl CoMPREHENSIVE INCoME/(loSS) FoR THE yEAR (100,817,010) 403,350,766
NET ASSETS ATTRIBUTABlE To UNITHolDERS AT 31ST DECEMBER 828,098,456 1,340,170,506
The accompanying notes form part of these financial statements .
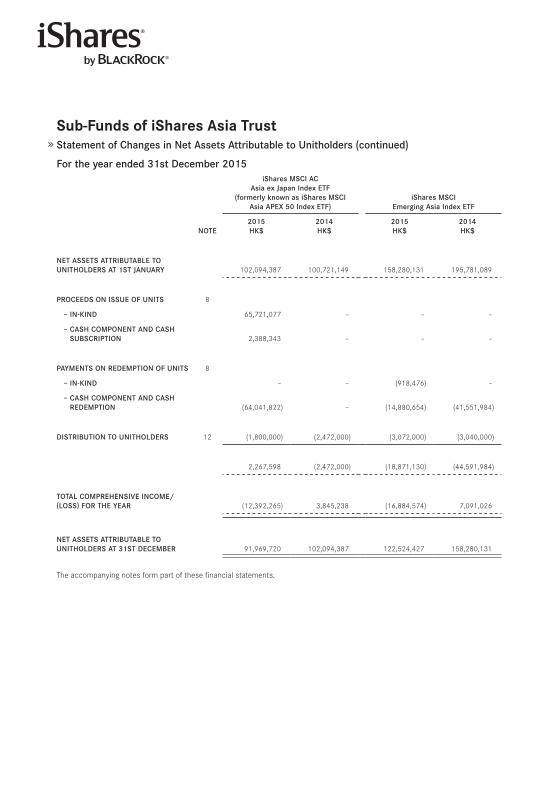
Sub-funds of iShares Asia TrustStatement of Changes in Net Assets Attributable to Unitholders (continued)
For the year ended 31st December 2015iShares MSCI AC
Asia ex Japan Index ETF(formerly known as iShares MSCI
Asia APEX 50 Index ETF)iShares MSCI
Emerging Asia Index ETF
NoTE2015HK$
2014HK$
2015HK$
2014HK$
NET ASSETS ATTRIBUTABlE To UNITHolDERS AT 1ST JANUARy 102,094,387 100,721,149 158,280,131 195,781,089
PRoCEEDS oN ISSUE oF UNITS 8
– IN-KIND 65,721,077 – – –
– CASH CoMPoNENT AND CASH SUBSCRIPTIoN 2,388,343 – – –
PAyMENTS oN REDEMPTIoN oF UNITS 8
– IN-KIND – – (918,476) –
– CASH CoMPoNENT AND CASH REDEMPTIoN (64,041,822) – (14,880,654) (41,551,984)
DISTRIBUTIoN To UNITHolDERS 12 (1,800,000) (2,472,000) (3,072,000) (3,040,000)
2,267,598 (2,472,000) (18,871,130) (44,591,984)
ToTAl CoMPREHENSIVE INCoME/(loSS) FoR THE yEAR (12,392,265) 3,845,238 (16,884,574) 7,091,026
NET ASSETS ATTRIBUTABlE To UNITHolDERS AT 31ST DECEMBER 91,969,720 102,094,387 122,524,427 158,280,131
The accompanying notes form part of these financial statements .
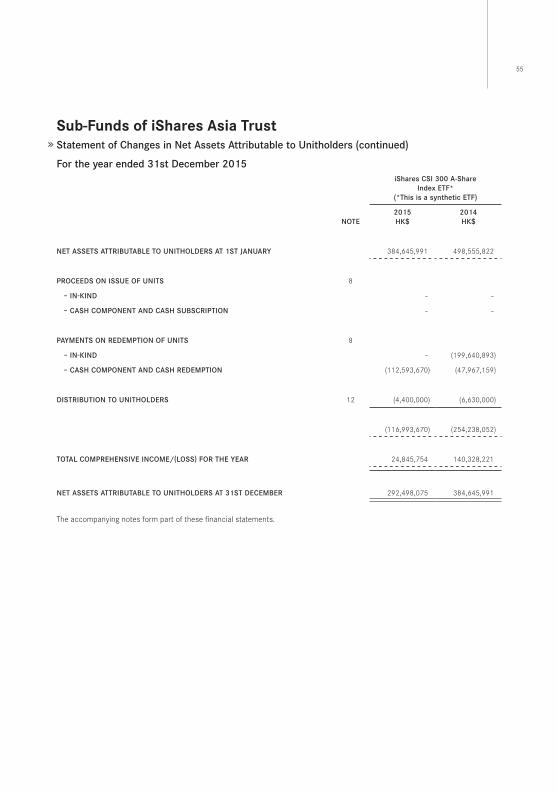
55
Sub-funds of iShares Asia TrustStatement of Changes in Net Assets Attributable to Unitholders (continued)
For the year ended 31st December 2015iShares CSI 300 A-Share
Index ETF* (*This is a synthetic ETF)
NoTE2015HK$
2014HK$
NET ASSETS ATTRIBUTABlE To UNITHolDERS AT 1ST JANUARy 384,645,991 498,555,822
PRoCEEDS oN ISSUE oF UNITS 8
– IN-KIND – –
– CASH CoMPoNENT AND CASH SUBSCRIPTIoN – –
PAyMENTS oN REDEMPTIoN oF UNITS 8
– IN-KIND – (199,640,893)
– CASH CoMPoNENT AND CASH REDEMPTIoN (112,593,670) (47,967,159)
DISTRIBUTIoN To UNITHolDERS 12 (4,400,000) (6,630,000)
(116,993,670) (254,238,052)
ToTAl CoMPREHENSIVE INCoME/(loSS) FoR THE yEAR 24,845,754 140,328,221
NET ASSETS ATTRIBUTABlE To UNITHolDERS AT 31ST DECEMBER 292,498,075 384,645,991
The accompanying notes form part of these financial statements .
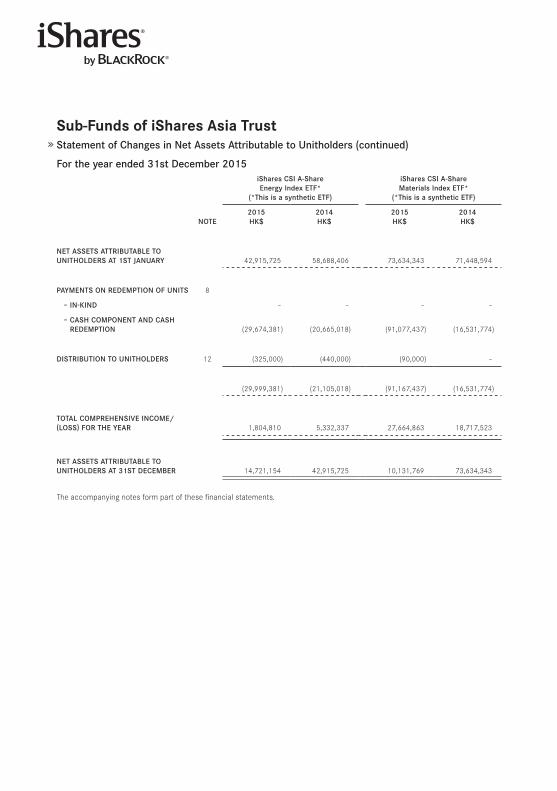
Sub-funds of iShares Asia TrustStatement of Changes in Net Assets Attributable to Unitholders (continued)
For the year ended 31st December 2015iShares CSI A-ShareEnergy Index ETF*
(*This is a synthetic ETF)
iShares CSI A-Share Materials Index ETF*
(*This is a synthetic ETF)
NoTE2015HK$
2014HK$
2015HK$
2014HK$
NET ASSETS ATTRIBUTABlE To UNITHolDERS AT 1ST JANUARy 42,915,725 58,688,406 73,634,343 71,448,594
PAyMENTS oN REDEMPTIoN oF UNITS 8
– IN-KIND – – – –
– CASH CoMPoNENT AND CASH REDEMPTIoN (29,674,381) (20,665,018) (91,077,437) (16,531,774)
DISTRIBUTIoN To UNITHolDERS 12 (325,000) (440,000) (90,000) –
(29,999,381) (21,105,018) (91,167,437) (16,531,774)
ToTAl CoMPREHENSIVE INCoME/(loSS) FoR THE yEAR 1,804,810 5,332,337 27,664,863 18,717,523
NET ASSETS ATTRIBUTABlE To UNITHolDERS AT 31ST DECEMBER 14,721,154 42,915,725 10,131,769 73,634,343
The accompanying notes form part of these financial statements .
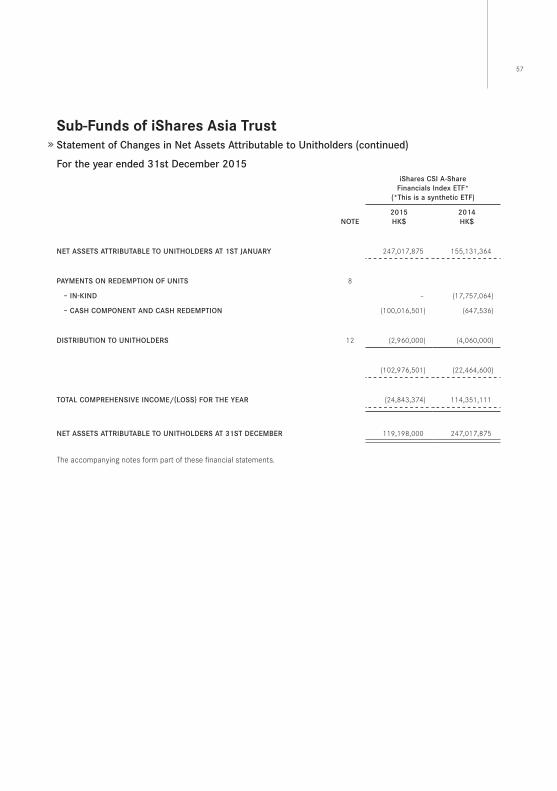
57
Sub-funds of iShares Asia TrustStatement of Changes in Net Assets Attributable to Unitholders (continued)
For the year ended 31st December 2015iShares CSI A-Share
Financials Index ETF* (*This is a synthetic ETF)
NoTE2015HK$
2014HK$
NET ASSETS ATTRIBUTABlE To UNITHolDERS AT 1ST JANUARy 247,017,875 155,131,364
PAyMENTS oN REDEMPTIoN oF UNITS 8
– IN-KIND – (17,757,064)
– CASH CoMPoNENT AND CASH REDEMPTIoN (100,016,501) (647,536)
DISTRIBUTIoN To UNITHolDERS 12 (2,960,000) (4,060,000)
(102,976,501) (22,464,600)
ToTAl CoMPREHENSIVE INCoME/(loSS) FoR THE yEAR (24,843,374) 114,351,111
NET ASSETS ATTRIBUTABlE To UNITHolDERS AT 31ST DECEMBER 119,198,000 247,017,875
The accompanying notes form part of these financial statements .
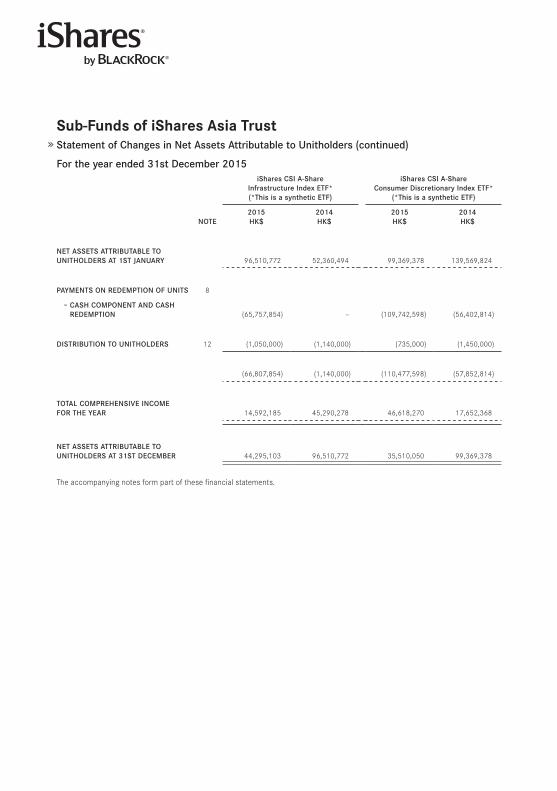
Sub-funds of iShares Asia TrustStatement of Changes in Net Assets Attributable to Unitholders (continued)
For the year ended 31st December 2015iShares CSI A-Share
Infrastructure Index ETF* (*This is a synthetic ETF)
iShares CSI A-ShareConsumer Discretionary Index ETF*
(*This is a synthetic ETF)
NoTE2015HK$
2014HK$
2015HK$
2014HK$
NET ASSETS ATTRIBUTABlE To UNITHolDERS AT 1ST JANUARy 96,510,772 52,360,494 99,369,378 139,569,824
PAyMENTS oN REDEMPTIoN oF UNITS 8
– CASH CoMPoNENT AND CASH REDEMPTIoN (65,757,854) – (109,742,598) (56,402,814)
DISTRIBUTIoN To UNITHolDERS 12 (1,050,000) (1,140,000) (735,000) (1,450,000)
(66,807,854) (1,140,000) (110,477,598) (57,852,814)
ToTAl CoMPREHENSIVE INCoME FoR THE yEAR 14,592,185 45,290,278 46,618,270 17,652,368
NET ASSETS ATTRIBUTABlE To UNITHolDERS AT 31ST DECEMBER 44,295,103 96,510,772 35,510,050 99,369,378
The accompanying notes form part of these financial statements .
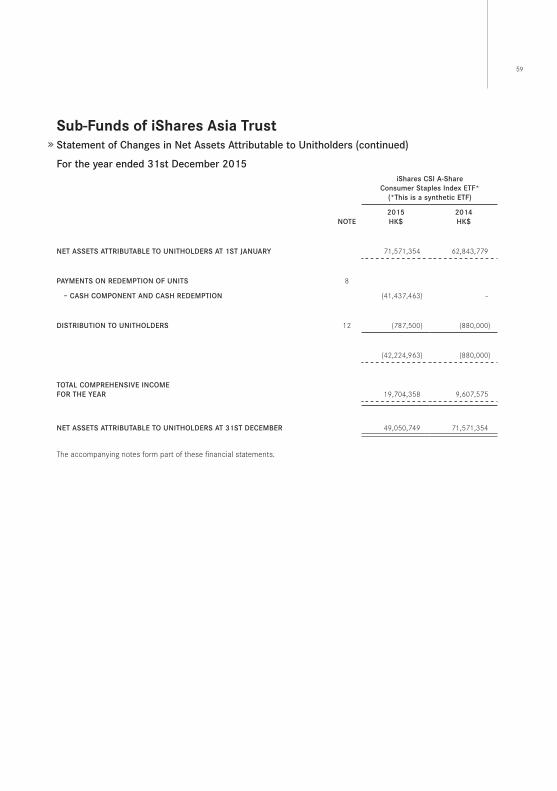
59
Sub-funds of iShares Asia TrustStatement of Changes in Net Assets Attributable to Unitholders (continued)
For the year ended 31st December 2015iShares CSI A-Share
Consumer Staples Index ETF* (*This is a synthetic ETF)
NoTE2015HK$
2014HK$
NET ASSETS ATTRIBUTABlE To UNITHolDERS AT 1ST JANUARy 71,571,354 62,843,779
PAyMENTS oN REDEMPTIoN oF UNITS 8
– CASH CoMPoNENT AND CASH REDEMPTIoN (41,437,463) –
DISTRIBUTIoN To UNITHolDERS 12 (787,500) (880,000)
(42,224,963) (880,000)
ToTAl CoMPREHENSIVE INCoME FoR THE yEAR 19,704,358 9,607,575
NET ASSETS ATTRIBUTABlE To UNITHolDERS AT 31ST DECEMBER 49,050,749 71,571,354
The accompanying notes form part of these financial statements .
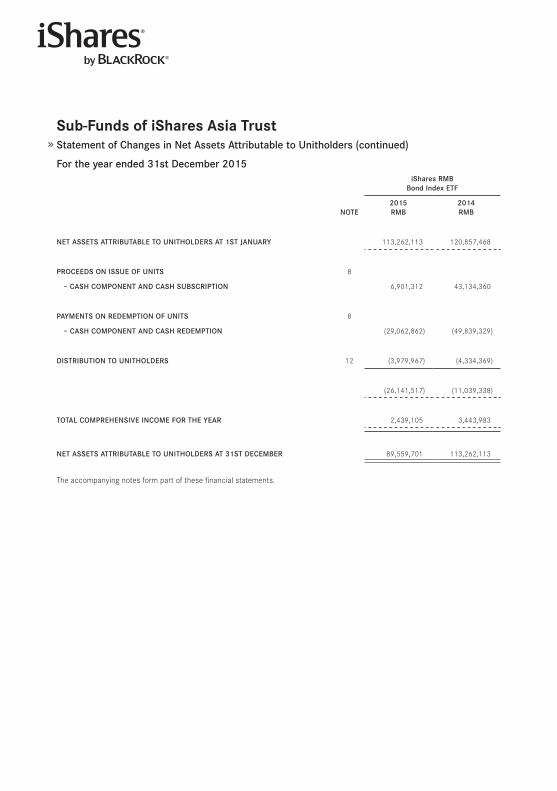
Sub-funds of iShares Asia TrustStatement of Changes in Net Assets Attributable to Unitholders (continued)
For the year ended 31st December 2015iShares RMB
Bond Index ETF
NoTE2015RMB
2014RMB
NET ASSETS ATTRIBUTABlE To UNITHolDERS AT 1ST JANUARy 113,262,113 120,857,468
PRoCEEDS oN ISSUE oF UNITS 8
– CASH CoMPoNENT AND CASH SUBSCRIPTIoN 6,901,312 43,134,360
PAyMENTS oN REDEMPTIoN oF UNITS 8
– CASH CoMPoNENT AND CASH REDEMPTIoN (29,062,862) (49,839,329)
DISTRIBUTIoN To UNITHolDERS 12 (3,979,967) (4,334,369)
(26,141,517) (11,039,338)
ToTAl CoMPREHENSIVE INCoME FoR THE yEAR 2,439,105 3,443,983
NET ASSETS ATTRIBUTABlE To UNITHolDERS AT 31ST DECEMBER 89,559,701 113,262,113
The accompanying notes form part of these financial statements .
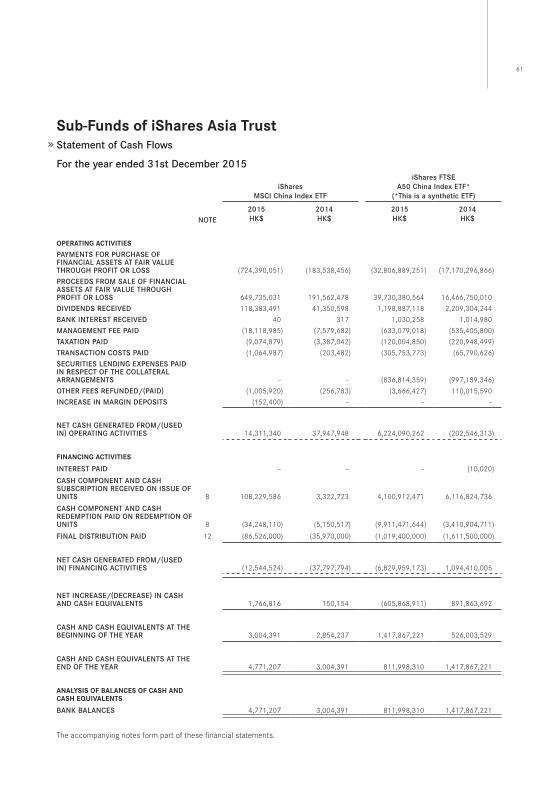
61
Sub-funds of iShares Asia TrustStatement of Cash Flows
For the year ended 31st December 2015
iSharesMSCI China Index ETF
iShares FTSEA50 China Index ETF*
(*This is a synthetic ETF)
NoTE2015HK$
2014HK$
2015HK$
2014HK$
opeRATing ACTiViTieS
PAyMENTS FoR PURCHASE oF FINANCIAl ASSETS AT FAIR VAlUE THRoUgH PRoFIT oR loSS (724,390,051) (183,538,456) (32,806,889,251) (17,170,296,866)
PRoCEEDS FRoM SAlE oF FINANCIAl ASSETS AT FAIR VAlUE THRoUgH PRoFIT oR loSS 649,735,031 191,562,478 39,730,380,564 16,466,750,010
DIVIDENDS RECEIVED 118,383,491 41,350,598 1,198,887,118 2,209,304,244
BANK INTEREST RECEIVED 40 317 1,030,258 1,014,980
MANAgEMENT FEE PAID (18,118,985) (7,579,682) (633,079,018) (535,405,800)
TAXATIoN PAID (9,074,879) (3,387,042) (120,004,850) (220,948,499)
TRANSACTIoN CoSTS PAID (1,064,987) (203,482) (305,753,773) (65,790,626)
SECURITIES lENDINg EXPENSES PAID IN RESPECT oF THE CollATERAl ARRANgEMENTS – – (836,814,359) (997,189,346)
oTHER FEES REFUNDED/(PAID) (1,005,920) (256,783) (3,666,427) 110,015,590
INCREASE IN MARgIN DEPoSITS (152,400) – – –
NET CASH gENERATED FRoM/(USED IN) oPERATINg ACTIVITIES 14,311,340 37,947,948 6,224,090,262 (202,546,313)
finAnCing ACTiViTieS
INTEREST PAID – – – (10,020)
CASH CoMPoNENT AND CASH SUBSCRIPTIoN RECEIVED oN ISSUE oF UNITS 8 108,229,586 3,322,723 4,100,912,471 6,116,824,736
CASH CoMPoNENT AND CASH REDEMPTIoN PAID oN REDEMPTIoN oF UNITS 8 (34,248,110) (5,150,517) (9,911,471,644) (3,410,904,711)
FINAl DISTRIBUTIoN PAID 12 (86,526,000) (35,970,000) (1,019,400,000) (1,611,500,000)
NET CASH gENERATED FRoM/(USED IN) FINANCINg ACTIVITIES (12,544,524) (37,797,794) (6,829,959,173) 1,094,410,005
NET INCREASE/(DECREASE) IN CASH AND CASH EqUIVAlENTS 1,766,816 150,154 (605,868,911) 891,863,692
CASH AND CASH EqUIVAlENTS AT THE BEgINNINg oF THE yEAR 3,004,391 2,854,237 1,417,867,221 526,003,529
CASH AND CASH EqUIVAlENTS AT THE END oF THE yEAR 4,771,207 3,004,391 811,998,310 1,417,867,221
AnAlYSiS of BAlAnCeS of CASh And CASh eQUiVAlenTS
BANK BAlANCES 4,771,207 3,004,391 811,998,310 1,417,867,221
The accompanying notes form part of these financial statements .
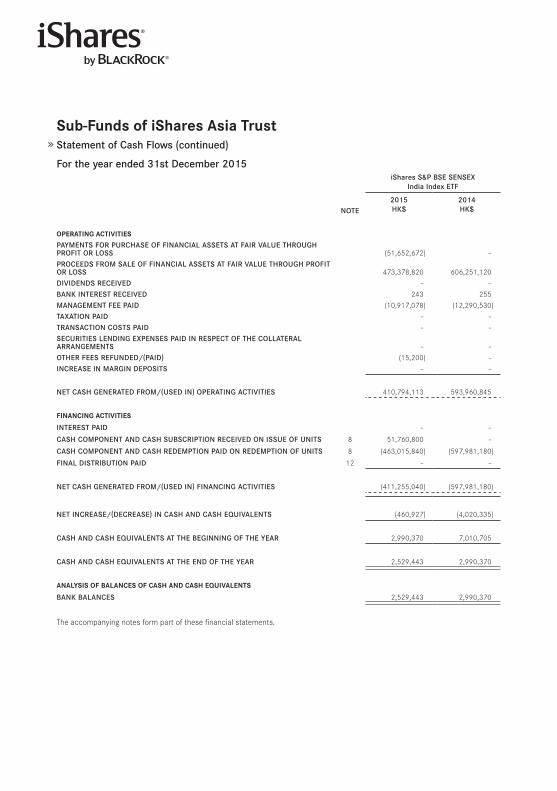
Sub-funds of iShares Asia TrustStatement of Cash Flows (continued)
For the year ended 31st December 2015iShares S﹠P BSE SENSEX
India Index ETF
NoTE2015HK$
2014HK$
opeRATing ACTiViTieS
PAyMENTS FoR PURCHASE oF FINANCIAl ASSETS AT FAIR VAlUE THRoUgH PRoFIT oR loSS (51,652,672) –
PRoCEEDS FRoM SAlE oF FINANCIAl ASSETS AT FAIR VAlUE THRoUgH PRoFIT oR loSS 473,378,820 606,251,120
DIVIDENDS RECEIVED – –
BANK INTEREST RECEIVED 243 255
MANAgEMENT FEE PAID (10,917,078) (12,290,530)
TAXATIoN PAID – –
TRANSACTIoN CoSTS PAID – –
SECURITIES lENDINg EXPENSES PAID IN RESPECT oF THE CollATERAl ARRANgEMENTS – –
oTHER FEES REFUNDED/(PAID) (15,200) –
INCREASE IN MARgIN DEPoSITS – –
NET CASH gENERATED FRoM/(USED IN) oPERATINg ACTIVITIES 410,794,113 593,960,845
finAnCing ACTiViTieS
INTEREST PAID – –
CASH CoMPoNENT AND CASH SUBSCRIPTIoN RECEIVED oN ISSUE oF UNITS 8 51,760,800 –
CASH CoMPoNENT AND CASH REDEMPTIoN PAID oN REDEMPTIoN oF UNITS 8 (463,015,840) (597,981,180)
FINAl DISTRIBUTIoN PAID 12 – –
NET CASH gENERATED FRoM/(USED IN) FINANCINg ACTIVITIES (411,255,040) (597,981,180)
NET INCREASE/(DECREASE) IN CASH AND CASH EqUIVAlENTS (460,927) (4,020,335)
CASH AND CASH EqUIVAlENTS AT THE BEgINNINg oF THE yEAR 2,990,370 7,010,705
CASH AND CASH EqUIVAlENTS AT THE END oF THE yEAR 2,529,443 2,990,370
AnAlYSiS of BAlAnCeS of CASh And CASh eQUiVAlenTS
BANK BAlANCES 2,529,443 2,990,370
The accompanying notes form part of these financial statements .
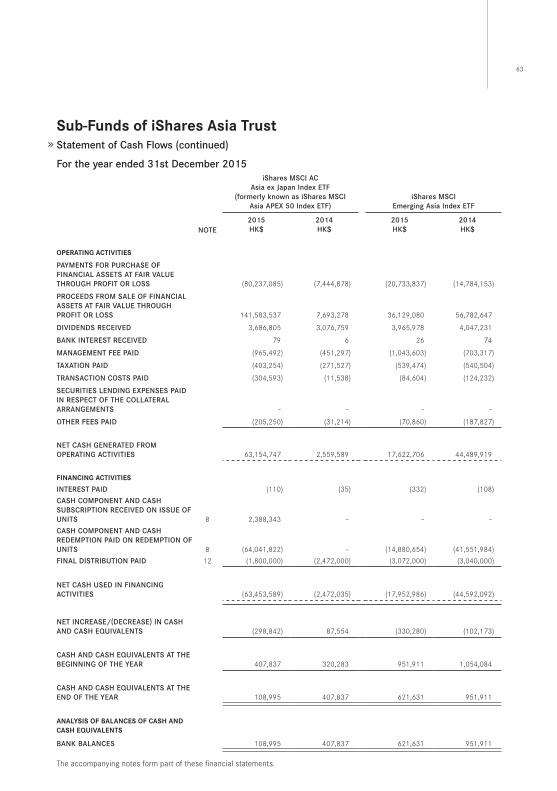
63
Sub-funds of iShares Asia TrustStatement of Cash Flows (continued)
For the year ended 31st December 2015iShares MSCI AC
Asia ex Japan Index ETF(formerly known as iShares MSCI
Asia APEX 50 Index ETF)iShares MSCI
Emerging Asia Index ETF
NoTE2015HK$
2014HK$
2015HK$
2014HK$
opeRATing ACTiViTieS
PAyMENTS FoR PURCHASE oF FINANCIAl ASSETS AT FAIR VAlUE THRoUgH PRoFIT oR loSS (80,237,085) (7,444,878) (20,733,837) (14,784,153)
PRoCEEDS FRoM SAlE oF FINANCIAl ASSETS AT FAIR VAlUE THRoUgH PRoFIT oR loSS 141,583,537 7,693,278 36,129,080 56,782,647
DIVIDENDS RECEIVED 3,686,805 3,076,759 3,965,978 4,047,231
BANK INTEREST RECEIVED 79 6 26 74
MANAgEMENT FEE PAID (965,492) (451,297) (1,043,603) (703,317)
TAXATIoN PAID (403,254) (271,527) (539,474) (540,504)
TRANSACTIoN CoSTS PAID (304,593) (11,538) (84,604) (124,232)
SECURITIES lENDINg EXPENSES PAID IN RESPECT oF THE CollATERAl ARRANgEMENTS – – – –
oTHER FEES PAID (205,250) (31,214) (70,860) (187,827)
NET CASH gENERATED FRoM oPERATINg ACTIVITIES 63,154,747 2,559,589 17,622,706 44,489,919
finAnCing ACTiViTieS
INTEREST PAID (110) (35) (332) (108)
CASH CoMPoNENT AND CASH SUBSCRIPTIoN RECEIVED oN ISSUE oF UNITS 8 2,388,343 – – –
CASH CoMPoNENT AND CASH REDEMPTIoN PAID oN REDEMPTIoN oF UNITS 8 (64,041,822) – (14,880,654) (41,551,984)
FINAl DISTRIBUTIoN PAID 12 (1,800,000) (2,472,000) (3,072,000) (3,040,000)
NET CASH USED IN FINANCINg ACTIVITIES (63,453,589) (2,472,035) (17,952,986) (44,592,092)
NET INCREASE/(DECREASE) IN CASH AND CASH EqUIVAlENTS (298,842) 87,554 (330,280) (102,173)
CASH AND CASH EqUIVAlENTS AT THE BEgINNINg oF THE yEAR 407,837 320,283 951,911 1,054,084
CASH AND CASH EqUIVAlENTS AT THE END oF THE yEAR 108,995 407,837 621,631 951,911
AnAlYSiS of BAlAnCeS of CASh And CASh eQUiVAlenTS
BANK BAlANCES 108,995 407,837 621,631 951,911
The accompanying notes form part of these financial statements .
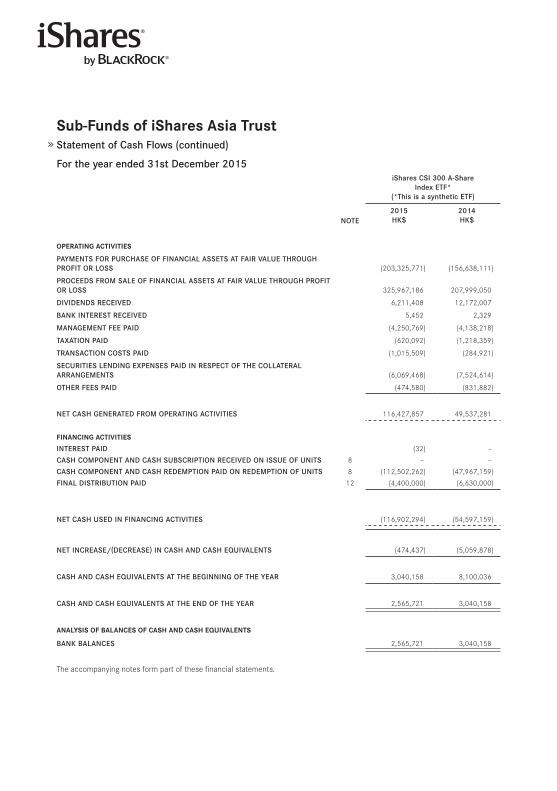
Sub-funds of iShares Asia TrustStatement of Cash Flows (continued)
For the year ended 31st December 2015iShares CSI 300 A-Share
Index ETF* (*This is a synthetic ETF)
NoTE2015HK$
2014HK$
opeRATing ACTiViTieS
PAyMENTS FoR PURCHASE oF FINANCIAl ASSETS AT FAIR VAlUE THRoUgH PRoFIT oR loSS (203,325,771) (156,638,111)
PRoCEEDS FRoM SAlE oF FINANCIAl ASSETS AT FAIR VAlUE THRoUgH PRoFIT oR loSS 325,967,186 207,999,050
DIVIDENDS RECEIVED 6,211,408 12,172,007
BANK INTEREST RECEIVED 5,452 2,329
MANAgEMENT FEE PAID (4,250,769) (4,138,218)
TAXATIoN PAID (620,092) (1,218,359)
TRANSACTIoN CoSTS PAID (1,015,509) (284,921)
SECURITIES lENDINg EXPENSES PAID IN RESPECT oF THE CollATERAl ARRANgEMENTS (6,069,468) (7,524,614)
oTHER FEES PAID (474,580) (831,882)
NET CASH gENERATED FRoM oPERATINg ACTIVITIES 116,427,857 49,537,281
finAnCing ACTiViTieS
INTEREST PAID (32) –
CASH CoMPoNENT AND CASH SUBSCRIPTIoN RECEIVED oN ISSUE oF UNITS 8 – –
CASH CoMPoNENT AND CASH REDEMPTIoN PAID oN REDEMPTIoN oF UNITS 8 (112,502,262) (47,967,159)
FINAl DISTRIBUTIoN PAID 12 (4,400,000) (6,630,000)
NET CASH USED IN FINANCINg ACTIVITIES (116,902,294) (54,597,159)
NET INCREASE/(DECREASE) IN CASH AND CASH EqUIVAlENTS (474,437) (5,059,878)
CASH AND CASH EqUIVAlENTS AT THE BEgINNINg oF THE yEAR 3,040,158 8,100,036
CASH AND CASH EqUIVAlENTS AT THE END oF THE yEAR 2,565,721 3,040,158
AnAlYSiS of BAlAnCeS of CASh And CASh eQUiVAlenTS
BANK BAlANCES 2,565,721 3,040,158
The accompanying notes form part of these financial statements .
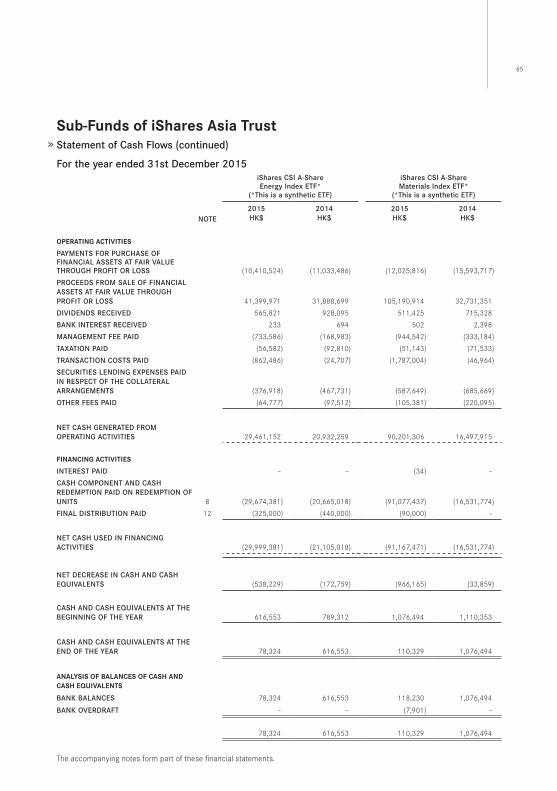
65
Sub-funds of iShares Asia TrustStatement of Cash Flows (continued)
For the year ended 31st December 2015iShares CSI A-ShareEnergy Index ETF*
(*This is a synthetic ETF)
iShares CSI A-Share Materials Index ETF*
(*This is a synthetic ETF)
NoTE2015HK$
2014HK$
2015HK$
2014HK$
opeRATing ACTiViTieS
PAyMENTS FoR PURCHASE oF FINANCIAl ASSETS AT FAIR VAlUE THRoUgH PRoFIT oR loSS (10,410,524) (11,033,486) (12,025,816) (15,593,717)
PRoCEEDS FRoM SAlE oF FINANCIAl ASSETS AT FAIR VAlUE THRoUgH PRoFIT oR loSS 41,399,971 31,888,699 105,190,914 32,731,351
DIVIDENDS RECEIVED 565,821 928,095 511,425 715,328
BANK INTEREST RECEIVED 233 694 502 2,398
MANAgEMENT FEE PAID (733,586) (168,983) (944,542) (333,184)
TAXATIoN PAID (56,582) (92,810) (51,143) (71,533)
TRANSACTIoN CoSTS PAID (862,486) (24,707) (1,787,004) (46,964)
SECURITIES lENDINg EXPENSES PAID IN RESPECT oF THE CollATERAl ARRANgEMENTS (376,918) (467,731) (587,649) (685,669)
oTHER FEES PAID (64,777) (97,512) (105,381) (220,095)
NET CASH gENERATED FRoM oPERATINg ACTIVITIES 29,461,152 20,932,259 90,201,306 16,497,915
finAnCing ACTiViTieS
INTEREST PAID – – (34) –
CASH CoMPoNENT AND CASH REDEMPTIoN PAID oN REDEMPTIoN oF UNITS 8 (29,674,381) (20,665,018) (91,077,437) (16,531,774)
FINAl DISTRIBUTIoN PAID 12 (325,000) (440,000) (90,000) –
NET CASH USED IN FINANCINg ACTIVITIES (29,999,381) (21,105,018) (91,167,471) (16,531,774)
NET DECREASE IN CASH AND CASH EqUIVAlENTS (538,229) (172,759) (966,165) (33,859)
CASH AND CASH EqUIVAlENTS AT THE BEgINNINg oF THE yEAR 616,553 789,312 1,076,494 1,110,353
CASH AND CASH EqUIVAlENTS AT THE END oF THE yEAR 78,324 616,553 110,329 1,076,494
AnAlYSiS of BAlAnCeS of CASh And CASh eQUiVAlenTS
BANK BAlANCES 78,324 616,553 118,230 1,076,494
BANK oVERDRAFT – – (7,901) –
78,324 616,553 110,329 1,076,494
The accompanying notes form part of these financial statements .
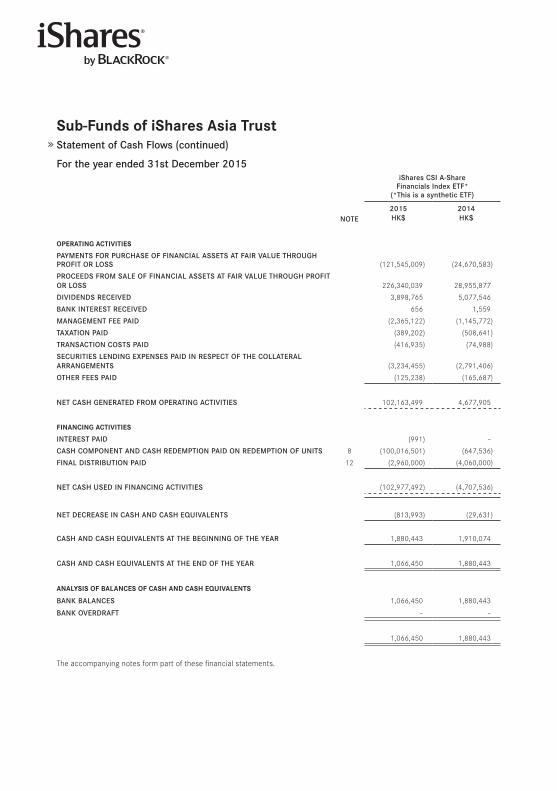
Sub-funds of iShares Asia TrustStatement of Cash Flows (continued)
For the year ended 31st December 2015iShares CSI A-Share
Financials Index ETF* (*This is a synthetic ETF)
NoTE2015HK$
2014HK$
opeRATing ACTiViTieS
PAyMENTS FoR PURCHASE oF FINANCIAl ASSETS AT FAIR VAlUE THRoUgH PRoFIT oR loSS (121,545,009) (24,670,583)
PRoCEEDS FRoM SAlE oF FINANCIAl ASSETS AT FAIR VAlUE THRoUgH PRoFIT oR loSS 226,340,039 28,955,877
DIVIDENDS RECEIVED 3,898,765 5,077,546
BANK INTEREST RECEIVED 656 1,559
MANAgEMENT FEE PAID (2,365,122) (1,145,772)
TAXATIoN PAID (389,202) (508,641)
TRANSACTIoN CoSTS PAID (416,935) (74,988)
SECURITIES lENDINg EXPENSES PAID IN RESPECT oF THE CollATERAl ARRANgEMENTS (3,234,455) (2,791,406)
oTHER FEES PAID (125,238) (165,687)
NET CASH gENERATED FRoM oPERATINg ACTIVITIES 102,163,499 4,677,905
finAnCing ACTiViTieS
INTEREST PAID (991) –
CASH CoMPoNENT AND CASH REDEMPTIoN PAID oN REDEMPTIoN oF UNITS 8 (100,016,501) (647,536)
FINAl DISTRIBUTIoN PAID 12 (2,960,000) (4,060,000)
NET CASH USED IN FINANCINg ACTIVITIES (102,977,492) (4,707,536)
NET DECREASE IN CASH AND CASH EqUIVAlENTS (813,993) (29,631)
CASH AND CASH EqUIVAlENTS AT THE BEgINNINg oF THE yEAR 1,880,443 1,910,074
CASH AND CASH EqUIVAlENTS AT THE END oF THE yEAR 1,066,450 1,880,443
AnAlYSiS of BAlAnCeS of CASh And CASh eQUiVAlenTS
BANK BAlANCES 1,066,450 1,880,443
BANK oVERDRAFT – –
1,066,450 1,880,443
The accompanying notes form part of these financial statements .
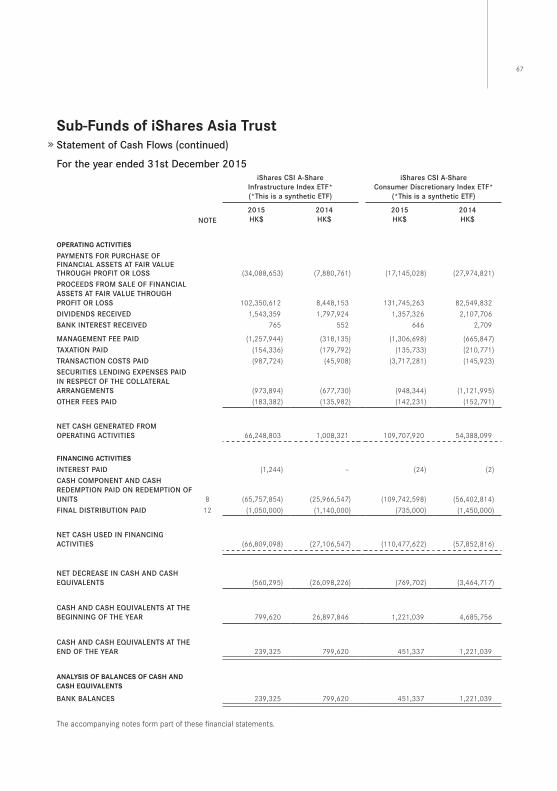
67
Sub-funds of iShares Asia TrustStatement of Cash Flows (continued)
For the year ended 31st December 2015iShares CSI A-Share
Infrastructure Index ETF* (*This is a synthetic ETF)
iShares CSI A-ShareConsumer Discretionary Index ETF*
(*This is a synthetic ETF)
NoTE2015HK$
2014HK$
2015HK$
2014HK$
opeRATing ACTiViTieS
PAyMENTS FoR PURCHASE oF FINANCIAl ASSETS AT FAIR VAlUE THRoUgH PRoFIT oR loSS (34,088,653) (7,880,761) (17,145,028) (27,974,821)
PRoCEEDS FRoM SAlE oF FINANCIAl ASSETS AT FAIR VAlUE THRoUgH PRoFIT oR loSS 102,350,612 8,448,153 131,745,263 82,549,832
DIVIDENDS RECEIVED 1,543,359 1,797,924 1,357,326 2,107,706
BANK INTEREST RECEIVED 765 552 646 2,709
MANAgEMENT FEE PAID (1,257,944) (318,135) (1,306,698) (665,847)
TAXATIoN PAID (154,336) (179,792) (135,733) (210,771)
TRANSACTIoN CoSTS PAID (987,724) (45,908) (3,717,281) (145,923)
SECURITIES lENDINg EXPENSES PAID IN RESPECT oF THE CollATERAl ARRANgEMENTS (973,894) (677,730) (948,344) (1,121,995)
oTHER FEES PAID (183,382) (135,982) (142,231) (152,791)
NET CASH gENERATED FRoM oPERATINg ACTIVITIES 66,248,803 1,008,321 109,707,920 54,388,099
finAnCing ACTiViTieS
INTEREST PAID (1,244) – (24) (2)
CASH CoMPoNENT AND CASH REDEMPTIoN PAID oN REDEMPTIoN oF UNITS 8 (65,757,854) (25,966,547) (109,742,598) (56,402,814)
FINAl DISTRIBUTIoN PAID 12 (1,050,000) (1,140,000) (735,000) (1,450,000)
NET CASH USED IN FINANCINg ACTIVITIES (66,809,098) (27,106,547) (110,477,622) (57,852,816)
NET DECREASE IN CASH AND CASH EqUIVAlENTS (560,295) (26,098,226) (769,702) (3,464,717)
CASH AND CASH EqUIVAlENTS AT THE BEgINNINg oF THE yEAR 799,620 26,897,846 1,221,039 4,685,756
CASH AND CASH EqUIVAlENTS AT THE END oF THE yEAR 239,325 799,620 451,337 1,221,039
AnAlYSiS of BAlAnCeS of CASh And CASh eQUiVAlenTS
BANK BAlANCES 239,325 799,620 451,337 1,221,039
The accompanying notes form part of these financial statements .
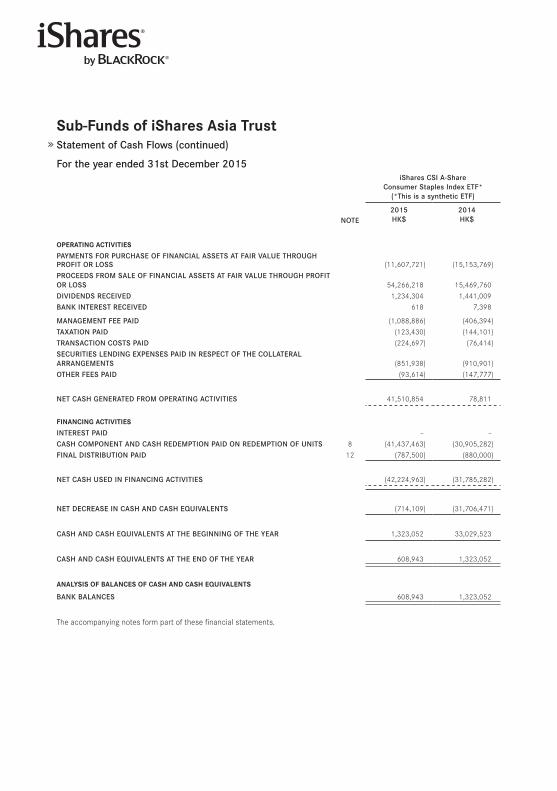
Sub-funds of iShares Asia TrustStatement of Cash Flows (continued)
For the year ended 31st December 2015iShares CSI A-Share
Consumer Staples Index ETF* (*This is a synthetic ETF)
NoTE2015HK$
2014HK$
opeRATing ACTiViTieS
PAyMENTS FoR PURCHASE oF FINANCIAl ASSETS AT FAIR VAlUE THRoUgH PRoFIT oR loSS (11,607,721) (15,153,769)
PRoCEEDS FRoM SAlE oF FINANCIAl ASSETS AT FAIR VAlUE THRoUgH PRoFIT oR loSS 54,266,218 15,469,760
DIVIDENDS RECEIVED 1,234,304 1,441,009
BANK INTEREST RECEIVED 618 7,398
MANAgEMENT FEE PAID (1,088,886) (406,394)
TAXATIoN PAID (123,430) (144,101)
TRANSACTIoN CoSTS PAID (224,697) (76,414)
SECURITIES lENDINg EXPENSES PAID IN RESPECT oF THE CollATERAl ARRANgEMENTS (851,938) (910,901)
oTHER FEES PAID (93,614) (147,777)
NET CASH gENERATED FRoM oPERATINg ACTIVITIES 41,510,854 78,811
finAnCing ACTiViTieS
INTEREST PAID – –
CASH CoMPoNENT AND CASH REDEMPTIoN PAID oN REDEMPTIoN oF UNITS 8 (41,437,463) (30,905,282)
FINAl DISTRIBUTIoN PAID 12 (787,500) (880,000)
NET CASH USED IN FINANCINg ACTIVITIES (42,224,963) (31,785,282)
NET DECREASE IN CASH AND CASH EqUIVAlENTS (714,109) (31,706,471)
CASH AND CASH EqUIVAlENTS AT THE BEgINNINg oF THE yEAR 1,323,052 33,029,523
CASH AND CASH EqUIVAlENTS AT THE END oF THE yEAR 608,943 1,323,052
AnAlYSiS of BAlAnCeS of CASh And CASh eQUiVAlenTS
BANK BAlANCES 608,943 1,323,052
The accompanying notes form part of these financial statements .
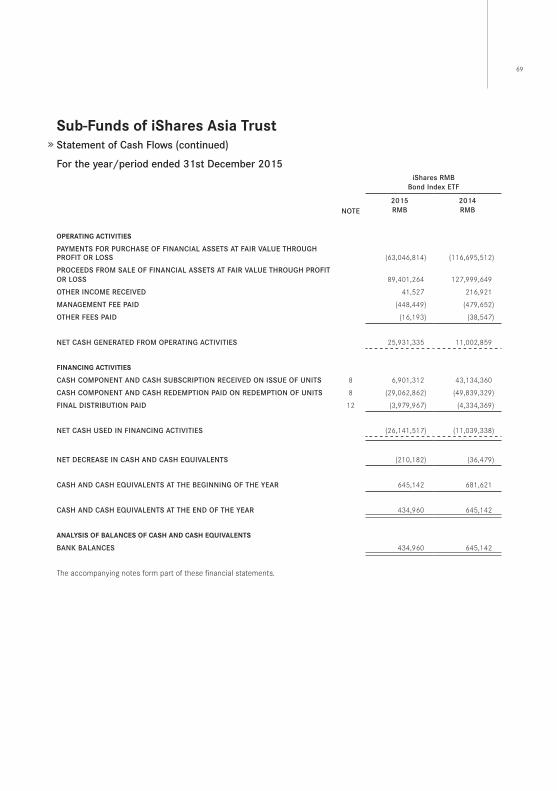
69
Sub-funds of iShares Asia TrustStatement of Cash Flows (continued)
For the year/period ended 31st December 2015iShares RMB
Bond Index ETF
NoTE2015RMB
2014RMB
opeRATing ACTiViTieS
PAyMENTS FoR PURCHASE oF FINANCIAl ASSETS AT FAIR VAlUE THRoUgH PRoFIT oR loSS (63,046,814) (116,695,512)
PRoCEEDS FRoM SAlE oF FINANCIAl ASSETS AT FAIR VAlUE THRoUgH PRoFIT oR loSS 89,401,264 127,999,649
oTHER INCoME RECEIVED 41,527 216,921
MANAgEMENT FEE PAID (448,449) (479,652)
oTHER FEES PAID (16,193) (38,547)
NET CASH gENERATED FRoM oPERATINg ACTIVITIES 25,931,335 11,002,859
finAnCing ACTiViTieS
CASH CoMPoNENT AND CASH SUBSCRIPTIoN RECEIVED oN ISSUE oF UNITS 8 6,901,312 43,134,360
CASH CoMPoNENT AND CASH REDEMPTIoN PAID oN REDEMPTIoN oF UNITS 8 (29,062,862) (49,839,329)
FINAl DISTRIBUTIoN PAID 12 (3,979,967) (4,334,369)
NET CASH USED IN FINANCINg ACTIVITIES (26,141,517) (11,039,338)
NET DECREASE IN CASH AND CASH EqUIVAlENTS (210,182) (36,479)
CASH AND CASH EqUIVAlENTS AT THE BEgINNINg oF THE yEAR 645,142 681,621
CASH AND CASH EqUIVAlENTS AT THE END oF THE yEAR 434,960 645,142
AnAlYSiS of BAlAnCeS of CASh And CASh eQUiVAlenTS
BANK BAlANCES 434,960 645,142
The accompanying notes form part of these financial statements .
Sub-funds of iShares Asia TrustNotes to the Financial Statements
1 THE TRUSTiShares Asia Trust (the “Trust”) is an umbrella unit trust governed by its Trust Deed dated 16th November 2001, as amended, (the “Trust Deed”) and authorized by the Securities and Futures Commission of Hong Kong (the “SFC”) pursuant to Section 104(1) of the Securities and Futures Ordinance .
As at 31st December 2015, the Trust has established thirteen sub-funds (each a separate sub-fund of the Trust and referred to individually or collectively as the “Sub-Funds”):
NAME oF SUB-FUND lISTINg DATE oN THE SToCK EXCHANgE oF HoNg KoNg
lIMITED (THE “SEHK”)
iShares MSCI China Index ETF 28th November 2001
iShares FTSE A50 China Index ETF* (*This is a synthetic ETF) 18th November 2004
iShares S&P BSE SENSEX India Index ETF 2nd November 2006
iShares MSCI AC Asia ex Japan Index ETF (formerly known as iShares MSCI Asia APEX 50 Index ETF)
23rd April 2009
iShares MSCI Emerging Asia Index ETF 23rd April 2009
iShares CSI 300 A-Share Index ETF* (*This is a synthetic ETF) 18th November 2009
iShares CSI A-Share Energy Index ETF* (*This is a synthetic ETF) 18th November 2009
iShares CSI A-Share Materials Index ETF* (*This is a synthetic ETF) 18th November 2009
iShares CSI A-Share Financials Index ETF* (*This is a synthetic ETF) 18th November 2009
iShares CSI A-Share Infrastructure Index ETF* (*This is a synthetic ETF) 18th November 2009
iShares CSI A-Share Consumer Discretionary Index ETF* (*This is a synthetic ETF) 20th July 2010
iShares CSI A-Share Consumer Staples Index ETF* (*This is a synthetic ETF) 20th July 2010
iShares RMB Bond Index ETF 18th June 2013
The manager of the Trust is BlackRock Asset Management North Asia Limited (the “Manager”) and the trustee is HSBC Institutional Trust Services (Asia) Limited (the “Trustee”) .
Pursuant to the Announcement and Notice on 18th September 2015, the net asset value of all the units outstanding in the iShares MSCI Asia APEX Mid Cap Index ETF (“MSCI Asia APEX Mid Cap ETF”) and iShares MSCI Asia APEX Small Cap Index ETF (“MSCI Asia APEX Small Cap ETF”) (collectively as the “Terminated Sub-Funds”) were less than HK$150 million (HK$8 .50 million and HK$43 .37 million for MSCI Asia APEX Mid Cap ETF and MSCI Asia APEX Small Cap ETF respectively) . The Manager therefore announced that it has, by means of a resolution of the board of directors of the Manager, decided to terminate the Terminated Sub-Funds and voluntarily seek deauthorisation and delisting of these Terminated Sub-Funds .
In accordance with the Final Distribution Announcement on 4th December 2015, a final distribution was declared in respect of the unitholders who were holding units on 28th October 2015 (the “Relevant Investors”) . The final distribution per unit for MSCI Asia APEX Mid Cap ETF and MSCI Asia APEX Small Cap ETF were HK$37 .1497 and HK$39 .7640 respectively, which were determined on the basis of net asset value per unit . Each Relevant Investor will be entitled to a final distribution of an amount equal to the relevant Terminated Sub-Fund’s then net asset value in proportion to their interests in the Terminated Sub-Funds . Pursuant to the Announcement and Notice on 18th December 2015, the Terminated Sub-Funds have no outstanding contingent or actual liabilities or assets . The termination process of the Terminated Sub-Funds have also been completed .
The Terminated Sub-Funds were terminated, deauthorised by the SFC and delisted from the SEHK on 18th December 2015 .
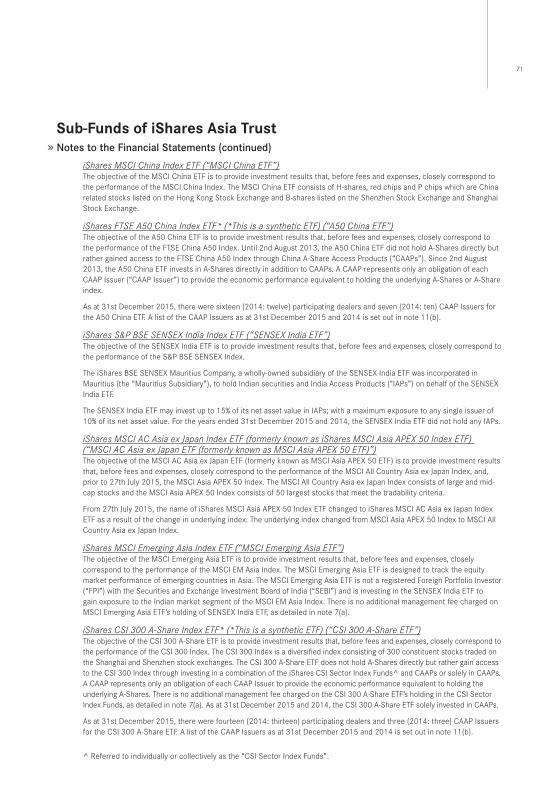
71
Sub-funds of iShares Asia TrustNotes to the Financial Statements (continued)
iSharesMSCIChinaIndexETF(“MSCIChinaETF”)The objective of the MSCI China ETF is to provide investment results that, before fees and expenses, closely correspond to the performance of the MSCI China Index . The MSCI China ETF consists of H-shares, red chips and P chips which are China related stocks listed on the Hong Kong Stock Exchange and B-shares listed on the Shenzhen Stock Exchange and Shanghai Stock Exchange .
iSharesFTSEA50ChinaIndexETF*(*ThisisasyntheticETF)(“A50ChinaETF”)The objective of the A50 China ETF is to provide investment results that, before fees and expenses, closely correspond to the performance of the FTSE China A50 Index . Until 2nd August 2013, the A50 China ETF did not hold A-Shares directly but rather gained access to the FTSE China A50 Index through China A-Share Access Products (“CAAPs”) . Since 2nd August 2013, the A50 China ETF invests in A-Shares directly in addition to CAAPs . A CAAP represents only an obligation of each CAAP Issuer (“CAAP Issuer”) to provide the economic performance equivalent to holding the underlying A-Shares or A-Share index .
As at 31st December 2015, there were sixteen (2014: twelve) participating dealers and seven (2014: ten) CAAP Issuers for the A50 China ETF . A list of the CAAP Issuers as at 31st December 2015 and 2014 is set out in note 11(b) .
iSharesS&PBSESENSEXIndiaIndexETF(“SENSEXIndiaETF”)The objective of the SENSEX India ETF is to provide investment results that, before fees and expenses, closely correspond to the performance of the S&P BSE SENSEX Index .
The iShares BSE SENSEX Mauritius Company, a wholly-owned subsidiary of the SENSEX India ETF was incorporated in Mauritius (the “Mauritius Subsidiary”), to hold Indian securities and India Access Products (“IAPs”) on behalf of the SENSEX India ETF .
The SENSEX India ETF may invest up to 15% of its net asset value in IAPs; with a maximum exposure to any single issuer of 10% of its net asset value . For the years ended 31st December 2015 and 2014, the SENSEX India ETF did not hold any IAPs .
iSharesMSCIACAsiaexJapanIndexETF(formerlyknownasiSharesMSCIAsiaAPEX50IndexETF)(“MSCIACAsiaexJapanETF(formerlyknownasMSCIAsiaAPEX50ETF)”)The objective of the MSCI AC Asia ex Japan ETF (formerly known as MSCI Asia APEX 50 ETF) is to provide investment results that, before fees and expenses, closely correspond to the performance of the MSCI All Country Asia ex Japan Index, and, prior to 27th July 2015, the MSCI Asia APEX 50 Index . The MSCI All Country Asia ex Japan Index consists of large and mid-cap stocks and the MSCI Asia APEX 50 Index consists of 50 largest stocks that meet the tradability criteria .
From 27th July 2015, the name of iShares MSCI Asia APEX 50 Index ETF changed to iShares MSCI AC Asia ex Japan Index ETF as a result of the change in underlying index . The underlying index changed from MSCI Asia APEX 50 Index to MSCI All Country Asia ex Japan Index .
iSharesMSCIEmergingAsiaIndexETF(“MSCIEmergingAsiaETF”)The objective of the MSCI Emerging Asia ETF is to provide investment results that, before fees and expenses, closely correspond to the performance of the MSCI EM Asia Index . The MSCI Emerging Asia ETF is designed to track the equity market performance of emerging countries in Asia . The MSCI Emerging Asia ETF is not a registered Foreign Portfolio Investor (“FPI”) with the Securities and Exchange Investment Board of India (“SEBI”) and is investing in the SENSEX India ETF to gain exposure to the Indian market segment of the MSCI EM Asia Index . There is no additional management fee charged on MSCI Emerging Asia ETF’s holding of SENSEX India ETF, as detailed in note 7(a) .
iSharesCSI300A-ShareIndexETF*(*ThisisasyntheticETF)(“CSI300A-ShareETF”)The objective of the CSI 300 A-Share ETF is to provide investment results that, before fees and expenses, closely correspond to the performance of the CSI 300 Index . The CSI 300 Index is a diversified index consisting of 300 constituent stocks traded on the Shanghai and Shenzhen stock exchanges . The CSI 300 A-Share ETF does not hold A-Shares directly but rather gain access to the CSI 300 Index through investing in a combination of the iShares CSI Sector Index Funds^ and CAAPs or solely in CAAPs . A CAAP represents only an obligation of each CAAP Issuer to provide the economic performance equivalent to holding the underlying A-Shares . There is no additional management fee charged on the CSI 300 A-Share ETF’s holding in the CSI Sector Index Funds, as detailed in note 7(a) . As at 31st December 2015 and 2014, the CSI 300 A-Share ETF solely invested in CAAPs .
As at 31st December 2015, there were fourteen (2014: thirteen) participating dealers and three (2014: three) CAAP Issuers for the CSI 300 A-Share ETF . A list of the CAAP Issuers as at 31st December 2015 and 2014 is set out in note 11(b) .
^ Referred to individually or collectively as the “CSI Sector Index Funds” .
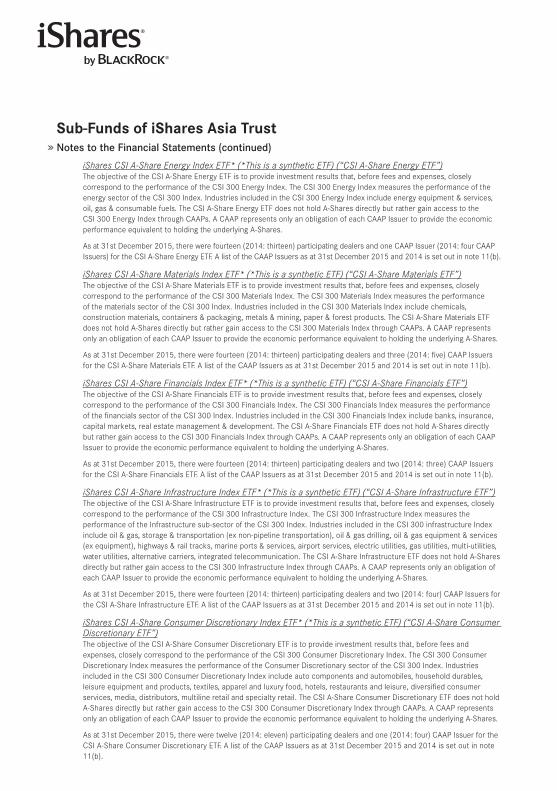
Sub-funds of iShares Asia TrustNotes to the Financial Statements (continued)
iSharesCSIA-ShareEnergyIndexETF*(*ThisisasyntheticETF)(“CSIA-ShareEnergyETF”)The objective of the CSI A-Share Energy ETF is to provide investment results that, before fees and expenses, closely correspond to the performance of the CSI 300 Energy Index . The CSI 300 Energy Index measures the performance of the energy sector of the CSI 300 Index . Industries included in the CSI 300 Energy Index include energy equipment & services, oil, gas & consumable fuels . The CSI A-Share Energy ETF does not hold A-Shares directly but rather gain access to the CSI 300 Energy Index through CAAPs . A CAAP represents only an obligation of each CAAP Issuer to provide the economic performance equivalent to holding the underlying A-Shares .
As at 31st December 2015, there were fourteen (2014: thirteen) participating dealers and one CAAP Issuer (2014: four CAAP Issuers) for the CSI A-Share Energy ETF . A list of the CAAP Issuers as at 31st December 2015 and 2014 is set out in note 11(b) .
iSharesCSIA-ShareMaterialsIndexETF*(*ThisisasyntheticETF)(“CSIA-ShareMaterialsETF”)The objective of the CSI A-Share Materials ETF is to provide investment results that, before fees and expenses, closely correspond to the performance of the CSI 300 Materials Index . The CSI 300 Materials Index measures the performance of the materials sector of the CSI 300 Index . Industries included in the CSI 300 Materials Index include chemicals, construction materials, containers & packaging, metals & mining, paper & forest products . The CSI A-Share Materials ETF does not hold A-Shares directly but rather gain access to the CSI 300 Materials Index through CAAPs . A CAAP represents only an obligation of each CAAP Issuer to provide the economic performance equivalent to holding the underlying A-Shares .
As at 31st December 2015, there were fourteen (2014: thirteen) participating dealers and three (2014: five) CAAP Issuers for the CSI A-Share Materials ETF . A list of the CAAP Issuers as at 31st December 2015 and 2014 is set out in note 11(b) .
iSharesCSIA-ShareFinancialsIndexETF*(*ThisisasyntheticETF)(“CSIA-ShareFinancialsETF”)The objective of the CSI A-Share Financials ETF is to provide investment results that, before fees and expenses, closely correspond to the performance of the CSI 300 Financials Index . The CSI 300 Financials Index measures the performance of the financials sector of the CSI 300 Index . Industries included in the CSI 300 Financials Index include banks, insurance, capital markets, real estate management & development . The CSI A-Share Financials ETF does not hold A-Shares directly but rather gain access to the CSI 300 Financials Index through CAAPs . A CAAP represents only an obligation of each CAAP Issuer to provide the economic performance equivalent to holding the underlying A-Shares .
As at 31st December 2015, there were fourteen (2014: thirteen) participating dealers and two (2014: three) CAAP Issuers for the CSI A-Share Financials ETF . A list of the CAAP Issuers as at 31st December 2015 and 2014 is set out in note 11(b) .
iSharesCSIA-ShareInfrastructureIndexETF*(*ThisisasyntheticETF)(“CSIA-ShareInfrastructureETF”)The objective of the CSI A-Share Infrastructure ETF is to provide investment results that, before fees and expenses, closely correspond to the performance of the CSI 300 Infrastructure Index . The CSI 300 Infrastructure Index measures the performance of the Infrastructure sub-sector of the CSI 300 Index . Industries included in the CSI 300 infrastructure Index include oil & gas, storage & transportation (ex non-pipeline transportation), oil & gas drilling, oil & gas equipment & services (ex equipment), highways & rail tracks, marine ports & services, airport services, electric utilities, gas utilities, multi-utilities, water utilities, alternative carriers, integrated telecommunication . The CSI A-Share Infrastructure ETF does not hold A-Shares directly but rather gain access to the CSI 300 Infrastructure Index through CAAPs . A CAAP represents only an obligation of each CAAP Issuer to provide the economic performance equivalent to holding the underlying A-Shares .
As at 31st December 2015, there were fourteen (2014: thirteen) participating dealers and two (2014: four) CAAP Issuers for the CSI A-Share Infrastructure ETF . A list of the CAAP Issuers as at 31st December 2015 and 2014 is set out in note 11(b) .
iSharesCSIA-ShareConsumerDiscretionaryIndexETF*(*ThisisasyntheticETF)(“CSIA-ShareConsumerDiscretionaryETF”)The objective of the CSI A-Share Consumer Discretionary ETF is to provide investment results that, before fees and expenses, closely correspond to the performance of the CSI 300 Consumer Discretionary Index . The CSI 300 Consumer Discretionary Index measures the performance of the Consumer Discretionary sector of the CSI 300 Index . Industries included in the CSI 300 Consumer Discretionary Index include auto components and automobiles, household durables, leisure equipment and products, textiles, apparel and luxury food, hotels, restaurants and leisure, diversified consumer services, media, distributors, multiline retail and specialty retail . The CSI A-Share Consumer Discretionary ETF does not hold A-Shares directly but rather gain access to the CSI 300 Consumer Discretionary Index through CAAPs . A CAAP represents only an obligation of each CAAP Issuer to provide the economic performance equivalent to holding the underlying A-Shares .
As at 31st December 2015, there were twelve (2014: eleven) participating dealers and one (2014: four) CAAP Issuer for the CSI A-Share Consumer Discretionary ETF . A list of the CAAP Issuers as at 31st December 2015 and 2014 is set out in note 11(b) .
73
Sub-funds of iShares Asia TrustNotes to the Financial Statements (continued)
iSharesCSIA-ShareConsumerStaplesIndexETF*(*ThisisasyntheticETF)(“CSIA-ShareConsumerStaplesETF”)The objective of the CSI A-Share Consumer Staples ETF is to provide investment results that, before fees and expenses, closely correspond to the performance of the CSI 300 Consumer Staples Index . The CSI 300 Consumer Staples Index measures the performance of the Consumer Staples sector of the CSI 300 Index . Industries included in the CSI 300 Consumer Staples Index include food and staples retailing, beverages, food products, household products and personal products . The CSI A-Share Consumer Staples ETF does not hold A-Shares directly but rather gain access to the CSI 300 Consumer Staples Index through CAAPs . A CAAP represents only an obligation of each CAAP Issuer to provide the economic performance equivalent to holding the underlying A-Shares .
As at 31st December 2015, there were twelve (2014: eleven) participating dealers and two (2014: four) CAAP Issuers for the CSI A-Share Consumer Staples ETF . A list of the CAAP Issuers as at 31st December 2015 and 2014 is set out in note 11(b) .
iSharesRMBBondIndexETF(“RMBBondIndexETF”)The objective of the RMB Bond Index ETF is to provide investment results that, before fees and expenses, closely correspond to the performance of the Citi RMB Bond Capped Index . The Citi RMB Bond Capped Index is a total return index and provides exposure to RMB-denominated bonds issued and settled outside the PRC . It includes fixed-rate securities issued by governments, government sponsored agencies, supranationals, and corporations that are issued or distributed outside the PRC with a minimum maturity date of one year and a minimum size outstanding of RMB1 billion .
2 SUMMARY OF SIGNIFICANT ACCOUNTING POLICIES
The principal accounting policies applied in the preparation of these financial statements are set out below . These policies have been consistently applied to all the periods presented, unless otherwise stated .
(a) Basis of preparation
The financial statements of the Sub-Funds have been prepared in accordance with International Financial Reporting Standards (“IFRS”) . The financial statements have been prepared under the historical cost convention, as modified by the revaluation of financial assets and liabilities (including derivative financial instruments) at fair value through profit or loss .
The preparation of financial statements in conformity with IFRS requires the use of certain critical accounting estimates . It also requires the Manager and the Trustee (the “Management”) to exercise their judgment in the process of applying the Sub-Funds’ accounting policies . The areas involving a higher degree of judgment or complexity, or areas where assumptions and estimates are significant to the financial statements are disclosed in note 3 .
The SENSEX India ETF meets the definition of an investment entity as defined by IFRS 10 and is required to account for the investment in its subsidiary, the Mauritius Subsidiary, at fair value through profit or loss .
The financial statements of the SENSEX India ETF are the only financial statements presented by the SENSEX India ETF .
Standardsandamendmentstoexistingstandardseffective1stJanuary2015
There are no standards, interpretations or amendments to existing standards that are effective for the first time for the financial year beginning 1st January 2015 that would be expected to have a material impact on the Sub-Funds .
Sub-funds of iShares Asia TrustNotes to the Financial Statements (continued)
Newstandards,amendmentsandinterpretationsissuedbutnoteffectiveforthefinancialyearbeginning1stJanuary2015andnotearlyadopted
IFRS 9, “Financial instruments”, addresses the classification, measurement and recognition of financial assets and financial liabilities . The complete version of IFRS 9 was issued in July 2014 . It replaces the guidance in IAS 39 that relates to the classification and measurement of financial instruments . IFRS 9 retains but simplifies the mixed measurement model and establishes three primary measurement categories for financial assets: amortised cost, fair value through other comprehensive income and fair value through profit or loss . The basis of classification depends on the entity’s business model and the contractual cash flow characteristics of the financial asset . Investments in equity instruments are required to be measured at fair value through profit or loss with the irrevocable option at inception to present changes in fair value in other comprehensive income not recycling . There is now a new expected credit losses model that replaces the incurred loss impairment model used in IAS 39 . For financial liabilities there were no changes to classification and measurement except for the recognition of changes in own credit risk in other comprehensive income, for liabilities designated at fair value through profit or loss . IFRS 9 relaxes the requirements for hedge effectiveness by replacing the bright line hedge effectiveness tests . It requires an economic relationship between the hedged item and hedging instrument and for the “hedged ratio” to be the same as the one management actually use for risk management purposes . Contemporaneous documentation is still required but is different to that currently prepared under IAS 39 . The standard is effective for accounting periods beginning on or after 1st January 2018 . The standard is not expected to have any significant impact on the Sub-Funds’ financial position or performance .
There are no other standards, interpretations or amendments to existing standards that are not yet effective that would be expected to have a significant impact on the Sub-Funds .
(b) investment entity
The SENSEX India ETF has multiple unrelated investors and indirectly holds multiple investments through the Mauritius Subsidiary . Ownership interests in the SENSEX India ETF are in the form of redeemable units which are classified as equity in accordance with IAS 32 and which are exposed to variable returns from changes in the fair value of the SENSEX India ETF’s net assets . The SENSEX India ETF has been deemed to meet the definition of an investment entity per IFRS 10 as the following conditions exist:
(i) The SENSEX India ETF has obtained funds for the purpose of providing investors with investment management services .
(ii) The SENSEX India ETF’s business purpose, which was communicated directly to investors, is investing solely for returns from capital appreciation and investment income, through the Mauritius Subsidiary . The Mauritius Subsidiary is set up to hold Indian securities and IAPs on behalf of the SENSEX India ETF .
(iii) The performance of investments made through the Mauritius Subsidiary is measured and evaluated on a fair value basis .
Although the SENSEX India ETF does not meet all of the typical characteristics of an investment entity (namely, the SENSEX India ETF does not have multiple investments), Management believe it is nevertheless an investment entity because it was formed in conjunction with the Mauritius Subsidiary and effects multiple investments through the Mauritius Subsidiary .
As such, consolidated financial statements have not been prepared by the SENSEX India ETF . In these non-consolidated financial statements, the SENSEX India ETF’s investment in its subsidiary is accounted for at fair value through profit or loss .
(c) Subsidiary
The Subsidiary is a private company with limited liability by shares incorporated in Mauritius . The Subsidiary is a wholly owned subsidiary of SENSEX India ETF . SENSEX India ETF and its Subsidiary operate as an integrated structure whereby SENSEX India ETF invests solely into the Subsidiary by subscribing all of the Subsidiary’s participating shares . The Subsidiary allows redemption of these participating shares on a daily basis .
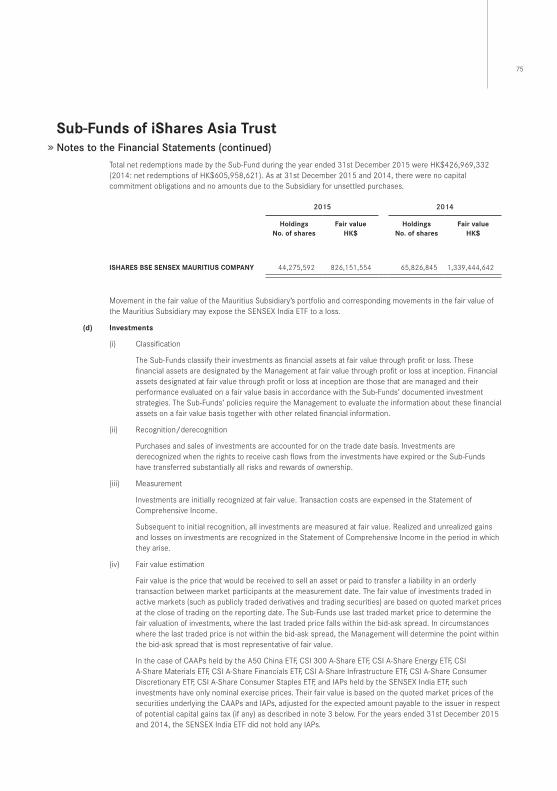
75
Sub-funds of iShares Asia TrustNotes to the Financial Statements (continued)
Total net redemptions made by the Sub-Fund during the year ended 31st December 2015 were HK$426,969,332 (2014: net redemptions of HK$605,958,621) . As at 31st December 2015 and 2014, there were no capital commitment obligations and no amounts due to the Subsidiary for unsettled purchases .
2015 2014
holdingsno. of shares
fair valuehK$
holdingsno. of shares
fair valuehK$
iShAReS BSe SenSeX MAURiTiUS CoMpAnY 44,275,592 826,151,554 65,826,845 1,339,444,642
Movement in the fair value of the Mauritius Subsidiary’s portfolio and corresponding movements in the fair value of the Mauritius Subsidiary may expose the SENSEX India ETF to a loss .
(d) investments
(i) Classification
The Sub-Funds classify their investments as financial assets at fair value through profit or loss . These financial assets are designated by the Management at fair value through profit or loss at inception . Financial assets designated at fair value through profit or loss at inception are those that are managed and their performance evaluated on a fair value basis in accordance with the Sub-Funds’ documented investment strategies . The Sub-Funds’ policies require the Management to evaluate the information about these financial assets on a fair value basis together with other related financial information .
(ii) Recognition/derecognition
Purchases and sales of investments are accounted for on the trade date basis . Investments are derecognized when the rights to receive cash flows from the investments have expired or the Sub-Funds have transferred substantially all risks and rewards of ownership .
(iii) Measurement
Investments are initially recognized at fair value . Transaction costs are expensed in the Statement of Comprehensive Income .
Subsequent to initial recognition, all investments are measured at fair value . Realized and unrealized gains and losses on investments are recognized in the Statement of Comprehensive Income in the period in which they arise .
(iv) Fair value estimation
Fair value is the price that would be received to sell an asset or paid to transfer a liability in an orderly transaction between market participants at the measurement date . The fair value of investments traded in active markets (such as publicly traded derivatives and trading securities) are based on quoted market prices at the close of trading on the reporting date . The Sub-Funds use last traded market price to determine the fair valuation of investments, where the last traded price falls within the bid-ask spread . In circumstances where the last traded price is not within the bid-ask spread, the Management will determine the point within the bid-ask spread that is most representative of fair value .
In the case of CAAPs held by the A50 China ETF, CSI 300 A-Share ETF, CSI A-Share Energy ETF, CSI A-Share Materials ETF, CSI A-Share Financials ETF, CSI A-Share Infrastructure ETF, CSI A-Share Consumer Discretionary ETF, CSI A-Share Consumer Staples ETF, and IAPs held by the SENSEX India ETF, such investments have only nominal exercise prices . Their fair value is based on the quoted market prices of the securities underlying the CAAPs and IAPs, adjusted for the expected amount payable to the issuer in respect of potential capital gains tax (if any) as described in note 3 below . For the years ended 31st December 2015 and 2014, the SENSEX India ETF did not hold any IAPs .
Sub-funds of iShares Asia TrustNotes to the Financial Statements (continued)
Investments that are not listed on an exchange or are thinly traded are valued by using quotes from brokers or based on Manager’s judgements and estimates . Debt securities are fair valued based on quoted market prices inclusive of accrued interests .
The SENSEX India ETF’s investment in the Mauritius Subsidiary and the underlying investments held by the Mauritius Subsidiary have been designated at fair value through profit or loss at inception as they are managed as portfolio and their performance evaluated on a fair value basis in accordance with the SENSEX India ETF’s offering document .
The Mauritius Subsidiary is fair valued based on its latest net asset value as reported by its administrator .
(v) Transfers between levels of the fair value hierarchy
Transfers between levels of the fair value hierarchy have occurred at the date of the event or change in circumstances that caused the transfer .
(e) offsetting financial instruments
Financial assets and liabilities are offset and the net amount reported in the Statement of Financial Position where the Sub-Funds currently have a legally enforceable right to set-off the recognized amounts and there is an intention to settle on a net basis or realize the asset and settle the liability simultaneously . The legally enforceable right must not be contingent on future events and must be enforceable in the normal course of business and in the event of default, insolvency or bankruptcy of the Sub-Funds or the counterparty .
(f) Amounts due from/to brokers
Amounts due from and to brokers represent receivables for securities sold, and payables for securities purchased, that have been contracted for but not yet settled or delivered by the end of the reporting period .
These amounts are recognized initially at fair value and subsequently measured at amortized cost using the effective interest method, less provision for impairment for amounts due from brokers . A provision for impairment of amounts due from brokers is established when there is objective evidence that the Sub-Funds will not be able to collect all amounts due from the relevant broker . Significant financial difficulties of the broker, probability that the broker will enter bankruptcy or financial reorganization, and default or delinquency in payments are considered indicators that the amounts due from brokers are impaired . The amount of the provision is the difference between the asset’s carrying amount and the present value of estimated future cash flows, discounted at the original effective interest rate . The amount of the provision is recognized in the Statement of Comprehensive Income . Amounts due from brokers in the Statement of Financial Position are stated net of such provisions .
(g) dividend income and bank interest income
Dividend income is recorded on an ex-dividend basis . Dividend income on equity securities and CAAPs where no ex-dividend date is quoted is accounted for when the Sub-Funds’ right to receive payment is established .
Interest income from bank balances is recognized in the Statement of Comprehensive Income on a time proportionate basis using the effective interest method .
(h) distributions to Unitholders
Distributions to Unitholders are recognized in the Statement of Changes in Net Assets Attributable to Unitholders when they are approved by the Manager .
(i) expenses
Expenses are accounted for on an accrual basis .
(j) Cash and cash equivalents
Cash and cash equivalents includes cash on hand, demand deposits and other short-term highly liquid investments with original maturities of three months or less and bank overdrafts . Bank overdrafts are shown as current liabilities on the Statement of Financial Position .
77
Sub-funds of iShares Asia TrustNotes to the Financial Statements (continued)
(k) Translation of foreign currencies
Functional and presentation currency
MSCI China ETF, A50 China ETF, SENSEX India ETF, MSCI AC Asia ex Japan ETF (formerly known as MSCI Asia APEX 50 ETF), MSCI Emerging Asia ETF, CSI 300 A-Share ETF, CSI A-Share Energy ETF, CSI A-Share Materials ETF, CSI A-Share Financials ETF, CSI A-Share Infrastructure ETF, CSI A-Share Consumer Discretionary ETF and CSI A-Share Consumer Staples ETF
Items included in the financial statements are measured using the currency of the primary economic environment in which the Sub-Funds operate (the “functional currency”) . The performance of the Sub-Funds are measured and reported to the unitholders in Hong Kong dollars . The Management considers the Hong Kong dollar as the currency that most faithfully represents the economic effects of the underlying transactions, events and conditions . The financial statements are presented in Hong Kong dollar, which is each Sub-Fund’s functional and presentation currency .
RMB Bond Index ETF
Items included in the financial statements are measured using the currency of the primary economic environment in which the Sub-Fund operates (the “functional currency”) . The performance of the Sub-Fund is measured and reported to the unitholders in Renminbi . The Management considers the Renminbi as the currency that most faithfully represents the economic effects of the underlying transactions, events and conditions . The financial statements are presented in Renminbi, which is the Sub-Fund’s functional and presentation currency .
Transactions and balances
Foreign currency transactions are translated into the functional currency using the exchange rates prevailing at the dates of the transactions . Foreign currency assets and liabilities are translated into the functional currency using the exchange rate prevailing at the period end date . Foreign exchange gains and losses arising from translation are included in the Statement of Comprehensive Income .
Foreign exchange gains and losses relating to cash and cash equivalents are presented in the Statement of Comprehensive Income within “Net foreign currency gain/(loss)” . Foreign exchange gains and losses relating to financial assets and liabilities carried at fair value through profit or loss are presented in the Statement of Comprehensive Income within “Net gain/(loss) on financial assets at fair value through profit or loss” .
(l) Redeemable units
The Sub-Funds issue redeemable units, which are redeemable at the holder’s option, are the most subordinated units in issue and are therefore classified as equity .
(m) Taxation
WithholdingtaxThe Sub-Funds currently incur withholding tax imposed by certain countries on investment income . Such income is recorded gross of withholding tax in the Statement of Comprehensive Income . Withholding tax is included as taxation in the Statement of Comprehensive Income .
CapitalgainstaxThe tax expense for capital gains tax for the period comprises current and deferred taxes . Tax is recognized in the Statement of Comprehensive Income, except to the extent that it relates to items recognized in other comprehensive income or directly in equity . In this case the tax is also recognized in other comprehensive income or directly in equity, respectively .
The current tax charge is calculated on the basis of the tax laws enacted or substantively enacted by the end of the reporting period in the countries where the Sub-Funds operate and generate taxable income . Management periodically evaluates positions taken with respect to situations in which applicable tax regulation is subject to interpretation or judgment . It establishes provisions where appropriate on the basis of amounts expected to be paid to the tax authorities .
Deferred tax is recognized, using the liability method, on temporary differences arising between the tax bases of assets and liabilities and their carrying amounts in the financial statements . Deferred tax is determined using tax rates (and laws) that have been enacted or substantively enacted by the end of reporting period and are expected to apply when the related deferred tax asset is realized or the deferred tax liability is settled .
Sub-funds of iShares Asia TrustNotes to the Financial Statements (continued)
Deferred tax assets are recognized only to the extent that it is probable that future taxable profit will be available against which the temporary differences can be utilized .
Deferred tax assets and liabilities are offset when there is a legally enforceable right to offset current tax assets against current tax liabilities and when the deferred tax assets and liabilities relate to income taxes levied by the same tax authority on either the taxable entity or different taxable entities where there is an intention to settle the balances on a net basis .
(n) Securities lending
CAAPs on loan are included in the investment portfolio of the A50 China ETF, CSI 300 A-Share ETF, CSI A-Share Energy ETF, CSI A-Share Materials ETF, CSI A-Share Financials ETF, CSI A-Share Infrastructure ETF, CSI A-Share Consumer Discretionary ETF and CSI A-Share Consumer Staples ETF as these Sub-Funds are entitled to the dividend income from the CAAPs on loan and retain substantially all the risks and rewards . Relevant securities lending expenses paid by these Sub-Funds are accounted for in the Statement of Comprehensive Income .
Collateral received for the purpose of securities on loan generally consists of share, fixed income or cash collateral . Share and fixed income collateral received is treated as an off-balance sheet transaction and is therefore not included in the Statement of Financial Position because the A50 China ETF, CSI 300 A-Share ETF, CSI A-Share Energy ETF, CSI A-Share Materials ETF, CSI A-Share Financials ETF, CSI A-Share Infrastructure ETF, CSI A-Share Consumer Discretionary ETF and CSI A-Share Consumer Staples ETF are not entitled to the dividend and interest income from the share and fixed income collateral and do not retain substantially all the risks and rewards . Dividends and interest received from the share and fixed income collateral are paid to the counterparty that provides the collateral to these Sub-Funds . Cash collateral received (if any) is treated as an on-balance sheet transaction with a corresponding liability shown separately . Income from the cash collateral is recognized as income in the Statement of Comprehensive Income .
Dividend income from the CAAPs on loan is recognized as income by the A50 China ETF, CSI 300 A-Share ETF, CSI A-Share Energy ETF, CSI A-Share Materials ETF, CSI A-Share Financials ETF, CSI A-Share Infrastructure ETF, CSI A-Share Consumer Discretionary ETF and CSI A-Share Consumer Staples ETF in the Statement of Comprehensive Income .
3 CRITICAL ACCOUNTING ESTIMATES AND JUDGMENTSThe preparation of financial statements in conformity with IFRS requires Management to make estimates and assumptions that affect the amounts reported in the financial statements and accompanying notes . Actual results could differ from those estimates .
Management makes estimates and assumptions concerning the future . The resulting accounting estimates will, by definition, seldom equal the related actual results . The estimates and assumptions that have a significant risk of causing a material adjustment to the carrying amounts of assets and liabilities within the next financial period are outlined below .
(a) FunctionalCurrencyMSCIChinaETF,A50ChinaETF,SENSEXIndiaETF,MSCIACAsiaexJapanETF(formerlyknownasMSCIAsiaAPEX50ETF),MSCIEmergingAsiaETF,CSI300A-ShareETF,CSIA-ShareEnergyETF,CSIA-ShareMaterialsETF,CSIA-ShareFinancialsETF,CSIA-ShareInfrastructureETF,CSIA-ShareConsumerDiscretionaryETFandCSIA-ShareConsumerStaplesETFManagement considers the Hong Kong dollar to be the currency that most faithfully represents the economic effect of the underlying transactions, events and conditions . The Hong Kong dollar is the currency in which the Sub-Funds measure their performance and report their results, as well as the currency in which the Sub-Funds determine the net asset value per unit at the time of issue or redemption . This determination also considers that the Sub-Funds are all listed on SEHK and their units are quoted in Hong Kong dollars .
RMBBondIndexETFManagement considers the Renminbi (“RMB”) to be the currency that most faithfully represents the economic effect of the underlying transactions, events and conditions . The RMB is the currency in which the Sub-Fund measures its performance and reports its results, as well as the currency in which the Sub-Fund determines the net asset value per unit at the time of issue or redemption . This determination also considers that the Sub-Fund is listed on SEHK with its units quoted in RMB .

79
Sub-funds of iShares Asia TrustNotes to the Financial Statements (continued)
(b) FairvalueofsecuritiesnotquotedinanactivemarketThe fair value of such securities not quoted in an active market may be determined by the Management using reputable pricing sources (such as pricing agencies) . Broker quotes as obtained from the pricing sources may be indicative and not executable or binding . The Management would exercise judgment and estimates on the quantity and quality of pricing sources used . Where no market data is available, the Management may value positions using their own models, which are usually based on valuation methods and techniques generally recognized as standard within the industry . The inputs into these models are primarily earning multiples and discounted cash flows . The models used to determine fair values are validated and periodically reviewed by experienced personnel at the Manager .
Models use observable data, to the extent practicable . However, areas such as credit risk (both own and counterparty), volatilities and correlations require Management to make estimates . Changes in assumptions about these factors could affect the reported fair value of financial instruments .
The determination of what constitutes “observable” requires significant judgment by the Management . The Management considers observable data to be market data that is readily available, regularly distributed or updated, reliable and verifiable, not proprietary, and provided by independent sources that are actively involved in the relevant market .
(c) TaxationIn preparing these financial statements, Management has made certain assumptions and used various estimates concerning the tax exposure which is dependent on what might happen in the future . The resulting accounting estimates may not equal the related actual results .
MSCIChinaETF,MSCIACAsiaexJapanETF(formerlyknownasMSCIAsiaAPEX50ETF)andMSCIEmergingAsiaETFThe Sub-Funds invest in Chinese securities (H-shares, Red Chips and P Chips) listed on the SEHK and B-shares of Chinese securities listed on the Shanghai Stock Exchange and the Shenzhen Stock Exchange . Under the PRC Corporate Income Tax Law, the Sub-Funds may be liable to pay PRC tax on the capital gains realized from the trading of these securities . However, no provision was made for taxation from such gains in the financial statements as the Manager believes that the Sub-Funds can sustain a position for not filing a tax return based on the existing tax regulations and that the enforcement of such PRC tax on capital gains is not probable .
A50ChinaETFTheA50ChinaETFinvestsdirectlyinA-SharesofChinasecurities. Under the PRC Corporate Income Tax Law, the A50 China ETF may be liable to pay PRC tax on the capital gains realized from the trading of these securities at 10% via the Manager’s Qualified Foreign Institutional Investor (“QFII”) and Renminbi Qualified Foreign Institutional Investor (“RQFII”) license quotas, provided that the A50 China ETF does not have a PRC tax establishment nor its central management and control in the PRC .
On 14th November 2014, via the release of Circular 79 by the Ministry of Finance (“MOF”) in the PRC, the China Securities Regulatory Commission (“CSRC”), and the State Administration of Taxation (“SAT”) acting with State Council’s approval, a temporary exemption was provided to QFIIs/RQFIIs from tax on capital gains derived from the trading of A-Shares on or after 17th November 2014 . However, Circular 79 did also state that any gains realized prior to 17th November 2014 would be subject to tax in accordance with law .
Pursuant to Circular 79, the Manager realigned the provisioning policy of the A50 China ETF in respect of its direct A-Shares investments . As such, the A50 China ETF currently no longer provisions for unrealized capital gains, or for capital gains realized on or after 17th November 2014 . With respect to the A50 China ETF’s direct investments in A-Shares via its QFII and RQFII quotas, the A50 China ETF filed for relief under the respective Double Tax Agreement (“DTA”) with the PRC tax authorities and was subsequently approved . As such, a positive yet immaterial adjustment was made to the NAV of the A50 China ETF on 29th October 2015 to reflect the true-up between tax settlement and provision .
(d) ValuationofCAAPsA50ChinaETF,CSI300A-ShareETF,CSIA-ShareEnergyETF,CSIA-ShareMaterialsETF,CSIA-ShareFinancialsETF,CSIA-ShareInfrastructureETF,CSIA-ShareConsumerDiscretionaryETFandCSIA-ShareConsumerStaplesETFThe A50 China ETF, CSI 300 A-Share ETF, CSI A-Share Energy ETF, CSI A-Share Materials ETF, CSI A-Share Financials ETF, CSI A-Share Infrastructure ETF, CSI A-Share Consumer Discretionary ETF and CSI A-Share Consumer Staples ETF gain some, or all, of their exposure to the relevant indices through CAAPs, being derivative instruments linked to A-Shares, issued by one or more QFIIs or their affiliates (together, “CAAP Issuers”) .
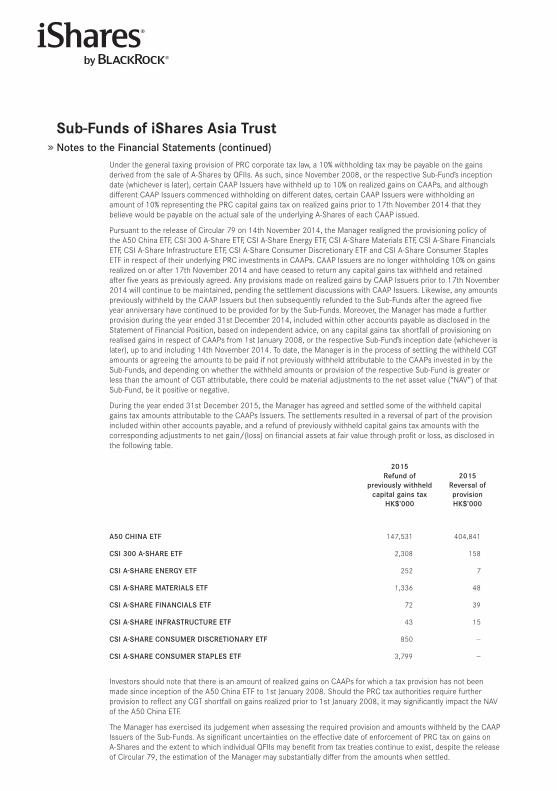
Sub-funds of iShares Asia TrustNotes to the Financial Statements (continued)
Under the general taxing provision of PRC corporate tax law, a 10% withholding tax may be payable on the gains derived from the sale of A-Shares by QFIIs . As such, since November 2008, or the respective Sub-Fund’s inception date (whichever is later), certain CAAP Issuers have withheld up to 10% on realized gains on CAAPs, and although different CAAP Issuers commenced withholding on different dates, certain CAAP Issuers were withholding an amount of 10% representing the PRC capital gains tax on realized gains prior to 17th November 2014 that they believe would be payable on the actual sale of the underlying A-Shares of each CAAP issued .
Pursuant to the release of Circular 79 on 14th November 2014, the Manager realigned the provisioning policy of the A50 China ETF, CSI 300 A-Share ETF, CSI A-Share Energy ETF, CSI A-Share Materials ETF, CSI A-Share Financials ETF, CSI A-Share Infrastructure ETF, CSI A-Share Consumer Discretionary ETF and CSI A-Share Consumer Staples ETF in respect of their underlying PRC investments in CAAPs . CAAP Issuers are no longer withholding 10% on gains realized on or after 17th November 2014 and have ceased to return any capital gains tax withheld and retained after five years as previously agreed . Any provisions made on realized gains by CAAP Issuers prior to 17th November 2014 will continue to be maintained, pending the settlement discussions with CAAP Issuers . Likewise, any amounts previously withheld by the CAAP Issuers but then subsequently refunded to the Sub-Funds after the agreed five year anniversary have continued to be provided for by the Sub-Funds . Moreover, the Manager has made a further provision during the year ended 31st December 2014, included within other accounts payable as disclosed in the Statement of Financial Position, based on independent advice, on any capital gains tax shortfall of provisioning on realised gains in respect of CAAPs from 1st January 2008, or the respective Sub-Fund’s inception date (whichever is later), up to and including 14th November 2014 . To date, the Manager is in the process of settling the withheld CGT amounts or agreeing the amounts to be paid if not previously withheld attributable to the CAAPs invested in by the Sub-Funds, and depending on whether the withheld amounts or provision of the respective Sub-Fund is greater or less than the amount of CGT attributable, there could be material adjustments to the net asset value (“NAV”) of that Sub-Fund, be it positive or negative .
During the year ended 31st December 2015, the Manager has agreed and settled some of the withheld capital gains tax amounts attributable to the CAAPs Issuers . The settlements resulted in a reversal of part of the provision included within other accounts payable, and a refund of previously withheld capital gains tax amounts with the corresponding adjustments to net gain/(loss) on financial assets at fair value through profit or loss, as disclosed in the following table .
2015Refund of
previously withheld capital gains tax
HK$’000
2015 Reversal of provisionHK$’000
A50 CHINA ETF 147,531 404,841
CSI 300 A-SHARE ETF 2,308 158
CSI A-SHARE ENERgy ETF 252 7
CSI A-SHARE MATERIAlS ETF 1,336 48
CSI A-SHARE FINANCIAlS ETF 72 39
CSI A-SHARE INFRASTRUCTURE ETF 43 15
CSI A-SHARE CoNSUMER DISCRETIoNARy ETF 850 —
CSI A-SHARE CoNSUMER STAPlES ETF 3,799 —
Investors should note that there is an amount of realized gains on CAAPs for which a tax provision has not been made since inception of the A50 China ETF to 1st January 2008 . Should the PRC tax authorities require further provision to reflect any CGT shortfall on gains realized prior to 1st January 2008, it may significantly impact the NAV of the A50 China ETF .
The Manager has exercised its judgement when assessing the required provision and amounts withheld by the CAAP Issuers of the Sub-Funds . As significant uncertainties on the effective date of enforcement of PRC tax on gains on A-Shares and the extent to which individual QFIIs may benefit from tax treaties continue to exist, despite the release of Circular 79, the estimation of the Manager may substantially differ from the amounts when settled .
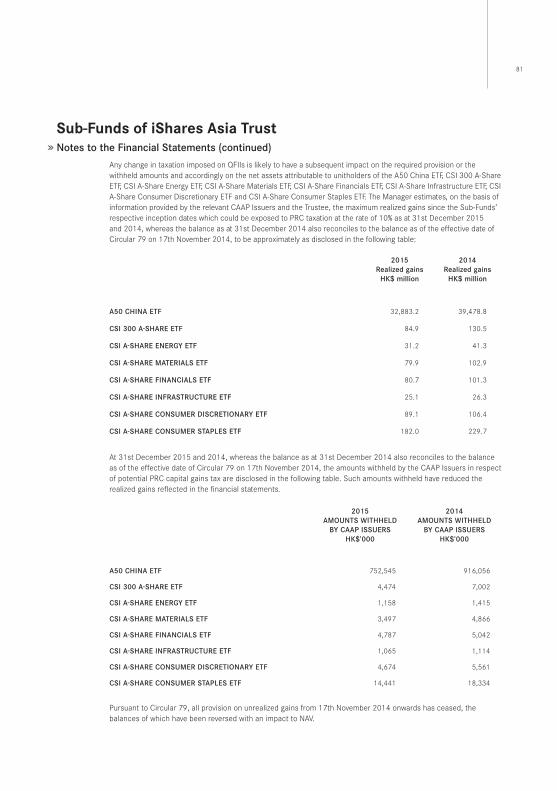
81
Sub-funds of iShares Asia TrustNotes to the Financial Statements (continued)
Any change in taxation imposed on QFIIs is likely to have a subsequent impact on the required provision or the withheld amounts and accordingly on the net assets attributable to unitholders of the A50 China ETF, CSI 300 A-Share ETF, CSI A-Share Energy ETF, CSI A-Share Materials ETF, CSI A-Share Financials ETF, CSI A-Share Infrastructure ETF, CSI A-Share Consumer Discretionary ETF and CSI A-Share Consumer Staples ETF . The Manager estimates, on the basis of information provided by the relevant CAAP Issuers and the Trustee, the maximum realized gains since the Sub-Funds’ respective inception dates which could be exposed to PRC taxation at the rate of 10% as at 31st December 2015 and 2014, whereas the balance as at 31st December 2014 also reconciles to the balance as of the effective date of Circular 79 on 17th November 2014, to be approximately as disclosed in the following table:
2015Realized gains
HK$ million
2014Realized gains
HK$ million
A50 CHINA ETF 32,883 .2 39,478 .8
CSI 300 A-SHARE ETF 84 .9 130 .5
CSI A-SHARE ENERgy ETF 31 .2 41 .3
CSI A-SHARE MATERIAlS ETF 79 .9 102 .9
CSI A-SHARE FINANCIAlS ETF 80 .7 101 .3
CSI A-SHARE INFRASTRUCTURE ETF 25 .1 26 .3
CSI A-SHARE CoNSUMER DISCRETIoNARy ETF 89 .1 106 .4
CSI A-SHARE CoNSUMER STAPlES ETF 182 .0 229 .7
At 31st December 2015 and 2014, whereas the balance as at 31st December 2014 also reconciles to the balance as of the effective date of Circular 79 on 17th November 2014, the amounts withheld by the CAAP Issuers in respect of potential PRC capital gains tax are disclosed in the following table . Such amounts withheld have reduced the realized gains reflected in the financial statements .
2015AMoUNTS wITHHElD
By CAAP ISSUERSHK$’000
2014AMoUNTS wITHHElD
By CAAP ISSUERSHK$’000
A50 CHINA ETF 752,545 916,056
CSI 300 A-SHARE ETF 4,474 7,002
CSI A-SHARE ENERgy ETF 1,158 1,415
CSI A-SHARE MATERIAlS ETF 3,497 4,866
CSI A-SHARE FINANCIAlS ETF 4,787 5,042
CSI A-SHARE INFRASTRUCTURE ETF 1,065 1,114
CSI A-SHARE CoNSUMER DISCRETIoNARy ETF 4,674 5,561
CSI A-SHARE CoNSUMER STAPlES ETF 14,441 18,334
Pursuant to Circular 79, all provision on unrealized gains from 17th November 2014 onwards has ceased, the balances of which have been reversed with an impact to NAV .
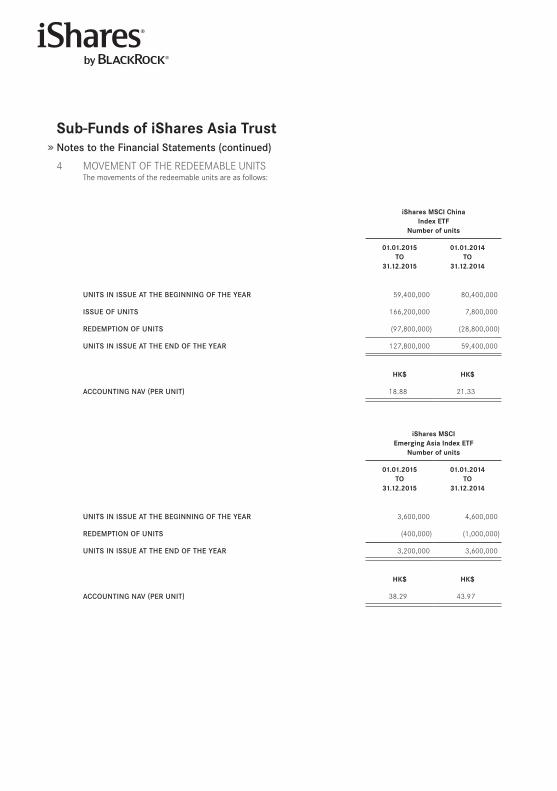
Sub-funds of iShares Asia TrustNotes to the Financial Statements (continued)
4 MOVEMENT OF THE REDEEMABLE UNITSThe movements of the redeemable units are as follows:
iShares MSCi Chinaindex eTf
number of units
iShares fTSeA50 China index eTf*
(*This is a synthetic eTf)number of units
iShares S&pBSe SenSeX
india index eTfnumber of units
iShares MSCiAC Asia ex Japan index eTf
(formerly known as iShares MSCiAsia ApeX 50 index eTf)
number of units
01.01.2015To
31.12.2015
01.01.2014To
31.12.2014
01.01.2015To
31.12.2015
01.01.2014To
31.12.2014
01.01.2015To
31.12.2015
01.01.2014To
31.12.2014
01.01.2015To
31.12.2015
01.01.2014To
31.12.2014
UNITS IN ISSUE AT THE BEgINNINg oF THE yEAR 59,400,000 80,400,000 6,326,000,000 5,894,000,000 68,600,000 100,400,000 2,400,000 2,400,000
ISSUE oF UNITS 166,200,000 7,800,000 920,000,000 2,648,000,000 2,400,000 – 1,600,000 –
REDEMPTIoN oF UNITS (97,800,000) (28,800,000) (3,736,000,000) (2,216,000,000) (24,400,000) (31,800,000) (1,600,000) –
UNITS IN ISSUE AT THE END oF THE yEAR 127,800,000 59,400,000 3,510,000,000 6,326,000,000 46,600,000 68,600,000 2,400,000 2,400,000
hK$ hK$ hK$ hK$ hK$ hK$ hK$ hK$
ACCoUNTINg NAV (PER UNIT) 18 .88 21 .33 12 .24 14 .00 17 .77 19 .54 38 .32 42 .54
iShares MSCiemerging Asia index eTf
number of units
iShares CSi 300 A-Shareindex eTf*
(*This is a synthetic eTf)number of units
iShares CSi A-Shareenergy index eTf*
(*This is a synthetic eTf)number of units
iShares CSi A-ShareMaterials index eTf*
(*This is a synthetic eTf)number of units
01.01.2015To
31.12.2015
01.01.2014To
31.12.2014
01.01.2015To
31.12.2015
01.01.2014To
31.12.2014
01.01.2015To
31.12.2015
01.01.2014To
31.12.2014
01.01.2015To
31.12.2015
01.01.2014To
31.12.2014
UNITS IN ISSUE AT THE BEgINNINg oF THE yEAR 3,600,000 4,600,000 13,000,000 25,000,000 5,500,000 9,000,000 7,500,000 10,000,000
REDEMPTIoN oF UNITS (400,000) (1,000,000) (3,000,000) (12,000,000) (3,000,000) (3,500,000) (6,500,000) (2,500,000)
UNITS IN ISSUE AT THE END oF THE yEAR 3,200,000 3,600,000 10,000,000 13,000,000 2,500,000 5,500,000 1,000,000 7,500,000
hK$ hK$ hK$ hK$ hK$ hK$ hK$ hK$
ACCoUNTINg NAV (PER UNIT) 38 .29 43 .97 29 .25 29 .59 5 .89 7 .80 10 .13 9 .82
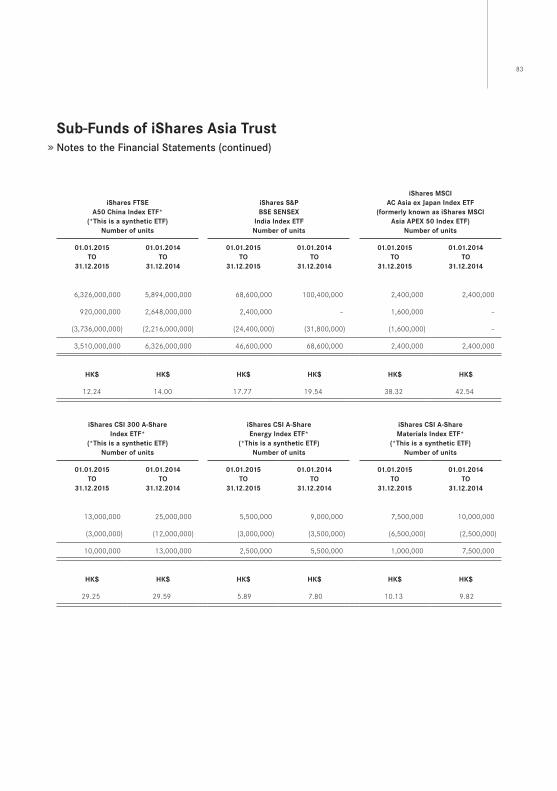
83
Sub-funds of iShares Asia TrustNotes to the Financial Statements (continued)
4 MOVEMENT OF THE REDEEMABLE UNITSThe movements of the redeemable units are as follows:
iShares MSCi Chinaindex eTf
number of units
iShares fTSeA50 China index eTf*
(*This is a synthetic eTf)number of units
iShares S&pBSe SenSeX
india index eTfnumber of units
iShares MSCiAC Asia ex Japan index eTf
(formerly known as iShares MSCiAsia ApeX 50 index eTf)
number of units
01.01.2015To
31.12.2015
01.01.2014To
31.12.2014
01.01.2015To
31.12.2015
01.01.2014To
31.12.2014
01.01.2015To
31.12.2015
01.01.2014To
31.12.2014
01.01.2015To
31.12.2015
01.01.2014To
31.12.2014
UNITS IN ISSUE AT THE BEgINNINg oF THE yEAR 59,400,000 80,400,000 6,326,000,000 5,894,000,000 68,600,000 100,400,000 2,400,000 2,400,000
ISSUE oF UNITS 166,200,000 7,800,000 920,000,000 2,648,000,000 2,400,000 – 1,600,000 –
REDEMPTIoN oF UNITS (97,800,000) (28,800,000) (3,736,000,000) (2,216,000,000) (24,400,000) (31,800,000) (1,600,000) –
UNITS IN ISSUE AT THE END oF THE yEAR 127,800,000 59,400,000 3,510,000,000 6,326,000,000 46,600,000 68,600,000 2,400,000 2,400,000
hK$ hK$ hK$ hK$ hK$ hK$ hK$ hK$
ACCoUNTINg NAV (PER UNIT) 18 .88 21 .33 12 .24 14 .00 17 .77 19 .54 38 .32 42 .54
iShares MSCiemerging Asia index eTf
number of units
iShares CSi 300 A-Shareindex eTf*
(*This is a synthetic eTf)number of units
iShares CSi A-Shareenergy index eTf*
(*This is a synthetic eTf)number of units
iShares CSi A-ShareMaterials index eTf*
(*This is a synthetic eTf)number of units
01.01.2015To
31.12.2015
01.01.2014To
31.12.2014
01.01.2015To
31.12.2015
01.01.2014To
31.12.2014
01.01.2015To
31.12.2015
01.01.2014To
31.12.2014
01.01.2015To
31.12.2015
01.01.2014To
31.12.2014
UNITS IN ISSUE AT THE BEgINNINg oF THE yEAR 3,600,000 4,600,000 13,000,000 25,000,000 5,500,000 9,000,000 7,500,000 10,000,000
REDEMPTIoN oF UNITS (400,000) (1,000,000) (3,000,000) (12,000,000) (3,000,000) (3,500,000) (6,500,000) (2,500,000)
UNITS IN ISSUE AT THE END oF THE yEAR 3,200,000 3,600,000 10,000,000 13,000,000 2,500,000 5,500,000 1,000,000 7,500,000
hK$ hK$ hK$ hK$ hK$ hK$ hK$ hK$
ACCoUNTINg NAV (PER UNIT) 38 .29 43 .97 29 .25 29 .59 5 .89 7 .80 10 .13 9 .82
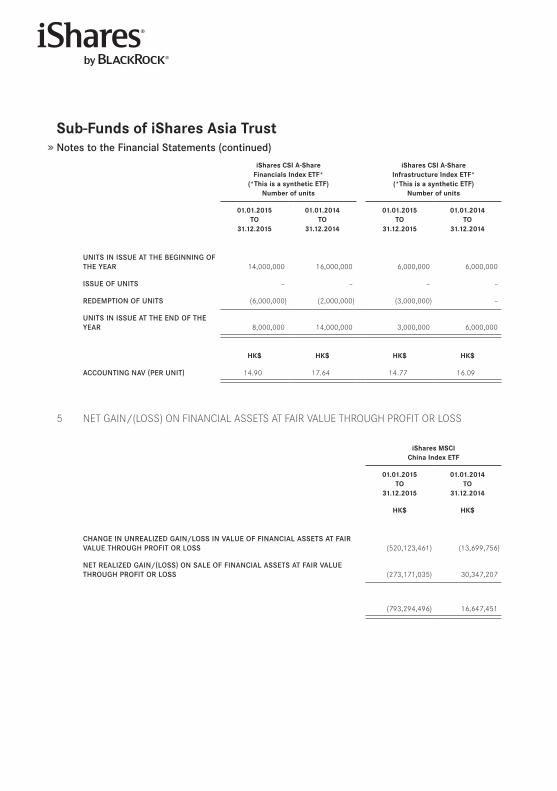
Sub-funds of iShares Asia TrustNotes to the Financial Statements (continued)
iShares CSi A-Sharefinancials index eTf*
(*This is a synthetic eTf)number of units
iShares CSi A-Shareinfrastructure index eTf*(*This is a synthetic eTf)
number of units
iShares CSi A-ShareConsumer discretionary index eTf*
(*This is a synthetic eTf)number of units
iShares CSi A-ShareConsumer Staples index eTf*
(*This is a synthetic eTf)number of units
iShares RMBBond index eTfnumber of units
01.01.2015To
31.12.2015
01.01.2014To
31.12.2014
01.01.2015To
31.12.2015
01.01.2014To
31.12.2014
01.01.2015To
31.12.2015
01.01.2014To
31.12.2014
01.01.2015To
31.12.2015
01.01.2014To
31.12.2014
01.01.2015To
31.12.2015
01.01.2014To
31.12.2014
UNITS IN ISSUE AT THE BEgINNINg oF THE yEAR 14,000,000 16,000,000 6,000,000 6,000,000 5,000,000 8,500,000 4,000,000 4,000,000 3,285,318 3,479,300
ISSUE oF UNITS – – – – – – – – 200,000 1,240,000
REDEMPTIoN oF UNITS (6,000,000) (2,000,000) (3,000,000) – (3,500,000) (3,500,000) (1,750,000) – (851,700) (1,433,982)
UNITS IN ISSUE AT THE END oF THE yEAR 8,000,000 14,000,000 3,000,000 6,000,000 1,500,000 5,000,000 2,250,000 4,000,000 2,633,618 3,285,318
hK$ hK$ hK$ hK$ hK$ hK$ hK$ hK$ RMB RMB
ACCoUNTINg NAV (PER UNIT) 14 .90 17 .64 14 .77 16 .09 23 .67 19 .87 21 .80 17 .89 34 .01 34 .48
5 NET GAIN/(LOSS) ON FINANCIAL ASSETS AT FAIR VALUE THROUGH PROFIT OR LOSS
iShares MSCiChina index eTf
iShares fTSeA50 China index eTf*
(*This is a synthetic eTf)iShares S&p BSe
SenSeX india index eTf
iShares MSCiAC Asia ex Japan index eTf
(formerly known as iShares MSCiAsia ApeX 50 index eTf)
01.01.2015To
31.12.2015
01.01.2014To
31.12.2014
01.01.2015To
31.12.2015
01.01.2014To
31.12.2014
01.01.2015To
31.12.2015
01.01.2014To
31.12.2014
01.01.2015To
31.12.2015
01.01.2014To
31.12.2014
hK$ hK$ hK$ hK$ hK$ hK$ hK$ hK$
CHANgE IN UNREAlIzED gAIN/loSS IN VAlUE oF FINANCIAl ASSETS AT FAIR VAlUE THRoUgH PRoFIT oR loSS (520,123,461) (13,699,756) (25,470,301,652) 34,947,291,611 (206,148,855) 269,831,071 (39,231,402) 461,215
NET REAlIzED gAIN/(loSS) oN SAlE oF FINANCIAl ASSETS AT FAIR VAlUE THRoUgH PRoFIT oR loSS (273,171,035) 30,347,207 24,658,115,395 1,908,026,111 114,582,202 146,600,316 24,888,603 1,225,527
(793,294,496) 16,647,451 (812,186,257) 36,855,317,722 (91,566,653) 416,431,387 (14,342,799) 1,686,742
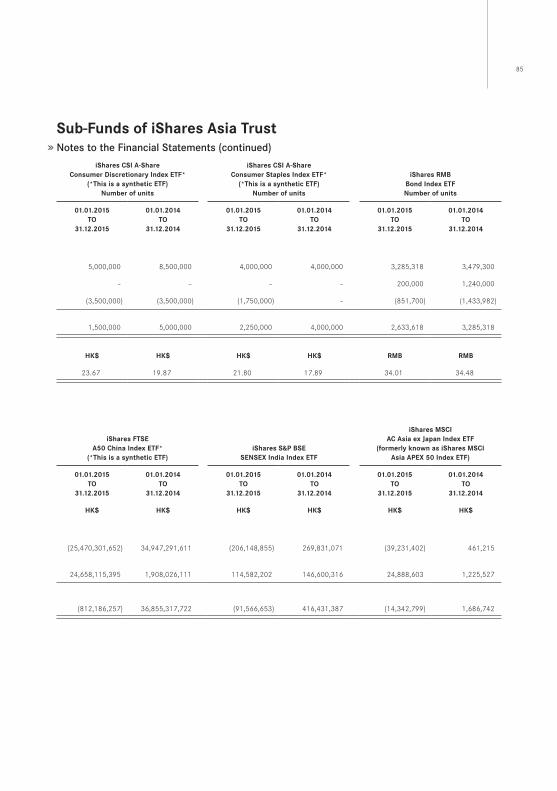
85
Sub-funds of iShares Asia TrustNotes to the Financial Statements (continued)
iShares CSi A-Sharefinancials index eTf*
(*This is a synthetic eTf)number of units
iShares CSi A-Shareinfrastructure index eTf*(*This is a synthetic eTf)
number of units
iShares CSi A-ShareConsumer discretionary index eTf*
(*This is a synthetic eTf)number of units
iShares CSi A-ShareConsumer Staples index eTf*
(*This is a synthetic eTf)number of units
iShares RMBBond index eTfnumber of units
01.01.2015To
31.12.2015
01.01.2014To
31.12.2014
01.01.2015To
31.12.2015
01.01.2014To
31.12.2014
01.01.2015To
31.12.2015
01.01.2014To
31.12.2014
01.01.2015To
31.12.2015
01.01.2014To
31.12.2014
01.01.2015To
31.12.2015
01.01.2014To
31.12.2014
UNITS IN ISSUE AT THE BEgINNINg oF THE yEAR 14,000,000 16,000,000 6,000,000 6,000,000 5,000,000 8,500,000 4,000,000 4,000,000 3,285,318 3,479,300
ISSUE oF UNITS – – – – – – – – 200,000 1,240,000
REDEMPTIoN oF UNITS (6,000,000) (2,000,000) (3,000,000) – (3,500,000) (3,500,000) (1,750,000) – (851,700) (1,433,982)
UNITS IN ISSUE AT THE END oF THE yEAR 8,000,000 14,000,000 3,000,000 6,000,000 1,500,000 5,000,000 2,250,000 4,000,000 2,633,618 3,285,318
hK$ hK$ hK$ hK$ hK$ hK$ hK$ hK$ RMB RMB
ACCoUNTINg NAV (PER UNIT) 14 .90 17 .64 14 .77 16 .09 23 .67 19 .87 21 .80 17 .89 34 .01 34 .48
5 NET GAIN/(LOSS) ON FINANCIAL ASSETS AT FAIR VALUE THROUGH PROFIT OR LOSS
iShares MSCiChina index eTf
iShares fTSeA50 China index eTf*
(*This is a synthetic eTf)iShares S&p BSe
SenSeX india index eTf
iShares MSCiAC Asia ex Japan index eTf
(formerly known as iShares MSCiAsia ApeX 50 index eTf)
01.01.2015To
31.12.2015
01.01.2014To
31.12.2014
01.01.2015To
31.12.2015
01.01.2014To
31.12.2014
01.01.2015To
31.12.2015
01.01.2014To
31.12.2014
01.01.2015To
31.12.2015
01.01.2014To
31.12.2014
hK$ hK$ hK$ hK$ hK$ hK$ hK$ hK$
CHANgE IN UNREAlIzED gAIN/loSS IN VAlUE oF FINANCIAl ASSETS AT FAIR VAlUE THRoUgH PRoFIT oR loSS (520,123,461) (13,699,756) (25,470,301,652) 34,947,291,611 (206,148,855) 269,831,071 (39,231,402) 461,215
NET REAlIzED gAIN/(loSS) oN SAlE oF FINANCIAl ASSETS AT FAIR VAlUE THRoUgH PRoFIT oR loSS (273,171,035) 30,347,207 24,658,115,395 1,908,026,111 114,582,202 146,600,316 24,888,603 1,225,527
(793,294,496) 16,647,451 (812,186,257) 36,855,317,722 (91,566,653) 416,431,387 (14,342,799) 1,686,742
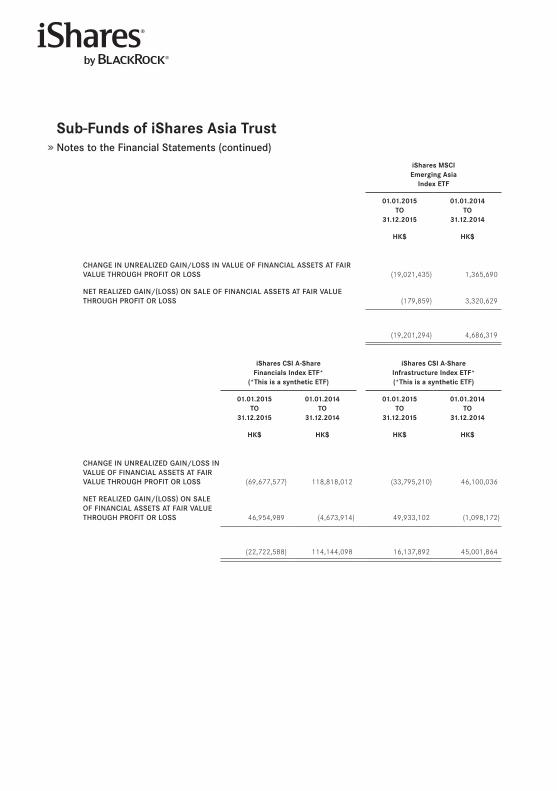
Sub-funds of iShares Asia TrustNotes to the Financial Statements (continued)
iShares MSCiemerging Asia
index eTf
iShares CSi 300 A-Shareindex eTf*
(*This is a synthetic eTf)
iShares CSiA-Share energy index eTf*(*This is a synthetic eTf)
iShares CSiA-Share Materials index eTf*
(*This is a synthetic eTf)
01.01.2015To
31.12.2015
01.01.2014To
31.12.2014
01.01.2015To
31.12.2015
01.01.2014To
31.12.2014
01.01.2015To
31.12.2015
01.01.2014To
31.12.2014
01.01.2015To
31.12.2015
01.01.2014To
31.12.2014
hK$ hK$ hK$ hK$ hK$ hK$ hK$ hK$
CHANgE IN UNREAlIzED gAIN/loSS IN VAlUE oF FINANCIAl ASSETS AT FAIR VAlUE THRoUgH PRoFIT oR loSS (19,021,435) 1,365,690 (87,836,864) 162,634,740 (386,248) 31,053,221 760,367 34,981,292
NET REAlIzED gAIN/(loSS) oN SAlE oF FINANCIAl ASSETS AT FAIR VAlUE THRoUgH PRoFIT oR loSS (179,859) 3,320,629 118,552,030 (20,563,681) 3,272,122 (25,704,516) 29,367,464 (15,524,074)
(19,201,294) 4,686,319 30,715,166 142,071,059 2,885,874 5,348,705 30,127,831 19,457,218
iShares CSi A-Sharefinancials index eTf*
(*This is a synthetic eTf)
iShares CSi A-Shareinfrastructure index eTf*(*This is a synthetic eTf)
iShares CSi A-ShareConsumer discretionary index eTf*
(*This is a synthetic eTf)
iShares CSi A-ShareConsumer Staples index eTf*
(*This is a synthetic eTf)iShares RMB
Bond index eTf
01.01.2015To
31.12.2015
01.01.2014To
31.12.2014
01.01.2015To
31.12.2015
01.01.2014To
31.12.2014
01.01.2015To
31.12.2015
01.01.2014To
31.12.2014
01.01.2015To
31.12.2015
01.01.2014To
31.12.2014
01.01.2015To
31.12.2015
01.01.2014To
31.12.2014
hK$ hK$ hK$ hK$ hK$ hK$ hK$ hK$ RMB RMB
CHANgE IN UNREAlIzED gAIN/loSS IN VAlUE oF FINANCIAl ASSETS AT FAIR VAlUE THRoUgH PRoFIT oR loSS (69,677,577) 118,818,012 (33,795,210) 46,100,036 (15,585,277) 6,050,426 (1,588,115) 11,042,613 (79,805) (360,657)
NET REAlIzED gAIN/(loSS) oN SAlE oF FINANCIAl ASSETS AT FAIR VAlUE THRoUgH PRoFIT oR loSS 46,954,989 (4,673,914) 49,933,102 (1,098,172) 66,542,978 11,840,999 21,988,172 (1,146,325) 2,906,549 4,122,306
(22,722,588) 114,144,098 16,137,892 45,001,864 50,957,701 17,891,425 20,400,057 9,896,288 2,826,744 3,761,649
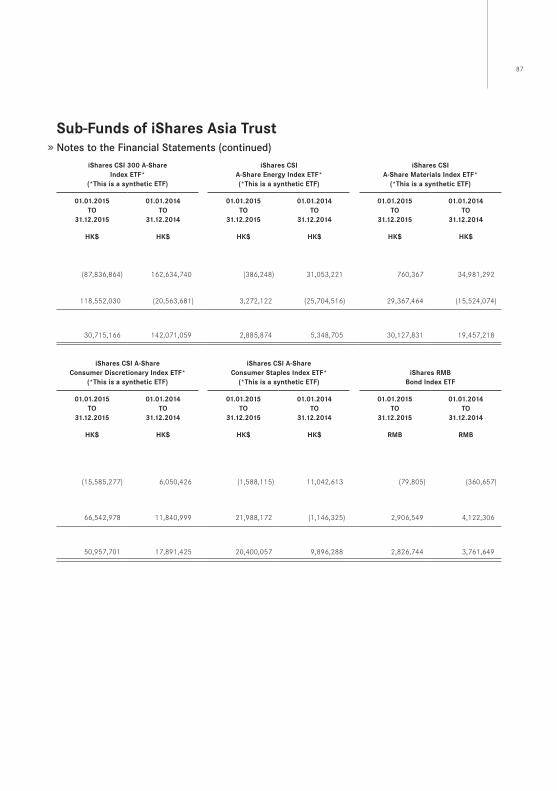
87
Sub-funds of iShares Asia TrustNotes to the Financial Statements (continued)
iShares MSCiemerging Asia
index eTf
iShares CSi 300 A-Shareindex eTf*
(*This is a synthetic eTf)
iShares CSiA-Share energy index eTf*(*This is a synthetic eTf)
iShares CSiA-Share Materials index eTf*
(*This is a synthetic eTf)
01.01.2015To
31.12.2015
01.01.2014To
31.12.2014
01.01.2015To
31.12.2015
01.01.2014To
31.12.2014
01.01.2015To
31.12.2015
01.01.2014To
31.12.2014
01.01.2015To
31.12.2015
01.01.2014To
31.12.2014
hK$ hK$ hK$ hK$ hK$ hK$ hK$ hK$
CHANgE IN UNREAlIzED gAIN/loSS IN VAlUE oF FINANCIAl ASSETS AT FAIR VAlUE THRoUgH PRoFIT oR loSS (19,021,435) 1,365,690 (87,836,864) 162,634,740 (386,248) 31,053,221 760,367 34,981,292
NET REAlIzED gAIN/(loSS) oN SAlE oF FINANCIAl ASSETS AT FAIR VAlUE THRoUgH PRoFIT oR loSS (179,859) 3,320,629 118,552,030 (20,563,681) 3,272,122 (25,704,516) 29,367,464 (15,524,074)
(19,201,294) 4,686,319 30,715,166 142,071,059 2,885,874 5,348,705 30,127,831 19,457,218
iShares CSi A-Sharefinancials index eTf*
(*This is a synthetic eTf)
iShares CSi A-Shareinfrastructure index eTf*(*This is a synthetic eTf)
iShares CSi A-ShareConsumer discretionary index eTf*
(*This is a synthetic eTf)
iShares CSi A-ShareConsumer Staples index eTf*
(*This is a synthetic eTf)iShares RMB
Bond index eTf
01.01.2015To
31.12.2015
01.01.2014To
31.12.2014
01.01.2015To
31.12.2015
01.01.2014To
31.12.2014
01.01.2015To
31.12.2015
01.01.2014To
31.12.2014
01.01.2015To
31.12.2015
01.01.2014To
31.12.2014
01.01.2015To
31.12.2015
01.01.2014To
31.12.2014
hK$ hK$ hK$ hK$ hK$ hK$ hK$ hK$ RMB RMB
CHANgE IN UNREAlIzED gAIN/loSS IN VAlUE oF FINANCIAl ASSETS AT FAIR VAlUE THRoUgH PRoFIT oR loSS (69,677,577) 118,818,012 (33,795,210) 46,100,036 (15,585,277) 6,050,426 (1,588,115) 11,042,613 (79,805) (360,657)
NET REAlIzED gAIN/(loSS) oN SAlE oF FINANCIAl ASSETS AT FAIR VAlUE THRoUgH PRoFIT oR loSS 46,954,989 (4,673,914) 49,933,102 (1,098,172) 66,542,978 11,840,999 21,988,172 (1,146,325) 2,906,549 4,122,306
(22,722,588) 114,144,098 16,137,892 45,001,864 50,957,701 17,891,425 20,400,057 9,896,288 2,826,744 3,761,649
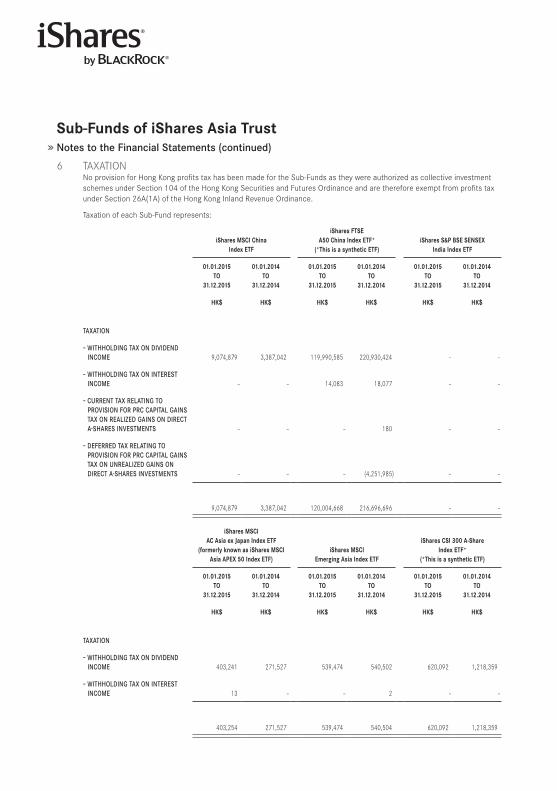
Sub-funds of iShares Asia TrustNotes to the Financial Statements (continued)
6 TAXATIONNo provision for Hong Kong profits tax has been made for the Sub-Funds as they were authorized as collective investment schemes under Section 104 of the Hong Kong Securities and Futures Ordinance and are therefore exempt from profits tax under Section 26A(1A) of the Hong Kong Inland Revenue Ordinance .
Taxation of each Sub-Fund represents:
iShares MSCi Chinaindex eTf
iShares fTSeA50 China index eTf*
(*This is a synthetic eTf)iShares S&p BSe SenSeX
india index eTf
01.01.2015To
31.12.2015
01.01.2014To
31.12.2014
01.01.2015To
31.12.2015
01.01.2014To
31.12.2014
01.01.2015To
31.12.2015
01.01.2014To
31.12.2014
hK$ hK$ hK$ hK$ hK$ hK$
TAXATIoN
– wITHHolDINg TAX oN DIVIDEND INCoME 9,074,879 3,387,042 119,990,585 220,930,424 – –
– wITHHolDINg TAX oN INTEREST INCoME – – 14,083 18,077 – –
– CURRENT TAX RElATINg To PRoVISIoN FoR PRC CAPITAl gAINS TAX oN REAlIzED gAINS oN DIRECT A-SHARES INVESTMENTS – – – 180 – –
– DEFERRED TAX RElATINg To PRoVISIoN FoR PRC CAPITAl gAINS TAX oN UNREAlIzED gAINS oN DIRECT A-SHARES INVESTMENTS – – – (4,251,985) – –
9,074,879 3,387,042 120,004,668 216,696,696 – –
iShares MSCiAC Asia ex Japan index eTf
(formerly known as iShares MSCiAsia ApeX 50 index eTf)
iShares MSCiemerging Asia index eTf
iShares CSi 300 A-Shareindex eTf*
(*This is a synthetic eTf)
01.01.2015To
31.12.2015
01.01.2014To
31.12.2014
01.01.2015To
31.12.2015
01.01.2014To
31.12.2014
01.01.2015To
31.12.2015
01.01.2014To
31.12.2014
hK$ hK$ hK$ hK$ hK$ hK$
TAXATIoN
– wITHHolDINg TAX oN DIVIDEND INCoME 403,241 271,527 539,474 540,502 620,092 1,218,359
– wITHHolDINg TAX oN INTEREST INCoME 13 – – 2 – –
403,254 271,527 539,474 540,504 620,092 1,218,359
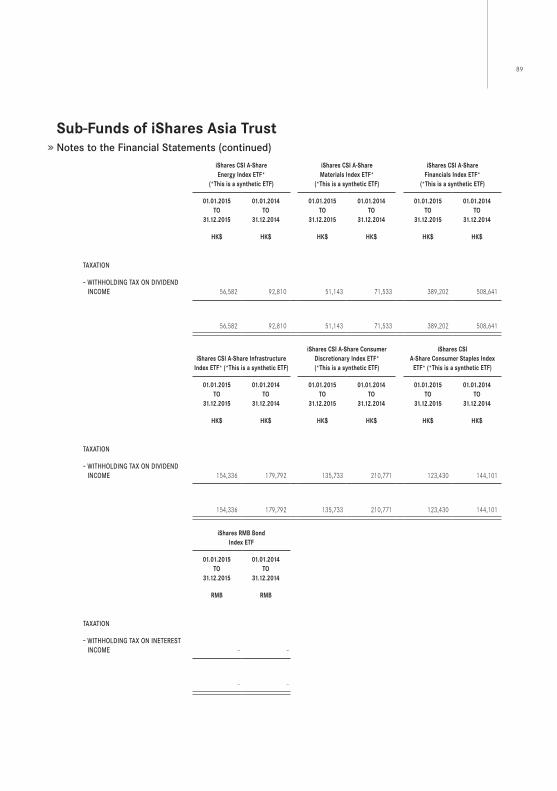
89
Sub-funds of iShares Asia TrustNotes to the Financial Statements (continued)
iShares CSi A-Shareenergy index eTf*
(*This is a synthetic eTf)
iShares CSi A-ShareMaterials index eTf*
(*This is a synthetic eTf)
iShares CSi A-Sharefinancials index eTf*
(*This is a synthetic eTf)
01.01.2015To
31.12.2015
01.01.2014To
31.12.2014
01.01.2015To
31.12.2015
01.01.2014To
31.12.2014
01.01.2015To
31.12.2015
01.01.2014To
31.12.2014
hK$ hK$ hK$ hK$ hK$ hK$
TAXATIoN
– wITHHolDINg TAX oN DIVIDEND INCoME 56,582 92,810 51,143 71,533 389,202 508,641
56,582 92,810 51,143 71,533 389,202 508,641
iShares CSi A-Share infrastructure index eTf* (*This is a synthetic eTf)
iShares CSi A-Share Consumer discretionary index eTf*(*This is a synthetic eTf)
iShares CSiA-Share Consumer Staples index
eTf* (*This is a synthetic eTf)
01.01.2015To
31.12.2015
01.01.2014To
31.12.2014
01.01.2015To
31.12.2015
01.01.2014To
31.12.2014
01.01.2015To
31.12.2015
01.01.2014To
31.12.2014
hK$ hK$ hK$ hK$ hK$ hK$
TAXATIoN
– wITHHolDINg TAX oN DIVIDEND INCoME 154,336 179,792 135,733 210,771 123,430 144,101
154,336 179,792 135,733 210,771 123,430 144,101
iShares RMB Bond index eTf
01.01.2015To
31.12.2015
01.01.2014To
31.12.2014
RMB RMB
TAXATIoN
– wITHHolDINg TAX oN INETEREST INCoME – –
– –
Sub-funds of iShares Asia TrustNotes to the Financial Statements (continued)
MauritiusIncomeTax
IndiaThe SENSEX India ETF invests in India through the Mauritius Subsidiary which is expected to obtain benefits under the double taxation treaty between Mauritius and India . To obtain benefits under the double taxation treaty, the Mauritius Subsidiary must meet certain tests and conditions, including the establishment of Mauritius tax residence and related requirements . The Mauritius Subsidiary has obtained a tax residence certificate (“TRC”) from the Mauritian Revenue Authorities and believes such certification is determinative of its resident status for treaty purposes .
A company which is determined to be a tax resident in Mauritius under the treaty, but has no branch or permanent establishment in India, will not be subject to capital gains tax in India on the sale of securities . India’s 2013 Finance Act articulated that a TRC would be a necessary but not sufficient condition for a company availing itself of treaty benefits . Shortly thereafter on 1st March 2013, India’s Finance Ministry issued a press release to clarify that not only would TRCs be a sufficient determinative of residency status for purposes of treaty relief, but also that Circular 789 in respect of Mauritius residency is valid and continues to be in force . Nonetheless, there can be no future assurances that Circular 789 will continue to be in force and respected and that companies resident in Mauritius will continue to be eligible for the beneficial provisions of the Tax Treaty .
Furthermore, in light of the retrospective nature of Indian tax legislation enacted as part of India’s 2012 Finance Act, there can be no assurance that any future changes to the India-Mauritius treaty or future interpretations or renegotiations thereof will not adversely affect the tax position of the Mauritius Subsidiary’s investments in India . If the treaty is interpreted, amended, terminated, renegotiated, or possibly overridden by the enacted General Anti-Avoidance Rules (“GAAR”) provisions, the details of which are pending further authoritative guidance, in a manner that would adversely affect the tax position in India of the Mauritius Subsidiary, such an interpretation, amendment, or override may cause the Mauritius Subsidiary to incur capital gains tax in India resulting in a reduction in its net asset value .
Although at present, the proposals of the 2012 Finance Bill have been enacted into India Tax Law, there is uncertainty still across the industry as well as in India’s Finance Ministry as to the extent, scope, intent and thus impact to offshore FPIs thereof of these changes in legislation . With the subsequent enactment of the 2015 Finance Act, the legislation has further deferred the effective date of GAAR until 1st April 2017 . More detailed guidelines and clarifications from India’s Finance Ministry are widely expected to be forthcoming on GAAR, particularly given the recent 2016 Finance Bill’s support of this 1st April 2017 effective date . In addition to GAAR, there are number of other tax matters, e .g ., Circular 789 and Mauritius and the indirect tax transfer rules, on which India continues not to provide any clear guidance on whether it intends to not only economically tax an investment once, but multiple times and with retrospective effect . As such, the returns of the Mauritius Subsidiary via its holdings in Indian investments may as a result be adversely impacted should the expected favourable changes not come to fruition and/or there are further unexpected changes in India’s political arena .
MauritiusThere is no capital gains tax in Mauritius on disposal of assets situated in Mauritius . Accordingly, capital gains arising on sale of securities would not be taxable in Mauritius . Further, dividend distributions made by the Mauritius Subsidiary would not be subject to any withholding tax .
Under the current Mauritian tax regime, the Mauritius Subsidiary will be charged income tax at the rate of 15% on dividend income . However, the Mauritius Subsidiary should be entitled to a foreign tax credit equivalent to the higher of the actual foreign tax suffered or a deemed tax credit of 80% of the Mauritian tax on its foreign source income . This would reduce the Mauritius rate of tax effectively to 3% . If the local tax in the foreign country has been charged at a rate greater than 15%, the effective rate of tax may be reduced further in certain circumstances . As per the double taxation treaty entered into between India and Mauritius, the Mauritius Subsidiary would be entitled to claim underlying tax credit in respect of Dividend Distribution Tax (“DDT”) paid by the Indian company if the shareholding exceeds a certain threshold . The DDT paid in India is currently charged at a rate of 20 .358% (2014: 19 .994%) under a gross-up approach and if the Mauritius Subsidiary holds more than a 5% stake in a company, it should not be liable to pay any tax in Mauritius in respect of its dividend income from such company .
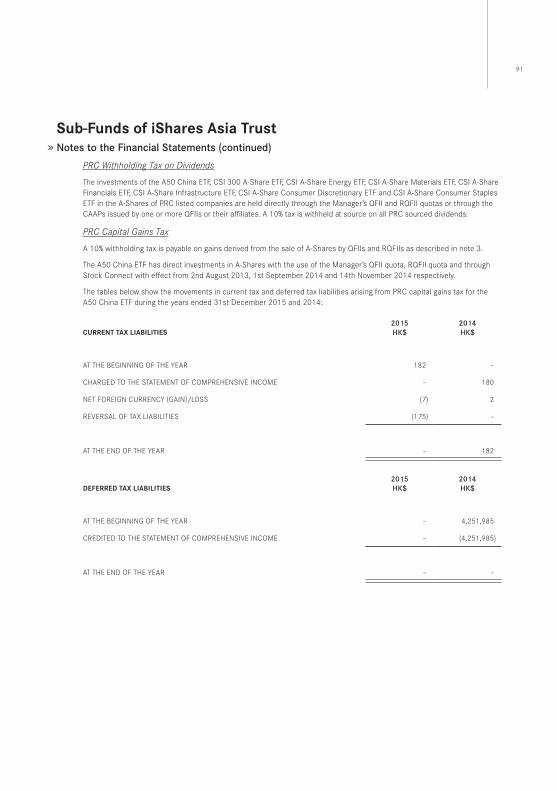
91
Sub-funds of iShares Asia TrustNotes to the Financial Statements (continued)
PRCWithholdingTaxonDividends
The investments of the A50 China ETF, CSI 300 A-Share ETF, CSI A-Share Energy ETF, CSI A-Share Materials ETF, CSI A-Share Financials ETF, CSI A-Share Infrastructure ETF, CSI A-Share Consumer Discretionary ETF and CSI A-Share Consumer Staples ETF in the A-Shares of PRC listed companies are held directly through the Manager’s QFII and RQFII quotas or through the CAAPs issued by one or more QFIIs or their affiliates . A 10% tax is withheld at source on all PRC sourced dividends .
PRCCapitalGainsTax
A 10% withholding tax is payable on gains derived from the sale of A-Shares by QFIIs and RQFIIs as described in note 3 .
The A50 China ETF has direct investments in A-Shares with the use of the Manager’s QFII quota, RQFII quota and through Stock Connect with effect from 2nd August 2013, 1st September 2014 and 14th November 2014 respectively .
The tables below show the movements in current tax and deferred tax liabilities arising from PRC capital gains tax for the A50 China ETF during the years ended 31st December 2015 and 2014:
CURRenT TAX liABiliTieS2015HK$
2014HK$
AT THE BEGINNING OF THE YEAR 182 –
CHARGED TO THE STATEMENT OF COMPREHENSIVE INCOME – 180
NET FOREIGN CURRENCY (GAIN)/LOSS (7) 2
REVERSAL OF TAX LIABILITIES (175) –
AT THE END OF THE YEAR – 182
defeRRed TAX liABiliTieS2015HK$
2014HK$
AT THE BEGINNING OF THE YEAR – 4,251,985
CREDITED TO THE STATEMENT OF COMPREHENSIVE INCOME – (4,251,985)
AT THE END OF THE YEAR – –
Sub-funds of iShares Asia TrustNotes to the Financial Statements (continued)
7 TRANSACTIONS WITH THE TRUSTEE, MANAGER AND CONNECTED PERSONSThe following is a summary of significant related party transactions/transactions entered into during the year between the Sub-Funds and the Trustee, the Manager and their Connected Persons . Connected Persons of the Manager are those as defined in the Code on Unit Trusts and Mutual Funds issued by the Securities and Futures Commission of Hong Kong (the “SFC Code”) . All transactions entered into during the year between the Sub-Funds and the Manager and its Connected Persons were carried out in the normal course of business and on normal commercial terms . To the best of the Manager’s knowledge, the Sub-Funds do not have any other transactions with Connected Persons except for those disclosed below .
(a) Management fee
MSCIChinaETFThe Manager is entitled to receive a management fee, currently at the annual rate of 0 .59% of the net asset value of the Sub-Fund . The fee is accrued daily and calculated as at each dealing day and payable monthly in arrears .
A50ChinaETF,SENSEXIndiaETF,CSI300A-ShareETF,CSIA-ShareEnergyETF,CSIA-ShareMaterialsETF,CSIA-ShareFinancialsETF,CSIA-ShareInfrastructureETF,CSIA-ShareConsumerDiscretionaryETFandCSIA-ShareConsumerStaplesETFThe Manager is entitled to receive a management fee, currently at the annual rate of 0 .99% of the net asset values of the Sub-Funds . The fee is accrued daily and calculated as at each dealing day and payable monthly in arrears .
MSCIACAsiaexJapanETF(formerlyknownasMSCIAsiaAPEX50ETF)andMSCIEmergingAsiaETFThe Manager is entitled to receive a management fee, currently at the annual rate of 0 .59% of the net asset values of the Sub-Funds . The fee is accrued daily and calculated as at each dealing day and payable monthly in arrears .
During the years ended 31st December 2015 and 2014, the Manager has waived the portion of the management fee charged on the SENSEX India ETF, which represented MSCI Emerging Asia ETF’s holding in the SENSEX India ETF .
RMBBondIndexETFThe Manager is entitled to receive a management fee, currently at the annual rate of 0 .39% of the net asset value of the Sub-Fund . The fee is accrued daily and calculated as at each dealing day and payable monthly in arrears .
Apart from the fees and expenses stated in notes 7(b) to (e) below, all other fees and expenses of each Sub-Fund are paid by the Manager .
(b) fees and Charges paid to the Trustee/Custodian and its Connected persons
The following table discloses the transaction handling fees paid by the Sub-Funds for the purchase and sale of investments and handling of CAAP Issuer collateral across different markets:
TRANSACTIoN HANDlINg FEE
MARKeTS
EFFECTIVE FRoM1ST SEPTEMBER
2014US$
PRIoR To1ST SEPTEMBER
2014US$
AUSTRAlIA 10 10
CHINA A-SHARES 22 40
CHINA B-SHARES 45 45
EURoClEAR 10 10
FRANCE 15 15
gERMANy 10 10
HoNg KoNg 10 10
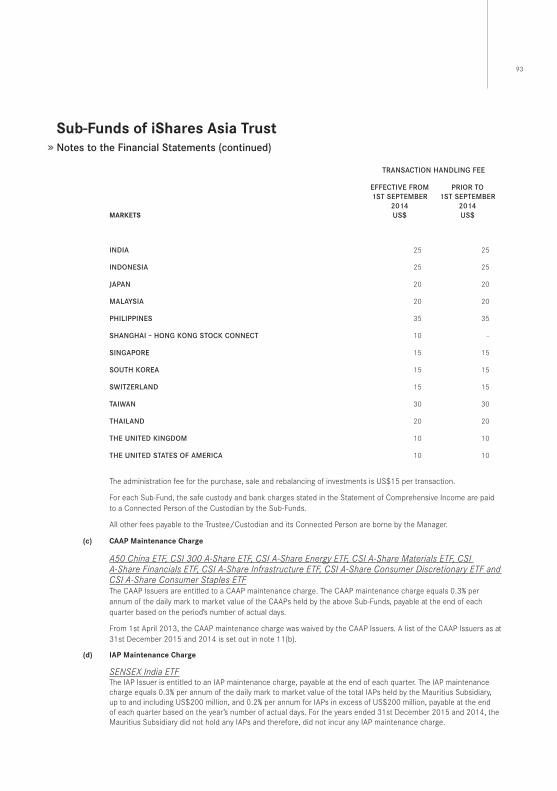
93
Sub-funds of iShares Asia TrustNotes to the Financial Statements (continued)
TRANSACTIoN HANDlINg FEE
MARKeTS
EFFECTIVE FRoM1ST SEPTEMBER
2014US$
PRIoR To1ST SEPTEMBER
2014US$
INDIA 25 25
INDoNESIA 25 25
JAPAN 20 20
MAlAySIA 20 20
PHIlIPPINES 35 35
SHANgHAI – HoNg KoNg SToCK CoNNECT 10 –
SINgAPoRE 15 15
SoUTH KoREA 15 15
SwITzERlAND 15 15
TAIwAN 30 30
THAIlAND 20 20
THE UNITED KINgDoM 10 10
THE UNITED STATES oF AMERICA 10 10
The administration fee for the purchase, sale and rebalancing of investments is US$15 per transaction .
For each Sub-Fund, the safe custody and bank charges stated in the Statement of Comprehensive Income are paid to a Connected Person of the Custodian by the Sub-Funds .
All other fees payable to the Trustee/Custodian and its Connected Person are borne by the Manager .
(c) CAAp Maintenance Charge
A50ChinaETF,CSI300A-ShareETF,CSIA-ShareEnergyETF,CSIA-ShareMaterialsETF,CSIA-ShareFinancialsETF,CSIA-ShareInfrastructureETF,CSIA-ShareConsumerDiscretionaryETFandCSIA-ShareConsumerStaplesETFThe CAAP Issuers are entitled to a CAAP maintenance charge . The CAAP maintenance charge equals 0 .3% per annum of the daily mark to market value of the CAAPs held by the above Sub-Funds, payable at the end of each quarter based on the period’s number of actual days .
From 1st April 2013, the CAAP maintenance charge was waived by the CAAP Issuers . A list of the CAAP Issuers as at 31st December 2015 and 2014 is set out in note 11(b) .
(d) iAp Maintenance Charge
SENSEXIndiaETFThe IAP Issuer is entitled to an IAP maintenance charge, payable at the end of each quarter . The IAP maintenance charge equals 0 .3% per annum of the daily mark to market value of the total IAPs held by the Mauritius Subsidiary, up to and including US$200 million, and 0 .2% per annum for IAPs in excess of US$200 million, payable at the end of each quarter based on the year’s number of actual days . For the years ended 31st December 2015 and 2014, the Mauritius Subsidiary did not hold any IAPs and therefore, did not incur any IAP maintenance charge .
Sub-funds of iShares Asia TrustNotes to the Financial Statements (continued)
(e) Transaction Costs on financial Assets at fair Value through profit or loss
A50ChinaETF,CSI300A-ShareETF,CSIA-ShareEnergyETF,CSIA-ShareMaterialsETF,CSIA-ShareFinancialsETF,CSIA-ShareInfrastructureETF,CSIA-ShareConsumerDiscretionaryETFandCSIA-ShareConsumerStaplesETFThe CAAP Issuers also charge a 0 .3% commission (excluding stamp duty of 0 .1%) on each purchase and sale of each CAAP acquired for the account of the A50 China ETF, CSI 300 A-Share ETF, CSI A-Share Energy ETF, CSI A-Share Materials ETF, CSI A-Share Financials ETF, CSI A-Share Infrastructure ETF, CSI A-Share Consumer Discretionary ETF and CSI A-Share Consumer Staples ETF . 0 .1% stamp duty is payable on the sale of A-Shares and is added to the CAAP commission on sale .
The CAAP commission may be agreed from time to time between the Manager and the CAAP Issuers .
SENSEXIndiaETFThe IAP Issuer also charges a 0 .295% commission (including Indian stamp duty of 0 .1%) on each purchase and sale of each IAP acquired for the account of the Mauritius Subsidiary . For the years and as of 31st December 2015 and 2014, the Mauritius Subsidiary did not hold any IAPs and therefore, did not incur any IAP transaction costs .
(f) Bank Balances
Bank balances are maintained with a group company of the Trustee, i .e . The Hongkong and Shanghai Banking Corporation Limited, which carry interest at normal commercial rates . Bank balances held with the group company of the Trustee as at 31st December 2015 and 2014 were as follows:
SUB-fUndS2015HK$
2014HK$
MSCI CHINA ETF 4,771,207 3,004,391
A50 CHINA ETF 811,998,310 1,417,867,221
SENSEX INDIA ETF 2,529,443 2,990,370
MSCI AC ASIA EX JAPAN ETF (FoRMERly KNowN AS MSCI ASIA APEX 50 ETF)
108,995 407,837
MSCI EMERgINg ASIA ETF 621,631 951,911
CSI 300 A-SHARE ETF 2,565,721 3,040,158
CSI A-SHARE ENERgy ETF 78,324 616,553
CSI A-SHARE MATERIAlS ETF 118,230 1,076,494
CSI A-SHARE FINANCIAlS ETF 1,066,450 1,880,443
CSI A-SHARE INFRASTRUCTURE ETF 239,325 799,620
CSI A-SHARE CoNSUMER DISCRETIoNARy ETF 451,337 1,221,039
CSI A-SHARE CoNSUMER STAPlES ETF 608,943 1,323,052
SUB-fUnd2015RMB
2014RMB
RMB BoND INDEX ETF 434,960 645,142
95
Sub-funds of iShares Asia TrustNotes to the Financial Statements (continued)
(g) Bank overdraft
Bank overdraft held with the group company of the Trustee, i .e . The Hongkong and Shanghai Banking Corporation Limited, as at 31st December 2015 and 2014 was as follows:
SUB-fUnd2015HK$
2014HK$
CSI A-SHARE MATERIAlS ETF 7,901 –
The bank overdraft as at 31st December 2015 was unsecured and repaid on 4th January 2016 .
(h) Bank overdraft facility
The Hongkong and Shanghai Banking Corporation Limited (“HSBC”), which is a fellow subsidiary under the same group of the Trustee, has granted an uncommitted banking overdraft facility lines to the Sub-Funds . The facility limit for each Sub-Fund shall be the lesser of (i) the limit applicable to such Sub-Fund or (ii) an amount which is 10% of the net asset value of such Sub-Fund under the custody of HSBC, the Trustee or any of its affiliates . In addition to the facility limit for each Sub-Fund, the overall limit applicable to all of the facilities shall not exceed US$50,000,000 . The total amount outstanding at any time under all of the facilities shall not exceed the overall limit . As at 31st December 2015 and 2014, the banking overdraft facility lines available to the following Sub-Funds were as follows:
SUB-fUndS2015US$
2014US$
MSCI CHINA ETF 5,000,000 5,000,000
A50 CHINA ETF 50,000,000 50,000,000
SENSEX INDIA ETF 5,000,000 5,000,000
MSCI AC ASIA EX JAPAN ETF (FoRMERly KNowN AS MSCI ASIA APEX 50 ETF)
1,000,000 1,000,000
MSCI EMERgINg ASIA ETF 2,500,000 2,500,000
CSI 300 A-SHARE ETF 5,000,000 5,000,000
CSI A-SHARE ENERgy ETF 500,000 500,000
CSI A-SHARE MATERIAlS ETF 500,000 500,000
CSI A-SHARE FINANCIAlS ETF 1,500,000 1,500,000
CSI A-SHARE INFRASTRUCTURE ETF 1,000,000 1,000,000
CSI A-SHARE CoNSUMER DISCRETIoNARy ETF 1,500,000 1,500,000
CSI A-SHARE CoNSUMER STAPlES ETF 1,000,000 1,000,000
(i) financial Assets at fair Value through profit or loss
MSCIACAsiaexJapanETF(formerlyknownasMSCIAsiaAPEX50ETF)For the Sub-Fund’s investments in the iShares MSCI India Index ETF, an exchange traded fund managed by BlackRock (Singapore) Limited, which is the affiliate of the Manager, please refer to note 11(a)(I)(iv) for details .
MSCIEmergingAsiaETFFor the Sub-Fund’s investments in the SENSEX India ETF, please refer to note 11(a)(I)(v) for details .

Sub-funds of iShares Asia TrustNotes to the Financial Statements (continued)
8 MAJOR NON-CASH TRANSACTIONS(a) Subscriptions
Until 14th November 2008, units could only be subscribed in kind and not for cash . Since 14th November 2008, units can be subscribed either (a) in-kind for an “Application Basket” plus a “Cash Component” (where the “Application Basket” means a portfolio of securities determined by the Manager for the relevant Sub-Fund at the start of business on the relevant dealing day for the purpose of the creation and redemption of units in an Application Unit size, notified on the relevant date by the Manager to Participating Dealers for the relevant Sub-Fund, the “Cash Component” means the difference between the aggregate Net Asset Value of the units comprising an Application Unit and the “Application Basket Value”, and the “Application Basket Value” means the aggregate value of the securities constituting the Application Basket as at the valuation point on the relevant dealing day) or (b) for a cash payment equivalent to the relevant Application Basket Value plus an amount equivalent to any Cash Component, which the Manager shall use to purchase the securities comprised in the Application Basket to replicate the underlying index applicable to that Sub-Fund, provided that the Manager shall be entitled in its discretion to charge (for the account of the relevant Sub-Fund) to the applicant of any units for which cash is paid in lieu of delivering any securities such additional sum as represents the appropriate provision for duties and charges .
MSCIChinaETFDuring the year ended 31st December 2015, the Sub-Fund issued 166,200,000 units (2014: 7,800,000 units) in exchange for Application Baskets consisting of investments valued at a total of HK$3,824,197,272 (2014: HK$159,088,217) plus the relevant cash component included in the Statement of Cash Flows .
A50ChinaETFDuring the year ended 31st December 2015, the Sub-Fund issued 596,000,000 units (2014: 2,028,000,000 units) in exchange for Application Baskets consisting of investments valued at a total of HK$7,514,824,497 (2014: HK$17,227,660,852) plus the relevant cash component included in the Statement of Cash Flows .
SENSEXIndiaETFDuring the year ended 31st December 2015, all units issued were through cash subscriptions . During the year ended 31st December 2014, there was no subscription for the Sub-Fund .
MSCIACAsiaexJapanETF(formerlyknownasMSCIAsiaAPEX50ETF)During the year ended 31st December 2015, the Sub-Fund issued 1,600,000 units in exchange for Application Baskets consisting of investments valued at a total of HK$65,721,077 plus the relevant cash component included in the Statement of Cash Flows . During the year ended 31st December 2014, there was no subscription for the Sub-Fund .
MSCIEmergingAsiaETF,CSI300A-ShareETF,CSIA-ShareEnergyETF,CSIA-ShareMaterialsETF,CSIA-ShareFinancialsETF,CSIA-ShareInfrastructureETF,CSIA-ShareConsumerDiscretionaryETFandCSIA-ShareConsumerStaplesETFDuring the years ended 31st December 2015 and 2014, there were no subscriptions for these Sub-Funds .
RMBBondIndexETFDuring the years ended 31st December 2015 and 2014, all units issued were through cash subscriptions .
(b) Redemptions
Until 14th November 2008, units could only be redeemed in-kind and not for cash . Since 14th November 2008, units can be redeemed either (a) in-kind for an Application Basket plus a cash component or (b) for a cash amount equivalent to the Application Basket Value plus a cash component .
MSCIChinaETFDuring the year ended 31st December 2015, the Sub-Fund redeemed 97,800,000 units (2014: 28,800,000 units) in exchange for Application Baskets consisting of investments valued at a total of HK$1,962,344,170 (2014: HK$541,342,503) plus the relevant cash component included in the Statement of Cash Flows .
A50ChinaETFDuring the year ended 31st December 2015, the Sub-Fund redeemed 3,090,000,000 units (2014: 1,884,000,000 units) in exchange for Application Baskets consisting of investments valued at a total of HK$44,929,916,659 (2014: HK$19,058,608,589) plus the relevant cash component included in the Statement of Cash Flows .
97
Sub-funds of iShares Asia TrustNotes to the Financial Statements (continued)
SENSEXIndiaETF,CSIA-ShareEnergyETF,CSIA-ShareMaterialsETF,CSIA-ShareConsumerDiscretionaryETFandRMBBondIndexETFDuring the years ended 31st December 2015 and 2014, all units redeemed were through cash redemptions .
MSCIACAsiaexJapanETF(formerlyknownasMSCIAsiaAPEX50ETF),CSIA-ShareInfrastructureETFandCSIA-ShareConsumerStaplesETFDuring the year ended 31st December 2015, all units redeemed were through cash redemptions . During the year ended 31st December 2014, there was no redemptions for the Sub-Funds .
MSCIEmergingAsiaETFDuring the year ended 31st December 2015, the Sub-Fund redeemed 200,000 units in exchange for Application Baskets consisting of investments valued at a total of HK$918,476 plus the relevant cash component included in the Statement of Cash Flows .
During the year ended 31st December 2014, all units redeemed were through cash redemptions .
CSI300A-ShareETFDuring the year ended 31st December 2015, all units redeemed were through cash redemptions . During the year ended 31st December 2014, the Sub-Fund redeemed 12,000,000 units in exchange for Application Baskets consisting of investments valued at a total of HK$199,640,893 plus the relevant cash component included in the Statement of Cash Flows .
CSIA-ShareFinancialsETFDuring the year ended 31st December 2015, all units redeemed were through cash redemptions . During the year ended 31st December 2014, the Sub-Fund redeemed 2,000,000 units in exchange for Application Baskets consisting of investments valued at a total of HK$17,757,064 plus the relevant cash component included in the Statement of Cash Flows .
9 SOFT COMMISSION ARRANGEMENTSThe Manager confirms that there have been no soft commission arrangements existing during the year in relation to directing transactions of the Sub-Funds through a broker or dealer (2014: Nil) .
10 INVESTMENT LIMITATION AND PROHIBITIONS UNDER THE SFC CODEPursuant to the SFC’s Guidelines for Regulating Index Tracking Exchange Traded Funds (the “ETF Guidelines”), the Manager is permitted to overweight the holdings of the Sub-Funds relative to their respective weightings in the underlying index, on the condition that the maximum extra weighting in any constituent securities will not exceed the maximum limit reasonably determined by the Sub-Funds and after consultation with the SFC . The maximum limit for each of the Sub-Funds has been disclosed in their respective prospectus .
The Manager and Trustee have confirmed that all Sub-Funds have complied with this limit during the years ended 31st December 2015 and 2014 .
The SFC Code allows the Sub-Funds to invest in constituent securities issued by a single issuer for more than 10% of the Sub-Funds’ net asset value provided that the investment is limited to any constituent securities that each accounts for more than 10% of the weighting of the Index and the Sub-Funds’ holding of any such constituent securities may not exceed their respective weightings in the Index (except as a result of changes in the composition of the Index and the excess is transitional and temporary in nature) .
Sub-funds of iShares Asia TrustNotes to the Financial Statements (continued)
The following Sub-Funds held constituent securities that individually accounted for more than 10% of the Sub-Funds’ net asset value and their respective weightings of the underlying index as at 31st December 2015 and 2014:
MSCi China eTfRESPECTIVE wEIgHTINg
IN THE INDEX (%) % oF NET ASSET VAlUE
31.12.2015 31.12.2014 31.12.2015 31.12.2014
TenCenT holdingS lTd 11 .12 8 .99 11 .10 8 .97
CSi A-Share energy eTfRESPECTIVE wEIgHTINg
IN THE INDEX (%) % oF NET ASSET VAlUE
31.12.2015 31.12.2014 31.12.2015 31.12.2014
ChinA peTRoleUM & CheMiCAl – A 19 .93 11 .79 19 .93 11 .76
ChinA ShenhUA eneRgY Co – A 11 .32 21 .86 11 .24 21 .80
peTRoChinA Co lTd – A 15 .50 13 .73 15 .55 13 .69
46 .75 47 .38 46 .72 47 .25
CSi A-Share infrastructure eTfRESPECTIVE wEIgHTINg
IN THE INDEX (%) % oF NET ASSET VAlUE
31.12.2015 31.12.2014 31.12.2015 31.12.2014
ChinA STATe ConSTRUCTion – A 9 .19 11 .99 9 .15 11 .97
CSi A-Share Consumer discretionary eTfRESPECTIVE wEIgHTINg
IN THE INDEX (%) % oF NET ASSET VAlUE
31.12.2015 31.12.2014 31.12.2015 31.12.2014
gRee eleCTRiC AppliAnCeS i – A 9 .34 10 .48 9 .30 10 .42
CSi A-Share Consumer Staples eTfRESPECTIVE wEIgHTINg
IN THE INDEX (%) % oF NET ASSET VAlUE
31.12.2015 31.12.2014 31.12.2015 31.12.2014
inneR MongoliA Yili indUS – A 16 .33 17 .02 16 .31 16 .94
KweiChow MoUTAi Co lTd – A 17 .97 16 .81 17 .93 16 .74
34 .30 33 .83 34 .24 33 .68
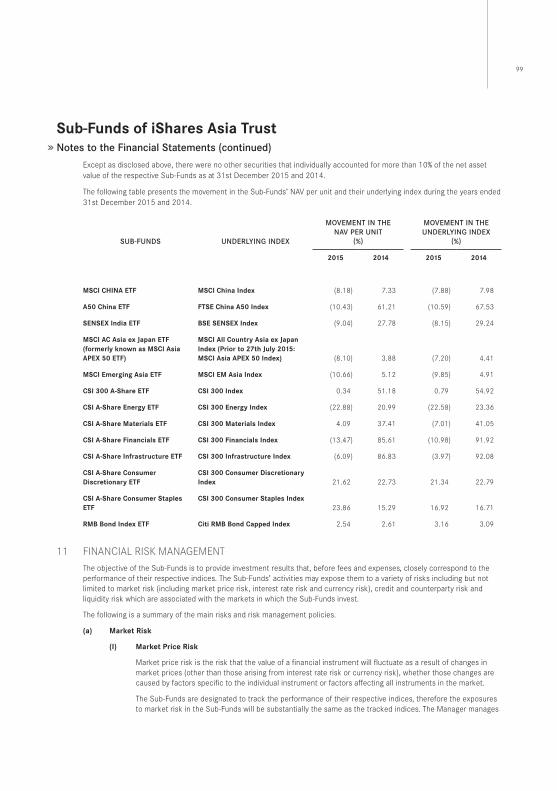
99
Sub-funds of iShares Asia TrustNotes to the Financial Statements (continued)
Except as disclosed above, there were no other securities that individually accounted for more than 10% of the net asset value of the respective Sub-Funds as at 31st December 2015 and 2014 .
The following table presents the movement in the Sub-Funds’ NAV per unit and their underlying index during the years ended 31st December 2015 and 2014 .
SUB-FUNDS UNDERlyINg INDEX
MoVEMENT IN THE NAV PER UNIT
(%)
MoVEMENT IN THE UNDERlyINg INDEX
(%)
2015 2014 2015 2014
MSCi ChinA eTf MSCi China index (8 .18) 7 .33 (7 .88) 7 .98
A50 China eTf fTSe China A50 index (10 .43) 61 .21 (10 .59) 67 .53
SenSeX india eTf BSe SenSeX index (9 .04) 27 .78 (8 .15) 29 .24
MSCi AC Asia ex Japan eTf (formerly known as MSCi Asia ApeX 50 eTf)
MSCi All Country Asia ex Japan index (prior to 27th July 2015: MSCi Asia ApeX 50 index) (8 .10) 3 .88 (7 .20) 4 .41
MSCi emerging Asia eTf MSCi eM Asia index (10 .66) 5 .12 (9 .85) 4 .91
CSi 300 A-Share eTf CSi 300 index 0 .34 51 .18 0 .79 54 .92
CSi A-Share energy eTf CSi 300 energy index (22 .88) 20 .99 (22 .58) 23 .36
CSi A-Share Materials eTf CSi 300 Materials index 4 .09 37 .41 (7 .01) 41 .05
CSi A-Share financials eTf CSi 300 financials index (13 .47) 85 .61 (10 .98) 91 .92
CSi A-Share infrastructure eTf CSi 300 infrastructure index (6 .09) 86 .83 (3 .97) 92 .08
CSi A-Share Consumer discretionary eTf
CSi 300 Consumer discretionary index 21 .62 22 .73 21 .34 22 .79
CSi A-Share Consumer Staples eTf
CSi 300 Consumer Staples index23 .86 15 .29 16 .92 16 .71
RMB Bond index eTf Citi RMB Bond Capped index 2 .54 2 .61 3 .16 3 .09
11 FINANCIAL RISK MANAGEMENT
The objective of the Sub-Funds is to provide investment results that, before fees and expenses, closely correspond to the performance of their respective indices . The Sub-Funds’ activities may expose them to a variety of risks including but not limited to market risk (including market price risk, interest rate risk and currency risk), credit and counterparty risk and liquidity risk which are associated with the markets in which the Sub-Funds invest .
The following is a summary of the main risks and risk management policies .
(a) Market Risk
(i) Market price Risk
Market price risk is the risk that the value of a financial instrument will fluctuate as a result of changes in market prices (other than those arising from interest rate risk or currency risk), whether those changes are caused by factors specific to the individual instrument or factors affecting all instruments in the market .
The Sub-Funds are designated to track the performance of their respective indices, therefore the exposures to market risk in the Sub-Funds will be substantially the same as the tracked indices . The Manager manages
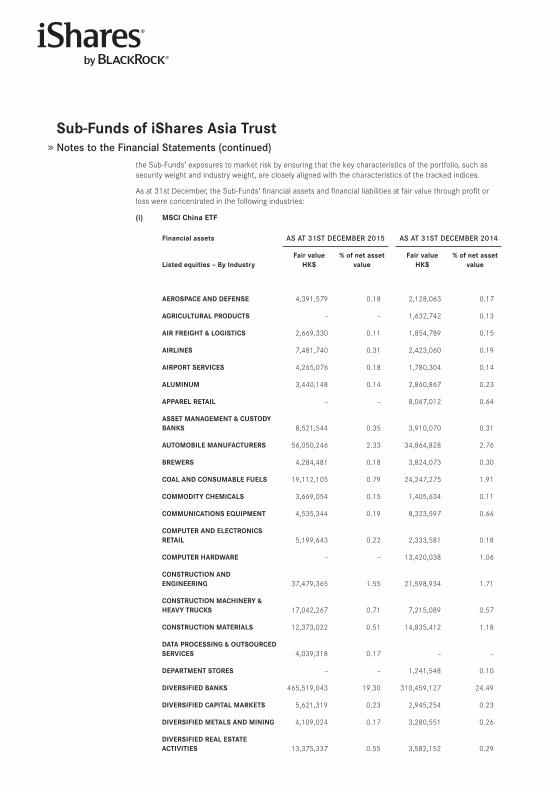
Sub-funds of iShares Asia TrustNotes to the Financial Statements (continued)
the Sub-Funds’ exposures to market risk by ensuring that the key characteristics of the portfolio, such as security weight and industry weight, are closely aligned with the characteristics of the tracked indices .
As at 31st December, the Sub-Funds’ financial assets and financial liabilities at fair value through profit or loss were concentrated in the following industries:
(i) MSCi China eTf
financial assets AS AT 31ST DECEMBER 2015 AS AT 31ST DECEMBER 2014
listed equities – By industryfair value
hK$% of net asset
valuefair value
hK$% of net asset
value
AeRoSpACe And defenSe 4,391,579 0 .18 2,128,063 0 .17
AgRiCUlTURAl pRodUCTS – – 1,632,742 0 .13
AiR fReighT & logiSTiCS 2,669,330 0 .11 1,854,789 0 .15
AiRlineS 7,481,740 0 .31 2,423,060 0 .19
AiRpoRT SeRViCeS 4,265,076 0 .18 1,780,304 0 .14
AlUMinUM 3,440,148 0 .14 2,860,867 0 .23
AppARel ReTAil – – 8,067,012 0 .64
ASSeT MAnAgeMenT & CUSTodY BAnKS 8,521,544 0 .35 3,910,070 0 .31
AUToMoBile MAnUfACTUReRS 56,050,246 2 .33 34,864,828 2 .76
BReweRS 4,284,481 0 .18 3,824,073 0 .30
CoAl And ConSUMABle fUelS 19,112,105 0 .79 24,247,275 1 .91
CoMModiTY CheMiCAlS 3,669,054 0 .15 1,405,634 0 .11
CoMMUniCATionS eQUipMenT 4,535,344 0 .19 8,323,597 0 .66
CoMpUTeR And eleCTRoniCS ReTAil 5,199,643 0 .22 2,333,581 0 .18
CoMpUTeR hARdwARe – – 13,420,038 1 .06
ConSTRUCTion And engineeRing 37,479,365 1 .55 21,598,934 1 .71
ConSTRUCTion MAChineRY & heAVY TRUCKS 17,042,267 0 .71 7,215,089 0 .57
ConSTRUCTion MATeRiAlS 12,373,022 0 .51 14,835,412 1 .18
dATA pRoCeSSing & oUTSoURCed SeRViCeS 4,039,318 0 .17 – –
depARTMenT SToReS – – 1,241,548 0 .10
diVeRSified BAnKS 465,519,043 19 .30 310,459,127 24 .49
diVeRSified CApiTAl MARKeTS 5,621,319 0 .23 2,945,254 0 .23
diVeRSified MeTAlS And Mining 4,109,024 0 .17 3,280,551 0 .26
diVeRSified ReAl eSTATe ACTiViTieS 13,375,337 0 .55 3,582,152 0 .29
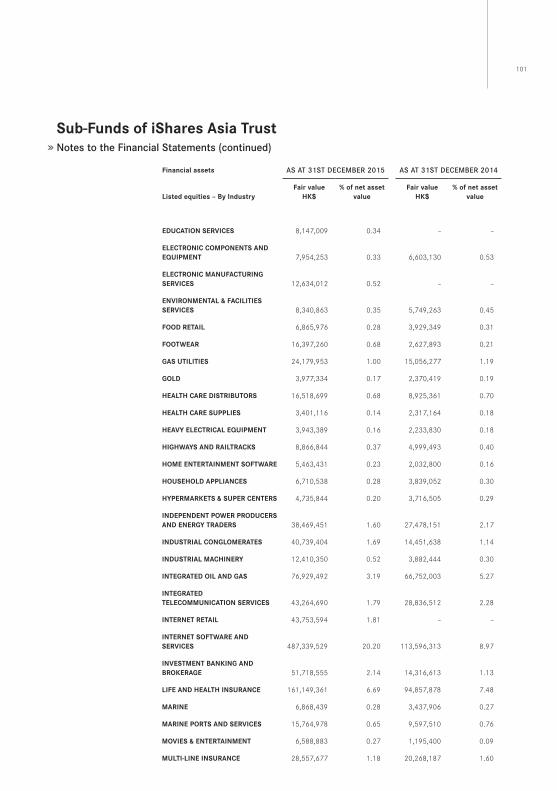
101
Sub-funds of iShares Asia TrustNotes to the Financial Statements (continued)
financial assets AS AT 31ST DECEMBER 2015 AS AT 31ST DECEMBER 2014
listed equities – By industryfair value
hK$% of net asset
valuefair value
hK$% of net asset
value
edUCATion SeRViCeS 8,147,009 0 .34 – –
eleCTRoniC CoMponenTS And eQUipMenT 7,954,253 0 .33 6,603,130 0 .53
eleCTRoniC MAnUfACTURing SeRViCeS 12,634,012 0 .52 – –
enViRonMenTAl & fACiliTieS SeRViCeS 8,340,863 0 .35 5,749,263 0 .45
food ReTAil 6,865,976 0 .28 3,929,349 0 .31
fooTweAR 16,397,260 0 .68 2,627,893 0 .21
gAS UTiliTieS 24,179,953 1 .00 15,056,277 1 .19
gold 3,977,334 0 .17 2,370,419 0 .19
heAlTh CARe diSTRiBUToRS 16,518,699 0 .68 8,925,361 0 .70
heAlTh CARe SUpplieS 3,401,116 0 .14 2,317,164 0 .18
heAVY eleCTRiCAl eQUipMenT 3,943,389 0 .16 2,233,830 0 .18
highwAYS And RAilTRACKS 8,866,844 0 .37 4,999,493 0 .40
hoMe enTeRTAinMenT SofTwARe 5,463,431 0 .23 2,032,800 0 .16
hoUSehold AppliAnCeS 6,710,538 0 .28 3,839,052 0 .30
hYpeRMARKeTS & SUpeR CenTeRS 4,735,844 0 .20 3,716,505 0 .29
independenT poweR pRodUCeRS And eneRgY TRAdeRS 38,469,451 1 .60 27,478,151 2 .17
indUSTRiAl CongloMeRATeS 40,739,404 1 .69 14,451,638 1 .14
indUSTRiAl MAChineRY 12,410,350 0 .52 3,882,444 0 .30
inTegRATed oil And gAS 76,929,492 3 .19 66,752,003 5 .27
inTegRATed TeleCoMMUniCATion SeRViCeS 43,264,690 1 .79 28,836,512 2 .28
inTeRneT ReTAil 43,753,594 1 .81 – –
inTeRneT SofTwARe And SeRViCeS 487,339,529 20 .20 113,596,313 8 .97
inVeSTMenT BAnKing And BRoKeRAge 51,718,555 2 .14 14,316,613 1 .13
life And heAlTh inSURAnCe 161,149,361 6 .69 94,857,878 7 .48
MARine 6,868,439 0 .28 3,437,906 0 .27
MARine poRTS And SeRViCeS 15,764,978 0 .65 9,597,510 0 .76
MoVieS & enTeRTAinMenT 6,588,883 0 .27 1,195,400 0 .09
MUlTi-line inSURAnCe 28,557,677 1 .18 20,268,187 1 .60
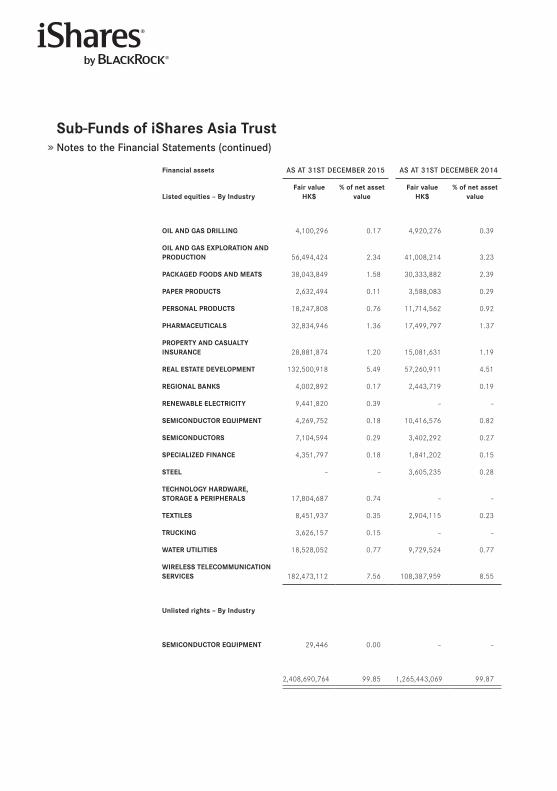
Sub-funds of iShares Asia TrustNotes to the Financial Statements (continued)
financial assets AS AT 31ST DECEMBER 2015 AS AT 31ST DECEMBER 2014
listed equities – By industryfair value
hK$% of net asset
valuefair value
hK$% of net asset
value
oil And gAS dRilling 4,100,296 0 .17 4,920,276 0 .39
oil And gAS eXploRATion And pRodUCTion 56,494,424 2 .34 41,008,214 3 .23
pACKAged foodS And MeATS 38,043,849 1 .58 30,333,882 2 .39
pApeR pRodUCTS 2,632,494 0 .11 3,588,083 0 .29
peRSonAl pRodUCTS 18,247,808 0 .76 11,714,562 0 .92
phARMACeUTiCAlS 32,834,946 1 .36 17,499,797 1 .37
pRopeRTY And CASUAlTY inSURAnCe 28,881,874 1 .20 15,081,631 1 .19
ReAl eSTATe deVelopMenT 132,500,918 5 .49 57,260,911 4 .51
RegionAl BAnKS 4,002,892 0 .17 2,443,719 0 .19
RenewABle eleCTRiCiTY 9,441,820 0 .39 – –
SeMiCondUCToR eQUipMenT 4,269,752 0 .18 10,416,576 0 .82
SeMiCondUCToRS 7,104,594 0 .29 3,402,292 0 .27
SpeCiAlized finAnCe 4,351,797 0 .18 1,841,202 0 .15
STeel – – 3,605,235 0 .28
TeChnologY hARdwARe, SToRAge & peRipheRAlS 17,804,687 0 .74 – –
TeXTileS 8,451,937 0 .35 2,904,115 0 .23
TRUCKing 3,626,157 0 .15 – –
wATeR UTiliTieS 18,528,052 0 .77 9,729,524 0 .77
wiReleSS TeleCoMMUniCATion SeRViCeS 182,473,112 7 .56 108,387,959 8 .55
Unlisted rights – By industry
SeMiCondUCToR eQUipMenT 29,446 0 .00 – –
2,408,690,764 99 .85 1,265,443,069 99 .87
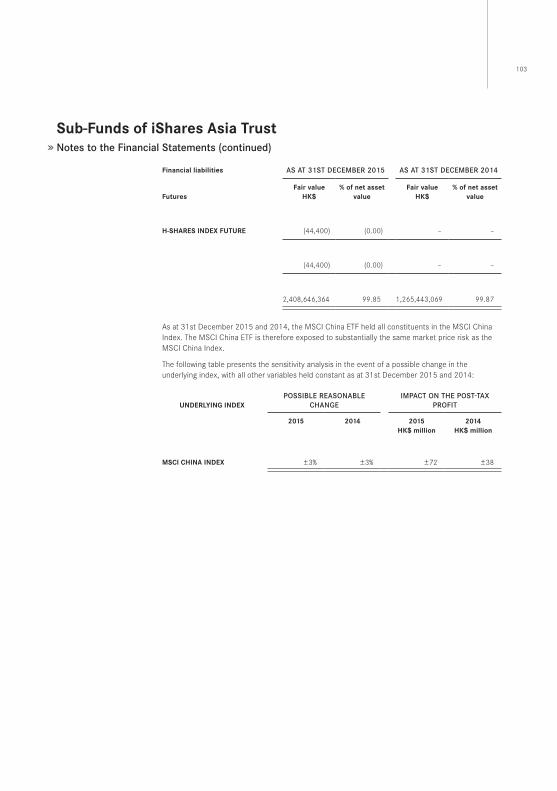
103
Sub-funds of iShares Asia TrustNotes to the Financial Statements (continued)
financial liabilities AS AT 31ST DECEMBER 2015 AS AT 31ST DECEMBER 2014
futuresfair value
hK$% of net asset
valuefair value
hK$% of net asset
value
h-ShAReS indeX fUTURe (44,400) (0 .00) – –
(44,400) (0 .00) – –
2,408,646,364 99 .85 1,265,443,069 99 .87
As at 31st December 2015 and 2014, the MSCI China ETF held all constituents in the MSCI China Index . The MSCI China ETF is therefore exposed to substantially the same market price risk as the MSCI China Index .
The following table presents the sensitivity analysis in the event of a possible change in the underlying index, with all other variables held constant as at 31st December 2015 and 2014:
UndeRlYing indeXPoSSIBlE REASoNABlE
CHANgEIMPACT oN THE PoST-TAX
PRoFIT
2015 2014 2015hK$ million
2014hK$ million
MSCi ChinA indeX ±3% ±3% ±72 ±38
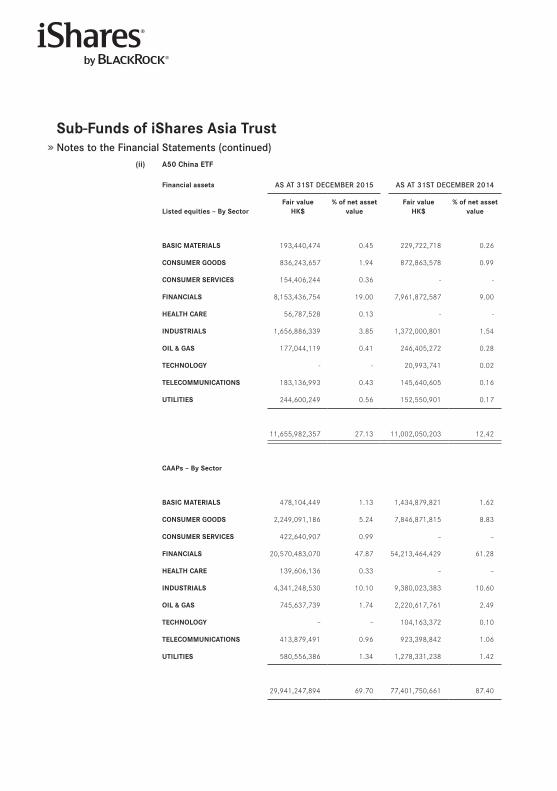
Sub-funds of iShares Asia TrustNotes to the Financial Statements (continued)
(ii) A50 China eTf
financial assets AS AT 31ST DECEMBER 2015 AS AT 31ST DECEMBER 2014
listed equities – By Sectorfair value
hK$% of net asset
valuefair value
hK$% of net asset
value
BASiC MATeRiAlS 193,440,474 0 .45 229,722,718 0 .26
ConSUMeR goodS 836,243,657 1 .94 872,863,578 0 .99
ConSUMeR SeRViCeS 154,406,244 0 .36 - -
finAnCiAlS 8,153,436,754 19 .00 7,961,872,587 9 .00
heAlTh CARe 56,787,528 0 .13 - -
indUSTRiAlS 1,656,886,339 3 .85 1,372,000,801 1 .54
oil & gAS 177,044,119 0 .41 246,405,272 0 .28
TeChnologY - - 20,993,741 0 .02
TeleCoMMUniCATionS 183,136,993 0 .43 145,640,605 0 .16
UTiliTieS 244,600,249 0 .56 152,550,901 0 .17
11,655,982,357 27 .13 11,002,050,203 12 .42
CAAps – By Sector
BASiC MATeRiAlS 478,104,449 1 .13 1,434,879,821 1 .62
ConSUMeR goodS 2,249,091,186 5 .24 7,846,871,815 8 .83
ConSUMeR SeRViCeS 422,640,907 0 .99 – –
finAnCiAlS 20,570,483,070 47 .87 54,213,464,429 61 .28
heAlTh CARe 139,606,136 0 .33 – –
indUSTRiAlS 4,341,248,530 10 .10 9,380,023,383 10 .60
oil & gAS 745,637,739 1 .74 2,220,617,761 2 .49
TeChnologY – – 104,163,372 0 .10
TeleCoMMUniCATionS 413,879,491 0 .96 923,398,842 1 .06
UTiliTieS 580,556,386 1 .34 1,278,331,238 1 .42
29,941,247,894 69 .70 77,401,750,661 87 .40
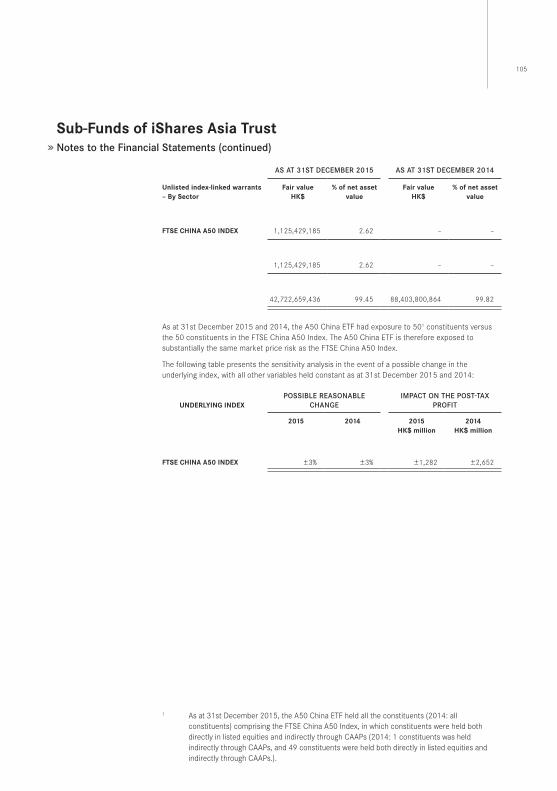
105
Sub-funds of iShares Asia TrustNotes to the Financial Statements (continued)
AS AT 31ST DECEMBER 2015 AS AT 31ST DECEMBER 2014
Unlisted index-linked warrants – By Sector
fair valuehK$
% of net asset value
fair valuehK$
% of net asset value
fTSe ChinA A50 indeX 1,125,429,185 2 .62 – –
1,125,429,185 2 .62 – –
42,722,659,436 99 .45 88,403,800,864 99 .82
As at 31st December 2015 and 2014, the A50 China ETF had exposure to 501 constituents versus the 50 constituents in the FTSE China A50 Index . The A50 China ETF is therefore exposed to substantially the same market price risk as the FTSE China A50 Index .
The following table presents the sensitivity analysis in the event of a possible change in the underlying index, with all other variables held constant as at 31st December 2015 and 2014:
UndeRlYing indeXPoSSIBlE REASoNABlE
CHANgEIMPACT oN THE PoST-TAX
PRoFIT
2015 2014 2015hK$ million
2014hK$ million
fTSe ChinA A50 indeX ±3% ±3% ±1,282 ±2,652
1 As at 31st December 2015, the A50 China ETF held all the constituents (2014: all constituents) comprising the FTSE China A50 Index, in which constituents were held both directly in listed equities and indirectly through CAAPs (2014: 1 constituents was held indirectly through CAAPs, and 49 constituents were held both directly in listed equities and indirectly through CAAPs .) .
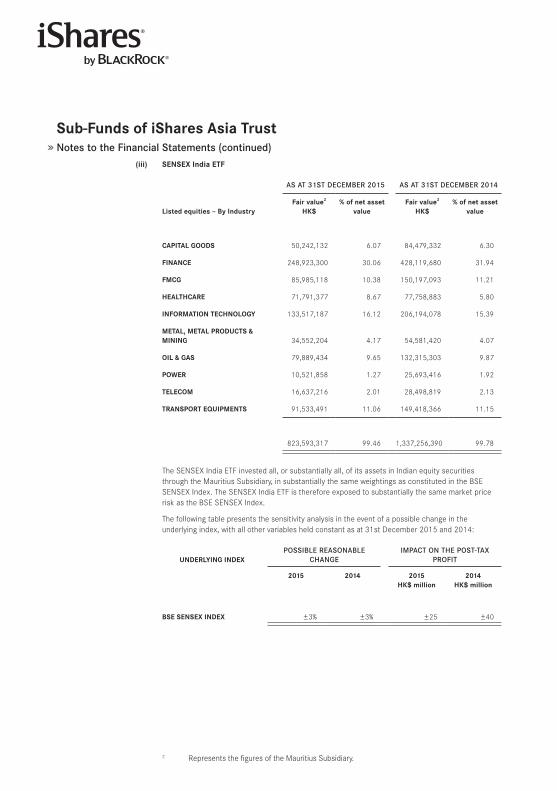
Sub-funds of iShares Asia TrustNotes to the Financial Statements (continued)
(iii) SenSeX india eTf
AS AT 31ST DECEMBER 2015 AS AT 31ST DECEMBER 2014
listed equities – By industryfair value2
hK$% of net asset
valuefair value2
hK$% of net asset
value
CApiTAl goodS 50,242,132 6 .07 84,479,332 6 .30
finAnCe 248,923,300 30 .06 428,119,680 31 .94
fMCg 85,985,118 10 .38 150,197,093 11 .21
heAlThCARe 71,791,377 8 .67 77,758,883 5 .80
infoRMATion TeChnologY 133,517,187 16 .12 206,194,078 15 .39
MeTAl, MeTAl pRodUCTS & Mining 34,552,204 4 .17 54,581,420 4 .07
oil & gAS 79,889,434 9 .65 132,315,303 9 .87
poweR 10,521,858 1 .27 25,693,416 1 .92
TeleCoM 16,637,216 2 .01 28,498,819 2 .13
TRAnSpoRT eQUipMenTS 91,533,491 11 .06 149,418,366 11 .15
823,593,317 99 .46 1,337,256,390 99 .78
The SENSEX India ETF invested all, or substantially all, of its assets in Indian equity securities through the Mauritius Subsidiary, in substantially the same weightings as constituted in the BSE SENSEX Index . The SENSEX India ETF is therefore exposed to substantially the same market price risk as the BSE SENSEX Index .
The following table presents the sensitivity analysis in the event of a possible change in the underlying index, with all other variables held constant as at 31st December 2015 and 2014:
UndeRlYing indeXPoSSIBlE REASoNABlE
CHANgEIMPACT oN THE PoST-TAX
PRoFIT
2015 2014 2015hK$ million
2014hK$ million
BSe SenSeX indeX ±3% ±3% ±25 ±40
2 Represents the figures of the Mauritius Subsidiary .
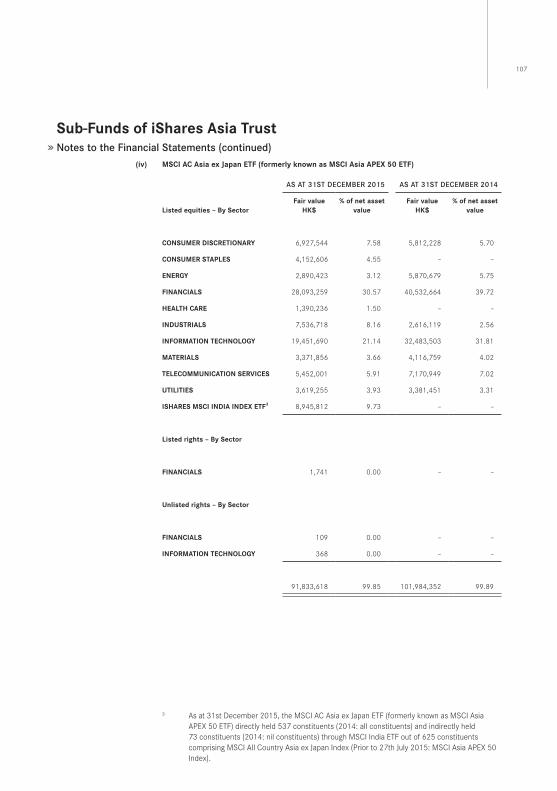
107
Sub-funds of iShares Asia TrustNotes to the Financial Statements (continued)
(iv) MSCi AC Asia ex Japan eTf (formerly known as MSCi Asia ApeX 50 eTf)
AS AT 31ST DECEMBER 2015 AS AT 31ST DECEMBER 2014
listed equities – By Sectorfair value
hK$% of net asset
valuefair value
hK$% of net asset
value
ConSUMeR diSCReTionARY 6,927,544 7 .58 5,812,228 5 .70
ConSUMeR STApleS 4,152,606 4 .55 – –
eneRgY 2,890,423 3 .12 5,870,679 5 .75
finAnCiAlS 28,093,259 30 .57 40,532,664 39 .72
heAlTh CARe 1,390,236 1 .50 – –
indUSTRiAlS 7,536,718 8 .16 2,616,119 2 .56
infoRMATion TeChnologY 19,451,690 21 .14 32,483,503 31 .81
MATeRiAlS 3,371,856 3 .66 4,116,759 4 .02
TeleCoMMUniCATion SeRViCeS 5,452,001 5 .91 7,170,949 7 .02
UTiliTieS 3,619,255 3 .93 3,381,451 3 .31
iShAReS MSCi indiA indeX eTf3 8,945,812 9 .73 – –
listed rights – By Sector
finAnCiAlS 1,741 0 .00 – –
Unlisted rights – By Sector
finAnCiAlS 109 0 .00 – –
infoRMATion TeChnologY 368 0 .00 – –
91,833,618 99 .85 101,984,352 99 .89
3 As at 31st December 2015, the MSCI AC Asia ex Japan ETF (formerly known as MSCI Asia APEX 50 ETF) directly held 537 constituents (2014: all constituents) and indirectly held 73 constituents (2014: nil constituents) through MSCI India ETF out of 625 constituents comprising MSCI All Country Asia ex Japan Index (Prior to 27th July 2015: MSCI Asia APEX 50 Index) .
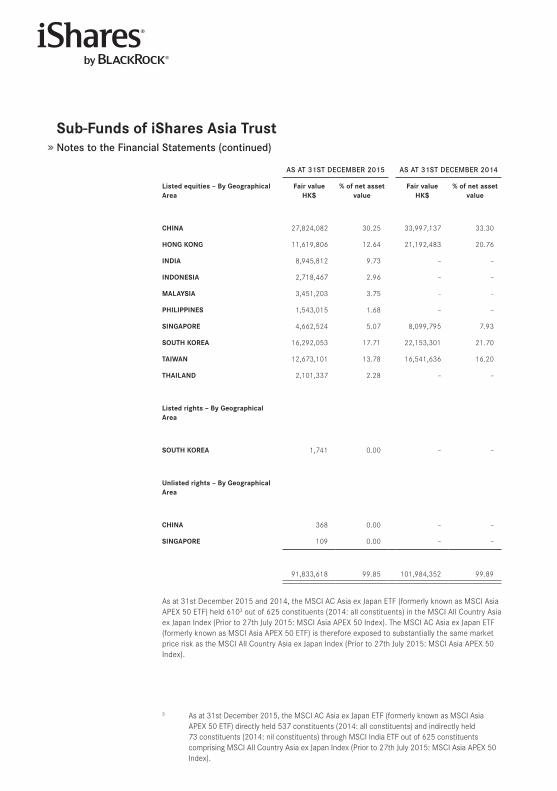
Sub-funds of iShares Asia TrustNotes to the Financial Statements (continued)
AS AT 31ST DECEMBER 2015 AS AT 31ST DECEMBER 2014
listed equities – By geographical Area
fair valuehK$
% of net asset value
fair valuehK$
% of net asset value
ChinA 27,824,082 30 .25 33,997,137 33 .30
hong Kong 11,619,806 12 .64 21,192,483 20 .76
indiA 8,945,812 9 .73 – –
indoneSiA 2,718,467 2 .96 – –
MAlAYSiA 3,451,203 3 .75 – –
philippineS 1,543,015 1 .68 – –
SingApoRe 4,662,524 5 .07 8,099,795 7 .93
SoUTh KoReA 16,292,053 17 .71 22,153,301 21 .70
TAiwAn 12,673,101 13 .78 16,541,636 16 .20
ThAilAnd 2,101,337 2 .28 – –
listed rights – By geographical Area
SoUTh KoReA 1,741 0 .00 – –
Unlisted rights – By geographical Area
ChinA 368 0 .00 – –
SingApoRe 109 0 .00 – –
91,833,618 99 .85 101,984,352 99 .89
As at 31st December 2015 and 2014, the MSCI AC Asia ex Japan ETF (formerly known as MSCI Asia APEX 50 ETF) held 6103 out of 625 constituents (2014: all constituents) in the MSCI All Country Asia ex Japan Index (Prior to 27th July 2015: MSCI Asia APEX 50 Index) . The MSCI AC Asia ex Japan ETF (formerly known as MSCI Asia APEX 50 ETF) is therefore exposed to substantially the same market price risk as the MSCI All Country Asia ex Japan Index (Prior to 27th July 2015: MSCI Asia APEX 50 Index) .
3 As at 31st December 2015, the MSCI AC Asia ex Japan ETF (formerly known as MSCI Asia APEX 50 ETF) directly held 537 constituents (2014: all constituents) and indirectly held 73 constituents (2014: nil constituents) through MSCI India ETF out of 625 constituents comprising MSCI All Country Asia ex Japan Index (Prior to 27th July 2015: MSCI Asia APEX 50 Index) .
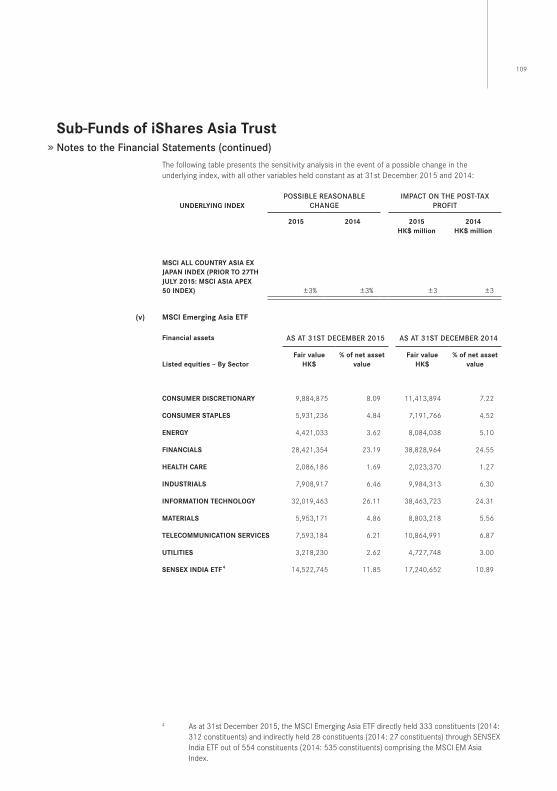
109
Sub-funds of iShares Asia TrustNotes to the Financial Statements (continued)
The following table presents the sensitivity analysis in the event of a possible change in the underlying index, with all other variables held constant as at 31st December 2015 and 2014:
UndeRlYing indeXPoSSIBlE REASoNABlE
CHANgEIMPACT oN THE PoST-TAX
PRoFIT
2015 2014 2015hK$ million
2014hK$ million
MSCi All CoUnTRY ASiA eX JApAn indeX (pRioR To 27Th JUlY 2015: MSCi ASiA ApeX 50 indeX) ±3% ±3% ±3 ±3
(v) MSCi emerging Asia eTf
financial assets AS AT 31ST DECEMBER 2015 AS AT 31ST DECEMBER 2014
listed equities – By Sectorfair value
hK$% of net asset
valuefair value
hK$% of net asset
value
ConSUMeR diSCReTionARY 9,884,875 8 .09 11,413,894 7 .22
ConSUMeR STApleS 5,931,236 4 .84 7,191,766 4 .52
eneRgY 4,421,033 3 .62 8,084,038 5 .10
finAnCiAlS 28,421,354 23 .19 38,828,964 24 .55
heAlTh CARe 2,086,186 1 .69 2,023,370 1 .27
indUSTRiAlS 7,908,917 6 .46 9,984,313 6 .30
infoRMATion TeChnologY 32,019,463 26 .11 38,463,723 24 .31
MATeRiAlS 5,953,171 4 .86 8,803,218 5 .56
TeleCoMMUniCATion SeRViCeS 7,593,184 6 .21 10,864,991 6 .87
UTiliTieS 3,218,230 2 .62 4,727,748 3 .00
SenSeX indiA eTf 4 14,522,745 11 .85 17,240,652 10 .89
4 As at 31st December 2015, the MSCI Emerging Asia ETF directly held 333 constituents (2014: 312 constituents) and indirectly held 28 constituents (2014: 27 constituents) through SENSEX India ETF out of 554 constituents (2014: 535 constituents) comprising the MSCI EM Asia Index .
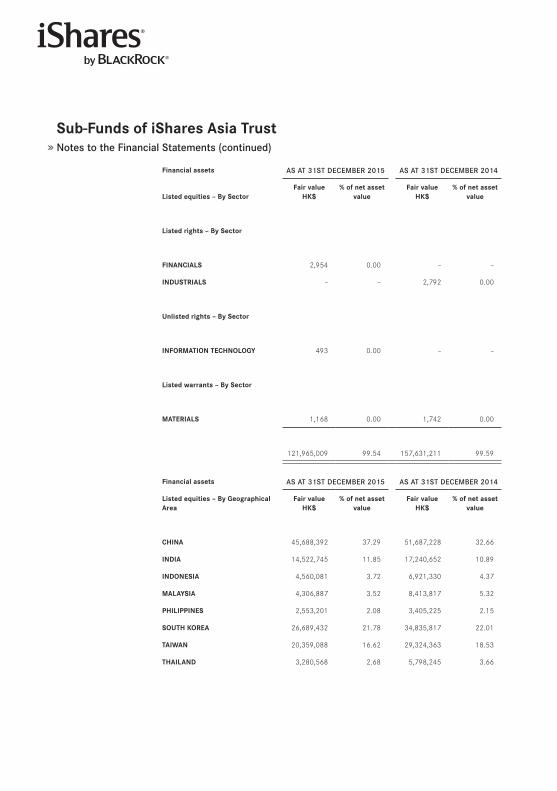
Sub-funds of iShares Asia TrustNotes to the Financial Statements (continued)
financial assets AS AT 31ST DECEMBER 2015 AS AT 31ST DECEMBER 2014
listed equities – By Sectorfair value
hK$% of net asset
valuefair value
hK$% of net asset
value
listed rights – By Sector
finAnCiAlS 2,954 0 .00 – –
indUSTRiAlS – – 2,792 0 .00
Unlisted rights – By Sector
infoRMATion TeChnologY 493 0 .00 – –
listed warrants – By Sector
MATeRiAlS 1,168 0 .00 1,742 0 .00
121,965,009 99 .54 157,631,211 99 .59
financial assets AS AT 31ST DECEMBER 2015 AS AT 31ST DECEMBER 2014
listed equities – By geographical Area
fair valuehK$
% of net asset value
fair valuehK$
% of net asset value
ChinA 45,688,392 37 .29 51,687,228 32 .66
indiA 14,522,745 11 .85 17,240,652 10 .89
indoneSiA 4,560,081 3 .72 6,921,330 4 .37
MAlAYSiA 4,306,887 3 .52 8,413,817 5 .32
philippineS 2,553,201 2 .08 3,405,225 2 .15
SoUTh KoReA 26,689,432 21 .78 34,835,817 22 .01
TAiwAn 20,359,088 16 .62 29,324,363 18 .53
ThAilAnd 3,280,568 2 .68 5,798,245 3 .66
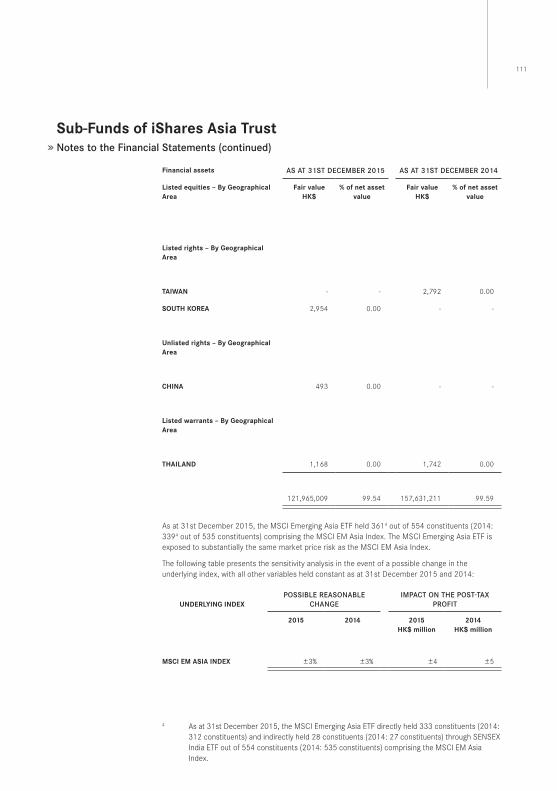
111
Sub-funds of iShares Asia TrustNotes to the Financial Statements (continued)
financial assets AS AT 31ST DECEMBER 2015 AS AT 31ST DECEMBER 2014
listed equities – By geographical Area
fair valuehK$
% of net asset value
fair valuehK$
% of net asset value
listed rights – By geographical Area
TAiwAn - - 2,792 0 .00
SoUTh KoReA 2,954 0 .00 - -
Unlisted rights – By geographical Area
ChinA 493 0 .00 - -
listed warrants – By geographical Area
ThAilAnd 1,168 0 .00 1,742 0 .00
121,965,009 99 .54 157,631,211 99 .59
As at 31st December 2015, the MSCI Emerging Asia ETF held 3614 out of 554 constituents (2014: 3394 out of 535 constituents) comprising the MSCI EM Asia Index . The MSCI Emerging Asia ETF is exposed to substantially the same market price risk as the MSCI EM Asia Index .
The following table presents the sensitivity analysis in the event of a possible change in the underlying index, with all other variables held constant as at 31st December 2015 and 2014:
UndeRlYing indeXPoSSIBlE REASoNABlE
CHANgEIMPACT oN THE PoST-TAX
PRoFIT
2015 2014 2015hK$ million
2014hK$ million
MSCi eM ASiA indeX ±3% ±3% ±4 ±5
4 As at 31st December 2015, the MSCI Emerging Asia ETF directly held 333 constituents (2014: 312 constituents) and indirectly held 28 constituents (2014: 27 constituents) through SENSEX India ETF out of 554 constituents (2014: 535 constituents) comprising the MSCI EM Asia Index .
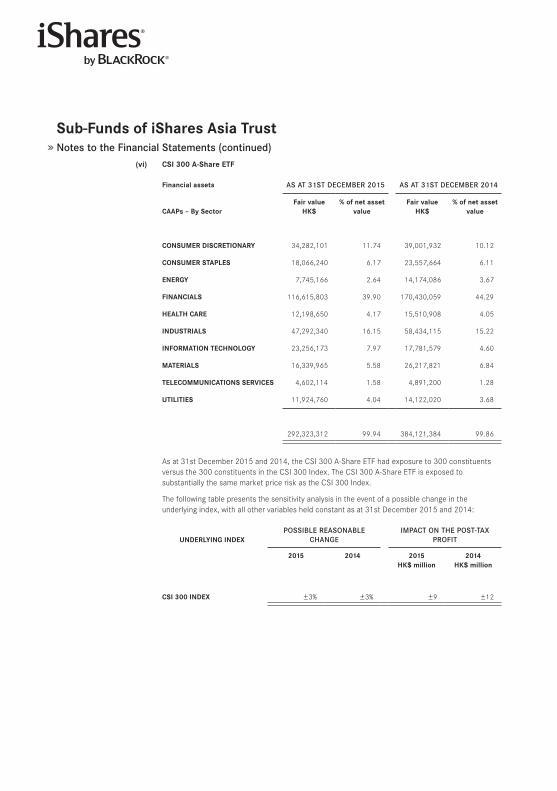
Sub-funds of iShares Asia TrustNotes to the Financial Statements (continued)
(vi) CSi 300 A-Share eTf
financial assets AS AT 31ST DECEMBER 2015 AS AT 31ST DECEMBER 2014
CAAps – By Sectorfair value
hK$% of net asset
valuefair value
hK$% of net asset
value
ConSUMeR diSCReTionARY 34,282,101 11 .74 39,001,932 10 .12
ConSUMeR STApleS 18,066,240 6 .17 23,557,664 6 .11
eneRgY 7,745,166 2 .64 14,174,086 3 .67
finAnCiAlS 116,615,803 39 .90 170,430,059 44 .29
heAlTh CARe 12,198,650 4 .17 15,510,908 4 .05
indUSTRiAlS 47,292,340 16 .15 58,434,115 15 .22
infoRMATion TeChnologY 23,256,173 7 .97 17,781,579 4 .60
MATeRiAlS 16,339,965 5 .58 26,217,821 6 .84
TeleCoMMUniCATionS SeRViCeS 4,602,114 1 .58 4,891,200 1 .28
UTiliTieS 11,924,760 4 .04 14,122,020 3 .68
292,323,312 99 .94 384,121,384 99 .86
As at 31st December 2015 and 2014, the CSI 300 A-Share ETF had exposure to 300 constituents versus the 300 constituents in the CSI 300 Index . The CSI 300 A-Share ETF is exposed to substantially the same market price risk as the CSI 300 Index .
The following table presents the sensitivity analysis in the event of a possible change in the underlying index, with all other variables held constant as at 31st December 2015 and 2014:
UndeRlYing indeXPoSSIBlE REASoNABlE
CHANgEIMPACT oN THE PoST-TAX
PRoFIT
2015 2014 2015hK$ million
2014hK$ million
CSi 300 indeX ±3% ±3% ±9 ±12
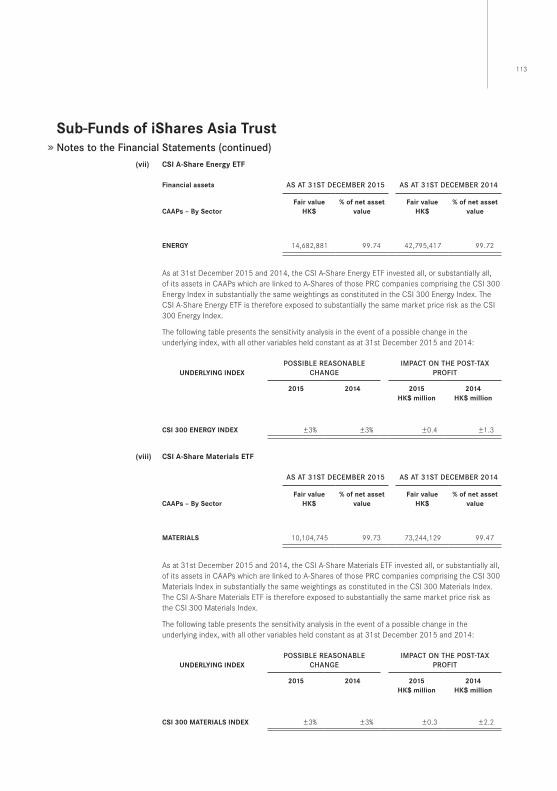
113
Sub-funds of iShares Asia TrustNotes to the Financial Statements (continued)
(vii) CSi A-Share energy eTf
financial assets AS AT 31ST DECEMBER 2015 AS AT 31ST DECEMBER 2014
CAAps – By Sectorfair value
hK$% of net asset
valuefair value
hK$% of net asset
value
eneRgY 14,682,881 99 .74 42,795,417 99 .72
As at 31st December 2015 and 2014, the CSI A-Share Energy ETF invested all, or substantially all, of its assets in CAAPs which are linked to A-Shares of those PRC companies comprising the CSI 300 Energy Index in substantially the same weightings as constituted in the CSI 300 Energy Index . The CSI A-Share Energy ETF is therefore exposed to substantially the same market price risk as the CSI 300 Energy Index .
The following table presents the sensitivity analysis in the event of a possible change in the underlying index, with all other variables held constant as at 31st December 2015 and 2014:
UndeRlYing indeXPoSSIBlE REASoNABlE
CHANgEIMPACT oN THE PoST-TAX
PRoFIT
2015 2014 2015hK$ million
2014hK$ million
CSi 300 eneRgY indeX ±3% ±3% ±0 .4 ±1 .3
(viii) CSi A-Share Materials eTf
AS AT 31ST DECEMBER 2015 AS AT 31ST DECEMBER 2014
CAAps – By Sectorfair value
hK$% of net asset
valuefair value
hK$% of net asset
value
MATeRiAlS 10,104,745 99 .73 73,244,129 99 .47
As at 31st December 2015 and 2014, the CSI A-Share Materials ETF invested all, or substantially all, of its assets in CAAPs which are linked to A-Shares of those PRC companies comprising the CSI 300 Materials Index in substantially the same weightings as constituted in the CSI 300 Materials Index . The CSI A-Share Materials ETF is therefore exposed to substantially the same market price risk as the CSI 300 Materials Index .
The following table presents the sensitivity analysis in the event of a possible change in the underlying index, with all other variables held constant as at 31st December 2015 and 2014:
UndeRlYing indeXPoSSIBlE REASoNABlE
CHANgEIMPACT oN THE PoST-TAX
PRoFIT
2015 2014 2015hK$ million
2014hK$ million
CSi 300 MATeRiAlS indeX ±3% ±3% ±0 .3 ±2 .2
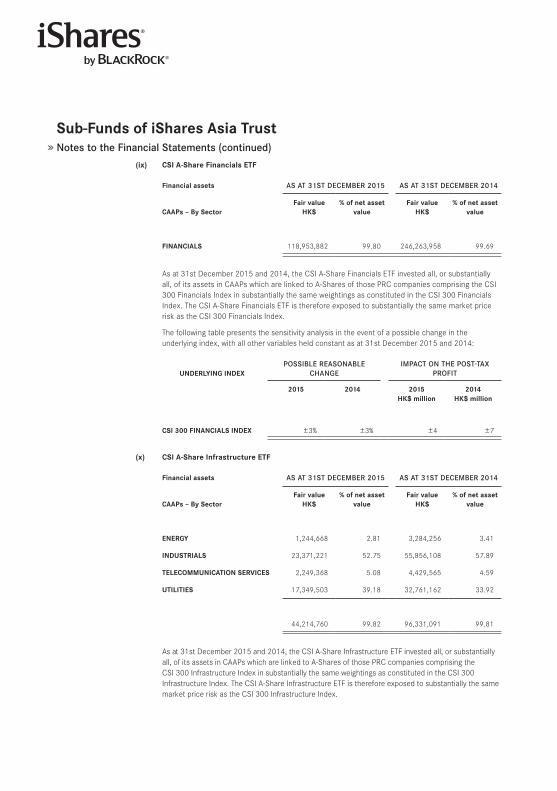
Sub-funds of iShares Asia TrustNotes to the Financial Statements (continued)
(ix) CSi A-Share financials eTf
financial assets AS AT 31ST DECEMBER 2015 AS AT 31ST DECEMBER 2014
CAAps – By Sectorfair value
hK$% of net asset
valuefair value
hK$% of net asset
value
finAnCiAlS 118,953,882 99 .80 246,263,958 99 .69
As at 31st December 2015 and 2014, the CSI A-Share Financials ETF invested all, or substantially all, of its assets in CAAPs which are linked to A-Shares of those PRC companies comprising the CSI 300 Financials Index in substantially the same weightings as constituted in the CSI 300 Financials Index . The CSI A-Share Financials ETF is therefore exposed to substantially the same market price risk as the CSI 300 Financials Index .
The following table presents the sensitivity analysis in the event of a possible change in the underlying index, with all other variables held constant as at 31st December 2015 and 2014:
UndeRlYing indeXPoSSIBlE REASoNABlE
CHANgEIMPACT oN THE PoST-TAX
PRoFIT
2015 2014 2015hK$ million
2014hK$ million
CSi 300 finAnCiAlS indeX ±3% ±3% ±4 ±7
(x) CSi A-Share infrastructure eTf
financial assets AS AT 31ST DECEMBER 2015 AS AT 31ST DECEMBER 2014
CAAps – By Sectorfair value
hK$% of net asset
valuefair value
hK$% of net asset
value
eneRgY 1,244,668 2 .81 3,284,256 3 .41
indUSTRiAlS 23,371,221 52 .75 55,856,108 57 .89
TeleCoMMUniCATion SeRViCeS 2,249,368 5 .08 4,429,565 4 .59
UTiliTieS 17,349,503 39 .18 32,761,162 33 .92
44,214,760 99 .82 96,331,091 99 .81
As at 31st December 2015 and 2014, the CSI A-Share Infrastructure ETF invested all, or substantially all, of its assets in CAAPs which are linked to A-Shares of those PRC companies comprising the CSI 300 Infrastructure Index in substantially the same weightings as constituted in the CSI 300 Infrastructure Index . The CSI A-Share Infrastructure ETF is therefore exposed to substantially the same market price risk as the CSI 300 Infrastructure Index .
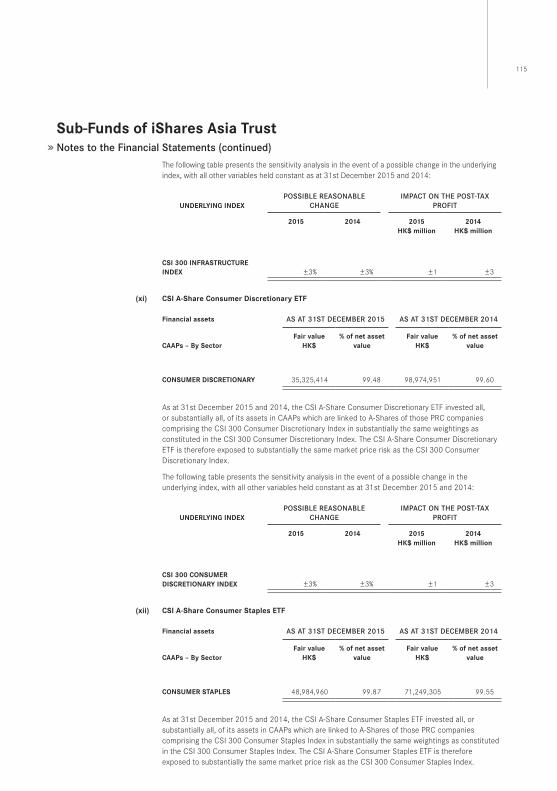
115
Sub-funds of iShares Asia TrustNotes to the Financial Statements (continued)
The following table presents the sensitivity analysis in the event of a possible change in the underlying index, with all other variables held constant as at 31st December 2015 and 2014:
UndeRlYing indeXPoSSIBlE REASoNABlE
CHANgEIMPACT oN THE PoST-TAX
PRoFIT
2015 2014 2015hK$ million
2014hK$ million
CSi 300 infRASTRUCTURe indeX ±3% ±3% ±1 ±3
(xi) CSi A-Share Consumer discretionary eTf
financial assets AS AT 31ST DECEMBER 2015 AS AT 31ST DECEMBER 2014
CAAps – By Sectorfair value
hK$% of net asset
valuefair value
hK$% of net asset
value
ConSUMeR diSCReTionARY 35,325,414 99 .48 98,974,951 99 .60
As at 31st December 2015 and 2014, the CSI A-Share Consumer Discretionary ETF invested all, or substantially all, of its assets in CAAPs which are linked to A-Shares of those PRC companies comprising the CSI 300 Consumer Discretionary Index in substantially the same weightings as constituted in the CSI 300 Consumer Discretionary Index . The CSI A-Share Consumer Discretionary ETF is therefore exposed to substantially the same market price risk as the CSI 300 Consumer Discretionary Index .
The following table presents the sensitivity analysis in the event of a possible change in the underlying index, with all other variables held constant as at 31st December 2015 and 2014:
UndeRlYing indeXPoSSIBlE REASoNABlE
CHANgEIMPACT oN THE PoST-TAX
PRoFIT
2015 2014 2015hK$ million
2014hK$ million
CSi 300 ConSUMeR diSCReTionARY indeX ±3% ±3% ±1 ±3
(xii) CSi A-Share Consumer Staples eTf
financial assets AS AT 31ST DECEMBER 2015 AS AT 31ST DECEMBER 2014
CAAps – By Sectorfair value
hK$% of net asset
valuefair value
hK$% of net asset
value
ConSUMeR STApleS 48,984,960 99 .87 71,249,305 99 .55
As at 31st December 2015 and 2014, the CSI A-Share Consumer Staples ETF invested all, or substantially all, of its assets in CAAPs which are linked to A-Shares of those PRC companies comprising the CSI 300 Consumer Staples Index in substantially the same weightings as constituted in the CSI 300 Consumer Staples Index . The CSI A-Share Consumer Staples ETF is therefore exposed to substantially the same market price risk as the CSI 300 Consumer Staples Index .
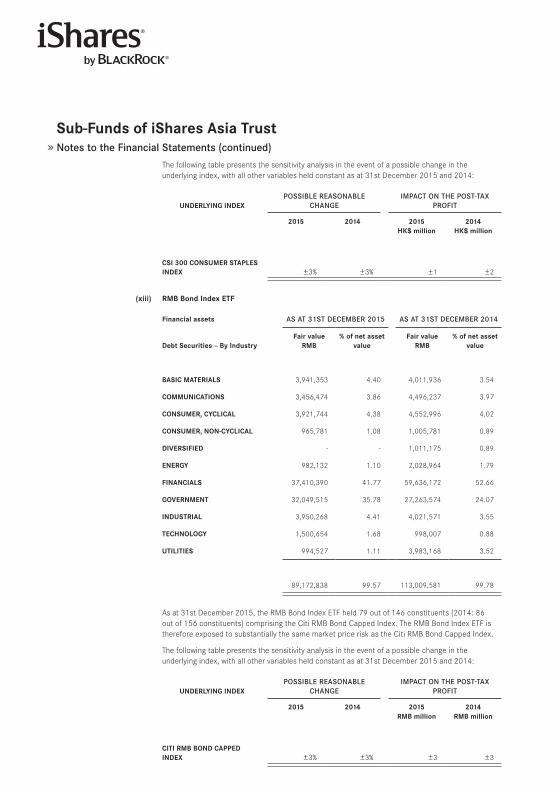
Sub-funds of iShares Asia TrustNotes to the Financial Statements (continued)
The following table presents the sensitivity analysis in the event of a possible change in the underlying index, with all other variables held constant as at 31st December 2015 and 2014:
UndeRlYing indeXPoSSIBlE REASoNABlE
CHANgEIMPACT oN THE PoST-TAX
PRoFIT
2015 2014 2015hK$ million
2014hK$ million
CSi 300 ConSUMeR STApleS indeX ±3% ±3% ±1 ±2
(xiii) RMB Bond index eTf
financial assets AS AT 31ST DECEMBER 2015 AS AT 31ST DECEMBER 2014
debt Securities – By industryfair value
RMB% of net asset
valuefair value
RMB% of net asset
value
BASiC MATeRiAlS 3,941,353 4 .40 4,011,936 3 .54
CoMMUniCATionS 3,456,474 3 .86 4,496,237 3 .97
ConSUMeR, CYCliCAl 3,921,744 4 .38 4,552,996 4 .02
ConSUMeR, non-CYCliCAl 965,781 1 .08 1,005,781 0 .89
diVeRSified - - 1,011,175 0 .89
eneRgY 982,132 1 .10 2,028,964 1 .79
finAnCiAlS 37,410,390 41 .77 59,636,172 52 .66
goVeRnMenT 32,049,515 35 .78 27,263,574 24 .07
indUSTRiAl 3,950,268 4 .41 4,021,571 3 .55
TeChnologY 1,500,654 1 .68 998,007 0 .88
UTiliTieS 994,527 1 .11 3,983,168 3 .52
89,172,838 99 .57 113,009,581 99 .78
As at 31st December 2015, the RMB Bond Index ETF held 79 out of 146 constituents (2014: 86 out of 156 constituents) comprising the Citi RMB Bond Capped Index . The RMB Bond Index ETF is therefore exposed to substantially the same market price risk as the Citi RMB Bond Capped Index .
The following table presents the sensitivity analysis in the event of a possible change in the underlying index, with all other variables held constant as at 31st December 2015 and 2014:
UndeRlYing indeXPoSSIBlE REASoNABlE
CHANgEIMPACT oN THE PoST-TAX
PRoFIT
2015 2014 2015RMB million
2014RMB million
CiTi RMB Bond CApped indeX ±3% ±3% ±3 ±3
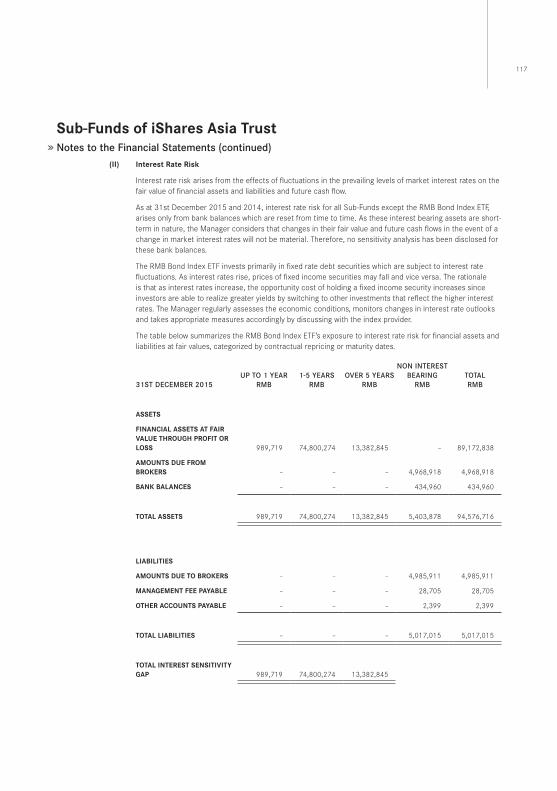
117
Sub-funds of iShares Asia TrustNotes to the Financial Statements (continued)
(ii) interest Rate Risk
Interest rate risk arises from the effects of fluctuations in the prevailing levels of market interest rates on the fair value of financial assets and liabilities and future cash flow .
As at 31st December 2015 and 2014, interest rate risk for all Sub-Funds except the RMB Bond Index ETF, arises only from bank balances which are reset from time to time . As these interest bearing assets are short-term in nature, the Manager considers that changes in their fair value and future cash flows in the event of a change in market interest rates will not be material . Therefore, no sensitivity analysis has been disclosed for these bank balances .
The RMB Bond Index ETF invests primarily in fixed rate debt securities which are subject to interest rate fluctuations . As interest rates rise, prices of fixed income securities may fall and vice versa . The rationale is that as interest rates increase, the opportunity cost of holding a fixed income security increases since investors are able to realize greater yields by switching to other investments that reflect the higher interest rates . The Manager regularly assesses the economic conditions, monitors changes in interest rate outlooks and takes appropriate measures accordingly by discussing with the index provider .
The table below summarizes the RMB Bond Index ETF’s exposure to interest rate risk for financial assets and liabilities at fair values, categorized by contractual repricing or maturity dates .
31ST DECEMBER 2015UP To 1 yEAR
RMB1-5 yEARS
RMBoVER 5 yEARS
RMB
NoN INTEREST BEARINg
RMBToTAlRMB
ASSeTS
finAnCiAl ASSeTS AT fAiR VAlUe ThRoUgh pRofiT oR loSS 989,719 74,800,274 13,382,845 – 89,172,838
AMoUnTS dUe fRoM BRoKeRS – – – 4,968,918 4,968,918
BAnK BAlAnCeS – – – 434,960 434,960
ToTAl ASSeTS 989,719 74,800,274 13,382,845 5,403,878 94,576,716
liABiliTieS
AMoUnTS dUe To BRoKeRS – – – 4,985,911 4,985,911
MAnAgeMenT fee pAYABle – – – 28,705 28,705
oTheR ACCoUnTS pAYABle – – – 2,399 2,399
ToTAl liABiliTieS – – – 5,017,015 5,017,015
ToTAl inTeReST SenSiTiViTY gAp 989,719 74,800,274 13,382,845
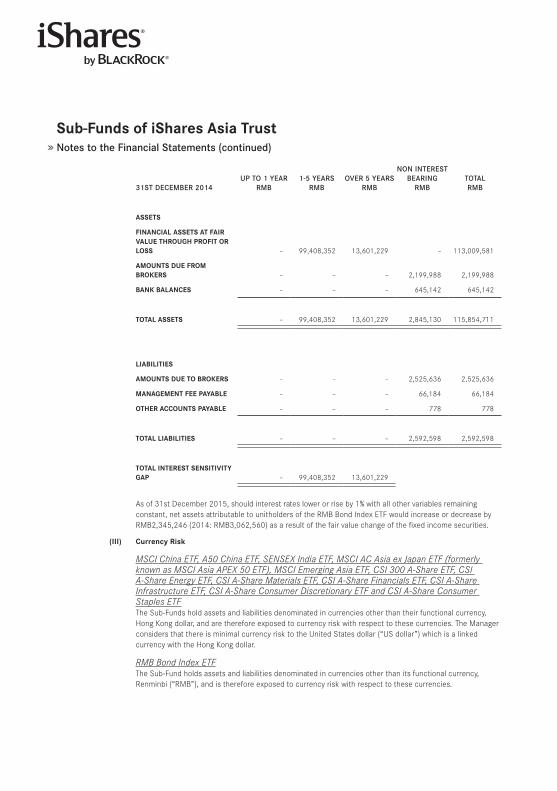
Sub-funds of iShares Asia TrustNotes to the Financial Statements (continued)
31ST DECEMBER 2014UP To 1 yEAR
RMB1-5 yEARS
RMBoVER 5 yEARS
RMB
NoN INTEREST BEARINg
RMBToTAlRMB
ASSeTS
finAnCiAl ASSeTS AT fAiR VAlUe ThRoUgh pRofiT oR loSS – 99,408,352 13,601,229 – 113,009,581
AMoUnTS dUe fRoM BRoKeRS – – – 2,199,988 2,199,988
BAnK BAlAnCeS – – – 645,142 645,142
ToTAl ASSeTS – 99,408,352 13,601,229 2,845,130 115,854,711
liABiliTieS
AMoUnTS dUe To BRoKeRS – – – 2,525,636 2,525,636
MAnAgeMenT fee pAYABle – – – 66,184 66,184
oTheR ACCoUnTS pAYABle – – – 778 778
ToTAl liABiliTieS – – – 2,592,598 2,592,598
ToTAl inTeReST SenSiTiViTY gAp – 99,408,352 13,601,229
As of 31st December 2015, should interest rates lower or rise by 1% with all other variables remaining constant, net assets attributable to unitholders of the RMB Bond Index ETF would increase or decrease by RMB2,345,246 (2014: RMB3,062,560) as a result of the fair value change of the fixed income securities .
(iii) Currency Risk
MSCIChinaETF,A50ChinaETF,SENSEXIndiaETF,MSCIACAsiaexJapanETF(formerlyknownasMSCIAsiaAPEX50ETF),MSCIEmergingAsiaETF,CSI300A-ShareETF,CSIA-ShareEnergyETF,CSIA-ShareMaterialsETF,CSIA-ShareFinancialsETF,CSIA-ShareInfrastructureETF,CSIA-ShareConsumerDiscretionaryETFandCSIA-ShareConsumerStaplesETFThe Sub-Funds hold assets and liabilities denominated in currencies other than their functional currency, Hong Kong dollar, and are therefore exposed to currency risk with respect to these currencies . The Manager considers that there is minimal currency risk to the United States dollar (“US dollar”) which is a linked currency with the Hong Kong dollar .
RMBBondIndexETFThe Sub-Fund holds assets and liabilities denominated in currencies other than its functional currency, Renminbi (“RMB”), and is therefore exposed to currency risk with respect to these currencies .
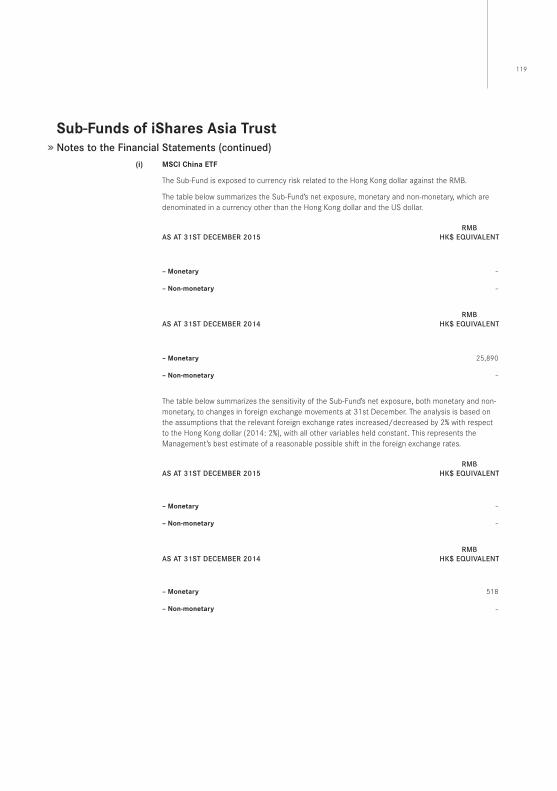
119
Sub-funds of iShares Asia TrustNotes to the Financial Statements (continued)
(i) MSCi China eTf
The Sub-Fund is exposed to currency risk related to the Hong Kong dollar against the RMB .
The table below summarizes the Sub-Fund’s net exposure, monetary and non-monetary, which are denominated in a currency other than the Hong Kong dollar and the US dollar .
AS AT 31ST DECEMBER 2015RMB
HK$ EqUIVAlENT
– Monetary –
– non-monetary –
AS AT 31ST DECEMBER 2014RMB
HK$ EqUIVAlENT
– Monetary 25,890
– non-monetary –
The table below summarizes the sensitivity of the Sub-Fund’s net exposure, both monetary and non-monetary, to changes in foreign exchange movements at 31st December . The analysis is based on the assumptions that the relevant foreign exchange rates increased/decreased by 2% with respect to the Hong Kong dollar (2014: 2%), with all other variables held constant . This represents the Management’s best estimate of a reasonable possible shift in the foreign exchange rates .
AS AT 31ST DECEMBER 2015RMB
HK$ EqUIVAlENT
– Monetary –
– non-monetary –
AS AT 31ST DECEMBER 2014RMB
HK$ EqUIVAlENT
– Monetary 518
– non-monetary –
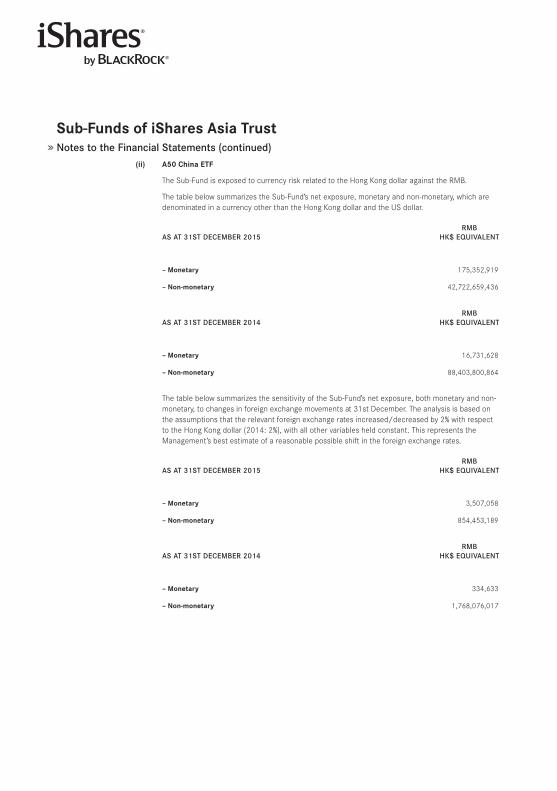
Sub-funds of iShares Asia TrustNotes to the Financial Statements (continued)
(ii) A50 China eTf
The Sub-Fund is exposed to currency risk related to the Hong Kong dollar against the RMB .
The table below summarizes the Sub-Fund’s net exposure, monetary and non-monetary, which are denominated in a currency other than the Hong Kong dollar and the US dollar .
AS AT 31ST DECEMBER 2015RMB
HK$ EqUIVAlENT
– Monetary 175,352,919
– non-monetary 42,722,659,436
AS AT 31ST DECEMBER 2014RMB
HK$ EqUIVAlENT
– Monetary 16,731,628
– non-monetary 88,403,800,864
The table below summarizes the sensitivity of the Sub-Fund’s net exposure, both monetary and non-monetary, to changes in foreign exchange movements at 31st December . The analysis is based on the assumptions that the relevant foreign exchange rates increased/decreased by 2% with respect to the Hong Kong dollar (2014: 2%), with all other variables held constant . This represents the Management’s best estimate of a reasonable possible shift in the foreign exchange rates .
AS AT 31ST DECEMBER 2015RMB
HK$ EqUIVAlENT
– Monetary 3,507,058
– non-monetary 854,453,189
AS AT 31ST DECEMBER 2014RMB
HK$ EqUIVAlENT
– Monetary 334,633
– non-monetary 1,768,076,017
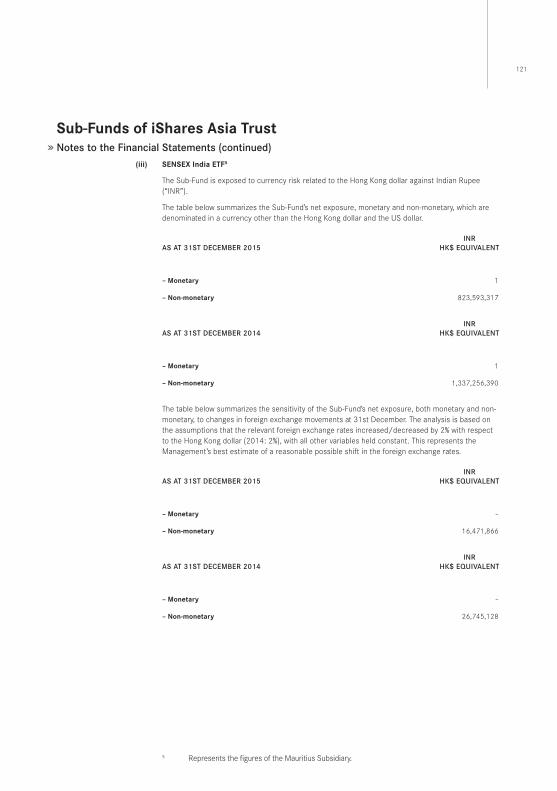
121
Sub-funds of iShares Asia TrustNotes to the Financial Statements (continued)
(iii) SenSeX india eTf5
The Sub-Fund is exposed to currency risk related to the Hong Kong dollar against Indian Rupee (“INR”) .
The table below summarizes the Sub-Fund’s net exposure, monetary and non-monetary, which are denominated in a currency other than the Hong Kong dollar and the US dollar .
AS AT 31ST DECEMBER 2015INR
HK$ EqUIVAlENT
– Monetary 1
– non-monetary 823,593,317
AS AT 31ST DECEMBER 2014INR
HK$ EqUIVAlENT
– Monetary 1
– non-monetary 1,337,256,390
The table below summarizes the sensitivity of the Sub-Fund’s net exposure, both monetary and non-monetary, to changes in foreign exchange movements at 31st December . The analysis is based on the assumptions that the relevant foreign exchange rates increased/decreased by 2% with respect to the Hong Kong dollar (2014: 2%), with all other variables held constant . This represents the Management’s best estimate of a reasonable possible shift in the foreign exchange rates .
AS AT 31ST DECEMBER 2015INR
HK$ EqUIVAlENT
– Monetary –
– non-monetary 16,471,866
AS AT 31ST DECEMBER 2014INR
HK$ EqUIVAlENT
– Monetary –
– non-monetary 26,745,128
5 Represents the figures of the Mauritius Subsidiary .
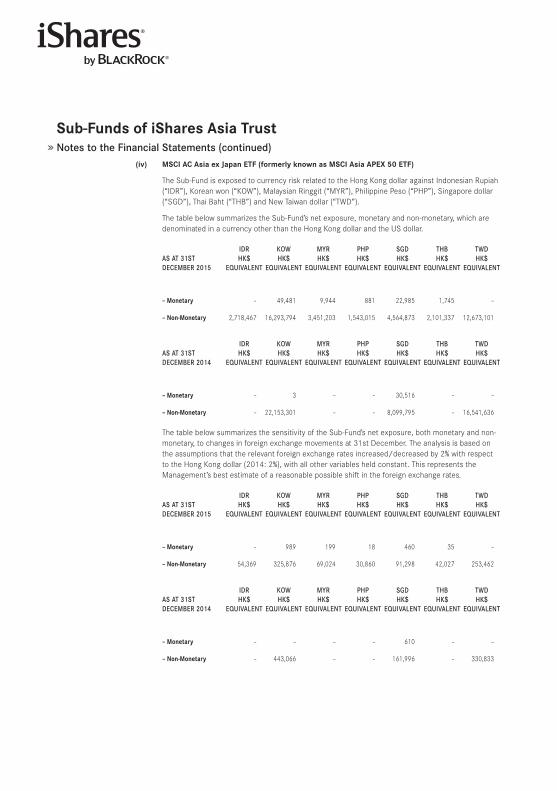
Sub-funds of iShares Asia TrustNotes to the Financial Statements (continued)
(iv) MSCi AC Asia ex Japan eTf (formerly known as MSCi Asia ApeX 50 eTf)
The Sub-Fund is exposed to currency risk related to the Hong Kong dollar against Indonesian Rupiah (“IDR”), Korean won (“KOW”), Malaysian Ringgit (“MYR”), Philippine Peso (“PHP”), Singapore dollar (“SGD”), Thai Baht (“THB”) and New Taiwan dollar (“TWD”) .
The table below summarizes the Sub-Fund’s net exposure, monetary and non-monetary, which are denominated in a currency other than the Hong Kong dollar and the US dollar .
AS AT 31ST DECEMBER 2015
IDRHK$
EqUIVAlENT
KowHK$
EqUIVAlENT
MyRHK$
EqUIVAlENT
PHPHK$
EqUIVAlENT
SgDHK$
EqUIVAlENT
THBHK$
EqUIVAlENT
TwDHK$
EqUIVAlENT
– Monetary – 49,481 9,944 881 22,985 1,745 –
– non-Monetary 2,718,467 16,293,794 3,451,203 1,543,015 4,564,873 2,101,337 12,673,101
AS AT 31ST DECEMBER 2014
IDRHK$
EqUIVAlENT
KowHK$
EqUIVAlENT
MyRHK$
EqUIVAlENT
PHPHK$
EqUIVAlENT
SgDHK$
EqUIVAlENT
THBHK$
EqUIVAlENT
TwDHK$
EqUIVAlENT
– Monetary – 3 – – 30,516 – –
– non-Monetary – 22,153,301 – – 8,099,795 – 16,541,636
The table below summarizes the sensitivity of the Sub-Fund’s net exposure, both monetary and non-monetary, to changes in foreign exchange movements at 31st December . The analysis is based on the assumptions that the relevant foreign exchange rates increased/decreased by 2% with respect to the Hong Kong dollar (2014: 2%), with all other variables held constant . This represents the Management’s best estimate of a reasonable possible shift in the foreign exchange rates .
AS AT 31ST DECEMBER 2015
IDRHK$
EqUIVAlENT
KowHK$
EqUIVAlENT
MyRHK$
EqUIVAlENT
PHPHK$
EqUIVAlENT
SgDHK$
EqUIVAlENT
THBHK$
EqUIVAlENT
TwDHK$
EqUIVAlENT
– Monetary – 989 199 18 460 35 –
– non-Monetary 54,369 325,876 69,024 30,860 91,298 42,027 253,462
AS AT 31ST DECEMBER 2014
IDRHK$
EqUIVAlENT
KowHK$
EqUIVAlENT
MyRHK$
EqUIVAlENT
PHPHK$
EqUIVAlENT
SgDHK$
EqUIVAlENT
THBHK$
EqUIVAlENT
TwDHK$
EqUIVAlENT
– Monetary – – – – 610 – –
– non-Monetary – 443,066 – – 161,996 – 330,833
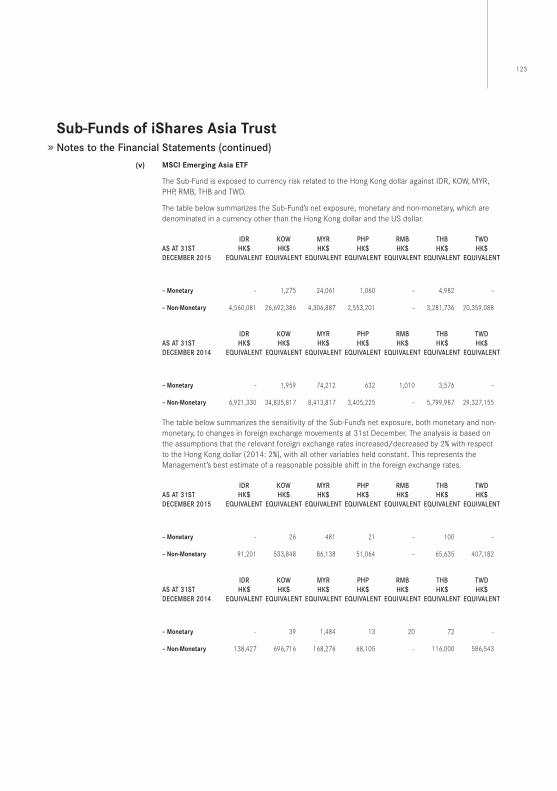
123
Sub-funds of iShares Asia TrustNotes to the Financial Statements (continued)
(v) MSCi emerging Asia eTf
The Sub-Fund is exposed to currency risk related to the Hong Kong dollar against IDR, KOW, MYR, PHP, RMB, THB and TWD .
The table below summarizes the Sub-Fund’s net exposure, monetary and non-monetary, which are denominated in a currency other than the Hong Kong dollar and the US dollar .
AS AT 31ST DECEMBER 2015
IDRHK$
EqUIVAlENT
KowHK$
EqUIVAlENT
MyRHK$
EqUIVAlENT
PHPHK$
EqUIVAlENT
RMBHK$
EqUIVAlENT
THBHK$
EqUIVAlENT
TwDHK$
EqUIVAlENT
– Monetary – 1,275 24,061 1,060 – 4,982 –
– non-Monetary 4,560,081 26,692,386 4,306,887 2,553,201 – 3,281,736 20,359,088
AS AT 31ST DECEMBER 2014
IDRHK$
EqUIVAlENT
KowHK$
EqUIVAlENT
MyRHK$
EqUIVAlENT
PHPHK$
EqUIVAlENT
RMBHK$
EqUIVAlENT
THBHK$
EqUIVAlENT
TwDHK$
EqUIVAlENT
– Monetary – 1,959 74,212 632 1,010 3,576 –
– non-Monetary 6,921,330 34,835,817 8,413,817 3,405,225 – 5,799,987 29,327,155
The table below summarizes the sensitivity of the Sub-Fund’s net exposure, both monetary and non-monetary, to changes in foreign exchange movements at 31st December . The analysis is based on the assumptions that the relevant foreign exchange rates increased/decreased by 2% with respect to the Hong Kong dollar (2014: 2%), with all other variables held constant . This represents the Management’s best estimate of a reasonable possible shift in the foreign exchange rates .
AS AT 31ST DECEMBER 2015
IDRHK$
EqUIVAlENT
KowHK$
EqUIVAlENT
MyRHK$
EqUIVAlENT
PHPHK$
EqUIVAlENT
RMBHK$
EqUIVAlENT
THBHK$
EqUIVAlENT
TwDHK$
EqUIVAlENT
– Monetary – 26 481 21 – 100 –
– non-Monetary 91,201 533,848 86,138 51,064 – 65,635 407,182
AS AT 31ST DECEMBER 2014
IDRHK$
EqUIVAlENT
KowHK$
EqUIVAlENT
MyRHK$
EqUIVAlENT
PHPHK$
EqUIVAlENT
RMBHK$
EqUIVAlENT
THBHK$
EqUIVAlENT
TwDHK$
EqUIVAlENT
– Monetary – 39 1,484 13 20 72 –
– non-Monetary 138,427 696,716 168,276 68,105 – 116,000 586,543

Sub-funds of iShares Asia TrustNotes to the Financial Statements (continued)
(vi) CSi 300 A-Share eTf
The Sub-Fund is exposed to currency risk related to the Hong Kong dollar against the RMB .
The table below summarizes the Sub-Fund’s net exposure, monetary and non-monetary, which are denominated in a currency other than the Hong Kong dollar and the US dollar .
AS AT 31ST DECEMBER 2015RMB
HK$ EqUIVAlENT
– Monetary 1,096
– non-monetary 292,323,312
AS AT 31ST DECEMBER 2014RMB
HK$ EqUIVAlENT
– Monetary 11,582
– non-monetary 384,121,384
The table below summarizes the sensitivity of the Sub-Fund’s net exposure, both monetary and non-monetary, to changes in foreign exchange movements at 31st December . The analysis is based on the assumptions that the relevant foreign exchange rates increased/decreased by 2% with respect to the Hong Kong dollar (2014: 2%), with all other variables held constant . This represents the Management’s best estimate of a reasonable possible shift in the foreign exchange rates .
AS AT 31ST DECEMBER 2015RMB
HK$ EqUIVAlENT
– Monetary 22
– non-monetary 5,846,466
AS AT 31ST DECEMBER 2014RMB
HK$ EqUIVAlENT
– Monetary 232
– non-monetary 7,682,428
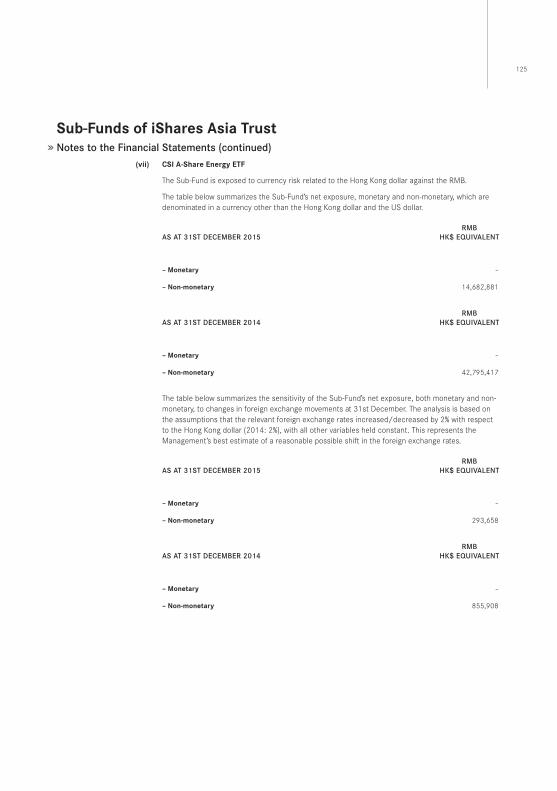
125
Sub-funds of iShares Asia TrustNotes to the Financial Statements (continued)
(vii) CSi A-Share energy eTf
The Sub-Fund is exposed to currency risk related to the Hong Kong dollar against the RMB .
The table below summarizes the Sub-Fund’s net exposure, monetary and non-monetary, which are denominated in a currency other than the Hong Kong dollar and the US dollar .
AS AT 31ST DECEMBER 2015RMB
HK$ EqUIVAlENT
– Monetary –
– non-monetary 14,682,881
AS AT 31ST DECEMBER 2014RMB
HK$ EqUIVAlENT
– Monetary –
– non-monetary 42,795,417
The table below summarizes the sensitivity of the Sub-Fund’s net exposure, both monetary and non-monetary, to changes in foreign exchange movements at 31st December . The analysis is based on the assumptions that the relevant foreign exchange rates increased/decreased by 2% with respect to the Hong Kong dollar (2014: 2%), with all other variables held constant . This represents the Management’s best estimate of a reasonable possible shift in the foreign exchange rates .
AS AT 31ST DECEMBER 2015RMB
HK$ EqUIVAlENT
– Monetary –
– non-monetary 293,658
AS AT 31ST DECEMBER 2014RMB
HK$ EqUIVAlENT
– Monetary –
– non-monetary 855,908

Sub-funds of iShares Asia TrustNotes to the Financial Statements (continued)
(viii) CSi A-Share Materials eTf
The Sub-Fund is exposed to currency risk related to the Hong Kong dollar against the RMB .
The table below summarizes the Sub-Fund’s net exposure, monetary and non-monetary, which are denominated in a currency other than the Hong Kong dollar and the US dollar .
AS AT 31ST DECEMBER 2015RMB
HK$ EqUIVAlENT
– Monetary –
– non-monetary 10,104,745
AS AT 31ST DECEMBER 2014RMB
HK$ EqUIVAlENT
– Monetary –
– non-monetary 73,244,129
The table below summarizes the sensitivity of the Sub-Fund’s net exposure, both monetary and non-monetary, to changes in foreign exchange movements at 31st December . The analysis is based on the assumptions that the relevant foreign exchange rates increased/decreased by 2% with respect to the Hong Kong dollar (2014: 2%), with all other variables held constant . This represents the Management’s best estimate of a reasonable possible shift in the foreign exchange rates .
AS AT 31ST DECEMBER 2015RMB
HK$ EqUIVAlENT
– Monetary –
– non-monetary 202,095
AS AT 31ST DECEMBER 2014RMB
HK$ EqUIVAlENT
– Monetary –
– non-monetary 1,464,883
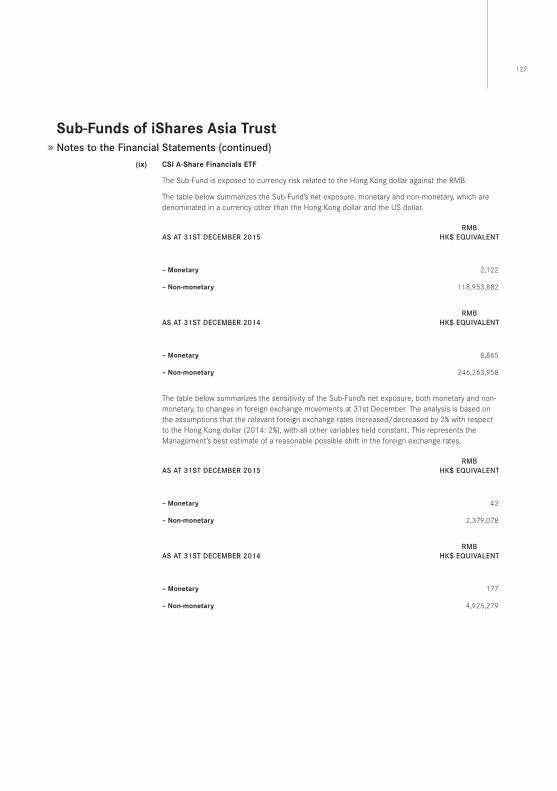
127
Sub-funds of iShares Asia TrustNotes to the Financial Statements (continued)
(ix) CSi A-Share financials eTf
The Sub-Fund is exposed to currency risk related to the Hong Kong dollar against the RMB .
The table below summarizes the Sub-Fund’s net exposure, monetary and non-monetary, which are denominated in a currency other than the Hong Kong dollar and the US dollar .
AS AT 31ST DECEMBER 2015RMB
HK$ EqUIVAlENT
– Monetary 2,122
– non-monetary 118,953,882
AS AT 31ST DECEMBER 2014RMB
HK$ EqUIVAlENT
– Monetary 8,865
– non-monetary 246,263,958
The table below summarizes the sensitivity of the Sub-Fund’s net exposure, both monetary and non-monetary, to changes in foreign exchange movements at 31st December . The analysis is based on the assumptions that the relevant foreign exchange rates increased/decreased by 2% with respect to the Hong Kong dollar (2014: 2%), with all other variables held constant . This represents the Management’s best estimate of a reasonable possible shift in the foreign exchange rates .
AS AT 31ST DECEMBER 2015RMB
HK$ EqUIVAlENT
– Monetary 42
– non-monetary 2,379,078
AS AT 31ST DECEMBER 2014RMB
HK$ EqUIVAlENT
– Monetary 177
– non-monetary 4,925,279

Sub-funds of iShares Asia TrustNotes to the Financial Statements (continued)
(x) CSi A-Share infrastructure eTf
The Sub-Fund is exposed to currency risk related to the Hong Kong dollar against the RMB .
The table below summarizes the Sub-Fund’s net exposure, monetary and non-monetary, which are denominated in a currency other than the Hong Kong dollar and the US dollar .
AS AT 31ST DECEMBER 2015RMB
HK$ EqUIVAlENT
– Monetary –
– non-monetary 44,214,760
AS AT 31ST DECEMBER 2014RMB
HK$ EqUIVAlENT
– Monetary –
– non-monetary 96,331,091
The table below summarizes the sensitivity of the Sub-Fund’s net exposure, both monetary and non-monetary, to changes in foreign exchange movements at 31st December . The analysis is based on the assumptions that the relevant foreign exchange rates increased/decreased by 2% with respect to the Hong Kong dollar (2014: 2%), with all other variables held constant . This represents the Management’s best estimate of a reasonable possible shift in the foreign exchange rates .
AS AT 31ST DECEMBER 2015RMB
HK$ EqUIVAlENT
– Monetary –
– non-monetary 884,295
AS AT 31ST DECEMBER 2014RMB
HK$ EqUIVAlENT
– Monetary –
– non-monetary 1,926,622

129
Sub-funds of iShares Asia TrustNotes to the Financial Statements (continued)
(xi) CSi A-Share Consumer discretionary eTf
The Sub-Fund is exposed to currency risk related to the Hong Kong dollar against the RMB .
The table below summarizes the Sub-Fund’s net exposure, monetary and non-monetary, which are denominated in a currency other than the Hong Kong dollar and the US dollar .
AS AT 31ST DECEMBER 2015RMB
HK$ EqUIVAlENT
– Monetary –
– non-monetary 35,325,414
AS AT 31ST DECEMBER 2014RMB
HK$ EqUIVAlENT
– Monetary –
– non-monetary 98,974,951
The table below summarizes the sensitivity of the Sub-Fund’s net exposure, both monetary and non-monetary, to changes in foreign exchange movements at 31st December . The analysis is based on the assumptions that the relevant foreign exchange rates increased/decreased by 2% with respect to the Hong Kong dollar (2014: 2%), with all other variables held constant . This represents the Management’s best estimate of a reasonable possible shift in the foreign exchange rates .
AS AT 31ST DECEMBER 2015RMB
HK$ EqUIVAlENT
– Monetary –
– non-monetary 706,508
AS AT 31ST DECEMBER 2014RMB
HK$ EqUIVAlENT
– Monetary –
– non-monetary 1,979,499
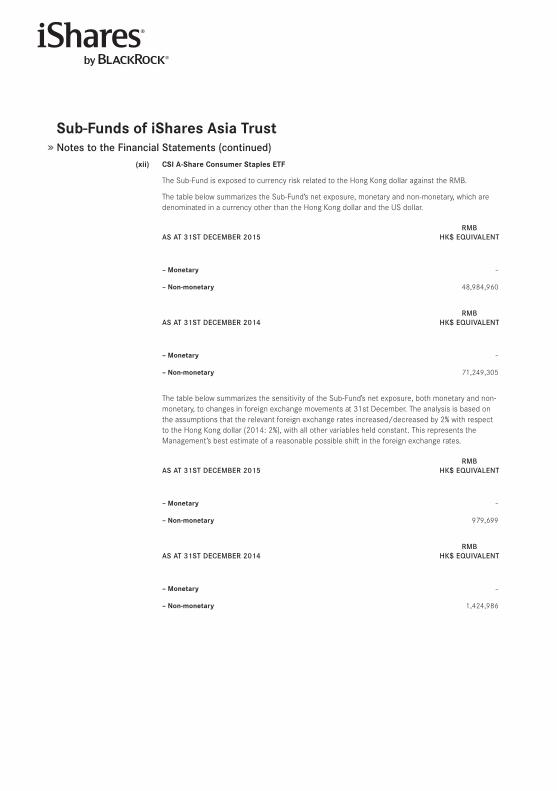
Sub-funds of iShares Asia TrustNotes to the Financial Statements (continued)
(xii) CSi A-Share Consumer Staples eTf
The Sub-Fund is exposed to currency risk related to the Hong Kong dollar against the RMB .
The table below summarizes the Sub-Fund’s net exposure, monetary and non-monetary, which are denominated in a currency other than the Hong Kong dollar and the US dollar .
AS AT 31ST DECEMBER 2015RMB
HK$ EqUIVAlENT
– Monetary –
– non-monetary 48,984,960
AS AT 31ST DECEMBER 2014RMB
HK$ EqUIVAlENT
– Monetary –
– non-monetary 71,249,305
The table below summarizes the sensitivity of the Sub-Fund’s net exposure, both monetary and non-monetary, to changes in foreign exchange movements at 31st December . The analysis is based on the assumptions that the relevant foreign exchange rates increased/decreased by 2% with respect to the Hong Kong dollar (2014: 2%), with all other variables held constant . This represents the Management’s best estimate of a reasonable possible shift in the foreign exchange rates .
AS AT 31ST DECEMBER 2015RMB
HK$ EqUIVAlENT
– Monetary –
– non-monetary 979,699
AS AT 31ST DECEMBER 2014RMB
HK$ EqUIVAlENT
– Monetary –
– non-monetary 1,424,986
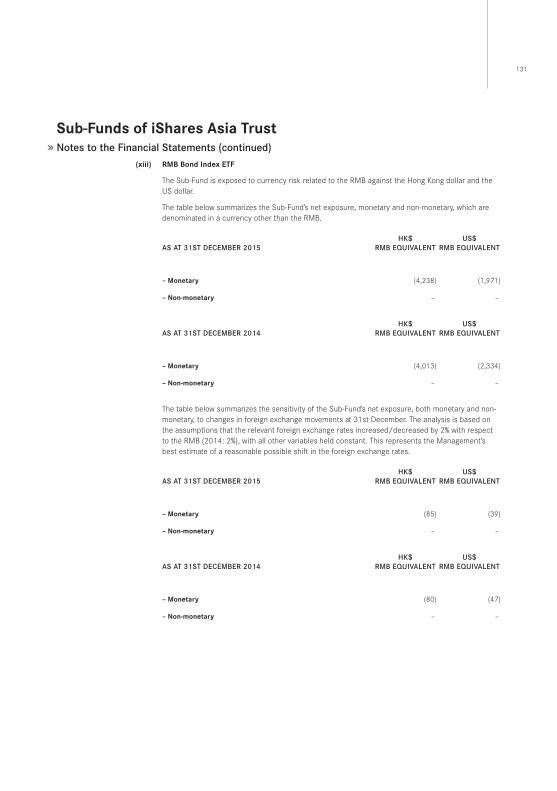
131
Sub-funds of iShares Asia TrustNotes to the Financial Statements (continued)
(xiii) RMB Bond index eTf
The Sub-Fund is exposed to currency risk related to the RMB against the Hong Kong dollar and the US dollar .
The table below summarizes the Sub-Fund’s net exposure, monetary and non-monetary, which are denominated in a currency other than the RMB .
AS AT 31ST DECEMBER 2015HK$
RMB EqUIVAlENTUS$
RMB EqUIVAlENT
– Monetary (4,238) (1,971)
– non-monetary – –
AS AT 31ST DECEMBER 2014HK$
RMB EqUIVAlENTUS$
RMB EqUIVAlENT
– Monetary (4,013) (2,334)
– non-monetary – –
The table below summarizes the sensitivity of the Sub-Fund’s net exposure, both monetary and non-monetary, to changes in foreign exchange movements at 31st December . The analysis is based on the assumptions that the relevant foreign exchange rates increased/decreased by 2% with respect to the RMB (2014: 2%), with all other variables held constant . This represents the Management’s best estimate of a reasonable possible shift in the foreign exchange rates .
AS AT 31ST DECEMBER 2015HK$
RMB EqUIVAlENTUS$
RMB EqUIVAlENT
– Monetary (85) (39)
– non-monetary – –
AS AT 31ST DECEMBER 2014HK$
RMB EqUIVAlENTUS$
RMB EqUIVAlENT
– Monetary (80) (47)
– non-monetary – –
Sub-funds of iShares Asia TrustNotes to the Financial Statements (continued)
(b) Credit and Counterparty Risk
Credit and counterparty risk is the risk that an issuer of a security or counterparty to a transaction will fail to fulfil an obligation or commitment that it has entered into with the Sub-Funds .
Financial assets which potentially cause the Sub-Funds to be subject to concentrations of credit and counterparty risk consist principally of investments issued by CAAP Issuers or IAP Issuers, investments in debt securities and bank balances .
With effect from 31st October 2011, the Manager is required to obtain collateral that represents at least 100% of each of the Sub-Funds’ gross total counterparty risk exposure to each individual CAAP Issuer so that there shall be no uncollateralized counterparty risk . Further, where collateral is taken in the nature of equity securities, the market value of the equity collateral should represent at least 120% of the related gross counterparty exposure . Where non-equity collateral is taken, a prudent haircut policy shall be adopted . Where a Sub-Fund with an exposure to CAAP Issuers is not fully collateralized due to circumstances beyond the control of the Manager, the Manager will procure such additional collateral to be delivered to the respective Sub-Fund as soon as practicable to comply with the above collateral requirements .
The SENSEX India ETF may invest up to 15% of its net asset value in IAPs; with a maximum exposure to any single issuer of 10% of its net asset value . For the years ended 31st December 2015 and 2014, the SENSEX India ETF did not hold any IAPs .
The Manager takes steps to minimise counterparty risk in the Sub-Funds by carrying out the majority of their investment transactions and contractual commitment activities with well established broker-dealers, banks and regulated exchanges with high credit ratings .
All transactions in listed investments are settled or paid for upon delivery using approved and reputable brokers . The risk of default is considered minimal since delivery of investments sold is made only when the Sub-Funds’ custodians have received payment . For a purchase, payment is made once the investments have been received by the broker . If either party fails to meet their obligation, the trade will fail .
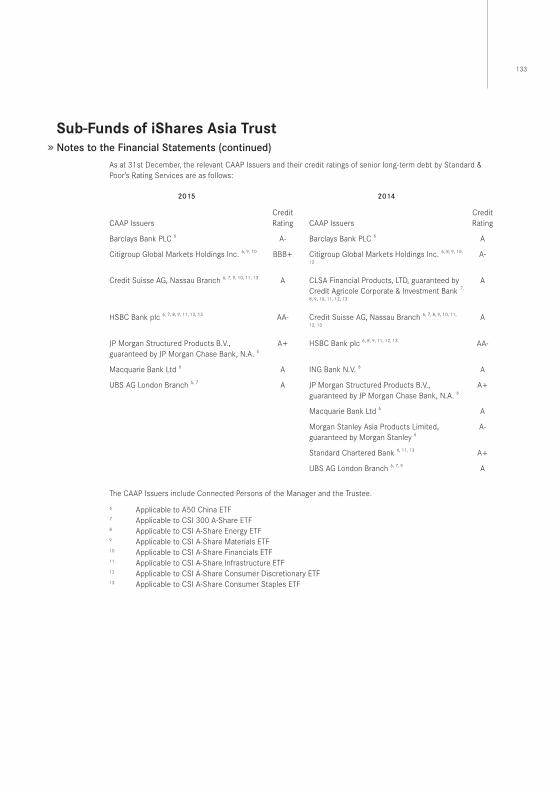
133
Sub-funds of iShares Asia TrustNotes to the Financial Statements (continued)
As at 31st December, the relevant CAAP Issuers and their credit ratings of senior long-term debt by Standard & Poor’s Rating Services are as follows:
2015 2014
CAAP IssuersCredit Rating CAAP Issuers
Credit Rating
Barclays Bank PLC 6 A- Barclays Bank PLC 6 A
Citigroup Global Markets Holdings Inc . 6, 9, 10 BBB+ Citigroup Global Markets Holdings Inc . 6, 8, 9, 10,
12A-
Credit Suisse AG, Nassau Branch 6, 7, 9, 10, 11, 13 A CLSA Financial Products, LTD, guaranteed by Credit Agricole Corporate & Investment Bank 7,
8, 9, 10, 11, 12, 13
A
HSBC Bank plc 6, 7, 8, 9, 11, 12, 13 AA- Credit Suisse AG, Nassau Branch 6, 7, 8, 9, 10, 11,
12, 13A
JP Morgan Structured Products B .V ., guaranteed by JP Morgan Chase Bank, N .A . 6
A+ HSBC Bank plc 6, 8, 9, 11, 12, 13 AA-
Macquarie Bank Ltd 6 A ING Bank N .V . 6 A
UBS AG London Branch 6, 7 A JP Morgan Structured Products B .V ., guaranteed by JP Morgan Chase Bank, N .A . 6
A+
Macquarie Bank Ltd 6 A
Morgan Stanley Asia Products Limited, guaranteed by Morgan Stanley 6
A-
Standard Chartered Bank 6, 11, 13 A+
UBS AG London Branch 6, 7, 9 A
The CAAP Issuers include Connected Persons of the Manager and the Trustee .
6 Applicable to A50 China ETF7 Applicable to CSI 300 A-Share ETF8 Applicable to CSI A-Share Energy ETF9 Applicable to CSI A-Share Materials ETF10 Applicable to CSI A-Share Financials ETF11 Applicable to CSI A-Share Infrastructure ETF12 Applicable to CSI A-Share Consumer Discretionary ETF13 Applicable to CSI A-Share Consumer Staples ETF
Sub-funds of iShares Asia TrustNotes to the Financial Statements (continued)
(i) MSCi China eTf, SenSeX india eTf, MSCi AC Asia ex Japan eTf (formerly known as MSCi Asia ApeX 50 eTf) and MSCi emerging Asia eTf
The following table sets out the net exposure of the Sub-Funds to counterparties as at 31st December 2015 and 2014 respectively together with their credit ratings of senior long-term debt by Standard & Poor’s Rating Services:
iShares MSCiChina index eTf
iShares S&p BSe SenSeXindia index eTf
iShares MSCiAC Asia ex Japan index eTf
(formerly known as iShares MSCiAsia ApeX 50 index eTf)
iShares MSCiemerging Asia index eTf
2015net exposure
tocounterparties
hK$
2014net exposure
tocounterparties
hK$
2015net exposure
tocounterparties
hK$
2014net exposure
tocounterparties
hK$
2015net exposure
tocounterparties
hK$
2014net exposure
tocounterparties
hK$
2015net exposure
tocounterparties
hK$
2014net exposure
tocounterparties
hK$
AMoUnTS dUe fRoM BRoKeRS
– golDMAN SACHS INTERNATIoNAl, gUARANTEED By golDMAN SACHS gRoUP, INC. N/A N/A N/A N/A 72,682 N/A N/A N/A
RATINg N/A N/A N/A N/A BBB+ N/A N/A N/A
MARgin depoSiTS
– CREDIT SUISSE INTERNATIoNAl 152,400 N/A N/A N/A N/A N/A N/A N/A
RATINg A N/A N/A N/A N/A N/A N/A N/A
The maximum exposure to credit risk at the end of the reporting period is the carrying amount of the assets as shown in the Statement of Financial Position .
The Sub-Funds are also exposed to credit and counterparty risk on assets held by custodian .
As at 31st December 2015 and 2014, all bank balances of the Sub-Funds were placed with The Hongkong and Shanghai Banking Corporation Limited, with a credit rating of senior long-term debt by Standard & Poor’s Rating Services of AA- (2014: AA-) .
As at 31st December 2015 and 2014, all investments were placed with HSBC Institutional Trust Services (Asia) Limited, with a credit rating of senior long-term debt by Standard & Poor’s Rating Services of AA- (2014: AA-) .
The Manager considers that none of these assets are impaired nor past due as at 31st December 2015 (2014: Nil)
(ii) A50 China eTf, CSi 300 A-Share eTf, CSi A-Share energy eTf, CSi A-Share Materials eTf, CSi A-Share financials eTf, CSi A-Share infrastructure eTf, CSi A-Share Consumer discretionary eTf and CSi A-Share Consumer Staples eTf
The Sub-Funds are subject to credit and counterparty risk associated with each CAAP Issuer and may suffer losses potentially equal to the full value of the CAAPs issued by a CAAP Issuer if such CAAP Issuer fails to perform its obligations under the CAAPs . The CAAPs constitute direct, general and unsecured contractual obligations of the CAAP Issuer .
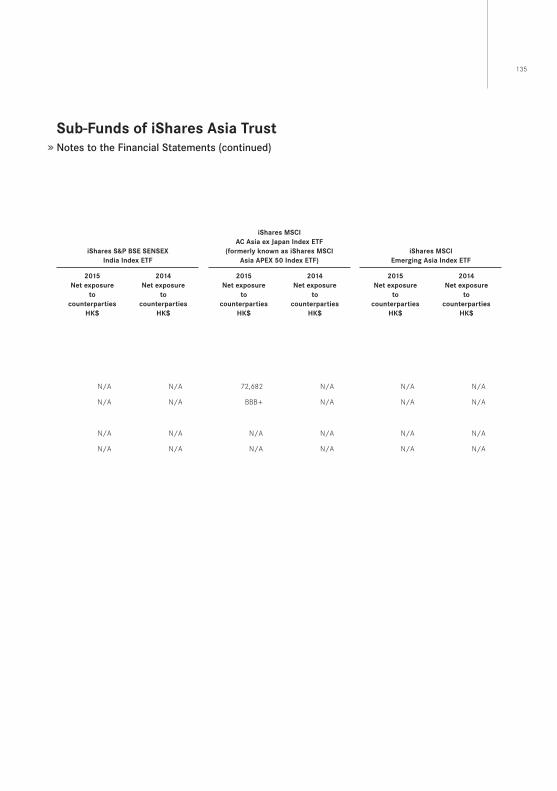
135
Sub-funds of iShares Asia TrustNotes to the Financial Statements (continued)
(i) MSCi China eTf, SenSeX india eTf, MSCi AC Asia ex Japan eTf (formerly known as MSCi Asia ApeX 50 eTf) and MSCi emerging Asia eTf
The following table sets out the net exposure of the Sub-Funds to counterparties as at 31st December 2015 and 2014 respectively together with their credit ratings of senior long-term debt by Standard & Poor’s Rating Services:
iShares MSCiChina index eTf
iShares S&p BSe SenSeXindia index eTf
iShares MSCiAC Asia ex Japan index eTf
(formerly known as iShares MSCiAsia ApeX 50 index eTf)
iShares MSCiemerging Asia index eTf
2015net exposure
tocounterparties
hK$
2014net exposure
tocounterparties
hK$
2015net exposure
tocounterparties
hK$
2014net exposure
tocounterparties
hK$
2015net exposure
tocounterparties
hK$
2014net exposure
tocounterparties
hK$
2015net exposure
tocounterparties
hK$
2014net exposure
tocounterparties
hK$
AMoUnTS dUe fRoM BRoKeRS
– golDMAN SACHS INTERNATIoNAl, gUARANTEED By golDMAN SACHS gRoUP, INC. N/A N/A N/A N/A 72,682 N/A N/A N/A
RATINg N/A N/A N/A N/A BBB+ N/A N/A N/A
MARgin depoSiTS
– CREDIT SUISSE INTERNATIoNAl 152,400 N/A N/A N/A N/A N/A N/A N/A
RATINg A N/A N/A N/A N/A N/A N/A N/A
The maximum exposure to credit risk at the end of the reporting period is the carrying amount of the assets as shown in the Statement of Financial Position .
The Sub-Funds are also exposed to credit and counterparty risk on assets held by custodian .
As at 31st December 2015 and 2014, all bank balances of the Sub-Funds were placed with The Hongkong and Shanghai Banking Corporation Limited, with a credit rating of senior long-term debt by Standard & Poor’s Rating Services of AA- (2014: AA-) .
As at 31st December 2015 and 2014, all investments were placed with HSBC Institutional Trust Services (Asia) Limited, with a credit rating of senior long-term debt by Standard & Poor’s Rating Services of AA- (2014: AA-) .
The Manager considers that none of these assets are impaired nor past due as at 31st December 2015 (2014: Nil)
(ii) A50 China eTf, CSi 300 A-Share eTf, CSi A-Share energy eTf, CSi A-Share Materials eTf, CSi A-Share financials eTf, CSi A-Share infrastructure eTf, CSi A-Share Consumer discretionary eTf and CSi A-Share Consumer Staples eTf
The Sub-Funds are subject to credit and counterparty risk associated with each CAAP Issuer and may suffer losses potentially equal to the full value of the CAAPs issued by a CAAP Issuer if such CAAP Issuer fails to perform its obligations under the CAAPs . The CAAPs constitute direct, general and unsecured contractual obligations of the CAAP Issuer .
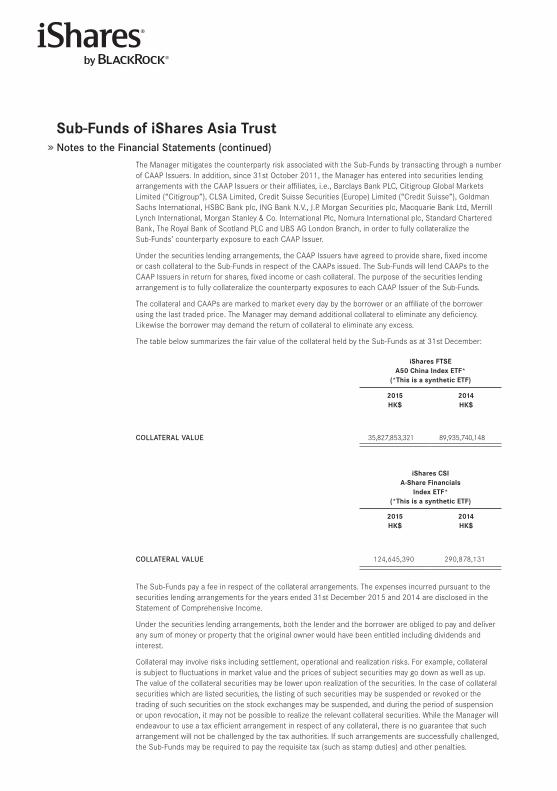
Sub-funds of iShares Asia TrustNotes to the Financial Statements (continued)
The Manager mitigates the counterparty risk associated with the Sub-Funds by transacting through a number of CAAP Issuers . In addition, since 31st October 2011, the Manager has entered into securities lending arrangements with the CAAP Issuers or their affiliates, i .e ., Barclays Bank PLC, Citigroup Global Markets Limited (“Citigroup”), CLSA Limited, Credit Suisse Securities (Europe) Limited (“Credit Suisse”), Goldman Sachs International, HSBC Bank plc, ING Bank N .V ., J .P . Morgan Securities plc, Macquarie Bank Ltd, Merrill Lynch International, Morgan Stanley & Co . International Plc, Nomura International plc, Standard Chartered Bank, The Royal Bank of Scotland PLC and UBS AG London Branch, in order to fully collateralize the Sub-Funds’ counterparty exposure to each CAAP Issuer .
Under the securities lending arrangements, the CAAP Issuers have agreed to provide share, fixed income or cash collateral to the Sub-Funds in respect of the CAAPs issued . The Sub-Funds will lend CAAPs to the CAAP Issuers in return for shares, fixed income or cash collateral . The purpose of the securities lending arrangement is to fully collateralize the counterparty exposures to each CAAP Issuer of the Sub-Funds .
The collateral and CAAPs are marked to market every day by the borrower or an affiliate of the borrower using the last traded price . The Manager may demand additional collateral to eliminate any deficiency . Likewise the borrower may demand the return of collateral to eliminate any excess .
The table below summarizes the fair value of the collateral held by the Sub-Funds as at 31st December:
iShares fTSeA50 China index eTf*
(*This is a synthetic eTf)
iShares CSi300 A-Share index eTf*
(*This is a synthetic eTf)
iShares CSiA-Share energy index eTf*(*This is a synthetic eTf)
iShares CSiA-Share Materials index eTf*
(*This is a synthetic eTf)
2015hK$
2014hK$
2015hK$
2014hK$
2015hK$
2014hK$
2015hK$
2014hK$
CollATERAl VAlUE 35,827,853,321 89,935,740,148 358,879,204 439,445,324 17,571,014 47,243,167 12,176,036 79,112,277
iShares CSi A-Share financials
index eTf* (*This is a synthetic eTf)
iShares CSi A-Share infrastructure
index eTf*(*This is a synthetic eTf)
iShares CSi A-Share
Consumer discretionary index eTf*
(*This is a synthetic eTf)
iShares CSi A-Share
Consumer Staples index eTf*(*This is a synthetic eTf)
2015hK$
2014hK$
2015hK$
2014hK$
2015hK$
2014hK$
2015hK$
2014hK$
CollATERAl VAlUE 124,645,390 290,878,131 52,836,795 105,501,815 42,971,039 110,824,885 58,281,971 81,833,934
The Sub-Funds pay a fee in respect of the collateral arrangements . The expenses incurred pursuant to the securities lending arrangements for the years ended 31st December 2015 and 2014 are disclosed in the Statement of Comprehensive Income .
Under the securities lending arrangements, both the lender and the borrower are obliged to pay and deliver any sum of money or property that the original owner would have been entitled including dividends and interest .
Collateral may involve risks including settlement, operational and realization risks . For example, collateral is subject to fluctuations in market value and the prices of subject securities may go down as well as up . The value of the collateral securities may be lower upon realization of the securities . In the case of collateral securities which are listed securities, the listing of such securities may be suspended or revoked or the trading of such securities on the stock exchanges may be suspended, and during the period of suspension or upon revocation, it may not be possible to realize the relevant collateral securities . While the Manager will endeavour to use a tax efficient arrangement in respect of any collateral, there is no guarantee that such arrangement will not be challenged by the tax authorities . If such arrangements are successfully challenged, the Sub-Funds may be required to pay the requisite tax (such as stamp duties) and other penalties .
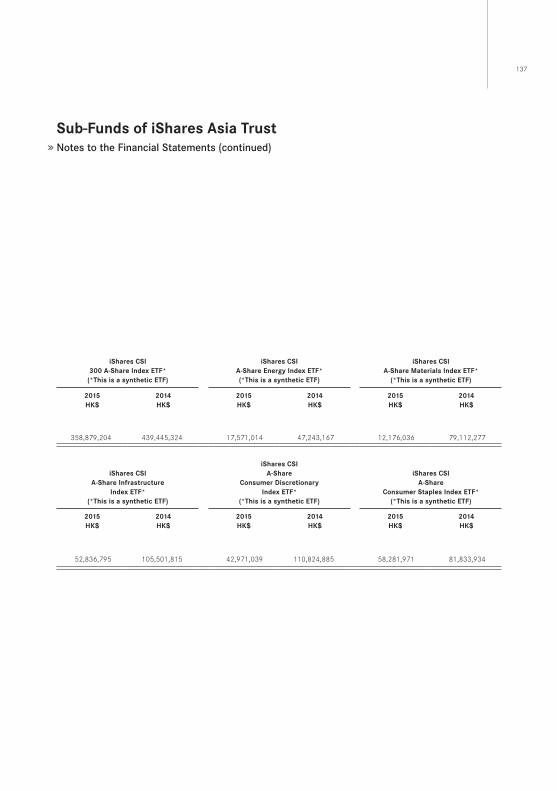
137
Sub-funds of iShares Asia TrustNotes to the Financial Statements (continued)
The Manager mitigates the counterparty risk associated with the Sub-Funds by transacting through a number of CAAP Issuers . In addition, since 31st October 2011, the Manager has entered into securities lending arrangements with the CAAP Issuers or their affiliates, i .e ., Barclays Bank PLC, Citigroup Global Markets Limited (“Citigroup”), CLSA Limited, Credit Suisse Securities (Europe) Limited (“Credit Suisse”), Goldman Sachs International, HSBC Bank plc, ING Bank N .V ., J .P . Morgan Securities plc, Macquarie Bank Ltd, Merrill Lynch International, Morgan Stanley & Co . International Plc, Nomura International plc, Standard Chartered Bank, The Royal Bank of Scotland PLC and UBS AG London Branch, in order to fully collateralize the Sub-Funds’ counterparty exposure to each CAAP Issuer .
Under the securities lending arrangements, the CAAP Issuers have agreed to provide share, fixed income or cash collateral to the Sub-Funds in respect of the CAAPs issued . The Sub-Funds will lend CAAPs to the CAAP Issuers in return for shares, fixed income or cash collateral . The purpose of the securities lending arrangement is to fully collateralize the counterparty exposures to each CAAP Issuer of the Sub-Funds .
The collateral and CAAPs are marked to market every day by the borrower or an affiliate of the borrower using the last traded price . The Manager may demand additional collateral to eliminate any deficiency . Likewise the borrower may demand the return of collateral to eliminate any excess .
The table below summarizes the fair value of the collateral held by the Sub-Funds as at 31st December:
iShares fTSeA50 China index eTf*
(*This is a synthetic eTf)
iShares CSi300 A-Share index eTf*
(*This is a synthetic eTf)
iShares CSiA-Share energy index eTf*(*This is a synthetic eTf)
iShares CSiA-Share Materials index eTf*
(*This is a synthetic eTf)
2015hK$
2014hK$
2015hK$
2014hK$
2015hK$
2014hK$
2015hK$
2014hK$
CollATERAl VAlUE 35,827,853,321 89,935,740,148 358,879,204 439,445,324 17,571,014 47,243,167 12,176,036 79,112,277
iShares CSi A-Share financials
index eTf* (*This is a synthetic eTf)
iShares CSi A-Share infrastructure
index eTf*(*This is a synthetic eTf)
iShares CSi A-Share
Consumer discretionary index eTf*
(*This is a synthetic eTf)
iShares CSi A-Share
Consumer Staples index eTf*(*This is a synthetic eTf)
2015hK$
2014hK$
2015hK$
2014hK$
2015hK$
2014hK$
2015hK$
2014hK$
CollATERAl VAlUE 124,645,390 290,878,131 52,836,795 105,501,815 42,971,039 110,824,885 58,281,971 81,833,934
The Sub-Funds pay a fee in respect of the collateral arrangements . The expenses incurred pursuant to the securities lending arrangements for the years ended 31st December 2015 and 2014 are disclosed in the Statement of Comprehensive Income .
Under the securities lending arrangements, both the lender and the borrower are obliged to pay and deliver any sum of money or property that the original owner would have been entitled including dividends and interest .
Collateral may involve risks including settlement, operational and realization risks . For example, collateral is subject to fluctuations in market value and the prices of subject securities may go down as well as up . The value of the collateral securities may be lower upon realization of the securities . In the case of collateral securities which are listed securities, the listing of such securities may be suspended or revoked or the trading of such securities on the stock exchanges may be suspended, and during the period of suspension or upon revocation, it may not be possible to realize the relevant collateral securities . While the Manager will endeavour to use a tax efficient arrangement in respect of any collateral, there is no guarantee that such arrangement will not be challenged by the tax authorities . If such arrangements are successfully challenged, the Sub-Funds may be required to pay the requisite tax (such as stamp duties) and other penalties .
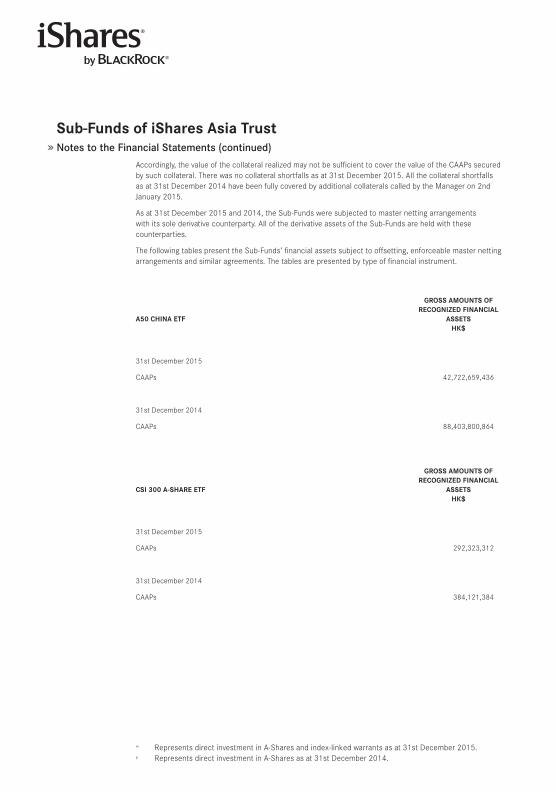
Sub-funds of iShares Asia TrustNotes to the Financial Statements (continued)
Accordingly, the value of the collateral realized may not be sufficient to cover the value of the CAAPs secured by such collateral . There was no collateral shortfalls as at 31st December 2015 . All the collateral shortfalls as at 31st December 2014 have been fully covered by additional collaterals called by the Manager on 2nd January 2015 .
As at 31st December 2015 and 2014, the Sub-Funds were subjected to master netting arrangements with its sole derivative counterparty . All of the derivative assets of the Sub-Funds are held with these counterparties .
The following tables present the Sub-Funds’ financial assets subject to offsetting, enforceable master netting arrangements and similar agreements . The tables are presented by type of financial instrument .
A50 ChinA eTf
gRoSS AMoUnTS of ReCognized finAnCiAl
ASSeTShK$
gRoSS AMoUnTS of ReCognized finAnCiAl
liABiliTieS SeT-off in The STATeMenT of finAnCiAl poSiTion
hK$
neT AMoUnTS of finAnCiAl ASSeTS pReSenTed in The
STATeMenT offinAnCiAl poSiTion
hK$
RelATed AMoUnTS noT SeT-off inThe STATeMenT of finAnCiAl poSiTion
neT AMoUnThK$
finAnCiAlinSTRUMenTS
hK$CollATeRAl
hK$
31st December 2015
CAAPs 42,722,659,436 – 42,722,659,436 12,781,411,542∞ 29,941,247,894 –
31st December 2014
CAAPs 88,403,800,864 – 88,403,800,864 11,002,050,203μ 77,375,087,034 26,663,627
CSi 300 A-ShARe eTf
gRoSS AMoUnTS of ReCognized finAnCiAl
ASSeTShK$
gRoSS AMoUnTS of ReCognized finAnCiAl
liABiliTieS SeT-off in The STATeMenT of finAnCiAl poSiTion
hK$
neT AMoUnTS of finAnCiAl ASSeTS pReSenTed in The
STATeMenT offinAnCiAl poSiTion
hK$
RelATed AMoUnTS noT SeT-off inThe STATeMenT of finAnCiAl poSiTion
neT AMoUnThK$
finAnCiAlinSTRUMenTS
hK$CollATeRAl
hK$
31st December 2015
CAAPs 292,323,312 – 292,323,312 – 292,323,312 –
31st December 2014
CAAPs 384,121,384 – 384,121,384 – 384,121,384 –
∞ Represents direct investment in A-Shares and index-linked warrants as at 31st December 2015 .μ Represents direct investment in A-Shares as at 31st December 2014 .
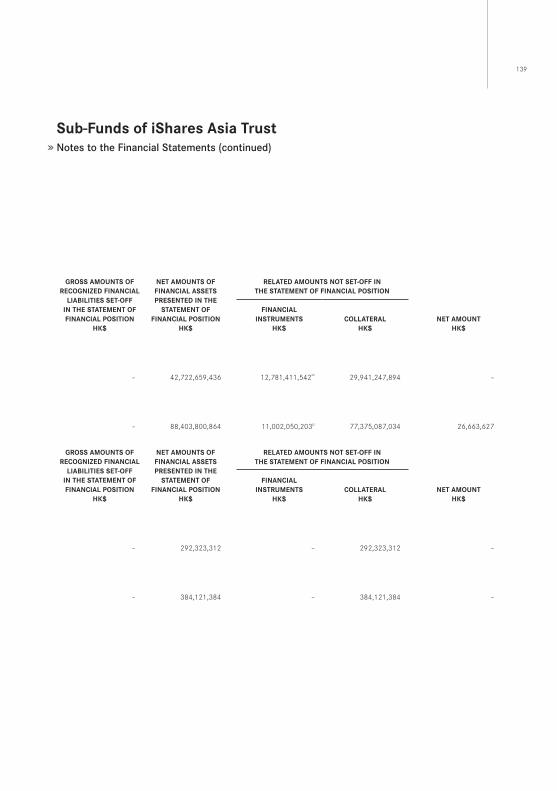
139
Sub-funds of iShares Asia TrustNotes to the Financial Statements (continued)
Accordingly, the value of the collateral realized may not be sufficient to cover the value of the CAAPs secured by such collateral . There was no collateral shortfalls as at 31st December 2015 . All the collateral shortfalls as at 31st December 2014 have been fully covered by additional collaterals called by the Manager on 2nd January 2015 .
As at 31st December 2015 and 2014, the Sub-Funds were subjected to master netting arrangements with its sole derivative counterparty . All of the derivative assets of the Sub-Funds are held with these counterparties .
The following tables present the Sub-Funds’ financial assets subject to offsetting, enforceable master netting arrangements and similar agreements . The tables are presented by type of financial instrument .
A50 ChinA eTf
gRoSS AMoUnTS of ReCognized finAnCiAl
ASSeTShK$
gRoSS AMoUnTS of ReCognized finAnCiAl
liABiliTieS SeT-off in The STATeMenT of finAnCiAl poSiTion
hK$
neT AMoUnTS of finAnCiAl ASSeTS pReSenTed in The
STATeMenT offinAnCiAl poSiTion
hK$
RelATed AMoUnTS noT SeT-off inThe STATeMenT of finAnCiAl poSiTion
neT AMoUnThK$
finAnCiAlinSTRUMenTS
hK$CollATeRAl
hK$
31st December 2015
CAAPs 42,722,659,436 – 42,722,659,436 12,781,411,542∞ 29,941,247,894 –
31st December 2014
CAAPs 88,403,800,864 – 88,403,800,864 11,002,050,203μ 77,375,087,034 26,663,627
CSi 300 A-ShARe eTf
gRoSS AMoUnTS of ReCognized finAnCiAl
ASSeTShK$
gRoSS AMoUnTS of ReCognized finAnCiAl
liABiliTieS SeT-off in The STATeMenT of finAnCiAl poSiTion
hK$
neT AMoUnTS of finAnCiAl ASSeTS pReSenTed in The
STATeMenT offinAnCiAl poSiTion
hK$
RelATed AMoUnTS noT SeT-off inThe STATeMenT of finAnCiAl poSiTion
neT AMoUnThK$
finAnCiAlinSTRUMenTS
hK$CollATeRAl
hK$
31st December 2015
CAAPs 292,323,312 – 292,323,312 – 292,323,312 –
31st December 2014
CAAPs 384,121,384 – 384,121,384 – 384,121,384 –
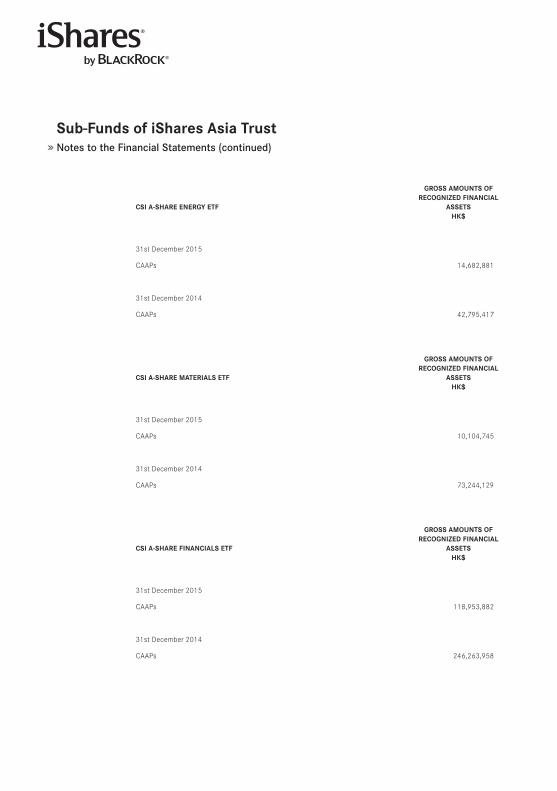
Sub-funds of iShares Asia TrustNotes to the Financial Statements (continued)
CSi A-ShARe eneRgY eTf
gRoSS AMoUnTS of ReCognized finAnCiAl
ASSeTShK$
gRoSS AMoUnTS of ReCognized finAnCiAl
liABiliTieS SeT-off in The STATeMenT of finAnCiAl poSiTion
hK$
neT AMoUnTS of finAnCiAl ASSeTS pReSenTed in The
STATeMenT offinAnCiAl poSiTion
hK$
RelATed AMoUnTS noT SeT-off inThe STATeMenT of finAnCiAl poSiTion
neT AMoUnThK$
finAnCiAlinSTRUMenTS
hK$CollATeRAl
hK$
31st December 2015
CAAPs 14,682,881 – 14,682,881 – 14,682,881 –
31st December 2014
CAAPs 42,795,417 – 42,795,417 – 42,795,417 –
CSi A-ShARe MATeRiAlS eTf
gRoSS AMoUnTS of ReCognized finAnCiAl
ASSeTShK$
gRoSS AMoUnTS of ReCognized finAnCiAl
liABiliTieS SeT-off in The STATeMenT of finAnCiAl poSiTion
hK$
neT AMoUnTS of finAnCiAl ASSeTS pReSenTed in The
STATeMenT offinAnCiAl poSiTion
hK$
RelATed AMoUnTS noT SeT-off inThe STATeMenT of finAnCiAl poSiTion
neT AMoUnThK$
finAnCiAlinSTRUMenTS
hK$CollATeRAl
hK$
31st December 2015
CAAPs 10,104,745 – 10,104,745 – 10,104,745 –
31st December 2014
CAAPs 73,244,129 – 73,244,129 – 73,244,129 –
CSi A-ShARe finAnCiAlS eTf
gRoSS AMoUnTS of ReCognized finAnCiAl
ASSeTShK$
gRoSS AMoUnTS of ReCognized finAnCiAl
liABiliTieS SeT-off in The STATeMenT of finAnCiAl poSiTion
hK$
neT AMoUnTS of finAnCiAl ASSeTS pReSenTed in The
STATeMenT offinAnCiAl poSiTion
hK$
RelATed AMoUnTS noT SeT-off inThe STATeMenT of finAnCiAl poSiTion
neT AMoUnThK$
finAnCiAlinSTRUMenTS
hK$CollATeRAl
hK$
31st December 2015
CAAPs 118,953,882 – 118,953,882 – 118,953,882 –
31st December 2014
CAAPs 246,263,958 – 246,263,958 – 246,262,964 994
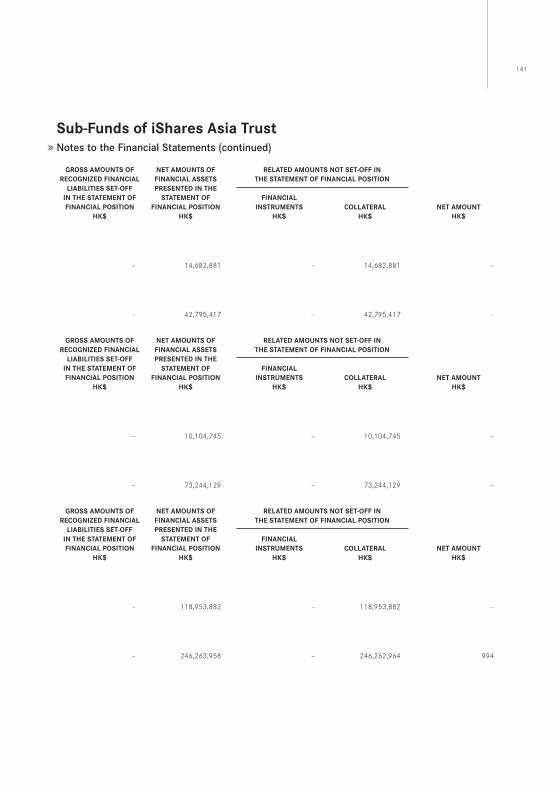
141
Sub-funds of iShares Asia TrustNotes to the Financial Statements (continued)
CSi A-ShARe eneRgY eTf
gRoSS AMoUnTS of ReCognized finAnCiAl
ASSeTShK$
gRoSS AMoUnTS of ReCognized finAnCiAl
liABiliTieS SeT-off in The STATeMenT of finAnCiAl poSiTion
hK$
neT AMoUnTS of finAnCiAl ASSeTS pReSenTed in The
STATeMenT offinAnCiAl poSiTion
hK$
RelATed AMoUnTS noT SeT-off inThe STATeMenT of finAnCiAl poSiTion
neT AMoUnThK$
finAnCiAlinSTRUMenTS
hK$CollATeRAl
hK$
31st December 2015
CAAPs 14,682,881 – 14,682,881 – 14,682,881 –
31st December 2014
CAAPs 42,795,417 – 42,795,417 – 42,795,417 –
CSi A-ShARe MATeRiAlS eTf
gRoSS AMoUnTS of ReCognized finAnCiAl
ASSeTShK$
gRoSS AMoUnTS of ReCognized finAnCiAl
liABiliTieS SeT-off in The STATeMenT of finAnCiAl poSiTion
hK$
neT AMoUnTS of finAnCiAl ASSeTS pReSenTed in The
STATeMenT offinAnCiAl poSiTion
hK$
RelATed AMoUnTS noT SeT-off inThe STATeMenT of finAnCiAl poSiTion
neT AMoUnThK$
finAnCiAlinSTRUMenTS
hK$CollATeRAl
hK$
31st December 2015
CAAPs 10,104,745 – 10,104,745 – 10,104,745 –
31st December 2014
CAAPs 73,244,129 – 73,244,129 – 73,244,129 –
CSi A-ShARe finAnCiAlS eTf
gRoSS AMoUnTS of ReCognized finAnCiAl
ASSeTShK$
gRoSS AMoUnTS of ReCognized finAnCiAl
liABiliTieS SeT-off in The STATeMenT of finAnCiAl poSiTion
hK$
neT AMoUnTS of finAnCiAl ASSeTS pReSenTed in The
STATeMenT offinAnCiAl poSiTion
hK$
RelATed AMoUnTS noT SeT-off inThe STATeMenT of finAnCiAl poSiTion
neT AMoUnThK$
finAnCiAlinSTRUMenTS
hK$CollATeRAl
hK$
31st December 2015
CAAPs 118,953,882 – 118,953,882 – 118,953,882 –
31st December 2014
CAAPs 246,263,958 – 246,263,958 – 246,262,964 994
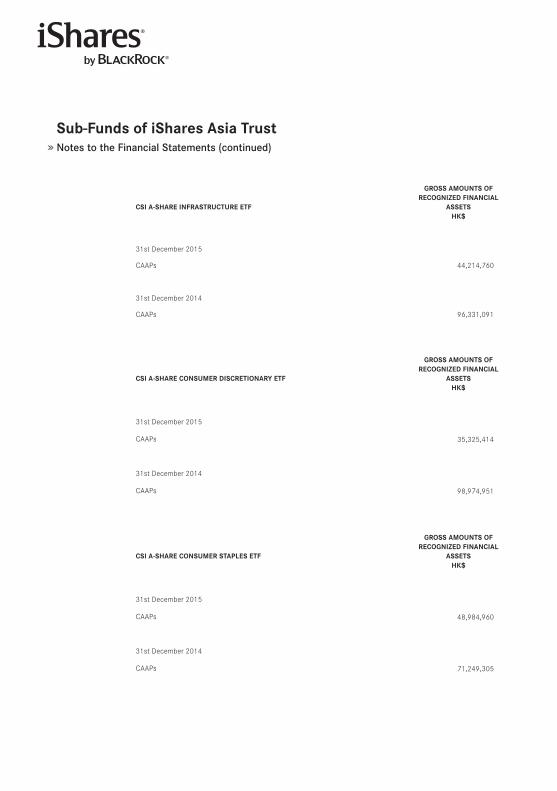
Sub-funds of iShares Asia TrustNotes to the Financial Statements (continued)
CSi A-ShARe infRASTRUCTURe eTf
gRoSS AMoUnTS of ReCognized finAnCiAl
ASSeTShK$
gRoSS AMoUnTS of ReCognized finAnCiAl
liABiliTieS SeT-off in The STATeMenT of finAnCiAl poSiTion
hK$
neT AMoUnTS of finAnCiAl ASSeTS pReSenTed in The
STATeMenT offinAnCiAl poSiTion
hK$
RelATed AMoUnTS noT SeT-off inThe STATeMenT of finAnCiAl poSiTion
neT AMoUnThK$
finAnCiAlinSTRUMenTS
hK$CollATeRAl
hK$
31st December 2015
CAAPs 44,214,760 – 44,214,760 – 44,214,760 –
31st December 2014
CAAPs 96,331,091 – 96,331,091 – 96,331,091 –
CSi A-ShARe ConSUMeR diSCReTionARY eTf
gRoSS AMoUnTS of ReCognized finAnCiAl
ASSeTShK$
gRoSS AMoUnTS of ReCognized finAnCiAl
liABiliTieS SeT-off in The STATeMenT of finAnCiAl poSiTion
hK$
neT AMoUnTS of finAnCiAl ASSeTS pReSenTed in The
STATeMenT offinAnCiAl poSiTion
hK$
RelATed AMoUnTS noT SeT-off inThe STATeMenT of finAnCiAl poSiTion
neT AMoUnThK$
finAnCiAlinSTRUMenTS
hK$CollATeRAl
hK$
31st December 2015
CAAPs 35,325,414 – 35,325,414 – 35,325,414 –
31st December 2014
CAAPs 98,974,951 – 98,974,951 – 98,974,951 –
CSi A-ShARe ConSUMeR STApleS eTf
gRoSS AMoUnTS of ReCognized finAnCiAl
ASSeTShK$
gRoSS AMoUnTS of ReCognized finAnCiAl
liABiliTieS SeT-off in The STATeMenT of finAnCiAl poSiTion
hK$
neT AMoUnTS of finAnCiAl ASSeTS pReSenTed in The
STATeMenT offinAnCiAl poSiTion
hK$
RelATed AMoUnTS noT SeT-off inThe STATeMenT of finAnCiAl poSiTion
neT AMoUnThK$
finAnCiAlinSTRUMenTS
hK$CollATeRAl
hK$
31st December 2015
CAAPs 48,984,960 – 48,984,960 – 48,984,960 –
31st December 2014
CAAPs 71,249,305 – 71,249,305 – 71,249,305 –

143
Sub-funds of iShares Asia TrustNotes to the Financial Statements (continued)
CSi A-ShARe infRASTRUCTURe eTf
gRoSS AMoUnTS of ReCognized finAnCiAl
ASSeTShK$
gRoSS AMoUnTS of ReCognized finAnCiAl
liABiliTieS SeT-off in The STATeMenT of finAnCiAl poSiTion
hK$
neT AMoUnTS of finAnCiAl ASSeTS pReSenTed in The
STATeMenT offinAnCiAl poSiTion
hK$
RelATed AMoUnTS noT SeT-off inThe STATeMenT of finAnCiAl poSiTion
neT AMoUnThK$
finAnCiAlinSTRUMenTS
hK$CollATeRAl
hK$
31st December 2015
CAAPs 44,214,760 – 44,214,760 – 44,214,760 –
31st December 2014
CAAPs 96,331,091 – 96,331,091 – 96,331,091 –
CSi A-ShARe ConSUMeR diSCReTionARY eTf
gRoSS AMoUnTS of ReCognized finAnCiAl
ASSeTShK$
gRoSS AMoUnTS of ReCognized finAnCiAl
liABiliTieS SeT-off in The STATeMenT of finAnCiAl poSiTion
hK$
neT AMoUnTS of finAnCiAl ASSeTS pReSenTed in The
STATeMenT offinAnCiAl poSiTion
hK$
RelATed AMoUnTS noT SeT-off inThe STATeMenT of finAnCiAl poSiTion
neT AMoUnThK$
finAnCiAlinSTRUMenTS
hK$CollATeRAl
hK$
31st December 2015
CAAPs 35,325,414 – 35,325,414 – 35,325,414 –
31st December 2014
CAAPs 98,974,951 – 98,974,951 – 98,974,951 –
CSi A-ShARe ConSUMeR STApleS eTf
gRoSS AMoUnTS of ReCognized finAnCiAl
ASSeTShK$
gRoSS AMoUnTS of ReCognized finAnCiAl
liABiliTieS SeT-off in The STATeMenT of finAnCiAl poSiTion
hK$
neT AMoUnTS of finAnCiAl ASSeTS pReSenTed in The
STATeMenT offinAnCiAl poSiTion
hK$
RelATed AMoUnTS noT SeT-off inThe STATeMenT of finAnCiAl poSiTion
neT AMoUnThK$
finAnCiAlinSTRUMenTS
hK$CollATeRAl
hK$
31st December 2015
CAAPs 48,984,960 – 48,984,960 – 48,984,960 –
31st December 2014
CAAPs 71,249,305 – 71,249,305 – 71,249,305 –
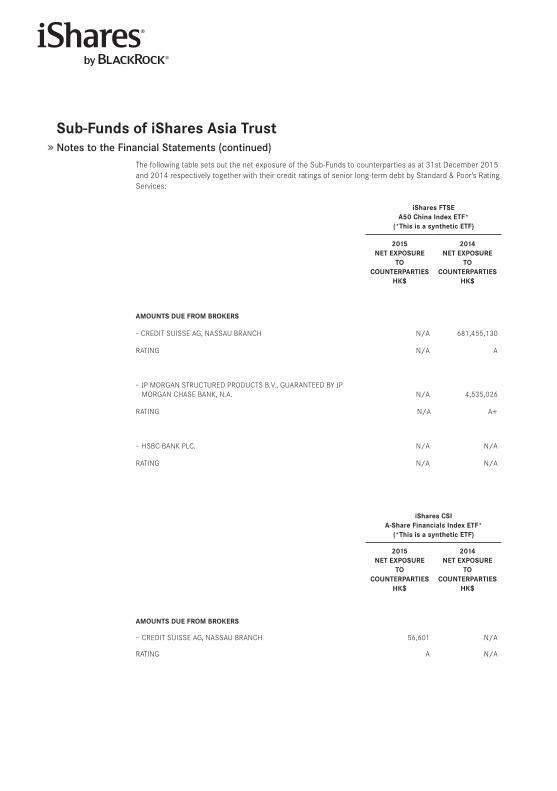
Sub-funds of iShares Asia TrustNotes to the Financial Statements (continued)
The following table sets out the net exposure of the Sub-Funds to counterparties as at 31st December 2015 and 2014 respectively together with their credit ratings of senior long-term debt by Standard & Poor’s Rating Services:
iShares fTSe A50 China index eTf*
(*This is a synthetic eTf)
iShares CSi 300 A-Share index eTf*
(*This is a synthetic eTf)
iShares CSi A-Share energy index eTf* (*This is a synthetic eTf)
iShares CSi A-Share Materials index eTf*
(*This is a synthetic eTf)
2015 neT eXpoSURe
To CoUnTeRpARTieS
hK$
2014 neT eXpoSURe
To CoUnTeRpARTieS
hK$
2015 neT eXpoSURe
ToCoUnTeRpARTieS
hK$
2014 neT eXpoSURe
ToCoUnTeRpARTieS
hK$
2015 neT eXpoSURe
ToCoUnTeRpARTieS
hK$
2014 neT eXpoSURe
ToCoUnTeRpARTieS
hK$
2015 neT eXpoSURe
ToCoUnTeRpARTieS
hK$
2014 neT eXpoSURe
ToCoUnTeRpARTieS
hK$
AMoUnTS dUe fRoM BRoKeRS
– CREDIT SUISSE AG, NASSAU BRANCH N/A 681,455,130 N/A N/A N/A N/A N/A N/A
RATING N/A A N/A N/A N/A N/A N/A N/A
– JP MORGAN STRUCTURED PRODUCTS B .V ., GUARANTEED BY JP MORGAN CHASE BANK, N .A . N/A 4,535,026 N/A N/A N/A N/A N/A N/A
RATING N/A A+ N/A N/A N/A N/A N/A N/A
– HSBC BANK PLC . N/A N/A N/A N/A N/A N/A 48,199 N/A
RATING N/A N/A N/A N/A N/A N/A AA- N/A
iShares CSiA-Share financials index eTf*
(*This is a synthetic eTf)
iShares CSiA-Share infrastructure index eTf*
(*This is a synthetic eTf)
iShares CSi A-ShareConsumer discretionary index eTf*
(*This is a synthetic eTf)
iShares CSiA-Share Consumer Staples index eTf*
(*This is a synthetic eTf)
2015 neT eXpoSURe
ToCoUnTeRpARTieS
hK$
2014 neT eXpoSURe
ToCoUnTeRpARTieS
hK$
2015 neT eXpoSURe
ToCoUnTeRpARTieS
hK$
2014 neT eXpoSURe
ToCoUnTeRpARTieS
hK$
2015 neT eXpoSURe
ToCoUnTeRpARTieS
hK$
2014 neT eXpoSURe
ToCoUnTeRpARTieS
hK$
2015 neT eXpoSURe
ToCoUnTeRpARTieS
hK$
2014 neT eXpoSURe
ToCoUnTeRpARTieS
hK$
AMoUnTS dUe fRoM BRoKeRS
– CREDIT SUISSE AG, NASSAU BRANCH 56,601 N/A N/A 311,064 N/A N/A N/A N/A
RATING A N/A N/A A N/A N/A N/A N/A
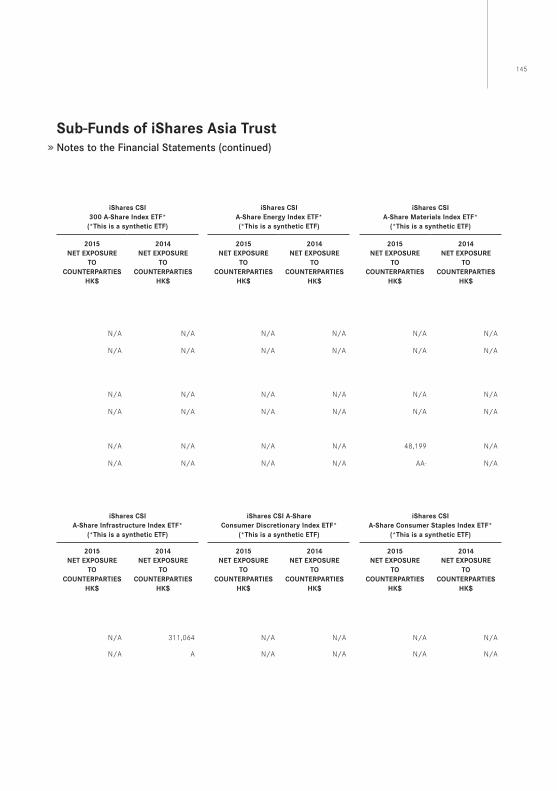
145
Sub-funds of iShares Asia TrustNotes to the Financial Statements (continued)
The following table sets out the net exposure of the Sub-Funds to counterparties as at 31st December 2015 and 2014 respectively together with their credit ratings of senior long-term debt by Standard & Poor’s Rating Services:
iShares fTSe A50 China index eTf*
(*This is a synthetic eTf)
iShares CSi 300 A-Share index eTf*
(*This is a synthetic eTf)
iShares CSi A-Share energy index eTf* (*This is a synthetic eTf)
iShares CSi A-Share Materials index eTf*
(*This is a synthetic eTf)
2015 neT eXpoSURe
To CoUnTeRpARTieS
hK$
2014 neT eXpoSURe
To CoUnTeRpARTieS
hK$
2015 neT eXpoSURe
ToCoUnTeRpARTieS
hK$
2014 neT eXpoSURe
ToCoUnTeRpARTieS
hK$
2015 neT eXpoSURe
ToCoUnTeRpARTieS
hK$
2014 neT eXpoSURe
ToCoUnTeRpARTieS
hK$
2015 neT eXpoSURe
ToCoUnTeRpARTieS
hK$
2014 neT eXpoSURe
ToCoUnTeRpARTieS
hK$
AMoUnTS dUe fRoM BRoKeRS
– CREDIT SUISSE AG, NASSAU BRANCH N/A 681,455,130 N/A N/A N/A N/A N/A N/A
RATING N/A A N/A N/A N/A N/A N/A N/A
– JP MORGAN STRUCTURED PRODUCTS B .V ., GUARANTEED BY JP MORGAN CHASE BANK, N .A . N/A 4,535,026 N/A N/A N/A N/A N/A N/A
RATING N/A A+ N/A N/A N/A N/A N/A N/A
– HSBC BANK PLC . N/A N/A N/A N/A N/A N/A 48,199 N/A
RATING N/A N/A N/A N/A N/A N/A AA- N/A
iShares CSiA-Share financials index eTf*
(*This is a synthetic eTf)
iShares CSiA-Share infrastructure index eTf*
(*This is a synthetic eTf)
iShares CSi A-ShareConsumer discretionary index eTf*
(*This is a synthetic eTf)
iShares CSiA-Share Consumer Staples index eTf*
(*This is a synthetic eTf)
2015 neT eXpoSURe
ToCoUnTeRpARTieS
hK$
2014 neT eXpoSURe
ToCoUnTeRpARTieS
hK$
2015 neT eXpoSURe
ToCoUnTeRpARTieS
hK$
2014 neT eXpoSURe
ToCoUnTeRpARTieS
hK$
2015 neT eXpoSURe
ToCoUnTeRpARTieS
hK$
2014 neT eXpoSURe
ToCoUnTeRpARTieS
hK$
2015 neT eXpoSURe
ToCoUnTeRpARTieS
hK$
2014 neT eXpoSURe
ToCoUnTeRpARTieS
hK$
AMoUnTS dUe fRoM BRoKeRS
– CREDIT SUISSE AG, NASSAU BRANCH 56,601 N/A N/A 311,064 N/A N/A N/A N/A
RATING A N/A N/A A N/A N/A N/A N/A
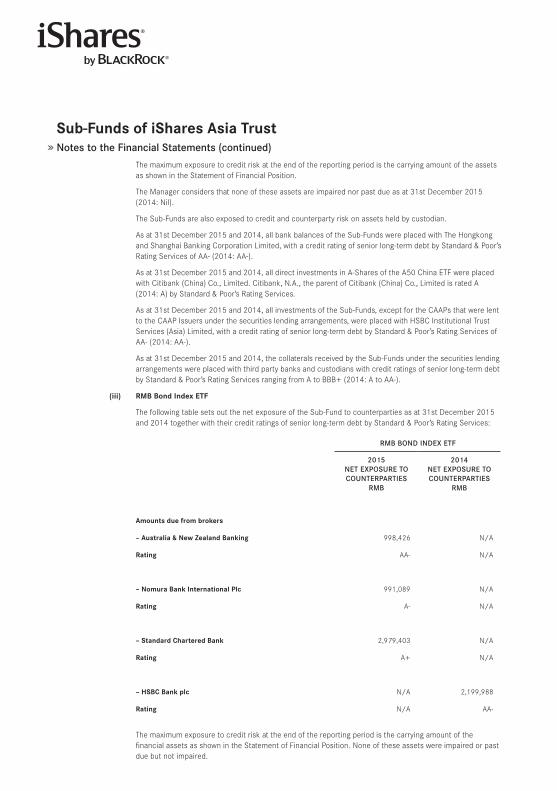
Sub-funds of iShares Asia TrustNotes to the Financial Statements (continued)
The maximum exposure to credit risk at the end of the reporting period is the carrying amount of the assets as shown in the Statement of Financial Position .
The Manager considers that none of these assets are impaired nor past due as at 31st December 2015 (2014: Nil) .
The Sub-Funds are also exposed to credit and counterparty risk on assets held by custodian .
As at 31st December 2015 and 2014, all bank balances of the Sub-Funds were placed with The Hongkong and Shanghai Banking Corporation Limited, with a credit rating of senior long-term debt by Standard & Poor’s Rating Services of AA- (2014: AA-) .
As at 31st December 2015 and 2014, all direct investments in A-Shares of the A50 China ETF were placed with Citibank (China) Co ., Limited . Citibank, N .A ., the parent of Citibank (China) Co ., Limited is rated A (2014: A) by Standard & Poor’s Rating Services .
As at 31st December 2015 and 2014, all investments of the Sub-Funds, except for the CAAPs that were lent to the CAAP Issuers under the securities lending arrangements, were placed with HSBC Institutional Trust Services (Asia) Limited, with a credit rating of senior long-term debt by Standard & Poor’s Rating Services of AA- (2014: AA-) .
As at 31st December 2015 and 2014, the collaterals received by the Sub-Funds under the securities lending arrangements were placed with third party banks and custodians with credit ratings of senior long-term debt by Standard & Poor’s Rating Services ranging from A to BBB+ (2014: A to AA-) .
(iii) RMB Bond index eTf
The following table sets out the net exposure of the Sub-Fund to counterparties as at 31st December 2015 and 2014 together with their credit ratings of senior long-term debt by Standard & Poor’s Rating Services:
RMB BoND INDEX ETF
2015NET EXPoSURE ToCoUNTERPARTIES
RMB
2014NET EXPoSURE ToCoUNTERPARTIES
RMB
Amounts due from brokers
– Australia & new zealand Banking 998,426 N/A
Rating AA- N/A
– nomura Bank international plc 991,089 N/A
Rating A- N/A
– Standard Chartered Bank 2,979,403 N/A
Rating A+ N/A
– hSBC Bank plc N/A 2,199,988
Rating N/A AA-
The maximum exposure to credit risk at the end of the reporting period is the carrying amount of the financial assets as shown in the Statement of Financial Position . None of these assets were impaired or past due but not impaired .
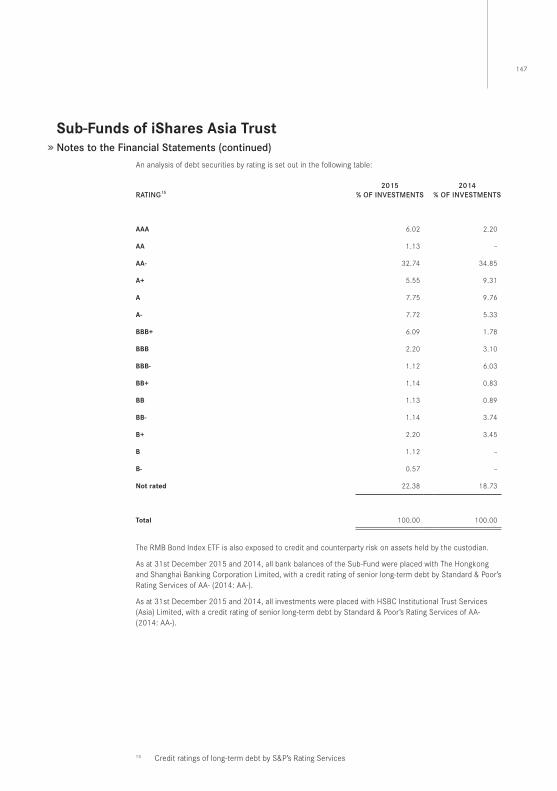
147
Sub-funds of iShares Asia TrustNotes to the Financial Statements (continued)
An analysis of debt securities by rating is set out in the following table:
RATINg152015
% oF INVESTMENTS2014
% oF INVESTMENTS
AAA 6 .02 2 .20
AA 1 .13 –
AA- 32 .74 34 .85
A+ 5 .55 9 .31
A 7 .75 9 .76
A- 7 .72 5 .33
BBB+ 6 .09 1 .78
BBB 2 .20 3 .10
BBB- 1 .12 6 .03
BB+ 1 .14 0 .83
BB 1 .13 0 .89
BB- 1 .14 3 .74
B+ 2 .20 3 .45
B 1 .12 –
B- 0 .57 –
not rated 22 .38 18 .73
Total 100 .00 100 .00
The RMB Bond Index ETF is also exposed to credit and counterparty risk on assets held by the custodian .
As at 31st December 2015 and 2014, all bank balances of the Sub-Fund were placed with The Hongkong and Shanghai Banking Corporation Limited, with a credit rating of senior long-term debt by Standard & Poor’s Rating Services of AA- (2014: AA-) .
As at 31st December 2015 and 2014, all investments were placed with HSBC Institutional Trust Services (Asia) Limited, with a credit rating of senior long-term debt by Standard & Poor’s Rating Services of AA- (2014: AA-) .
15 Credit ratings of long-term debt by S&P’s Rating Services
Sub-funds of iShares Asia TrustNotes to the Financial Statements (continued)
(c) liquidity Risk
Liquidity risk is the risk that the Sub-Funds may not be able to generate sufficient cash resources to settle their obligations in full as they fall due or can only do so on terms that are materially disadvantageous .
As at 31st December 2015 and 2014, all of the Sub-Funds’ financial liabilities are due within twelve months and therefore equal their carrying balances, as the impact of discounting is not significant . As at 31st December 2015 and 2014, each Sub-Fund held financial assets at fair value through profit or loss and other liquid assets as stated in the Statement of Financial Position that are expected to readily generate cash inflows, normally within one month, for managing liquidity risk .
The RMB Bond Index ETF invests in Renminbi (“RMB”) denominated and settled bonds that are issued outside of mainland China . The Sub-Fund invests in securities that the Manager expects to be able to maintain continuous monitoring of forecast and actual cash flows and match the maturity profiles of financial assets and liabilities .
Each of the MSCI China ETF, MSCI AC Asia ex Japan ETF (formerly known as MSCI Asia APEX 50 ETF) and MSCI Emerging Asia ETF invest the majority of their assets in investments that are traded in active markets and can be readily disposed of .
The A50 China ETF, CSI 300 A-Share ETF, CSI A-Share Energy ETF, CSI A-Share Materials ETF, CSI A-Share Financials ETF, CSI A-Share Infrastructure ETF, CSI A-Share Consumer Discretionary ETF and CSI A-Share Consumer Staples ETF hold CAAPs which do not have an active market . However, transactions with participating dealers are generally in-kind and where a participating dealer subscribes or redeems in cash, such transactions would be effected with a CAAP Issuer nominated by the participating dealer .
The SENSEX India ETF invests the majority of its assets, through the Mauritius Subsidiary, in investments that are traded in an active market and can be readily disposed of, but may hold up to 15% of its net asset value in IAPs which do not have an active market . However, where a participating dealer subscribes or redeems in cash, such transactions would be effected with an IAP Issuer nominated by the participating dealer . For the years and as of 31st December 2015 and 2014, the SENSEX India ETF did not hold any IAPs .
(d) fair Value estimation
The fair value of investments traded in active markets (such as publicly traded derivatives and trading securities) are based on quoted market prices at the close of trading on the reporting date . Investments that are listed or traded on an exchange are fair valued based on the last traded market prices .
An active market is a market in which transactions for the asset or liability take place with sufficient frequency and volume to provide pricing information on an ongoing basis .
As at 31st December 2015, 100% (2014: 100%) of the financial assets at fair value through profit or loss relate to the SENSEX India ETF’s investment in the Mauritius Subsidiary that has been fair valued in accordance with the policies set out in note 2(d) . The shares of the Mauritius Subsidiary are not publicly traded; redemptions can only be made by the SENSEX India ETF on the redemption dates as specified in the offering document . As a result, the carrying value of the Mauritius Subsidiary may not be indicative of the value ultimately realized on redemption .
The fair value of the investment in Mauritius Subsidiary is primarily based on the latest net asset value of the Mauritius Subsidiary’s participating shares as reported by its administrator . The SENSEX India ETF may make adjustments to the value based on considerations such as; liquidity of the SENSEX India ETF’s holding in the Mauritius Subsidiary or its underlying investments .
IFRS 13 requires the Sub-Funds to classify their fair value measurements using a fair value hierarchy that reflects the significance of the inputs used in making the measurements . The fair value hierarchy has the following levels:
• Quoted prices (unadjusted) in active markets for identical assets or liabilities that the entity can access at the measurement date (level 1) .
• Inputs other than quoted prices included within level 1 that are observable for the asset or liability, either directly or indirectly (level 2) .
• Inputs for the asset or liability that are unobservable inputs (level 3) .
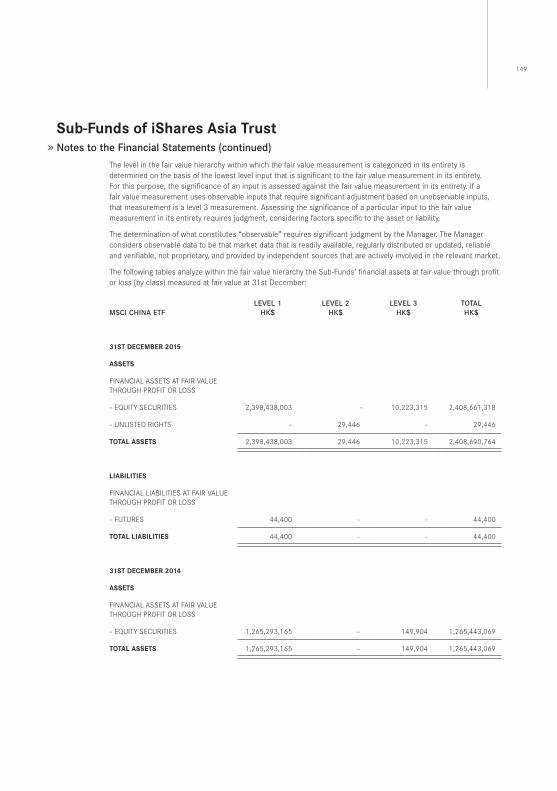
149
Sub-funds of iShares Asia TrustNotes to the Financial Statements (continued)
The level in the fair value hierarchy within which the fair value measurement is categorized in its entirety is determined on the basis of the lowest level input that is significant to the fair value measurement in its entirety . For this purpose, the significance of an input is assessed against the fair value measurement in its entirety . If a fair value measurement uses observable inputs that require significant adjustment based on unobservable inputs, that measurement is a level 3 measurement . Assessing the significance of a particular input to the fair value measurement in its entirety requires judgment, considering factors specific to the asset or liability .
The determination of what constitutes “observable” requires significant judgment by the Manager . The Manager considers observable data to be that market data that is readily available, regularly distributed or updated, reliable and verifiable, not proprietary, and provided by independent sources that are actively involved in the relevant market .
The following tables analyze within the fair value hierarchy the Sub-Funds’ financial assets at fair value through profit or loss (by class) measured at fair value at 31st December:
MSCI CHINA ETFlEVEl 1
HK$lEVEl 2
HK$lEVEl 3
HK$ToTAlHK$
31ST deCeMBeR 2015
ASSeTS
FINANCIAL ASSETS AT FAIR VALUE THROUGH PROFIT OR LOSS
– EQUITY SECURITIES 2,398,438,003 – 10,223,315 2,408,661,318
– UNLISTED RIGHTS – 29,446 – 29,446
ToTAl ASSeTS 2,398,438,003 29,446 10,223,315 2,408,690,764
liABiliTieS
FINANCIAL LIABILITIES AT FAIR VALUE THROUGH PROFIT OR LOSS
– FUTURES 44,400 – – 44,400
ToTAl liABiliTieS 44,400 – – 44,400
31ST deCeMBeR 2014
ASSeTS
FINANCIAL ASSETS AT FAIR VALUE THROUGH PROFIT OR LOSS
– EQUITY SECURITIES 1,265,293,165 – 149,904 1,265,443,069
ToTAl ASSeTS 1,265,293,165 – 149,904 1,265,443,069
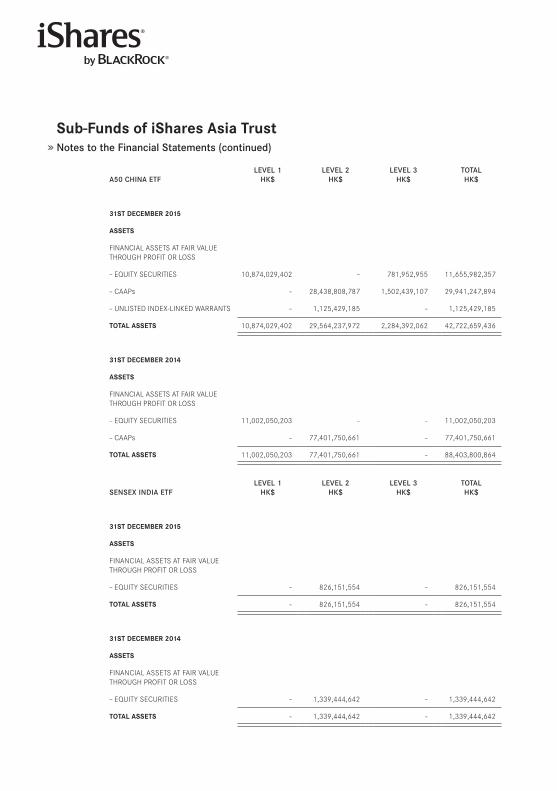
Sub-funds of iShares Asia TrustNotes to the Financial Statements (continued)
A50 CHINA ETFlEVEl 1
HK$lEVEl 2
HK$lEVEl 3
HK$ToTAlHK$
31ST deCeMBeR 2015
ASSeTS
FINANCIAL ASSETS AT FAIR VALUE THROUGH PROFIT OR LOSS
– EQUITY SECURITIES 10,874,029,402 – 781,952,955 11,655,982,357
– CAAPs – 28,438,808,787 1,502,439,107 29,941,247,894
– UNLISTED INDEX-LINKED WARRANTS – 1,125,429,185 – 1,125,429,185
ToTAl ASSeTS 10,874,029,402 29,564,237,972 2,284,392,062 42,722,659,436
31ST deCeMBeR 2014
ASSeTS
FINANCIAL ASSETS AT FAIR VALUE THROUGH PROFIT OR LOSS
– EQUITY SECURITIES 11,002,050,203 – – 11,002,050,203
– CAAPs – 77,401,750,661 – 77,401,750,661
ToTAl ASSeTS 11,002,050,203 77,401,750,661 – 88,403,800,864
SENSEX INDIA ETFlEVEl 1
HK$lEVEl 2
HK$lEVEl 3
HK$ToTAlHK$
31ST deCeMBeR 2015
ASSeTS
FINANCIAL ASSETS AT FAIR VALUE THROUGH PROFIT OR LOSS
– EQUITY SECURITIES – 826,151,554 – 826,151,554
ToTAl ASSeTS – 826,151,554 – 826,151,554
31ST deCeMBeR 2014
ASSeTS
FINANCIAL ASSETS AT FAIR VALUE THROUGH PROFIT OR LOSS
– EQUITY SECURITIES – 1,339,444,642 – 1,339,444,642
ToTAl ASSeTS – 1,339,444,642 – 1,339,444,642
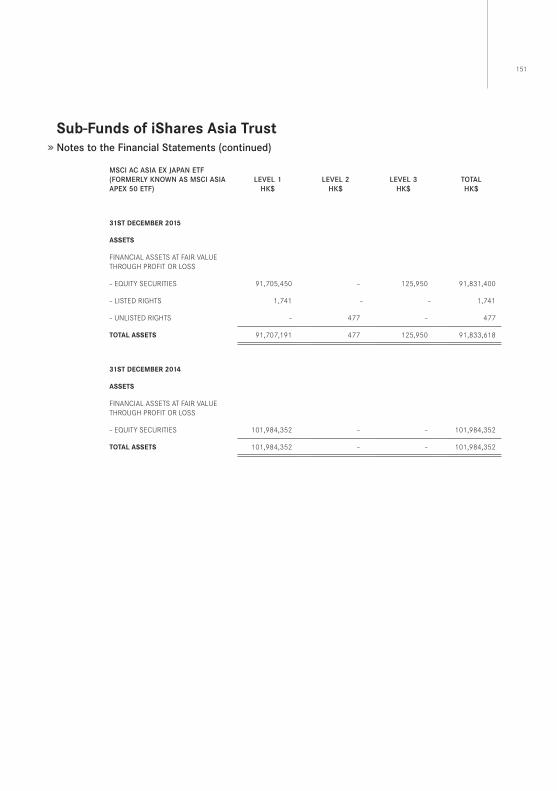
151
Sub-funds of iShares Asia TrustNotes to the Financial Statements (continued)
MSCI AC ASIA EX JAPAN ETF (FoRMERly KNowN AS MSCI ASIA APEX 50 ETF)
lEVEl 1HK$
lEVEl 2HK$
lEVEl 3HK$
ToTAlHK$
31ST deCeMBeR 2015
ASSeTS
FINANCIAL ASSETS AT FAIR VALUE THROUGH PROFIT OR LOSS
– EQUITY SECURITIES 91,705,450 – 125,950 91,831,400
– LISTED RIGHTS 1,741 – – 1,741
– UNLISTED RIGHTS – 477 – 477
ToTAl ASSeTS 91,707,191 477 125,950 91,833,618
31ST deCeMBeR 2014
ASSeTS
FINANCIAL ASSETS AT FAIR VALUE THROUGH PROFIT OR LOSS
– EQUITY SECURITIES 101,984,352 – – 101,984,352
ToTAl ASSeTS 101,984,352 – – 101,984,352
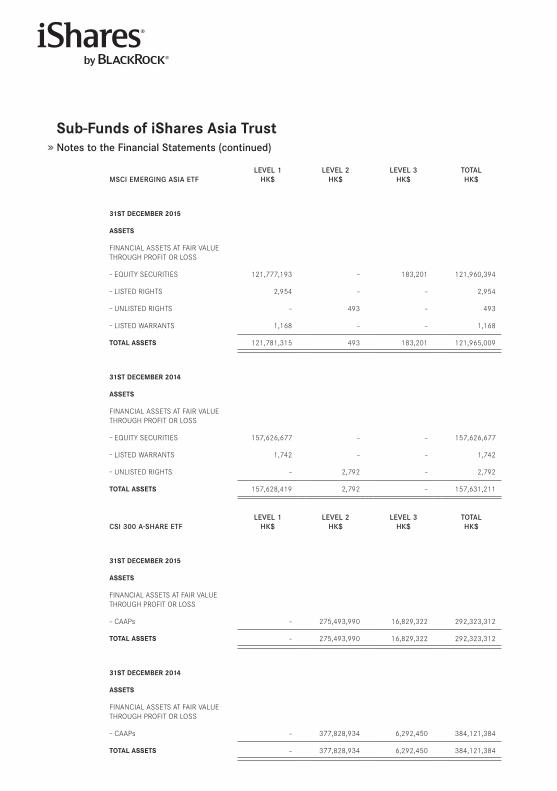
Sub-funds of iShares Asia TrustNotes to the Financial Statements (continued)
MSCI EMERgINg ASIA ETFlEVEl 1
HK$lEVEl 2
HK$lEVEl 3
HK$ToTAlHK$
31ST deCeMBeR 2015
ASSeTS
FINANCIAL ASSETS AT FAIR VALUE THROUGH PROFIT OR LOSS
– EQUITY SECURITIES 121,777,193 – 183,201 121,960,394
– LISTED RIGHTS 2,954 – – 2,954
– UNLISTED RIGHTS – 493 – 493
– LISTED WARRANTS 1,168 – – 1,168
ToTAl ASSeTS 121,781,315 493 183,201 121,965,009
31ST deCeMBeR 2014
ASSeTS
FINANCIAL ASSETS AT FAIR VALUE THROUGH PROFIT OR LOSS
– EQUITY SECURITIES 157,626,677 – – 157,626,677
– LISTED WARRANTS 1,742 – – 1,742
– UNLISTED RIGHTS – 2,792 – 2,792
ToTAl ASSeTS 157,628,419 2,792 – 157,631,211
CSI 300 A-SHARE ETFlEVEl 1
HK$lEVEl 2
HK$lEVEl 3
HK$ToTAlHK$
31ST deCeMBeR 2015
ASSeTS
FINANCIAL ASSETS AT FAIR VALUE THROUGH PROFIT OR LOSS
– CAAPs – 275,493,990 16,829,322 292,323,312
ToTAl ASSeTS – 275,493,990 16,829,322 292,323,312
31ST deCeMBeR 2014
ASSeTS
FINANCIAL ASSETS AT FAIR VALUE THROUGH PROFIT OR LOSS
– CAAPs – 377,828,934 6,292,450 384,121,384
ToTAl ASSeTS – 377,828,934 6,292,450 384,121,384
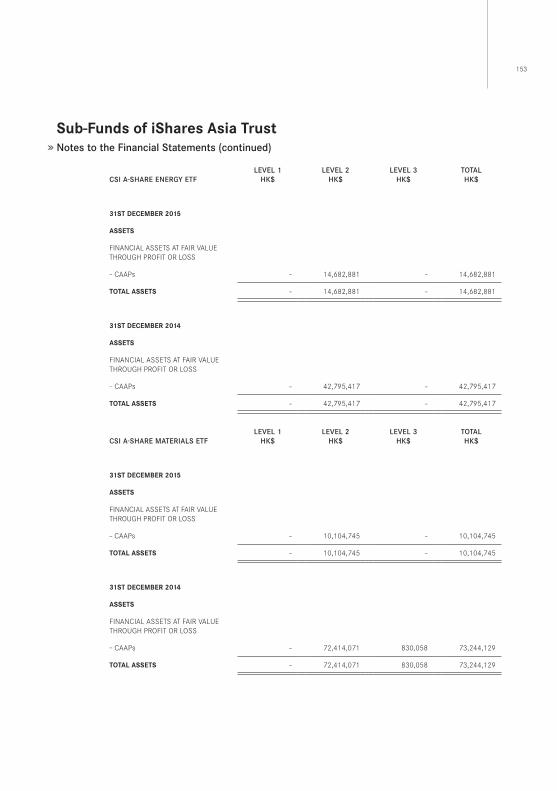
153
Sub-funds of iShares Asia TrustNotes to the Financial Statements (continued)
CSI A-SHARE ENERgy ETFlEVEl 1
HK$lEVEl 2
HK$lEVEl 3
HK$ToTAlHK$
31ST deCeMBeR 2015
ASSeTS
FINANCIAL ASSETS AT FAIR VALUE THROUGH PROFIT OR LOSS
– CAAPs – 14,682,881 – 14,682,881
ToTAl ASSeTS – 14,682,881 – 14,682,881
31ST deCeMBeR 2014
ASSeTS
FINANCIAL ASSETS AT FAIR VALUE THROUGH PROFIT OR LOSS
– CAAPs – 42,795,417 – 42,795,417
ToTAl ASSeTS – 42,795,417 – 42,795,417
CSI A-SHARE MATERIAlS ETFlEVEl 1
HK$lEVEl 2
HK$lEVEl 3
HK$ToTAlHK$
31ST deCeMBeR 2015
ASSeTS
FINANCIAL ASSETS AT FAIR VALUE THROUGH PROFIT OR LOSS
– CAAPs – 10,104,745 – 10,104,745
ToTAl ASSeTS – 10,104,745 – 10,104,745
31ST deCeMBeR 2014
ASSeTS
FINANCIAL ASSETS AT FAIR VALUE THROUGH PROFIT OR LOSS
– CAAPs – 72,414,071 830,058 73,244,129
ToTAl ASSeTS – 72,414,071 830,058 73,244,129
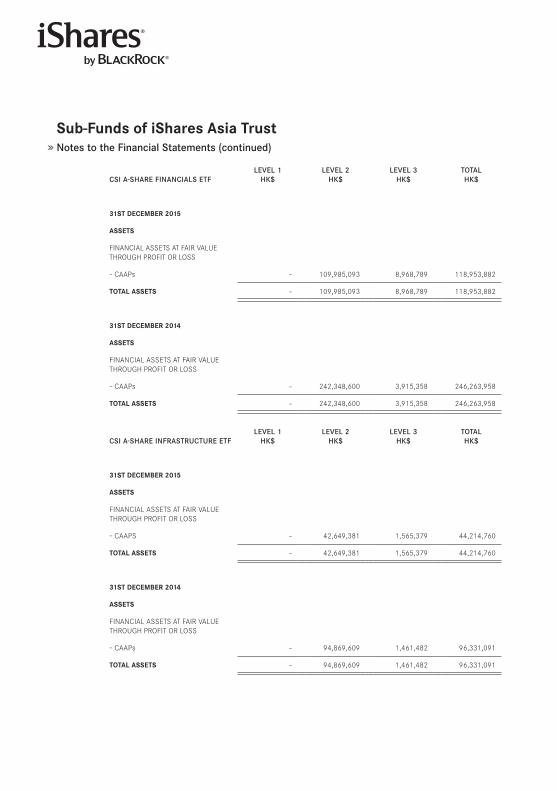
Sub-funds of iShares Asia TrustNotes to the Financial Statements (continued)
CSI A-SHARE FINANCIAlS ETFlEVEl 1
HK$lEVEl 2
HK$lEVEl 3
HK$ToTAlHK$
31ST deCeMBeR 2015
ASSeTS
FINANCIAL ASSETS AT FAIR VALUE THROUGH PROFIT OR LOSS
– CAAPs – 109,985,093 8,968,789 118,953,882
ToTAl ASSeTS – 109,985,093 8,968,789 118,953,882
31ST deCeMBeR 2014
ASSeTS
FINANCIAL ASSETS AT FAIR VALUE THROUGH PROFIT OR LOSS
– CAAPs – 242,348,600 3,915,358 246,263,958
ToTAl ASSeTS – 242,348,600 3,915,358 246,263,958
CSI A-SHARE INFRASTRUCTURE ETFlEVEl 1
HK$lEVEl 2
HK$lEVEl 3
HK$ToTAlHK$
31ST deCeMBeR 2015
ASSeTS
FINANCIAL ASSETS AT FAIR VALUE THROUGH PROFIT OR LOSS
– CAAPS – 42,649,381 1,565,379 44,214,760
ToTAl ASSeTS – 42,649,381 1,565,379 44,214,760
31ST deCeMBeR 2014
ASSeTS
FINANCIAL ASSETS AT FAIR VALUE THROUGH PROFIT OR LOSS
– CAAPs – 94,869,609 1,461,482 96,331,091
ToTAl ASSeTS – 94,869,609 1,461,482 96,331,091
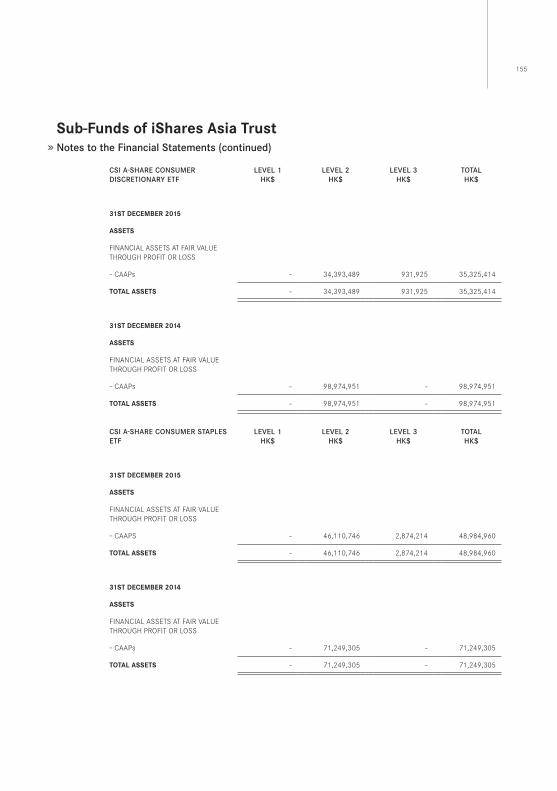
155
Sub-funds of iShares Asia TrustNotes to the Financial Statements (continued)
CSI A-SHARE CoNSUMER DISCRETIoNARy ETF
lEVEl 1HK$
lEVEl 2HK$
lEVEl 3HK$
ToTAlHK$
31ST deCeMBeR 2015
ASSeTS
FINANCIAL ASSETS AT FAIR VALUE THROUGH PROFIT OR LOSS
– CAAPs – 34,393,489 931,925 35,325,414
ToTAl ASSeTS – 34,393,489 931,925 35,325,414
31ST deCeMBeR 2014
ASSeTS
FINANCIAL ASSETS AT FAIR VALUE THROUGH PROFIT OR LOSS
– CAAPs – 98,974,951 – 98,974,951
ToTAl ASSeTS – 98,974,951 – 98,974,951
CSI A-SHARE CoNSUMER STAPlES ETF
lEVEl 1HK$
lEVEl 2HK$
lEVEl 3HK$
ToTAlHK$
31ST deCeMBeR 2015
ASSeTS
FINANCIAL ASSETS AT FAIR VALUE THROUGH PROFIT OR LOSS
– CAAPS – 46,110,746 2,874,214 48,984,960
ToTAl ASSeTS – 46,110,746 2,874,214 48,984,960
31ST deCeMBeR 2014
ASSeTS
FINANCIAL ASSETS AT FAIR VALUE THROUGH PROFIT OR LOSS
– CAAPs – 71,249,305 – 71,249,305
ToTAl ASSeTS – 71,249,305 – 71,249,305
Sub-funds of iShares Asia TrustNotes to the Financial Statements (continued)
RMB BoND INDEX ETFlEVEl 1
RMBlEVEl 2
RMBlEVEl 3
RMBToTAlRMB
31ST deCeMBeR 2015
ASSeTS
FINANCIAL ASSETS AT FAIR VALUE THROUGH PROFIT OR LOSS
– DEBT SECURITIES – 89,172,838 – 89,172,838
ToTAl ASSeTS – 89,172,838 – 89,172,838
31ST deCeMBeR 2014
ASSeTS
FINANCIAL ASSETS AT FAIR VALUE THROUGH PROFIT OR LOSS
– DEBT SECURITIES – 113,009,581 – 113,009,581
ToTAl ASSeTS – 113,009,581 – 113,009,581
Investments whose values are based on quoted market prices in active markets are classified within level 1 . The Sub-Funds do not adjust the quoted price for these instruments .
Investments that trade in markets that are not considered to be active but are valued based on quoted market prices, dealer quotations or alternative pricing sources supported by observable inputs are classified within level 2 . The Sub-Funds’ level 2 investments are mainly investment grade government or corporate bonds, CAAPs, unlisted index-linked warrants and rights .
As at 31st December 2015 and 2014, the SENSEX India ETF classified its investment in the Mauritius Subsidiary as level 2 within the fair value hierarchy, as the Manager believes the SENSEX India ETF could have redeemed its investment at the net asset value per share, as at the statement of financial position date . The investment was valued at fair value using the net asset value as reported by the Mauritius Subsidiary’s administrator .
Investments classified within level 3 have significant unobservable inputs, as they are infrequently traded . As at 31st December 2015, the level 3 investments consisted of equity securities held by the MSCI China ETF, A50 China ETF, MSCI AC Asia ex Japan ETF (formerly known as MSCI Asia APEX 50 ETF) and MSCI Emerging Asia ETF, priced using an external pricing source, that are suspended from trading . The level 3 investments held by the A50 China ETF, CSI 300 A-Share ETF, CSI A-Share Materials ETF, CSI A-Share Financials ETF, CSI A-Share Infrastructure ETF, CSI A-Share Consumer Discretionary ETF and CSI A-Share Consumer Staples ETF represent illiquid CAAPs .
Prior to the issuance of Circular 79 on 14th November 2014, the fair value of each CAAP was derived from the quoted market prices of the relevant underlying security, adjusted for the expected amount payable to the issuer in respect of potential capital gains tax . The valuation inputs for CAAPs were not therefore based on market observable inputs and resulted in level 3 classification . As a result of Circular 79, there is no adjustment to the fair value of the CAAPs held from 14th November 2014 onwards with respect to capital gains tax on gross unrealized gains and resulted in the reclassification to level 2 .
Level 3 valuations are reviewed monthly by the Manager’s valuation committee who evaluates the appropriateness of the valuation of the investments .
The following tables present the sensitivity analysis for the level 3 investments held by the Sub-Funds as at 31st December 2015 and 2014 .
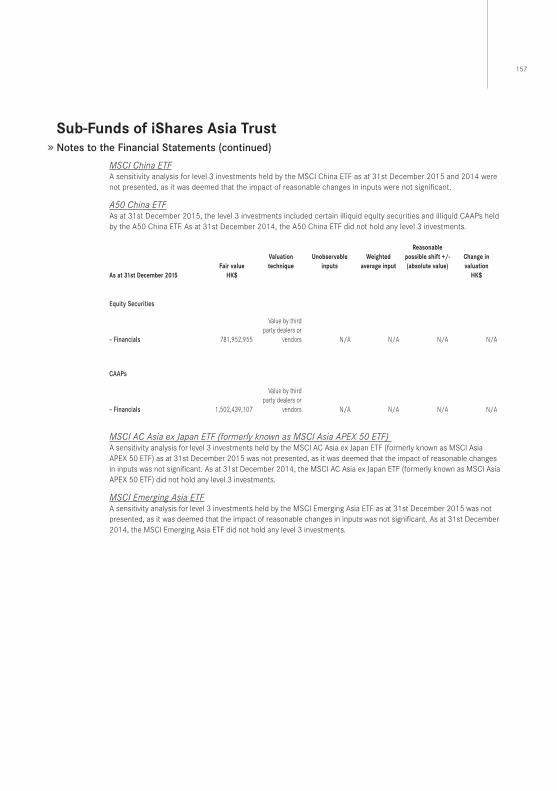
157
Sub-funds of iShares Asia TrustNotes to the Financial Statements (continued)
MSCIChinaETFA sensitivity analysis for level 3 investments held by the MSCI China ETF as at 31st December 2015 and 2014 were not presented, as it was deemed that the impact of reasonable changes in inputs were not significant .
A50ChinaETFAs at 31st December 2015, the level 3 investments included certain illiquid equity securities and illiquid CAAPs held by the A50 China ETF . As at 31st December 2014, the A50 China ETF did not hold any level 3 investments .
As at 31st december 2015fair value
hK$
Valuation technique
Unobservable inputs
weightedaverage input
Reasonable possible shift +/- (absolute value)
Change in valuation
hK$
Equity Securities
– Financials 781,952,955
Value by third party dealers or
vendors N/A N/A N/A N/A
CAAPs
– Financials 1,502,439,107
Value by third party dealers or
vendors N/A N/A N/A N/A
MSCIACAsiaexJapanETF(formerlyknownasMSCIAsiaAPEX50ETF)A sensitivity analysis for level 3 investments held by the MSCI AC Asia ex Japan ETF (formerly known as MSCI Asia APEX 50 ETF) as at 31st December 2015 was not presented, as it was deemed that the impact of reasonable changes in inputs was not significant . As at 31st December 2014, the MSCI AC Asia ex Japan ETF (formerly known as MSCI Asia APEX 50 ETF) did not hold any level 3 investments .
MSCIEmergingAsiaETFA sensitivity analysis for level 3 investments held by the MSCI Emerging Asia ETF as at 31st December 2015 was not presented, as it was deemed that the impact of reasonable changes in inputs was not significant . As at 31st December 2014, the MSCI Emerging Asia ETF did not hold any level 3 investments .
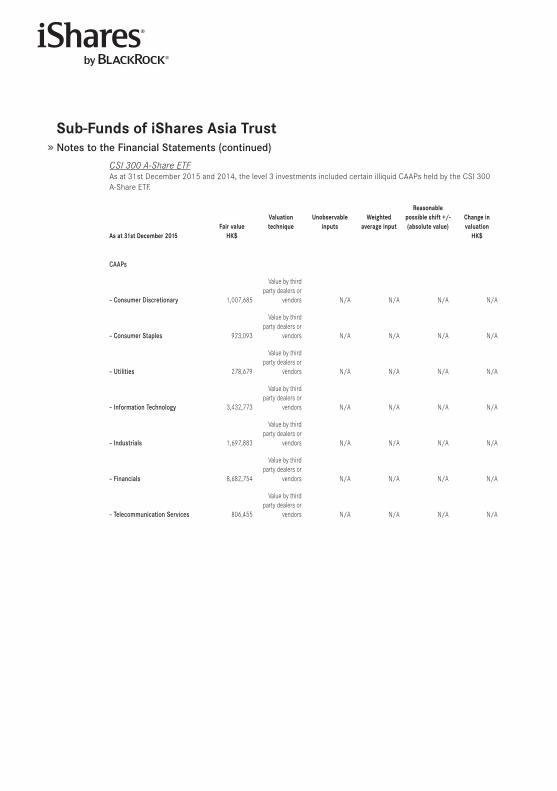
Sub-funds of iShares Asia TrustNotes to the Financial Statements (continued)
CSI300A-ShareETFAs at 31st December 2015 and 2014, the level 3 investments included certain illiquid CAAPs held by the CSI 300 A-Share ETF .
As at 31st december 2015fair value
hK$
Valuation technique
Unobservable inputs
weightedaverage input
Reasonable possible shift +/-(absolute value)
Change in valuation
hK$
CAAPs
– Consumer Discretionary 1,007,685
Value by third party dealers or
vendors N/A N/A N/A N/A
– Consumer Staples 923,093
Value by third party dealers or
vendors N/A N/A N/A N/A
– Utilities 278,679
Value by third party dealers or
vendors N/A N/A N/A N/A
– Information Technology 3,432,773
Value by third party dealers or
vendors N/A N/A N/A N/A
– Industrials 1,697,883
Value by third party dealers or
vendors N/A N/A N/A N/A
– Financials 8,682,754
Value by third party dealers or
vendors N/A N/A N/A N/A
– Telecommunication Services 806,455
Value by third party dealers or
vendors N/A N/A N/A N/A
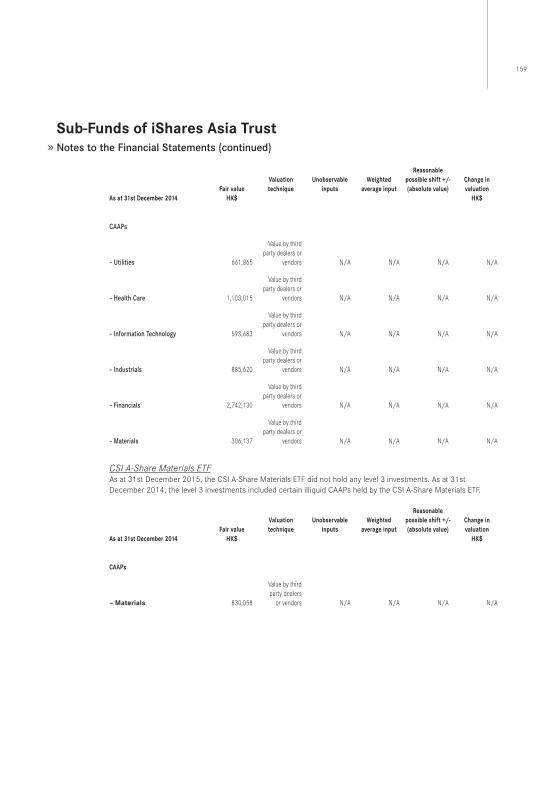
159
Sub-funds of iShares Asia TrustNotes to the Financial Statements (continued)
As at 31st december 2014fair value
hK$
Valuation technique
Unobservable inputs
weightedaverage input
Reasonable possible shift +/-(absolute value)
Change in valuation
hK$
CAAPs
– Utilities 661,865
Value by third party dealers or
vendors N/A N/A N/A N/A
– Health Care 1,103,015
Value by third party dealers or
vendors N/A N/A N/A N/A
– Information Technology 593,683
Value by third party dealers or
vendors N/A N/A N/A N/A
– Industrials 885,620
Value by third party dealers or
vendors N/A N/A N/A N/A
– Financials 2,742,130
Value by third party dealers or
vendors N/A N/A N/A N/A
– Materials 306,137
Value by third party dealers or
vendors N/A N/A N/A N/A
CSIA-ShareMaterialsETFAs at 31st December 2015, the CSI A-Share Materials ETF did not hold any level 3 investments . As at 31st December 2014, the level 3 investments included certain illiquid CAAPs held by the CSI A-Share Materials ETF .
As at 31st december 2014fair value
hK$
Valuation technique
Unobservable inputs
weightedaverage input
Reasonable possible shift +/-(absolute value)
Change in valuation
hK$
CAAps
– Materials 830,058
Value by thirdparty dealers
or vendors N/A N/A N/A N/A
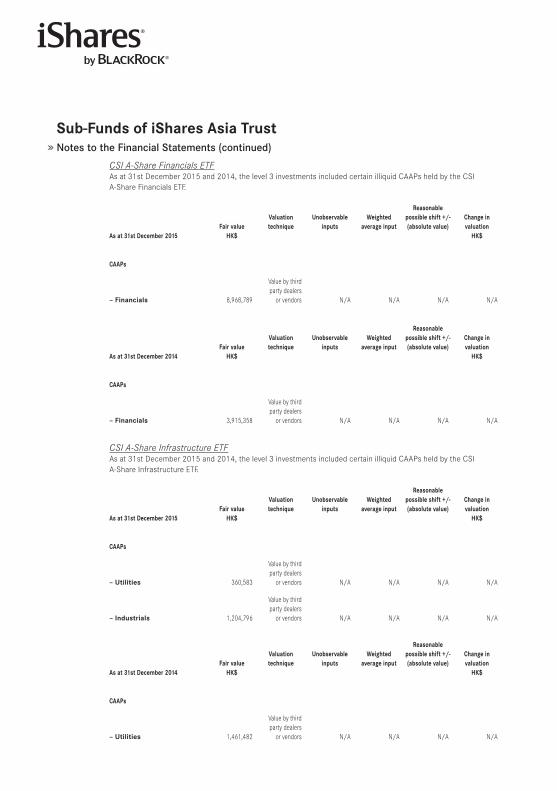
Sub-funds of iShares Asia TrustNotes to the Financial Statements (continued)
CSIA-ShareFinancialsETFAs at 31st December 2015 and 2014, the level 3 investments included certain illiquid CAAPs held by the CSI A-Share Financials ETF .
As at 31st december 2015fair value
hK$
Valuation technique
Unobservable inputs
weightedaverage input
Reasonable possible shift +/-(absolute value)
Change in valuation
hK$
CAAps
– financials 8,968,789
Value by thirdparty dealers
or vendors N/A N/A N/A N/A
As at 31st december 2014fair value
hK$
Valuation technique
Unobservable inputs
weightedaverage input
Reasonable possible shift +/-(absolute value)
Change in valuation
hK$
CAAps
– financials 3,915,358
Value by thirdparty dealers
or vendors N/A N/A N/A N/A
CSIA-ShareInfrastructureETFAs at 31st December 2015 and 2014, the level 3 investments included certain illiquid CAAPs held by the CSI A-Share Infrastructure ETF .
As at 31st december 2015fair value
hK$
Valuation technique
Unobservable inputs
weightedaverage input
Reasonable possible shift +/-(absolute value)
Change in valuation
hK$
CAAps
– Utilities 360,583
Value by thirdparty dealers
or vendors N/A N/A N/A N/A
– industrials 1,204,796
Value by thirdparty dealers
or vendors N/A N/A N/A N/A
As at 31st december 2014fair value
hK$
Valuation technique
Unobservable inputs
weightedaverage input
Reasonable possible shift +/-(absolute value)
Change in valuation
hK$
CAAps
– Utilities 1,461,482
Value by thirdparty dealers
or vendors N/A N/A N/A N/A
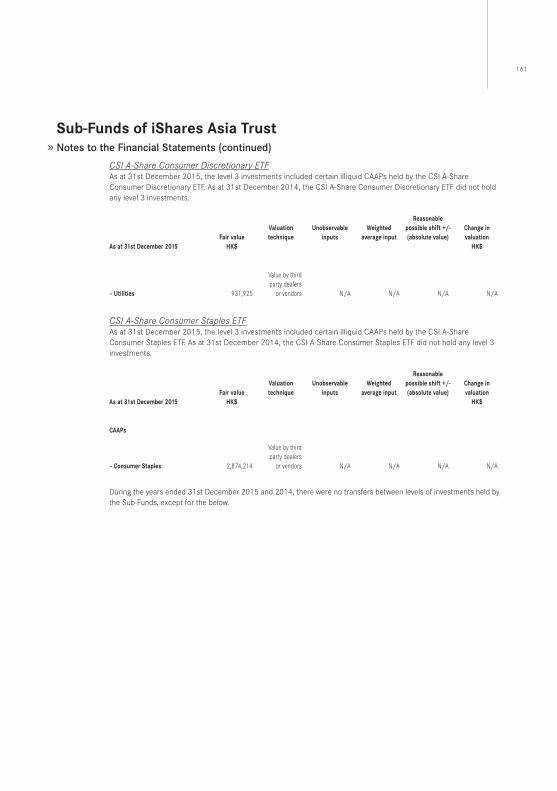
161
Sub-funds of iShares Asia TrustNotes to the Financial Statements (continued)
CSIA-ShareConsumerDiscretionaryETFAs at 31st December 2015, the level 3 investments included certain illiquid CAAPs held by the CSI A-Share Consumer Discretionary ETF . As at 31st December 2014, the CSI A-Share Consumer Discretionary ETF did not hold any level 3 investments .
As at 31st december 2015fair value
hK$
Valuation technique
Unobservable inputs
weightedaverage input
Reasonable possible shift +/-(absolute value)
Change in valuation
hK$
– Utilities 931,925
Value by thirdparty dealers
or vendors N/A N/A N/A N/A
CSIA-ShareConsumerStaplesETFAs at 31st December 2015, the level 3 investments included certain illiquid CAAPs held by the CSI A-Share Consumer Staples ETF . As at 31st December 2014, the CSI A-Share Consumer Staples ETF did not hold any level 3 investments .
As at 31st december 2015fair value
hK$
Valuation technique
Unobservable inputs
weightedaverage input
Reasonable possible shift +/-(absolute value)
Change in valuation
hK$
CAAps
– Consumer Staples 2,874,214
Value by thirdparty dealers
or vendors N/A N/A N/A N/A
During the years ended 31st December 2015 and 2014, there were no transfers between levels of investments held by the Sub-Funds, except for the below .
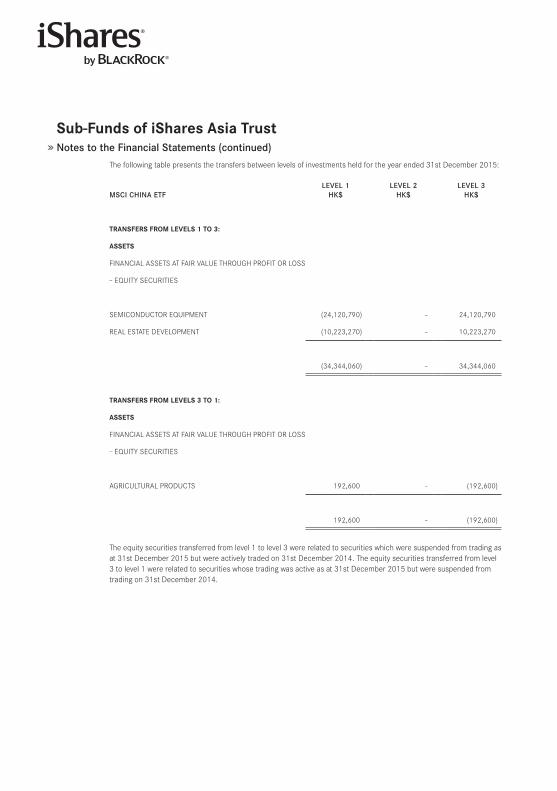
Sub-funds of iShares Asia TrustNotes to the Financial Statements (continued)
The following table presents the transfers between levels of investments held for the year ended 31st December 2015:
MSCI CHINA ETFlEVEl 1
HK$lEVEl 2
HK$lEVEl 3
HK$
TRAnSfeRS fRoM leVelS 1 To 3:
ASSeTS
FINANCIAL ASSETS AT FAIR VALUE THROUGH PROFIT OR LOSS
– EQUITY SECURITIES
SEMICONDUCTOR EQUIPMENT (24,120,790) – 24,120,790
REAL ESTATE DEVELOPMENT (10,223,270) – 10,223,270
(34,344,060) – 34,344,060
TRAnSfeRS fRoM leVelS 3 To 1:
ASSeTS
FINANCIAL ASSETS AT FAIR VALUE THROUGH PROFIT OR LOSS
– EQUITY SECURITIES
AGRICULTURAL PRODUCTS 192,600 – (192,600)
192,600 – (192,600)
The equity securities transferred from level 1 to level 3 were related to securities which were suspended from trading as at 31st December 2015 but were actively traded on 31st December 2014 . The equity securities transferred from level 3 to level 1 were related to securities whose trading was active as at 31st December 2015 but were suspended from trading on 31st December 2014 .
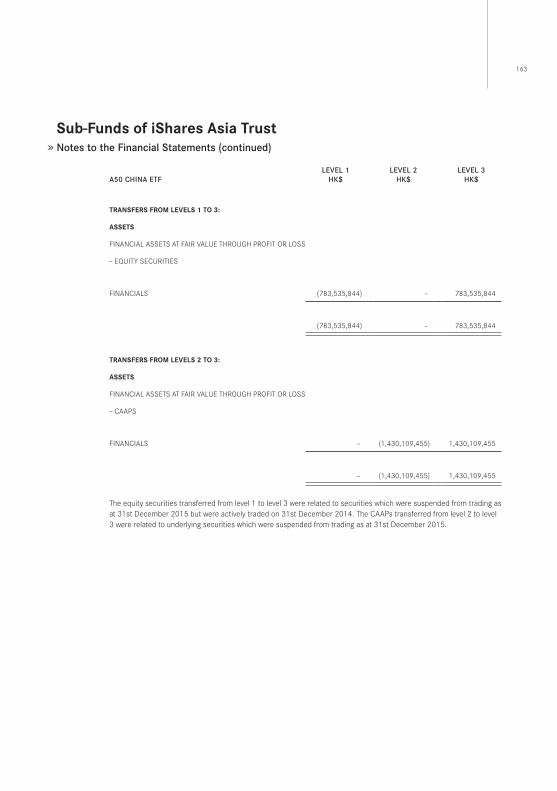
163
Sub-funds of iShares Asia TrustNotes to the Financial Statements (continued)
A50 CHINA ETFlEVEl 1
HK$lEVEl 2
HK$lEVEl 3
HK$
TRAnSfeRS fRoM leVelS 1 To 3:
ASSeTS
FINANCIAL ASSETS AT FAIR VALUE THROUGH PROFIT OR LOSS
– EQUITY SECURITIES
FINANCIALS (783,535,844) – 783,535,844
(783,535,844) – 783,535,844
TRAnSfeRS fRoM leVelS 2 To 3:
ASSeTS
FINANCIAL ASSETS AT FAIR VALUE THROUGH PROFIT OR LOSS
– CAAPS
FINANCIALS – (1,430,109,455) 1,430,109,455
– (1,430,109,455) 1,430,109,455
The equity securities transferred from level 1 to level 3 were related to securities which were suspended from trading as at 31st December 2015 but were actively traded on 31st December 2014 . The CAAPs transferred from level 2 to level 3 were related to underlying securities which were suspended from trading as at 31st December 2015 .
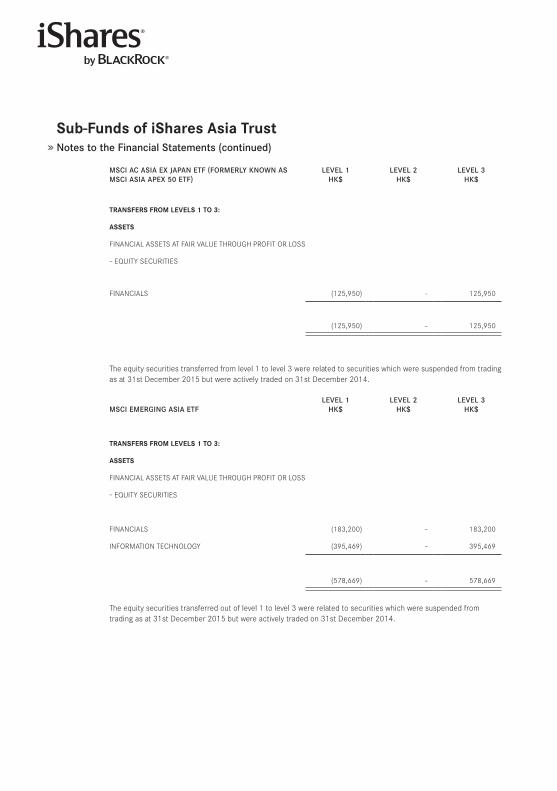
Sub-funds of iShares Asia TrustNotes to the Financial Statements (continued)
MSCI AC ASIA EX JAPAN ETF (FoRMERly KNowN AS MSCI ASIA APEX 50 ETF)
lEVEl 1HK$
lEVEl 2HK$
lEVEl 3HK$
TRAnSfeRS fRoM leVelS 1 To 3:
ASSeTS
FINANCIAL ASSETS AT FAIR VALUE THROUGH PROFIT OR LOSS
– EQUITY SECURITIES
FINANCIALS (125,950) – 125,950
(125,950) – 125,950
The equity securities transferred from level 1 to level 3 were related to securities which were suspended from trading as at 31st December 2015 but were actively traded on 31st December 2014 .
MSCI EMERgINg ASIA ETFlEVEl 1
HK$lEVEl 2
HK$lEVEl 3
HK$
TRAnSfeRS fRoM leVelS 1 To 3:
ASSeTS
FINANCIAL ASSETS AT FAIR VALUE THROUGH PROFIT OR LOSS
– EQUITY SECURITIES
FINANCIALS (183,200) – 183,200
INFORMATION TECHNOLOGY (395,469) – 395,469
(578,669) – 578,669
The equity securities transferred out of level 1 to level 3 were related to securities which were suspended from trading as at 31st December 2015 but were actively traded on 31st December 2014 .
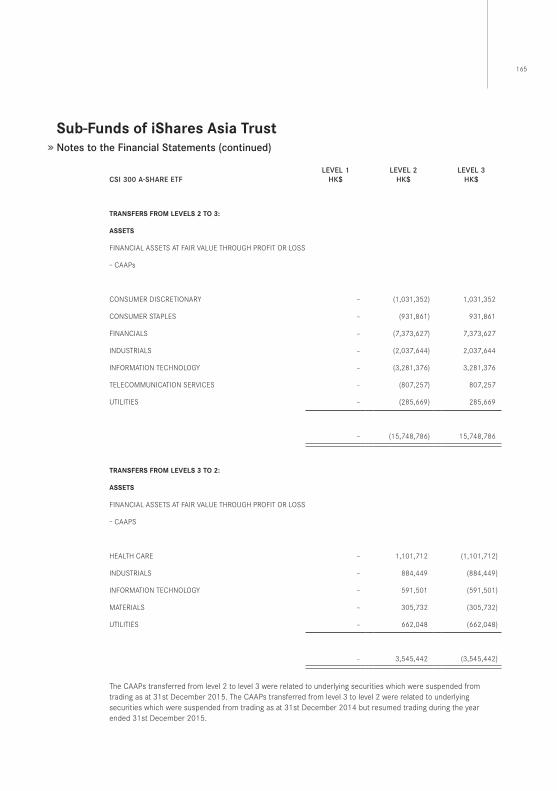
165
Sub-funds of iShares Asia TrustNotes to the Financial Statements (continued)
CSI 300 A-SHARE ETFlEVEl 1
HK$lEVEl 2
HK$lEVEl 3
HK$
TRAnSfeRS fRoM leVelS 2 To 3:
ASSeTS
FINANCIAL ASSETS AT FAIR VALUE THROUGH PROFIT OR LOSS
– CAAPs
CONSUMER DISCRETIONARY – (1,031,352) 1,031,352
CONSUMER STAPLES – (931,861) 931,861
FINANCIALS – (7,373,627) 7,373,627
INDUSTRIALS – (2,037,644) 2,037,644
INFORMATION TECHNOLOGY – (3,281,376) 3,281,376
TELECOMMUNICATION SERVICES – (807,257) 807,257
UTILITIES – (285,669) 285,669
– (15,748,786) 15,748,786
TRAnSfeRS fRoM leVelS 3 To 2:
ASSeTS
FINANCIAL ASSETS AT FAIR VALUE THROUGH PROFIT OR LOSS
– CAAPS
HEALTH CARE – 1,101,712 (1,101,712)
INDUSTRIALS – 884,449 (884,449)
INFORMATION TECHNOLOGY – 591,501 (591,501)
MATERIALS – 305,732 (305,732)
UTILITIES – 662,048 (662,048)
– 3,545,442 (3,545,442)
The CAAPs transferred from level 2 to level 3 were related to underlying securities which were suspended from trading as at 31st December 2015 . The CAAPs transferred from level 3 to level 2 were related to underlying securities which were suspended from trading as at 31st December 2014 but resumed trading during the year ended 31st December 2015 .
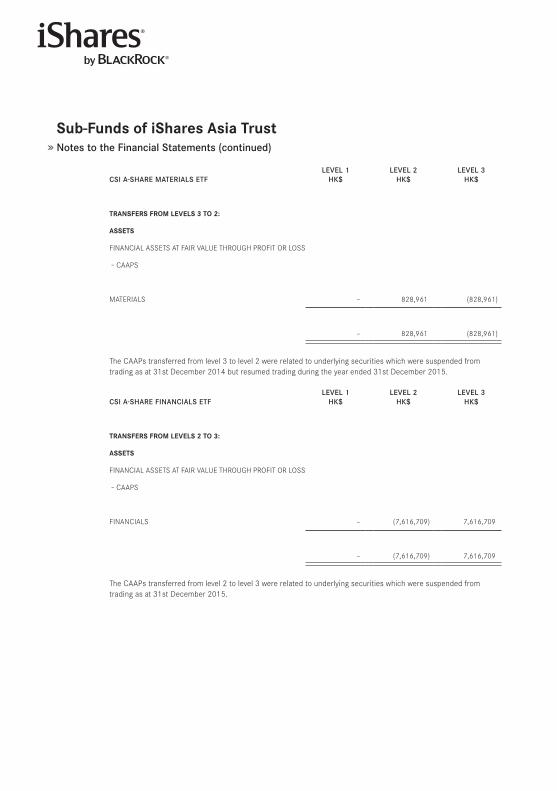
Sub-funds of iShares Asia TrustNotes to the Financial Statements (continued)
CSI A-SHARE MATERIAlS ETFlEVEl 1
HK$lEVEl 2
HK$lEVEl 3
HK$
TRAnSfeRS fRoM leVelS 3 To 2:
ASSeTS
FINANCIAL ASSETS AT FAIR VALUE THROUGH PROFIT OR LOSS
– CAAPS
MATERIALS – 828,961 (828,961)
– 828,961 (828,961)
The CAAPs transferred from level 3 to level 2 were related to underlying securities which were suspended from trading as at 31st December 2014 but resumed trading during the year ended 31st December 2015 .
CSI A-SHARE FINANCIAlS ETFlEVEl 1
HK$lEVEl 2
HK$lEVEl 3
HK$
TRAnSfeRS fRoM leVelS 2 To 3:
ASSeTS
FINANCIAL ASSETS AT FAIR VALUE THROUGH PROFIT OR LOSS
– CAAPS
FINANCIALS – (7,616,709) 7,616,709
– (7,616,709) 7,616,709
The CAAPs transferred from level 2 to level 3 were related to underlying securities which were suspended from trading as at 31st December 2015 .
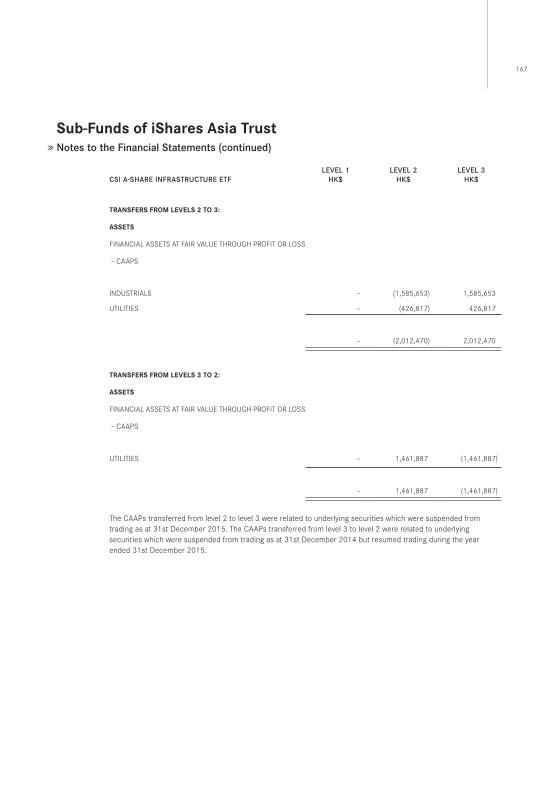
167
Sub-funds of iShares Asia TrustNotes to the Financial Statements (continued)
CSI A-SHARE INFRASTRUCTURE ETFlEVEl 1
HK$lEVEl 2
HK$lEVEl 3
HK$
TRAnSfeRS fRoM leVelS 2 To 3:
ASSeTS
FINANCIAL ASSETS AT FAIR VALUE THROUGH PROFIT OR LOSS
– CAAPS
INDUSTRIALS – (1,585,653) 1,585,653
UTILITIES – (426,817) 426,817
– (2,012,470) 2,012,470
TRAnSfeRS fRoM leVelS 3 To 2:
ASSeTS
FINANCIAL ASSETS AT FAIR VALUE THROUGH PROFIT OR LOSS
– CAAPS
UTILITIES – 1,461,887 (1,461,887)
– 1,461,887 (1,461,887)
The CAAPs transferred from level 2 to level 3 were related to underlying securities which were suspended from trading as at 31st December 2015 . The CAAPs transferred from level 3 to level 2 were related to underlying securities which were suspended from trading as at 31st December 2014 but resumed trading during the year ended 31st December 2015 .
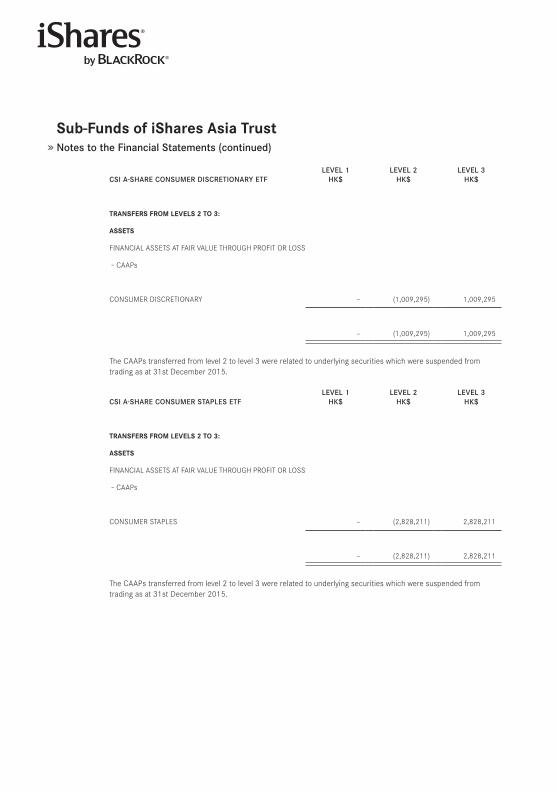
Sub-funds of iShares Asia TrustNotes to the Financial Statements (continued)
CSI A-SHARE CoNSUMER DISCRETIoNARy ETFlEVEl 1
HK$lEVEl 2
HK$lEVEl 3
HK$
TRAnSfeRS fRoM leVelS 2 To 3:
ASSeTS
FINANCIAL ASSETS AT FAIR VALUE THROUGH PROFIT OR LOSS
– CAAPs
CONSUMER DISCRETIONARY – (1,009,295) 1,009,295
– (1,009,295) 1,009,295
The CAAPs transferred from level 2 to level 3 were related to underlying securities which were suspended from trading as at 31st December 2015 .
CSI A-SHARE CoNSUMER STAPlES ETFlEVEl 1
HK$lEVEl 2
HK$lEVEl 3
HK$
TRAnSfeRS fRoM leVelS 2 To 3:
ASSeTS
FINANCIAL ASSETS AT FAIR VALUE THROUGH PROFIT OR LOSS
– CAAPs
CONSUMER STAPLES – (2,828,211) 2,828,211
– (2,828,211) 2,828,211
The CAAPs transferred from level 2 to level 3 were related to underlying securities which were suspended from trading as at 31st December 2015 .
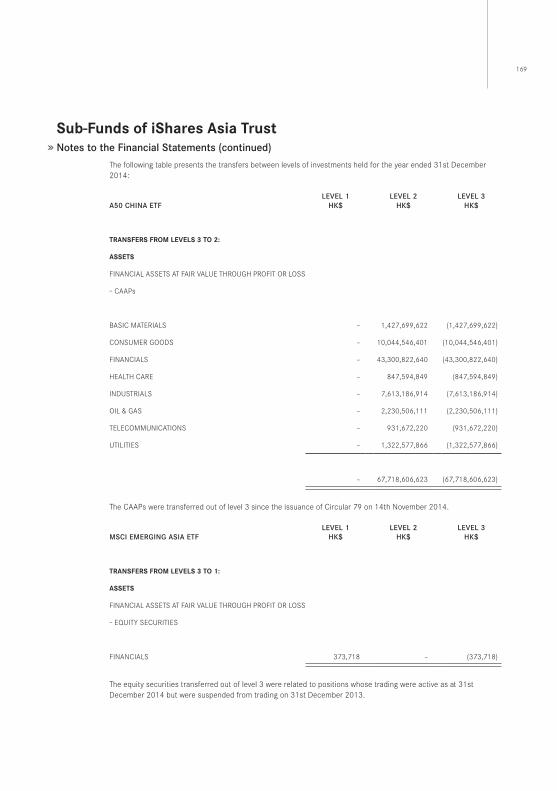
169
Sub-funds of iShares Asia TrustNotes to the Financial Statements (continued)
The following table presents the transfers between levels of investments held for the year ended 31st December 2014:
A50 CHINA ETFlEVEl 1
HK$lEVEl 2
HK$lEVEl 3
HK$
TRAnSfeRS fRoM leVelS 3 To 2:
ASSeTS
FINANCIAL ASSETS AT FAIR VALUE THROUGH PROFIT OR LOSS
– CAAPs
BASIC MATERIALS – 1,427,699,622 (1,427,699,622)
CONSUMER GOODS – 10,044,546,401 (10,044,546,401)
FINANCIALS – 43,300,822,640 (43,300,822,640)
HEALTH CARE – 847,594,849 (847,594,849)
INDUSTRIALS – 7,613,186,914 (7,613,186,914)
OIL & GAS – 2,230,506,111 (2,230,506,111)
TELECOMMUNICATIONS – 931,672,220 (931,672,220)
UTILITIES – 1,322,577,866 (1,322,577,866)
– 67,718,606,623 (67,718,606,623)
The CAAPs were transferred out of level 3 since the issuance of Circular 79 on 14th November 2014 .
MSCI EMERgINg ASIA ETFlEVEl 1
HK$lEVEl 2
HK$lEVEl 3
HK$
TRAnSfeRS fRoM leVelS 3 To 1:
ASSeTS
FINANCIAL ASSETS AT FAIR VALUE THROUGH PROFIT OR LOSS
– EQUITY SECURITIES
FINANCIALS 373,718 – (373,718)
The equity securities transferred out of level 3 were related to positions whose trading were active as at 31st December 2014 but were suspended from trading on 31st December 2013 .
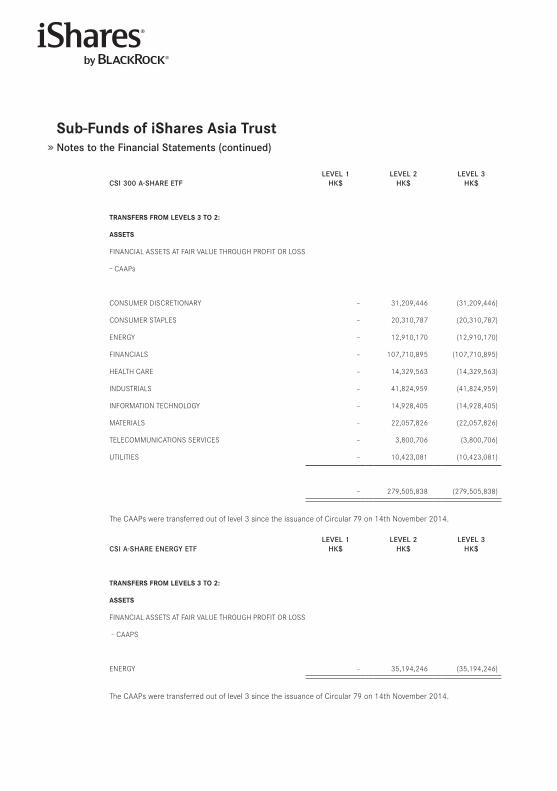
Sub-funds of iShares Asia TrustNotes to the Financial Statements (continued)
CSI 300 A-SHARE ETFlEVEl 1
HK$lEVEl 2
HK$lEVEl 3
HK$
TRAnSfeRS fRoM leVelS 3 To 2:
ASSeTS
FINANCIAL ASSETS AT FAIR VALUE THROUGH PROFIT OR LOSS
– CAAPs
CONSUMER DISCRETIONARY – 31,209,446 (31,209,446)
CONSUMER STAPLES – 20,310,787 (20,310,787)
ENERGY – 12,910,170 (12,910,170)
FINANCIALS – 107,710,895 (107,710,895)
HEALTH CARE – 14,329,563 (14,329,563)
INDUSTRIALS – 41,824,959 (41,824,959)
INFORMATION TECHNOLOGY – 14,928,405 (14,928,405)
MATERIALS – 22,057,826 (22,057,826)
TELECOMMUNICATIONS SERVICES – 3,800,706 (3,800,706)
UTILITIES – 10,423,081 (10,423,081)
– 279,505,838 (279,505,838)
The CAAPs were transferred out of level 3 since the issuance of Circular 79 on 14th November 2014 .
CSI A-SHARE ENERgy ETFlEVEl 1
HK$lEVEl 2
HK$lEVEl 3
HK$
TRAnSfeRS fRoM leVelS 3 To 2:
ASSeTS
FINANCIAL ASSETS AT FAIR VALUE THROUGH PROFIT OR LOSS
– CAAPS
ENERGY – 35,194,246 (35,194,246)
The CAAPs were transferred out of level 3 since the issuance of Circular 79 on 14th November 2014 .
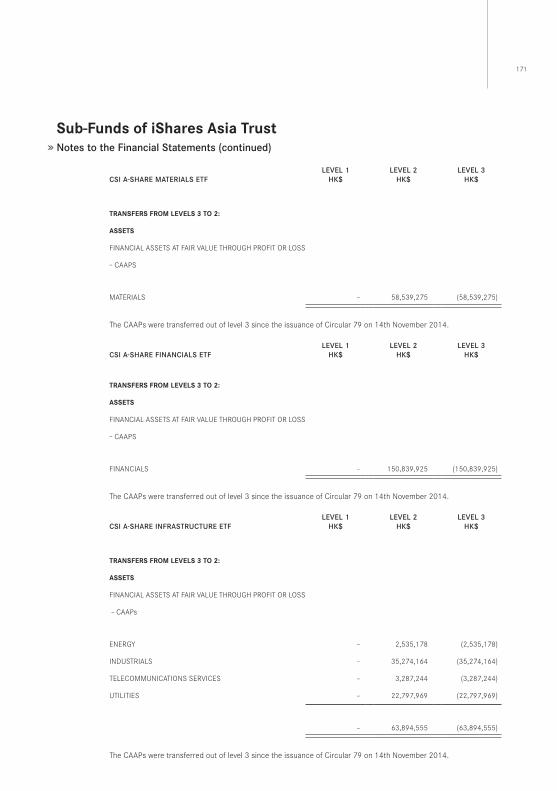
171
Sub-funds of iShares Asia TrustNotes to the Financial Statements (continued)
CSI A-SHARE MATERIAlS ETFlEVEl 1
HK$lEVEl 2
HK$lEVEl 3
HK$
TRAnSfeRS fRoM leVelS 3 To 2:
ASSeTS
FINANCIAL ASSETS AT FAIR VALUE THROUGH PROFIT OR LOSS
– CAAPS
MATERIALS – 58,539,275 (58,539,275)
The CAAPs were transferred out of level 3 since the issuance of Circular 79 on 14th November 2014 .
CSI A-SHARE FINANCIAlS ETFlEVEl 1
HK$lEVEl 2
HK$lEVEl 3
HK$
TRAnSfeRS fRoM leVelS 3 To 2:
ASSeTS
FINANCIAL ASSETS AT FAIR VALUE THROUGH PROFIT OR LOSS
– CAAPS
FINANCIALS – 150,839,925 (150,839,925)
The CAAPs were transferred out of level 3 since the issuance of Circular 79 on 14th November 2014 .
CSI A-SHARE INFRASTRUCTURE ETFlEVEl 1
HK$lEVEl 2
HK$lEVEl 3
HK$
TRAnSfeRS fRoM leVelS 3 To 2:
ASSeTS
FINANCIAL ASSETS AT FAIR VALUE THROUGH PROFIT OR LOSS
– CAAPs
ENERGY – 2,535,178 (2,535,178)
INDUSTRIALS – 35,274,164 (35,274,164)
TELECOMMUNICATIONS SERVICES – 3,287,244 (3,287,244)
UTILITIES – 22,797,969 (22,797,969)
– 63,894,555 (63,894,555)
The CAAPs were transferred out of level 3 since the issuance of Circular 79 on 14th November 2014 .
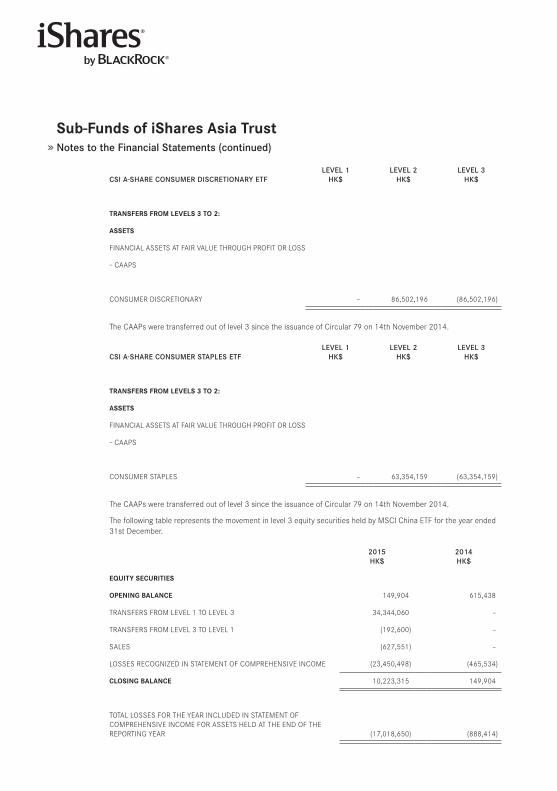
Sub-funds of iShares Asia TrustNotes to the Financial Statements (continued)
CSI A-SHARE CoNSUMER DISCRETIoNARy ETFlEVEl 1
HK$lEVEl 2
HK$lEVEl 3
HK$
TRAnSfeRS fRoM leVelS 3 To 2:
ASSeTS
FINANCIAL ASSETS AT FAIR VALUE THROUGH PROFIT OR LOSS
– CAAPS
CONSUMER DISCRETIONARY – 86,502,196 (86,502,196)
The CAAPs were transferred out of level 3 since the issuance of Circular 79 on 14th November 2014 .
CSI A-SHARE CoNSUMER STAPlES ETFlEVEl 1
HK$lEVEl 2
HK$lEVEl 3
HK$
TRAnSfeRS fRoM leVelS 3 To 2:
ASSeTS
FINANCIAL ASSETS AT FAIR VALUE THROUGH PROFIT OR LOSS
– CAAPS
CONSUMER STAPLES – 63,354,159 (63,354,159)
The CAAPs were transferred out of level 3 since the issuance of Circular 79 on 14th November 2014 .
The following table represents the movement in level 3 equity securities held by MSCI China ETF for the year ended 31st December .
2015HK$
2014HK$
eQUiTY SeCURiTieS
opening BAlAnCe 149,904 615,438
TRANSFERS FROM LEVEL 1 TO LEVEL 3 34,344,060 –
TRANSFERS FROM LEVEL 3 TO LEVEL 1 (192,600) –
SALES (627,551) –
LOSSES RECOGNIzED IN STATEMENT OF COMPREHENSIVE INCOME (23,450,498) (465,534)
CloSing BAlAnCe 10,223,315 149,904
TOTAL LOSSES FOR THE YEAR INCLUDED IN STATEMENT OF COMPREHENSIVE INCOME FOR ASSETS HELD AT THE END OF THE REPORTING YEAR (17,018,650) (888,414)
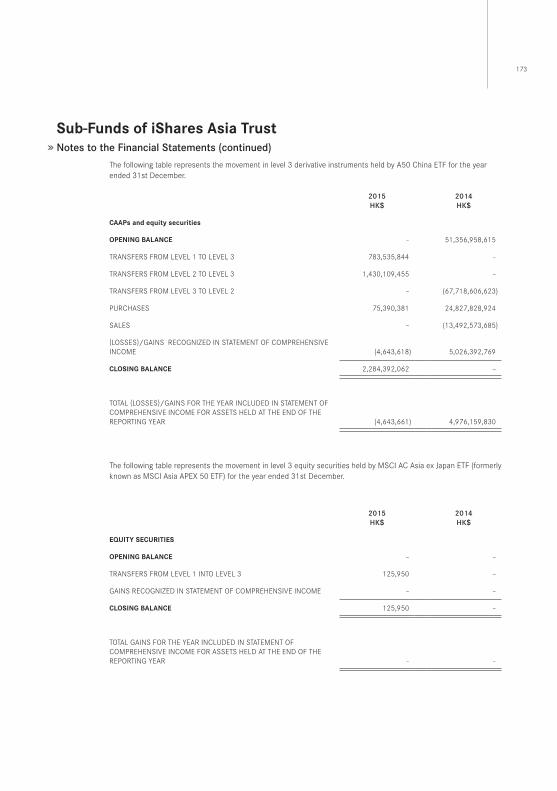
173
Sub-funds of iShares Asia TrustNotes to the Financial Statements (continued)
The following table represents the movement in level 3 derivative instruments held by A50 China ETF for the year ended 31st December .
2015HK$
2014HK$
CAAps and equity securities
opening BAlAnCe – 51,356,958,615
TRANSFERS FROM LEVEL 1 TO LEVEL 3 783,535,844 –
TRANSFERS FROM LEVEL 2 TO LEVEL 3 1,430,109,455 –
TRANSFERS FROM LEVEL 3 TO LEVEL 2 – (67,718,606,623)
PURCHASES 75,390,381 24,827,828,924
SALES – (13,492,573,685)
(LOSSES)/GAINS RECOGNIzED IN STATEMENT OF COMPREHENSIVE INCOME (4,643,618) 5,026,392,769
CloSing BAlAnCe 2,284,392,062 –
TOTAL (LOSSES)/GAINS FOR THE YEAR INCLUDED IN STATEMENT OF COMPREHENSIVE INCOME FOR ASSETS HELD AT THE END OF THE REPORTING YEAR (4,643,661) 4,976,159,830
The following table represents the movement in level 3 equity securities held by MSCI AC Asia ex Japan ETF (formerly known as MSCI Asia APEX 50 ETF) for the year ended 31st December .
2015HK$
2014HK$
eQUiTY SeCURiTieS
opening BAlAnCe – –
TRANSFERS FROM LEVEL 1 INTO LEVEL 3 125,950 –
GAINS RECOGNIzED IN STATEMENT OF COMPREHENSIVE INCOME – –
CloSing BAlAnCe 125,950 –
TOTAL GAINS FOR THE YEAR INCLUDED IN STATEMENT OF COMPREHENSIVE INCOME FOR ASSETS HELD AT THE END OF THE REPORTING YEAR – –
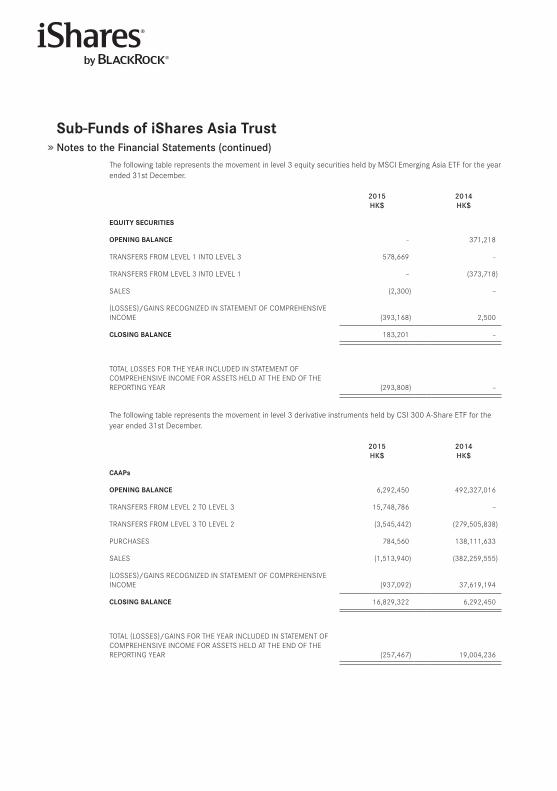
Sub-funds of iShares Asia TrustNotes to the Financial Statements (continued)
The following table represents the movement in level 3 equity securities held by MSCI Emerging Asia ETF for the year ended 31st December .
2015HK$
2014HK$
eQUiTY SeCURiTieS
opening BAlAnCe – 371,218
TRANSFERS FROM LEVEL 1 INTO LEVEL 3 578,669 –
TRANSFERS FROM LEVEL 3 INTO LEVEL 1 – (373,718)
SALES (2,300) –
(LOSSES)/GAINS RECOGNIzED IN STATEMENT OF COMPREHENSIVE INCOME (393,168) 2,500
CloSing BAlAnCe 183,201 –
TOTAL LOSSES FOR THE YEAR INCLUDED IN STATEMENT OF COMPREHENSIVE INCOME FOR ASSETS HELD AT THE END OF THE REPORTING YEAR (293,808) –
The following table represents the movement in level 3 derivative instruments held by CSI 300 A-Share ETF for the year ended 31st December .
2015HK$
2014HK$
CAAps
opening BAlAnCe 6,292,450 492,327,016
TRANSFERS FROM LEVEL 2 TO LEVEL 3 15,748,786 –
TRANSFERS FROM LEVEL 3 TO LEVEL 2 (3,545,442) (279,505,838)
PURCHASES 784,560 138,111,633
SALES (1,513,940) (382,259,555)
(LOSSES)/GAINS RECOGNIzED IN STATEMENT OF COMPREHENSIVE INCOME (937,092) 37,619,194
CloSing BAlAnCe 16,829,322 6,292,450
TOTAL (LOSSES)/GAINS FOR THE YEAR INCLUDED IN STATEMENT OF COMPREHENSIVE INCOME FOR ASSETS HELD AT THE END OF THE REPORTING YEAR (257,467) 19,004,236
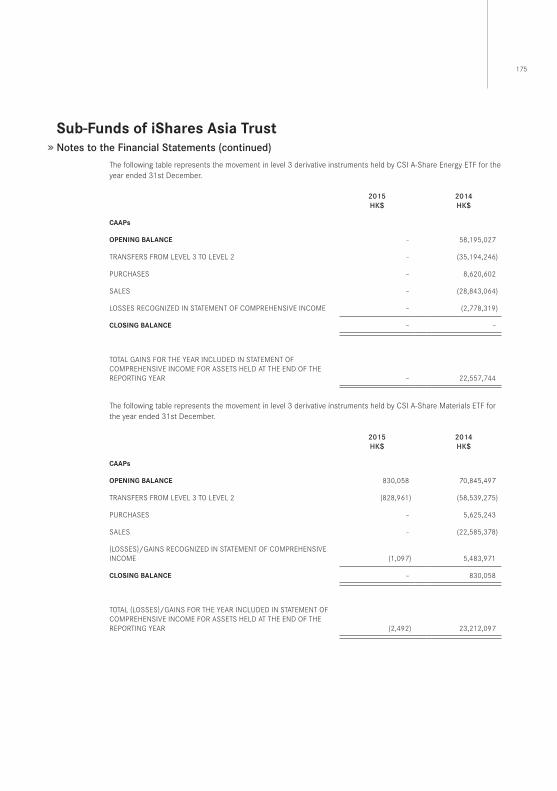
175
Sub-funds of iShares Asia TrustNotes to the Financial Statements (continued)
The following table represents the movement in level 3 derivative instruments held by CSI A-Share Energy ETF for the year ended 31st December .
2015HK$
2014HK$
CAAps
opening BAlAnCe – 58,195,027
TRANSFERS FROM LEVEL 3 TO LEVEL 2 – (35,194,246)
PURCHASES – 8,620,602
SALES – (28,843,064)
LOSSES RECOGNIzED IN STATEMENT OF COMPREHENSIVE INCOME – (2,778,319)
CloSing BAlAnCe – –
TOTAL GAINS FOR THE YEAR INCLUDED IN STATEMENT OF COMPREHENSIVE INCOME FOR ASSETS HELD AT THE END OF THE REPORTING YEAR – 22,557,744
The following table represents the movement in level 3 derivative instruments held by CSI A-Share Materials ETF for the year ended 31st December .
2015HK$
2014HK$
CAAps
opening BAlAnCe 830,058 70,845,497
TRANSFERS FROM LEVEL 3 TO LEVEL 2 (828,961) (58,539,275)
PURCHASES – 5,625,243
SALES – (22,585,378)
(LOSSES)/GAINS RECOGNIzED IN STATEMENT OF COMPREHENSIVE INCOME (1,097) 5,483,971
CloSing BAlAnCe – 830,058
TOTAL (LOSSES)/GAINS FOR THE YEAR INCLUDED IN STATEMENT OF COMPREHENSIVE INCOME FOR ASSETS HELD AT THE END OF THE REPORTING YEAR (2,492) 23,212,097
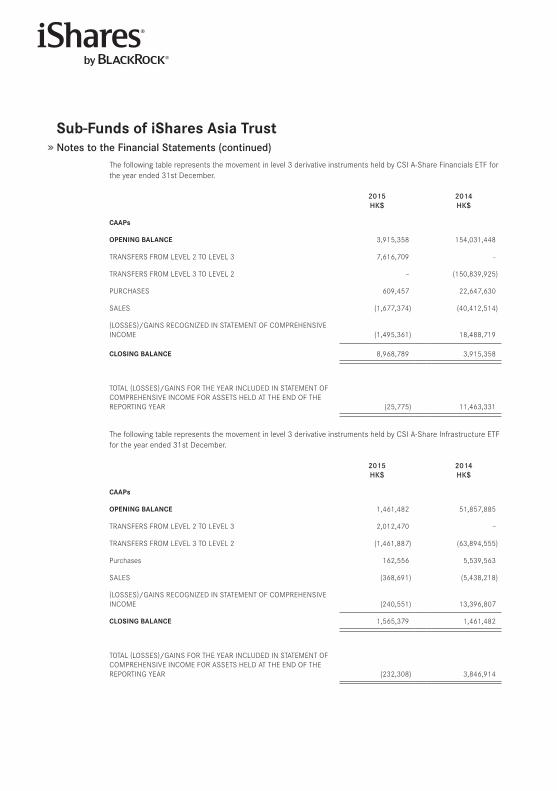
Sub-funds of iShares Asia TrustNotes to the Financial Statements (continued)
The following table represents the movement in level 3 derivative instruments held by CSI A-Share Financials ETF for the year ended 31st December .
2015HK$
2014HK$
CAAps
opening BAlAnCe 3,915,358 154,031,448
TRANSFERS FROM LEVEL 2 TO LEVEL 3 7,616,709 –
TRANSFERS FROM LEVEL 3 TO LEVEL 2 – (150,839,925)
PURCHASES 609,457 22,647,630
SALES (1,677,374) (40,412,514)
(LOSSES)/GAINS RECOGNIzED IN STATEMENT OF COMPREHENSIVE INCOME (1,495,361) 18,488,719
CloSing BAlAnCe 8,968,789 3,915,358
TOTAL (LOSSES)/GAINS FOR THE YEAR INCLUDED IN STATEMENT OF COMPREHENSIVE INCOME FOR ASSETS HELD AT THE END OF THE REPORTING YEAR (25,775) 11,463,331
The following table represents the movement in level 3 derivative instruments held by CSI A-Share Infrastructure ETF for the year ended 31st December .
2015HK$
2014HK$
CAAps
opening BAlAnCe 1,461,482 51,857,885
TRANSFERS FROM LEVEL 2 TO LEVEL 3 2,012,470 –
TRANSFERS FROM LEVEL 3 TO LEVEL 2 (1,461,887) (63,894,555)
Purchases 162,556 5,539,563
SALES (368,691) (5,438,218)
(LOSSES)/GAINS RECOGNIzED IN STATEMENT OF COMPREHENSIVE INCOME (240,551) 13,396,807
CloSing BAlAnCe 1,565,379 1,461,482
TOTAL (LOSSES)/GAINS FOR THE YEAR INCLUDED IN STATEMENT OF COMPREHENSIVE INCOME FOR ASSETS HELD AT THE END OF THE REPORTING YEAR (232,308) 3,846,914
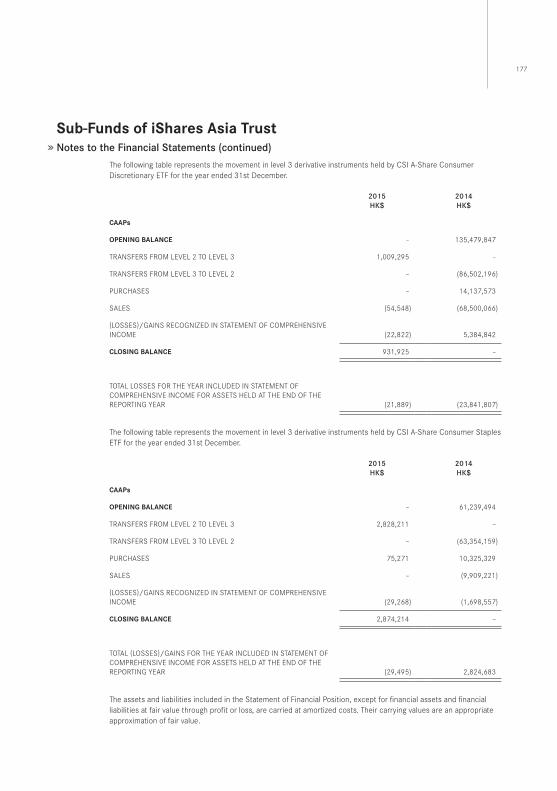
177
Sub-funds of iShares Asia TrustNotes to the Financial Statements (continued)
The following table represents the movement in level 3 derivative instruments held by CSI A-Share Consumer Discretionary ETF for the year ended 31st December .
2015HK$
2014HK$
CAAps
opening BAlAnCe – 135,479,847
TRANSFERS FROM LEVEL 2 TO LEVEL 3 1,009,295 –
TRANSFERS FROM LEVEL 3 TO LEVEL 2 – (86,502,196)
PURCHASES – 14,137,573
SALES (54,548) (68,500,066)
(LOSSES)/GAINS RECOGNIzED IN STATEMENT OF COMPREHENSIVE INCOME (22,822) 5,384,842
CloSing BAlAnCe 931,925 –
TOTAL LOSSES FOR THE YEAR INCLUDED IN STATEMENT OF COMPREHENSIVE INCOME FOR ASSETS HELD AT THE END OF THE REPORTING YEAR (21,889) (23,841,807)
The following table represents the movement in level 3 derivative instruments held by CSI A-Share Consumer Staples ETF for the year ended 31st December .
2015HK$
2014HK$
CAAps
opening BAlAnCe – 61,239,494
TRANSFERS FROM LEVEL 2 TO LEVEL 3 2,828,211 –
TRANSFERS FROM LEVEL 3 TO LEVEL 2 – (63,354,159)
PURCHASES 75,271 10,325,329
SALES – (9,909,221)
(LOSSES)/GAINS RECOGNIzED IN STATEMENT OF COMPREHENSIVE INCOME (29,268) (1,698,557)
CloSing BAlAnCe 2,874,214 –
TOTAL (LOSSES)/GAINS FOR THE YEAR INCLUDED IN STATEMENT OF COMPREHENSIVE INCOME FOR ASSETS HELD AT THE END OF THE REPORTING YEAR (29,495) 2,824,683
The assets and liabilities included in the Statement of Financial Position, except for financial assets and financial liabilities at fair value through profit or loss, are carried at amortized costs . Their carrying values are an appropriate approximation of fair value .
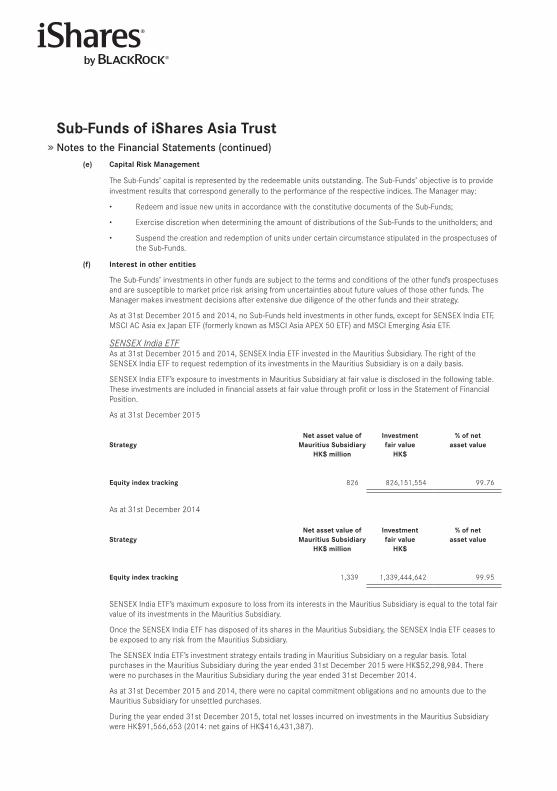
Sub-funds of iShares Asia TrustNotes to the Financial Statements (continued)
(e) Capital Risk Management
The Sub-Funds’ capital is represented by the redeemable units outstanding . The Sub-Funds’ objective is to provide investment results that correspond generally to the performance of the respective indices . The Manager may:
• Redeem and issue new units in accordance with the constitutive documents of the Sub-Funds;
• Exercise discretion when determining the amount of distributions of the Sub-Funds to the unitholders; and
• Suspend the creation and redemption of units under certain circumstance stipulated in the prospectuses of the Sub-Funds .
(f) interest in other entities
The Sub-Funds’ investments in other funds are subject to the terms and conditions of the other fund’s prospectuses and are susceptible to market price risk arising from uncertainties about future values of those other funds . The Manager makes investment decisions after extensive due diligence of the other funds and their strategy .
As at 31st December 2015 and 2014, no Sub-Funds held investments in other funds, except for SENSEX India ETF, MSCI AC Asia ex Japan ETF (formerly known as MSCI Asia APEX 50 ETF) and MSCI Emerging Asia ETF .
SENSEXIndiaETFAs at 31st December 2015 and 2014, SENSEX India ETF invested in the Mauritius Subsidiary . The right of the SENSEX India ETF to request redemption of its investments in the Mauritius Subsidiary is on a daily basis .
SENSEX India ETF’s exposure to investments in Mauritius Subsidiary at fair value is disclosed in the following table . These investments are included in financial assets at fair value through profit or loss in the Statement of Financial Position .
As at 31st December 2015
Strategynet asset value of
Mauritius SubsidiaryhK$ million
investmentfair value
hK$
% of netasset value
equity index tracking 826 826,151,554 99 .76
As at 31st December 2014
Strategynet asset value of
Mauritius SubsidiaryhK$ million
investmentfair value
hK$
% of netasset value
equity index tracking 1,339 1,339,444,642 99 .95
SENSEX India ETF’s maximum exposure to loss from its interests in the Mauritius Subsidiary is equal to the total fair value of its investments in the Mauritius Subsidiary .
Once the SENSEX India ETF has disposed of its shares in the Mauritius Subsidiary, the SENSEX India ETF ceases to be exposed to any risk from the Mauritius Subsidiary .
The SENSEX India ETF’s investment strategy entails trading in Mauritius Subsidiary on a regular basis . Total purchases in the Mauritius Subsidiary during the year ended 31st December 2015 were HK$52,298,984 . There were no purchases in the Mauritius Subsidiary during the year ended 31st December 2014 .
As at 31st December 2015 and 2014, there were no capital commitment obligations and no amounts due to the Mauritius Subsidiary for unsettled purchases .
During the year ended 31st December 2015, total net losses incurred on investments in the Mauritius Subsidiary were HK$91,566,653 (2014: net gains of HK$416,431,387) .
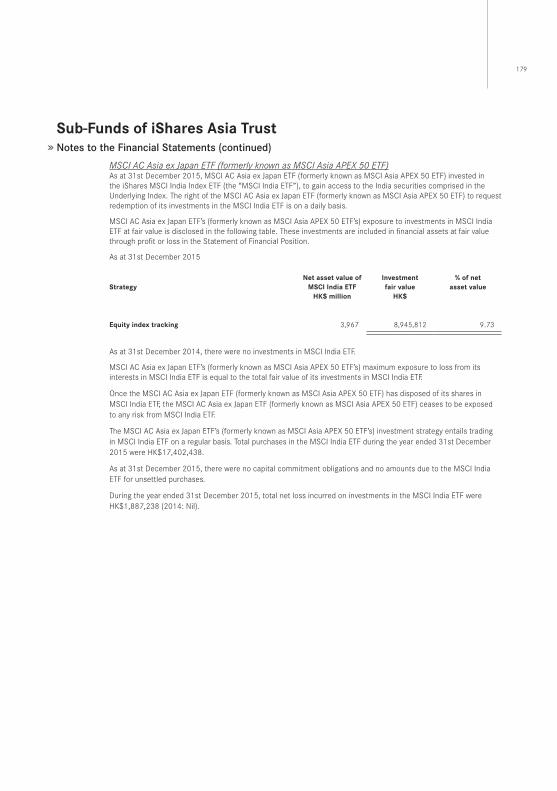
179
Sub-funds of iShares Asia TrustNotes to the Financial Statements (continued)
MSCIACAsiaexJapanETF(formerlyknownasMSCIAsiaAPEX50ETF)As at 31st December 2015, MSCI AC Asia ex Japan ETF (formerly known as MSCI Asia APEX 50 ETF) invested in the iShares MSCI India Index ETF (the “MSCI India ETF”), to gain access to the India securities comprised in the Underlying Index . The right of the MSCI AC Asia ex Japan ETF (formerly known as MSCI Asia APEX 50 ETF) to request redemption of its investments in the MSCI India ETF is on a daily basis .
MSCI AC Asia ex Japan ETF’s (formerly known as MSCI Asia APEX 50 ETF’s) exposure to investments in MSCI India ETF at fair value is disclosed in the following table . These investments are included in financial assets at fair value through profit or loss in the Statement of Financial Position .
As at 31st December 2015
Strategynet asset value of
MSCi india eTf hK$ million
investmentfair value
hK$
% of netasset value
equity index tracking 3,967 8,945,812 9 .73
As at 31st December 2014, there were no investments in MSCI India ETF .
MSCI AC Asia ex Japan ETF’s (formerly known as MSCI Asia APEX 50 ETF’s) maximum exposure to loss from its interests in MSCI India ETF is equal to the total fair value of its investments in MSCI India ETF .
Once the MSCI AC Asia ex Japan ETF (formerly known as MSCI Asia APEX 50 ETF) has disposed of its shares in MSCI India ETF, the MSCI AC Asia ex Japan ETF (formerly known as MSCI Asia APEX 50 ETF) ceases to be exposed to any risk from MSCI India ETF .
The MSCI AC Asia ex Japan ETF’s (formerly known as MSCI Asia APEX 50 ETF’s) investment strategy entails trading in MSCI India ETF on a regular basis . Total purchases in the MSCI India ETF during the year ended 31st December 2015 were HK$17,402,438 .
As at 31st December 2015, there were no capital commitment obligations and no amounts due to the MSCI India ETF for unsettled purchases .
During the year ended 31st December 2015, total net loss incurred on investments in the MSCI India ETF were HK$1,887,238 (2014: Nil) .
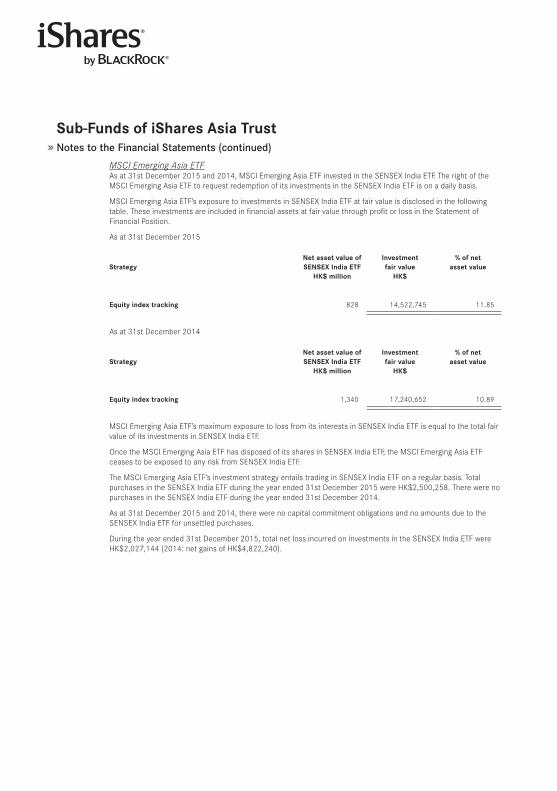
Sub-funds of iShares Asia TrustNotes to the Financial Statements (continued)
MSCIEmergingAsiaETFAs at 31st December 2015 and 2014, MSCI Emerging Asia ETF invested in the SENSEX India ETF . The right of the MSCI Emerging Asia ETF to request redemption of its investments in the SENSEX India ETF is on a daily basis .
MSCI Emerging Asia ETF’s exposure to investments in SENSEX India ETF at fair value is disclosed in the following table . These investments are included in financial assets at fair value through profit or loss in the Statement of Financial Position .
As at 31st December 2015
Strategynet asset value of SenSeX india eTf
hK$ million
investmentfair value
hK$
% of netasset value
equity index tracking 828 14,522,745 11 .85
As at 31st December 2014
Strategynet asset value of SenSeX india eTf
hK$ million
investmentfair value
hK$
% of netasset value
equity index tracking 1,340 17,240,652 10 .89
MSCI Emerging Asia ETF’s maximum exposure to loss from its interests in SENSEX India ETF is equal to the total fair value of its investments in SENSEX India ETF .
Once the MSCI Emerging Asia ETF has disposed of its shares in SENSEX India ETF, the MSCI Emerging Asia ETF ceases to be exposed to any risk from SENSEX India ETF .
The MSCI Emerging Asia ETF’s investment strategy entails trading in SENSEX India ETF on a regular basis . Total purchases in the SENSEX India ETF during the year ended 31st December 2015 were HK$2,500,258 . There were no purchases in the SENSEX India ETF during the year ended 31st December 2014 .
As at 31st December 2015 and 2014, there were no capital commitment obligations and no amounts due to the SENSEX India ETF for unsettled purchases .
During the year ended 31st December 2015, total net loss incurred on investments in the SENSEX India ETF were HK$2,027,144 (2014: net gains of HK$4,822,240) .
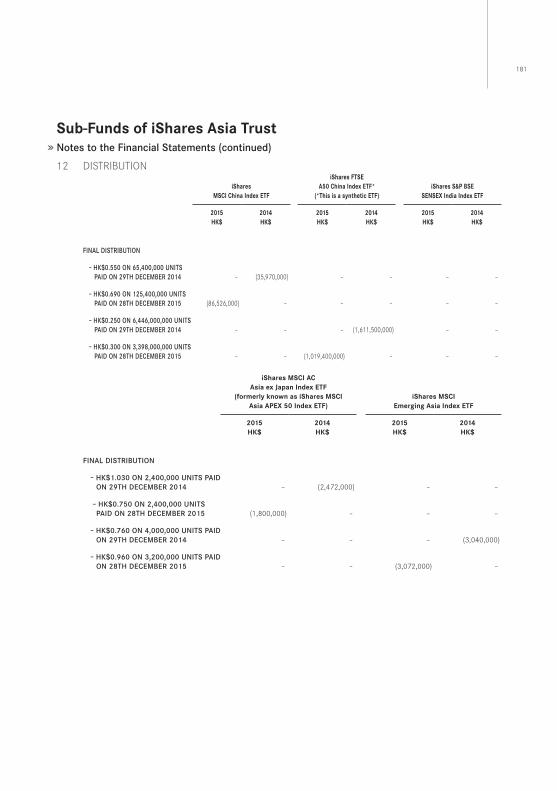
181
Sub-funds of iShares Asia TrustNotes to the Financial Statements (continued)
12 DISTRIBUTION
iSharesMSCi China index eTf
iShares fTSeA50 China index eTf*
(*This is a synthetic eTf)iShares S&p BSe
SenSeX india index eTf
2015hK$
2014hK$
2015hK$
2014hK$
2015hK$
2014hK$
FINAl DISTRIBUTIoN
– HK$0.550 oN 65,400,000 UNITS PAID oN 29TH DECEMBER 2014 – (35,970,000) – – – –
– HK$0.690 oN 125,400,000 UNITS PAID oN 28TH DECEMBER 2015 (86,526,000) – – – – –
– HK$0.250 oN 6,446,000,000 UNITS PAID oN 29TH DECEMBER 2014 – – – (1,611,500,000) – –
– HK$0.300 oN 3,398,000,000 UNITS PAID oN 28TH DECEMBER 2015 – – (1,019,400,000) – – –
iShares MSCi AC Asia ex Japan index eTf
(formerly known as iShares MSCiAsia ApeX 50 index eTf)
iShares MSCiemerging Asia index eTf
2015hK$
2014hK$
2015hK$
2014hK$
FINAl DISTRIBUTIoN
– HK$1.030 oN 2,400,000 UNITS PAID oN 29TH DECEMBER 2014 – (2,472,000) – –
– HK$0.750 oN 2,400,000 UNITS PAID oN 28TH DECEMBER 2015 (1,800,000) – – –
– HK$0.760 oN 4,000,000 UNITS PAID oN 29TH DECEMBER 2014 – – – (3,040,000)
– HK$0.960 oN 3,200,000 UNITS PAID oN 28TH DECEMBER 2015 – – (3,072,000) –

Sub-funds of iShares Asia TrustNotes to the Financial Statements (continued)
iShares CSi300 A-Share index eTf*
(*This is a synthetic eTf)
iShares CSiA-Share energy index eTf*(*This is a synthetic eTf)
2015hK$
2014hK$
2015hK$
2014hK$
FINAl DISTRIBUTIoN
– HK$0.510 oN 13,000,000 UNITS PAID oN 29TH DECEMBER 2014 – (6,630,000) – –
– HK$0.440 oN 10,000,000 UNITS PAID oN 28TH DECEMBER 2015 (4,400,000) – – –
– HK$0.080 oN 5,500,000 UNITS PAID oN 29TH DECEMBER 2014 – – – (440,000)
– HK$0.130 oN 2,500,000 UNITS PAID oN 28TH DECEMBER 2015 – – (325,000) –
iShares CSiA-Share Materials index eTf*
(*This is a synthetic eTf)
iShares CSiA-Share financials index eTf*
(*This is a synthetic eTf)
2015hK$
2014hK$
2015hK$
2014hK$
FINAl DISTRIBUTIoN
– HK$0.090 oN 1,000,000 UNITS PAID oN 28TH DECEMBER 2015 (90,000) – – –
– HK$0.290 oN 14,000,000 UNITS PAID oN 29TH DECEMBER 2014 – – – (4,060,000)
– HK$0.370 oN 8,000,000 UNITS PAID oN 28TH DECEMBER 2015 – – (2,960,000) –
iShares CSiA-Share infrastructure index eTf*
(*This is a synthetic eTf)
iShares CSiA-Share Consumer discretionary index
eTf* (*This is a synthetic eTf)
2015hK$
2014hK$
2015hK$
2014hK$
FINAl DISTRIBUTIoN
– HK$0.190 oN 6,000,000 UNITS PAID oN 29TH DECEMBER 2014 – (1,140,000) – –
– HK$0.350 oN 3,000,000 UNITS PAID oN 28TH DECEMBER 2015 (1,050,000) – – –
– HK$0.290 oN 5,000,000 UNITS PAID oN 29TH DECEMBER 2014 – – – (1,450,000)
– HK$0.490 oN 1,500,000 UNITS PAID oN 28TH DECEMBER 2015 – – (735,000) –
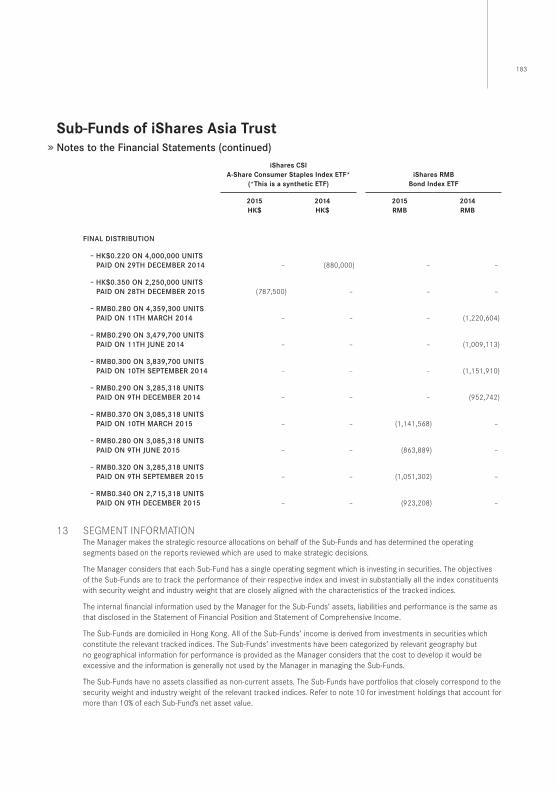
183
Sub-funds of iShares Asia TrustNotes to the Financial Statements (continued)
iShares CSiA-Share Consumer Staples index eTf*
(*This is a synthetic eTf)iShares RMB
Bond index eTf
2015hK$
2014hK$
2015RMB
2014RMB
FINAl DISTRIBUTIoN
– HK$0.220 oN 4,000,000 UNITS PAID oN 29TH DECEMBER 2014 – (880,000) – –
– HK$0.350 oN 2,250,000 UNITS PAID oN 28TH DECEMBER 2015 (787,500) – – –
– RMB0.280 oN 4,359,300 UNITS PAID oN 11TH MARCH 2014 – – – (1,220,604)
– RMB0.290 oN 3,479,700 UNITS PAID oN 11TH JUNE 2014 – – – (1,009,113)
– RMB0.300 oN 3,839,700 UNITS PAID oN 10TH SEPTEMBER 2014 – – – (1,151,910)
– RMB0.290 oN 3,285,318 UNITS PAID oN 9TH DECEMBER 2014 – – – (952,742)
– RMB0.370 oN 3,085,318 UNITS PAID oN 10TH MARCH 2015 – – (1,141,568) –
– RMB0.280 oN 3,085,318 UNITS PAID oN 9TH JUNE 2015 – – (863,889) –
– RMB0.320 oN 3,285,318 UNITS PAID oN 9TH SEPTEMBER 2015 – – (1,051,302) –
– RMB0.340 oN 2,715,318 UNITS PAID oN 9TH DECEMBER 2015 – – (923,208) –
13 SEGMENT INFORMATIONThe Manager makes the strategic resource allocations on behalf of the Sub-Funds and has determined the operating segments based on the reports reviewed which are used to make strategic decisions .
The Manager considers that each Sub-Fund has a single operating segment which is investing in securities . The objectives of the Sub-Funds are to track the performance of their respective index and invest in substantially all the index constituents with security weight and industry weight that are closely aligned with the characteristics of the tracked indices .
The internal financial information used by the Manager for the Sub-Funds’ assets, liabilities and performance is the same as that disclosed in the Statement of Financial Position and Statement of Comprehensive Income .
The Sub-Funds are domiciled in Hong Kong . All of the Sub-Funds’ income is derived from investments in securities which constitute the relevant tracked indices . The Sub-Funds’ investments have been categorized by relevant geography but no geographical information for performance is provided as the Manager considers that the cost to develop it would be excessive and the information is generally not used by the Manager in managing the Sub-Funds .
The Sub-Funds have no assets classified as non-current assets . The Sub-Funds have portfolios that closely correspond to the security weight and industry weight of the relevant tracked indices . Refer to note 10 for investment holdings that account for more than 10% of each Sub-Fund’s net asset value .
Sub-funds of iShares Asia TrustNotes to the Financial Statements (continued)
14 SUBSEQUENT EVENTThe Trust launched a new Sub-Fund, namely iShares MSCI China A International Index ETF on 25th January 2016 and commenced trading under the stock codes 83162 for the RMB counter and 3162 for the HKD counter on The Stock Exchange of Hong Kong Limited (the “SEHK”) on 28th January 2016 .
15 APPROVAL OF FINANCIAL STATEMENTSThe financial statements were approved by the Trustee and the Manager on 21st April 2016 .
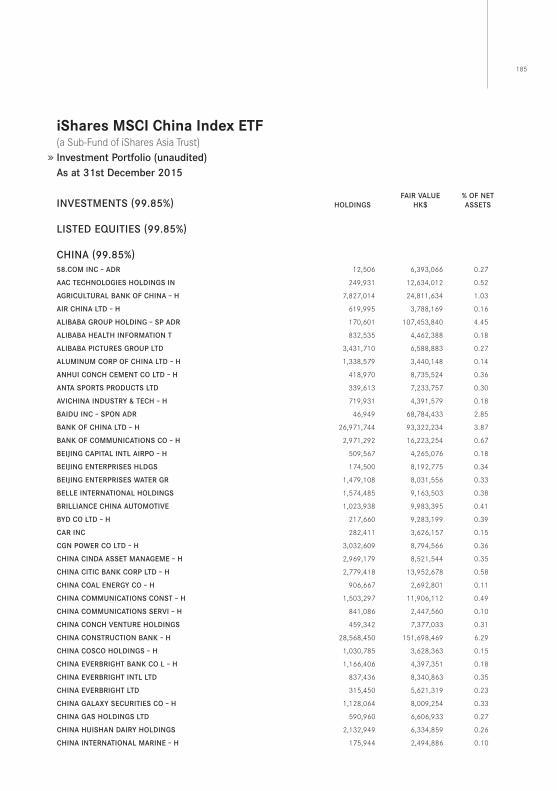
185
iShares MSCi China index eTf (a Sub-Fund of iShares Asia Trust) Investment Portfolio (unaudited)As at 31st December 2015
INVESTMENTS (99.85%) HolDINgSFAIR VAlUE
HK$% oF NET ASSETS
lISTED EqUITIES (99.85%)
CHINA (99.85%)58.CoM INC – ADR 12,506 6,393,066 0 .27
AAC TECHNologIES HolDINgS IN 249,931 12,634,012 0 .52
AgRICUlTURAl BANK oF CHINA – H 7,827,014 24,811,634 1 .03
AIR CHINA lTD – H 619,995 3,788,169 0 .16
AlIBABA gRoUP HolDINg – SP ADR 170,601 107,453,840 4 .45
AlIBABA HEAlTH INFoRMATIoN T 832,535 4,462,388 0 .18
AlIBABA PICTURES gRoUP lTD 3,431,710 6,588,883 0 .27
AlUMINUM CoRP oF CHINA lTD – H 1,338,579 3,440,148 0 .14
ANHUI CoNCH CEMENT Co lTD – H 418,970 8,735,524 0 .36
ANTA SPoRTS PRoDUCTS lTD 339,613 7,233,757 0 .30
AVICHINA INDUSTRy ﹠ TECH – H 719,931 4,391,579 0 .18
BAIDU INC – SPoN ADR 46,949 68,784,433 2 .85
BANK oF CHINA lTD – H 26,971,744 93,322,234 3 .87
BANK oF CoMMUNICATIoNS Co – H 2,971,292 16,223,254 0 .67
BEIJINg CAPITAl INTl AIRPo – H 509,567 4,265,076 0 .18
BEIJINg ENTERPRISES HlDgS 174,500 8,192,775 0 .34
BEIJINg ENTERPRISES wATER gR 1,479,108 8,031,556 0 .33
BEllE INTERNATIoNAl HolDINgS 1,574,485 9,163,503 0 .38
BRIllIANCE CHINA AUToMoTIVE 1,023,938 9,983,395 0 .41
ByD Co lTD – H 217,660 9,283,199 0 .39
CAR INC 282,411 3,626,157 0 .15
CgN PowER Co lTD – H 3,032,609 8,794,566 0 .36
CHINA CINDA ASSET MANAgEME – H 2,969,179 8,521,544 0 .35
CHINA CITIC BANK CoRP lTD – H 2,779,418 13,952,678 0 .58
CHINA CoAl ENERgy Co – H 906,667 2,692,801 0 .11
CHINA CoMMUNICATIoNS CoNST – H 1,503,297 11,906,112 0 .49
CHINA CoMMUNICATIoNS SERVI – H 841,086 2,447,560 0 .10
CHINA CoNCH VENTURE HolDINgS 459,342 7,377,033 0 .31
CHINA CoNSTRUCTIoN BANK – H 28,568,450 151,698,469 6 .29
CHINA CoSCo HolDINgS – H 1,030,785 3,628,363 0 .15
CHINA EVERBRIgHT BANK Co l – H 1,166,406 4,397,351 0 .18
CHINA EVERBRIgHT INTl lTD 837,436 8,340,863 0 .35
CHINA EVERBRIgHT lTD 315,450 5,621,319 0 .23
CHINA gAlAXy SECURITIES Co – H 1,128,064 8,009,254 0 .33
CHINA gAS HolDINgS lTD 590,960 6,606,933 0 .27
CHINA HUISHAN DAIRy HolDINgS 2,132,949 6,334,859 0 .26
CHINA INTERNATIoNAl MARINE – H 175,944 2,494,886 0 .10
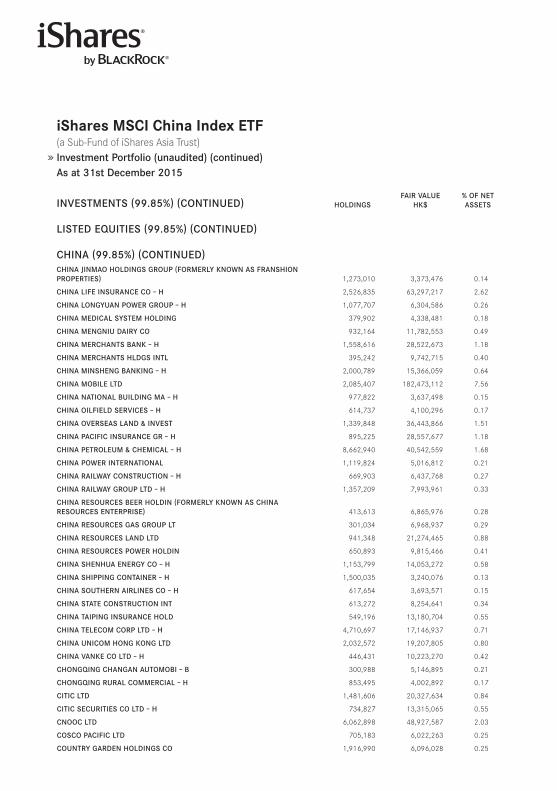
iShares MSCi China index eTf (a Sub-Fund of iShares Asia Trust) Investment Portfolio (unaudited) (continued)As at 31st December 2015
INVESTMENTS (99.85%) (CoNTINUED) HolDINgSFAIR VAlUE
HK$% oF NET ASSETS
lISTED EqUITIES (99.85%) (CoNTINUED)
CHINA (99.85%) (CoNTINUED)CHINA JINMAo HolDINgS gRoUP (FoRMERly KNowN AS FRANSHIoN PRoPERTIES) 1,273,010 3,373,476 0 .14
CHINA lIFE INSURANCE Co – H 2,526,835 63,297,217 2 .62
CHINA loNgyUAN PowER gRoUP – H 1,077,707 6,304,586 0 .26
CHINA MEDICAl SySTEM HolDINg 379,902 4,338,481 0 .18
CHINA MENgNIU DAIRy Co 932,164 11,782,553 0 .49
CHINA MERCHANTS BANK – H 1,558,616 28,522,673 1 .18
CHINA MERCHANTS HlDgS INTl 395,242 9,742,715 0 .40
CHINA MINSHENg BANKINg – H 2,000,789 15,366,059 0 .64
CHINA MoBIlE lTD 2,085,407 182,473,112 7 .56
CHINA NATIoNAl BUIlDINg MA – H 977,822 3,637,498 0 .15
CHINA oIlFIElD SERVICES – H 614,737 4,100,296 0 .17
CHINA oVERSEAS lAND ﹠ INVEST 1,339,848 36,443,866 1 .51
CHINA PACIFIC INSURANCE gR – H 895,225 28,557,677 1 .18
CHINA PETRolEUM ﹠ CHEMICAl – H 8,662,940 40,542,559 1 .68
CHINA PowER INTERNATIoNAl 1,119,824 5,016,812 0 .21
CHINA RAIlwAy CoNSTRUCTIoN – H 669,903 6,437,768 0 .27
CHINA RAIlwAy gRoUP lTD – H 1,357,209 7,993,961 0 .33
CHINA RESoURCES BEER HolDIN (FoRMERly KNowN AS CHINA RESoURCES ENTERPRISE) 413,613 6,865,976 0 .28
CHINA RESoURCES gAS gRoUP lT 301,034 6,968,937 0 .29
CHINA RESoURCES lAND lTD 941,348 21,274,465 0 .88
CHINA RESoURCES PowER HolDIN 650,893 9,815,466 0 .41
CHINA SHENHUA ENERgy Co – H 1,153,799 14,053,272 0 .58
CHINA SHIPPINg CoNTAINER – H 1,500,035 3,240,076 0 .13
CHINA SoUTHERN AIRlINES Co – H 617,654 3,693,571 0 .15
CHINA STATE CoNSTRUCTIoN INT 613,272 8,254,641 0 .34
CHINA TAIPINg INSURANCE HolD 549,196 13,180,704 0 .55
CHINA TElECoM CoRP lTD – H 4,710,697 17,146,937 0 .71
CHINA UNICoM HoNg KoNg lTD 2,032,572 19,207,805 0 .80
CHINA VANKE Co lTD – H 446,431 10,223,270 0 .42
CHoNgqINg CHANgAN AUToMoBI – B 300,988 5,146,895 0 .21
CHoNgqINg RURAl CoMMERCIAl – H 853,495 4,002,892 0 .17
CITIC lTD 1,481,606 20,327,634 0 .84
CITIC SECURITIES Co lTD – H 734,827 13,315,065 0 .55
CNooC lTD 6,062,898 48,927,587 2 .03
CoSCo PACIFIC lTD 705,183 6,022,263 0 .25
CoUNTRy gARDEN HolDINgS Co 1,916,990 6,096,028 0 .25
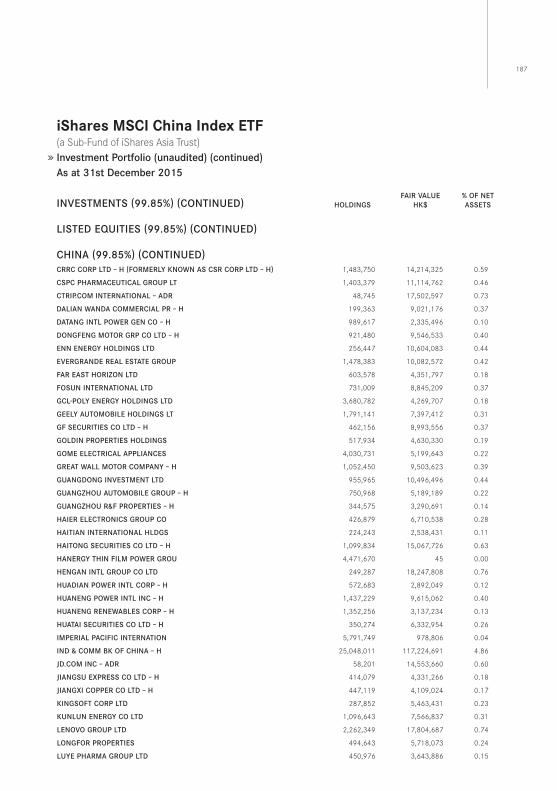
187
iShares MSCi China index eTf (a Sub-Fund of iShares Asia Trust) Investment Portfolio (unaudited) (continued)As at 31st December 2015
INVESTMENTS (99.85%) (CoNTINUED) HolDINgSFAIR VAlUE
HK$% oF NET ASSETS
lISTED EqUITIES (99.85%) (CoNTINUED)
CHINA (99.85%) (CoNTINUED)CRRC CoRP lTD – H (FoRMERly KNowN AS CSR CoRP lTD – H) 1,483,750 14,214,325 0 .59
CSPC PHARMACEUTICAl gRoUP lT 1,403,379 11,114,762 0 .46
CTRIP.CoM INTERNATIoNAl – ADR 48,745 17,502,597 0 .73
DAlIAN wANDA CoMMERCIAl PR – H 199,363 9,021,176 0 .37
DATANg INTl PowER gEN Co – H 989,617 2,335,496 0 .10
DoNgFENg MoToR gRP Co lTD – H 921,480 9,546,533 0 .40
ENN ENERgy HolDINgS lTD 256,447 10,604,083 0 .44
EVERgRANDE REAl ESTATE gRoUP 1,478,383 10,082,572 0 .42
FAR EAST HoRIzoN lTD 603,578 4,351,797 0 .18
FoSUN INTERNATIoNAl lTD 731,009 8,845,209 0 .37
gCl-Poly ENERgy HolDINgS lTD 3,680,782 4,269,707 0 .18
gEEly AUToMoBIlE HolDINgS lT 1,791,141 7,397,412 0 .31
gF SECURITIES Co lTD – H 462,156 8,993,556 0 .37
golDIN PRoPERTIES HolDINgS 517,934 4,630,330 0 .19
goME ElECTRICAl APPlIANCES 4,030,731 5,199,643 0 .22
gREAT wAll MoToR CoMPANy – H 1,052,450 9,503,623 0 .39
gUANgDoNg INVESTMENT lTD 955,965 10,496,496 0 .44
gUANgzHoU AUToMoBIlE gRoUP – H 750,968 5,189,189 0 .22
gUANgzHoU R﹠F PRoPERTIES – H 344,575 3,290,691 0 .14
HAIER ElECTRoNICS gRoUP Co 426,879 6,710,538 0 .28
HAITIAN INTERNATIoNAl HlDgS 224,243 2,538,431 0 .11
HAIToNg SECURITIES Co lTD – H 1,099,834 15,067,726 0 .63
HANERgy THIN FIlM PowER gRoU 4,471,670 45 0 .00
HENgAN INTl gRoUP Co lTD 249,287 18,247,808 0 .76
HUADIAN PowER INTl CoRP – H 572,683 2,892,049 0 .12
HUANENg PowER INTl INC – H 1,437,229 9,615,062 0 .40
HUANENg RENEwABlES CoRP – H 1,352,256 3,137,234 0 .13
HUATAI SECURITIES Co lTD – H 350,274 6,332,954 0 .26
IMPERIAl PACIFIC INTERNATIoN 5,791,749 978,806 0 .04
IND ﹠ CoMM BK oF CHINA – H 25,048,011 117,224,691 4 .86
JD.CoM INC – ADR 58,201 14,553,660 0 .60
JIANgSU EXPRESS Co lTD – H 414,079 4,331,266 0 .18
JIANgXI CoPPER Co lTD – H 447,119 4,109,024 0 .17
KINgSoFT CoRP lTD 287,852 5,463,431 0 .23
KUNlUN ENERgy Co lTD 1,096,643 7,566,837 0 .31
lENoVo gRoUP lTD 2,262,349 17,804,687 0 .74
loNgFoR PRoPERTIES 494,643 5,718,073 0 .24
lUyE PHARMA gRoUP lTD 450,976 3,643,886 0 .15
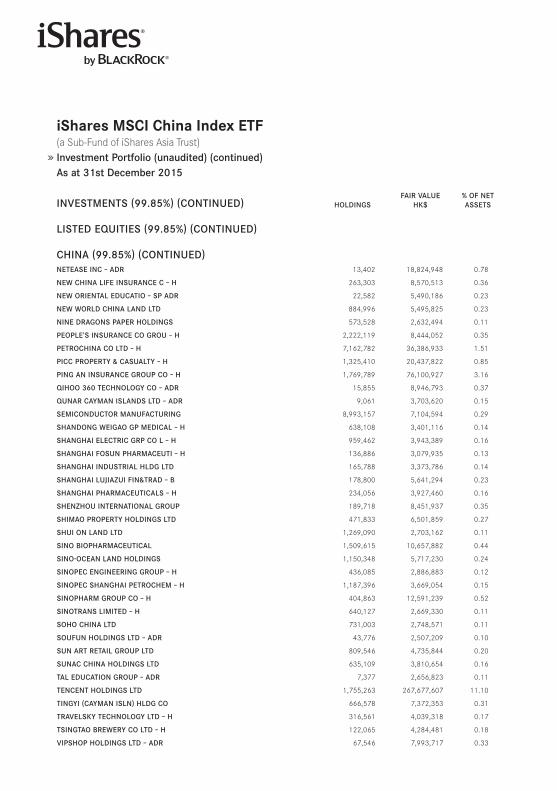
iShares MSCi China index eTf (a Sub-Fund of iShares Asia Trust) Investment Portfolio (unaudited) (continued)As at 31st December 2015
INVESTMENTS (99.85%) (CoNTINUED) HolDINgSFAIR VAlUE
HK$% oF NET ASSETS
lISTED EqUITIES (99.85%) (CoNTINUED)
CHINA (99.85%) (CoNTINUED)NETEASE INC – ADR 13,402 18,824,948 0 .78
NEw CHINA lIFE INSURANCE C – H 263,303 8,570,513 0 .36
NEw oRIENTAl EDUCATIo – SP ADR 22,582 5,490,186 0 .23
NEw woRlD CHINA lAND lTD 884,996 5,495,825 0 .23
NINE DRAgoNS PAPER HolDINgS 573,528 2,632,494 0 .11
PEoPlE’S INSURANCE Co gRoU – H 2,222,119 8,444,052 0 .35
PETRoCHINA Co lTD – H 7,162,782 36,386,933 1 .51
PICC PRoPERTy ﹠ CASUAlTy – H 1,325,410 20,437,822 0 .85
PINg AN INSURANCE gRoUP Co – H 1,769,789 76,100,927 3 .16
qIHoo 360 TECHNology Co – ADR 15,855 8,946,793 0 .37
qUNAR CAyMAN ISlANDS lTD – ADR 9,061 3,703,620 0 .15
SEMICoNDUCToR MANUFACTURINg 8,993,157 7,104,594 0 .29
SHANDoNg wEIgAo gP MEDICAl – H 638,108 3,401,116 0 .14
SHANgHAI ElECTRIC gRP Co l – H 959,462 3,943,389 0 .16
SHANgHAI FoSUN PHARMACEUTI – H 136,886 3,079,935 0 .13
SHANgHAI INDUSTRIAl HlDg lTD 165,788 3,373,786 0 .14
SHANgHAI lUJIAzUI FIN﹠TRAD – B 178,800 5,641,294 0 .23
SHANgHAI PHARMACEUTICAlS – H 234,056 3,927,460 0 .16
SHENzHoU INTERNATIoNAl gRoUP 189,718 8,451,937 0 .35
SHIMAo PRoPERTy HolDINgS lTD 471,833 6,501,859 0 .27
SHUI oN lAND lTD 1,269,090 2,703,162 0 .11
SINo BIoPHARMACEUTICAl 1,509,615 10,657,882 0 .44
SINo-oCEAN lAND HolDINgS 1,150,348 5,717,230 0 .24
SINoPEC ENgINEERINg gRoUP – H 436,085 2,886,883 0 .12
SINoPEC SHANgHAI PETRoCHEM – H 1,187,396 3,669,054 0 .15
SINoPHARM gRoUP Co – H 404,863 12,591,239 0 .52
SINoTRANS lIMITED – H 640,127 2,669,330 0 .11
SoHo CHINA lTD 731,003 2,748,571 0 .11
SoUFUN HolDINgS lTD – ADR 43,776 2,507,209 0 .10
SUN ART RETAIl gRoUP lTD 809,546 4,735,844 0 .20
SUNAC CHINA HolDINgS lTD 635,109 3,810,654 0 .16
TAl EDUCATIoN gRoUP – ADR 7,377 2,656,823 0 .11
TENCENT HolDINgS lTD 1,755,263 267,677,607 11 .10
TINgyI (CAyMAN ISlN) HlDg Co 666,578 7,372,353 0 .31
TRAVElSKy TECHNology lTD – H 316,561 4,039,318 0 .17
TSINgTAo BREwERy Co lTD – H 122,065 4,284,481 0 .18
VIPSHoP HolDINgS lTD – ADR 67,546 7,993,717 0 .33
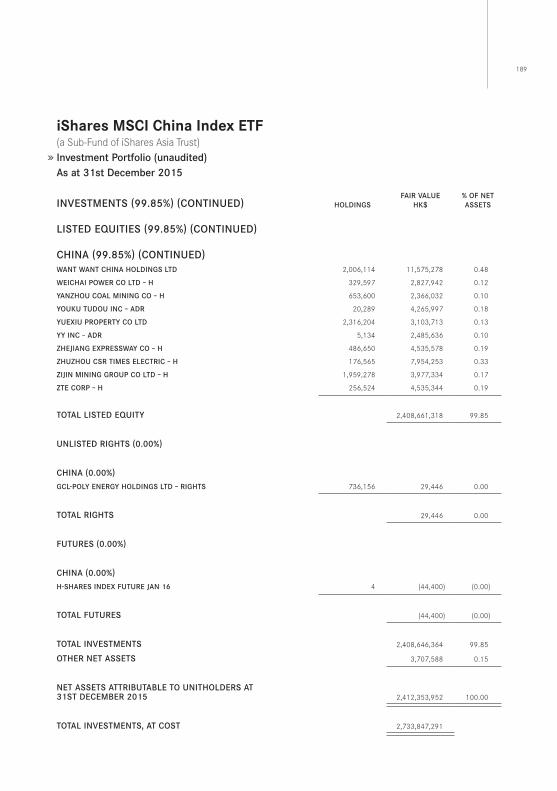
189
iShares MSCi China index eTf (a Sub-Fund of iShares Asia Trust) Investment Portfolio (unaudited)As at 31st December 2015
INVESTMENTS (99.85%) (CoNTINUED) HolDINgSFAIR VAlUE
HK$% oF NET ASSETS
lISTED EqUITIES (99.85%) (CoNTINUED)
CHINA (99.85%) (CoNTINUED)wANT wANT CHINA HolDINgS lTD 2,006,114 11,575,278 0 .48
wEICHAI PowER Co lTD – H 329,597 2,827,942 0 .12
yANzHoU CoAl MININg Co – H 653,600 2,366,032 0 .10
yoUKU TUDoU INC – ADR 20,289 4,265,997 0 .18
yUEXIU PRoPERTy Co lTD 2,316,204 3,103,713 0 .13
yy INC – ADR 5,134 2,485,636 0 .10
zHEJIANg EXPRESSwAy Co – H 486,650 4,535,578 0 .19
zHUzHoU CSR TIMES ElECTRIC – H 176,565 7,954,253 0 .33
zIJIN MININg gRoUP Co lTD – H 1,959,278 3,977,334 0 .17
zTE CoRP – H 256,524 4,535,344 0 .19
ToTAl lISTED EqUITy 2,408,661,318 99 .85
UNlISTED RIgHTS (0.00%)
CHINA (0.00%)
gCl-Poly ENERgy HolDINgS lTD – RIgHTS 736,156 29,446 0 .00
ToTAl RIgHTS 29,446 0 .00
FUTURES (0.00%)
CHINA (0.00%)
H-SHARES INDEX FUTURE JAN 16 4 (44,400) (0 .00)
ToTAl FUTURES (44,400) (0 .00)
ToTAl INVESTMENTS 2,408,646,364 99 .85
oTHER NET ASSETS 3,707,588 0 .15
NET ASSETS ATTRIBUTABlE To UNITHolDERS AT 31ST DECEMBER 2015 2,412,353,952 100 .00
ToTAl INVESTMENTS, AT CoST 2,733,847,291

iShares MSCi China index eTf (a Sub-Fund of iShares Asia Trust) Statement of Movements in Investment Portfolio (unaudited)For the year ended 31st December 2015
HolDINgS
INVESTMENTS 2014 ADDITIoNSCoRPoRATE
ACTIoN DISPoSAlS 2015
lISTED EqUITIES58.CoM INC – ADR – 12,935 – 429 12,506
AAC TECHNologIES HolDINgS IN 148,777 398,096 – 296,942 249,931
AgRICUlTURAl BANK oF CHINA – H 4,177,548 12,022,036 – 8,372,570 7,827,014
AIR CHINA lTD – H 386,453 986,166 – 752,624 619,995
AlIBABA gRoUP HolDINg – SP ADR – 176,442 – 5,841 170,601
AlIBABA HEAlTH INFoRMATIoN T 495,998 1,346,733 – 1,010,196 832,535
AlIBABA PICTURES gRoUP lTD 860,000 5,586,254 – 3,014,544 3,431,710
AlUMINUM CoRP oF CHINA lTD – H 796,899 2,180,681 – 1,639,001 1,338,579
ANHUI CoNCH CEMENT Co lTD – H 235,746 653,192 – 469,968 418,970
ANTA SPoRTS PRoDUCTS lTD 191,817 530,584 – 382,788 339,613
AVICHINA INDUSTRy ﹠ TECH – H 444,272 1,190,126 – 914,467 719,931
BAIDU INC – SPoN ADR – 48,556 – 1,607 46,949
BANK oF CHINA lTD – H 15,550,964 42,754,055 – 31,333,275 26,971,744
BANK oF CoMMUNICATIoNS Co – H 1,697,358 4,681,117 – 3,407,183 2,971,292
BBMg CoRPoRATIoN – H 246,162 654,400 – 900,562 –
BEIJINg CAPITAl INTl AIRPo – H 285,763 796,222 – 572,418 509,567
BEIJINg ENTERPRISES HlDgS 103,003 273,118 – 201,621 174,500
BEIJINg ENTERPRISES wATER gR 875,743 2,382,863 – 1,779,498 1,479,108
BEllE INTERNATIoNAl HolDINgS 925,116 2,527,273 – 1,877,904 1,574,485
BRIllIANCE CHINA AUToMoTIVE 579,875 1,604,044 – 1,159,981 1,023,938
ByD Co lTD – H 129,303 347,950 – 259,593 217,660
CAR INC – 291,411 – 9,000 282,411
CgN PowER Co lTD – H 1,045,000 4,971,837 – 2,984,228 3,032,609
CHAoDA MoDERN AgRICUlTURE 690,100 – – 690,100 –
CHINA AgRI-INDUSTRIES HlDgS 463,387 1,403,092 – 1,866,479 –
CHINA CINDA ASSET MANAgEME – H 1,034,410 5,015,461 – 3,080,692 2,969,179
CHINA CITIC BANK CoRP lTD – H 1,592,015 4,393,221 – 3,205,818 2,779,418
CHINA CNR CoRP lTD – H – 1,039,792 – 1,039,792 –
CHINA CoAl ENERgy Co – H 829,972 2,098,347 – 2,021,652 906,667
CHINA CoMMUNICATIoNS CoNST – H 850,888 2,354,359 – 1,701,950 1,503,297
CHINA CoMMUNICATIoNS SERVI – H 482,442 1,320,733 – 962,089 841,086
CHINA CoNCH VENTURE HolDINgS – 872,717 – 413,375 459,342
CHINA CoNSTRUCTIoN BANK – H 14,115,590 45,007,809 – 30,554,949 28,568,450
CHINA CoSCo HolDINgS – H 471,303 1,424,867 – 865,385 1,030,785
CHINA EVERBRIgHT BANK Co l – H 555,000 1,848,419 – 1,237,013 1,166,406
CHINA EVERBRIgHT INTl lTD 498,203 1,341,475 – 1,002,242 837,436
CHINA EVERBRIgHT lTD 159,031 492,062 – 335,643 315,450
CHINA gAlAXy SECURITIES Co – H 311,530 2,049,849 – 1,233,315 1,128,064
CHINA gAS HolDINgS lTD 406,850 1,061,410 – 877,300 590,960
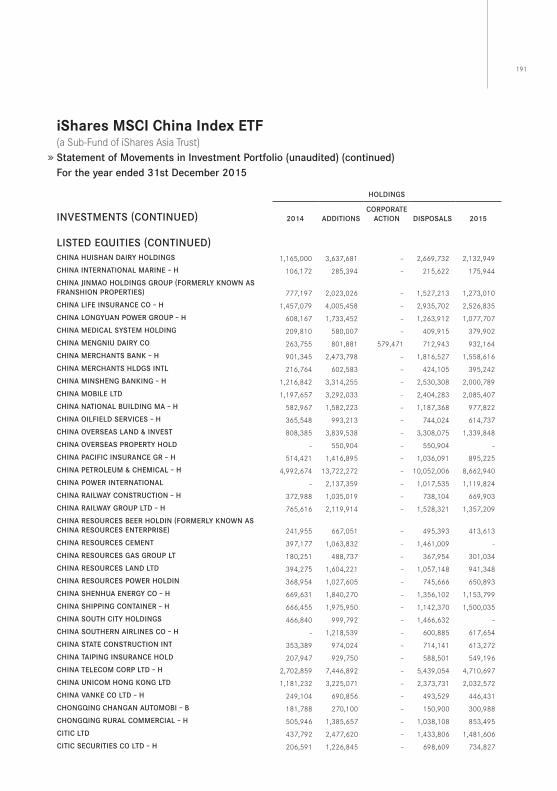
191
iShares MSCi China index eTf (a Sub-Fund of iShares Asia Trust) Statement of Movements in Investment Portfolio (unaudited) (continued)For the year ended 31st December 2015
HolDINgS
INVESTMENTS (CoNTINUED) 2014 ADDITIoNSCoRPoRATE
ACTIoN DISPoSAlS 2015
lISTED EqUITIES (CoNTINUED)CHINA HUISHAN DAIRy HolDINgS 1,165,000 3,637,681 – 2,669,732 2,132,949
CHINA INTERNATIoNAl MARINE – H 106,172 285,394 – 215,622 175,944
CHINA JINMAo HolDINgS gRoUP (FoRMERly KNowN AS FRANSHIoN PRoPERTIES) 777,197 2,023,026 – 1,527,213 1,273,010
CHINA lIFE INSURANCE Co – H 1,457,079 4,005,458 – 2,935,702 2,526,835
CHINA loNgyUAN PowER gRoUP – H 608,167 1,733,452 – 1,263,912 1,077,707
CHINA MEDICAl SySTEM HolDINg 209,810 580,007 – 409,915 379,902
CHINA MENgNIU DAIRy Co 263,755 801,881 579,471 712,943 932,164
CHINA MERCHANTS BANK – H 901,345 2,473,798 – 1,816,527 1,558,616
CHINA MERCHANTS HlDgS INTl 216,764 602,583 – 424,105 395,242
CHINA MINSHENg BANKINg – H 1,216,842 3,314,255 – 2,530,308 2,000,789
CHINA MoBIlE lTD 1,197,657 3,292,033 – 2,404,283 2,085,407
CHINA NATIoNAl BUIlDINg MA – H 582,967 1,582,223 – 1,187,368 977,822
CHINA oIlFIElD SERVICES – H 365,548 993,213 – 744,024 614,737
CHINA oVERSEAS lAND ﹠ INVEST 808,385 3,839,538 – 3,308,075 1,339,848
CHINA oVERSEAS PRoPERTy HolD – 550,904 – 550,904 –
CHINA PACIFIC INSURANCE gR – H 514,421 1,416,895 – 1,036,091 895,225
CHINA PETRolEUM ﹠ CHEMICAl – H 4,992,674 13,722,272 – 10,052,006 8,662,940
CHINA PowER INTERNATIoNAl – 2,137,359 – 1,017,535 1,119,824
CHINA RAIlwAy CoNSTRUCTIoN – H 372,988 1,035,019 – 738,104 669,903
CHINA RAIlwAy gRoUP lTD – H 765,616 2,119,914 – 1,528,321 1,357,209
CHINA RESoURCES BEER HolDIN (FoRMERly KNowN AS CHINA RESoURCES ENTERPRISE) 241,955 667,051 – 495,393 413,613
CHINA RESoURCES CEMENT 397,177 1,063,832 – 1,461,009 –
CHINA RESoURCES gAS gRoUP lT 180,251 488,737 – 367,954 301,034
CHINA RESoURCES lAND lTD 394,275 1,604,221 – 1,057,148 941,348
CHINA RESoURCES PowER HolDIN 368,954 1,027,605 – 745,666 650,893
CHINA SHENHUA ENERgy Co – H 669,631 1,840,270 – 1,356,102 1,153,799
CHINA SHIPPINg CoNTAINER – H 666,455 1,975,950 – 1,142,370 1,500,035
CHINA SoUTH CITy HolDINgS 466,840 999,792 – 1,466,632 –
CHINA SoUTHERN AIRlINES Co – H – 1,218,539 – 600,885 617,654
CHINA STATE CoNSTRUCTIoN INT 353,389 974,024 – 714,141 613,272
CHINA TAIPINg INSURANCE HolD 207,947 929,750 – 588,501 549,196
CHINA TElECoM CoRP lTD – H 2,702,859 7,446,892 – 5,439,054 4,710,697
CHINA UNICoM HoNg KoNg lTD 1,181,232 3,225,071 – 2,373,731 2,032,572
CHINA VANKE Co lTD – H 249,104 690,856 – 493,529 446,431
CHoNgqINg CHANgAN AUToMoBI – B 181,788 270,100 – 150,900 300,988
CHoNgqINg RURAl CoMMERCIAl – H 505,946 1,385,657 – 1,038,108 853,495
CITIC lTD 437,792 2,477,620 – 1,433,806 1,481,606
CITIC SECURITIES Co lTD – H 206,591 1,226,845 – 698,609 734,827
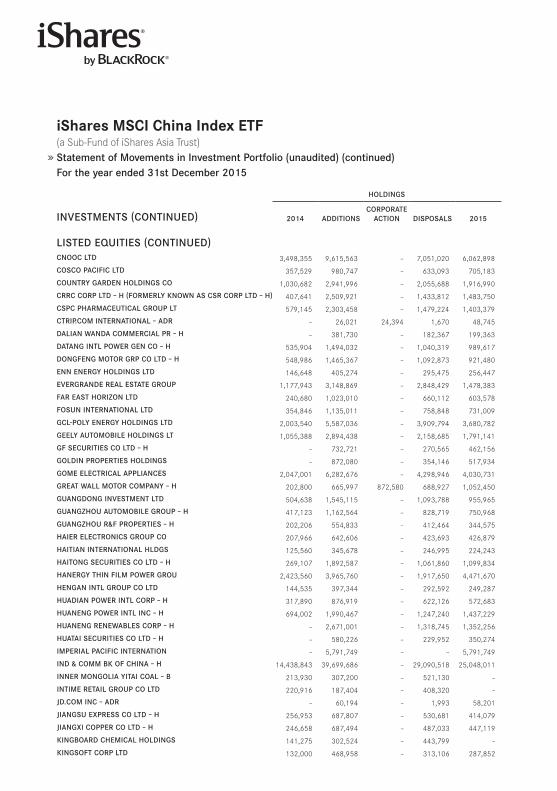
iShares MSCi China index eTf (a Sub-Fund of iShares Asia Trust) Statement of Movements in Investment Portfolio (unaudited) (continued)For the year ended 31st December 2015
HolDINgS
INVESTMENTS (CoNTINUED) 2014 ADDITIoNSCoRPoRATE
ACTIoN DISPoSAlS 2015
lISTED EqUITIES (CoNTINUED)CNooC lTD 3,498,355 9,615,563 – 7,051,020 6,062,898
CoSCo PACIFIC lTD 357,529 980,747 – 633,093 705,183
CoUNTRy gARDEN HolDINgS Co 1,030,682 2,941,996 – 2,055,688 1,916,990
CRRC CoRP lTD – H (FoRMERly KNowN AS CSR CoRP lTD – H) 407,641 2,509,921 – 1,433,812 1,483,750
CSPC PHARMACEUTICAl gRoUP lT 579,145 2,303,458 – 1,479,224 1,403,379
CTRIP.CoM INTERNATIoNAl – ADR – 26,021 24,394 1,670 48,745
DAlIAN wANDA CoMMERCIAl PR – H – 381,730 – 182,367 199,363
DATANg INTl PowER gEN Co – H 535,904 1,494,032 – 1,040,319 989,617
DoNgFENg MoToR gRP Co lTD – H 548,986 1,465,367 – 1,092,873 921,480
ENN ENERgy HolDINgS lTD 146,648 405,274 – 295,475 256,447
EVERgRANDE REAl ESTATE gRoUP 1,177,943 3,148,869 – 2,848,429 1,478,383
FAR EAST HoRIzoN lTD 240,680 1,023,010 – 660,112 603,578
FoSUN INTERNATIoNAl lTD 354,846 1,135,011 – 758,848 731,009
gCl-Poly ENERgy HolDINgS lTD 2,003,540 5,587,036 – 3,909,794 3,680,782
gEEly AUToMoBIlE HolDINgS lT 1,055,388 2,894,438 – 2,158,685 1,791,141
gF SECURITIES Co lTD – H – 732,721 – 270,565 462,156
golDIN PRoPERTIES HolDINgS – 872,080 – 354,146 517,934
goME ElECTRICAl APPlIANCES 2,047,001 6,282,676 – 4,298,946 4,030,731
gREAT wAll MoToR CoMPANy – H 202,800 665,997 872,580 688,927 1,052,450
gUANgDoNg INVESTMENT lTD 504,638 1,545,115 – 1,093,788 955,965
gUANgzHoU AUToMoBIlE gRoUP – H 417,123 1,162,564 – 828,719 750,968
gUANgzHoU R﹠F PRoPERTIES – H 202,206 554,833 – 412,464 344,575
HAIER ElECTRoNICS gRoUP Co 207,966 642,606 – 423,693 426,879
HAITIAN INTERNATIoNAl HlDgS 125,560 345,678 – 246,995 224,243
HAIToNg SECURITIES Co lTD – H 269,107 1,892,587 – 1,061,860 1,099,834
HANERgy THIN FIlM PowER gRoU 2,423,560 3,965,760 – 1,917,650 4,471,670
HENgAN INTl gRoUP Co lTD 144,535 397,344 – 292,592 249,287
HUADIAN PowER INTl CoRP – H 317,890 876,919 – 622,126 572,683
HUANENg PowER INTl INC – H 694,002 1,990,467 – 1,247,240 1,437,229
HUANENg RENEwABlES CoRP – H – 2,671,001 – 1,318,745 1,352,256
HUATAI SECURITIES Co lTD – H – 580,226 – 229,952 350,274
IMPERIAl PACIFIC INTERNATIoN – 5,791,749 – – 5,791,749
IND ﹠ CoMM BK oF CHINA – H 14,438,843 39,699,686 – 29,090,518 25,048,011
INNER MoNgolIA yITAI CoAl – B 213,930 307,200 – 521,130 –
INTIME RETAIl gRoUP Co lTD 220,916 187,404 – 408,320 –
JD.CoM INC – ADR – 60,194 – 1,993 58,201
JIANgSU EXPRESS Co lTD – H 256,953 687,807 – 530,681 414,079
JIANgXI CoPPER Co lTD – H 246,658 687,494 – 487,033 447,119
KINgBoARD CHEMICAl HolDINgS 141,275 302,524 – 443,799 –
KINgSoFT CoRP lTD 132,000 468,958 – 313,106 287,852
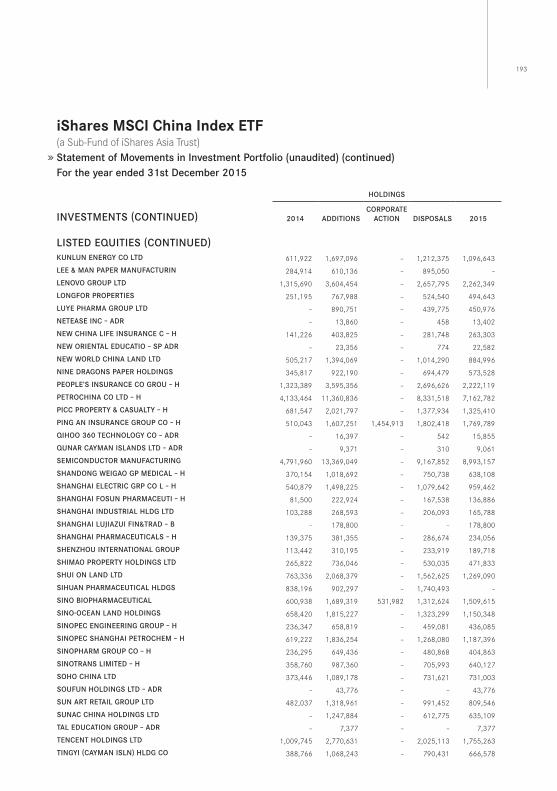
193
iShares MSCi China index eTf (a Sub-Fund of iShares Asia Trust) Statement of Movements in Investment Portfolio (unaudited) (continued)For the year ended 31st December 2015
HolDINgS
INVESTMENTS (CoNTINUED) 2014 ADDITIoNSCoRPoRATE
ACTIoN DISPoSAlS 2015
lISTED EqUITIES (CoNTINUED)KUNlUN ENERgy Co lTD 611,922 1,697,096 – 1,212,375 1,096,643
lEE ﹠ MAN PAPER MANUFACTURIN 284,914 610,136 – 895,050 –
lENoVo gRoUP lTD 1,315,690 3,604,454 – 2,657,795 2,262,349
loNgFoR PRoPERTIES 251,195 767,988 – 524,540 494,643
lUyE PHARMA gRoUP lTD – 890,751 – 439,775 450,976
NETEASE INC – ADR – 13,860 – 458 13,402
NEw CHINA lIFE INSURANCE C – H 141,226 403,825 – 281,748 263,303
NEw oRIENTAl EDUCATIo – SP ADR – 23,356 – 774 22,582
NEw woRlD CHINA lAND lTD 505,217 1,394,069 – 1,014,290 884,996
NINE DRAgoNS PAPER HolDINgS 345,817 922,190 – 694,479 573,528
PEoPlE’S INSURANCE Co gRoU – H 1,323,389 3,595,356 – 2,696,626 2,222,119
PETRoCHINA Co lTD – H 4,133,464 11,360,836 – 8,331,518 7,162,782
PICC PRoPERTy ﹠ CASUAlTy – H 681,547 2,021,797 – 1,377,934 1,325,410
PINg AN INSURANCE gRoUP Co – H 510,043 1,607,251 1,454,913 1,802,418 1,769,789
qIHoo 360 TECHNology Co – ADR – 16,397 – 542 15,855
qUNAR CAyMAN ISlANDS lTD – ADR – 9,371 – 310 9,061
SEMICoNDUCToR MANUFACTURINg 4,791,960 13,369,049 – 9,167,852 8,993,157
SHANDoNg wEIgAo gP MEDICAl – H 370,154 1,018,692 – 750,738 638,108
SHANgHAI ElECTRIC gRP Co l – H 540,879 1,498,225 – 1,079,642 959,462
SHANgHAI FoSUN PHARMACEUTI – H 81,500 222,924 – 167,538 136,886
SHANgHAI INDUSTRIAl HlDg lTD 103,288 268,593 – 206,093 165,788
SHANgHAI lUJIAzUI FIN﹠TRAD – B – 178,800 – – 178,800
SHANgHAI PHARMACEUTICAlS – H 139,375 381,355 – 286,674 234,056
SHENzHoU INTERNATIoNAl gRoUP 113,442 310,195 – 233,919 189,718
SHIMAo PRoPERTy HolDINgS lTD 265,822 736,046 – 530,035 471,833
SHUI oN lAND lTD 763,336 2,068,379 – 1,562,625 1,269,090
SIHUAN PHARMACEUTICAl HlDgS 838,196 902,297 – 1,740,493 –
SINo BIoPHARMACEUTICAl 600,938 1,689,319 531,982 1,312,624 1,509,615
SINo-oCEAN lAND HolDINgS 658,420 1,815,227 – 1,323,299 1,150,348
SINoPEC ENgINEERINg gRoUP – H 236,347 658,819 – 459,081 436,085
SINoPEC SHANgHAI PETRoCHEM – H 619,222 1,836,254 – 1,268,080 1,187,396
SINoPHARM gRoUP Co – H 236,295 649,436 – 480,868 404,863
SINoTRANS lIMITED – H 358,760 987,360 – 705,993 640,127
SoHo CHINA lTD 373,446 1,089,178 – 731,621 731,003
SoUFUN HolDINgS lTD – ADR – 43,776 – – 43,776
SUN ART RETAIl gRoUP lTD 482,037 1,318,961 – 991,452 809,546
SUNAC CHINA HolDINgS lTD – 1,247,884 – 612,775 635,109
TAl EDUCATIoN gRoUP – ADR – 7,377 – – 7,377
TENCENT HolDINgS lTD 1,009,745 2,770,631 – 2,025,113 1,755,263
TINgyI (CAyMAN ISlN) HlDg Co 388,766 1,068,243 – 790,431 666,578
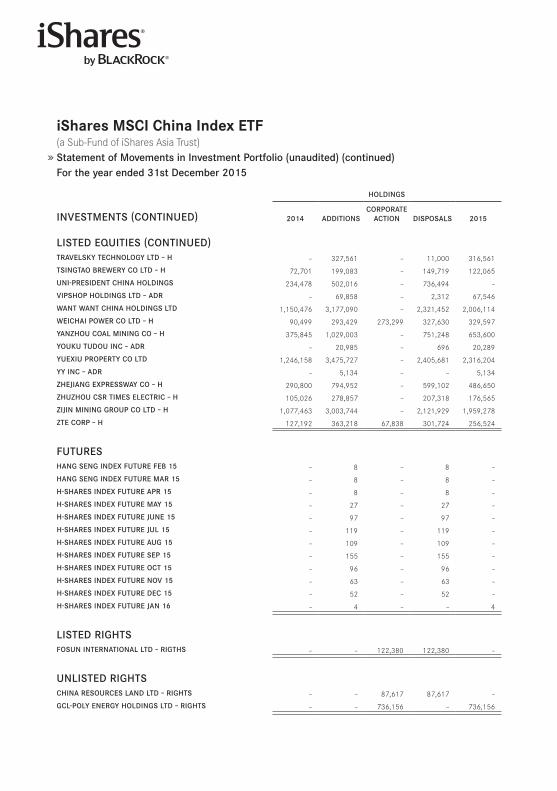
iShares MSCi China index eTf (a Sub-Fund of iShares Asia Trust) Statement of Movements in Investment Portfolio (unaudited) (continued)For the year ended 31st December 2015
HolDINgS
INVESTMENTS (CoNTINUED) 2014 ADDITIoNSCoRPoRATE
ACTIoN DISPoSAlS 2015
lISTED EqUITIES (CoNTINUED)TRAVElSKy TECHNology lTD – H – 327,561 – 11,000 316,561
TSINgTAo BREwERy Co lTD – H 72,701 199,083 – 149,719 122,065
UNI-PRESIDENT CHINA HolDINgS 234,478 502,016 – 736,494 –
VIPSHoP HolDINgS lTD – ADR – 69,858 – 2,312 67,546
wANT wANT CHINA HolDINgS lTD 1,150,476 3,177,090 – 2,321,452 2,006,114
wEICHAI PowER Co lTD – H 90,499 293,429 273,299 327,630 329,597
yANzHoU CoAl MININg Co – H 375,845 1,029,003 – 751,248 653,600
yoUKU TUDoU INC – ADR – 20,985 – 696 20,289
yUEXIU PRoPERTy Co lTD 1,246,158 3,475,727 – 2,405,681 2,316,204
yy INC – ADR – 5,134 – – 5,134
zHEJIANg EXPRESSwAy Co – H 290,800 794,952 – 599,102 486,650
zHUzHoU CSR TIMES ElECTRIC – H 105,026 278,857 – 207,318 176,565
zIJIN MININg gRoUP Co lTD – H 1,077,463 3,003,744 – 2,121,929 1,959,278
zTE CoRP – H 127,192 363,218 67,838 301,724 256,524
FUTURESHANg SENg INDEX FUTURE FEB 15 – 8 – 8 –
HANg SENg INDEX FUTURE MAR 15 – 8 – 8 –
H-SHARES INDEX FUTURE APR 15 – 8 – 8 –
H-SHARES INDEX FUTURE MAy 15 – 27 – 27 –
H-SHARES INDEX FUTURE JUNE 15 – 97 – 97 –
H-SHARES INDEX FUTURE JUl 15 – 119 – 119 –
H-SHARES INDEX FUTURE AUg 15 – 109 – 109 –
H-SHARES INDEX FUTURE SEP 15 – 155 – 155 –
H-SHARES INDEX FUTURE oCT 15 – 96 – 96 –
H-SHARES INDEX FUTURE NoV 15 – 63 – 63 –
H-SHARES INDEX FUTURE DEC 15 – 52 – 52 –
H-SHARES INDEX FUTURE JAN 16 – 4 – – 4
lISTED RIgHTSFoSUN INTERNATIoNAl lTD – RIgTHS – – 122,380 122,380 –
UNlISTED RIgHTSCHINA RESoURCES lAND lTD – RIgHTS – – 87,617 87,617 –
gCl-Poly ENERgy HolDINgS lTD – RIgHTS – – 736,156 – 736,156
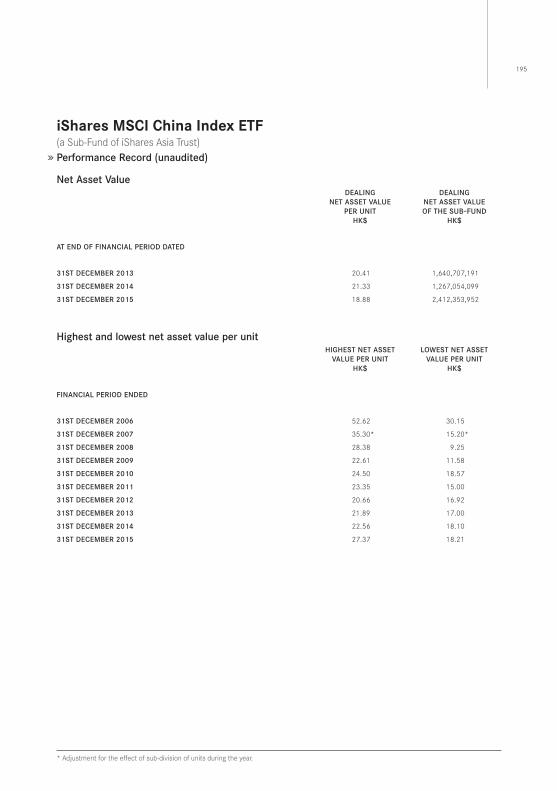
195
iShares MSCi China index eTf (a Sub-Fund of iShares Asia Trust) Performance Record (unaudited)
Net Asset ValueDEAlINg
NET ASSET VAlUE PER UNIT
HK$
DEAlINgNET ASSET VAlUE oF THE SUB–FUND
HK$
AT END oF FINANCIAl PERIoD DATED
31ST DECEMBER 2013 20 .41 1,640,707,191
31ST DECEMBER 2014 21 .33 1,267,054,099
31ST DECEMBER 2015 18 .88 2,412,353,952
Highest and lowest net asset value per unitHIgHEST NET ASSET
VAlUE PER UNITHK$
lowEST NET ASSETVAlUE PER UNIT
HK$
FINANCIAl PERIoD ENDED
31ST DECEMBER 2006 52 .62 30 .15
31ST DECEMBER 2007 35 .30* 15 .20*
31ST DECEMBER 2008 28 .38 9 .25
31ST DECEMBER 2009 22 .61 11 .58
31ST DECEMBER 2010 24 .50 18 .57
31ST DECEMBER 2011 23 .35 15 .00
31ST DECEMBER 2012 20 .66 16 .92
31ST DECEMBER 2013 21 .89 17 .00
31ST DECEMBER 2014 22 .56 18 .10
31ST DECEMBER 2015 27 .37 18 .21
* Adjustment for the effect of sub-division of units during the year .
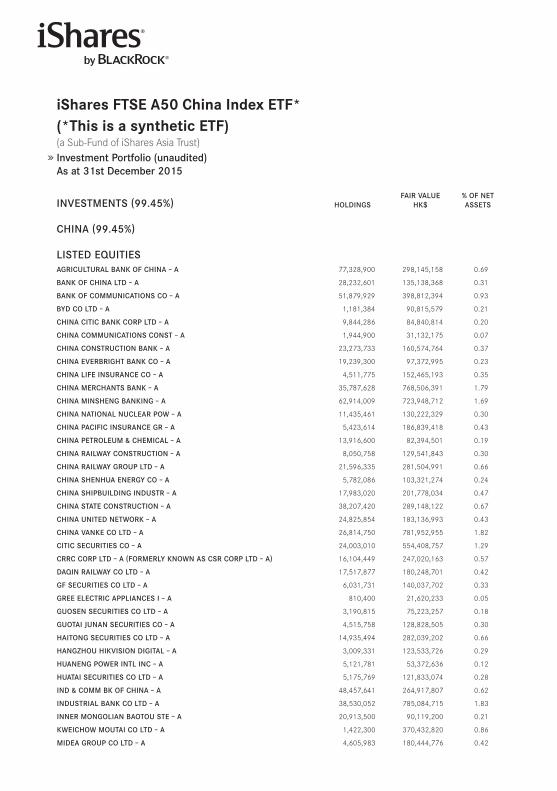
iShares fTSe A50 China index eTf*(*This is a synthetic eTf) (a Sub-Fund of iShares Asia Trust) Investment Portfolio (unaudited)As at 31st December 2015
INVESTMENTS (99.45%) HolDINgSFAIR VAlUE
HK$% oF NET ASSETS
CHINA (99.45%)
lISTED EqUITIESAgRICUlTURAl BANK oF CHINA – A 77,328,900 298,145,158 0 .69
BANK oF CHINA lTD – A 28,232,601 135,138,368 0 .31
BANK oF CoMMUNICATIoNS Co – A 51,879,929 398,812,394 0 .93
ByD Co lTD – A 1,181,384 90,815,579 0 .21
CHINA CITIC BANK CoRP lTD – A 9,844,286 84,840,814 0 .20
CHINA CoMMUNICATIoNS CoNST – A 1,944,900 31,132,175 0 .07
CHINA CoNSTRUCTIoN BANK – A 23,273,733 160,574,764 0 .37
CHINA EVERBRIgHT BANK Co – A 19,239,300 97,372,995 0 .23
CHINA lIFE INSURANCE Co – A 4,511,775 152,465,193 0 .35
CHINA MERCHANTS BANK – A 35,787,628 768,506,391 1 .79
CHINA MINSHENg BANKINg – A 62,914,009 723,948,712 1 .69
CHINA NATIoNAl NUClEAR Pow – A 11,435,461 130,222,329 0 .30
CHINA PACIFIC INSURANCE gR – A 5,423,614 186,839,418 0 .43
CHINA PETRolEUM ﹠ CHEMICAl – A 13,916,600 82,394,501 0 .19
CHINA RAIlwAy CoNSTRUCTIoN – A 8,050,758 129,541,843 0 .30
CHINA RAIlwAy gRoUP lTD – A 21,596,335 281,504,991 0 .66
CHINA SHENHUA ENERgy Co – A 5,782,086 103,321,274 0 .24
CHINA SHIPBUIlDINg INDUSTR – A 17,983,020 201,778,034 0 .47
CHINA STATE CoNSTRUCTIoN – A 38,207,420 289,148,122 0 .67
CHINA UNITED NETwoRK – A 24,825,854 183,136,993 0 .43
CHINA VANKE Co lTD – A 26,814,750 781,952,955 1 .82
CITIC SECURITIES Co – A 24,003,010 554,408,757 1 .29
CRRC CoRP lTD – A (FoRMERly KNowN AS CSR CoRP lTD – A) 16,104,449 247,020,163 0 .57
DAqIN RAIlwAy Co lTD – A 17,517,877 180,248,701 0 .42
gF SECURITIES Co lTD – A 6,031,731 140,037,702 0 .33
gREE ElECTRIC APPlIANCES I – A 810,400 21,620,233 0 .05
gUoSEN SECURITIES Co lTD – A 3,190,815 75,223,257 0 .18
gUoTAI JUNAN SECURITIES Co – A 4,515,758 128,828,505 0 .30
HAIToNg SECURITIES Co lTD – A 14,935,494 282,039,202 0 .66
HANgzHoU HIKVISIoN DIgITAl – A 3,009,331 123,533,726 0 .29
HUANENg PowER INTl INC – A 5,121,781 53,372,636 0 .12
HUATAI SECURITIES Co lTD – A 5,175,769 121,833,074 0 .28
IND ﹠ CoMM BK oF CHINA – A 48,457,641 264,917,807 0 .62
INDUSTRIAl BANK Co lTD – A 38,530,052 785,084,715 1 .83
INNER MoNgolIAN BAoToU STE – A 20,913,500 90,119,200 0 .21
KwEICHow MoUTAI Co lTD – A 1,422,300 370,432,820 0 .86
MIDEA gRoUP Co lTD – A 4,605,983 180,444,776 0 .42
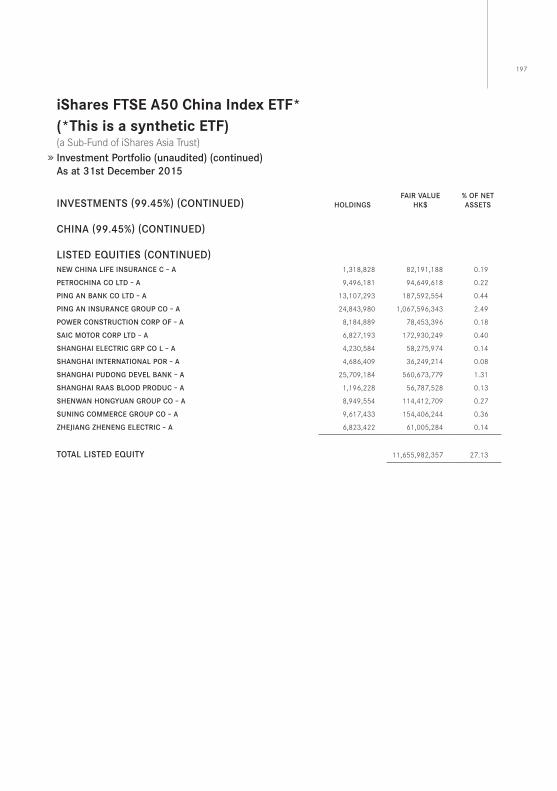
197
iShares fTSe A50 China index eTf*(*This is a synthetic eTf) (a Sub-Fund of iShares Asia Trust) Investment Portfolio (unaudited) (continued)As at 31st December 2015
INVESTMENTS (99.45%) (CoNTINUED) HolDINgSFAIR VAlUE
HK$% oF NET ASSETS
CHINA (99.45%) (CoNTINUED)
lISTED EqUITIES (CoNTINUED)NEw CHINA lIFE INSURANCE C – A 1,318,828 82,191,188 0 .19
PETRoCHINA Co lTD – A 9,496,181 94,649,618 0 .22
PINg AN BANK Co lTD – A 13,107,293 187,592,554 0 .44
PINg AN INSURANCE gRoUP Co – A 24,843,980 1,067,596,343 2 .49
PowER CoNSTRUCTIoN CoRP oF – A 8,184,889 78,453,396 0 .18
SAIC MoToR CoRP lTD – A 6,827,193 172,930,249 0 .40
SHANgHAI ElECTRIC gRP Co l – A 4,230,584 58,275,974 0 .14
SHANgHAI INTERNATIoNAl PoR – A 4,686,409 36,249,214 0 .08
SHANgHAI PUDoNg DEVEl BANK – A 25,709,184 560,673,779 1 .31
SHANgHAI RAAS BlooD PRoDUC – A 1,196,228 56,787,528 0 .13
SHENwAN HoNgyUAN gRoUP Co – A 8,949,554 114,412,709 0 .27
SUNINg CoMMERCE gRoUP Co – A 9,617,433 154,406,244 0 .36
zHEJIANg zHENENg ElECTRIC – A 6,823,422 61,005,284 0 .14
ToTAl lISTED EqUITy 11,655,982,357 27 .13
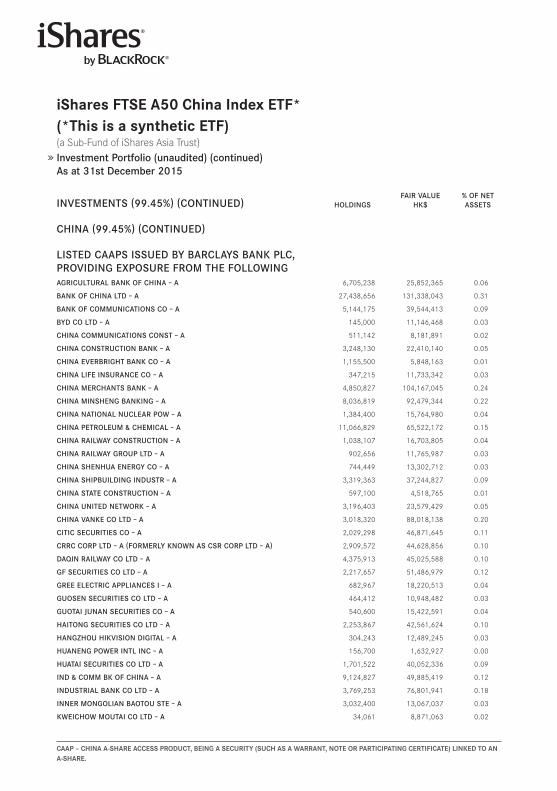
CAAp – ChinA A-ShARe ACCeSS pRodUCT, Being A SeCURiTY (SUCh AS A wARRAnT, noTe oR pARTiCipATing CeRTifiCATe) linKed To An A-ShARe.
iShares fTSe A50 China index eTf*(*This is a synthetic eTf) (a Sub-Fund of iShares Asia Trust) Investment Portfolio (unaudited) (continued)As at 31st December 2015
INVESTMENTS (99.45%) (CoNTINUED) HolDINgSFAIR VAlUE
HK$% oF NET ASSETS
CHINA (99.45%) (CoNTINUED)
lISTED CAAPS ISSUED By BARClAyS BANK PlC, PRoVIDINg EXPoSURE FRoM THE FollowINgAgRICUlTURAl BANK oF CHINA – A 6,705,238 25,852,365 0 .06
BANK oF CHINA lTD – A 27,438,656 131,338,043 0 .31
BANK oF CoMMUNICATIoNS Co – A 5,144,175 39,544,413 0 .09
ByD Co lTD – A 145,000 11,146,468 0 .03
CHINA CoMMUNICATIoNS CoNST – A 511,142 8,181,891 0 .02
CHINA CoNSTRUCTIoN BANK – A 3,248,130 22,410,140 0 .05
CHINA EVERBRIgHT BANK Co – A 1,155,500 5,848,163 0 .01
CHINA lIFE INSURANCE Co – A 347,215 11,733,342 0 .03
CHINA MERCHANTS BANK – A 4,850,827 104,167,045 0 .24
CHINA MINSHENg BANKINg – A 8,036,819 92,479,344 0 .22
CHINA NATIoNAl NUClEAR Pow – A 1,384,400 15,764,980 0 .04
CHINA PETRolEUM ﹠ CHEMICAl – A 11,066,829 65,522,172 0 .15
CHINA RAIlwAy CoNSTRUCTIoN – A 1,038,107 16,703,805 0 .04
CHINA RAIlwAy gRoUP lTD – A 902,656 11,765,987 0 .03
CHINA SHENHUA ENERgy Co – A 744,449 13,302,712 0 .03
CHINA SHIPBUIlDINg INDUSTR – A 3,319,363 37,244,827 0 .09
CHINA STATE CoNSTRUCTIoN – A 597,100 4,518,765 0 .01
CHINA UNITED NETwoRK – A 3,196,403 23,579,429 0 .05
CHINA VANKE Co lTD – A 3,018,320 88,018,138 0 .20
CITIC SECURITIES Co – A 2,029,298 46,871,645 0 .11
CRRC CoRP lTD – A (FoRMERly KNowN AS CSR CoRP lTD – A) 2,909,572 44,628,856 0 .10
DAqIN RAIlwAy Co lTD – A 4,375,913 45,025,588 0 .10
gF SECURITIES Co lTD – A 2,217,657 51,486,979 0 .12
gREE ElECTRIC APPlIANCES I – A 682,967 18,220,513 0 .04
gUoSEN SECURITIES Co lTD – A 464,412 10,948,482 0 .03
gUoTAI JUNAN SECURITIES Co – A 540,600 15,422,591 0 .04
HAIToNg SECURITIES Co lTD – A 2,253,867 42,561,624 0 .10
HANgzHoU HIKVISIoN DIgITAl – A 304,243 12,489,245 0 .03
HUANENg PowER INTl INC – A 156,700 1,632,927 0 .00
HUATAI SECURITIES Co lTD – A 1,701,522 40,052,336 0 .09
IND ﹠ CoMM BK oF CHINA – A 9,124,827 49,885,419 0 .12
INDUSTRIAl BANK Co lTD – A 3,769,253 76,801,941 0 .18
INNER MoNgolIAN BAoToU STE – A 3,032,400 13,067,037 0 .03
KwEICHow MoUTAI Co lTD – A 34,061 8,871,063 0 .02
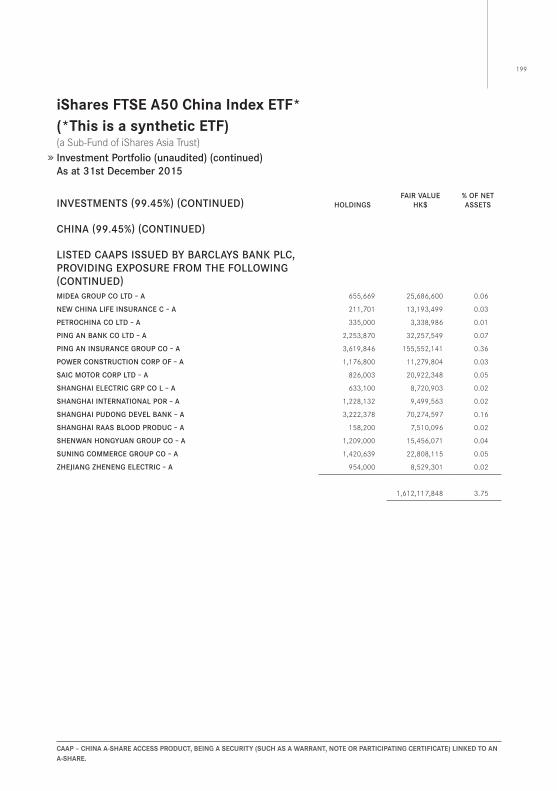
199
CAAp – ChinA A-ShARe ACCeSS pRodUCT, Being A SeCURiTY (SUCh AS A wARRAnT, noTe oR pARTiCipATing CeRTifiCATe) linKed To An A-ShARe.
iShares fTSe A50 China index eTf*(*This is a synthetic eTf) (a Sub-Fund of iShares Asia Trust) Investment Portfolio (unaudited) (continued)As at 31st December 2015
INVESTMENTS (99.45%) (CoNTINUED) HolDINgSFAIR VAlUE
HK$% oF NET ASSETS
CHINA (99.45%) (CoNTINUED)
lISTED CAAPS ISSUED By BARClAyS BANK PlC, PRoVIDINg EXPoSURE FRoM THE FollowINg (CoNTINUED)MIDEA gRoUP Co lTD – A 655,669 25,686,600 0 .06
NEw CHINA lIFE INSURANCE C – A 211,701 13,193,499 0 .03
PETRoCHINA Co lTD – A 335,000 3,338,986 0 .01
PINg AN BANK Co lTD – A 2,253,870 32,257,549 0 .07
PINg AN INSURANCE gRoUP Co – A 3,619,846 155,552,141 0 .36
PowER CoNSTRUCTIoN CoRP oF – A 1,176,800 11,279,804 0 .03
SAIC MoToR CoRP lTD – A 826,003 20,922,348 0 .05
SHANgHAI ElECTRIC gRP Co l – A 633,100 8,720,903 0 .02
SHANgHAI INTERNATIoNAl PoR – A 1,228,132 9,499,563 0 .02
SHANgHAI PUDoNg DEVEl BANK – A 3,222,378 70,274,597 0 .16
SHANgHAI RAAS BlooD PRoDUC – A 158,200 7,510,096 0 .02
SHENwAN HoNgyUAN gRoUP Co – A 1,209,000 15,456,071 0 .04
SUNINg CoMMERCE gRoUP Co – A 1,420,639 22,808,115 0 .05
zHEJIANg zHENENg ElECTRIC – A 954,000 8,529,301 0 .02
1,612,117,848 3 .75
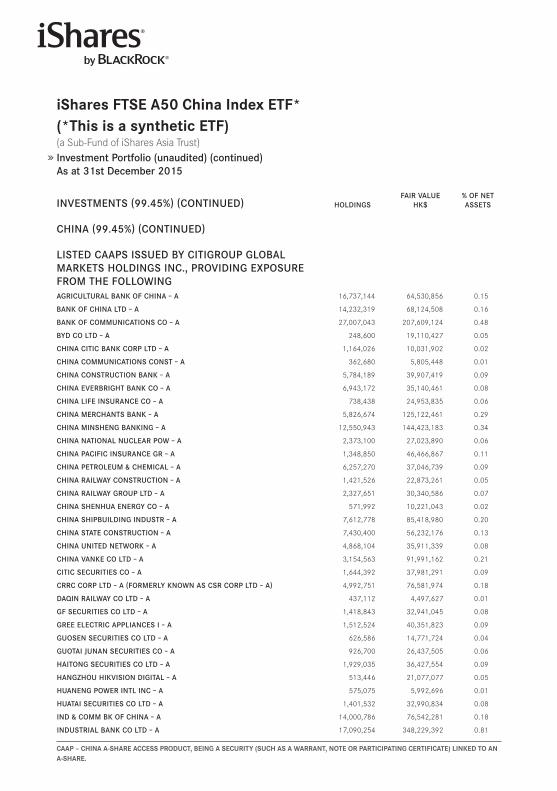
CAAp – ChinA A-ShARe ACCeSS pRodUCT, Being A SeCURiTY (SUCh AS A wARRAnT, noTe oR pARTiCipATing CeRTifiCATe) linKed To An A-ShARe.
iShares fTSe A50 China index eTf*(*This is a synthetic eTf) (a Sub-Fund of iShares Asia Trust) Investment Portfolio (unaudited) (continued)As at 31st December 2015
INVESTMENTS (99.45%) (CoNTINUED) HolDINgSFAIR VAlUE
HK$% oF NET ASSETS
CHINA (99.45%) (CoNTINUED)
lISTED CAAPS ISSUED By CITIgRoUP gloBAl MARKETS HolDINgS INC., PRoVIDINg EXPoSURE FRoM THE FollowINgAgRICUlTURAl BANK oF CHINA – A 16,737,144 64,530,856 0 .15
BANK oF CHINA lTD – A 14,232,319 68,124,508 0 .16
BANK oF CoMMUNICATIoNS Co – A 27,007,043 207,609,124 0 .48
ByD Co lTD – A 248,600 19,110,427 0 .05
CHINA CITIC BANK CoRP lTD – A 1,164,026 10,031,902 0 .02
CHINA CoMMUNICATIoNS CoNST – A 362,680 5,805,448 0 .01
CHINA CoNSTRUCTIoN BANK – A 5,784,189 39,907,419 0 .09
CHINA EVERBRIgHT BANK Co – A 6,943,172 35,140,461 0 .08
CHINA lIFE INSURANCE Co – A 738,438 24,953,835 0 .06
CHINA MERCHANTS BANK – A 5,826,674 125,122,461 0 .29
CHINA MINSHENg BANKINg – A 12,550,943 144,423,183 0 .34
CHINA NATIoNAl NUClEAR Pow – A 2,373,100 27,023,890 0 .06
CHINA PACIFIC INSURANCE gR – A 1,348,850 46,466,867 0 .11
CHINA PETRolEUM ﹠ CHEMICAl – A 6,257,270 37,046,739 0 .09
CHINA RAIlwAy CoNSTRUCTIoN – A 1,421,526 22,873,261 0 .05
CHINA RAIlwAy gRoUP lTD – A 2,327,651 30,340,586 0 .07
CHINA SHENHUA ENERgy Co – A 571,992 10,221,043 0 .02
CHINA SHIPBUIlDINg INDUSTR – A 7,612,778 85,418,980 0 .20
CHINA STATE CoNSTRUCTIoN – A 7,430,400 56,232,176 0 .13
CHINA UNITED NETwoRK – A 4,868,104 35,911,339 0 .08
CHINA VANKE Co lTD – A 3,154,563 91,991,162 0 .21
CITIC SECURITIES Co – A 1,644,392 37,981,291 0 .09
CRRC CoRP lTD – A (FoRMERly KNowN AS CSR CoRP lTD – A) 4,992,751 76,581,974 0 .18
DAqIN RAIlwAy Co lTD – A 437,112 4,497,627 0 .01
gF SECURITIES Co lTD – A 1,418,843 32,941,045 0 .08
gREE ElECTRIC APPlIANCES I – A 1,512,524 40,351,823 0 .09
gUoSEN SECURITIES Co lTD – A 626,586 14,771,724 0 .04
gUoTAI JUNAN SECURITIES Co – A 926,700 26,437,505 0 .06
HAIToNg SECURITIES Co lTD – A 1,929,035 36,427,554 0 .09
HANgzHoU HIKVISIoN DIgITAl – A 513,446 21,077,077 0 .05
HUANENg PowER INTl INC – A 575,075 5,992,696 0 .01
HUATAI SECURITIES Co lTD – A 1,401,532 32,990,834 0 .08
IND ﹠ CoMM BK oF CHINA – A 14,000,786 76,542,281 0 .18
INDUSTRIAl BANK Co lTD – A 17,090,254 348,229,392 0 .81
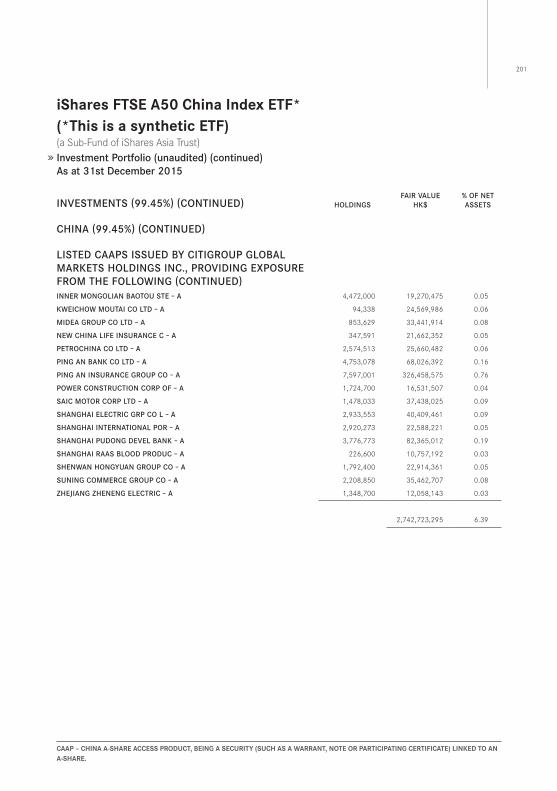
201
CAAp – ChinA A-ShARe ACCeSS pRodUCT, Being A SeCURiTY (SUCh AS A wARRAnT, noTe oR pARTiCipATing CeRTifiCATe) linKed To An A-ShARe.
iShares fTSe A50 China index eTf*(*This is a synthetic eTf) (a Sub-Fund of iShares Asia Trust) Investment Portfolio (unaudited) (continued)As at 31st December 2015
INVESTMENTS (99.45%) (CoNTINUED) HolDINgSFAIR VAlUE
HK$% oF NET ASSETS
CHINA (99.45%) (CoNTINUED)
lISTED CAAPS ISSUED By CITIgRoUP gloBAl MARKETS HolDINgS INC., PRoVIDINg EXPoSURE FRoM THE FollowINg (CoNTINUED)INNER MoNgolIAN BAoToU STE – A 4,472,000 19,270,475 0 .05
KwEICHow MoUTAI Co lTD – A 94,338 24,569,986 0 .06
MIDEA gRoUP Co lTD – A 853,629 33,441,914 0 .08
NEw CHINA lIFE INSURANCE C – A 347,591 21,662,352 0 .05
PETRoCHINA Co lTD – A 2,574,513 25,660,482 0 .06
PINg AN BANK Co lTD – A 4,753,078 68,026,392 0 .16
PINg AN INSURANCE gRoUP Co – A 7,597,001 326,458,575 0 .76
PowER CoNSTRUCTIoN CoRP oF – A 1,724,700 16,531,507 0 .04
SAIC MoToR CoRP lTD – A 1,478,033 37,438,025 0 .09
SHANgHAI ElECTRIC gRP Co l – A 2,933,553 40,409,461 0 .09
SHANgHAI INTERNATIoNAl PoR – A 2,920,273 22,588,221 0 .05
SHANgHAI PUDoNg DEVEl BANK – A 3,776,773 82,365,012 0 .19
SHANgHAI RAAS BlooD PRoDUC – A 226,600 10,757,192 0 .03
SHENwAN HoNgyUAN gRoUP Co – A 1,792,400 22,914,361 0 .05
SUNINg CoMMERCE gRoUP Co – A 2,208,850 35,462,707 0 .08
zHEJIANg zHENENg ElECTRIC – A 1,348,700 12,058,143 0 .03
2,742,723,295 6 .39
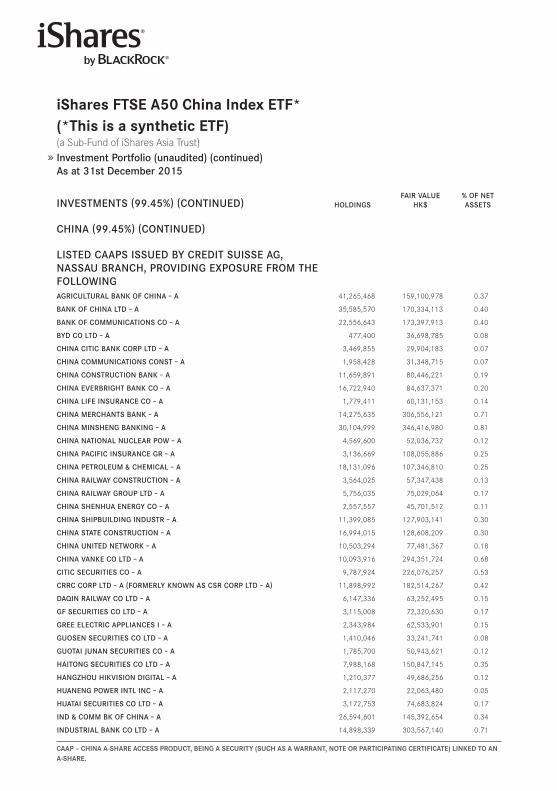
CAAp – ChinA A-ShARe ACCeSS pRodUCT, Being A SeCURiTY (SUCh AS A wARRAnT, noTe oR pARTiCipATing CeRTifiCATe) linKed To An A-ShARe.
iShares fTSe A50 China index eTf*(*This is a synthetic eTf) (a Sub-Fund of iShares Asia Trust) Investment Portfolio (unaudited) (continued)As at 31st December 2015
INVESTMENTS (99.45%) (CoNTINUED) HolDINgSFAIR VAlUE
HK$% oF NET ASSETS
CHINA (99.45%) (CoNTINUED)
lISTED CAAPS ISSUED By CREDIT SUISSE Ag, NASSAU BRANCH, PRoVIDINg EXPoSURE FRoM THE FollowINgAgRICUlTURAl BANK oF CHINA – A 41,265,468 159,100,978 0 .37
BANK oF CHINA lTD – A 35,585,570 170,334,113 0 .40
BANK oF CoMMUNICATIoNS Co – A 22,556,643 173,397,913 0 .40
ByD Co lTD – A 477,400 36,698,785 0 .08
CHINA CITIC BANK CoRP lTD – A 3,469,855 29,904,183 0 .07
CHINA CoMMUNICATIoNS CoNST – A 1,958,428 31,348,715 0 .07
CHINA CoNSTRUCTIoN BANK – A 11,659,891 80,446,221 0 .19
CHINA EVERBRIgHT BANK Co – A 16,722,940 84,637,371 0 .20
CHINA lIFE INSURANCE Co – A 1,779,411 60,131,153 0 .14
CHINA MERCHANTS BANK – A 14,275,635 306,556,121 0 .71
CHINA MINSHENg BANKINg – A 30,104,999 346,416,980 0 .81
CHINA NATIoNAl NUClEAR Pow – A 4,569,600 52,036,732 0 .12
CHINA PACIFIC INSURANCE gR – A 3,136,669 108,055,886 0 .25
CHINA PETRolEUM ﹠ CHEMICAl – A 18,131,096 107,346,810 0 .25
CHINA RAIlwAy CoNSTRUCTIoN – A 3,564,025 57,347,438 0 .13
CHINA RAIlwAy gRoUP lTD – A 5,756,035 75,029,064 0 .17
CHINA SHENHUA ENERgy Co – A 2,557,557 45,701,512 0 .11
CHINA SHIPBUIlDINg INDUSTR – A 11,399,085 127,903,141 0 .30
CHINA STATE CoNSTRUCTIoN – A 16,994,015 128,608,209 0 .30
CHINA UNITED NETwoRK – A 10,503,294 77,481,367 0 .18
CHINA VANKE Co lTD – A 10,093,916 294,351,724 0 .68
CITIC SECURITIES Co – A 9,787,924 226,076,257 0 .53
CRRC CoRP lTD – A (FoRMERly KNowN AS CSR CoRP lTD – A) 11,898,992 182,514,267 0 .42
DAqIN RAIlwAy Co lTD – A 6,147,336 63,252,495 0 .15
gF SECURITIES Co lTD – A 3,115,008 72,320,630 0 .17
gREE ElECTRIC APPlIANCES I – A 2,343,984 62,533,901 0 .15
gUoSEN SECURITIES Co lTD – A 1,410,046 33,241,741 0 .08
gUoTAI JUNAN SECURITIES Co – A 1,785,700 50,943,621 0 .12
HAIToNg SECURITIES Co lTD – A 7,988,168 150,847,145 0 .35
HANgzHoU HIKVISIoN DIgITAl – A 1,210,377 49,686,256 0 .12
HUANENg PowER INTl INC – A 2,117,270 22,063,480 0 .05
HUATAI SECURITIES Co lTD – A 3,172,753 74,683,824 0 .17
IND ﹠ CoMM BK oF CHINA – A 26,594,601 145,392,654 0 .34
INDUSTRIAl BANK Co lTD – A 14,898,339 303,567,140 0 .71
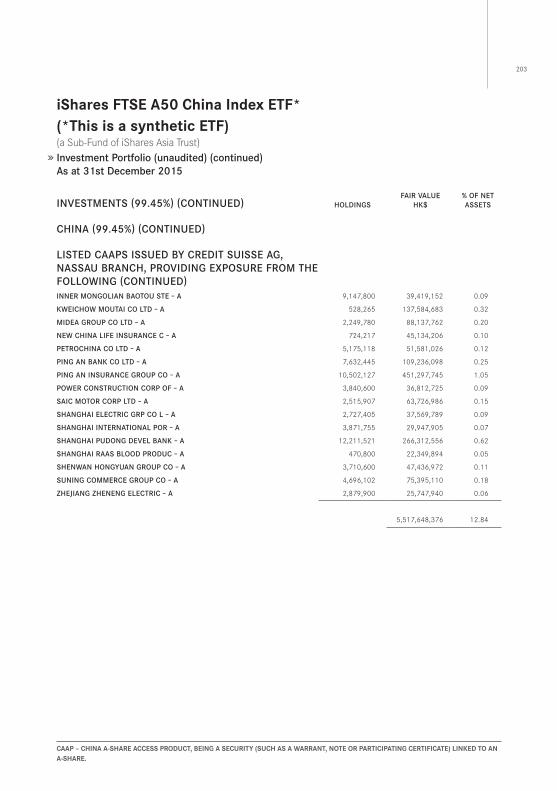
203
CAAp – ChinA A-ShARe ACCeSS pRodUCT, Being A SeCURiTY (SUCh AS A wARRAnT, noTe oR pARTiCipATing CeRTifiCATe) linKed To An A-ShARe.
iShares fTSe A50 China index eTf*(*This is a synthetic eTf) (a Sub-Fund of iShares Asia Trust) Investment Portfolio (unaudited) (continued)As at 31st December 2015
INVESTMENTS (99.45%) (CoNTINUED) HolDINgSFAIR VAlUE
HK$% oF NET ASSETS
CHINA (99.45%) (CoNTINUED)
lISTED CAAPS ISSUED By CREDIT SUISSE Ag, NASSAU BRANCH, PRoVIDINg EXPoSURE FRoM THE FollowINg (CoNTINUED)INNER MoNgolIAN BAoToU STE – A 9,147,800 39,419,152 0 .09
KwEICHow MoUTAI Co lTD – A 528,265 137,584,683 0 .32
MIDEA gRoUP Co lTD – A 2,249,780 88,137,762 0 .20
NEw CHINA lIFE INSURANCE C – A 724,217 45,134,206 0 .10
PETRoCHINA Co lTD – A 5,175,118 51,581,026 0 .12
PINg AN BANK Co lTD – A 7,632,445 109,236,098 0 .25
PINg AN INSURANCE gRoUP Co – A 10,502,127 451,297,745 1 .05
PowER CoNSTRUCTIoN CoRP oF – A 3,840,600 36,812,725 0 .09
SAIC MoToR CoRP lTD – A 2,515,907 63,726,986 0 .15
SHANgHAI ElECTRIC gRP Co l – A 2,727,405 37,569,789 0 .09
SHANgHAI INTERNATIoNAl PoR – A 3,871,755 29,947,905 0 .07
SHANgHAI PUDoNg DEVEl BANK – A 12,211,521 266,312,556 0 .62
SHANgHAI RAAS BlooD PRoDUC – A 470,800 22,349,894 0 .05
SHENwAN HoNgyUAN gRoUP Co – A 3,710,600 47,436,972 0 .11
SUNINg CoMMERCE gRoUP Co – A 4,696,102 75,395,110 0 .18
zHEJIANg zHENENg ElECTRIC – A 2,879,900 25,747,940 0 .06
5,517,648,376 12 .84
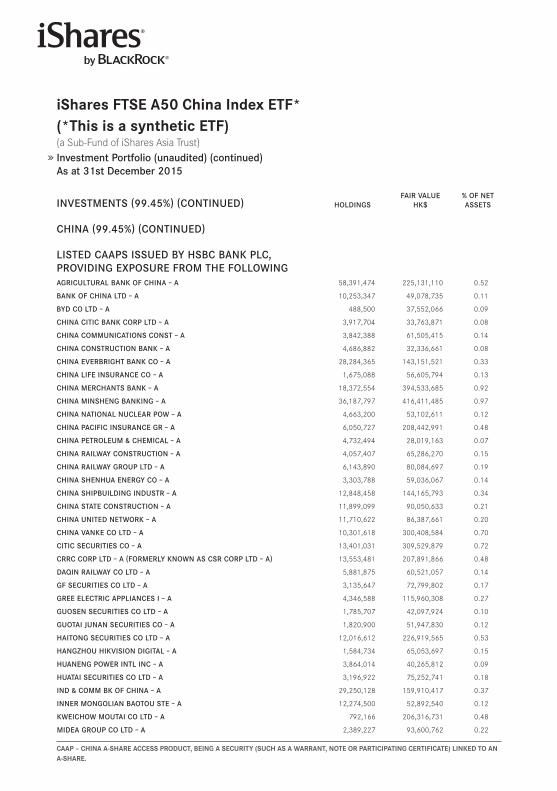
CAAp – ChinA A-ShARe ACCeSS pRodUCT, Being A SeCURiTY (SUCh AS A wARRAnT, noTe oR pARTiCipATing CeRTifiCATe) linKed To An A-ShARe.
iShares fTSe A50 China index eTf*(*This is a synthetic eTf) (a Sub-Fund of iShares Asia Trust) Investment Portfolio (unaudited) (continued)As at 31st December 2015
INVESTMENTS (99.45%) (CoNTINUED) HolDINgSFAIR VAlUE
HK$% oF NET ASSETS
CHINA (99.45%) (CoNTINUED)
lISTED CAAPS ISSUED By HSBC BANK PlC, PRoVIDINg EXPoSURE FRoM THE FollowINgAgRICUlTURAl BANK oF CHINA – A 58,391,474 225,131,110 0 .52
BANK oF CHINA lTD – A 10,253,347 49,078,735 0 .11
ByD Co lTD – A 488,500 37,552,066 0 .09
CHINA CITIC BANK CoRP lTD – A 3,917,704 33,763,871 0 .08
CHINA CoMMUNICATIoNS CoNST – A 3,842,388 61,505,415 0 .14
CHINA CoNSTRUCTIoN BANK – A 4,686,882 32,336,661 0 .08
CHINA EVERBRIgHT BANK Co – A 28,284,365 143,151,521 0 .33
CHINA lIFE INSURANCE Co – A 1,675,088 56,605,794 0 .13
CHINA MERCHANTS BANK – A 18,372,554 394,533,685 0 .92
CHINA MINSHENg BANKINg – A 36,187,797 416,411,485 0 .97
CHINA NATIoNAl NUClEAR Pow – A 4,663,200 53,102,611 0 .12
CHINA PACIFIC INSURANCE gR – A 6,050,727 208,442,991 0 .48
CHINA PETRolEUM ﹠ CHEMICAl – A 4,732,494 28,019,163 0 .07
CHINA RAIlwAy CoNSTRUCTIoN – A 4,057,407 65,286,270 0 .15
CHINA RAIlwAy gRoUP lTD – A 6,143,890 80,084,697 0 .19
CHINA SHENHUA ENERgy Co – A 3,303,788 59,036,067 0 .14
CHINA SHIPBUIlDINg INDUSTR – A 12,848,458 144,165,793 0 .34
CHINA STATE CoNSTRUCTIoN – A 11,899,099 90,050,633 0 .21
CHINA UNITED NETwoRK – A 11,710,622 86,387,661 0 .20
CHINA VANKE Co lTD – A 10,301,618 300,408,584 0 .70
CITIC SECURITIES Co – A 13,401,031 309,529,879 0 .72
CRRC CoRP lTD – A (FoRMERly KNowN AS CSR CoRP lTD – A) 13,553,481 207,891,866 0 .48
DAqIN RAIlwAy Co lTD – A 5,881,875 60,521,057 0 .14
gF SECURITIES Co lTD – A 3,135,647 72,799,802 0 .17
gREE ElECTRIC APPlIANCES I – A 4,346,588 115,960,308 0 .27
gUoSEN SECURITIES Co lTD – A 1,785,707 42,097,924 0 .10
gUoTAI JUNAN SECURITIES Co – A 1,820,900 51,947,830 0 .12
HAIToNg SECURITIES Co lTD – A 12,016,612 226,919,565 0 .53
HANgzHoU HIKVISIoN DIgITAl – A 1,584,734 65,053,697 0 .15
HUANENg PowER INTl INC – A 3,864,014 40,265,812 0 .09
HUATAI SECURITIES Co lTD – A 3,196,922 75,252,741 0 .18
IND ﹠ CoMM BK oF CHINA – A 29,250,128 159,910,417 0 .37
INNER MoNgolIAN BAoToU STE – A 12,274,500 52,892,540 0 .12
KwEICHow MoUTAI Co lTD – A 792,166 206,316,731 0 .48
MIDEA gRoUP Co lTD – A 2,389,227 93,600,762 0 .22

205
CAAp – ChinA A-ShARe ACCeSS pRodUCT, Being A SeCURiTY (SUCh AS A wARRAnT, noTe oR pARTiCipATing CeRTifiCATe) linKed To An A-ShARe.
iShares fTSe A50 China index eTf*(*This is a synthetic eTf) (a Sub-Fund of iShares Asia Trust) Investment Portfolio (unaudited) (continued)As at 31st December 2015
INVESTMENTS (99.45%) (CoNTINUED) HolDINgSFAIR VAlUE
HK$% oF NET ASSETS
CHINA (99.45%) (CoNTINUED)
lISTED CAAPS ISSUED By HSBC BANK PlC, PRoVIDINg EXPoSURE FRoM THE FollowINg (CoNTINUED)NEw CHINA lIFE INSURANCE C – A 1,064,598 66,347,221 0 .15
PETRoCHINA Co lTD – A 8,240,945 82,138,494 0 .19
PINg AN BANK Co lTD – A 7,144,749 102,256,158 0 .24
PINg AN INSURANCE gRoUP Co – A 485,027 20,842,596 0 .05
PowER CoNSTRUCTIoN CoRP oF – A 4,268,400 40,913,252 0 .10
SAIC MoToR CoRP lTD – A 1,371,923 34,750,298 0 .08
SHANgHAI ElECTRIC gRP Co l – A 3,149,118 43,378,852 0 .10
SHANgHAI INTERNATIoNAl PoR – A 4,288,001 33,167,555 0 .08
SHANgHAI PUDoNg DEVEl BANK – A 18,914,526 412,493,724 0 .96
SHANgHAI RAAS BlooD PRoDUC – A 829,000 39,354,423 0 .09
SHENwAN HoNgyUAN gRoUP Co – A 4,568,700 58,407,075 0 .14
SUNINg CoMMERCE gRoUP Co – A 5,719,930 91,832,492 0 .21
zHEJIANg zHENENg ElECTRIC – A 3,731,500 33,361,727 0 .08
5,405,259,611 12 .58
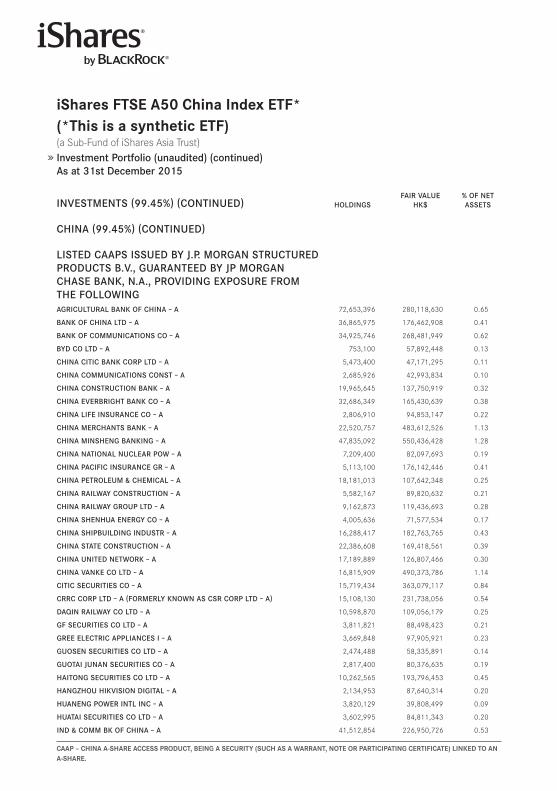
CAAp – ChinA A-ShARe ACCeSS pRodUCT, Being A SeCURiTY (SUCh AS A wARRAnT, noTe oR pARTiCipATing CeRTifiCATe) linKed To An A-ShARe.
iShares fTSe A50 China index eTf*(*This is a synthetic eTf) (a Sub-Fund of iShares Asia Trust) Investment Portfolio (unaudited) (continued)As at 31st December 2015
INVESTMENTS (99.45%) (CoNTINUED) HolDINgSFAIR VAlUE
HK$% oF NET ASSETS
CHINA (99.45%) (CoNTINUED)
lISTED CAAPS ISSUED By J.P. MoRgAN STRUCTURED PRoDUCTS B.V., gUARANTEED By JP MoRgAN CHASE BANK, N.A., PRoVIDINg EXPoSURE FRoM THE FollowINgAgRICUlTURAl BANK oF CHINA – A 72,653,396 280,118,630 0 .65
BANK oF CHINA lTD – A 36,865,975 176,462,908 0 .41
BANK oF CoMMUNICATIoNS Co – A 34,925,746 268,481,949 0 .62
ByD Co lTD – A 753,100 57,892,448 0 .13
CHINA CITIC BANK CoRP lTD – A 5,473,400 47,171,295 0 .11
CHINA CoMMUNICATIoNS CoNST – A 2,685,926 42,993,834 0 .10
CHINA CoNSTRUCTIoN BANK – A 19,965,645 137,750,919 0 .32
CHINA EVERBRIgHT BANK Co – A 32,686,349 165,430,639 0 .38
CHINA lIFE INSURANCE Co – A 2,806,910 94,853,147 0 .22
CHINA MERCHANTS BANK – A 22,520,757 483,612,526 1 .13
CHINA MINSHENg BANKINg – A 47,835,092 550,436,428 1 .28
CHINA NATIoNAl NUClEAR Pow – A 7,209,400 82,097,693 0 .19
CHINA PACIFIC INSURANCE gR – A 5,113,100 176,142,446 0 .41
CHINA PETRolEUM ﹠ CHEMICAl – A 18,181,013 107,642,348 0 .25
CHINA RAIlwAy CoNSTRUCTIoN – A 5,582,167 89,820,632 0 .21
CHINA RAIlwAy gRoUP lTD – A 9,162,873 119,436,693 0 .28
CHINA SHENHUA ENERgy Co – A 4,005,636 71,577,534 0 .17
CHINA SHIPBUIlDINg INDUSTR – A 16,288,417 182,763,765 0 .43
CHINA STATE CoNSTRUCTIoN – A 22,386,608 169,418,561 0 .39
CHINA UNITED NETwoRK – A 17,189,889 126,807,466 0 .30
CHINA VANKE Co lTD – A 16,815,909 490,373,786 1 .14
CITIC SECURITIES Co – A 15,719,434 363,079,117 0 .84
CRRC CoRP lTD – A (FoRMERly KNowN AS CSR CoRP lTD – A) 15,108,130 231,738,056 0 .54
DAqIN RAIlwAy Co lTD – A 10,598,870 109,056,179 0 .25
gF SECURITIES Co lTD – A 3,811,821 88,498,423 0 .21
gREE ElECTRIC APPlIANCES I – A 3,669,848 97,905,921 0 .23
gUoSEN SECURITIES Co lTD – A 2,474,488 58,335,891 0 .14
gUoTAI JUNAN SECURITIES Co – A 2,817,400 80,376,635 0 .19
HAIToNg SECURITIES Co lTD – A 10,262,565 193,796,453 0 .45
HANgzHoU HIKVISIoN DIgITAl – A 2,134,953 87,640,314 0 .20
HUANENg PowER INTl INC – A 3,820,129 39,808,499 0 .09
HUATAI SECURITIES Co lTD – A 3,602,995 84,811,343 0 .20
IND ﹠ CoMM BK oF CHINA – A 41,512,854 226,950,726 0 .53
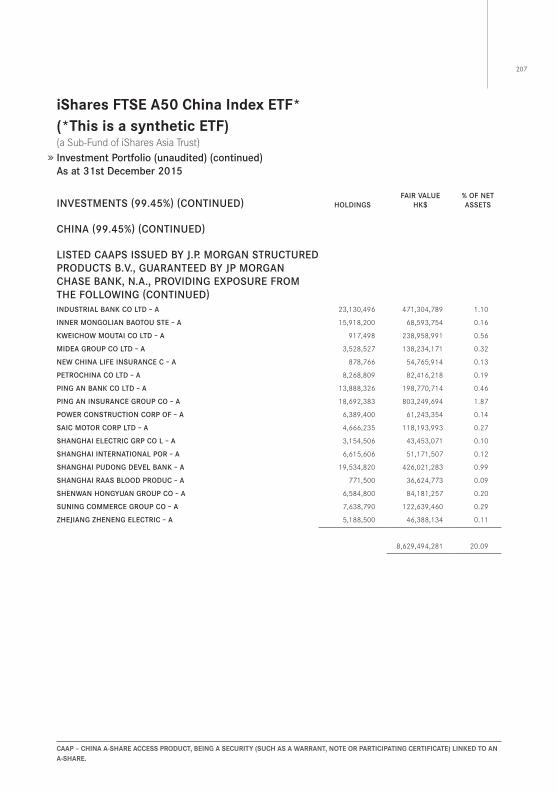
207
CAAp – ChinA A-ShARe ACCeSS pRodUCT, Being A SeCURiTY (SUCh AS A wARRAnT, noTe oR pARTiCipATing CeRTifiCATe) linKed To An A-ShARe.
iShares fTSe A50 China index eTf*(*This is a synthetic eTf) (a Sub-Fund of iShares Asia Trust) Investment Portfolio (unaudited) (continued)As at 31st December 2015
INVESTMENTS (99.45%) (CoNTINUED) HolDINgSFAIR VAlUE
HK$% oF NET ASSETS
CHINA (99.45%) (CoNTINUED)
lISTED CAAPS ISSUED By J.P. MoRgAN STRUCTURED PRoDUCTS B.V., gUARANTEED By JP MoRgAN CHASE BANK, N.A., PRoVIDINg EXPoSURE FRoM THE FollowINg (CoNTINUED)INDUSTRIAl BANK Co lTD – A 23,130,496 471,304,789 1 .10
INNER MoNgolIAN BAoToU STE – A 15,918,200 68,593,754 0 .16
KwEICHow MoUTAI Co lTD – A 917,498 238,958,991 0 .56
MIDEA gRoUP Co lTD – A 3,528,527 138,234,171 0 .32
NEw CHINA lIFE INSURANCE C – A 878,766 54,765,914 0 .13
PETRoCHINA Co lTD – A 8,268,809 82,416,218 0 .19
PINg AN BANK Co lTD – A 13,888,326 198,770,714 0 .46
PINg AN INSURANCE gRoUP Co – A 18,692,383 803,249,694 1 .87
PowER CoNSTRUCTIoN CoRP oF – A 6,389,400 61,243,354 0 .14
SAIC MoToR CoRP lTD – A 4,666,235 118,193,993 0 .27
SHANgHAI ElECTRIC gRP Co l – A 3,154,506 43,453,071 0 .10
SHANgHAI INTERNATIoNAl PoR – A 6,615,606 51,171,507 0 .12
SHANgHAI PUDoNg DEVEl BANK – A 19,534,820 426,021,283 0 .99
SHANgHAI RAAS BlooD PRoDUC – A 771,500 36,624,773 0 .09
SHENwAN HoNgyUAN gRoUP Co – A 6,584,800 84,181,257 0 .20
SUNINg CoMMERCE gRoUP Co – A 7,638,790 122,639,460 0 .29
zHEJIANg zHENENg ElECTRIC – A 5,188,500 46,388,134 0 .11
8,629,494,281 20 .09
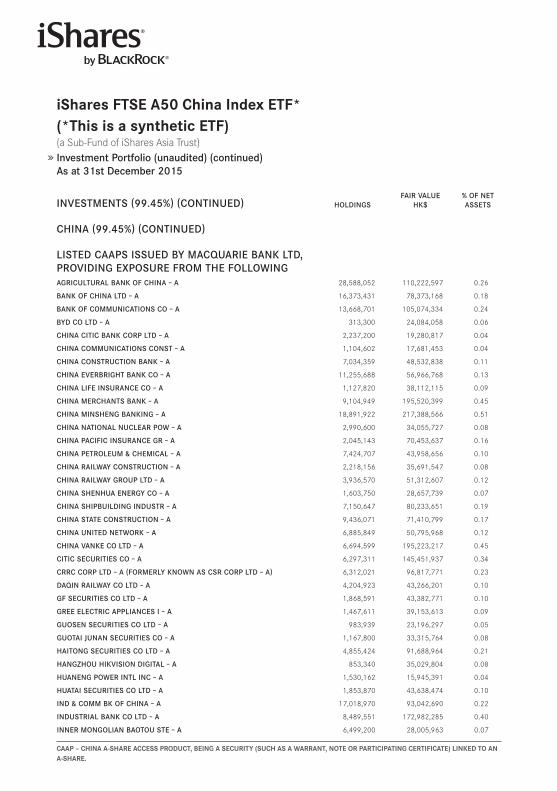
CAAp – ChinA A-ShARe ACCeSS pRodUCT, Being A SeCURiTY (SUCh AS A wARRAnT, noTe oR pARTiCipATing CeRTifiCATe) linKed To An A-ShARe.
iShares fTSe A50 China index eTf*(*This is a synthetic eTf) (a Sub-Fund of iShares Asia Trust) Investment Portfolio (unaudited) (continued)As at 31st December 2015
INVESTMENTS (99.45%) (CoNTINUED) HolDINgSFAIR VAlUE
HK$% oF NET ASSETS
CHINA (99.45%) (CoNTINUED)
lISTED CAAPS ISSUED By MACqUARIE BANK lTD, PRoVIDINg EXPoSURE FRoM THE FollowINgAgRICUlTURAl BANK oF CHINA – A 28,588,052 110,222,597 0 .26
BANK oF CHINA lTD – A 16,373,431 78,373,168 0 .18
BANK oF CoMMUNICATIoNS Co – A 13,668,701 105,074,334 0 .24
ByD Co lTD – A 313,300 24,084,058 0 .06
CHINA CITIC BANK CoRP lTD – A 2,237,200 19,280,817 0 .04
CHINA CoMMUNICATIoNS CoNST – A 1,104,602 17,681,453 0 .04
CHINA CoNSTRUCTIoN BANK – A 7,034,359 48,532,838 0 .11
CHINA EVERBRIgHT BANK Co – A 11,255,688 56,966,768 0 .13
CHINA lIFE INSURANCE Co – A 1,127,820 38,112,115 0 .09
CHINA MERCHANTS BANK – A 9,104,949 195,520,399 0 .45
CHINA MINSHENg BANKINg – A 18,891,922 217,388,566 0 .51
CHINA NATIoNAl NUClEAR Pow – A 2,990,600 34,055,727 0 .08
CHINA PACIFIC INSURANCE gR – A 2,045,143 70,453,637 0 .16
CHINA PETRolEUM ﹠ CHEMICAl – A 7,424,707 43,958,656 0 .10
CHINA RAIlwAy CoNSTRUCTIoN – A 2,218,156 35,691,547 0 .08
CHINA RAIlwAy gRoUP lTD – A 3,936,570 51,312,607 0 .12
CHINA SHENHUA ENERgy Co – A 1,603,750 28,657,739 0 .07
CHINA SHIPBUIlDINg INDUSTR – A 7,150,647 80,233,651 0 .19
CHINA STATE CoNSTRUCTIoN – A 9,436,071 71,410,799 0 .17
CHINA UNITED NETwoRK – A 6,885,849 50,795,968 0 .12
CHINA VANKE Co lTD – A 6,694,599 195,223,217 0 .45
CITIC SECURITIES Co – A 6,297,311 145,451,937 0 .34
CRRC CoRP lTD – A (FoRMERly KNowN AS CSR CoRP lTD – A) 6,312,021 96,817,771 0 .23
DAqIN RAIlwAy Co lTD – A 4,204,923 43,266,201 0 .10
gF SECURITIES Co lTD – A 1,868,591 43,382,771 0 .10
gREE ElECTRIC APPlIANCES I – A 1,467,611 39,153,613 0 .09
gUoSEN SECURITIES Co lTD – A 983,939 23,196,297 0 .05
gUoTAI JUNAN SECURITIES Co – A 1,167,800 33,315,764 0 .08
HAIToNg SECURITIES Co lTD – A 4,855,424 91,688,964 0 .21
HANgzHoU HIKVISIoN DIgITAl – A 853,340 35,029,804 0 .08
HUANENg PowER INTl INC – A 1,530,162 15,945,391 0 .04
HUATAI SECURITIES Co lTD – A 1,853,870 43,638,474 0 .10
IND ﹠ CoMM BK oF CHINA – A 17,018,970 93,042,690 0 .22
INDUSTRIAl BANK Co lTD – A 8,489,551 172,982,285 0 .40
INNER MoNgolIAN BAoToU STE – A 6,499,200 28,005,963 0 .07
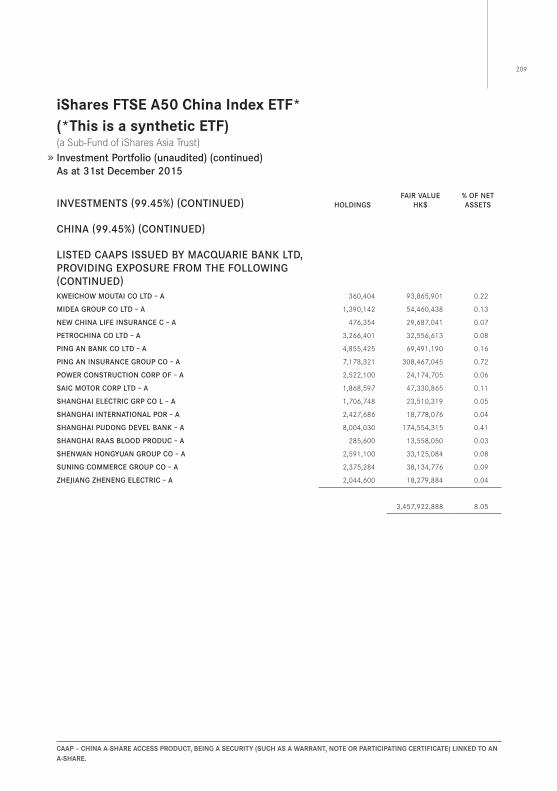
209
CAAp – ChinA A-ShARe ACCeSS pRodUCT, Being A SeCURiTY (SUCh AS A wARRAnT, noTe oR pARTiCipATing CeRTifiCATe) linKed To An A-ShARe.
iShares fTSe A50 China index eTf*(*This is a synthetic eTf) (a Sub-Fund of iShares Asia Trust) Investment Portfolio (unaudited) (continued)As at 31st December 2015
INVESTMENTS (99.45%) (CoNTINUED) HolDINgSFAIR VAlUE
HK$% oF NET ASSETS
CHINA (99.45%) (CoNTINUED)
lISTED CAAPS ISSUED By MACqUARIE BANK lTD, PRoVIDINg EXPoSURE FRoM THE FollowINg (CoNTINUED)KwEICHow MoUTAI Co lTD – A 360,404 93,865,901 0 .22
MIDEA gRoUP Co lTD – A 1,390,142 54,460,438 0 .13
NEw CHINA lIFE INSURANCE C – A 476,354 29,687,041 0 .07
PETRoCHINA Co lTD – A 3,266,401 32,556,613 0 .08
PINg AN BANK Co lTD – A 4,855,425 69,491,190 0 .16
PINg AN INSURANCE gRoUP Co – A 7,178,321 308,467,045 0 .72
PowER CoNSTRUCTIoN CoRP oF – A 2,522,100 24,174,705 0 .06
SAIC MoToR CoRP lTD – A 1,868,597 47,330,865 0 .11
SHANgHAI ElECTRIC gRP Co l – A 1,706,748 23,510,319 0 .05
SHANgHAI INTERNATIoNAl PoR – A 2,427,686 18,778,076 0 .04
SHANgHAI PUDoNg DEVEl BANK – A 8,004,030 174,554,315 0 .41
SHANgHAI RAAS BlooD PRoDUC – A 285,600 13,558,050 0 .03
SHENwAN HoNgyUAN gRoUP Co – A 2,591,100 33,125,084 0 .08
SUNINg CoMMERCE gRoUP Co – A 2,375,284 38,134,776 0 .09
zHEJIANg zHENENg ElECTRIC – A 2,044,600 18,279,884 0 .04
3,457,922,888 8 .05
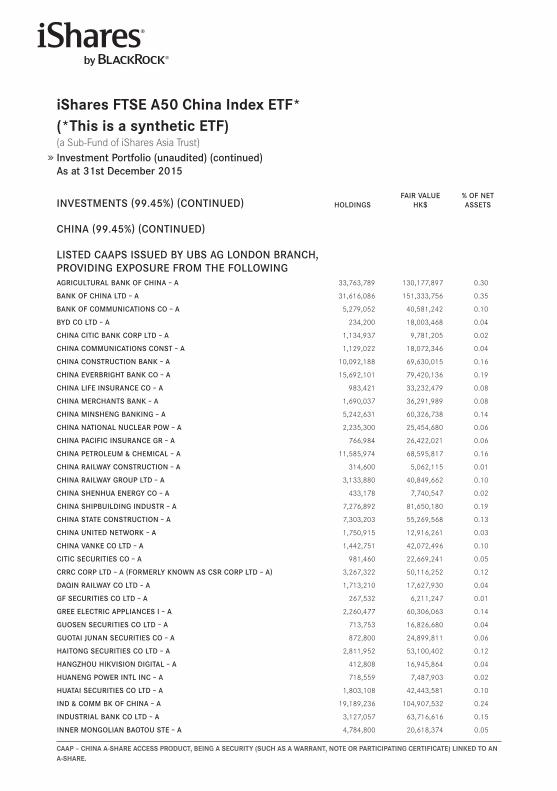
CAAp – ChinA A-ShARe ACCeSS pRodUCT, Being A SeCURiTY (SUCh AS A wARRAnT, noTe oR pARTiCipATing CeRTifiCATe) linKed To An A-ShARe.
iShares fTSe A50 China index eTf*(*This is a synthetic eTf) (a Sub-Fund of iShares Asia Trust) Investment Portfolio (unaudited) (continued)As at 31st December 2015
INVESTMENTS (99.45%) (CoNTINUED) HolDINgSFAIR VAlUE
HK$% oF NET ASSETS
CHINA (99.45%) (CoNTINUED)
lISTED CAAPS ISSUED By UBS Ag loNDoN BRANCH, PRoVIDINg EXPoSURE FRoM THE FollowINgAgRICUlTURAl BANK oF CHINA – A 33,763,789 130,177,897 0 .30
BANK oF CHINA lTD – A 31,616,086 151,333,756 0 .35
BANK oF CoMMUNICATIoNS Co – A 5,279,052 40,581,242 0 .10
ByD Co lTD – A 234,200 18,003,468 0 .04
CHINA CITIC BANK CoRP lTD – A 1,134,937 9,781,205 0 .02
CHINA CoMMUNICATIoNS CoNST – A 1,129,022 18,072,346 0 .04
CHINA CoNSTRUCTIoN BANK – A 10,092,188 69,630,015 0 .16
CHINA EVERBRIgHT BANK Co – A 15,692,101 79,420,136 0 .19
CHINA lIFE INSURANCE Co – A 983,421 33,232,479 0 .08
CHINA MERCHANTS BANK – A 1,690,037 36,291,989 0 .08
CHINA MINSHENg BANKINg – A 5,242,631 60,326,738 0 .14
CHINA NATIoNAl NUClEAR Pow – A 2,235,300 25,454,680 0 .06
CHINA PACIFIC INSURANCE gR – A 766,984 26,422,021 0 .06
CHINA PETRolEUM ﹠ CHEMICAl – A 11,585,974 68,595,817 0 .16
CHINA RAIlwAy CoNSTRUCTIoN – A 314,600 5,062,115 0 .01
CHINA RAIlwAy gRoUP lTD – A 3,133,880 40,849,662 0 .10
CHINA SHENHUA ENERgy Co – A 433,178 7,740,547 0 .02
CHINA SHIPBUIlDINg INDUSTR – A 7,276,892 81,650,180 0 .19
CHINA STATE CoNSTRUCTIoN – A 7,303,203 55,269,568 0 .13
CHINA UNITED NETwoRK – A 1,750,915 12,916,261 0 .03
CHINA VANKE Co lTD – A 1,442,751 42,072,496 0 .10
CITIC SECURITIES Co – A 981,460 22,669,241 0 .05
CRRC CoRP lTD – A (FoRMERly KNowN AS CSR CoRP lTD – A) 3,267,322 50,116,252 0 .12
DAqIN RAIlwAy Co lTD – A 1,713,210 17,627,930 0 .04
gF SECURITIES Co lTD – A 267,532 6,211,247 0 .01
gREE ElECTRIC APPlIANCES I – A 2,260,477 60,306,063 0 .14
gUoSEN SECURITIES Co lTD – A 713,753 16,826,680 0 .04
gUoTAI JUNAN SECURITIES Co – A 872,800 24,899,811 0 .06
HAIToNg SECURITIES Co lTD – A 2,811,952 53,100,402 0 .12
HANgzHoU HIKVISIoN DIgITAl – A 412,808 16,945,864 0 .04
HUANENg PowER INTl INC – A 718,559 7,487,903 0 .02
HUATAI SECURITIES Co lTD – A 1,803,108 42,443,581 0 .10
IND ﹠ CoMM BK oF CHINA – A 19,189,236 104,907,532 0 .24
INDUSTRIAl BANK Co lTD – A 3,127,057 63,716,616 0 .15
INNER MoNgolIAN BAoToU STE – A 4,784,800 20,618,374 0 .05
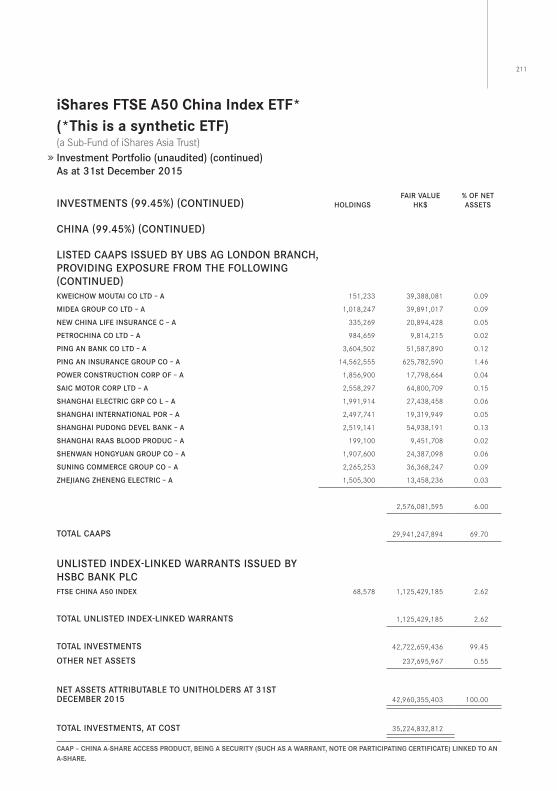
211
CAAp – ChinA A-ShARe ACCeSS pRodUCT, Being A SeCURiTY (SUCh AS A wARRAnT, noTe oR pARTiCipATing CeRTifiCATe) linKed To An A-ShARe.
iShares fTSe A50 China index eTf*(*This is a synthetic eTf) (a Sub-Fund of iShares Asia Trust) Investment Portfolio (unaudited) (continued)As at 31st December 2015
INVESTMENTS (99.45%) (CoNTINUED) HolDINgSFAIR VAlUE
HK$% oF NET ASSETS
CHINA (99.45%) (CoNTINUED)
lISTED CAAPS ISSUED By UBS Ag loNDoN BRANCH, PRoVIDINg EXPoSURE FRoM THE FollowINg (CoNTINUED)KwEICHow MoUTAI Co lTD – A 151,233 39,388,081 0 .09
MIDEA gRoUP Co lTD – A 1,018,247 39,891,017 0 .09
NEw CHINA lIFE INSURANCE C – A 335,269 20,894,428 0 .05
PETRoCHINA Co lTD – A 984,659 9,814,215 0 .02
PINg AN BANK Co lTD – A 3,604,502 51,587,890 0 .12
PINg AN INSURANCE gRoUP Co – A 14,562,555 625,782,590 1 .46
PowER CoNSTRUCTIoN CoRP oF – A 1,856,900 17,798,664 0 .04
SAIC MoToR CoRP lTD – A 2,558,297 64,800,709 0 .15
SHANgHAI ElECTRIC gRP Co l – A 1,991,914 27,438,458 0 .06
SHANgHAI INTERNATIoNAl PoR – A 2,497,741 19,319,949 0 .05
SHANgHAI PUDoNg DEVEl BANK – A 2,519,141 54,938,191 0 .13
SHANgHAI RAAS BlooD PRoDUC – A 199,100 9,451,708 0 .02
SHENwAN HoNgyUAN gRoUP Co – A 1,907,600 24,387,098 0 .06
SUNINg CoMMERCE gRoUP Co – A 2,265,253 36,368,247 0 .09
zHEJIANg zHENENg ElECTRIC – A 1,505,300 13,458,236 0 .03
2,576,081,595 6 .00
ToTAl CAAPS 29,941,247,894 69 .70
UNlISTED INDEX-lINKED wARRANTS ISSUED By HSBC BANK PlCFTSE CHINA A50 INDEX 68,578 1,125,429,185 2 .62
ToTAl UNlISTED INDEX-lINKED wARRANTS 1,125,429,185 2 .62
ToTAl INVESTMENTS 42,722,659,436 99 .45
oTHER NET ASSETS 237,695,967 0 .55
NET ASSETS ATTRIBUTABlE To UNITHolDERS AT 31ST DECEMBER 2015 42,960,355,403 100 .00
ToTAl INVESTMENTS, AT CoST 35,224,832,812
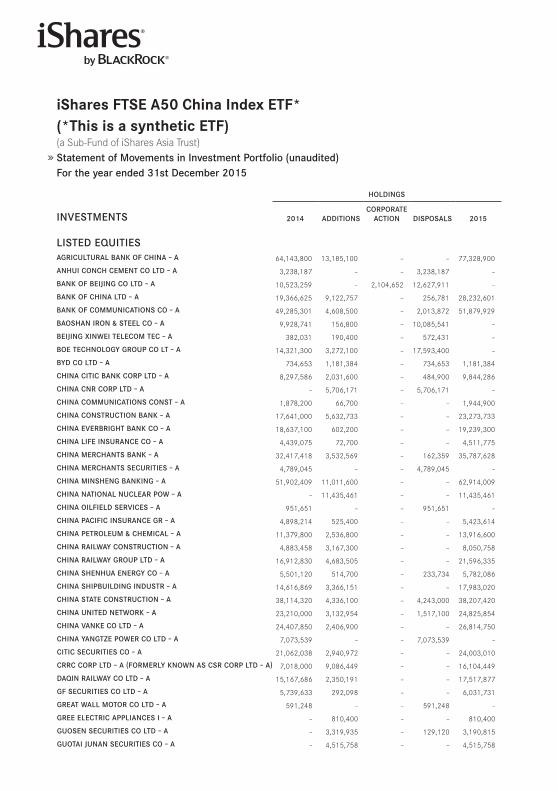
iShares fTSe A50 China index eTf*(*This is a synthetic eTf) (a Sub-Fund of iShares Asia Trust) Statement of Movements in Investment Portfolio (unaudited)For the year ended 31st December 2015
HolDINgS
INVESTMENTS 2014 ADDITIoNSCoRPoRATE
ACTIoN DISPoSAlS 2015
lISTED EqUITIESAgRICUlTURAl BANK oF CHINA – A 64,143,800 13,185,100 – – 77,328,900
ANHUI CoNCH CEMENT Co lTD – A 3,238,187 – – 3,238,187 –
BANK oF BEIJINg Co lTD – A 10,523,259 – 2,104,652 12,627,911 –
BANK oF CHINA lTD – A 19,366,625 9,122,757 – 256,781 28,232,601
BANK oF CoMMUNICATIoNS Co – A 49,285,301 4,608,500 – 2,013,872 51,879,929
BAoSHAN IRoN ﹠ STEEl Co – A 9,928,741 156,800 – 10,085,541 –
BEIJINg XINwEI TElECoM TEC – A 382,031 190,400 – 572,431 –
BoE TECHNology gRoUP Co lT – A 14,321,300 3,272,100 – 17,593,400 –
ByD Co lTD – A 734,653 1,181,384 – 734,653 1,181,384
CHINA CITIC BANK CoRP lTD – A 8,297,586 2,031,600 – 484,900 9,844,286
CHINA CNR CoRP lTD – A – 5,706,171 – 5,706,171 –
CHINA CoMMUNICATIoNS CoNST – A 1,878,200 66,700 – – 1,944,900
CHINA CoNSTRUCTIoN BANK – A 17,641,000 5,632,733 – – 23,273,733
CHINA EVERBRIgHT BANK Co – A 18,637,100 602,200 – – 19,239,300
CHINA lIFE INSURANCE Co – A 4,439,075 72,700 – – 4,511,775
CHINA MERCHANTS BANK – A 32,417,418 3,532,569 – 162,359 35,787,628
CHINA MERCHANTS SECURITIES – A 4,789,045 – – 4,789,045 –
CHINA MINSHENg BANKINg – A 51,902,409 11,011,600 – – 62,914,009
CHINA NATIoNAl NUClEAR Pow – A – 11,435,461 – – 11,435,461
CHINA oIlFIElD SERVICES – A 951,651 – – 951,651 –
CHINA PACIFIC INSURANCE gR – A 4,898,214 525,400 – – 5,423,614
CHINA PETRolEUM ﹠ CHEMICAl – A 11,379,800 2,536,800 – – 13,916,600
CHINA RAIlwAy CoNSTRUCTIoN – A 4,883,458 3,167,300 – – 8,050,758
CHINA RAIlwAy gRoUP lTD – A 16,912,830 4,683,505 – – 21,596,335
CHINA SHENHUA ENERgy Co – A 5,501,120 514,700 – 233,734 5,782,086
CHINA SHIPBUIlDINg INDUSTR – A 14,616,869 3,366,151 – – 17,983,020
CHINA STATE CoNSTRUCTIoN – A 38,114,320 4,336,100 – 4,243,000 38,207,420
CHINA UNITED NETwoRK – A 23,210,000 3,132,954 – 1,517,100 24,825,854
CHINA VANKE Co lTD – A 24,407,850 2,406,900 – – 26,814,750
CHINA yANgTzE PowER Co lTD – A 7,073,539 – – 7,073,539 –
CITIC SECURITIES Co – A 21,062,038 2,940,972 – – 24,003,010
CRRC CoRP lTD – A (FoRMERly KNowN AS CSR CoRP lTD – A) 7,018,000 9,086,449 – – 16,104,449
DAqIN RAIlwAy Co lTD – A 15,167,686 2,350,191 – – 17,517,877
gF SECURITIES Co lTD – A 5,739,633 292,098 – – 6,031,731
gREAT wAll MoToR Co lTD – A 591,248 – – 591,248 –
gREE ElECTRIC APPlIANCES I – A – 810,400 – – 810,400
gUoSEN SECURITIES Co lTD – A – 3,319,935 – 129,120 3,190,815
gUoTAI JUNAN SECURITIES Co – A – 4,515,758 – – 4,515,758
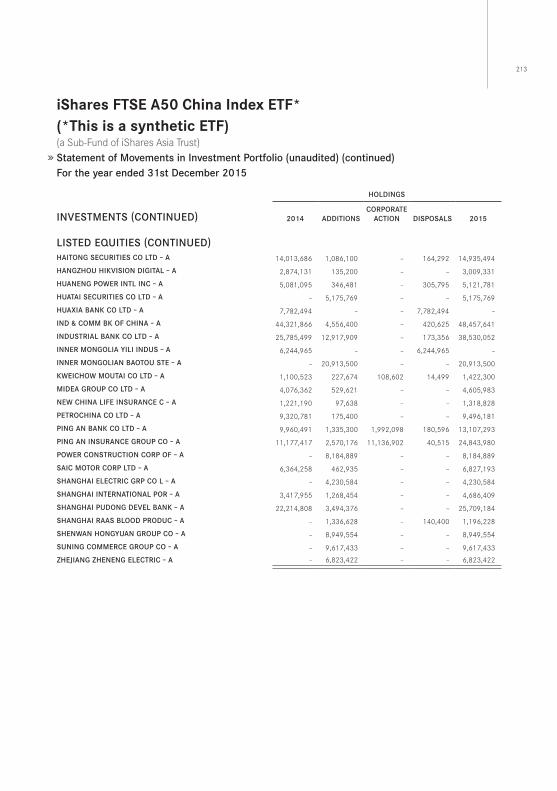
213
iShares fTSe A50 China index eTf*(*This is a synthetic eTf) (a Sub-Fund of iShares Asia Trust) Statement of Movements in Investment Portfolio (unaudited) (continued)For the year ended 31st December 2015
HolDINgS
INVESTMENTS (CoNTINUED) 2014 ADDITIoNSCoRPoRATE
ACTIoN DISPoSAlS 2015
lISTED EqUITIES (CoNTINUED)HAIToNg SECURITIES Co lTD – A 14,013,686 1,086,100 – 164,292 14,935,494
HANgzHoU HIKVISIoN DIgITAl – A 2,874,131 135,200 – – 3,009,331
HUANENg PowER INTl INC – A 5,081,095 346,481 – 305,795 5,121,781
HUATAI SECURITIES Co lTD – A – 5,175,769 – – 5,175,769
HUAXIA BANK Co lTD – A 7,782,494 – – 7,782,494 –
IND ﹠ CoMM BK oF CHINA – A 44,321,866 4,556,400 – 420,625 48,457,641
INDUSTRIAl BANK Co lTD – A 25,785,499 12,917,909 – 173,356 38,530,052
INNER MoNgolIA yIlI INDUS – A 6,244,965 – – 6,244,965 –
INNER MoNgolIAN BAoToU STE – A – 20,913,500 – – 20,913,500
KwEICHow MoUTAI Co lTD – A 1,100,523 227,674 108,602 14,499 1,422,300
MIDEA gRoUP Co lTD – A 4,076,362 529,621 – – 4,605,983
NEw CHINA lIFE INSURANCE C – A 1,221,190 97,638 – – 1,318,828
PETRoCHINA Co lTD – A 9,320,781 175,400 – – 9,496,181
PINg AN BANK Co lTD – A 9,960,491 1,335,300 1,992,098 180,596 13,107,293
PINg AN INSURANCE gRoUP Co – A 11,177,417 2,570,176 11,136,902 40,515 24,843,980
PowER CoNSTRUCTIoN CoRP oF – A – 8,184,889 – – 8,184,889
SAIC MoToR CoRP lTD – A 6,364,258 462,935 – – 6,827,193
SHANgHAI ElECTRIC gRP Co l – A – 4,230,584 – – 4,230,584
SHANgHAI INTERNATIoNAl PoR – A 3,417,955 1,268,454 – – 4,686,409
SHANgHAI PUDoNg DEVEl BANK – A 22,214,808 3,494,376 – – 25,709,184
SHANgHAI RAAS BlooD PRoDUC – A – 1,336,628 – 140,400 1,196,228
SHENwAN HoNgyUAN gRoUP Co – A – 8,949,554 – – 8,949,554
SUNINg CoMMERCE gRoUP Co – A – 9,617,433 – – 9,617,433
zHEJIANg zHENENg ElECTRIC – A – 6,823,422 – – 6,823,422
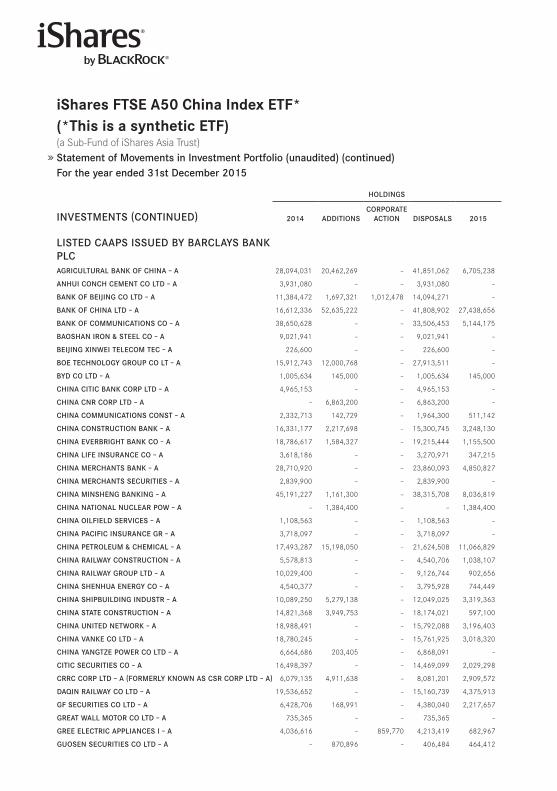
iShares fTSe A50 China index eTf*(*This is a synthetic eTf) (a Sub-Fund of iShares Asia Trust) Statement of Movements in Investment Portfolio (unaudited) (continued)For the year ended 31st December 2015
HolDINgS
INVESTMENTS (CoNTINUED) 2014 ADDITIoNSCoRPoRATE
ACTIoN DISPoSAlS 2015
lISTED CAAPS ISSUED By BARClAyS BANK PlCAgRICUlTURAl BANK oF CHINA – A 28,094,031 20,462,269 – 41,851,062 6,705,238
ANHUI CoNCH CEMENT Co lTD – A 3,931,080 – – 3,931,080 –
BANK oF BEIJINg Co lTD – A 11,384,472 1,697,321 1,012,478 14,094,271 –
BANK oF CHINA lTD – A 16,612,336 52,635,222 – 41,808,902 27,438,656
BANK oF CoMMUNICATIoNS Co – A 38,650,628 – – 33,506,453 5,144,175
BAoSHAN IRoN ﹠ STEEl Co – A 9,021,941 – – 9,021,941 –
BEIJINg XINwEI TElECoM TEC – A 226,600 – – 226,600 –
BoE TECHNology gRoUP Co lT – A 15,912,743 12,000,768 – 27,913,511 –
ByD Co lTD – A 1,005,634 145,000 – 1,005,634 145,000
CHINA CITIC BANK CoRP lTD – A 4,965,153 – – 4,965,153 –
CHINA CNR CoRP lTD – A – 6,863,200 – 6,863,200 –
CHINA CoMMUNICATIoNS CoNST – A 2,332,713 142,729 – 1,964,300 511,142
CHINA CoNSTRUCTIoN BANK – A 16,331,177 2,217,698 – 15,300,745 3,248,130
CHINA EVERBRIgHT BANK Co – A 18,786,617 1,584,327 – 19,215,444 1,155,500
CHINA lIFE INSURANCE Co – A 3,618,186 – – 3,270,971 347,215
CHINA MERCHANTS BANK – A 28,710,920 – – 23,860,093 4,850,827
CHINA MERCHANTS SECURITIES – A 2,839,900 – – 2,839,900 –
CHINA MINSHENg BANKINg – A 45,191,227 1,161,300 – 38,315,708 8,036,819
CHINA NATIoNAl NUClEAR Pow – A – 1,384,400 – – 1,384,400
CHINA oIlFIElD SERVICES – A 1,108,563 – – 1,108,563 –
CHINA PACIFIC INSURANCE gR – A 3,718,097 – – 3,718,097 –
CHINA PETRolEUM ﹠ CHEMICAl – A 17,493,287 15,198,050 – 21,624,508 11,066,829
CHINA RAIlwAy CoNSTRUCTIoN – A 5,578,813 – – 4,540,706 1,038,107
CHINA RAIlwAy gRoUP lTD – A 10,029,400 – – 9,126,744 902,656
CHINA SHENHUA ENERgy Co – A 4,540,377 – – 3,795,928 744,449
CHINA SHIPBUIlDINg INDUSTR – A 10,089,250 5,279,138 – 12,049,025 3,319,363
CHINA STATE CoNSTRUCTIoN – A 14,821,368 3,949,753 – 18,174,021 597,100
CHINA UNITED NETwoRK – A 18,988,491 – – 15,792,088 3,196,403
CHINA VANKE Co lTD – A 18,780,245 – – 15,761,925 3,018,320
CHINA yANgTzE PowER Co lTD – A 6,664,686 203,405 – 6,868,091 –
CITIC SECURITIES Co – A 16,498,397 – – 14,469,099 2,029,298
CRRC CoRP lTD – A (FoRMERly KNowN AS CSR CoRP lTD – A) 6,079,135 4,911,638 – 8,081,201 2,909,572
DAqIN RAIlwAy Co lTD – A 19,536,652 – – 15,160,739 4,375,913
gF SECURITIES Co lTD – A 6,428,706 168,991 – 4,380,040 2,217,657
gREAT wAll MoToR Co lTD – A 735,365 – – 735,365 –
gREE ElECTRIC APPlIANCES I – A 4,036,616 – 859,770 4,213,419 682,967
gUoSEN SECURITIES Co lTD – A – 870,896 – 406,484 464,412

215
iShares fTSe A50 China index eTf*(*This is a synthetic eTf) (a Sub-Fund of iShares Asia Trust) Statement of Movements in Investment Portfolio (unaudited) (continued)For the year ended 31st December 2015
HolDINgS
INVESTMENTS (CoNTINUED) 2014 ADDITIoNSCoRPoRATE
ACTIoN DISPoSAlS 2015
lISTED CAAPS ISSUED By BARClAyS BANK PlC (CoNTINUED)gUoTAI JUNAN SECURITIES Co – A – 540,600 – – 540,600
HAIToNg SECURITIES Co lTD – A 12,970,382 – – 10,716,515 2,253,867
HANgzHoU HIKVISIoN DIgITAl – A 2,234,810 – – 1,930,567 304,243
HUANENg PowER INTl INC – A 3,830,051 156,700 – 3,830,051 156,700
HUATAI SECURITIES Co lTD – A – 5,140,200 – 3,438,678 1,701,522
HUAXIA BANK Co lTD – A 6,183,915 – – 6,183,915 –
IND ﹠ CoMM BK oF CHINA – A 33,146,343 20,703,975 – 44,725,491 9,124,827
INDUSTRIAl BANK Co lTD – A 21,099,390 1,490,267 – 18,820,404 3,769,253
INNER MoNgolIA yIlI INDUS – A 5,460,140 – – 5,460,140 –
INNER MoNgolIAN BAoToU STE – A – 3,032,400 – – 3,032,400
KwEICHow MoUTAI Co lTD – A 693,564 26,600 7,770 693,873 34,061
MIDEA gRoUP Co lTD – A 3,631,135 – – 2,975,466 655,669
NEw CHINA lIFE INSURANCE C – A 1,019,758 68,501 – 876,558 211,701
PETRoCHINA Co lTD – A 6,955,481 366,945 – 6,987,426 335,000
PINg AN BANK Co lTD – A 10,352,414 – 1,626,763 9,725,307 2,253,870
PINg AN INSURANCE gRoUP Co – A 9,063,561 538,435 2,849,526 8,831,676 3,619,846
PowER CoNSTRUCTIoN CoRP oF – A – 1,176,800 – – 1,176,800
SAIC MoToR CoRP lTD – A 4,224,908 425,500 – 3,824,405 826,003
SHANgHAI ElECTRIC gRP Co l – A – 1,166,067 – 532,967 633,100
SHANgHAI INTERNATIoNAl PoR – A 4,805,355 232,941 – 3,810,164 1,228,132
SHANgHAI PUDoNg DEVEl BANK – A 21,779,062 – – 18,556,684 3,222,378
SHANgHAI RAAS BlooD PRoDUC – A – 204,800 – 46,600 158,200
SHENwAN HoNgyUAN gRoUP Co – A – 1,209,000 – – 1,209,000
SUNINg CoMMERCE gRoUP Co – A – 2,666,039 – 1,245,400 1,420,639
zHEJIANg zHENENg ElECTRIC – A – 954,000 – – 954,000
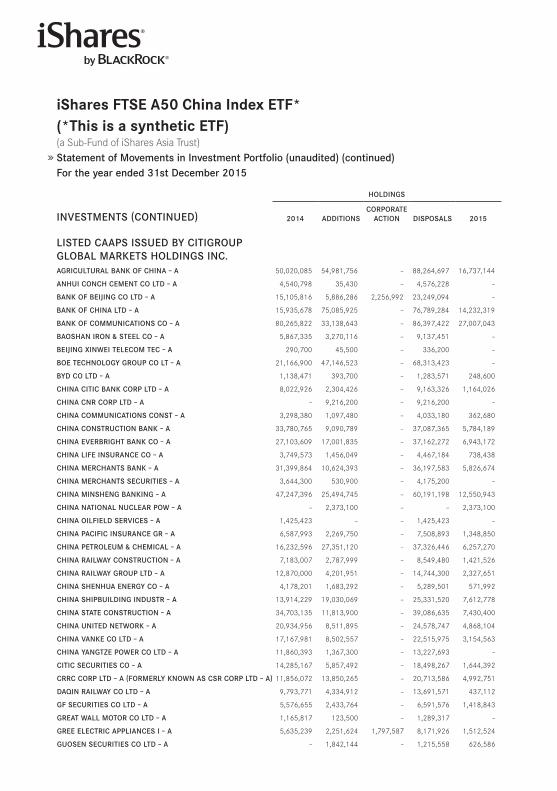
iShares fTSe A50 China index eTf*(*This is a synthetic eTf) (a Sub-Fund of iShares Asia Trust) Statement of Movements in Investment Portfolio (unaudited) (continued)For the year ended 31st December 2015
HolDINgS
INVESTMENTS (CoNTINUED) 2014 ADDITIoNSCoRPoRATE
ACTIoN DISPoSAlS 2015
lISTED CAAPS ISSUED By CITIgRoUP gloBAl MARKETS HolDINgS INC.AgRICUlTURAl BANK oF CHINA – A 50,020,085 54,981,756 – 88,264,697 16,737,144
ANHUI CoNCH CEMENT Co lTD – A 4,540,798 35,430 – 4,576,228 –
BANK oF BEIJINg Co lTD – A 15,105,816 5,886,286 2,256,992 23,249,094 –
BANK oF CHINA lTD – A 15,935,678 75,085,925 – 76,789,284 14,232,319
BANK oF CoMMUNICATIoNS Co – A 80,265,822 33,138,643 – 86,397,422 27,007,043
BAoSHAN IRoN ﹠ STEEl Co – A 5,867,335 3,270,116 – 9,137,451 –
BEIJINg XINwEI TElECoM TEC – A 290,700 45,500 – 336,200 –
BoE TECHNology gRoUP Co lT – A 21,166,900 47,146,523 – 68,313,423 –
ByD Co lTD – A 1,138,471 393,700 – 1,283,571 248,600
CHINA CITIC BANK CoRP lTD – A 8,022,926 2,304,426 – 9,163,326 1,164,026
CHINA CNR CoRP lTD – A – 9,216,200 – 9,216,200 –
CHINA CoMMUNICATIoNS CoNST – A 3,298,380 1,097,480 – 4,033,180 362,680
CHINA CoNSTRUCTIoN BANK – A 33,780,765 9,090,789 – 37,087,365 5,784,189
CHINA EVERBRIgHT BANK Co – A 27,103,609 17,001,835 – 37,162,272 6,943,172
CHINA lIFE INSURANCE Co – A 3,749,573 1,456,049 – 4,467,184 738,438
CHINA MERCHANTS BANK – A 31,399,864 10,624,393 – 36,197,583 5,826,674
CHINA MERCHANTS SECURITIES – A 3,644,300 530,900 – 4,175,200 –
CHINA MINSHENg BANKINg – A 47,247,396 25,494,745 – 60,191,198 12,550,943
CHINA NATIoNAl NUClEAR Pow – A – 2,373,100 – – 2,373,100
CHINA oIlFIElD SERVICES – A 1,425,423 – – 1,425,423 –
CHINA PACIFIC INSURANCE gR – A 6,587,993 2,269,750 – 7,508,893 1,348,850
CHINA PETRolEUM ﹠ CHEMICAl – A 16,232,596 27,351,120 – 37,326,446 6,257,270
CHINA RAIlwAy CoNSTRUCTIoN – A 7,183,007 2,787,999 – 8,549,480 1,421,526
CHINA RAIlwAy gRoUP lTD – A 12,870,000 4,201,951 – 14,744,300 2,327,651
CHINA SHENHUA ENERgy Co – A 4,178,201 1,683,292 – 5,289,501 571,992
CHINA SHIPBUIlDINg INDUSTR – A 13,914,229 19,030,069 – 25,331,520 7,612,778
CHINA STATE CoNSTRUCTIoN – A 34,703,135 11,813,900 – 39,086,635 7,430,400
CHINA UNITED NETwoRK – A 20,934,956 8,511,895 – 24,578,747 4,868,104
CHINA VANKE Co lTD – A 17,167,981 8,502,557 – 22,515,975 3,154,563
CHINA yANgTzE PowER Co lTD – A 11,860,393 1,367,300 – 13,227,693 –
CITIC SECURITIES Co – A 14,285,167 5,857,492 – 18,498,267 1,644,392
CRRC CoRP lTD – A (FoRMERly KNowN AS CSR CoRP lTD – A) 11,856,072 13,850,265 – 20,713,586 4,992,751
DAqIN RAIlwAy Co lTD – A 9,793,771 4,334,912 – 13,691,571 437,112
gF SECURITIES Co lTD – A 5,576,655 2,433,764 – 6,591,576 1,418,843
gREAT wAll MoToR Co lTD – A 1,165,817 123,500 – 1,289,317 –
gREE ElECTRIC APPlIANCES I – A 5,635,239 2,251,624 1,797,587 8,171,926 1,512,524
gUoSEN SECURITIES Co lTD – A – 1,842,144 – 1,215,558 626,586
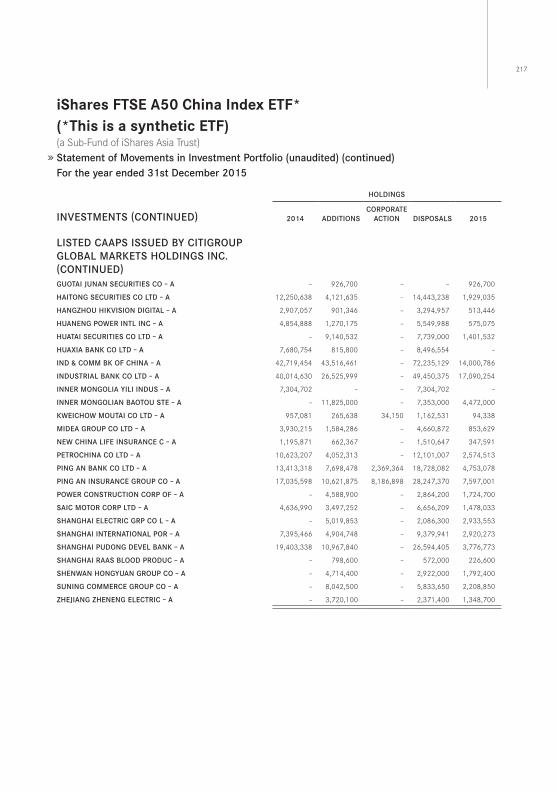
217
iShares fTSe A50 China index eTf*(*This is a synthetic eTf) (a Sub-Fund of iShares Asia Trust) Statement of Movements in Investment Portfolio (unaudited) (continued)For the year ended 31st December 2015
HolDINgS
INVESTMENTS (CoNTINUED) 2014 ADDITIoNSCoRPoRATE
ACTIoN DISPoSAlS 2015
lISTED CAAPS ISSUED By CITIgRoUP gloBAl MARKETS HolDINgS INC. (CoNTINUED)gUoTAI JUNAN SECURITIES Co – A – 926,700 – – 926,700
HAIToNg SECURITIES Co lTD – A 12,250,638 4,121,635 – 14,443,238 1,929,035
HANgzHoU HIKVISIoN DIgITAl – A 2,907,057 901,346 – 3,294,957 513,446
HUANENg PowER INTl INC – A 4,854,888 1,270,175 – 5,549,988 575,075
HUATAI SECURITIES Co lTD – A – 9,140,532 – 7,739,000 1,401,532
HUAXIA BANK Co lTD – A 7,680,754 815,800 – 8,496,554 –
IND ﹠ CoMM BK oF CHINA – A 42,719,454 43,516,461 – 72,235,129 14,000,786
INDUSTRIAl BANK Co lTD – A 40,014,630 26,525,999 – 49,450,375 17,090,254
INNER MoNgolIA yIlI INDUS – A 7,304,702 – – 7,304,702 –
INNER MoNgolIAN BAoToU STE – A – 11,825,000 – 7,353,000 4,472,000
KwEICHow MoUTAI Co lTD – A 957,081 265,638 34,150 1,162,531 94,338
MIDEA gRoUP Co lTD – A 3,930,215 1,584,286 – 4,660,872 853,629
NEw CHINA lIFE INSURANCE C – A 1,195,871 662,367 – 1,510,647 347,591
PETRoCHINA Co lTD – A 10,623,207 4,052,313 – 12,101,007 2,574,513
PINg AN BANK Co lTD – A 13,413,318 7,698,478 2,369,364 18,728,082 4,753,078
PINg AN INSURANCE gRoUP Co – A 17,035,598 10,621,875 8,186,898 28,247,370 7,597,001
PowER CoNSTRUCTIoN CoRP oF – A – 4,588,900 – 2,864,200 1,724,700
SAIC MoToR CoRP lTD – A 4,636,990 3,497,252 – 6,656,209 1,478,033
SHANgHAI ElECTRIC gRP Co l – A – 5,019,853 – 2,086,300 2,933,553
SHANgHAI INTERNATIoNAl PoR – A 7,395,466 4,904,748 – 9,379,941 2,920,273
SHANgHAI PUDoNg DEVEl BANK – A 19,403,338 10,967,840 – 26,594,405 3,776,773
SHANgHAI RAAS BlooD PRoDUC – A – 798,600 – 572,000 226,600
SHENwAN HoNgyUAN gRoUP Co – A – 4,714,400 – 2,922,000 1,792,400
SUNINg CoMMERCE gRoUP Co – A – 8,042,500 – 5,833,650 2,208,850
zHEJIANg zHENENg ElECTRIC – A – 3,720,100 – 2,371,400 1,348,700
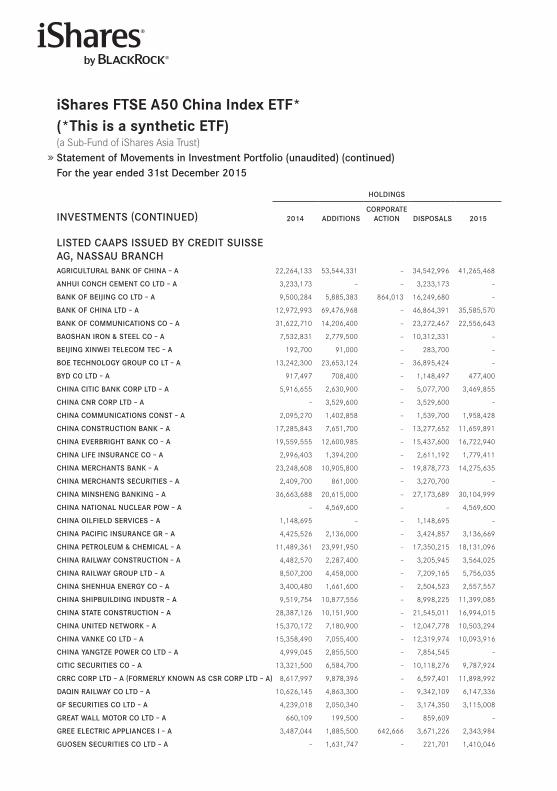
iShares fTSe A50 China index eTf*(*This is a synthetic eTf) (a Sub-Fund of iShares Asia Trust) Statement of Movements in Investment Portfolio (unaudited) (continued)For the year ended 31st December 2015
HolDINgS
INVESTMENTS (CoNTINUED) 2014 ADDITIoNSCoRPoRATE
ACTIoN DISPoSAlS 2015
lISTED CAAPS ISSUED By CREDIT SUISSE Ag, NASSAU BRANCHAgRICUlTURAl BANK oF CHINA – A 22,264,133 53,544,331 – 34,542,996 41,265,468
ANHUI CoNCH CEMENT Co lTD – A 3,233,173 – – 3,233,173 –
BANK oF BEIJINg Co lTD – A 9,500,284 5,885,383 864,013 16,249,680 –
BANK oF CHINA lTD – A 12,972,993 69,476,968 – 46,864,391 35,585,570
BANK oF CoMMUNICATIoNS Co – A 31,622,710 14,206,400 – 23,272,467 22,556,643
BAoSHAN IRoN ﹠ STEEl Co – A 7,532,831 2,779,500 – 10,312,331 –
BEIJINg XINwEI TElECoM TEC – A 192,700 91,000 – 283,700 –
BoE TECHNology gRoUP Co lT – A 13,242,300 23,653,124 – 36,895,424 –
ByD Co lTD – A 917,497 708,400 – 1,148,497 477,400
CHINA CITIC BANK CoRP lTD – A 5,916,655 2,630,900 – 5,077,700 3,469,855
CHINA CNR CoRP lTD – A – 3,529,600 – 3,529,600 –
CHINA CoMMUNICATIoNS CoNST – A 2,095,270 1,402,858 – 1,539,700 1,958,428
CHINA CoNSTRUCTIoN BANK – A 17,285,843 7,651,700 – 13,277,652 11,659,891
CHINA EVERBRIgHT BANK Co – A 19,559,555 12,600,985 – 15,437,600 16,722,940
CHINA lIFE INSURANCE Co – A 2,996,403 1,394,200 – 2,611,192 1,779,411
CHINA MERCHANTS BANK – A 23,248,608 10,905,800 – 19,878,773 14,275,635
CHINA MERCHANTS SECURITIES – A 2,409,700 861,000 – 3,270,700 –
CHINA MINSHENg BANKINg – A 36,663,688 20,615,000 – 27,173,689 30,104,999
CHINA NATIoNAl NUClEAR Pow – A – 4,569,600 – – 4,569,600
CHINA oIlFIElD SERVICES – A 1,148,695 – – 1,148,695 –
CHINA PACIFIC INSURANCE gR – A 4,425,526 2,136,000 – 3,424,857 3,136,669
CHINA PETRolEUM ﹠ CHEMICAl – A 11,489,361 23,991,950 – 17,350,215 18,131,096
CHINA RAIlwAy CoNSTRUCTIoN – A 4,482,570 2,287,400 – 3,205,945 3,564,025
CHINA RAIlwAy gRoUP lTD – A 8,507,200 4,458,000 – 7,209,165 5,756,035
CHINA SHENHUA ENERgy Co – A 3,400,480 1,661,600 – 2,504,523 2,557,557
CHINA SHIPBUIlDINg INDUSTR – A 9,519,754 10,877,556 – 8,998,225 11,399,085
CHINA STATE CoNSTRUCTIoN – A 28,387,126 10,151,900 – 21,545,011 16,994,015
CHINA UNITED NETwoRK – A 15,370,172 7,180,900 – 12,047,778 10,503,294
CHINA VANKE Co lTD – A 15,358,490 7,055,400 – 12,319,974 10,093,916
CHINA yANgTzE PowER Co lTD – A 4,999,045 2,855,500 – 7,854,545 –
CITIC SECURITIES Co – A 13,321,500 6,584,700 – 10,118,276 9,787,924
CRRC CoRP lTD – A (FoRMERly KNowN AS CSR CoRP lTD – A) 8,617,997 9,878,396 – 6,597,401 11,898,992
DAqIN RAIlwAy Co lTD – A 10,626,145 4,863,300 – 9,342,109 6,147,336
gF SECURITIES Co lTD – A 4,239,018 2,050,340 – 3,174,350 3,115,008
gREAT wAll MoToR Co lTD – A 660,109 199,500 – 859,609 –
gREE ElECTRIC APPlIANCES I – A 3,487,044 1,885,500 642,666 3,671,226 2,343,984
gUoSEN SECURITIES Co lTD – A – 1,631,747 – 221,701 1,410,046
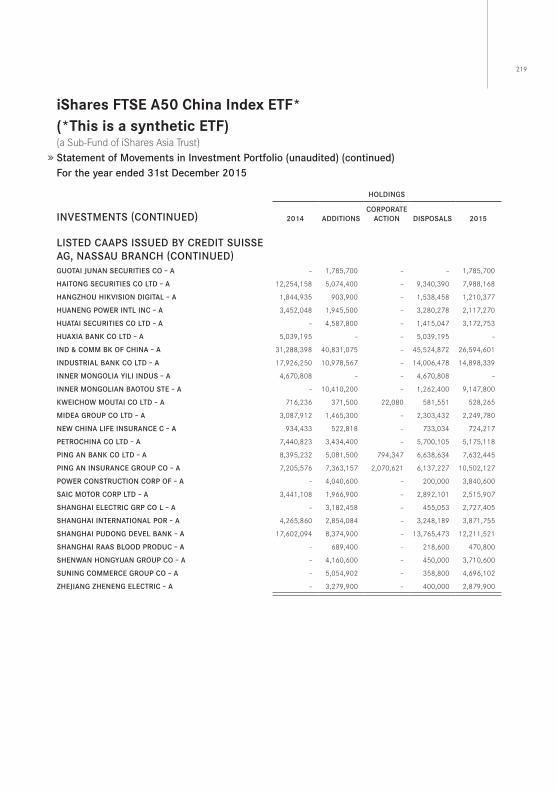
219
iShares fTSe A50 China index eTf*(*This is a synthetic eTf) (a Sub-Fund of iShares Asia Trust) Statement of Movements in Investment Portfolio (unaudited) (continued)For the year ended 31st December 2015
HolDINgS
INVESTMENTS (CoNTINUED) 2014 ADDITIoNSCoRPoRATE
ACTIoN DISPoSAlS 2015
lISTED CAAPS ISSUED By CREDIT SUISSE Ag, NASSAU BRANCH (CoNTINUED)gUoTAI JUNAN SECURITIES Co – A – 1,785,700 – – 1,785,700
HAIToNg SECURITIES Co lTD – A 12,254,158 5,074,400 – 9,340,390 7,988,168
HANgzHoU HIKVISIoN DIgITAl – A 1,844,935 903,900 – 1,538,458 1,210,377
HUANENg PowER INTl INC – A 3,452,048 1,945,500 – 3,280,278 2,117,270
HUATAI SECURITIES Co lTD – A – 4,587,800 – 1,415,047 3,172,753
HUAXIA BANK Co lTD – A 5,039,195 – – 5,039,195 –
IND ﹠ CoMM BK oF CHINA – A 31,288,398 40,831,075 – 45,524,872 26,594,601
INDUSTRIAl BANK Co lTD – A 17,926,250 10,978,567 – 14,006,478 14,898,339
INNER MoNgolIA yIlI INDUS – A 4,670,808 – – 4,670,808 –
INNER MoNgolIAN BAoToU STE – A – 10,410,200 – 1,262,400 9,147,800
KwEICHow MoUTAI Co lTD – A 716,236 371,500 22,080 581,551 528,265
MIDEA gRoUP Co lTD – A 3,087,912 1,465,300 – 2,303,432 2,249,780
NEw CHINA lIFE INSURANCE C – A 934,433 522,818 – 733,034 724,217
PETRoCHINA Co lTD – A 7,440,823 3,434,400 – 5,700,105 5,175,118
PINg AN BANK Co lTD – A 8,395,232 5,081,500 794,347 6,638,634 7,632,445
PINg AN INSURANCE gRoUP Co – A 7,205,576 7,363,157 2,070,621 6,137,227 10,502,127
PowER CoNSTRUCTIoN CoRP oF – A – 4,040,600 – 200,000 3,840,600
SAIC MoToR CoRP lTD – A 3,441,108 1,966,900 – 2,892,101 2,515,907
SHANgHAI ElECTRIC gRP Co l – A – 3,182,458 – 455,053 2,727,405
SHANgHAI INTERNATIoNAl PoR – A 4,265,860 2,854,084 – 3,248,189 3,871,755
SHANgHAI PUDoNg DEVEl BANK – A 17,602,094 8,374,900 – 13,765,473 12,211,521
SHANgHAI RAAS BlooD PRoDUC – A – 689,400 – 218,600 470,800
SHENwAN HoNgyUAN gRoUP Co – A – 4,160,600 – 450,000 3,710,600
SUNINg CoMMERCE gRoUP Co – A – 5,054,902 – 358,800 4,696,102
zHEJIANg zHENENg ElECTRIC – A – 3,279,900 – 400,000 2,879,900
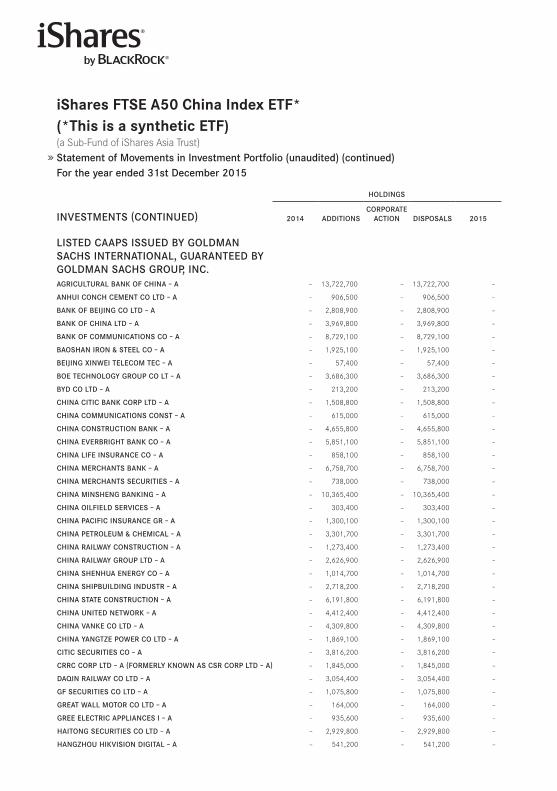
iShares fTSe A50 China index eTf*(*This is a synthetic eTf) (a Sub-Fund of iShares Asia Trust) Statement of Movements in Investment Portfolio (unaudited) (continued)For the year ended 31st December 2015
HolDINgS
INVESTMENTS (CoNTINUED) 2014 ADDITIoNSCoRPoRATE
ACTIoN DISPoSAlS 2015
lISTED CAAPS ISSUED By golDMAN SACHS INTERNATIoNAl, gUARANTEED By golDMAN SACHS gRoUP, INC.AgRICUlTURAl BANK oF CHINA – A – 13,722,700 – 13,722,700 –
ANHUI CoNCH CEMENT Co lTD – A – 906,500 – 906,500 –
BANK oF BEIJINg Co lTD – A – 2,808,900 – 2,808,900 –
BANK oF CHINA lTD – A – 3,969,800 – 3,969,800 –
BANK oF CoMMUNICATIoNS Co – A – 8,729,100 – 8,729,100 –
BAoSHAN IRoN ﹠ STEEl Co – A – 1,925,100 – 1,925,100 –
BEIJINg XINwEI TElECoM TEC – A – 57,400 – 57,400 –
BoE TECHNology gRoUP Co lT – A – 3,686,300 – 3,686,300 –
ByD Co lTD – A – 213,200 – 213,200 –
CHINA CITIC BANK CoRP lTD – A – 1,508,800 – 1,508,800 –
CHINA CoMMUNICATIoNS CoNST – A – 615,000 – 615,000 –
CHINA CoNSTRUCTIoN BANK – A – 4,655,800 – 4,655,800 –
CHINA EVERBRIgHT BANK Co – A – 5,851,100 – 5,851,100 –
CHINA lIFE INSURANCE Co – A – 858,100 – 858,100 –
CHINA MERCHANTS BANK – A – 6,758,700 – 6,758,700 –
CHINA MERCHANTS SECURITIES – A – 738,000 – 738,000 –
CHINA MINSHENg BANKINg – A – 10,365,400 – 10,365,400 –
CHINA oIlFIElD SERVICES – A – 303,400 – 303,400 –
CHINA PACIFIC INSURANCE gR – A – 1,300,100 – 1,300,100 –
CHINA PETRolEUM ﹠ CHEMICAl – A – 3,301,700 – 3,301,700 –
CHINA RAIlwAy CoNSTRUCTIoN – A – 1,273,400 – 1,273,400 –
CHINA RAIlwAy gRoUP lTD – A – 2,626,900 – 2,626,900 –
CHINA SHENHUA ENERgy Co – A – 1,014,700 – 1,014,700 –
CHINA SHIPBUIlDINg INDUSTR – A – 2,718,200 – 2,718,200 –
CHINA STATE CoNSTRUCTIoN – A – 6,191,800 – 6,191,800 –
CHINA UNITED NETwoRK – A – 4,412,400 – 4,412,400 –
CHINA VANKE Co lTD – A – 4,309,800 – 4,309,800 –
CHINA yANgTzE PowER Co lTD – A – 1,869,100 – 1,869,100 –
CITIC SECURITIES Co – A – 3,816,200 – 3,816,200 –
CRRC CoRP lTD – A (FoRMERly KNowN AS CSR CoRP lTD – A) – 1,845,000 – 1,845,000 –
DAqIN RAIlwAy Co lTD – A – 3,054,400 – 3,054,400 –
gF SECURITIES Co lTD – A – 1,075,800 – 1,075,800 –
gREAT wAll MoToR Co lTD – A – 164,000 – 164,000 –
gREE ElECTRIC APPlIANCES I – A – 935,600 – 935,600 –
HAIToNg SECURITIES Co lTD – A – 2,929,800 – 2,929,800 –
HANgzHoU HIKVISIoN DIgITAl – A – 541,200 – 541,200 –

221
iShares fTSe A50 China index eTf*(*This is a synthetic eTf) (a Sub-Fund of iShares Asia Trust) Statement of Movements in Investment Portfolio (unaudited) (continued)For the year ended 31st December 2015
HolDINgS
INVESTMENTS (CoNTINUED) 2014 ADDITIoNSCoRPoRATE
ACTIoN DISPoSAlS 2015
lISTED CAAPS ISSUED By golDMAN SACHS INTERNATIoNAl, gUARANTEED By golDMAN SACHS gRoUP, INC. (CoNTINUED)HUANENg PowER INTl INC – A – 1,013,100 – 1,013,100 –
HUAXIA BANK Co lTD – A – 1,501,900 – 1,501,900 –
IND ﹠ CoMM BK oF CHINA – A – 9,418,900 – 9,418,900 –
INDUSTRIAl BANK Co lTD – A – 4,727,200 – 4,727,200 –
INNER MoNgolIA yIlI INDUS – A – 1,297,200 – 1,297,200 –
KwEICHow MoUTAI Co lTD – A – 213,200 – 213,200 –
MIDEA gRoUP Co lTD – A – 873,700 – 873,700 –
NEw CHINA lIFE INSURANCE C – A – 246,000 – 246,000 –
PETRoCHINA Co lTD – A – 2,087,300 – 2,087,300 –
PINg AN BANK Co lTD – A – 2,458,700 – 2,458,700 –
PINg AN INSURANCE gRoUP Co – A – 2,173,700 – 2,173,700 –
SAIC MoToR CoRP lTD – A – 1,190,600 – 1,190,600 –
SHANgHAI INTERNATIoNAl PoR – A – 1,172,600 – 1,172,600 –
SHANgHAI PUDoNg DEVEl BANK – A – 5,104,400 – 5,104,400 –
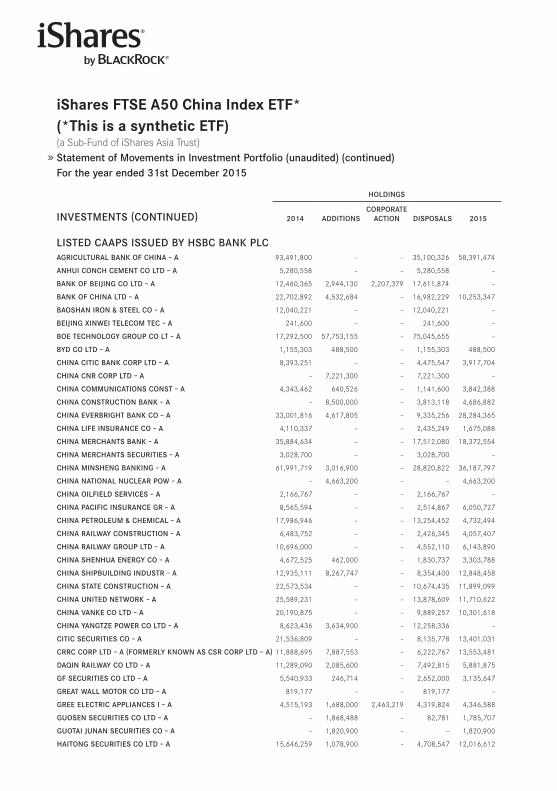
iShares fTSe A50 China index eTf*(*This is a synthetic eTf) (a Sub-Fund of iShares Asia Trust) Statement of Movements in Investment Portfolio (unaudited) (continued)For the year ended 31st December 2015
HolDINgS
INVESTMENTS (CoNTINUED) 2014 ADDITIoNSCoRPoRATE
ACTIoN DISPoSAlS 2015
lISTED CAAPS ISSUED By HSBC BANK PlCAgRICUlTURAl BANK oF CHINA – A 93,491,800 – – 35,100,326 58,391,474
ANHUI CoNCH CEMENT Co lTD – A 5,280,558 – – 5,280,558 –
BANK oF BEIJINg Co lTD – A 12,460,365 2,944,130 2,207,379 17,611,874 –
BANK oF CHINA lTD – A 22,702,892 4,532,684 – 16,982,229 10,253,347
BAoSHAN IRoN ﹠ STEEl Co – A 12,040,221 – – 12,040,221 –
BEIJINg XINwEI TElECoM TEC – A 241,600 – – 241,600 –
BoE TECHNology gRoUP Co lT – A 17,292,500 57,753,155 – 75,045,655 –
ByD Co lTD – A 1,155,303 488,500 – 1,155,303 488,500
CHINA CITIC BANK CoRP lTD – A 8,393,251 – – 4,475,547 3,917,704
CHINA CNR CoRP lTD – A – 7,221,300 – 7,221,300 –
CHINA CoMMUNICATIoNS CoNST – A 4,343,462 640,526 – 1,141,600 3,842,388
CHINA CoNSTRUCTIoN BANK – A – 8,500,000 – 3,813,118 4,686,882
CHINA EVERBRIgHT BANK Co – A 33,001,816 4,617,805 – 9,335,256 28,284,365
CHINA lIFE INSURANCE Co – A 4,110,337 – – 2,435,249 1,675,088
CHINA MERCHANTS BANK – A 35,884,634 – – 17,512,080 18,372,554
CHINA MERCHANTS SECURITIES – A 3,028,700 – – 3,028,700 –
CHINA MINSHENg BANKINg – A 61,991,719 3,016,900 – 28,820,822 36,187,797
CHINA NATIoNAl NUClEAR Pow – A – 4,663,200 – – 4,663,200
CHINA oIlFIElD SERVICES – A 2,166,767 – – 2,166,767 –
CHINA PACIFIC INSURANCE gR – A 8,565,594 – – 2,514,867 6,050,727
CHINA PETRolEUM ﹠ CHEMICAl – A 17,986,946 – – 13,254,452 4,732,494
CHINA RAIlwAy CoNSTRUCTIoN – A 6,483,752 – – 2,426,345 4,057,407
CHINA RAIlwAy gRoUP lTD – A 10,696,000 – – 4,552,110 6,143,890
CHINA SHENHUA ENERgy Co – A 4,672,525 462,000 – 1,830,737 3,303,788
CHINA SHIPBUIlDINg INDUSTR – A 12,935,111 8,267,747 – 8,354,400 12,848,458
CHINA STATE CoNSTRUCTIoN – A 22,573,534 – – 10,674,435 11,899,099
CHINA UNITED NETwoRK – A 25,589,231 – – 13,878,609 11,710,622
CHINA VANKE Co lTD – A 20,190,875 – – 9,889,257 10,301,618
CHINA yANgTzE PowER Co lTD – A 8,623,436 3,634,900 – 12,258,336 –
CITIC SECURITIES Co – A 21,536,809 – – 8,135,778 13,401,031
CRRC CoRP lTD – A (FoRMERly KNowN AS CSR CoRP lTD – A) 11,888,695 7,887,553 – 6,222,767 13,553,481
DAqIN RAIlwAy Co lTD – A 11,289,090 2,085,600 – 7,492,815 5,881,875
gF SECURITIES Co lTD – A 5,540,933 246,714 – 2,652,000 3,135,647
gREAT wAll MoToR Co lTD – A 819,177 – – 819,177 –
gREE ElECTRIC APPlIANCES I – A 4,515,193 1,688,000 2,463,219 4,319,824 4,346,588
gUoSEN SECURITIES Co lTD – A – 1,868,488 – 82,781 1,785,707
gUoTAI JUNAN SECURITIES Co – A – 1,820,900 – – 1,820,900
HAIToNg SECURITIES Co lTD – A 15,646,259 1,078,900 – 4,708,547 12,016,612
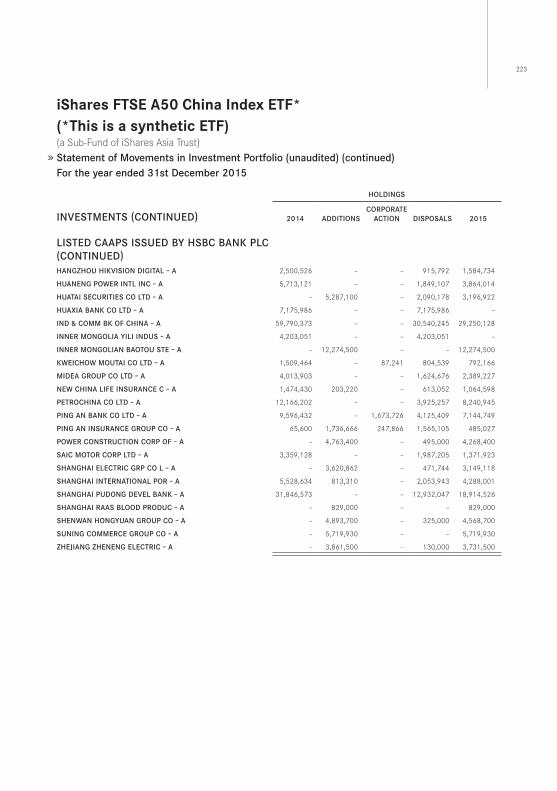
223
iShares fTSe A50 China index eTf*(*This is a synthetic eTf) (a Sub-Fund of iShares Asia Trust) Statement of Movements in Investment Portfolio (unaudited) (continued)For the year ended 31st December 2015
HolDINgS
INVESTMENTS (CoNTINUED) 2014 ADDITIoNSCoRPoRATE
ACTIoN DISPoSAlS 2015
lISTED CAAPS ISSUED By HSBC BANK PlC (CoNTINUED)HANgzHoU HIKVISIoN DIgITAl – A 2,500,526 – – 915,792 1,584,734
HUANENg PowER INTl INC – A 5,713,121 – – 1,849,107 3,864,014
HUATAI SECURITIES Co lTD – A – 5,287,100 – 2,090,178 3,196,922
HUAXIA BANK Co lTD – A 7,175,986 – – 7,175,986 –
IND ﹠ CoMM BK oF CHINA – A 59,790,373 – – 30,540,245 29,250,128
INNER MoNgolIA yIlI INDUS – A 4,203,051 – – 4,203,051 –
INNER MoNgolIAN BAoToU STE – A – 12,274,500 – – 12,274,500
KwEICHow MoUTAI Co lTD – A 1,509,464 – 87,241 804,539 792,166
MIDEA gRoUP Co lTD – A 4,013,903 – – 1,624,676 2,389,227
NEw CHINA lIFE INSURANCE C – A 1,474,430 203,220 – 613,052 1,064,598
PETRoCHINA Co lTD – A 12,166,202 – – 3,925,257 8,240,945
PINg AN BANK Co lTD – A 9,596,432 – 1,673,726 4,125,409 7,144,749
PINg AN INSURANCE gRoUP Co – A 65,600 1,736,666 247,866 1,565,105 485,027
PowER CoNSTRUCTIoN CoRP oF – A – 4,763,400 – 495,000 4,268,400
SAIC MoToR CoRP lTD – A 3,359,128 – – 1,987,205 1,371,923
SHANgHAI ElECTRIC gRP Co l – A – 3,620,862 – 471,744 3,149,118
SHANgHAI INTERNATIoNAl PoR – A 5,528,634 813,310 – 2,053,943 4,288,001
SHANgHAI PUDoNg DEVEl BANK – A 31,846,573 – – 12,932,047 18,914,526
SHANgHAI RAAS BlooD PRoDUC – A – 829,000 – – 829,000
SHENwAN HoNgyUAN gRoUP Co – A – 4,893,700 – 325,000 4,568,700
SUNINg CoMMERCE gRoUP Co – A – 5,719,930 – – 5,719,930
zHEJIANg zHENENg ElECTRIC – A – 3,861,500 – 130,000 3,731,500
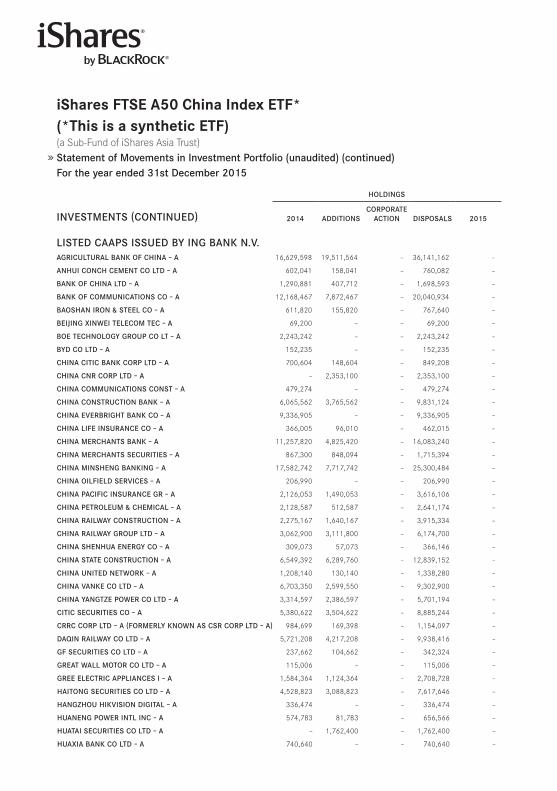
iShares fTSe A50 China index eTf*(*This is a synthetic eTf) (a Sub-Fund of iShares Asia Trust) Statement of Movements in Investment Portfolio (unaudited) (continued)For the year ended 31st December 2015
HolDINgS
INVESTMENTS (CoNTINUED) 2014 ADDITIoNSCoRPoRATE
ACTIoN DISPoSAlS 2015
lISTED CAAPS ISSUED By INg BANK N.V.AgRICUlTURAl BANK oF CHINA – A 16,629,598 19,511,564 – 36,141,162 –
ANHUI CoNCH CEMENT Co lTD – A 602,041 158,041 – 760,082 –
BANK oF CHINA lTD – A 1,290,881 407,712 – 1,698,593 –
BANK oF CoMMUNICATIoNS Co – A 12,168,467 7,872,467 – 20,040,934 –
BAoSHAN IRoN ﹠ STEEl Co – A 611,820 155,820 – 767,640 –
BEIJINg XINwEI TElECoM TEC – A 69,200 – – 69,200 –
BoE TECHNology gRoUP Co lT – A 2,243,242 – – 2,243,242 –
ByD Co lTD – A 152,235 – – 152,235 –
CHINA CITIC BANK CoRP lTD – A 700,604 148,604 – 849,208 –
CHINA CNR CoRP lTD – A – 2,353,100 – 2,353,100 –
CHINA CoMMUNICATIoNS CoNST – A 479,274 – – 479,274 –
CHINA CoNSTRUCTIoN BANK – A 6,065,562 3,765,562 – 9,831,124 –
CHINA EVERBRIgHT BANK Co – A 9,336,905 – – 9,336,905 –
CHINA lIFE INSURANCE Co – A 366,005 96,010 – 462,015 –
CHINA MERCHANTS BANK – A 11,257,820 4,825,420 – 16,083,240 –
CHINA MERCHANTS SECURITIES – A 867,300 848,094 – 1,715,394 –
CHINA MINSHENg BANKINg – A 17,582,742 7,717,742 – 25,300,484 –
CHINA oIlFIElD SERVICES – A 206,990 – – 206,990 –
CHINA PACIFIC INSURANCE gR – A 2,126,053 1,490,053 – 3,616,106 –
CHINA PETRolEUM ﹠ CHEMICAl – A 2,128,587 512,587 – 2,641,174 –
CHINA RAIlwAy CoNSTRUCTIoN – A 2,275,167 1,640,167 – 3,915,334 –
CHINA RAIlwAy gRoUP lTD – A 3,062,900 3,111,800 – 6,174,700 –
CHINA SHENHUA ENERgy Co – A 309,073 57,073 – 366,146 –
CHINA STATE CoNSTRUCTIoN – A 6,549,392 6,289,760 – 12,839,152 –
CHINA UNITED NETwoRK – A 1,208,140 130,140 – 1,338,280 –
CHINA VANKE Co lTD – A 6,703,350 2,599,550 – 9,302,900 –
CHINA yANgTzE PowER Co lTD – A 3,314,597 2,386,597 – 5,701,194 –
CITIC SECURITIES Co – A 5,380,622 3,504,622 – 8,885,244 –
CRRC CoRP lTD – A (FoRMERly KNowN AS CSR CoRP lTD – A) 984,699 169,398 – 1,154,097 –
DAqIN RAIlwAy Co lTD – A 5,721,208 4,217,208 – 9,938,416 –
gF SECURITIES Co lTD – A 237,662 104,662 – 342,324 –
gREAT wAll MoToR Co lTD – A 115,006 – – 115,006 –
gREE ElECTRIC APPlIANCES I – A 1,584,364 1,124,364 – 2,708,728 –
HAIToNg SECURITIES Co lTD – A 4,528,823 3,088,823 – 7,617,646 –
HANgzHoU HIKVISIoN DIgITAl – A 336,474 – – 336,474 –
HUANENg PowER INTl INC – A 574,783 81,783 – 656,566 –
HUATAI SECURITIES Co lTD – A – 1,762,400 – 1,762,400 –
HUAXIA BANK Co lTD – A 740,640 – – 740,640 –
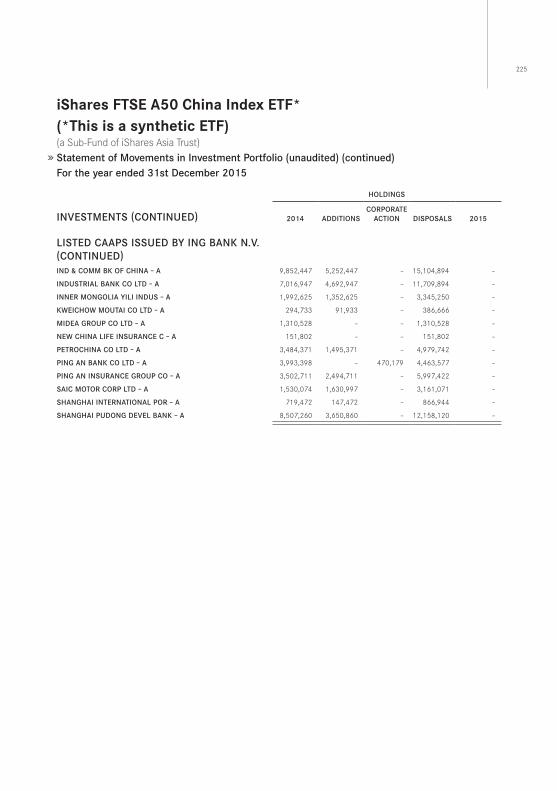
225
iShares fTSe A50 China index eTf*(*This is a synthetic eTf) (a Sub-Fund of iShares Asia Trust) Statement of Movements in Investment Portfolio (unaudited) (continued)For the year ended 31st December 2015
HolDINgS
INVESTMENTS (CoNTINUED) 2014 ADDITIoNSCoRPoRATE
ACTIoN DISPoSAlS 2015
lISTED CAAPS ISSUED By INg BANK N.V. (CoNTINUED)IND ﹠ CoMM BK oF CHINA – A 9,852,447 5,252,447 – 15,104,894 –
INDUSTRIAl BANK Co lTD – A 7,016,947 4,692,947 – 11,709,894 –
INNER MoNgolIA yIlI INDUS – A 1,992,625 1,352,625 – 3,345,250 –
KwEICHow MoUTAI Co lTD – A 294,733 91,933 – 386,666 –
MIDEA gRoUP Co lTD – A 1,310,528 – – 1,310,528 –
NEw CHINA lIFE INSURANCE C – A 151,802 – – 151,802 –
PETRoCHINA Co lTD – A 3,484,371 1,495,371 – 4,979,742 –
PINg AN BANK Co lTD – A 3,993,398 – 470,179 4,463,577 –
PINg AN INSURANCE gRoUP Co – A 3,502,711 2,494,711 – 5,997,422 –
SAIC MoToR CoRP lTD – A 1,530,074 1,630,997 – 3,161,071 –
SHANgHAI INTERNATIoNAl PoR – A 719,472 147,472 – 866,944 –
SHANgHAI PUDoNg DEVEl BANK – A 8,507,260 3,650,860 – 12,158,120 –
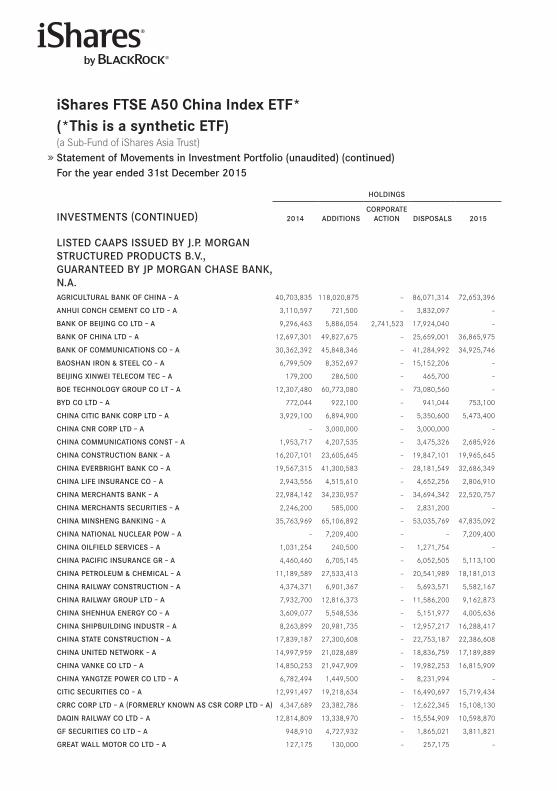
iShares fTSe A50 China index eTf*(*This is a synthetic eTf) (a Sub-Fund of iShares Asia Trust) Statement of Movements in Investment Portfolio (unaudited) (continued)For the year ended 31st December 2015
HolDINgS
INVESTMENTS (CoNTINUED) 2014 ADDITIoNSCoRPoRATE
ACTIoN DISPoSAlS 2015
lISTED CAAPS ISSUED By J.P. MoRgAN STRUCTURED PRoDUCTS B.V., gUARANTEED By JP MoRgAN CHASE BANK, N.A.AgRICUlTURAl BANK oF CHINA – A 40,703,835 118,020,875 – 86,071,314 72,653,396
ANHUI CoNCH CEMENT Co lTD – A 3,110,597 721,500 – 3,832,097 –
BANK oF BEIJINg Co lTD – A 9,296,463 5,886,054 2,741,523 17,924,040 –
BANK oF CHINA lTD – A 12,697,301 49,827,675 – 25,659,001 36,865,975
BANK oF CoMMUNICATIoNS Co – A 30,362,392 45,848,346 – 41,284,992 34,925,746
BAoSHAN IRoN ﹠ STEEl Co – A 6,799,509 8,352,697 – 15,152,206 –
BEIJINg XINwEI TElECoM TEC – A 179,200 286,500 – 465,700 –
BoE TECHNology gRoUP Co lT – A 12,307,480 60,773,080 – 73,080,560 –
ByD Co lTD – A 772,044 922,100 – 941,044 753,100
CHINA CITIC BANK CoRP lTD – A 3,929,100 6,894,900 – 5,350,600 5,473,400
CHINA CNR CoRP lTD – A – 3,000,000 – 3,000,000 –
CHINA CoMMUNICATIoNS CoNST – A 1,953,717 4,207,535 – 3,475,326 2,685,926
CHINA CoNSTRUCTIoN BANK – A 16,207,101 23,605,645 – 19,847,101 19,965,645
CHINA EVERBRIgHT BANK Co – A 19,567,315 41,300,583 – 28,181,549 32,686,349
CHINA lIFE INSURANCE Co – A 2,943,556 4,515,610 – 4,652,256 2,806,910
CHINA MERCHANTS BANK – A 22,984,142 34,230,957 – 34,694,342 22,520,757
CHINA MERCHANTS SECURITIES – A 2,246,200 585,000 – 2,831,200 –
CHINA MINSHENg BANKINg – A 35,763,969 65,106,892 – 53,035,769 47,835,092
CHINA NATIoNAl NUClEAR Pow – A – 7,209,400 – – 7,209,400
CHINA oIlFIElD SERVICES – A 1,031,254 240,500 – 1,271,754 –
CHINA PACIFIC INSURANCE gR – A 4,460,460 6,705,145 – 6,052,505 5,113,100
CHINA PETRolEUM ﹠ CHEMICAl – A 11,189,589 27,533,413 – 20,541,989 18,181,013
CHINA RAIlwAy CoNSTRUCTIoN – A 4,374,371 6,901,367 – 5,693,571 5,582,167
CHINA RAIlwAy gRoUP lTD – A 7,932,700 12,816,373 – 11,586,200 9,162,873
CHINA SHENHUA ENERgy Co – A 3,609,077 5,548,536 – 5,151,977 4,005,636
CHINA SHIPBUIlDINg INDUSTR – A 8,263,899 20,981,735 – 12,957,217 16,288,417
CHINA STATE CoNSTRUCTIoN – A 17,839,187 27,300,608 – 22,753,187 22,386,608
CHINA UNITED NETwoRK – A 14,997,959 21,028,689 – 18,836,759 17,189,889
CHINA VANKE Co lTD – A 14,850,253 21,947,909 – 19,982,253 16,815,909
CHINA yANgTzE PowER Co lTD – A 6,782,494 1,449,500 – 8,231,994 –
CITIC SECURITIES Co – A 12,991,497 19,218,634 – 16,490,697 15,719,434
CRRC CoRP lTD – A (FoRMERly KNowN AS CSR CoRP lTD – A) 4,347,689 23,382,786 – 12,622,345 15,108,130
DAqIN RAIlwAy Co lTD – A 12,814,809 13,338,970 – 15,554,909 10,598,870
gF SECURITIES Co lTD – A 948,910 4,727,932 – 1,865,021 3,811,821
gREAT wAll MoToR Co lTD – A 127,175 130,000 – 257,175 –
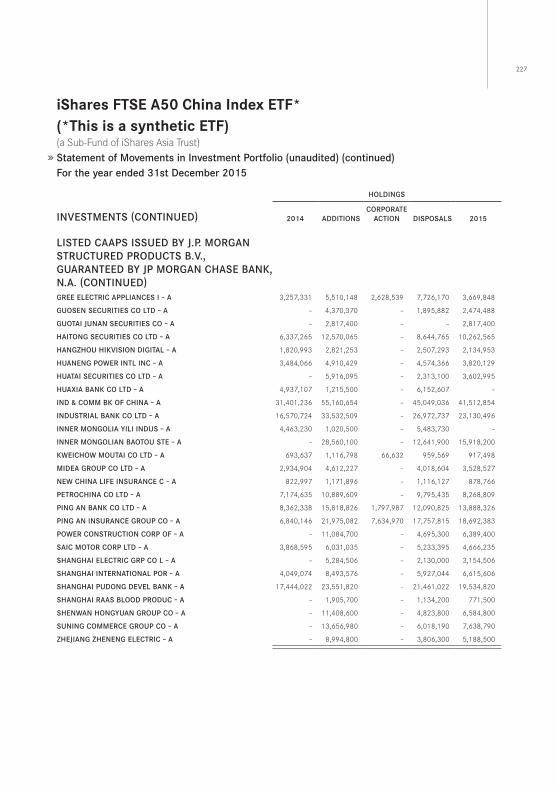
227
iShares fTSe A50 China index eTf*(*This is a synthetic eTf) (a Sub-Fund of iShares Asia Trust) Statement of Movements in Investment Portfolio (unaudited) (continued)For the year ended 31st December 2015
HolDINgS
INVESTMENTS (CoNTINUED) 2014 ADDITIoNSCoRPoRATE
ACTIoN DISPoSAlS 2015
lISTED CAAPS ISSUED By J.P. MoRgAN STRUCTURED PRoDUCTS B.V., gUARANTEED By JP MoRgAN CHASE BANK, N.A. (CoNTINUED)gREE ElECTRIC APPlIANCES I – A 3,257,331 5,510,148 2,628,539 7,726,170 3,669,848
gUoSEN SECURITIES Co lTD – A – 4,370,370 – 1,895,882 2,474,488
gUoTAI JUNAN SECURITIES Co – A – 2,817,400 – – 2,817,400
HAIToNg SECURITIES Co lTD – A 6,337,265 12,570,065 – 8,644,765 10,262,565
HANgzHoU HIKVISIoN DIgITAl – A 1,820,993 2,821,253 – 2,507,293 2,134,953
HUANENg PowER INTl INC – A 3,484,066 4,910,429 – 4,574,366 3,820,129
HUATAI SECURITIES Co lTD – A – 5,916,095 – 2,313,100 3,602,995
HUAXIA BANK Co lTD – A 4,937,107 1,215,500 – 6,152,607 –
IND ﹠ CoMM BK oF CHINA – A 31,401,236 55,160,654 – 45,049,036 41,512,854
INDUSTRIAl BANK Co lTD – A 16,570,724 33,532,509 – 26,972,737 23,130,496
INNER MoNgolIA yIlI INDUS – A 4,463,230 1,020,500 – 5,483,730 –
INNER MoNgolIAN BAoToU STE – A – 28,560,100 – 12,641,900 15,918,200
KwEICHow MoUTAI Co lTD – A 693,637 1,116,798 66,632 959,569 917,498
MIDEA gRoUP Co lTD – A 2,934,904 4,612,227 – 4,018,604 3,528,527
NEw CHINA lIFE INSURANCE C – A 822,997 1,171,896 – 1,116,127 878,766
PETRoCHINA Co lTD – A 7,174,635 10,889,609 – 9,795,435 8,268,809
PINg AN BANK Co lTD – A 8,362,338 15,818,826 1,797,987 12,090,825 13,888,326
PINg AN INSURANCE gRoUP Co – A 6,840,146 21,975,082 7,634,970 17,757,815 18,692,383
PowER CoNSTRUCTIoN CoRP oF – A – 11,084,700 – 4,695,300 6,389,400
SAIC MoToR CoRP lTD – A 3,868,595 6,031,035 – 5,233,395 4,666,235
SHANgHAI ElECTRIC gRP Co l – A – 5,284,506 – 2,130,000 3,154,506
SHANgHAI INTERNATIoNAl PoR – A 4,049,074 8,493,576 – 5,927,044 6,615,606
SHANgHAI PUDoNg DEVEl BANK – A 17,444,022 23,551,820 – 21,461,022 19,534,820
SHANgHAI RAAS BlooD PRoDUC – A – 1,905,700 – 1,134,200 771,500
SHENwAN HoNgyUAN gRoUP Co – A – 11,408,600 – 4,823,800 6,584,800
SUNINg CoMMERCE gRoUP Co – A – 13,656,980 – 6,018,190 7,638,790
zHEJIANg zHENENg ElECTRIC – A – 8,994,800 – 3,806,300 5,188,500

iShares fTSe A50 China index eTf*(*This is a synthetic eTf) (a Sub-Fund of iShares Asia Trust) Statement of Movements in Investment Portfolio (unaudited) (continued)For the year ended 31st December 2015
HolDINgS
INVESTMENTS (CoNTINUED) 2014 ADDITIoNSCoRPoRATE
ACTIoN DISPoSAlS 2015
lISTED CAAPS ISSUED By MACqUARIE BANK lTDAgRICUlTURAl BANK oF CHINA – A 24,255,810 9,065,255 – 4,733,013 28,588,052
ANHUI CoNCH CEMENT Co lTD – A 1,644,432 – – 1,644,432 –
BANK oF BEIJINg Co lTD – A 4,973,619 1,809,391 1,356,602 8,139,612 –
BANK oF CHINA lTD – A 6,786,428 13,228,188 – 3,641,185 16,373,431
BANK oF CoMMUNICATIoNS Co – A 16,165,272 – – 2,496,571 13,668,701
BAoSHAN IRoN ﹠ STEEl Co – A 3,357,888 – – 3,357,888 –
BEIJINg XINwEI TElECoM TEC – A 99,300 – – 99,300 –
BoE TECHNology gRoUP Co lT – A 5,979,520 11,882,930 – 17,862,450 –
ByD Co lTD – A 402,232 313,300 – 402,232 313,300
CHINA CITIC BANK CoRP lTD – A 2,673,800 – – 436,600 2,237,200
CHINA CNR CoRP lTD – A – 3,529,600 – 3,529,600 –
CHINA CoMMUNICATIoNS CoNST – A 1,144,156 213,746 – 253,300 1,104,602
CHINA CoNSTRUCTIoN BANK – A 8,527,685 – – 1,493,326 7,034,359
CHINA EVERBRIgHT BANK Co – A 10,447,937 1,963,851 – 1,156,100 11,255,688
CHINA lIFE INSURANCE Co – A 1,556,220 – – 428,400 1,127,820
CHINA MERCHANTS BANK – A 12,254,554 – – 3,149,605 9,104,949
CHINA MERCHANTS SECURITIES – A 1,244,900 – – 1,244,900 –
CHINA MINSHENg BANKINg – A 18,936,465 1,651,000 – 1,695,543 18,891,922
CHINA NATIoNAl NUClEAR Pow – A – 2,990,600 – – 2,990,600
CHINA oIlFIElD SERVICES – A 557,510 – – 557,510 –
CHINA PACIFIC INSURANCE gR – A 2,355,553 – – 310,410 2,045,143
CHINA PETRolEUM ﹠ CHEMICAl – A 5,958,405 3,376,100 – 1,909,798 7,424,707
CHINA RAIlwAy CoNSTRUCTIoN – A 2,350,699 – – 132,543 2,218,156
CHINA RAIlwAy gRoUP lTD – A 4,396,300 – – 459,730 3,936,570
CHINA SHENHUA ENERgy Co – A 1,867,602 – – 263,852 1,603,750
CHINA SHIPBUIlDINg INDUSTR – A 4,673,263 3,623,916 – 1,146,532 7,150,647
CHINA STATE CoNSTRUCTIoN – A 10,816,090 – – 1,380,019 9,436,071
CHINA UNITED NETwoRK – A 7,916,056 – – 1,030,207 6,885,849
CHINA VANKE Co lTD – A 7,826,992 – – 1,132,393 6,694,599
CHINA yANgTzE PowER Co lTD – A 3,473,998 – – 3,473,998 –
CITIC SECURITIES Co – A 6,909,859 – – 612,548 6,297,311
CRRC CoRP lTD – A (FoRMERly KNowN AS CSR CoRP lTD – A) 3,321,835 4,796,175 – 1,805,989 6,312,021
DAqIN RAIlwAy Co lTD – A 5,795,148 – – 1,590,225 4,204,923
gF SECURITIES Co lTD – A 2,025,276 129,315 – 286,000 1,868,591
gREAT wAll MoToR Co lTD – A 316,432 – – 316,432 –
gREE ElECTRIC APPlIANCES I – A 1,685,129 – 1,013,218 1,230,736 1,467,611
gUoSEN SECURITIES Co lTD – A – 1,029,552 – 45,613 983,939
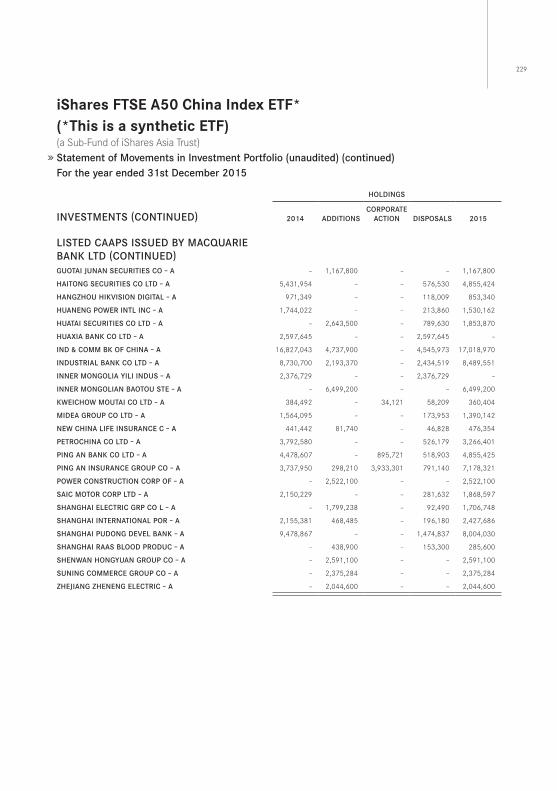
229
iShares fTSe A50 China index eTf*(*This is a synthetic eTf) (a Sub-Fund of iShares Asia Trust) Statement of Movements in Investment Portfolio (unaudited) (continued)For the year ended 31st December 2015
HolDINgS
INVESTMENTS (CoNTINUED) 2014 ADDITIoNSCoRPoRATE
ACTIoN DISPoSAlS 2015
lISTED CAAPS ISSUED By MACqUARIE BANK lTD (CoNTINUED)gUoTAI JUNAN SECURITIES Co – A – 1,167,800 – – 1,167,800
HAIToNg SECURITIES Co lTD – A 5,431,954 – – 576,530 4,855,424
HANgzHoU HIKVISIoN DIgITAl – A 971,349 – – 118,009 853,340
HUANENg PowER INTl INC – A 1,744,022 – – 213,860 1,530,162
HUATAI SECURITIES Co lTD – A – 2,643,500 – 789,630 1,853,870
HUAXIA BANK Co lTD – A 2,597,645 – – 2,597,645 –
IND ﹠ CoMM BK oF CHINA – A 16,827,043 4,737,900 – 4,545,973 17,018,970
INDUSTRIAl BANK Co lTD – A 8,730,700 2,193,370 – 2,434,519 8,489,551
INNER MoNgolIA yIlI INDUS – A 2,376,729 – – 2,376,729 –
INNER MoNgolIAN BAoToU STE – A – 6,499,200 – – 6,499,200
KwEICHow MoUTAI Co lTD – A 384,492 – 34,121 58,209 360,404
MIDEA gRoUP Co lTD – A 1,564,095 – – 173,953 1,390,142
NEw CHINA lIFE INSURANCE C – A 441,442 81,740 – 46,828 476,354
PETRoCHINA Co lTD – A 3,792,580 – – 526,179 3,266,401
PINg AN BANK Co lTD – A 4,478,607 – 895,721 518,903 4,855,425
PINg AN INSURANCE gRoUP Co – A 3,737,950 298,210 3,933,301 791,140 7,178,321
PowER CoNSTRUCTIoN CoRP oF – A – 2,522,100 – – 2,522,100
SAIC MoToR CoRP lTD – A 2,150,229 – – 281,632 1,868,597
SHANgHAI ElECTRIC gRP Co l – A – 1,799,238 – 92,490 1,706,748
SHANgHAI INTERNATIoNAl PoR – A 2,155,381 468,485 – 196,180 2,427,686
SHANgHAI PUDoNg DEVEl BANK – A 9,478,867 – – 1,474,837 8,004,030
SHANgHAI RAAS BlooD PRoDUC – A – 438,900 – 153,300 285,600
SHENwAN HoNgyUAN gRoUP Co – A – 2,591,100 – – 2,591,100
SUNINg CoMMERCE gRoUP Co – A – 2,375,284 – – 2,375,284
zHEJIANg zHENENg ElECTRIC – A – 2,044,600 – – 2,044,600
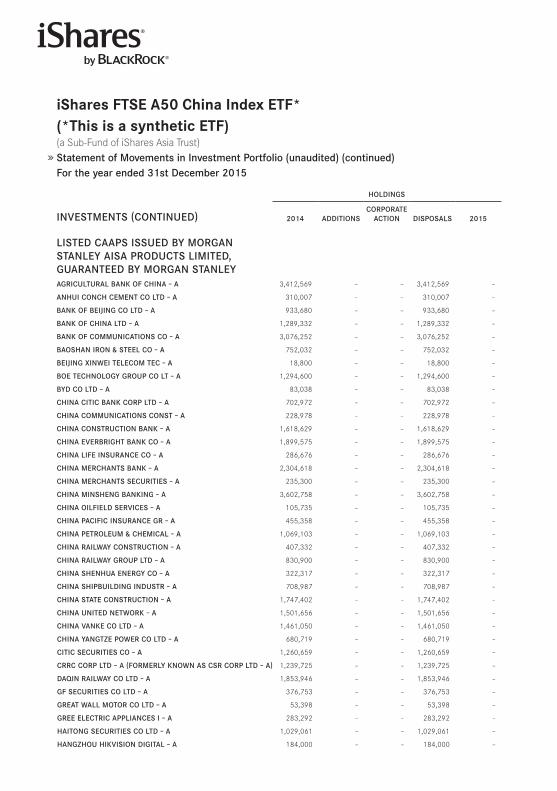
iShares fTSe A50 China index eTf*(*This is a synthetic eTf) (a Sub-Fund of iShares Asia Trust) Statement of Movements in Investment Portfolio (unaudited) (continued)For the year ended 31st December 2015
HolDINgS
INVESTMENTS (CoNTINUED) 2014 ADDITIoNSCoRPoRATE
ACTIoN DISPoSAlS 2015
lISTED CAAPS ISSUED By MoRgAN STANlEy AISA PRoDUCTS lIMITED, gUARANTEED By MoRgAN STANlEyAgRICUlTURAl BANK oF CHINA – A 3,412,569 – – 3,412,569 –
ANHUI CoNCH CEMENT Co lTD – A 310,007 – – 310,007 –
BANK oF BEIJINg Co lTD – A 933,680 – – 933,680 –
BANK oF CHINA lTD – A 1,289,332 – – 1,289,332 –
BANK oF CoMMUNICATIoNS Co – A 3,076,252 – – 3,076,252 –
BAoSHAN IRoN ﹠ STEEl Co – A 752,032 – – 752,032 –
BEIJINg XINwEI TElECoM TEC – A 18,800 – – 18,800 –
BoE TECHNology gRoUP Co lT – A 1,294,600 – – 1,294,600 –
ByD Co lTD – A 83,038 – – 83,038 –
CHINA CITIC BANK CoRP lTD – A 702,972 – – 702,972 –
CHINA CoMMUNICATIoNS CoNST – A 228,978 – – 228,978 –
CHINA CoNSTRUCTIoN BANK – A 1,618,629 – – 1,618,629 –
CHINA EVERBRIgHT BANK Co – A 1,899,575 – – 1,899,575 –
CHINA lIFE INSURANCE Co – A 286,676 – – 286,676 –
CHINA MERCHANTS BANK – A 2,304,618 – – 2,304,618 –
CHINA MERCHANTS SECURITIES – A 235,300 – – 235,300 –
CHINA MINSHENg BANKINg – A 3,602,758 – – 3,602,758 –
CHINA oIlFIElD SERVICES – A 105,735 – – 105,735 –
CHINA PACIFIC INSURANCE gR – A 455,358 – – 455,358 –
CHINA PETRolEUM ﹠ CHEMICAl – A 1,069,103 – – 1,069,103 –
CHINA RAIlwAy CoNSTRUCTIoN – A 407,332 – – 407,332 –
CHINA RAIlwAy gRoUP lTD – A 830,900 – – 830,900 –
CHINA SHENHUA ENERgy Co – A 322,317 – – 322,317 –
CHINA SHIPBUIlDINg INDUSTR – A 708,987 – – 708,987 –
CHINA STATE CoNSTRUCTIoN – A 1,747,402 – – 1,747,402 –
CHINA UNITED NETwoRK – A 1,501,656 – – 1,501,656 –
CHINA VANKE Co lTD – A 1,461,050 – – 1,461,050 –
CHINA yANgTzE PowER Co lTD – A 680,719 – – 680,719 –
CITIC SECURITIES Co – A 1,260,659 – – 1,260,659 –
CRRC CoRP lTD – A (FoRMERly KNowN AS CSR CoRP lTD – A) 1,239,725 – – 1,239,725 –
DAqIN RAIlwAy Co lTD – A 1,853,946 – – 1,853,946 –
gF SECURITIES Co lTD – A 376,753 – – 376,753 –
gREAT wAll MoToR Co lTD – A 53,398 – – 53,398 –
gREE ElECTRIC APPlIANCES I – A 283,292 – – 283,292 –
HAIToNg SECURITIES Co lTD – A 1,029,061 – – 1,029,061 –
HANgzHoU HIKVISIoN DIgITAl – A 184,000 – – 184,000 –
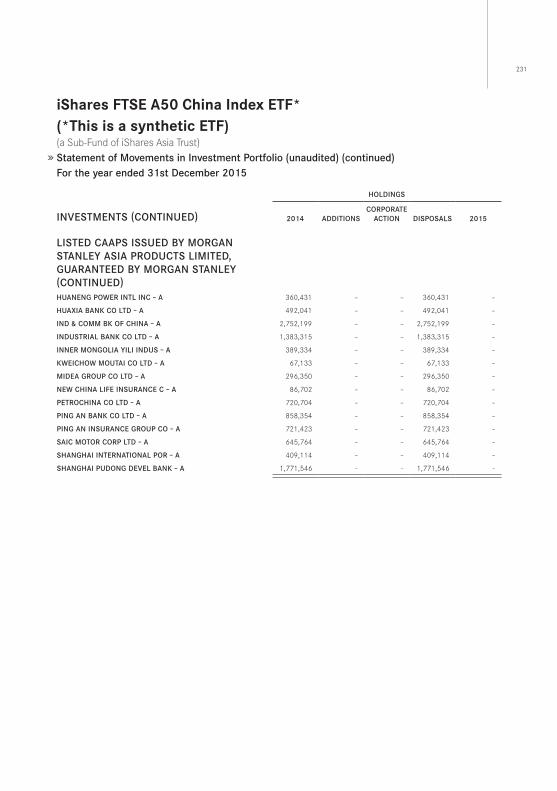
231
iShares fTSe A50 China index eTf*(*This is a synthetic eTf) (a Sub-Fund of iShares Asia Trust) Statement of Movements in Investment Portfolio (unaudited) (continued)For the year ended 31st December 2015
HolDINgS
INVESTMENTS (CoNTINUED) 2014 ADDITIoNSCoRPoRATE
ACTIoN DISPoSAlS 2015
lISTED CAAPS ISSUED By MoRgAN STANlEy ASIA PRoDUCTS lIMITED, gUARANTEED By MoRgAN STANlEy (CoNTINUED)HUANENg PowER INTl INC – A 360,431 – – 360,431 –
HUAXIA BANK Co lTD – A 492,041 – – 492,041 –
IND ﹠ CoMM BK oF CHINA – A 2,752,199 – – 2,752,199 –
INDUSTRIAl BANK Co lTD – A 1,383,315 – – 1,383,315 –
INNER MoNgolIA yIlI INDUS – A 389,334 – – 389,334 –
KwEICHow MoUTAI Co lTD – A 67,133 – – 67,133 –
MIDEA gRoUP Co lTD – A 296,350 – – 296,350 –
NEw CHINA lIFE INSURANCE C – A 86,702 – – 86,702 –
PETRoCHINA Co lTD – A 720,704 – – 720,704 –
PINg AN BANK Co lTD – A 858,354 – – 858,354 –
PINg AN INSURANCE gRoUP Co – A 721,423 – – 721,423 –
SAIC MoToR CoRP lTD – A 645,764 – – 645,764 –
SHANgHAI INTERNATIoNAl PoR – A 409,114 – – 409,114 –
SHANgHAI PUDoNg DEVEl BANK – A 1,771,546 – – 1,771,546 –
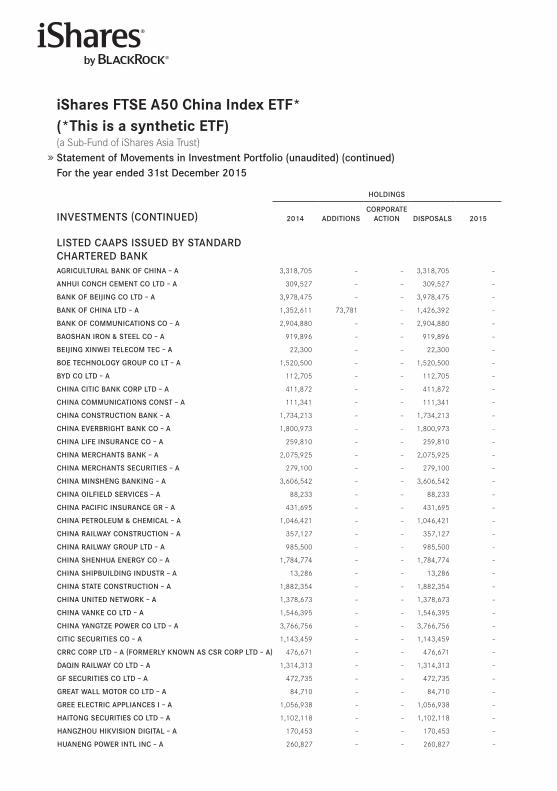
iShares fTSe A50 China index eTf*(*This is a synthetic eTf) (a Sub-Fund of iShares Asia Trust) Statement of Movements in Investment Portfolio (unaudited) (continued)For the year ended 31st December 2015
HolDINgS
INVESTMENTS (CoNTINUED) 2014 ADDITIoNSCoRPoRATE
ACTIoN DISPoSAlS 2015
lISTED CAAPS ISSUED By STANDARD CHARTERED BANKAgRICUlTURAl BANK oF CHINA – A 3,318,705 – – 3,318,705 –
ANHUI CoNCH CEMENT Co lTD – A 309,527 – – 309,527 –
BANK oF BEIJINg Co lTD – A 3,978,475 – – 3,978,475 –
BANK oF CHINA lTD – A 1,352,611 73,781 – 1,426,392 –
BANK oF CoMMUNICATIoNS Co – A 2,904,880 – – 2,904,880 –
BAoSHAN IRoN ﹠ STEEl Co – A 919,896 – – 919,896 –
BEIJINg XINwEI TElECoM TEC – A 22,300 – – 22,300 –
BoE TECHNology gRoUP Co lT – A 1,520,500 – – 1,520,500 –
ByD Co lTD – A 112,705 – – 112,705 –
CHINA CITIC BANK CoRP lTD – A 411,872 – – 411,872 –
CHINA CoMMUNICATIoNS CoNST – A 111,341 – – 111,341 –
CHINA CoNSTRUCTIoN BANK – A 1,734,213 – – 1,734,213 –
CHINA EVERBRIgHT BANK Co – A 1,800,973 – – 1,800,973 –
CHINA lIFE INSURANCE Co – A 259,810 – – 259,810 –
CHINA MERCHANTS BANK – A 2,075,925 – – 2,075,925 –
CHINA MERCHANTS SECURITIES – A 279,100 – – 279,100 –
CHINA MINSHENg BANKINg – A 3,606,542 – – 3,606,542 –
CHINA oIlFIElD SERVICES – A 88,233 – – 88,233 –
CHINA PACIFIC INSURANCE gR – A 431,695 – – 431,695 –
CHINA PETRolEUM ﹠ CHEMICAl – A 1,046,421 – – 1,046,421 –
CHINA RAIlwAy CoNSTRUCTIoN – A 357,127 – – 357,127 –
CHINA RAIlwAy gRoUP lTD – A 985,500 – – 985,500 –
CHINA SHENHUA ENERgy Co – A 1,784,774 – – 1,784,774 –
CHINA SHIPBUIlDINg INDUSTR – A 13,286 – – 13,286 –
CHINA STATE CoNSTRUCTIoN – A 1,882,354 – – 1,882,354 –
CHINA UNITED NETwoRK – A 1,378,673 – – 1,378,673 –
CHINA VANKE Co lTD – A 1,546,395 – – 1,546,395 –
CHINA yANgTzE PowER Co lTD – A 3,766,756 – – 3,766,756 –
CITIC SECURITIES Co – A 1,143,459 – – 1,143,459 –
CRRC CoRP lTD – A (FoRMERly KNowN AS CSR CoRP lTD – A) 476,671 – – 476,671 –
DAqIN RAIlwAy Co lTD – A 1,314,313 – – 1,314,313 –
gF SECURITIES Co lTD – A 472,735 – – 472,735 –
gREAT wAll MoToR Co lTD – A 84,710 – – 84,710 –
gREE ElECTRIC APPlIANCES I – A 1,056,938 – – 1,056,938 –
HAIToNg SECURITIES Co lTD – A 1,102,118 – – 1,102,118 –
HANgzHoU HIKVISIoN DIgITAl – A 170,453 – – 170,453 –
HUANENg PowER INTl INC – A 260,827 – – 260,827 –
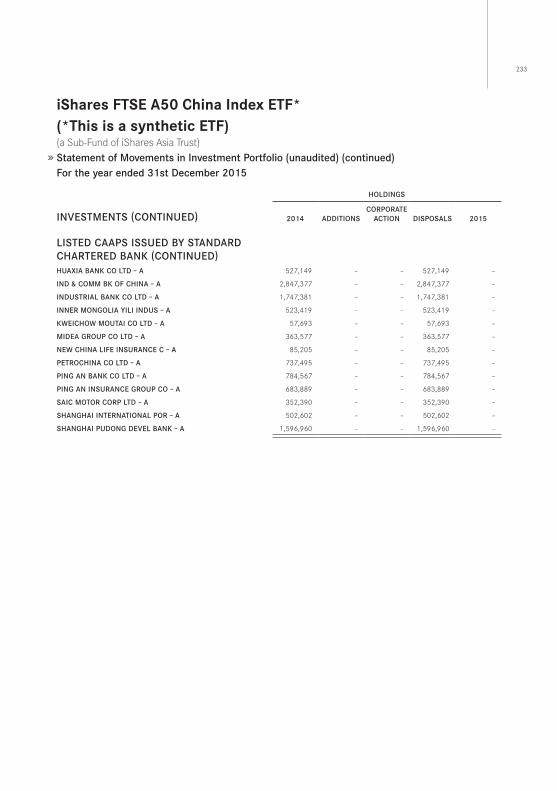
233
iShares fTSe A50 China index eTf*(*This is a synthetic eTf) (a Sub-Fund of iShares Asia Trust) Statement of Movements in Investment Portfolio (unaudited) (continued)For the year ended 31st December 2015
HolDINgS
INVESTMENTS (CoNTINUED) 2014 ADDITIoNSCoRPoRATE
ACTIoN DISPoSAlS 2015
lISTED CAAPS ISSUED By STANDARD CHARTERED BANK (CoNTINUED)HUAXIA BANK Co lTD – A 527,149 – – 527,149 –
IND ﹠ CoMM BK oF CHINA – A 2,847,377 – – 2,847,377 –
INDUSTRIAl BANK Co lTD – A 1,747,381 – – 1,747,381 –
INNER MoNgolIA yIlI INDUS – A 523,419 – – 523,419 –
KwEICHow MoUTAI Co lTD – A 57,693 – – 57,693 –
MIDEA gRoUP Co lTD – A 363,577 – – 363,577 –
NEw CHINA lIFE INSURANCE C – A 85,205 – – 85,205 –
PETRoCHINA Co lTD – A 737,495 – – 737,495 –
PINg AN BANK Co lTD – A 784,567 – – 784,567 –
PINg AN INSURANCE gRoUP Co – A 683,889 – – 683,889 –
SAIC MoToR CoRP lTD – A 352,390 – – 352,390 –
SHANgHAI INTERNATIoNAl PoR – A 502,602 – – 502,602 –
SHANgHAI PUDoNg DEVEl BANK – A 1,596,960 – – 1,596,960 –
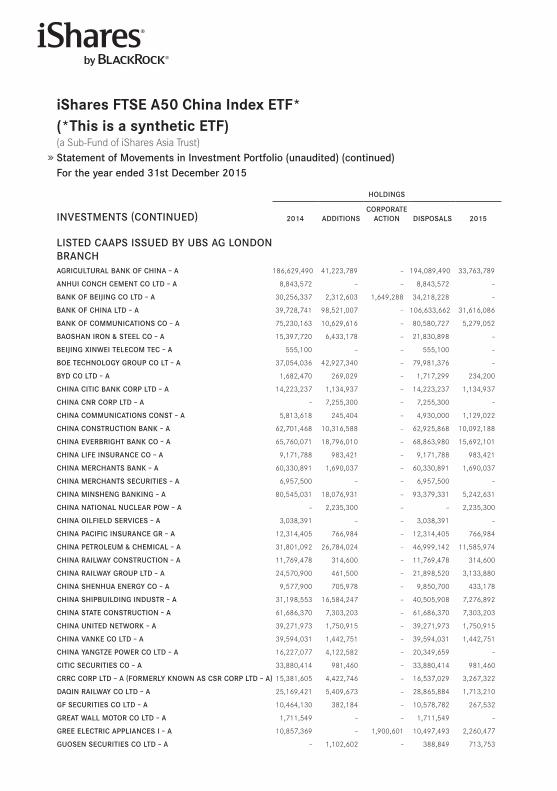
iShares fTSe A50 China index eTf*(*This is a synthetic eTf) (a Sub-Fund of iShares Asia Trust) Statement of Movements in Investment Portfolio (unaudited) (continued)For the year ended 31st December 2015
HolDINgS
INVESTMENTS (CoNTINUED) 2014 ADDITIoNSCoRPoRATE
ACTIoN DISPoSAlS 2015
lISTED CAAPS ISSUED By UBS Ag loNDoN BRANCHAgRICUlTURAl BANK oF CHINA – A 186,629,490 41,223,789 – 194,089,490 33,763,789
ANHUI CoNCH CEMENT Co lTD – A 8,843,572 – – 8,843,572 –
BANK oF BEIJINg Co lTD – A 30,256,337 2,312,603 1,649,288 34,218,228 –
BANK oF CHINA lTD – A 39,728,741 98,521,007 – 106,633,662 31,616,086
BANK oF CoMMUNICATIoNS Co – A 75,230,163 10,629,616 – 80,580,727 5,279,052
BAoSHAN IRoN ﹠ STEEl Co – A 15,397,720 6,433,178 – 21,830,898 –
BEIJINg XINwEI TElECoM TEC – A 555,100 – – 555,100 –
BoE TECHNology gRoUP Co lT – A 37,054,036 42,927,340 – 79,981,376 –
ByD Co lTD – A 1,682,470 269,029 – 1,717,299 234,200
CHINA CITIC BANK CoRP lTD – A 14,223,237 1,134,937 – 14,223,237 1,134,937
CHINA CNR CoRP lTD – A – 7,255,300 – 7,255,300 –
CHINA CoMMUNICATIoNS CoNST – A 5,813,618 245,404 – 4,930,000 1,129,022
CHINA CoNSTRUCTIoN BANK – A 62,701,468 10,316,588 – 62,925,868 10,092,188
CHINA EVERBRIgHT BANK Co – A 65,760,071 18,796,010 – 68,863,980 15,692,101
CHINA lIFE INSURANCE Co – A 9,171,788 983,421 – 9,171,788 983,421
CHINA MERCHANTS BANK – A 60,330,891 1,690,037 – 60,330,891 1,690,037
CHINA MERCHANTS SECURITIES – A 6,957,500 – – 6,957,500 –
CHINA MINSHENg BANKINg – A 80,545,031 18,076,931 – 93,379,331 5,242,631
CHINA NATIoNAl NUClEAR Pow – A – 2,235,300 – – 2,235,300
CHINA oIlFIElD SERVICES – A 3,038,391 – – 3,038,391 –
CHINA PACIFIC INSURANCE gR – A 12,314,405 766,984 – 12,314,405 766,984
CHINA PETRolEUM ﹠ CHEMICAl – A 31,801,092 26,784,024 – 46,999,142 11,585,974
CHINA RAIlwAy CoNSTRUCTIoN – A 11,769,478 314,600 – 11,769,478 314,600
CHINA RAIlwAy gRoUP lTD – A 24,570,900 461,500 – 21,898,520 3,133,880
CHINA SHENHUA ENERgy Co – A 9,577,900 705,978 – 9,850,700 433,178
CHINA SHIPBUIlDINg INDUSTR – A 31,198,553 16,584,247 – 40,505,908 7,276,892
CHINA STATE CoNSTRUCTIoN – A 61,686,370 7,303,203 – 61,686,370 7,303,203
CHINA UNITED NETwoRK – A 39,271,973 1,750,915 – 39,271,973 1,750,915
CHINA VANKE Co lTD – A 39,594,031 1,442,751 – 39,594,031 1,442,751
CHINA yANgTzE PowER Co lTD – A 16,227,077 4,122,582 – 20,349,659 –
CITIC SECURITIES Co – A 33,880,414 981,460 – 33,880,414 981,460
CRRC CoRP lTD – A (FoRMERly KNowN AS CSR CoRP lTD – A) 15,381,605 4,422,746 – 16,537,029 3,267,322
DAqIN RAIlwAy Co lTD – A 25,169,421 5,409,673 – 28,865,884 1,713,210
gF SECURITIES Co lTD – A 10,464,130 382,184 – 10,578,782 267,532
gREAT wAll MoToR Co lTD – A 1,711,549 – – 1,711,549 –
gREE ElECTRIC APPlIANCES I – A 10,857,369 – 1,900,601 10,497,493 2,260,477
gUoSEN SECURITIES Co lTD – A – 1,102,602 – 388,849 713,753
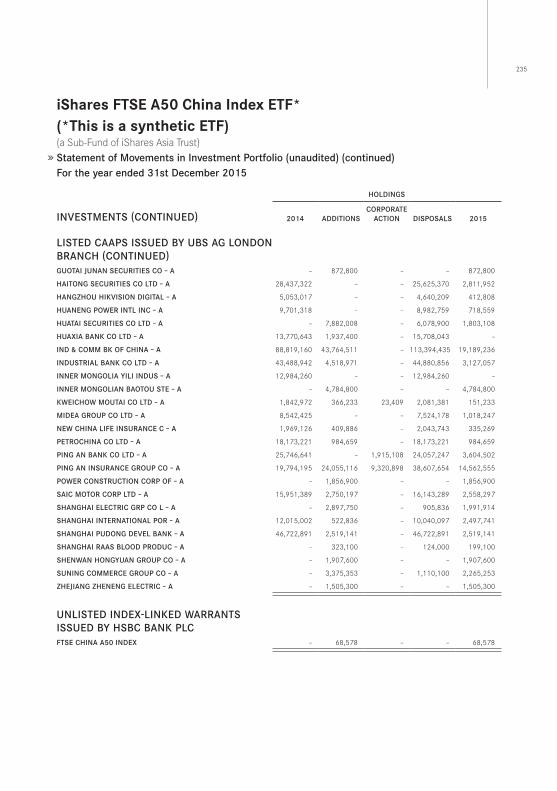
235
iShares fTSe A50 China index eTf*(*This is a synthetic eTf) (a Sub-Fund of iShares Asia Trust) Statement of Movements in Investment Portfolio (unaudited) (continued)For the year ended 31st December 2015
HolDINgS
INVESTMENTS (CoNTINUED) 2014 ADDITIoNSCoRPoRATE
ACTIoN DISPoSAlS 2015
lISTED CAAPS ISSUED By UBS Ag loNDoN BRANCH (CoNTINUED)gUoTAI JUNAN SECURITIES Co – A – 872,800 – – 872,800
HAIToNg SECURITIES Co lTD – A 28,437,322 – – 25,625,370 2,811,952
HANgzHoU HIKVISIoN DIgITAl – A 5,053,017 – – 4,640,209 412,808
HUANENg PowER INTl INC – A 9,701,318 – – 8,982,759 718,559
HUATAI SECURITIES Co lTD – A – 7,882,008 – 6,078,900 1,803,108
HUAXIA BANK Co lTD – A 13,770,643 1,937,400 – 15,708,043 –
IND ﹠ CoMM BK oF CHINA – A 88,819,160 43,764,511 – 113,394,435 19,189,236
INDUSTRIAl BANK Co lTD – A 43,488,942 4,518,971 – 44,880,856 3,127,057
INNER MoNgolIA yIlI INDUS – A 12,984,260 – – 12,984,260 –
INNER MoNgolIAN BAoToU STE – A – 4,784,800 – – 4,784,800
KwEICHow MoUTAI Co lTD – A 1,842,972 366,233 23,409 2,081,381 151,233
MIDEA gRoUP Co lTD – A 8,542,425 – – 7,524,178 1,018,247
NEw CHINA lIFE INSURANCE C – A 1,969,126 409,886 – 2,043,743 335,269
PETRoCHINA Co lTD – A 18,173,221 984,659 – 18,173,221 984,659
PINg AN BANK Co lTD – A 25,746,641 – 1,915,108 24,057,247 3,604,502
PINg AN INSURANCE gRoUP Co – A 19,794,195 24,055,116 9,320,898 38,607,654 14,562,555
PowER CoNSTRUCTIoN CoRP oF – A – 1,856,900 – – 1,856,900
SAIC MoToR CoRP lTD – A 15,951,389 2,750,197 – 16,143,289 2,558,297
SHANgHAI ElECTRIC gRP Co l – A – 2,897,750 – 905,836 1,991,914
SHANgHAI INTERNATIoNAl PoR – A 12,015,002 522,836 – 10,040,097 2,497,741
SHANgHAI PUDoNg DEVEl BANK – A 46,722,891 2,519,141 – 46,722,891 2,519,141
SHANgHAI RAAS BlooD PRoDUC – A – 323,100 – 124,000 199,100
SHENwAN HoNgyUAN gRoUP Co – A – 1,907,600 – – 1,907,600
SUNINg CoMMERCE gRoUP Co – A – 3,375,353 – 1,110,100 2,265,253
zHEJIANg zHENENg ElECTRIC – A – 1,505,300 – – 1,505,300
UNlISTED INDEX-lINKED wARRANTS ISSUED By HSBC BANK PlC
FTSE CHINA A50 INDEX – 68,578 – – 68,578
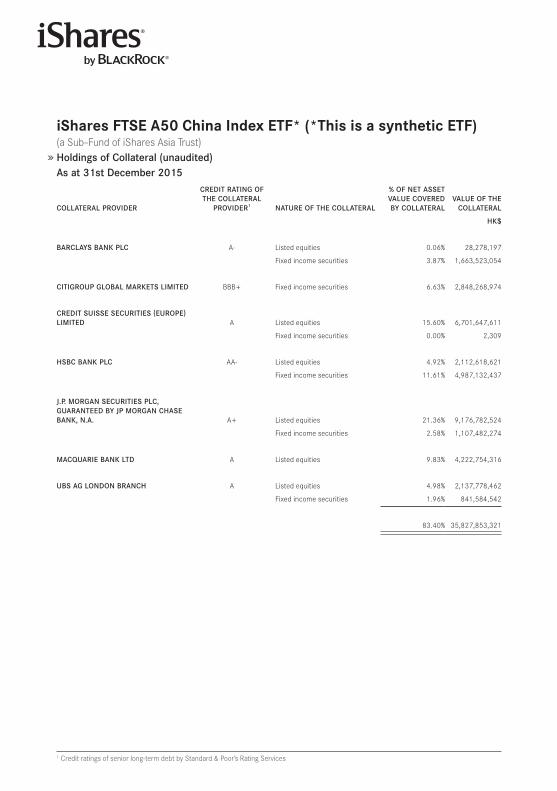
iShares fTSe A50 China index eTf* (*This is a synthetic eTf) (a Sub–Fund of iShares Asia Trust) Holdings of Collateral (unaudited)As at 31st December 2015
CollATERAl PRoVIDER
CREDIT RATINg oF THE CollATERAl
PRoVIDER1 NATURE oF THE CollATERAl
% oF NET ASSET VAlUE CoVERED By CollATERAl
VAlUE oF THE CollATERAl
HK$
BARClAyS BANK PlC A- Listed equities 0 .06% 28,278,197
Fixed income securities 3 .87% 1,663,523,054
CITIgRoUP gloBAl MARKETS lIMITED BBB+ Fixed income securities 6 .63% 2,848,268,974
CREDIT SUISSE SECURITIES (EURoPE) lIMITED A Listed equities 15 .60% 6,701,647,611
Fixed income securities 0 .00% 2,309
HSBC BANK PlC AA- Listed equities 4 .92% 2,112,618,621
Fixed income securities 11 .61% 4,987,132,437
J.P. MoRgAN SECURITIES PlC, gUARANTEED By JP MoRgAN CHASE BANK, N.A. A+ Listed equities 21 .36% 9,176,782,524
Fixed income securities 2 .58% 1,107,482,274
MACqUARIE BANK lTD A Listed equities 9 .83% 4,222,754,316
UBS Ag loNDoN BRANCH A Listed equities 4 .98% 2,137,778,462
Fixed income securities 1 .96% 841,584,542
83 .40% 35,827,853,321
1 Credit ratings of senior long-term debt by Standard & Poor’s Rating Services
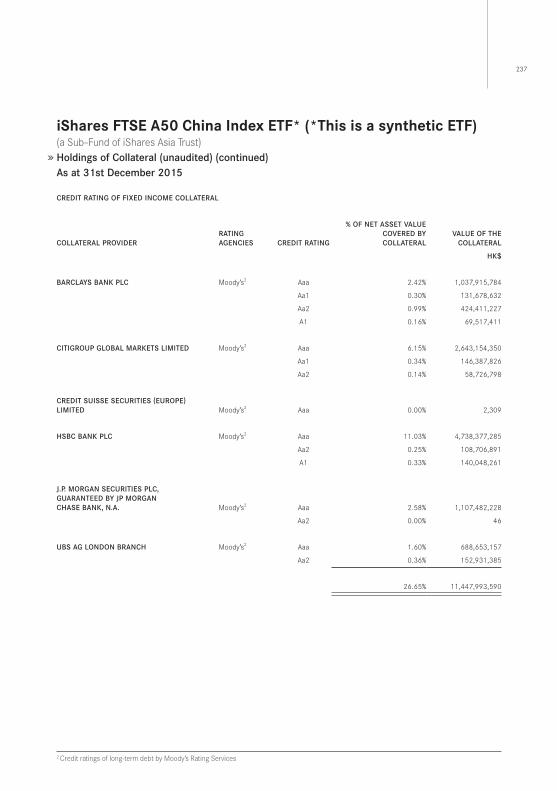
237
iShares fTSe A50 China index eTf* (*This is a synthetic eTf) (a Sub–Fund of iShares Asia Trust) Holdings of Collateral (unaudited) (continued)As at 31st December 2015
2 Credit ratings of long-term debt by Moody’s Rating Services
CREDIT RATINg oF FIXED INCoME CollATERAl
CollATERAl PRoVIDERRATINg AgENCIES CREDIT RATINg
% oF NET ASSET VAlUE CoVERED ByCollATERAl
VAlUE oF THE CollATERAl
HK$
BARClAyS BANK PlC Moody’s2 Aaa 2 .42% 1,037,915,784
Aa1 0 .30% 131,678,632
Aa2 0 .99% 424,411,227
A1 0 .16% 69,517,411
CITIgRoUP gloBAl MARKETS lIMITED Moody’s2 Aaa 6 .15% 2,643,154,350
Aa1 0 .34% 146,387,826
Aa2 0 .14% 58,726,798
CREDIT SUISSE SECURITIES (EURoPE) lIMITED Moody’s2 Aaa 0 .00% 2,309
HSBC BANK PlC Moody’s2 Aaa 11 .03% 4,738,377,285
Aa2 0 .25% 108,706,891
A1 0 .33% 140,048,261
J.P. MoRgAN SECURITIES PlC, gUARANTEED By JP MoRgAN CHASE BANK, N.A. Moody’s2 Aaa 2 .58% 1,107,482,228
Aa2 0 .00% 46
UBS Ag loNDoN BRANCH Moody’s2 Aaa 1 .60% 688,653,157
Aa2 0 .36% 152,931,385
26 .65% 11,447,993,590

iShares fTSe A50 China index eTf*(*This is a synthetic eTf) (a Sub-Fund of iShares Asia Trust) Performance Record (unaudited)
Net Asset ValueDEAlINg
NET ASSET VAlUEPER UNIT
HK$
DEAlINgNET ASSET VAlUEoF THE SUB–FUND
HK$
AT END oF FINANCIAl PERIoD DATED
31ST DECEMBER 2013 8 .87 52,270,941,879
31ST DECEMBER 2014 14 .00 88,566,777,395
31ST DECEMBER 2015 12 .24 42,960,355,219
Highest and lowest net asset value per unitHIgHEST NET ASSET
VAlUE PER UNITHK$
lowEST NET ASSETVAlUE PER UNIT
HK$
FINANCIAl PERIoD ENDED
31ST DECEMBER 2006 105 .34 46 .56
31ST DECEMBER 2007 27 .61* 10 .53*
31ST DECEMBER 2008 26 .54 7 .64
31ST DECEMBER 2009 16 .49 8 .39
31ST DECEMBER 2010 14 .69 10 .46
31ST DECEMBER 2011 12 .73 9 .45
31ST DECEMBER 2012 10 .85 8 .79
31ST DECEMBER 2013 11 .55 8 .53
31ST DECEMBER 2014 14 .00 7 .84
31ST DECEMBER 2015 18 .18 9 .99
* Adjustment for the effect of sub-division of units during the year .
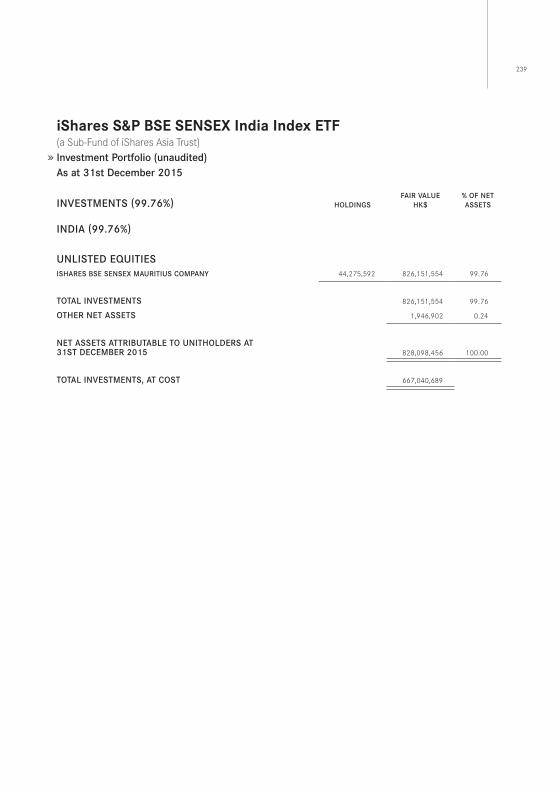
239
iShares S&p BSe SenSeX india index eTf(a Sub-Fund of iShares Asia Trust) Investment Portfolio (unaudited)As at 31st December 2015
INVESTMENTS (99.76%) HolDINgSFAIR VAlUE
HK$% oF NET ASSETS
INDIA (99.76%)
UNlISTED EqUITIESISHARES BSE SENSEX MAURITIUS CoMPANy 44,275,592 826,151,554 99 .76
ToTAl INVESTMENTS 826,151,554 99 .76
oTHER NET ASSETS 1,946,902 0 .24
NET ASSETS ATTRIBUTABlE To UNITHolDERS AT31ST DECEMBER 2015 828,098,456 100 .00
ToTAl INVESTMENTS, AT CoST 667,040,689
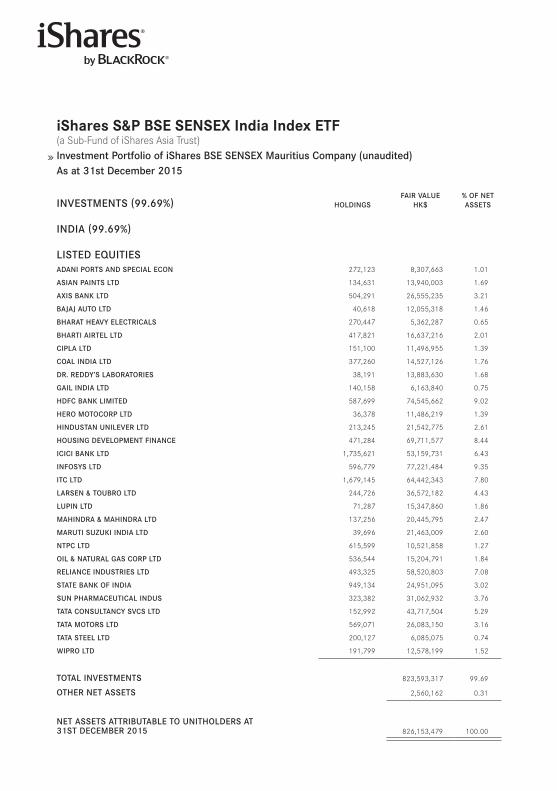
iShares S&p BSe SenSeX india index eTf(a Sub-Fund of iShares Asia Trust) Investment Portfolio of iShares BSE SENSEX Mauritius Company (unaudited)As at 31st December 2015
INVESTMENTS (99.69%) HolDINgSFAIR VAlUE
HK$% oF NET ASSETS
INDIA (99.69%)
lISTED EqUITIESADANI PoRTS AND SPECIAl ECoN 272,123 8,307,663 1 .01
ASIAN PAINTS lTD 134,631 13,940,003 1 .69
AXIS BANK lTD 504,291 26,555,235 3 .21
BAJAJ AUTo lTD 40,618 12,055,318 1 .46
BHARAT HEAVy ElECTRICAlS 270,447 5,362,287 0 .65
BHARTI AIRTEl lTD 417,821 16,637,216 2 .01
CIPlA lTD 151,100 11,496,955 1 .39
CoAl INDIA lTD 377,260 14,527,126 1 .76
DR. REDDy’S lABoRAToRIES 38,191 13,883,630 1 .68
gAIl INDIA lTD 140,158 6,163,840 0 .75
HDFC BANK lIMITED 587,699 74,545,662 9 .02
HERo MoToCoRP lTD 36,378 11,486,219 1 .39
HINDUSTAN UNIlEVER lTD 213,245 21,542,775 2 .61
HoUSINg DEVEloPMENT FINANCE 471,284 69,711,577 8 .44
ICICI BANK lTD 1,735,621 53,159,731 6 .43
INFoSyS lTD 596,779 77,221,484 9 .35
ITC lTD 1,679,145 64,442,343 7 .80
lARSEN ﹠ ToUBRo lTD 244,726 36,572,182 4 .43
lUPIN lTD 71,287 15,347,860 1 .86
MAHINDRA ﹠ MAHINDRA lTD 137,256 20,445,795 2 .47
MARUTI SUzUKI INDIA lTD 39,696 21,463,009 2 .60
NTPC lTD 615,599 10,521,858 1 .27
oIl ﹠ NATURAl gAS CoRP lTD 536,544 15,204,791 1 .84
RElIANCE INDUSTRIES lTD 493,325 58,520,803 7 .08
STATE BANK oF INDIA 949,134 24,951,095 3 .02
SUN PHARMACEUTICAl INDUS 323,382 31,062,932 3 .76
TATA CoNSUlTANCy SVCS lTD 152,992 43,717,504 5 .29
TATA MoToRS lTD 569,071 26,083,150 3 .16
TATA STEEl lTD 200,127 6,085,075 0 .74
wIPRo lTD 191,799 12,578,199 1 .52
ToTAl INVESTMENTS 823,593,317 99 .69
oTHER NET ASSETS 2,560,162 0 .31
NET ASSETS ATTRIBUTABlE To UNITHolDERS AT31ST DECEMBER 2015 826,153,479 100 .00
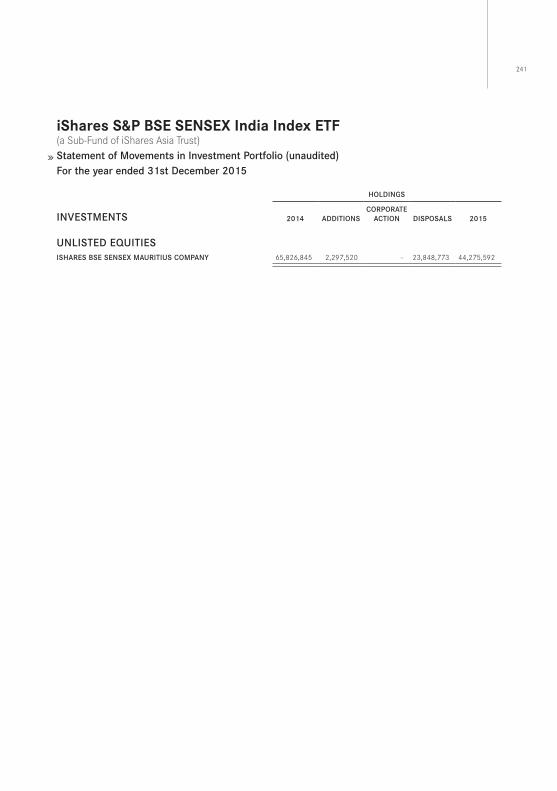
241
iShares S&p BSe SenSeX india index eTf(a Sub-Fund of iShares Asia Trust) Statement of Movements in Investment Portfolio (unaudited)For the year ended 31st December 2015
HolDINgS
INVESTMENTS 2014 ADDITIoNSCoRPoRATE
ACTIoN DISPoSAlS 2015
UNlISTED EqUITIESISHARES BSE SENSEX MAURITIUS CoMPANy 65,826,845 2,297,520 – 23,848,773 44,275,592
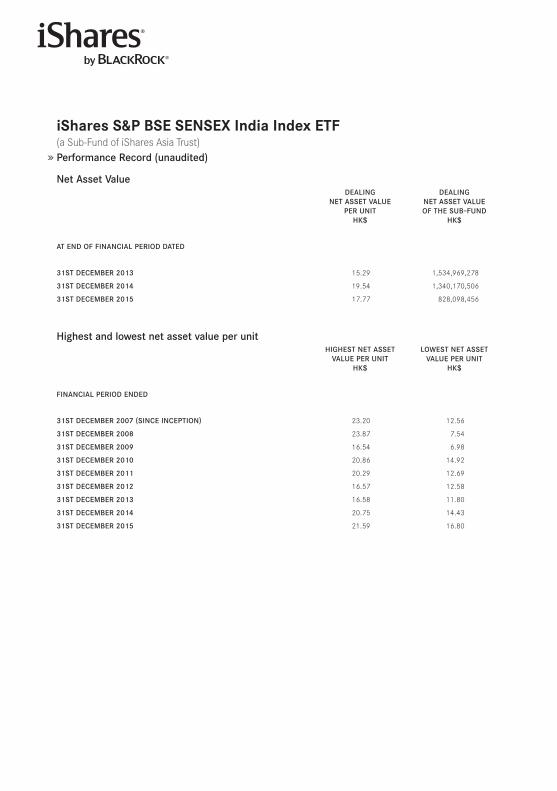
iShares S&p BSe SenSeX india index eTf(a Sub-Fund of iShares Asia Trust) Performance Record (unaudited)
Net Asset ValueDEAlINg
NET ASSET VAlUE PER UNIT
HK$
DEAlINgNET ASSET VAlUE oF THE SUB–FUND
HK$
AT END oF FINANCIAl PERIoD DATED
31ST DECEMBER 2013 15 .29 1,534,969,278
31ST DECEMBER 2014 19 .54 1,340,170,506
31ST DECEMBER 2015 17 .77 828,098,456
Highest and lowest net asset value per unitHIgHEST NET ASSET
VAlUE PER UNITHK$
lowEST NET ASSETVAlUE PER UNIT
HK$
FINANCIAl PERIoD ENDED
31ST DECEMBER 2007 (SINCE INCEPTIoN) 23 .20 12 .56
31ST DECEMBER 2008 23 .87 7 .54
31ST DECEMBER 2009 16 .54 6 .98
31ST DECEMBER 2010 20 .86 14 .92
31ST DECEMBER 2011 20 .29 12 .69
31ST DECEMBER 2012 16 .57 12 .58
31ST DECEMBER 2013 16 .58 11 .80
31ST DECEMBER 2014 20 .75 14 .43
31ST DECEMBER 2015 21 .59 16 .80
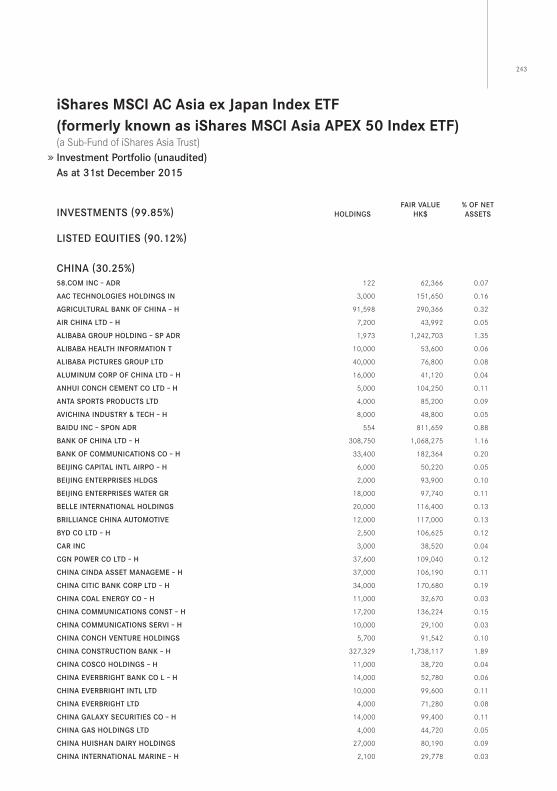
243
iShares MSCi AC Asia ex Japan index eTf(formerly known as iShares MSCi Asia ApeX 50 index eTf)(a Sub-Fund of iShares Asia Trust) Investment Portfolio (unaudited)As at 31st December 2015
INVESTMENTS (99.85%) HolDINgSFAIR VAlUE
HK$% oF NET ASSETS
lISTED EqUITIES (90.12%)
CHINA (30.25%)58.CoM INC – ADR 122 62,366 0 .07
AAC TECHNologIES HolDINgS IN 3,000 151,650 0 .16
AgRICUlTURAl BANK oF CHINA – H 91,598 290,366 0 .32
AIR CHINA lTD – H 7,200 43,992 0 .05
AlIBABA gRoUP HolDINg – SP ADR 1,973 1,242,703 1 .35
AlIBABA HEAlTH INFoRMATIoN T 10,000 53,600 0 .06
AlIBABA PICTURES gRoUP lTD 40,000 76,800 0 .08
AlUMINUM CoRP oF CHINA lTD – H 16,000 41,120 0 .04
ANHUI CoNCH CEMENT Co lTD – H 5,000 104,250 0 .11
ANTA SPoRTS PRoDUCTS lTD 4,000 85,200 0 .09
AVICHINA INDUSTRy ﹠ TECH – H 8,000 48,800 0 .05
BAIDU INC – SPoN ADR 554 811,659 0 .88
BANK oF CHINA lTD – H 308,750 1,068,275 1 .16
BANK oF CoMMUNICATIoNS Co – H 33,400 182,364 0 .20
BEIJINg CAPITAl INTl AIRPo – H 6,000 50,220 0 .05
BEIJINg ENTERPRISES HlDgS 2,000 93,900 0 .10
BEIJINg ENTERPRISES wATER gR 18,000 97,740 0 .11
BEllE INTERNATIoNAl HolDINgS 20,000 116,400 0 .13
BRIllIANCE CHINA AUToMoTIVE 12,000 117,000 0 .13
ByD Co lTD – H 2,500 106,625 0 .12
CAR INC 3,000 38,520 0 .04
CgN PowER Co lTD – H 37,600 109,040 0 .12
CHINA CINDA ASSET MANAgEME – H 37,000 106,190 0 .11
CHINA CITIC BANK CoRP lTD – H 34,000 170,680 0 .19
CHINA CoAl ENERgy Co – H 11,000 32,670 0 .03
CHINA CoMMUNICATIoNS CoNST – H 17,200 136,224 0 .15
CHINA CoMMUNICATIoNS SERVI – H 10,000 29,100 0 .03
CHINA CoNCH VENTURE HolDINgS 5,700 91,542 0 .10
CHINA CoNSTRUCTIoN BANK – H 327,329 1,738,117 1 .89
CHINA CoSCo HolDINgS – H 11,000 38,720 0 .04
CHINA EVERBRIgHT BANK Co l – H 14,000 52,780 0 .06
CHINA EVERBRIgHT INTl lTD 10,000 99,600 0 .11
CHINA EVERBRIgHT lTD 4,000 71,280 0 .08
CHINA gAlAXy SECURITIES Co – H 14,000 99,400 0 .11
CHINA gAS HolDINgS lTD 4,000 44,720 0 .05
CHINA HUISHAN DAIRy HolDINgS 27,000 80,190 0 .09
CHINA INTERNATIoNAl MARINE – H 2,100 29,778 0 .03
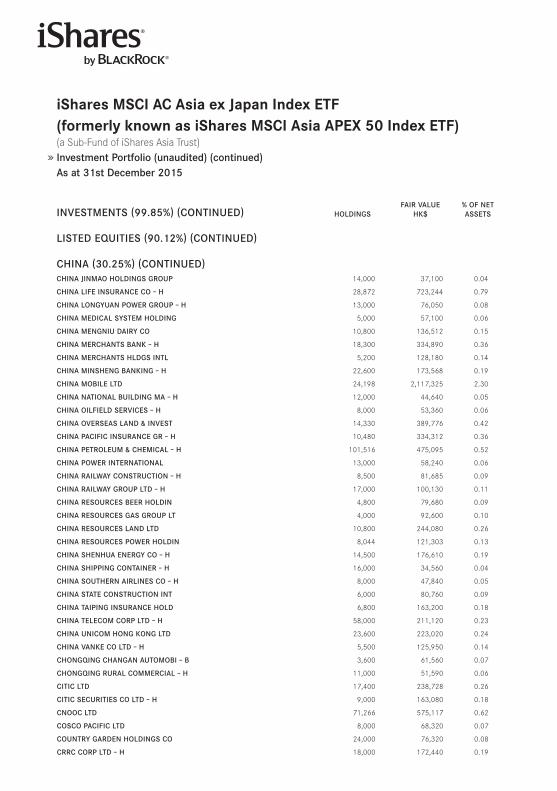
iShares MSCi AC Asia ex Japan index eTf(formerly known as iShares MSCi Asia ApeX 50 index eTf)(a Sub-Fund of iShares Asia Trust) Investment Portfolio (unaudited) (continued)As at 31st December 2015
INVESTMENTS (99.85%) (CoNTINUED) HolDINgSFAIR VAlUE
HK$% oF NET ASSETS
lISTED EqUITIES (90.12%) (CoNTINUED)
CHINA (30.25%) (CoNTINUED)CHINA JINMAo HolDINgS gRoUP 14,000 37,100 0 .04
CHINA lIFE INSURANCE Co – H 28,872 723,244 0 .79
CHINA loNgyUAN PowER gRoUP – H 13,000 76,050 0 .08
CHINA MEDICAl SySTEM HolDINg 5,000 57,100 0 .06
CHINA MENgNIU DAIRy Co 10,800 136,512 0 .15
CHINA MERCHANTS BANK – H 18,300 334,890 0 .36
CHINA MERCHANTS HlDgS INTl 5,200 128,180 0 .14
CHINA MINSHENg BANKINg – H 22,600 173,568 0 .19
CHINA MoBIlE lTD 24,198 2,117,325 2 .30
CHINA NATIoNAl BUIlDINg MA – H 12,000 44,640 0 .05
CHINA oIlFIElD SERVICES – H 8,000 53,360 0 .06
CHINA oVERSEAS lAND ﹠ INVEST 14,330 389,776 0 .42
CHINA PACIFIC INSURANCE gR – H 10,480 334,312 0 .36
CHINA PETRolEUM ﹠ CHEMICAl – H 101,516 475,095 0 .52
CHINA PowER INTERNATIoNAl 13,000 58,240 0 .06
CHINA RAIlwAy CoNSTRUCTIoN – H 8,500 81,685 0 .09
CHINA RAIlwAy gRoUP lTD – H 17,000 100,130 0 .11
CHINA RESoURCES BEER HolDIN 4,800 79,680 0 .09
CHINA RESoURCES gAS gRoUP lT 4,000 92,600 0 .10
CHINA RESoURCES lAND lTD 10,800 244,080 0 .26
CHINA RESoURCES PowER HolDIN 8,044 121,303 0 .13
CHINA SHENHUA ENERgy Co – H 14,500 176,610 0 .19
CHINA SHIPPINg CoNTAINER – H 16,000 34,560 0 .04
CHINA SoUTHERN AIRlINES Co – H 8,000 47,840 0 .05
CHINA STATE CoNSTRUCTIoN INT 6,000 80,760 0 .09
CHINA TAIPINg INSURANCE HolD 6,800 163,200 0 .18
CHINA TElECoM CoRP lTD – H 58,000 211,120 0 .23
CHINA UNICoM HoNg KoNg lTD 23,600 223,020 0 .24
CHINA VANKE Co lTD – H 5,500 125,950 0 .14
CHoNgqINg CHANgAN AUToMoBI – B 3,600 61,560 0 .07
CHoNgqINg RURAl CoMMERCIAl – H 11,000 51,590 0 .06
CITIC lTD 17,400 238,728 0 .26
CITIC SECURITIES Co lTD – H 9,000 163,080 0 .18
CNooC lTD 71,266 575,117 0 .62
CoSCo PACIFIC lTD 8,000 68,320 0 .07
CoUNTRy gARDEN HolDINgS Co 24,000 76,320 0 .08
CRRC CoRP lTD – H 18,000 172,440 0 .19
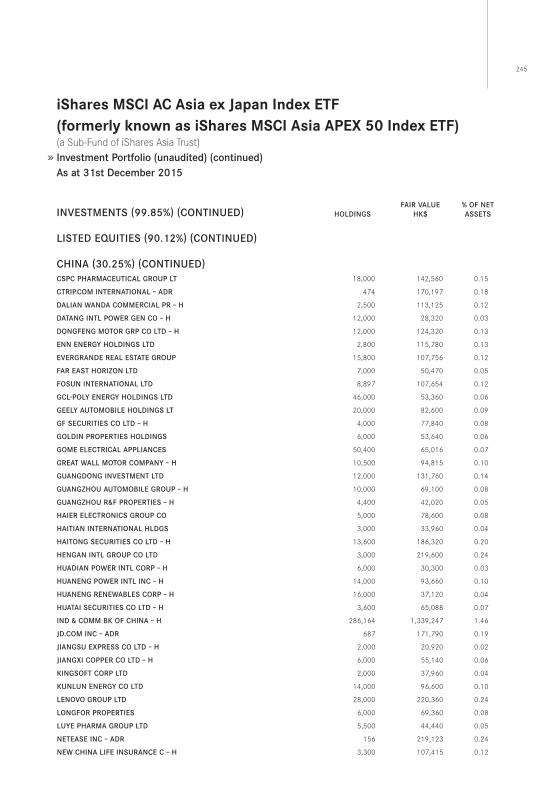
245
iShares MSCi AC Asia ex Japan index eTf(formerly known as iShares MSCi Asia ApeX 50 index eTf)(a Sub-Fund of iShares Asia Trust) Investment Portfolio (unaudited) (continued)As at 31st December 2015
INVESTMENTS (99.85%) (CoNTINUED) HolDINgSFAIR VAlUE
HK$% oF NET ASSETS
lISTED EqUITIES (90.12%) (CoNTINUED)
CHINA (30.25%) (CoNTINUED)CSPC PHARMACEUTICAl gRoUP lT 18,000 142,560 0 .15
CTRIP.CoM INTERNATIoNAl – ADR 474 170,197 0 .18
DAlIAN wANDA CoMMERCIAl PR – H 2,500 113,125 0 .12
DATANg INTl PowER gEN Co – H 12,000 28,320 0 .03
DoNgFENg MoToR gRP Co lTD – H 12,000 124,320 0 .13
ENN ENERgy HolDINgS lTD 2,800 115,780 0 .13
EVERgRANDE REAl ESTATE gRoUP 15,800 107,756 0 .12
FAR EAST HoRIzoN lTD 7,000 50,470 0 .05
FoSUN INTERNATIoNAl lTD 8,897 107,654 0 .12
gCl-Poly ENERgy HolDINgS lTD 46,000 53,360 0 .06
gEEly AUToMoBIlE HolDINgS lT 20,000 82,600 0 .09
gF SECURITIES Co lTD – H 4,000 77,840 0 .08
golDIN PRoPERTIES HolDINgS 6,000 53,640 0 .06
goME ElECTRICAl APPlIANCES 50,400 65,016 0 .07
gREAT wAll MoToR CoMPANy – H 10,500 94,815 0 .10
gUANgDoNg INVESTMENT lTD 12,000 131,760 0 .14
gUANgzHoU AUToMoBIlE gRoUP – H 10,000 69,100 0 .08
gUANgzHoU R﹠F PRoPERTIES – H 4,400 42,020 0 .05
HAIER ElECTRoNICS gRoUP Co 5,000 78,600 0 .08
HAITIAN INTERNATIoNAl HlDgS 3,000 33,960 0 .04
HAIToNg SECURITIES Co lTD – H 13,600 186,320 0 .20
HENgAN INTl gRoUP Co lTD 3,000 219,600 0 .24
HUADIAN PowER INTl CoRP – H 6,000 30,300 0 .03
HUANENg PowER INTl INC – H 14,000 93,660 0 .10
HUANENg RENEwABlES CoRP – H 16,000 37,120 0 .04
HUATAI SECURITIES Co lTD – H 3,600 65,088 0 .07
IND ﹠ CoMM BK oF CHINA – H 286,164 1,339,247 1 .46
JD.CoM INC – ADR 687 171,790 0 .19
JIANgSU EXPRESS Co lTD – H 2,000 20,920 0 .02
JIANgXI CoPPER Co lTD – H 6,000 55,140 0 .06
KINgSoFT CoRP lTD 2,000 37,960 0 .04
KUNlUN ENERgy Co lTD 14,000 96,600 0 .10
lENoVo gRoUP lTD 28,000 220,360 0 .24
loNgFoR PRoPERTIES 6,000 69,360 0 .08
lUyE PHARMA gRoUP lTD 5,500 44,440 0 .05
NETEASE INC – ADR 156 219,123 0 .24
NEw CHINA lIFE INSURANCE C – H 3,300 107,415 0 .12
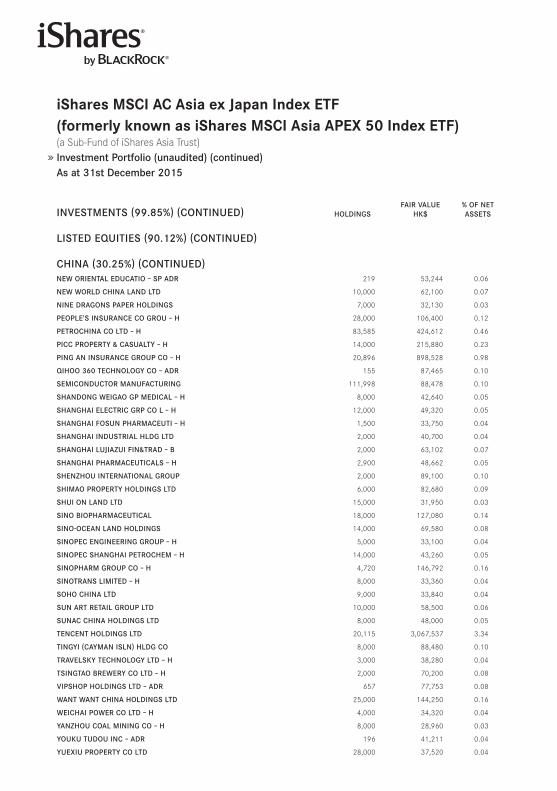
iShares MSCi AC Asia ex Japan index eTf(formerly known as iShares MSCi Asia ApeX 50 index eTf)(a Sub-Fund of iShares Asia Trust) Investment Portfolio (unaudited) (continued)As at 31st December 2015
INVESTMENTS (99.85%) (CoNTINUED) HolDINgSFAIR VAlUE
HK$% oF NET ASSETS
lISTED EqUITIES (90.12%) (CoNTINUED)
CHINA (30.25%) (CoNTINUED)NEw oRIENTAl EDUCATIo – SP ADR 219 53,244 0 .06
NEw woRlD CHINA lAND lTD 10,000 62,100 0 .07
NINE DRAgoNS PAPER HolDINgS 7,000 32,130 0 .03
PEoPlE’S INSURANCE Co gRoU – H 28,000 106,400 0 .12
PETRoCHINA Co lTD – H 83,585 424,612 0 .46
PICC PRoPERTy ﹠ CASUAlTy – H 14,000 215,880 0 .23
PINg AN INSURANCE gRoUP Co – H 20,896 898,528 0 .98
qIHoo 360 TECHNology Co – ADR 155 87,465 0 .10
SEMICoNDUCToR MANUFACTURINg 111,998 88,478 0 .10
SHANDoNg wEIgAo gP MEDICAl – H 8,000 42,640 0 .05
SHANgHAI ElECTRIC gRP Co l – H 12,000 49,320 0 .05
SHANgHAI FoSUN PHARMACEUTI – H 1,500 33,750 0 .04
SHANgHAI INDUSTRIAl HlDg lTD 2,000 40,700 0 .04
SHANgHAI lUJIAzUI FIN﹠TRAD – B 2,000 63,102 0 .07
SHANgHAI PHARMACEUTICAlS – H 2,900 48,662 0 .05
SHENzHoU INTERNATIoNAl gRoUP 2,000 89,100 0 .10
SHIMAo PRoPERTy HolDINgS lTD 6,000 82,680 0 .09
SHUI oN lAND lTD 15,000 31,950 0 .03
SINo BIoPHARMACEUTICAl 18,000 127,080 0 .14
SINo-oCEAN lAND HolDINgS 14,000 69,580 0 .08
SINoPEC ENgINEERINg gRoUP – H 5,000 33,100 0 .04
SINoPEC SHANgHAI PETRoCHEM – H 14,000 43,260 0 .05
SINoPHARM gRoUP Co – H 4,720 146,792 0 .16
SINoTRANS lIMITED – H 8,000 33,360 0 .04
SoHo CHINA lTD 9,000 33,840 0 .04
SUN ART RETAIl gRoUP lTD 10,000 58,500 0 .06
SUNAC CHINA HolDINgS lTD 8,000 48,000 0 .05
TENCENT HolDINgS lTD 20,115 3,067,537 3 .34
TINgyI (CAyMAN ISlN) HlDg Co 8,000 88,480 0 .10
TRAVElSKy TECHNology lTD – H 3,000 38,280 0 .04
TSINgTAo BREwERy Co lTD – H 2,000 70,200 0 .08
VIPSHoP HolDINgS lTD – ADR 657 77,753 0 .08
wANT wANT CHINA HolDINgS lTD 25,000 144,250 0 .16
wEICHAI PowER Co lTD – H 4,000 34,320 0 .04
yANzHoU CoAl MININg Co – H 8,000 28,960 0 .03
yoUKU TUDoU INC – ADR 196 41,211 0 .04
yUEXIU PRoPERTy Co lTD 28,000 37,520 0 .04

247
iShares MSCi AC Asia ex Japan index eTf(formerly known as iShares MSCi Asia ApeX 50 index eTf)(a Sub-Fund of iShares Asia Trust) Investment Portfolio (unaudited) (continued)As at 31st December 2015
INVESTMENTS (99.85%) (CoNTINUED) HolDINgSFAIR VAlUE
HK$% oF NET ASSETS
lISTED EqUITIES (90.12%) (CoNTINUED)
CHINA (30.25%) (CoNTINUED)zHEJIANg EXPRESSwAy Co – H 6,000 55,920 0 .06
zHUzHoU CSR TIMES ElECTRIC – H 2,000 90,100 0 .10
zIJIN MININg gRoUP Co lTD – H 24,000 48,720 0 .05
zTE CoRP – H 3,200 56,576 0 .06
27,824,082 30 .25

iShares MSCi AC Asia ex Japan index eTf(formerly known as iShares MSCi Asia ApeX 50 index eTf)(a Sub-Fund of iShares Asia Trust) Investment Portfolio (unaudited) (continued)As at 31st December 2015
INVESTMENTS (99.85%) (CoNTINUED) HolDINgSFAIR VAlUE
HK$% oF NET ASSETS
lISTED EqUITIES (90.12%) (CoNTINUED)
HoNg KoNg (12.64%)AIA gRoUP lTD 46,821 2,181,859 2 .37
ASM PACIFIC TECHNology 1,000 60,900 0 .07
BANK oF EAST ASIA 5,000 144,250 0 .16
BoC HoNg KoNg HolDINgS lTD 14,734 349,196 0 .38
CATHAy PACIFIC AIRwAyS 5,000 67,100 0 .07
CHEUNg KoNg INFRASTRUCTURE 2,400 172,320 0 .19
CHEUNg KoNg PRoPERTy HolDINg 10,416 524,966 0 .57
CK HUTCHISoN HolDINgS lTD (FoRMERly KNowN AS CHEUNg KoNg HolDINgS lTD) 10,316 1,079,054 1 .17
ClP HolDINgS lTD 7,587 499,604 0 .54
FIRST PACIFIC Co 10,000 51,400 0 .06
gAlAXy ENTERTAINMENT gRoUP l 9,400 229,830 0 .25
HANg lUNg PRoPERTIES lTD 9,000 158,760 0 .17
HANg SENg BANK lTD 3,037 447,957 0 .49
HENDERSoN lAND DEVEloPMENT 4,400 209,000 0 .23
HK ElECTRIC INVESTMENTS – SS 8,700 56,550 0 .06
HKT TRUST AND HKT lTD – SS 11,000 108,900 0 .12
HoNg KoNg ﹠ CHINA gAS 27,568 419,034 0 .46
HoNg KoNg EXCHANgES ﹠ ClEAR 4,391 871,613 0 .95
HoNgKoNg lAND HolDINgS lTD 2,400 130,202 0 .14
HySAN DEVEloPMENT Co 2,400 76,200 0 .08
KERRy PRoPERTIES lTD 2,500 52,875 0 .06
lI ﹠ FUNg lTD 24,000 126,480 0 .14
lINK REIT 8,900 412,960 0 .45
MElCo CRowN ENTERTAINME – ADR 314 40,884 0 .04
MgM CHINA HolDINgS lTD 4,000 38,800 0 .04
MTR CoRP 6,000 230,400 0 .25
NEw woRlD DEVEloPMENT 19,493 149,316 0 .16
NwS HolDINgS lTD 6,321 73,324 0 .08
PCCw lTD 17,000 77,350 0 .08
PowER ASSETS HolDINgS lTD 5,460 389,298 0 .42
SANDS CHINA lTD 9,430 250,366 0 .27
SHANgRI-lA ASIA lTD 6,000 45,420 0 .05
SINo lAND Co 12,000 136,320 0 .15
SJM HolDINgS lTD 8,000 44,240 0 .05
SUN HUNg KAI PRoPERTIES 7,088 663,437 0 .72
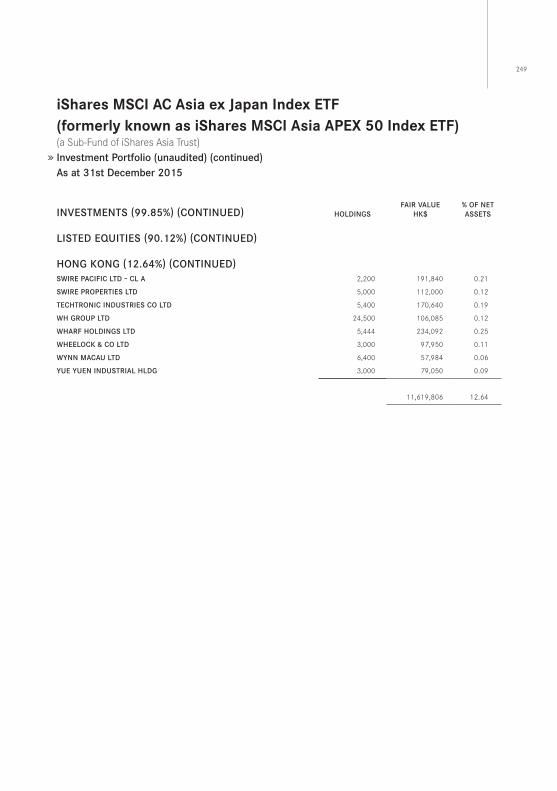
249
iShares MSCi AC Asia ex Japan index eTf(formerly known as iShares MSCi Asia ApeX 50 index eTf)(a Sub-Fund of iShares Asia Trust) Investment Portfolio (unaudited) (continued)As at 31st December 2015
INVESTMENTS (99.85%) (CoNTINUED) HolDINgSFAIR VAlUE
HK$% oF NET ASSETS
lISTED EqUITIES (90.12%) (CoNTINUED)
HoNg KoNg (12.64%) (CoNTINUED)SwIRE PACIFIC lTD – Cl A 2,200 191,840 0 .21
SwIRE PRoPERTIES lTD 5,000 112,000 0 .12
TECHTRoNIC INDUSTRIES Co lTD 5,400 170,640 0 .19
wH gRoUP lTD 24,500 106,085 0 .12
wHARF HolDINgS lTD 5,444 234,092 0 .25
wHEEloCK ﹠ Co lTD 3,000 97,950 0 .11
wyNN MACAU lTD 6,400 57,984 0 .06
yUE yUEN INDUSTRIAl HlDg 3,000 79,050 0 .09
11,619,806 12 .64
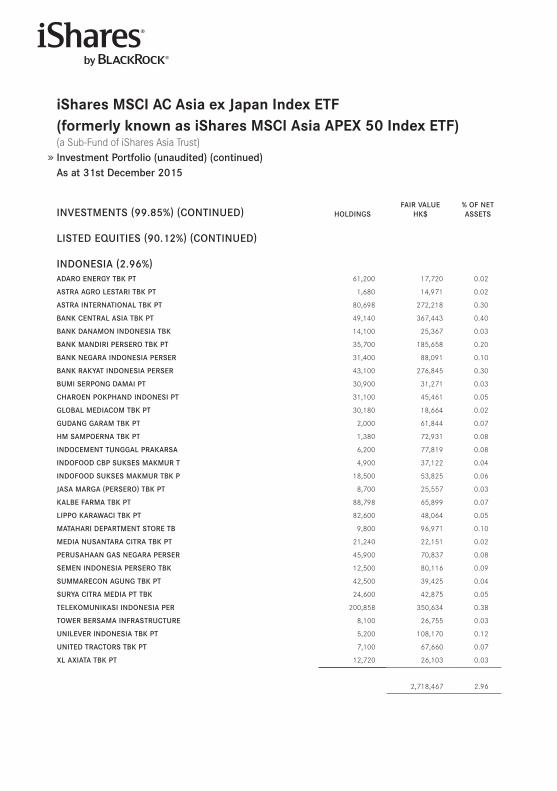
iShares MSCi AC Asia ex Japan index eTf(formerly known as iShares MSCi Asia ApeX 50 index eTf)(a Sub-Fund of iShares Asia Trust) Investment Portfolio (unaudited) (continued)As at 31st December 2015
INVESTMENTS (99.85%) (CoNTINUED) HolDINgSFAIR VAlUE
HK$% oF NET ASSETS
lISTED EqUITIES (90.12%) (CoNTINUED)
INDoNESIA (2.96%)ADARo ENERgy TBK PT 61,200 17,720 0 .02
ASTRA AgRo lESTARI TBK PT 1,680 14,971 0 .02
ASTRA INTERNATIoNAl TBK PT 80,698 272,218 0 .30
BANK CENTRAl ASIA TBK PT 49,140 367,443 0 .40
BANK DANAMoN INDoNESIA TBK 14,100 25,367 0 .03
BANK MANDIRI PERSERo TBK PT 35,700 185,658 0 .20
BANK NEgARA INDoNESIA PERSER 31,400 88,091 0 .10
BANK RAKyAT INDoNESIA PERSER 43,100 276,845 0 .30
BUMI SERPoNg DAMAI PT 30,900 31,271 0 .03
CHARoEN PoKPHAND INDoNESI PT 31,100 45,461 0 .05
gloBAl MEDIACoM TBK PT 30,180 18,664 0 .02
gUDANg gARAM TBK PT 2,000 61,844 0 .07
HM SAMPoERNA TBK PT 1,380 72,931 0 .08
INDoCEMENT TUNggAl PRAKARSA 6,200 77,819 0 .08
INDoFooD CBP SUKSES MAKMUR T 4,900 37,122 0 .04
INDoFooD SUKSES MAKMUR TBK P 18,500 53,825 0 .06
JASA MARgA (PERSERo) TBK PT 8,700 25,557 0 .03
KAlBE FARMA TBK PT 88,798 65,899 0 .07
lIPPo KARAwACI TBK PT 82,600 48,064 0 .05
MATAHARI DEPARTMENT SToRE TB 9,800 96,971 0 .10
MEDIA NUSANTARA CITRA TBK PT 21,240 22,151 0 .02
PERUSAHAAN gAS NEgARA PERSER 45,900 70,837 0 .08
SEMEN INDoNESIA PERSERo TBK 12,500 80,116 0 .09
SUMMARECoN AgUNg TBK PT 42,500 39,425 0 .04
SURyA CITRA MEDIA PT TBK 24,600 42,875 0 .05
TElEKoMUNIKASI INDoNESIA PER 200,858 350,634 0 .38
TowER BERSAMA INFRASTRUCTURE 8,100 26,755 0 .03
UNIlEVER INDoNESIA TBK PT 5,200 108,170 0 .12
UNITED TRACToRS TBK PT 7,100 67,660 0 .07
Xl AXIATA TBK PT 12,720 26,103 0 .03
2,718,467 2 .96
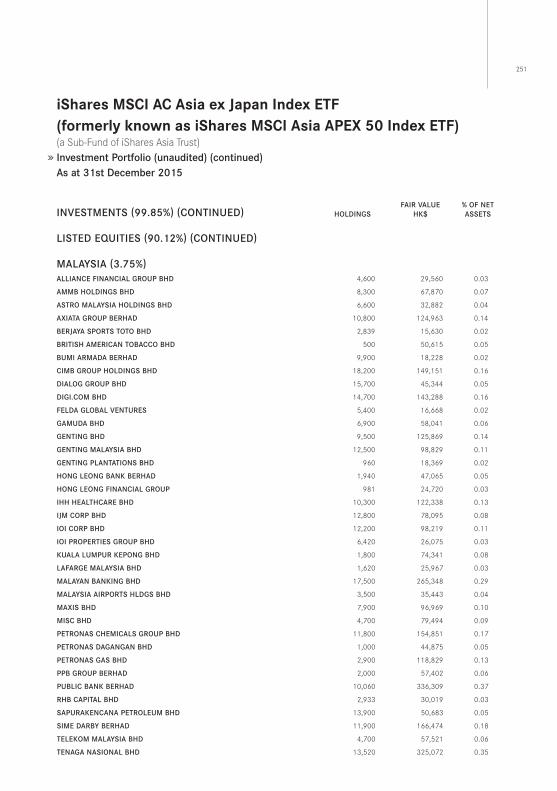
251
iShares MSCi AC Asia ex Japan index eTf(formerly known as iShares MSCi Asia ApeX 50 index eTf)(a Sub-Fund of iShares Asia Trust) Investment Portfolio (unaudited) (continued)As at 31st December 2015
INVESTMENTS (99.85%) (CoNTINUED) HolDINgSFAIR VAlUE
HK$% oF NET ASSETS
lISTED EqUITIES (90.12%) (CoNTINUED)
MAlAySIA (3.75%)AllIANCE FINANCIAl gRoUP BHD 4,600 29,560 0 .03
AMMB HolDINgS BHD 8,300 67,870 0 .07
ASTRo MAlAySIA HolDINgS BHD 6,600 32,882 0 .04
AXIATA gRoUP BERHAD 10,800 124,963 0 .14
BERJAyA SPoRTS ToTo BHD 2,839 15,630 0 .02
BRITISH AMERICAN ToBACCo BHD 500 50,615 0 .05
BUMI ARMADA BERHAD 9,900 18,228 0 .02
CIMB gRoUP HolDINgS BHD 18,200 149,151 0 .16
DIAlog gRoUP BHD 15,700 45,344 0 .05
DIgI.CoM BHD 14,700 143,288 0 .16
FElDA gloBAl VENTURES 5,400 16,668 0 .02
gAMUDA BHD 6,900 58,041 0 .06
gENTINg BHD 9,500 125,869 0 .14
gENTINg MAlAySIA BHD 12,500 98,829 0 .11
gENTINg PlANTATIoNS BHD 960 18,369 0 .02
HoNg lEoNg BANK BERHAD 1,940 47,065 0 .05
HoNg lEoNg FINANCIAl gRoUP 981 24,720 0 .03
IHH HEAlTHCARE BHD 10,300 122,338 0 .13
IJM CoRP BHD 12,800 78,095 0 .08
IoI CoRP BHD 12,200 98,219 0 .11
IoI PRoPERTIES gRoUP BHD 6,420 26,075 0 .03
KUAlA lUMPUR KEPoNg BHD 1,800 74,341 0 .08
lAFARgE MAlAySIA BHD 1,620 25,967 0 .03
MAlAyAN BANKINg BHD 17,500 265,348 0 .29
MAlAySIA AIRPoRTS HlDgS BHD 3,500 35,443 0 .04
MAXIS BHD 7,900 96,969 0 .10
MISC BHD 4,700 79,494 0 .09
PETRoNAS CHEMICAlS gRoUP BHD 11,800 154,851 0 .17
PETRoNAS DAgANgAN BHD 1,000 44,875 0 .05
PETRoNAS gAS BHD 2,900 118,829 0 .13
PPB gRoUP BERHAD 2,000 57,402 0 .06
PUBlIC BANK BERHAD 10,060 336,309 0 .37
RHB CAPITAl BHD 2,933 30,019 0 .03
SAPURAKENCANA PETRolEUM BHD 13,900 50,683 0 .05
SIME DARBy BERHAD 11,900 166,474 0 .18
TElEKoM MAlAySIA BHD 4,700 57,521 0 .06
TENAgA NASIoNAl BHD 13,520 325,072 0 .35
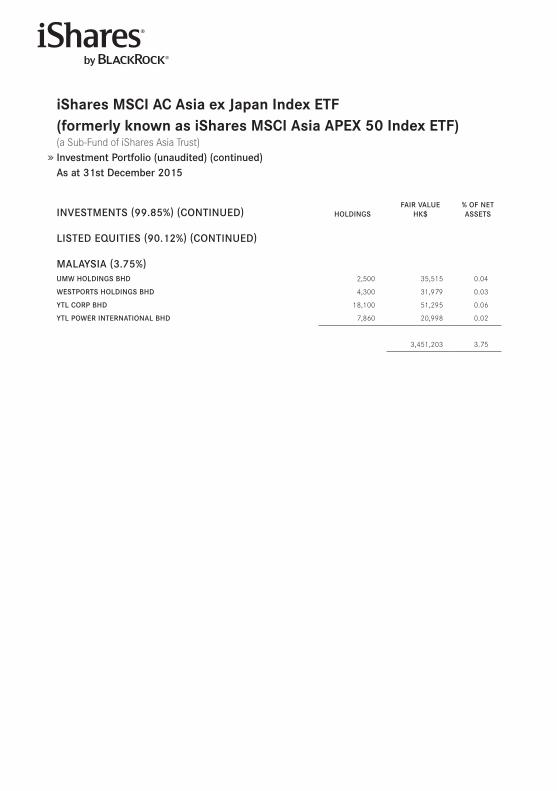
iShares MSCi AC Asia ex Japan index eTf(formerly known as iShares MSCi Asia ApeX 50 index eTf)(a Sub-Fund of iShares Asia Trust) Investment Portfolio (unaudited) (continued)As at 31st December 2015
INVESTMENTS (99.85%) (CoNTINUED) HolDINgSFAIR VAlUE
HK$% oF NET ASSETS
lISTED EqUITIES (90.12%) (CoNTINUED)
MAlAySIA (3.75%)UMw HolDINgS BHD 2,500 35,515 0 .04
wESTPoRTS HolDINgS BHD 4,300 31,979 0 .03
yTl CoRP BHD 18,100 51,295 0 .06
yTl PowER INTERNATIoNAl BHD 7,860 20,998 0 .02
3,451,203 3 .75
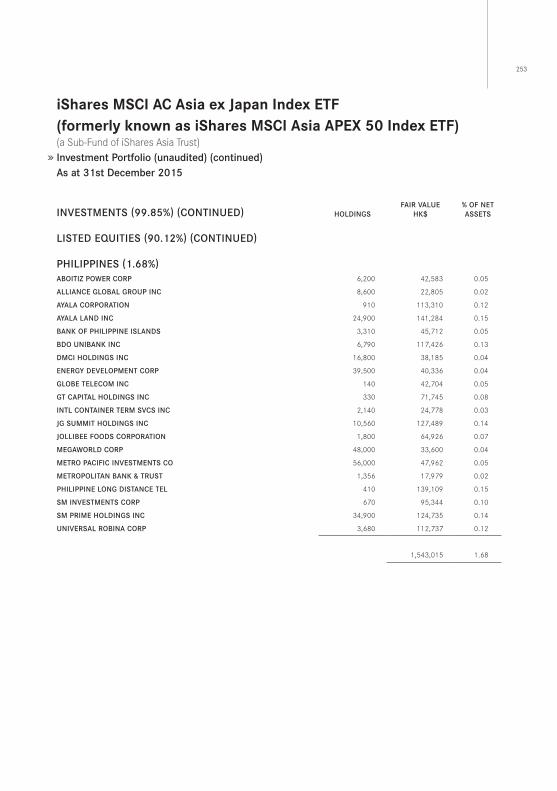
253
iShares MSCi AC Asia ex Japan index eTf(formerly known as iShares MSCi Asia ApeX 50 index eTf)(a Sub-Fund of iShares Asia Trust) Investment Portfolio (unaudited) (continued)As at 31st December 2015
INVESTMENTS (99.85%) (CoNTINUED) HolDINgSFAIR VAlUE
HK$% oF NET ASSETS
lISTED EqUITIES (90.12%) (CoNTINUED)
PHIlIPPINES (1.68%)ABoITIz PowER CoRP 6,200 42,583 0 .05
AllIANCE gloBAl gRoUP INC 8,600 22,805 0 .02
AyAlA CoRPoRATIoN 910 113,310 0 .12
AyAlA lAND INC 24,900 141,284 0 .15
BANK oF PHIlIPPINE ISlANDS 3,310 45,712 0 .05
BDo UNIBANK INC 6,790 117,426 0 .13
DMCI HolDINgS INC 16,800 38,185 0 .04
ENERgy DEVEloPMENT CoRP 39,500 40,336 0 .04
gloBE TElECoM INC 140 42,704 0 .05
gT CAPITAl HolDINgS INC 330 71,745 0 .08
INTl CoNTAINER TERM SVCS INC 2,140 24,778 0 .03
Jg SUMMIT HolDINgS INC 10,560 127,489 0 .14
JollIBEE FooDS CoRPoRATIoN 1,800 64,926 0 .07
MEgAwoRlD CoRP 48,000 33,600 0 .04
METRo PACIFIC INVESTMENTS Co 56,000 47,962 0 .05
METRoPolITAN BANK ﹠ TRUST 1,356 17,979 0 .02
PHIlIPPINE loNg DISTANCE TEl 410 139,109 0 .15
SM INVESTMENTS CoRP 670 95,344 0 .10
SM PRIME HolDINgS INC 34,900 124,735 0 .14
UNIVERSAl RoBINA CoRP 3,680 112,737 0 .12
1,543,015 1 .68
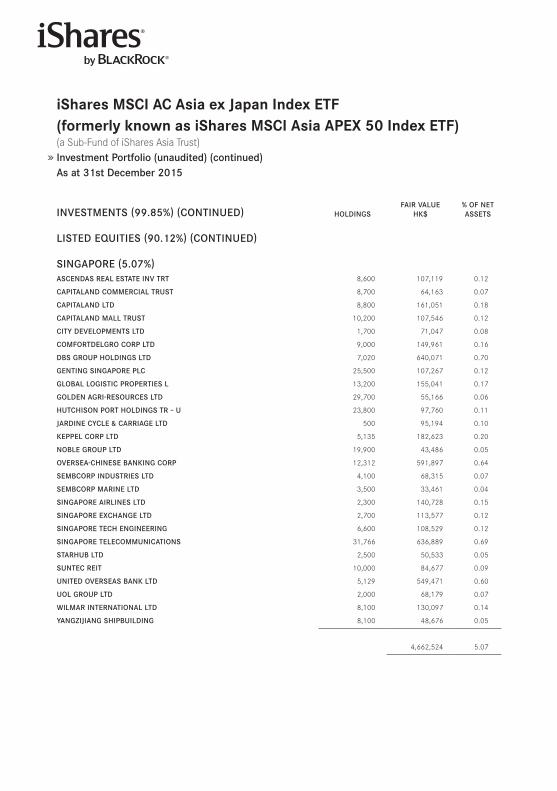
iShares MSCi AC Asia ex Japan index eTf(formerly known as iShares MSCi Asia ApeX 50 index eTf)(a Sub-Fund of iShares Asia Trust) Investment Portfolio (unaudited) (continued)As at 31st December 2015
INVESTMENTS (99.85%) (CoNTINUED) HolDINgSFAIR VAlUE
HK$% oF NET ASSETS
lISTED EqUITIES (90.12%) (CoNTINUED)
SINgAPoRE (5.07%)ASCENDAS REAl ESTATE INV TRT 8,600 107,119 0 .12
CAPITAlAND CoMMERCIAl TRUST 8,700 64,163 0 .07
CAPITAlAND lTD 8,800 161,051 0 .18
CAPITAlAND MAll TRUST 10,200 107,546 0 .12
CITy DEVEloPMENTS lTD 1,700 71,047 0 .08
CoMFoRTDElgRo CoRP lTD 9,000 149,961 0 .16
DBS gRoUP HolDINgS lTD 7,020 640,071 0 .70
gENTINg SINgAPoRE PlC 25,500 107,267 0 .12
gloBAl logISTIC PRoPERTIES l 13,200 155,041 0 .17
golDEN AgRI-RESoURCES lTD 29,700 55,166 0 .06
HUTCHISoN PoRT HolDINgS TR – U 23,800 97,760 0 .11
JARDINE CyClE ﹠ CARRIAgE lTD 500 95,194 0 .10
KEPPEl CoRP lTD 5,135 182,623 0 .20
NoBlE gRoUP lTD 19,900 43,486 0 .05
oVERSEA-CHINESE BANKINg CoRP 12,312 591,897 0 .64
SEMBCoRP INDUSTRIES lTD 4,100 68,315 0 .07
SEMBCoRP MARINE lTD 3,500 33,461 0 .04
SINgAPoRE AIRlINES lTD 2,300 140,728 0 .15
SINgAPoRE EXCHANgE lTD 2,700 113,577 0 .12
SINgAPoRE TECH ENgINEERINg 6,600 108,529 0 .12
SINgAPoRE TElECoMMUNICATIoNS 31,766 636,889 0 .69
STARHUB lTD 2,500 50,533 0 .05
SUNTEC REIT 10,000 84,677 0 .09
UNITED oVERSEAS BANK lTD 5,129 549,471 0 .60
Uol gRoUP lTD 2,000 68,179 0 .07
wIlMAR INTERNATIoNAl lTD 8,100 130,097 0 .14
yANgzIJIANg SHIPBUIlDINg 8,100 48,676 0 .05
4,662,524 5 .07
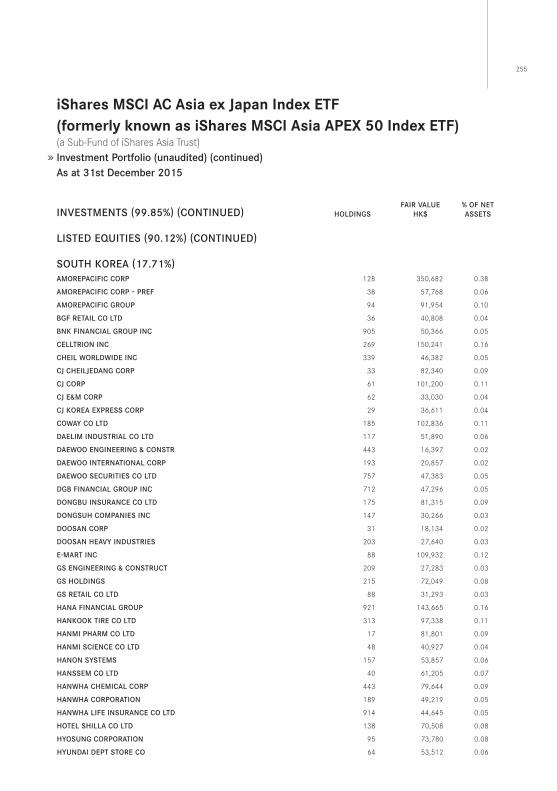
255
iShares MSCi AC Asia ex Japan index eTf(formerly known as iShares MSCi Asia ApeX 50 index eTf)(a Sub-Fund of iShares Asia Trust) Investment Portfolio (unaudited) (continued)As at 31st December 2015
INVESTMENTS (99.85%) (CoNTINUED) HolDINgSFAIR VAlUE
HK$% oF NET ASSETS
lISTED EqUITIES (90.12%) (CoNTINUED)
SoUTH KoREA (17.71%)AMoREPACIFIC CoRP 128 350,682 0 .38
AMoREPACIFIC CoRP – PREF 38 57,768 0 .06
AMoREPACIFIC gRoUP 94 91,954 0 .10
BgF RETAIl Co lTD 36 40,808 0 .04
BNK FINANCIAl gRoUP INC 905 50,366 0 .05
CEllTRIoN INC 269 150,241 0 .16
CHEIl woRlDwIDE INC 339 46,382 0 .05
CJ CHEIlJEDANg CoRP 33 82,340 0 .09
CJ CoRP 61 101,200 0 .11
CJ E﹠M CoRP 62 33,030 0 .04
CJ KoREA EXPRESS CoRP 29 36,611 0 .04
CowAy Co lTD 185 102,836 0 .11
DAElIM INDUSTRIAl Co lTD 117 51,890 0 .06
DAEwoo ENgINEERINg ﹠ CoNSTR 443 16,397 0 .02
DAEwoo INTERNATIoNAl CoRP 193 20,857 0 .02
DAEwoo SECURITIES Co lTD 757 47,383 0 .05
DgB FINANCIAl gRoUP INC 712 47,296 0 .05
DoNgBU INSURANCE Co lTD 175 81,315 0 .09
DoNgSUH CoMPANIES INC 147 30,266 0 .03
DooSAN CoRP 31 18,134 0 .02
DooSAN HEAVy INDUSTRIES 203 27,640 0 .03
E-MART INC 88 109,932 0 .12
gS ENgINEERINg ﹠ CoNSTRUCT 209 27,283 0 .03
gS HolDINgS 215 72,049 0 .08
gS RETAIl Co lTD 88 31,293 0 .03
HANA FINANCIAl gRoUP 921 143,665 0 .16
HANKooK TIRE Co lTD 313 97,338 0 .11
HANMI PHARM Co lTD 17 81,801 0 .09
HANMI SCIENCE Co lTD 48 40,927 0 .04
HANoN SySTEMS 157 53,857 0 .06
HANSSEM Co lTD 40 61,205 0 .07
HANwHA CHEMICAl CoRP 443 79,644 0 .09
HANwHA CoRPoRATIoN 189 49,219 0 .05
HANwHA lIFE INSURANCE Co lTD 914 44,645 0 .05
HoTEl SHIllA Co lTD 138 70,508 0 .08
HyoSUNg CoRPoRATIoN 95 73,780 0 .08
HyUNDAI DEPT SToRE Co 64 53,512 0 .06
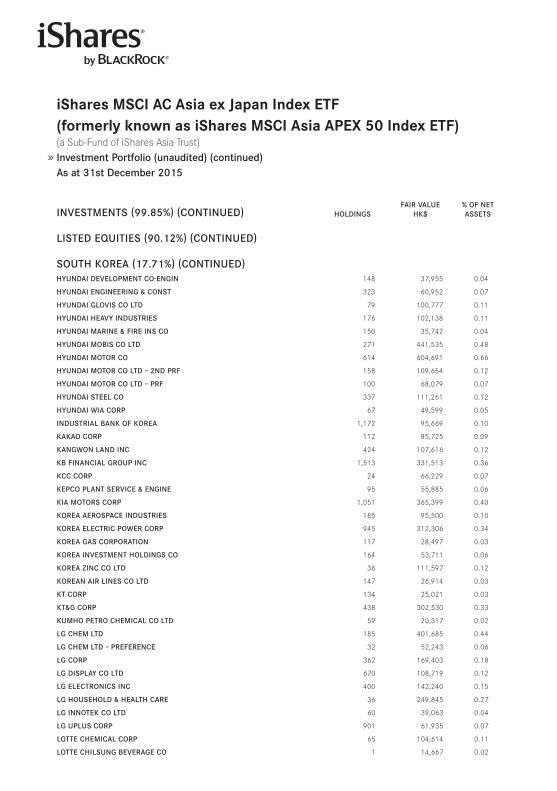
iShares MSCi AC Asia ex Japan index eTf(formerly known as iShares MSCi Asia ApeX 50 index eTf)(a Sub-Fund of iShares Asia Trust) Investment Portfolio (unaudited) (continued)As at 31st December 2015
INVESTMENTS (99.85%) (CoNTINUED) HolDINgSFAIR VAlUE
HK$% oF NET ASSETS
lISTED EqUITIES (90.12%) (CoNTINUED)
SoUTH KoREA (17.71%) (CoNTINUED)HyUNDAI DEVEloPMENT Co-ENgIN 148 37,955 0 .04
HyUNDAI ENgINEERINg ﹠ CoNST 323 60,952 0 .07
HyUNDAI gloVIS Co lTD 79 100,777 0 .11
HyUNDAI HEAVy INDUSTRIES 176 102,138 0 .11
HyUNDAI MARINE ﹠ FIRE INS Co 150 35,742 0 .04
HyUNDAI MoBIS Co lTD 271 441,535 0 .48
HyUNDAI MoToR Co 614 604,691 0 .66
HyUNDAI MoToR Co lTD – 2ND PRF 158 109,654 0 .12
HyUNDAI MoToR Co lTD – PRF 100 68,079 0 .07
HyUNDAI STEEl Co 337 111,261 0 .12
HyUNDAI wIA CoRP 67 49,599 0 .05
INDUSTRIAl BANK oF KoREA 1,172 95,669 0 .10
KAKAo CoRP 112 85,725 0 .09
KANgwoN lAND INC 424 107,616 0 .12
KB FINANCIAl gRoUP INC 1,513 331,513 0 .36
KCC CoRP 24 66,229 0 .07
KEPCo PlANT SERVICE ﹠ ENgINE 95 55,885 0 .06
KIA MoToRS CoRP 1,051 365,399 0 .40
KoREA AERoSPACE INDUSTRIES 185 95,500 0 .10
KoREA ElECTRIC PowER CoRP 945 312,306 0 .34
KoREA gAS CoRPoRATIoN 117 28,497 0 .03
KoREA INVESTMENT HolDINgS Co 164 53,711 0 .06
KoREA zINC Co lTD 36 111,597 0 .12
KoREAN AIR lINES Co lTD 147 26,914 0 .03
KT CoRP 134 25,021 0 .03
KT﹠g CoRP 438 302,530 0 .33
KUMHo PETRo CHEMICAl Co lTD 59 20,317 0 .02
lg CHEM lTD 185 401,685 0 .44
lg CHEM lTD – PREFERENCE 32 52,243 0 .06
lg CoRP 362 169,403 0 .18
lg DISPlAy Co lTD 670 108,719 0 .12
lg ElECTRoNICS INC 400 142,240 0 .15
lg HoUSEHolD ﹠ HEAlTH CARE 36 249,845 0 .27
lg INNoTEK Co lTD 60 39,063 0 .04
lg UPlUS CoRP 901 61,935 0 .07
loTTE CHEMICAl CoRP 65 104,614 0 .11
loTTE CHIlSUNg BEVERAgE Co 1 14,667 0 .02

257
iShares MSCi AC Asia ex Japan index eTf(formerly known as iShares MSCi Asia ApeX 50 index eTf)(a Sub-Fund of iShares Asia Trust) Investment Portfolio (unaudited) (continued)As at 31st December 2015
INVESTMENTS (99.85%) (CoNTINUED) HolDINgSFAIR VAlUE
HK$% oF NET ASSETS
lISTED EqUITIES (90.12%) (CoNTINUED)
SoUTH KoREA (17.71%) (CoNTINUED)loTTE CoNFECTIoNERy Co lTD 3 45,190 0 .05
loTTE SHoPPINg Co 46 70,690 0 .08
MIRAE ASSET SECURITIES Co lT 251 35,835 0 .04
NAVER CoRP 107 465,359 0 .51
NCSoFT CoRP 65 91,511 0 .10
NH INVESTMENT ﹠ SECURITIES C 593 39,587 0 .04
oCI Co lTD 70 34,701 0 .04
oRIoN CoRP 15 115,603 0 .13
oTTogI CoRPoRATIoN 4 32,387 0 .04
PARADISE Co lTD 194 22,632 0 .03
PoSCo 273 300,439 0 .33
S-1 CoRPoRATIoN 80 52,719 0 .06
SAMSUNg C﹠T CoRP 302 279,456 0 .30
SAMSUNg CARD Co 146 29,771 0 .03
SAMSUNg ElECTRo-MECHANICS Co 252 104,768 0 .11
SAMSUNg ElECTRoNICS – PREF 79 569,679 0 .62
SAMSUNg ElECTRoNICS Co lTD 433 3,606,095 3 .92
SAMSUNg FIRE ﹠ MARINE INS 142 288,611 0 .31
SAMSUNg HEAVy INDUSTRIES 632 45,324 0 .05
SAMSUNg lIFE INSURANCE Co lT 305 221,754 0 .24
SAMSUNg SDI Co lTD 206 155,221 0 .17
SAMSUNg SDS Co lTD 118 198,105 0 .22
SAMSUNg SECURITIES Co lTD 241 66,505 0 .07
SHINHAN FINANCIAl gRoUP lTD 1,702 444,923 0 .48
SHINSEgAE Co lTD 29 44,086 0 .05
SK HolDINgS Co lTD 140 222,547 0 .24
SK HyNIX INC 2,282 463,809 0 .50
SK INNoVATIoN Co lTD 247 212,236 0 .23
SK NETwoRKS Co lTD 476 17,273 0 .02
SK TElECoM 41 58,400 0 .06
S-oIl CoRP 190 99,713 0 .11
wooRI BANK 1,424 83,015 0 .09
yUHAN CoRP 26 46,829 0 .05
16,292,053 17 .71
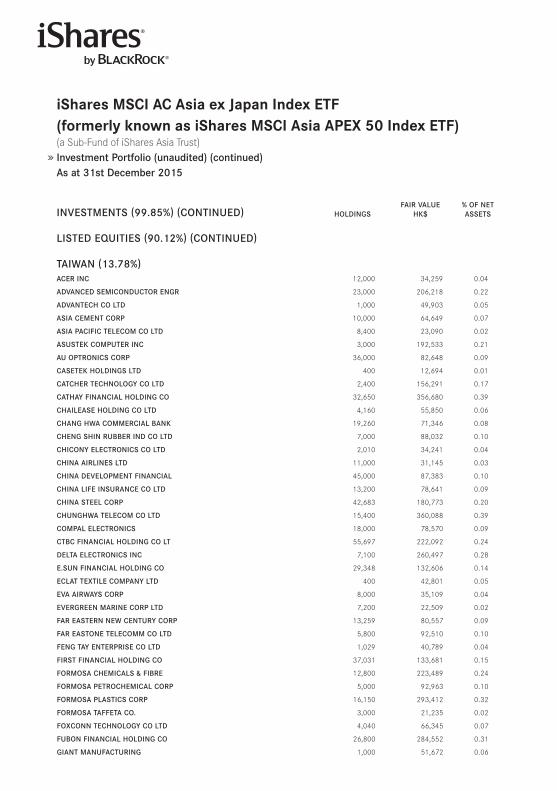
iShares MSCi AC Asia ex Japan index eTf(formerly known as iShares MSCi Asia ApeX 50 index eTf)(a Sub-Fund of iShares Asia Trust) Investment Portfolio (unaudited) (continued)As at 31st December 2015
INVESTMENTS (99.85%) (CoNTINUED) HolDINgSFAIR VAlUE
HK$% oF NET ASSETS
lISTED EqUITIES (90.12%) (CoNTINUED)
TAIwAN (13.78%)ACER INC 12,000 34,259 0 .04
ADVANCED SEMICoNDUCToR ENgR 23,000 206,218 0 .22
ADVANTECH Co lTD 1,000 49,903 0 .05
ASIA CEMENT CoRP 10,000 64,649 0 .07
ASIA PACIFIC TElECoM Co lTD 8,400 23,090 0 .02
ASUSTEK CoMPUTER INC 3,000 192,533 0 .21
AU oPTRoNICS CoRP 36,000 82,648 0 .09
CASETEK HolDINgS lTD 400 12,694 0 .01
CATCHER TECHNology Co lTD 2,400 156,291 0 .17
CATHAy FINANCIAl HolDINg Co 32,650 356,680 0 .39
CHAIlEASE HolDINg Co lTD 4,160 55,850 0 .06
CHANg HwA CoMMERCIAl BANK 19,260 71,346 0 .08
CHENg SHIN RUBBER IND Co lTD 7,000 88,032 0 .10
CHICoNy ElECTRoNICS Co lTD 2,010 34,241 0 .04
CHINA AIRlINES lTD 11,000 31,145 0 .03
CHINA DEVEloPMENT FINANCIAl 45,000 87,383 0 .10
CHINA lIFE INSURANCE Co lTD 13,200 78,641 0 .09
CHINA STEEl CoRP 42,683 180,773 0 .20
CHUNgHwA TElECoM Co lTD 15,400 360,088 0 .39
CoMPAl ElECTRoNICS 18,000 78,570 0 .09
CTBC FINANCIAl HolDINg Co lT 55,697 222,092 0 .24
DElTA ElECTRoNICS INC 7,100 260,497 0 .28
E.SUN FINANCIAl HolDINg Co 29,348 132,606 0 .14
EClAT TEXTIlE CoMPANy lTD 400 42,801 0 .05
EVA AIRwAyS CoRP 8,000 35,109 0 .04
EVERgREEN MARINE CoRP lTD 7,200 22,509 0 .02
FAR EASTERN NEw CENTURy CoRP 13,259 80,557 0 .09
FAR EASToNE TElECoMM Co lTD 5,800 92,510 0 .10
FENg TAy ENTERPRISE Co lTD 1,029 40,789 0 .04
FIRST FINANCIAl HolDINg Co 37,031 133,681 0 .15
FoRMoSA CHEMICAlS ﹠ FIBRE 12,800 223,489 0 .24
FoRMoSA PETRoCHEMICAl CoRP 5,000 92,963 0 .10
FoRMoSA PlASTICS CoRP 16,150 293,412 0 .32
FoRMoSA TAFFETA Co. 3,000 21,235 0 .02
FoXCoNN TECHNology Co lTD 4,040 66,345 0 .07
FUBoN FINANCIAl HolDINg Co 26,800 284,552 0 .31
gIANT MANUFACTURINg 1,000 51,672 0 .06
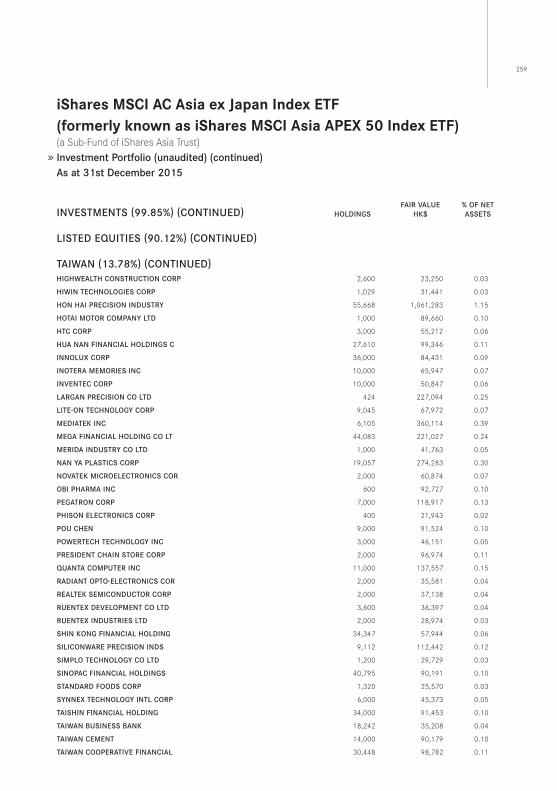
259
iShares MSCi AC Asia ex Japan index eTf(formerly known as iShares MSCi Asia ApeX 50 index eTf)(a Sub-Fund of iShares Asia Trust) Investment Portfolio (unaudited) (continued)As at 31st December 2015
INVESTMENTS (99.85%) (CoNTINUED) HolDINgSFAIR VAlUE
HK$% oF NET ASSETS
lISTED EqUITIES (90.12%) (CoNTINUED)
TAIwAN (13.78%) (CoNTINUED)HIgHwEAlTH CoNSTRUCTIoN CoRP 2,600 23,250 0 .03
HIwIN TECHNologIES CoRP 1,029 31,441 0 .03
HoN HAI PRECISIoN INDUSTRy 55,668 1,061,283 1 .15
HoTAI MoToR CoMPANy lTD 1,000 89,660 0 .10
HTC CoRP 3,000 55,212 0 .06
HUA NAN FINANCIAl HolDINgS C 27,610 99,346 0 .11
INNolUX CoRP 36,000 84,431 0 .09
INoTERA MEMoRIES INC 10,000 65,947 0 .07
INVENTEC CoRP 10,000 50,847 0 .06
lARgAN PRECISIoN Co lTD 424 227,094 0 .25
lITE-oN TECHNology CoRP 9,045 67,972 0 .07
MEDIATEK INC 6,105 360,114 0 .39
MEgA FINANCIAl HolDINg Co lT 44,083 221,027 0 .24
MERIDA INDUSTRy Co lTD 1,000 41,763 0 .05
NAN yA PlASTICS CoRP 19,057 274,283 0 .30
NoVATEK MICRoElECTRoNICS CoR 2,000 60,874 0 .07
oBI PHARMA INC 600 92,727 0 .10
PEgATRoN CoRP 7,000 118,917 0 .13
PHISoN ElECTRoNICS CoRP 400 21,943 0 .02
PoU CHEN 9,000 91,524 0 .10
PowERTECH TECHNology INC 3,000 46,151 0 .05
PRESIDENT CHAIN SToRE CoRP 2,000 96,974 0 .11
qUANTA CoMPUTER INC 11,000 137,557 0 .15
RADIANT oPTo-ElECTRoNICS CoR 2,000 35,581 0 .04
REAlTEK SEMICoNDUCToR CoRP 2,000 37,138 0 .04
RUENTEX DEVEloPMENT Co lTD 3,600 36,397 0 .04
RUENTEX INDUSTRIES lTD 2,000 28,974 0 .03
SHIN KoNg FINANCIAl HolDINg 34,347 57,944 0 .06
SIlICoNwARE PRECISIoN INDS 9,112 112,442 0 .12
SIMPlo TECHNology Co lTD 1,200 29,729 0 .03
SINoPAC FINANCIAl HolDINgS 40,795 90,191 0 .10
STANDARD FooDS CoRP 1,320 25,570 0 .03
SyNNEX TECHNology INTl CoRP 6,000 45,373 0 .05
TAISHIN FINANCIAl HolDINg 34,000 91,453 0 .10
TAIwAN BUSINESS BANK 18,242 35,208 0 .04
TAIwAN CEMENT 14,000 90,179 0 .10
TAIwAN CooPERATIVE FINANCIAl 30,448 98,782 0 .11
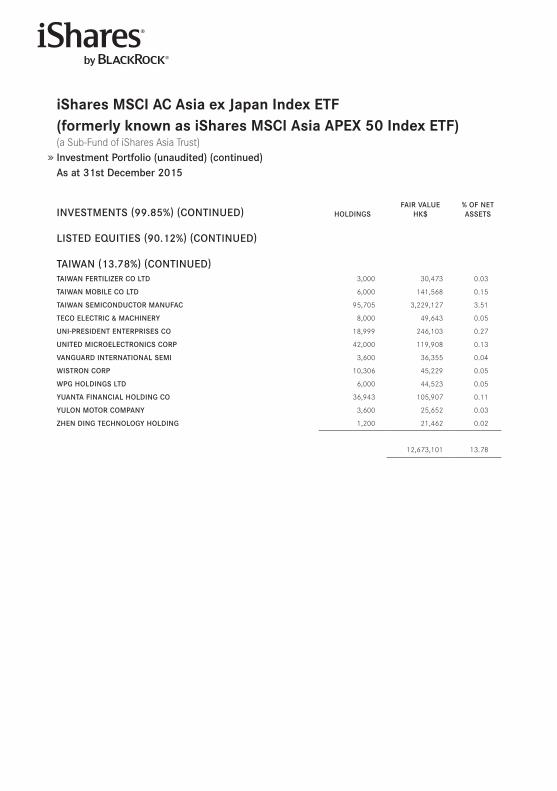
iShares MSCi AC Asia ex Japan index eTf(formerly known as iShares MSCi Asia ApeX 50 index eTf)(a Sub-Fund of iShares Asia Trust) Investment Portfolio (unaudited) (continued)As at 31st December 2015
INVESTMENTS (99.85%) (CoNTINUED) HolDINgSFAIR VAlUE
HK$% oF NET ASSETS
lISTED EqUITIES (90.12%) (CoNTINUED)
TAIwAN (13.78%) (CoNTINUED)TAIwAN FERTIlIzER Co lTD 3,000 30,473 0 .03
TAIwAN MoBIlE Co lTD 6,000 141,568 0 .15
TAIwAN SEMICoNDUCToR MANUFAC 95,705 3,229,127 3 .51
TECo ElECTRIC ﹠ MACHINERy 8,000 49,643 0 .05
UNI-PRESIDENT ENTERPRISES Co 18,999 246,103 0 .27
UNITED MICRoElECTRoNICS CoRP 42,000 119,908 0 .13
VANgUARD INTERNATIoNAl SEMI 3,600 36,355 0 .04
wISTRoN CoRP 10,306 45,229 0 .05
wPg HolDINgS lTD 6,000 44,523 0 .05
yUANTA FINANCIAl HolDINg Co 36,943 105,907 0 .11
yUloN MoToR CoMPANy 3,600 25,652 0 .03
zHEN DINg TECHNology HolDINg 1,200 21,462 0 .02
12,673,101 13 .78
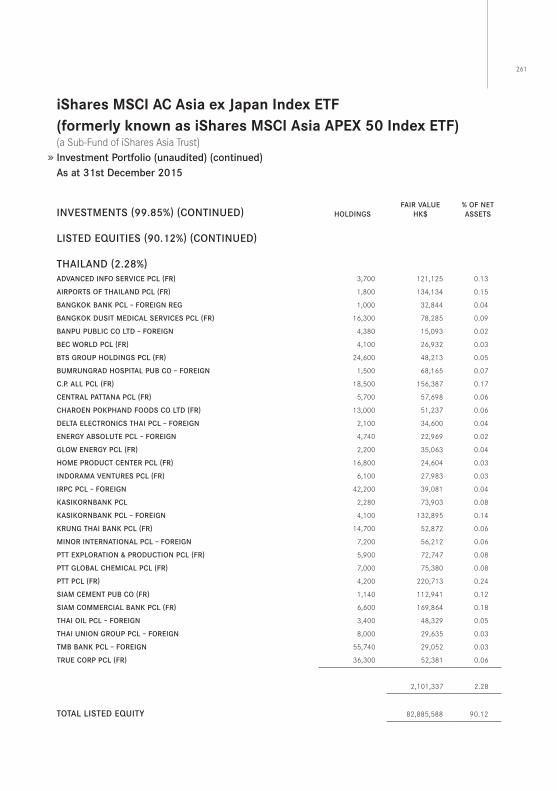
261
iShares MSCi AC Asia ex Japan index eTf(formerly known as iShares MSCi Asia ApeX 50 index eTf)(a Sub-Fund of iShares Asia Trust) Investment Portfolio (unaudited) (continued)As at 31st December 2015
INVESTMENTS (99.85%) (CoNTINUED) HolDINgSFAIR VAlUE
HK$% oF NET ASSETS
lISTED EqUITIES (90.12%) (CoNTINUED)
THAIlAND (2.28%)ADVANCED INFo SERVICE PCl (FR) 3,700 121,125 0 .13
AIRPoRTS oF THAIlAND PCl (FR) 1,800 134,134 0 .15
BANgKoK BANK PCl – FoREIgN REg 1,000 32,844 0 .04
BANgKoK DUSIT MEDICAl SERVICES PCl (FR) 16,300 78,285 0 .09
BANPU PUBlIC Co lTD – FoREIgN 4,380 15,093 0 .02
BEC woRlD PCl (FR) 4,100 26,932 0 .03
BTS gRoUP HolDINgS PCl (FR) 24,600 48,213 0 .05
BUMRUNgRAD HoSPITAl PUB Co – FoREIgN 1,500 68,165 0 .07
C.P. All PCl (FR) 18,500 156,387 0 .17
CENTRAl PATTANA PCl (FR) 5,700 57,698 0 .06
CHARoEN PoKPHAND FooDS Co lTD (FR) 13,000 51,237 0 .06
DElTA ElECTRoNICS THAI PCl – FoREIgN 2,100 34,600 0 .04
ENERgy ABSolUTE PCl – FoREIgN 4,740 22,969 0 .02
glow ENERgy PCl (FR) 2,200 35,063 0 .04
HoME PRoDUCT CENTER PCl (FR) 16,800 24,604 0 .03
INDoRAMA VENTURES PCl (FR) 6,100 27,983 0 .03
IRPC PCl – FoREIgN 42,200 39,081 0 .04
KASIKoRNBANK PCl 2,280 73,903 0 .08
KASIKoRNBANK PCl – FoREIgN 4,100 132,895 0 .14
KRUNg THAI BANK PCl (FR) 14,700 52,872 0 .06
MINoR INTERNATIoNAl PCl – FoREIgN 7,200 56,212 0 .06
PTT EXPloRATIoN ﹠ PRoDUCTIoN PCl (FR) 5,900 72,747 0 .08
PTT gloBAl CHEMICAl PCl (FR) 7,000 75,380 0 .08
PTT PCl (FR) 4,200 220,713 0 .24
SIAM CEMENT PUB Co (FR) 1,140 112,941 0 .12
SIAM CoMMERCIAl BANK PCl (FR) 6,600 169,864 0 .18
THAI oIl PCl – FoREIgN 3,400 48,329 0 .05
THAI UNIoN gRoUP PCl – FoREIgN 8,000 29,635 0 .03
TMB BANK PCl – FoREIgN 55,740 29,052 0 .03
TRUE CoRP PCl (FR) 36,300 52,381 0 .06
2,101,337 2 .28
ToTAl lISTED EqUITy 82,885,588 90 .12
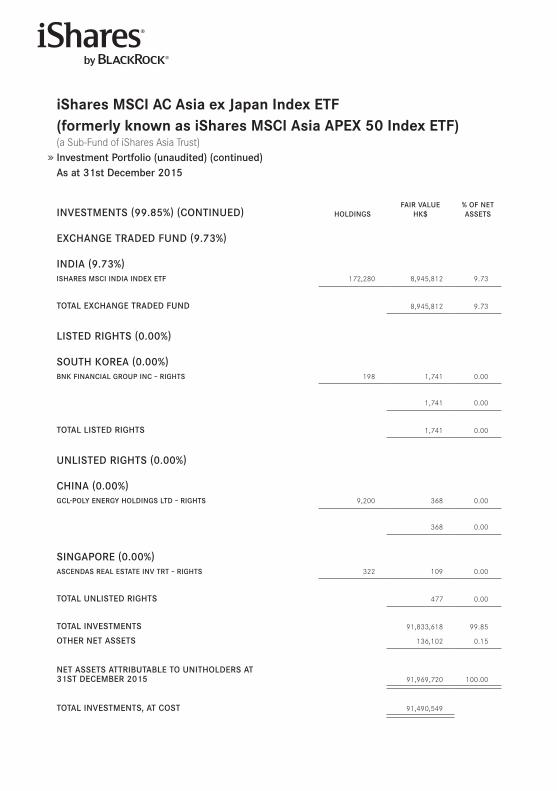
iShares MSCi AC Asia ex Japan index eTf(formerly known as iShares MSCi Asia ApeX 50 index eTf)(a Sub-Fund of iShares Asia Trust) Investment Portfolio (unaudited) (continued)As at 31st December 2015
INVESTMENTS (99.85%) (CoNTINUED) HolDINgSFAIR VAlUE
HK$% oF NET ASSETS
EXCHANgE TRADED FUND (9.73%)
INDIA (9.73%)ISHARES MSCI INDIA INDEX ETF 172,280 8,945,812 9 .73
ToTAl EXCHANgE TRADED FUND 8,945,812 9 .73
lISTED RIgHTS (0.00%)
SoUTH KoREA (0.00%)BNK FINANCIAl gRoUP INC – RIgHTS 198 1,741 0 .00
1,741 0 .00
ToTAl lISTED RIgHTS 1,741 0 .00
UNlISTED RIgHTS (0.00%)
CHINA (0.00%)gCl-Poly ENERgy HolDINgS lTD – RIgHTS 9,200 368 0 .00
368 0 .00
SINgAPoRE (0.00%)ASCENDAS REAl ESTATE INV TRT – RIgHTS 322 109 0 .00
ToTAl UNlISTED RIgHTS 477 0 .00
ToTAl INVESTMENTS 91,833,618 99 .85
oTHER NET ASSETS 136,102 0 .15
NET ASSETS ATTRIBUTABlE To UNITHolDERS AT31ST DECEMBER 2015 91,969,720 100 .00
ToTAl INVESTMENTS, AT CoST 91,490,549
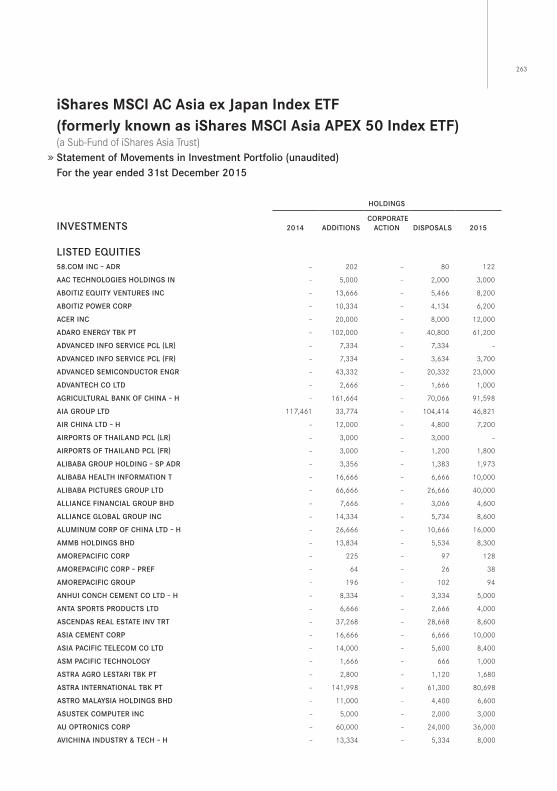
263
iShares MSCi AC Asia ex Japan index eTf(formerly known as iShares MSCi Asia ApeX 50 index eTf)(a Sub-Fund of iShares Asia Trust) Statement of Movements in Investment Portfolio (unaudited)For the year ended 31st December 2015
HolDINgS
INVESTMENTS 2014 ADDITIoNS CoRPoRATE
ACTIoN DISPoSAlS 2015
lISTED EqUITIES58.CoM INC – ADR – 202 – 80 122
AAC TECHNologIES HolDINgS IN – 5,000 – 2,000 3,000
ABoITIz EqUITy VENTURES INC – 13,666 – 5,466 8,200
ABoITIz PowER CoRP – 10,334 – 4,134 6,200
ACER INC – 20,000 – 8,000 12,000
ADARo ENERgy TBK PT – 102,000 – 40,800 61,200
ADVANCED INFo SERVICE PCl (lR) – 7,334 – 7,334 –
ADVANCED INFo SERVICE PCl (FR) – 7,334 – 3,634 3,700
ADVANCED SEMICoNDUCToR ENgR – 43,332 – 20,332 23,000
ADVANTECH Co lTD – 2,666 – 1,666 1,000
AgRICUlTURAl BANK oF CHINA – H – 161,664 – 70,066 91,598
AIA gRoUP lTD 117,461 33,774 – 104,414 46,821
AIR CHINA lTD – H – 12,000 – 4,800 7,200
AIRPoRTS oF THAIlAND PCl (lR) – 3,000 – 3,000 –
AIRPoRTS oF THAIlAND PCl (FR) – 3,000 – 1,200 1,800
AlIBABA gRoUP HolDINg – SP ADR – 3,356 – 1,383 1,973
AlIBABA HEAlTH INFoRMATIoN T – 16,666 – 6,666 10,000
AlIBABA PICTURES gRoUP lTD – 66,666 – 26,666 40,000
AllIANCE FINANCIAl gRoUP BHD – 7,666 – 3,066 4,600
AllIANCE gloBAl gRoUP INC – 14,334 – 5,734 8,600
AlUMINUM CoRP oF CHINA lTD – H – 26,666 – 10,666 16,000
AMMB HolDINgS BHD – 13,834 – 5,534 8,300
AMoREPACIFIC CoRP – 225 – 97 128
AMoREPACIFIC CoRP – PREF – 64 – 26 38
AMoREPACIFIC gRoUP – 196 – 102 94
ANHUI CoNCH CEMENT Co lTD – H – 8,334 – 3,334 5,000
ANTA SPoRTS PRoDUCTS lTD – 6,666 – 2,666 4,000
ASCENDAS REAl ESTATE INV TRT – 37,268 – 28,668 8,600
ASIA CEMENT CoRP – 16,666 – 6,666 10,000
ASIA PACIFIC TElECoM Co lTD – 14,000 – 5,600 8,400
ASM PACIFIC TECHNology – 1,666 – 666 1,000
ASTRA AgRo lESTARI TBK PT – 2,800 – 1,120 1,680
ASTRA INTERNATIoNAl TBK PT – 141,998 – 61,300 80,698
ASTRo MAlAySIA HolDINgS BHD – 11,000 – 4,400 6,600
ASUSTEK CoMPUTER INC – 5,000 – 2,000 3,000
AU oPTRoNICS CoRP – 60,000 – 24,000 36,000
AVICHINA INDUSTRy ﹠ TECH – H – 13,334 – 5,334 8,000
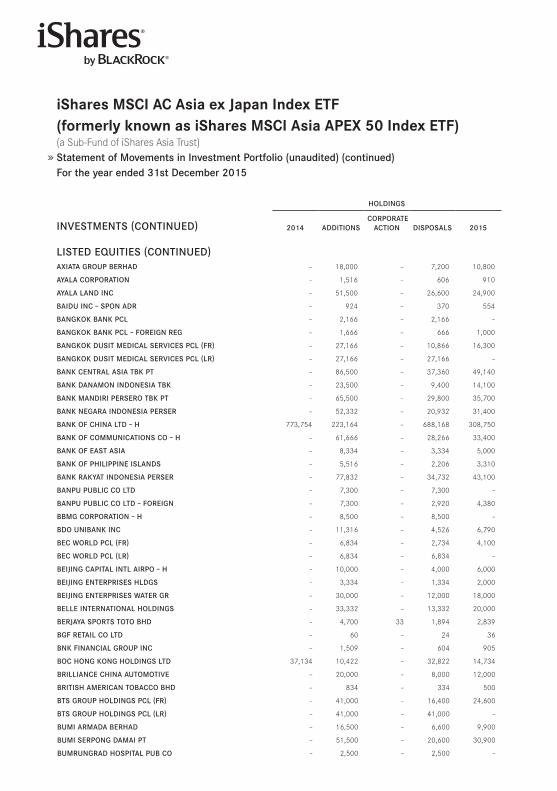
iShares MSCi AC Asia ex Japan index eTf(formerly known as iShares MSCi Asia ApeX 50 index eTf)(a Sub-Fund of iShares Asia Trust) Statement of Movements in Investment Portfolio (unaudited) (continued)For the year ended 31st December 2015
HolDINgS
INVESTMENTS (CoNTINUED) 2014 ADDITIoNS CoRPoRATE
ACTIoN DISPoSAlS 2015
lISTED EqUITIES (CoNTINUED)AXIATA gRoUP BERHAD – 18,000 – 7,200 10,800
AyAlA CoRPoRATIoN – 1,516 – 606 910
AyAlA lAND INC – 51,500 – 26,600 24,900
BAIDU INC – SPoN ADR – 924 – 370 554
BANgKoK BANK PCl – 2,166 – 2,166 –
BANgKoK BANK PCl – FoREIgN REg – 1,666 – 666 1,000
BANgKoK DUSIT MEDICAl SERVICES PCl (FR) – 27,166 – 10,866 16,300
BANgKoK DUSIT MEDICAl SERVICES PCl (lR) – 27,166 – 27,166 –
BANK CENTRAl ASIA TBK PT – 86,500 – 37,360 49,140
BANK DANAMoN INDoNESIA TBK – 23,500 – 9,400 14,100
BANK MANDIRI PERSERo TBK PT – 65,500 – 29,800 35,700
BANK NEgARA INDoNESIA PERSER – 52,332 – 20,932 31,400
BANK oF CHINA lTD – H 773,754 223,164 – 688,168 308,750
BANK oF CoMMUNICATIoNS Co – H – 61,666 – 28,266 33,400
BANK oF EAST ASIA – 8,334 – 3,334 5,000
BANK oF PHIlIPPINE ISlANDS – 5,516 – 2,206 3,310
BANK RAKyAT INDoNESIA PERSER – 77,832 – 34,732 43,100
BANPU PUBlIC Co lTD – 7,300 – 7,300 –
BANPU PUBlIC Co lTD – FoREIgN – 7,300 – 2,920 4,380
BBMg CoRPoRATIoN – H – 8,500 – 8,500 –
BDo UNIBANK INC – 11,316 – 4,526 6,790
BEC woRlD PCl (FR) – 6,834 – 2,734 4,100
BEC woRlD PCl (lR) – 6,834 – 6,834 –
BEIJINg CAPITAl INTl AIRPo – H – 10,000 – 4,000 6,000
BEIJINg ENTERPRISES HlDgS – 3,334 – 1,334 2,000
BEIJINg ENTERPRISES wATER gR – 30,000 – 12,000 18,000
BEllE INTERNATIoNAl HolDINgS – 33,332 – 13,332 20,000
BERJAyA SPoRTS ToTo BHD – 4,700 33 1,894 2,839
BgF RETAIl Co lTD – 60 – 24 36
BNK FINANCIAl gRoUP INC – 1,509 – 604 905
BoC HoNg KoNg HolDINgS lTD 37,134 10,422 – 32,822 14,734
BRIllIANCE CHINA AUToMoTIVE – 20,000 – 8,000 12,000
BRITISH AMERICAN ToBACCo BHD – 834 – 334 500
BTS gRoUP HolDINgS PCl (FR) – 41,000 – 16,400 24,600
BTS gRoUP HolDINgS PCl (lR) – 41,000 – 41,000 –
BUMI ARMADA BERHAD – 16,500 – 6,600 9,900
BUMI SERPoNg DAMAI PT – 51,500 – 20,600 30,900
BUMRUNgRAD HoSPITAl PUB Co – 2,500 – 2,500 –
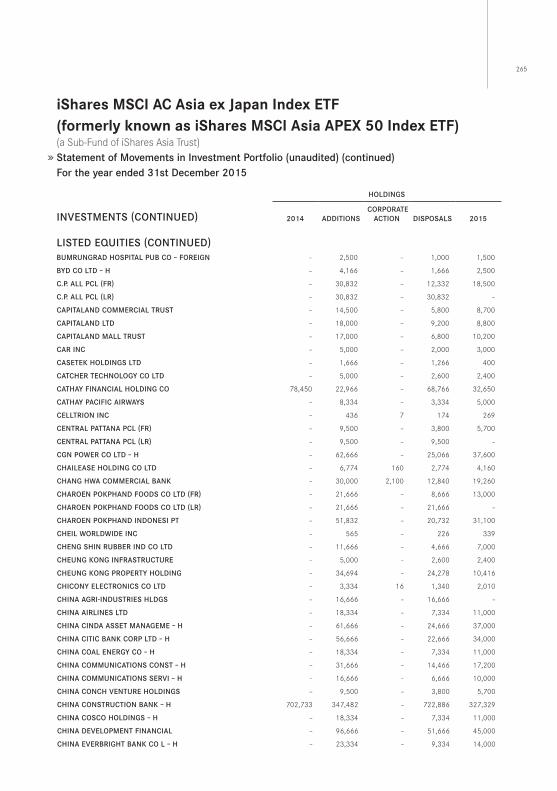
265
iShares MSCi AC Asia ex Japan index eTf(formerly known as iShares MSCi Asia ApeX 50 index eTf)(a Sub-Fund of iShares Asia Trust) Statement of Movements in Investment Portfolio (unaudited) (continued)For the year ended 31st December 2015
HolDINgS
INVESTMENTS (CoNTINUED) 2014 ADDITIoNS CoRPoRATE
ACTIoN DISPoSAlS 2015
lISTED EqUITIES (CoNTINUED)BUMRUNgRAD HoSPITAl PUB Co – FoREIgN – 2,500 – 1,000 1,500
ByD Co lTD – H – 4,166 – 1,666 2,500
C.P. All PCl (FR) – 30,832 – 12,332 18,500
C.P. All PCl (lR) – 30,832 – 30,832 –
CAPITAlAND CoMMERCIAl TRUST – 14,500 – 5,800 8,700
CAPITAlAND lTD – 18,000 – 9,200 8,800
CAPITAlAND MAll TRUST – 17,000 – 6,800 10,200
CAR INC – 5,000 – 2,000 3,000
CASETEK HolDINgS lTD – 1,666 – 1,266 400
CATCHER TECHNology Co lTD – 5,000 – 2,600 2,400
CATHAy FINANCIAl HolDINg Co 78,450 22,966 – 68,766 32,650
CATHAy PACIFIC AIRwAyS – 8,334 – 3,334 5,000
CEllTRIoN INC – 436 7 174 269
CENTRAl PATTANA PCl (FR) – 9,500 – 3,800 5,700
CENTRAl PATTANA PCl (lR) – 9,500 – 9,500 –
CgN PowER Co lTD – H – 62,666 – 25,066 37,600
CHAIlEASE HolDINg Co lTD – 6,774 160 2,774 4,160
CHANg HwA CoMMERCIAl BANK – 30,000 2,100 12,840 19,260
CHARoEN PoKPHAND FooDS Co lTD (FR) – 21,666 – 8,666 13,000
CHARoEN PoKPHAND FooDS Co lTD (lR) – 21,666 – 21,666 –
CHARoEN PoKPHAND INDoNESI PT – 51,832 – 20,732 31,100
CHEIl woRlDwIDE INC – 565 – 226 339
CHENg SHIN RUBBER IND Co lTD – 11,666 – 4,666 7,000
CHEUNg KoNg INFRASTRUCTURE – 5,000 – 2,600 2,400
CHEUNg KoNg PRoPERTy HolDINg – 34,694 – 24,278 10,416
CHICoNy ElECTRoNICS Co lTD – 3,334 16 1,340 2,010
CHINA AgRI-INDUSTRIES HlDgS – 16,666 – 16,666 –
CHINA AIRlINES lTD – 18,334 – 7,334 11,000
CHINA CINDA ASSET MANAgEME – H – 61,666 – 24,666 37,000
CHINA CITIC BANK CoRP lTD – H – 56,666 – 22,666 34,000
CHINA CoAl ENERgy Co – H – 18,334 – 7,334 11,000
CHINA CoMMUNICATIoNS CoNST – H – 31,666 – 14,466 17,200
CHINA CoMMUNICATIoNS SERVI – H – 16,666 – 6,666 10,000
CHINA CoNCH VENTURE HolDINgS – 9,500 – 3,800 5,700
CHINA CoNSTRUCTIoN BANK – H 702,733 347,482 – 722,886 327,329
CHINA CoSCo HolDINgS – H – 18,334 – 7,334 11,000
CHINA DEVEloPMENT FINANCIAl – 96,666 – 51,666 45,000
CHINA EVERBRIgHT BANK Co l – H – 23,334 – 9,334 14,000
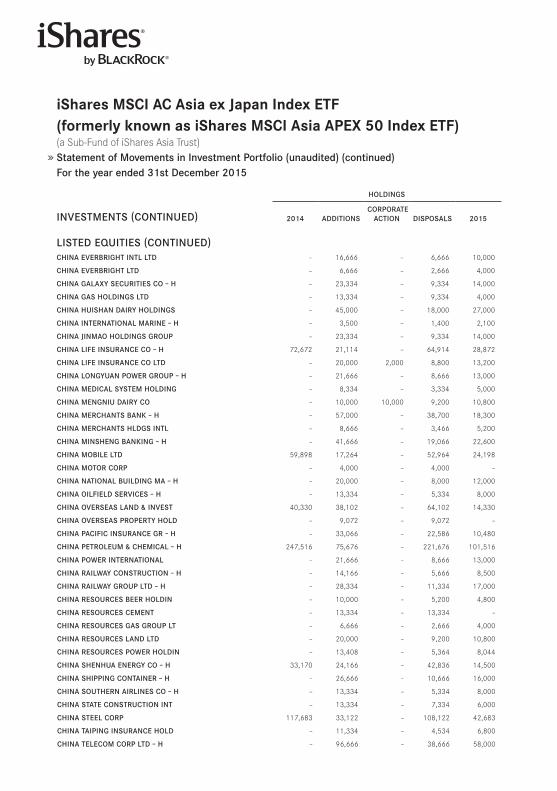
iShares MSCi AC Asia ex Japan index eTf(formerly known as iShares MSCi Asia ApeX 50 index eTf)(a Sub-Fund of iShares Asia Trust) Statement of Movements in Investment Portfolio (unaudited) (continued)For the year ended 31st December 2015
HolDINgS
INVESTMENTS (CoNTINUED) 2014 ADDITIoNS CoRPoRATE
ACTIoN DISPoSAlS 2015
lISTED EqUITIES (CoNTINUED)CHINA EVERBRIgHT INTl lTD – 16,666 – 6,666 10,000
CHINA EVERBRIgHT lTD – 6,666 – 2,666 4,000
CHINA gAlAXy SECURITIES Co – H – 23,334 – 9,334 14,000
CHINA gAS HolDINgS lTD – 13,334 – 9,334 4,000
CHINA HUISHAN DAIRy HolDINgS – 45,000 – 18,000 27,000
CHINA INTERNATIoNAl MARINE – H – 3,500 – 1,400 2,100
CHINA JINMAo HolDINgS gRoUP – 23,334 – 9,334 14,000
CHINA lIFE INSURANCE Co – H 72,672 21,114 – 64,914 28,872
CHINA lIFE INSURANCE Co lTD – 20,000 2,000 8,800 13,200
CHINA loNgyUAN PowER gRoUP – H – 21,666 – 8,666 13,000
CHINA MEDICAl SySTEM HolDINg – 8,334 – 3,334 5,000
CHINA MENgNIU DAIRy Co – 10,000 10,000 9,200 10,800
CHINA MERCHANTS BANK – H – 57,000 – 38,700 18,300
CHINA MERCHANTS HlDgS INTl – 8,666 – 3,466 5,200
CHINA MINSHENg BANKINg – H – 41,666 – 19,066 22,600
CHINA MoBIlE lTD 59,898 17,264 – 52,964 24,198
CHINA MoToR CoRP – 4,000 – 4,000 –
CHINA NATIoNAl BUIlDINg MA – H – 20,000 – 8,000 12,000
CHINA oIlFIElD SERVICES – H – 13,334 – 5,334 8,000
CHINA oVERSEAS lAND ﹠ INVEST 40,330 38,102 – 64,102 14,330
CHINA oVERSEAS PRoPERTy HolD – 9,072 – 9,072 –
CHINA PACIFIC INSURANCE gR – H – 33,066 – 22,586 10,480
CHINA PETRolEUM ﹠ CHEMICAl – H 247,516 75,676 – 221,676 101,516
CHINA PowER INTERNATIoNAl – 21,666 – 8,666 13,000
CHINA RAIlwAy CoNSTRUCTIoN – H – 14,166 – 5,666 8,500
CHINA RAIlwAy gRoUP lTD – H – 28,334 – 11,334 17,000
CHINA RESoURCES BEER HolDIN – 10,000 – 5,200 4,800
CHINA RESoURCES CEMENT – 13,334 – 13,334 –
CHINA RESoURCES gAS gRoUP lT – 6,666 – 2,666 4,000
CHINA RESoURCES lAND lTD – 20,000 – 9,200 10,800
CHINA RESoURCES PowER HolDIN – 13,408 – 5,364 8,044
CHINA SHENHUA ENERgy Co – H 33,170 24,166 – 42,836 14,500
CHINA SHIPPINg CoNTAINER – H – 26,666 – 10,666 16,000
CHINA SoUTHERN AIRlINES Co – H – 13,334 – 5,334 8,000
CHINA STATE CoNSTRUCTIoN INT – 13,334 – 7,334 6,000
CHINA STEEl CoRP 117,683 33,122 – 108,122 42,683
CHINA TAIPINg INSURANCE HolD – 11,334 – 4,534 6,800
CHINA TElECoM CoRP lTD – H – 96,666 – 38,666 58,000
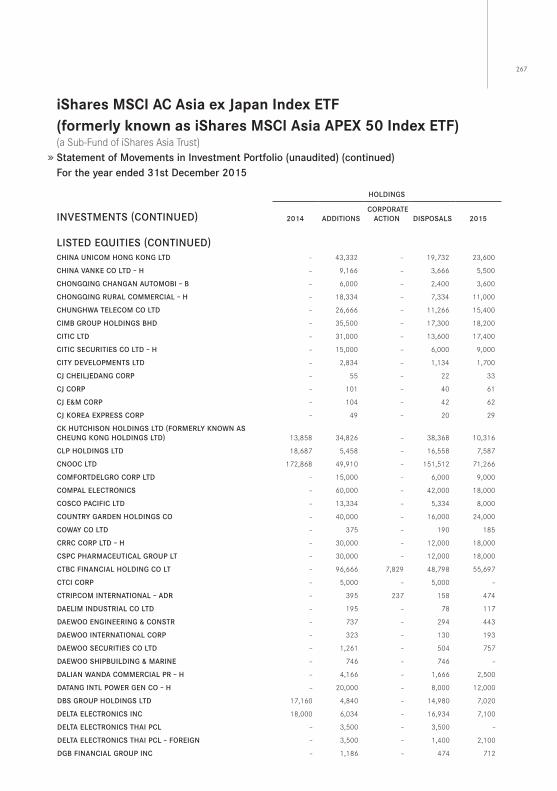
267
iShares MSCi AC Asia ex Japan index eTf(formerly known as iShares MSCi Asia ApeX 50 index eTf)(a Sub-Fund of iShares Asia Trust) Statement of Movements in Investment Portfolio (unaudited) (continued)For the year ended 31st December 2015
HolDINgS
INVESTMENTS (CoNTINUED) 2014 ADDITIoNS CoRPoRATE
ACTIoN DISPoSAlS 2015
lISTED EqUITIES (CoNTINUED)CHINA UNICoM HoNg KoNg lTD – 43,332 – 19,732 23,600
CHINA VANKE Co lTD – H – 9,166 – 3,666 5,500
CHoNgqINg CHANgAN AUToMoBI – B – 6,000 – 2,400 3,600
CHoNgqINg RURAl CoMMERCIAl – H – 18,334 – 7,334 11,000
CHUNgHwA TElECoM Co lTD – 26,666 – 11,266 15,400
CIMB gRoUP HolDINgS BHD – 35,500 – 17,300 18,200
CITIC lTD – 31,000 – 13,600 17,400
CITIC SECURITIES Co lTD – H – 15,000 – 6,000 9,000
CITy DEVEloPMENTS lTD – 2,834 – 1,134 1,700
CJ CHEIlJEDANg CoRP – 55 – 22 33
CJ CoRP – 101 – 40 61
CJ E﹠M CoRP – 104 – 42 62
CJ KoREA EXPRESS CoRP – 49 – 20 29
CK HUTCHISoN HolDINgS lTD (FoRMERly KNowN AS CHEUNg KoNg HolDINgS lTD) 13,858 34,826 – 38,368 10,316
ClP HolDINgS lTD 18,687 5,458 – 16,558 7,587
CNooC lTD 172,868 49,910 – 151,512 71,266
CoMFoRTDElgRo CoRP lTD – 15,000 – 6,000 9,000
CoMPAl ElECTRoNICS – 60,000 – 42,000 18,000
CoSCo PACIFIC lTD – 13,334 – 5,334 8,000
CoUNTRy gARDEN HolDINgS Co – 40,000 – 16,000 24,000
CowAy Co lTD – 375 – 190 185
CRRC CoRP lTD – H – 30,000 – 12,000 18,000
CSPC PHARMACEUTICAl gRoUP lT – 30,000 – 12,000 18,000
CTBC FINANCIAl HolDINg Co lT – 96,666 7,829 48,798 55,697
CTCI CoRP – 5,000 – 5,000 –
CTRIP.CoM INTERNATIoNAl – ADR – 395 237 158 474
DAElIM INDUSTRIAl Co lTD – 195 – 78 117
DAEwoo ENgINEERINg ﹠ CoNSTR – 737 – 294 443
DAEwoo INTERNATIoNAl CoRP – 323 – 130 193
DAEwoo SECURITIES Co lTD – 1,261 – 504 757
DAEwoo SHIPBUIlDINg ﹠ MARINE – 746 – 746 –
DAlIAN wANDA CoMMERCIAl PR – H – 4,166 – 1,666 2,500
DATANg INTl PowER gEN Co – H – 20,000 – 8,000 12,000
DBS gRoUP HolDINgS lTD 17,160 4,840 – 14,980 7,020
DElTA ElECTRoNICS INC 18,000 6,034 – 16,934 7,100
DElTA ElECTRoNICS THAI PCl – 3,500 – 3,500 –
DElTA ElECTRoNICS THAI PCl – FoREIgN – 3,500 – 1,400 2,100
DgB FINANCIAl gRoUP INC – 1,186 – 474 712
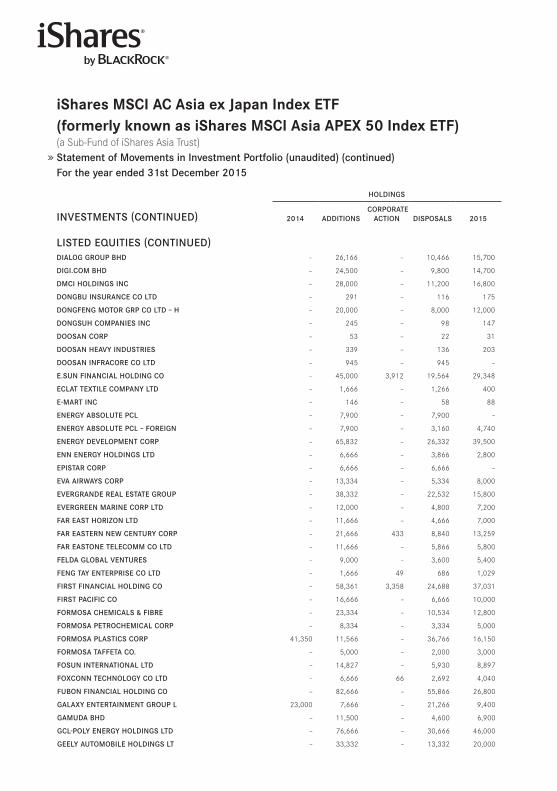
iShares MSCi AC Asia ex Japan index eTf(formerly known as iShares MSCi Asia ApeX 50 index eTf)(a Sub-Fund of iShares Asia Trust) Statement of Movements in Investment Portfolio (unaudited) (continued)For the year ended 31st December 2015
HolDINgS
INVESTMENTS (CoNTINUED) 2014 ADDITIoNS CoRPoRATE
ACTIoN DISPoSAlS 2015
lISTED EqUITIES (CoNTINUED)DIAlog gRoUP BHD – 26,166 – 10,466 15,700
DIgI.CoM BHD – 24,500 – 9,800 14,700
DMCI HolDINgS INC – 28,000 – 11,200 16,800
DoNgBU INSURANCE Co lTD – 291 – 116 175
DoNgFENg MoToR gRP Co lTD – H – 20,000 – 8,000 12,000
DoNgSUH CoMPANIES INC – 245 – 98 147
DooSAN CoRP – 53 – 22 31
DooSAN HEAVy INDUSTRIES – 339 – 136 203
DooSAN INFRACoRE Co lTD – 945 – 945 –
E.SUN FINANCIAl HolDINg Co – 45,000 3,912 19,564 29,348
EClAT TEXTIlE CoMPANy lTD – 1,666 – 1,266 400
E-MART INC – 146 – 58 88
ENERgy ABSolUTE PCl – 7,900 – 7,900 –
ENERgy ABSolUTE PCl – FoREIgN – 7,900 – 3,160 4,740
ENERgy DEVEloPMENT CoRP – 65,832 – 26,332 39,500
ENN ENERgy HolDINgS lTD – 6,666 – 3,866 2,800
EPISTAR CoRP – 6,666 – 6,666 –
EVA AIRwAyS CoRP – 13,334 – 5,334 8,000
EVERgRANDE REAl ESTATE gRoUP – 38,332 – 22,532 15,800
EVERgREEN MARINE CoRP lTD – 12,000 – 4,800 7,200
FAR EAST HoRIzoN lTD – 11,666 – 4,666 7,000
FAR EASTERN NEw CENTURy CoRP – 21,666 433 8,840 13,259
FAR EASToNE TElECoMM Co lTD – 11,666 – 5,866 5,800
FElDA gloBAl VENTURES – 9,000 – 3,600 5,400
FENg TAy ENTERPRISE Co lTD – 1,666 49 686 1,029
FIRST FINANCIAl HolDINg Co – 58,361 3,358 24,688 37,031
FIRST PACIFIC Co – 16,666 – 6,666 10,000
FoRMoSA CHEMICAlS ﹠ FIBRE – 23,334 – 10,534 12,800
FoRMoSA PETRoCHEMICAl CoRP – 8,334 – 3,334 5,000
FoRMoSA PlASTICS CoRP 41,350 11,566 – 36,766 16,150
FoRMoSA TAFFETA Co. – 5,000 – 2,000 3,000
FoSUN INTERNATIoNAl lTD – 14,827 – 5,930 8,897
FoXCoNN TECHNology Co lTD – 6,666 66 2,692 4,040
FUBoN FINANCIAl HolDINg Co – 82,666 – 55,866 26,800
gAlAXy ENTERTAINMENT gRoUP l 23,000 7,666 – 21,266 9,400
gAMUDA BHD – 11,500 – 4,600 6,900
gCl-Poly ENERgy HolDINgS lTD – 76,666 – 30,666 46,000
gEEly AUToMoBIlE HolDINgS lT – 33,332 – 13,332 20,000
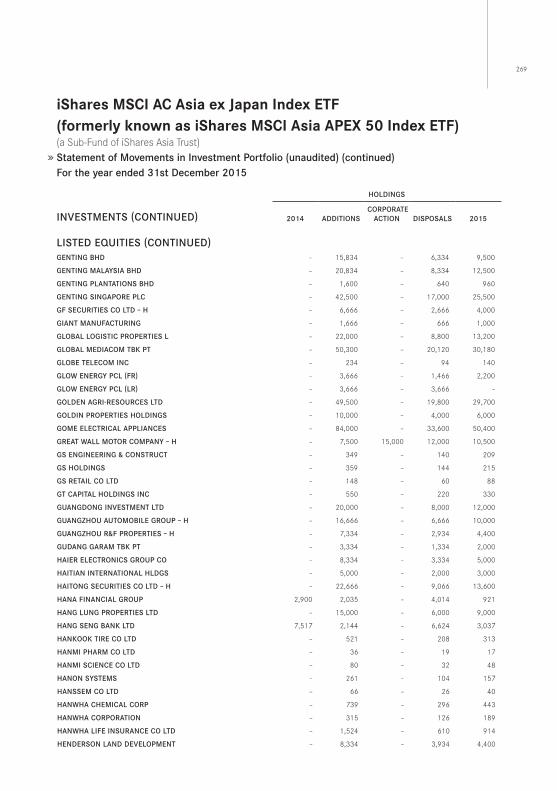
269
iShares MSCi AC Asia ex Japan index eTf(formerly known as iShares MSCi Asia ApeX 50 index eTf)(a Sub-Fund of iShares Asia Trust) Statement of Movements in Investment Portfolio (unaudited) (continued)For the year ended 31st December 2015
HolDINgS
INVESTMENTS (CoNTINUED) 2014 ADDITIoNS CoRPoRATE
ACTIoN DISPoSAlS 2015
lISTED EqUITIES (CoNTINUED)gENTINg BHD – 15,834 – 6,334 9,500
gENTINg MAlAySIA BHD – 20,834 – 8,334 12,500
gENTINg PlANTATIoNS BHD – 1,600 – 640 960
gENTINg SINgAPoRE PlC – 42,500 – 17,000 25,500
gF SECURITIES Co lTD – H – 6,666 – 2,666 4,000
gIANT MANUFACTURINg – 1,666 – 666 1,000
gloBAl logISTIC PRoPERTIES l – 22,000 – 8,800 13,200
gloBAl MEDIACoM TBK PT – 50,300 – 20,120 30,180
gloBE TElECoM INC – 234 – 94 140
glow ENERgy PCl (FR) – 3,666 – 1,466 2,200
glow ENERgy PCl (lR) – 3,666 – 3,666 –
golDEN AgRI-RESoURCES lTD – 49,500 – 19,800 29,700
golDIN PRoPERTIES HolDINgS – 10,000 – 4,000 6,000
goME ElECTRICAl APPlIANCES – 84,000 – 33,600 50,400
gREAT wAll MoToR CoMPANy – H – 7,500 15,000 12,000 10,500
gS ENgINEERINg ﹠ CoNSTRUCT – 349 – 140 209
gS HolDINgS – 359 – 144 215
gS RETAIl Co lTD – 148 – 60 88
gT CAPITAl HolDINgS INC – 550 – 220 330
gUANgDoNg INVESTMENT lTD – 20,000 – 8,000 12,000
gUANgzHoU AUToMoBIlE gRoUP – H – 16,666 – 6,666 10,000
gUANgzHoU R﹠F PRoPERTIES – H – 7,334 – 2,934 4,400
gUDANg gARAM TBK PT – 3,334 – 1,334 2,000
HAIER ElECTRoNICS gRoUP Co – 8,334 – 3,334 5,000
HAITIAN INTERNATIoNAl HlDgS – 5,000 – 2,000 3,000
HAIToNg SECURITIES Co lTD – H – 22,666 – 9,066 13,600
HANA FINANCIAl gRoUP 2,900 2,035 – 4,014 921
HANg lUNg PRoPERTIES lTD – 15,000 – 6,000 9,000
HANg SENg BANK lTD 7,517 2,144 – 6,624 3,037
HANKooK TIRE Co lTD – 521 – 208 313
HANMI PHARM Co lTD – 36 – 19 17
HANMI SCIENCE Co lTD – 80 – 32 48
HANoN SySTEMS – 261 – 104 157
HANSSEM Co lTD – 66 – 26 40
HANwHA CHEMICAl CoRP – 739 – 296 443
HANwHA CoRPoRATIoN – 315 – 126 189
HANwHA lIFE INSURANCE Co lTD – 1,524 – 610 914
HENDERSoN lAND DEVEloPMENT – 8,334 – 3,934 4,400
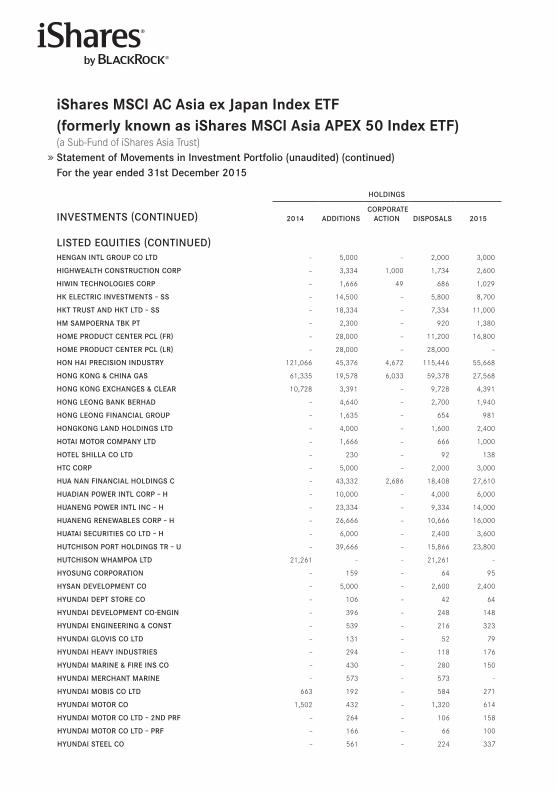
iShares MSCi AC Asia ex Japan index eTf(formerly known as iShares MSCi Asia ApeX 50 index eTf)(a Sub-Fund of iShares Asia Trust) Statement of Movements in Investment Portfolio (unaudited) (continued)For the year ended 31st December 2015
HolDINgS
INVESTMENTS (CoNTINUED) 2014 ADDITIoNS CoRPoRATE
ACTIoN DISPoSAlS 2015
lISTED EqUITIES (CoNTINUED)HENgAN INTl gRoUP Co lTD – 5,000 – 2,000 3,000
HIgHwEAlTH CoNSTRUCTIoN CoRP – 3,334 1,000 1,734 2,600
HIwIN TECHNologIES CoRP – 1,666 49 686 1,029
HK ElECTRIC INVESTMENTS – SS – 14,500 – 5,800 8,700
HKT TRUST AND HKT lTD – SS – 18,334 – 7,334 11,000
HM SAMPoERNA TBK PT – 2,300 – 920 1,380
HoME PRoDUCT CENTER PCl (FR) – 28,000 – 11,200 16,800
HoME PRoDUCT CENTER PCl (lR) – 28,000 – 28,000 –
HoN HAI PRECISIoN INDUSTRy 121,066 45,376 4,672 115,446 55,668
HoNg KoNg ﹠ CHINA gAS 61,335 19,578 6,033 59,378 27,568
HoNg KoNg EXCHANgES ﹠ ClEAR 10,728 3,391 – 9,728 4,391
HoNg lEoNg BANK BERHAD – 4,640 – 2,700 1,940
HoNg lEoNg FINANCIAl gRoUP – 1,635 – 654 981
HoNgKoNg lAND HolDINgS lTD – 4,000 – 1,600 2,400
HoTAI MoToR CoMPANy lTD – 1,666 – 666 1,000
HoTEl SHIllA Co lTD – 230 – 92 138
HTC CoRP – 5,000 – 2,000 3,000
HUA NAN FINANCIAl HolDINgS C – 43,332 2,686 18,408 27,610
HUADIAN PowER INTl CoRP – H – 10,000 – 4,000 6,000
HUANENg PowER INTl INC – H – 23,334 – 9,334 14,000
HUANENg RENEwABlES CoRP – H – 26,666 – 10,666 16,000
HUATAI SECURITIES Co lTD – H – 6,000 – 2,400 3,600
HUTCHISoN PoRT HolDINgS TR – U – 39,666 – 15,866 23,800
HUTCHISoN wHAMPoA lTD 21,261 – – 21,261 –
HyoSUNg CoRPoRATIoN – 159 – 64 95
HySAN DEVEloPMENT Co – 5,000 – 2,600 2,400
HyUNDAI DEPT SToRE Co – 106 – 42 64
HyUNDAI DEVEloPMENT Co-ENgIN – 396 – 248 148
HyUNDAI ENgINEERINg ﹠ CoNST – 539 – 216 323
HyUNDAI gloVIS Co lTD – 131 – 52 79
HyUNDAI HEAVy INDUSTRIES – 294 – 118 176
HyUNDAI MARINE ﹠ FIRE INS Co – 430 – 280 150
HyUNDAI MERCHANT MARINE – 573 – 573 –
HyUNDAI MoBIS Co lTD 663 192 – 584 271
HyUNDAI MoToR Co 1,502 432 – 1,320 614
HyUNDAI MoToR Co lTD – 2ND PRF – 264 – 106 158
HyUNDAI MoToR Co lTD – PRF – 166 – 66 100
HyUNDAI STEEl Co – 561 – 224 337

271
iShares MSCi AC Asia ex Japan index eTf(formerly known as iShares MSCi Asia ApeX 50 index eTf)(a Sub-Fund of iShares Asia Trust) Statement of Movements in Investment Portfolio (unaudited) (continued)For the year ended 31st December 2015
HolDINgS
INVESTMENTS (CoNTINUED) 2014 ADDITIoNS CoRPoRATE
ACTIoN DISPoSAlS 2015
lISTED EqUITIES (CoNTINUED)HyUNDAI wIA CoRP – 111 – 44 67
IHH HEAlTHCARE BHD – 17,166 – 6,866 10,300
IJM CoRP BHD – 10,666 10,666 8,532 12,800
IND ﹠ CoMM BK oF CHINA – H 718,366 213,906 – 646,108 286,164
INDoCEMENT TUNggAl PRAKARSA – 10,334 – 4,134 6,200
INDoFooD CBP SUKSES MAKMUR T – 8,166 – 3,266 4,900
INDoFooD SUKSES MAKMUR TBK P – 30,832 – 12,332 18,500
INDoRAMA VENTURES PCl (FR) – 10,166 – 4,066 6,100
INDoRAMA VENTURES PCl (lR) – 10,166 – 10,166 –
INDUSTRIAl BANK oF KoREA – 1,954 – 782 1,172
INNER MoNgolIA yITAI CoAl – B – 7,500 – 7,500 –
INNolUX CoRP – 60,000 – 24,000 36,000
INoTERA MEMoRIES INC – 16,666 – 6,666 10,000
INTl CoNTAINER TERM SVCS INC – 3,566 – 1,426 2,140
INVENTEC CoRP – 16,666 – 6,666 10,000
IoI CoRP BHD – 20,334 – 8,134 12,200
IoI PRoPERTIES gRoUP BHD – 10,700 – 4,280 6,420
IRPC PCl – 70,332 – 70,332 –
IRPC PCl – FoREIgN – 70,332 – 28,132 42,200
JARDINE CyClE ﹠ CARRIAgE lTD – 834 – 334 500
JASA MARgA (PERSERo) TBK PT – 14,500 – 5,800 8,700
JD.CoM INC – ADR – 1,145 – 458 687
Jg SUMMIT HolDINgS INC – 17,600 – 7,040 10,560
JIANgSU EXPRESS Co lTD – H – 10,000 – 8,000 2,000
JIANgXI CoPPER Co lTD – H – 10,000 – 4,000 6,000
JollIBEE FooDS CoRPoRATIoN – 3,000 – 1,200 1,800
KAKAo CoRP – 186 – 74 112
KAlBE FARMA TBK PT – 147,998 – 59,200 88,798
KANgwoN lAND INC – 826 – 402 424
KASIKoRNBANK PCl – 4,500 – 2,220 2,280
KASIKoRNBANK PCl – FoREIgN – 8,166 – 4,066 4,100
KB FINANCIAl gRoUP INC 3,763 – – 2,250 1,513
KCC CoRP – 40 – 16 24
KEPCo PlANT SERVICE ﹠ ENgINE – 159 – 64 95
KEPPEl CoRP lTD 13,835 4,090 – 12,790 5,135
KERRy PRoPERTIES lTD – 4,166 – 1,666 2,500
KIA MoToRS CoRP 2,652 740 – 2,341 1,051
KINgSoFT CoRP lTD – 6,666 – 4,666 2,000
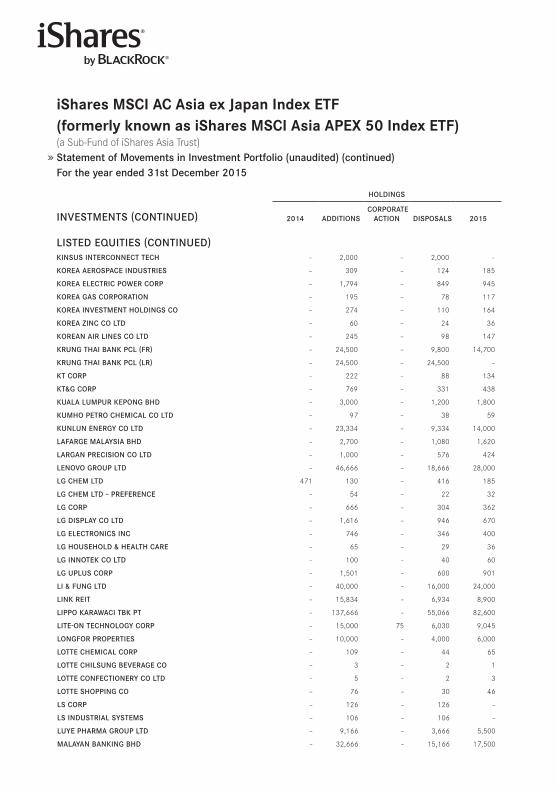
iShares MSCi AC Asia ex Japan index eTf(formerly known as iShares MSCi Asia ApeX 50 index eTf)(a Sub-Fund of iShares Asia Trust) Statement of Movements in Investment Portfolio (unaudited) (continued)For the year ended 31st December 2015
HolDINgS
INVESTMENTS (CoNTINUED) 2014 ADDITIoNS CoRPoRATE
ACTIoN DISPoSAlS 2015
lISTED EqUITIES (CoNTINUED)KINSUS INTERCoNNECT TECH – 2,000 – 2,000 –
KoREA AERoSPACE INDUSTRIES – 309 – 124 185
KoREA ElECTRIC PowER CoRP – 1,794 – 849 945
KoREA gAS CoRPoRATIoN – 195 – 78 117
KoREA INVESTMENT HolDINgS Co – 274 – 110 164
KoREA zINC Co lTD – 60 – 24 36
KoREAN AIR lINES Co lTD – 245 – 98 147
KRUNg THAI BANK PCl (FR) – 24,500 – 9,800 14,700
KRUNg THAI BANK PCl (lR) – 24,500 – 24,500 –
KT CoRP – 222 – 88 134
KT﹠g CoRP – 769 – 331 438
KUAlA lUMPUR KEPoNg BHD – 3,000 – 1,200 1,800
KUMHo PETRo CHEMICAl Co lTD – 97 – 38 59
KUNlUN ENERgy Co lTD – 23,334 – 9,334 14,000
lAFARgE MAlAySIA BHD – 2,700 – 1,080 1,620
lARgAN PRECISIoN Co lTD – 1,000 – 576 424
lENoVo gRoUP lTD – 46,666 – 18,666 28,000
lg CHEM lTD 471 130 – 416 185
lg CHEM lTD – PREFERENCE – 54 – 22 32
lg CoRP – 666 – 304 362
lg DISPlAy Co lTD – 1,616 – 946 670
lg ElECTRoNICS INC – 746 – 346 400
lg HoUSEHolD ﹠ HEAlTH CARE – 65 – 29 36
lg INNoTEK Co lTD – 100 – 40 60
lg UPlUS CoRP – 1,501 – 600 901
lI ﹠ FUNg lTD – 40,000 – 16,000 24,000
lINK REIT – 15,834 – 6,934 8,900
lIPPo KARAwACI TBK PT – 137,666 – 55,066 82,600
lITE-oN TECHNology CoRP – 15,000 75 6,030 9,045
loNgFoR PRoPERTIES – 10,000 – 4,000 6,000
loTTE CHEMICAl CoRP – 109 – 44 65
loTTE CHIlSUNg BEVERAgE Co – 3 – 2 1
loTTE CoNFECTIoNERy Co lTD – 5 – 2 3
loTTE SHoPPINg Co – 76 – 30 46
lS CoRP – 126 – 126 –
lS INDUSTRIAl SySTEMS – 106 – 106 –
lUyE PHARMA gRoUP lTD – 9,166 – 3,666 5,500
MAlAyAN BANKINg BHD – 32,666 – 15,166 17,500
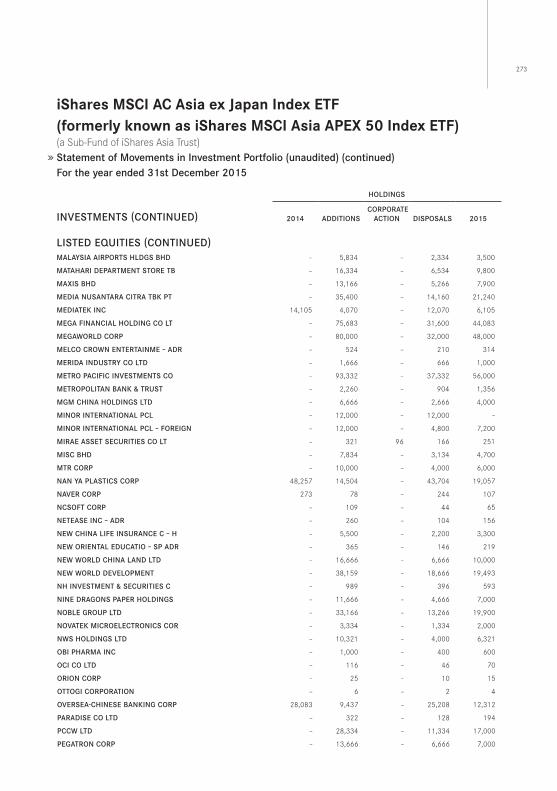
273
iShares MSCi AC Asia ex Japan index eTf(formerly known as iShares MSCi Asia ApeX 50 index eTf)(a Sub-Fund of iShares Asia Trust) Statement of Movements in Investment Portfolio (unaudited) (continued)For the year ended 31st December 2015
HolDINgS
INVESTMENTS (CoNTINUED) 2014 ADDITIoNS CoRPoRATE
ACTIoN DISPoSAlS 2015
lISTED EqUITIES (CoNTINUED)MAlAySIA AIRPoRTS HlDgS BHD – 5,834 – 2,334 3,500
MATAHARI DEPARTMENT SToRE TB – 16,334 – 6,534 9,800
MAXIS BHD – 13,166 – 5,266 7,900
MEDIA NUSANTARA CITRA TBK PT – 35,400 – 14,160 21,240
MEDIATEK INC 14,105 4,070 – 12,070 6,105
MEgA FINANCIAl HolDINg Co lT – 75,683 – 31,600 44,083
MEgAwoRlD CoRP – 80,000 – 32,000 48,000
MElCo CRowN ENTERTAINME – ADR – 524 – 210 314
MERIDA INDUSTRy Co lTD – 1,666 – 666 1,000
METRo PACIFIC INVESTMENTS Co – 93,332 – 37,332 56,000
METRoPolITAN BANK ﹠ TRUST – 2,260 – 904 1,356
MgM CHINA HolDINgS lTD – 6,666 – 2,666 4,000
MINoR INTERNATIoNAl PCl – 12,000 – 12,000 –
MINoR INTERNATIoNAl PCl – FoREIgN – 12,000 – 4,800 7,200
MIRAE ASSET SECURITIES Co lT – 321 96 166 251
MISC BHD – 7,834 – 3,134 4,700
MTR CoRP – 10,000 – 4,000 6,000
NAN yA PlASTICS CoRP 48,257 14,504 – 43,704 19,057
NAVER CoRP 273 78 – 244 107
NCSoFT CoRP – 109 – 44 65
NETEASE INC – ADR – 260 – 104 156
NEw CHINA lIFE INSURANCE C – H – 5,500 – 2,200 3,300
NEw oRIENTAl EDUCATIo – SP ADR – 365 – 146 219
NEw woRlD CHINA lAND lTD – 16,666 – 6,666 10,000
NEw woRlD DEVEloPMENT – 38,159 – 18,666 19,493
NH INVESTMENT ﹠ SECURITIES C – 989 – 396 593
NINE DRAgoNS PAPER HolDINgS – 11,666 – 4,666 7,000
NoBlE gRoUP lTD – 33,166 – 13,266 19,900
NoVATEK MICRoElECTRoNICS CoR – 3,334 – 1,334 2,000
NwS HolDINgS lTD – 10,321 – 4,000 6,321
oBI PHARMA INC – 1,000 – 400 600
oCI Co lTD – 116 – 46 70
oRIoN CoRP – 25 – 10 15
oTTogI CoRPoRATIoN – 6 – 2 4
oVERSEA-CHINESE BANKINg CoRP 28,083 9,437 – 25,208 12,312
PARADISE Co lTD – 322 – 128 194
PCCw lTD – 28,334 – 11,334 17,000
PEgATRoN CoRP – 13,666 – 6,666 7,000
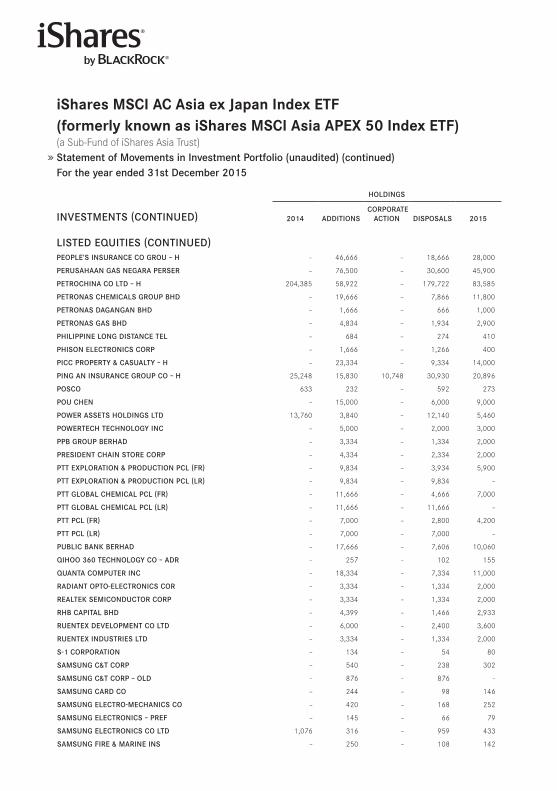
iShares MSCi AC Asia ex Japan index eTf(formerly known as iShares MSCi Asia ApeX 50 index eTf)(a Sub-Fund of iShares Asia Trust) Statement of Movements in Investment Portfolio (unaudited) (continued)For the year ended 31st December 2015
HolDINgS
INVESTMENTS (CoNTINUED) 2014 ADDITIoNS CoRPoRATE
ACTIoN DISPoSAlS 2015
lISTED EqUITIES (CoNTINUED)PEoPlE’S INSURANCE Co gRoU – H – 46,666 – 18,666 28,000
PERUSAHAAN gAS NEgARA PERSER – 76,500 – 30,600 45,900
PETRoCHINA Co lTD – H 204,385 58,922 – 179,722 83,585
PETRoNAS CHEMICAlS gRoUP BHD – 19,666 – 7,866 11,800
PETRoNAS DAgANgAN BHD – 1,666 – 666 1,000
PETRoNAS gAS BHD – 4,834 – 1,934 2,900
PHIlIPPINE loNg DISTANCE TEl – 684 – 274 410
PHISoN ElECTRoNICS CoRP – 1,666 – 1,266 400
PICC PRoPERTy ﹠ CASUAlTy – H – 23,334 – 9,334 14,000
PINg AN INSURANCE gRoUP Co – H 25,248 15,830 10,748 30,930 20,896
PoSCo 633 232 – 592 273
PoU CHEN – 15,000 – 6,000 9,000
PowER ASSETS HolDINgS lTD 13,760 3,840 – 12,140 5,460
PowERTECH TECHNology INC – 5,000 – 2,000 3,000
PPB gRoUP BERHAD – 3,334 – 1,334 2,000
PRESIDENT CHAIN SToRE CoRP – 4,334 – 2,334 2,000
PTT EXPloRATIoN ﹠ PRoDUCTIoN PCl (FR) – 9,834 – 3,934 5,900
PTT EXPloRATIoN ﹠ PRoDUCTIoN PCl (lR) – 9,834 – 9,834 –
PTT gloBAl CHEMICAl PCl (FR) – 11,666 – 4,666 7,000
PTT gloBAl CHEMICAl PCl (lR) – 11,666 – 11,666 –
PTT PCl (FR) – 7,000 – 2,800 4,200
PTT PCl (lR) – 7,000 – 7,000 –
PUBlIC BANK BERHAD – 17,666 – 7,606 10,060
qIHoo 360 TECHNology Co – ADR – 257 – 102 155
qUANTA CoMPUTER INC – 18,334 – 7,334 11,000
RADIANT oPTo-ElECTRoNICS CoR – 3,334 – 1,334 2,000
REAlTEK SEMICoNDUCToR CoRP – 3,334 – 1,334 2,000
RHB CAPITAl BHD – 4,399 – 1,466 2,933
RUENTEX DEVEloPMENT Co lTD – 6,000 – 2,400 3,600
RUENTEX INDUSTRIES lTD – 3,334 – 1,334 2,000
S-1 CoRPoRATIoN – 134 – 54 80
SAMSUNg C﹠T CoRP – 540 – 238 302
SAMSUNg C﹠T CoRP – olD – 876 – 876 –
SAMSUNg CARD Co – 244 – 98 146
SAMSUNg ElECTRo-MECHANICS Co – 420 – 168 252
SAMSUNg ElECTRoNICS – PREF – 145 – 66 79
SAMSUNg ElECTRoNICS Co lTD 1,076 316 – 959 433
SAMSUNg FIRE ﹠ MARINE INS – 250 – 108 142
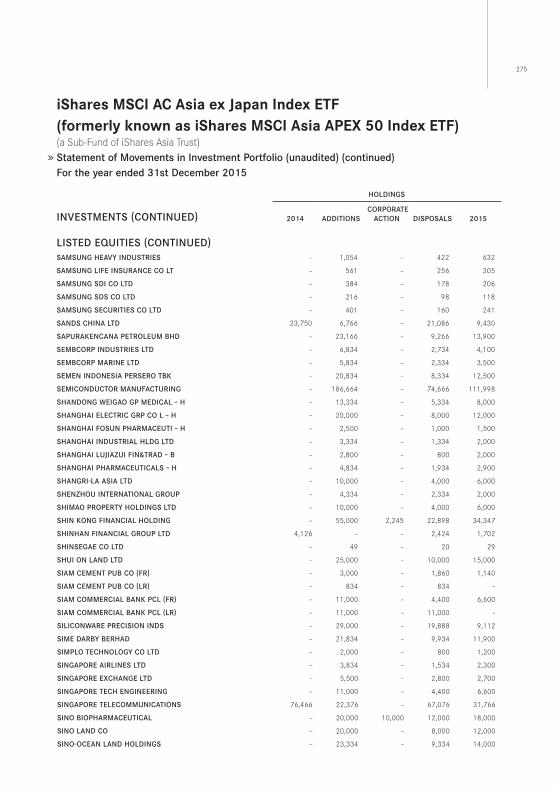
275
iShares MSCi AC Asia ex Japan index eTf(formerly known as iShares MSCi Asia ApeX 50 index eTf)(a Sub-Fund of iShares Asia Trust) Statement of Movements in Investment Portfolio (unaudited) (continued)For the year ended 31st December 2015
HolDINgS
INVESTMENTS (CoNTINUED) 2014 ADDITIoNS CoRPoRATE
ACTIoN DISPoSAlS 2015
lISTED EqUITIES (CoNTINUED)SAMSUNg HEAVy INDUSTRIES – 1,054 – 422 632
SAMSUNg lIFE INSURANCE Co lT – 561 – 256 305
SAMSUNg SDI Co lTD – 384 – 178 206
SAMSUNg SDS Co lTD – 216 – 98 118
SAMSUNg SECURITIES Co lTD – 401 – 160 241
SANDS CHINA lTD 23,750 6,766 – 21,086 9,430
SAPURAKENCANA PETRolEUM BHD – 23,166 – 9,266 13,900
SEMBCoRP INDUSTRIES lTD – 6,834 – 2,734 4,100
SEMBCoRP MARINE lTD – 5,834 – 2,334 3,500
SEMEN INDoNESIA PERSERo TBK – 20,834 – 8,334 12,500
SEMICoNDUCToR MANUFACTURINg – 186,664 – 74,666 111,998
SHANDoNg wEIgAo gP MEDICAl – H – 13,334 – 5,334 8,000
SHANgHAI ElECTRIC gRP Co l – H – 20,000 – 8,000 12,000
SHANgHAI FoSUN PHARMACEUTI – H – 2,500 – 1,000 1,500
SHANgHAI INDUSTRIAl HlDg lTD – 3,334 – 1,334 2,000
SHANgHAI lUJIAzUI FIN﹠TRAD – B – 2,800 – 800 2,000
SHANgHAI PHARMACEUTICAlS – H – 4,834 – 1,934 2,900
SHANgRI-lA ASIA lTD – 10,000 – 4,000 6,000
SHENzHoU INTERNATIoNAl gRoUP – 4,334 – 2,334 2,000
SHIMAo PRoPERTy HolDINgS lTD – 10,000 – 4,000 6,000
SHIN KoNg FINANCIAl HolDINg – 55,000 2,245 22,898 34,347
SHINHAN FINANCIAl gRoUP lTD 4,126 – – 2,424 1,702
SHINSEgAE Co lTD – 49 – 20 29
SHUI oN lAND lTD – 25,000 – 10,000 15,000
SIAM CEMENT PUB Co (FR) – 3,000 – 1,860 1,140
SIAM CEMENT PUB Co (lR) – 834 – 834 –
SIAM CoMMERCIAl BANK PCl (FR) – 11,000 – 4,400 6,600
SIAM CoMMERCIAl BANK PCl (lR) – 11,000 – 11,000 –
SIlICoNwARE PRECISIoN INDS – 29,000 – 19,888 9,112
SIME DARBy BERHAD – 21,834 – 9,934 11,900
SIMPlo TECHNology Co lTD – 2,000 – 800 1,200
SINgAPoRE AIRlINES lTD – 3,834 – 1,534 2,300
SINgAPoRE EXCHANgE lTD – 5,500 – 2,800 2,700
SINgAPoRE TECH ENgINEERINg – 11,000 – 4,400 6,600
SINgAPoRE TElECoMMUNICATIoNS 76,466 22,376 – 67,076 31,766
SINo BIoPHARMACEUTICAl – 20,000 10,000 12,000 18,000
SINo lAND Co – 20,000 – 8,000 12,000
SINo-oCEAN lAND HolDINgS – 23,334 – 9,334 14,000
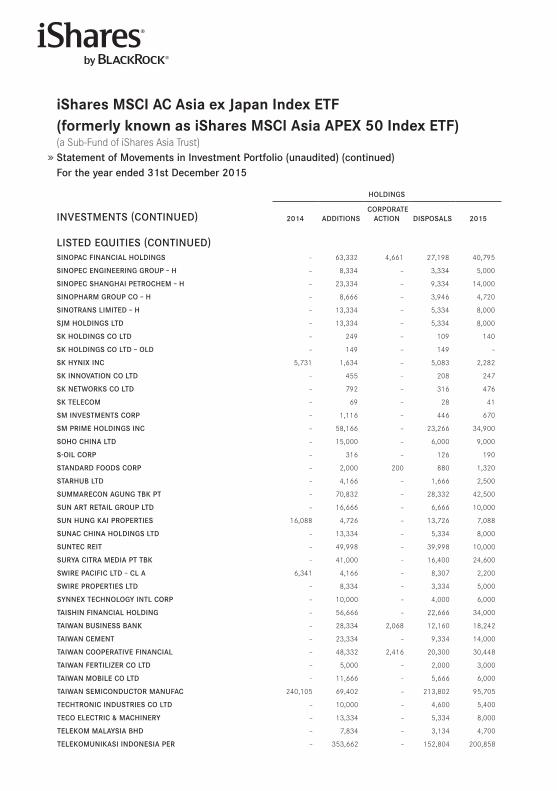
iShares MSCi AC Asia ex Japan index eTf(formerly known as iShares MSCi Asia ApeX 50 index eTf)(a Sub-Fund of iShares Asia Trust) Statement of Movements in Investment Portfolio (unaudited) (continued)For the year ended 31st December 2015
HolDINgS
INVESTMENTS (CoNTINUED) 2014 ADDITIoNS CoRPoRATE
ACTIoN DISPoSAlS 2015
lISTED EqUITIES (CoNTINUED)SINoPAC FINANCIAl HolDINgS – 63,332 4,661 27,198 40,795
SINoPEC ENgINEERINg gRoUP – H – 8,334 – 3,334 5,000
SINoPEC SHANgHAI PETRoCHEM – H – 23,334 – 9,334 14,000
SINoPHARM gRoUP Co – H – 8,666 – 3,946 4,720
SINoTRANS lIMITED – H – 13,334 – 5,334 8,000
SJM HolDINgS lTD – 13,334 – 5,334 8,000
SK HolDINgS Co lTD – 249 – 109 140
SK HolDINgS Co lTD – olD – 149 – 149 –
SK HyNIX INC 5,731 1,634 – 5,083 2,282
SK INNoVATIoN Co lTD – 455 – 208 247
SK NETwoRKS Co lTD – 792 – 316 476
SK TElECoM – 69 – 28 41
SM INVESTMENTS CoRP – 1,116 – 446 670
SM PRIME HolDINgS INC – 58,166 – 23,266 34,900
SoHo CHINA lTD – 15,000 – 6,000 9,000
S-oIl CoRP – 316 – 126 190
STANDARD FooDS CoRP – 2,000 200 880 1,320
STARHUB lTD – 4,166 – 1,666 2,500
SUMMARECoN AgUNg TBK PT – 70,832 – 28,332 42,500
SUN ART RETAIl gRoUP lTD – 16,666 – 6,666 10,000
SUN HUNg KAI PRoPERTIES 16,088 4,726 – 13,726 7,088
SUNAC CHINA HolDINgS lTD – 13,334 – 5,334 8,000
SUNTEC REIT – 49,998 – 39,998 10,000
SURyA CITRA MEDIA PT TBK – 41,000 – 16,400 24,600
SwIRE PACIFIC lTD – Cl A 6,341 4,166 – 8,307 2,200
SwIRE PRoPERTIES lTD – 8,334 – 3,334 5,000
SyNNEX TECHNology INTl CoRP – 10,000 – 4,000 6,000
TAISHIN FINANCIAl HolDINg – 56,666 – 22,666 34,000
TAIwAN BUSINESS BANK – 28,334 2,068 12,160 18,242
TAIwAN CEMENT – 23,334 – 9,334 14,000
TAIwAN CooPERATIVE FINANCIAl – 48,332 2,416 20,300 30,448
TAIwAN FERTIlIzER Co lTD – 5,000 – 2,000 3,000
TAIwAN MoBIlE Co lTD – 11,666 – 5,666 6,000
TAIwAN SEMICoNDUCToR MANUFAC 240,105 69,402 – 213,802 95,705
TECHTRoNIC INDUSTRIES Co lTD – 10,000 – 4,600 5,400
TECo ElECTRIC ﹠ MACHINERy – 13,334 – 5,334 8,000
TElEKoM MAlAySIA BHD – 7,834 – 3,134 4,700
TElEKoMUNIKASI INDoNESIA PER – 353,662 – 152,804 200,858
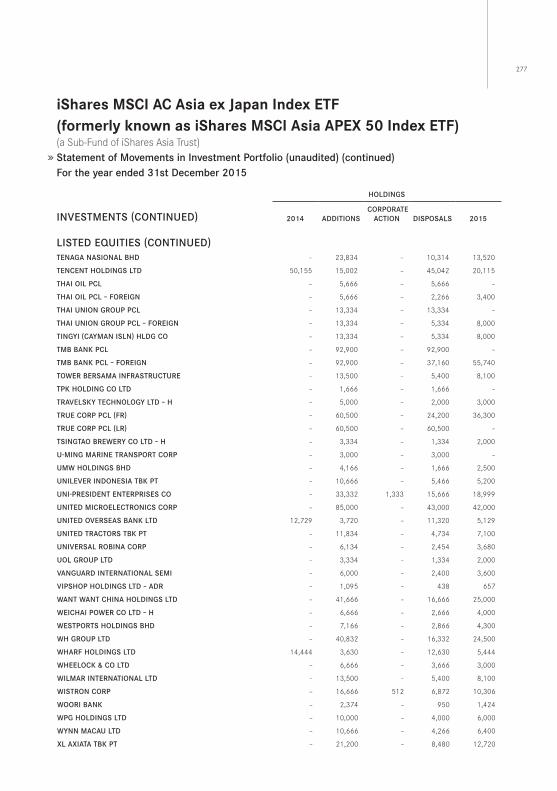
277
iShares MSCi AC Asia ex Japan index eTf(formerly known as iShares MSCi Asia ApeX 50 index eTf)(a Sub-Fund of iShares Asia Trust) Statement of Movements in Investment Portfolio (unaudited) (continued)For the year ended 31st December 2015
HolDINgS
INVESTMENTS (CoNTINUED) 2014 ADDITIoNS CoRPoRATE
ACTIoN DISPoSAlS 2015
lISTED EqUITIES (CoNTINUED)TENAgA NASIoNAl BHD – 23,834 – 10,314 13,520
TENCENT HolDINgS lTD 50,155 15,002 – 45,042 20,115
THAI oIl PCl – 5,666 – 5,666 –
THAI oIl PCl – FoREIgN – 5,666 – 2,266 3,400
THAI UNIoN gRoUP PCl – 13,334 – 13,334 –
THAI UNIoN gRoUP PCl – FoREIgN – 13,334 – 5,334 8,000
TINgyI (CAyMAN ISlN) HlDg Co – 13,334 – 5,334 8,000
TMB BANK PCl – 92,900 – 92,900 –
TMB BANK PCl – FoREIgN – 92,900 – 37,160 55,740
TowER BERSAMA INFRASTRUCTURE – 13,500 – 5,400 8,100
TPK HolDINg Co lTD – 1,666 – 1,666 –
TRAVElSKy TECHNology lTD – H – 5,000 – 2,000 3,000
TRUE CoRP PCl (FR) – 60,500 – 24,200 36,300
TRUE CoRP PCl (lR) – 60,500 – 60,500 –
TSINgTAo BREwERy Co lTD – H – 3,334 – 1,334 2,000
U-MINg MARINE TRANSPoRT CoRP – 3,000 – 3,000 –
UMw HolDINgS BHD – 4,166 – 1,666 2,500
UNIlEVER INDoNESIA TBK PT – 10,666 – 5,466 5,200
UNI-PRESIDENT ENTERPRISES Co – 33,332 1,333 15,666 18,999
UNITED MICRoElECTRoNICS CoRP – 85,000 – 43,000 42,000
UNITED oVERSEAS BANK lTD 12,729 3,720 – 11,320 5,129
UNITED TRACToRS TBK PT – 11,834 – 4,734 7,100
UNIVERSAl RoBINA CoRP – 6,134 – 2,454 3,680
Uol gRoUP lTD – 3,334 – 1,334 2,000
VANgUARD INTERNATIoNAl SEMI – 6,000 – 2,400 3,600
VIPSHoP HolDINgS lTD – ADR – 1,095 – 438 657
wANT wANT CHINA HolDINgS lTD – 41,666 – 16,666 25,000
wEICHAI PowER Co lTD – H – 6,666 – 2,666 4,000
wESTPoRTS HolDINgS BHD – 7,166 – 2,866 4,300
wH gRoUP lTD – 40,832 – 16,332 24,500
wHARF HolDINgS lTD 14,444 3,630 – 12,630 5,444
wHEEloCK ﹠ Co lTD – 6,666 – 3,666 3,000
wIlMAR INTERNATIoNAl lTD – 13,500 – 5,400 8,100
wISTRoN CoRP – 16,666 512 6,872 10,306
wooRI BANK – 2,374 – 950 1,424
wPg HolDINgS lTD – 10,000 – 4,000 6,000
wyNN MACAU lTD – 10,666 – 4,266 6,400
Xl AXIATA TBK PT – 21,200 – 8,480 12,720
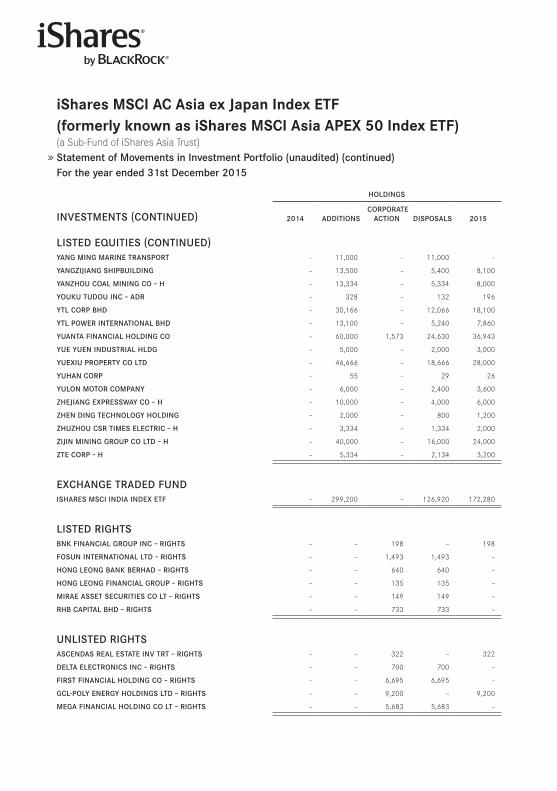
iShares MSCi AC Asia ex Japan index eTf(formerly known as iShares MSCi Asia ApeX 50 index eTf)(a Sub-Fund of iShares Asia Trust) Statement of Movements in Investment Portfolio (unaudited) (continued)For the year ended 31st December 2015
HolDINgS
INVESTMENTS (CoNTINUED) 2014 ADDITIoNS CoRPoRATE
ACTIoN DISPoSAlS 2015
lISTED EqUITIES (CoNTINUED)yANg MINg MARINE TRANSPoRT – 11,000 – 11,000 –
yANgzIJIANg SHIPBUIlDINg – 13,500 – 5,400 8,100
yANzHoU CoAl MININg Co – H – 13,334 – 5,334 8,000
yoUKU TUDoU INC – ADR – 328 – 132 196
yTl CoRP BHD – 30,166 – 12,066 18,100
yTl PowER INTERNATIoNAl BHD – 13,100 – 5,240 7,860
yUANTA FINANCIAl HolDINg Co – 60,000 1,573 24,630 36,943
yUE yUEN INDUSTRIAl HlDg – 5,000 – 2,000 3,000
yUEXIU PRoPERTy Co lTD – 46,666 – 18,666 28,000
yUHAN CoRP – 55 – 29 26
yUloN MoToR CoMPANy – 6,000 – 2,400 3,600
zHEJIANg EXPRESSwAy Co – H – 10,000 – 4,000 6,000
zHEN DINg TECHNology HolDINg – 2,000 – 800 1,200
zHUzHoU CSR TIMES ElECTRIC – H – 3,334 – 1,334 2,000
zIJIN MININg gRoUP Co lTD – H – 40,000 – 16,000 24,000
zTE CoRP – H – 5,334 – 2,134 3,200
EXCHANgE TRADED FUNDISHARES MSCI INDIA INDEX ETF – 299,200 – 126,920 172,280
lISTED RIgHTSBNK FINANCIAl gRoUP INC – RIgHTS – – 198 – 198
FoSUN INTERNATIoNAl lTD – RIgHTS – – 1,493 1,493 –
HoNg lEoNg BANK BERHAD – RIgHTS – – 640 640 –
HoNg lEoNg FINANCIAl gRoUP – RIgHTS – – 135 135 –
MIRAE ASSET SECURITIES Co lT – RIgHTS – – 149 149 –
RHB CAPITAl BHD – RIgHTS – – 733 733 –
UNlISTED RIgHTSASCENDAS REAl ESTATE INV TRT – RIgHTS – – 322 – 322
DElTA ElECTRoNICS INC – RIgHTS – – 700 700 –
FIRST FINANCIAl HolDINg Co – RIgHTS – – 6,695 6,695 –
gCl-Poly ENERgy HolDINgS lTD – RIgHTS – – 9,200 – 9,200
MEgA FINANCIAl HolDINg Co lT – RIgHTS – – 5,683 5,683 –
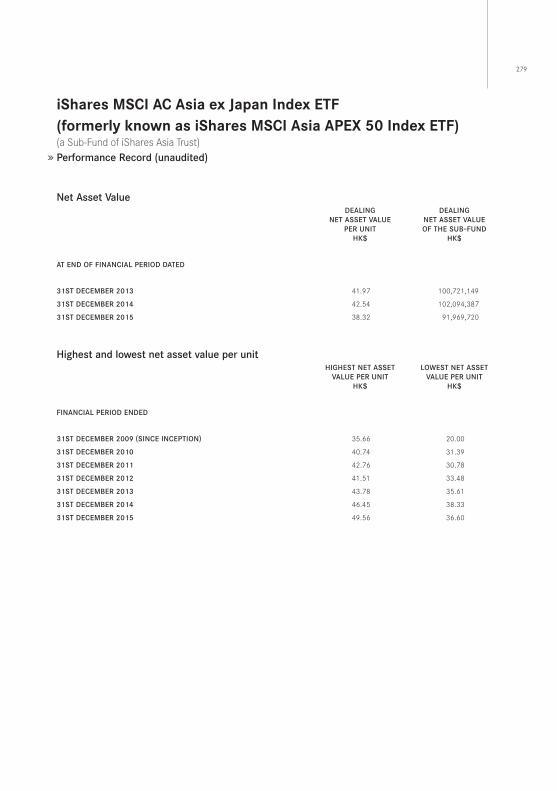
279
iShares MSCi AC Asia ex Japan index eTf(formerly known as iShares MSCi Asia ApeX 50 index eTf)(a Sub-Fund of iShares Asia Trust) Performance Record (unaudited)
Net Asset ValueDEAlINg
NET ASSET VAlUE PER UNIT
HK$
DEAlINgNET ASSET VAlUE oF THE SUB–FUND
HK$
AT END oF FINANCIAl PERIoD DATED
31ST DECEMBER 2013 41 .97 100,721,149
31ST DECEMBER 2014 42 .54 102,094,387
31ST DECEMBER 2015 38 .32 91,969,720
Highest and lowest net asset value per unitHIgHEST NET ASSET
VAlUE PER UNITHK$
lowEST NET ASSETVAlUE PER UNIT
HK$
FINANCIAl PERIoD ENDED
31ST DECEMBER 2009 (SINCE INCEPTIoN) 35 .66 20 .00
31ST DECEMBER 2010 40 .74 31 .39
31ST DECEMBER 2011 42 .76 30 .78
31ST DECEMBER 2012 41 .51 33 .48
31ST DECEMBER 2013 43 .78 35 .61
31ST DECEMBER 2014 46 .45 38 .33
31ST DECEMBER 2015 49 .56 36 .60
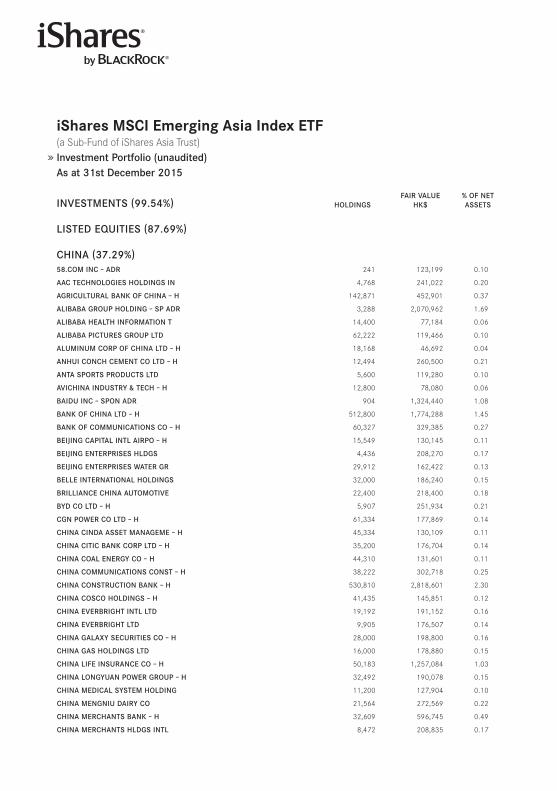
iShares MSCi emerging Asia index eTf(a Sub-Fund of iShares Asia Trust) Investment Portfolio (unaudited)As at 31st December 2015
INVESTMENTS (99.54%) HolDINgSFAIR VAlUE
HK$% oF NET ASSETS
lISTED EqUITIES (87.69%)
CHINA (37.29%)58.CoM INC – ADR 241 123,199 0 .10
AAC TECHNologIES HolDINgS IN 4,768 241,022 0 .20
AgRICUlTURAl BANK oF CHINA – H 142,871 452,901 0 .37
AlIBABA gRoUP HolDINg – SP ADR 3,288 2,070,962 1 .69
AlIBABA HEAlTH INFoRMATIoN T 14,400 77,184 0 .06
AlIBABA PICTURES gRoUP lTD 62,222 119,466 0 .10
AlUMINUM CoRP oF CHINA lTD – H 18,168 46,692 0 .04
ANHUI CoNCH CEMENT Co lTD – H 12,494 260,500 0 .21
ANTA SPoRTS PRoDUCTS lTD 5,600 119,280 0 .10
AVICHINA INDUSTRy ﹠ TECH – H 12,800 78,080 0 .06
BAIDU INC – SPoN ADR 904 1,324,440 1 .08
BANK oF CHINA lTD – H 512,800 1,774,288 1 .45
BANK oF CoMMUNICATIoNS Co – H 60,327 329,385 0 .27
BEIJINg CAPITAl INTl AIRPo – H 15,549 130,145 0 .11
BEIJINg ENTERPRISES HlDgS 4,436 208,270 0 .17
BEIJINg ENTERPRISES wATER gR 29,912 162,422 0 .13
BEllE INTERNATIoNAl HolDINgS 32,000 186,240 0 .15
BRIllIANCE CHINA AUToMoTIVE 22,400 218,400 0 .18
ByD Co lTD – H 5,907 251,934 0 .21
CgN PowER Co lTD – H 61,334 177,869 0 .14
CHINA CINDA ASSET MANAgEME – H 45,334 130,109 0 .11
CHINA CITIC BANK CoRP lTD – H 35,200 176,704 0 .14
CHINA CoAl ENERgy Co – H 44,310 131,601 0 .11
CHINA CoMMUNICATIoNS CoNST – H 38,222 302,718 0 .25
CHINA CoNSTRUCTIoN BANK – H 530,810 2,818,601 2 .30
CHINA CoSCo HolDINgS – H 41,435 145,851 0 .12
CHINA EVERBRIgHT INTl lTD 19,192 191,152 0 .16
CHINA EVERBRIgHT lTD 9,905 176,507 0 .14
CHINA gAlAXy SECURITIES Co – H 28,000 198,800 0 .16
CHINA gAS HolDINgS lTD 16,000 178,880 0 .15
CHINA lIFE INSURANCE Co – H 50,183 1,257,084 1 .03
CHINA loNgyUAN PowER gRoUP – H 32,492 190,078 0 .15
CHINA MEDICAl SySTEM HolDINg 11,200 127,904 0 .10
CHINA MENgNIU DAIRy Co 21,564 272,569 0 .22
CHINA MERCHANTS BANK – H 32,609 596,745 0 .49
CHINA MERCHANTS HlDgS INTl 8,472 208,835 0 .17
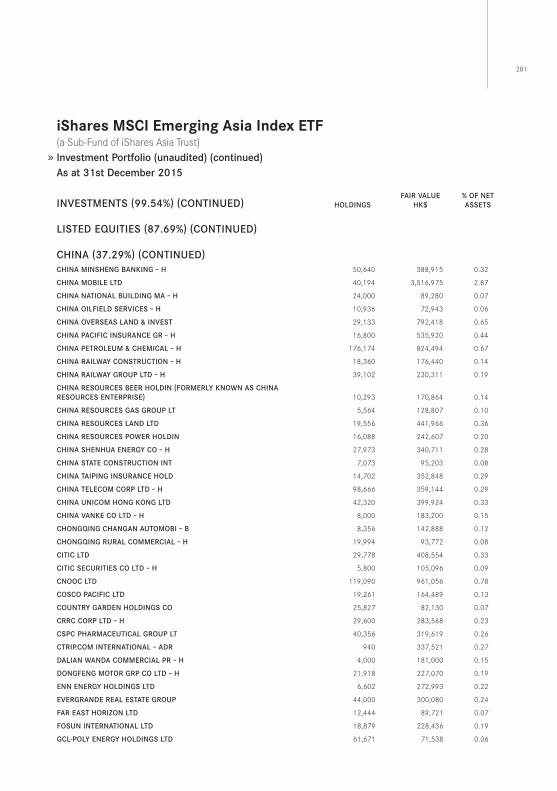
281
iShares MSCi emerging Asia index eTf(a Sub-Fund of iShares Asia Trust) Investment Portfolio (unaudited) (continued)As at 31st December 2015
INVESTMENTS (99.54%) (CoNTINUED) HolDINgSFAIR VAlUE
HK$% oF NET ASSETS
lISTED EqUITIES (87.69%) (CoNTINUED)
CHINA (37.29%) (CoNTINUED)CHINA MINSHENg BANKINg – H 50,640 388,915 0 .32
CHINA MoBIlE lTD 40,194 3,516,975 2 .87
CHINA NATIoNAl BUIlDINg MA – H 24,000 89,280 0 .07
CHINA oIlFIElD SERVICES – H 10,936 72,943 0 .06
CHINA oVERSEAS lAND ﹠ INVEST 29,133 792,418 0 .65
CHINA PACIFIC INSURANCE gR – H 16,800 535,920 0 .44
CHINA PETRolEUM ﹠ CHEMICAl – H 176,174 824,494 0 .67
CHINA RAIlwAy CoNSTRUCTIoN – H 18,360 176,440 0 .14
CHINA RAIlwAy gRoUP lTD – H 39,102 230,311 0 .19
CHINA RESoURCES BEER HolDIN (FoRMERly KNowN AS CHINA RESoURCES ENTERPRISE) 10,293 170,864 0 .14
CHINA RESoURCES gAS gRoUP lT 5,564 128,807 0 .10
CHINA RESoURCES lAND lTD 19,556 441,966 0 .36
CHINA RESoURCES PowER HolDIN 16,088 242,607 0 .20
CHINA SHENHUA ENERgy Co – H 27,973 340,711 0 .28
CHINA STATE CoNSTRUCTIoN INT 7,073 95,203 0 .08
CHINA TAIPINg INSURANCE HolD 14,702 352,848 0 .29
CHINA TElECoM CoRP lTD – H 98,666 359,144 0 .29
CHINA UNICoM HoNg KoNg lTD 42,320 399,924 0 .33
CHINA VANKE Co lTD – H 8,000 183,200 0 .15
CHoNgqINg CHANgAN AUToMoBI – B 8,356 142,888 0 .12
CHoNgqINg RURAl CoMMERCIAl – H 19,994 93,772 0 .08
CITIC lTD 29,778 408,554 0 .33
CITIC SECURITIES Co lTD – H 5,800 105,096 0 .09
CNooC lTD 119,090 961,056 0 .78
CoSCo PACIFIC lTD 19,261 164,489 0 .13
CoUNTRy gARDEN HolDINgS Co 25,827 82,130 0 .07
CRRC CoRP lTD – H 29,600 283,568 0 .23
CSPC PHARMACEUTICAl gRoUP lT 40,356 319,619 0 .26
CTRIP.CoM INTERNATIoNAl – ADR 940 337,521 0 .27
DAlIAN wANDA CoMMERCIAl PR – H 4,000 181,000 0 .15
DoNgFENg MoToR gRP Co lTD – H 21,918 227,070 0 .19
ENN ENERgy HolDINgS lTD 6,602 272,993 0 .22
EVERgRANDE REAl ESTATE gRoUP 44,000 300,080 0 .24
FAR EAST HoRIzoN lTD 12,444 89,721 0 .07
FoSUN INTERNATIoNAl lTD 18,879 228,436 0 .19
gCl-Poly ENERgy HolDINgS lTD 61,671 71,538 0 .06
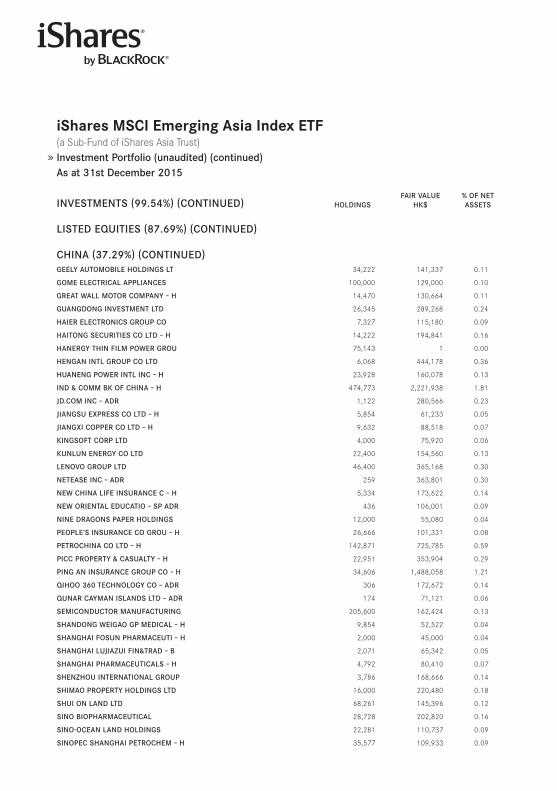
iShares MSCi emerging Asia index eTf(a Sub-Fund of iShares Asia Trust) Investment Portfolio (unaudited) (continued)As at 31st December 2015
INVESTMENTS (99.54%) (CoNTINUED) HolDINgSFAIR VAlUE
HK$% oF NET ASSETS
lISTED EqUITIES (87.69%) (CoNTINUED)
CHINA (37.29%) (CoNTINUED)gEEly AUToMoBIlE HolDINgS lT 34,222 141,337 0 .11
goME ElECTRICAl APPlIANCES 100,000 129,000 0 .10
gREAT wAll MoToR CoMPANy – H 14,470 130,664 0 .11
gUANgDoNg INVESTMENT lTD 26,345 289,268 0 .24
HAIER ElECTRoNICS gRoUP Co 7,327 115,180 0 .09
HAIToNg SECURITIES Co lTD – H 14,222 194,841 0 .16
HANERgy THIN FIlM PowER gRoU 75,143 1 0 .00
HENgAN INTl gRoUP Co lTD 6,068 444,178 0 .36
HUANENg PowER INTl INC – H 23,928 160,078 0 .13
IND ﹠ CoMM BK oF CHINA – H 474,773 2,221,938 1 .81
JD.CoM INC – ADR 1,122 280,566 0 .23
JIANgSU EXPRESS Co lTD – H 5,854 61,233 0 .05
JIANgXI CoPPER Co lTD – H 9,632 88,518 0 .07
KINgSoFT CoRP lTD 4,000 75,920 0 .06
KUNlUN ENERgy Co lTD 22,400 154,560 0 .13
lENoVo gRoUP lTD 46,400 365,168 0 .30
NETEASE INC – ADR 259 363,801 0 .30
NEw CHINA lIFE INSURANCE C – H 5,334 173,622 0 .14
NEw oRIENTAl EDUCATIo – SP ADR 436 106,001 0 .09
NINE DRAgoNS PAPER HolDINgS 12,000 55,080 0 .04
PEoPlE’S INSURANCE Co gRoU – H 26,666 101,331 0 .08
PETRoCHINA Co lTD – H 142,871 725,785 0 .59
PICC PRoPERTy ﹠ CASUAlTy – H 22,951 353,904 0 .29
PINg AN INSURANCE gRoUP Co – H 34,606 1,488,058 1 .21
qIHoo 360 TECHNology Co – ADR 306 172,672 0 .14
qUNAR CAyMAN ISlANDS lTD – ADR 174 71,121 0 .06
SEMICoNDUCToR MANUFACTURINg 205,600 162,424 0 .13
SHANDoNg wEIgAo gP MEDICAl – H 9,854 52,522 0 .04
SHANgHAI FoSUN PHARMACEUTI – H 2,000 45,000 0 .04
SHANgHAI lUJIAzUI FIN﹠TRAD – B 2,071 65,342 0 .05
SHANgHAI PHARMACEUTICAlS – H 4,792 80,410 0 .07
SHENzHoU INTERNATIoNAl gRoUP 3,786 168,666 0 .14
SHIMAo PRoPERTy HolDINgS lTD 16,000 220,480 0 .18
SHUI oN lAND lTD 68,261 145,396 0 .12
SINo BIoPHARMACEUTICAl 28,728 202,820 0 .16
SINo-oCEAN lAND HolDINgS 22,281 110,737 0 .09
SINoPEC SHANgHAI PETRoCHEM – H 35,577 109,933 0 .09
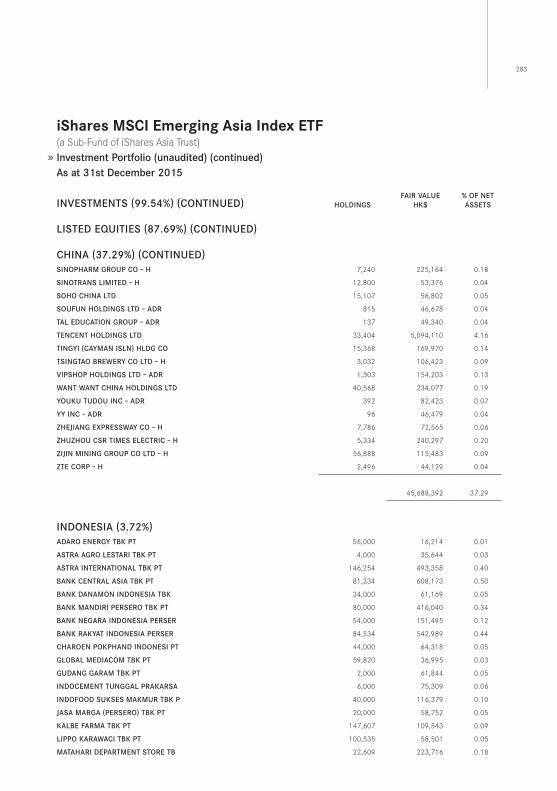
283
iShares MSCi emerging Asia index eTf(a Sub-Fund of iShares Asia Trust) Investment Portfolio (unaudited) (continued)As at 31st December 2015
INVESTMENTS (99.54%) (CoNTINUED) HolDINgSFAIR VAlUE
HK$% oF NET ASSETS
lISTED EqUITIES (87.69%) (CoNTINUED)
CHINA (37.29%) (CoNTINUED)SINoPHARM gRoUP Co – H 7,240 225,164 0 .18
SINoTRANS lIMITED – H 12,800 53,376 0 .04
SoHo CHINA lTD 15,107 56,802 0 .05
SoUFUN HolDINgS lTD – ADR 815 46,678 0 .04
TAl EDUCATIoN gRoUP – ADR 137 49,340 0 .04
TENCENT HolDINgS lTD 33,404 5,094,110 4 .16
TINgyI (CAyMAN ISlN) HlDg Co 15,368 169,970 0 .14
TSINgTAo BREwERy Co lTD – H 3,032 106,423 0 .09
VIPSHoP HolDINgS lTD – ADR 1,303 154,203 0 .13
wANT wANT CHINA HolDINgS lTD 40,568 234,077 0 .19
yoUKU TUDoU INC – ADR 392 82,423 0 .07
yy INC – ADR 96 46,479 0 .04
zHEJIANg EXPRESSwAy Co – H 7,786 72,565 0 .06
zHUzHoU CSR TIMES ElECTRIC – H 5,334 240,297 0 .20
zIJIN MININg gRoUP Co lTD – H 56,888 115,483 0 .09
zTE CoRP – H 2,496 44,129 0 .04
45,688,392 37 .29
INDoNESIA (3.72%)ADARo ENERgy TBK PT 56,000 16,214 0 .01
ASTRA AgRo lESTARI TBK PT 4,000 35,644 0 .03
ASTRA INTERNATIoNAl TBK PT 146,254 493,358 0 .40
BANK CENTRAl ASIA TBK PT 81,334 608,173 0 .50
BANK DANAMoN INDoNESIA TBK 34,000 61,169 0 .05
BANK MANDIRI PERSERo TBK PT 80,000 416,040 0 .34
BANK NEgARA INDoNESIA PERSER 54,000 151,495 0 .12
BANK RAKyAT INDoNESIA PERSER 84,534 542,989 0 .44
CHARoEN PoKPHAND INDoNESI PT 44,000 64,318 0 .05
gloBAl MEDIACoM TBK PT 59,820 36,995 0 .03
gUDANg gARAM TBK PT 2,000 61,844 0 .05
INDoCEMENT TUNggAl PRAKARSA 6,000 75,309 0 .06
INDoFooD SUKSES MAKMUR TBK P 40,000 116,379 0 .10
JASA MARgA (PERSERo) TBK PT 20,000 58,752 0 .05
KAlBE FARMA TBK PT 147,607 109,543 0 .09
lIPPo KARAwACI TBK PT 100,535 58,501 0 .05
MATAHARI DEPARTMENT SToRE TB 22,609 223,716 0 .18
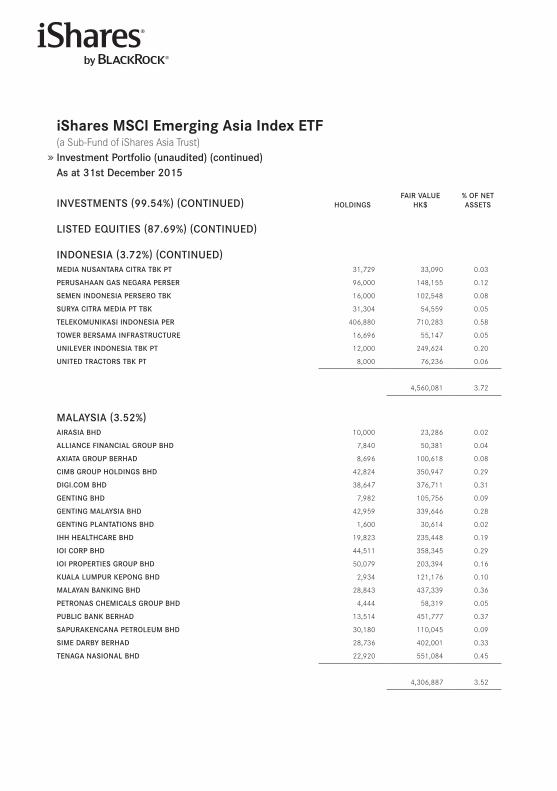
iShares MSCi emerging Asia index eTf(a Sub-Fund of iShares Asia Trust) Investment Portfolio (unaudited) (continued)As at 31st December 2015
INVESTMENTS (99.54%) (CoNTINUED) HolDINgSFAIR VAlUE
HK$% oF NET ASSETS
lISTED EqUITIES (87.69%) (CoNTINUED)
INDoNESIA (3.72%) (CoNTINUED)MEDIA NUSANTARA CITRA TBK PT 31,729 33,090 0 .03
PERUSAHAAN gAS NEgARA PERSER 96,000 148,155 0 .12
SEMEN INDoNESIA PERSERo TBK 16,000 102,548 0 .08
SURyA CITRA MEDIA PT TBK 31,304 54,559 0 .05
TElEKoMUNIKASI INDoNESIA PER 406,880 710,283 0 .58
TowER BERSAMA INFRASTRUCTURE 16,696 55,147 0 .05
UNIlEVER INDoNESIA TBK PT 12,000 249,624 0 .20
UNITED TRACToRS TBK PT 8,000 76,236 0 .06
4,560,081 3 .72
MAlAySIA (3.52%)AIRASIA BHD 10,000 23,286 0 .02
AllIANCE FINANCIAl gRoUP BHD 7,840 50,381 0 .04
AXIATA gRoUP BERHAD 8,696 100,618 0 .08
CIMB gRoUP HolDINgS BHD 42,824 350,947 0 .29
DIgI.CoM BHD 38,647 376,711 0 .31
gENTINg BHD 7,982 105,756 0 .09
gENTINg MAlAySIA BHD 42,959 339,646 0 .28
gENTINg PlANTATIoNS BHD 1,600 30,614 0 .02
IHH HEAlTHCARE BHD 19,823 235,448 0 .19
IoI CoRP BHD 44,511 358,345 0 .29
IoI PRoPERTIES gRoUP BHD 50,079 203,394 0 .16
KUAlA lUMPUR KEPoNg BHD 2,934 121,176 0 .10
MAlAyAN BANKINg BHD 28,843 437,339 0 .36
PETRoNAS CHEMICAlS gRoUP BHD 4,444 58,319 0 .05
PUBlIC BANK BERHAD 13,514 451,777 0 .37
SAPURAKENCANA PETRolEUM BHD 30,180 110,045 0 .09
SIME DARBy BERHAD 28,736 402,001 0 .33
TENAgA NASIoNAl BHD 22,920 551,084 0 .45
4,306,887 3 .52
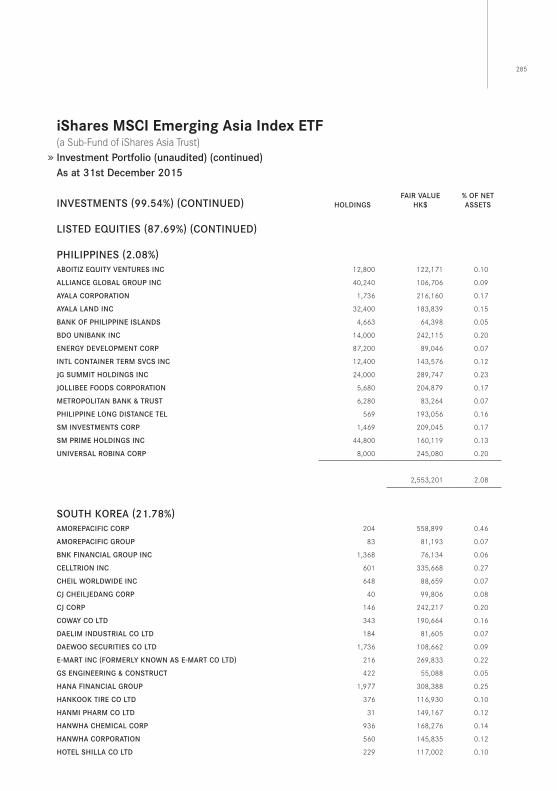
285
iShares MSCi emerging Asia index eTf(a Sub-Fund of iShares Asia Trust) Investment Portfolio (unaudited) (continued)As at 31st December 2015
INVESTMENTS (99.54%) (CoNTINUED) HolDINgSFAIR VAlUE
HK$% oF NET ASSETS
lISTED EqUITIES (87.69%) (CoNTINUED)
PHIlIPPINES (2.08%)ABoITIz EqUITy VENTURES INC 12,800 122,171 0 .10
AllIANCE gloBAl gRoUP INC 40,240 106,706 0 .09
AyAlA CoRPoRATIoN 1,736 216,160 0 .17
AyAlA lAND INC 32,400 183,839 0 .15
BANK oF PHIlIPPINE ISlANDS 4,663 64,398 0 .05
BDo UNIBANK INC 14,000 242,115 0 .20
ENERgy DEVEloPMENT CoRP 87,200 89,046 0 .07
INTl CoNTAINER TERM SVCS INC 12,400 143,576 0 .12
Jg SUMMIT HolDINgS INC 24,000 289,747 0 .23
JollIBEE FooDS CoRPoRATIoN 5,680 204,879 0 .17
METRoPolITAN BANK ﹠ TRUST 6,280 83,264 0 .07
PHIlIPPINE loNg DISTANCE TEl 569 193,056 0 .16
SM INVESTMENTS CoRP 1,469 209,045 0 .17
SM PRIME HolDINgS INC 44,800 160,119 0 .13
UNIVERSAl RoBINA CoRP 8,000 245,080 0 .20
2,553,201 2 .08
SoUTH KoREA (21.78%)AMoREPACIFIC CoRP 204 558,899 0 .46
AMoREPACIFIC gRoUP 83 81,193 0 .07
BNK FINANCIAl gRoUP INC 1,368 76,134 0 .06
CEllTRIoN INC 601 335,668 0 .27
CHEIl woRlDwIDE INC 648 88,659 0 .07
CJ CHEIlJEDANg CoRP 40 99,806 0 .08
CJ CoRP 146 242,217 0 .20
CowAy Co lTD 343 190,664 0 .16
DAElIM INDUSTRIAl Co lTD 184 81,605 0 .07
DAEwoo SECURITIES Co lTD 1,736 108,662 0 .09
E-MART INC (FoRMERly KNowN AS E-MART Co lTD) 216 269,833 0 .22
gS ENgINEERINg ﹠ CoNSTRUCT 422 55,088 0 .05
HANA FINANCIAl gRoUP 1,977 308,388 0 .25
HANKooK TIRE Co lTD 376 116,930 0 .10
HANMI PHARM Co lTD 31 149,167 0 .12
HANwHA CHEMICAl CoRP 936 168,276 0 .14
HANwHA CoRPoRATIoN 560 145,835 0 .12
HoTEl SHIllA Co lTD 229 117,002 0 .10
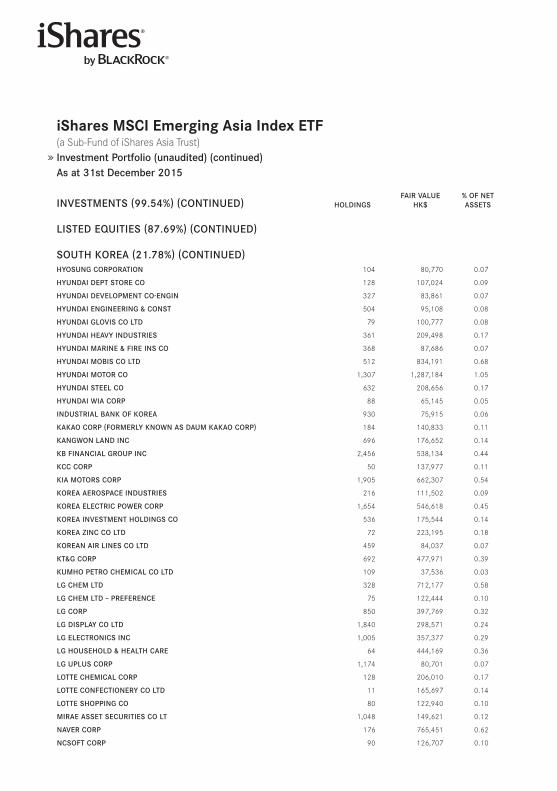
iShares MSCi emerging Asia index eTf(a Sub-Fund of iShares Asia Trust) Investment Portfolio (unaudited) (continued)As at 31st December 2015
INVESTMENTS (99.54%) (CoNTINUED) HolDINgSFAIR VAlUE
HK$% oF NET ASSETS
lISTED EqUITIES (87.69%) (CoNTINUED)
SoUTH KoREA (21.78%) (CoNTINUED)HyoSUNg CoRPoRATIoN 104 80,770 0 .07
HyUNDAI DEPT SToRE Co 128 107,024 0 .09
HyUNDAI DEVEloPMENT Co-ENgIN 327 83,861 0 .07
HyUNDAI ENgINEERINg ﹠ CoNST 504 95,108 0 .08
HyUNDAI gloVIS Co lTD 79 100,777 0 .08
HyUNDAI HEAVy INDUSTRIES 361 209,498 0 .17
HyUNDAI MARINE ﹠ FIRE INS Co 368 87,686 0 .07
HyUNDAI MoBIS Co lTD 512 834,191 0 .68
HyUNDAI MoToR Co 1,307 1,287,184 1 .05
HyUNDAI STEEl Co 632 208,656 0 .17
HyUNDAI wIA CoRP 88 65,145 0 .05
INDUSTRIAl BANK oF KoREA 930 75,915 0 .06
KAKAo CoRP (FoRMERly KNowN AS DAUM KAKAo CoRP) 184 140,833 0 .11
KANgwoN lAND INC 696 176,652 0 .14
KB FINANCIAl gRoUP INC 2,456 538,134 0 .44
KCC CoRP 50 137,977 0 .11
KIA MoToRS CoRP 1,905 662,307 0 .54
KoREA AERoSPACE INDUSTRIES 216 111,502 0 .09
KoREA ElECTRIC PowER CoRP 1,654 546,618 0 .45
KoREA INVESTMENT HolDINgS Co 536 175,544 0 .14
KoREA zINC Co lTD 72 223,195 0 .18
KoREAN AIR lINES Co lTD 459 84,037 0 .07
KT﹠g CoRP 692 477,971 0 .39
KUMHo PETRo CHEMICAl Co lTD 109 37,536 0 .03
lg CHEM lTD 328 712,177 0 .58
lg CHEM lTD – PREFERENCE 75 122,444 0 .10
lg CoRP 850 397,769 0 .32
lg DISPlAy Co lTD 1,840 298,571 0 .24
lg ElECTRoNICS INC 1,005 357,377 0 .29
lg HoUSEHolD ﹠ HEAlTH CARE 64 444,169 0 .36
lg UPlUS CoRP 1,174 80,701 0 .07
loTTE CHEMICAl CoRP 128 206,010 0 .17
loTTE CoNFECTIoNERy Co lTD 11 165,697 0 .14
loTTE SHoPPINg Co 80 122,940 0 .10
MIRAE ASSET SECURITIES Co lT 1,048 149,621 0 .12
NAVER CoRP 176 765,451 0 .62
NCSoFT CoRP 90 126,707 0 .10
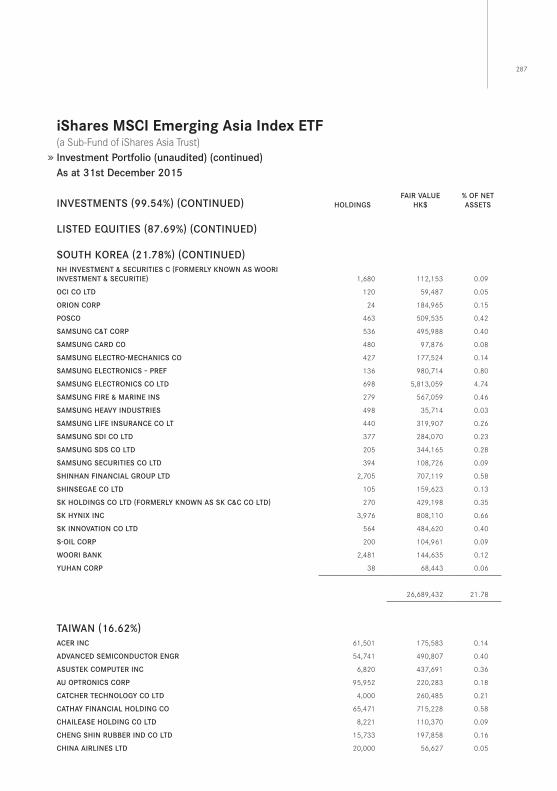
287
iShares MSCi emerging Asia index eTf(a Sub-Fund of iShares Asia Trust) Investment Portfolio (unaudited) (continued)As at 31st December 2015
INVESTMENTS (99.54%) (CoNTINUED) HolDINgSFAIR VAlUE
HK$% oF NET ASSETS
lISTED EqUITIES (87.69%) (CoNTINUED)
SoUTH KoREA (21.78%) (CoNTINUED)NH INVESTMENT ﹠ SECURITIES C (FoRMERly KNowN AS wooRI INVESTMENT ﹠ SECURITIE) 1,680 112,153 0 .09
oCI Co lTD 120 59,487 0 .05
oRIoN CoRP 24 184,965 0 .15
PoSCo 463 509,535 0 .42
SAMSUNg C﹠T CoRP 536 495,988 0 .40
SAMSUNg CARD Co 480 97,876 0 .08
SAMSUNg ElECTRo-MECHANICS Co 427 177,524 0 .14
SAMSUNg ElECTRoNICS – PREF 136 980,714 0 .80
SAMSUNg ElECTRoNICS Co lTD 698 5,813,059 4 .74
SAMSUNg FIRE ﹠ MARINE INS 279 567,059 0 .46
SAMSUNg HEAVy INDUSTRIES 498 35,714 0 .03
SAMSUNg lIFE INSURANCE Co lT 440 319,907 0 .26
SAMSUNg SDI Co lTD 377 284,070 0 .23
SAMSUNg SDS Co lTD 205 344,165 0 .28
SAMSUNg SECURITIES Co lTD 394 108,726 0 .09
SHINHAN FINANCIAl gRoUP lTD 2,705 707,119 0 .58
SHINSEgAE Co lTD 105 159,623 0 .13
SK HolDINgS Co lTD (FoRMERly KNowN AS SK C﹠C Co lTD) 270 429,198 0 .35
SK HyNIX INC 3,976 808,110 0 .66
SK INNoVATIoN Co lTD 564 484,620 0 .40
S-oIl CoRP 200 104,961 0 .09
wooRI BANK 2,481 144,635 0 .12
yUHAN CoRP 38 68,443 0 .06
26,689,432 21 .78
TAIwAN (16.62%)ACER INC 61,501 175,583 0 .14
ADVANCED SEMICoNDUCToR ENgR 54,741 490,807 0 .40
ASUSTEK CoMPUTER INC 6,820 437,691 0 .36
AU oPTRoNICS CoRP 95,952 220,283 0 .18
CATCHER TECHNology Co lTD 4,000 260,485 0 .21
CATHAy FINANCIAl HolDINg Co 65,471 715,228 0 .58
CHAIlEASE HolDINg Co lTD 8,221 110,370 0 .09
CHENg SHIN RUBBER IND Co lTD 15,733 197,858 0 .16
CHINA AIRlINES lTD 20,000 56,627 0 .05
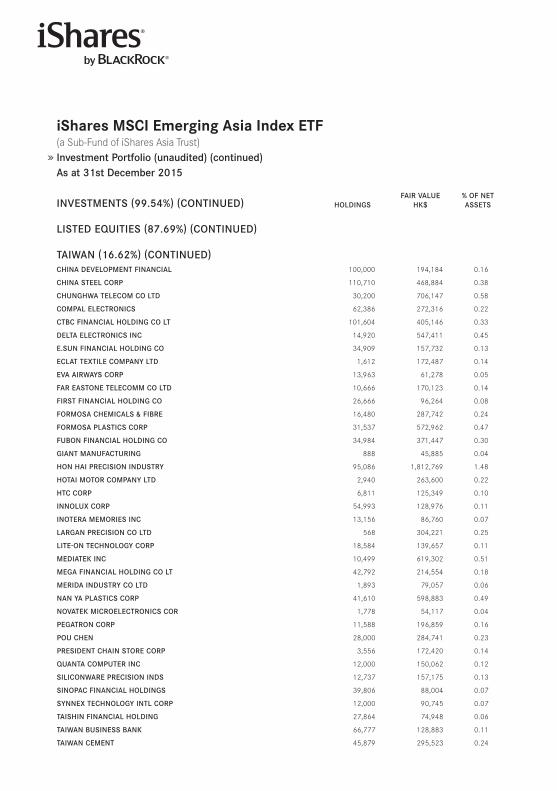
iShares MSCi emerging Asia index eTf(a Sub-Fund of iShares Asia Trust) Investment Portfolio (unaudited) (continued)As at 31st December 2015
INVESTMENTS (99.54%) (CoNTINUED) HolDINgSFAIR VAlUE
HK$% oF NET ASSETS
lISTED EqUITIES (87.69%) (CoNTINUED)
TAIwAN (16.62%) (CoNTINUED)CHINA DEVEloPMENT FINANCIAl 100,000 194,184 0 .16
CHINA STEEl CoRP 110,710 468,884 0 .38
CHUNgHwA TElECoM Co lTD 30,200 706,147 0 .58
CoMPAl ElECTRoNICS 62,386 272,316 0 .22
CTBC FINANCIAl HolDINg Co lT 101,604 405,146 0 .33
DElTA ElECTRoNICS INC 14,920 547,411 0 .45
E.SUN FINANCIAl HolDINg Co 34,909 157,732 0 .13
EClAT TEXTIlE CoMPANy lTD 1,612 172,487 0 .14
EVA AIRwAyS CoRP 13,963 61,278 0 .05
FAR EASToNE TElECoMM Co lTD 10,666 170,123 0 .14
FIRST FINANCIAl HolDINg Co 26,666 96,264 0 .08
FoRMoSA CHEMICAlS ﹠ FIBRE 16,480 287,742 0 .24
FoRMoSA PlASTICS CoRP 31,537 572,962 0 .47
FUBoN FINANCIAl HolDINg Co 34,984 371,447 0 .30
gIANT MANUFACTURINg 888 45,885 0 .04
HoN HAI PRECISIoN INDUSTRy 95,086 1,812,769 1 .48
HoTAI MoToR CoMPANy lTD 2,940 263,600 0 .22
HTC CoRP 6,811 125,349 0 .10
INNolUX CoRP 54,993 128,976 0 .11
INoTERA MEMoRIES INC 13,156 86,760 0 .07
lARgAN PRECISIoN Co lTD 568 304,221 0 .25
lITE-oN TECHNology CoRP 18,584 139,657 0 .11
MEDIATEK INC 10,499 619,302 0 .51
MEgA FINANCIAl HolDINg Co lT 42,792 214,554 0 .18
MERIDA INDUSTRy Co lTD 1,893 79,057 0 .06
NAN yA PlASTICS CoRP 41,610 598,883 0 .49
NoVATEK MICRoElECTRoNICS CoR 1,778 54,117 0 .04
PEgATRoN CoRP 11,588 196,859 0 .16
PoU CHEN 28,000 284,741 0 .23
PRESIDENT CHAIN SToRE CoRP 3,556 172,420 0 .14
qUANTA CoMPUTER INC 12,000 150,062 0 .12
SIlICoNwARE PRECISIoN INDS 12,737 157,175 0 .13
SINoPAC FINANCIAl HolDINgS 39,806 88,004 0 .07
SyNNEX TECHNology INTl CoRP 12,000 90,745 0 .07
TAISHIN FINANCIAl HolDINg 27,864 74,948 0 .06
TAIwAN BUSINESS BANK 66,777 128,883 0 .11
TAIwAN CEMENT 45,879 295,523 0 .24
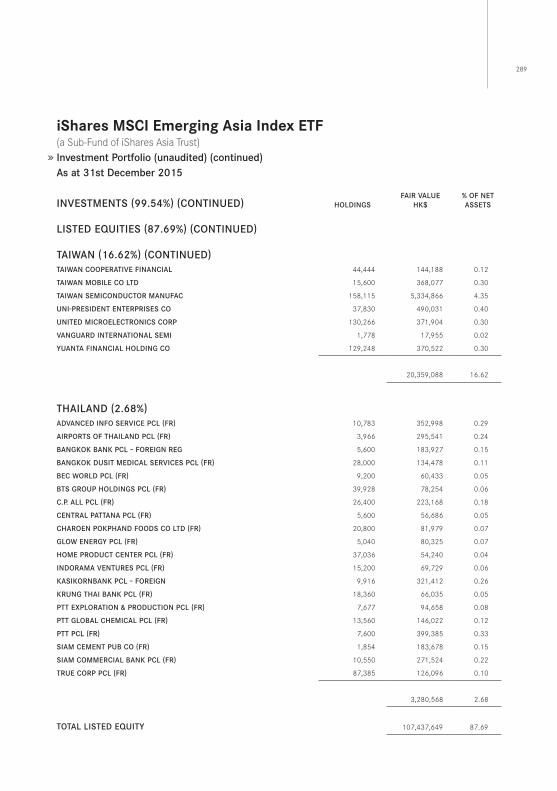
289
iShares MSCi emerging Asia index eTf(a Sub-Fund of iShares Asia Trust) Investment Portfolio (unaudited) (continued)As at 31st December 2015
INVESTMENTS (99.54%) (CoNTINUED) HolDINgSFAIR VAlUE
HK$% oF NET ASSETS
lISTED EqUITIES (87.69%) (CoNTINUED)
TAIwAN (16.62%) (CoNTINUED)TAIwAN CooPERATIVE FINANCIAl 44,444 144,188 0 .12
TAIwAN MoBIlE Co lTD 15,600 368,077 0 .30
TAIwAN SEMICoNDUCToR MANUFAC 158,115 5,334,866 4 .35
UNI-PRESIDENT ENTERPRISES Co 37,830 490,031 0 .40
UNITED MICRoElECTRoNICS CoRP 130,266 371,904 0 .30
VANgUARD INTERNATIoNAl SEMI 1,778 17,955 0 .02
yUANTA FINANCIAl HolDINg Co 129,248 370,522 0 .30
20,359,088 16 .62
THAIlAND (2.68%)ADVANCED INFo SERVICE PCl (FR) 10,783 352,998 0 .29
AIRPoRTS oF THAIlAND PCl (FR) 3,966 295,541 0 .24
BANgKoK BANK PCl – FoREIgN REg 5,600 183,927 0 .15
BANgKoK DUSIT MEDICAl SERVICES PCl (FR) 28,000 134,478 0 .11
BEC woRlD PCl (FR) 9,200 60,433 0 .05
BTS gRoUP HolDINgS PCl (FR) 39,928 78,254 0 .06
C.P. All PCl (FR) 26,400 223,168 0 .18
CENTRAl PATTANA PCl (FR) 5,600 56,686 0 .05
CHARoEN PoKPHAND FooDS Co lTD (FR) 20,800 81,979 0 .07
glow ENERgy PCl (FR) 5,040 80,325 0 .07
HoME PRoDUCT CENTER PCl (FR) 37,036 54,240 0 .04
INDoRAMA VENTURES PCl (FR) 15,200 69,729 0 .06
KASIKoRNBANK PCl – FoREIgN 9,916 321,412 0 .26
KRUNg THAI BANK PCl (FR) 18,360 66,035 0 .05
PTT EXPloRATIoN ﹠ PRoDUCTIoN PCl (FR) 7,677 94,658 0 .08
PTT gloBAl CHEMICAl PCl (FR) 13,560 146,022 0 .12
PTT PCl (FR) 7,600 399,385 0 .33
SIAM CEMENT PUB Co (FR) 1,854 183,678 0 .15
SIAM CoMMERCIAl BANK PCl (FR) 10,550 271,524 0 .22
TRUE CoRP PCl (FR) 87,385 126,096 0 .10
3,280,568 2 .68
ToTAl lISTED EqUITy 107,437,649 87 .69
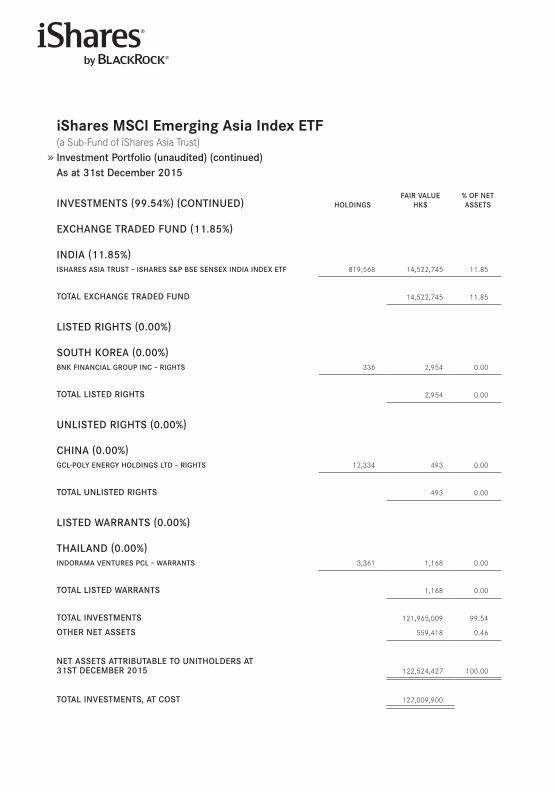
iShares MSCi emerging Asia index eTf(a Sub-Fund of iShares Asia Trust) Investment Portfolio (unaudited) (continued)As at 31st December 2015
INVESTMENTS (99.54%) (CoNTINUED) HolDINgSFAIR VAlUE
HK$% oF NET ASSETS
EXCHANgE TRADED FUND (11.85%)
INDIA (11.85%)ISHARES ASIA TRUST – ISHARES S﹠P BSE SENSEX INDIA INDEX ETF 819,568 14,522,745 11 .85
ToTAl EXCHANgE TRADED FUND 14,522,745 11 .85
lISTED RIgHTS (0.00%)
SoUTH KoREA (0.00%)BNK FINANCIAl gRoUP INC – RIgHTS 336 2,954 0 .00
ToTAl lISTED RIgHTS 2,954 0 .00
UNlISTED RIgHTS (0.00%)
CHINA (0.00%)gCl-Poly ENERgy HolDINgS lTD – RIgHTS 12,334 493 0 .00
ToTAl UNlISTED RIgHTS 493 0 .00
lISTED wARRANTS (0.00%)
THAIlAND (0.00%)INDoRAMA VENTURES PCl – wARRANTS 3,361 1,168 0 .00
ToTAl lISTED wARRANTS 1,168 0 .00
ToTAl INVESTMENTS 121,965,009 99 .54
oTHER NET ASSETS 559,418 0 .46
NET ASSETS ATTRIBUTABlE To UNITHolDERS AT31ST DECEMBER 2015 122,524,427 100 .00
ToTAl INVESTMENTS, AT CoST 127,009,900
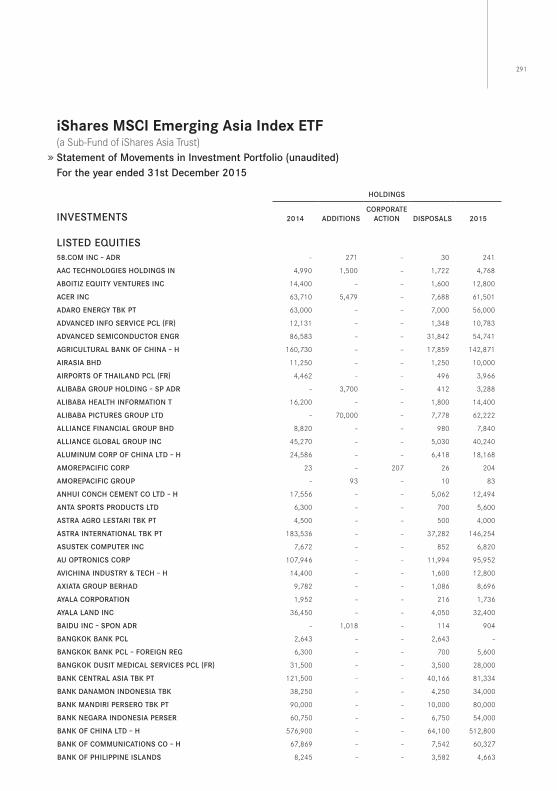
291
iShares MSCi emerging Asia index eTf(a Sub-Fund of iShares Asia Trust) Statement of Movements in Investment Portfolio (unaudited)For the year ended 31st December 2015
HolDINgS
INVESTMENTS 2014 ADDITIoNSCoRPoRATE
ACTIoN DISPoSAlS 2015
lISTED EqUITIES58.CoM INC – ADR – 271 – 30 241
AAC TECHNologIES HolDINgS IN 4,990 1,500 – 1,722 4,768
ABoITIz EqUITy VENTURES INC 14,400 – – 1,600 12,800
ACER INC 63,710 5,479 – 7,688 61,501
ADARo ENERgy TBK PT 63,000 – – 7,000 56,000
ADVANCED INFo SERVICE PCl (FR) 12,131 – – 1,348 10,783
ADVANCED SEMICoNDUCToR ENgR 86,583 – – 31,842 54,741
AgRICUlTURAl BANK oF CHINA – H 160,730 – – 17,859 142,871
AIRASIA BHD 11,250 – – 1,250 10,000
AIRPoRTS oF THAIlAND PCl (FR) 4,462 – – 496 3,966
AlIBABA gRoUP HolDINg – SP ADR – 3,700 – 412 3,288
AlIBABA HEAlTH INFoRMATIoN T 16,200 – – 1,800 14,400
AlIBABA PICTURES gRoUP lTD – 70,000 – 7,778 62,222
AllIANCE FINANCIAl gRoUP BHD 8,820 – – 980 7,840
AllIANCE gloBAl gRoUP INC 45,270 – – 5,030 40,240
AlUMINUM CoRP oF CHINA lTD – H 24,586 – – 6,418 18,168
AMoREPACIFIC CoRP 23 – 207 26 204
AMoREPACIFIC gRoUP – 93 – 10 83
ANHUI CoNCH CEMENT Co lTD – H 17,556 – – 5,062 12,494
ANTA SPoRTS PRoDUCTS lTD 6,300 – – 700 5,600
ASTRA AgRo lESTARI TBK PT 4,500 – – 500 4,000
ASTRA INTERNATIoNAl TBK PT 183,536 – – 37,282 146,254
ASUSTEK CoMPUTER INC 7,672 – – 852 6,820
AU oPTRoNICS CoRP 107,946 – – 11,994 95,952
AVICHINA INDUSTRy ﹠ TECH – H 14,400 – – 1,600 12,800
AXIATA gRoUP BERHAD 9,782 – – 1,086 8,696
AyAlA CoRPoRATIoN 1,952 – – 216 1,736
AyAlA lAND INC 36,450 – – 4,050 32,400
BAIDU INC – SPoN ADR – 1,018 – 114 904
BANgKoK BANK PCl 2,643 – – 2,643 –
BANgKoK BANK PCl – FoREIgN REg 6,300 – – 700 5,600
BANgKoK DUSIT MEDICAl SERVICES PCl (FR) 31,500 – – 3,500 28,000
BANK CENTRAl ASIA TBK PT 121,500 – – 40,166 81,334
BANK DANAMoN INDoNESIA TBK 38,250 – – 4,250 34,000
BANK MANDIRI PERSERo TBK PT 90,000 – – 10,000 80,000
BANK NEgARA INDoNESIA PERSER 60,750 – – 6,750 54,000
BANK oF CHINA lTD – H 576,900 – – 64,100 512,800
BANK oF CoMMUNICATIoNS Co – H 67,869 – – 7,542 60,327
BANK oF PHIlIPPINE ISlANDS 8,245 – – 3,582 4,663
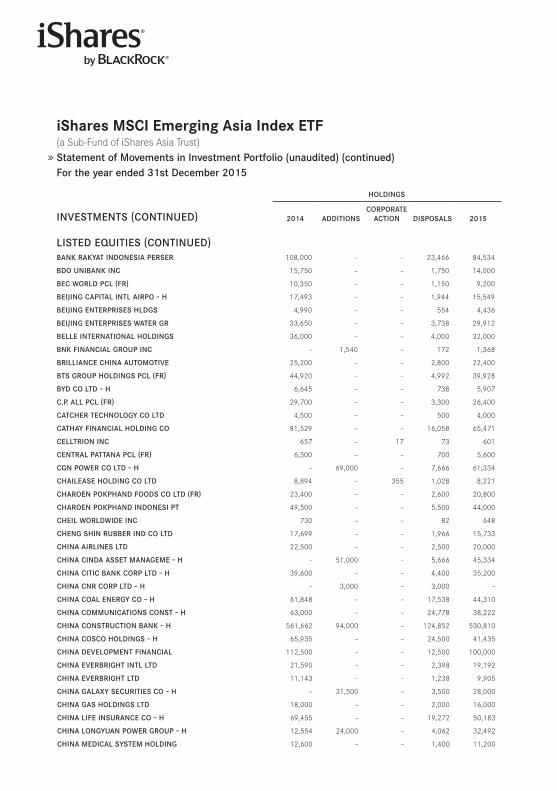
iShares MSCi emerging Asia index eTf(a Sub-Fund of iShares Asia Trust) Statement of Movements in Investment Portfolio (unaudited) (continued)For the year ended 31st December 2015
HolDINgS
INVESTMENTS (CoNTINUED) 2014 ADDITIoNSCoRPoRATE
ACTIoN DISPoSAlS 2015
lISTED EqUITIES (CoNTINUED)BANK RAKyAT INDoNESIA PERSER 108,000 – – 23,466 84,534
BDo UNIBANK INC 15,750 – – 1,750 14,000
BEC woRlD PCl (FR) 10,350 – – 1,150 9,200
BEIJINg CAPITAl INTl AIRPo – H 17,493 – – 1,944 15,549
BEIJINg ENTERPRISES HlDgS 4,990 – – 554 4,436
BEIJINg ENTERPRISES wATER gR 33,650 – – 3,738 29,912
BEllE INTERNATIoNAl HolDINgS 36,000 – – 4,000 32,000
BNK FINANCIAl gRoUP INC – 1,540 – 172 1,368
BRIllIANCE CHINA AUToMoTIVE 25,200 – – 2,800 22,400
BTS gRoUP HolDINgS PCl (FR) 44,920 – – 4,992 39,928
ByD Co lTD – H 6,645 – – 738 5,907
C.P. All PCl (FR) 29,700 – – 3,300 26,400
CATCHER TECHNology Co lTD 4,500 – – 500 4,000
CATHAy FINANCIAl HolDINg Co 81,529 – – 16,058 65,471
CEllTRIoN INC 657 – 17 73 601
CENTRAl PATTANA PCl (FR) 6,300 – – 700 5,600
CgN PowER Co lTD – H – 69,000 – 7,666 61,334
CHAIlEASE HolDINg Co lTD 8,894 – 355 1,028 8,221
CHARoEN PoKPHAND FooDS Co lTD (FR) 23,400 – – 2,600 20,800
CHARoEN PoKPHAND INDoNESI PT 49,500 – – 5,500 44,000
CHEIl woRlDwIDE INC 730 – – 82 648
CHENg SHIN RUBBER IND Co lTD 17,699 – – 1,966 15,733
CHINA AIRlINES lTD 22,500 – – 2,500 20,000
CHINA CINDA ASSET MANAgEME – H – 51,000 – 5,666 45,334
CHINA CITIC BANK CoRP lTD – H 39,600 – – 4,400 35,200
CHINA CNR CoRP lTD – H – 3,000 – 3,000 –
CHINA CoAl ENERgy Co – H 61,848 – – 17,538 44,310
CHINA CoMMUNICATIoNS CoNST – H 63,000 – – 24,778 38,222
CHINA CoNSTRUCTIoN BANK – H 561,662 94,000 – 124,852 530,810
CHINA CoSCo HolDINgS – H 65,935 – – 24,500 41,435
CHINA DEVEloPMENT FINANCIAl 112,500 – – 12,500 100,000
CHINA EVERBRIgHT INTl lTD 21,590 – – 2,398 19,192
CHINA EVERBRIgHT lTD 11,143 – – 1,238 9,905
CHINA gAlAXy SECURITIES Co – H – 31,500 – 3,500 28,000
CHINA gAS HolDINgS lTD 18,000 – – 2,000 16,000
CHINA lIFE INSURANCE Co – H 69,455 – – 19,272 50,183
CHINA loNgyUAN PowER gRoUP – H 12,554 24,000 – 4,062 32,492
CHINA MEDICAl SySTEM HolDINg 12,600 – – 1,400 11,200
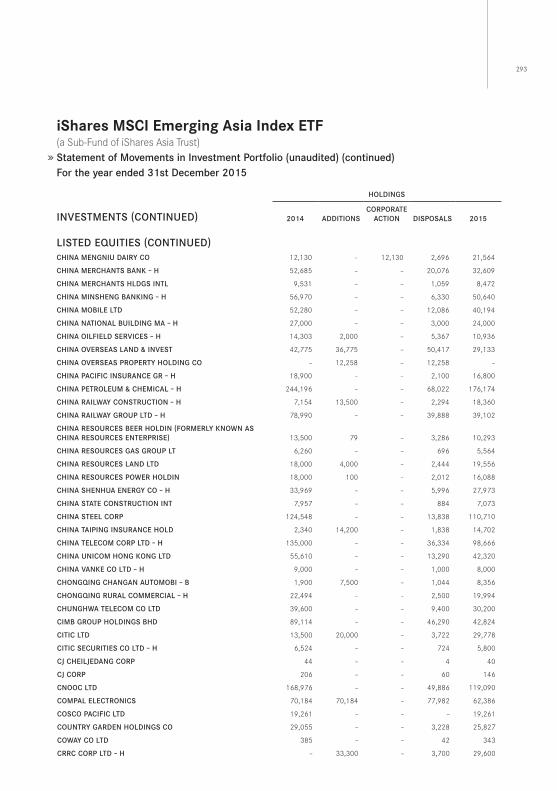
293
iShares MSCi emerging Asia index eTf(a Sub-Fund of iShares Asia Trust) Statement of Movements in Investment Portfolio (unaudited) (continued)For the year ended 31st December 2015
HolDINgS
INVESTMENTS (CoNTINUED) 2014 ADDITIoNSCoRPoRATE
ACTIoN DISPoSAlS 2015
lISTED EqUITIES (CoNTINUED)CHINA MENgNIU DAIRy Co 12,130 – 12,130 2,696 21,564
CHINA MERCHANTS BANK – H 52,685 – – 20,076 32,609
CHINA MERCHANTS HlDgS INTl 9,531 – – 1,059 8,472
CHINA MINSHENg BANKINg – H 56,970 – – 6,330 50,640
CHINA MoBIlE lTD 52,280 – – 12,086 40,194
CHINA NATIoNAl BUIlDINg MA – H 27,000 – – 3,000 24,000
CHINA oIlFIElD SERVICES – H 14,303 2,000 – 5,367 10,936
CHINA oVERSEAS lAND ﹠ INVEST 42,775 36,775 – 50,417 29,133
CHINA oVERSEAS PRoPERTy HolDINg Co – 12,258 – 12,258 –
CHINA PACIFIC INSURANCE gR – H 18,900 – – 2,100 16,800
CHINA PETRolEUM ﹠ CHEMICAl – H 244,196 – – 68,022 176,174
CHINA RAIlwAy CoNSTRUCTIoN – H 7,154 13,500 – 2,294 18,360
CHINA RAIlwAy gRoUP lTD – H 78,990 – – 39,888 39,102
CHINA RESoURCES BEER HolDIN (FoRMERly KNowN AS CHINA RESoURCES ENTERPRISE) 13,500 79 – 3,286 10,293
CHINA RESoURCES gAS gRoUP lT 6,260 – – 696 5,564
CHINA RESoURCES lAND lTD 18,000 4,000 – 2,444 19,556
CHINA RESoURCES PowER HolDIN 18,000 100 – 2,012 16,088
CHINA SHENHUA ENERgy Co – H 33,969 – – 5,996 27,973
CHINA STATE CoNSTRUCTIoN INT 7,957 – – 884 7,073
CHINA STEEl CoRP 124,548 – – 13,838 110,710
CHINA TAIPINg INSURANCE HolD 2,340 14,200 – 1,838 14,702
CHINA TElECoM CoRP lTD – H 135,000 – – 36,334 98,666
CHINA UNICoM HoNg KoNg lTD 55,610 – – 13,290 42,320
CHINA VANKE Co lTD – H 9,000 – – 1,000 8,000
CHoNgqINg CHANgAN AUToMoBI – B 1,900 7,500 – 1,044 8,356
CHoNgqINg RURAl CoMMERCIAl – H 22,494 – – 2,500 19,994
CHUNgHwA TElECoM Co lTD 39,600 – – 9,400 30,200
CIMB gRoUP HolDINgS BHD 89,114 – – 46,290 42,824
CITIC lTD 13,500 20,000 – 3,722 29,778
CITIC SECURITIES Co lTD – H 6,524 – – 724 5,800
CJ CHEIlJEDANg CoRP 44 – – 4 40
CJ CoRP 206 – – 60 146
CNooC lTD 168,976 – – 49,886 119,090
CoMPAl ElECTRoNICS 70,184 70,184 – 77,982 62,386
CoSCo PACIFIC lTD 19,261 – – – 19,261
CoUNTRy gARDEN HolDINgS Co 29,055 – – 3,228 25,827
CowAy Co lTD 385 – – 42 343
CRRC CoRP lTD – H – 33,300 – 3,700 29,600
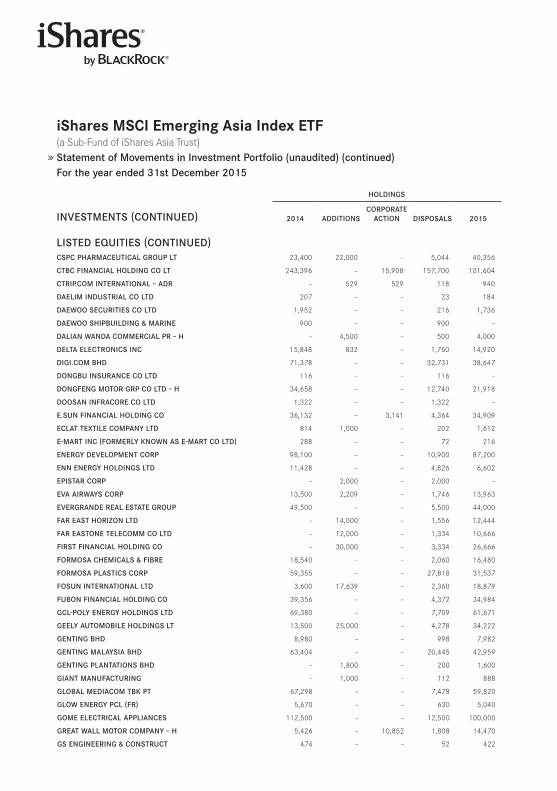
iShares MSCi emerging Asia index eTf(a Sub-Fund of iShares Asia Trust) Statement of Movements in Investment Portfolio (unaudited) (continued)For the year ended 31st December 2015
HolDINgS
INVESTMENTS (CoNTINUED) 2014 ADDITIoNSCoRPoRATE
ACTIoN DISPoSAlS 2015
lISTED EqUITIES (CoNTINUED)CSPC PHARMACEUTICAl gRoUP lT 23,400 22,000 – 5,044 40,356
CTBC FINANCIAl HolDINg Co lT 243,396 – 15,908 157,700 101,604
CTRIP.CoM INTERNATIoNAl – ADR – 529 529 118 940
DAElIM INDUSTRIAl Co lTD 207 – – 23 184
DAEwoo SECURITIES Co lTD 1,952 – – 216 1,736
DAEwoo SHIPBUIlDINg ﹠ MARINE 900 – – 900 –
DAlIAN wANDA CoMMERCIAl PR – H – 4,500 – 500 4,000
DElTA ElECTRoNICS INC 15,848 832 – 1,760 14,920
DIgI.CoM BHD 71,378 – – 32,731 38,647
DoNgBU INSURANCE Co lTD 116 – – 116 –
DoNgFENg MoToR gRP Co lTD – H 34,658 – – 12,740 21,918
DooSAN INFRACoRE Co lTD 1,322 – – 1,322 –
E.SUN FINANCIAl HolDINg Co 36,132 – 3,141 4,364 34,909
EClAT TEXTIlE CoMPANy lTD 814 1,000 – 202 1,612
E-MART INC (FoRMERly KNowN AS E-MART Co lTD) 288 – – 72 216
ENERgy DEVEloPMENT CoRP 98,100 – – 10,900 87,200
ENN ENERgy HolDINgS lTD 11,428 – – 4,826 6,602
EPISTAR CoRP – 2,000 – 2,000 –
EVA AIRwAyS CoRP 13,500 2,209 – 1,746 13,963
EVERgRANDE REAl ESTATE gRoUP 49,500 – – 5,500 44,000
FAR EAST HoRIzoN lTD – 14,000 – 1,556 12,444
FAR EASToNE TElECoMM Co lTD – 12,000 – 1,334 10,666
FIRST FINANCIAl HolDINg Co – 30,000 – 3,334 26,666
FoRMoSA CHEMICAlS ﹠ FIBRE 18,540 – – 2,060 16,480
FoRMoSA PlASTICS CoRP 59,355 – – 27,818 31,537
FoSUN INTERNATIoNAl lTD 3,600 17,639 – 2,360 18,879
FUBoN FINANCIAl HolDINg Co 39,356 – – 4,372 34,984
gCl-Poly ENERgy HolDINgS lTD 69,380 – – 7,709 61,671
gEEly AUToMoBIlE HolDINgS lT 13,500 25,000 – 4,278 34,222
gENTINg BHD 8,980 – – 998 7,982
gENTINg MAlAySIA BHD 63,404 – – 20,445 42,959
gENTINg PlANTATIoNS BHD – 1,800 – 200 1,600
gIANT MANUFACTURINg – 1,000 – 112 888
gloBAl MEDIACoM TBK PT 67,298 – – 7,478 59,820
glow ENERgy PCl (FR) 5,670 – – 630 5,040
goME ElECTRICAl APPlIANCES 112,500 – – 12,500 100,000
gREAT wAll MoToR CoMPANy – H 5,426 – 10,852 1,808 14,470
gS ENgINEERINg ﹠ CoNSTRUCT 474 – – 52 422
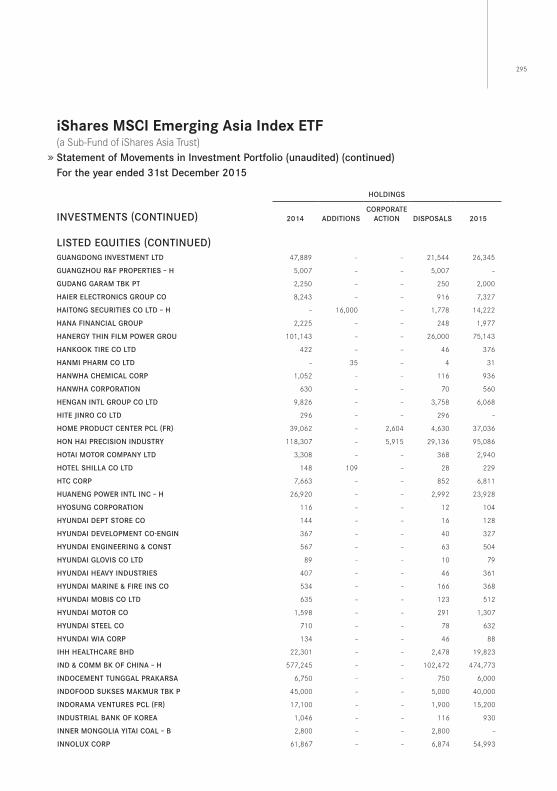
295
iShares MSCi emerging Asia index eTf(a Sub-Fund of iShares Asia Trust) Statement of Movements in Investment Portfolio (unaudited) (continued)For the year ended 31st December 2015
HolDINgS
INVESTMENTS (CoNTINUED) 2014 ADDITIoNSCoRPoRATE
ACTIoN DISPoSAlS 2015
lISTED EqUITIES (CoNTINUED)gUANgDoNg INVESTMENT lTD 47,889 – – 21,544 26,345
gUANgzHoU R﹠F PRoPERTIES – H 5,007 – – 5,007 –
gUDANg gARAM TBK PT 2,250 – – 250 2,000
HAIER ElECTRoNICS gRoUP Co 8,243 – – 916 7,327
HAIToNg SECURITIES Co lTD – H – 16,000 – 1,778 14,222
HANA FINANCIAl gRoUP 2,225 – – 248 1,977
HANERgy THIN FIlM PowER gRoU 101,143 – – 26,000 75,143
HANKooK TIRE Co lTD 422 – – 46 376
HANMI PHARM Co lTD – 35 – 4 31
HANwHA CHEMICAl CoRP 1,052 – – 116 936
HANwHA CoRPoRATIoN 630 – – 70 560
HENgAN INTl gRoUP Co lTD 9,826 – – 3,758 6,068
HITE JINRo Co lTD 296 – – 296 –
HoME PRoDUCT CENTER PCl (FR) 39,062 – 2,604 4,630 37,036
HoN HAI PRECISIoN INDUSTRy 118,307 – 5,915 29,136 95,086
HoTAI MoToR CoMPANy lTD 3,308 – – 368 2,940
HoTEl SHIllA Co lTD 148 109 – 28 229
HTC CoRP 7,663 – – 852 6,811
HUANENg PowER INTl INC – H 26,920 – – 2,992 23,928
HyoSUNg CoRPoRATIoN 116 – – 12 104
HyUNDAI DEPT SToRE Co 144 – – 16 128
HyUNDAI DEVEloPMENT Co-ENgIN 367 – – 40 327
HyUNDAI ENgINEERINg ﹠ CoNST 567 – – 63 504
HyUNDAI gloVIS Co lTD 89 – – 10 79
HyUNDAI HEAVy INDUSTRIES 407 – – 46 361
HyUNDAI MARINE ﹠ FIRE INS Co 534 – – 166 368
HyUNDAI MoBIS Co lTD 635 – – 123 512
HyUNDAI MoToR Co 1,598 – – 291 1,307
HyUNDAI STEEl Co 710 – – 78 632
HyUNDAI wIA CoRP 134 – – 46 88
IHH HEAlTHCARE BHD 22,301 – – 2,478 19,823
IND ﹠ CoMM BK oF CHINA – H 577,245 – – 102,472 474,773
INDoCEMENT TUNggAl PRAKARSA 6,750 – – 750 6,000
INDoFooD SUKSES MAKMUR TBK P 45,000 – – 5,000 40,000
INDoRAMA VENTURES PCl (FR) 17,100 – – 1,900 15,200
INDUSTRIAl BANK oF KoREA 1,046 – – 116 930
INNER MoNgolIA yITAI CoAl – B 2,800 – – 2,800 –
INNolUX CoRP 61,867 – – 6,874 54,993
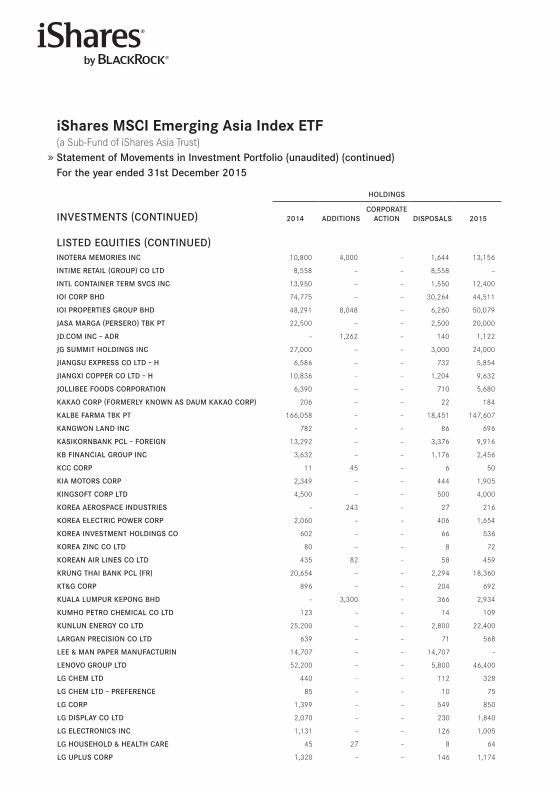
iShares MSCi emerging Asia index eTf(a Sub-Fund of iShares Asia Trust) Statement of Movements in Investment Portfolio (unaudited) (continued)For the year ended 31st December 2015
HolDINgS
INVESTMENTS (CoNTINUED) 2014 ADDITIoNSCoRPoRATE
ACTIoN DISPoSAlS 2015
lISTED EqUITIES (CoNTINUED)INoTERA MEMoRIES INC 10,800 4,000 – 1,644 13,156
INTIME RETAIl (gRoUP) Co lTD 8,558 – – 8,558 –
INTl CoNTAINER TERM SVCS INC 13,950 – – 1,550 12,400
IoI CoRP BHD 74,775 – – 30,264 44,511
IoI PRoPERTIES gRoUP BHD 48,291 8,048 – 6,260 50,079
JASA MARgA (PERSERo) TBK PT 22,500 – – 2,500 20,000
JD.CoM INC – ADR – 1,262 – 140 1,122
Jg SUMMIT HolDINgS INC 27,000 – – 3,000 24,000
JIANgSU EXPRESS Co lTD – H 6,586 – – 732 5,854
JIANgXI CoPPER Co lTD – H 10,836 – – 1,204 9,632
JollIBEE FooDS CoRPoRATIoN 6,390 – – 710 5,680
KAKAo CoRP (FoRMERly KNowN AS DAUM KAKAo CoRP) 206 – – 22 184
KAlBE FARMA TBK PT 166,058 – – 18,451 147,607
KANgwoN lAND INC 782 – – 86 696
KASIKoRNBANK PCl – FoREIgN 13,292 – – 3,376 9,916
KB FINANCIAl gRoUP INC 3,632 – – 1,176 2,456
KCC CoRP 11 45 – 6 50
KIA MoToRS CoRP 2,349 – – 444 1,905
KINgSoFT CoRP lTD 4,500 – – 500 4,000
KoREA AERoSPACE INDUSTRIES – 243 – 27 216
KoREA ElECTRIC PowER CoRP 2,060 – – 406 1,654
KoREA INVESTMENT HolDINgS Co 602 – – 66 536
KoREA zINC Co lTD 80 – – 8 72
KoREAN AIR lINES Co lTD 435 82 – 58 459
KRUNg THAI BANK PCl (FR) 20,654 – – 2,294 18,360
KT﹠g CoRP 896 – – 204 692
KUAlA lUMPUR KEPoNg BHD – 3,300 – 366 2,934
KUMHo PETRo CHEMICAl Co lTD 123 – – 14 109
KUNlUN ENERgy Co lTD 25,200 – – 2,800 22,400
lARgAN PRECISIoN Co lTD 639 – – 71 568
lEE ﹠ MAN PAPER MANUFACTURIN 14,707 – – 14,707 –
lENoVo gRoUP lTD 52,200 – – 5,800 46,400
lg CHEM lTD 440 – – 112 328
lg CHEM lTD – PREFERENCE 85 – – 10 75
lg CoRP 1,399 – – 549 850
lg DISPlAy Co lTD 2,070 – – 230 1,840
lg ElECTRoNICS INC 1,131 – – 126 1,005
lg HoUSEHolD ﹠ HEAlTH CARE 45 27 – 8 64
lg UPlUS CoRP 1,320 – – 146 1,174

297
iShares MSCi emerging Asia index eTf(a Sub-Fund of iShares Asia Trust) Statement of Movements in Investment Portfolio (unaudited) (continued)For the year ended 31st December 2015
HolDINgS
INVESTMENTS (CoNTINUED) 2014 ADDITIoNSCoRPoRATE
ACTIoN DISPoSAlS 2015
lISTED EqUITIES (CoNTINUED)lIPPo KARAwACI TBK PT 113,102 – – 12,567 100,535
lITE-oN TECHNology CoRP 20,804 – 104 2,324 18,584
loTTE CHEMICAl CoRP 144 – – 16 128
loTTE CoNFECTIoNERy Co lTD 18 – – 7 11
loTTE SHoPPINg Co 90 – – 10 80
lS CoRP 297 – – 297 –
MAlAyAN BANKINg BHD 32,449 – – 3,606 28,843
MATAHARI DEPARTMENT SToRE TB 25,435 – – 2,826 22,609
MEDIA NUSANTARA CITRA TBK PT 35,695 – – 3,966 31,729
MEDIATEK INC 11,811 – – 1,312 10,499
MEgA FINANCIAl HolDINg Co lT 44,306 3,597 – 5,111 42,792
MERIDA INDUSTRy Co lTD 2,129 – – 236 1,893
METRoPolITAN BANK ﹠ TRUST 6,099 967 – 786 6,280
MIRAE ASSET SECURITIES Co lT 485 422 273 132 1,048
NAN yA PlASTICS CoRP 46,812 – – 5,202 41,610
NAVER CoRP 230 – – 54 176
NCSoFT CoRP 102 – – 12 90
NETEASE INC – ADR – 291 – 32 259
NEw CHINA lIFE INSURANCE C – H – 6,000 – 666 5,334
NEw oRIENTAl EDUCATIo – SP ADR – 490 – 54 436
NH INVESTMENT ﹠ SECURITIES C (FoRMERly KNowN AS wooRI INVESTMENT ﹠ SECURITIE) 1,890 – – 210 1,680
NINE DRAgoNS PAPER HolDINgS 13,500 – – 1,500 12,000
NoVATEK MICRoElECTRoNICS CoR – 2,000 – 222 1,778
oCI Co lTD 135 – – 15 120
oRIoN CoRP 15 12 – 3 24
PEgATRoN CoRP 13,036 – – 1,448 11,588
PEoPlE’S INSURANCE Co gRoU – H – 30,000 – 3,334 26,666
PERUSAHAAN gAS NEgARA PERSER 108,000 – – 12,000 96,000
PETRoCHINA Co lTD – H 196,731 – – 53,860 142,871
PETRoNAS CHEMICAlS gRoUP BHD 7,200 5,000 – 7,756 4,444
PHIlIPPINE loNg DISTANCE TEl 941 – – 372 569
PICC PRoPERTy ﹠ CASUAlTy – H 20,172 12,000 – 9,221 22,951
PINg AN INSURANCE gRoUP Co – H 19,466 – 19,466 4,326 34,606
PoSCo 521 – – 58 463
PoU CHEN 31,500 – – 3,500 28,000
PRESIDENT CHAIN SToRE CoRP – 4,000 – 444 3,556
PTT EXPloRATIoN ﹠ PRoDUCTIoN PCl (FR) 8,637 – – 960 7,677
PTT gloBAl CHEMICAl PCl (FR) 15,254 – – 1,694 13,560
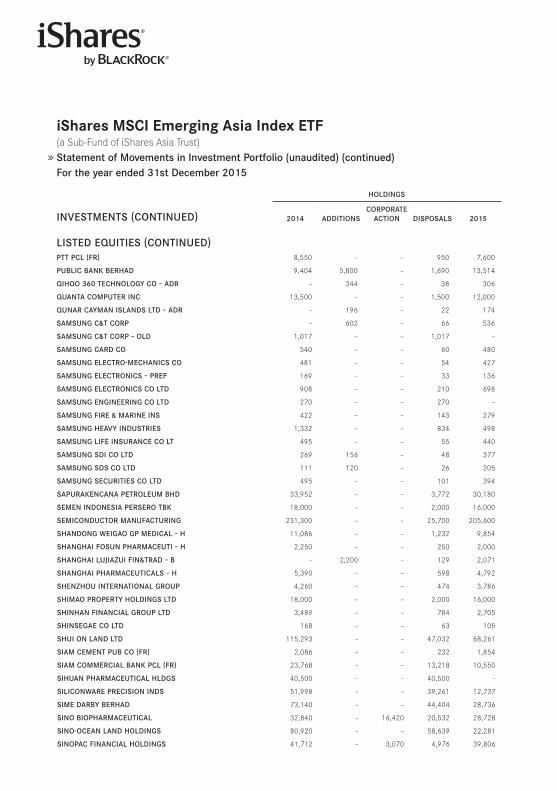
iShares MSCi emerging Asia index eTf(a Sub-Fund of iShares Asia Trust) Statement of Movements in Investment Portfolio (unaudited) (continued)For the year ended 31st December 2015
HolDINgS
INVESTMENTS (CoNTINUED) 2014 ADDITIoNSCoRPoRATE
ACTIoN DISPoSAlS 2015
lISTED EqUITIES (CoNTINUED)PTT PCl (FR) 8,550 – – 950 7,600
PUBlIC BANK BERHAD 9,404 5,800 – 1,690 13,514
qIHoo 360 TECHNology Co – ADR – 344 – 38 306
qUANTA CoMPUTER INC 13,500 – – 1,500 12,000
qUNAR CAyMAN ISlANDS lTD – ADR – 196 – 22 174
SAMSUNg C﹠T CoRP – 602 – 66 536
SAMSUNg C﹠T CoRP – olD 1,017 – – 1,017 –
SAMSUNg CARD Co 540 – – 60 480
SAMSUNg ElECTRo-MECHANICS Co 481 – – 54 427
SAMSUNg ElECTRoNICS – PREF 169 – – 33 136
SAMSUNg ElECTRoNICS Co lTD 908 – – 210 698
SAMSUNg ENgINEERINg Co lTD 270 – – 270 –
SAMSUNg FIRE ﹠ MARINE INS 422 – – 143 279
SAMSUNg HEAVy INDUSTRIES 1,332 – – 834 498
SAMSUNg lIFE INSURANCE Co lT 495 – – 55 440
SAMSUNg SDI Co lTD 269 156 – 48 377
SAMSUNg SDS Co lTD 111 120 – 26 205
SAMSUNg SECURITIES Co lTD 495 – – 101 394
SAPURAKENCANA PETRolEUM BHD 33,952 – – 3,772 30,180
SEMEN INDoNESIA PERSERo TBK 18,000 – – 2,000 16,000
SEMICoNDUCToR MANUFACTURINg 231,300 – – 25,700 205,600
SHANDoNg wEIgAo gP MEDICAl – H 11,086 – – 1,232 9,854
SHANgHAI FoSUN PHARMACEUTI – H 2,250 – – 250 2,000
SHANgHAI lUJIAzUI FIN﹠TRAD – B – 2,200 – 129 2,071
SHANgHAI PHARMACEUTICAlS – H 5,390 – – 598 4,792
SHENzHoU INTERNATIoNAl gRoUP 4,260 – – 474 3,786
SHIMAo PRoPERTy HolDINgS lTD 18,000 – – 2,000 16,000
SHINHAN FINANCIAl gRoUP lTD 3,489 – – 784 2,705
SHINSEgAE Co lTD 168 – – 63 105
SHUI oN lAND lTD 115,293 – – 47,032 68,261
SIAM CEMENT PUB Co (FR) 2,086 – – 232 1,854
SIAM CoMMERCIAl BANK PCl (FR) 23,768 – – 13,218 10,550
SIHUAN PHARMACEUTICAl HlDgS 40,500 – – 40,500 –
SIlICoNwARE PRECISIoN INDS 51,998 – – 39,261 12,737
SIME DARBy BERHAD 73,140 – – 44,404 28,736
SINo BIoPHARMACEUTICAl 32,840 – 16,420 20,532 28,728
SINo-oCEAN lAND HolDINgS 80,920 – – 58,639 22,281
SINoPAC FINANCIAl HolDINgS 41,712 – 3,070 4,976 39,806
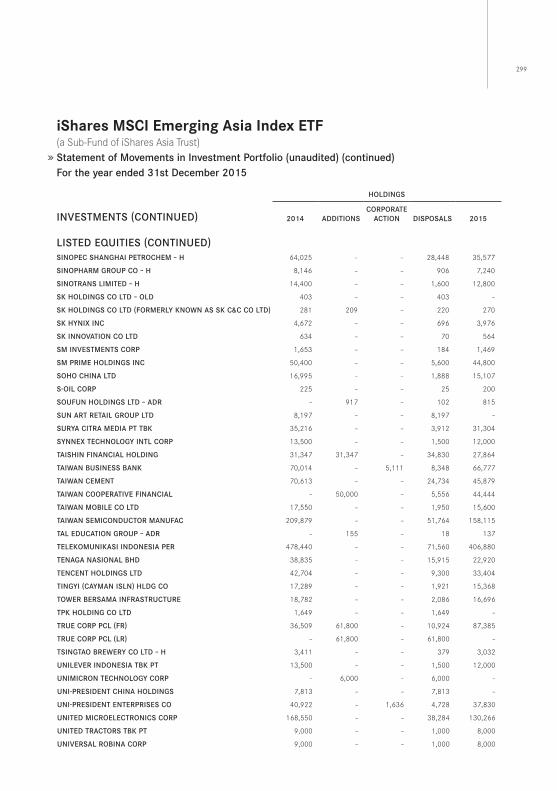
299
iShares MSCi emerging Asia index eTf(a Sub-Fund of iShares Asia Trust) Statement of Movements in Investment Portfolio (unaudited) (continued)For the year ended 31st December 2015
HolDINgS
INVESTMENTS (CoNTINUED) 2014 ADDITIoNSCoRPoRATE
ACTIoN DISPoSAlS 2015
lISTED EqUITIES (CoNTINUED)SINoPEC SHANgHAI PETRoCHEM – H 64,025 – – 28,448 35,577
SINoPHARM gRoUP Co – H 8,146 – – 906 7,240
SINoTRANS lIMITED – H 14,400 – – 1,600 12,800
SK HolDINgS Co lTD – olD 403 – – 403 –
SK HolDINgS Co lTD (FoRMERly KNowN AS SK C﹠C Co lTD) 281 209 – 220 270
SK HyNIX INC 4,672 – – 696 3,976
SK INNoVATIoN Co lTD 634 – – 70 564
SM INVESTMENTS CoRP 1,653 – – 184 1,469
SM PRIME HolDINgS INC 50,400 – – 5,600 44,800
SoHo CHINA lTD 16,995 – – 1,888 15,107
S-oIl CoRP 225 – – 25 200
SoUFUN HolDINgS lTD – ADR – 917 – 102 815
SUN ART RETAIl gRoUP lTD 8,197 – – 8,197 –
SURyA CITRA MEDIA PT TBK 35,216 – – 3,912 31,304
SyNNEX TECHNology INTl CoRP 13,500 – – 1,500 12,000
TAISHIN FINANCIAl HolDINg 31,347 31,347 – 34,830 27,864
TAIwAN BUSINESS BANK 70,014 – 5,111 8,348 66,777
TAIwAN CEMENT 70,613 – – 24,734 45,879
TAIwAN CooPERATIVE FINANCIAl – 50,000 – 5,556 44,444
TAIwAN MoBIlE Co lTD 17,550 – – 1,950 15,600
TAIwAN SEMICoNDUCToR MANUFAC 209,879 – – 51,764 158,115
TAl EDUCATIoN gRoUP – ADR – 155 – 18 137
TElEKoMUNIKASI INDoNESIA PER 478,440 – – 71,560 406,880
TENAgA NASIoNAl BHD 38,835 – – 15,915 22,920
TENCENT HolDINgS lTD 42,704 – – 9,300 33,404
TINgyI (CAyMAN ISlN) HlDg Co 17,289 – – 1,921 15,368
TowER BERSAMA INFRASTRUCTURE 18,782 – – 2,086 16,696
TPK HolDINg Co lTD 1,649 – – 1,649 –
TRUE CoRP PCl (FR) 36,509 61,800 – 10,924 87,385
TRUE CoRP PCl (lR) – 61,800 – 61,800 –
TSINgTAo BREwERy Co lTD – H 3,411 – – 379 3,032
UNIlEVER INDoNESIA TBK PT 13,500 – – 1,500 12,000
UNIMICRoN TECHNology CoRP – 6,000 – 6,000 –
UNI-PRESIDENT CHINA HolDINgS 7,813 – – 7,813 –
UNI-PRESIDENT ENTERPRISES Co 40,922 – 1,636 4,728 37,830
UNITED MICRoElECTRoNICS CoRP 168,550 – – 38,284 130,266
UNITED TRACToRS TBK PT 9,000 – – 1,000 8,000
UNIVERSAl RoBINA CoRP 9,000 – – 1,000 8,000
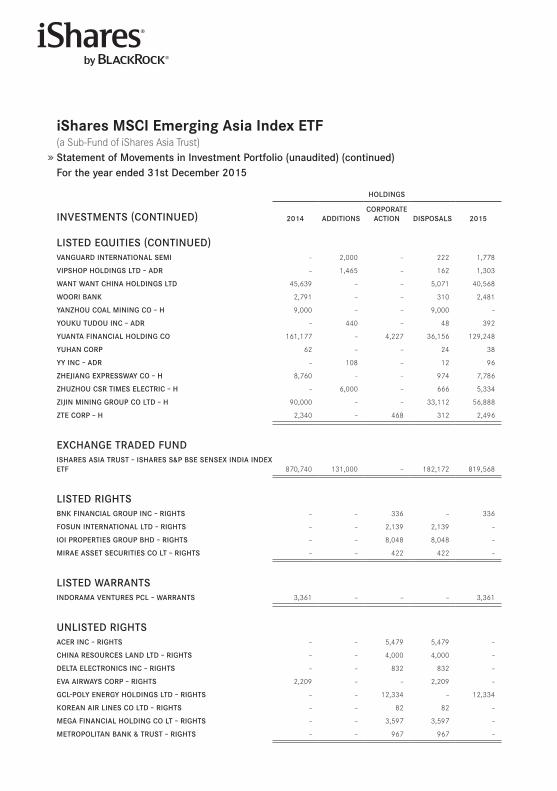
iShares MSCi emerging Asia index eTf(a Sub-Fund of iShares Asia Trust) Statement of Movements in Investment Portfolio (unaudited) (continued)For the year ended 31st December 2015
HolDINgS
INVESTMENTS (CoNTINUED) 2014 ADDITIoNSCoRPoRATE
ACTIoN DISPoSAlS 2015
lISTED EqUITIES (CoNTINUED)VANgUARD INTERNATIoNAl SEMI – 2,000 – 222 1,778
VIPSHoP HolDINgS lTD – ADR – 1,465 – 162 1,303
wANT wANT CHINA HolDINgS lTD 45,639 – – 5,071 40,568
wooRI BANK 2,791 – – 310 2,481
yANzHoU CoAl MININg Co – H 9,000 – – 9,000 –
yoUKU TUDoU INC – ADR – 440 – 48 392
yUANTA FINANCIAl HolDINg Co 161,177 – 4,227 36,156 129,248
yUHAN CoRP 62 – – 24 38
yy INC – ADR – 108 – 12 96
zHEJIANg EXPRESSwAy Co – H 8,760 – – 974 7,786
zHUzHoU CSR TIMES ElECTRIC – H – 6,000 – 666 5,334
zIJIN MININg gRoUP Co lTD – H 90,000 – – 33,112 56,888
zTE CoRP – H 2,340 – 468 312 2,496
EXCHANgE TRADED FUNDISHARES ASIA TRUST – ISHARES S﹠P BSE SENSEX INDIA INDEX ETF 870,740 131,000 – 182,172 819,568
lISTED RIgHTSBNK FINANCIAl gRoUP INC – RIgHTS – – 336 – 336
FoSUN INTERNATIoNAl lTD – RIgHTS – – 2,139 2,139 –
IoI PRoPERTIES gRoUP BHD – RIgHTS – – 8,048 8,048 –
MIRAE ASSET SECURITIES Co lT – RIgHTS – – 422 422 –
lISTED wARRANTSINDoRAMA VENTURES PCl – wARRANTS 3,361 – – – 3,361
UNlISTED RIgHTSACER INC – RIgHTS – – 5,479 5,479 –
CHINA RESoURCES lAND lTD – RIgHTS – – 4,000 4,000 –
DElTA ElECTRoNICS INC – RIgHTS – – 832 832 –
EVA AIRwAyS CoRP – RIgHTS 2,209 – – 2,209 –
gCl-Poly ENERgy HolDINgS lTD – RIgHTS – – 12,334 – 12,334
KoREAN AIR lINES Co lTD – RIgHTS – – 82 82 –
MEgA FINANCIAl HolDINg Co lT – RIgHTS – – 3,597 3,597 –
METRoPolITAN BANK ﹠ TRUST – RIgHTS – – 967 967 –
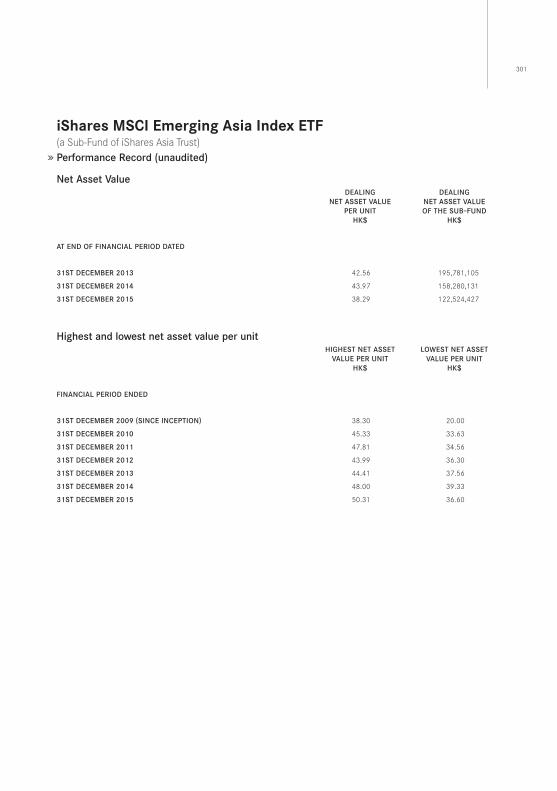
301
iShares MSCi emerging Asia index eTf(a Sub-Fund of iShares Asia Trust) Performance Record (unaudited)
Net Asset ValueDEAlINg
NET ASSET VAlUE PER UNIT
HK$
DEAlINgNET ASSET VAlUE oF THE SUB–FUND
HK$
AT END oF FINANCIAl PERIoD DATED
31ST DECEMBER 2013 42 .56 195,781,105
31ST DECEMBER 2014 43 .97 158,280,131
31ST DECEMBER 2015 38 .29 122,524,427
Highest and lowest net asset value per unitHIgHEST NET ASSET
VAlUE PER UNITHK$
lowEST NET ASSETVAlUE PER UNIT
HK$
FINANCIAl PERIoD ENDED
31ST DECEMBER 2009 (SINCE INCEPTIoN) 38 .30 20 .00
31ST DECEMBER 2010 45 .33 33 .63
31ST DECEMBER 2011 47 .81 34 .56
31ST DECEMBER 2012 43 .99 36 .30
31ST DECEMBER 2013 44 .41 37 .56
31ST DECEMBER 2014 48 .00 39 .33
31ST DECEMBER 2015 50 .31 36 .60
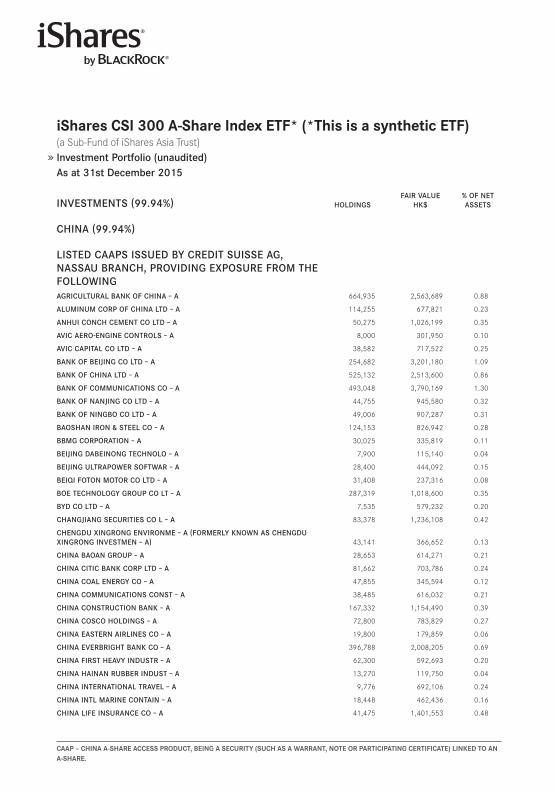
CAAp – ChinA A-ShARe ACCeSS pRodUCT, Being A SeCURiTY (SUCh AS A wARRAnT, noTe oR pARTiCipATing CeRTifiCATe) linKed To An A-ShARe.
iShares CSi 300 A-Share index eTf* (*This is a synthetic eTf) (a Sub-Fund of iShares Asia Trust) Investment Portfolio (unaudited)As at 31st December 2015
INVESTMENTS (99.94%) HolDINgSFAIR VAlUE
HK$% oF NET ASSETS
CHINA (99.94%)
lISTED CAAPS ISSUED By CREDIT SUISSE Ag, NASSAU BRANCH, PRoVIDINg EXPoSURE FRoM THE FollowINgAgRICUlTURAl BANK oF CHINA – A 664,935 2,563,689 0 .88
AlUMINUM CoRP oF CHINA lTD – A 114,255 677,821 0 .23
ANHUI CoNCH CEMENT Co lTD – A 50,275 1,026,199 0 .35
AVIC AERo-ENgINE CoNTRolS – A 8,000 301,950 0 .10
AVIC CAPITAl Co lTD – A 38,582 717,522 0 .25
BANK oF BEIJINg Co lTD – A 254,682 3,201,180 1 .09
BANK oF CHINA lTD – A 525,132 2,513,600 0 .86
BANK oF CoMMUNICATIoNS Co – A 493,048 3,790,169 1 .30
BANK oF NANJINg Co lTD – A 44,755 945,580 0 .32
BANK oF NINgBo Co lTD – A 49,006 907,287 0 .31
BAoSHAN IRoN ﹠ STEEl Co – A 124,153 826,942 0 .28
BBMg CoRPoRATIoN – A 30,025 335,819 0 .11
BEIJINg DABEINoNg TECHNolo – A 7,900 115,140 0 .04
BEIJINg UlTRAPowER SoFTwAR – A 28,400 444,092 0 .15
BEIqI FoToN MoToR Co lTD – A 31,408 237,316 0 .08
BoE TECHNology gRoUP Co lT – A 287,319 1,018,600 0 .35
ByD Co lTD – A 7,535 579,232 0 .20
CHANgJIANg SECURITIES Co l – A 83,378 1,236,108 0 .42
CHENgDU XINgRoNg ENVIRoNME – A (FoRMERly KNowN AS CHENgDU XINgRoNg INVESTMEN – A) 43,141 366,652 0 .13
CHINA BAoAN gRoUP – A 28,653 614,271 0 .21
CHINA CITIC BANK CoRP lTD – A 81,662 703,786 0 .24
CHINA CoAl ENERgy Co – A 47,855 345,594 0 .12
CHINA CoMMUNICATIoNS CoNST – A 38,485 616,032 0 .21
CHINA CoNSTRUCTIoN BANK – A 167,332 1,154,490 0 .39
CHINA CoSCo HolDINgS – A 72,800 783,829 0 .27
CHINA EASTERN AIRlINES Co – A 19,800 179,859 0 .06
CHINA EVERBRIgHT BANK Co – A 396,788 2,008,205 0 .69
CHINA FIRST HEAVy INDUSTR – A 62,300 592,693 0 .20
CHINA HAINAN RUBBER INDUST – A 13,270 119,750 0 .04
CHINA INTERNATIoNAl TRAVEl – A 9,776 692,106 0 .24
CHINA INTl MARINE CoNTAIN – A 18,448 462,436 0 .16
CHINA lIFE INSURANCE Co – A 41,475 1,401,553 0 .48
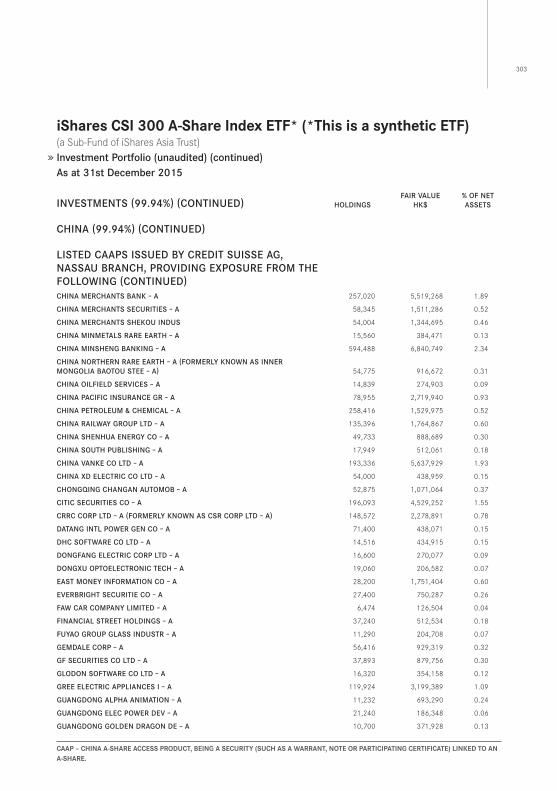
303
CAAp – ChinA A-ShARe ACCeSS pRodUCT, Being A SeCURiTY (SUCh AS A wARRAnT, noTe oR pARTiCipATing CeRTifiCATe) linKed To An A-ShARe.
iShares CSi 300 A-Share index eTf* (*This is a synthetic eTf) (a Sub-Fund of iShares Asia Trust) Investment Portfolio (unaudited) (continued)As at 31st December 2015
INVESTMENTS (99.94%) (CoNTINUED) HolDINgSFAIR VAlUE
HK$% oF NET ASSETS
CHINA (99.94%) (CoNTINUED)
lISTED CAAPS ISSUED By CREDIT SUISSE Ag, NASSAU BRANCH, PRoVIDINg EXPoSURE FRoM THE FollowINg (CoNTINUED)CHINA MERCHANTS BANK – A 257,020 5,519,268 1 .89
CHINA MERCHANTS SECURITIES – A 58,345 1,511,286 0 .52
CHINA MERCHANTS SHEKoU INDUS 54,004 1,344,695 0 .46
CHINA MINMETAlS RARE EARTH – A 15,560 384,471 0 .13
CHINA MINSHENg BANKINg – A 594,488 6,840,749 2 .34
CHINA NoRTHERN RARE EARTH – A (FoRMERly KNowN AS INNER MoNgolIA BAoToU STEE – A) 54,775 916,672 0 .31
CHINA oIlFIElD SERVICES – A 14,839 274,903 0 .09
CHINA PACIFIC INSURANCE gR – A 78,955 2,719,940 0 .93
CHINA PETRolEUM ﹠ CHEMICAl – A 258,416 1,529,975 0 .52
CHINA RAIlwAy gRoUP lTD – A 135,396 1,764,867 0 .60
CHINA SHENHUA ENERgy Co – A 49,733 888,689 0 .30
CHINA SoUTH PUBlISHINg – A 17,949 512,061 0 .18
CHINA VANKE Co lTD – A 193,336 5,637,929 1 .93
CHINA XD ElECTRIC Co lTD – A 54,000 438,959 0 .15
CHoNgqINg CHANgAN AUToMoB – A 52,875 1,071,064 0 .37
CITIC SECURITIES Co – A 196,093 4,529,252 1 .55
CRRC CoRP lTD – A (FoRMERly KNowN AS CSR CoRP lTD – A) 148,572 2,278,891 0 .78
DATANg INTl PowER gEN Co – A 71,400 438,071 0 .15
DHC SoFTwARE Co lTD – A 14,516 434,915 0 .15
DoNgFANg ElECTRIC CoRP lTD – A 16,600 270,077 0 .09
DoNgXU oPToElECTRoNIC TECH – A 19,060 206,582 0 .07
EAST MoNEy INFoRMATIoN Co – A 28,200 1,751,404 0 .60
EVERBRIgHT SECURITIE Co – A 27,400 750,287 0 .26
FAw CAR CoMPANy lIMITED – A 6,474 126,504 0 .04
FINANCIAl STREET HolDINgS – A 37,240 512,534 0 .18
FUyAo gRoUP glASS INDUSTR – A 11,290 204,708 0 .07
gEMDAlE CoRP – A 56,416 929,319 0 .32
gF SECURITIES Co lTD – A 37,893 879,756 0 .30
gloDoN SoFTwARE Co lTD – A 16,320 354,158 0 .12
gREE ElECTRIC APPlIANCES I – A 119,924 3,199,389 1 .09
gUANgDoNg AlPHA ANIMATIoN – A 11,232 693,290 0 .24
gUANgDoNg ElEC PowER DEV – A 21,240 186,348 0 .06
gUANgDoNg golDEN DRAgoN DE – A 10,700 371,928 0 .13
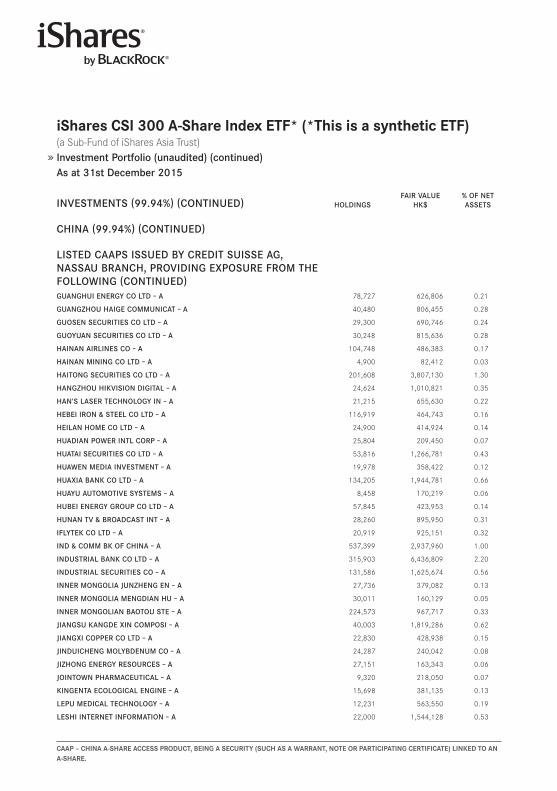
CAAp – ChinA A-ShARe ACCeSS pRodUCT, Being A SeCURiTY (SUCh AS A wARRAnT, noTe oR pARTiCipATing CeRTifiCATe) linKed To An A-ShARe.
iShares CSi 300 A-Share index eTf* (*This is a synthetic eTf) (a Sub-Fund of iShares Asia Trust) Investment Portfolio (unaudited) (continued)As at 31st December 2015
INVESTMENTS (99.94%) (CoNTINUED) HolDINgSFAIR VAlUE
HK$% oF NET ASSETS
CHINA (99.94%) (CoNTINUED)
lISTED CAAPS ISSUED By CREDIT SUISSE Ag, NASSAU BRANCH, PRoVIDINg EXPoSURE FRoM THE FollowINg (CoNTINUED)gUANgHUI ENERgy Co lTD – A 78,727 626,806 0 .21
gUANgzHoU HAIgE CoMMUNICAT – A 40,480 806,455 0 .28
gUoSEN SECURITIES Co lTD – A 29,300 690,746 0 .24
gUoyUAN SECURITIES Co lTD – A 30,248 815,636 0 .28
HAINAN AIRlINES Co – A 104,748 486,383 0 .17
HAINAN MININg Co lTD – A 4,900 82,412 0 .03
HAIToNg SECURITIES Co lTD – A 201,608 3,807,130 1 .30
HANgzHoU HIKVISIoN DIgITAl – A 24,624 1,010,821 0 .35
HAN’S lASER TECHNology IN – A 21,215 655,630 0 .22
HEBEI IRoN ﹠ STEEl Co lTD – A 116,919 464,743 0 .16
HEIlAN HoME Co lTD – A 24,900 414,924 0 .14
HUADIAN PowER INTl CoRP – A 25,804 209,450 0 .07
HUATAI SECURITIES Co lTD – A 53,816 1,266,781 0 .43
HUAwEN MEDIA INVESTMENT – A 19,978 358,422 0 .12
HUAXIA BANK Co lTD – A 134,205 1,944,781 0 .66
HUAyU AUToMoTIVE SySTEMS – A 8,458 170,219 0 .06
HUBEI ENERgy gRoUP Co lTD – A 57,845 423,953 0 .14
HUNAN TV ﹠ BRoADCAST INT – A 28,260 895,950 0 .31
IFlyTEK Co lTD – A 20,919 925,151 0 .32
IND ﹠ CoMM BK oF CHINA – A 537,399 2,937,960 1 .00
INDUSTRIAl BANK Co lTD – A 315,903 6,436,809 2 .20
INDUSTRIAl SECURITIES Co – A 131,586 1,625,674 0 .56
INNER MoNgolIA JUNzHENg EN – A 27,736 379,082 0 .13
INNER MoNgolIA MENgDIAN HU – A 30,011 160,129 0 .05
INNER MoNgolIAN BAoToU STE – A 224,573 967,717 0 .33
JIANgSU KANgDE XIN CoMPoSI – A 40,003 1,819,286 0 .62
JIANgXI CoPPER Co lTD – A 22,830 428,938 0 .15
JINDUICHENg MolyBDENUM Co – A 24,287 240,042 0 .08
JIzHoNg ENERgy RESoURCES – A 27,151 163,343 0 .06
JoINTowN PHARMACEUTICAl – A 9,320 218,050 0 .07
KINgENTA ECologICAl ENgINE – A 15,698 381,135 0 .13
lEPU MEDICAl TECHNology – A 12,231 563,550 0 .19
lESHI INTERNET INFoRMATIoN – A 22,000 1,544,128 0 .53
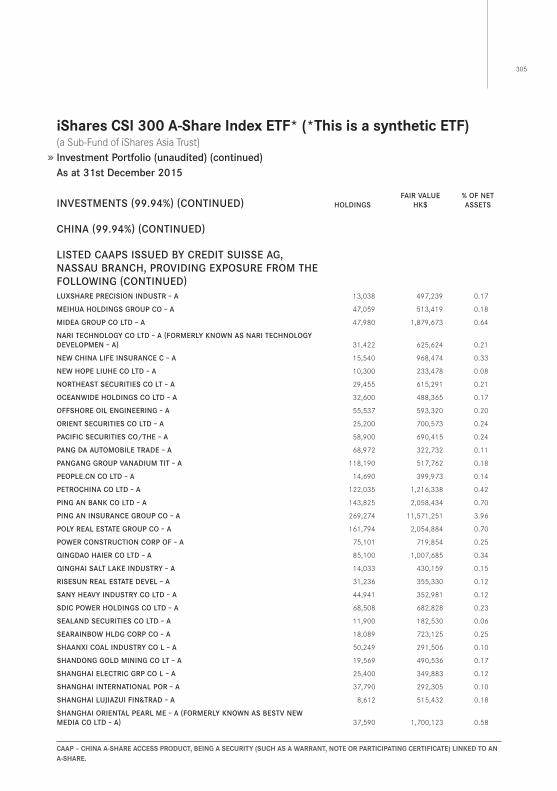
305
CAAp – ChinA A-ShARe ACCeSS pRodUCT, Being A SeCURiTY (SUCh AS A wARRAnT, noTe oR pARTiCipATing CeRTifiCATe) linKed To An A-ShARe.
iShares CSi 300 A-Share index eTf* (*This is a synthetic eTf) (a Sub-Fund of iShares Asia Trust) Investment Portfolio (unaudited) (continued)As at 31st December 2015
INVESTMENTS (99.94%) (CoNTINUED) HolDINgSFAIR VAlUE
HK$% oF NET ASSETS
CHINA (99.94%) (CoNTINUED)
lISTED CAAPS ISSUED By CREDIT SUISSE Ag, NASSAU BRANCH, PRoVIDINg EXPoSURE FRoM THE FollowINg (CoNTINUED)lUXSHARE PRECISIoN INDUSTR – A 13,038 497,239 0 .17
MEIHUA HolDINgS gRoUP Co – A 47,059 513,419 0 .18
MIDEA gRoUP Co lTD – A 47,980 1,879,673 0 .64
NARI TECHNology Co lTD – A (FoRMERly KNowN AS NARI TECHNology DEVEloPMEN – A) 31,422 625,624 0 .21
NEw CHINA lIFE INSURANCE C – A 15,540 968,474 0 .33
NEw HoPE lIUHE Co lTD – A 10,300 233,478 0 .08
NoRTHEAST SECURITIES Co lT – A 29,455 615,291 0 .21
oCEANwIDE HolDINgS Co lTD – A 32,600 488,365 0 .17
oFFSHoRE oIl ENgINEERINg – A 55,537 593,320 0 .20
oRIENT SECURITIES Co lTD – A 25,200 700,573 0 .24
PACIFIC SECURITIES Co/THE – A 58,900 690,415 0 .24
PANg DA AUToMoBIlE TRADE – A 68,972 322,732 0 .11
PANgANg gRoUP VANADIUM TIT – A 118,190 517,762 0 .18
PEoPlE.CN Co lTD – A 14,690 399,973 0 .14
PETRoCHINA Co lTD – A 122,035 1,216,338 0 .42
PINg AN BANK Co lTD – A 143,825 2,058,434 0 .70
PINg AN INSURANCE gRoUP Co – A 269,274 11,571,251 3 .96
Poly REAl ESTATE gRoUP Co – A 161,794 2,054,884 0 .70
PowER CoNSTRUCTIoN CoRP oF – A 75,101 719,854 0 .25
qINgDAo HAIER Co lTD – A 85,100 1,007,685 0 .34
qINgHAI SAlT lAKE INDUSTRy – A 14,033 430,159 0 .15
RISESUN REAl ESTATE DEVEl – A 31,236 355,330 0 .12
SANy HEAVy INDUSTRy Co lTD – A 44,941 352,981 0 .12
SDIC PowER HolDINgS Co lTD – A 68,508 682,828 0 .23
SEAlAND SECURITIES Co lTD – A 11,900 182,530 0 .06
SEARAINBow HlDg CoRP Co – A 18,089 723,125 0 .25
SHAANXI CoAl INDUSTRy Co l – A 50,249 291,506 0 .10
SHANDoNg golD MININg Co lT – A 19,569 490,536 0 .17
SHANgHAI ElECTRIC gRP Co l – A 25,400 349,883 0 .12
SHANgHAI INTERNATIoNAl PoR – A 37,790 292,305 0 .10
SHANgHAI lUJIAzUI FIN﹠TRAD – A 8,612 515,432 0 .18
SHANgHAI oRIENTAl PEARl ME – A (FoRMERly KNowN AS BESTV NEw MEDIA Co lTD – A) 37,590 1,700,123 0 .58

CAAp – ChinA A-ShARe ACCeSS pRodUCT, Being A SeCURiTY (SUCh AS A wARRAnT, noTe oR pARTiCipATing CeRTifiCATe) linKed To An A-ShARe.
iShares CSi 300 A-Share index eTf* (*This is a synthetic eTf) (a Sub-Fund of iShares Asia Trust) Investment Portfolio (unaudited) (continued)As at 31st December 2015
INVESTMENTS (99.94%) (CoNTINUED) HolDINgSFAIR VAlUE
HK$% oF NET ASSETS
CHINA (99.94%) (CoNTINUED)
lISTED CAAPS ISSUED By CREDIT SUISSE Ag, NASSAU BRANCH, PRoVIDINg EXPoSURE FRoM THE FollowINg (CoNTINUED)SHANgHAI PUDoNg DEVEl BANK – A 232,374 5,067,683 1 .73
SHANgHAI RAAS BlooD PRoDUC – A 14,170 672,681 0 .23
SHANgHAI SMI HolDINg Co lT – A (FoRMERly KNowN AS SHANgHAI CHENgToU HolDINg – A) 37,213 1,028,766 0 .35
SHANgHAI wAIgAoqIAo FTz – A 5,850 183,442 0 .06
SHANXI lU’AN ENVIRoNMENTAl – A 30,092 230,605 0 .08
SHANXI SECURITIES Co lTD – A 20,229 367,996 0 .13
SHANXI XISHAN CoAl ﹠ ElEC – A 41,195 298,973 0 .10
SHENwAN HoNgyUAN gRoUP Co – A 111,965 1,431,381 0 .49
SHENzHEN ENERgy gRoUP Co l – A 30,001 351,308 0 .12
SHENzHEN o-FIlM TECH Co – A 15,498 573,853 0 .20
SHENzHEN oVERSEAS CHINESE – A 91,650 962,716 0 .33
SHENzHEN zHoNgJIN lINgNAN – A 34,234 573,322 0 .20
SICHUAN CHANgHoNg ElECTRIC – A 92,015 635,946 0 .22
SINolINK SECURITIES Co lTD – A 45,242 870,543 0 .30
SINoPEC SHANgHAI PETRoCHE – A 42,769 330,817 0 .11
SooCHow SECURITIES Co lTD – A 33,277 638,327 0 .22
SoUTHwEST SECURITIES Co lT – A 72,590 857,818 0 .29
SPRINg AIRlINES Co lTD – A 5,600 407,757 0 .14
SUNINg CoMMERCE gRoUP Co – A 110,341 1,771,506 0 .61
SUzHoU golD MANTIS CoNSTR – A 22,291 497,038 0 .17
TCl CoRP – A 212,878 1,082,491 0 .37
TIANJIN PoRT Co lTD – A 20,000 269,053 0 .09
TIANJIN zHoNgHUAN SEMICoND – A 18,623 271,647 0 .09
ToNgHUA DoNgBAo PHARMACEUT – A 21,120 684,963 0 .23
ToNglINg NoNFERRoUS METAlS – A 95,295 407,227 0 .14
TUS-SoUND ENVIRoNMEN-RES – A (FoRMERly KNowN AS SoUND ENVIRoNMENTAl RESoUR – A) 12,137 573,996 0 .20
UNIVERSAl SCIENTIFIC INDUS – A 546 9,424 0 .00
wANHUA CHEMICAl gRoUP Co – A 28,941 616,645 0 .21
wEICHAI PowER Co lTD – A 876 10,101 0 .00
wEIFU HIgH-TECHNology gRP – A 12,516 369,913 0 .13
wESTERN SECURITIES Co lTD – A 28,660 1,125,868 0 .39
wINTIME ENERgy Co lTD – A 59,602 339,361 0 .12
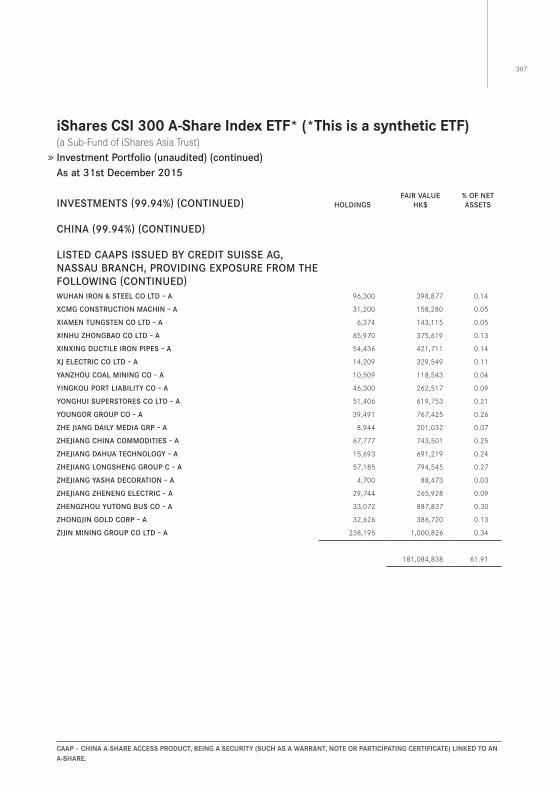
307
CAAp – ChinA A-ShARe ACCeSS pRodUCT, Being A SeCURiTY (SUCh AS A wARRAnT, noTe oR pARTiCipATing CeRTifiCATe) linKed To An A-ShARe.
iShares CSi 300 A-Share index eTf* (*This is a synthetic eTf) (a Sub-Fund of iShares Asia Trust) Investment Portfolio (unaudited) (continued)As at 31st December 2015
INVESTMENTS (99.94%) (CoNTINUED) HolDINgSFAIR VAlUE
HK$% oF NET ASSETS
CHINA (99.94%) (CoNTINUED)
lISTED CAAPS ISSUED By CREDIT SUISSE Ag, NASSAU BRANCH, PRoVIDINg EXPoSURE FRoM THE FollowINg (CoNTINUED)wUHAN IRoN ﹠ STEEl Co lTD – A 96,300 398,877 0 .14
XCMg CoNSTRUCTIoN MACHIN – A 31,200 158,280 0 .05
XIAMEN TUNgSTEN Co lTD – A 6,374 143,115 0 .05
XINHU zHoNgBAo Co lTD – A 65,970 375,619 0 .13
XINXINg DUCTIlE IRoN PIPES – A 54,436 421,711 0 .14
XJ ElECTRIC Co lTD – A 14,209 329,549 0 .11
yANzHoU CoAl MININg Co – A 10,509 118,543 0 .04
yINgKoU PoRT lIABIlITy Co – A 46,300 262,517 0 .09
yoNgHUI SUPERSToRES Co lTD – A 51,406 619,753 0 .21
yoUNgoR gRoUP Co – A 39,491 767,425 0 .26
zHE JIANg DAIly MEDIA gRP – A 8,944 201,032 0 .07
zHEJIANg CHINA CoMMoDITIES – A 67,777 743,501 0 .25
zHEJIANg DAHUA TECHNology – A 15,693 691,219 0 .24
zHEJIANg loNgSHENg gRoUP C – A 57,185 794,545 0 .27
zHEJIANg yASHA DECoRATIoN – A 4,700 88,473 0 .03
zHEJIANg zHENENg ElECTRIC – A 29,744 265,928 0 .09
zHENgzHoU yUToNg BUS Co – A 33,072 887,837 0 .30
zHoNgJIN golD CoRP – A 32,626 386,720 0 .13
zIJIN MININg gRoUP Co lTD – A 238,195 1,000,826 0 .34
181,084,838 61 .91
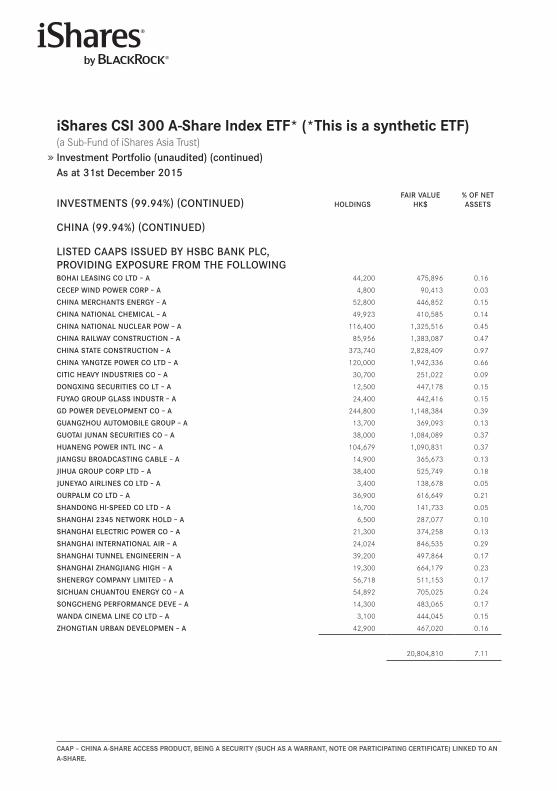
CAAp – ChinA A-ShARe ACCeSS pRodUCT, Being A SeCURiTY (SUCh AS A wARRAnT, noTe oR pARTiCipATing CeRTifiCATe) linKed To An A-ShARe.
iShares CSi 300 A-Share index eTf* (*This is a synthetic eTf) (a Sub-Fund of iShares Asia Trust) Investment Portfolio (unaudited) (continued)As at 31st December 2015
INVESTMENTS (99.94%) (CoNTINUED) HolDINgSFAIR VAlUE
HK$% oF NET ASSETS
CHINA (99.94%) (CoNTINUED)
lISTED CAAPS ISSUED By HSBC BANK PlC, PRoVIDINg EXPoSURE FRoM THE FollowINgBoHAI lEASINg Co lTD – A 44,200 475,896 0 .16
CECEP wIND PowER CoRP – A 4,800 90,413 0 .03
CHINA MERCHANTS ENERgy – A 52,800 446,852 0 .15
CHINA NATIoNAl CHEMICAl – A 49,923 410,585 0 .14
CHINA NATIoNAl NUClEAR Pow – A 116,400 1,325,516 0 .45
CHINA RAIlwAy CoNSTRUCTIoN – A 85,956 1,383,087 0 .47
CHINA STATE CoNSTRUCTIoN – A 373,740 2,828,409 0 .97
CHINA yANgTzE PowER Co lTD – A 120,000 1,942,336 0 .66
CITIC HEAVy INDUSTRIES Co – A 30,700 251,022 0 .09
DoNgXINg SECURITIES Co lT – A 12,500 447,178 0 .15
FUyAo gRoUP glASS INDUSTR – A 24,400 442,416 0 .15
gD PowER DEVEloPMENT Co – A 244,800 1,148,384 0 .39
gUANgzHoU AUToMoBIlE gRoUP – A 13,700 369,093 0 .13
gUoTAI JUNAN SECURITIES Co – A 38,000 1,084,089 0 .37
HUANENg PowER INTl INC – A 104,679 1,090,831 0 .37
JIANgSU BRoADCASTINg CABlE – A 14,900 365,673 0 .13
JIHUA gRoUP CoRP lTD – A 38,400 525,749 0 .18
JUNEyAo AIRlINES Co lTD – A 3,400 138,678 0 .05
oURPAlM Co lTD – A 36,900 616,649 0 .21
SHANDoNg HI-SPEED Co lTD – A 16,700 141,733 0 .05
SHANgHAI 2345 NETwoRK HolD – A 6,500 287,077 0 .10
SHANgHAI ElECTRIC PowER Co – A 21,300 374,258 0 .13
SHANgHAI INTERNATIoNAl AIR – A 24,024 846,535 0 .29
SHANgHAI TUNNEl ENgINEERIN – A 39,200 497,864 0 .17
SHANgHAI zHANgJIANg HIgH – A 19,300 664,179 0 .23
SHENERgy CoMPANy lIMITED – A 56,718 511,153 0 .17
SICHUAN CHUANToU ENERgy Co – A 54,892 705,025 0 .24
SoNgCHENg PERFoRMANCE DEVE – A 14,300 483,065 0 .17
wANDA CINEMA lINE Co lTD – A 3,100 444,045 0 .15
zHoNgTIAN URBAN DEVEloPMEN – A 42,900 467,020 0 .16
20,804,810 7 .11
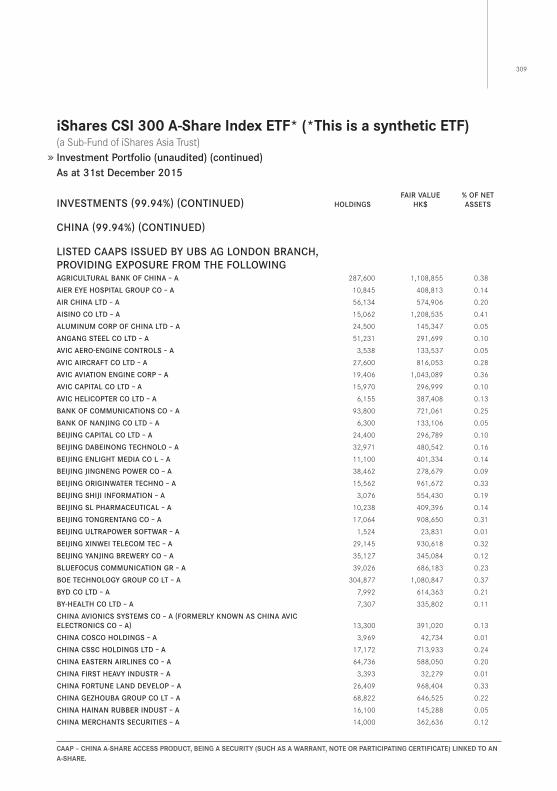
309
CAAp – ChinA A-ShARe ACCeSS pRodUCT, Being A SeCURiTY (SUCh AS A wARRAnT, noTe oR pARTiCipATing CeRTifiCATe) linKed To An A-ShARe.
iShares CSi 300 A-Share index eTf* (*This is a synthetic eTf) (a Sub-Fund of iShares Asia Trust) Investment Portfolio (unaudited) (continued)As at 31st December 2015
INVESTMENTS (99.94%) (CoNTINUED) HolDINgSFAIR VAlUE
HK$% oF NET ASSETS
CHINA (99.94%) (CoNTINUED)
lISTED CAAPS ISSUED By UBS Ag loNDoN BRANCH, PRoVIDINg EXPoSURE FRoM THE FollowINgAgRICUlTURAl BANK oF CHINA – A 287,600 1,108,855 0 .38
AIER EyE HoSPITAl gRoUP Co – A 10,845 408,813 0 .14
AIR CHINA lTD – A 56,134 574,906 0 .20
AISINo Co lTD – A 15,062 1,208,535 0 .41
AlUMINUM CoRP oF CHINA lTD – A 24,500 145,347 0 .05
ANgANg STEEl Co lTD – A 51,231 291,699 0 .10
AVIC AERo-ENgINE CoNTRolS – A 3,538 133,537 0 .05
AVIC AIRCRAFT Co lTD – A 27,600 816,053 0 .28
AVIC AVIATIoN ENgINE CoRP – A 19,406 1,043,089 0 .36
AVIC CAPITAl Co lTD – A 15,970 296,999 0 .10
AVIC HElICoPTER Co lTD – A 6,155 387,408 0 .13
BANK oF CoMMUNICATIoNS Co – A 93,800 721,061 0 .25
BANK oF NANJINg Co lTD – A 6,300 133,106 0 .05
BEIJINg CAPITAl Co lTD – A 24,400 296,789 0 .10
BEIJINg DABEINoNg TECHNolo – A 32,971 480,542 0 .16
BEIJINg ENlIgHT MEDIA Co l – A 11,100 401,334 0 .14
BEIJINg JINgNENg PowER Co – A 38,462 278,679 0 .09
BEIJINg oRIgINwATER TECHNo – A 15,562 961,672 0 .33
BEIJINg SHIJI INFoRMATIoN – A 3,076 554,430 0 .19
BEIJINg Sl PHARMACEUTICAl – A 10,238 409,396 0 .14
BEIJINg ToNgRENTANg Co – A 17,064 908,650 0 .31
BEIJINg UlTRAPowER SoFTwAR – A 1,524 23,831 0 .01
BEIJINg XINwEI TElECoM TEC – A 29,145 930,618 0 .32
BEIJINg yANJINg BREwERy Co – A 35,127 345,084 0 .12
BlUEFoCUS CoMMUNICATIoN gR – A 39,026 686,183 0 .23
BoE TECHNology gRoUP Co lT – A 304,877 1,080,847 0 .37
ByD Co lTD – A 7,992 614,363 0 .21
By-HEAlTH Co lTD – A 7,307 335,802 0 .11
CHINA AVIoNICS SySTEMS Co – A (FoRMERly KNowN AS CHINA AVIC ElECTRoNICS Co – A) 13,300 391,020 0 .13
CHINA CoSCo HolDINgS – A 3,969 42,734 0 .01
CHINA CSSC HolDINgS lTD – A 17,172 713,933 0 .24
CHINA EASTERN AIRlINES Co – A 64,736 588,050 0 .20
CHINA FIRST HEAVy INDUSTR – A 3,393 32,279 0 .01
CHINA FoRTUNE lAND DEVEloP – A 26,409 968,404 0 .33
CHINA gEzHoUBA gRoUP Co lT – A 68,822 646,525 0 .22
CHINA HAINAN RUBBER INDUST – A 16,100 145,288 0 .05
CHINA MERCHANTS SECURITIES – A 14,000 362,636 0 .12
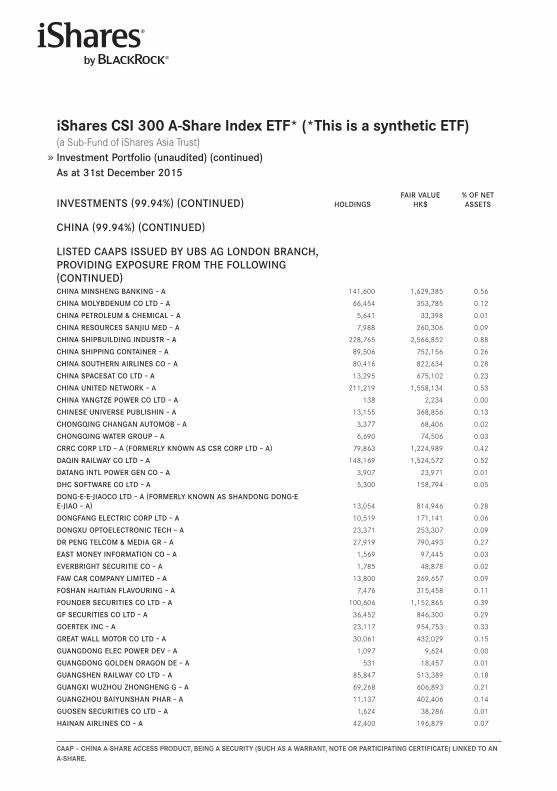
CAAp – ChinA A-ShARe ACCeSS pRodUCT, Being A SeCURiTY (SUCh AS A wARRAnT, noTe oR pARTiCipATing CeRTifiCATe) linKed To An A-ShARe.
iShares CSi 300 A-Share index eTf* (*This is a synthetic eTf) (a Sub-Fund of iShares Asia Trust) Investment Portfolio (unaudited) (continued)As at 31st December 2015
INVESTMENTS (99.94%) (CoNTINUED) HolDINgSFAIR VAlUE
HK$% oF NET ASSETS
CHINA (99.94%) (CoNTINUED)
lISTED CAAPS ISSUED By UBS Ag loNDoN BRANCH, PRoVIDINg EXPoSURE FRoM THE FollowINg(CoNTINUED)CHINA MINSHENg BANKINg – A 141,600 1,629,385 0 .56
CHINA MolyBDENUM Co lTD – A 66,454 353,785 0 .12
CHINA PETRolEUM ﹠ CHEMICAl – A 5,641 33,398 0 .01
CHINA RESoURCES SANJIU MED – A 7,988 260,306 0 .09
CHINA SHIPBUIlDINg INDUSTR – A 228,765 2,566,852 0 .88
CHINA SHIPPINg CoNTAINER – A 89,506 752,156 0 .26
CHINA SoUTHERN AIRlINES Co – A 80,416 822,634 0 .28
CHINA SPACESAT Co lTD – A 13,295 675,102 0 .23
CHINA UNITED NETwoRK – A 211,219 1,558,134 0 .53
CHINA yANgTzE PowER Co lTD – A 138 2,234 0 .00
CHINESE UNIVERSE PUBlISHIN – A 13,155 368,856 0 .13
CHoNgqINg CHANgAN AUToMoB – A 3,377 68,406 0 .02
CHoNgqINg wATER gRoUP – A 6,690 74,506 0 .03
CRRC CoRP lTD – A (FoRMERly KNowN AS CSR CoRP lTD – A) 79,863 1,224,989 0 .42
DAqIN RAIlwAy Co lTD – A 148,169 1,524,572 0 .52
DATANg INTl PowER gEN Co – A 3,907 23,971 0 .01
DHC SoFTwARE Co lTD – A 5,300 158,794 0 .05
DoNg-E-E-JIAoCo lTD – A (FoRMERly KNowN AS SHANDoNg DoNg-E E-JIAo – A) 13,054 814,946 0 .28
DoNgFANg ElECTRIC CoRP lTD – A 10,519 171,141 0 .06
DoNgXU oPToElECTRoNIC TECH – A 23,371 253,307 0 .09
DR PENg TElCoM ﹠ MEDIA gR – A 27,919 790,493 0 .27
EAST MoNEy INFoRMATIoN Co – A 1,569 97,445 0 .03
EVERBRIgHT SECURITIE Co – A 1,785 48,878 0 .02
FAw CAR CoMPANy lIMITED – A 13,800 269,657 0 .09
FoSHAN HAITIAN FlAVoURINg – A 7,476 315,458 0 .11
FoUNDER SECURITIES Co lTD – A 100,606 1,152,865 0 .39
gF SECURITIES Co lTD – A 36,452 846,300 0 .29
goERTEK INC – A 23,117 954,753 0 .33
gREAT wAll MoToR Co lTD – A 30,061 432,029 0 .15
gUANgDoNg ElEC PowER DEV – A 1,097 9,624 0 .00
gUANgDoNg golDEN DRAgoN DE – A 531 18,457 0 .01
gUANgSHEN RAIlwAy Co lTD – A 85,847 513,389 0 .18
gUANgXI wUzHoU zHoNgHENg g – A 69,268 606,893 0 .21
gUANgzHoU BAIyUNSHAN PHAR – A 11,137 402,406 0 .14
gUoSEN SECURITIES Co lTD – A 1,624 38,286 0 .01
HAINAN AIRlINES Co – A 42,400 196,879 0 .07
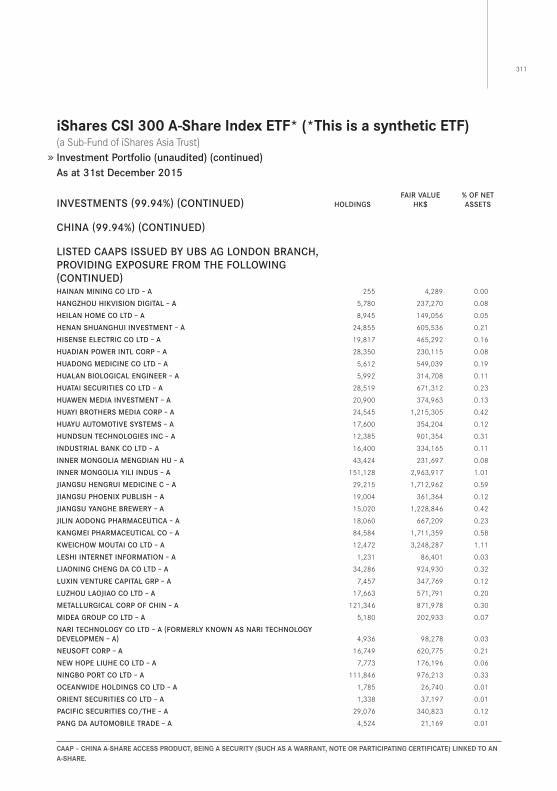
311
CAAp – ChinA A-ShARe ACCeSS pRodUCT, Being A SeCURiTY (SUCh AS A wARRAnT, noTe oR pARTiCipATing CeRTifiCATe) linKed To An A-ShARe.
iShares CSi 300 A-Share index eTf* (*This is a synthetic eTf) (a Sub-Fund of iShares Asia Trust) Investment Portfolio (unaudited) (continued)As at 31st December 2015
INVESTMENTS (99.94%) (CoNTINUED) HolDINgSFAIR VAlUE
HK$% oF NET ASSETS
CHINA (99.94%) (CoNTINUED)
lISTED CAAPS ISSUED By UBS Ag loNDoN BRANCH, PRoVIDINg EXPoSURE FRoM THE FollowINg(CoNTINUED)HAINAN MININg Co lTD – A 255 4,289 0 .00
HANgzHoU HIKVISIoN DIgITAl – A 5,780 237,270 0 .08
HEIlAN HoME Co lTD – A 8,945 149,056 0 .05
HENAN SHUANgHUI INVESTMENT – A 24,855 605,536 0 .21
HISENSE ElECTRIC Co lTD – A 19,817 465,292 0 .16
HUADIAN PowER INTl CoRP – A 28,350 230,115 0 .08
HUADoNg MEDICINE Co lTD – A 5,612 549,039 0 .19
HUAlAN BIologICAl ENgINEER – A 5,992 314,708 0 .11
HUATAI SECURITIES Co lTD – A 28,519 671,312 0 .23
HUAwEN MEDIA INVESTMENT – A 20,900 374,963 0 .13
HUAyI BRoTHERS MEDIA CoRP – A 24,545 1,215,305 0 .42
HUAyU AUToMoTIVE SySTEMS – A 17,600 354,204 0 .12
HUNDSUN TECHNologIES INC – A 12,385 901,354 0 .31
INDUSTRIAl BANK Co lTD – A 16,400 334,165 0 .11
INNER MoNgolIA MENgDIAN HU – A 43,424 231,697 0 .08
INNER MoNgolIA yIlI INDUS – A 151,128 2,963,917 1 .01
JIANgSU HENgRUI MEDICINE C – A 29,215 1,712,962 0 .59
JIANgSU PHoENIX PUBlISH – A 19,004 361,364 0 .12
JIANgSU yANgHE BREwERy – A 15,020 1,228,846 0 .42
JIlIN AoDoNg PHARMACEUTICA – A 18,060 667,209 0 .23
KANgMEI PHARMACEUTICAl Co – A 84,584 1,711,359 0 .58
KwEICHow MoUTAI Co lTD – A 12,472 3,248,287 1 .11
lESHI INTERNET INFoRMATIoN – A 1,231 86,401 0 .03
lIAoNINg CHENg DA Co lTD – A 34,286 924,930 0 .32
lUXIN VENTURE CAPITAl gRP – A 7,457 347,769 0 .12
lUzHoU lAoJIAo Co lTD – A 17,663 571,791 0 .20
METAllURgICAl CoRP oF CHIN – A 121,346 871,978 0 .30
MIDEA gRoUP Co lTD – A 5,180 202,933 0 .07
NARI TECHNology Co lTD – A (FoRMERly KNowN AS NARI TECHNology DEVEloPMEN – A) 4,936 98,278 0 .03
NEUSoFT CoRP – A 16,749 620,775 0 .21
NEw HoPE lIUHE Co lTD – A 7,773 176,196 0 .06
NINgBo PoRT Co lTD – A 111,846 976,213 0 .33
oCEANwIDE HolDINgS Co lTD – A 1,785 26,740 0 .01
oRIENT SECURITIES Co lTD – A 1,338 37,197 0 .01
PACIFIC SECURITIES Co/THE – A 29,076 340,823 0 .12
PANg DA AUToMoBIlE TRADE – A 4,524 21,169 0 .01
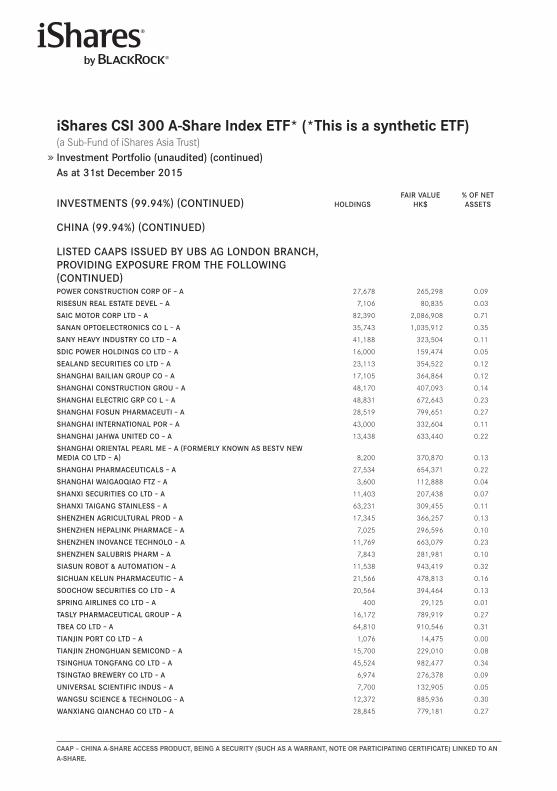
CAAp – ChinA A-ShARe ACCeSS pRodUCT, Being A SeCURiTY (SUCh AS A wARRAnT, noTe oR pARTiCipATing CeRTifiCATe) linKed To An A-ShARe.
iShares CSi 300 A-Share index eTf* (*This is a synthetic eTf) (a Sub-Fund of iShares Asia Trust) Investment Portfolio (unaudited) (continued)As at 31st December 2015
INVESTMENTS (99.94%) (CoNTINUED) HolDINgSFAIR VAlUE
HK$% oF NET ASSETS
CHINA (99.94%) (CoNTINUED)
lISTED CAAPS ISSUED By UBS Ag loNDoN BRANCH, PRoVIDINg EXPoSURE FRoM THE FollowINg(CoNTINUED)PowER CoNSTRUCTIoN CoRP oF – A 27,678 265,298 0 .09
RISESUN REAl ESTATE DEVEl – A 7,106 80,835 0 .03
SAIC MoToR CoRP lTD – A 82,390 2,086,908 0 .71
SANAN oPToElECTRoNICS Co l – A 35,743 1,035,912 0 .35
SANy HEAVy INDUSTRy Co lTD – A 41,188 323,504 0 .11
SDIC PowER HolDINgS Co lTD – A 16,000 159,474 0 .05
SEAlAND SECURITIES Co lTD – A 23,113 354,522 0 .12
SHANgHAI BAIlIAN gRoUP Co – A 17,105 364,864 0 .12
SHANgHAI CoNSTRUCTIoN gRoU – A 48,170 407,093 0 .14
SHANgHAI ElECTRIC gRP Co l – A 48,831 672,643 0 .23
SHANgHAI FoSUN PHARMACEUTI – A 28,519 799,651 0 .27
SHANgHAI INTERNATIoNAl PoR – A 43,000 332,604 0 .11
SHANgHAI JAHwA UNITED Co – A 13,438 633,440 0 .22
SHANgHAI oRIENTAl PEARl ME – A (FoRMERly KNowN AS BESTV NEw MEDIA Co lTD – A) 8,200 370,870 0 .13
SHANgHAI PHARMACEUTICAlS – A 27,534 654,371 0 .22
SHANgHAI wAIgAoqIAo FTz – A 3,600 112,888 0 .04
SHANXI SECURITIES Co lTD – A 11,403 207,438 0 .07
SHANXI TAIgANg STAINlESS – A 63,231 309,455 0 .11
SHENzHEN AgRICUlTURAl PRoD – A 17,345 366,257 0 .13
SHENzHEN HEPAlINK PHARMACE – A 7,025 296,596 0 .10
SHENzHEN INoVANCE TECHNolo – A 11,769 663,079 0 .23
SHENzHEN SAlUBRIS PHARM – A 7,843 281,981 0 .10
SIASUN RoBoT ﹠ AUToMATIoN – A 11,538 943,419 0 .32
SICHUAN KElUN PHARMACEUTIC – A 21,566 478,813 0 .16
SooCHow SECURITIES Co lTD – A 20,564 394,464 0 .13
SPRINg AIRlINES Co lTD – A 400 29,125 0 .01
TASly PHARMACEUTICAl gRoUP – A 16,172 789,919 0 .27
TBEA Co lTD – A 64,810 910,546 0 .31
TIANJIN PoRT Co lTD – A 1,076 14,475 0 .00
TIANJIN zHoNgHUAN SEMICoND – A 15,700 229,010 0 .08
TSINgHUA ToNgFANg Co lTD – A 45,524 982,477 0 .34
TSINgTAo BREwERy Co lTD – A 6,974 276,378 0 .09
UNIVERSAl SCIENTIFIC INDUS – A 7,700 132,905 0 .05
wANgSU SCIENCE ﹠ TECHNolog – A 12,372 885,936 0 .30
wANXIANg qIANCHAo Co lTD – A 28,845 779,181 0 .27
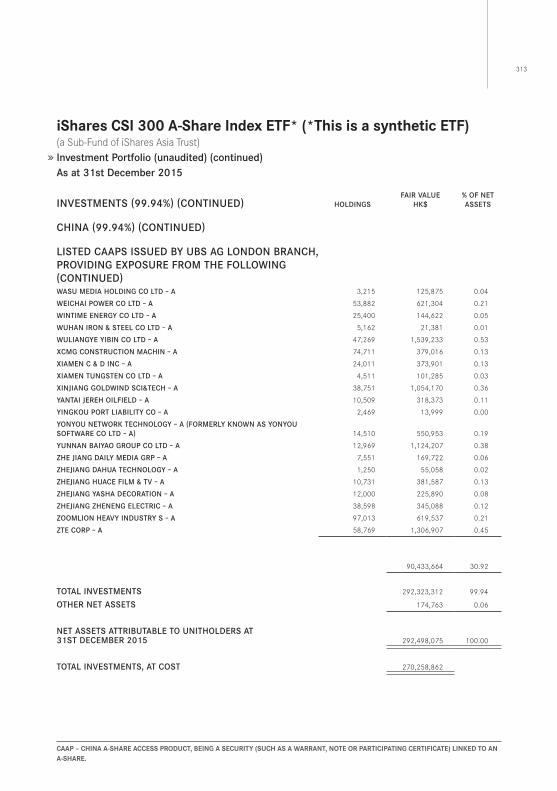
313
CAAp – ChinA A-ShARe ACCeSS pRodUCT, Being A SeCURiTY (SUCh AS A wARRAnT, noTe oR pARTiCipATing CeRTifiCATe) linKed To An A-ShARe.
iShares CSi 300 A-Share index eTf* (*This is a synthetic eTf) (a Sub-Fund of iShares Asia Trust) Investment Portfolio (unaudited) (continued)As at 31st December 2015
INVESTMENTS (99.94%) (CoNTINUED) HolDINgSFAIR VAlUE
HK$% oF NET ASSETS
CHINA (99.94%) (CoNTINUED)
lISTED CAAPS ISSUED By UBS Ag loNDoN BRANCH, PRoVIDINg EXPoSURE FRoM THE FollowINg(CoNTINUED)wASU MEDIA HolDINg Co lTD – A 3,215 125,875 0 .04
wEICHAI PowER Co lTD – A 53,882 621,304 0 .21
wINTIME ENERgy Co lTD – A 25,400 144,622 0 .05
wUHAN IRoN ﹠ STEEl Co lTD – A 5,162 21,381 0 .01
wUlIANgyE yIBIN Co lTD – A 47,269 1,539,233 0 .53
XCMg CoNSTRUCTIoN MACHIN – A 74,711 379,016 0 .13
XIAMEN C ﹠ D INC – A 24,011 373,901 0 .13
XIAMEN TUNgSTEN Co lTD – A 4,511 101,285 0 .03
XINJIANg golDwIND SCI﹠TECH – A 38,751 1,054,170 0 .36
yANTAI JEREH oIlFIElD – A 10,509 318,373 0 .11
yINgKoU PoRT lIABIlITy Co – A 2,469 13,999 0 .00
yoNyoU NETwoRK TECHNology – A (FoRMERly KNowN AS yoNyoU SoFTwARE Co lTD – A) 14,510 550,953 0 .19
yUNNAN BAIyAo gRoUP Co lTD – A 12,969 1,124,207 0 .38
zHE JIANg DAIly MEDIA gRP – A 7,551 169,722 0 .06
zHEJIANg DAHUA TECHNology – A 1,250 55,058 0 .02
zHEJIANg HUACE FIlM ﹠ TV – A 10,731 381,587 0 .13
zHEJIANg yASHA DECoRATIoN – A 12,000 225,890 0 .08
zHEJIANg zHENENg ElECTRIC – A 38,598 345,088 0 .12
zooMlIoN HEAVy INDUSTRy S – A 97,013 619,537 0 .21
zTE CoRP – A 58,769 1,306,907 0 .45
90,433,664 30 .92
ToTAl INVESTMENTS 292,323,312 99 .94
oTHER NET ASSETS 174,763 0 .06
NET ASSETS ATTRIBUTABlE To UNITHolDERS AT31ST DECEMBER 2015 292,498,075 100 .00
ToTAl INVESTMENTS, AT CoST 270,258,862
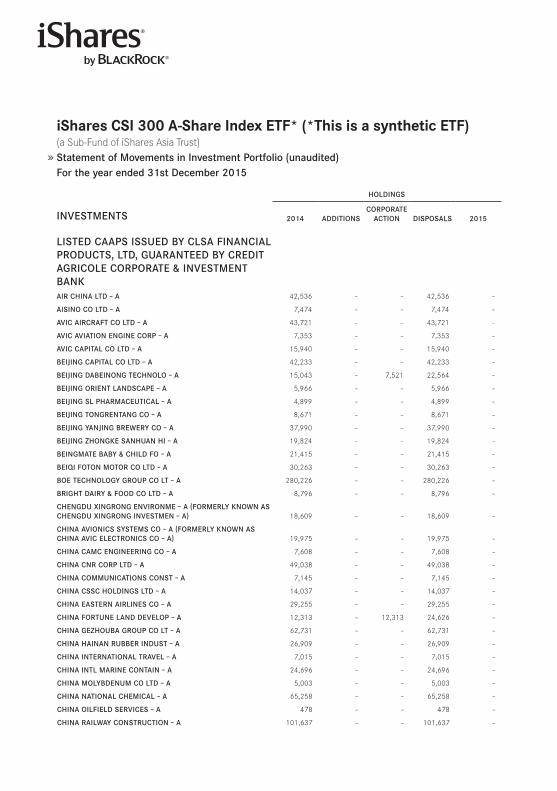
iShares CSi 300 A-Share index eTf* (*This is a synthetic eTf) (a Sub-Fund of iShares Asia Trust) Statement of Movements in Investment Portfolio (unaudited)For the year ended 31st December 2015
HolDINgS
INVESTMENTS 2014 ADDITIoNSCoRPoRATE
ACTIoN DISPoSAlS 2015
lISTED CAAPS ISSUED By ClSA FINANCIAl PRoDUCTS, lTD, gUARANTEED By CREDIT AgRIColE CoRPoRATE ﹠ INVESTMENT BANKAIR CHINA lTD – A 42,536 – – 42,536 –
AISINo Co lTD – A 7,474 – – 7,474 –
AVIC AIRCRAFT Co lTD – A 43,721 – – 43,721 –
AVIC AVIATIoN ENgINE CoRP – A 7,353 – – 7,353 –
AVIC CAPITAl Co lTD – A 15,940 – – 15,940 –
BEIJINg CAPITAl Co lTD – A 42,233 – – 42,233 –
BEIJINg DABEINoNg TECHNolo – A 15,043 – 7,521 22,564 –
BEIJINg oRIENT lANDSCAPE – A 5,966 – – 5,966 –
BEIJINg Sl PHARMACEUTICAl – A 4,899 – – 4,899 –
BEIJINg ToNgRENTANg Co – A 8,671 – – 8,671 –
BEIJINg yANJINg BREwERy Co – A 37,990 – – 37,990 –
BEIJINg zHoNgKE SANHUAN HI – A 19,824 – – 19,824 –
BEINgMATE BABy ﹠ CHIlD Fo – A 21,415 – – 21,415 –
BEIqI FoToN MoToR Co lTD – A 30,263 – – 30,263 –
BoE TECHNology gRoUP Co lT – A 280,226 – – 280,226 –
BRIgHT DAIRy ﹠ FooD Co lTD – A 8,796 – – 8,796 –
CHENgDU XINgRoNg ENVIRoNME – A (FoRMERly KNowN AS CHENgDU XINgRoNg INVESTMEN – A) 18,609 – – 18,609 –
CHINA AVIoNICS SySTEMS Co – A (FoRMERly KNowN AS CHINA AVIC ElECTRoNICS Co – A) 19,975 – – 19,975 –
CHINA CAMC ENgINEERINg Co – A 7,608 – – 7,608 –
CHINA CNR CoRP lTD – A 49,038 – – 49,038 –
CHINA CoMMUNICATIoNS CoNST – A 7,145 – – 7,145 –
CHINA CSSC HolDINgS lTD – A 14,037 – – 14,037 –
CHINA EASTERN AIRlINES Co – A 29,255 – – 29,255 –
CHINA FoRTUNE lAND DEVEloP – A 12,313 – 12,313 24,626 –
CHINA gEzHoUBA gRoUP Co lT – A 62,731 – – 62,731 –
CHINA HAINAN RUBBER INDUST – A 26,909 – – 26,909 –
CHINA INTERNATIoNAl TRAVEl – A 7,015 – – 7,015 –
CHINA INTl MARINE CoNTAIN – A 24,696 – – 24,696 –
CHINA MolyBDENUM Co lTD – A 5,003 – – 5,003 –
CHINA NATIoNAl CHEMICAl – A 65,258 – – 65,258 –
CHINA oIlFIElD SERVICES – A 478 – – 478 –
CHINA RAIlwAy CoNSTRUCTIoN – A 101,637 – – 101,637 –
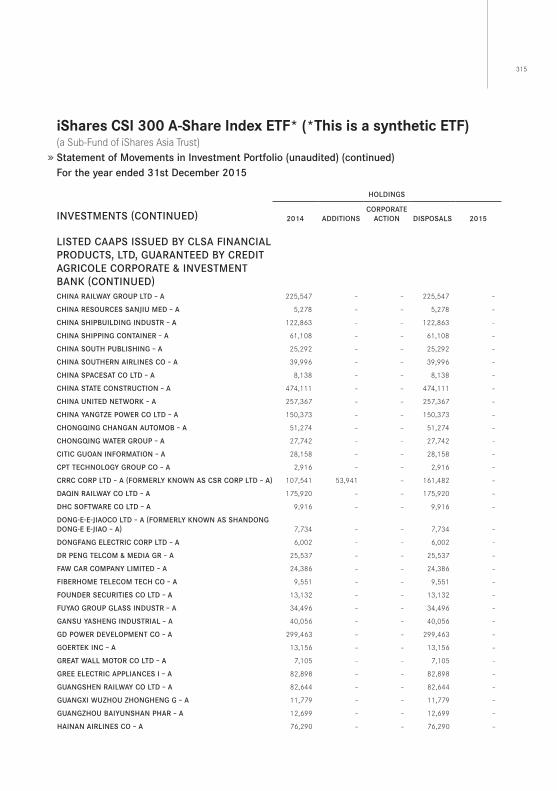
315
iShares CSi 300 A-Share index eTf* (*This is a synthetic eTf) (a Sub-Fund of iShares Asia Trust) Statement of Movements in Investment Portfolio (unaudited) (continued)For the year ended 31st December 2015
HolDINgS
INVESTMENTS (CoNTINUED) 2014 ADDITIoNSCoRPoRATE
ACTIoN DISPoSAlS 2015
lISTED CAAPS ISSUED By ClSA FINANCIAl PRoDUCTS, lTD, gUARANTEED By CREDIT AgRIColE CoRPoRATE ﹠ INVESTMENT BANK (CoNTINUED)CHINA RAIlwAy gRoUP lTD – A 225,547 – – 225,547 –
CHINA RESoURCES SANJIU MED – A 5,278 – – 5,278 –
CHINA SHIPBUIlDINg INDUSTR – A 122,863 – – 122,863 –
CHINA SHIPPINg CoNTAINER – A 61,108 – – 61,108 –
CHINA SoUTH PUBlISHINg – A 25,292 – – 25,292 –
CHINA SoUTHERN AIRlINES Co – A 39,996 – – 39,996 –
CHINA SPACESAT Co lTD – A 8,138 – – 8,138 –
CHINA STATE CoNSTRUCTIoN – A 474,111 – – 474,111 –
CHINA UNITED NETwoRK – A 257,367 – – 257,367 –
CHINA yANgTzE PowER Co lTD – A 150,373 – – 150,373 –
CHoNgqINg CHANgAN AUToMoB – A 51,274 – – 51,274 –
CHoNgqINg wATER gRoUP – A 27,742 – – 27,742 –
CITIC gUoAN INFoRMATIoN – A 28,158 – – 28,158 –
CPT TECHNology gRoUP Co – A 2,916 – – 2,916 –
CRRC CoRP lTD – A (FoRMERly KNowN AS CSR CoRP lTD – A) 107,541 53,941 – 161,482 –
DAqIN RAIlwAy Co lTD – A 175,920 – – 175,920 –
DHC SoFTwARE Co lTD – A 9,916 – – 9,916 –
DoNg-E-E-JIAoCo lTD – A (FoRMERly KNowN AS SHANDoNg DoNg-E E-JIAo – A) 7,734 – – 7,734 –
DoNgFANg ElECTRIC CoRP lTD – A 6,002 – – 6,002 –
DR PENg TElCoM ﹠ MEDIA gR – A 25,537 – – 25,537 –
FAw CAR CoMPANy lIMITED – A 24,386 – – 24,386 –
FIBERHoME TElECoM TECH Co – A 9,551 – – 9,551 –
FoUNDER SECURITIES Co lTD – A 13,132 – – 13,132 –
FUyAo gRoUP glASS INDUSTR – A 34,496 – – 34,496 –
gANSU yASHENg INDUSTRIAl – A 40,056 – – 40,056 –
gD PowER DEVEloPMENT Co – A 299,463 – – 299,463 –
goERTEK INC – A 13,156 – – 13,156 –
gREAT wAll MoToR Co lTD – A 7,105 – – 7,105 –
gREE ElECTRIC APPlIANCES I – A 82,898 – – 82,898 –
gUANgSHEN RAIlwAy Co lTD – A 82,644 – – 82,644 –
gUANgXI wUzHoU zHoNgHENg g – A 11,779 – – 11,779 –
gUANgzHoU BAIyUNSHAN PHAR – A 12,699 – – 12,699 –
HAINAN AIRlINES Co – A 76,290 – – 76,290 –
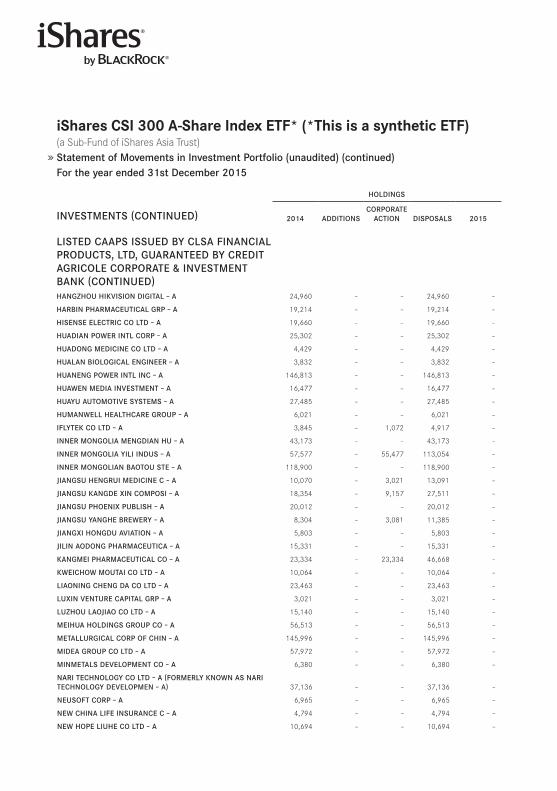
iShares CSi 300 A-Share index eTf* (*This is a synthetic eTf) (a Sub-Fund of iShares Asia Trust) Statement of Movements in Investment Portfolio (unaudited) (continued)For the year ended 31st December 2015
HolDINgS
INVESTMENTS (CoNTINUED) 2014 ADDITIoNSCoRPoRATE
ACTIoN DISPoSAlS 2015
lISTED CAAPS ISSUED By ClSA FINANCIAl PRoDUCTS, lTD, gUARANTEED By CREDIT AgRIColE CoRPoRATE ﹠ INVESTMENT BANK (CoNTINUED)HANgzHoU HIKVISIoN DIgITAl – A 24,960 – – 24,960 –
HARBIN PHARMACEUTICAl gRP – A 19,214 – – 19,214 –
HISENSE ElECTRIC Co lTD – A 19,660 – – 19,660 –
HUADIAN PowER INTl CoRP – A 25,302 – – 25,302 –
HUADoNg MEDICINE Co lTD – A 4,429 – – 4,429 –
HUAlAN BIologICAl ENgINEER – A 3,832 – – 3,832 –
HUANENg PowER INTl INC – A 146,813 – – 146,813 –
HUAwEN MEDIA INVESTMENT – A 16,477 – – 16,477 –
HUAyU AUToMoTIVE SySTEMS – A 27,485 – – 27,485 –
HUMANwEll HEAlTHCARE gRoUP – A 6,021 – – 6,021 –
IFlyTEK Co lTD – A 3,845 – 1,072 4,917 –
INNER MoNgolIA MENgDIAN HU – A 43,173 – – 43,173 –
INNER MoNgolIA yIlI INDUS – A 57,577 – 55,477 113,054 –
INNER MoNgolIAN BAoToU STE – A 118,900 – – 118,900 –
JIANgSU HENgRUI MEDICINE C – A 10,070 – 3,021 13,091 –
JIANgSU KANgDE XIN CoMPoSI – A 18,354 – 9,157 27,511 –
JIANgSU PHoENIX PUBlISH – A 20,012 – – 20,012 –
JIANgSU yANgHE BREwERy – A 8,304 – 3,081 11,385 –
JIANgXI HoNgDU AVIATIoN – A 5,803 – – 5,803 –
JIlIN AoDoNg PHARMACEUTICA – A 15,331 – – 15,331 –
KANgMEI PHARMACEUTICAl Co – A 23,334 – 23,334 46,668 –
KwEICHow MoUTAI Co lTD – A 10,064 – – 10,064 –
lIAoNINg CHENg DA Co lTD – A 23,463 – – 23,463 –
lUXIN VENTURE CAPITAl gRP – A 3,021 – – 3,021 –
lUzHoU lAoJIAo Co lTD – A 15,140 – – 15,140 –
MEIHUA HolDINgS gRoUP Co – A 56,513 – – 56,513 –
METAllURgICAl CoRP oF CHIN – A 145,996 – – 145,996 –
MIDEA gRoUP Co lTD – A 57,972 – – 57,972 –
MINMETAlS DEVEloPMENT Co – A 6,380 – – 6,380 –
NARI TECHNology Co lTD – A (FoRMERly KNowN AS NARI TECHNology DEVEloPMEN – A) 37,136 – – 37,136 –
NEUSoFT CoRP – A 6,965 – – 6,965 –
NEw CHINA lIFE INSURANCE C – A 4,794 – – 4,794 –
NEw HoPE lIUHE Co lTD – A 10,694 – – 10,694 –
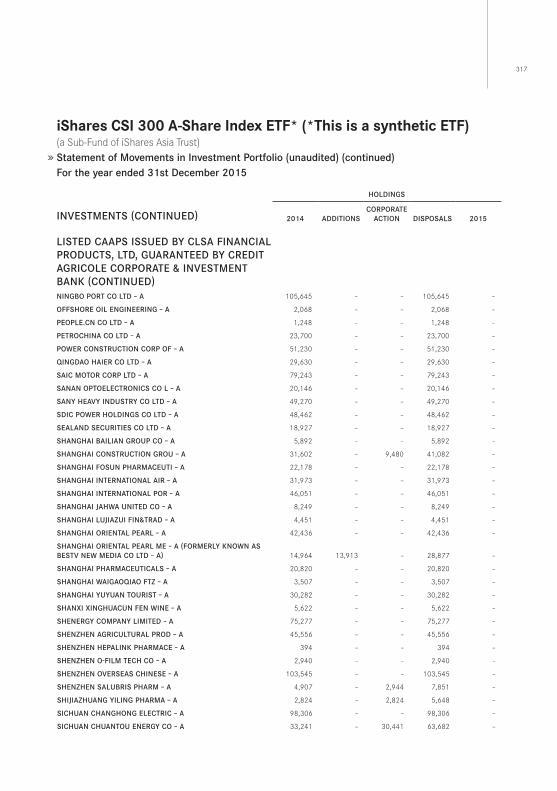
317
iShares CSi 300 A-Share index eTf* (*This is a synthetic eTf) (a Sub-Fund of iShares Asia Trust) Statement of Movements in Investment Portfolio (unaudited) (continued)For the year ended 31st December 2015
HolDINgS
INVESTMENTS (CoNTINUED) 2014 ADDITIoNSCoRPoRATE
ACTIoN DISPoSAlS 2015
lISTED CAAPS ISSUED By ClSA FINANCIAl PRoDUCTS, lTD, gUARANTEED By CREDIT AgRIColE CoRPoRATE ﹠ INVESTMENT BANK (CoNTINUED)NINgBo PoRT Co lTD – A 105,645 – – 105,645 –
oFFSHoRE oIl ENgINEERINg – A 2,068 – – 2,068 –
PEoPlE.CN Co lTD – A 1,248 – – 1,248 –
PETRoCHINA Co lTD – A 23,700 – – 23,700 –
PowER CoNSTRUCTIoN CoRP oF – A 51,230 – – 51,230 –
qINgDAo HAIER Co lTD – A 29,630 – – 29,630 –
SAIC MoToR CoRP lTD – A 79,243 – – 79,243 –
SANAN oPToElECTRoNICS Co l – A 20,146 – – 20,146 –
SANy HEAVy INDUSTRy Co lTD – A 49,270 – – 49,270 –
SDIC PowER HolDINgS Co lTD – A 48,462 – – 48,462 –
SEAlAND SECURITIES Co lTD – A 18,927 – – 18,927 –
SHANgHAI BAIlIAN gRoUP Co – A 5,892 – – 5,892 –
SHANgHAI CoNSTRUCTIoN gRoU – A 31,602 – 9,480 41,082 –
SHANgHAI FoSUN PHARMACEUTI – A 22,178 – – 22,178 –
SHANgHAI INTERNATIoNAl AIR – A 31,973 – – 31,973 –
SHANgHAI INTERNATIoNAl PoR – A 46,051 – – 46,051 –
SHANgHAI JAHwA UNITED Co – A 8,249 – – 8,249 –
SHANgHAI lUJIAzUI FIN﹠TRAD – A 4,451 – – 4,451 –
SHANgHAI oRIENTAl PEARl – A 42,436 – – 42,436 –
SHANgHAI oRIENTAl PEARl ME – A (FoRMERly KNowN AS BESTV NEw MEDIA Co lTD – A) 14,964 13,913 – 28,877 –
SHANgHAI PHARMACEUTICAlS – A 20,820 – – 20,820 –
SHANgHAI wAIgAoqIAo FTz – A 3,507 – – 3,507 –
SHANgHAI yUyUAN ToURIST – A 30,282 – – 30,282 –
SHANXI XINgHUACUN FEN wINE – A 5,622 – – 5,622 –
SHENERgy CoMPANy lIMITED – A 75,277 – – 75,277 –
SHENzHEN AgRICUlTURAl PRoD – A 45,556 – – 45,556 –
SHENzHEN HEPAlINK PHARMACE – A 394 – – 394 –
SHENzHEN o-FIlM TECH Co – A 2,940 – – 2,940 –
SHENzHEN oVERSEAS CHINESE – A 103,545 – – 103,545 –
SHENzHEN SAlUBRIS PHARM – A 4,907 – 2,944 7,851 –
SHIJIAzHUANg yIlINg PHARMA – A 2,824 – 2,824 5,648 –
SICHUAN CHANgHoNg ElECTRIC – A 98,306 – – 98,306 –
SICHUAN CHUANToU ENERgy Co – A 33,241 – 30,441 63,682 –
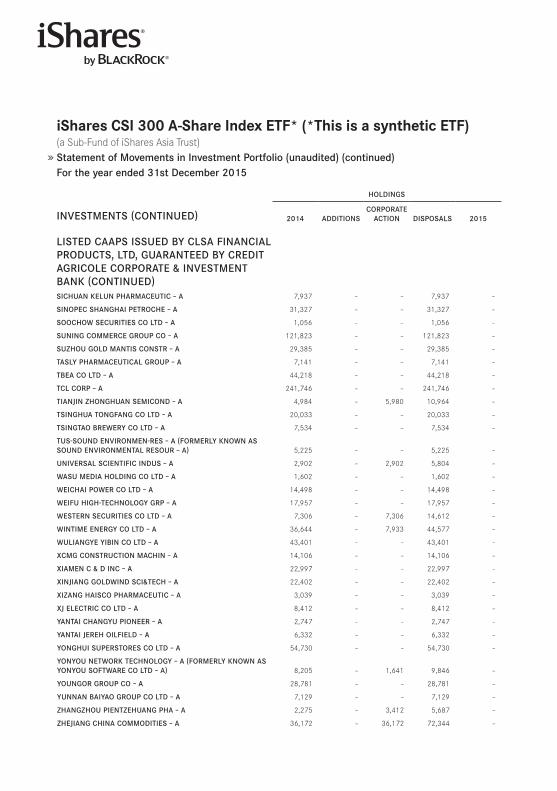
iShares CSi 300 A-Share index eTf* (*This is a synthetic eTf) (a Sub-Fund of iShares Asia Trust) Statement of Movements in Investment Portfolio (unaudited) (continued)For the year ended 31st December 2015
HolDINgS
INVESTMENTS (CoNTINUED) 2014 ADDITIoNSCoRPoRATE
ACTIoN DISPoSAlS 2015
lISTED CAAPS ISSUED By ClSA FINANCIAl PRoDUCTS, lTD, gUARANTEED By CREDIT AgRIColE CoRPoRATE ﹠ INVESTMENT BANK (CoNTINUED)SICHUAN KElUN PHARMACEUTIC – A 7,937 – – 7,937 –
SINoPEC SHANgHAI PETRoCHE – A 31,327 – – 31,327 –
SooCHow SECURITIES Co lTD – A 1,056 – – 1,056 –
SUNINg CoMMERCE gRoUP Co – A 121,823 – – 121,823 –
SUzHoU golD MANTIS CoNSTR – A 29,385 – – 29,385 –
TASly PHARMACEUTICAl gRoUP – A 7,141 – – 7,141 –
TBEA Co lTD – A 44,218 – – 44,218 –
TCl CoRP – A 241,746 – – 241,746 –
TIANJIN zHoNgHUAN SEMICoND – A 4,984 – 5,980 10,964 –
TSINgHUA ToNgFANg Co lTD – A 20,033 – – 20,033 –
TSINgTAo BREwERy Co lTD – A 7,534 – – 7,534 –
TUS-SoUND ENVIRoNMEN-RES – A (FoRMERly KNowN AS SoUND ENVIRoNMENTAl RESoUR – A) 5,225 – – 5,225 –
UNIVERSAl SCIENTIFIC INDUS – A 2,902 – 2,902 5,804 –
wASU MEDIA HolDINg Co lTD – A 1,602 – – 1,602 –
wEICHAI PowER Co lTD – A 14,498 – – 14,498 –
wEIFU HIgH-TECHNology gRP – A 17,957 – – 17,957 –
wESTERN SECURITIES Co lTD – A 7,306 – 7,306 14,612 –
wINTIME ENERgy Co lTD – A 36,644 – 7,933 44,577 –
wUlIANgyE yIBIN Co lTD – A 43,401 – – 43,401 –
XCMg CoNSTRUCTIoN MACHIN – A 14,106 – – 14,106 –
XIAMEN C ﹠ D INC – A 22,997 – – 22,997 –
XINJIANg golDwIND SCI﹠TECH – A 22,402 – – 22,402 –
XIzANg HAISCo PHARMACEUTIC – A 3,039 – – 3,039 –
XJ ElECTRIC Co lTD – A 8,412 – – 8,412 –
yANTAI CHANgyU PIoNEER – A 2,747 – – 2,747 –
yANTAI JEREH oIlFIElD – A 6,332 – – 6,332 –
yoNgHUI SUPERSToRES Co lTD – A 54,730 – – 54,730 –
yoNyoU NETwoRK TECHNology – A (FoRMERly KNowN AS yoNyoU SoFTwARE Co lTD – A) 8,205 – 1,641 9,846 –
yoUNgoR gRoUP Co – A 28,781 – – 28,781 –
yUNNAN BAIyAo gRoUP Co lTD – A 7,129 – – 7,129 –
zHANgzHoU PIENTzEHUANg PHA – A 2,275 – 3,412 5,687 –
zHEJIANg CHINA CoMMoDITIES – A 36,172 – 36,172 72,344 –
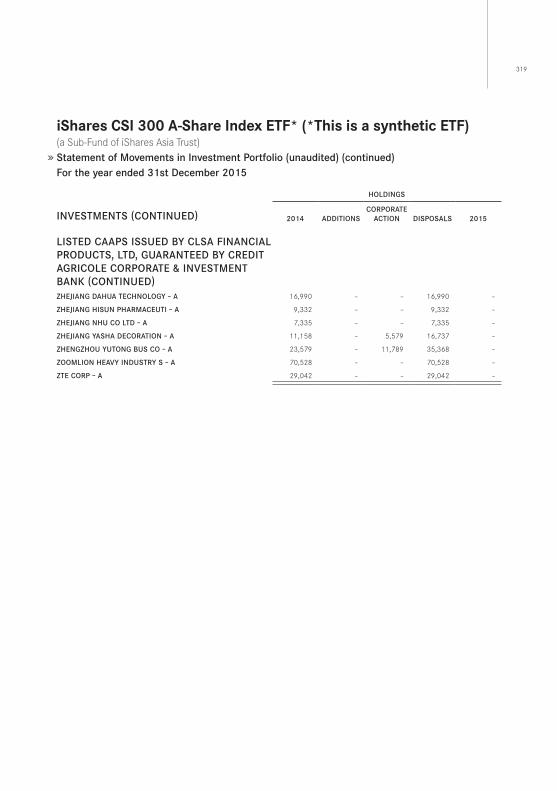
319
iShares CSi 300 A-Share index eTf* (*This is a synthetic eTf) (a Sub-Fund of iShares Asia Trust) Statement of Movements in Investment Portfolio (unaudited) (continued)For the year ended 31st December 2015
HolDINgS
INVESTMENTS (CoNTINUED) 2014 ADDITIoNSCoRPoRATE
ACTIoN DISPoSAlS 2015
lISTED CAAPS ISSUED By ClSA FINANCIAl PRoDUCTS, lTD, gUARANTEED By CREDIT AgRIColE CoRPoRATE ﹠ INVESTMENT BANK (CoNTINUED)zHEJIANg DAHUA TECHNology – A 16,990 – – 16,990 –
zHEJIANg HISUN PHARMACEUTI – A 9,332 – – 9,332 –
zHEJIANg NHU Co lTD – A 7,335 – – 7,335 –
zHEJIANg yASHA DECoRATIoN – A 11,158 – 5,579 16,737 –
zHENgzHoU yUToNg BUS Co – A 23,579 – 11,789 35,368 –
zooMlIoN HEAVy INDUSTRy S – A 70,528 – – 70,528 –
zTE CoRP – A 29,042 – – 29,042 –
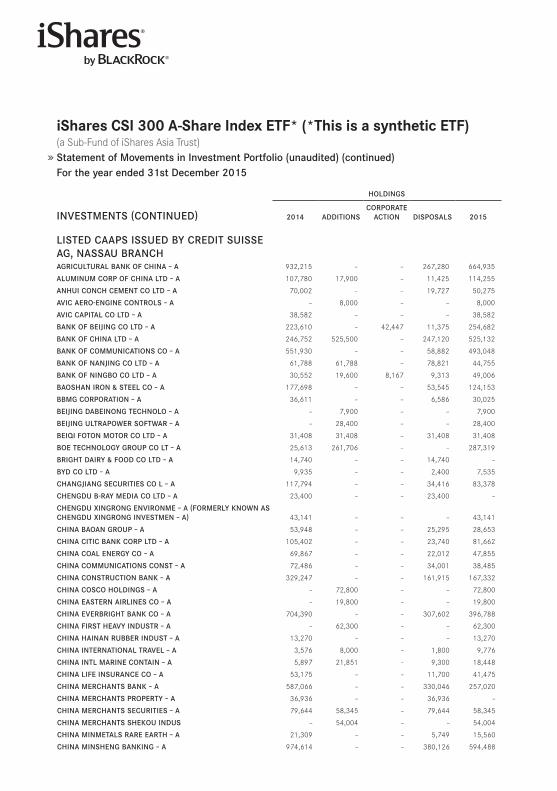
iShares CSi 300 A-Share index eTf* (*This is a synthetic eTf) (a Sub-Fund of iShares Asia Trust) Statement of Movements in Investment Portfolio (unaudited) (continued)For the year ended 31st December 2015
HolDINgS
INVESTMENTS (CoNTINUED) 2014 ADDITIoNSCoRPoRATE
ACTIoN DISPoSAlS 2015
lISTED CAAPS ISSUED By CREDIT SUISSE Ag, NASSAU BRANCHAgRICUlTURAl BANK oF CHINA – A 932,215 – – 267,280 664,935
AlUMINUM CoRP oF CHINA lTD – A 107,780 17,900 – 11,425 114,255
ANHUI CoNCH CEMENT Co lTD – A 70,002 – – 19,727 50,275
AVIC AERo-ENgINE CoNTRolS – A – 8,000 – – 8,000
AVIC CAPITAl Co lTD – A 38,582 – – – 38,582
BANK oF BEIJINg Co lTD – A 223,610 – 42,447 11,375 254,682
BANK oF CHINA lTD – A 246,752 525,500 – 247,120 525,132
BANK oF CoMMUNICATIoNS Co – A 551,930 – – 58,882 493,048
BANK oF NANJINg Co lTD – A 61,788 61,788 – 78,821 44,755
BANK oF NINgBo Co lTD – A 30,552 19,600 8,167 9,313 49,006
BAoSHAN IRoN ﹠ STEEl Co – A 177,698 – – 53,545 124,153
BBMg CoRPoRATIoN – A 36,611 – – 6,586 30,025
BEIJINg DABEINoNg TECHNolo – A – 7,900 – – 7,900
BEIJINg UlTRAPowER SoFTwAR – A – 28,400 – – 28,400
BEIqI FoToN MoToR Co lTD – A 31,408 31,408 – 31,408 31,408
BoE TECHNology gRoUP Co lT – A 25,613 261,706 – – 287,319
BRIgHT DAIRy ﹠ FooD Co lTD – A 14,740 – – 14,740 –
ByD Co lTD – A 9,935 – – 2,400 7,535
CHANgJIANg SECURITIES Co l – A 117,794 – – 34,416 83,378
CHENgDU B-RAy MEDIA Co lTD – A 23,400 – – 23,400 –
CHENgDU XINgRoNg ENVIRoNME – A (FoRMERly KNowN AS CHENgDU XINgRoNg INVESTMEN – A) 43,141 – – – 43,141
CHINA BAoAN gRoUP – A 53,948 – – 25,295 28,653
CHINA CITIC BANK CoRP lTD – A 105,402 – – 23,740 81,662
CHINA CoAl ENERgy Co – A 69,867 – – 22,012 47,855
CHINA CoMMUNICATIoNS CoNST – A 72,486 – – 34,001 38,485
CHINA CoNSTRUCTIoN BANK – A 329,247 – – 161,915 167,332
CHINA CoSCo HolDINgS – A – 72,800 – – 72,800
CHINA EASTERN AIRlINES Co – A – 19,800 – – 19,800
CHINA EVERBRIgHT BANK Co – A 704,390 – – 307,602 396,788
CHINA FIRST HEAVy INDUSTR – A – 62,300 – – 62,300
CHINA HAINAN RUBBER INDUST – A 13,270 – – – 13,270
CHINA INTERNATIoNAl TRAVEl – A 3,576 8,000 – 1,800 9,776
CHINA INTl MARINE CoNTAIN – A 5,897 21,851 – 9,300 18,448
CHINA lIFE INSURANCE Co – A 53,175 – – 11,700 41,475
CHINA MERCHANTS BANK – A 587,066 – – 330,046 257,020
CHINA MERCHANTS PRoPERTy – A 36,936 – – 36,936 –
CHINA MERCHANTS SECURITIES – A 79,644 58,345 – 79,644 58,345
CHINA MERCHANTS SHEKoU INDUS – 54,004 – – 54,004
CHINA MINMETAlS RARE EARTH – A 21,309 – – 5,749 15,560
CHINA MINSHENg BANKINg – A 974,614 – – 380,126 594,488
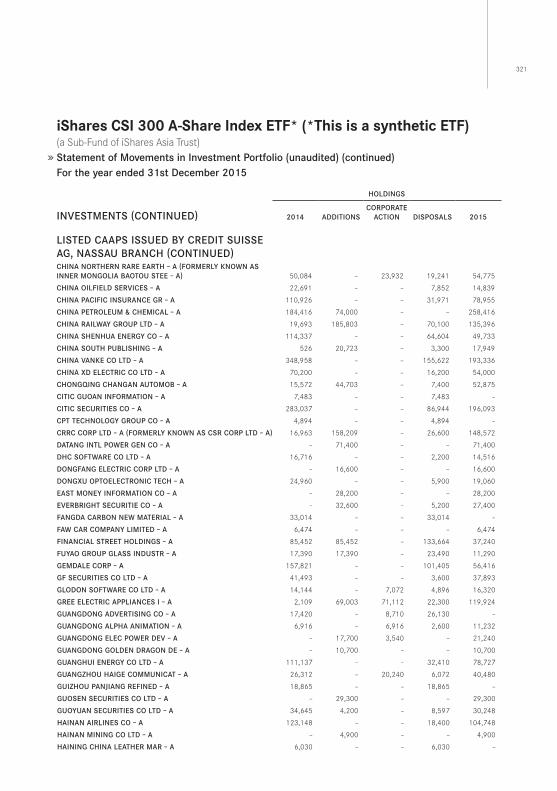
321
iShares CSi 300 A-Share index eTf* (*This is a synthetic eTf) (a Sub-Fund of iShares Asia Trust) Statement of Movements in Investment Portfolio (unaudited) (continued)For the year ended 31st December 2015
HolDINgS
INVESTMENTS (CoNTINUED) 2014 ADDITIoNSCoRPoRATE
ACTIoN DISPoSAlS 2015
lISTED CAAPS ISSUED By CREDIT SUISSE Ag, NASSAU BRANCH (CoNTINUED)CHINA NoRTHERN RARE EARTH – A (FoRMERly KNowN AS INNER MoNgolIA BAoToU STEE – A) 50,084 – 23,932 19,241 54,775
CHINA oIlFIElD SERVICES – A 22,691 – – 7,852 14,839
CHINA PACIFIC INSURANCE gR – A 110,926 – – 31,971 78,955
CHINA PETRolEUM ﹠ CHEMICAl – A 184,416 74,000 – – 258,416
CHINA RAIlwAy gRoUP lTD – A 19,693 185,803 – 70,100 135,396
CHINA SHENHUA ENERgy Co – A 114,337 – – 64,604 49,733
CHINA SoUTH PUBlISHINg – A 526 20,723 – 3,300 17,949
CHINA VANKE Co lTD – A 348,958 – – 155,622 193,336
CHINA XD ElECTRIC Co lTD – A 70,200 – – 16,200 54,000
CHoNgqINg CHANgAN AUToMoB – A 15,572 44,703 – 7,400 52,875
CITIC gUoAN INFoRMATIoN – A 7,483 – – 7,483 –
CITIC SECURITIES Co – A 283,037 – – 86,944 196,093
CPT TECHNology gRoUP Co – A 4,894 – – 4,894 –
CRRC CoRP lTD – A (FoRMERly KNowN AS CSR CoRP lTD – A) 16,963 158,209 – 26,600 148,572
DATANg INTl PowER gEN Co – A – 71,400 – – 71,400
DHC SoFTwARE Co lTD – A 16,716 – – 2,200 14,516
DoNgFANg ElECTRIC CoRP lTD – A – 16,600 – – 16,600
DoNgXU oPToElECTRoNIC TECH – A 24,960 – – 5,900 19,060
EAST MoNEy INFoRMATIoN Co – A – 28,200 – – 28,200
EVERBRIgHT SECURITIE Co – A – 32,600 – 5,200 27,400
FANgDA CARBoN NEw MATERIAl – A 33,014 – – 33,014 –
FAw CAR CoMPANy lIMITED – A 6,474 – – – 6,474
FINANCIAl STREET HolDINgS – A 85,452 85,452 – 133,664 37,240
FUyAo gRoUP glASS INDUSTR – A 17,390 17,390 – 23,490 11,290
gEMDAlE CoRP – A 157,821 – – 101,405 56,416
gF SECURITIES Co lTD – A 41,493 – – 3,600 37,893
gloDoN SoFTwARE Co lTD – A 14,144 – 7,072 4,896 16,320
gREE ElECTRIC APPlIANCES I – A 2,109 69,003 71,112 22,300 119,924
gUANgDoNg ADVERTISINg Co – A 17,420 – 8,710 26,130 –
gUANgDoNg AlPHA ANIMATIoN – A 6,916 – 6,916 2,600 11,232
gUANgDoNg ElEC PowER DEV – A – 17,700 3,540 – 21,240
gUANgDoNg golDEN DRAgoN DE – A – 10,700 – – 10,700
gUANgHUI ENERgy Co lTD – A 111,137 – – 32,410 78,727
gUANgzHoU HAIgE CoMMUNICAT – A 26,312 – 20,240 6,072 40,480
gUIzHoU PANJIANg REFINED – A 18,865 – – 18,865 –
gUoSEN SECURITIES Co lTD – A – 29,300 – – 29,300
gUoyUAN SECURITIES Co lTD – A 34,645 4,200 – 8,597 30,248
HAINAN AIRlINES Co – A 123,148 – – 18,400 104,748
HAINAN MININg Co lTD – A – 4,900 – – 4,900
HAININg CHINA lEATHER MAR – A 6,030 – – 6,030 –
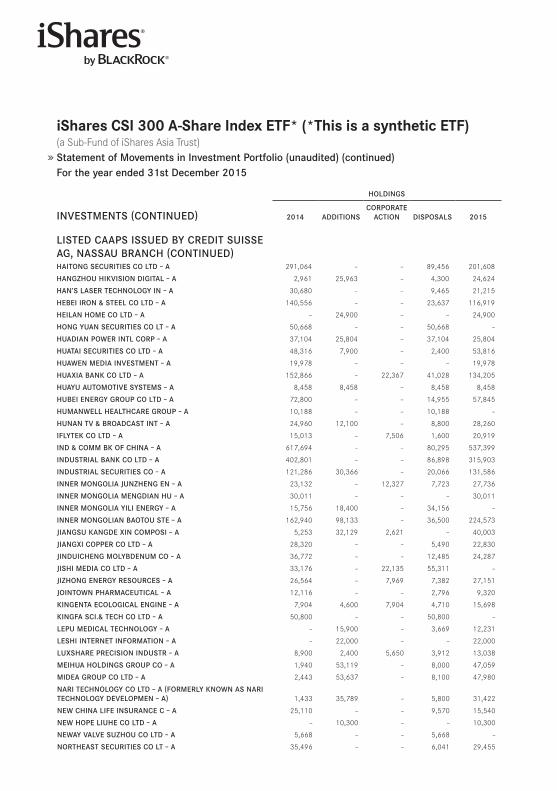
iShares CSi 300 A-Share index eTf* (*This is a synthetic eTf) (a Sub-Fund of iShares Asia Trust) Statement of Movements in Investment Portfolio (unaudited) (continued)For the year ended 31st December 2015
HolDINgS
INVESTMENTS (CoNTINUED) 2014 ADDITIoNSCoRPoRATE
ACTIoN DISPoSAlS 2015
lISTED CAAPS ISSUED By CREDIT SUISSE Ag, NASSAU BRANCH (CoNTINUED)HAIToNg SECURITIES Co lTD – A 291,064 – – 89,456 201,608
HANgzHoU HIKVISIoN DIgITAl – A 2,961 25,963 – 4,300 24,624
HAN’S lASER TECHNology IN – A 30,680 – – 9,465 21,215
HEBEI IRoN ﹠ STEEl Co lTD – A 140,556 – – 23,637 116,919
HEIlAN HoME Co lTD – A – 24,900 – – 24,900
HoNg yUAN SECURITIES Co lT – A 50,668 – – 50,668 –
HUADIAN PowER INTl CoRP – A 37,104 25,804 – 37,104 25,804
HUATAI SECURITIES Co lTD – A 48,316 7,900 – 2,400 53,816
HUAwEN MEDIA INVESTMENT – A 19,978 – – – 19,978
HUAXIA BANK Co lTD – A 152,866 – 22,367 41,028 134,205
HUAyU AUToMoTIVE SySTEMS – A 8,458 8,458 – 8,458 8,458
HUBEI ENERgy gRoUP Co lTD – A 72,800 – – 14,955 57,845
HUMANwEll HEAlTHCARE gRoUP – A 10,188 – – 10,188 –
HUNAN TV ﹠ BRoADCAST INT – A 24,960 12,100 – 8,800 28,260
IFlyTEK Co lTD – A 15,013 – 7,506 1,600 20,919
IND ﹠ CoMM BK oF CHINA – A 617,694 – – 80,295 537,399
INDUSTRIAl BANK Co lTD – A 402,801 – – 86,898 315,903
INDUSTRIAl SECURITIES Co – A 121,286 30,366 – 20,066 131,586
INNER MoNgolIA JUNzHENg EN – A 23,132 – 12,327 7,723 27,736
INNER MoNgolIA MENgDIAN HU – A 30,011 – – – 30,011
INNER MoNgolIA yIlI ENERgy – A 15,756 18,400 – 34,156 –
INNER MoNgolIAN BAoToU STE – A 162,940 98,133 – 36,500 224,573
JIANgSU KANgDE XIN CoMPoSI – A 5,253 32,129 2,621 – 40,003
JIANgXI CoPPER Co lTD – A 28,320 – – 5,490 22,830
JINDUICHENg MolyBDENUM Co – A 36,772 – – 12,485 24,287
JISHI MEDIA Co lTD – A 33,176 – 22,135 55,311 –
JIzHoNg ENERgy RESoURCES – A 26,564 – 7,969 7,382 27,151
JoINTowN PHARMACEUTICAl – A 12,116 – – 2,796 9,320
KINgENTA ECologICAl ENgINE – A 7,904 4,600 7,904 4,710 15,698
KINgFA SCI.﹠ TECH Co lTD – A 50,800 – – 50,800 –
lEPU MEDICAl TECHNology – A – 15,900 – 3,669 12,231
lESHI INTERNET INFoRMATIoN – A – 22,000 – – 22,000
lUXSHARE PRECISIoN INDUSTR – A 8,900 2,400 5,650 3,912 13,038
MEIHUA HolDINgS gRoUP Co – A 1,940 53,119 – 8,000 47,059
MIDEA gRoUP Co lTD – A 2,443 53,637 – 8,100 47,980
NARI TECHNology Co lTD – A (FoRMERly KNowN AS NARI TECHNology DEVEloPMEN – A) 1,433 35,789 – 5,800 31,422
NEw CHINA lIFE INSURANCE C – A 25,110 – – 9,570 15,540
NEw HoPE lIUHE Co lTD – A – 10,300 – – 10,300
NEwAy VAlVE SUzHoU Co lTD – A 5,668 – – 5,668 –
NoRTHEAST SECURITIES Co lT – A 35,496 – – 6,041 29,455
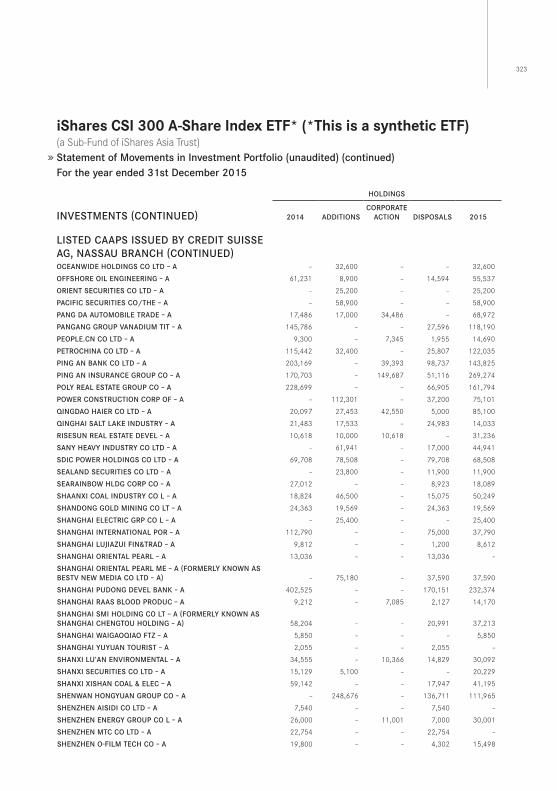
323
iShares CSi 300 A-Share index eTf* (*This is a synthetic eTf) (a Sub-Fund of iShares Asia Trust) Statement of Movements in Investment Portfolio (unaudited) (continued)For the year ended 31st December 2015
HolDINgS
INVESTMENTS (CoNTINUED) 2014 ADDITIoNSCoRPoRATE
ACTIoN DISPoSAlS 2015
lISTED CAAPS ISSUED By CREDIT SUISSE Ag, NASSAU BRANCH (CoNTINUED)oCEANwIDE HolDINgS Co lTD – A – 32,600 – – 32,600
oFFSHoRE oIl ENgINEERINg – A 61,231 8,900 – 14,594 55,537
oRIENT SECURITIES Co lTD – A – 25,200 – – 25,200
PACIFIC SECURITIES Co/THE – A – 58,900 – – 58,900
PANg DA AUToMoBIlE TRADE – A 17,486 17,000 34,486 – 68,972
PANgANg gRoUP VANADIUM TIT – A 145,786 – – 27,596 118,190
PEoPlE.CN Co lTD – A 9,300 – 7,345 1,955 14,690
PETRoCHINA Co lTD – A 115,442 32,400 – 25,807 122,035
PINg AN BANK Co lTD – A 203,169 – 39,393 98,737 143,825
PINg AN INSURANCE gRoUP Co – A 170,703 – 149,687 51,116 269,274
Poly REAl ESTATE gRoUP Co – A 228,699 – – 66,905 161,794
PowER CoNSTRUCTIoN CoRP oF – A – 112,301 – 37,200 75,101
qINgDAo HAIER Co lTD – A 20,097 27,453 42,550 5,000 85,100
qINgHAI SAlT lAKE INDUSTRy – A 21,483 17,533 – 24,983 14,033
RISESUN REAl ESTATE DEVEl – A 10,618 10,000 10,618 – 31,236
SANy HEAVy INDUSTRy Co lTD – A – 61,941 – 17,000 44,941
SDIC PowER HolDINgS Co lTD – A 69,708 78,508 – 79,708 68,508
SEAlAND SECURITIES Co lTD – A – 23,800 – 11,900 11,900
SEARAINBow HlDg CoRP Co – A 27,012 – – 8,923 18,089
SHAANXI CoAl INDUSTRy Co l – A 18,824 46,500 – 15,075 50,249
SHANDoNg golD MININg Co lT – A 24,363 19,569 – 24,363 19,569
SHANgHAI ElECTRIC gRP Co l – A – 25,400 – – 25,400
SHANgHAI INTERNATIoNAl PoR – A 112,790 – – 75,000 37,790
SHANgHAI lUJIAzUI FIN﹠TRAD – A 9,812 – – 1,200 8,612
SHANgHAI oRIENTAl PEARl – A 13,036 – – 13,036 –
SHANgHAI oRIENTAl PEARl ME – A (FoRMERly KNowN AS BESTV NEw MEDIA Co lTD – A) – 75,180 – 37,590 37,590
SHANgHAI PUDoNg DEVEl BANK – A 402,525 – – 170,151 232,374
SHANgHAI RAAS BlooD PRoDUC – A 9,212 – 7,085 2,127 14,170
SHANgHAI SMI HolDINg Co lT – A (FoRMERly KNowN AS SHANgHAI CHENgToU HolDINg – A) 58,204 – – 20,991 37,213
SHANgHAI wAIgAoqIAo FTz – A 5,850 – – – 5,850
SHANgHAI yUyUAN ToURIST – A 2,055 – – 2,055 –
SHANXI lU’AN ENVIRoNMENTAl – A 34,555 – 10,366 14,829 30,092
SHANXI SECURITIES Co lTD – A 15,129 5,100 – – 20,229
SHANXI XISHAN CoAl ﹠ ElEC – A 59,142 – – 17,947 41,195
SHENwAN HoNgyUAN gRoUP Co – A – 248,676 – 136,711 111,965
SHENzHEN AISIDI Co lTD – A 7,540 – – 7,540 –
SHENzHEN ENERgy gRoUP Co l – A 26,000 – 11,001 7,000 30,001
SHENzHEN MTC Co lTD – A 22,754 – – 22,754 –
SHENzHEN o-FIlM TECH Co – A 19,800 – – 4,302 15,498

iShares CSi 300 A-Share index eTf* (*This is a synthetic eTf) (a Sub-Fund of iShares Asia Trust) Statement of Movements in Investment Portfolio (unaudited) (continued)For the year ended 31st December 2015
HolDINgS
INVESTMENTS (CoNTINUED) 2014 ADDITIoNSCoRPoRATE
ACTIoN DISPoSAlS 2015
lISTED CAAPS ISSUED By CREDIT SUISSE Ag, NASSAU BRANCH (CoNTINUED)SHENzHEN oVERSEAS CHINESE – A 22,723 81,227 – 12,300 91,650
SHENzHEN zHoNgJIN lINgNAN – A 50,520 – – 16,286 34,234
SICHUAN CHANgHoNg ElECTRIC – A 29,408 88,607 – 26,000 92,015
SINolINK SECURITIES Co lTD – A 55,726 70,326 – 80,810 45,242
SINoPEC SHANgHAI PETRoCHE – A 52,769 – – 10,000 42,769
SooCHow SECURITIES Co lTD – A 37,977 33,277 – 37,977 33,277
SoUTHwEST SECURITIES Co lT – A 41,984 77,790 36,295 83,479 72,590
SPRINg AIRlINES Co lTD – A – 2,800 2,800 – 5,600
SUNINg CoMMERCE gRoUP Co – A 32,249 93,592 – 15,500 110,341
SUzHoU golD MANTIS CoNSTR – A 1,593 25,891 – 5,193 22,291
TANgSHAN JIDoNg CEMENT INV – A 19,660 – – 19,660 –
TCl CoRP – A 20,673 229,405 – 37,200 212,878
TIANJIN PoRT Co lTD – A – 20,000 – – 20,000
TIANJIN zHoNgHUAN SEMICoND – A 8,465 – 10,158 – 18,623
ToNgHUA DoNgBAo PHARMACEUT – A 24,960 – 2,496 6,336 21,120
ToNglINg NoNFERRoUS METAlS – A 27,279 – 109,116 41,100 95,295
TUS-SoUND ENVIRoNMEN-RES – A (FoRMERly KNowN AS SoUND ENVIRoNMENTAl RESoUR – A) 12,137 – – – 12,137
UNIVERSAl SCIENTIFIC INDUS – A 273 – 273 – 546
wANHUA CHEMICAl gRoUP Co – A 38,330 – – 9,389 28,941
wEICHAI PowER Co lTD – A 438 – 438 – 876
wEIFU HIgH-TECHNology gRP – A 3,216 13,000 – 3,700 12,516
wESTERN MININg Co – A 65,045 – – 65,045 –
wESTERN SECURITIES Co lTD – A 5,180 46,960 5,180 28,660 28,660
wINTIME ENERgy Co lTD – A 45,848 59,602 13,754 59,602 59,602
wUHAN IRoN ﹠ STEEl Co lTD – A – 96,300 – – 96,300
XCMg CoNSTRUCTIoN MACHIN – A – 10,400 20,800 – 31,200
XIAMEN TUNgSTEN Co lTD – A 6,980 – 2,094 2,700 6,374
XINHU zHoNgBAo Co lTD – A 77,547 – – 11,577 65,970
XINXINg DUCTIlE IRoN PIPES – A 73,936 – – 19,500 54,436
XIzANg HAISCo PHARMACEUTIC – A 5,204 – – 5,204 –
XJ ElECTRIC Co lTD – A 14,209 – – – 14,209
yANgqUAN CoAl INDUSTRy gRP – A 45,089 – – 45,089 –
yANzHoU CoAl MININg Co – A 22,662 – – 12,153 10,509
yINgKoU PoRT lIABIlITy Co – A – 46,300 – – 46,300
yoNgHUI SUPERSToRES Co lTD – A 2,973 55,433 – 7,000 51,406
yoUNgoR gRoUP Co – A 22,319 25,772 – 8,600 39,491
yUNNAN CHIHoNg zINC ﹠ gERM – A 35,432 – – 35,432 –
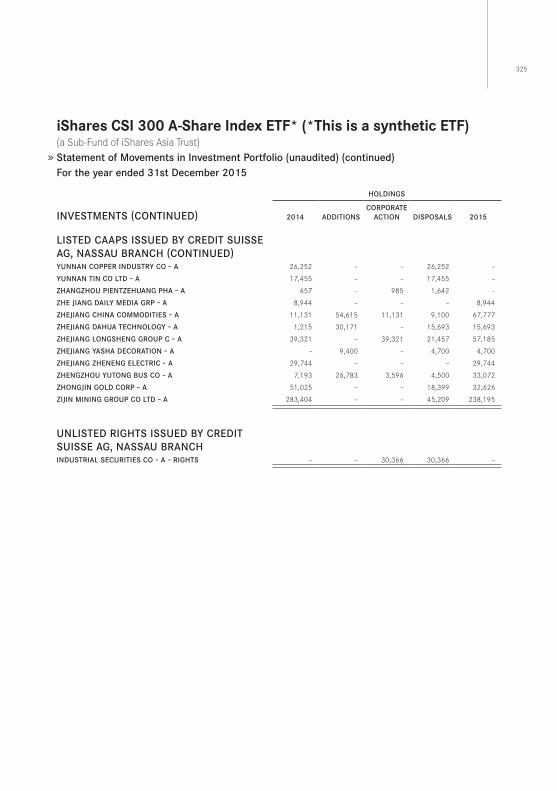
325
iShares CSi 300 A-Share index eTf* (*This is a synthetic eTf) (a Sub-Fund of iShares Asia Trust) Statement of Movements in Investment Portfolio (unaudited) (continued)For the year ended 31st December 2015
HolDINgS
INVESTMENTS (CoNTINUED) 2014 ADDITIoNSCoRPoRATE
ACTIoN DISPoSAlS 2015
lISTED CAAPS ISSUED By CREDIT SUISSE Ag, NASSAU BRANCH (CoNTINUED)yUNNAN CoPPER INDUSTRy Co – A 26,252 – – 26,252 –
yUNNAN TIN Co lTD – A 17,455 – – 17,455 –
zHANgzHoU PIENTzEHUANg PHA – A 657 – 985 1,642 –
zHE JIANg DAIly MEDIA gRP – A 8,944 – – – 8,944
zHEJIANg CHINA CoMMoDITIES – A 11,131 54,615 11,131 9,100 67,777
zHEJIANg DAHUA TECHNology – A 1,215 30,171 – 15,693 15,693
zHEJIANg loNgSHENg gRoUP C – A 39,321 – 39,321 21,457 57,185
zHEJIANg yASHA DECoRATIoN – A – 9,400 – 4,700 4,700
zHEJIANg zHENENg ElECTRIC – A 29,744 – – – 29,744
zHENgzHoU yUToNg BUS Co – A 7,193 26,783 3,596 4,500 33,072
zHoNgJIN golD CoRP – A 51,025 – – 18,399 32,626
zIJIN MININg gRoUP Co lTD – A 283,404 – – 45,209 238,195
UNlISTED RIgHTS ISSUED By CREDIT SUISSE Ag, NASSAU BRANCHINDUSTRIAl SECURITIES Co – A – RIgHTS – – 30,366 30,366 –
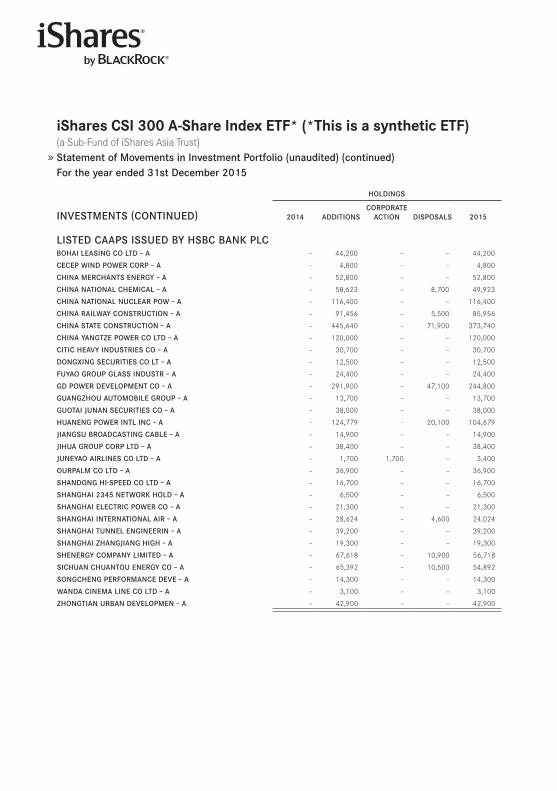
iShares CSi 300 A-Share index eTf* (*This is a synthetic eTf) (a Sub-Fund of iShares Asia Trust) Statement of Movements in Investment Portfolio (unaudited) (continued)For the year ended 31st December 2015
HolDINgS
INVESTMENTS (CoNTINUED) 2014 ADDITIoNSCoRPoRATE
ACTIoN DISPoSAlS 2015
lISTED CAAPS ISSUED By HSBC BANK PlCBoHAI lEASINg Co lTD – A – 44,200 – – 44,200
CECEP wIND PowER CoRP – A – 4,800 – – 4,800
CHINA MERCHANTS ENERgy – A – 52,800 – – 52,800
CHINA NATIoNAl CHEMICAl – A – 58,623 – 8,700 49,923
CHINA NATIoNAl NUClEAR Pow – A – 116,400 – – 116,400
CHINA RAIlwAy CoNSTRUCTIoN – A – 91,456 – 5,500 85,956
CHINA STATE CoNSTRUCTIoN – A – 445,640 – 71,900 373,740
CHINA yANgTzE PowER Co lTD – A – 120,000 – – 120,000
CITIC HEAVy INDUSTRIES Co – A – 30,700 – – 30,700
DoNgXINg SECURITIES Co lT – A – 12,500 – – 12,500
FUyAo gRoUP glASS INDUSTR – A – 24,400 – – 24,400
gD PowER DEVEloPMENT Co – A – 291,900 – 47,100 244,800
gUANgzHoU AUToMoBIlE gRoUP – A – 13,700 – – 13,700
gUoTAI JUNAN SECURITIES Co – A – 38,000 – – 38,000
HUANENg PowER INTl INC – A – 124,779 – 20,100 104,679
JIANgSU BRoADCASTINg CABlE – A – 14,900 – – 14,900
JIHUA gRoUP CoRP lTD – A – 38,400 – – 38,400
JUNEyAo AIRlINES Co lTD – A – 1,700 1,700 – 3,400
oURPAlM Co lTD – A – 36,900 – – 36,900
SHANDoNg HI-SPEED Co lTD – A – 16,700 – – 16,700
SHANgHAI 2345 NETwoRK HolD – A – 6,500 – – 6,500
SHANgHAI ElECTRIC PowER Co – A – 21,300 – – 21,300
SHANgHAI INTERNATIoNAl AIR – A – 28,624 – 4,600 24,024
SHANgHAI TUNNEl ENgINEERIN – A – 39,200 – – 39,200
SHANgHAI zHANgJIANg HIgH – A – 19,300 – – 19,300
SHENERgy CoMPANy lIMITED – A – 67,618 – 10,900 56,718
SICHUAN CHUANToU ENERgy Co – A – 65,392 – 10,500 54,892
SoNgCHENg PERFoRMANCE DEVE – A – 14,300 – – 14,300
wANDA CINEMA lINE Co lTD – A – 3,100 – – 3,100
zHoNgTIAN URBAN DEVEloPMEN – A – 42,900 – – 42,900
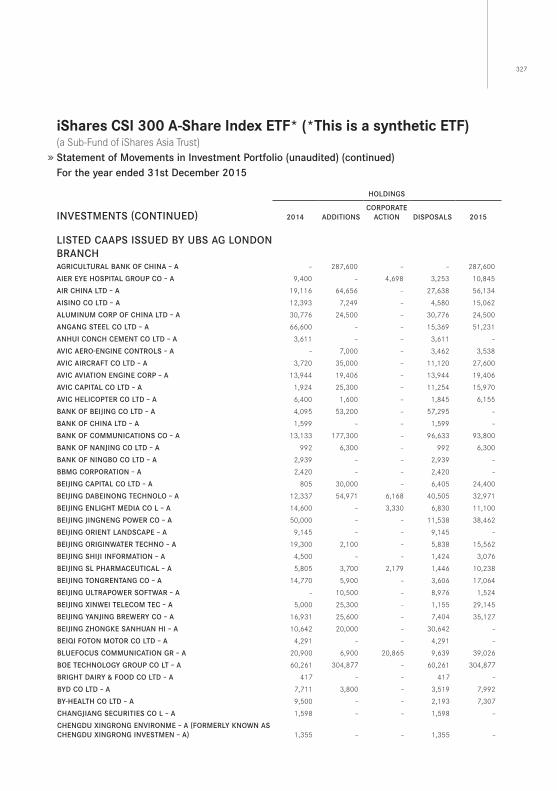
327
iShares CSi 300 A-Share index eTf* (*This is a synthetic eTf) (a Sub-Fund of iShares Asia Trust) Statement of Movements in Investment Portfolio (unaudited) (continued)For the year ended 31st December 2015
HolDINgS
INVESTMENTS (CoNTINUED) 2014 ADDITIoNSCoRPoRATE
ACTIoN DISPoSAlS 2015
lISTED CAAPS ISSUED By UBS Ag loNDoN BRANCHAgRICUlTURAl BANK oF CHINA – A – 287,600 – – 287,600
AIER EyE HoSPITAl gRoUP Co – A 9,400 – 4,698 3,253 10,845
AIR CHINA lTD – A 19,116 64,656 – 27,638 56,134
AISINo Co lTD – A 12,393 7,249 – 4,580 15,062
AlUMINUM CoRP oF CHINA lTD – A 30,776 24,500 – 30,776 24,500
ANgANg STEEl Co lTD – A 66,600 – – 15,369 51,231
ANHUI CoNCH CEMENT Co lTD – A 3,611 – – 3,611 –
AVIC AERo-ENgINE CoNTRolS – A – 7,000 – 3,462 3,538
AVIC AIRCRAFT Co lTD – A 3,720 35,000 – 11,120 27,600
AVIC AVIATIoN ENgINE CoRP – A 13,944 19,406 – 13,944 19,406
AVIC CAPITAl Co lTD – A 1,924 25,300 – 11,254 15,970
AVIC HElICoPTER Co lTD – A 6,400 1,600 – 1,845 6,155
BANK oF BEIJINg Co lTD – A 4,095 53,200 – 57,295 –
BANK oF CHINA lTD – A 1,599 – – 1,599 –
BANK oF CoMMUNICATIoNS Co – A 13,133 177,300 – 96,633 93,800
BANK oF NANJINg Co lTD – A 992 6,300 – 992 6,300
BANK oF NINgBo Co lTD – A 2,939 – – 2,939 –
BBMg CoRPoRATIoN – A 2,420 – – 2,420 –
BEIJINg CAPITAl Co lTD – A 805 30,000 – 6,405 24,400
BEIJINg DABEINoNg TECHNolo – A 12,337 54,971 6,168 40,505 32,971
BEIJINg ENlIgHT MEDIA Co l – A 14,600 – 3,330 6,830 11,100
BEIJINg JINgNENg PowER Co – A 50,000 – – 11,538 38,462
BEIJINg oRIENT lANDSCAPE – A 9,145 – – 9,145 –
BEIJINg oRIgINwATER TECHNo – A 19,300 2,100 – 5,838 15,562
BEIJINg SHIJI INFoRMATIoN – A 4,500 – – 1,424 3,076
BEIJINg Sl PHARMACEUTICAl – A 5,805 3,700 2,179 1,446 10,238
BEIJINg ToNgRENTANg Co – A 14,770 5,900 – 3,606 17,064
BEIJINg UlTRAPowER SoFTwAR – A – 10,500 – 8,976 1,524
BEIJINg XINwEI TElECoM TEC – A 5,000 25,300 – 1,155 29,145
BEIJINg yANJINg BREwERy Co – A 16,931 25,600 – 7,404 35,127
BEIJINg zHoNgKE SANHUAN HI – A 10,642 20,000 – 30,642 –
BEIqI FoToN MoToR Co lTD – A 4,291 – – 4,291 –
BlUEFoCUS CoMMUNICATIoN gR – A 20,900 6,900 20,865 9,639 39,026
BoE TECHNology gRoUP Co lT – A 60,261 304,877 – 60,261 304,877
BRIgHT DAIRy ﹠ FooD Co lTD – A 417 – – 417 –
ByD Co lTD – A 7,711 3,800 – 3,519 7,992
By-HEAlTH Co lTD – A 9,500 – – 2,193 7,307
CHANgJIANg SECURITIES Co l – A 1,598 – – 1,598 –
CHENgDU XINgRoNg ENVIRoNME – A (FoRMERly KNowN AS CHENgDU XINgRoNg INVESTMEN – A) 1,355 – – 1,355 –
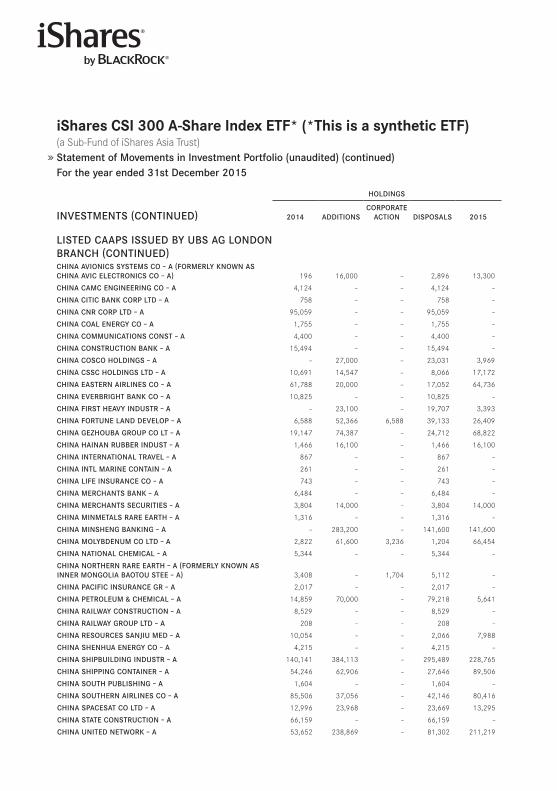
iShares CSi 300 A-Share index eTf* (*This is a synthetic eTf) (a Sub-Fund of iShares Asia Trust) Statement of Movements in Investment Portfolio (unaudited) (continued)For the year ended 31st December 2015
HolDINgS
INVESTMENTS (CoNTINUED) 2014 ADDITIoNSCoRPoRATE
ACTIoN DISPoSAlS 2015
lISTED CAAPS ISSUED By UBS Ag loNDoN BRANCH (CoNTINUED)CHINA AVIoNICS SySTEMS Co – A (FoRMERly KNowN AS CHINA AVIC ElECTRoNICS Co – A) 196 16,000 – 2,896 13,300
CHINA CAMC ENgINEERINg Co – A 4,124 – – 4,124 –
CHINA CITIC BANK CoRP lTD – A 758 – – 758 –
CHINA CNR CoRP lTD – A 95,059 – – 95,059 –
CHINA CoAl ENERgy Co – A 1,755 – – 1,755 –
CHINA CoMMUNICATIoNS CoNST – A 4,400 – – 4,400 –
CHINA CoNSTRUCTIoN BANK – A 15,494 – – 15,494 –
CHINA CoSCo HolDINgS – A – 27,000 – 23,031 3,969
CHINA CSSC HolDINgS lTD – A 10,691 14,547 – 8,066 17,172
CHINA EASTERN AIRlINES Co – A 61,788 20,000 – 17,052 64,736
CHINA EVERBRIgHT BANK Co – A 10,825 – – 10,825 –
CHINA FIRST HEAVy INDUSTR – A – 23,100 – 19,707 3,393
CHINA FoRTUNE lAND DEVEloP – A 6,588 52,366 6,588 39,133 26,409
CHINA gEzHoUBA gRoUP Co lT – A 19,147 74,387 – 24,712 68,822
CHINA HAINAN RUBBER INDUST – A 1,466 16,100 – 1,466 16,100
CHINA INTERNATIoNAl TRAVEl – A 867 – – 867 –
CHINA INTl MARINE CoNTAIN – A 261 – – 261 –
CHINA lIFE INSURANCE Co – A 743 – – 743 –
CHINA MERCHANTS BANK – A 6,484 – – 6,484 –
CHINA MERCHANTS SECURITIES – A 3,804 14,000 – 3,804 14,000
CHINA MINMETAlS RARE EARTH – A 1,316 – – 1,316 –
CHINA MINSHENg BANKINg – A – 283,200 – 141,600 141,600
CHINA MolyBDENUM Co lTD – A 2,822 61,600 3,236 1,204 66,454
CHINA NATIoNAl CHEMICAl – A 5,344 – – 5,344 –
CHINA NoRTHERN RARE EARTH – A (FoRMERly KNowN AS INNER MoNgolIA BAoToU STEE – A) 3,408 – 1,704 5,112 –
CHINA PACIFIC INSURANCE gR – A 2,017 – – 2,017 –
CHINA PETRolEUM ﹠ CHEMICAl – A 14,859 70,000 – 79,218 5,641
CHINA RAIlwAy CoNSTRUCTIoN – A 8,529 – – 8,529 –
CHINA RAIlwAy gRoUP lTD – A 208 – – 208 –
CHINA RESoURCES SANJIU MED – A 10,054 – – 2,066 7,988
CHINA SHENHUA ENERgy Co – A 4,215 – – 4,215 –
CHINA SHIPBUIlDINg INDUSTR – A 140,141 384,113 – 295,489 228,765
CHINA SHIPPINg CoNTAINER – A 54,246 62,906 – 27,646 89,506
CHINA SoUTH PUBlISHINg – A 1,604 – – 1,604 –
CHINA SoUTHERN AIRlINES Co – A 85,506 37,056 – 42,146 80,416
CHINA SPACESAT Co lTD – A 12,996 23,968 – 23,669 13,295
CHINA STATE CoNSTRUCTIoN – A 66,159 – – 66,159 –
CHINA UNITED NETwoRK – A 53,652 238,869 – 81,302 211,219
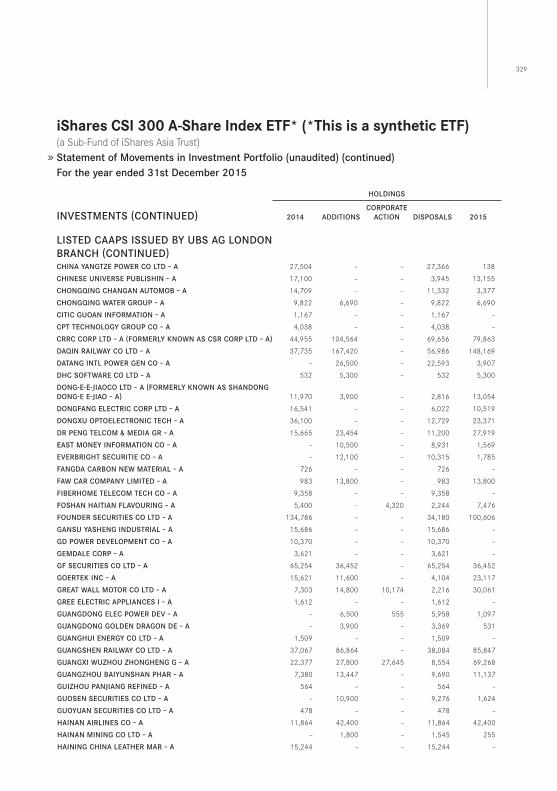
329
iShares CSi 300 A-Share index eTf* (*This is a synthetic eTf) (a Sub-Fund of iShares Asia Trust) Statement of Movements in Investment Portfolio (unaudited) (continued)For the year ended 31st December 2015
HolDINgS
INVESTMENTS (CoNTINUED) 2014 ADDITIoNSCoRPoRATE
ACTIoN DISPoSAlS 2015
lISTED CAAPS ISSUED By UBS Ag loNDoN BRANCH (CoNTINUED)CHINA yANgTzE PowER Co lTD – A 27,504 – – 27,366 138
CHINESE UNIVERSE PUBlISHIN – A 17,100 – – 3,945 13,155
CHoNgqINg CHANgAN AUToMoB – A 14,709 – – 11,332 3,377
CHoNgqINg wATER gRoUP – A 9,822 6,690 – 9,822 6,690
CITIC gUoAN INFoRMATIoN – A 1,167 – – 1,167 –
CPT TECHNology gRoUP Co – A 4,038 – – 4,038 –
CRRC CoRP lTD – A (FoRMERly KNowN AS CSR CoRP lTD – A) 44,955 104,564 – 69,656 79,863
DAqIN RAIlwAy Co lTD – A 37,735 167,420 – 56,986 148,169
DATANg INTl PowER gEN Co – A – 26,500 – 22,593 3,907
DHC SoFTwARE Co lTD – A 532 5,300 – 532 5,300
DoNg-E-E-JIAoCo lTD – A (FoRMERly KNowN AS SHANDoNg DoNg-E E-JIAo – A) 11,970 3,900 – 2,816 13,054
DoNgFANg ElECTRIC CoRP lTD – A 16,541 – – 6,022 10,519
DoNgXU oPToElECTRoNIC TECH – A 36,100 – – 12,729 23,371
DR PENg TElCoM ﹠ MEDIA gR – A 15,665 23,454 – 11,200 27,919
EAST MoNEy INFoRMATIoN Co – A – 10,500 – 8,931 1,569
EVERBRIgHT SECURITIE Co – A – 12,100 – 10,315 1,785
FANgDA CARBoN NEw MATERIAl – A 726 – – 726 –
FAw CAR CoMPANy lIMITED – A 983 13,800 – 983 13,800
FIBERHoME TElECoM TECH Co – A 9,358 – – 9,358 –
FoSHAN HAITIAN FlAVoURINg – A 5,400 – 4,320 2,244 7,476
FoUNDER SECURITIES Co lTD – A 134,786 – – 34,180 100,606
gANSU yASHENg INDUSTRIAl – A 15,686 – – 15,686 –
gD PowER DEVEloPMENT Co – A 10,370 – – 10,370 –
gEMDAlE CoRP – A 3,621 – – 3,621 –
gF SECURITIES Co lTD – A 65,254 36,452 – 65,254 36,452
goERTEK INC – A 15,621 11,600 – 4,104 23,117
gREAT wAll MoToR Co lTD – A 7,303 14,800 10,174 2,216 30,061
gREE ElECTRIC APPlIANCES I – A 1,612 – – 1,612 –
gUANgDoNg ElEC PowER DEV – A – 6,500 555 5,958 1,097
gUANgDoNg golDEN DRAgoN DE – A – 3,900 – 3,369 531
gUANgHUI ENERgy Co lTD – A 1,509 – – 1,509 –
gUANgSHEN RAIlwAy Co lTD – A 37,067 86,864 – 38,084 85,847
gUANgXI wUzHoU zHoNgHENg g – A 22,377 27,800 27,645 8,554 69,268
gUANgzHoU BAIyUNSHAN PHAR – A 7,380 13,447 – 9,690 11,137
gUIzHoU PANJIANg REFINED – A 564 – – 564 –
gUoSEN SECURITIES Co lTD – A – 10,900 – 9,276 1,624
gUoyUAN SECURITIES Co lTD – A 478 – – 478 –
HAINAN AIRlINES Co – A 11,864 42,400 – 11,864 42,400
HAINAN MININg Co lTD – A – 1,800 – 1,545 255
HAININg CHINA lEATHER MAR – A 15,244 – – 15,244 –
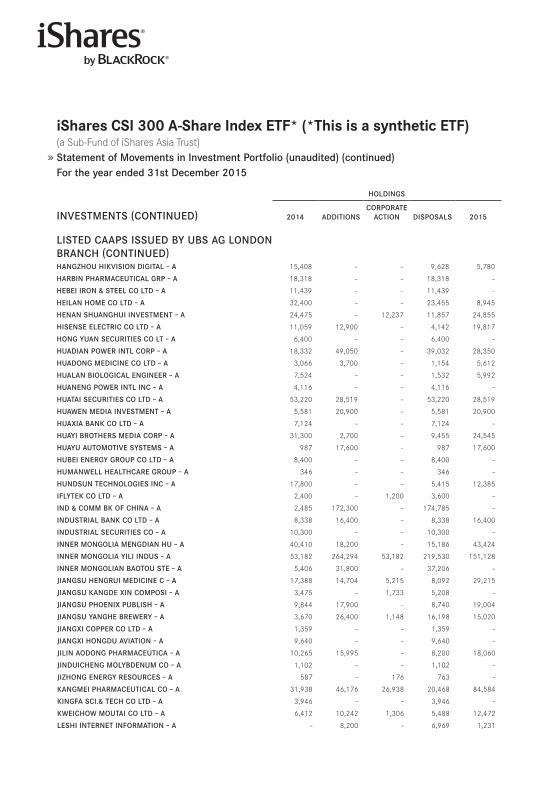
iShares CSi 300 A-Share index eTf* (*This is a synthetic eTf) (a Sub-Fund of iShares Asia Trust) Statement of Movements in Investment Portfolio (unaudited) (continued)For the year ended 31st December 2015
HolDINgS
INVESTMENTS (CoNTINUED) 2014 ADDITIoNSCoRPoRATE
ACTIoN DISPoSAlS 2015
lISTED CAAPS ISSUED By UBS Ag loNDoN BRANCH (CoNTINUED)HANgzHoU HIKVISIoN DIgITAl – A 15,408 – – 9,628 5,780
HARBIN PHARMACEUTICAl gRP – A 18,318 – – 18,318 –
HEBEI IRoN ﹠ STEEl Co lTD – A 11,439 – – 11,439 –
HEIlAN HoME Co lTD – A 32,400 – – 23,455 8,945
HENAN SHUANgHUI INVESTMENT – A 24,475 – 12,237 11,857 24,855
HISENSE ElECTRIC Co lTD – A 11,059 12,900 – 4,142 19,817
HoNg yUAN SECURITIES Co lT – A 6,400 – – 6,400 –
HUADIAN PowER INTl CoRP – A 18,332 49,050 – 39,032 28,350
HUADoNg MEDICINE Co lTD – A 3,066 3,700 – 1,154 5,612
HUAlAN BIologICAl ENgINEER – A 7,524 – – 1,532 5,992
HUANENg PowER INTl INC – A 4,116 – – 4,116 –
HUATAI SECURITIES Co lTD – A 53,220 28,519 – 53,220 28,519
HUAwEN MEDIA INVESTMENT – A 5,581 20,900 – 5,581 20,900
HUAXIA BANK Co lTD – A 7,124 – – 7,124 –
HUAyI BRoTHERS MEDIA CoRP – A 31,300 2,700 – 9,455 24,545
HUAyU AUToMoTIVE SySTEMS – A 987 17,600 – 987 17,600
HUBEI ENERgy gRoUP Co lTD – A 8,400 – – 8,400 –
HUMANwEll HEAlTHCARE gRoUP – A 346 – – 346 –
HUNDSUN TECHNologIES INC – A 17,800 – – 5,415 12,385
IFlyTEK Co lTD – A 2,400 – 1,200 3,600 –
IND ﹠ CoMM BK oF CHINA – A 2,485 172,300 – 174,785 –
INDUSTRIAl BANK Co lTD – A 8,338 16,400 – 8,338 16,400
INDUSTRIAl SECURITIES Co – A 10,300 – – 10,300 –
INNER MoNgolIA MENgDIAN HU – A 40,410 18,200 – 15,186 43,424
INNER MoNgolIA yIlI INDUS – A 53,182 264,294 53,182 219,530 151,128
INNER MoNgolIAN BAoToU STE – A 5,406 31,800 – 37,206 –
JIANgSU HENgRUI MEDICINE C – A 17,388 14,704 5,215 8,092 29,215
JIANgSU KANgDE XIN CoMPoSI – A 3,475 – 1,733 5,208 –
JIANgSU PHoENIX PUBlISH – A 9,844 17,900 – 8,740 19,004
JIANgSU yANgHE BREwERy – A 3,670 26,400 1,148 16,198 15,020
JIANgXI CoPPER Co lTD – A 1,359 – – 1,359 –
JIANgXI HoNgDU AVIATIoN – A 9,640 – – 9,640 –
JIlIN AoDoNg PHARMACEUTICA – A 10,265 15,995 – 8,200 18,060
JINDUICHENg MolyBDENUM Co – A 1,102 – – 1,102 –
JIzHoNg ENERgy RESoURCES – A 587 – 176 763 –
KANgMEI PHARMACEUTICAl Co – A 31,938 46,176 26,938 20,468 84,584
KINgFA SCI.﹠ TECH Co lTD – A 3,946 – – 3,946 –
KwEICHow MoUTAI Co lTD – A 6,412 10,242 1,306 5,488 12,472
lESHI INTERNET INFoRMATIoN – A – 8,200 – 6,969 1,231
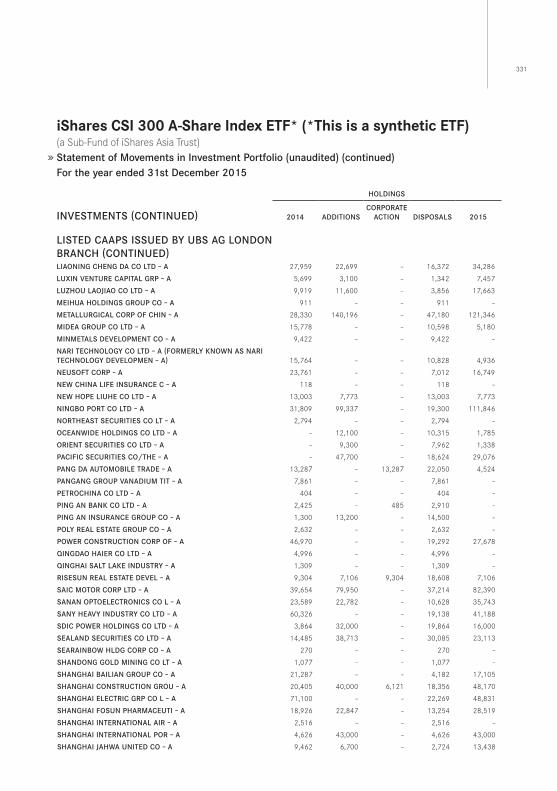
331
iShares CSi 300 A-Share index eTf* (*This is a synthetic eTf) (a Sub-Fund of iShares Asia Trust) Statement of Movements in Investment Portfolio (unaudited) (continued)For the year ended 31st December 2015
HolDINgS
INVESTMENTS (CoNTINUED) 2014 ADDITIoNSCoRPoRATE
ACTIoN DISPoSAlS 2015
lISTED CAAPS ISSUED By UBS Ag loNDoN BRANCH (CoNTINUED)lIAoNINg CHENg DA Co lTD – A 27,959 22,699 – 16,372 34,286
lUXIN VENTURE CAPITAl gRP – A 5,699 3,100 – 1,342 7,457
lUzHoU lAoJIAo Co lTD – A 9,919 11,600 – 3,856 17,663
MEIHUA HolDINgS gRoUP Co – A 911 – – 911 –
METAllURgICAl CoRP oF CHIN – A 28,330 140,196 – 47,180 121,346
MIDEA gRoUP Co lTD – A 15,778 – – 10,598 5,180
MINMETAlS DEVEloPMENT Co – A 9,422 – – 9,422 –
NARI TECHNology Co lTD – A (FoRMERly KNowN AS NARI TECHNology DEVEloPMEN – A) 15,764 – – 10,828 4,936
NEUSoFT CoRP – A 23,761 – – 7,012 16,749
NEw CHINA lIFE INSURANCE C – A 118 – – 118 –
NEw HoPE lIUHE Co lTD – A 13,003 7,773 – 13,003 7,773
NINgBo PoRT Co lTD – A 31,809 99,337 – 19,300 111,846
NoRTHEAST SECURITIES Co lT – A 2,794 – – 2,794 –
oCEANwIDE HolDINgS Co lTD – A – 12,100 – 10,315 1,785
oRIENT SECURITIES Co lTD – A – 9,300 – 7,962 1,338
PACIFIC SECURITIES Co/THE – A – 47,700 – 18,624 29,076
PANg DA AUToMoBIlE TRADE – A 13,287 – 13,287 22,050 4,524
PANgANg gRoUP VANADIUM TIT – A 7,861 – – 7,861 –
PETRoCHINA Co lTD – A 404 – – 404 –
PINg AN BANK Co lTD – A 2,425 – 485 2,910 –
PINg AN INSURANCE gRoUP Co – A 1,300 13,200 – 14,500 –
Poly REAl ESTATE gRoUP Co – A 2,632 – – 2,632 –
PowER CoNSTRUCTIoN CoRP oF – A 46,970 – – 19,292 27,678
qINgDAo HAIER Co lTD – A 4,996 – – 4,996 –
qINgHAI SAlT lAKE INDUSTRy – A 1,309 – – 1,309 –
RISESUN REAl ESTATE DEVEl – A 9,304 7,106 9,304 18,608 7,106
SAIC MoToR CoRP lTD – A 39,654 79,950 – 37,214 82,390
SANAN oPToElECTRoNICS Co l – A 23,589 22,782 – 10,628 35,743
SANy HEAVy INDUSTRy Co lTD – A 60,326 – – 19,138 41,188
SDIC PowER HolDINgS Co lTD – A 3,864 32,000 – 19,864 16,000
SEAlAND SECURITIES Co lTD – A 14,485 38,713 – 30,085 23,113
SEARAINBow HlDg CoRP Co – A 270 – – 270 –
SHANDoNg golD MININg Co lT – A 1,077 – – 1,077 –
SHANgHAI BAIlIAN gRoUP Co – A 21,287 – – 4,182 17,105
SHANgHAI CoNSTRUCTIoN gRoU – A 20,405 40,000 6,121 18,356 48,170
SHANgHAI ElECTRIC gRP Co l – A 71,100 – – 22,269 48,831
SHANgHAI FoSUN PHARMACEUTI – A 18,926 22,847 – 13,254 28,519
SHANgHAI INTERNATIoNAl AIR – A 2,516 – – 2,516 –
SHANgHAI INTERNATIoNAl PoR – A 4,626 43,000 – 4,626 43,000
SHANgHAI JAHwA UNITED Co – A 9,462 6,700 – 2,724 13,438
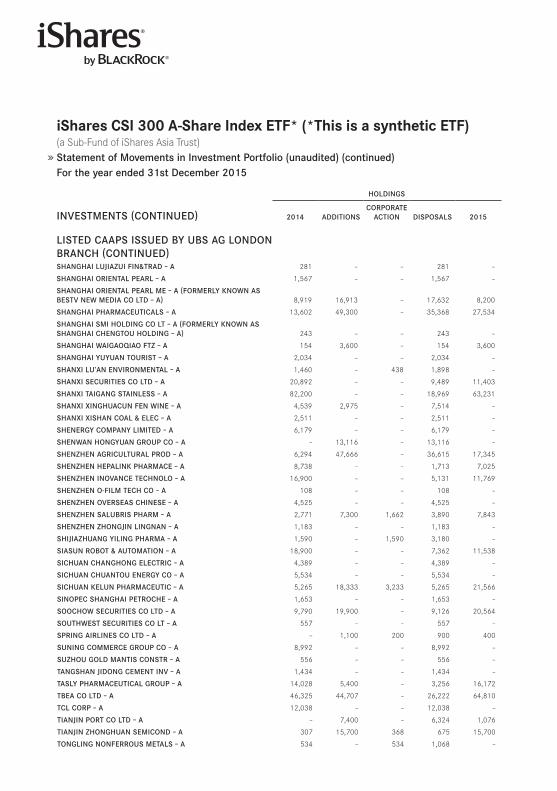
iShares CSi 300 A-Share index eTf* (*This is a synthetic eTf) (a Sub-Fund of iShares Asia Trust) Statement of Movements in Investment Portfolio (unaudited) (continued)For the year ended 31st December 2015
HolDINgS
INVESTMENTS (CoNTINUED) 2014 ADDITIoNSCoRPoRATE
ACTIoN DISPoSAlS 2015
lISTED CAAPS ISSUED By UBS Ag loNDoN BRANCH (CoNTINUED)SHANgHAI lUJIAzUI FIN﹠TRAD – A 281 – – 281 –
SHANgHAI oRIENTAl PEARl – A 1,567 – – 1,567 –
SHANgHAI oRIENTAl PEARl ME – A (FoRMERly KNowN AS BESTV NEw MEDIA Co lTD – A) 8,919 16,913 – 17,632 8,200
SHANgHAI PHARMACEUTICAlS – A 13,602 49,300 – 35,368 27,534
SHANgHAI SMI HolDINg Co lT – A (FoRMERly KNowN AS SHANgHAI CHENgToU HolDINg – A) 243 – – 243 –
SHANgHAI wAIgAoqIAo FTz – A 154 3,600 – 154 3,600
SHANgHAI yUyUAN ToURIST – A 2,034 – – 2,034 –
SHANXI lU’AN ENVIRoNMENTAl – A 1,460 – 438 1,898 –
SHANXI SECURITIES Co lTD – A 20,892 – – 9,489 11,403
SHANXI TAIgANg STAINlESS – A 82,200 – – 18,969 63,231
SHANXI XINgHUACUN FEN wINE – A 4,539 2,975 – 7,514 –
SHANXI XISHAN CoAl ﹠ ElEC – A 2,511 – – 2,511 –
SHENERgy CoMPANy lIMITED – A 6,179 – – 6,179 –
SHENwAN HoNgyUAN gRoUP Co – A – 13,116 – 13,116 –
SHENzHEN AgRICUlTURAl PRoD – A 6,294 47,666 – 36,615 17,345
SHENzHEN HEPAlINK PHARMACE – A 8,738 – – 1,713 7,025
SHENzHEN INoVANCE TECHNolo – A 16,900 – – 5,131 11,769
SHENzHEN o-FIlM TECH Co – A 108 – – 108 –
SHENzHEN oVERSEAS CHINESE – A 4,525 – – 4,525 –
SHENzHEN SAlUBRIS PHARM – A 2,771 7,300 1,662 3,890 7,843
SHENzHEN zHoNgJIN lINgNAN – A 1,183 – – 1,183 –
SHIJIAzHUANg yIlINg PHARMA – A 1,590 – 1,590 3,180 –
SIASUN RoBoT ﹠ AUToMATIoN – A 18,900 – – 7,362 11,538
SICHUAN CHANgHoNg ElECTRIC – A 4,389 – – 4,389 –
SICHUAN CHUANToU ENERgy Co – A 5,534 – – 5,534 –
SICHUAN KElUN PHARMACEUTIC – A 5,265 18,333 3,233 5,265 21,566
SINoPEC SHANgHAI PETRoCHE – A 1,653 – – 1,653 –
SooCHow SECURITIES Co lTD – A 9,790 19,900 – 9,126 20,564
SoUTHwEST SECURITIES Co lT – A 557 – – 557 –
SPRINg AIRlINES Co lTD – A – 1,100 200 900 400
SUNINg CoMMERCE gRoUP Co – A 8,992 – – 8,992 –
SUzHoU golD MANTIS CoNSTR – A 556 – – 556 –
TANgSHAN JIDoNg CEMENT INV – A 1,434 – – 1,434 –
TASly PHARMACEUTICAl gRoUP – A 14,028 5,400 – 3,256 16,172
TBEA Co lTD – A 46,325 44,707 – 26,222 64,810
TCl CoRP – A 12,038 – – 12,038 –
TIANJIN PoRT Co lTD – A – 7,400 – 6,324 1,076
TIANJIN zHoNgHUAN SEMICoND – A 307 15,700 368 675 15,700
ToNglINg NoNFERRoUS METAlS – A 534 – 534 1,068 –
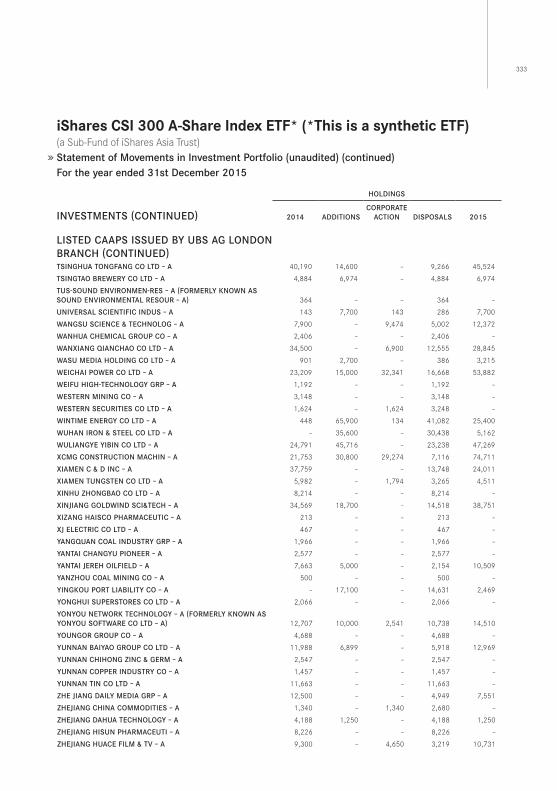
333
iShares CSi 300 A-Share index eTf* (*This is a synthetic eTf) (a Sub-Fund of iShares Asia Trust) Statement of Movements in Investment Portfolio (unaudited) (continued)For the year ended 31st December 2015
HolDINgS
INVESTMENTS (CoNTINUED) 2014 ADDITIoNSCoRPoRATE
ACTIoN DISPoSAlS 2015
lISTED CAAPS ISSUED By UBS Ag loNDoN BRANCH (CoNTINUED)TSINgHUA ToNgFANg Co lTD – A 40,190 14,600 – 9,266 45,524
TSINgTAo BREwERy Co lTD – A 4,884 6,974 – 4,884 6,974
TUS-SoUND ENVIRoNMEN-RES – A (FoRMERly KNowN AS SoUND ENVIRoNMENTAl RESoUR – A) 364 – – 364 –
UNIVERSAl SCIENTIFIC INDUS – A 143 7,700 143 286 7,700
wANgSU SCIENCE ﹠ TECHNolog – A 7,900 – 9,474 5,002 12,372
wANHUA CHEMICAl gRoUP Co – A 2,406 – – 2,406 –
wANXIANg qIANCHAo Co lTD – A 34,500 – 6,900 12,555 28,845
wASU MEDIA HolDINg Co lTD – A 901 2,700 – 386 3,215
wEICHAI PowER Co lTD – A 23,209 15,000 32,341 16,668 53,882
wEIFU HIgH-TECHNology gRP – A 1,192 – – 1,192 –
wESTERN MININg Co – A 3,148 – – 3,148 –
wESTERN SECURITIES Co lTD – A 1,624 – 1,624 3,248 –
wINTIME ENERgy Co lTD – A 448 65,900 134 41,082 25,400
wUHAN IRoN ﹠ STEEl Co lTD – A – 35,600 – 30,438 5,162
wUlIANgyE yIBIN Co lTD – A 24,791 45,716 – 23,238 47,269
XCMg CoNSTRUCTIoN MACHIN – A 21,753 30,800 29,274 7,116 74,711
XIAMEN C ﹠ D INC – A 37,759 – – 13,748 24,011
XIAMEN TUNgSTEN Co lTD – A 5,982 – 1,794 3,265 4,511
XINHU zHoNgBAo Co lTD – A 8,214 – – 8,214 –
XINJIANg golDwIND SCI﹠TECH – A 34,569 18,700 – 14,518 38,751
XIzANg HAISCo PHARMACEUTIC – A 213 – – 213 –
XJ ElECTRIC Co lTD – A 467 – – 467 –
yANgqUAN CoAl INDUSTRy gRP – A 1,966 – – 1,966 –
yANTAI CHANgyU PIoNEER – A 2,577 – – 2,577 –
yANTAI JEREH oIlFIElD – A 7,663 5,000 – 2,154 10,509
yANzHoU CoAl MININg Co – A 500 – – 500 –
yINgKoU PoRT lIABIlITy Co – A – 17,100 – 14,631 2,469
yoNgHUI SUPERSToRES Co lTD – A 2,066 – – 2,066 –
yoNyoU NETwoRK TECHNology – A (FoRMERly KNowN AS yoNyoU SoFTwARE Co lTD – A) 12,707 10,000 2,541 10,738 14,510
yoUNgoR gRoUP Co – A 4,688 – – 4,688 –
yUNNAN BAIyAo gRoUP Co lTD – A 11,988 6,899 – 5,918 12,969
yUNNAN CHIHoNg zINC ﹠ gERM – A 2,547 – – 2,547 –
yUNNAN CoPPER INDUSTRy Co – A 1,457 – – 1,457 –
yUNNAN TIN Co lTD – A 11,663 – – 11,663 –
zHE JIANg DAIly MEDIA gRP – A 12,500 – – 4,949 7,551
zHEJIANg CHINA CoMMoDITIES – A 1,340 – 1,340 2,680 –
zHEJIANg DAHUA TECHNology – A 4,188 1,250 – 4,188 1,250
zHEJIANg HISUN PHARMACEUTI – A 8,226 – – 8,226 –
zHEJIANg HUACE FIlM ﹠ TV – A 9,300 – 4,650 3,219 10,731

iShares CSi 300 A-Share index eTf* (*This is a synthetic eTf) (a Sub-Fund of iShares Asia Trust) Statement of Movements in Investment Portfolio (unaudited) (continued)For the year ended 31st December 2015
HolDINgS
INVESTMENTS (CoNTINUED) 2014 ADDITIoNSCoRPoRATE
ACTIoN DISPoSAlS 2015
lISTED CAAPS ISSUED By UBS Ag loNDoN BRANCH (CoNTINUED)zHEJIANg NHU Co lTD – A 13,966 – – 13,966 –
zHEJIANg yASHA DECoRATIoN – A 251 24,000 125 12,376 12,000
zHEJIANg zHENENg ElECTRIC – A – 59,100 – 20,502 38,598
zHENgzHoU yUToNg BUS Co – A 1,013 – 506 1,519 –
zHoNgJIN golD CoRP – A 1,660 – – 1,660 –
zIJIN MININg gRoUP Co lTD – A 14,343 34,700 – 49,043 –
zooMlIoN HEAVy INDUSTRy S – A 87,496 70,497 – 60,980 97,013
zTE CoRP – A 43,064 25,405 10,678 20,378 58,769
UNlISTED RIgHTS ISSUED By UBS Ag loNDoN BRANCHBlUEFoCUS CoMMUNICATIoN gR – A – RIgHTS – – 28,289 28,289 –
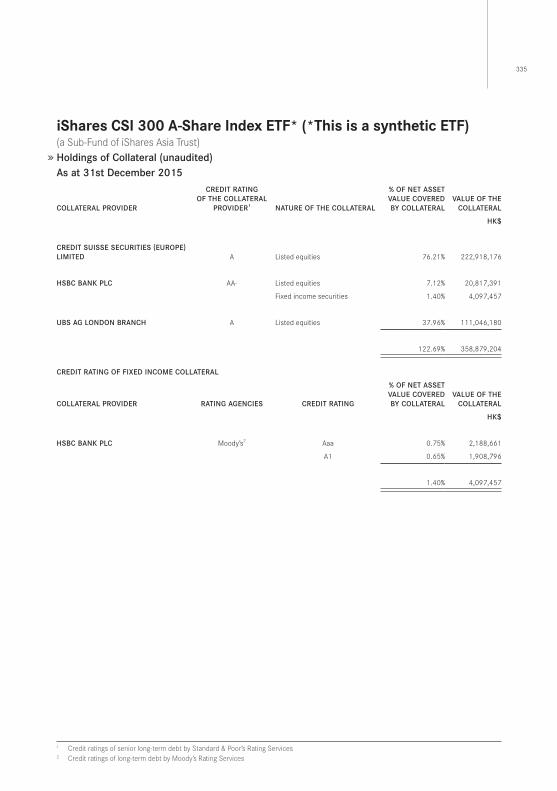
335
iShares CSi 300 A-Share index eTf* (*This is a synthetic eTf) (a Sub-Fund of iShares Asia Trust) Holdings of Collateral (unaudited)As at 31st December 2015
CollATERAl PRoVIDER
CREDIT RATINgoF THE CollATERAl
PRoVIDER1 NATURE oF THE CollATERAl
% oF NET ASSET VAlUE CoVERED By CollATERAl
VAlUE oF THE CollATERAl
HK$
CREDIT SUISSE SECURITIES (EURoPE) lIMITED A Listed equities 76 .21% 222,918,176
HSBC BANK PlC AA- Listed equities 7 .12% 20,817,391
Fixed income securities 1 .40% 4,097,457
UBS Ag loNDoN BRANCH A Listed equities 37 .96% 111,046,180
122 .69% 358,879,204
CREDIT RATINg oF FIXED INCoME CollATERAl
CollATERAl PRoVIDER RATINg AgENCIES CREDIT RATINg
% oF NET ASSET VAlUE CoVERED By CollATERAl
VAlUE oF THE CollATERAl
HK$
HSBC BANK PlC Moody’s2 Aaa 0 .75% 2,188,661
A1 0 .65% 1,908,796
1 .40% 4,097,457
1 Credit ratings of senior long-term debt by Standard & Poor’s Rating Services2 Credit ratings of long-term debt by Moody’s Rating Services
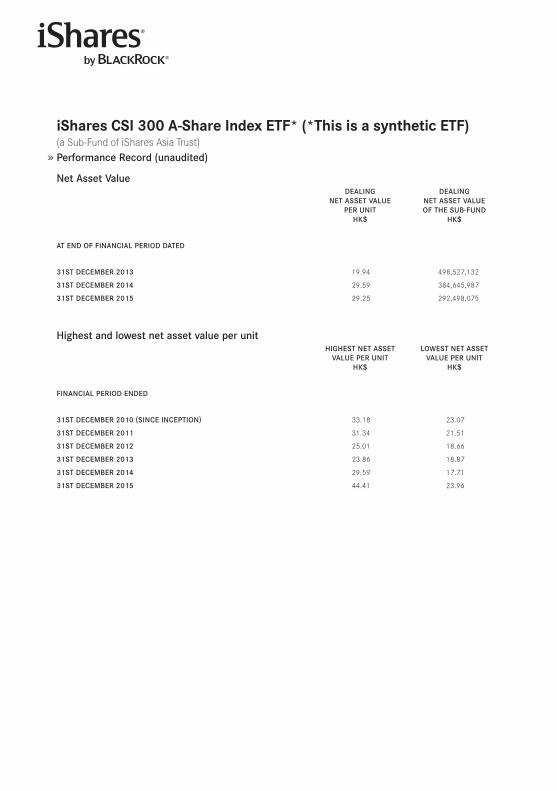
iShares CSi 300 A-Share index eTf* (*This is a synthetic eTf) (a Sub-Fund of iShares Asia Trust)Performance Record (unaudited)
Net Asset ValueDEAlINg
NET ASSET VAlUE PER UNIT
HK$
DEAlINgNET ASSET VAlUE oF THE SUB-FUND
HK$
AT END oF FINANCIAl PERIoD DATED
31ST DECEMBER 2013 19 .94 498,527,132
31ST DECEMBER 2014 29 .59 384,645,987
31ST DECEMBER 2015 29 .25 292,498,075
Highest and lowest net asset value per unitHIgHEST NET ASSET
VAlUE PER UNITHK$
lowEST NET ASSETVAlUE PER UNIT
HK$
FINANCIAl PERIoD ENDED
31ST DECEMBER 2010 (SINCE INCEPTIoN) 33 .18 23 .07
31ST DECEMBER 2011 31 .34 21 .51
31ST DECEMBER 2012 25 .01 18 .66
31ST DECEMBER 2013 23 .86 18 .87
31ST DECEMBER 2014 29 .59 17 .71
31ST DECEMBER 2015 44 .41 23 .96
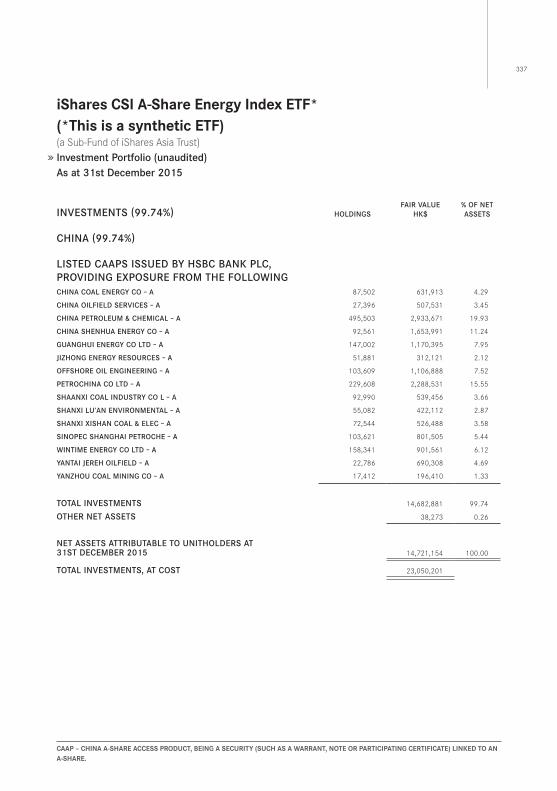
337
iShares CSi A-Share energy index eTf* (*This is a synthetic eTf) (a Sub-Fund of iShares Asia Trust) Investment Portfolio (unaudited)As at 31st December 2015
CAAp – ChinA A-ShARe ACCeSS pRodUCT, Being A SeCURiTY (SUCh AS A wARRAnT, noTe oR pARTiCipATing CeRTifiCATe) linKed To An A-ShARe.
INVESTMENTS (99.74%) HolDINgSFAIR VAlUE
HK$% oF NET ASSETS
CHINA (99.74%)
lISTED CAAPS ISSUED By HSBC BANK PlC, PRoVIDINg EXPoSURE FRoM THE FollowINgCHINA CoAl ENERgy Co – A 87,502 631,913 4 .29
CHINA oIlFIElD SERVICES – A 27,396 507,531 3 .45
CHINA PETRolEUM ﹠ CHEMICAl – A 495,503 2,933,671 19 .93
CHINA SHENHUA ENERgy Co – A 92,561 1,653,991 11 .24
gUANgHUI ENERgy Co lTD – A 147,002 1,170,395 7 .95
JIzHoNg ENERgy RESoURCES – A 51,881 312,121 2 .12
oFFSHoRE oIl ENgINEERINg – A 103,609 1,106,888 7 .52
PETRoCHINA Co lTD – A 229,608 2,288,531 15 .55
SHAANXI CoAl INDUSTRy Co l – A 92,990 539,456 3 .66
SHANXI lU’AN ENVIRoNMENTAl – A 55,082 422,112 2 .87
SHANXI XISHAN CoAl ﹠ ElEC – A 72,544 526,488 3 .58
SINoPEC SHANgHAI PETRoCHE – A 103,621 801,505 5 .44
wINTIME ENERgy Co lTD – A 158,341 901,561 6 .12
yANTAI JEREH oIlFIElD – A 22,786 690,308 4 .69
yANzHoU CoAl MININg Co – A 17,412 196,410 1 .33
ToTAl INVESTMENTS 14,682,881 99 .74
oTHER NET ASSETS 38,273 0 .26
NET ASSETS ATTRIBUTABlE To UNITHolDERS AT31ST DECEMBER 2015 14,721,154 100 .00
ToTAl INVESTMENTS, AT CoST 23,050,201
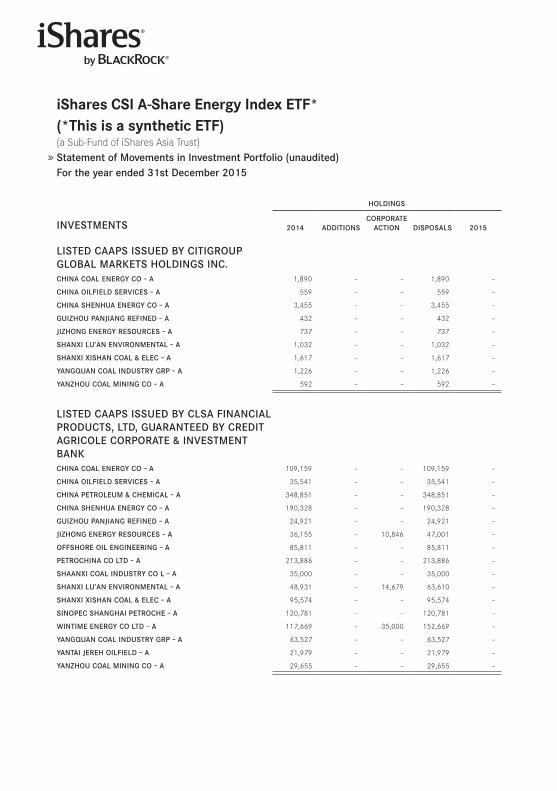
iShares CSi A-Share energy index eTf* (*This is a synthetic eTf) (a Sub-Fund of iShares Asia Trust) Statement of Movements in Investment Portfolio (unaudited)For the year ended 31st December 2015
HolDINgS
INVESTMENTS 2014 ADDITIoNSCoRPoRATE
ACTIoN DISPoSAlS 2015
lISTED CAAPS ISSUED By CITIgRoUP gloBAl MARKETS HolDINgS INC.CHINA CoAl ENERgy Co – A 1,890 – – 1,890 –
CHINA oIlFIElD SERVICES – A 559 – – 559 –
CHINA SHENHUA ENERgy Co – A 3,455 – – 3,455 –
gUIzHoU PANJIANg REFINED – A 432 – – 432 –
JIzHoNg ENERgy RESoURCES – A 737 – – 737 –
SHANXI lU’AN ENVIRoNMENTAl – A 1,032 – – 1,032 –
SHANXI XISHAN CoAl ﹠ ElEC – A 1,617 – – 1,617 –
yANgqUAN CoAl INDUSTRy gRP – A 1,226 – – 1,226 –
yANzHoU CoAl MININg Co – A 592 – – 592 –
lISTED CAAPS ISSUED By ClSA FINANCIAl PRoDUCTS, lTD, gUARANTEED By CREDIT AgRIColE CoRPoRATE ﹠ INVESTMENT BANKCHINA CoAl ENERgy Co – A 109,159 – – 109,159 –
CHINA oIlFIElD SERVICES – A 35,541 – – 35,541 –
CHINA PETRolEUM ﹠ CHEMICAl – A 348,851 – – 348,851 –
CHINA SHENHUA ENERgy Co – A 190,328 – – 190,328 –
gUIzHoU PANJIANg REFINED – A 24,921 – – 24,921 –
JIzHoNg ENERgy RESoURCES – A 36,155 – 10,846 47,001 –
oFFSHoRE oIl ENgINEERINg – A 85,811 – – 85,811 –
PETRoCHINA Co lTD – A 213,886 – – 213,886 –
SHAANXI CoAl INDUSTRy Co l – A 35,000 – – 35,000 –
SHANXI lU’AN ENVIRoNMENTAl – A 48,931 – 14,679 63,610 –
SHANXI XISHAN CoAl ﹠ ElEC – A 95,574 – – 95,574 –
SINoPEC SHANgHAI PETRoCHE – A 120,781 – – 120,781 –
wINTIME ENERgy Co lTD – A 117,669 – 35,000 152,669 –
yANgqUAN CoAl INDUSTRy gRP – A 63,527 – – 63,527 –
yANTAI JEREH oIlFIElD – A 21,979 – – 21,979 –
yANzHoU CoAl MININg Co – A 29,655 – – 29,655 –
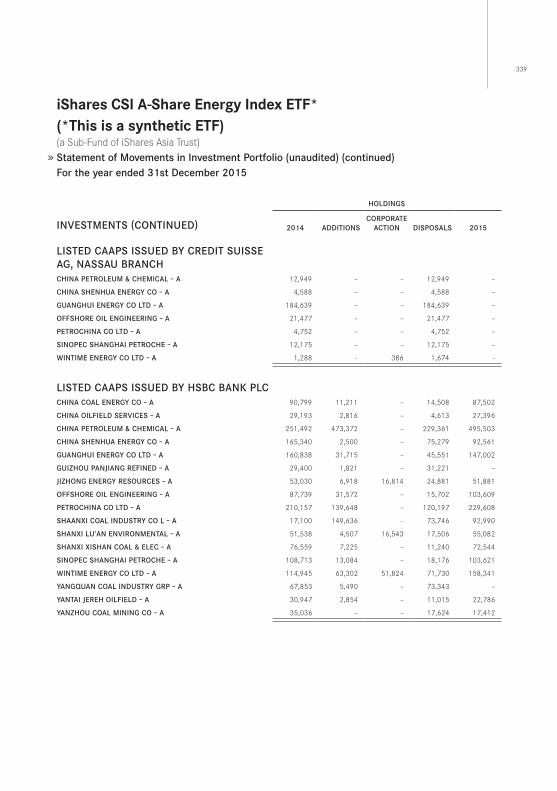
339
iShares CSi A-Share energy index eTf* (*This is a synthetic eTf) (a Sub-Fund of iShares Asia Trust) Statement of Movements in Investment Portfolio (unaudited) (continued)For the year ended 31st December 2015
HolDINgS
INVESTMENTS (CoNTINUED) 2014 ADDITIoNSCoRPoRATE
ACTIoN DISPoSAlS 2015
lISTED CAAPS ISSUED By CREDIT SUISSE Ag, NASSAU BRANCHCHINA PETRolEUM ﹠ CHEMICAl – A 12,949 – – 12,949 –
CHINA SHENHUA ENERgy Co – A 4,588 – – 4,588 –
gUANgHUI ENERgy Co lTD – A 184,639 – – 184,639 –
oFFSHoRE oIl ENgINEERINg – A 21,477 – – 21,477 –
PETRoCHINA Co lTD – A 4,752 – – 4,752 –
SINoPEC SHANgHAI PETRoCHE – A 12,175 – – 12,175 –
wINTIME ENERgy Co lTD – A 1,288 – 386 1,674 –
lISTED CAAPS ISSUED By HSBC BANK PlCCHINA CoAl ENERgy Co – A 90,799 11,211 – 14,508 87,502
CHINA oIlFIElD SERVICES – A 29,193 2,816 – 4,613 27,396
CHINA PETRolEUM ﹠ CHEMICAl – A 251,492 473,372 – 229,361 495,503
CHINA SHENHUA ENERgy Co – A 165,340 2,500 – 75,279 92,561
gUANgHUI ENERgy Co lTD – A 160,838 31,715 – 45,551 147,002
gUIzHoU PANJIANg REFINED – A 29,400 1,821 – 31,221 –
JIzHoNg ENERgy RESoURCES – A 53,030 6,918 16,814 24,881 51,881
oFFSHoRE oIl ENgINEERINg – A 87,739 31,572 – 15,702 103,609
PETRoCHINA Co lTD – A 210,157 139,648 – 120,197 229,608
SHAANXI CoAl INDUSTRy Co l – A 17,100 149,636 – 73,746 92,990
SHANXI lU’AN ENVIRoNMENTAl – A 51,538 4,507 16,543 17,506 55,082
SHANXI XISHAN CoAl ﹠ ElEC – A 76,559 7,225 – 11,240 72,544
SINoPEC SHANgHAI PETRoCHE – A 108,713 13,084 – 18,176 103,621
wINTIME ENERgy Co lTD – A 114,945 63,302 51,824 71,730 158,341
yANgqUAN CoAl INDUSTRy gRP – A 67,853 5,490 – 73,343 –
yANTAI JEREH oIlFIElD – A 30,947 2,854 – 11,015 22,786
yANzHoU CoAl MININg Co – A 35,036 – – 17,624 17,412
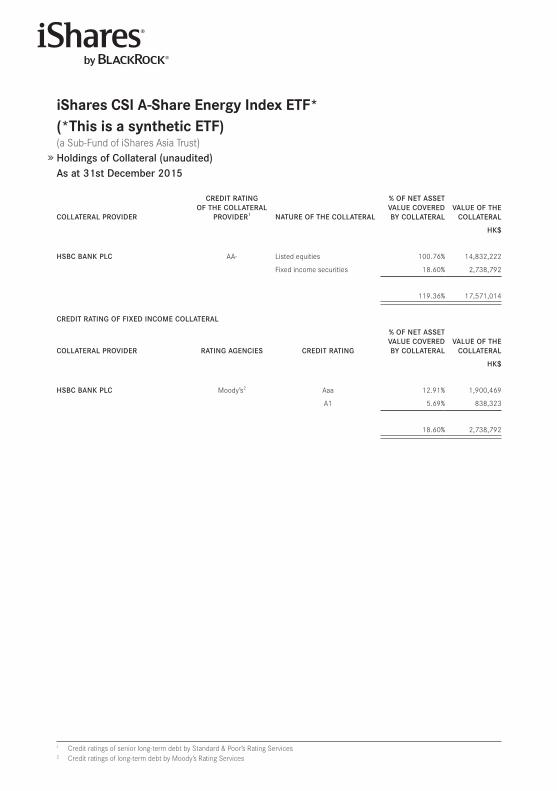
iShares CSi A-Share energy index eTf*(*This is a synthetic eTf) (a Sub-Fund of iShares Asia Trust) Holdings of Collateral (unaudited)As at 31st December 2015
CollATERAl PRoVIDER
CREDIT RATINg oF THE CollATERAl
PRoVIDER1 NATURE oF THE CollATERAl
% oF NET ASSET VAlUE CoVERED By CollATERAl
VAlUE oF THE CollATERAl
HK$
HSBC BANK PlC AA- Listed equities 100 .76% 14,832,222
Fixed income securities 18 .60% 2,738,792
119 .36% 17,571,014
CREDIT RATINg oF FIXED INCoME CollATERAl
CollATERAl PRoVIDER RATINg AgENCIES CREDIT RATINg
% oF NET ASSET VAlUE CoVERED By CollATERAl
VAlUE oF THE CollATERAl
HK$
HSBC BANK PlC Moody’s2 Aaa 12 .91% 1,900,469
A1 5 .69% 838,323
18 .60% 2,738,792
1 Credit ratings of senior long-term debt by Standard & Poor’s Rating Services2 Credit ratings of long-term debt by Moody’s Rating Services
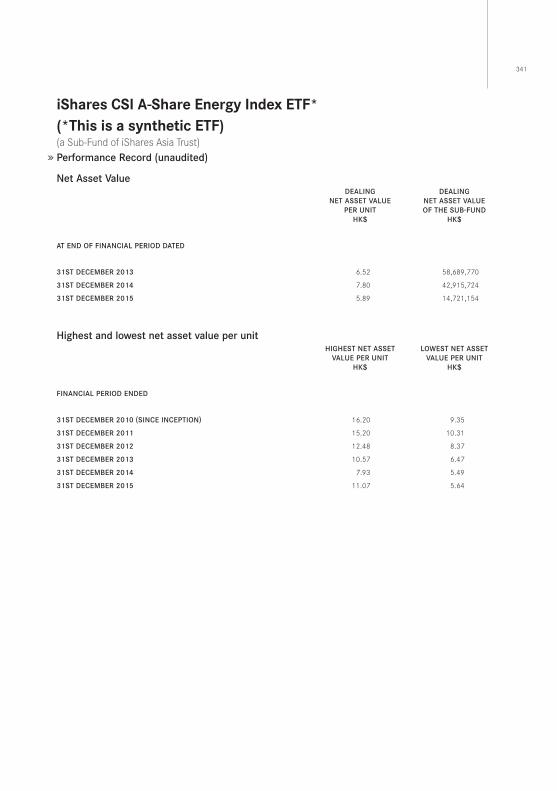
341
iShares CSi A-Share energy index eTf* (*This is a synthetic eTf) (a Sub-Fund of iShares Asia Trust) Performance Record (unaudited)
Net Asset ValueDEAlINg
NET ASSET VAlUE PER UNIT
HK$
DEAlINgNET ASSET VAlUE oF THE SUB-FUND
HK$
AT END oF FINANCIAl PERIoD DATED
31ST DECEMBER 2013 6 .52 58,689,770
31ST DECEMBER 2014 7 .80 42,915,724
31ST DECEMBER 2015 5 .89 14,721,154
Highest and lowest net asset value per unitHIgHEST NET ASSET
VAlUE PER UNITHK$
lowEST NET ASSETVAlUE PER UNIT
HK$
FINANCIAl PERIoD ENDED
31ST DECEMBER 2010 (SINCE INCEPTIoN) 16 .20 9 .35
31ST DECEMBER 2011 15 .20 10 .31
31ST DECEMBER 2012 12 .48 8 .37
31ST DECEMBER 2013 10 .57 6 .47
31ST DECEMBER 2014 7 .93 5 .49
31ST DECEMBER 2015 11 .07 5 .64
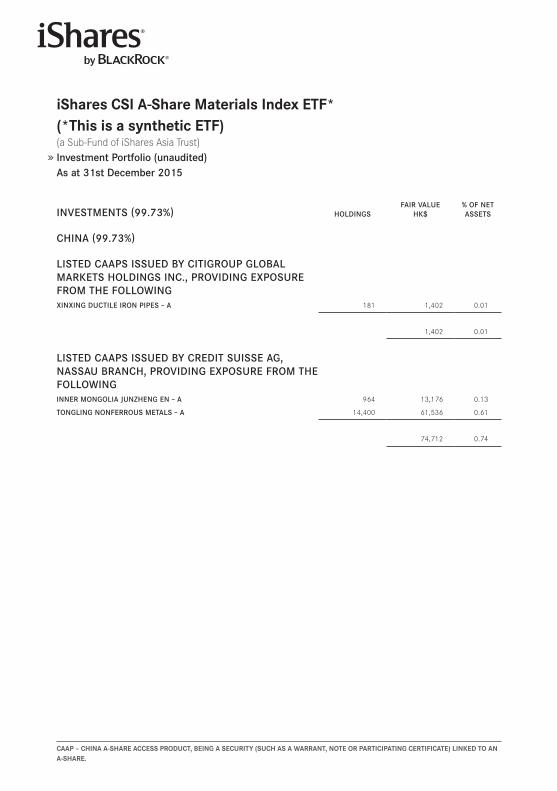
iShares CSi A-Share Materials index eTf*(*This is a synthetic eTf) (a Sub-Fund of iShares Asia Trust) Investment Portfolio (unaudited)As at 31st December 2015
CAAp – ChinA A-ShARe ACCeSS pRodUCT, Being A SeCURiTY (SUCh AS A wARRAnT, noTe oR pARTiCipATing CeRTifiCATe) linKed To An A-ShARe.
INVESTMENTS (99.73%) HolDINgSFAIR VAlUE
HK$% oF NET ASSETS
CHINA (99.73%)
lISTED CAAPS ISSUED By CITIgRoUP gloBAl MARKETS HolDINgS INC., PRoVIDINg EXPoSURE FRoM THE FollowINgXINXINg DUCTIlE IRoN PIPES – A 181 1,402 0 .01
1,402 0 .01
lISTED CAAPS ISSUED By CREDIT SUISSE Ag, NASSAU BRANCH, PRoVIDINg EXPoSURE FRoM THE FollowINgINNER MoNgolIA JUNzHENg EN – A 964 13,176 0 .13
ToNglINg NoNFERRoUS METAlS – A 14,400 61,536 0 .61
74,712 0 .74
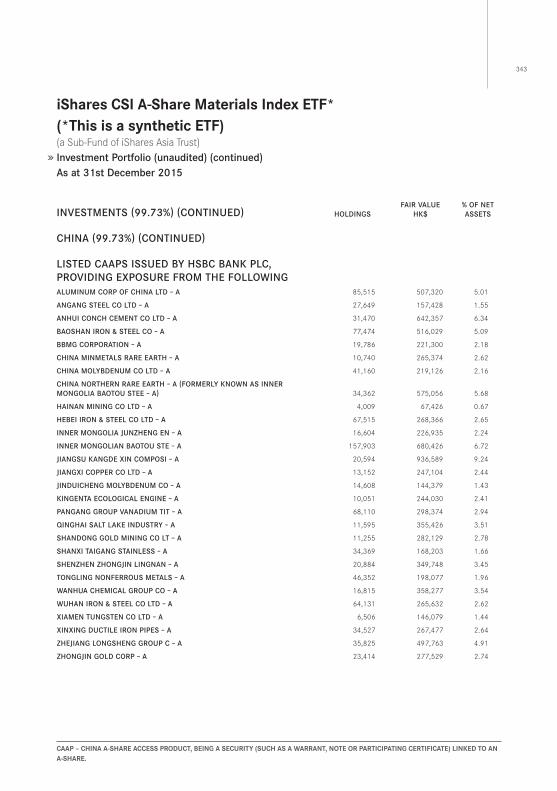
343
iShares CSi A-Share Materials index eTf*(*This is a synthetic eTf) (a Sub-Fund of iShares Asia Trust) Investment Portfolio (unaudited) (continued)As at 31st December 2015
CAAp – ChinA A-ShARe ACCeSS pRodUCT, Being A SeCURiTY (SUCh AS A wARRAnT, noTe oR pARTiCipATing CeRTifiCATe) linKed To An A-ShARe.
INVESTMENTS (99.73%) (CoNTINUED) HolDINgSFAIR VAlUE
HK$% oF NET ASSETS
CHINA (99.73%) (CoNTINUED)
lISTED CAAPS ISSUED By HSBC BANK PlC, PRoVIDINg EXPoSURE FRoM THE FollowINgAlUMINUM CoRP oF CHINA lTD – A 85,515 507,320 5 .01
ANgANg STEEl Co lTD – A 27,649 157,428 1 .55
ANHUI CoNCH CEMENT Co lTD – A 31,470 642,357 6 .34
BAoSHAN IRoN ﹠ STEEl Co – A 77,474 516,029 5 .09
BBMg CoRPoRATIoN – A 19,786 221,300 2 .18
CHINA MINMETAlS RARE EARTH – A 10,740 265,374 2 .62
CHINA MolyBDENUM Co lTD – A 41,160 219,126 2 .16
CHINA NoRTHERN RARE EARTH – A (FoRMERly KNowN AS INNER MoNgolIA BAoToU STEE – A) 34,362 575,056 5 .68
HAINAN MININg Co lTD – A 4,009 67,426 0 .67
HEBEI IRoN ﹠ STEEl Co lTD – A 67,515 268,366 2 .65
INNER MoNgolIA JUNzHENg EN – A 16,604 226,935 2 .24
INNER MoNgolIAN BAoToU STE – A 157,903 680,426 6 .72
JIANgSU KANgDE XIN CoMPoSI – A 20,594 936,589 9 .24
JIANgXI CoPPER Co lTD – A 13,152 247,104 2 .44
JINDUICHENg MolyBDENUM Co – A 14,608 144,379 1 .43
KINgENTA ECologICAl ENgINE – A 10,051 244,030 2 .41
PANgANg gRoUP VANADIUM TIT – A 68,110 298,374 2 .94
qINgHAI SAlT lAKE INDUSTRy – A 11,595 355,426 3 .51
SHANDoNg golD MININg Co lT – A 11,255 282,129 2 .78
SHANXI TAIgANg STAINlESS – A 34,369 168,203 1 .66
SHENzHEN zHoNgJIN lINgNAN – A 20,884 349,748 3 .45
ToNglINg NoNFERRoUS METAlS – A 46,352 198,077 1 .96
wANHUA CHEMICAl gRoUP Co – A 16,815 358,277 3 .54
wUHAN IRoN ﹠ STEEl Co lTD – A 64,131 265,632 2 .62
XIAMEN TUNgSTEN Co lTD – A 6,506 146,079 1 .44
XINXINg DUCTIlE IRoN PIPES – A 34,527 267,477 2 .64
zHEJIANg loNgSHENg gRoUP C – A 35,825 497,763 4 .91
zHoNgJIN golD CoRP – A 23,414 277,529 2 .74
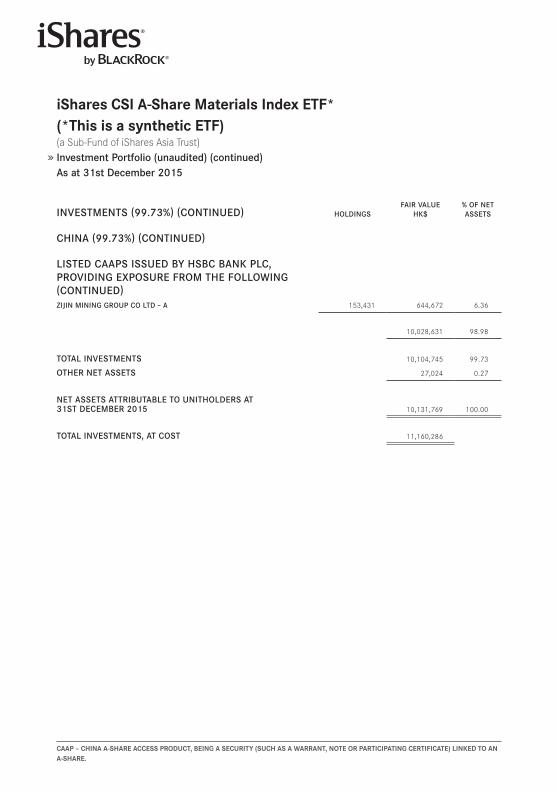
iShares CSi A-Share Materials index eTf*(*This is a synthetic eTf) (a Sub-Fund of iShares Asia Trust) Investment Portfolio (unaudited) (continued)As at 31st December 2015
CAAp – ChinA A-ShARe ACCeSS pRodUCT, Being A SeCURiTY (SUCh AS A wARRAnT, noTe oR pARTiCipATing CeRTifiCATe) linKed To An A-ShARe.
INVESTMENTS (99.73%) (CoNTINUED) HolDINgSFAIR VAlUE
HK$% oF NET ASSETS
CHINA (99.73%) (CoNTINUED)
lISTED CAAPS ISSUED By HSBC BANK PlC, PRoVIDINg EXPoSURE FRoM THE FollowINg (CoNTINUED)zIJIN MININg gRoUP Co lTD – A 153,431 644,672 6 .36
10,028,631 98 .98
ToTAl INVESTMENTS 10,104,745 99 .73
oTHER NET ASSETS 27,024 0 .27
NET ASSETS ATTRIBUTABlE To UNITHolDERS AT31ST DECEMBER 2015 10,131,769 100 .00
ToTAl INVESTMENTS, AT CoST 11,160,286

345
iShares CSi A-Share Materials index eTf*(*This is a synthetic eTf) (a Sub-Fund of iShares Asia Trust) Statement of Movements in Investment Portfolio (unaudited)For the year ended 31st December 2015
HolDINgS
INVESTMENTS 2014 ADDITIoNSCoRPoRATE
ACTIoN DISPoSAlS 2015
lISTED CAAPS ISSUED By CITIgRoUP gloBAl MARKETS HolDINgS INC.AlUMINUM CoRP oF CHINA lTD – A 5,292 – – 5,292 –
ANHUI CoNCH CEMENT Co lTD – A 1,333 – – 1,333 –
BAoSHAN IRoN ﹠ STEEl Co – A 8,853 – – 8,853 –
CHINA NoRTHERN RARE EARTH – A (FoRMERly KNowN AS INNER MoNgolIA BAoToU STEE – A) 2,546 – 1,273 3,819 –
HEBEI IRoN ﹠ STEEl Co lTD – A 14,686 – – 14,686 –
JIANgXI CoPPER Co lTD – A 1,311 – – 1,311 –
PANgANg gRoUP VANADIUM TIT – A 3,107 – – 3,107 –
qINgHAI SAlT lAKE INDUSTRy – A 1,213 – – 1,213 –
SHANDoNg golD MININg Co lT – A 1,128 – – 1,128 –
ToNglINg NoNFERRoUS METAlS – A 1,867 – 1,867 3,734 –
wANHUA CHEMICAl gRoUP Co – A 491 – – 491 –
wESTERN MININg Co – A 3,068 – – 3,068 –
XINXINg DUCTIlE IRoN PIPES – A 3,180 181 – 3,180 181
yUNNAN CHIHoNg zINC ﹠ gERM – A 336 – – 336 –
yUNNAN TIN Co lTD – A 187 – – 187 –
zHoNgJIN golD CoRP – A 2,017 – – 2,017 –
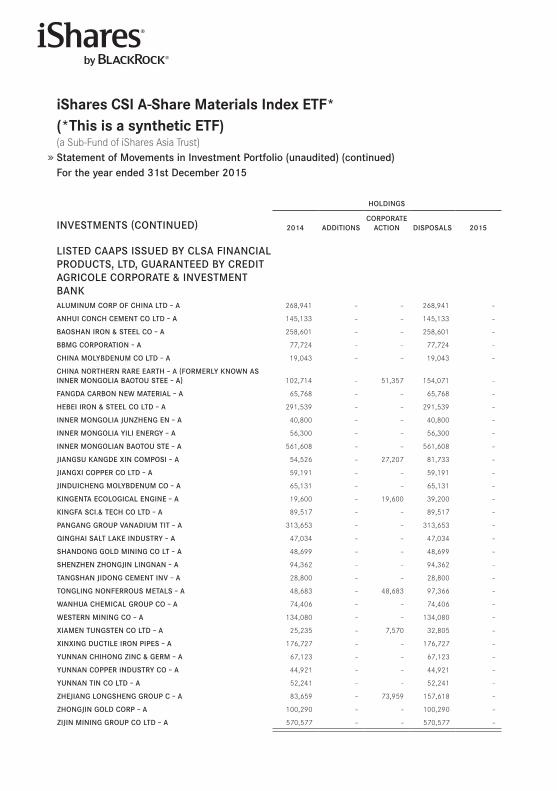
iShares CSi A-Share Materials index eTf*(*This is a synthetic eTf) (a Sub-Fund of iShares Asia Trust) Statement of Movements in Investment Portfolio (unaudited) (continued)For the year ended 31st December 2015
HolDINgS
INVESTMENTS (CoNTINUED) 2014 ADDITIoNSCoRPoRATE
ACTIoN DISPoSAlS 2015
lISTED CAAPS ISSUED By ClSA FINANCIAl PRoDUCTS, lTD, gUARANTEED By CREDIT AgRIColE CoRPoRATE ﹠ INVESTMENT BANKAlUMINUM CoRP oF CHINA lTD – A 268,941 – – 268,941 –
ANHUI CoNCH CEMENT Co lTD – A 145,133 – – 145,133 –
BAoSHAN IRoN ﹠ STEEl Co – A 258,601 – – 258,601 –
BBMg CoRPoRATIoN – A 77,724 – – 77,724 –
CHINA MolyBDENUM Co lTD – A 19,043 – – 19,043 –
CHINA NoRTHERN RARE EARTH – A (FoRMERly KNowN AS INNER MoNgolIA BAoToU STEE – A) 102,714 – 51,357 154,071 –
FANgDA CARBoN NEw MATERIAl – A 65,768 – – 65,768 –
HEBEI IRoN ﹠ STEEl Co lTD – A 291,539 – – 291,539 –
INNER MoNgolIA JUNzHENg EN – A 40,800 – – 40,800 –
INNER MoNgolIA yIlI ENERgy – A 56,300 – – 56,300 –
INNER MoNgolIAN BAoToU STE – A 561,608 – – 561,608 –
JIANgSU KANgDE XIN CoMPoSI – A 54,526 – 27,207 81,733 –
JIANgXI CoPPER Co lTD – A 59,191 – – 59,191 –
JINDUICHENg MolyBDENUM Co – A 65,131 – – 65,131 –
KINgENTA ECologICAl ENgINE – A 19,600 – 19,600 39,200 –
KINgFA SCI.﹠ TECH Co lTD – A 89,517 – – 89,517 –
PANgANg gRoUP VANADIUM TIT – A 313,653 – – 313,653 –
qINgHAI SAlT lAKE INDUSTRy – A 47,034 – – 47,034 –
SHANDoNg golD MININg Co lT – A 48,699 – – 48,699 –
SHENzHEN zHoNgJIN lINgNAN – A 94,362 – – 94,362 –
TANgSHAN JIDoNg CEMENT INV – A 28,800 – – 28,800 –
ToNglINg NoNFERRoUS METAlS – A 48,683 – 48,683 97,366 –
wANHUA CHEMICAl gRoUP Co – A 74,406 – – 74,406 –
wESTERN MININg Co – A 134,080 – – 134,080 –
XIAMEN TUNgSTEN Co lTD – A 25,235 – 7,570 32,805 –
XINXINg DUCTIlE IRoN PIPES – A 176,727 – – 176,727 –
yUNNAN CHIHoNg zINC ﹠ gERM – A 67,123 – – 67,123 –
yUNNAN CoPPER INDUSTRy Co – A 44,921 – – 44,921 –
yUNNAN TIN Co lTD – A 52,241 – – 52,241 –
zHEJIANg loNgSHENg gRoUP C – A 83,659 – 73,959 157,618 –
zHoNgJIN golD CoRP – A 100,290 – – 100,290 –
zIJIN MININg gRoUP Co lTD – A 570,577 – – 570,577 –
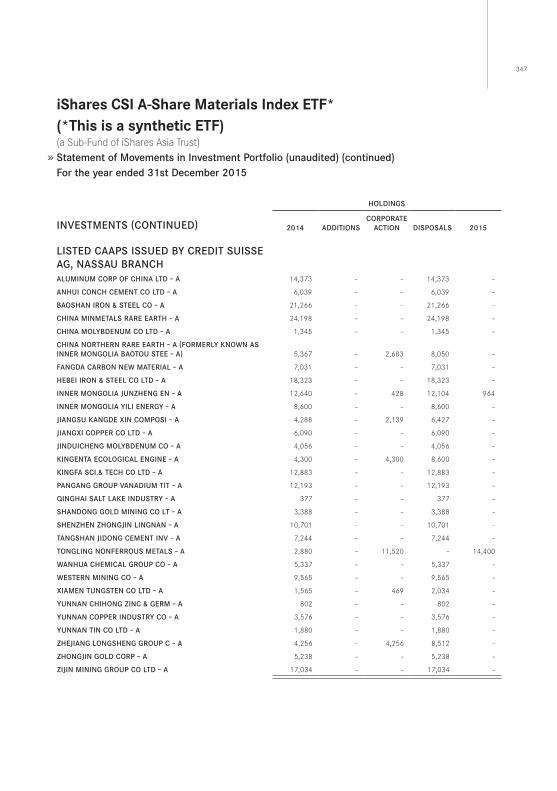
347
iShares CSi A-Share Materials index eTf*(*This is a synthetic eTf) (a Sub-Fund of iShares Asia Trust) Statement of Movements in Investment Portfolio (unaudited) (continued)For the year ended 31st December 2015
HolDINgS
INVESTMENTS (CoNTINUED) 2014 ADDITIoNSCoRPoRATE
ACTIoN DISPoSAlS 2015
lISTED CAAPS ISSUED By CREDIT SUISSE Ag, NASSAU BRANCHAlUMINUM CoRP oF CHINA lTD – A 14,373 – – 14,373 –
ANHUI CoNCH CEMENT Co lTD – A 6,039 – – 6,039 –
BAoSHAN IRoN ﹠ STEEl Co – A 21,266 – – 21,266 –
CHINA MINMETAlS RARE EARTH – A 24,198 – – 24,198 –
CHINA MolyBDENUM Co lTD – A 1,345 – – 1,345 –
CHINA NoRTHERN RARE EARTH – A (FoRMERly KNowN AS INNER MoNgolIA BAoToU STEE – A) 5,367 – 2,683 8,050 –
FANgDA CARBoN NEw MATERIAl – A 7,031 – – 7,031 –
HEBEI IRoN ﹠ STEEl Co lTD – A 18,323 – – 18,323 –
INNER MoNgolIA JUNzHENg EN – A 12,640 – 428 12,104 964
INNER MoNgolIA yIlI ENERgy – A 8,600 – – 8,600 –
JIANgSU KANgDE XIN CoMPoSI – A 4,288 – 2,139 6,427 –
JIANgXI CoPPER Co lTD – A 6,090 – – 6,090 –
JINDUICHENg MolyBDENUM Co – A 4,056 – – 4,056 –
KINgENTA ECologICAl ENgINE – A 4,300 – 4,300 8,600 –
KINgFA SCI.﹠ TECH Co lTD – A 12,883 – – 12,883 –
PANgANg gRoUP VANADIUM TIT – A 12,193 – – 12,193 –
qINgHAI SAlT lAKE INDUSTRy – A 377 – – 377 –
SHANDoNg golD MININg Co lT – A 3,388 – – 3,388 –
SHENzHEN zHoNgJIN lINgNAN – A 10,701 – – 10,701 –
TANgSHAN JIDoNg CEMENT INV – A 7,244 – – 7,244 –
ToNglINg NoNFERRoUS METAlS – A 2,880 – 11,520 – 14,400
wANHUA CHEMICAl gRoUP Co – A 5,337 – – 5,337 –
wESTERN MININg Co – A 9,565 – – 9,565 –
XIAMEN TUNgSTEN Co lTD – A 1,565 – 469 2,034 –
yUNNAN CHIHoNg zINC ﹠ gERM – A 802 – – 802 –
yUNNAN CoPPER INDUSTRy Co – A 3,576 – – 3,576 –
yUNNAN TIN Co lTD – A 1,880 – – 1,880 –
zHEJIANg loNgSHENg gRoUP C – A 4,256 – 4,256 8,512 –
zHoNgJIN golD CoRP – A 5,238 – – 5,238 –
zIJIN MININg gRoUP Co lTD – A 17,034 – – 17,034 –
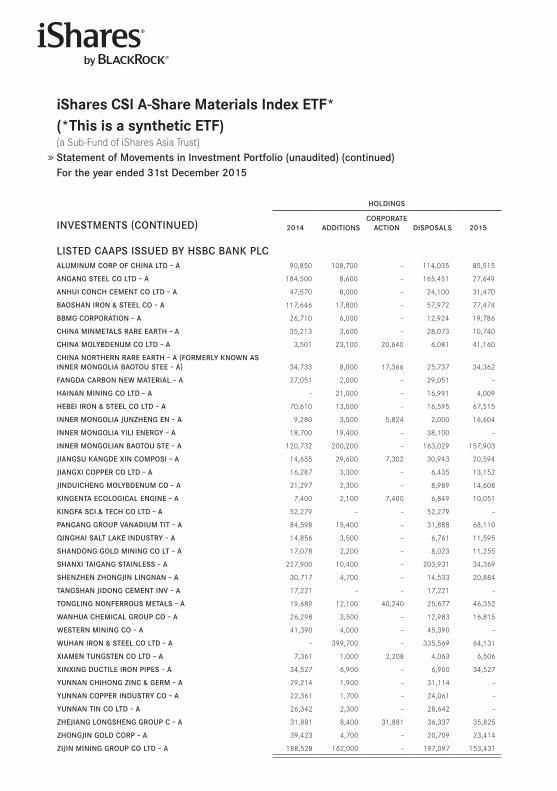
iShares CSi A-Share Materials index eTf*(*This is a synthetic eTf) (a Sub-Fund of iShares Asia Trust) Statement of Movements in Investment Portfolio (unaudited) (continued)For the year ended 31st December 2015
HolDINgS
INVESTMENTS (CoNTINUED) 2014 ADDITIoNSCoRPoRATE
ACTIoN DISPoSAlS 2015
lISTED CAAPS ISSUED By HSBC BANK PlCAlUMINUM CoRP oF CHINA lTD – A 90,850 108,700 – 114,035 85,515
ANgANg STEEl Co lTD – A 184,500 8,600 – 165,451 27,649
ANHUI CoNCH CEMENT Co lTD – A 47,570 8,000 – 24,100 31,470
BAoSHAN IRoN ﹠ STEEl Co – A 117,646 17,800 – 57,972 77,474
BBMg CoRPoRATIoN – A 26,710 6,000 – 12,924 19,786
CHINA MINMETAlS RARE EARTH – A 35,213 3,600 – 28,073 10,740
CHINA MolyBDENUM Co lTD – A 3,501 23,100 20,640 6,081 41,160
CHINA NoRTHERN RARE EARTH – A (FoRMERly KNowN AS INNER MoNgolIA BAoToU STEE – A) 34,733 8,000 17,366 25,737 34,362
FANgDA CARBoN NEw MATERIAl – A 27,051 2,000 – 29,051 –
HAINAN MININg Co lTD – A – 21,000 – 16,991 4,009
HEBEI IRoN ﹠ STEEl Co lTD – A 70,610 13,500 – 16,595 67,515
INNER MoNgolIA JUNzHENg EN – A 9,280 3,500 5,824 2,000 16,604
INNER MoNgolIA yIlI ENERgy – A 18,700 19,400 – 38,100 –
INNER MoNgolIAN BAoToU STE – A 120,732 200,200 – 163,029 157,903
JIANgSU KANgDE XIN CoMPoSI – A 14,635 29,600 7,302 30,943 20,594
JIANgXI CoPPER Co lTD – A 16,287 3,300 – 6,435 13,152
JINDUICHENg MolyBDENUM Co – A 21,297 2,300 – 8,989 14,608
KINgENTA ECologICAl ENgINE – A 7,400 2,100 7,400 6,849 10,051
KINgFA SCI.﹠ TECH Co lTD – A 52,279 – – 52,279 –
PANgANg gRoUP VANADIUM TIT – A 84,598 15,400 – 31,888 68,110
qINgHAI SAlT lAKE INDUSTRy – A 14,856 3,500 – 6,761 11,595
SHANDoNg golD MININg Co lT – A 17,078 2,200 – 8,023 11,255
SHANXI TAIgANg STAINlESS – A 227,900 10,400 – 203,931 34,369
SHENzHEN zHoNgJIN lINgNAN – A 30,717 4,700 – 14,533 20,884
TANgSHAN JIDoNg CEMENT INV – A 17,221 – – 17,221 –
ToNglINg NoNFERRoUS METAlS – A 19,689 12,100 40,240 25,677 46,352
wANHUA CHEMICAl gRoUP Co – A 26,298 3,500 – 12,983 16,815
wESTERN MININg Co – A 41,390 4,000 – 45,390 –
wUHAN IRoN ﹠ STEEl Co lTD – A – 399,700 – 335,569 64,131
XIAMEN TUNgSTEN Co lTD – A 7,361 1,000 2,208 4,063 6,506
XINXINg DUCTIlE IRoN PIPES – A 34,527 6,900 – 6,900 34,527
yUNNAN CHIHoNg zINC ﹠ gERM – A 29,214 1,900 – 31,114 –
yUNNAN CoPPER INDUSTRy Co – A 22,361 1,700 – 24,061 –
yUNNAN TIN Co lTD – A 26,342 2,300 – 28,642 –
zHEJIANg loNgSHENg gRoUP C – A 31,881 8,400 31,881 36,337 35,825
zHoNgJIN golD CoRP – A 39,423 4,700 – 20,709 23,414
zIJIN MININg gRoUP Co lTD – A 188,528 162,000 – 197,097 153,431
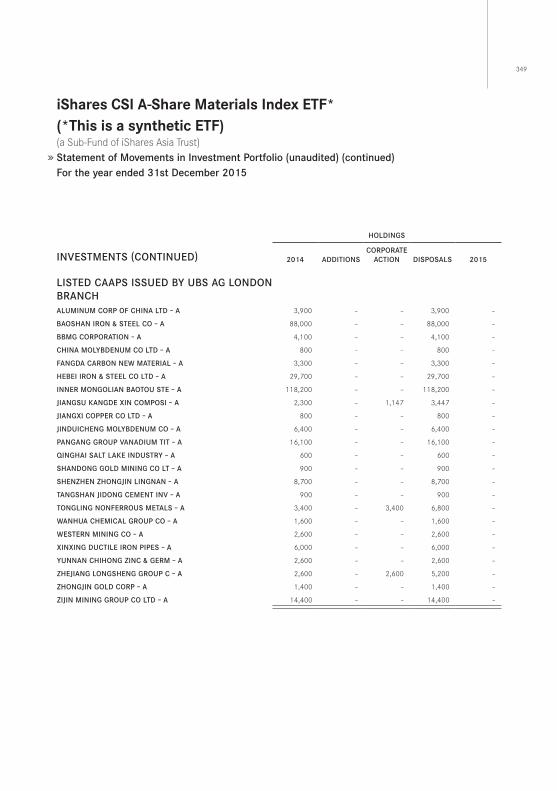
349
iShares CSi A-Share Materials index eTf*(*This is a synthetic eTf) (a Sub-Fund of iShares Asia Trust) Statement of Movements in Investment Portfolio (unaudited) (continued)For the year ended 31st December 2015
HolDINgS
INVESTMENTS (CoNTINUED) 2014 ADDITIoNSCoRPoRATE
ACTIoN DISPoSAlS 2015
lISTED CAAPS ISSUED By UBS Ag loNDoN BRANCHAlUMINUM CoRP oF CHINA lTD – A 3,900 – – 3,900 –
BAoSHAN IRoN ﹠ STEEl Co – A 88,000 – – 88,000 –
BBMg CoRPoRATIoN – A 4,100 – – 4,100 –
CHINA MolyBDENUM Co lTD – A 800 – – 800 –
FANgDA CARBoN NEw MATERIAl – A 3,300 – – 3,300 –
HEBEI IRoN ﹠ STEEl Co lTD – A 29,700 – – 29,700 –
INNER MoNgolIAN BAoToU STE – A 118,200 – – 118,200 –
JIANgSU KANgDE XIN CoMPoSI – A 2,300 – 1,147 3,447 –
JIANgXI CoPPER Co lTD – A 800 – – 800 –
JINDUICHENg MolyBDENUM Co – A 6,400 – – 6,400 –
PANgANg gRoUP VANADIUM TIT – A 16,100 – – 16,100 –
qINgHAI SAlT lAKE INDUSTRy – A 600 – – 600 –
SHANDoNg golD MININg Co lT – A 900 – – 900 –
SHENzHEN zHoNgJIN lINgNAN – A 8,700 – – 8,700 –
TANgSHAN JIDoNg CEMENT INV – A 900 – – 900 –
ToNglINg NoNFERRoUS METAlS – A 3,400 – 3,400 6,800 –
wANHUA CHEMICAl gRoUP Co – A 1,600 – – 1,600 –
wESTERN MININg Co – A 2,600 – – 2,600 –
XINXINg DUCTIlE IRoN PIPES – A 6,000 – – 6,000 –
yUNNAN CHIHoNg zINC ﹠ gERM – A 2,600 – – 2,600 –
zHEJIANg loNgSHENg gRoUP C – A 2,600 – 2,600 5,200 –
zHoNgJIN golD CoRP – A 1,400 – – 1,400 –
zIJIN MININg gRoUP Co lTD – A 14,400 – – 14,400 –
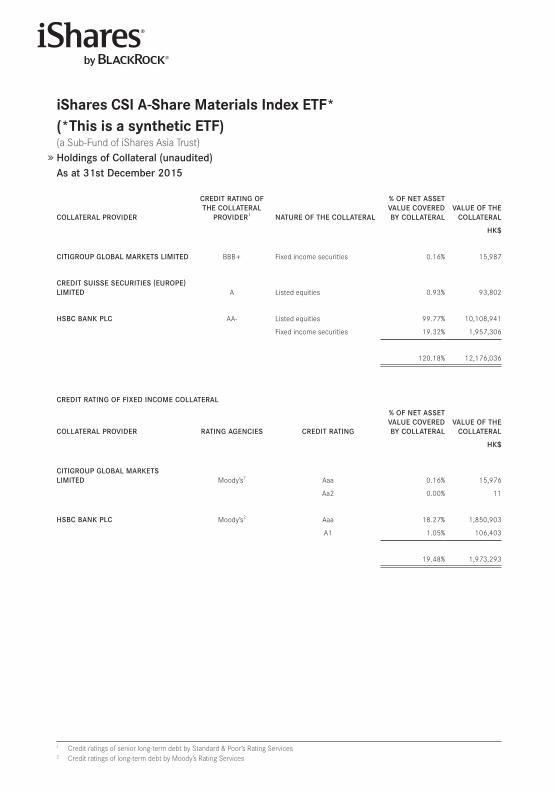
iShares CSi A-Share Materials index eTf* (*This is a synthetic eTf) (a Sub-Fund of iShares Asia Trust)Holdings of Collateral (unaudited)As at 31st December 2015
CollATERAl PRoVIDER
CREDIT RATINg oF THE CollATERAl
PRoVIDER1 NATURE oF THE CollATERAl
% oF NET ASSET VAlUE CoVERED By CollATERAl
VAlUE oF THE CollATERAl
HK$
CITIgRoUP gloBAl MARKETS lIMITED BBB+ Fixed income securities 0 .16% 15,987
CREDIT SUISSE SECURITIES (EURoPE) lIMITED A Listed equities 0 .93% 93,802
HSBC BANK PlC AA- Listed equities 99 .77% 10,108,941
Fixed income securities 19 .32% 1,957,306
120 .18% 12,176,036
CREDIT RATINg oF FIXED INCoME CollATERAl
CollATERAl PRoVIDER RATINg AgENCIES CREDIT RATINg
% oF NET ASSET VAlUE CoVERED By CollATERAl
VAlUE oF THE CollATERAl
HK$
CITIgRoUP gloBAl MARKETS lIMITED Moody’s2 Aaa 0 .16% 15,976
Aa2 0 .00% 11
HSBC BANK PlC Moody’s2 Aaa 18 .27% 1,850,903
A1 1 .05% 106,403
19 .48% 1,973,293
1 Credit ratings of senior long-term debt by Standard & Poor’s Rating Services2 Credit ratings of long-term debt by Moody’s Rating Services
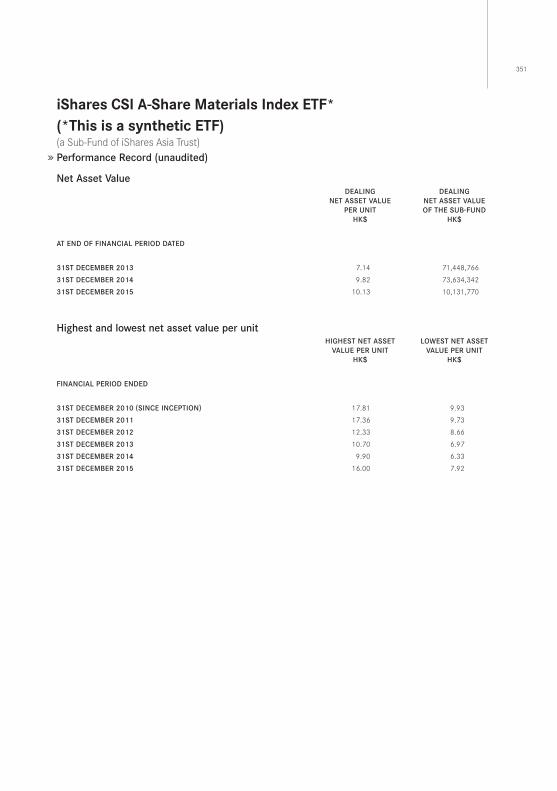
351
iShares CSi A-Share Materials index eTf* (*This is a synthetic eTf) (a Sub-Fund of iShares Asia Trust)Performance Record (unaudited)
Net Asset ValueDEAlINg
NET ASSET VAlUE PER UNIT
HK$
DEAlINgNET ASSET VAlUE oF THE SUB-FUND
HK$
AT END oF FINANCIAl PERIoD DATED
31ST DECEMBER 2013 7 .14 71,448,766
31ST DECEMBER 2014 9 .82 73,634,342
31ST DECEMBER 2015 10 .13 10,131,770
Highest and lowest net asset value per unitHIgHEST NET ASSET
VAlUE PER UNITHK$
lowEST NET ASSETVAlUE PER UNIT
HK$
FINANCIAl PERIoD ENDED
31ST DECEMBER 2010 (SINCE INCEPTIoN) 17 .81 9 .93
31ST DECEMBER 2011 17 .36 9 .73
31ST DECEMBER 2012 12 .33 8 .66
31ST DECEMBER 2013 10 .70 6 .97
31ST DECEMBER 2014 9 .90 6 .33
31ST DECEMBER 2015 16 .00 7 .92
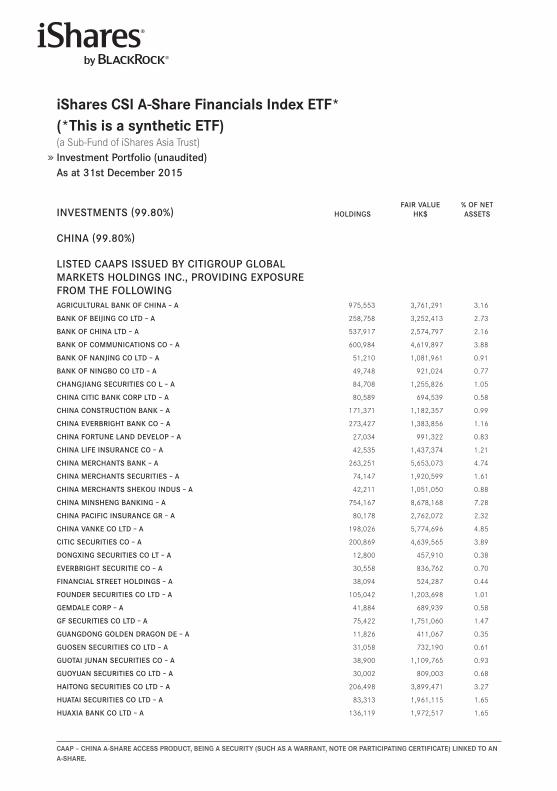
iShares CSi A-Share financials index eTf*(*This is a synthetic eTf) (a Sub-Fund of iShares Asia Trust) Investment Portfolio (unaudited)As at 31st December 2015
CAAp – ChinA A-ShARe ACCeSS pRodUCT, Being A SeCURiTY (SUCh AS A wARRAnT, noTe oR pARTiCipATing CeRTifiCATe) linKed To An A-ShARe.
INVESTMENTS (99.80%) HolDINgSFAIR VAlUE
HK$% oF NET ASSETS
CHINA (99.80%)
lISTED CAAPS ISSUED By CITIgRoUP gloBAl MARKETS HolDINgS INC., PRoVIDINg EXPoSURE FRoM THE FollowINgAgRICUlTURAl BANK oF CHINA – A 975,553 3,761,291 3 .16
BANK oF BEIJINg Co lTD – A 258,758 3,252,413 2 .73
BANK oF CHINA lTD – A 537,917 2,574,797 2 .16
BANK oF CoMMUNICATIoNS Co – A 600,984 4,619,897 3 .88
BANK oF NANJINg Co lTD – A 51,210 1,081,961 0 .91
BANK oF NINgBo Co lTD – A 49,748 921,024 0 .77
CHANgJIANg SECURITIES Co l – A 84,708 1,255,826 1 .05
CHINA CITIC BANK CoRP lTD – A 80,589 694,539 0 .58
CHINA CoNSTRUCTIoN BANK – A 171,371 1,182,357 0 .99
CHINA EVERBRIgHT BANK Co – A 273,427 1,383,856 1 .16
CHINA FoRTUNE lAND DEVEloP – A 27,034 991,322 0 .83
CHINA lIFE INSURANCE Co – A 42,535 1,437,374 1 .21
CHINA MERCHANTS BANK – A 263,251 5,653,073 4 .74
CHINA MERCHANTS SECURITIES – A 74,147 1,920,599 1 .61
CHINA MERCHANTS SHEKoU INDUS – A 42,211 1,051,050 0 .88
CHINA MINSHENg BANKINg – A 754,167 8,678,168 7 .28
CHINA PACIFIC INSURANCE gR – A 80,178 2,762,072 2 .32
CHINA VANKE Co lTD – A 198,026 5,774,696 4 .85
CITIC SECURITIES Co – A 200,869 4,639,565 3 .89
DoNgXINg SECURITIES Co lT – A 12,800 457,910 0 .38
EVERBRIgHT SECURITIE Co – A 30,558 836,762 0 .70
FINANCIAl STREET HolDINgS – A 38,094 524,287 0 .44
FoUNDER SECURITIES Co lTD – A 105,042 1,203,698 1 .01
gEMDAlE CoRP – A 41,884 689,939 0 .58
gF SECURITIES Co lTD – A 75,422 1,751,060 1 .47
gUANgDoNg golDEN DRAgoN DE – A 11,826 411,067 0 .35
gUoSEN SECURITIES Co lTD – A 31,058 732,190 0 .61
gUoTAI JUNAN SECURITIES Co – A 38,900 1,109,765 0 .93
gUoyUAN SECURITIES Co lTD – A 30,002 809,003 0 .68
HAIToNg SECURITIES Co lTD – A 206,498 3,899,471 3 .27
HUATAI SECURITIES Co lTD – A 83,313 1,961,115 1 .65
HUAXIA BANK Co lTD – A 136,119 1,972,517 1 .65
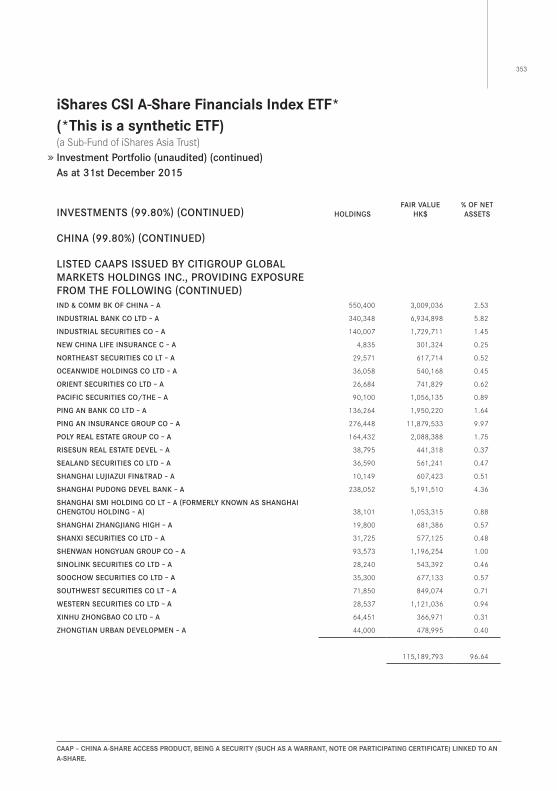
353
iShares CSi A-Share financials index eTf*(*This is a synthetic eTf) (a Sub-Fund of iShares Asia Trust) Investment Portfolio (unaudited) (continued)As at 31st December 2015
CAAp – ChinA A-ShARe ACCeSS pRodUCT, Being A SeCURiTY (SUCh AS A wARRAnT, noTe oR pARTiCipATing CeRTifiCATe) linKed To An A-ShARe.
INVESTMENTS (99.80%) (CoNTINUED) HolDINgSFAIR VAlUE
HK$% oF NET ASSETS
CHINA (99.80%) (CoNTINUED)
lISTED CAAPS ISSUED By CITIgRoUP gloBAl MARKETS HolDINgS INC., PRoVIDINg EXPoSURE FRoM THE FollowINg (CoNTINUED)IND ﹠ CoMM BK oF CHINA – A 550,400 3,009,036 2 .53
INDUSTRIAl BANK Co lTD – A 340,348 6,934,898 5 .82
INDUSTRIAl SECURITIES Co – A 140,007 1,729,711 1 .45
NEw CHINA lIFE INSURANCE C – A 4,835 301,324 0 .25
NoRTHEAST SECURITIES Co lT – A 29,571 617,714 0 .52
oCEANwIDE HolDINgS Co lTD – A 36,058 540,168 0 .45
oRIENT SECURITIES Co lTD – A 26,684 741,829 0 .62
PACIFIC SECURITIES Co/THE – A 90,100 1,056,135 0 .89
PINg AN BANK Co lTD – A 136,264 1,950,220 1 .64
PINg AN INSURANCE gRoUP Co – A 276,448 11,879,533 9 .97
Poly REAl ESTATE gRoUP Co – A 164,432 2,088,388 1 .75
RISESUN REAl ESTATE DEVEl – A 38,795 441,318 0 .37
SEAlAND SECURITIES Co lTD – A 36,590 561,241 0 .47
SHANgHAI lUJIAzUI FIN﹠TRAD – A 10,149 607,423 0 .51
SHANgHAI PUDoNg DEVEl BANK – A 238,052 5,191,510 4 .36
SHANgHAI SMI HolDINg Co lT – A (FoRMERly KNowN AS SHANgHAI CHENgToU HolDINg – A) 38,101 1,053,315 0 .88
SHANgHAI zHANgJIANg HIgH – A 19,800 681,386 0 .57
SHANXI SECURITIES Co lTD – A 31,725 577,125 0 .48
SHENwAN HoNgyUAN gRoUP Co – A 93,573 1,196,254 1 .00
SINolINK SECURITIES Co lTD – A 28,240 543,392 0 .46
SooCHow SECURITIES Co lTD – A 35,300 677,133 0 .57
SoUTHwEST SECURITIES Co lT – A 71,850 849,074 0 .71
wESTERN SECURITIES Co lTD – A 28,537 1,121,036 0 .94
XINHU zHoNgBAo Co lTD – A 64,451 366,971 0 .31
zHoNgTIAN URBAN DEVEloPMEN – A 44,000 478,995 0 .40
115,189,793 96 .64
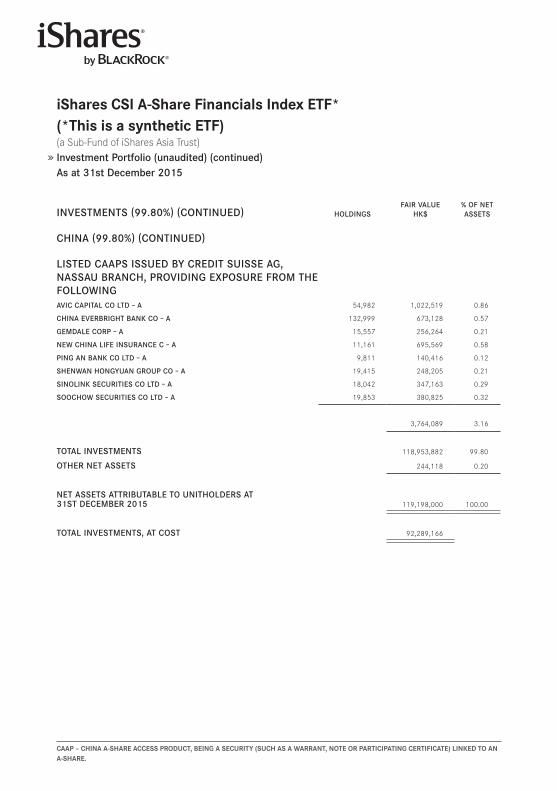
iShares CSi A-Share financials index eTf*(*This is a synthetic eTf) (a Sub-Fund of iShares Asia Trust) Investment Portfolio (unaudited) (continued)As at 31st December 2015
CAAp – ChinA A-ShARe ACCeSS pRodUCT, Being A SeCURiTY (SUCh AS A wARRAnT, noTe oR pARTiCipATing CeRTifiCATe) linKed To An A-ShARe.
INVESTMENTS (99.80%) (CoNTINUED) HolDINgSFAIR VAlUE
HK$% oF NET ASSETS
CHINA (99.80%) (CoNTINUED)
lISTED CAAPS ISSUED By CREDIT SUISSE Ag, NASSAU BRANCH, PRoVIDINg EXPoSURE FRoM THE FollowINgAVIC CAPITAl Co lTD – A 54,982 1,022,519 0 .86
CHINA EVERBRIgHT BANK Co – A 132,999 673,128 0 .57
gEMDAlE CoRP – A 15,557 256,264 0 .21
NEw CHINA lIFE INSURANCE C – A 11,161 695,569 0 .58
PINg AN BANK Co lTD – A 9,811 140,416 0 .12
SHENwAN HoNgyUAN gRoUP Co – A 19,415 248,205 0 .21
SINolINK SECURITIES Co lTD – A 18,042 347,163 0 .29
SooCHow SECURITIES Co lTD – A 19,853 380,825 0 .32
3,764,089 3 .16
ToTAl INVESTMENTS 118,953,882 99 .80
oTHER NET ASSETS 244,118 0 .20
NET ASSETS ATTRIBUTABlE To UNITHolDERS AT31ST DECEMBER 2015 119,198,000 100 .00
ToTAl INVESTMENTS, AT CoST 92,289,166
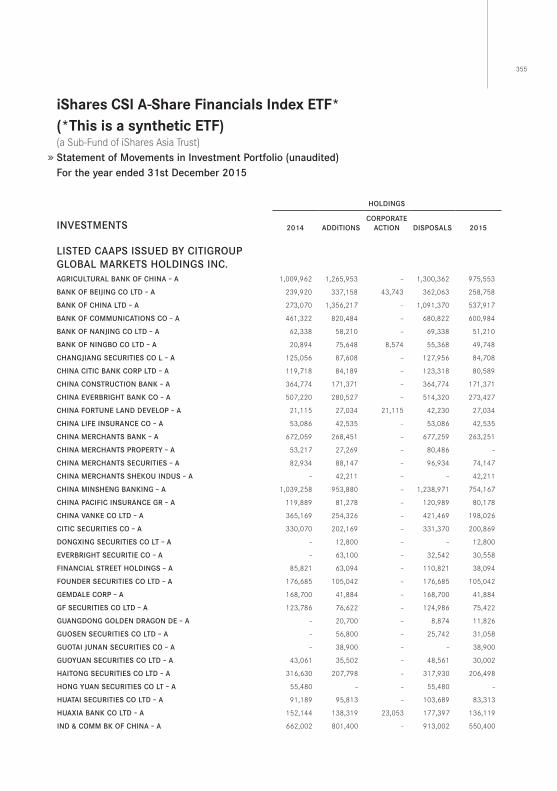
355
iShares CSi A-Share financials index eTf*(*This is a synthetic eTf) (a Sub-Fund of iShares Asia Trust) Statement of Movements in Investment Portfolio (unaudited)For the year ended 31st December 2015
HolDINgS
INVESTMENTS 2014 ADDITIoNSCoRPoRATE
ACTIoN DISPoSAlS 2015
lISTED CAAPS ISSUED By CITIgRoUP gloBAl MARKETS HolDINgS INC.AgRICUlTURAl BANK oF CHINA – A 1,009,962 1,265,953 – 1,300,362 975,553
BANK oF BEIJINg Co lTD – A 239,920 337,158 43,743 362,063 258,758
BANK oF CHINA lTD – A 273,070 1,356,217 – 1,091,370 537,917
BANK oF CoMMUNICATIoNS Co – A 461,322 820,484 – 680,822 600,984
BANK oF NANJINg Co lTD – A 62,338 58,210 – 69,338 51,210
BANK oF NINgBo Co lTD – A 20,894 75,648 8,574 55,368 49,748
CHANgJIANg SECURITIES Co l – A 125,056 87,608 – 127,956 84,708
CHINA CITIC BANK CoRP lTD – A 119,718 84,189 – 123,318 80,589
CHINA CoNSTRUCTIoN BANK – A 364,774 171,371 – 364,774 171,371
CHINA EVERBRIgHT BANK Co – A 507,220 280,527 – 514,320 273,427
CHINA FoRTUNE lAND DEVEloP – A 21,115 27,034 21,115 42,230 27,034
CHINA lIFE INSURANCE Co – A 53,086 42,535 – 53,086 42,535
CHINA MERCHANTS BANK – A 672,059 268,451 – 677,259 263,251
CHINA MERCHANTS PRoPERTy – A 53,217 27,269 – 80,486 –
CHINA MERCHANTS SECURITIES – A 82,934 88,147 – 96,934 74,147
CHINA MERCHANTS SHEKoU INDUS – A – 42,211 – – 42,211
CHINA MINSHENg BANKINg – A 1,039,258 953,880 – 1,238,971 754,167
CHINA PACIFIC INSURANCE gR – A 119,889 81,278 – 120,989 80,178
CHINA VANKE Co lTD – A 365,169 254,326 – 421,469 198,026
CITIC SECURITIES Co – A 330,070 202,169 – 331,370 200,869
DoNgXINg SECURITIES Co lT – A – 12,800 – – 12,800
EVERBRIgHT SECURITIE Co – A – 63,100 – 32,542 30,558
FINANCIAl STREET HolDINgS – A 85,821 63,094 – 110,821 38,094
FoUNDER SECURITIES Co lTD – A 176,685 105,042 – 176,685 105,042
gEMDAlE CoRP – A 168,700 41,884 – 168,700 41,884
gF SECURITIES Co lTD – A 123,786 76,622 – 124,986 75,422
gUANgDoNg golDEN DRAgoN DE – A – 20,700 – 8,874 11,826
gUoSEN SECURITIES Co lTD – A – 56,800 – 25,742 31,058
gUoTAI JUNAN SECURITIES Co – A – 38,900 – – 38,900
gUoyUAN SECURITIES Co lTD – A 43,061 35,502 – 48,561 30,002
HAIToNg SECURITIES Co lTD – A 316,630 207,798 – 317,930 206,498
HoNg yUAN SECURITIES Co lT – A 55,480 – – 55,480 –
HUATAI SECURITIES Co lTD – A 91,189 95,813 – 103,689 83,313
HUAXIA BANK Co lTD – A 152,144 138,319 23,053 177,397 136,119
IND ﹠ CoMM BK oF CHINA – A 662,002 801,400 – 913,002 550,400
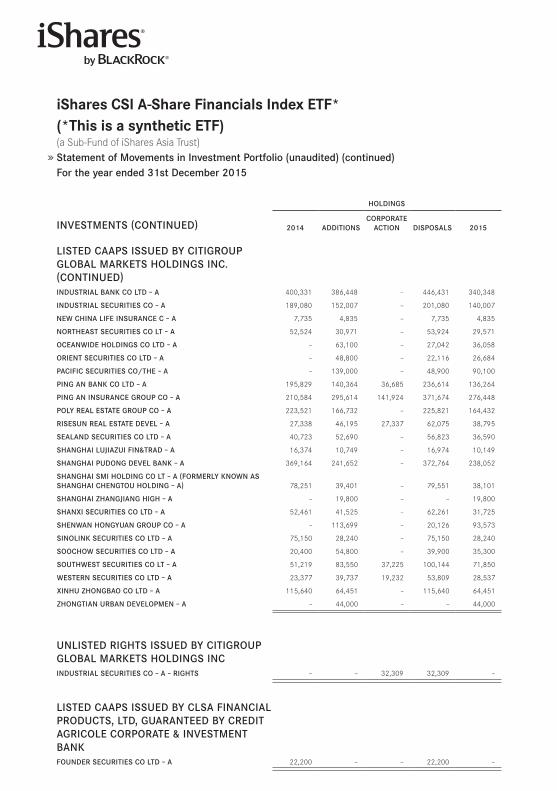
iShares CSi A-Share financials index eTf*(*This is a synthetic eTf) (a Sub-Fund of iShares Asia Trust) Statement of Movements in Investment Portfolio (unaudited) (continued)For the year ended 31st December 2015
HolDINgS
INVESTMENTS (CoNTINUED) 2014 ADDITIoNSCoRPoRATE
ACTIoN DISPoSAlS 2015
lISTED CAAPS ISSUED By CITIgRoUP gloBAl MARKETS HolDINgS INC. (CoNTINUED)INDUSTRIAl BANK Co lTD – A 400,331 386,448 – 446,431 340,348
INDUSTRIAl SECURITIES Co – A 189,080 152,007 – 201,080 140,007
NEw CHINA lIFE INSURANCE C – A 7,735 4,835 – 7,735 4,835
NoRTHEAST SECURITIES Co lT – A 52,524 30,971 – 53,924 29,571
oCEANwIDE HolDINgS Co lTD – A – 63,100 – 27,042 36,058
oRIENT SECURITIES Co lTD – A – 48,800 – 22,116 26,684
PACIFIC SECURITIES Co/THE – A – 139,000 – 48,900 90,100
PINg AN BANK Co lTD – A 195,829 140,364 36,685 236,614 136,264
PINg AN INSURANCE gRoUP Co – A 210,584 295,614 141,924 371,674 276,448
Poly REAl ESTATE gRoUP Co – A 223,521 166,732 – 225,821 164,432
RISESUN REAl ESTATE DEVEl – A 27,338 46,195 27,337 62,075 38,795
SEAlAND SECURITIES Co lTD – A 40,723 52,690 – 56,823 36,590
SHANgHAI lUJIAzUI FIN﹠TRAD – A 16,374 10,749 – 16,974 10,149
SHANgHAI PUDoNg DEVEl BANK – A 369,164 241,652 – 372,764 238,052
SHANgHAI SMI HolDINg Co lT – A (FoRMERly KNowN AS SHANgHAI CHENgToU HolDINg – A) 78,251 39,401 – 79,551 38,101
SHANgHAI zHANgJIANg HIgH – A – 19,800 – – 19,800
SHANXI SECURITIES Co lTD – A 52,461 41,525 – 62,261 31,725
SHENwAN HoNgyUAN gRoUP Co – A – 113,699 – 20,126 93,573
SINolINK SECURITIES Co lTD – A 75,150 28,240 – 75,150 28,240
SooCHow SECURITIES Co lTD – A 20,400 54,800 – 39,900 35,300
SoUTHwEST SECURITIES Co lT – A 51,219 83,550 37,225 100,144 71,850
wESTERN SECURITIES Co lTD – A 23,377 39,737 19,232 53,809 28,537
XINHU zHoNgBAo Co lTD – A 115,640 64,451 – 115,640 64,451
zHoNgTIAN URBAN DEVEloPMEN – A – 44,000 – – 44,000
UNlISTED RIgHTS ISSUED By CITIgRoUP gloBAl MARKETS HolDINgS INCINDUSTRIAl SECURITIES Co – A – RIgHTS – – 32,309 32,309 –
lISTED CAAPS ISSUED By ClSA FINANCIAl PRoDUCTS, lTD, gUARANTEED By CREDIT AgRIColE CoRPoRATE ﹠ INVESTMENT BANKFoUNDER SECURITIES Co lTD – A 22,200 – – 22,200 –
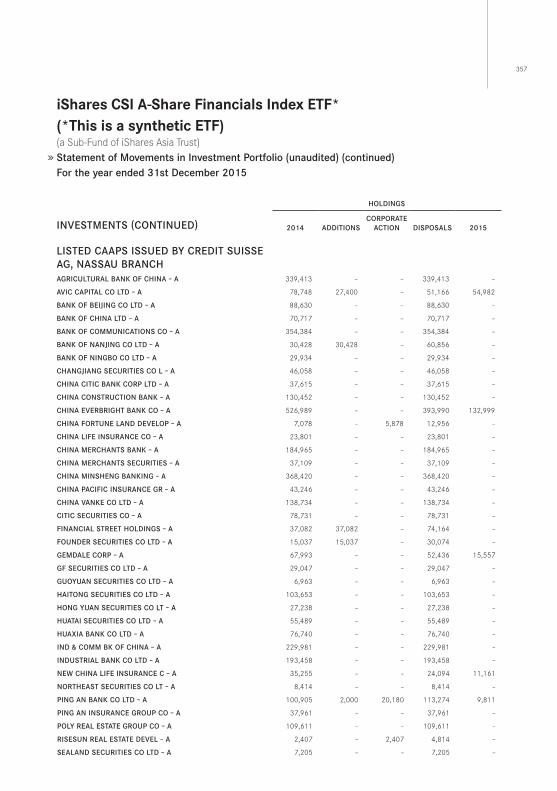
357
iShares CSi A-Share financials index eTf*(*This is a synthetic eTf) (a Sub-Fund of iShares Asia Trust) Statement of Movements in Investment Portfolio (unaudited) (continued)For the year ended 31st December 2015
HolDINgS
INVESTMENTS (CoNTINUED) 2014 ADDITIoNSCoRPoRATE
ACTIoN DISPoSAlS 2015
lISTED CAAPS ISSUED By CREDIT SUISSE Ag, NASSAU BRANCHAgRICUlTURAl BANK oF CHINA – A 339,413 – – 339,413 –
AVIC CAPITAl Co lTD – A 78,748 27,400 – 51,166 54,982
BANK oF BEIJINg Co lTD – A 88,630 – – 88,630 –
BANK oF CHINA lTD – A 70,717 – – 70,717 –
BANK oF CoMMUNICATIoNS Co – A 354,384 – – 354,384 –
BANK oF NANJINg Co lTD – A 30,428 30,428 – 60,856 –
BANK oF NINgBo Co lTD – A 29,934 – – 29,934 –
CHANgJIANg SECURITIES Co l – A 46,058 – – 46,058 –
CHINA CITIC BANK CoRP lTD – A 37,615 – – 37,615 –
CHINA CoNSTRUCTIoN BANK – A 130,452 – – 130,452 –
CHINA EVERBRIgHT BANK Co – A 526,989 – – 393,990 132,999
CHINA FoRTUNE lAND DEVEloP – A 7,078 – 5,878 12,956 –
CHINA lIFE INSURANCE Co – A 23,801 – – 23,801 –
CHINA MERCHANTS BANK – A 184,965 – – 184,965 –
CHINA MERCHANTS SECURITIES – A 37,109 – – 37,109 –
CHINA MINSHENg BANKINg – A 368,420 – – 368,420 –
CHINA PACIFIC INSURANCE gR – A 43,246 – – 43,246 –
CHINA VANKE Co lTD – A 138,734 – – 138,734 –
CITIC SECURITIES Co – A 78,731 – – 78,731 –
FINANCIAl STREET HolDINgS – A 37,082 37,082 – 74,164 –
FoUNDER SECURITIES Co lTD – A 15,037 15,037 – 30,074 –
gEMDAlE CoRP – A 67,993 – – 52,436 15,557
gF SECURITIES Co lTD – A 29,047 – – 29,047 –
gUoyUAN SECURITIES Co lTD – A 6,963 – – 6,963 –
HAIToNg SECURITIES Co lTD – A 103,653 – – 103,653 –
HoNg yUAN SECURITIES Co lT – A 27,238 – – 27,238 –
HUATAI SECURITIES Co lTD – A 55,489 – – 55,489 –
HUAXIA BANK Co lTD – A 76,740 – – 76,740 –
IND ﹠ CoMM BK oF CHINA – A 229,981 – – 229,981 –
INDUSTRIAl BANK Co lTD – A 193,458 – – 193,458 –
NEw CHINA lIFE INSURANCE C – A 35,255 – – 24,094 11,161
NoRTHEAST SECURITIES Co lT – A 8,414 – – 8,414 –
PINg AN BANK Co lTD – A 100,905 2,000 20,180 113,274 9,811
PINg AN INSURANCE gRoUP Co – A 37,961 – – 37,961 –
Poly REAl ESTATE gRoUP Co – A 109,611 – – 109,611 –
RISESUN REAl ESTATE DEVEl – A 2,407 – 2,407 4,814 –
SEAlAND SECURITIES Co lTD – A 7,205 – – 7,205 –
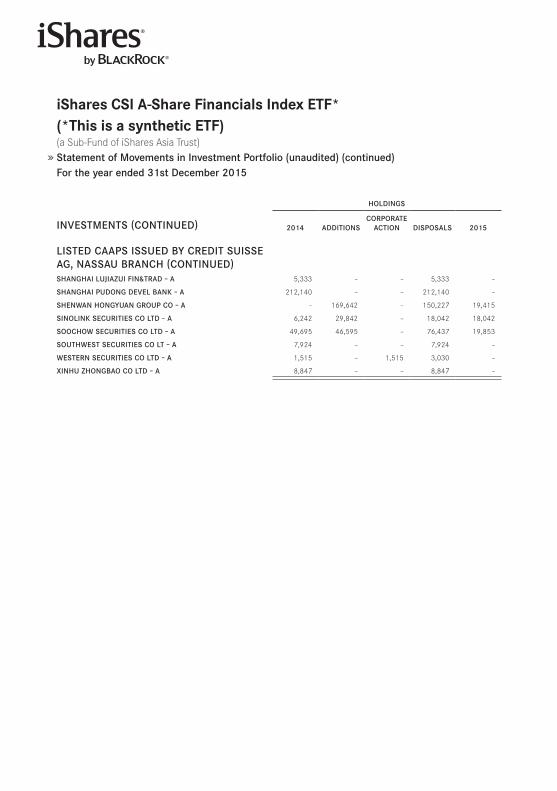
iShares CSi A-Share financials index eTf*(*This is a synthetic eTf) (a Sub-Fund of iShares Asia Trust) Statement of Movements in Investment Portfolio (unaudited) (continued)For the year ended 31st December 2015
HolDINgS
INVESTMENTS (CoNTINUED) 2014 ADDITIoNSCoRPoRATE
ACTIoN DISPoSAlS 2015
lISTED CAAPS ISSUED By CREDIT SUISSE Ag, NASSAU BRANCH (CoNTINUED)SHANgHAI lUJIAzUI FIN﹠TRAD – A 5,333 – – 5,333 –
SHANgHAI PUDoNg DEVEl BANK – A 212,140 – – 212,140 –
SHENwAN HoNgyUAN gRoUP Co – A – 169,642 – 150,227 19,415
SINolINK SECURITIES Co lTD – A 6,242 29,842 – 18,042 18,042
SooCHow SECURITIES Co lTD – A 49,695 46,595 – 76,437 19,853
SoUTHwEST SECURITIES Co lT – A 7,924 – – 7,924 –
wESTERN SECURITIES Co lTD – A 1,515 – 1,515 3,030 –
XINHU zHoNgBAo Co lTD – A 8,847 – – 8,847 –
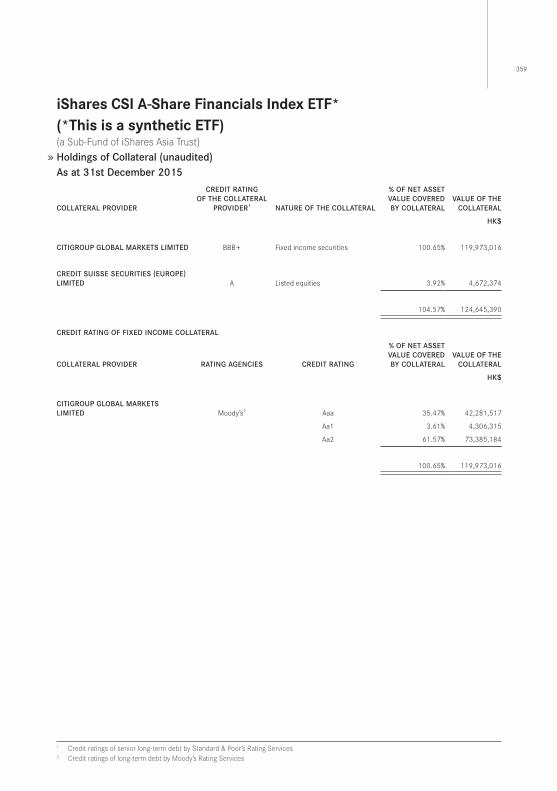
359
iShares CSi A-Share financials index eTf*(*This is a synthetic eTf) (a Sub-Fund of iShares Asia Trust) Holdings of Collateral (unaudited)As at 31st December 2015
CollATERAl PRoVIDER
CREDIT RATINg oF THE CollATERAl
PRoVIDER1 NATURE oF THE CollATERAl
% oF NET ASSET VAlUE CoVERED By CollATERAl
VAlUE oF THE CollATERAl
HK$
CITIgRoUP gloBAl MARKETS lIMITED BBB+ Fixed income securities 100 .65% 119,973,016
CREDIT SUISSE SECURITIES (EURoPE) lIMITED A Listed equities 3 .92% 4,672,374
104 .57% 124,645,390
CREDIT RATINg oF FIXED INCoME CollATERAl
CollATERAl PRoVIDER RATINg AgENCIES CREDIT RATINg
% oF NET ASSET VAlUE CoVERED By CollATERAl
VAlUE oF THE CollATERAl
HK$
CITIgRoUP gloBAl MARKETS lIMITED Moody’s2 Aaa 35 .47% 42,281,517
Aa1 3 .61% 4,306,315
Aa2 61 .57% 73,385,184
100 .65% 119,973,016
1 Credit ratings of senior long-term debt by Standard & Poor’s Rating Services2 Credit ratings of long-term debt by Moody’s Rating Services
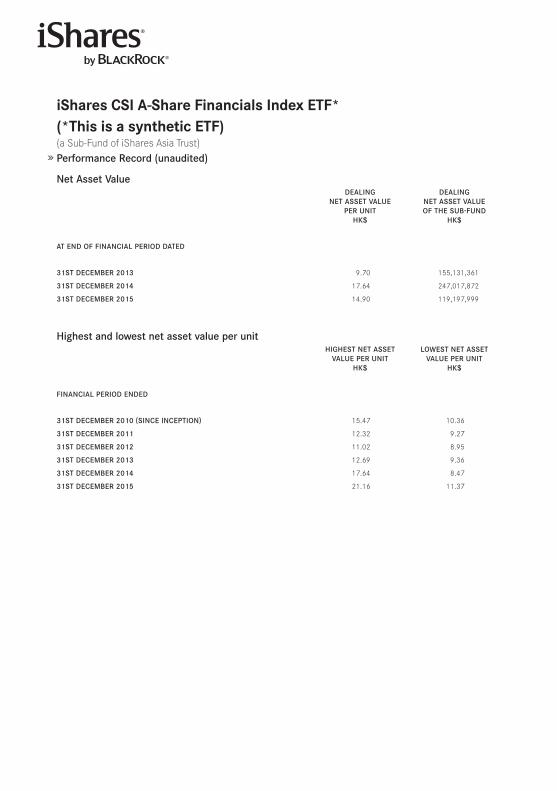
iShares CSi A-Share financials index eTf*(*This is a synthetic eTf) (a Sub-Fund of iShares Asia Trust) Performance Record (unaudited)
Net Asset ValueDEAlINg
NET ASSET VAlUE PER UNIT
HK$
DEAlINgNET ASSET VAlUE oF THE SUB-FUND
HK$
AT END oF FINANCIAl PERIoD DATED
31ST DECEMBER 2013 9 .70 155,131,361
31ST DECEMBER 2014 17 .64 247,017,872
31ST DECEMBER 2015 14 .90 119,197,999
Highest and lowest net asset value per unitHIgHEST NET ASSET
VAlUE PER UNITHK$
lowEST NET ASSETVAlUE PER UNIT
HK$
FINANCIAl PERIoD ENDED
31ST DECEMBER 2010 (SINCE INCEPTIoN) 15 .47 10 .36
31ST DECEMBER 2011 12 .32 9 .27
31ST DECEMBER 2012 11 .02 8 .95
31ST DECEMBER 2013 12 .69 9 .36
31ST DECEMBER 2014 17 .64 8 .47
31ST DECEMBER 2015 21 .16 11 .37
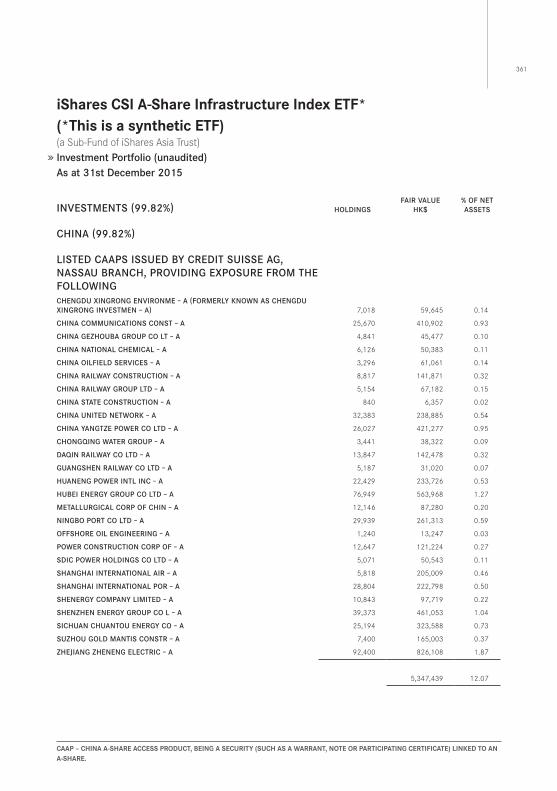
361
iShares CSi A-Share infrastructure index eTf*(*This is a synthetic eTf) (a Sub-Fund of iShares Asia Trust) Investment Portfolio (unaudited)As at 31st December 2015
CAAp – ChinA A-ShARe ACCeSS pRodUCT, Being A SeCURiTY (SUCh AS A wARRAnT, noTe oR pARTiCipATing CeRTifiCATe) linKed To An A-ShARe.
INVESTMENTS (99.82%) HolDINgSFAIR VAlUE
HK$% oF NET ASSETS
CHINA (99.82%)
lISTED CAAPS ISSUED By CREDIT SUISSE Ag, NASSAU BRANCH, PRoVIDINg EXPoSURE FRoM THE FollowINgCHENgDU XINgRoNg ENVIRoNME – A (FoRMERly KNowN AS CHENgDU XINgRoNg INVESTMEN – A) 7,018 59,645 0 .14
CHINA CoMMUNICATIoNS CoNST – A 25,670 410,902 0 .93
CHINA gEzHoUBA gRoUP Co lT – A 4,841 45,477 0 .10
CHINA NATIoNAl CHEMICAl – A 6,126 50,383 0 .11
CHINA oIlFIElD SERVICES – A 3,296 61,061 0 .14
CHINA RAIlwAy CoNSTRUCTIoN – A 8,817 141,871 0 .32
CHINA RAIlwAy gRoUP lTD – A 5,154 67,182 0 .15
CHINA STATE CoNSTRUCTIoN – A 840 6,357 0 .02
CHINA UNITED NETwoRK – A 32,383 238,885 0 .54
CHINA yANgTzE PowER Co lTD – A 26,027 421,277 0 .95
CHoNgqINg wATER gRoUP – A 3,441 38,322 0 .09
DAqIN RAIlwAy Co lTD – A 13,847 142,478 0 .32
gUANgSHEN RAIlwAy Co lTD – A 5,187 31,020 0 .07
HUANENg PowER INTl INC – A 22,429 233,726 0 .53
HUBEI ENERgy gRoUP Co lTD – A 76,949 563,968 1 .27
METAllURgICAl CoRP oF CHIN – A 12,146 87,280 0 .20
NINgBo PoRT Co lTD – A 29,939 261,313 0 .59
oFFSHoRE oIl ENgINEERINg – A 1,240 13,247 0 .03
PowER CoNSTRUCTIoN CoRP oF – A 12,647 121,224 0 .27
SDIC PowER HolDINgS Co lTD – A 5,071 50,543 0 .11
SHANgHAI INTERNATIoNAl AIR – A 5,818 205,009 0 .46
SHANgHAI INTERNATIoNAl PoR – A 28,804 222,798 0 .50
SHENERgy CoMPANy lIMITED – A 10,843 97,719 0 .22
SHENzHEN ENERgy gRoUP Co l – A 39,373 461,053 1 .04
SICHUAN CHUANToU ENERgy Co – A 25,194 323,588 0 .73
SUzHoU golD MANTIS CoNSTR – A 7,400 165,003 0 .37
zHEJIANg zHENENg ElECTRIC – A 92,400 826,108 1 .87
5,347,439 12 .07
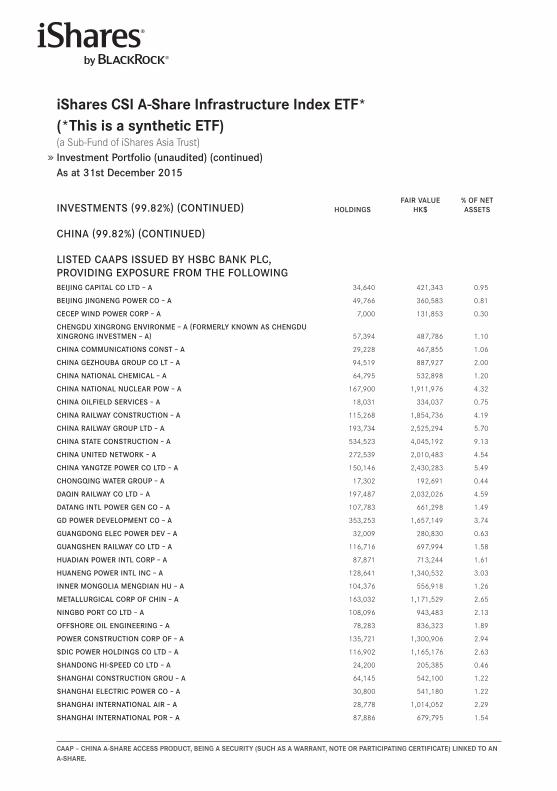
iShares CSi A-Share infrastructure index eTf*(*This is a synthetic eTf) (a Sub-Fund of iShares Asia Trust) Investment Portfolio (unaudited) (continued)As at 31st December 2015
CAAp – ChinA A-ShARe ACCeSS pRodUCT, Being A SeCURiTY (SUCh AS A wARRAnT, noTe oR pARTiCipATing CeRTifiCATe) linKed To An A-ShARe.
INVESTMENTS (99.82%) (CoNTINUED) HolDINgSFAIR VAlUE
HK$% oF NET ASSETS
CHINA (99.82%) (CoNTINUED)
lISTED CAAPS ISSUED By HSBC BANK PlC, PRoVIDINg EXPoSURE FRoM THE FollowINgBEIJINg CAPITAl Co lTD – A 34,640 421,343 0 .95
BEIJINg JINgNENg PowER Co – A 49,766 360,583 0 .81
CECEP wIND PowER CoRP – A 7,000 131,853 0 .30
CHENgDU XINgRoNg ENVIRoNME – A (FoRMERly KNowN AS CHENgDU XINgRoNg INVESTMEN – A) 57,394 487,786 1 .10
CHINA CoMMUNICATIoNS CoNST – A 29,228 467,855 1 .06
CHINA gEzHoUBA gRoUP Co lT – A 94,519 887,927 2 .00
CHINA NATIoNAl CHEMICAl – A 64,795 532,898 1 .20
CHINA NATIoNAl NUClEAR Pow – A 167,900 1,911,976 4 .32
CHINA oIlFIElD SERVICES – A 18,031 334,037 0 .75
CHINA RAIlwAy CoNSTRUCTIoN – A 115,268 1,854,736 4 .19
CHINA RAIlwAy gRoUP lTD – A 193,734 2,525,294 5 .70
CHINA STATE CoNSTRUCTIoN – A 534,523 4,045,192 9 .13
CHINA UNITED NETwoRK – A 272,539 2,010,483 4 .54
CHINA yANgTzE PowER Co lTD – A 150,146 2,430,283 5 .49
CHoNgqINg wATER gRoUP – A 17,302 192,691 0 .44
DAqIN RAIlwAy Co lTD – A 197,487 2,032,026 4 .59
DATANg INTl PowER gEN Co – A 107,783 661,298 1 .49
gD PowER DEVEloPMENT Co – A 353,253 1,657,149 3 .74
gUANgDoNg ElEC PowER DEV – A 32,009 280,830 0 .63
gUANgSHEN RAIlwAy Co lTD – A 116,716 697,994 1 .58
HUADIAN PowER INTl CoRP – A 87,871 713,244 1 .61
HUANENg PowER INTl INC – A 128,641 1,340,532 3 .03
INNER MoNgolIA MENgDIAN HU – A 104,376 556,918 1 .26
METAllURgICAl CoRP oF CHIN – A 163,032 1,171,529 2 .65
NINgBo PoRT Co lTD – A 108,096 943,483 2 .13
oFFSHoRE oIl ENgINEERINg – A 78,283 836,323 1 .89
PowER CoNSTRUCTIoN CoRP oF – A 135,721 1,300,906 2 .94
SDIC PowER HolDINgS Co lTD – A 116,902 1,165,176 2 .63
SHANDoNg HI-SPEED Co lTD – A 24,200 205,385 0 .46
SHANgHAI CoNSTRUCTIoN gRoU – A 64,145 542,100 1 .22
SHANgHAI ElECTRIC PowER Co – A 30,800 541,180 1 .22
SHANgHAI INTERNATIoNAl AIR – A 28,778 1,014,052 2 .29
SHANgHAI INTERNATIoNAl PoR – A 87,886 679,795 1 .54

363
iShares CSi A-Share infrastructure index eTf*(*This is a synthetic eTf) (a Sub-Fund of iShares Asia Trust) Investment Portfolio (unaudited) (continued)As at 31st December 2015
CAAp – ChinA A-ShARe ACCeSS pRodUCT, Being A SeCURiTY (SUCh AS A wARRAnT, noTe oR pARTiCipATing CeRTifiCATe) linKed To An A-ShARe.
INVESTMENTS (99.82%) (CoNTINUED) HolDINgSFAIR VAlUE
HK$% oF NET ASSETS
CHINA (99.82%) (CoNTINUED)
lISTED CAAPS ISSUED By HSBC BANK PlC, PRoVIDINg EXPoSURE FRoM THE FollowINg (CoNTINUED)SHANgHAI TUNNEl ENgINEERIN – A 56,500 717,585 1 .62
SHENERgy CoMPANy lIMITED – A 71,035 640,181 1 .45
SHENzHEN ENERgy gRoUP Co l – A 3,400 39,814 0 .09
SICHUAN CHUANToU ENERgy Co – A 53,912 692,438 1 .56
SUzHoU golD MANTIS CoNSTR – A 24,245 540,608 1 .22
TIANJIN PoRT Co lTD – A 30,106 405,005 0 .91
yINgKoU PoRT lIABIlITy Co – A 69,803 395,777 0 .89
zHEJIANg yASHA DECoRATIoN – A 24,053 452,777 1 .02
zHEJIANg zHENENg ElECTRIC – A 5,400 48,279 0 .11
38,867,321 87 .75
ToTAl INVESTMENTS 44,214,760 99 .82
oTHER NET ASSETS 80,343 0 .18
NET ASSETS ATTRIBUTABlE To UNITHolDERS AT31ST DECEMBER 2015 44,295,103 100 .00
ToTAl INVESTMENTS, AT CoST 41,058,293
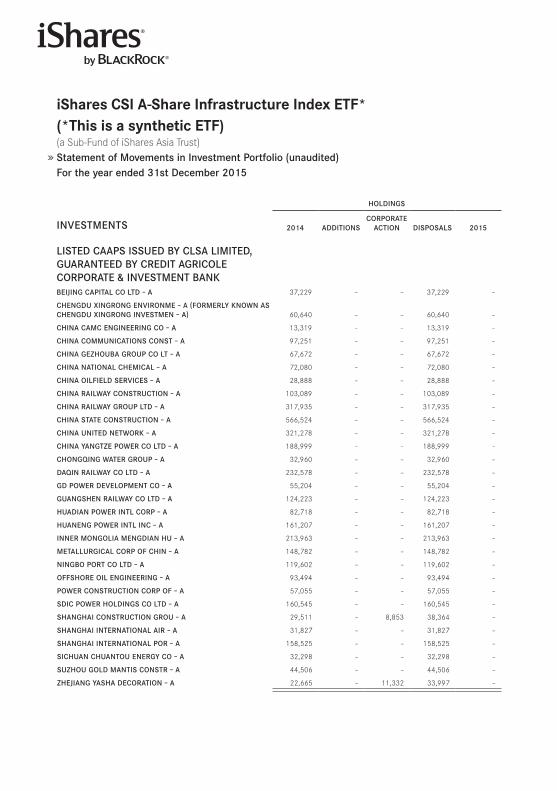
iShares CSi A-Share infrastructure index eTf*(*This is a synthetic eTf) (a Sub-Fund of iShares Asia Trust) Statement of Movements in Investment Portfolio (unaudited)For the year ended 31st December 2015
HolDINgS
INVESTMENTS 2014 ADDITIoNSCoRPoRATE
ACTIoN DISPoSAlS 2015
lISTED CAAPS ISSUED By ClSA lIMITED, gUARANTEED By CREDIT AgRIColE CoRPoRATE ﹠ INVESTMENT BANKBEIJINg CAPITAl Co lTD – A 37,229 – – 37,229 –
CHENgDU XINgRoNg ENVIRoNME – A (FoRMERly KNowN AS CHENgDU XINgRoNg INVESTMEN – A) 60,640 – – 60,640 –
CHINA CAMC ENgINEERINg Co – A 13,319 – – 13,319 –
CHINA CoMMUNICATIoNS CoNST – A 97,251 – – 97,251 –
CHINA gEzHoUBA gRoUP Co lT – A 67,672 – – 67,672 –
CHINA NATIoNAl CHEMICAl – A 72,080 – – 72,080 –
CHINA oIlFIElD SERVICES – A 28,888 – – 28,888 –
CHINA RAIlwAy CoNSTRUCTIoN – A 103,089 – – 103,089 –
CHINA RAIlwAy gRoUP lTD – A 317,935 – – 317,935 –
CHINA STATE CoNSTRUCTIoN – A 566,524 – – 566,524 –
CHINA UNITED NETwoRK – A 321,278 – – 321,278 –
CHINA yANgTzE PowER Co lTD – A 188,999 – – 188,999 –
CHoNgqINg wATER gRoUP – A 32,960 – – 32,960 –
DAqIN RAIlwAy Co lTD – A 232,578 – – 232,578 –
gD PowER DEVEloPMENT Co – A 55,204 – – 55,204 –
gUANgSHEN RAIlwAy Co lTD – A 124,223 – – 124,223 –
HUADIAN PowER INTl CoRP – A 82,718 – – 82,718 –
HUANENg PowER INTl INC – A 161,207 – – 161,207 –
INNER MoNgolIA MENgDIAN HU – A 213,963 – – 213,963 –
METAllURgICAl CoRP oF CHIN – A 148,782 – – 148,782 –
NINgBo PoRT Co lTD – A 119,602 – – 119,602 –
oFFSHoRE oIl ENgINEERINg – A 93,494 – – 93,494 –
PowER CoNSTRUCTIoN CoRP oF – A 57,055 – – 57,055 –
SDIC PowER HolDINgS Co lTD – A 160,545 – – 160,545 –
SHANgHAI CoNSTRUCTIoN gRoU – A 29,511 – 8,853 38,364 –
SHANgHAI INTERNATIoNAl AIR – A 31,827 – – 31,827 –
SHANgHAI INTERNATIoNAl PoR – A 158,525 – – 158,525 –
SICHUAN CHUANToU ENERgy Co – A 32,298 – – 32,298 –
SUzHoU golD MANTIS CoNSTR – A 44,506 – – 44,506 –
zHEJIANg yASHA DECoRATIoN – A 22,665 – 11,332 33,997 –
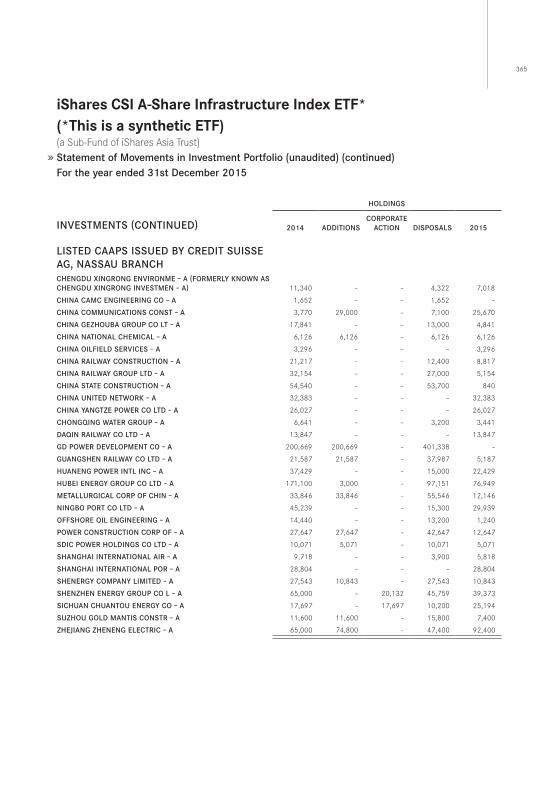
365
iShares CSi A-Share infrastructure index eTf*(*This is a synthetic eTf) (a Sub-Fund of iShares Asia Trust) Statement of Movements in Investment Portfolio (unaudited) (continued)For the year ended 31st December 2015
HolDINgS
INVESTMENTS (CoNTINUED) 2014 ADDITIoNSCoRPoRATE
ACTIoN DISPoSAlS 2015
lISTED CAAPS ISSUED By CREDIT SUISSE Ag, NASSAU BRANCHCHENgDU XINgRoNg ENVIRoNME – A (FoRMERly KNowN AS CHENgDU XINgRoNg INVESTMEN – A) 11,340 – – 4,322 7,018
CHINA CAMC ENgINEERINg Co – A 1,652 – – 1,652 –
CHINA CoMMUNICATIoNS CoNST – A 3,770 29,000 – 7,100 25,670
CHINA gEzHoUBA gRoUP Co lT – A 17,841 – – 13,000 4,841
CHINA NATIoNAl CHEMICAl – A 6,126 6,126 – 6,126 6,126
CHINA oIlFIElD SERVICES – A 3,296 – – – 3,296
CHINA RAIlwAy CoNSTRUCTIoN – A 21,217 – – 12,400 8,817
CHINA RAIlwAy gRoUP lTD – A 32,154 – – 27,000 5,154
CHINA STATE CoNSTRUCTIoN – A 54,540 – – 53,700 840
CHINA UNITED NETwoRK – A 32,383 – – – 32,383
CHINA yANgTzE PowER Co lTD – A 26,027 – – – 26,027
CHoNgqINg wATER gRoUP – A 6,641 – – 3,200 3,441
DAqIN RAIlwAy Co lTD – A 13,847 – – – 13,847
gD PowER DEVEloPMENT Co – A 200,669 200,669 – 401,338 –
gUANgSHEN RAIlwAy Co lTD – A 21,587 21,587 – 37,987 5,187
HUANENg PowER INTl INC – A 37,429 – – 15,000 22,429
HUBEI ENERgy gRoUP Co lTD – A 171,100 3,000 – 97,151 76,949
METAllURgICAl CoRP oF CHIN – A 33,846 33,846 – 55,546 12,146
NINgBo PoRT Co lTD – A 45,239 – – 15,300 29,939
oFFSHoRE oIl ENgINEERINg – A 14,440 – – 13,200 1,240
PowER CoNSTRUCTIoN CoRP oF – A 27,647 27,647 – 42,647 12,647
SDIC PowER HolDINgS Co lTD – A 10,071 5,071 – 10,071 5,071
SHANgHAI INTERNATIoNAl AIR – A 9,718 – – 3,900 5,818
SHANgHAI INTERNATIoNAl PoR – A 28,804 – – – 28,804
SHENERgy CoMPANy lIMITED – A 27,543 10,843 – 27,543 10,843
SHENzHEN ENERgy gRoUP Co l – A 65,000 – 20,132 45,759 39,373
SICHUAN CHUANToU ENERgy Co – A 17,697 – 17,697 10,200 25,194
SUzHoU golD MANTIS CoNSTR – A 11,600 11,600 – 15,800 7,400
zHEJIANg zHENENg ElECTRIC – A 65,000 74,800 – 47,400 92,400
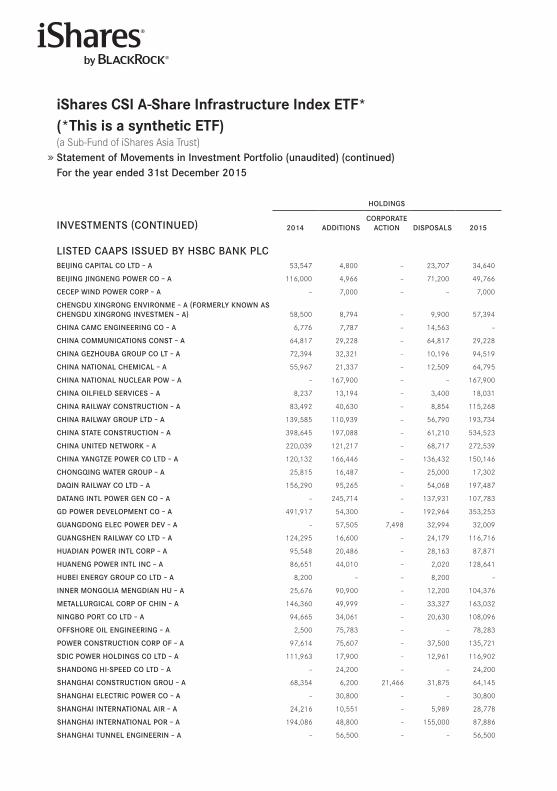
iShares CSi A-Share infrastructure index eTf*(*This is a synthetic eTf) (a Sub-Fund of iShares Asia Trust) Statement of Movements in Investment Portfolio (unaudited) (continued)For the year ended 31st December 2015
HolDINgS
INVESTMENTS (CoNTINUED) 2014 ADDITIoNSCoRPoRATE
ACTIoN DISPoSAlS 2015
lISTED CAAPS ISSUED By HSBC BANK PlCBEIJINg CAPITAl Co lTD – A 53,547 4,800 – 23,707 34,640
BEIJINg JINgNENg PowER Co – A 116,000 4,966 – 71,200 49,766
CECEP wIND PowER CoRP – A – 7,000 – – 7,000
CHENgDU XINgRoNg ENVIRoNME – A (FoRMERly KNowN AS CHENgDU XINgRoNg INVESTMEN – A) 58,500 8,794 – 9,900 57,394
CHINA CAMC ENgINEERINg Co – A 6,776 7,787 – 14,563 –
CHINA CoMMUNICATIoNS CoNST – A 64,817 29,228 – 64,817 29,228
CHINA gEzHoUBA gRoUP Co lT – A 72,394 32,321 – 10,196 94,519
CHINA NATIoNAl CHEMICAl – A 55,967 21,337 – 12,509 64,795
CHINA NATIoNAl NUClEAR Pow – A – 167,900 – – 167,900
CHINA oIlFIElD SERVICES – A 8,237 13,194 – 3,400 18,031
CHINA RAIlwAy CoNSTRUCTIoN – A 83,492 40,630 – 8,854 115,268
CHINA RAIlwAy gRoUP lTD – A 139,585 110,939 – 56,790 193,734
CHINA STATE CoNSTRUCTIoN – A 398,645 197,088 – 61,210 534,523
CHINA UNITED NETwoRK – A 220,039 121,217 – 68,717 272,539
CHINA yANgTzE PowER Co lTD – A 120,132 166,446 – 136,432 150,146
CHoNgqINg wATER gRoUP – A 25,815 16,487 – 25,000 17,302
DAqIN RAIlwAy Co lTD – A 156,290 95,265 – 54,068 197,487
DATANg INTl PowER gEN Co – A – 245,714 – 137,931 107,783
gD PowER DEVEloPMENT Co – A 491,917 54,300 – 192,964 353,253
gUANgDoNg ElEC PowER DEV – A – 57,505 7,498 32,994 32,009
gUANgSHEN RAIlwAy Co lTD – A 124,295 16,600 – 24,179 116,716
HUADIAN PowER INTl CoRP – A 95,548 20,486 – 28,163 87,871
HUANENg PowER INTl INC – A 86,651 44,010 – 2,020 128,641
HUBEI ENERgy gRoUP Co lTD – A 8,200 – – 8,200 –
INNER MoNgolIA MENgDIAN HU – A 25,676 90,900 – 12,200 104,376
METAllURgICAl CoRP oF CHIN – A 146,360 49,999 – 33,327 163,032
NINgBo PoRT Co lTD – A 94,665 34,061 – 20,630 108,096
oFFSHoRE oIl ENgINEERINg – A 2,500 75,783 – – 78,283
PowER CoNSTRUCTIoN CoRP oF – A 97,614 75,607 – 37,500 135,721
SDIC PowER HolDINgS Co lTD – A 111,963 17,900 – 12,961 116,902
SHANDoNg HI-SPEED Co lTD – A – 24,200 – – 24,200
SHANgHAI CoNSTRUCTIoN gRoU – A 68,354 6,200 21,466 31,875 64,145
SHANgHAI ElECTRIC PowER Co – A – 30,800 – – 30,800
SHANgHAI INTERNATIoNAl AIR – A 24,216 10,551 – 5,989 28,778
SHANgHAI INTERNATIoNAl PoR – A 194,086 48,800 – 155,000 87,886
SHANgHAI TUNNEl ENgINEERIN – A – 56,500 – – 56,500
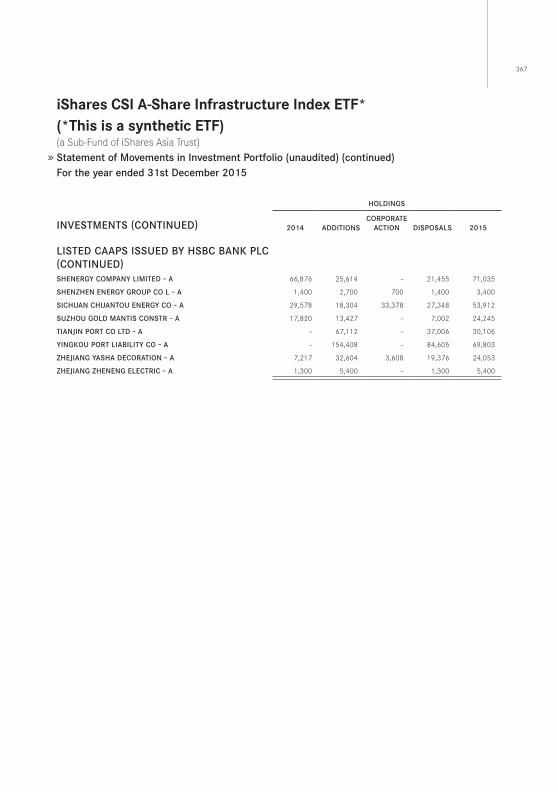
367
iShares CSi A-Share infrastructure index eTf*(*This is a synthetic eTf) (a Sub-Fund of iShares Asia Trust) Statement of Movements in Investment Portfolio (unaudited) (continued)For the year ended 31st December 2015
HolDINgS
INVESTMENTS (CoNTINUED) 2014 ADDITIoNSCoRPoRATE
ACTIoN DISPoSAlS 2015
lISTED CAAPS ISSUED By HSBC BANK PlC (CoNTINUED)SHENERgy CoMPANy lIMITED – A 66,876 25,614 – 21,455 71,035
SHENzHEN ENERgy gRoUP Co l – A 1,400 2,700 700 1,400 3,400
SICHUAN CHUANToU ENERgy Co – A 29,578 18,304 33,378 27,348 53,912
SUzHoU golD MANTIS CoNSTR – A 17,820 13,427 – 7,002 24,245
TIANJIN PoRT Co lTD – A – 67,112 – 37,006 30,106
yINgKoU PoRT lIABIlITy Co – A – 154,408 – 84,605 69,803
zHEJIANg yASHA DECoRATIoN – A 7,217 32,604 3,608 19,376 24,053
zHEJIANg zHENENg ElECTRIC – A 1,300 5,400 – 1,300 5,400
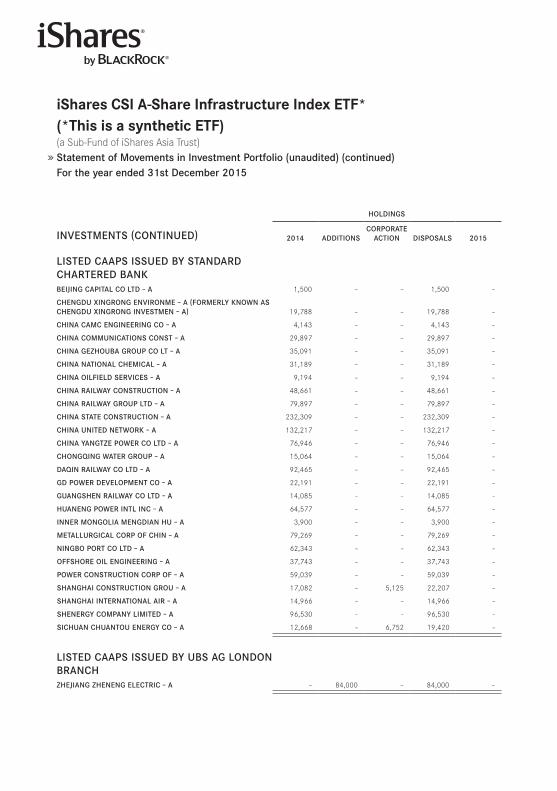
iShares CSi A-Share infrastructure index eTf*(*This is a synthetic eTf) (a Sub-Fund of iShares Asia Trust) Statement of Movements in Investment Portfolio (unaudited) (continued)For the year ended 31st December 2015
HolDINgS
INVESTMENTS (CoNTINUED) 2014 ADDITIoNSCoRPoRATE
ACTIoN DISPoSAlS 2015
lISTED CAAPS ISSUED By STANDARD CHARTERED BANKBEIJINg CAPITAl Co lTD – A 1,500 – – 1,500 –
CHENgDU XINgRoNg ENVIRoNME – A (FoRMERly KNowN AS CHENgDU XINgRoNg INVESTMEN – A) 19,788 – – 19,788 –
CHINA CAMC ENgINEERINg Co – A 4,143 – – 4,143 –
CHINA CoMMUNICATIoNS CoNST – A 29,897 – – 29,897 –
CHINA gEzHoUBA gRoUP Co lT – A 35,091 – – 35,091 –
CHINA NATIoNAl CHEMICAl – A 31,189 – – 31,189 –
CHINA oIlFIElD SERVICES – A 9,194 – – 9,194 –
CHINA RAIlwAy CoNSTRUCTIoN – A 48,661 – – 48,661 –
CHINA RAIlwAy gRoUP lTD – A 79,897 – – 79,897 –
CHINA STATE CoNSTRUCTIoN – A 232,309 – – 232,309 –
CHINA UNITED NETwoRK – A 132,217 – – 132,217 –
CHINA yANgTzE PowER Co lTD – A 76,946 – – 76,946 –
CHoNgqINg wATER gRoUP – A 15,064 – – 15,064 –
DAqIN RAIlwAy Co lTD – A 92,465 – – 92,465 –
gD PowER DEVEloPMENT Co – A 22,191 – – 22,191 –
gUANgSHEN RAIlwAy Co lTD – A 14,085 – – 14,085 –
HUANENg PowER INTl INC – A 64,577 – – 64,577 –
INNER MoNgolIA MENgDIAN HU – A 3,900 – – 3,900 –
METAllURgICAl CoRP oF CHIN – A 79,269 – – 79,269 –
NINgBo PoRT Co lTD – A 62,343 – – 62,343 –
oFFSHoRE oIl ENgINEERINg – A 37,743 – – 37,743 –
PowER CoNSTRUCTIoN CoRP oF – A 59,039 – – 59,039 –
SHANgHAI CoNSTRUCTIoN gRoU – A 17,082 – 5,125 22,207 –
SHANgHAI INTERNATIoNAl AIR – A 14,966 – – 14,966 –
SHENERgy CoMPANy lIMITED – A 96,530 – – 96,530 –
SICHUAN CHUANToU ENERgy Co – A 12,668 – 6,752 19,420 –
lISTED CAAPS ISSUED By UBS Ag loNDoN BRANCHzHEJIANg zHENENg ElECTRIC – A – 84,000 – 84,000 –
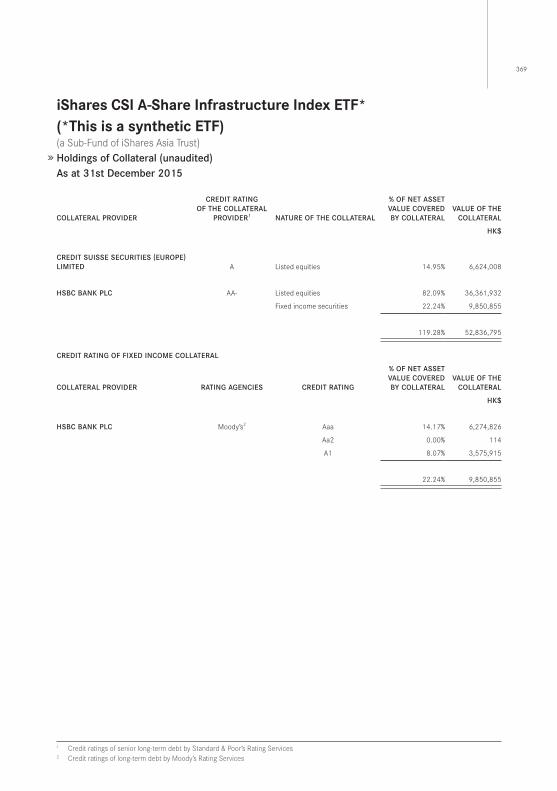
369
iShares CSi A-Share infrastructure index eTf*(*This is a synthetic eTf) (a Sub-Fund of iShares Asia Trust)Holdings of Collateral (unaudited)As at 31st December 2015
CollATERAl PRoVIDER
CREDIT RATINg oF THE CollATERAl
PRoVIDER1 NATURE oF THE CollATERAl
% oF NET ASSET VAlUE CoVERED By CollATERAl
VAlUE oF THE CollATERAl
HK$
CREDIT SUISSE SECURITIES (EURoPE) lIMITED A Listed equities 14 .95% 6,624,008
HSBC BANK PlC AA- Listed equities 82 .09% 36,361,932
Fixed income securities 22 .24% 9,850,855
119 .28% 52,836,795
CREDIT RATINg oF FIXED INCoME CollATERAl
CollATERAl PRoVIDER RATINg AgENCIES CREDIT RATINg
% oF NET ASSET VAlUE CoVERED By CollATERAl
VAlUE oF THE CollATERAl
HK$
HSBC BANK PlC Moody’s2 Aaa 14 .17% 6,274,826
Aa2 0 .00% 114
A1 8 .07% 3,575,915
22 .24% 9,850,855
1 Credit ratings of senior long-term debt by Standard & Poor’s Rating Services2 Credit ratings of long-term debt by Moody’s Rating Services
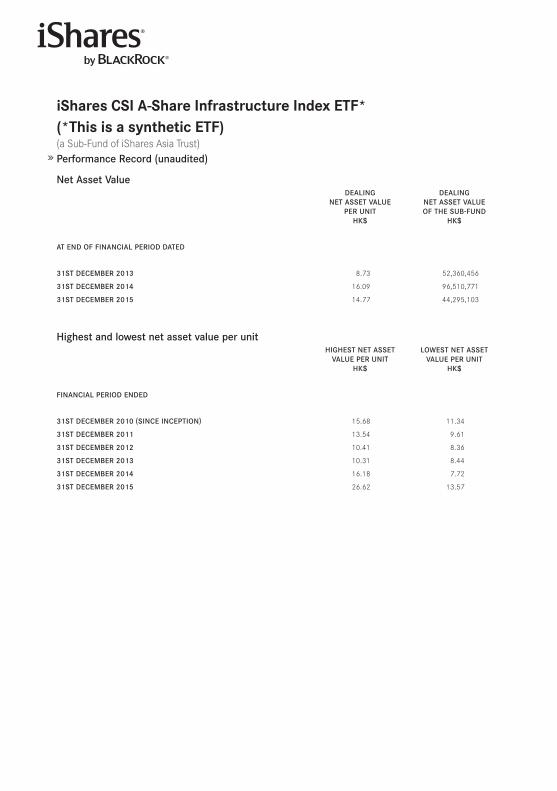
iShares CSi A-Share infrastructure index eTf*(*This is a synthetic eTf) (a Sub-Fund of iShares Asia Trust)Performance Record (unaudited)
Net Asset ValueDEAlINg
NET ASSET VAlUE PER UNIT
HK$
DEAlINgNET ASSET VAlUE oF THE SUB-FUND
HK$
AT END oF FINANCIAl PERIoD DATED
31ST DECEMBER 2013 8 .73 52,360,456
31ST DECEMBER 2014 16 .09 96,510,771
31ST DECEMBER 2015 14 .77 44,295,103
Highest and lowest net asset value per unitHIgHEST NET ASSET
VAlUE PER UNITHK$
lowEST NET ASSETVAlUE PER UNIT
HK$
FINANCIAl PERIoD ENDED
31ST DECEMBER 2010 (SINCE INCEPTIoN) 15 .68 11 .34
31ST DECEMBER 2011 13 .54 9 .61
31ST DECEMBER 2012 10 .41 8 .36
31ST DECEMBER 2013 10 .31 8 .44
31ST DECEMBER 2014 16 .18 7 .72
31ST DECEMBER 2015 26 .62 13 .57
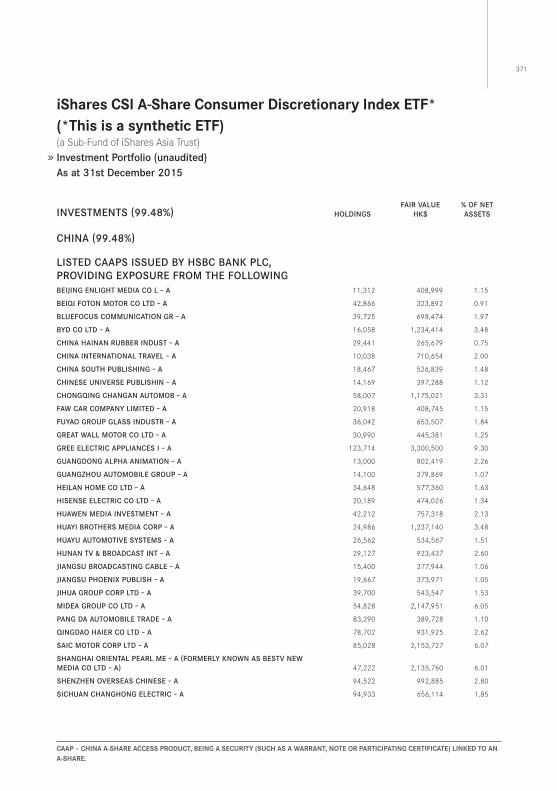
371
iShares CSi A-Share Consumer discretionary index eTf*(*This is a synthetic eTf) (a Sub-Fund of iShares Asia Trust) Investment Portfolio (unaudited)As at 31st December 2015
CAAp – ChinA A-ShARe ACCeSS pRodUCT, Being A SeCURiTY (SUCh AS A wARRAnT, noTe oR pARTiCipATing CeRTifiCATe) linKed To An A-ShARe.
INVESTMENTS (99.48%) HolDINgSFAIR VAlUE
HK$% oF NET ASSETS
CHINA (99.48%)
lISTED CAAPS ISSUED By HSBC BANK PlC, PRoVIDINg EXPoSURE FRoM THE FollowINgBEIJINg ENlIgHT MEDIA Co l – A 11,312 408,999 1 .15
BEIqI FoToN MoToR Co lTD – A 42,866 323,892 0 .91
BlUEFoCUS CoMMUNICATIoN gR – A 39,725 698,474 1 .97
ByD Co lTD – A 16,058 1,234,414 3 .48
CHINA HAINAN RUBBER INDUST – A 29,441 265,679 0 .75
CHINA INTERNATIoNAl TRAVEl – A 10,038 710,654 2 .00
CHINA SoUTH PUBlISHINg – A 18,467 526,839 1 .48
CHINESE UNIVERSE PUBlISHIN – A 14,169 397,288 1 .12
CHoNgqINg CHANgAN AUToMoB – A 58,007 1,175,021 3 .31
FAw CAR CoMPANy lIMITED – A 20,918 408,745 1 .15
FUyAo gRoUP glASS INDUSTR – A 36,042 653,507 1 .84
gREAT wAll MoToR Co lTD – A 30,990 445,381 1 .25
gREE ElECTRIC APPlIANCES I – A 123,714 3,300,500 9 .30
gUANgDoNg AlPHA ANIMATIoN – A 13,000 802,419 2 .26
gUANgzHoU AUToMoBIlE gRoUP – A 14,100 379,869 1 .07
HEIlAN HoME Co lTD – A 34,648 577,360 1 .63
HISENSE ElECTRIC Co lTD – A 20,189 474,026 1 .34
HUAwEN MEDIA INVESTMENT – A 42,212 757,318 2 .13
HUAyI BRoTHERS MEDIA CoRP – A 24,986 1,237,140 3 .48
HUAyU AUToMoTIVE SySTEMS – A 26,562 534,567 1 .51
HUNAN TV ﹠ BRoADCAST INT – A 29,127 923,437 2 .60
JIANgSU BRoADCASTINg CABlE – A 15,400 377,944 1 .06
JIANgSU PHoENIX PUBlISH – A 19,667 373,971 1 .05
JIHUA gRoUP CoRP lTD – A 39,700 543,547 1 .53
MIDEA gRoUP Co lTD – A 54,828 2,147,951 6 .05
PANg DA AUToMoBIlE TRADE – A 83,290 389,728 1 .10
qINgDAo HAIER Co lTD – A 78,702 931,925 2 .62
SAIC MoToR CoRP lTD – A 85,028 2,153,727 6 .07
SHANgHAI oRIENTAl PEARl ME – A (FoRMERly KNowN AS BESTV NEw MEDIA Co lTD – A) 47,222 2,135,760 6 .01
SHENzHEN oVERSEAS CHINESE – A 94,522 992,885 2 .80
SICHUAN CHANgHoNg ElECTRIC – A 94,933 656,114 1 .85
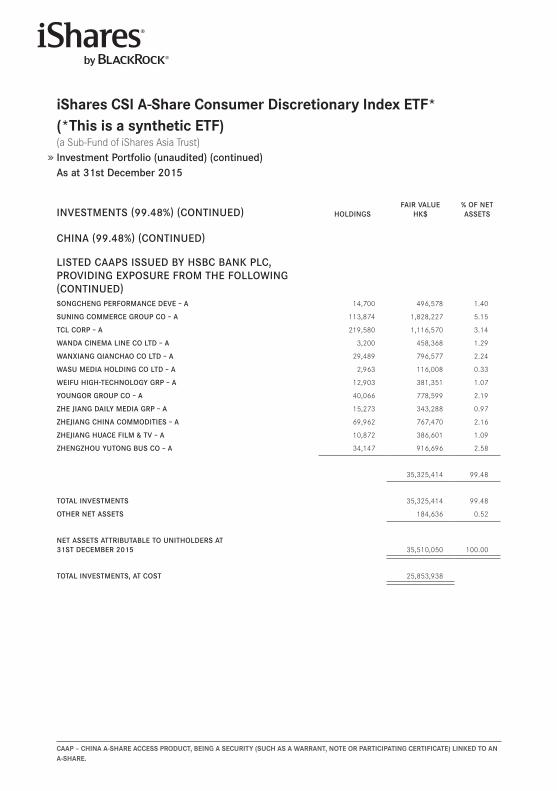
iShares CSi A-Share Consumer discretionary index eTf*(*This is a synthetic eTf) (a Sub-Fund of iShares Asia Trust) Investment Portfolio (unaudited) (continued)As at 31st December 2015
CAAp – ChinA A-ShARe ACCeSS pRodUCT, Being A SeCURiTY (SUCh AS A wARRAnT, noTe oR pARTiCipATing CeRTifiCATe) linKed To An A-ShARe.
INVESTMENTS (99.48%) (CoNTINUED) HolDINgSFAIR VAlUE
HK$% oF NET ASSETS
CHINA (99.48%) (CoNTINUED)
lISTED CAAPS ISSUED By HSBC BANK PlC, PRoVIDINg EXPoSURE FRoM THE FollowINg (CoNTINUED)SoNgCHENg PERFoRMANCE DEVE – A 14,700 496,578 1 .40
SUNINg CoMMERCE gRoUP Co – A 113,874 1,828,227 5 .15
TCl CoRP – A 219,580 1,116,570 3 .14
wANDA CINEMA lINE Co lTD – A 3,200 458,368 1 .29
wANXIANg qIANCHAo Co lTD – A 29,489 796,577 2 .24
wASU MEDIA HolDINg Co lTD – A 2,963 116,008 0 .33
wEIFU HIgH-TECHNology gRP – A 12,903 381,351 1 .07
yoUNgoR gRoUP Co – A 40,066 778,599 2 .19
zHE JIANg DAIly MEDIA gRP – A 15,273 343,288 0 .97
zHEJIANg CHINA CoMMoDITIES – A 69,962 767,470 2 .16
zHEJIANg HUACE FIlM ﹠ TV – A 10,872 386,601 1 .09
zHENgzHoU yUToNg BUS Co – A 34,147 916,696 2 .58
35,325,414 99 .48
ToTAl INVESTMENTS 35,325,414 99 .48
oTHER NET ASSETS 184,636 0 .52
NET ASSETS ATTRIBUTABlE To UNITHolDERS AT31ST DECEMBER 2015 35,510,050 100 .00
ToTAl INVESTMENTS, AT CoST 25,853,938
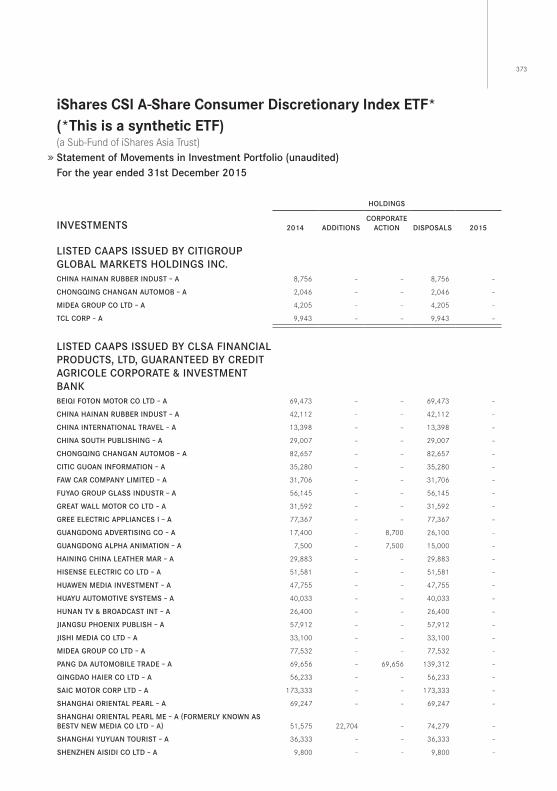
373
iShares CSi A-Share Consumer discretionary index eTf*(*This is a synthetic eTf) (a Sub-Fund of iShares Asia Trust) Statement of Movements in Investment Portfolio (unaudited)For the year ended 31st December 2015
HolDINgS
INVESTMENTS 2014 ADDITIoNSCoRPoRATE
ACTIoN DISPoSAlS 2015
lISTED CAAPS ISSUED By CITIgRoUP gloBAl MARKETS HolDINgS INC.CHINA HAINAN RUBBER INDUST – A 8,756 – – 8,756 –
CHoNgqINg CHANgAN AUToMoB – A 2,046 – – 2,046 –
MIDEA gRoUP Co lTD – A 4,205 – – 4,205 –
TCl CoRP – A 9,943 – – 9,943 –
lISTED CAAPS ISSUED By ClSA FINANCIAl PRoDUCTS, lTD, gUARANTEED By CREDIT AgRIColE CoRPoRATE ﹠ INVESTMENT BANKBEIqI FoToN MoToR Co lTD – A 69,473 – – 69,473 –
CHINA HAINAN RUBBER INDUST – A 42,112 – – 42,112 –
CHINA INTERNATIoNAl TRAVEl – A 13,398 – – 13,398 –
CHINA SoUTH PUBlISHINg – A 29,007 – – 29,007 –
CHoNgqINg CHANgAN AUToMoB – A 82,657 – – 82,657 –
CITIC gUoAN INFoRMATIoN – A 35,280 – – 35,280 –
FAw CAR CoMPANy lIMITED – A 31,706 – – 31,706 –
FUyAo gRoUP glASS INDUSTR – A 56,145 – – 56,145 –
gREAT wAll MoToR Co lTD – A 31,592 – – 31,592 –
gREE ElECTRIC APPlIANCES I – A 77,367 – – 77,367 –
gUANgDoNg ADVERTISINg Co – A 17,400 – 8,700 26,100 –
gUANgDoNg AlPHA ANIMATIoN – A 7,500 – 7,500 15,000 –
HAININg CHINA lEATHER MAR – A 29,883 – – 29,883 –
HISENSE ElECTRIC Co lTD – A 51,581 – – 51,581 –
HUAwEN MEDIA INVESTMENT – A 47,755 – – 47,755 –
HUAyU AUToMoTIVE SySTEMS – A 40,033 – – 40,033 –
HUNAN TV ﹠ BRoADCAST INT – A 26,400 – – 26,400 –
JIANgSU PHoENIX PUBlISH – A 57,912 – – 57,912 –
JISHI MEDIA Co lTD – A 33,100 – – 33,100 –
MIDEA gRoUP Co lTD – A 77,532 – – 77,532 –
PANg DA AUToMoBIlE TRADE – A 69,656 – 69,656 139,312 –
qINgDAo HAIER Co lTD – A 56,233 – – 56,233 –
SAIC MoToR CoRP lTD – A 173,333 – – 173,333 –
SHANgHAI oRIENTAl PEARl – A 69,247 – – 69,247 –
SHANgHAI oRIENTAl PEARl ME – A (FoRMERly KNowN AS BESTV NEw MEDIA Co lTD – A) 51,575 22,704 – 74,279 –
SHANgHAI yUyUAN ToURIST – A 36,333 – – 36,333 –
SHENzHEN AISIDI Co lTD – A 9,800 – – 9,800 –

iShares CSi A-Share Consumer discretionary index eTf*(*This is a synthetic eTf) (a Sub-Fund of iShares Asia Trust) Statement of Movements in Investment Portfolio (unaudited) (continued)For the year ended 31st December 2015
HolDINgS
INVESTMENTS (CoNTINUED) 2014 ADDITIoNSCoRPoRATE
ACTIoN DISPoSAlS 2015
lISTED CAAPS ISSUED By ClSA FINANCIAl PRoDUCTS, lTD, gUARANTEED By CREDIT AgRIColE CoRPoRATE ﹠ INVESTMENT BANK (CoNTINUED)SHENzHEN MTC Co lTD – A 31,000 – – 31,000 –
SHENzHEN oVERSEAS CHINESE – A 132,929 – – 132,929 –
SICHUAN CHANgHoNg ElECTRIC – A 141,132 – – 141,132 –
SUNINg CoMMERCE gRoUP Co – A 162,858 – – 162,858 –
TCl CoRP – A 303,708 – – 303,708 –
wASU MEDIA HolDINg Co lTD – A 5,313 – – 5,313 –
wEIFU HIgH-TECHNology gRP – A 23,209 – – 23,209 –
yoUNgoR gRoUP Co – A 57,642 – – 57,642 –
zHE JIANg DAIly MEDIA gRP – A 24,500 – – 24,500 –
zHEJIANg CHINA CoMMoDITIES – A 49,872 – 49,872 99,744 –
zHENgzHoU yUToNg BUS Co – A 37,390 – 18,695 56,085 –
lISTED CAAPS ISSUED By CREDIT SUISSE Ag, NASSAU BRANCHBEIqI FoToN MoToR Co lTD – A 7,651 – – 7,651 –
CHINA INTERNATIoNAl TRAVEl – A 5,965 – – 5,965 –
CHINA SoUTH PUBlISHINg – A 10,322 – – 10,322 –
CHoNgqINg CHANgAN AUToMoB – A 6,322 – – 6,322 –
CITIC gUoAN INFoRMATIoN – A 7,097 – – 7,097 –
FAw CAR CoMPANy lIMITED – A 2,700 – – 2,700 –
FUyAo gRoUP glASS INDUSTR – A 5,716 5,716 – 11,432 –
gREE ElECTRIC APPlIANCES I – A 5,911 – – 5,911 –
gUANgDoNg ADVERTISINg Co – A 4,000 – 2,000 6,000 –
HAININg CHINA lEATHER MAR – A 3,811 – – 3,811 –
HISENSE ElECTRIC Co lTD – A 9,794 – – 9,794 –
HUAwEN MEDIA INVESTMENT – A 14,742 – – 14,742 –
HUAyU AUToMoTIVE SySTEMS – A 3,819 3,819 – 7,638 –
HUNAN TV ﹠ BRoADCAST INT – A 6,500 – – 6,500 –
JIANgSU PHoENIX PUBlISH – A 3,028 3,028 – 6,056 –
JISHI MEDIA Co lTD – A 7,000 – – 7,000 –
MIDEA gRoUP Co lTD – A 12,490 – – 12,490 –
qINgDAo HAIER Co lTD – A 12,195 – – 12,195 –
SHANgHAI oRIENTAl PEARl – A 4,700 – – 4,700 –
SHANgHAI oRIENTAl PEARl ME – A (FoRMERly KNowN AS BESTV NEw MEDIA Co lTD – A) 8,460 1,541 – 10,001 –
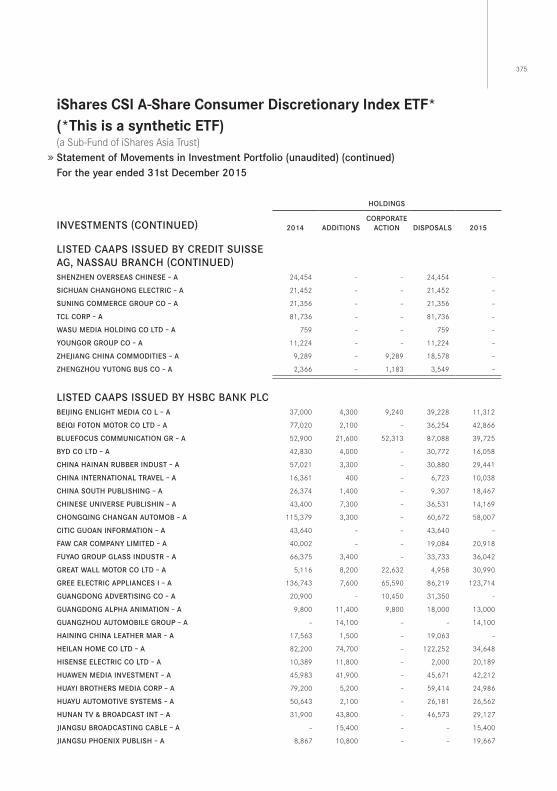
375
iShares CSi A-Share Consumer discretionary index eTf*(*This is a synthetic eTf) (a Sub-Fund of iShares Asia Trust) Statement of Movements in Investment Portfolio (unaudited) (continued)For the year ended 31st December 2015
HolDINgS
INVESTMENTS (CoNTINUED) 2014 ADDITIoNSCoRPoRATE
ACTIoN DISPoSAlS 2015
lISTED CAAPS ISSUED By CREDIT SUISSE Ag, NASSAU BRANCH (CoNTINUED)SHENzHEN oVERSEAS CHINESE – A 24,454 – – 24,454 –
SICHUAN CHANgHoNg ElECTRIC – A 21,452 – – 21,452 –
SUNINg CoMMERCE gRoUP Co – A 21,356 – – 21,356 –
TCl CoRP – A 81,736 – – 81,736 –
wASU MEDIA HolDINg Co lTD – A 759 – – 759 –
yoUNgoR gRoUP Co – A 11,224 – – 11,224 –
zHEJIANg CHINA CoMMoDITIES – A 9,289 – 9,289 18,578 –
zHENgzHoU yUToNg BUS Co – A 2,366 – 1,183 3,549 –
lISTED CAAPS ISSUED By HSBC BANK PlCBEIJINg ENlIgHT MEDIA Co l – A 37,000 4,300 9,240 39,228 11,312
BEIqI FoToN MoToR Co lTD – A 77,020 2,100 – 36,254 42,866
BlUEFoCUS CoMMUNICATIoN gR – A 52,900 21,600 52,313 87,088 39,725
ByD Co lTD – A 42,830 4,000 – 30,772 16,058
CHINA HAINAN RUBBER INDUST – A 57,021 3,300 – 30,880 29,441
CHINA INTERNATIoNAl TRAVEl – A 16,361 400 – 6,723 10,038
CHINA SoUTH PUBlISHINg – A 26,374 1,400 – 9,307 18,467
CHINESE UNIVERSE PUBlISHIN – A 43,400 7,300 – 36,531 14,169
CHoNgqINg CHANgAN AUToMoB – A 115,379 3,300 – 60,672 58,007
CITIC gUoAN INFoRMATIoN – A 43,640 – – 43,640 –
FAw CAR CoMPANy lIMITED – A 40,002 – – 19,084 20,918
FUyAo gRoUP glASS INDUSTR – A 66,375 3,400 – 33,733 36,042
gREAT wAll MoToR Co lTD – A 5,116 8,200 22,632 4,958 30,990
gREE ElECTRIC APPlIANCES I – A 136,743 7,600 65,590 86,219 123,714
gUANgDoNg ADVERTISINg Co – A 20,900 – 10,450 31,350 –
gUANgDoNg AlPHA ANIMATIoN – A 9,800 11,400 9,800 18,000 13,000
gUANgzHoU AUToMoBIlE gRoUP – A – 14,100 – – 14,100
HAININg CHINA lEATHER MAR – A 17,563 1,500 – 19,063 –
HEIlAN HoME Co lTD – A 82,200 74,700 – 122,252 34,648
HISENSE ElECTRIC Co lTD – A 10,389 11,800 – 2,000 20,189
HUAwEN MEDIA INVESTMENT – A 45,983 41,900 – 45,671 42,212
HUAyI BRoTHERS MEDIA CoRP – A 79,200 5,200 – 59,414 24,986
HUAyU AUToMoTIVE SySTEMS – A 50,643 2,100 – 26,181 26,562
HUNAN TV ﹠ BRoADCAST INT – A 31,900 43,800 – 46,573 29,127
JIANgSU BRoADCASTINg CABlE – A – 15,400 – – 15,400
JIANgSU PHoENIX PUBlISH – A 8,867 10,800 – – 19,667
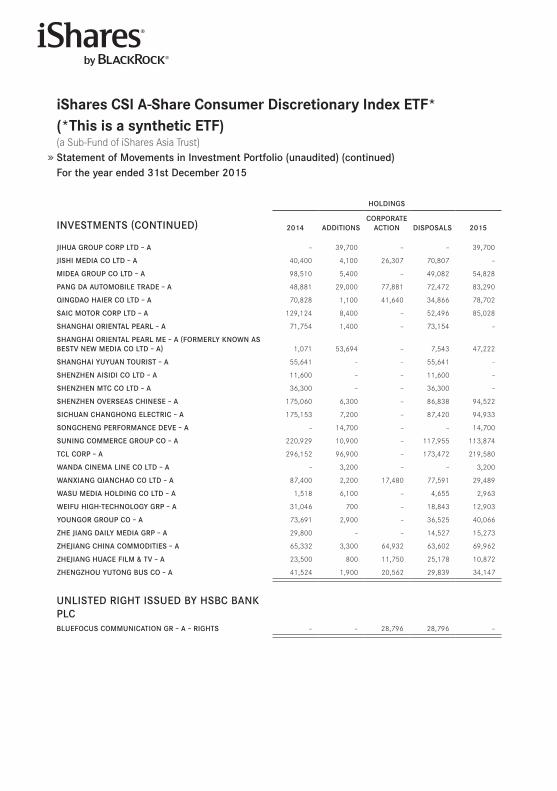
iShares CSi A-Share Consumer discretionary index eTf*(*This is a synthetic eTf) (a Sub-Fund of iShares Asia Trust) Statement of Movements in Investment Portfolio (unaudited) (continued)For the year ended 31st December 2015
HolDINgS
INVESTMENTS (CoNTINUED) 2014 ADDITIoNSCoRPoRATE
ACTIoN DISPoSAlS 2015
JIHUA gRoUP CoRP lTD – A – 39,700 – – 39,700
JISHI MEDIA Co lTD – A 40,400 4,100 26,307 70,807 –
MIDEA gRoUP Co lTD – A 98,510 5,400 – 49,082 54,828
PANg DA AUToMoBIlE TRADE – A 48,881 29,000 77,881 72,472 83,290
qINgDAo HAIER Co lTD – A 70,828 1,100 41,640 34,866 78,702
SAIC MoToR CoRP lTD – A 129,124 8,400 – 52,496 85,028
SHANgHAI oRIENTAl PEARl – A 71,754 1,400 – 73,154 –
SHANgHAI oRIENTAl PEARl ME – A (FoRMERly KNowN AS BESTV NEw MEDIA Co lTD – A) 1,071 53,694 – 7,543 47,222
SHANgHAI yUyUAN ToURIST – A 55,641 – – 55,641 –
SHENzHEN AISIDI Co lTD – A 11,600 – – 11,600 –
SHENzHEN MTC Co lTD – A 36,300 – – 36,300 –
SHENzHEN oVERSEAS CHINESE – A 175,060 6,300 – 86,838 94,522
SICHUAN CHANgHoNg ElECTRIC – A 175,153 7,200 – 87,420 94,933
SoNgCHENg PERFoRMANCE DEVE – A – 14,700 – – 14,700
SUNINg CoMMERCE gRoUP Co – A 220,929 10,900 – 117,955 113,874
TCl CoRP – A 296,152 96,900 – 173,472 219,580
wANDA CINEMA lINE Co lTD – A – 3,200 – – 3,200
wANXIANg qIANCHAo Co lTD – A 87,400 2,200 17,480 77,591 29,489
wASU MEDIA HolDINg Co lTD – A 1,518 6,100 – 4,655 2,963
wEIFU HIgH-TECHNology gRP – A 31,046 700 – 18,843 12,903
yoUNgoR gRoUP Co – A 73,691 2,900 – 36,525 40,066
zHE JIANg DAIly MEDIA gRP – A 29,800 – – 14,527 15,273
zHEJIANg CHINA CoMMoDITIES – A 65,332 3,300 64,932 63,602 69,962
zHEJIANg HUACE FIlM ﹠ TV – A 23,500 800 11,750 25,178 10,872
zHENgzHoU yUToNg BUS Co – A 41,524 1,900 20,562 29,839 34,147
UNlISTED RIgHT ISSUED By HSBC BANK PlCBlUEFoCUS CoMMUNICATIoN gR – A – RIgHTS – – 28,796 28,796 –
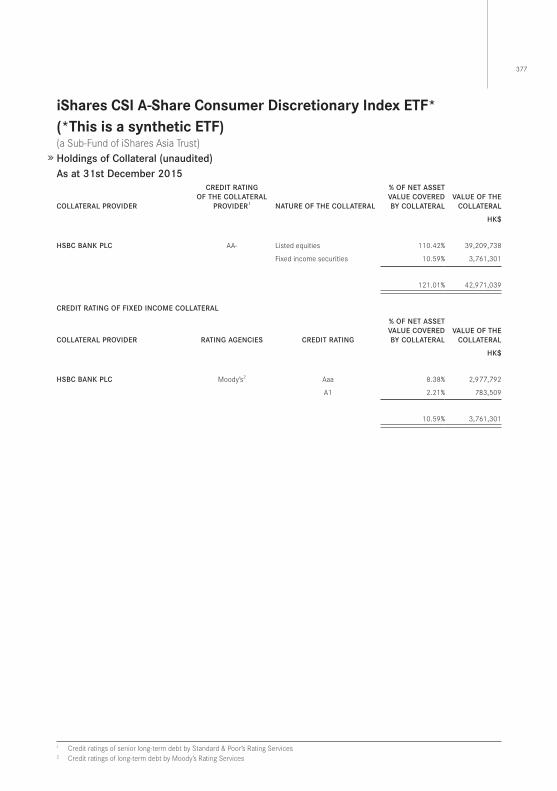
377
iShares CSi A-Share Consumer discretionary index eTf*(*This is a synthetic eTf) (a Sub-Fund of iShares Asia Trust) Holdings of Collateral (unaudited)As at 31st December 2015
CollATERAl PRoVIDER
CREDIT RATINg oF THE CollATERAl
PRoVIDER1 NATURE oF THE CollATERAl
% oF NET ASSET VAlUE CoVERED By CollATERAl
VAlUE oF THE CollATERAl
HK$
HSBC BANK PlC AA- Listed equities 110 .42% 39,209,738
Fixed income securities 10 .59% 3,761,301
121 .01% 42,971,039
CREDIT RATINg oF FIXED INCoME CollATERAl
CollATERAl PRoVIDER RATINg AgENCIES CREDIT RATINg
% oF NET ASSET VAlUE CoVERED By CollATERAl
VAlUE oF THE CollATERAl
HK$
HSBC BANK PlC Moody’s2 Aaa 8 .38% 2,977,792
A1 2 .21% 783,509
10 .59% 3,761,301
1 Credit ratings of senior long-term debt by Standard & Poor’s Rating Services2 Credit ratings of long-term debt by Moody’s Rating Services

iShares CSi A-Share Consumer discretionary index eTf*(*This is a synthetic eTf) (a Sub-Fund of iShares Asia Trust) Performance Record (unaudited)
Net Asset ValueDEAlINg
NET ASSET VAlUE PER UNIT
HK$
DEAlINgNET ASSET VAlUE oF THE SUB-FUND
HK$
AT END oF FINANCIAl PERIoD DATED
31ST DECEMBER 2013 16 .42 139,569,818
31ST DECEMBER 2014 19 .87 99,369,376
31ST DECEMBER 2015 23 .67 35,510,050
Highest and lowest net asset value per unitHIgHEST NET ASSET
VAlUE PER UNITHK$
lowEST NET ASSETVAlUE PER UNIT
HK$
FINANCIAl PERIoD ENDED
31ST DECEMBER 2010 (SINCE INCEPTIoN) 20 .70 14 .84
31ST DECEMBER 2011 20 .23 12 .95
31ST DECEMBER 2012 15 .54 11 .89
31ST DECEMBER 2013 18 .31 13 .27
31ST DECEMBER 2014 20 .99 14 .64
31ST DECEMBER 2015 36 .25 19 .17
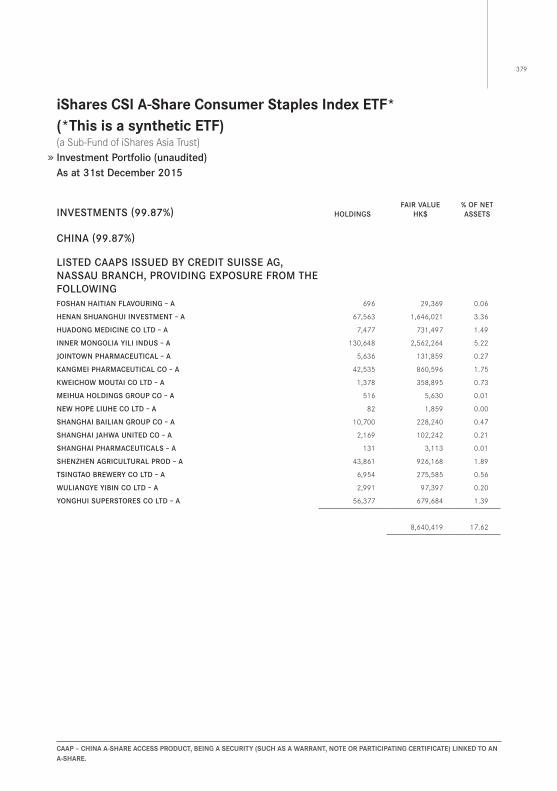
379
iShares CSi A-Share Consumer Staples index eTf*(*This is a synthetic eTf) (a Sub-Fund of iShares Asia Trust) Investment Portfolio (unaudited)As at 31st December 2015
CAAp – ChinA A-ShARe ACCeSS pRodUCT, Being A SeCURiTY (SUCh AS A wARRAnT, noTe oR pARTiCipATing CeRTifiCATe) linKed To An A-ShARe.
INVESTMENTS (99.87%) HolDINgSFAIR VAlUE
HK$% oF NET ASSETS
CHINA (99.87%)
lISTED CAAPS ISSUED By CREDIT SUISSE Ag, NASSAU BRANCH, PRoVIDINg EXPoSURE FRoM THE FollowINgFoSHAN HAITIAN FlAVoURINg – A 696 29,369 0 .06
HENAN SHUANgHUI INVESTMENT – A 67,563 1,646,021 3 .36
HUADoNg MEDICINE Co lTD – A 7,477 731,497 1 .49
INNER MoNgolIA yIlI INDUS – A 130,648 2,562,264 5 .22
JoINTowN PHARMACEUTICAl – A 5,636 131,859 0 .27
KANgMEI PHARMACEUTICAl Co – A 42,535 860,596 1 .75
KwEICHow MoUTAI Co lTD – A 1,378 358,895 0 .73
MEIHUA HolDINgS gRoUP Co – A 516 5,630 0 .01
NEw HoPE lIUHE Co lTD – A 82 1,859 0 .00
SHANgHAI BAIlIAN gRoUP Co – A 10,700 228,240 0 .47
SHANgHAI JAHwA UNITED Co – A 2,169 102,242 0 .21
SHANgHAI PHARMACEUTICAlS – A 131 3,113 0 .01
SHENzHEN AgRICUlTURAl PRoD – A 43,861 926,168 1 .89
TSINgTAo BREwERy Co lTD – A 6,954 275,585 0 .56
wUlIANgyE yIBIN Co lTD – A 2,991 97,397 0 .20
yoNgHUI SUPERSToRES Co lTD – A 56,377 679,684 1 .39
8,640,419 17 .62
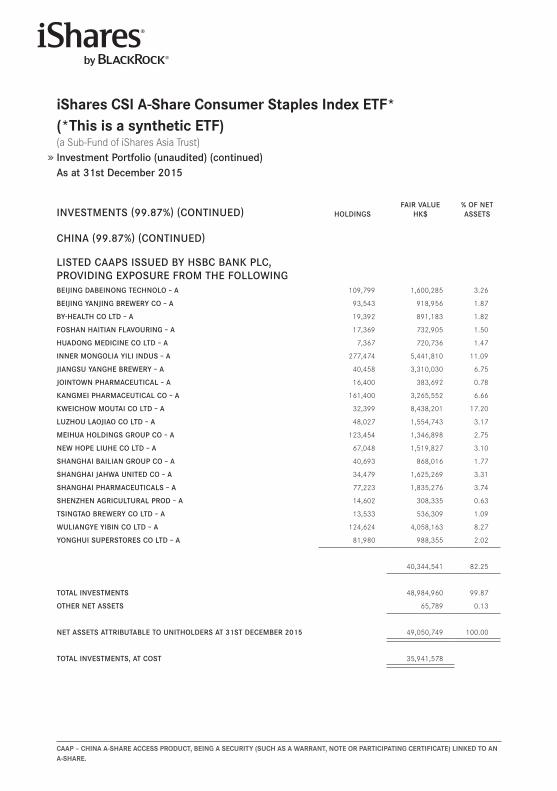
iShares CSi A-Share Consumer Staples index eTf*(*This is a synthetic eTf) (a Sub-Fund of iShares Asia Trust) Investment Portfolio (unaudited) (continued)As at 31st December 2015
CAAp – ChinA A-ShARe ACCeSS pRodUCT, Being A SeCURiTY (SUCh AS A wARRAnT, noTe oR pARTiCipATing CeRTifiCATe) linKed To An A-ShARe.
INVESTMENTS (99.87%) (CoNTINUED) HolDINgSFAIR VAlUE
HK$% oF NET ASSETS
CHINA (99.87%) (CoNTINUED)
lISTED CAAPS ISSUED By HSBC BANK PlC, PRoVIDINg EXPoSURE FRoM THE FollowINgBEIJINg DABEINoNg TECHNolo – A 109,799 1,600,285 3 .26
BEIJINg yANJINg BREwERy Co – A 93,543 918,956 1 .87
By-HEAlTH Co lTD – A 19,392 891,183 1 .82
FoSHAN HAITIAN FlAVoURINg – A 17,369 732,905 1 .50
HUADoNg MEDICINE Co lTD – A 7,367 720,736 1 .47
INNER MoNgolIA yIlI INDUS – A 277,474 5,441,810 11 .09
JIANgSU yANgHE BREwERy – A 40,458 3,310,030 6 .75
JoINTowN PHARMACEUTICAl – A 16,400 383,692 0 .78
KANgMEI PHARMACEUTICAl Co – A 161,400 3,265,552 6 .66
KwEICHow MoUTAI Co lTD – A 32,399 8,438,201 17 .20
lUzHoU lAoJIAo Co lTD – A 48,027 1,554,743 3 .17
MEIHUA HolDINgS gRoUP Co – A 123,454 1,346,898 2 .75
NEw HoPE lIUHE Co lTD – A 67,048 1,519,827 3 .10
SHANgHAI BAIlIAN gRoUP Co – A 40,693 868,016 1 .77
SHANgHAI JAHwA UNITED Co – A 34,479 1,625,269 3 .31
SHANgHAI PHARMACEUTICAlS – A 77,223 1,835,276 3 .74
SHENzHEN AgRICUlTURAl PRoD – A 14,602 308,335 0 .63
TSINgTAo BREwERy Co lTD – A 13,533 536,309 1 .09
wUlIANgyE yIBIN Co lTD – A 124,624 4,058,163 8 .27
yoNgHUI SUPERSToRES Co lTD – A 81,980 988,355 2 .02
40,344,541 82 .25
ToTAl INVESTMENTS 48,984,960 99 .87
oTHER NET ASSETS 65,789 0 .13
NET ASSETS ATTRIBUTABlE To UNITHolDERS AT 31ST DECEMBER 2015 49,050,749 100 .00
ToTAl INVESTMENTS, AT CoST 35,941,578
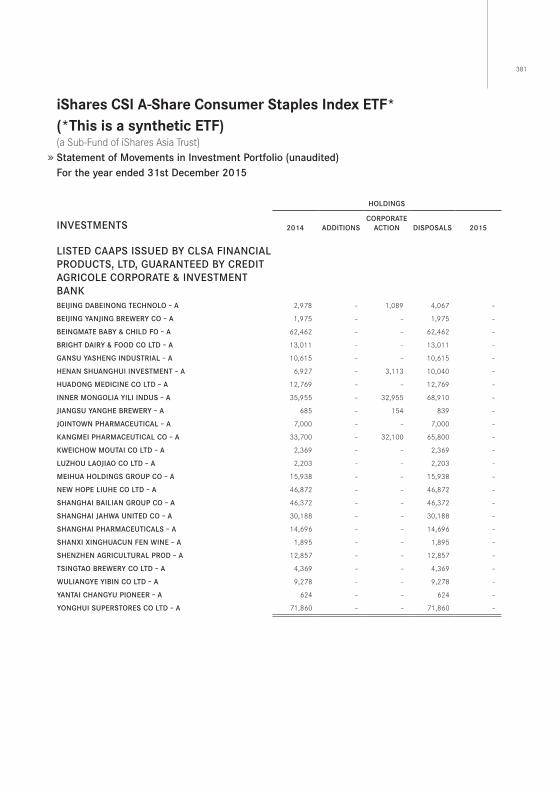
381
iShares CSi A-Share Consumer Staples index eTf*(*This is a synthetic eTf) (a Sub-Fund of iShares Asia Trust) Statement of Movements in Investment Portfolio (unaudited)For the year ended 31st December 2015
HolDINgS
INVESTMENTS 2014 ADDITIoNSCoRPoRATE
ACTIoN DISPoSAlS 2015
lISTED CAAPS ISSUED By ClSA FINANCIAl PRoDUCTS, lTD, gUARANTEED By CREDIT AgRIColE CoRPoRATE ﹠ INVESTMENT BANKBEIJINg DABEINoNg TECHNolo – A 2,978 – 1,089 4,067 –
BEIJINg yANJINg BREwERy Co – A 1,975 – – 1,975 –
BEINgMATE BABy ﹠ CHIlD Fo – A 62,462 – – 62,462 –
BRIgHT DAIRy ﹠ FooD Co lTD – A 13,011 – – 13,011 –
gANSU yASHENg INDUSTRIAl – A 10,615 – – 10,615 –
HENAN SHUANgHUI INVESTMENT – A 6,927 – 3,113 10,040 –
HUADoNg MEDICINE Co lTD – A 12,769 – – 12,769 –
INNER MoNgolIA yIlI INDUS – A 35,955 – 32,955 68,910 –
JIANgSU yANgHE BREwERy – A 685 – 154 839 –
JoINTowN PHARMACEUTICAl – A 7,000 – – 7,000 –
KANgMEI PHARMACEUTICAl Co – A 33,700 – 32,100 65,800 –
KwEICHow MoUTAI Co lTD – A 2,369 – – 2,369 –
lUzHoU lAoJIAo Co lTD – A 2,203 – – 2,203 –
MEIHUA HolDINgS gRoUP Co – A 15,938 – – 15,938 –
NEw HoPE lIUHE Co lTD – A 46,872 – – 46,872 –
SHANgHAI BAIlIAN gRoUP Co – A 46,372 – – 46,372 –
SHANgHAI JAHwA UNITED Co – A 30,188 – – 30,188 –
SHANgHAI PHARMACEUTICAlS – A 14,696 – – 14,696 –
SHANXI XINgHUACUN FEN wINE – A 1,895 – – 1,895 –
SHENzHEN AgRICUlTURAl PRoD – A 12,857 – – 12,857 –
TSINgTAo BREwERy Co lTD – A 4,369 – – 4,369 –
wUlIANgyE yIBIN Co lTD – A 9,278 – – 9,278 –
yANTAI CHANgyU PIoNEER – A 624 – – 624 –
yoNgHUI SUPERSToRES Co lTD – A 71,860 – – 71,860 –
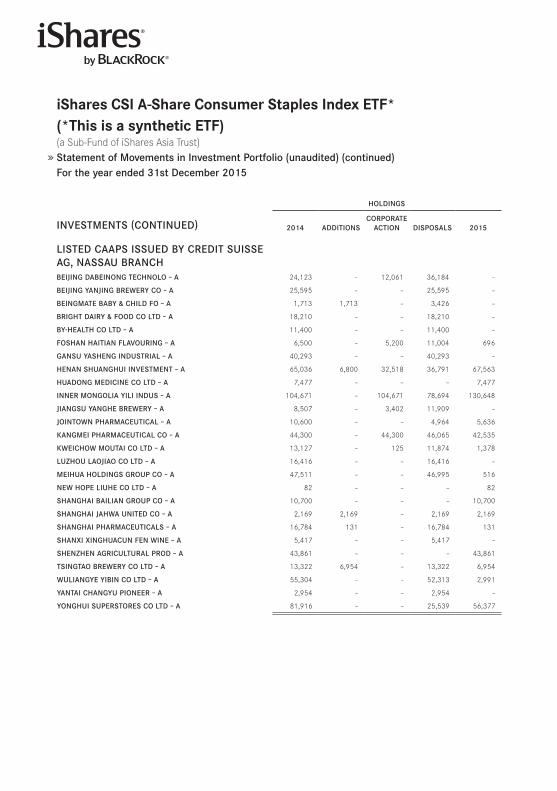
iShares CSi A-Share Consumer Staples index eTf*(*This is a synthetic eTf) (a Sub-Fund of iShares Asia Trust) Statement of Movements in Investment Portfolio (unaudited) (continued)For the year ended 31st December 2015
HolDINgS
INVESTMENTS (CoNTINUED) 2014 ADDITIoNSCoRPoRATE
ACTIoN DISPoSAlS 2015
lISTED CAAPS ISSUED By CREDIT SUISSE Ag, NASSAU BRANCHBEIJINg DABEINoNg TECHNolo – A 24,123 – 12,061 36,184 –
BEIJINg yANJINg BREwERy Co – A 25,595 – – 25,595 –
BEINgMATE BABy ﹠ CHIlD Fo – A 1,713 1,713 – 3,426 –
BRIgHT DAIRy ﹠ FooD Co lTD – A 18,210 – – 18,210 –
By-HEAlTH Co lTD – A 11,400 – – 11,400 –
FoSHAN HAITIAN FlAVoURINg – A 6,500 – 5,200 11,004 696
gANSU yASHENg INDUSTRIAl – A 40,293 – – 40,293 –
HENAN SHUANgHUI INVESTMENT – A 65,036 6,800 32,518 36,791 67,563
HUADoNg MEDICINE Co lTD – A 7,477 – – – 7,477
INNER MoNgolIA yIlI INDUS – A 104,671 – 104,671 78,694 130,648
JIANgSU yANgHE BREwERy – A 8,507 – 3,402 11,909 –
JoINTowN PHARMACEUTICAl – A 10,600 – – 4,964 5,636
KANgMEI PHARMACEUTICAl Co – A 44,300 – 44,300 46,065 42,535
KwEICHow MoUTAI Co lTD – A 13,127 – 125 11,874 1,378
lUzHoU lAoJIAo Co lTD – A 16,416 – – 16,416 –
MEIHUA HolDINgS gRoUP Co – A 47,511 – – 46,995 516
NEw HoPE lIUHE Co lTD – A 82 – – – 82
SHANgHAI BAIlIAN gRoUP Co – A 10,700 – – – 10,700
SHANgHAI JAHwA UNITED Co – A 2,169 2,169 – 2,169 2,169
SHANgHAI PHARMACEUTICAlS – A 16,784 131 – 16,784 131
SHANXI XINgHUACUN FEN wINE – A 5,417 – – 5,417 –
SHENzHEN AgRICUlTURAl PRoD – A 43,861 – – – 43,861
TSINgTAo BREwERy Co lTD – A 13,322 6,954 – 13,322 6,954
wUlIANgyE yIBIN Co lTD – A 55,304 – – 52,313 2,991
yANTAI CHANgyU PIoNEER – A 2,954 – – 2,954 –
yoNgHUI SUPERSToRES Co lTD – A 81,916 – – 25,539 56,377
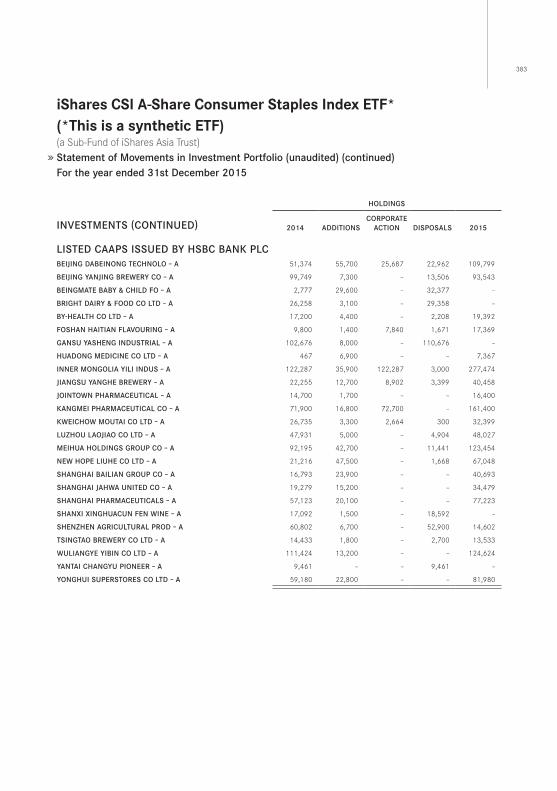
383
iShares CSi A-Share Consumer Staples index eTf*(*This is a synthetic eTf) (a Sub-Fund of iShares Asia Trust) Statement of Movements in Investment Portfolio (unaudited) (continued)For the year ended 31st December 2015
HolDINgS
INVESTMENTS (CoNTINUED) 2014 ADDITIoNSCoRPoRATE
ACTIoN DISPoSAlS 2015
lISTED CAAPS ISSUED By HSBC BANK PlCBEIJINg DABEINoNg TECHNolo – A 51,374 55,700 25,687 22,962 109,799
BEIJINg yANJINg BREwERy Co – A 99,749 7,300 – 13,506 93,543
BEINgMATE BABy ﹠ CHIlD Fo – A 2,777 29,600 – 32,377 –
BRIgHT DAIRy ﹠ FooD Co lTD – A 26,258 3,100 – 29,358 –
By-HEAlTH Co lTD – A 17,200 4,400 – 2,208 19,392
FoSHAN HAITIAN FlAVoURINg – A 9,800 1,400 7,840 1,671 17,369
gANSU yASHENg INDUSTRIAl – A 102,676 8,000 – 110,676 –
HUADoNg MEDICINE Co lTD – A 467 6,900 – – 7,367
INNER MoNgolIA yIlI INDUS – A 122,287 35,900 122,287 3,000 277,474
JIANgSU yANgHE BREwERy – A 22,255 12,700 8,902 3,399 40,458
JoINTowN PHARMACEUTICAl – A 14,700 1,700 – – 16,400
KANgMEI PHARMACEUTICAl Co – A 71,900 16,800 72,700 – 161,400
KwEICHow MoUTAI Co lTD – A 26,735 3,300 2,664 300 32,399
lUzHoU lAoJIAo Co lTD – A 47,931 5,000 – 4,904 48,027
MEIHUA HolDINgS gRoUP Co – A 92,195 42,700 – 11,441 123,454
NEw HoPE lIUHE Co lTD – A 21,216 47,500 – 1,668 67,048
SHANgHAI BAIlIAN gRoUP Co – A 16,793 23,900 – – 40,693
SHANgHAI JAHwA UNITED Co – A 19,279 15,200 – – 34,479
SHANgHAI PHARMACEUTICAlS – A 57,123 20,100 – – 77,223
SHANXI XINgHUACUN FEN wINE – A 17,092 1,500 – 18,592 –
SHENzHEN AgRICUlTURAl PRoD – A 60,802 6,700 – 52,900 14,602
TSINgTAo BREwERy Co lTD – A 14,433 1,800 – 2,700 13,533
wUlIANgyE yIBIN Co lTD – A 111,424 13,200 – – 124,624
yANTAI CHANgyU PIoNEER – A 9,461 – – 9,461 –
yoNgHUI SUPERSToRES Co lTD – A 59,180 22,800 – – 81,980
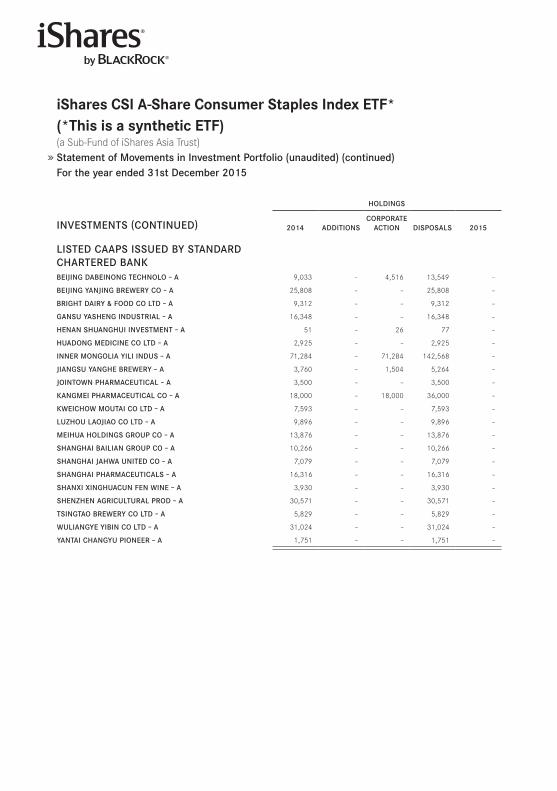
iShares CSi A-Share Consumer Staples index eTf*(*This is a synthetic eTf) (a Sub-Fund of iShares Asia Trust) Statement of Movements in Investment Portfolio (unaudited) (continued)For the year ended 31st December 2015
HolDINgS
INVESTMENTS (CoNTINUED) 2014 ADDITIoNSCoRPoRATE
ACTIoN DISPoSAlS 2015
lISTED CAAPS ISSUED By STANDARD CHARTERED BANKBEIJINg DABEINoNg TECHNolo – A 9,033 – 4,516 13,549 –
BEIJINg yANJINg BREwERy Co – A 25,808 – – 25,808 –
BRIgHT DAIRy ﹠ FooD Co lTD – A 9,312 – – 9,312 –
gANSU yASHENg INDUSTRIAl – A 16,348 – – 16,348 –
HENAN SHUANgHUI INVESTMENT – A 51 – 26 77 –
HUADoNg MEDICINE Co lTD – A 2,925 – – 2,925 –
INNER MoNgolIA yIlI INDUS – A 71,284 – 71,284 142,568 –
JIANgSU yANgHE BREwERy – A 3,760 – 1,504 5,264 –
JoINTowN PHARMACEUTICAl – A 3,500 – – 3,500 –
KANgMEI PHARMACEUTICAl Co – A 18,000 – 18,000 36,000 –
KwEICHow MoUTAI Co lTD – A 7,593 – – 7,593 –
lUzHoU lAoJIAo Co lTD – A 9,896 – – 9,896 –
MEIHUA HolDINgS gRoUP Co – A 13,876 – – 13,876 –
SHANgHAI BAIlIAN gRoUP Co – A 10,266 – – 10,266 –
SHANgHAI JAHwA UNITED Co – A 7,079 – – 7,079 –
SHANgHAI PHARMACEUTICAlS – A 16,316 – – 16,316 –
SHANXI XINgHUACUN FEN wINE – A 3,930 – – 3,930 –
SHENzHEN AgRICUlTURAl PRoD – A 30,571 – – 30,571 –
TSINgTAo BREwERy Co lTD – A 5,829 – – 5,829 –
wUlIANgyE yIBIN Co lTD – A 31,024 – – 31,024 –
yANTAI CHANgyU PIoNEER – A 1,751 – – 1,751 –
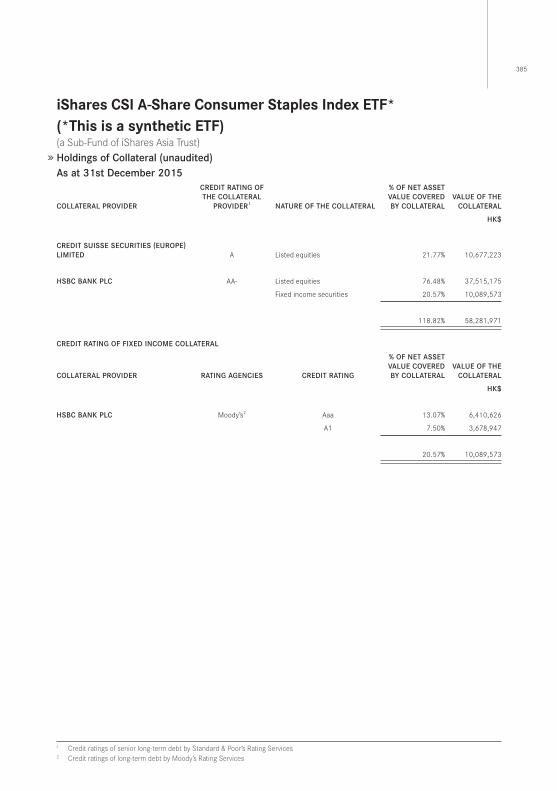
385
iShares CSi A-Share Consumer Staples index eTf* (*This is a synthetic eTf)(a Sub-Fund of iShares Asia Trust)Holdings of Collateral (unaudited)As at 31st December 2015
CollATERAl PRoVIDER
CREDIT RATINg oF THE CollATERAl
PRoVIDER1 NATURE oF THE CollATERAl
% oF NET ASSET VAlUE CoVERED By CollATERAl
VAlUE oF THE CollATERAl
HK$
CREDIT SUISSE SECURITIES (EURoPE) lIMITED A Listed equities 21 .77% 10,677,223
HSBC BANK PlC AA- Listed equities 76 .48% 37,515,175
Fixed income securities 20 .57% 10,089,573
118 .82% 58,281,971
CREDIT RATINg oF FIXED INCoME CollATERAl
CollATERAl PRoVIDER RATINg AgENCIES CREDIT RATINg
% oF NET ASSET VAlUE CoVERED By CollATERAl
VAlUE oF THE CollATERAl
HK$
HSBC BANK PlC Moody’s2 Aaa 13 .07% 6,410,626
A1 7 .50% 3,678,947
20 .57% 10,089,573
1 Credit ratings of senior long-term debt by Standard & Poor’s Rating Services2 Credit ratings of long-term debt by Moody’s Rating Services

iShares CSi A-Share Consumer Staples index eTf*(*This is a synthetic eTf) (a Sub-Fund of iShares Asia Trust) Performance Record (unaudited)
Net Asset ValueDEAlINg
NET ASSET VAlUE PER UNIT
HK$
DEAlINgNET ASSET VAlUE oF THE SUB-FUND
HK$
AT END oF FINANCIAl PERIoD DATED
31ST DECEMBER 2013 15 .71 62,843,733
31ST DECEMBER 2014 17 .89 71,571,352
31ST DECEMBER 2015 21 .80 49,050,748
Highest and lowest net asset value per unitHIgHEST NET ASSET
VAlUE PER UNITHK$
lowEST NET ASSETVAlUE PER UNIT
HK$
FINANCIAl PERIoD ENDED
31ST DECEMBER 2010 (SINCE INCEPTIoN) 22 .94 14 .93
31ST DECEMBER 2011 23 .71 18 .70
31ST DECEMBER 2012 21 .86 15 .70
31ST DECEMBER 2013 18 .56 15 .27
31ST DECEMBER 2014 17 .92 13 .99
31ST DECEMBER 2015 28 .82 17 .27
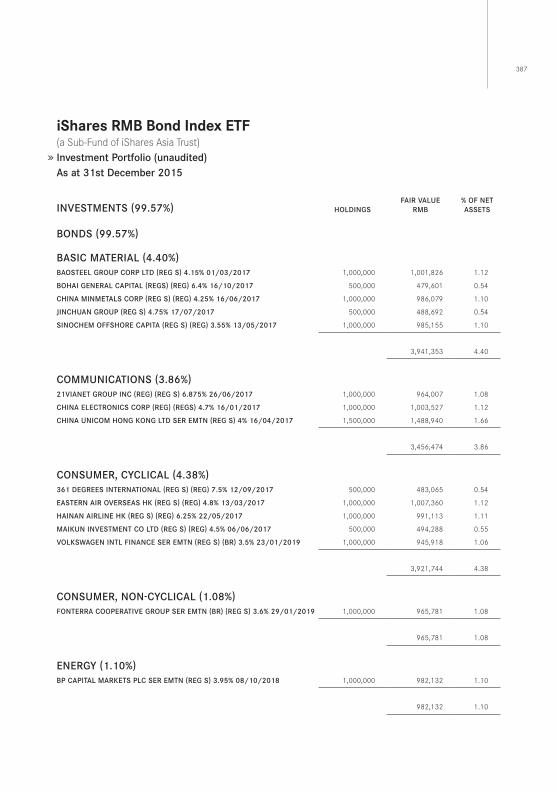
387
iShares RMB Bond index eTf(a Sub-Fund of iShares Asia Trust) Investment Portfolio (unaudited)As at 31st December 2015
INVESTMENTS (99.57%) HolDINgSFAIR VAlUE
RMB% oF NET ASSETS
BoNDS (99.57%)
BASIC MATERIAl (4.40%)BAoSTEEl gRoUP CoRP lTD (REg S) 4.15% 01/03/2017 1,000,000 1,001,826 1 .12
BoHAI gENERAl CAPITAl (REgS) (REg) 6.4% 16/10/2017 500,000 479,601 0 .54
CHINA MINMETAlS CoRP (REg S) (REg) 4.25% 16/06/2017 1,000,000 986,079 1 .10
JINCHUAN gRoUP (REg S) 4.75% 17/07/2017 500,000 488,692 0 .54
SINoCHEM oFFSHoRE CAPITA (REg S) (REg) 3.55% 13/05/2017 1,000,000 985,155 1 .10
3,941,353 4 .40
CoMMUNICATIoNS (3.86%)21VIANET gRoUP INC (REg) (REg S) 6.875% 26/06/2017 1,000,000 964,007 1 .08
CHINA ElECTRoNICS CoRP (REg) (REgS) 4.7% 16/01/2017 1,000,000 1,003,527 1 .12
CHINA UNICoM HoNg KoNg lTD SER EMTN (REg S) 4% 16/04/2017 1,500,000 1,488,940 1 .66
3,456,474 3 .86
CoNSUMER, CyClICAl (4.38%)361 DEgREES INTERNATIoNAl (REg S) (REg) 7.5% 12/09/2017 500,000 483,065 0 .54
EASTERN AIR oVERSEAS HK (REg S) (REg) 4.8% 13/03/2017 1,000,000 1,007,360 1 .12
HAINAN AIRlINE HK (REg S) (REg) 6.25% 22/05/2017 1,000,000 991,113 1 .11
MAIKUN INVESTMENT Co lTD (REg S) (REg) 4.5% 06/06/2017 500,000 494,288 0 .55
VolKSwAgEN INTl FINANCE SER EMTN (REg S) (BR) 3.5% 23/01/2019 1,000,000 945,918 1 .06
3,921,744 4 .38
CoNSUMER, NoN-CyClICAl (1.08%)FoNTERRA CooPERATIVE gRoUP SER EMTN (BR) (REg S) 3.6% 29/01/2019 1,000,000 965,781 1 .08
965,781 1 .08
ENERgy (1.10%)BP CAPITAl MARKETS PlC SER EMTN (REg S) 3.95% 08/10/2018 1,000,000 982,132 1 .10
982,132 1 .10
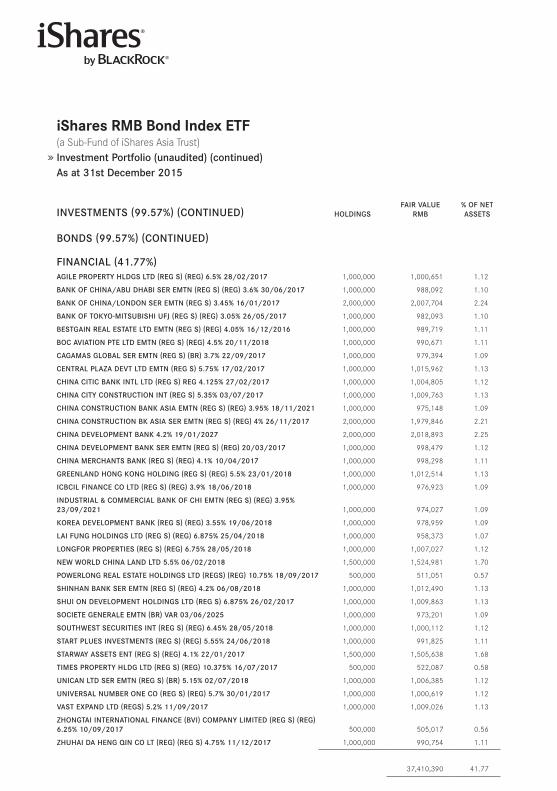
iShares RMB Bond index eTf (a Sub-Fund of iShares Asia Trust) Investment Portfolio (unaudited) (continued)As at 31st December 2015
INVESTMENTS (99.57%) (CoNTINUED) HolDINgSFAIR VAlUE
RMB% oF NET ASSETS
BoNDS (99.57%) (CoNTINUED)
FINANCIAl (41.77%)AgIlE PRoPERTy HlDgS lTD (REg S) (REg) 6.5% 28/02/2017 1,000,000 1,000,651 1 .12
BANK oF CHINA/ABU DHABI SER EMTN (REg S) (REg) 3.6% 30/06/2017 1,000,000 988,092 1 .10
BANK oF CHINA/loNDoN SER EMTN (REg S) 3.45% 16/01/2017 2,000,000 2,007,704 2 .24
BANK oF ToKyo-MITSUBISHI UFJ (REg S) (REg) 3.05% 26/05/2017 1,000,000 982,093 1 .10
BESTgAIN REAl ESTATE lTD EMTN (REg S) (REg) 4.05% 16/12/2016 1,000,000 989,719 1 .11
BoC AVIATIoN PTE lTD EMTN (REg S) (REg) 4.5% 20/11/2018 1,000,000 990,671 1 .11
CAgAMAS gloBAl SER EMTN (REg S) (BR) 3.7% 22/09/2017 1,000,000 979,394 1 .09
CENTRAl PlAzA DEVT lTD EMTN (REg S) 5.75% 17/02/2017 1,000,000 1,015,962 1 .13
CHINA CITIC BANK INTl lTD (REg S) REg 4.125% 27/02/2017 1,000,000 1,004,805 1 .12
CHINA CITy CoNSTRUCTIoN INT (REg S) 5.35% 03/07/2017 1,000,000 1,009,763 1 .13
CHINA CoNSTRUCTIoN BANK ASIA EMTN (REg S) (REg) 3.95% 18/11/2021 1,000,000 975,148 1 .09
CHINA CoNSTRUCTIoN BK ASIA SER EMTN (REg S) (REg) 4% 26/11/2017 2,000,000 1,979,846 2 .21
CHINA DEVEloPMENT BANK 4.2% 19/01/2027 2,000,000 2,018,893 2 .25
CHINA DEVEloPMENT BANK SER EMTN (REg S) (REg) 20/03/2017 1,000,000 998,479 1 .12
CHINA MERCHANTS BANK (REg S) (REg) 4.1% 10/04/2017 1,000,000 998,298 1 .11
gREENlAND HoNg KoNg HolDINg (REg S) (REg) 5.5% 23/01/2018 1,000,000 1,012,514 1 .13
ICBCIl FINANCE Co lTD (REg S) (REg) 3.9% 18/06/2018 1,000,000 976,923 1 .09
INDUSTRIAl ﹠ CoMMERCIAl BANK oF CHI EMTN (REg S) (REg) 3.95% 23/09/2021 1,000,000 974,027 1 .09
KoREA DEVEloPMENT BANK (REg S) (REg) 3.55% 19/06/2018 1,000,000 978,959 1 .09
lAI FUNg HolDINgS lTD (REg S) (REg) 6.875% 25/04/2018 1,000,000 958,373 1 .07
loNgFoR PRoPERTIES (REg S) (REg) 6.75% 28/05/2018 1,000,000 1,007,027 1 .12
NEw woRlD CHINA lAND lTD 5.5% 06/02/2018 1,500,000 1,524,981 1 .70
PowERloNg REAl ESTATE HolDINgS lTD (REgS) (REg) 10.75% 18/09/2017 500,000 511,051 0 .57
SHINHAN BANK SER EMTN (REg S) (REg) 4.2% 06/08/2018 1,000,000 1,012,490 1 .13
SHUI oN DEVEloPMENT HolDINgS lTD (REg S) 6.875% 26/02/2017 1,000,000 1,009,863 1 .13
SoCIETE gENERAlE EMTN (BR) VAR 03/06/2025 1,000,000 973,201 1 .09
SoUTHwEST SECURITIES INT (REg S) (REg) 6.45% 28/05/2018 1,000,000 1,000,112 1 .12
START PlUES INVESTMENTS (REg S) (REg) 5.55% 24/06/2018 1,000,000 991,825 1 .11
STARwAy ASSETS ENT (REg S) (REg) 4.1% 22/01/2017 1,500,000 1,505,638 1 .68
TIMES PRoPERTy HlDg lTD (REg S) (REg) 10.375% 16/07/2017 500,000 522,087 0 .58
UNICAN lTD SER EMTN (REg S) (BR) 5.15% 02/07/2018 1,000,000 1,006,385 1 .12
UNIVERSAl NUMBER oNE Co (REg S) (REg) 5.7% 30/01/2017 1,000,000 1,000,619 1 .12
VAST EXPAND lTD (REgS) 5.2% 11/09/2017 1,000,000 1,009,026 1 .13
zHoNgTAI INTERNATIoNAl FINANCE (BVI) CoMPANy lIMITED (REg S) (REg) 6.25% 10/09/2017 500,000 505,017 0 .56
zHUHAI DA HENg qIN Co lT (REg) (REg S) 4.75% 11/12/2017 1,000,000 990,754 1 .11
37,410,390 41 .77
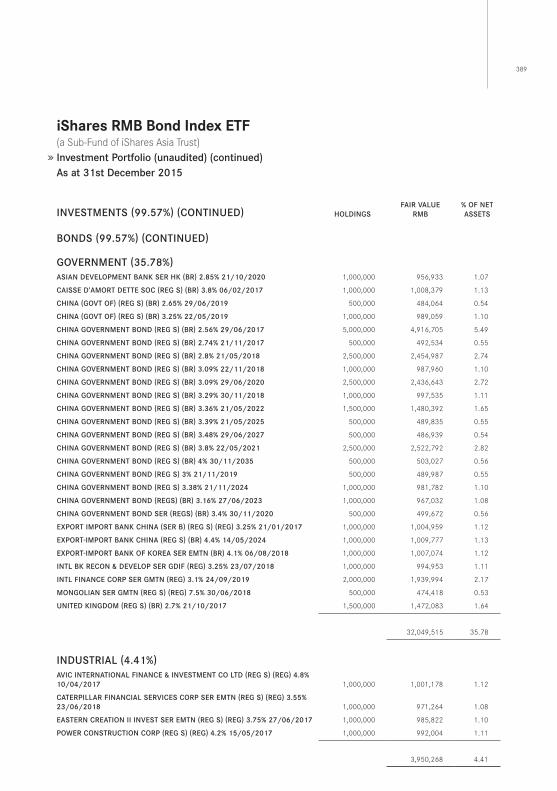
389
iShares RMB Bond index eTf (a Sub-Fund of iShares Asia Trust) Investment Portfolio (unaudited) (continued)As at 31st December 2015
INVESTMENTS (99.57%) (CoNTINUED) HolDINgSFAIR VAlUE
RMB% oF NET ASSETS
BoNDS (99.57%) (CoNTINUED)
goVERNMENT (35.78%)ASIAN DEVEloPMENT BANK SER HK (BR) 2.85% 21/10/2020 1,000,000 956,933 1 .07
CAISSE D’AMoRT DETTE SoC (REg S) (BR) 3.8% 06/02/2017 1,000,000 1,008,379 1 .13
CHINA (goVT oF) (REg S) (BR) 2.65% 29/06/2019 500,000 484,064 0 .54
CHINA (goVT oF) (REg S) (BR) 3.25% 22/05/2019 1,000,000 989,059 1 .10
CHINA goVERNMENT BoND (REg S) (BR) 2.56% 29/06/2017 5,000,000 4,916,705 5 .49
CHINA goVERNMENT BoND (REg S) (BR) 2.74% 21/11/2017 500,000 492,534 0 .55
CHINA goVERNMENT BoND (REg S) (BR) 2.8% 21/05/2018 2,500,000 2,454,987 2 .74
CHINA goVERNMENT BoND (REg S) (BR) 3.09% 22/11/2018 1,000,000 987,960 1 .10
CHINA goVERNMENT BoND (REg S) (BR) 3.09% 29/06/2020 2,500,000 2,436,643 2 .72
CHINA goVERNMENT BoND (REg S) (BR) 3.29% 30/11/2018 1,000,000 997,535 1 .11
CHINA goVERNMENT BoND (REg S) (BR) 3.36% 21/05/2022 1,500,000 1,480,392 1 .65
CHINA goVERNMENT BoND (REg S) (BR) 3.39% 21/05/2025 500,000 489,835 0 .55
CHINA goVERNMENT BoND (REg S) (BR) 3.48% 29/06/2027 500,000 486,939 0 .54
CHINA goVERNMENT BoND (REg S) (BR) 3.8% 22/05/2021 2,500,000 2,522,792 2 .82
CHINA goVERNMENT BoND (REg S) (BR) 4% 30/11/2035 500,000 503,027 0 .56
CHINA goVERNMENT BoND (REg S) 3% 21/11/2019 500,000 489,987 0 .55
CHINA goVERNMENT BoND (REg S) 3.38% 21/11/2024 1,000,000 981,782 1 .10
CHINA goVERNMENT BoND (REgS) (BR) 3.16% 27/06/2023 1,000,000 967,032 1 .08
CHINA goVERNMENT BoND SER (REgS) (BR) 3.4% 30/11/2020 500,000 499,672 0 .56
EXPoRT IMPoRT BANK CHINA (SER B) (REg S) (REg) 3.25% 21/01/2017 1,000,000 1,004,959 1 .12
EXPoRT-IMPoRT BANK CHINA (REg S) (BR) 4.4% 14/05/2024 1,000,000 1,009,777 1 .13
EXPoRT-IMPoRT BANK oF KoREA SER EMTN (BR) 4.1% 06/08/2018 1,000,000 1,007,074 1 .12
INTl BK RECoN ﹠ DEVEloP SER gDIF (REg) 3.25% 23/07/2018 1,000,000 994,953 1 .11
INTl FINANCE CoRP SER gMTN (REg) 3.1% 24/09/2019 2,000,000 1,939,994 2 .17
MoNgolIAN SER gMTN (REg S) (REg) 7.5% 30/06/2018 500,000 474,418 0 .53
UNITED KINgDoM (REg S) (BR) 2.7% 21/10/2017 1,500,000 1,472,083 1 .64
32,049,515 35 .78
INDUSTRIAl (4.41%)AVIC INTERNATIoNAl FINANCE ﹠ INVESTMENT Co lTD (REg S) (REg) 4.8% 10/04/2017 1,000,000 1,001,178 1 .12
CATERPIllAR FINANCIAl SERVICES CoRP SER EMTN (REg S) (REg) 3.55% 23/06/2018 1,000,000 971,264 1 .08
EASTERN CREATIoN II INVEST SER EMTN (REg S) (REg) 3.75% 27/06/2017 1,000,000 985,822 1 .10
PowER CoNSTRUCTIoN CoRP (REg S) (REg) 4.2% 15/05/2017 1,000,000 992,004 1 .11
3,950,268 4 .41
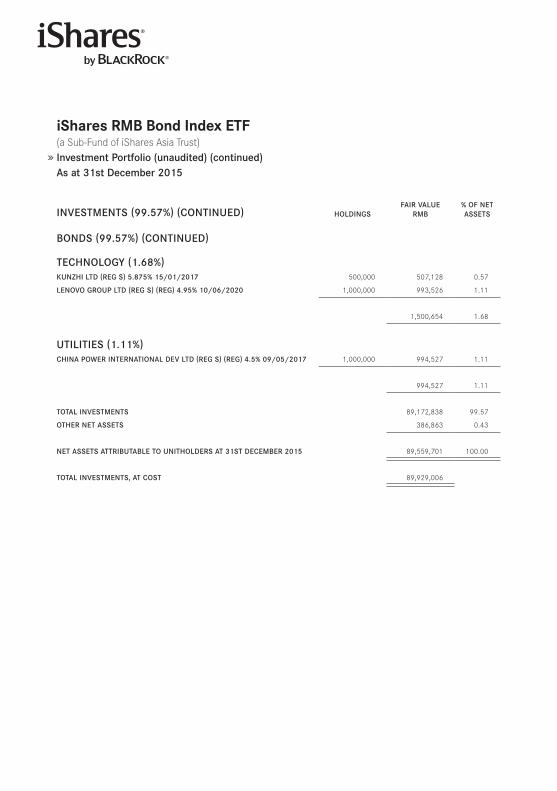
iShares RMB Bond index eTf (a Sub-Fund of iShares Asia Trust) Investment Portfolio (unaudited) (continued)As at 31st December 2015
INVESTMENTS (99.57%) (CoNTINUED) HolDINgSFAIR VAlUE
RMB% oF NET ASSETS
BoNDS (99.57%) (CoNTINUED)
TECHNology (1.68%)KUNzHI lTD (REg S) 5.875% 15/01/2017 500,000 507,128 0 .57
lENoVo gRoUP lTD (REg S) (REg) 4.95% 10/06/2020 1,000,000 993,526 1 .11
1,500,654 1 .68
UTIlITIES (1.11%)CHINA PowER INTERNATIoNAl DEV lTD (REg S) (REg) 4.5% 09/05/2017 1,000,000 994,527 1 .11
994,527 1 .11
ToTAl INVESTMENTS 89,172,838 99 .57
oTHER NET ASSETS 386,863 0 .43
NET ASSETS ATTRIBUTABlE To UNITHolDERS AT 31ST DECEMBER 2015 89,559,701 100 .00
ToTAl INVESTMENTS, AT CoST 89,929,006
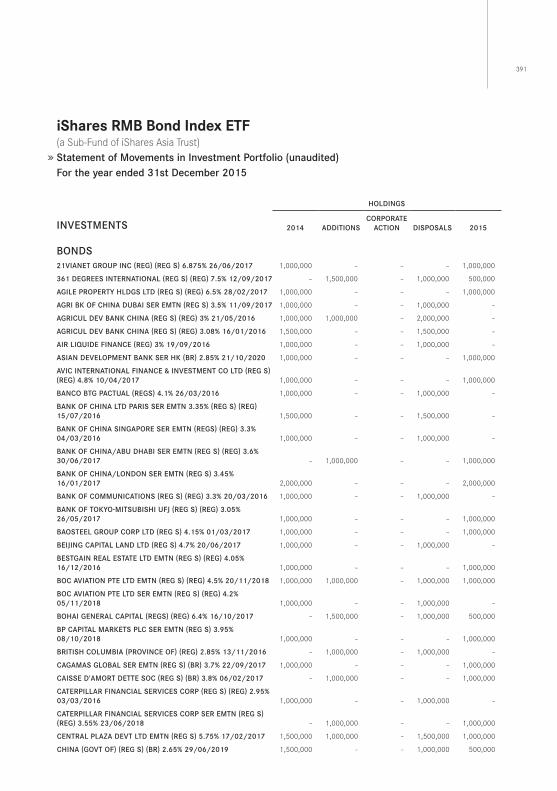
391
iShares RMB Bond index eTf (a Sub-Fund of iShares Asia Trust) Statement of Movements in Investment Portfolio (unaudited)For the year ended 31st December 2015
HolDINgS
INVESTMENTS 2014 ADDITIoNSCoRPoRATE
ACTIoN DISPoSAlS 2015
BoNDS21VIANET gRoUP INC (REg) (REg S) 6.875% 26/06/2017 1,000,000 – – – 1,000,000
361 DEgREES INTERNATIoNAl (REg S) (REg) 7.5% 12/09/2017 – 1,500,000 – 1,000,000 500,000
AgIlE PRoPERTy HlDgS lTD (REg S) (REg) 6.5% 28/02/2017 1,000,000 – – – 1,000,000
AgRI BK oF CHINA DUBAI SER EMTN (REg S) 3.5% 11/09/2017 1,000,000 – – 1,000,000 –
AgRICUl DEV BANK CHINA (REg S) (REg) 3% 21/05/2016 1,000,000 1,000,000 – 2,000,000 –
AgRICUl DEV BANK CHINA (REg S) (REg) 3.08% 16/01/2016 1,500,000 – – 1,500,000 –
AIR lIqUIDE FINANCE (REg) 3% 19/09/2016 1,000,000 – – 1,000,000 –
ASIAN DEVEloPMENT BANK SER HK (BR) 2.85% 21/10/2020 1,000,000 – – – 1,000,000
AVIC INTERNATIoNAl FINANCE ﹠ INVESTMENT Co lTD (REg S) (REg) 4.8% 10/04/2017 1,000,000 – – – 1,000,000
BANCo BTg PACTUAl (REgS) 4.1% 26/03/2016 1,000,000 – – 1,000,000 –
BANK oF CHINA lTD PARIS SER EMTN 3.35% (REg S) (REg) 15/07/2016 1,500,000 – – 1,500,000 –
BANK oF CHINA SINgAPoRE SER EMTN (REgS) (REg) 3.3% 04/03/2016 1,000,000 – – 1,000,000 –
BANK oF CHINA/ABU DHABI SER EMTN (REg S) (REg) 3.6% 30/06/2017 – 1,000,000 – – 1,000,000
BANK oF CHINA/loNDoN SER EMTN (REg S) 3.45% 16/01/2017 2,000,000 – – – 2,000,000
BANK oF CoMMUNICATIoNS (REg S) (REg) 3.3% 20/03/2016 1,000,000 – – 1,000,000 –
BANK oF ToKyo-MITSUBISHI UFJ (REg S) (REg) 3.05% 26/05/2017 1,000,000 – – – 1,000,000
BAoSTEEl gRoUP CoRP lTD (REg S) 4.15% 01/03/2017 1,000,000 – – – 1,000,000
BEIJINg CAPITAl lAND lTD (REg S) 4.7% 20/06/2017 1,000,000 – – 1,000,000 –
BESTgAIN REAl ESTATE lTD EMTN (REg S) (REg) 4.05% 16/12/2016 1,000,000 – – – 1,000,000
BoC AVIATIoN PTE lTD EMTN (REg S) (REg) 4.5% 20/11/2018 1,000,000 1,000,000 – 1,000,000 1,000,000
BoC AVIATIoN PTE lTD SER EMTN (REg S) (REg) 4.2% 05/11/2018 1,000,000 – – 1,000,000 –
BoHAI gENERAl CAPITAl (REgS) (REg) 6.4% 16/10/2017 – 1,500,000 – 1,000,000 500,000
BP CAPITAl MARKETS PlC SER EMTN (REg S) 3.95% 08/10/2018 1,000,000 – – – 1,000,000
BRITISH ColUMBIA (PRoVINCE oF) (REg) 2.85% 13/11/2016 – 1,000,000 – 1,000,000 –
CAgAMAS gloBAl SER EMTN (REg S) (BR) 3.7% 22/09/2017 1,000,000 – – – 1,000,000
CAISSE D’AMoRT DETTE SoC (REg S) (BR) 3.8% 06/02/2017 – 1,000,000 – – 1,000,000
CATERPIllAR FINANCIAl SERVICES CoRP (REg S) (REg) 2.95% 03/03/2016 1,000,000 – – 1,000,000 –
CATERPIllAR FINANCIAl SERVICES CoRP SER EMTN (REg S) (REg) 3.55% 23/06/2018 – 1,000,000 – – 1,000,000
CENTRAl PlAzA DEVT lTD EMTN (REg S) 5.75% 17/02/2017 1,500,000 1,000,000 – 1,500,000 1,000,000
CHINA (goVT oF) (REg S) (BR) 2.65% 29/06/2019 1,500,000 – – 1,000,000 500,000
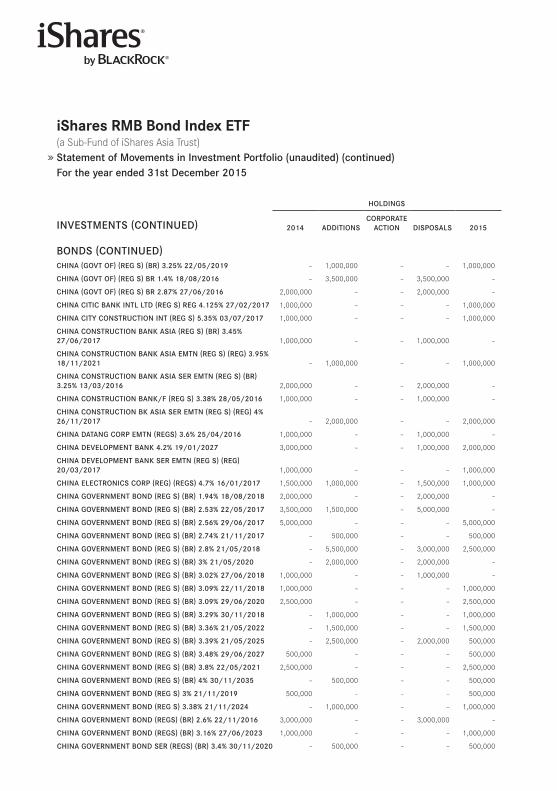
iShares RMB Bond index eTf (a Sub-Fund of iShares Asia Trust) Statement of Movements in Investment Portfolio (unaudited) (continued)For the year ended 31st December 2015
HolDINgS
INVESTMENTS (CoNTINUED) 2014 ADDITIoNSCoRPoRATE
ACTIoN DISPoSAlS 2015
BoNDS (CoNTINUED)CHINA (goVT oF) (REg S) (BR) 3.25% 22/05/2019 – 1,000,000 – – 1,000,000
CHINA (goVT oF) (REg S) BR 1.4% 18/08/2016 – 3,500,000 – 3,500,000 –
CHINA (goVT oF) (REg S) BR 2.87% 27/06/2016 2,000,000 – – 2,000,000 –
CHINA CITIC BANK INTl lTD (REg S) REg 4.125% 27/02/2017 1,000,000 – – – 1,000,000
CHINA CITy CoNSTRUCTIoN INT (REg S) 5.35% 03/07/2017 1,000,000 – – – 1,000,000
CHINA CoNSTRUCTIoN BANK ASIA (REg S) (BR) 3.45% 27/06/2017 1,000,000 – – 1,000,000 –
CHINA CoNSTRUCTIoN BANK ASIA EMTN (REg S) (REg) 3.95% 18/11/2021 – 1,000,000 – – 1,000,000
CHINA CoNSTRUCTIoN BANK ASIA SER EMTN (REg S) (BR) 3.25% 13/03/2016 2,000,000 – – 2,000,000 –
CHINA CoNSTRUCTIoN BANK/F (REg S) 3.38% 28/05/2016 1,000,000 – – 1,000,000 –
CHINA CoNSTRUCTIoN BK ASIA SER EMTN (REg S) (REg) 4% 26/11/2017 – 2,000,000 – – 2,000,000
CHINA DATANg CoRP EMTN (REgS) 3.6% 25/04/2016 1,000,000 – – 1,000,000 –
CHINA DEVEloPMENT BANK 4.2% 19/01/2027 3,000,000 – – 1,000,000 2,000,000
CHINA DEVEloPMENT BANK SER EMTN (REg S) (REg) 20/03/2017 1,000,000 – – – 1,000,000
CHINA ElECTRoNICS CoRP (REg) (REgS) 4.7% 16/01/2017 1,500,000 1,000,000 – 1,500,000 1,000,000
CHINA goVERNMENT BoND (REg S) (BR) 1.94% 18/08/2018 2,000,000 – – 2,000,000 –
CHINA goVERNMENT BoND (REg S) (BR) 2.53% 22/05/2017 3,500,000 1,500,000 – 5,000,000 –
CHINA goVERNMENT BoND (REg S) (BR) 2.56% 29/06/2017 5,000,000 – – – 5,000,000
CHINA goVERNMENT BoND (REg S) (BR) 2.74% 21/11/2017 – 500,000 – – 500,000
CHINA goVERNMENT BoND (REg S) (BR) 2.8% 21/05/2018 – 5,500,000 – 3,000,000 2,500,000
CHINA goVERNMENT BoND (REg S) (BR) 3% 21/05/2020 – 2,000,000 – 2,000,000 –
CHINA goVERNMENT BoND (REg S) (BR) 3.02% 27/06/2018 1,000,000 – – 1,000,000 –
CHINA goVERNMENT BoND (REg S) (BR) 3.09% 22/11/2018 1,000,000 – – – 1,000,000
CHINA goVERNMENT BoND (REg S) (BR) 3.09% 29/06/2020 2,500,000 – – – 2,500,000
CHINA goVERNMENT BoND (REg S) (BR) 3.29% 30/11/2018 – 1,000,000 – – 1,000,000
CHINA goVERNMENT BoND (REg S) (BR) 3.36% 21/05/2022 – 1,500,000 – – 1,500,000
CHINA goVERNMENT BoND (REg S) (BR) 3.39% 21/05/2025 – 2,500,000 – 2,000,000 500,000
CHINA goVERNMENT BoND (REg S) (BR) 3.48% 29/06/2027 500,000 – – – 500,000
CHINA goVERNMENT BoND (REg S) (BR) 3.8% 22/05/2021 2,500,000 – – – 2,500,000
CHINA goVERNMENT BoND (REg S) (BR) 4% 30/11/2035 – 500,000 – – 500,000
CHINA goVERNMENT BoND (REg S) 3% 21/11/2019 500,000 – – – 500,000
CHINA goVERNMENT BoND (REg S) 3.38% 21/11/2024 – 1,000,000 – – 1,000,000
CHINA goVERNMENT BoND (REgS) (BR) 2.6% 22/11/2016 3,000,000 – – 3,000,000 –
CHINA goVERNMENT BoND (REgS) (BR) 3.16% 27/06/2023 1,000,000 – – – 1,000,000
CHINA goVERNMENT BoND SER (REgS) (BR) 3.4% 30/11/2020 – 500,000 – – 500,000
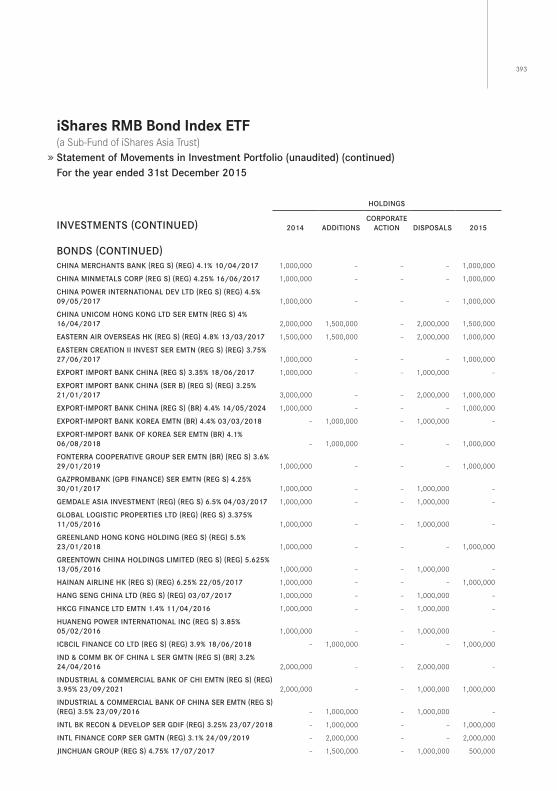
393
iShares RMB Bond index eTf (a Sub-Fund of iShares Asia Trust) Statement of Movements in Investment Portfolio (unaudited) (continued)For the year ended 31st December 2015
HolDINgS
INVESTMENTS (CoNTINUED) 2014 ADDITIoNSCoRPoRATE
ACTIoN DISPoSAlS 2015
BoNDS (CoNTINUED)CHINA MERCHANTS BANK (REg S) (REg) 4.1% 10/04/2017 1,000,000 – – – 1,000,000
CHINA MINMETAlS CoRP (REg S) (REg) 4.25% 16/06/2017 1,000,000 – – – 1,000,000
CHINA PowER INTERNATIoNAl DEV lTD (REg S) (REg) 4.5% 09/05/2017 1,000,000 – – – 1,000,000
CHINA UNICoM HoNg KoNg lTD SER EMTN (REg S) 4% 16/04/2017 2,000,000 1,500,000 – 2,000,000 1,500,000
EASTERN AIR oVERSEAS HK (REg S) (REg) 4.8% 13/03/2017 1,500,000 1,500,000 – 2,000,000 1,000,000
EASTERN CREATIoN II INVEST SER EMTN (REg S) (REg) 3.75% 27/06/2017 1,000,000 – – – 1,000,000
EXPoRT IMPoRT BANK CHINA (REg S) 3.35% 18/06/2017 1,000,000 – – 1,000,000 –
EXPoRT IMPoRT BANK CHINA (SER B) (REg S) (REg) 3.25% 21/01/2017 3,000,000 – – 2,000,000 1,000,000
EXPoRT-IMPoRT BANK CHINA (REg S) (BR) 4.4% 14/05/2024 1,000,000 – – – 1,000,000
EXPoRT-IMPoRT BANK KoREA EMTN (BR) 4.4% 03/03/2018 – 1,000,000 – 1,000,000 –
EXPoRT-IMPoRT BANK oF KoREA SER EMTN (BR) 4.1% 06/08/2018 – 1,000,000 – – 1,000,000
FoNTERRA CooPERATIVE gRoUP SER EMTN (BR) (REg S) 3.6% 29/01/2019 1,000,000 – – – 1,000,000
gAzPRoMBANK (gPB FINANCE) SER EMTN (REg S) 4.25% 30/01/2017 1,000,000 – – 1,000,000 –
gEMDAlE ASIA INVESTMENT (REg) (REg S) 6.5% 04/03/2017 1,000,000 – – 1,000,000 –
gloBAl logISTIC PRoPERTIES lTD (REg) (REg S) 3.375% 11/05/2016 1,000,000 – – 1,000,000 –
gREENlAND HoNg KoNg HolDINg (REg S) (REg) 5.5% 23/01/2018 1,000,000 – – – 1,000,000
gREENTowN CHINA HolDINgS lIMITED (REg S) (REg) 5.625% 13/05/2016 1,000,000 – – 1,000,000 –
HAINAN AIRlINE HK (REg S) (REg) 6.25% 22/05/2017 1,000,000 – – – 1,000,000
HANg SENg CHINA lTD (REg S) (REg) 03/07/2017 1,000,000 – – 1,000,000 –
HKCg FINANCE lTD EMTN 1.4% 11/04/2016 1,000,000 – – 1,000,000 –
HUANENg PowER INTERNATIoNAl INC (REg S) 3.85% 05/02/2016 1,000,000 – – 1,000,000 –
ICBCIl FINANCE Co lTD (REg S) (REg) 3.9% 18/06/2018 – 1,000,000 – – 1,000,000
IND ﹠ CoMM BK oF CHINA l SER gMTN (REg S) (BR) 3.2% 24/04/2016 2,000,000 – – 2,000,000 –
INDUSTRIAl ﹠ CoMMERCIAl BANK oF CHI EMTN (REg S) (REg) 3.95% 23/09/2021 2,000,000 – – 1,000,000 1,000,000
INDUSTRIAl ﹠ CoMMERCIAl BANK oF CHINA SER EMTN (REg S) (REg) 3.5% 23/09/2016 – 1,000,000 – 1,000,000 –
INTl BK RECoN ﹠ DEVEloP SER gDIF (REg) 3.25% 23/07/2018 – 1,000,000 – – 1,000,000
INTl FINANCE CoRP SER gMTN (REg) 3.1% 24/09/2019 – 2,000,000 – – 2,000,000
JINCHUAN gRoUP (REg S) 4.75% 17/07/2017 – 1,500,000 – 1,000,000 500,000
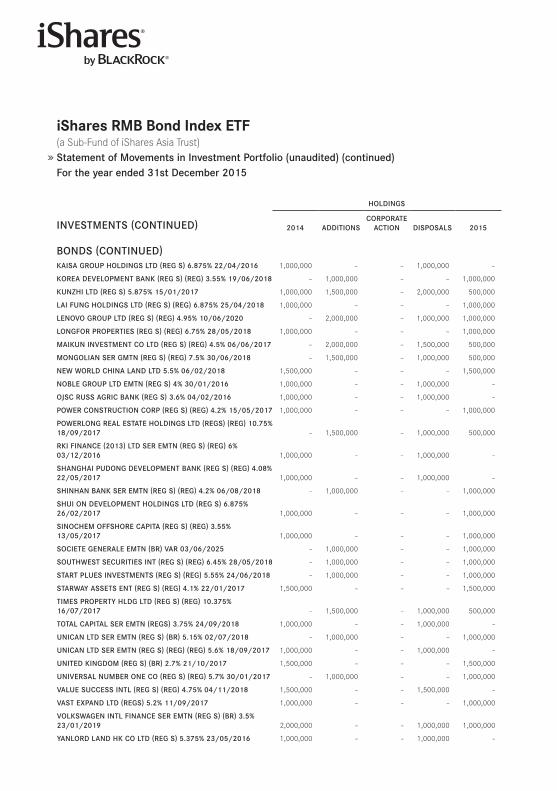
iShares RMB Bond index eTf (a Sub-Fund of iShares Asia Trust) Statement of Movements in Investment Portfolio (unaudited) (continued)For the year ended 31st December 2015
HolDINgS
INVESTMENTS (CoNTINUED) 2014 ADDITIoNSCoRPoRATE
ACTIoN DISPoSAlS 2015
BoNDS (CoNTINUED)KAISA gRoUP HolDINgS lTD (REg S) 6.875% 22/04/2016 1,000,000 – – 1,000,000 –
KoREA DEVEloPMENT BANK (REg S) (REg) 3.55% 19/06/2018 – 1,000,000 – – 1,000,000
KUNzHI lTD (REg S) 5.875% 15/01/2017 1,000,000 1,500,000 – 2,000,000 500,000
lAI FUNg HolDINgS lTD (REg S) (REg) 6.875% 25/04/2018 1,000,000 – – – 1,000,000
lENoVo gRoUP lTD (REg S) (REg) 4.95% 10/06/2020 – 2,000,000 – 1,000,000 1,000,000
loNgFoR PRoPERTIES (REg S) (REg) 6.75% 28/05/2018 1,000,000 – – – 1,000,000
MAIKUN INVESTMENT Co lTD (REg S) (REg) 4.5% 06/06/2017 – 2,000,000 – 1,500,000 500,000
MoNgolIAN SER gMTN (REg S) (REg) 7.5% 30/06/2018 – 1,500,000 – 1,000,000 500,000
NEw woRlD CHINA lAND lTD 5.5% 06/02/2018 1,500,000 – – – 1,500,000
NoBlE gRoUP lTD EMTN (REg S) 4% 30/01/2016 1,000,000 – – 1,000,000 –
oJSC RUSS AgRIC BANK (REg S) 3.6% 04/02/2016 1,000,000 – – 1,000,000 –
PowER CoNSTRUCTIoN CoRP (REg S) (REg) 4.2% 15/05/2017 1,000,000 – – – 1,000,000
PowERloNg REAl ESTATE HolDINgS lTD (REgS) (REg) 10.75% 18/09/2017 – 1,500,000 – 1,000,000 500,000
RKI FINANCE (2013) lTD SER EMTN (REg S) (REg) 6% 03/12/2016 1,000,000 – – 1,000,000 –
SHANgHAI PUDoNg DEVEloPMENT BANK (REg S) (REg) 4.08% 22/05/2017 1,000,000 – – 1,000,000 –
SHINHAN BANK SER EMTN (REg S) (REg) 4.2% 06/08/2018 – 1,000,000 – – 1,000,000
SHUI oN DEVEloPMENT HolDINgS lTD (REg S) 6.875% 26/02/2017 1,000,000 – – – 1,000,000
SINoCHEM oFFSHoRE CAPITA (REg S) (REg) 3.55% 13/05/2017 1,000,000 – – – 1,000,000
SoCIETE gENERAlE EMTN (BR) VAR 03/06/2025 – 1,000,000 – – 1,000,000
SoUTHwEST SECURITIES INT (REg S) (REg) 6.45% 28/05/2018 – 1,000,000 – – 1,000,000
START PlUES INVESTMENTS (REg S) (REg) 5.55% 24/06/2018 – 1,000,000 – – 1,000,000
STARwAy ASSETS ENT (REg S) (REg) 4.1% 22/01/2017 1,500,000 – – – 1,500,000
TIMES PRoPERTy HlDg lTD (REg S) (REg) 10.375% 16/07/2017 – 1,500,000 – 1,000,000 500,000
ToTAl CAPITAl SER EMTN (REgS) 3.75% 24/09/2018 1,000,000 – – 1,000,000 –
UNICAN lTD SER EMTN (REg S) (BR) 5.15% 02/07/2018 – 1,000,000 – – 1,000,000
UNICAN lTD SER EMTN (REg S) (REg) (REg) 5.6% 18/09/2017 1,000,000 – – 1,000,000 –
UNITED KINgDoM (REg S) (BR) 2.7% 21/10/2017 1,500,000 – – – 1,500,000
UNIVERSAl NUMBER oNE Co (REg S) (REg) 5.7% 30/01/2017 – 1,000,000 – – 1,000,000
VAlUE SUCCESS INTl (REg S) (REg) 4.75% 04/11/2018 1,500,000 – – 1,500,000 –
VAST EXPAND lTD (REgS) 5.2% 11/09/2017 1,000,000 – – – 1,000,000
VolKSwAgEN INTl FINANCE SER EMTN (REg S) (BR) 3.5% 23/01/2019 2,000,000 – – 1,000,000 1,000,000
yANloRD lAND HK Co lTD (REg S) 5.375% 23/05/2016 1,000,000 – – 1,000,000 –
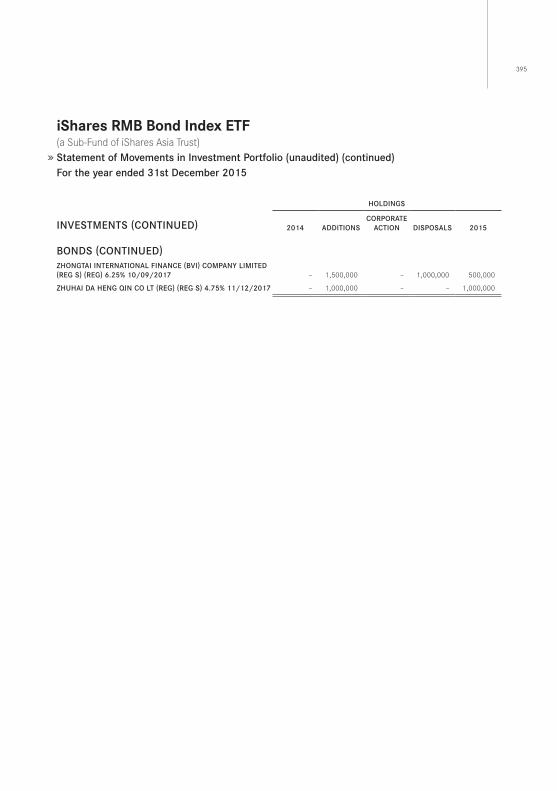
395
iShares RMB Bond index eTf (a Sub-Fund of iShares Asia Trust) Statement of Movements in Investment Portfolio (unaudited) (continued)For the year ended 31st December 2015
HolDINgS
INVESTMENTS (CoNTINUED) 2014 ADDITIoNSCoRPoRATE
ACTIoN DISPoSAlS 2015
BoNDS (CoNTINUED)zHoNgTAI INTERNATIoNAl FINANCE (BVI) CoMPANy lIMITED (REg S) (REg) 6.25% 10/09/2017 – 1,500,000 – 1,000,000 500,000
zHUHAI DA HENg qIN Co lT (REg) (REg S) 4.75% 11/12/2017 – 1,000,000 – – 1,000,000
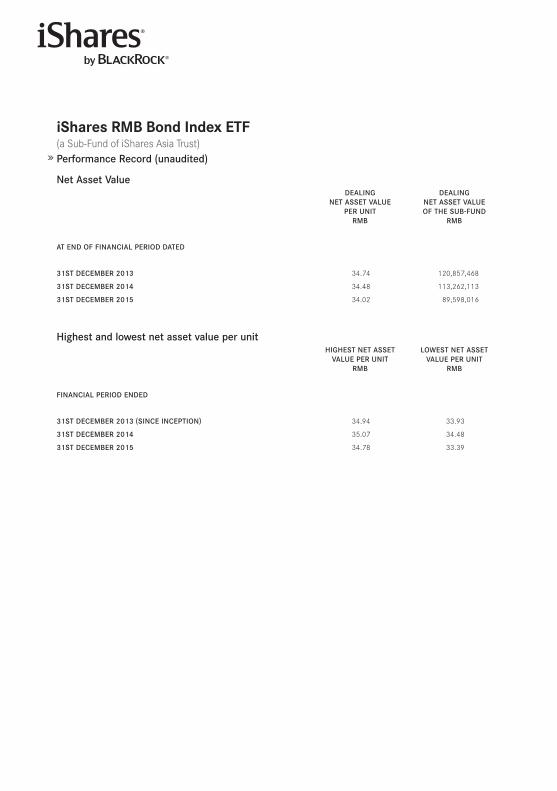
iShares RMB Bond index eTf (a Sub-Fund of iShares Asia Trust) Performance Record (unaudited)
Net Asset ValueDEAlINg
NET ASSET VAlUE PER UNIT
RMB
DEAlINgNET ASSET VAlUE oF THE SUB-FUND
RMB
AT END oF FINANCIAl PERIoD DATED
31ST DECEMBER 2013 34 .74 120,857,468
31ST DECEMBER 2014 34 .48 113,262,113
31ST DECEMBER 2015 34 .02 89,598,016
Highest and lowest net asset value per unitHIgHEST NET ASSET
VAlUE PER UNITRMB
lowEST NET ASSETVAlUE PER UNIT
RMB
FINANCIAl PERIoD ENDED
31ST DECEMBER 2013 (SINCE INCEPTIoN) 34 .94 33 .93
31ST DECEMBER 2014 35 .07 34 .48
31ST DECEMBER 2015 34 .78 33 .39
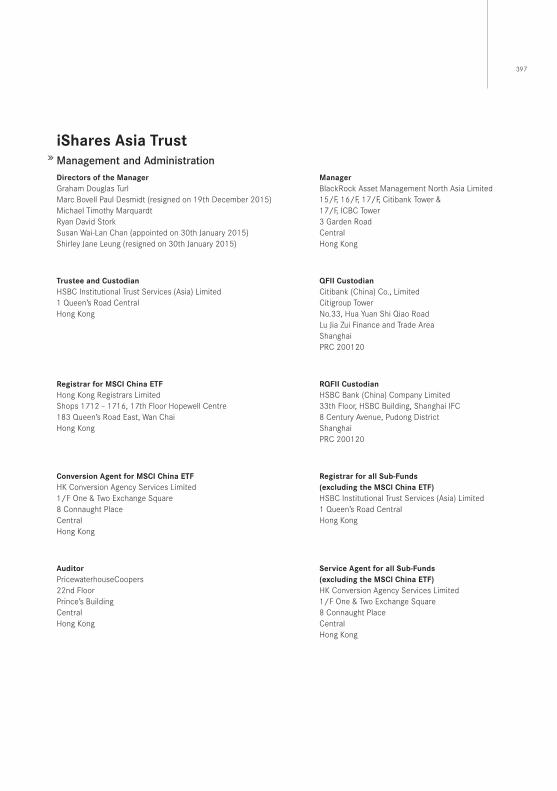
397
iShares Asia Trust Management and Administrationdirectors of the ManagerGraham Douglas Turl Marc Bovell Paul Desmidt (resigned on 19th December 2015)Michael Timothy MarquardtRyan David Stork Susan Wai-Lan Chan (appointed on 30th January 2015)Shirley Jane Leung (resigned on 30th January 2015)
ManagerBlackRock Asset Management North Asia Limited15/F, 16/F, 17/F, Citibank Tower &17/F, ICBC Tower3 Garden RoadCentralHong Kong
Trustee and CustodianHSBC Institutional Trust Services (Asia) Limited1 Queen’s Road CentralHong Kong
Qfii CustodianCitibank (China) Co ., LimitedCitigroup TowerNo .33, Hua Yuan Shi Qiao RoadLu Jia zui Finance and Trade AreaShanghaiPRC 200120
Registrar for MSCi China eTfHong Kong Registrars LimitedShops 1712 – 1716, 17th Floor Hopewell Centre183 Queen’s Road East, Wan ChaiHong Kong
RQfii CustodianHSBC Bank (China) Company Limited33th Floor, HSBC Building, Shanghai IFC8 Century Avenue, Pudong DistrictShanghaiPRC 200120
Conversion Agent for MSCi China eTfHK Conversion Agency Services Limited1/F One & Two Exchange Square8 Connaught PlaceCentralHong Kong
Registrar for all Sub-funds (excluding the MSCi China eTf)HSBC Institutional Trust Services (Asia) Limited1 Queen’s Road CentralHong Kong
Auditor PricewaterhouseCoopers22nd Floor Prince’s BuildingCentralHong Kong
Service Agent for all Sub-funds (excluding the MSCi China eTf)HK Conversion Agency Services Limited1/F One & Two Exchange Square8 Connaught PlaceCentralHong Kong
This page is intentionally left blank
2015 AnnuAl RepoRt
iShares MSCI China Index etF
iShares FtSe A50 China Index etF* (*this is a synthetic etF)
iShares S&p BSe SenSeX India Index etF
iShares MSCI AC Asia ex Japan Index etF (formerly known as iShares MSCI Asia ApeX 50 Index etF)
iShares MSCI emerging Asia Index etF
iShares CSI 300 A-Share Index etF* (*this is a synthetic etF)
iShares CSI A-Share energy Index etF* (*this is a synthetic etF)
iShares CSI A-Share Materials Index etF* (*this is a synthetic etF)
iShares CSI A-Share Financials Index etF* (*this is a synthetic etF)
iShares CSI A-Share Infrastructure Index etF* (*this is a synthetic etF)
iShares CSI A-Share Consumer Discretionary Index etF* (*this is a synthetic etF)
iShares CSI A-Share Consumer Staples Index etF* (*this is a synthetic etF)
iShares RMB Bond Index etF
(Sub-funds of iShares Asia Trust)
December 31, 2015
2015 An
nu
Al R
ep
oR
t
D
ecem
ber 31, 2
015
Related Documents