Traffic Data Report for the Illinois Tollway System 2014

Welcome message from author
This document is posted to help you gain knowledge. Please leave a comment to let me know what you think about it! Share it to your friends and learn new things together.
Transcript

Traffic Data Reportfor the Illinois Tollway System2014


Prepared by:
2014


Illinois Tollway 2014 Traffic Data Report
SECTION 1: THE ILLINOIS TOLLWAY SYSTEM SECTION 2: JANE ADDAMS MEMORIAL TOLLWAY SECTION 3: TRI-STATE TOLLWAY SECTION 4: REAGAN MEMORIAL TOLLWAY SECTION 5: VETERANS MEMORIAL TOLLWAY APPENDICES:
APPENDIX – A: 2014 SYSTEMWIDE ANNUAL AVERAGE DAILY
TRAFFIC SCHEMATICS APPENDIX – B: 2014 SYSTEMWIDE AM AND PM PEAK HOUR
TRAFFIC SCHEMATICS APPENDIX – C: 2014 LANE CONFIGURATION SCHEMATICS APPENDIX – D: PLAZA LANE LISTING
(Please refer to individual sections for detailed Table of Contents)
C O N T E N T S


2014
The Illinois Tollway System
Section 1 The Illinois Tollw
ay System

The Tollway System
1-1
Illinois Tollway 2014 Traffic Data Report
General Information 1-2 TABULATIONS TABLE PAGE
1-A Systemwide Average Daily Traffic Data 1-7
1-B Annual Traffic Totals 1-8
1-C Average Daily Traffic Totals 1-8
1-D Systemwide Monthly Factors 1-8
1-E Annual Transactions by Vehicle 2013-2014 1-9
1-F I-PASS Participation Rate 2013-2014 1-9
1-G History of Tollway Additions by Mileage 1959 - 2014 1-10
1-H History of Tollway Additions by Location 1959 - 2014 1-11
1-I Summary of Traffic Characteristics at Plazas (Annual Transactions) 1-14
ILLUSTRATIONS FIGURE PAGE
1-A The Illinois Tollway System 2014 1-16
1-B Average Daily Traffic 2014 1-17
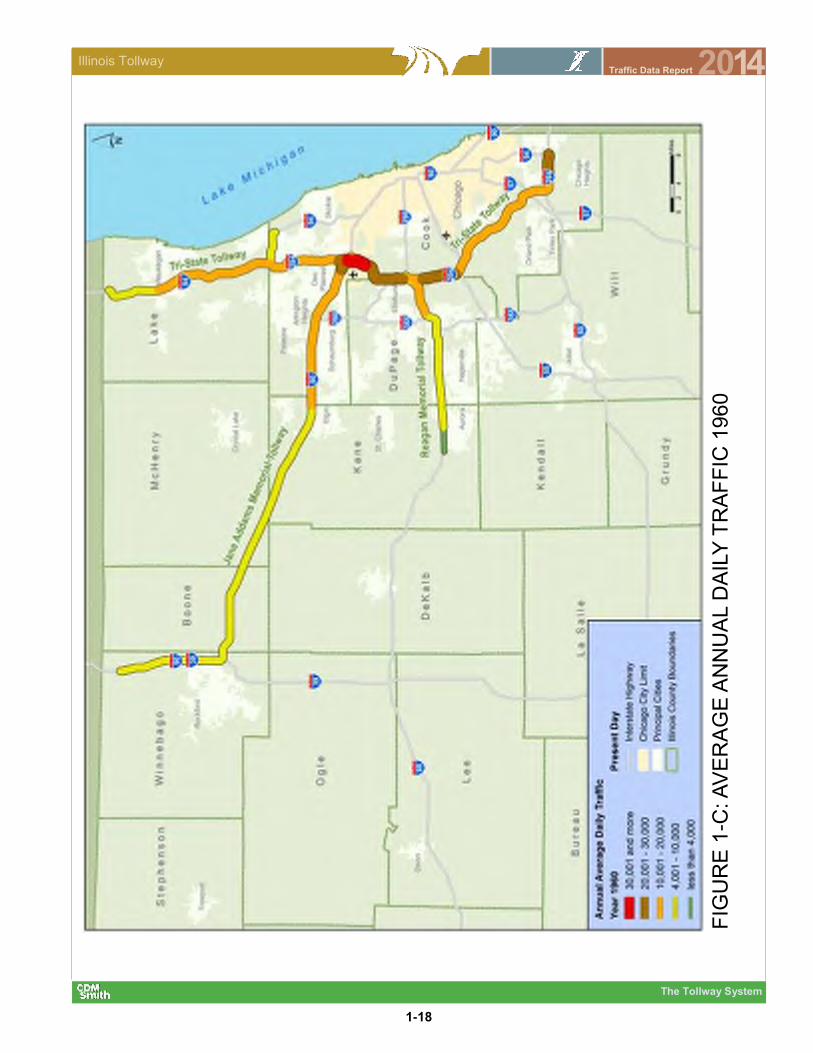
1-C Average Daily Traffic 1960 1-18
1-D Annual Average Percentage Change in Daily Traffic Volumes
2000 - 2014 1-19
1-E Annual Average Percentage Change in Daily Traffic Volumes
2010 - 2014 1-20
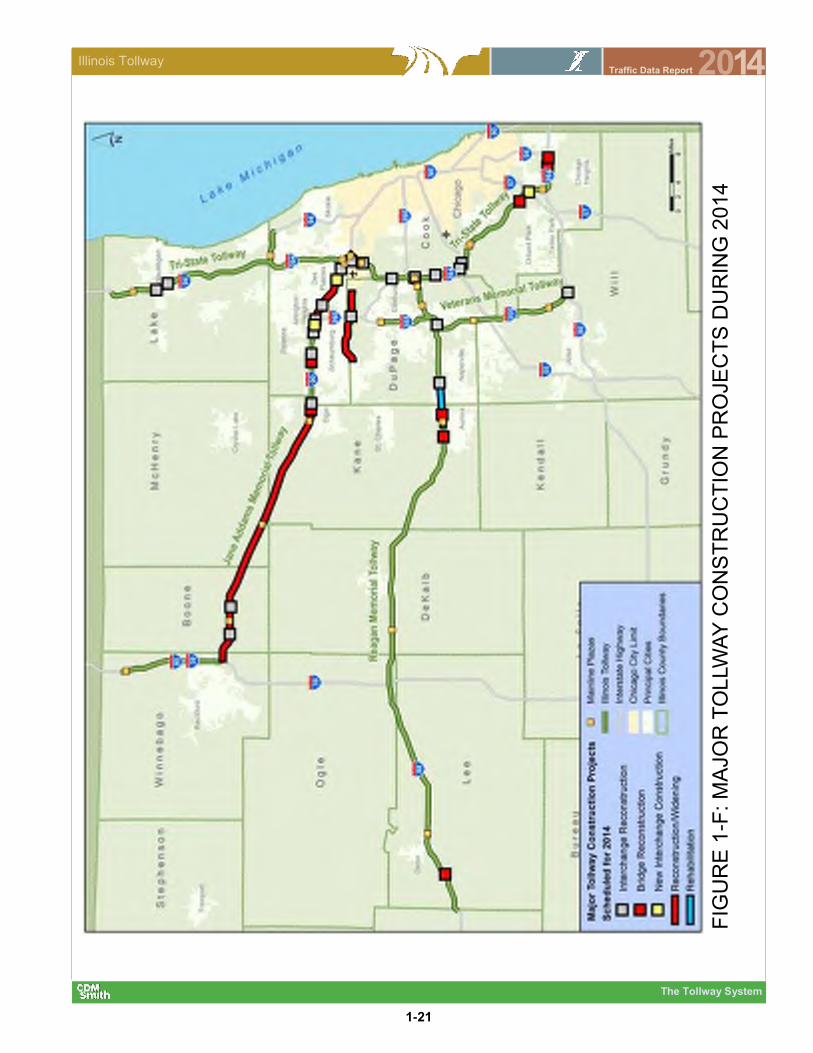
1-F Major Tollway Construction Projects During 2014 1-21
1-G Major Off-Tollway Construction Projects During 2014 1-22
SECTION 1 The Illinois Tollway System
1-2
The Tollway System
Illinois Tollway 2014 Traffic Data Report
GENERAL INFORMATION
The 2014 Traffic Data Report is intended to provide a snapshot of the average traffic
conditions throughout the Tollway system for the year 2014. The primary sources of
information for the development of this report are:
Toll plaza transaction data
Non-tolled ramp sample traffic counts
Physical configuration of the Tollway system and connections to other routes
Historical traffic data for the Tollway system.
The traffic volumes presented in this report for each link of the system are primarily based
on toll plaza transaction data. The data were extracted from the Electronic Transaction
Consultants’ Traffic Activity by Class Report and Hourly Traffic Volume Report run on
January 23, 2015. Since transaction data is essentially continuous, accurate annual
average daily traffic (AADT) and peak hour traffic volumes may be determined at
mainline toll plazas and at tolled ramps. To obtain AADT and peak volumes in
intermediate mainline segments and on non-tolled ramps, transaction data is
supplemented by sample traffic counts conducted at non-tolled ramps. These sample
counts are converted to AADT and peak volumes using seasonal adjustment factors and
a balancing algorithm that adjusts non-toll ramp counts so that all mainline volumes are
consistent with ramp exiting and entering volumes. The AADT and peak traffic estimates
are then validated using historical trends and data.
Conditions influencing local traffic flow frequently cause traffic volumes to vary from
historical trends. While major traffic incidents or weather events can have a significant
impact on the traffic on a particular day, use of annual averages tends to diminish these
types of impacts. On the other hand, some events can have an effect on typical traffic
volumes on a long-term basis. One such event was the passenger car toll rate change
that took effect in 2012.
In 2011, the Tollway approved the $12 billion Move Illinois capital program. To fund the
program, passenger car rates were increased 87.5 percent on January 1, 2012 for both
cash and I-PASS users. Systemwide, passenger car transactions declined 4.2 percent from
2011, largely due to the toll increase. Passenger car transactions increased by 1.2 percent
in 2013, and a further 2.3 percent in 2014, finally surpassing pre-toll increase totals.
Any reconfiguration of the Tollway system, such as a new interchange or major capacity
improvement, will have a permanent impact on traffic patterns. Additionally, major
construction projects extend over many months and are likely to cause a reduction in
average traffic volumes on that route and increases in volumes on parallel routes. Most
notably, traffic on the western Jane Addams Memorial Tollway dropped while undergoing
major construction in 2014 and leading to an increase in traffic on the western portion of
the Reagan Memorial Tollway.
1-3
The Tollway System
Illinois Tollway 2014 Traffic Data Report
The following sections of the Illinois Tollway were under construction during 2014:
ILLINOIS TOLLWAY SYSTEM
Jane Addams Memorial Tollway (I-90/39)
Reconstruction/Widening – I-39 to Elgin
Reconstruction/Widening – Elgin to Kennedy Expressway
Interchange Reconstruction – Irene Road
Bridge and Interchange Reconstruction – Genoa Road
Bridge Reconstruction – Fox River Bridge
Interchange Reconstruction – Illinois Route 25
Bridge Reconstruction – Higgins Road (Illinois Route 72)
Interchange Reconstruction – Barrington Road
Interchange Reconstruction – Roselle Road
Interchange Reconstruction – Meacham Road
Ramp Toll Plaza Reconstruction – Illinois Route 53
Ramp Toll Plaza Reconstruction – Arlington Heights Road
Interchange Reconstruction – Elmhurst Road
Interchange Reconstruction – Lee Street (Illinois Route 72)
Ramp Toll Plaza Reconstruction – O’Hare Plaza 31
Tri-State Tollway (I-94/294/80)
Interchange Improvements – Grand Avenue (Illinois Route 132)
Interchange Improvements – Belvidere Road (Illinois Route 120)
Interchange Repairs – Irving Park Road, I-290, Roosevelt Road, Ogden Avenue,
75th Street, I-55
Interchange Construction – I-57 and 147th Street
Bridge Repairs – Midlothian Turnpike, CSX Railroad Bridge, Thornton Quarry, and
Thorn Creek
Reagan Memorial Tollway (I-88)
Roadway Rehabilitation – Aurora Toll Plaza to Illinois Route 59
Bridge Repairs – Harmon Road, Randall Road, and Church Road
Veterans Memorial Tollway (I-355)
Ramp Repairs – I-80 and I-88
Elgin O’Hare Expressway (I-390)
Rehabilitation/Widening – Lake Street (U.S. Route 20) to Meacham Road
New Construction – Meacham Road to Illinois Route 83
Interchange Reconstruction – I-290
Off-system construction projects in the Tollway service area, particularly those on the
expressway system, can also have a significant impact on Tollway traffic volumes. During
2014, construction projects with the potential to impact traffic on the Tollway system
included the following:
IDOT EXPRESSWAY SYSTEM
I-55 – Interchange Improvement – County Line Road
I-55 – Interchange Reconfiguration – Arsenal Road
I-55 – Interchange Improvement – Illinois Route 171

1-4
The Tollway System
Illinois Tollway 2014 Traffic Data Report
I-57 – Interchange Construction – I-294
I-90/94 – Bridge Replacement and Rehabilitation – Ohio Street
I-94 – Interchange Reconfiguration – Stony Island Avenue
ARTERIALS
Illinois Route 19 – Reconstruction/Realignment – York Road to Taft Avenue,
Bensenville
U.S. Routes 12/45 (Mannheim Road) – Reconstruction/Widening – Illinois Route 19 to
Illinois Route 72
U.S. Route 20 – Interchange Reconstruction – McLean Boulevard, Elgin
Willow Road – Reconstruction/Widening – Illinois Route 43 to I-94, Northfield
Barrington Road – Pavement Repairs - U.S. Route 20 to Schaumburg Road, Hanover
Park
Illinois Route 173 – Reconstruction – Illinois Route 251 to I-90, Machesney Park
Illinois Route 43 (Waukegan Road) – Resurfacing – Lake Cook Road to Deerfield
Road and Illinois Route 22 (Half Day Road) to North Avenue, Deerfield
Illinois Route 59 – Reconstruction/Widening – New York Street to Ferry Road, Aurora
Illinois Route 83 – Resurfacing – Illinois Route 19 to Illinois Route 72, Bensenville
Torrence Avenue – Reconstruction – 130th Street to 126th Street, Chicago
U.S. Route 12 – Resurfacing – Ela Road to Lake Cook Road, Lake Zurich
U.S. Route 14 – Reconstruction/Widening – Crystal Lake Avenue to Lake Shore Drive,
Crystal Lake
U.S Route 45 – Reconstruction/Widening – 131st Street to 179th Street, Cook County
Cumberland Avenue – Bridge Replacement – I-90, Chicago
Illinois Route 38 – Grade Separation over Union Pacific Railroad, Geneva
Illinois Route 53 (Rohlwing Road) – Bridge Construction over Illinois Route 390, Itasca
Illinois Route 137 – Resurfacing – U.S. Route 45 and Illinois Route 83, Grayslake
U.S. Route 30 – Grade Separation over EJ&E/CN Railroad, Lynwood
U.S. Route 30 – Reconstruction/Widening at Illinois Route 31, Kendall and Kane
counties
U.S. Route 34 (Ogden Avenue) – Grade Separation over EJ&E/CN Railroad, Aurora
The listed projects may have caused variations in traffic patterns affecting Tollway traffic
to varying degrees and may be positive or negative. These impacts are not individually
quantified, but serve to illustrate the need for the reader to be cautious when using
average daily or peak hour volumes from a single year.
TRAFFIC DEFINITIONS AS USED HEREIN
Traffic volumes are balanced over the entire system so that mainline and ramp volumes
are consistent along a route; therefore the listed volumes are a precise numerical
average only in locations where there is a toll plaza and complete data is available. Three
types of traffic volumes are provided in this report and are defined below.
Annual Average Daily Traffic (AADT) Volume -- is an approximation of the numerical
average daily traffic volume for each day of 2014.

1-5
The Tollway System
Illinois Tollway 2014 Traffic Data Report
AM Peak Hour Volume -- is an approximation of the 85th percentile hourly traffic volume
in the highest AM hours (6:00-8:00 A.M) on all Mondays through Thursdays in 2014,
excluding holidays.
PM Peak Hour Volume -- is an approximation of the 85th percentile hourly traffic volume
in the highest PM hours (4:00-6:00 P.M.) on all Mondays through Thursdays in 2014,
excluding holidays.
Weekends – consist of Fridays, Saturdays, and Sundays that do not fall on holidays.
ROADWAY PERFORMANCE MEASURES
Roadway performance measures are used to illustrate congestion on the Illinois Tollway
system. Performance measures are tabulated for all weekdays, Monday through Friday,
including holidays. A.M. and P.M. peak hours are defined as 6:00-9:00 A.M. and 4:00-7:00
P.M., respectively, for roadway performance measures. All calculations use actual travel
times from I-PASS transaction data aggregated to the one-hour level. Roadway
performance measure terms are defined below.
Average Travel Time Index – is the ratio of the average peak period travel time to an
off-peak travel time (assumed to have a free-flow speed of 60 mph). For example, a
value of 1.20 means that average peak travel times are 20% longer than off-peak (free
-flow) travel times.
Planning Time Index – is the ratio of the total time needed to ensure 95% on-time arrival
as compared to a free-flow travel time. For example, a value of 1.20 means that a
traveler should budget an additional 4 minute buffer for a 20-minute average peak trip
time to ensure 95% on-time arrival.
Total Delay – is a ratio of additional travel time spent by drivers, above the travel times
required under free-flow conditions, to vehicle-miles traveled (measured in vehicle-
hours/1,000 VMT).
Vehicle-Miles Traveled (VMT) – is the sum of distances traveled by all motor vehicles
within a section of the Illinois Tollway.
Average Daily Delay – is the additional travel time spent by drivers, above the travel
times required under free-flow conditions (measured in vehicle-hours).
Percent Congested Travel – is the ratio of congested vehicle-miles-traveled to total
vehicle-miles-traveled. Congestion is defined as any one-hour time period in which the
actual travel time is greater than the free-flow travel time.
The Tollway system is divided into eleven sections for reporting performance measures.
They are described in the table on the following page.

1-6
The Tollway System
Illinois Tollway 2014 Traffic Data Report
OTHER DEFINITIONS
30th Hourly Volume (30th HV) – is the 30th highest hourly volume occurring at a plaza
during 2014, regardless of day or time.
PC – Passenger Cars. Motorcycles and two-axle, four wheeled vehicles are considered
passenger cars.
CV – Commercial Vehicles. All vehicles with more than four wheels, including
passenger cars towing trailers are considered commercial vehicles.
HOLIDAYS AND DAYS WITH UNCHARACTERISTIC TRAFFIC PATTERNS
Due to differing traffic patterns, major holidays are classified separately from weekdays
and weekends. Additionally, the day immediately preceding some holidays are
considered holidays for the purpose of this report due to their unusual traffic
characteristics. Below is a list of holidays and their dates in 2014.
Section Route
Designation
Beginning
Milepost
Ending
Milepost
Eastern Jane Addams Memorial Tollway I-90 54.6 79.1
Western Jane Addams Memorial Tollway I-90/I-39 2.7 54.6
Northern Tri-State Tollway I-94 1.2 30.0
North Central Tri-State Tollway I-294 40.7 52.8
South Central Tri-State Tollway I-294 24.1 40.7
Southern Tri-State Tollway I-294 0.0 24.1
Eastern Reagan Memorial Tollway I-88 116.8 140.4
Western Reagan Memorial Tollway I-88 44.2 116.8
Northern Veterans Memorial Tollway I-355 22.6 29.8
Central Veterans Memorial Tollway I-355 12.3 22.6
Southern Veterans Memorial Tollway I-355 0.0 12.3
New Years Wednesday, January 1
Memorial Day Friday, May 23
Monday, May 26
Independence Day Friday, July 4
Labor Day Friday, August 29
Monday, September 1
Thanksgiving Wednesday, November 26
Thursday, November 27
Friday, November 28
Christmas Wednesday, December 24
Thursday, December 25
New Years Wednesday, December 31

1-7
The Tollway System
Illinois Tollway 2014 Traffic Data Report
Average Trip
Vehicles Vehicle Miles Transactions Length (miles)
1959 62,321 1,753,465 117,637 28.14
1960 87,358 2,346,638 160,973 26.86
1961 109,731 2,659,991 194,577 24.24
1962 132,668 2,985,415 222,322 22.50
1963 134,818 2,878,143 211,939 21.35
1964 138,876 2,971,427 217,831 21.40
1965 158,170 3,303,069 247,469 20.88
1966 172,263 3,705,230 283,152 21.51
1967 186,379 3,973,250 313,648 21.32
1968 206,449 4,376,634 368,342 21.20
1969 238,245 4,821,981 440,997 20.24
1970 254,586 5,180,119 485,214 20.35
1971 279,326 5,669,283 533,241 20.30
1972 303,014 5,892,861 561,173 19.45
1973 342,322 6,353,650 621,905 18.56
1974 349,315 6,450,658 637,824 18.47
1975 369,435 6,780,810 666,002 18.35
1976 404,502 7,356,671 723,102 18.19
1977 431,215 7,850,792 770,872 18.21
1978 465,613 8,392,536 824,085 18.02
1979 479,525 8,685,523 851,116 18.11
1980 472,518 8,578,161 842,742 18.15
1981 493,226 8,846,114 866,299 17.94
1982 500,961 8,820,131 869,866 17.61
1983 527,505 9,273,782 906,308 17.58
1984 544,532 9,779,084 958,999 17.96
1985 587,614 10,283,396 1,008,812 17.50
1986 629,278 11,295,635 1,102,413 17.95
1987 672,160 11,689,569 1,172,861 17.39
1988 721,177 12,902,373 1,269,782 17.89
1989 745,381 13,323,423 1,307,767 17.87
1990 896,699 14,672,385 1,487,801 16.36
1991 946,112 14,913,846 1,547,094 15.76
1992 993,920 15,290,401 1,572,740 15.38
1993 1,034,054 15,612,752 1,607,475 15.10
1994 1,041,362 17,231,387 1,732,312 16.55
1995 1,088,510 18,271,480 1,827,959 16.79
1996 1,123,270 18,878,017 1,890,858 16.81
1997 1,193,230 19,316,298 1,941,011 16.19
1998 1,218,030 19,550,833 1,984,130 16.05
1999 1,247,410 20,374,456 1,972,261 16.33
2000 1,277,940 20,647,836 2,011,583 16.16
2001 1,322,130 21,431,414 2,088,631 16.21
2002 1,337,005 22,274,640 2,153,241 16.66
2003 1,363,990 22,791,808 2,196,240 16.71
2004 1,404,110 23,382,734 2,249,030 16.65
2005 1,344,410 22,381,137 2,138,209 16.65
2006 1,333,990 22,184,397 2,093,494 16.63
2007 1,412,430 22,775,523 2,159,704 16.13
2008 1,382,450 22,005,034 2,125,361 15.92
2009 1,381,050 21,951,844 2,124,254 15.90
2010 1,445,500 23,363,833 2,238,582 16.16
2011 1,464,450 23,713,815 2,287,292 16.19
2012 1,425,550 22,776,184 2,196,121 15.98
2013 1,450,420 23,251,182 2,235,730 16.03
2014 1,470,550 23,741,315 2,296,656 16.14
YearAverage Daily Total
TABLE 1-A: SYSTEM WIDE AVERAGE DAILY TRAFFIC DATA

1-8
The Tollway System
Illinois Tollway 2014 Traffic Data Report
PC CV Total
Jane Addams Memorial 112,171,800 1,658,455,534 286,229,791 1,944,685,325 166,188,830
Tri-State 241,859,950 3,235,598,117 615,558,858 3,851,156,975 367,459,321
Reagan Memorial 87,559,850 1,574,826,583 249,829,587 1,824,656,170 145,516,073
Veterans Memorial 95,159,150 935,293,556 109,787,949 1,045,081,505 159,115,110
Total 536,750,750 7,404,173,790 1,261,406,185 8,665,579,975 838,279,334
Tollway Route VehiclesVehicle Miles
Transactions
PC CV Total
Jane Addams Memorial 307,320 4,543,714 784,191 5,327,905 455,312
Tri-State 662,630 8,864,652 1,686,463 10,551,115 1,006,738
Reagan Memorial 239,890 4,314,593 684,465 4,999,058 398,674
Veterans Memorial 260,710 2,562,448 300,789 2,863,237 435,932
Total 1,470,550 20,285,408 3,455,907 23,741,315 2,296,656
Tollway Route VehiclesVehicle Miles
Transactions
TABLE 1-B: ANNUAL TRAFFIC TOTALS
TABLE 1-C: AVERAGE DAILY TRAFFIC TOTALS
TABLE 1-D: SYSTEMWIDE MONTHLY FACTORS
Month Factor
January 0.83
February 0.90
March 0.95
April 1.01
May 1.04
June 1.07
July 1.08
August 1.07
September 1.04
October 1.05
November 0.98
December 0.98
Note: Numbers may not add due to rounding.
1-9
The Tollway System
Illinois Tollway 2014 Traffic Data Report
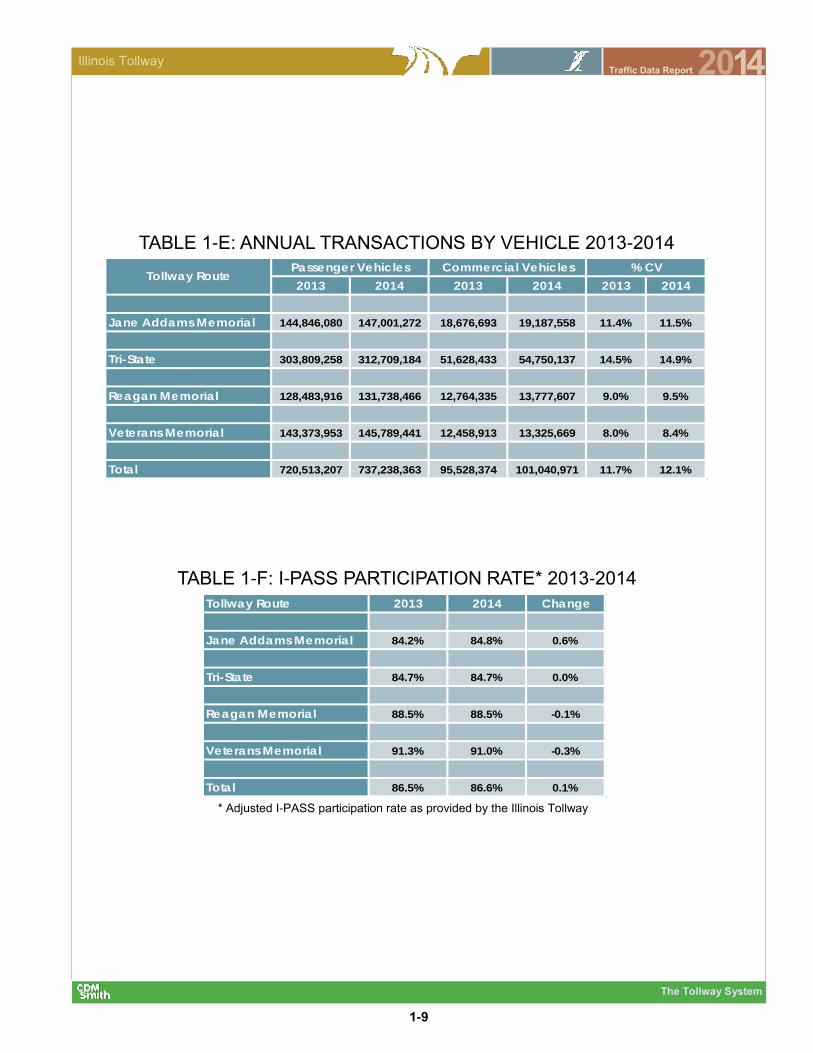
TABLE 1-E: ANNUAL TRANSACTIONS BY VEHICLE 2013-2014
TABLE 1-F: I-PASS PARTICIPATION RATE* 2013-2014
* Adjusted I-PASS participation rate as provided by the Illinois Tollway
2013 2014 2013 2014 2013 2014
Jane Addams Memorial 144,846,080 147,001,272 18,676,693 19,187,558 11.4% 11.5%
Tri-State 303,809,258 312,709,184 51,628,433 54,750,137 14.5% 14.9%
Reagan Memorial 128,483,916 131,738,466 12,764,335 13,777,607 9.0% 9.5%
Veterans Memorial 143,373,953 145,789,441 12,458,913 13,325,669 8.0% 8.4%
Total 720,513,207 737,238,363 95,528,374 101,040,971 11.7% 12.1%
Tollway RoutePassenger Vehicles % CVCommercial Vehicles
Tollway Route 2013 2014 Change
Jane Addams Memorial 84.2% 84.8% 0.6%
Tri-State 84.7% 84.7% 0.0%
Reagan Memorial 88.5% 88.5% -0.1%
Veterans Memorial 91.3% 91.0% -0.3%
Total 86.5% 86.6% 0.1%

1-10
The Tollway System
Illinois Tollway 2014 Traffic Data Report
Mainline Ramp Total
Lane - Miles Lane - Miles Lane - Miles
1959 811 88 899
1960 812 88 900
1963 812 89 901
1966 822 92 914
1967 839 93 932
1970 839 94 933
1971 839 96 935
1972 840 97 937
1973 856 98 954
1974 1,154 109 1,263
1975 1,176 110 1,286
1976 1,200 110 1,310
1977 1,222 110 1,332
1979 1,235 110 1,345
1982 1,235 115 1,350
1983 1,235 115 1,350
1984 1,237 117 1,354
1986 1,237 118 1,355
1987 1,249 118 1,367
1988 1,249 119 1,368
1989 1,342 154 1,496
1990 1,342 156 1,498
1991 1,342 157 1,499
1992 1,354 159 1,513
1993 1,413 159 1,572
1994 1,417 164 1,581
1995 1,417 167 1,584
1996 1,427 169 1,596
1997 1,428 175 1,603
1998 1,444 179 1,623
1999 1,459 181 1,641
2000 1,467 183 1,649
2001 1,469 184 1,653
2002 1,470 184 1,654
2003 1,473 184 1,657
2004 1,477 185 1,662
2005 1,484 186 1,670
2006 1,501 186 1,687
2007 1,575 210 1,785
2008 1,599 267 1,866
2009 1,741 305 2,046
2010 1,741 305 2,046
2011 1,741 305 2,046
2012 1,744 305 2,049
2013 1,744 309 2,053
2014 1,816 316 2,132
Year
TABLE 1-G: HISTORY OF TOLLWAY ADDITIONS BY MILEAGE 1959 — 2014
Mainline Ramp Total
Lane - Miles Lane - Miles Lane - Miles
1959 811 88 899
1960 812 88 900
1963 812 89 901
1966 822 92 914
1967 839 93 932
1970 839 94 933
1971 839 96 935
1972 840 97 937
1973 856 98 954
1974 1,154 109 1,263
1975 1,176 110 1,286
1976 1,200 110 1,310
1977 1,222 110 1,332
1979 1,235 110 1,345
1982 1,235 115 1,350
1983 1,235 115 1,350
1984 1,237 117 1,354
1986 1,237 118 1,355
1987 1,249 118 1,367
1988 1,249 119 1,368
1989 1,342 154 1,496
1990 1,342 156 1,498
1991 1,342 157 1,499
1992 1,354 159 1,513
1993 1,413 159 1,572
1994 1,417 164 1,581
1995 1,417 167 1,584
1996 1,427 169 1,596
1997 1,428 175 1,603
1998 1,444 179 1,623
1999 1,459 181 1,641
2000 1,467 183 1,649
2001 1,469 184 1,653
2002 1,470 184 1,654
2003 1,473 184 1,657
2004 1,477 185 1,662
2005 1,484 186 1,670
2006 1,501 186 1,687
2007 1,575 210 1,785
2008 1,599 267 1,866
2009 1,741 305 2,046
2010 1,741 305 2,046
2011 1,741 305 2,046
2012 1,744 305 2,049
2013 1,744 309 2,053
2014 1,816 316 2,132
Year
Values taken from AECOM 2014 Consulting Engineer’s Annual Report, Appendix I:
Tollway System Expansion History
1-11
The Tollway System
Illinois Tollway 2014 Traffic Data Report
Year
Mainline
Lane
Miles
Ramp
Lane
Miles
Additions
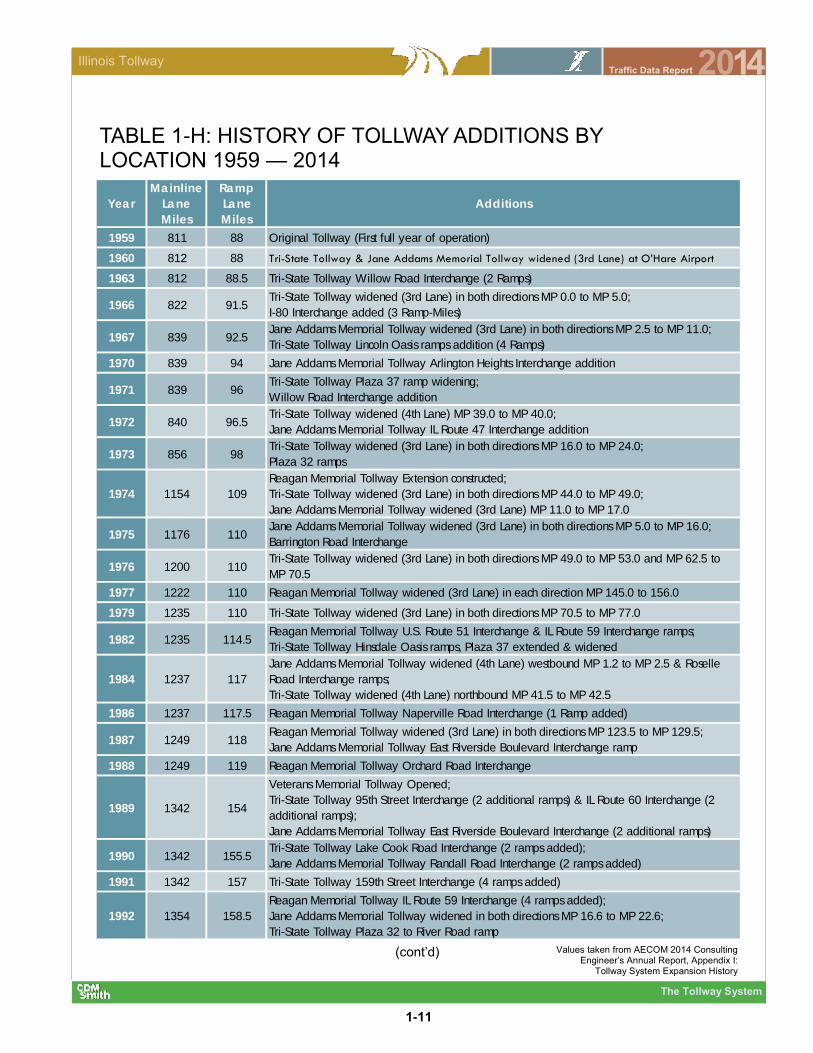
1959 811 88 Original Tollway (First full year of operation)
1960 812 88 Tri-State Tollway & Jane Addams Memorial Tollway widened (3rd Lane) at O’Hare Airport
1963 812 88.5 Tri-State Tollway Willow Road Interchange (2 Ramps)
1966 822 91.5Tri-State Tollway widened (3rd Lane) in both directions MP 0.0 to MP 5.0;
I-80 Interchange added (3 Ramp-Miles)
1967 839 92.5Jane Addams Memorial Tollway widened (3rd Lane) in both directions MP 2.5 to MP 11.0;
Tri-State Tollway Lincoln Oasis ramps addition (4 Ramps)
1970 839 94 Jane Addams Memorial Tollway Arlington Heights Interchange addition
1971 839 96Tri-State Tollway Plaza 37 ramp widening;
Willow Road Interchange addition
1972 840 96.5Tri-State Tollway widened (4th Lane) MP 39.0 to MP 40.0;
Jane Addams Memorial Tollway IL Route 47 Interchange addition
1973 856 98Tri-State Tollway widened (3rd Lane) in both directions MP 16.0 to MP 24.0;
Plaza 32 ramps
1974 1154 109
Reagan Memorial Tollway Extension constructed;
Tri-State Tollway widened (3rd Lane) in both directions MP 44.0 to MP 49.0;
Jane Addams Memorial Tollway widened (3rd Lane) MP 11.0 to MP 17.0
1975 1176 110Jane Addams Memorial Tollway widened (3rd Lane) in both directions MP 5.0 to MP 16.0;
Barrington Road Interchange
1976 1200 110Tri-State Tollway widened (3rd Lane) in both directions MP 49.0 to MP 53.0 and MP 62.5 to
MP 70.5
1977 1222 110 Reagan Memorial Tollway widened (3rd Lane) in each direction MP 145.0 to 156.0
1979 1235 110 Tri-State Tollway widened (3rd Lane) in both directions MP 70.5 to MP 77.0
1982 1235 114.5Reagan Memorial Tollway U.S. Route 51 Interchange & IL Route 59 Interchange ramps;
Tri-State Tollway Hinsdale Oasis ramps, Plaza 37 extended & widened
1984 1237 117
Jane Addams Memorial Tollway widened (4th Lane) westbound MP 1.2 to MP 2.5 & Roselle
Road Interchange ramps;
Tri-State Tollway widened (4th Lane) northbound MP 41.5 to MP 42.5
1986 1237 117.5 Reagan Memorial Tollway Naperville Road Interchange (1 Ramp added)
1987 1249 118Reagan Memorial Tollway widened (3rd Lane) in both directions MP 123.5 to MP 129.5;
Jane Addams Memorial Tollway East Riverside Boulevard Interchange ramp
1988 1249 119 Reagan Memorial Tollway Orchard Road Interchange
1989 1342 154
Veterans Memorial Tollway Opened;
Tri-State Tollway 95th Street Interchange (2 additional ramps) & IL Route 60 Interchange (2
additional ramps);
Jane Addams Memorial Tollway East Riverside Boulevard Interchange (2 additional ramps)
1990 1342 155.5Tri-State Tollway Lake Cook Road Interchange (2 ramps added);
Jane Addams Memorial Tollway Randall Road Interchange (2 ramps added)
1991 1342 157 Tri-State Tollway 159th Street Interchange (4 ramps added)
1992 1354 158.5
Reagan Memorial Tollway IL Route 59 Interchange (4 ramps added);
Jane Addams Memorial Tollway widened in both directions MP 16.6 to MP 22.6;
Tri-State Tollway Plaza 32 to River Road ramp
TABLE 1-H: HISTORY OF TOLLWAY ADDITIONS BY LOCATION 1959 — 2014
(cont’d) Values taken from AECOM 2014 Consulting Engineer’s Annual Report, Appendix I:
Tollway System Expansion History

1-12
The Tollway System
Illinois Tollway 2014 Traffic Data Report
Year
Mainline
Lane
Miles
Ramp
Lane
Miles
Additions
1993 1412.5 159Tri-State Tollway widened in both directions 95th Street to I-190;
Balmoral Avenue Interchange (1 ramp added)
1994 1416.6 164.3
Tri-State Tollway 75th Street Interchange;
Reagan Memorial Tollway Winfield Road Interchange;
Jane Addams Memorial Tollway Beverly Road Interchange;
Veterans Memorial Tollway widened (3rd Lane) MP 14.4 to MP 18.5
1995 1416.6 167.3
Tri-State Tollway Lake Cook Road Exit Ramp, Southbound Buckley Road (Route 137)
Interchange;
Jane Addams Memorial Tollway Rockton Road Interchange
1997 1428.2 175.2
Veterans Memorial Tollway widened (3rd Lane) in both directions MP 22.6 to MP 27.9;
Jane Addams Memorial Tollway Randall Road Interchange, Barrington Road & Roselle Road
Interchange Plazas w/ additional westbound lane;
Tri-State Tollway IL Route 137 Interchange expansion;
Reagan Memorial Tollway Orchard Road Interchange
1998 1443.5 179.1
Reagan Memorial Tollway widened MP 118.7 (Plaza 61 – Aurora) to MP 123.5 (IL Route 59);
Edens Spur Plaza 24 (Edens Spur);
Jane Addams Memorial Tollway Fox River & Plaza 9 (Elgin) widening MP 21.75 to MP 22.0;
U.S. Route 20 Bypass exit lane added;
Reagan Memorial Tollway Peace Road Interchange (2 ramps added);
Tri-State Tollway Willow Road Interchange (2 ramps added);
Golf Road Interchange Plaza 28 lanes;
Veterans Memorial Tollway 63rd Street interchange Plaza 85 widening;
Ogden Avenue Interchange Plaza 81 widening
1999 1459.4 181.1
Veterans Memorial Tollway Plaza 73 (Army Trail Road);
Boughton Road Interchange and Plaza expansion;
Jane Addams Memorial Tollway I-290/Route 53 Interchange & Plaza 15 expansion;
Tri-State Tollway widened (4th Lane) northbound from Edens Spur to Half Day Road
2000 1466.8 182.6
Reagan Memorial Tollway Plaza 61 (Aurora) I-PASS Express expansion MP 117.6 to MP
118.2;
Tri-State Tollway widened (4th Lane) southbound from Half Day Road to Edens Spur Split and
additional southbound exit ramp length to Lake Cook Road (MP 52.9 to MP 56.4);
Tri-State Tollway Plaza 41 (163rd Street) I-PASS only lanes & increased ramp tapers to 159th
Street Interchange MP 5.0 to MP 6.5
2001 1468.6 183.9
Tri-State Tollway widened from Plaza 36 (82nd Street) to 95th Street (MP 18.0 to MP 19.8);
Deerfield Road northbound exit ramp added from Edens Spur and northbound entrance ramp
added from Lake Cook Road (MP 52.9);
Grand Avenue Interchange ramp added (MP 69.8)
2002 1469.6 183.9
Reagan Memorial Tollway Plaza 61 (Aurora) reconfigure for additional I-PASS Express Lane
eastbound (MP 117.6 to MP 118.2);
Tri-State Tollway Plaza 29 (Touhy) additional I-PASS Only Lane northbound (MP 41.8)
2003 1473.3 183.9
Jane Addams Memorial Tollway Plaza 19 (River Road) additional I-PASS Only Lanes (MP 0.6);
Plaza 17 (Devon Avenue) additional I-PASS Only Lanes (MP 1.7);
Reagan Memorial Tollway Plaza 51 (York Road) westbound convert shoulder to increase I-
PASS Only Lane taper (MP 138.2)
TABLE 1-H: HISTORY OF TOLLWAY ADDITIONS BY LOCATION 1959 — 2014
(cont’d) Values taken from AECOM 2014 Consulting Engineer’s Annual Report, Appendix I:
Tollway System Expansion History
1-13
The Tollway System
Illinois Tollway 2014 Traffic Data Report
Year
Mainline
Lane
Miles
Ramp
Lane
Miles
Additions
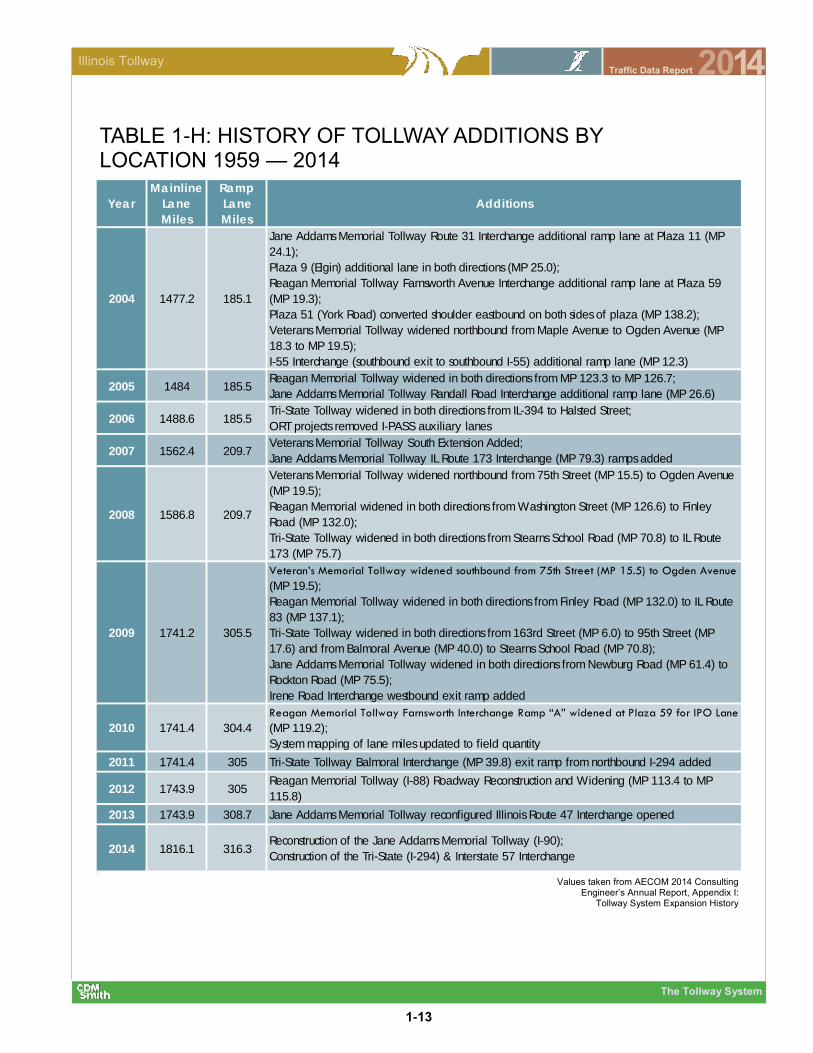
2004 1477.2 185.1
Jane Addams Memorial Tollway Route 31 Interchange additional ramp lane at Plaza 11 (MP
24.1);
Plaza 9 (Elgin) additional lane in both directions (MP 25.0);
Reagan Memorial Tollway Farnsworth Avenue Interchange additional ramp lane at Plaza 59
(MP 19.3);
Plaza 51 (York Road) converted shoulder eastbound on both sides of plaza (MP 138.2);
Veterans Memorial Tollway widened northbound from Maple Avenue to Ogden Avenue (MP
18.3 to MP 19.5);
I-55 Interchange (southbound exit to southbound I-55) additional ramp lane (MP 12.3)
2005 1484 185.5Reagan Memorial Tollway widened in both directions from MP 123.3 to MP 126.7;
Jane Addams Memorial Tollway Randall Road Interchange additional ramp lane (MP 26.6)
2006 1488.6 185.5Tri-State Tollway widened in both directions from IL-394 to Halsted Street;
ORT projects removed I-PASS auxiliary lanes
2007 1562.4 209.7Veterans Memorial Tollway South Extension Added;
Jane Addams Memorial Tollway IL Route 173 Interchange (MP 79.3) ramps added
2008 1586.8 209.7
Veterans Memorial Tollway widened northbound from 75th Street (MP 15.5) to Ogden Avenue
(MP 19.5);
Reagan Memorial widened in both directions from Washington Street (MP 126.6) to Finley
Road (MP 132.0);
Tri-State Tollway widened in both directions from Stearns School Road (MP 70.8) to IL Route
173 (MP 75.7)
2009 1741.2 305.5
Veteran’s Memorial Tollway widened southbound from 75th Street (MP 15.5) to Ogden Avenue
(MP 19.5);
Reagan Memorial Tollway widened in both directions from Finley Road (MP 132.0) to IL Route
83 (MP 137.1);
Tri-State Tollway widened in both directions from 163rd Street (MP 6.0) to 95th Street (MP
17.6) and from Balmoral Avenue (MP 40.0) to Stearns School Road (MP 70.8);
Jane Addams Memorial Tollway widened in both directions from Newburg Road (MP 61.4) to
Rockton Road (MP 75.5);
Irene Road Interchange westbound exit ramp added
2010 1741.4 304.4
Reagan Memorial Tollway Farnsworth Interchange Ramp “A” widened at Plaza 59 for IPO Lane
(MP 119.2);
System mapping of lane miles updated to field quantity
2011 1741.4 305 Tri-State Tollway Balmoral Interchange (MP 39.8) exit ramp from northbound I-294 added
2012 1743.9 305Reagan Memorial Tollway (I-88) Roadway Reconstruction and Widening (MP 113.4 to MP
115.8)
2013 1743.9 308.7 Jane Addams Memorial Tollway reconfigured Illinois Route 47 Interchange opened
2014 1816.1 316.3Reconstruction of the Jane Addams Memorial Tollway (I-90);
Construction of the Tri-State (I-294) & Interstate 57 Interchange
TABLE 1-H: HISTORY OF TOLLWAY ADDITIONS BY LOCATION 1959 — 2014
Values taken from AECOM 2014 Consulting Engineer’s Annual Report, Appendix I:
Tollway System Expansion History

1-14
The Tollway System
Illinois Tollway 2014 Traffic Data Report
Total (000s) PC% CV% Total (000s) Total%2 PC% CV%
1 17,540 70.2% 29.8% 12,541 71.5% 68.0% 79.7%
2 2,685 90.6% 9.4% 2,345 87.3% 87.4% 86.3%
4 1,796 88.0% 12.0% 1,554 86.5% 87.2% 81.1%
5 5,849 78.0% 22.0% 4,667 79.8% 78.0% 86.2%
6 5,887 90.5% 9.5% 5,522 93.8% 93.9% 92.4%
7 6,962 82.2% 17.8% 5,519 79.3% 77.5% 87.5%
8 2,062 88.8% 11.2% 1,828 88.7% 89.4% 82.9%
9 28,973 86.5% 13.5% 24,868 85.8% 85.8% 86.3%
10 3,272 95.2% 4.8% 2,899 88.6% 90.3% 54.2%
11 6,677 93.8% 6.2% 6,014 90.1% 90.9% 78.1%
12 3,862 95.7% 4.3% 3,444 89.2% 91.1% 45.5%
13 1,918 93.8% 6.2% 1,623 84.6% 85.0% 79.3%
14 2,917 94.3% 5.7% 2,646 90.7% 90.7% 91.4%
15 12,380 89.3% 10.7% 10,801 87.2% 86.7% 91.5%
16 4,470 91.6% 8.4% 3,953 88.4% 90.1% 69.9%
17 29,342 93.2% 6.8% 25,219 85.9% 85.8% 88.5%
18 7,072 91.7% 8.3% 6,497 91.9% 92.4% 85.6%
19 22,527 95.8% 4.2% 18,982 84.3% 84.2% 85.9%
Jane Addams
Memorial Total166,189 88.5% 11.5% 140,919 84.8% 84.9% 84.1%
20 2,564 92.4% 7.6% 2,332 90.9% 92.6% 70.7%
21 25,575 80.1% 19.9% 20,932 81.8% 80.1% 88.8%
22 3,874 94.4% 5.6% 3,461 89.3% 91.4% 54.4%
23 3,724 95.0% 5.0% 3,318 89.1% 91.0% 52.2%
24 19,684 92.0% 8.0% 16,438 83.5% 83.6% 82.7%
26 6,079 95.9% 4.1% 5,501 90.5% 90.4% 91.5%
27 6,030 95.2% 4.8% 5,483 90.9% 91.0% 90.1%
28 6,163 96.8% 3.2% 5,538 89.9% 89.9% 88.9%
29 32,577 90.3% 9.7% 28,519 87.5% 87.2% 90.9%
30 3,065 93.7% 6.3% 2,845 92.8% 92.8% 93.1%
31 7,874 98.4% 1.6% 6,890 87.5% 87.4% 93.4%
32 6,019 97.7% 2.3% 5,167 85.8% 85.7% 92.2%
33 36,744 89.7% 10.3% 32,201 87.6% 87.3% 90.7%
34 2,346 60.4% 39.6% 2,161 92.1% 91.9% 92.5%
35 50,983 82.8% 17.2% 43,794 85.9% 85.1% 89.6%
36 26,599 82.6% 17.4% 22,619 85.0% 84.0% 89.8%
37 21,802 84.2% 15.8% 18,784 86.2% 85.1% 91.9%
38 5,110 81.7% 18.3% 4,255 83.3% 83.8% 80.8%
39 25,935 82.6% 17.4% 21,992 84.8% 83.8% 89.3%
40 3,341 84.6% 15.4% 2,824 84.5% 83.2% 91.5%
41 38,404 77.3% 22.7% 31,618 82.3% 80.3% 89.3%
42 1,285 84.7% 15.3% 1,160 90.3% 89.8% 92.8%
43 12,268 74.8% 25.2% 9,119 74.3% 73.7% 76.0%
45 11,818 75.2% 24.8% 8,815 74.6% 73.9% 76.5%
47 7,595 90.8% 9.2% 5,469 72.0% 70.0% 91.6%
Tri-State Total 367,459 85.1% 14.9% 311,237 84.7% 84.2% 87.7%
Traffic I-PASS Usage1
Plaza
JANE ADDAMS MEMORIAL TOLLWAY
TRI-STATE TOLLWAY
(cont’d)
TABLE 1-I: SUMMARY OF TRAFFIC CHARACTERISTICS AT PLAZAS (Annual Transactions)
1 Adjusted I-PASS percentage provided by Illinois Tollway 2 Percent of total traffic
1-15
The Tollway System
Illinois Tollway 2014 Traffic Data Report
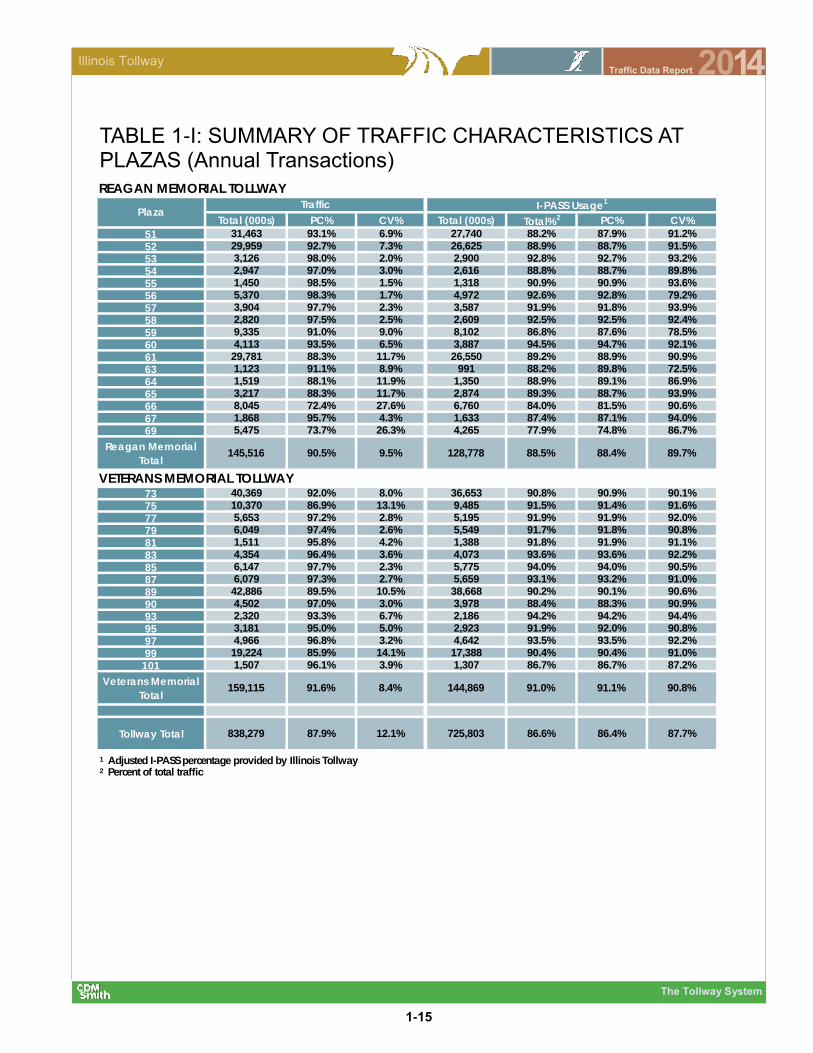
TABLE 1-I: SUMMARY OF TRAFFIC CHARACTERISTICS AT PLAZAS (Annual Transactions)
1 Adjusted I-PASS percentage provided by Illinois Tollway 2 Percent of total traffic
Total (000s) PC% CV% Total (000s) Total%2 PC% CV%
51 31,463 93.1% 6.9% 27,740 88.2% 87.9% 91.2%
52 29,959 92.7% 7.3% 26,625 88.9% 88.7% 91.5%
53 3,126 98.0% 2.0% 2,900 92.8% 92.7% 93.2%
54 2,947 97.0% 3.0% 2,616 88.8% 88.7% 89.8%
55 1,450 98.5% 1.5% 1,318 90.9% 90.9% 93.6%
56 5,370 98.3% 1.7% 4,972 92.6% 92.8% 79.2%
57 3,904 97.7% 2.3% 3,587 91.9% 91.8% 93.9%
58 2,820 97.5% 2.5% 2,609 92.5% 92.5% 92.4%
59 9,335 91.0% 9.0% 8,102 86.8% 87.6% 78.5%
60 4,113 93.5% 6.5% 3,887 94.5% 94.7% 92.1%
61 29,781 88.3% 11.7% 26,550 89.2% 88.9% 90.9%
63 1,123 91.1% 8.9% 991 88.2% 89.8% 72.5%
64 1,519 88.1% 11.9% 1,350 88.9% 89.1% 86.9%
65 3,217 88.3% 11.7% 2,874 89.3% 88.7% 93.9%
66 8,045 72.4% 27.6% 6,760 84.0% 81.5% 90.6%
67 1,868 95.7% 4.3% 1,633 87.4% 87.1% 94.0%
69 5,475 73.7% 26.3% 4,265 77.9% 74.8% 86.7%
Reagan Memorial
Total145,516 90.5% 9.5% 128,778 88.5% 88.4% 89.7%
73 40,369 92.0% 8.0% 36,653 90.8% 90.9% 90.1%
75 10,370 86.9% 13.1% 9,485 91.5% 91.4% 91.6%
77 5,653 97.2% 2.8% 5,195 91.9% 91.9% 92.0%
79 6,049 97.4% 2.6% 5,549 91.7% 91.8% 90.8%
81 1,511 95.8% 4.2% 1,388 91.8% 91.9% 91.1%
83 4,354 96.4% 3.6% 4,073 93.6% 93.6% 92.2%
85 6,147 97.7% 2.3% 5,775 94.0% 94.0% 90.5%
87 6,079 97.3% 2.7% 5,659 93.1% 93.2% 91.0%
89 42,886 89.5% 10.5% 38,668 90.2% 90.1% 90.6%
90 4,502 97.0% 3.0% 3,978 88.4% 88.3% 90.9%
93 2,320 93.3% 6.7% 2,186 94.2% 94.2% 94.4%
95 3,181 95.0% 5.0% 2,923 91.9% 92.0% 90.8%
97 4,966 96.8% 3.2% 4,642 93.5% 93.5% 92.2%
99 19,224 85.9% 14.1% 17,388 90.4% 90.4% 91.0%
101 1,507 96.1% 3.9% 1,307 86.7% 86.7% 87.2%
Veterans Memorial
Total159,115 91.6% 8.4% 144,869 91.0% 91.1% 90.8%
Tollway Total 838,279 87.9% 12.1% 725,803 86.6% 86.4% 87.7%
PlazaTraffic I-PASS Usage
1
REAGAN MEMORIAL TOLLWAY
VETERANS MEMORIAL TOLLWAY

1-16
The Tollway System
Illinois Tollway 2014 Traffic Data Report
FIG
UR
E 1
-A: T
HE
ILL
INO
IS T
OL
LW
AY
SY
ST
EM
2014

1-17
The Tollway System
Illinois Tollway 2014 Traffic Data Report
FIG
UR
E 1
-B: A
VE
RA
GE
AN
NU
AL D
AIL
Y T
RA
FF
IC 2
014
1-18
The Tollway System
Illinois Tollway 2014 Traffic Data Report
FIG
UR
E 1
-C: A
VE
RA
GE
AN
NU
AL D
AIL
Y T
RA
FF
IC 1
960

1-19
The Tollway System
Illinois Tollway 2014 Traffic Data Report
FIG
UR
E 1
-D: A
NN
UA
L A
VE
RA
GE
PE
RC
EN
TA
GE
C
HA
NG
E IN
DA
ILY
TR
AF
FIC
VO
LU
ME
S 2
000
-20
14

1-20
The Tollway System
Illinois Tollway 2014 Traffic Data Report
FIG
UR
E 1
-E: A
NN
UA
L A
VE
RA
GE
PE
RC
EN
TA
GE
C
HA
NG
E IN
DA
ILY
TR
AF
FIC
VO
LU
ME
S 2
010
-20
14
1-21
The Tollway System
Illinois Tollway 2014 Traffic Data Report
FIG
UR
E 1
-F: M
AJO
R T
OL
LW
AY
CO
NS
TR
UC
TIO
N P
RO
JE
CT
S D
UR
ING
2014

1-22
The Tollway System
Illinois Tollway 2014 Traffic Data Report
FIG
UR
E 1
-G: M
AJO
R O
FF
-TO
LLW
AY
CO
NS
TR
UC
TIO
N P
RO
JE
CT
S D
UR
ING
20
14
Section 2Jane Addams Memorial Tollway
2014
Jane Addams Memorial Tollway
Section 2
Jane Addam
s M
emorial Tollw
ay


Jane Addams Memorial Tollway
2-1
Illinois Tollway 2014 Traffic Data Report
TABULATIONS TABLE PAGE
2-A Average Daily Traffic Volumes Between Interchanges
1980 – 2014 (Westbound) 2-4
2-B Average Daily Traffic Volumes Between Interchanges
1980 – 2014 (Eastbound) 2-5
2-C General Statistics for Mainline Plazas 2-6
2-D Indexed Monthly Variation by Mainline Plaza 2-8
2-E Indexed Daily Variation by Mainline Plaza 2-8
2-F Annual Total Transactions by Toll Plaza 2-9
2-G Average Daily Traffic Data 2-10
ILLUSTRATIONS FIGURE PAGE
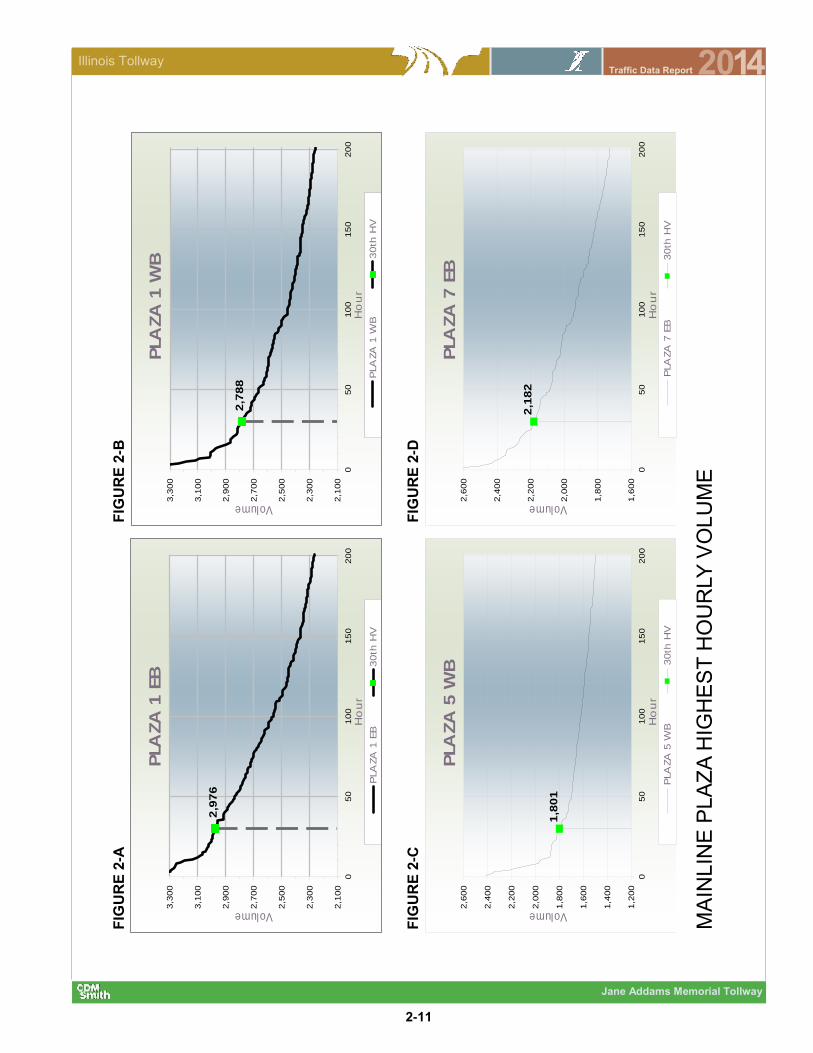
2-A Mainline Plaza Highest Hourly Volume Plaza 1 EB 2-11
2-B Mainline Plaza Highest Hourly Volume Plaza 1 WB 2-11
2-C Mainline Plaza Highest Hourly Volume Plaza 5 WB 2-11
2-D Mainline Plaza Highest Hourly Volume Plaza 7 EB 2-11
2-E Mainline Plaza Highest Hourly Volume Plaza 9 EB 2-12
2-F Mainline Plaza Highest Hourly Volume Plaza 9 WB 2-12
2-G Mainline Plaza Highest Hourly Volume Plaza 17 WB 2-12
2-H Mainline Plaza Highest Hourly Volume Plaza 19 EB 2-12
2-I Average Daily Traffic Trends Plaza 1 South Beloit 2-13
2-J Average Daily Traffic Trends Plaza 2 East Riverside Boulevard 2-13
2-K Average Daily Traffic Trends Plaza 3 South Rockford 2-13
2-L Average Daily Traffic Trends Plaza 4 Illinois Route 173 2-14
2-M Average Daily Traffic Trends Plaza 5 Belvidere 2-14
2-N Average Daily Traffic Trends Plaza 6 Illinois Route 47 2-14
2-O Average Daily Traffic Trends Plaza 7 Marengo-Hampshire 2-15
2-P Average Daily Traffic Trends Plaza 8 Randall Road 2-15
2-Q Average Daily Traffic Trends Plaza 9 Elgin 2-15
2-R Average Daily Traffic Trends Plaza 10 Barrington Road 2-16
2-S Average Daily Traffic Trends Plaza 11 Illinois 31 2-16
2-T Average Daily Traffic Trends Plaza 12 Roselle Road 2-16
SECTION 2 Jane Addams Memorial Tollway

Jane Addams Memorial Tollway
2-2
Illinois Tollway 2014 Traffic Data Report
ILLUSTRATIONS (CONTINUED) FIGURE PAGE
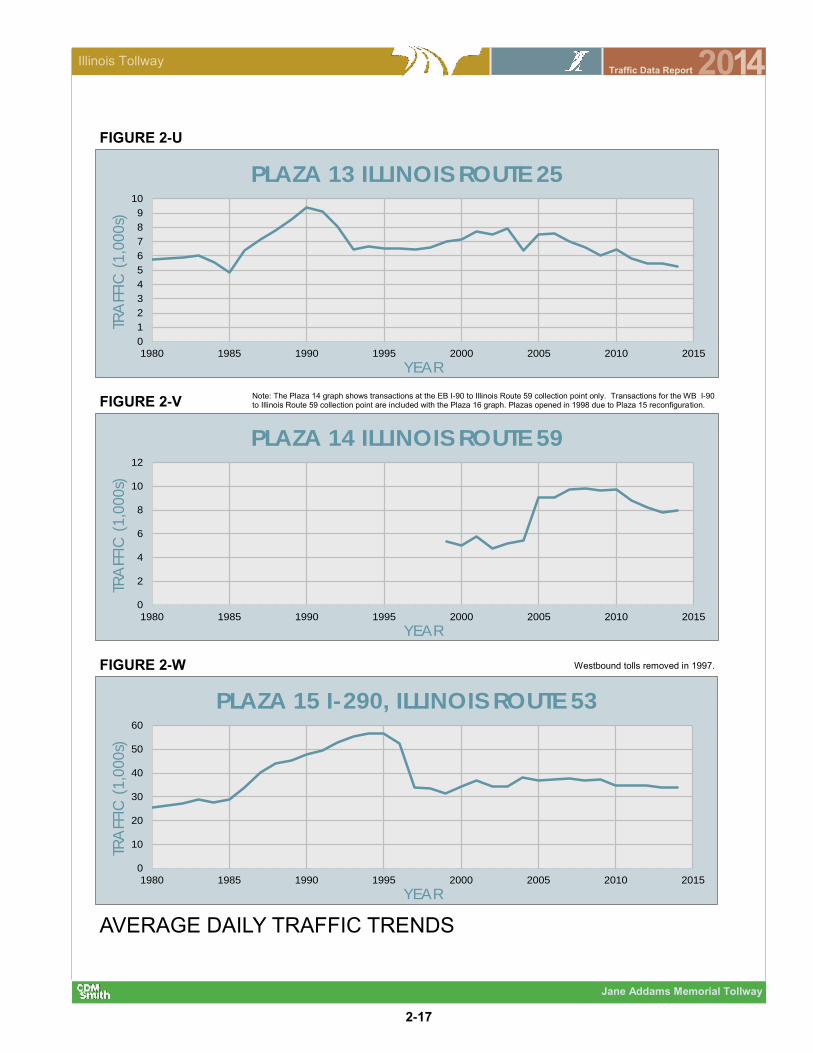
2-U Average Daily Traffic Trends Plaza 13 Illinois 25 2-17
2-V Average Daily Traffic Trends Plaza 14 Illinois Route 59 2-17
2-W Average Daily Traffic Trends Plaza 15 I-290, Illinois Route 53 2-17
2-X Average Daily Traffic Trends Plaza 16 Beverly Road 2-18
2-Y Average Daily Traffic Trends Plaza 17 Devon Avenue 2-18
2-Z Average Daily Traffic Trends Plaza 18 Arlington Heights Road 2-18
2-AA Average Daily Traffic Trends Plaza 19 River Road 2-19
2-AB Average Weekday Speed Distributions, Eastern Section—Eastbound 2-20
2-AC Average Weekday Speed Distributions, Eastern Section—Westbound 2-20
2-AD Average Weekday Speed Distributions, Western Section—Eastbound 2-20
2-AE Average Weekday Speed Distributions, Western Section—Westbound 2-20
2-AF Roadway Performance Measures, Eastern Section 2-21
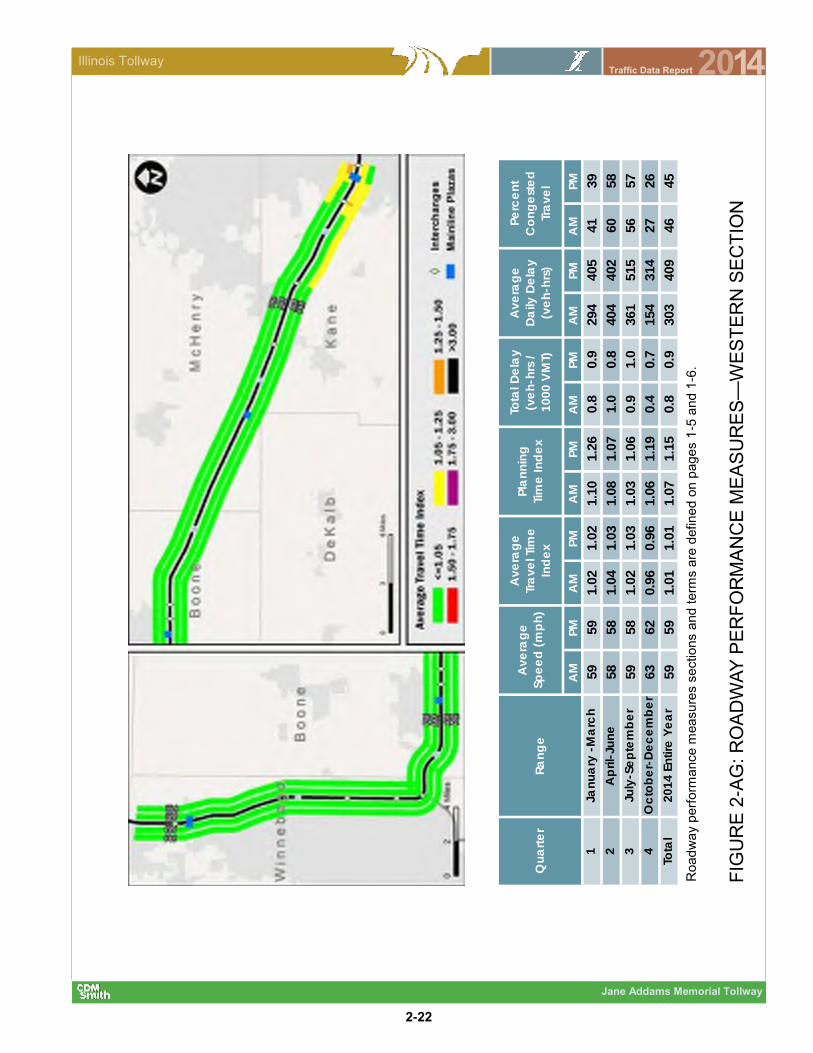
2-AG Roadway Performance Measures, Western Section 2-22
2-AH Average Speed Contours, MP 55.0 to 78.5 2-23
2-AI Average Speed Contours, MP 32.0 to 54.5 2-24
SECTION 2 Jane Addams Memorial Tollway

2-3
Jane Addams Memorial Tollway
Illinois Tollway 2014 Traffic Data Report
This Page Is Intentionally Left Blank

2-4
Jane Addams Memorial Tollway
Illinois Tollway 2014 Traffic Data Report
Kennedy Expressway 78.6
0.8 39,270 4.0 58,040 1.4 66,420 -0.5 62,870 -1.5 59,240
Tri-State Interchange 77.8
0.5 51,310 3.7 73,590 1.5 85,520 -0.2 83,420 -2.0 76,950
Devon Avenue 77.3
Toll Plaza 17 77.3 1.2 56,160 3.7 80,790 1.4 93,190 -0.4 89,150 -2.6 80,390
Lee Street 76.1
1.7 52,730 3.5 74,740 1.6 87,610 -0.5 83,390 -2.7 74,780
Des Plaines Oasis 74.4
0.9 52,730 3.5 74,740 1.6 87,610 -0.5 83,390 -2.7 74,780
Elmhurst Road 73.5
2.8 40,790 3.8 59,510 1.8 70,910 -0.1 70,530 -3.1 62,250
Arlington Heights Road (PL18) 70.7
2.5 34,440 3.8 50,010 3.9 73,120 -0.2 71,440 -3.4 62,190
Ilinois Route 53/I-290 68.2
2.7 29,360 5.9 51,970 3.2 71,530 1.2 80,270 -2.5 72,520
Roselle Road (PL12) 65.5
3.3 29,360 3.9 43,100 3.6 61,490 1.2 69,090 -2.7 61,940
Barrington Road (PL10) 62.2
2.5 17,070 4.5 26,580 6.4 49,640 1.8 59,410 -2.8 52,980
Illinois Route 59 (PL14) 59.7
1.6 18,470 4.9 29,780 4.9 48,160 2.4 61,340 -3.4 53,320
Beverly Road (PL16) 58.1
1.8 18,470 4.9 29,780 3.8 43,120 2.7 56,220 -3.5 48,800
Illinois Route 25 (PL13) 56.3
1.7 16,330 4.9 26,350 4.7 41,520 2.7 54,370 -3.3 47,590
Illinois Route 31 (PL11) 54.6
Toll Plaza 9 53.8 2.5 11,340 4.2 17,090 6.6 32,270 3.5 45,660 -3.4 39,720
Randall Road (PL8) 52.1
5.7 11,340 2.9 15,020 5.6 25,780 2.4 32,800 -4.8 26,940
Illinois Route 47 46.4
4.5 10,130 2.0 12,380 5.4 20,870 1.8 25,040 -4.9 20,500
Marengo Road (U.S. Route 20) 41.9
16.6 9,340 2.5 12,000 4.9 19,320 1.9 23,390 -4.8 19,220
Genoa Road 25.3
1.1 8,490 2.5 10,860 4.1 16,300 1.8 19,420 -4.7 16,020
Belvidere Oasis 24.2
Toll Plaza 5 23.3 3.4 8,490 2.5 10,860 4.1 16,300 1.8 19,420 -4.7 16,020
Irene Road 20.8
3.4 8,490 2.5 10,860 4.1 16,300 1.7 19,200 -4.7 15,870
I-39/U.S. Route 20 (Cherry Valley) 17.4
2.2 9,160 4.6 14,330 3.9 21,010 3.1 28,380 0.2 28,650
U.S. Business 20 15.2
2.9 8,270 5.2 13,750 4.8 22,060 1.7 26,060 0.9 27,020
E. Riverside Boulevard (PL2) 12.3
3.4 8,270 4.8 13,180 4.7 20,840 1.5 24,300 1.3 25,600
Illinois Route 173 (PL4) 8.9
Toll Plaza 1 3.5 6.2 8,270 4.8 13,180 4.7 20,840 0.9 22,800 1.0 23,760
West Terminus 2.7
Grand Total 75.9 558,080 4.0 822,490 3.1 1,111,730 0.9 1,211,360 -2.7 1,087,050
Location
Average
Annual
Percent
Change
ADT
2010
Average
Annual
Percent
Change
ADT
1990
Average
Annual
Percent
Change
ADT
2000Mile
Post
Miles
Btwn.
Int.
ADT
1980
Average
Annual
Percent
Change
ADT
2014
TABLE 2-A: AVERAGE DAILY TRAFFIC VOLUMES BETWEEN INTERCHANGES 1980-2014 (WESTBOUND)

2-5
Jane Addams Memorial Tollway
Illinois Tollway 2014 Traffic Data Report
Kennedy Expressway 78.6
Toll Plaza 19 78.5 0.8 48,260 3.3 67,020 1.3 76,300 -0.9 69,600 -3.0 61,730
Tri-State Interchange 77.8
0.5 55,550 3.4 77,830 2.5 99,340 -1.7 83,980 -2.4 76,060
Devon Avenue 77.3
77.3 1.2 55,550 3.4 77,830 2.5 99,340 -1.7 83,980 -2.4 76,060
Lee Street 76.1
1.7 52,110 3.3 71,920 2.4 91,250 -1.6 77,640 -2.6 69,980
Des Plaines Oasis 74.4
0.9 52,110 3.3 71,920 2.4 91,250 -1.6 77,640 -2.6 69,980
Elmhurst Road 73.5
2.8 40,200 3.6 57,210 2.3 72,090 -0.5 68,390 -2.8 61,120
Arlington Heights Road (PL18) 70.7
2.5 33,800 3.6 48,150 4.3 73,360 -0.4 70,680 -3.1 62,200
Illinois Route 53/I-290 (PL 15) 68.2
2.7 29,110 5.8 50,930 4.2 77,040 0.7 82,430 -2.6 74,100
Roselle Road 65.5
3.3 29,110 3.9 42,540 4.8 68,280 0.4 70,850 -2.9 63,010
Barrington Road 62.2
2.5 16,770 4.6 26,250 7.5 54,030 0.9 59,150 -2.8 52,870
Illinois Route 59 (PL14) 59.7
1.6 18,090 5.0 29,480 5.5 50,150 1.9 60,830 -3.3 53,160
Beverly Road 58.1
1.8 18,090 5.0 29,480 4.3 44,840 2.1 55,370 -3.5 47,930
Illinois Route 25 (PL13) 56.3
1.7 15,860 5.1 26,180 5.1 43,030 2.3 54,220 -3.3 47,500
Illinois Route 31 (PL11) 54.6
Toll Plaza 9 53.8 2.5 11,660 4.1 17,360 6.6 32,790 3.3 45,350 -3.3 39,640
Randall Road (PL8) 52.1
5.7 11,660 2.7 15,290 5.5 26,180 2.5 33,500 -4.4 27,970
Illinois Route 47 46.4
4.5 10,360 2.0 12,620 5.1 20,770 2.5 26,520 -5.1 21,520
Marengo Road (U.S. Route 20) 41.9
Toll Plaza 7 16.6 9,290 2.6 12,000 4.7 19,010 2.0 23,220 -4.8 19,070
Genoa Road 25.3
1.1 8,720 2.3 10,990 4.1 16,430 2.2 20,470 -4.0 17,390
Belvidere Oasis 24.2
3.4 8,720 2.3 10,990 4.1 16,430 2.2 20,470 -4.0 17,390
Irene Road 20.8
3.4 8,720 2.3 10,990 4.1 16,430 2.2 20,470 -4.1 17,310
I-39/U.S. Route 20 (Cherry Valley) 17.4
2.2 9,490 4.6 14,920 3.5 20,960 2.9 27,820 0.3 28,120
U.S. Business 20 15.2
2.9 8,430 5.2 14,000 4.3 21,370 2.2 26,690 0.7 27,480
E. Riverside Boulevard (PL2) 12.3
3.4 8,430 4.8 13,450 4.1 20,100 2.1 24,680 1.2 25,860
Illinois Route 173 (PL4) 8.9
Toll Plaza 1 3.5 6.2 8,430 4.8 13,450 4.1 20,100 1.5 23,420 0.9 24,300
North Terminus 2.7
Grand Total 75.9 568,520 3.8 822,800 3.6 1,170,870 0.3 1,207,370 -2.7 1,081,750
Average
Annual
Percent
Change
ADT
1980
Average
Annual
Percent
Change
ADT
1990
Average
Annual
Percent
Change
ADT
2000
ADT
2010
Location Mile
Post
Miles
Btwn.
Int.
Average
Annual
Percent
Change
ADT
2014
TABLE 2-B: AVERAGE DAILY TRAFFIC VOLUMES BETWEEN INTERCHANGES 1980-2014 (EASTBOUND)
2-6
Jane Addams Memorial Tollway
Illinois Tollway 2014 Traffic Data Report
(cont’d)
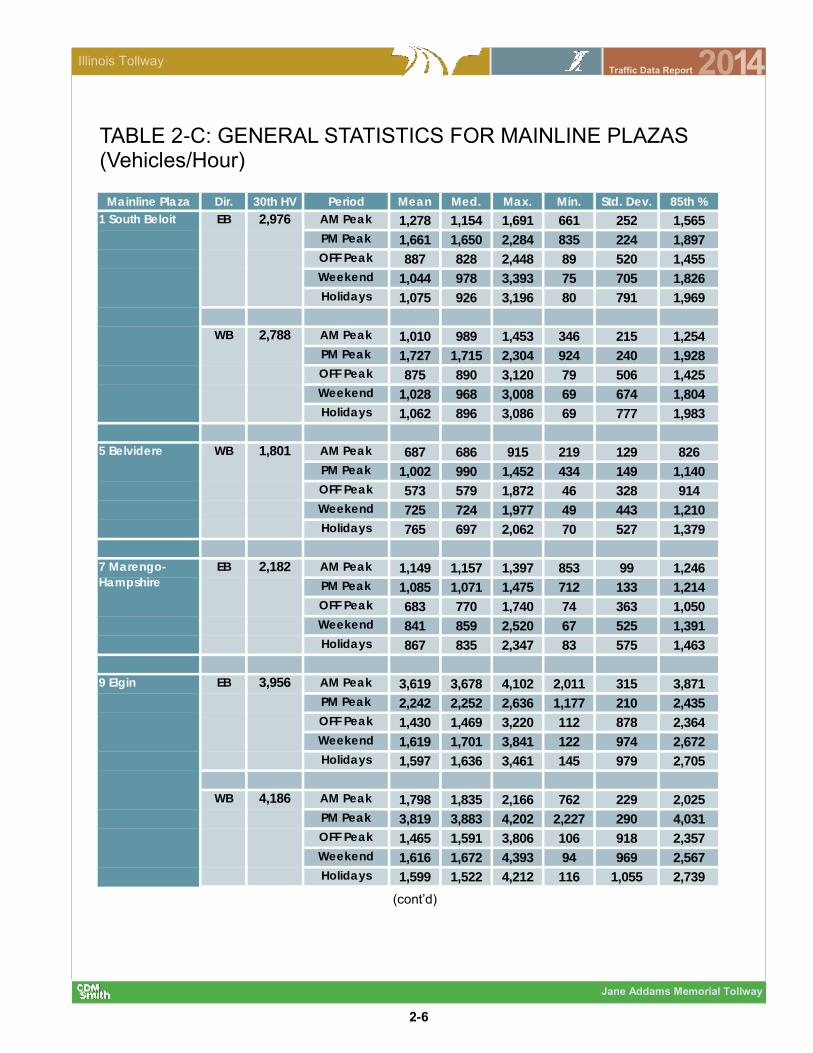
TABLE 2-C: GENERAL STATISTICS FOR MAINLINE PLAZAS (Vehicles/Hour)
Mainline Plaza Dir. 30th HV Period Mean Med. Max. Min. Std. Dev. 85th %
2,976 AM Peak 1,278 1,154 1,691 661 252 1,565
PM Peak 1,661 1,650 2,284 835 224 1,897
OFF Peak 887 828 2,448 89 520 1,455
Weekend 1,044 978 3,393 75 705 1,826
Holidays 1,075 926 3,196 80 791 1,969
2,788 AM Peak 1,010 989 1,453 346 215 1,254
PM Peak 1,727 1,715 2,304 924 240 1,928
OFF Peak 875 890 3,120 79 506 1,425
Weekend 1,028 968 3,008 69 674 1,804
Holidays 1,062 896 3,086 69 777 1,983
1,801 AM Peak 687 686 915 219 129 826
PM Peak 1,002 990 1,452 434 149 1,140
OFF Peak 573 579 1,872 46 328 914
Weekend 725 724 1,977 49 443 1,210
Holidays 765 697 2,062 70 527 1,379
2,182 AM Peak 1,149 1,157 1,397 853 99 1,246
PM Peak 1,085 1,071 1,475 712 133 1,214
OFF Peak 683 770 1,740 74 363 1,050
Weekend 841 859 2,520 67 525 1,391
Holidays 867 835 2,347 83 575 1,463
3,956 AM Peak 3,619 3,678 4,102 2,011 315 3,871
PM Peak 2,242 2,252 2,636 1,177 210 2,435
OFF Peak 1,430 1,469 3,220 112 878 2,364
Weekend 1,619 1,701 3,841 122 974 2,672
Holidays 1,597 1,636 3,461 145 979 2,705
4,186 AM Peak 1,798 1,835 2,166 762 229 2,025
PM Peak 3,819 3,883 4,202 2,227 290 4,031
OFF Peak 1,465 1,591 3,806 106 918 2,357
Weekend 1,616 1,672 4,393 94 969 2,567
Holidays 1,599 1,522 4,212 116 1,055 2,739
9 Elgin EB
WB
7 Marengo-
Hampshire
EB
5 Belvidere WB
1 South Beloit EB
WB

2-7
Jane Addams Memorial Tollway
Illinois Tollway 2014 Traffic Data Report
TABLE 2-C: GENERAL STATISTICS FOR MAINLINE PLAZAS (Vehicles/Hour)
AM Peak = Weekday 6:00 AM To 8:00 AM Except Fridays PM Peak = Weekday 4:00 PM To 6:00 PM Except Fridays OFF Peak = Weekday 5:00 AM To 10:00 PM Except AM and PM Peak Periods Weekend = Fridays, Saturdays, and Sundays Holidays = See Page 1-6 for a list of Holidays.
Mainline Plaza Dir. 30th HV Period Mean Med. Max. Min. Std. Dev. 85th %
6,312 AM Peak 5,286 5,218 6,586 3,110 612 5,892
PM Peak 5,749 5,798 6,530 3,667 403 6,053
OFF Peak 3,108 3,376 6,243 274 1,753 5,013
Weekend 3,177 3,352 6,434 354 1,613 4,827
Holidays 2,860 2,890 5,922 428 1,603 4,743
4,450 AM Peak 3,261 3,281 4,007 2,000 398 3,665
PM Peak 3,329 3,340 4,169 2,353 414 3,774
OFF Peak 2,411 2,951 4,483 177 1,290 3,647
Weekend 2,605 3,103 4,649 243 1,319 3,908
Holidays 2,373 2,732 5,184 232 1,306 3,683
19 River Road EB
17 Devon
Avenue
WB

2-8
Jane Addams Memorial Tollway
Illinois Tollway 2014 Traffic Data Report
TABLE 2-E: INDEXED DAILY VARIATION BY MAINLINE PLAZA
Table 2-E includes Monthly Variation
Month South Beloit Belvidere Marengo ElginDevon
AvenueRiver Road
January 0.76 0.77 0.80 0.83 0.89 0.88
February 0.81 0.83 0.88 0.90 0.96 0.96
March 0.90 0.92 0.93 0.95 1.00 1.00
April 0.96 0.94 0.97 1.01 1.04 1.04
May 1.03 1.01 1.02 1.04 1.03 1.02
June 1.13 1.10 1.08 1.07 1.03 1.02
July 1.23 1.18 1.14 1.09 1.03 1.03
August 1.21 1.20 1.14 1.09 1.03 1.04
September 1.04 1.01 1.02 1.02 1.02 1.01
October 1.03 1.01 1.01 1.02 1.02 1.01
November 0.95 1.00 0.99 0.98 0.96 0.97
December 0.93 1.02 1.01 1.00 0.98 1.00
Month Day South Beloit Belvidere Marengo ElginDevon
AvenueRiver Road
Monday 1.19 1.17 1.11 1.09 1.04 1.04
Tuesday 1.13 1.11 1.08 1.06 1.02 1.04
Wednesday 1.16 1.14 1.10 1.08 1.04 1.07
Thursday 1.17 1.14 1.10 1.07 1.03 1.03
Friday 1.23 1.23 1.12 1.09 1.03 1.02
Saturday 1.25 1.28 1.14 1.11 1.03 1.02
Sunday 1.26 1.22 1.25 1.15 1.07 1.07
Monday 0.98 1.07 1.03 1.02 1.00 1.00
Tuesday 1.04 1.14 1.09 1.04 1.00 1.01
Wednesday 0.95 1.08 1.04 1.01 0.96 1.02
Thursday 0.86 0.96 1.00 0.98 0.93 1.00
Friday 0.89 0.93 1.01 0.96 0.96 1.01
Saturday 0.95 0.98 1.03 1.00 1.01 1.01
Sunday 0.87 1.00 0.88 0.95 0.99 0.98
August
December
TABLE 2-D: INDEXED MONTHLY VARIATION BY MAINLINE PLAZA

2-9
Jane Addams Memorial Tollway
Illinois Tollway 2014 Traffic Data Report
TABLE 2-F: ANNUAL TOTAL TRANSACTIONS BY TOLL PLAZA
Plaza Percentage
Code* Change
1 South Beloit M 16,876,690 17,539,539 3.9%
2 East Riverside Boulevard R 2,650,788 2,685,042 1.3%
4 Illinois Route 173 R 1,673,475 1,796,386 7.3%
5 Belvidere M1 5,823,482 5,848,620 0.4%
6 Illinois Route 47** E 835,658 5,886,702
7 Marengo-Hampshire M1 7,038,158 6,961,725 -1.1%
8 Randall Road R 2,137,644 2,061,961 -3.5%
9 Elgin M 29,345,160 28,972,585 -1.3%
10 Barrington Road R 3,353,372 3,271,988 -2.4%
11 Illinois Route 31 R 6,946,906 6,677,060 -3.9%
12 Roselle Road R 3,865,467 3,861,867 -0.1%
13 Illinois Route 25 R 2,003,176 1,917,587 -4.3%
14 Illinois Route 59 R 2,859,970 2,916,774 2.0%
15 I-290, Illinois Route 53 R 12,394,900 12,379,772 -0.1%
16 Beverly Road R 4,460,870 4,469,856 0.2%
17 Devon Avenue M1 30,663,475 29,342,232 -4.3%
18 Arlington Heights Road R 7,179,437 7,072,428 -1.5%
19 River Road M1 23,414,145 22,526,706 -3.8%
Jane Addams Total 163,522,773 166,188,830 1.6%
* M=Mainline / R=Ramp / A=Attended Ramp Plaza / E=Electronic Toll Collection Only Ramp
1=Toll Collected in One Direction Only
** Plaza 6 opened on November 8, 2013.
Plaza 2013 2014

2-10
Jane Addams Memorial Tollway
Illinois Tollway 2014 Traffic Data Report
Average Trip
Vehicles Vehicle Miles Transactions Length (Miles)
1959 10,937 513,839 16,852 46.98
1960 21,417 720,403 29,637 33.64
1961 30,379 893,740 41,601 29.42
1962 35,337 978,261 48,297 27.68
1963 36,384 1,060,625 52,810 29.15
1964 38,704 1,130,304 55,528 29.20
1965 44,034 1,239,411 62,735 28.15
1966 49,418 1,348,751 68,336 27.29
1967 53,402 1,397,288 73,035 26.17
1968 59,443 1,535,620 81,811 25.83
1969 66,752 1,637,427 118,986 24.53
1970 75,218 1,757,108 138,024 23.36
1971 81,517 1,867,136 146,198 22.90
1972 87,416 1,929,076 156,403 22.07
1973 102,262 2,070,220 175,930 20.24
1974 101,814 2,001,520 171,108 19.66
1975 110,185 2,141,250 184,352 19.43
1976 118,923 2,301,465 199,710 19.35
1977 126,388 2,435,431 212,020 19.27
1978 134,830 2,502,453 220,878 18.56
1979 139,786 2,606,029 228,180 18.64
1980 140,928 2,536,515 227,729 18.00
1981 143,284 2,619,176 230,868 18.28
1982 146,090 2,634,806 234,034 18.04
1983 152,561 2,770,933 247,674 18.16
1984 144,728 2,666,506 238,152 18.42
1985 164,771 2,861,454 257,366 17.37
1986 175,655 3,134,635 281,112 17.85
1987 191,936 3,392,046 307,469 17.67
1988 205,510 3,558,352 329,391 17.31
1989 213,965 3,643,665 336,575 17.03
1990 225,655 3,669,541 347,884 16.26
1991 222,370 3,673,993 365,120 16.52
1992 234,074 4,081,095 375,921 17.44
1993 253,304 4,279,655 389,127 16.90
1994 260,359 4,533,228 412,288 17.41
1995 269,680 4,774,725 432,373 17.71
1996 275,020 4,912,102 439,095 17.86
1997 282,900 5,105,618 454,622 18.05
1998 284,860 5,125,064 480,098 17.99
1999 294,050 5,567,182 512,810 18.93
2000 294,850 5,402,466 507,784 18.32
2001 309,100 5,828,988 541,479 18.86
2002 296,870 5,773,234 532,658 19.45
2003 304,510 5,857,387 541,345 19.24
2004 323,450 6,158,090 556,501 19.04
2005 312,300 6,002,609 530,257 19.22
2006 312,990 5,918,699 478,556 18.91
2007 318,420 6,120,967 492,225 19.22
2008 313,550 5,853,800 479,141 18.67
2009 308,050 5,744,595 473,015 18.65
2010 335,170 5,994,090 484,642 17.88
2011 317,070 5,813,945 470,237 18.34
2012 308,770 5,659,154 456,180 18.33
2013 309,780 5,376,980 448,008 17.36
2014 307,320 5,327,905 455,312 17.34
YearAverage Daily Total
TABLE 2-G: AVERAGE DAILY TRAFFIC DATA
2-11
Jane Addams Memorial Tollway
Illinois Tollway 2014 Traffic Data Report
MA
INLIN
E P
LA
ZA
HIG
HE
ST
HO
UR
LY
VO
LU
ME
FIG
UR
E 2
-B
FIG
UR
E 2
-A
FIG
UR
E 2
-D
FIG
UR
E 2
-C
2,9
76
2,1
00
2,3
00
2,5
00
2,7
00
2,9
00
3,1
00
3,3
00
050
10
01
50
20
0
Volume
Ho
ur
PLA
ZA
1 E
B
PLA
ZA
1 E
B30th
HV
2,7
88
2,1
00
2,3
00
2,5
00
2,7
00
2,9
00
3,1
00
3,3
00
050
10
01
50
20
0
Volume
Ho
ur
PLA
ZA
1 W
B
PLA
ZA
1 W
B30th
HV
1,8
01
1,2
00
1,4
00
1,6
00
1,8
00
2,0
00
2,2
00
2,4
00
2,6
00
050
10
01
50
20
0
Volume
Ho
ur
PLA
ZA
5 W
B
PLA
ZA
5 W
B30th
HV
2,1
82
1,6
00
1,8
00
2,0
00
2,2
00
2,4
00
2,6
00
050
10
015
020
0
Volume
Ho
ur
PLA
ZA
7 E
B
PLA
ZA
7 E
B30th
HV

2-12
Jane Addams Memorial Tollway
Illinois Tollway 2014 Traffic Data Report
4,1
86
3,8
00
4,0
00
4,2
00
4,4
00
4,6
00
050
10
015
020
0
Volume
Ho
ur
PLA
ZA
9 W
B
PLA
ZA
9 W
B30th
HV
4,4
50
4,0
00
4,2
00
4,4
00
4,6
00
4,8
00
5,0
00
5,2
00
5,4
00
05
010
015
020
0
Volume
Ho
ur
PLA
ZA
19
EB
PLA
ZA
19 E
B30th
HV
6,3
12
5,9
00
6,1
00
6,3
00
6,5
00
6,7
00
05
010
015
020
0
Volume
Ho
ur
PLA
ZA
17
WB
PLA
ZA
17 W
B3
0th
HV
MA
INLIN
E P
LA
ZA
HIG
HE
ST
HO
UR
LY
VO
LU
ME
3,9
56
3,6
00
3,8
00
4,0
00
4,2
00
4,4
00
050
10
01
50
20
0
Volume
Ho
ur
PLA
ZA
9 E
B
PLA
ZA
9 E
B30th
HV
FIG
UR
E 2
-F
FIG
UR
E 2
-E
FIG
UR
E 2
-H
FIG
UR
E 2
-G

2-13
Jane Addams Memorial Tollway
Illinois Tollway 2014 Traffic Data Report
FIGURE 2-I
FIGURE 2-J
FIGURE 2-K
AVERAGE DAILY TRAFFIC TRENDS
0
2
4
6
8
10
12
1980 1985 1990 1995 2000 2005 2010 2015
TRA
FFIC
(1,0
00s)
YEAR
PLAZA 2 EAST RIVERSIDE BOULEVARD
0
5
10
15
20
25
30
1980 1985 1990 1995 2000 2005 2010 2015
TRA
FFIC
(1
,000
s)
YEAR
PLAZA 3 SOUTH ROCKFORD
0
10
20
30
40
50
60
1980 1985 1990 1995 2000 2005 2010 2015
TRA
FFIC
(1,0
00s)
YEAR
PLAZA 1 SOUTH BELOIT
Plaza 3 removed in 2004.

2-14
Jane Addams Memorial Tollway
Illinois Tollway 2014 Traffic Data Report
0
1
2
3
4
5
6
1980 1985 1990 1995 2000 2005 2010 2015
TRA
FFIC
(1,0
00s)
YEAR
PLAZA 4 ILLINOIS ROUTE 173
FIGURE 2-L
0
10
20
30
40
50
1980 1985 1990 1995 2000 2005 2010 2015
TRA
FFIC
(1,0
00s)
YEAR
PLAZA 5 BELVIDERE
FIGURE 2-M
0
5
10
15
20
1980 1985 1990 1995 2000 2005 2010 2015
TRA
FFIC
(1,0
00s)
YEAR
PLAZA 6 ILLINOIS ROUTE 47
FIGURE 2-N
AVERAGE DAILY TRAFFIC TRENDS
Plaza 4 opened in 2007.
Plaza 5 converted to one way tolling (WB) in 2006.
Plaza 6 opened in 2014.

2-15
Jane Addams Memorial Tollway
Illinois Tollway 2014 Traffic Data Report
FIGURE 2-O
FIGURE 2-P
FIGURE 2-Q
AVERAGE DAILY TRAFFIC TRENDS
0
10
20
30
40
50
1980 1985 1990 1995 2000 2005 2010 2015
TRA
FFIC
(1,0
00s)
YEAR
PLAZA 7 MARENGO-HAMPSHIRE
0
20
40
60
80
100
1980 1985 1990 1995 2000 2005 2010 2015
TRA
FFIC
(1,0
00s)
YEAR
PLAZA 9 ELGIN
0
2
4
6
8
10
1980 1985 1990 1995 2000 2005 2010 2015
TRA
FFIC
(1,0
00s)
YEAR
PLAZA 8 RANDALL ROAD
Plaza 7 converted to one way tolling (EB) in 2006.
Ramps to and from the west opened in 1997

2-16
Jane Addams Memorial Tollway
Illinois Tollway 2014 Traffic Data Report
0
2
4
6
8
10
12
14
1980 1985 1990 1995 2000 2005 2010 2015
TRA
FFIC
(1,0
00s)
YEAR
PLAZA 10 BARRINGTON ROAD
FIGURE 2-R
0
5
10
15
20
25
30
1980 1985 1990 1995 2000 2005 2010 2015
TRA
FFIC
(1,0
00s)
YEAR
PLAZA 11 ILLINOIS ROUTE 31
FIGURE 2-S
0
2
4
6
8
10
12
14
1980 1985 1990 1995 2000 2005 2010 2015
TRA
FFIC
(1,0
00s)
YEAR
PLAZA 12 ROSELLE ROAD
FIGURE 2-T
AVERAGE DAILY TRAFFIC TRENDS
Plaza 10 opened in 1998 due to Plaza 15 reconfiguration.
Plaza 12 opened in 1998 due to Plaza 15 reconfiguration..
2-17
Jane Addams Memorial Tollway
Illinois Tollway 2014 Traffic Data Report
0
1
2
3
4
5
6
7
8
9
10
1980 1985 1990 1995 2000 2005 2010 2015
TRA
FFIC
(1
,000
s)
YEAR
PLAZA 13 ILLINOIS ROUTE 25
FIGURE 2-U
0
2
4
6
8
10
12
1980 1985 1990 1995 2000 2005 2010 2015
TRA
FFIC
(1
,000
s)
YEAR
PLAZA 14 ILLINOIS ROUTE 59
FIGURE 2-V
0
10
20
30
40
50
60
1980 1985 1990 1995 2000 2005 2010 2015
TRA
FFIC
(1
,000
s)
YEAR
PLAZA 15 I-290, ILLINOIS ROUTE 53
FIGURE 2-W
AVERAGE DAILY TRAFFIC TRENDS
Note: The Plaza 14 graph shows transactions at the EB I-90 to Illinois Route 59 collection point only. Transactions for the WB I-90 to Illinois Route 59 collection point are included with the Plaza 16 graph. Plazas opened in 1998 due to Plaza 15 reconfiguration.
Westbound tolls removed in 1997.

2-18
Jane Addams Memorial Tollway
Illinois Tollway 2014 Traffic Data Report
0
3
6
9
12
15
18
1980 1985 1990 1995 2000 2005 2010 2015
TRA
FFIC
(1,0
00s)
YEAR
PLAZA 16 BEVERLY ROAD
FIGURE 2-X
0
20
40
60
80
100
120
1980 1985 1990 1995 2000 2005 2010 2015
TRA
FFIC
(1,0
00s)
YEAR
PLAZA 17 DEVON AVENUE
FIGURE 2-Y
0
5
10
15
20
25
30
1980 1985 1990 1995 2000 2005 2010 2015
TRA
FFIC
(1,0
00s)
YEAR
PLAZA 18 ARLINGTON HEIGHTS ROAD
FIGURE 2-Z
AVERAGE DAILY TRAFFIC TRENDS
Note: The Plaza 16 graph shows transactions from two collection points: (1) WB I-90 to Illinois Route 59 (Plaza 16a) and (2) WB I-90 to Beverly Road (Plaza 16b). Plaza 16b opened in 1995.

2-19
Jane Addams Memorial Tollway
Illinois Tollway 2014 Traffic Data Report
0
10
20
30
40
50
60
70
80
90
1980 1985 1990 1995 2000 2005 2010 2015
TRA
FFIC
(1,0
00s)
YEAR
PLAZA 19 RIVER ROAD
FIGURE 2-AA
AVERAGE DAILY TRAFFIC TRENDS

2-20
Jane Addams Memorial Tollway
Illinois Tollway 2014 Traffic Data Report
0%
20%
40%
60%
80%
100%
120%
0:0
0
2:0
0
4:0
0
6:0
0
8:0
0
10
:00
12
:00
14
:00
16
:00
18
:00
20
:00
22
:00
% o
f Fre
e F
low
Sp
ee
d
Westbound
15th Percentile Median 85th Percentile
0%
20%
40%
60%
80%
100%
120%
140%
0:0
0
2:0
0
4:0
0
6:0
0
8:0
0
10
:00
12
:00
14
:00
16
:00
18
:00
20
:00
22
:00
% o
f Fre
e F
low
Sp
ee
d
Westbound
15th Percentile Median 85th Percentile
0%
20%
40%
60%
80%
100%
120%
140%
0:0
0
2:0
0
4:0
0
6:0
0
8:0
0
10
:00
12
:00
14
:00
16
:00
18
:00
20
:00
22
:00
% o
f Fre
e F
low
Sp
ee
d
Eastbound
15th Percentile Median 85th Percentile
FIGURE 2-AB
AVERAGE WEEKDAY SPEED DISTRIBUTIONS, EASTERN SECTION
FIGURE 2-AC
FIGURE 2-AD
AVERAGE WEEKDAY SPEED DISTRIBUTIONS, WESTERN SECTION
FIGURE 2-AE
0%
20%
40%
60%
80%
100%
120%
0:0
0
2:0
0
4:0
0
6:0
0
8:0
0
10
:00
12
:00
14
:00
16
:00
18
:00
20
:00
22
:00
% o
f Fre
e F
low
Sp
ee
d
Eastbound
15th Percentile Median 85th Percentile

2-21
Jane Addams Memorial Tollway
Illinois Tollway 2014 Traffic Data Report
AM
PM
AM
PM
AM
PM
AM
PM
AM
PM
AM
PM
1Ja
nu
ary
-M
arc
h53
49
1.1
31.2
31.7
01.6
23.0
4.2
1,6
44
2,3
59
44
61
2A
pri
l-Ju
ne
55
47
1.1
01.2
81.3
71.6
32.4
5.0
1,3
31
2,8
17
39
67
3Ju
ly-S
ep
tem
be
r53
47
1.1
41.2
91.3
71.7
52.9
5.0
1,6
05
2,8
33
44
73
4O
cto
be
r-D
ec
em
be
r55
46
1.0
91.2
91.3
21.7
32.1
5.1
1,0
65
2,8
81
40
74
Tota
l2
01
4 E
ntire
Ye
ar
54
47
1.1
11.2
71.4
41.6
82.6
4.8
1,4
11
2,7
22
42
69
Tota
l D
ela
y
(ve
h-h
rs /
10
00
VM
T)
Av
era
ge
Da
ily
De
lay
(ve
h-h
rs)
Pe
rce
nt
Co
ng
est
ed
Tra
ve
lQ
ua
rte
r
Pla
nn
ing
Tim
e I
nd
ex
Av
era
ge
Tra
ve
l Ti
me
Ind
ex
Av
era
ge
Sp
ee
d (
mp
h)
Ra
ng
e
FIG
UR
E 2
-AF
: R
OA
DW
AY
PE
RF
OR
MA
NC
E M
EA
SU
RE
S—
EA
ST
ER
N S
EC
TIO
N
Road
wa
y p
erf
orm
ance m
easure
s s
ections a
nd t
erm
s a
re d
efin
ed o
n p
ages 1
-5 a
nd 1
-6.
2-22
Jane Addams Memorial Tollway
Illinois Tollway 2014 Traffic Data Report
AM
PM
AM
PM
AM
PM
AM
PM
AM
PM
AM
PM
1Ja
nu
ary
-M
arc
h59
59
1.0
21.0
21.1
01.2
60.8
0.9
294
405
41
39
2A
pri
l-Ju
ne
58
58
1.0
41.0
31.0
81.0
71.0
0.8
404
402
60
58
3Ju
ly-S
ep
tem
be
r59
58
1.0
21.0
31.0
31.0
60.9
1.0
361
515
56
57
4O
cto
be
r-D
ec
em
be
r63
62
0.9
60.9
61.0
61.1
90.4
0.7
154
314
27
26
Tota
l2
01
4 E
ntire
Ye
ar
59
59
1.0
11.0
11.0
71.1
50.8
0.9
303
409
46
45
Qu
art
er
Ra
ng
e
Av
era
ge
Sp
ee
d (
mp
h)
Av
era
ge
Tra
ve
l Ti
me
Ind
ex
Tota
l D
ela
y
(ve
h-h
rs /
10
00
VM
T)
Pla
nn
ing
Tim
e I
nd
ex
Av
era
ge
Da
ily
De
lay
(ve
h-h
rs)
Pe
rce
nt
Co
ng
est
ed
Tra
ve
l
FIG
UR
E 2
-AG
: R
OA
DW
AY
PE
RF
OR
MA
NC
E M
EA
SU
RE
S—
WE
ST
ER
N S
EC
TIO
N
Road
wa
y p
erf
orm
ance m
easure
s s
ections a
nd t
erm
s a
re d
efin
ed o
n p
ages 1
-5 a
nd 1
-6.

2-23
Jane Addams Memorial Tollway
Illinois Tollway 2014 Traffic Data Report
MIL
E
PO
ST55 56 57 58 59 60 61 62 63 64 65 66 67 68 69 70 71 72 73 74 75 76 77 78
2223
2223
WES
TBO
UN
D
1011
1213
1415
16
EAST
BO
UN
D
1011
1213
1415
1618
01
23
45
1819
2021
1719
2021
176
78
96
78
90
12
34
5
290
Illin
ois
53
294
Illin
ois
31
Pla
za 1
7
Pla
za 1
9
51>5
0 m
ph25
20-3
0 m
ph
4540
-50
mph
1510
-20
mph
3530
-40
mph
5<1
0 m
ph
FIG
UR
E 2
-AH
: A
VE
RA
GE
SP
EE
D C
ON
TO
UR
S M
P 5
5.0
TO
78
.5

2-24
Jane Addams Memorial Tollway
Illinois Tollway 2014 Traffic Data Report
MIL
E
PO
ST
32
33
34
35
36
37
38
39
40
41
42
43
44
45
46
IL 4
74
7
48
49
50
51
52
53
54
2223
1011
1213
1415
1819
2021
1617
67
89
01
23
45
1819
2021
2213
1415
1617
EAST
BO
UN
DW
ESTB
OU
ND
110
12
34
56
78
910
2312
Illi
no
is
23
Illin
ois
47
Pla
za 9
Pla
za 7
Segm
ent pri
or
to m
ilep
ost 3
2 is o
mitte
d b
ecause
avera
ge
speeds d
o n
ot fa
ll be
low
50
mph.
51>5
0 m
ph25
20-3
0 m
ph
4540
-50
mph
1510
-20
mph
3530
-40
mph
5<1
0 m
ph
FIG
UR
E 2
-AI: A
VE
RA
GE
SP
EE
D C
ON
TO
UR
S M
P 3
2.0
TO
54
.5

Section 3Tri-State Tollway
2014
Tri-State Tollway
Section 3
Tri-State Tollway

Tri-State Tollway
3-1
Illinois Tollway 2014 Traffic Data Report
TABULATIONS TABLE PAGE
3-A Average Daily Traffic Volumes Between
Interchanges 1980 – 2014 (Northbound-1) 3-4
3-B Average Daily Traffic Volumes Between
Interchanges 1980 – 2014 (Northbound-2) 3-5
3-C Average Daily Traffic Volumes Between
Interchanges 1980 – 2014 (Southbound-1) 3-6
3-D Average Daily Traffic Volumes Between
Interchanges 1980 – 2014 (Southbound-2) 3-7
3-E General Statistics for Mainline Plazas 3-8
3-F Indexed Monthly Variation by Mainline Plaza 3-10
3-G Indexed Daily Variation by Mainline Plaza 3-10
3-H Annual Total Transactions by Toll Plaza 3-11
3-I Average Daily Traffic Data 3-12
ILLUSTRATIONS FIGURE PAGE
3-A Mainline Plaza Highest Hourly Volume Plaza 21 NB 3-13
3-B Mainline Plaza Highest Hourly Volume Plaza 21 SB 3-13
3-C Mainline Plaza Highest Hourly Volume Plaza 24 EB 3-13
3-D Mainline Plaza Highest Hourly Volume Plaza 24 WB 3-13
3-E Mainline Plaza Highest Hourly Volume Plaza 29 NB 3-14
3-F Mainline Plaza Highest Hourly Volume Plaza 33 SB 3-14
3-G Mainline Plaza Highest Hourly Volume Plaza 35 NB 3-14
3-H Mainline Plaza Highest Hourly Volume Plaza 35 SB 3-14
3-I Mainline Plaza Highest Hourly Volume Plaza 36 SB 3-15
3-J Mainline Plaza Highest Hourly Volume Plaza 39 NB 3-15
3-K Mainline Plaza Highest Hourly Volume Plaza 41 NB 3-15
3-L Mainline Plaza Highest Hourly Volume Plaza 41 SB 3-15
3-M Average Daily Traffic Trends Plaza 20 Buckley Road 3-16
3-N Average Daily Traffic Trends Plaza 21 Waukegan 3-16
3-O Average Daily Traffic Trends Plaza 22 Townline Road 3-16
3-P Average Daily Traffic Trends Plaza 23 Half Day Road 3-17
3-Q Average Daily Traffic Trends Plaza 24 Edens Spur 3-17
SECTION 3 Tri-State Tollway
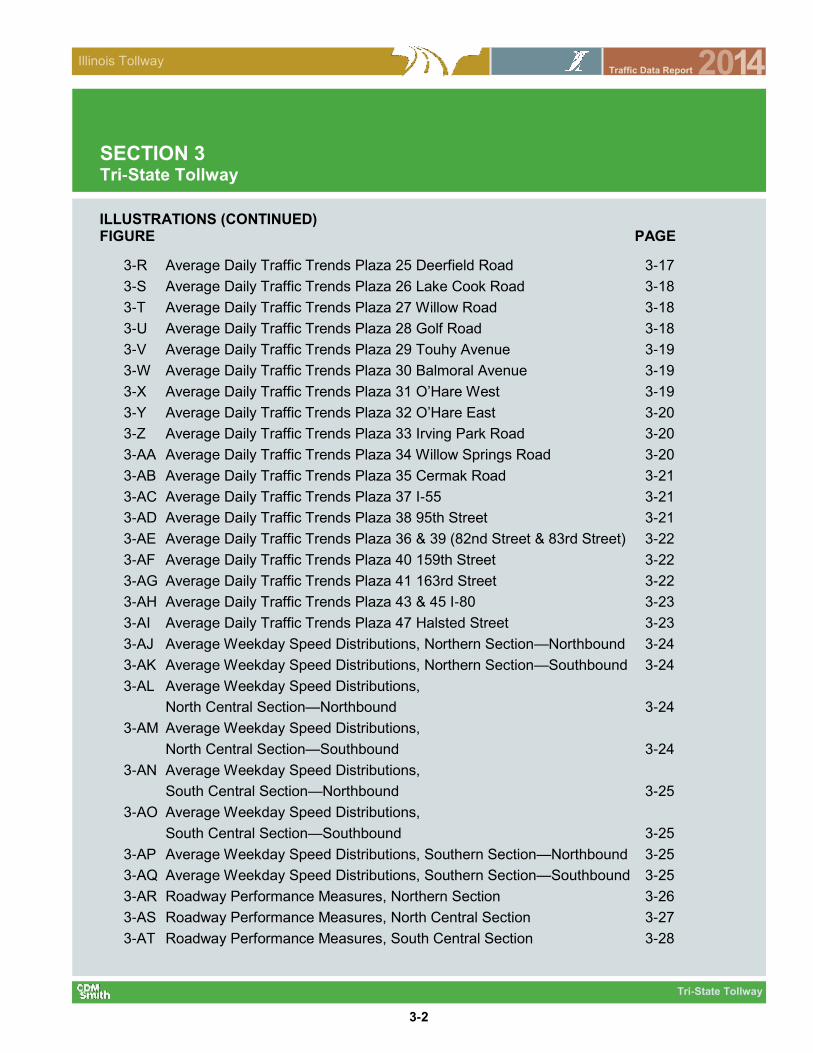
Tri-State Tollway
3-2
Illinois Tollway 2014 Traffic Data Report
ILLUSTRATIONS (CONTINUED) FIGURE PAGE
3-R Average Daily Traffic Trends Plaza 25 Deerfield Road 3-17
3-S Average Daily Traffic Trends Plaza 26 Lake Cook Road 3-18
3-T Average Daily Traffic Trends Plaza 27 Willow Road 3-18
3-U Average Daily Traffic Trends Plaza 28 Golf Road 3-18
3-V Average Daily Traffic Trends Plaza 29 Touhy Avenue 3-19
3-W Average Daily Traffic Trends Plaza 30 Balmoral Avenue 3-19
3-X Average Daily Traffic Trends Plaza 31 O’Hare West 3-19
3-Y Average Daily Traffic Trends Plaza 32 O’Hare East 3-20
3-Z Average Daily Traffic Trends Plaza 33 Irving Park Road 3-20
3-AA Average Daily Traffic Trends Plaza 34 Willow Springs Road 3-20
3-AB Average Daily Traffic Trends Plaza 35 Cermak Road 3-21
3-AC Average Daily Traffic Trends Plaza 37 I-55 3-21
3-AD Average Daily Traffic Trends Plaza 38 95th Street 3-21
3-AE Average Daily Traffic Trends Plaza 36 & 39 (82nd Street & 83rd Street) 3-22
3-AF Average Daily Traffic Trends Plaza 40 159th Street 3-22
3-AG Average Daily Traffic Trends Plaza 41 163rd Street 3-22
3-AH Average Daily Traffic Trends Plaza 43 & 45 I-80 3-23
3-AI Average Daily Traffic Trends Plaza 47 Halsted Street 3-23
3-AJ Average Weekday Speed Distributions, Northern Section—Northbound 3-24
3-AK Average Weekday Speed Distributions, Northern Section—Southbound 3-24
3-AL Average Weekday Speed Distributions,
North Central Section—Northbound 3-24
3-AM Average Weekday Speed Distributions,
North Central Section—Southbound 3-24
3-AN Average Weekday Speed Distributions,
South Central Section—Northbound 3-25
3-AO Average Weekday Speed Distributions,
South Central Section—Southbound 3-25
3-AP Average Weekday Speed Distributions, Southern Section—Northbound 3-25
3-AQ Average Weekday Speed Distributions, Southern Section—Southbound 3-25
3-AR Roadway Performance Measures, Northern Section 3-26
3-AS Roadway Performance Measures, North Central Section 3-27
3-AT Roadway Performance Measures, South Central Section 3-28
SECTION 3 Tri-State Tollway

Tri-State Tollway
3-3
Illinois Tollway 2014 Traffic Data Report
ILLUSTRATIONS (CONTINUED) FIGURE PAGE
3-AU Roadway Performance Measures, Southern Section 3-29
3-AV Average Speed Contours, I-94 MP 0.0 to 29.5 3-30
3-AW Average Speed Contours, I-294 MP 24.5 to 52.5 3-31
3-AX Average Speed Contours, I-294 MP 0.5 to 24.0 3-32
SECTION 3 Tri-State Tollway

3-4
Tri-State Tollway
Illinois Tollway 2014 Traffic Data Report
TABLE 3-A: AVERAGE DAILY TRAFFIC VOLUMES BETWEEN INTERCHANGES 1980-2014 (NORTHBOUND-1)
Bishop Ford Freeway/Calumet Expy 0.0
0.8 32,090 5.0 52,400 1.4 60,000 2.2 74,800 1.3 78,770
Lincoln Oasis 0.8
1.9 32,090 5.0 52,400 1.4 60,000 2.2 74,800 1.3 78,770
Halsted Street (PL47) 2.7
1.3 30,070 5.1 49,550 1.2 55,610 2.8 73,290 1.0 76,400
Wood Street 4.0
0.2 32,700 5.1 53,610 0.8 57,980 2.8 76,610 1.1 79,910
Dixie Highway 4.2
0.9 32,700 5.1 53,610 0.8 57,980 2.8 76,610 1.1 79,910
I-80 (PL43 & 45) 5.1
Toll Plaza 41 5.6 1.2 25,440 4.9 40,940 -0.4 39,520 2.4 49,880 1.4 52,740
159th Street (PL40) 6.3
1.7 24,250 4.9 39,250 1.6 45,790 1.0 50,740 1.7 54,180
I-57/147th Street 8.0
4.0 24,250 4.9 39,250 1.6 45,790 1.0 50,740 1.7 54,180
Cicero Avenue (Illinois Route 50) 12.0
5.5 26,970 4.9 43,610 2.9 58,210 -0.3 56,490 1.0 58,740
95th Street (PL38) 17.5
Toll Plaza 39 19.5 2.8 35,890 4.2 53,970 2.8 70,920 -0.7 66,260 1.8 71,060
79th Street/Archer Avenue 20.3
1.7 33,380 4.2 50,370 3.5 70,920 -0.7 66,260 1.8 71,060
Willow Springs Road (PL34) 22.0
1.1 33,380 4.2 50,370 3.5 71,300 -0.7 66,630 1.9 71,740
I-55 EB 23.1
0.2 31,230 4.2 47,190 3.4 65,740 -0.4 63,070 1.1 65,850
Wolf Road & I-55 WB 23.3
0.8 28,380 3.8 41,260 2.8 54,250 0.2 55,330 -0.2 54,870
Toll Plaza 37 (I-55) 24.1
0.9 45,400 3.3 62,620 2.0 76,420 0.8 83,150 -0.7 80,950
Hinsdale Oasis 25.0
2.4 45,400 3.3 62,620 2.4 79,570 0.8 86,270 -0.6 84,130
Ogden Avenue (U.S. Route 34) 27.4
1.6 44,710 3.5 62,980 2.1 77,300 1.0 85,260 -0.1 84,780
Reagan Connector 29.0
0.5 37,610 2.8 49,760 2.2 62,050 0.6 66,010 -0.5 64,660
Cermak Road 29.5
Toll Plaza 35 29.9 1.0 39,360 2.9 52,420 2.4 66,410 0.3 68,280 0.5 69,620
Roosevelt Road (IL38) 30.5
0.6 37,590 2.9 49,900 2.1 61,270 0.6 64,930 0.1 65,170
Reagan Memorial Tollway (I-88) 31.1
0.5 44,050 0.8 47,710 1.2 53,500 1.9 64,820 0.6 66,430
Eisenhower Expressway (I-290) 31.6
2.0 40,130 2.5 51,370 1.7 60,900 1.3 69,560 1.4 73,520
Illinois Route 64 & U.S. Route 20 33.6
4.2 47,320 2.6 61,300 1.9 74,020 1.0 81,990 1.4 86,720
O'Hare Oasis 37.8
0.5 47,320 2.6 61,300 1.9 74,020 1.0 81,990 1.4 86,720
Irving Park Road (Illinois Route 19) 38.3
Toll Plaza 33 38.9 1.5 53,050 3.1 71,830 1.7 85,080 1.0 93,650 1.6 99,620
Balmoral Avenue 39.8
Average
Annual
Percent
Change
ADT
2014
Location Mile
Post
Miles
Btwn.
Int.
ADT
1980
Average
Annual
Percent
Change
ADT
1990
Average
Annual
Percent
Change
ADT
2000
Average
Annual
Percent
Change
ADT
2010

3-5
Tri-State Tollway
Illinois Tollway 2014 Traffic Data Report
Balmoral Avenue 39.8
Kennedy Expressway (I-190) 40.5 1.1 53,050 3.1 71,830 1.7 85,080 1.0 93,650 -0.7 91,220
Jane Addams Interchange 40.9
Toll Plaza 29 41.6 1.2 45,770 4.1 68,690 2.0 83,800 -0.1 82,840 1.9 89,260
Touhy Avenue 42.1
2.1 39,730 4.3 60,690 2.1 74,390 0.3 76,590 1.9 82,470
Dempster Street (U.S. Route 14) 44.2
1.0 29,250 4.0 43,230 2.4 55,050 0.1 55,450 1.8 59,600
Golf Road (Illinois Route 58) 45.2
3.7 33,080 4.3 50,550 2.3 63,640 0.0 63,340 1.9 68,160
Willow Road (PL27) 48.9
3.9 21,750 6.6 41,210 2.9 55,010 0.1 55,480 1.7 59,300
Lake Cook Road 52.8
Edens Spur 30.0
2.3 8,120 8.5 18,300 2.3 22,880 -0.7 21,420 2.0 23,160
Waukegan Road 27.7
2.5 10,350 7.2 20,760 1.9 25,010 -0.3 24,280 2.4 26,670
Tri-State Tollway 25.2
Lake Cook Road / I-94 / I-294 25.2
1.0 32,100 6.0 57,460 2.0 69,970 0.9 76,390 1.7 81,620
Deerfield Road 24.2
2.4 29,180 5.6 50,360 2.3 63,280 1.4 72,870 1.6 77,760
Half Day Road (Illinois Route 22/PL 23) 21.8
2.9 28,600 5.5 48,980 2.5 62,960 0.8 68,200 1.7 73,100
Town Line Road (Illinois Route 60/PL 22) 18.9
0.8 26,050 5.8 45,830 2.9 61,020 0.2 62,510 2.0 67,620
Lake Forest Oasis 18.1
2.1 26,050 5.8 45,830 2.9 61,020 0.2 62,510 2.0 67,620
Rockland Avenue (Illinois Route 176) 16.0
2.2 24,220 5.6 41,940 3.1 56,670 0.3 58,280 2.0 63,180
Buckley Road (Illinois Route 137) 13.8
2.6 22,310 5.5 38,070 3.3 52,860 0.3 54,570 1.8 58,600
Belvidere Road (Illinois Route 120) 11.2
1.1 18,840 5.1 31,010 3.2 42,380 0.5 44,450 1.9 47,980
Milwaukee Avenue (Illinois Route 21) 10.1
1.7 19,580 5.2 32,400 3.3 44,640 0.6 47,290 1.9 50,940
Grand Avenue (Illinois Route 132) 8.4
Toll Plaza 21 4.8 6.0 13,440 5.6 23,220 2.8 30,650 0.4 31,920 2.1 34,630
Rosecrans Road (Illinois Route 173) 2.4
1.2 12,580 5.4 21,250 2.6 27,590 0.3 28,340 1.7 30,330
Mill Creek Road 1.2
0.4 12,580 5.4 21,250 2.6 27,590 0.3 28,340 1.7 30,330
Skokie Highway (U.S. Route 41) 0.8
I-294 Subtotal 52.8 1,127,390 3.8 1,637,790 2.0 2,001,520 0.8 2,174,770 1.0 2,260,510
Edens Spur Subtotal 4.8 18,470 7.8 39,060 2.1 47,890 -0.5 45,700 2.2 49,830
I-94 Subtotal 24.4 265,530 5.6 457,600 2.8 600,630 0.6 635,670 1.8 683,710
Tri-State Grand Total 82.0 1,411,390 4.2 2,134,450 2.2 2,650,040 0.8 2,856,140 1.2 2,994,050
Average
Annual
Percent
Change
ADT
2010
Location Mile
Post
Miles
Btwn.
Int.
ADT
1980
Average
Annual
Percent
Change
ADT
1990
Average
Annual
Percent
Change
ADT
2000
Average
Annual
Percent
Change
ADT
2014
TABLE 3-B: AVERAGE DAILY TRAFFIC VOLUMES BETWEEN INTERCHANGES 1980-2014 (NORTHBOUND-2)

3-6
Tri-State Tollway
Illinois Tollway 2014 Traffic Data Report
Bishop Ford Freeway/Calumet Expy 0.0
0.8 32,160 4.9 51,770 0.9 56,630 2.9 75,700 0.6 77,480
Lincoln Oasis 0.8
1.9 32,160 4.9 51,770 0.9 56,630 2.9 75,700 0.6 77,480
Halsted Street (Pl 47) 2.7
1.3 30,260 5.0 49,300 0.8 53,380 3.1 72,100 0.9 74,860
Wood Street 4.0
0.2 30,260 5.0 49,300 0.8 53,380 3.1 72,100 0.9 74,860
Dixie Highway 4.2
0.9 33,000 4.9 53,370 0.7 57,100 2.9 75,790 0.8 78,170
I-80 (PL 43 & 45) 5.1
Toll Plaza 41 5.6 1.2 25,850 4.7 40,770 -0.4 39,050 2.4 49,600 1.4 52,490
159th Street (PL46) 6.3
1.7 24,400 4.8 39,050 1.2 44,180 1.2 49,570 1.8 53,220
I-57/147th Street 8.0
4.0 24,400 4.8 39,050 1.2 44,180 1.2 49,570 1.8 53,220
Cicero Avenue (Illinois Route 50) 12.0
5.5 27,290 4.6 42,590 2.8 56,350 -0.4 54,280 2.0 58,730
95th Street (U.S. Routes 12&20) 17.5
Toll Plaza 36 19.5 2.8 35,750 4.0 53,170 2.9 70,920 -0.5 67,510 1.9 72,880
79th Street/Archer Avenue 20.3
1.7 30,530 4.0 45,290 3.8 65,790 -0.4 63,000 3.6 72,470
Willow Springs Road/75th Street 22.0
1.1 30,530 4.0 45,290 4.1 67,370 -0.4 64,420 0.4 65,510
Interstate 55 (No SB Ramps) 23.1
0.2 30,530 4.0 45,290 4.1 67,370 -0.4 64,420 0.3 65,310
Wolf Road & NB I-55 Entrance 23.3
0.8 27,460 3.3 37,980 3.6 54,270 0.2 55,200 0.4 56,000
Interstate 55 24.1
0.9 45,140 3.0 60,840 2.9 80,730 0.6 86,050 0.0 86,020
Hinsdale Oasis 25.0
2.4 45,140 3.0 60,840 2.9 80,730 0.6 86,050 0.0 86,020
Ogden Avenue (U.S. Route 34) 27.4
1.6 44,450 3.2 60,940 2.9 80,940 0.6 86,180 -0.2 85,610
Reagan Connector 29.0
0.5 37,400 2.5 47,760 3.7 68,440 -0.2 67,060 -0.6 65,470
Cermak Road 29.5
Toll Plaza 35 29.9 1.0 39,160 2.5 50,330 3.6 71,370 -0.3 69,070 0.4 70,060
Roosevelt Road (Illinois Route 38) 30.5
0.6 37,330 2.6 48,030 3.5 67,520 -0.4 65,020 0.1 65,210
Reagan Memorial Tollway (I-88) 31.1
0.5 43,340 4.2 65,600 2.9 87,710 0.4 91,100 0.5 92,900
Eisenhower Expressway (I-290) 31.6
2.0 39,180 2.5 50,360 3.4 70,590 0.6 74,620 1.2 78,310
Illinois Route 64 & U.S. Route 20 33.6
4.2 46,280 2.7 60,310 3.2 82,840 0.3 85,070 1.4 89,890
O'Hare Oasis 37.8
0.5 46,280 2.7 60,310 3.2 82,840 0.3 85,070 1.4 89,890
Irving Park Road (Illinois Route 19) 38.3
Toll Plaza 33 38.9 1.5 51,960 3.2 70,940 2.9 94,270 0.2 96,260 1.1 100,660
Balmoral Avenue 39.8
Average
Annual
Percent
Change
ADT
2014
Average
Annual
Percent
Change
ADT
2010
ADT
2000
ADT
1980
Average
Annual
Percent
Change
ADT
1990
Average
Annual
Percent
Change
Location Mile
Post
Miles
Btwn.
Int.
TABLE 3-C: AVERAGE DAILY TRAFFIC VOLUMES BETWEEN INTERCHANGES 1980-2014 (SOUTHBOUND-1)

3-7
Tri-State Tollway
Illinois Tollway 2014 Traffic Data Report
Balmoral Avenue 39.8
40.5 1.1 51,960 3.2 70,940 2.6 91,700 -0.2 90,200 0.9 93,600
O'Hare Interchange (I-90/I-294/I-190) 40.9
Toll Plaza 29 41.6 1.2 45,980 4.5 71,500 1.0 79,140 -0.1 78,040 2.9 87,430
Touhy Avenue 42.1
2.1 39,940 4.8 63,660 0.9 69,290 -0.1 68,920 2.7 76,600
Dempster Street (U.S. Route 14) 44.2
1.0 29,520 4.6 46,460 0.6 49,170 0.0 49,030 3.9 57,100
Golf Road (Illinois Route 58) 45.2
3.7 33,480 4.8 53,510 0.8 57,890 -0.1 57,080 3.5 65,420
Willow Road (PL27) 48.9
3.9 22,130 7.2 44,410 1.2 50,280 0.3 51,810 3.3 59,060
Lake Cook Road 52.8
Edens Expressway 30.0
2.3 8,500 8.0 18,420 2.3 23,100 -0.6 21,800 0.9 22,640
Waukegan Road 27.7
2.5 10,230 7.3 20,760 2.0 25,310 -0.1 25,010 2.2 27,280
Lake Cook Road / I-94 / I-294 25.2
Lake Cook Road / I-94 / I-294 25.2
1.0 32,360 6.5 60,480 1.6 70,900 0.8 76,560 2.8 85,640
Deerfield Road 24.2
2.4 29,260 6.2 53,160 2.0 64,960 0.7 69,920 3.5 80,130
Half Day Road (Illinois Route 22/PL23) 21.8
2.9 28,440 6.1 51,480 2.3 64,320 0.3 66,210 3.4 75,650
Town Line Road (Illinois Route 60/PL22) 18.9
0.8 25,900 6.4 48,000 2.6 62,080 -0.2 61,150 3.4 69,830
Lake Forest Oasis 18.1
2.1 25,900 6.4 48,000 2.6 62,080 -0.2 61,150 3.4 69,830
Rockland Road (Illinois Route 176) 16.0
2.2 24,080 6.2 43,780 2.8 57,680 0.0 57,430 3.4 65,620
Buckley Road (Illinois Route 137/PL20) 13.8
2.6 22,100 6.0 39,560 3.0 53,310 0.0 53,370 2.9 59,930
Belvidere Road (Illinois Route 120) 11.2
1.1 18,770 5.6 32,240 2.7 41,900 0.4 43,600 2.9 48,890
Milwaukee Avenue (Illinois Route 21) 10.1
1.7 19,580 5.5 33,590 2.8 44,350 0.5 46,680 2.7 51,860
Grand Avenue (Illinois Route 132) 8.4
Toll Plaza 21 4.8 6.0 13,520 5.8 23,690 2.8 31,270 0.5 32,730 2.0 35,450
Rosecrans Road (Illinois Route 173) 2.4
1.2 12,380 5.8 21,740 2.5 27,960 0.3 28,800 2.0 31,190
U.S. Route 41 1.2
0.4 11,410 5.7 19,830 2.8 26,110 3.4 36,630 2.6 40,620
Russell Road (West Terminus) 0.8
I-294 Subtotal 52.8 1,113,250 3.9 1,630,730 2.3 2,052,050 0.6 2,175,590 1.2 2,281,930
Edens Spur Subtotal 4.8 18,730 7.7 39,180 2.1 48,410 -0.3 46,810 1.6 49,920
I-94 Subtotal 24.4 263,700 6.1 475,550 2.5 606,920 0.4 634,230 3.0 714,640
Tri-State Grand Total 82.0 1,395,680 4.4 2,145,460 2.4 2,707,380 0.5 2,856,630 1.6 3,046,490
Average
Annual
Percent
Change
ADT
2014
Average
Annual
Percent
Change
ADT
2010
Location Mile
Post
Miles
Btwn.
Int.
ADT
1980
Average
Annual
Percent
Change
ADT
1990
Average
Annual
Percent
Change
ADT
2000
TABLE 3-D: AVERAGE DAILY TRAFFIC VOLUMES BETWEEN INTERCHANGES 1980-2014 (SOUTHBOUND-2)

3-8
Tri-State Tollway
Illinois Tollway 2014 Traffic Data Report
(cont’d)
TABLE 3-E: GENERAL STATISTICS FOR MAINLINE PLAZAS (Vehicles/Hour)
Mainline Plaza Dir. 30th HV Period Mean Med. Max. Min. Std. Dev. 85th %
4,161 AM Peak 1,446 1,464 1,896 603 213 1,647
PM Peak 3,221 3,241 3,931 1,534 324 3,495
OFF Peak 1,220 1,202 4,592 105 767 2,048
Weekend 1,492 1,409 4,547 74 1,019 2,560
Holidays 1,448 1,242 4,346 84 1,070 2,641
4,253 AM Peak 3,000 2,901 3,802 1,763 420 3,450
PM Peak 1,769 1,768 2,296 1,206 203 1,974
OFF Peak 1,258 1,356 2,933 110 751 2,086
Weekend 1,518 1,515 5,351 102 1,013 2,564
Holidays 1,467 1,418 4,510 121 1,017 2,494
2,659 AM Peak 2,356 2,390 2,820 1,219 273 2,608
PM Peak 1,727 1,728 2,138 877 202 1,932
OFF Peak 993 1,128 2,658 55 657 1,623
Weekend 1,103 1,222 2,657 54 689 1,849
Holidays 1,012 1,064 2,473 75 646 1,768
2,728 AM Peak 1,612 1,443 2,280 659 375 2,036
PM Peak 2,373 2,406 2,791 1,138 245 2,597
OFF Peak 991 1,002 2,740 65 670 1,769
Weekend 1,059 1,038 2,927 86 678 1,820
Holidays 990 897 2,880 56 703 1,748
8,608 AM Peak 7,474 7,469 9,073 3,803 923 8,400
PM Peak 7,045 7,067 8,303 3,994 696 7,754
OFF Peak 3,382 3,697 8,406 244 2,145 5,629
Weekend 3,359 3,465 8,456 287 2,017 5,399
Holidays 3,102 3,078 7,837 302 1,947 5,113
8,543 AM Peak 6,745 6,174 8,569 3,440 1,241 8,163
PM Peak 7,745 7,948 8,818 4,418 789 8,308
OFF Peak 3,942 4,174 8,809 260 2,507 7,053
Weekend 3,853 3,934 8,538 348 2,248 6,299
Holidays 3,526 3,418 7,888 334 2,209 5,997
33 Irving Park
Road
SB
29 Touhy Avenue NB
24 Edens Spur EB
WB
21 Waukegan NB
SB

3-9
Tri-State Tollway
Illinois Tollway 2014 Traffic Data Report
AM Peak = Weekday 6:00 AM To 8:00 AM Except Fridays PM Peak = Weekday 4:00 PM To 6:00 PM Except Fridays OFF Peak = Weekday 5:00 AM To 10:00 PM Except AM and PM Peak Periods Weekend = Fridays, Saturdays, and Sundays Holidays = See Page 1-6 for a list of Holidays.
TABLE 3-E: GENERAL STATISTICS FOR MAINLINE PLAZAS (Vehicles/Hour)
Mainline Plaza Dir. 30th HV Period Mean Med. Max. Min. Std. Dev. 85th %
6,118 AM Peak 5,356 5,338 6,293 2,499 623 5,995
PM Peak 4,851 4,912 5,877 2,302 468 5,242
OFF Peak 2,657 2,872 5,556 163 1,576 4,380
Weekend 2,711 2,737 6,175 266 1,598 4,500
Holidays 2,558 2,524 5,877 291 1,559 4,262
5,811 AM Peak 4,252 4,147 5,221 1,829 649 4,955
PM Peak 4,936 5,021 5,676 2,643 443 5,316
OFF Peak 2,802 2,837 6,000 225 1,698 4,662
Weekend 2,708 2,762 5,947 235 1,559 4,495
Holidays 2,562 2,419 5,901 226 1,578 4,590
7,252 AM Peak 3,951 3,894 4,950 1,743 636 4,643
PM Peak 6,718 6,882 7,651 3,601 583 7,111
OFF Peak 2,864 2,866 7,092 170 1,801 4,680
Weekend 2,749 2,706 7,477 209 1,703 4,449
Holidays 2,668 2,430 7,387 212 1,773 4,598
7,434 AM Peak 6,573 6,693 7,728 3,621 772 7,326
PM Peak 4,621 4,678 5,563 2,523 488 5,059
OFF Peak 2,674 2,738 5,909 158 1,586 4,459
Weekend 2,721 2,669 7,361 287 1,664 4,502
Holidays 2,627 2,632 6,978 243 1,654 4,420
5,016 AM Peak 4,391 4,456 5,197 2,220 558 4,909
PM Peak 3,340 3,385 4,248 1,790 428 3,733
OFF Peak 1,998 2,083 4,299 121 1,127 3,273
Weekend 2,069 2,029 4,920 193 1,230 3,512
Holidays 1,943 1,860 4,688 185 1,214 3,435
5,096 AM Peak 2,631 2,606 3,433 1,030 488 3,183
PM Peak 4,426 4,599 5,126 2,835 506 4,837
OFF Peak 2,068 2,127 5,078 115 1,198 3,330
Weekend 2,044 1,977 5,468 176 1,234 3,355
Holidays 1,909 1,684 5,246 143 1,256 3,298
41 163rd
Street NB
SB
39 83rd
Street NB
36 82nd
Street SB
35 Cermak Road NB
SB

3-10
Tri-State Tollway
Illinois Tollway 2014 Traffic Data Report
TABLE 3-F: INDEXED MONTHLY VARIATION BY MAINLINE PLAZA
TABLE 3-G: INDEXED DAILY VARIATION BY MAINLINE PLAZA
Table 3-G includes Monthly Variation
MonthWau-
kegan
Edens
Spur
Touhy
Avenue
Irving
Park
Cermak
Road
82nd
Street
83rd
Street
163rd
Street
January 0.78 0.81 0.85 0.84 0.82 0.81 0.81 0.80
February 0.84 0.87 0.91 0.90 0.88 0.88 0.88 0.87
March 0.90 0.91 0.95 0.95 0.95 0.94 0.94 0.95
April 0.97 0.99 1.01 1.00 1.01 1.00 1.01 1.02
May 1.04 1.05 1.04 1.03 1.05 1.04 1.04 1.08
June 1.10 1.08 1.07 1.07 1.08 1.08 1.08 1.12
July 1.18 1.12 1.08 1.06 1.08 1.09 1.09 1.15
August 1.19 1.11 1.06 1.06 1.08 1.09 1.08 1.13
September 1.04 1.05 1.03 1.04 1.03 1.03 1.03 1.05
October 1.04 1.05 1.06 1.07 1.06 1.06 1.06 1.05
November 0.97 0.98 0.98 0.99 0.99 1.00 1.00 0.89
December 0.95 0.97 0.96 0.98 0.99 0.99 0.99 0.87
Month DayWau-
kegan
Edens
Spur
Touhy
Avenue
Irving
Park
Cermak
Road
82nd
Street
83rd
Street
163rd
Street
Monday 1.14 1.11 1.07 1.08 1.09 1.10 1.10 1.13
Tuesday 1.10 1.07 1.05 1.05 1.06 1.07 1.06 1.10
Wednesday 1.14 1.12 1.08 1.08 1.08 1.09 1.09 1.12
Thursday 1.13 1.09 1.05 1.05 1.06 1.08 1.06 1.11
Friday 1.16 1.11 1.06 1.04 1.06 1.08 1.05 1.12
Saturday 1.25 1.11 1.09 1.09 1.10 1.13 1.10 1.21
Sunday 1.34 1.20 1.11 1.13 1.13 1.14 1.16 1.21
Monday 1.00 1.00 0.99 1.01 1.01 1.04 1.02 0.92
Tuesday 1.04 1.00 0.98 1.01 1.02 1.04 1.04 0.93
Wednesday 0.97 0.96 0.94 0.96 0.97 0.97 0.98 0.86
Thursday 0.91 0.92 0.92 0.94 0.94 0.93 0.94 0.80
Friday 0.93 0.95 0.94 0.98 0.97 0.97 0.98 0.85
Saturday 0.95 0.99 0.98 1.00 1.00 1.00 0.99 0.88
Sunday 0.86 0.93 0.94 0.94 0.94 0.96 0.95 0.84
August
December

3-11
Tri-State Tollway
Illinois Tollway 2014 Traffic Data Report
Plaza Percentage
Code* Change
20 Buckley Road R 2,551,144 2,563,842 0.5%
21 Waukegan M 24,393,817 25,575,051 4.8%
22 Townline Road R 3,829,366 3,874,003 1.2%
23 Half Day Road R 3,672,556 3,724,079 1.4%
24 Edens Spur M 19,535,361 19,684,350 0.8%
26 Lake Cook Road R 5,721,249 6,078,916 6.3%
27 Willow Road R 5,776,776 6,030,447 4.4%
28 Golf Road R 5,837,567 6,162,764 5.6%
29 Touhy Avenue M1 32,077,806 32,577,292 1.6%
30 Balmoral Avenue E1 2,606,923 3,065,154 17.6%
31 O'Hare West R1 7,904,066 7,874,026 -0.4%
32 O'Hare East R1 5,691,314 6,018,569 5.8%
33 Irving Park Road M1 35,132,882 36,743,640 4.6%
34 75th Street, Willow Springs Road R 2,139,293 2,346,333 9.7%
35 Cermak Road M 49,265,874 50,983,089 3.5%
36 82nd Street M1 25,305,641 26,598,708 5.1%
37 I-55 / 147th Street R 21,136,829 21,802,448 3.1%
38 95th Street R 4,898,319 5,110,348 4.3%
39 83rd Street M1 25,077,224 25,934,781 3.4%
40 159th Street R 3,268,926 3,341,351 2.2%
41 163rd Street M 37,630,991 38,403,743 2.1%
42 I-57** E 1,285,321
43 I-80 Westbound A 12,358,479 12,268,486 -0.7%
45 I-80 Eastbound A 11,989,491 11,817,712 -1.4%
47 Halsted Street R 7,635,797 7,594,868 -0.5%
Tri-State Total 355,437,691 367,459,321 3.4%
Plaza 2013 2014
* M=Mainline / R=Ramp / A=Attended Ramp Plaza / E=Electronic Toll Collection Only Ramp
1=Toll Collected in One Direction Only
** Plaza 42 opened October 2014
TABLE 3-H: ANNUAL TOTAL TRANSACTIONS BY TOLL PLAZA

3-12
Tri-State Tollway
Illinois Tollway 2014 Traffic Data Report
Average Trip
Vehicles Vehicle Miles Transactions Length (Miles)
1959 42,944 1,074,421 87,977 25.02
1960 53,665 1,423,119 114,591 26.52
1961 63,040 1,508,414 113,413 23.93
1962 79,567 1,716,653 149,996 21.57
1963 81,865 1,538,064 135,872 18.79
1964 83,177 1,576,375 140,729 18.95
1965 96,141 1,791,966 161,958 18.64
1966 104,898 2,070,944 189,068 19.74
1967 113,248 2,264,510 211,941 20.00
1968 124,197 2,499,952 255,161 20.13
1969 145,335 2,795,118 285,279 19.23
1970 150,204 2,993,741 305,965 19.93
1971 165,910 3,324,444 340,539 20.04
1972 177,740 3,435,183 352,056 19.33
1973 196,462 3,684,032 386,527 18.75
1974 206,074 3,814,440 404,858 18.51
1975 212,313 3,815,435 407,611 17.97
1976 234,136 4,147,527 442,435 17.71
1977 252,032 4,472,743 475,766 17.75
1978 268,655 4,748,560 504,534 17.68
1979 274,714 4,870,270 520,258 17.73
1980 264,698 4,804,154 508,555 18.15
1981 279,965 4,905,922 522,890 17.52
1982 281,782 4,818,745 519,152 17.10
1983 291,652 5,001,519 532,111 17.15
1984 310,008 5,493,171 583,129 17.72
1985 327,277 5,660,998 603,292 17.30
1986 348,651 6,227,866 654,517 17.86
1987 367,191 6,233,335 685,226 16.98
1988 396,711 7,132,315 749,395 17.98
1989 410,352 7,364,825 771,395 17.95
1990 425,089 7,501,631 779,065 17.65
1991 478,355 7,607,215 797,157 15.90
1992 494,963 7,283,706 781,630 14.72
1993 499,598 7,205,338 782,631 14.42
1994 491,071 8,254,734 859,181 16.81
1995 520,320 8,814,694 916,329 16.94
1996 540,460 9,090,414 945,831 16.82
1997 562,300 9,257,833 971,481 16.46
1998 577,930 9,408,676 975,821 16.28
1999 576,220 9,404,524 893,630 16.32
2000 590,900 9,632,552 916,723 16.30
2001 601,820 9,775,171 933,313 16.24
2002 615,200 10,263,261 965,408 16.68
2003 626,950 10,515,023 989,952 16.77
2004 634,390 10,611,992 1,003,291 16.73
2005 594,220 9,982,878 936,432 16.80
2006 537,400 9,956,325 927,615 18.53
2007 563,600 10,132,520 964,388 17.98
2008 581,370 9,101,117 894,275 15.65
2009 578,140 8,992,194 886,512 15.55
2010 624,360 9,979,253 955,841 15.98
2011 638,210 10,128,377 982,468 15.87
2012 628,660 9,752,805 940,793 15.51
2013 645,820 10,242,864 973,802 15.86
2014 662,630 10,551,115 1,006,738 15.92
YearAverage Daily Total
TABLE 3-I: AVERAGE DAILY TRAFFIC DATA

3-13
Tri-State Tollway
Illinois Tollway 2014 Traffic Data Report
MA
INLIN
E P
LA
ZA
HIG
HE
ST
HO
UR
LY
VO
LU
ME
4,2
53
3,2
00
3,4
00
3,6
00
3,8
00
4,0
00
4,2
00
4,4
00
4,6
00
4,8
00
5,0
00
050
10
01
50
20
0
Volume
Ho
ur
PLA
ZA
21
SB
PLA
ZA
21
SB
30th
HV
FIG
UR
E 3
-B
4,1
61
3,2
00
3,4
00
3,6
00
3,8
00
4,0
00
4,2
00
4,4
00
4,6
00
050
10
01
50
20
0
Volume
Ho
ur
PLA
ZA
21
NB
PLA
ZA
21 N
B3
0th
HV
FIG
UR
E 3
-A
2,7
28
2,3
00
2,5
00
2,7
00
2,9
00
3,1
00
050
10
01
50
20
0
Volume
Ho
ur
PLA
ZA
24
WB
PLA
ZA
24 W
B3
0th
HV
FIG
UR
E 3
-D
2,6
59
2,4
00
2,6
00
2,8
00
3,0
00
050
10
01
50
20
0
Volume
Ho
ur
PLA
ZA
24
EB
PLA
ZA
24 E
B3
0th
HV
FIG
UR
E 3
-C

3-14
Tri-State Tollway
Illinois Tollway 2014 Traffic Data Report
8,5
43
8,0
00
8,2
00
8,4
00
8,6
00
8,8
00
050
10
015
020
0
Volume
Ho
ur
PLA
ZA
33
SB
PLA
ZA
33 S
B30th
HV
FIG
UR
E 3
-G
6,1
18
5,4
00
5,6
00
5,8
00
6,0
00
6,2
00
6,4
00
05
01
00
15
02
00
Volume
Ho
ur
PLA
ZA
35
NB
PLA
ZA
35 N
B3
0th
HV
FIG
UR
E 3
-H
5,8
11
5,5
00
5,7
00
5,9
00
6,1
00
6,3
00
050
10
01
50
20
0
Volume
Ho
ur
PLA
ZA
35
SB
PLA
ZA
35 S
B3
0th
HV
FIG
UR
E 3
-E
8,6
08
8,0
00
8,2
00
8,4
00
8,6
00
8,8
00
9,0
00
9,2
00
9,4
00
050
10
01
50
20
0
Volume
Ho
ur
PLA
ZA
29
NB
PLA
ZA
29 N
B3
0th
HV
FIG
UR
E 3
-F
MA
INLIN
E P
LA
ZA
HIG
HE
ST
HO
UR
LY
VO
LU
ME
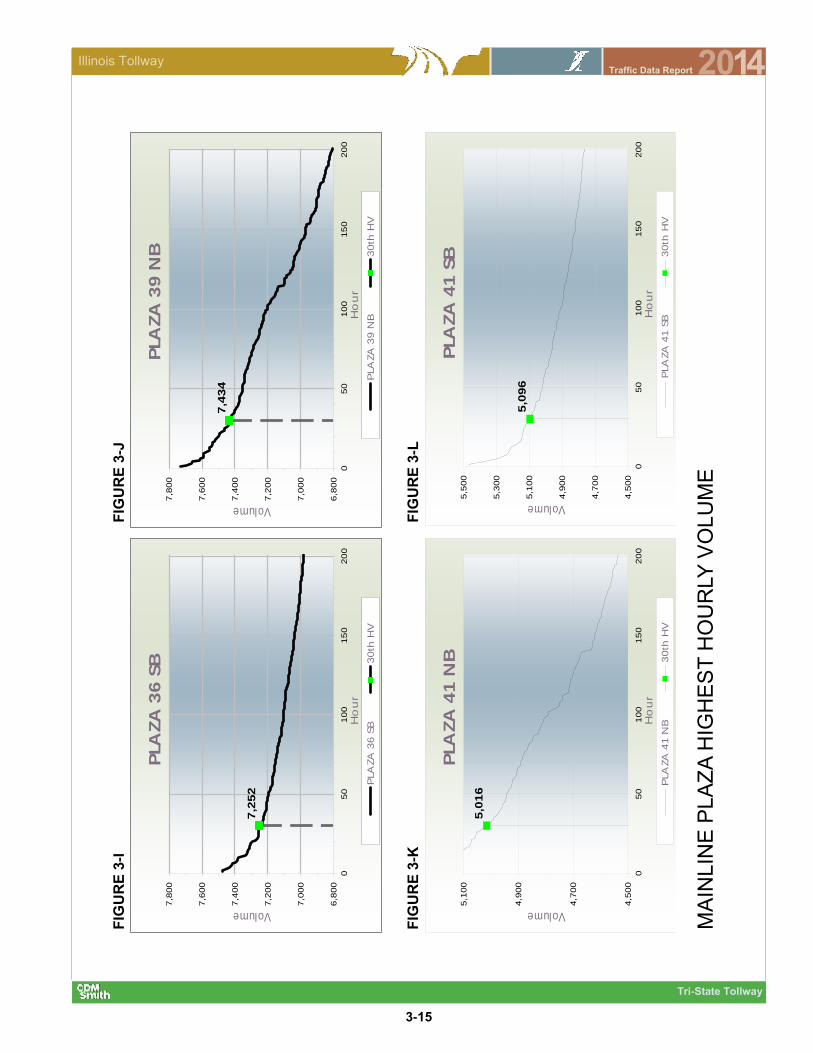
3-15
Tri-State Tollway
Illinois Tollway 2014 Traffic Data Report
7,4
34
6,8
00
7,0
00
7,2
00
7,4
00
7,6
00
7,8
00
050
10
01
50
20
0
Volume
Ho
ur
PLA
ZA
39
NB
PLA
ZA
39 N
B30th
HV
FIG
UR
E 3
-K
5,0
16
4,5
00
4,7
00
4,9
00
5,1
00
05
01
00
15
02
00
Volume
Ho
ur
PLA
ZA
41
NB
PLA
ZA
41 N
B3
0th
HV
FIG
UR
E 3
-L
5,0
96
4,5
00
4,7
00
4,9
00
5,1
00
5,3
00
5,5
00
050
10
01
50
20
0
Volume
Ho
ur
PLA
ZA
41
SB
PLA
ZA
41 S
B3
0th
HV
7,2
52
6,8
00
7,0
00
7,2
00
7,4
00
7,6
00
7,8
00
050
10
01
50
20
0
Volume
Ho
ur
PLA
ZA
36
SB
PLA
ZA
36 S
B3
0th
HV
FIG
UR
E 3
-I
FIG
UR
E 3
-J
MA
INLIN
E P
LA
ZA
HIG
HE
ST
HO
UR
LY
VO
LU
ME

3-16
Tri-State Tollway
Illinois Tollway 2014 Traffic Data Report
FIGURE 3-O
0
2
4
6
8
10
12
1980 1985 1990 1995 2000 2005 2010 2015
TRA
FFIC
(1,0
00s)
YEAR
PLAZA 22 TOWNLINE ROAD
FIGURE 3-N
0
10
20
30
40
50
60
70
80
1980 1985 1990 1995 2000 2005 2010 2015
TRA
FFIC
(1,0
00s)
YEAR
PLAZA 21 WAUKEGAN
FIGURE 3-M
0
2
4
6
8
10
1980 1985 1990 1995 2000 2005 2010 2015
TRA
FFIC
(1,0
00s)
YEAR
PLAZA 20 BUCKLEY ROAD
AVERAGE DAILY TRAFFIC TRENDS
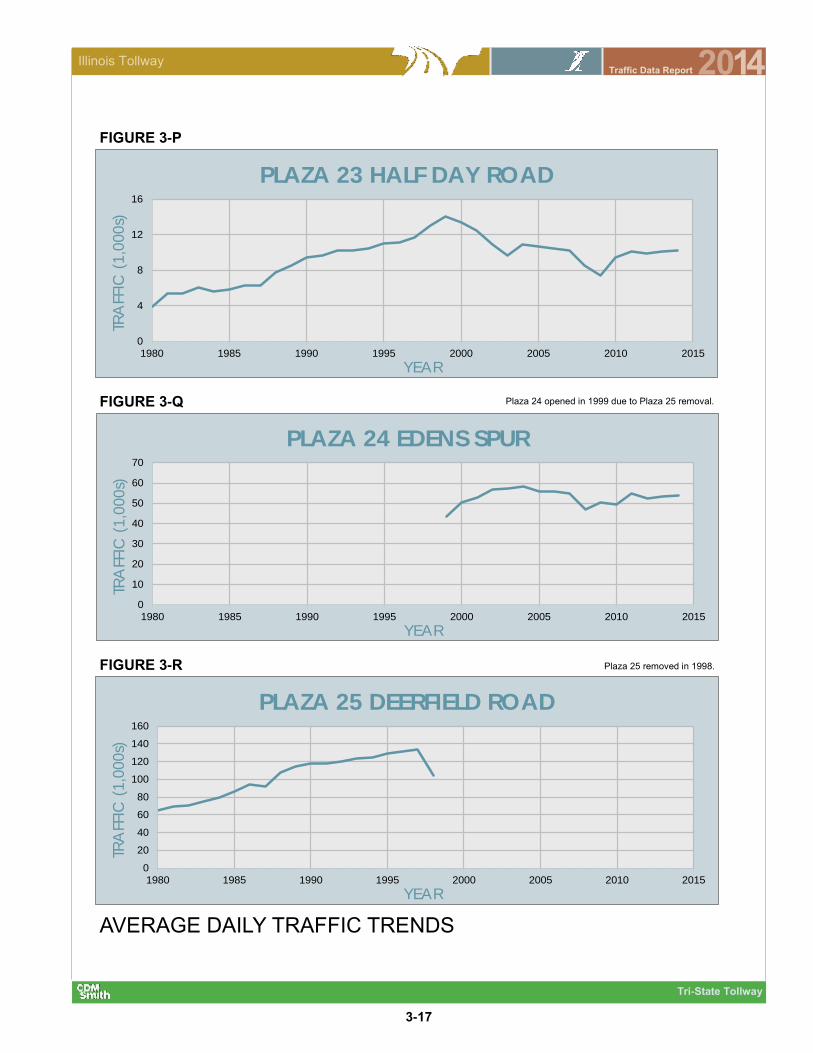
3-17
Tri-State Tollway
Illinois Tollway 2014 Traffic Data Report
FIGURE 3-R
0
20
40
60
80
100
120
140
160
1980 1985 1990 1995 2000 2005 2010 2015
TRA
FFIC
(1,0
00s)
YEAR
PLAZA 25 DEERFIELD ROAD
FIGURE 3-Q
0
10
20
30
40
50
60
70
1980 1985 1990 1995 2000 2005 2010 2015
TRA
FFIC
(1,0
00s)
YEAR
PLAZA 24 EDENS SPUR
FIGURE 3-P
0
4
8
12
16
1980 1985 1990 1995 2000 2005 2010 2015
TRA
FFIC
(1
,000
s)
YEAR
PLAZA 23 HALF DAY ROAD
AVERAGE DAILY TRAFFIC TRENDS
Plaza 24 opened in 1999 due to Plaza 25 removal.
Plaza 25 removed in 1998.

3-18
Tri-State Tollway
Illinois Tollway 2014 Traffic Data Report
FIGURE 3-U
0
5
10
15
20
1980 1985 1990 1995 2000 2005 2010 2015
TRA
FFIC
(1,0
00s)
YEAR
PLAZA 28 GOLF ROAD
0
5
10
15
20
25
30
35
1980 1985 1990 1995 2000 2005 2010 2015
TRA
FFIC
(1,0
00s)
YEAR
PLAZA 27 WILLOW ROAD
FIGURE 3-T
0
5
10
15
20
1980 1985 1990 1995 2000 2005 2010 2015
TRA
FFIC
(1,0
00s)
YEAR
PLAZA 26 LAKE COOK ROAD
FIGURE 3-S
AVERAGE DAILY TRAFFIC TRENDS
Toll collection at Plaza 27 was moved from ramps to/from the south to ramps to/from the north due to Plaza 25 removal.
Toll collection at Plaza 26 was moved from ramps to/from the south to ramps to/from the north due to Plaza 25 removal.
Plaza 28 opened in 1998 due to Plaza 25 removal.

3-19
Tri-State Tollway
Illinois Tollway 2014 Traffic Data Report
FIGURE 3-X
0
5
10
15
20
25
1980 1985 1990 1995 2000 2005 2010 2015
TRA
FFIC
(1,0
00s)
YEAR
PLAZA 31 O'HARE WEST
FIGURE 3-W
0
2
4
6
8
10
12
1980 1985 1990 1995 2000 2005 2010 2015
TRA
FFIC
(1,0
00s)
YEAR
PLAZA 30 BALMORAL AVENUE
FIGURE 3-V
0
20
40
60
80
100
1980 1985 1990 1995 2000 2005 2010 2015
TRA
FFIC
(1
,000
s)
YEAR
PLAZA 29 TOUHY AVENUE
AVERAGE DAILY TRAFFIC TRENDS
Plaza 30 opened December, 2011.

3-20
Tri-State Tollway
Illinois Tollway 2014 Traffic Data Report
FIGURE 3-AA
0
2
4
6
8
10
1980 1985 1990 1995 2000 2005 2010 2015
TRA
FFIC
(1,0
00s)
YEAR
PLAZA 34 WILLOW SPRINGS ROAD
FIGURE 3-Z
0
20
40
60
80
100
120
1980 1985 1990 1995 2000 2005 2010 2015
TRA
FFIC
(1,0
00s)
YEAR
PLAZA 33 IRVING PARK ROAD
FIGURE 3-Y
0
5
10
15
20
25
30
1980 1985 1990 1995 2000 2005 2010 2015
TRA
FFIC
(1,0
00s)
YEAR
PLAZA 32 O'HARE EAST
AVERAGE DAILY TRAFFIC TRENDS
Plaza 34 opened in 1994 due to the replacement of southbound Plaza 39 with Plaza 36.

3-21
Tri-State Tollway
Illinois Tollway 2014 Traffic Data Report
FIGURE 3-AD
0
4
8
12
16
1980 1985 1990 1995 2000 2005 2010 2015
TRA
FFIC
(1,0
00s)
YEAR
PLAZA 38 95th STREET
FIGURE 3-AC
0
20
40
60
80
1980 1985 1990 1995 2000 2005 2010 2015
TRA
FFIC
(1,0
00s)
YEAR
PLAZA 37 I-55
FIGURE 3-AB
0
40
80
120
160
1980 1985 1990 1995 2000 2005 2010 2015
TRA
FFIC
(1
,000
s)
YEAR
PLAZA 35 CERMAK ROAD
AVERAGE DAILY TRAFFIC TRENDS

3-22
Tri-State Tollway
Illinois Tollway 2014 Traffic Data Report
FIGURE 3-AG
0
20
40
60
80
100
120
1980 1985 1990 1995 2000 2005 2010 2015
TRA
FFIC
(1,0
00s)
YEAR
PLAZA 41 163rd STREET
FIGURE 3-AF
0
5
10
15
20
25
1980 1985 1990 1995 2000 2005 2010 2015
TRA
FFIC
(1,0
00s)
YEAR
PLAZA 40 159th STREET
FIGURE 3-AE
0
30
60
90
120
150
180
1980 1985 1990 1995 2000 2005 2010 2015
TRA
FFIC
(1,0
00s)
YEAR
PLAZA 36 & 39 (82nd STREET & 83rd STREET)
AVERAGE DAILY TRAFFIC TRENDS

3-23
Tri-State Tollway
Illinois Tollway 2014 Traffic Data Report
FIGURE 3-AI
0
5
10
15
20
25
1980 1985 1990 1995 2000 2005 2010 2015
TRA
FFIC
(1
,000
s)
YEAR
PLAZA 47 HALSTED STREET
FIGURE 3-AH
0
20
40
60
80
1980 1985 1990 1995 2000 2005 2010 2015
TRA
FFIC
(1,0
00s)
YEAR
PLAZA 43 & 45 I-80
AVERAGE DAILY TRAFFIC TRENDS

3-24
Tri-State Tollway
Illinois Tollway 2014 Traffic Data Report
0%
20%
40%
60%
80%
100%
120%
0:0
0
2:0
0
4:0
0
6:0
0
8:0
0
10
:00
12
:00
14
:00
16
:00
18
:00
20
:00
22
:00
% o
f Fre
e F
low
Sp
ee
d
Southbound
15th Percentile Median 85th Percentile
0%
20%
40%
60%
80%
100%
120%
140%
0:0
0
2:0
0
4:0
0
6:0
0
8:0
0
10
:00
12
:00
14
:00
16
:00
18
:00
20
:00
22
:00
% o
f Fre
e F
low
Sp
ee
d
Northbound
15th Percentile Median 85th Percentile
0%
20%
40%
60%
80%
100%
120%
140%
0:0
0
2:0
0
4:0
0
6:0
0
8:0
0
10
:00
12
:00
14
:00
16
:00
18
:00
20
:00
22
:00
% o
f Fre
e F
low
Sp
ee
d
Westbound
15th Percentile Median 85th Percentile
FIGURE 3-AJ
AVERAGE WEEKDAY SPEED DISTRIBUTIONS, NORTHERN SECTION
FIGURE 3-AK
0%
20%
40%
60%
80%
100%
120%
140%
0:0
0
2:0
0
4:0
0
6:0
0
8:0
0
10
:00
12
:00
14
:00
16
:00
18
:00
20
:00
22
:00
% o
f Fre
e F
low
Sp
ee
d
Eastbound
15th Percentile Median 85th Percentile
FIGURE 3-AL
AVERAGE WEEKDAY SPEED DISTRIBUTIONS, NORTH CENTRAL SECTION
FIGURE 3-AM

3-25
Tri-State Tollway
Illinois Tollway 2014 Traffic Data Report
0%
20%
40%
60%
80%
100%
120%
0:0
0
2:0
0
4:0
0
6:0
0
8:0
0
10
:00
12
:00
14
:00
16
:00
18
:00
20
:00
22
:00
% o
f Fre
e F
low
Sp
ee
d
Southbound
15th Percentile Median 85th Percentile
0%
20%
40%
60%
80%
100%
120%
0:0
0
2:0
0
4:0
0
6:0
0
8:0
0
10
:00
12
:00
14
:00
16
:00
18
:00
20
:00
22
:00
% o
f Fre
e F
low
Sp
ee
d
Northbound
15th Percentile Median 85th Percentile
0%
20%
40%
60%
80%
100%
120%
0:0
0
2:0
0
4:0
0
6:0
0
8:0
0
10
:00
12
:00
14
:00
16
:00
18
:00
20
:00
22
:00
% o
f Fre
e F
low
Sp
ee
d
Southbound
15th Percentile Median 85th Percentile
0%
20%
40%
60%
80%
100%
120%
0:0
0
2:0
0
4:0
0
6:0
0
8:0
0
10
:00
12
:00
14
:00
16
:00
18
:00
20
:00
22
:00
% o
f Fre
e F
low
Sp
ee
d
Northbound
15th Percentile Median 85th Percentile
FIGURE 3-AN
AVERAGE WEEKDAY SPEED DISTRIBUTIONS, SOUTH CENTRAL SECTION
FIGURE 3-AO
FIGURE 3-AP
AVERAGE WEEKDAY SPEED DISTRIBUTIONS, SOUTHERN SECTION
FIGURE 3-AQ
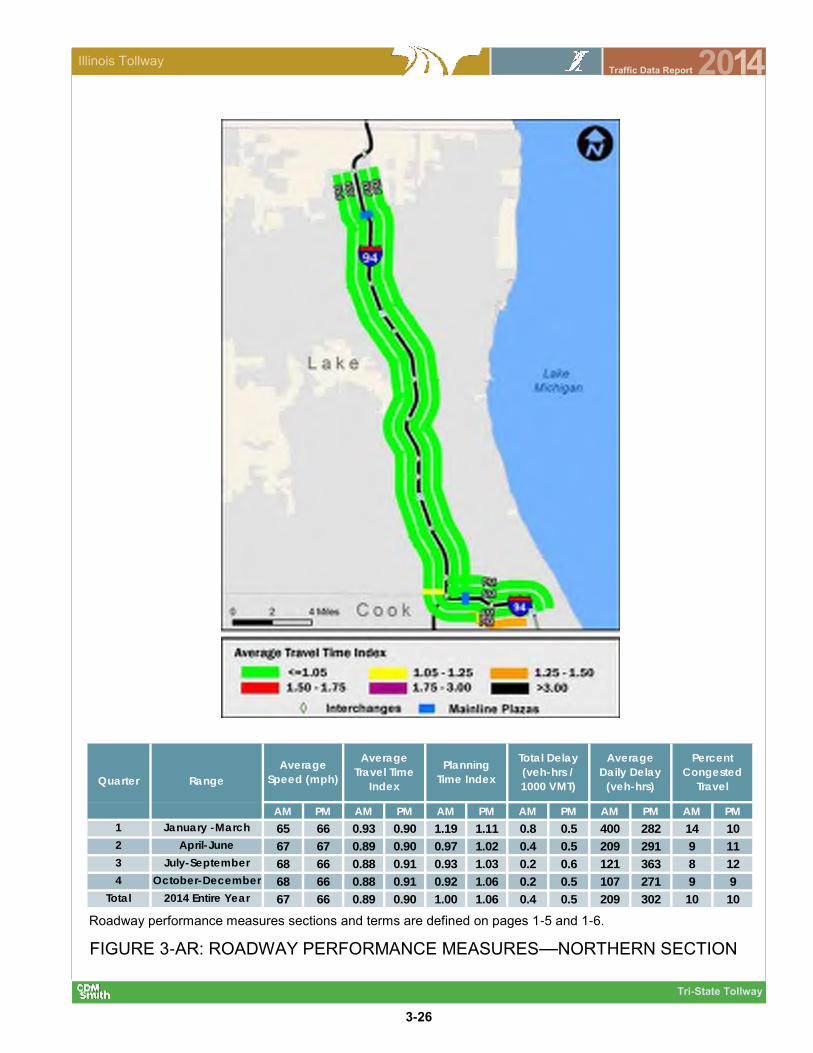
3-26
Tri-State Tollway
Illinois Tollway 2014 Traffic Data Report
AM PM AM PM AM PM AM PM AM PM AM PM
1 January -March 65 66 0.93 0.90 1.19 1.11 0.8 0.5 400 282 14 10
2 April-June 67 67 0.89 0.90 0.97 1.02 0.4 0.5 209 291 9 11
3 July-September 68 66 0.88 0.91 0.93 1.03 0.2 0.6 121 363 8 12
4 October-December 68 66 0.88 0.91 0.92 1.06 0.2 0.5 107 271 9 9
Total 2014 Entire Year 67 66 0.89 0.90 1.00 1.06 0.4 0.5 209 302 10 10
Total Delay
(veh-hrs /
1000 VMT)
Average
Travel Time
Index
Planning
Time IndexQuarter
Percent
Congested
TravelRange
Average
Speed (mph)
Average
Daily Delay
(veh-hrs)
Roadway performance measures sections and terms are defined on pages 1-5 and 1-6.
FIGURE 3-AR: ROADWAY PERFORMANCE MEASURES—NORTHERN SECTION

3-27
Tri-State Tollway
Illinois Tollway 2014 Traffic Data Report
AM PM AM PM AM PM AM PM AM PM AM PM
1 January -March 59 40 1.01 1.52 1.26 2.34 1.3 9.6 440 3,302 40 46
2 April-June 62 33 0.97 1.83 1.01 2.62 0.8 14.6 310 5,460 33 52
3 July-September 61 35 0.99 1.73 1.04 2.69 1.0 12.8 373 4,804 35 56
4 October-December 61 36 0.98 1.67 1.01 2.45 1.0 12.0 340 4,358 35 47
Total 2014 Entire Year 61 36 0.99 1.69 1.08 2.53 1.0 12.3 366 4,481 36 50
Planning
Time Index
Total Delay
(veh-hrs /
1000 VMT)Quarter Range
Average
Speed (mph)
Average
Travel Time
Index
Average
Daily Delay
(veh-hrs)
Percent
Congested
Travel
Roadway performance measures sections and terms are defined on pages 1-5 and 1-6.
FIGURE 3-AS: ROADWAY PERFORMANCE MEASURES—NORTH CENTRAL
SECTION
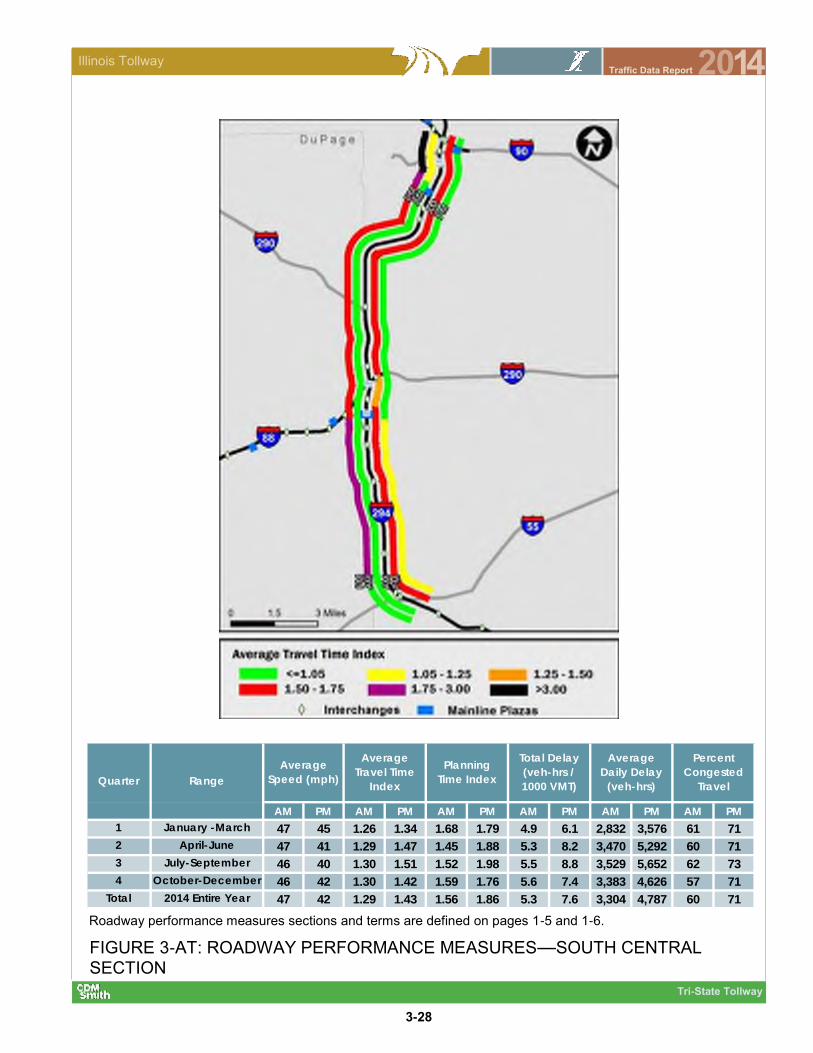
3-28
Tri-State Tollway
Illinois Tollway 2014 Traffic Data Report
AM PM AM PM AM PM AM PM AM PM AM PM
1 January -March 47 45 1.26 1.34 1.68 1.79 4.9 6.1 2,832 3,576 61 71
2 April-June 47 41 1.29 1.47 1.45 1.88 5.3 8.2 3,470 5,292 60 71
3 July-September 46 40 1.30 1.51 1.52 1.98 5.5 8.8 3,529 5,652 62 73
4 October-December 46 42 1.30 1.42 1.59 1.76 5.6 7.4 3,383 4,626 57 71
Total 2014 Entire Year 47 42 1.29 1.43 1.56 1.86 5.3 7.6 3,304 4,787 60 71
Quarter Range
Average
Speed (mph)
Average
Travel Time
Index
Planning
Time Index
Percent
Congested
Travel
Total Delay
(veh-hrs /
1000 VMT)
Average
Daily Delay
(veh-hrs)
Roadway performance measures sections and terms are defined on pages 1-5 and 1-6.
FIGURE 3-AT: ROADWAY PERFORMANCE MEASURES—SOUTH CENTRAL
SECTION

3-29
Tri-State Tollway
Illinois Tollway 2014 Traffic Data Report
AM PM AM PM AM PM AM PM AM PM AM PM
1 January -March 54 61 1.11 0.99 1.39 1.24 2.7 0.9 1,528 562 42 27
2 April-June 53 61 1.13 0.99 1.36 1.18 3.1 0.9 1,930 614 42 24
3 July-September 53 56 1.13 1.07 1.40 1.31 2.9 2.1 1,863 1,415 47 32
4 October-December 54 60 1.11 1.00 1.36 1.12 2.8 1.1 1,601 707 43 25
Total 2014 Entire Year 54 59 1.12 1.01 1.38 1.21 2.9 1.3 1,731 825 44 27
Average
Speed (mph)
Average
Travel Time
IndexQuarter Range
Planning
Time Index
Average
Daily Delay
(veh-hrs)
Total Delay
(veh-hrs /
1000 VMT)
Percent
Congested
Travel
Roadway performance measures sections and terms are defined on pages 1-5 and 1-6.
FIGURE 3-AU: ROADWAY PERFORMANCE MEASURES, SOUTHERN SECTION

3-30
Tri-State Tollway
Illinois Tollway 2014 Traffic Data Report
MIL
E
PO
ST
0 1 2 3 4 5 6 7 8 9 10
11
12
13
14
15
16
17
18
19
20
21
22
23
24
25
26
27
28
29
EAST
BO
UN
DW
ESTB
OU
ND
110
12
34
56
78
910
2312
1314
1516
1718
1920
2122
110
12
34
56
78
910
2312
1314
1516
1718
1920
2122
294
Pla
za 2
1
Illin
ois
173
Illi
no
is
137
Illin
ois
22
Illi
no
is
43
Pla
za 2
4
Illin
ois
132
Illi
no
is
60
51>5
0 m
ph25
20-3
0 m
ph
4540
-50
mph
1510
-20
mph
3530
-40
mph
5<1
0 m
ph
FIG
UR
E 3
-AV
: A
VE
RA
GE
SP
EE
D C
ON
TO
UR
S M
P 0
.0 to 2
9.5
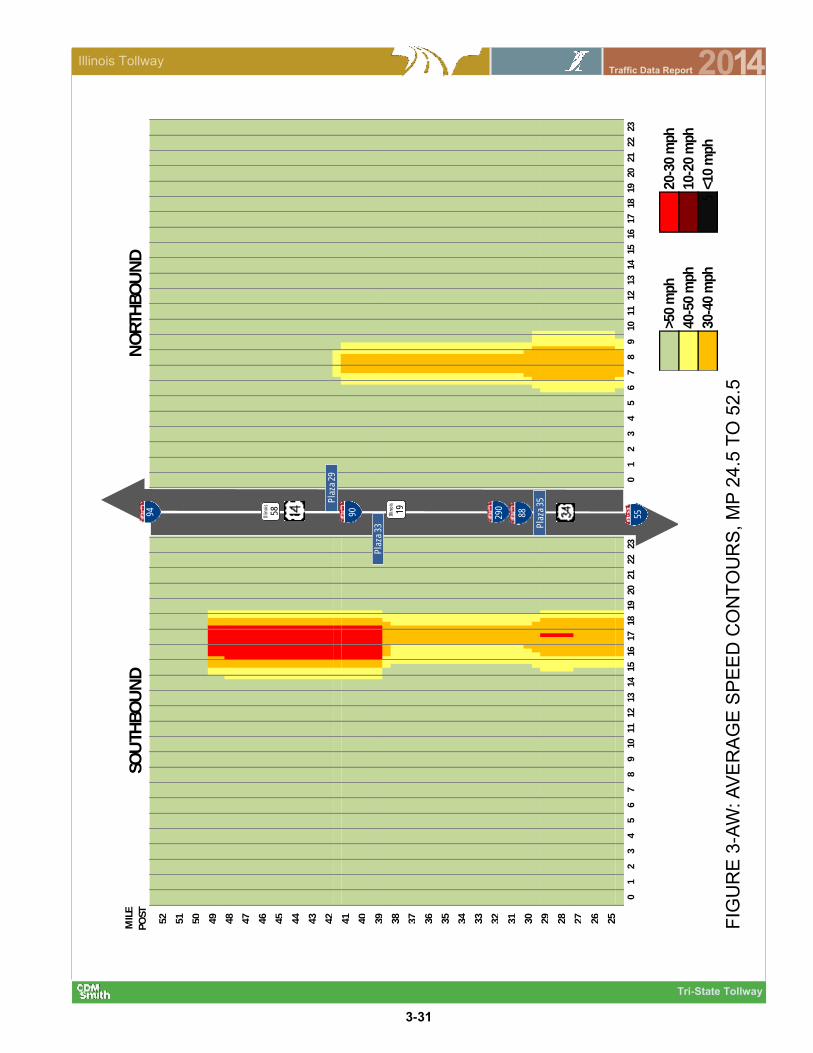
3-31
Tri-State Tollway
Illinois Tollway 2014 Traffic Data Report
MIL
E
PO
ST
52 51 50 49 48 47 46 45 44 43 42 41I-
90
40 39 38 37 36 35 34 33 32 31 30 29 28 27 26 25
13
SOU
THB
OU
ND
NO
RTH
BO
UN
D
01
23
45
67
89
1011
121
1415
1617
1819
2021
2223
013
23
45
67
89
1011
1220
2122
2314
1516
1718
19
90 88290
Pla
za 3
5
Pla
za 3
3
Pla
za 2
9
94 55Illin
ois
19
Illin
ois
58
51>5
0 m
ph25
20-3
0 m
ph
4540
-50
mph
1510
-20
mph
3530
-40
mph
5<1
0 m
ph
FIG
UR
E 3
-AW
: A
VE
RA
GE
SP
EE
D C
ON
TO
UR
S,
MP
24
.5 T
O 5
2.5
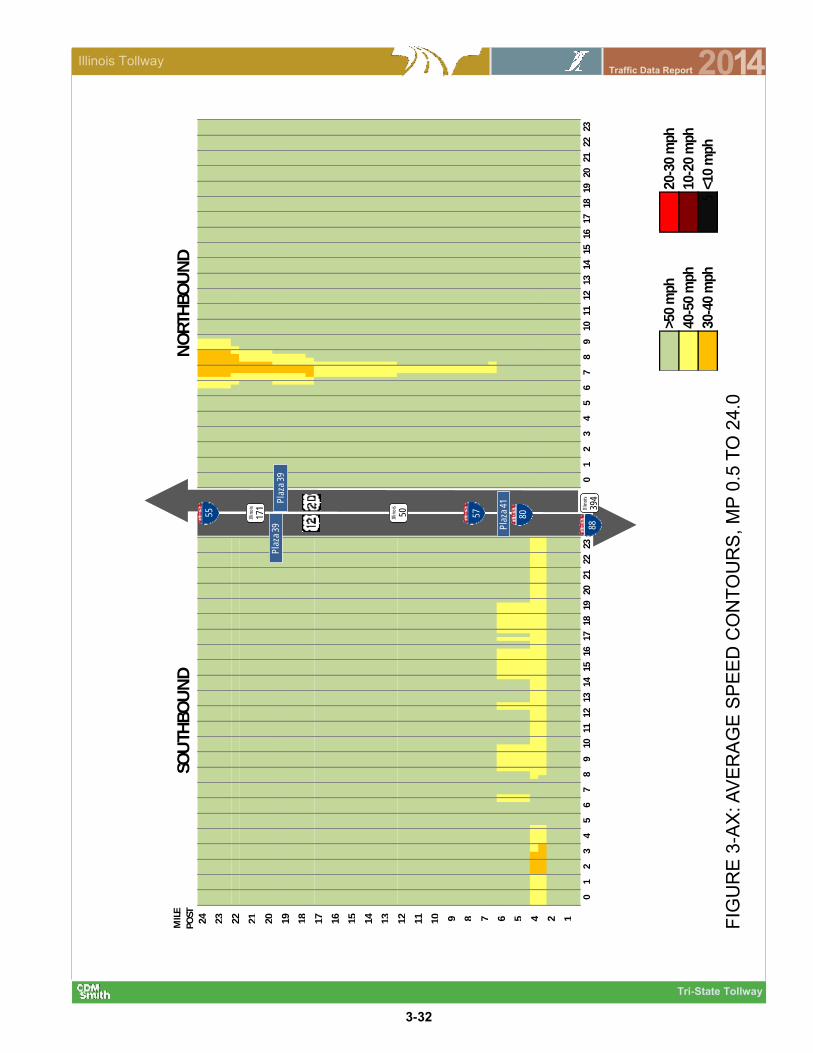
3-32
Tri-State Tollway
Illinois Tollway 2014 Traffic Data Report
MIL
E
PO
ST
24 23 22 21 20 19 18 17 16 15 14 13 12 11 10 9 8 7 6 5 4 2 1
13
SOU
THB
OU
ND
NO
RTH
BO
UN
D
01
23
45
67
89
1011
121
1415
1617
1819
2021
2223
013
23
45
67
89
1011
1220
2122
2314
1516
1718
19
55 57
Illin
ois
394
88Pla
za 4
1
80Illin
ois
50
Pla
za 3
9P
laza
39
Illin
ois
171
51>5
0 m
ph25
20-3
0 m
ph
4540
-50
mph
1510
-20
mph
3530
-40
mph
5<1
0 m
ph
FIG
UR
E 3
-AX
: A
VE
RA
GE
SP
EE
D C
ON
TO
UR
S,
MP
0.5
TO
24.0

Section 4Reagan Memorial Tollway
2014
Reagan Memorial Tollway
Section 4
Reagan Mem
orial Tollw
ay


Reagan Memorial Tollway
4-1
Illinois Tollway 2014 Traffic Data Report
TABULATIONS TABLE PAGE
4-A Average Daily Traffic Volumes Between
Interchanges 1980 – 2014 (Westbound) 4-4
4-B Average Daily Traffic Volumes Between
Interchanges 1980 – 2014 (Eastbound) 4-5
4-C General Statistics for Mainline Plazas 4-6
4-D Indexed Monthly Variation by Mainline Plaza 4-8
4-E Indexed Daily Variation by Mainline Plaza 4-8
4-F Annual Total Transactions by Toll Plaza 4-9
4-G Average Daily Traffic Data 4-10
ILLUSTRATIONS FIGURE PAGE
4-A Mainline Plaza Highest Hourly Volume Plaza 51 WB 4-11
4-B Mainline Plaza Highest Hourly Volume Plaza 52 EB 4-11
4-C Mainline Plaza Highest Hourly Volume Plaza 61 EB 4-11
4-D Mainline Plaza Highest Hourly Volume Plaza 61 WB 4-11
4-E Mainline Plaza Highest Hourly Volume Plaza 66 EB 4-12
4-F Mainline Plaza Highest Hourly Volume Plaza 66 WB 4-12
4-G Mainline Plaza Highest Hourly Volume Plaza 69 EB 4-12
4-H Mainline Plaza Highest Hourly Volume Plaza 69 WB 4-12
4-I Average Daily Traffic Trends Plaza 51 York Road 4-13
4-J Average Daily Traffic Trends Plaza 52 Meyers Road 4-13
4-K Average Daily Traffic Trends Plaza 53 Spring Road 4-13
4-L Average Daily Traffic Trends Plaza 54 Illinois Route 83 4-14
4-M Average Daily Traffic Trends Plaza 55 Midwest Road 4-14
4-N Average Daily Traffic Trends Plaza 56 Highland Avenue 4-14
4-O Average Daily Traffic Trends Plaza 57 Naperville Road 4-15
4-P Average Daily Traffic Trends Plaza 58 Winfield Road 4-15
4-Q Average Daily Traffic Trends Plaza 59 Farnsworth Avenue 4-15
4-R Average Daily Traffic Trends Plaza 60 Eola Road 4-16
4-S Average Daily Traffic Trends Plaza 61 Aurora 4-16
4-T Average Daily Traffic Trends Plaza 63 Illinois Route 31 4-16
SECTION 4 Reagan Memorial Tollway

Reagan Memorial Tollway
4-2
Illinois Tollway 2014 Traffic Data Report
ILLUSTRATIONS (CONTINUED) FIGURE PAGE
4-U Average Daily Traffic Trends Plaza 64 Orchard Road 4-17
4-V Average Daily Traffic Trends Plaza 65 Peace Road 4-17
4-W Average Daily Traffic Trends Plaza 66 DeKalb 4-17
4-X Average Daily Traffic Trends Plaza 67 Annie Glidden Road 4-18
4-Y Average Daily Traffic Trends Plaza 69 Dixon 4-18
4-Z Average Daily Traffic Trends Plaza 70 Illinois Route 26 West 4-18
4-AA Average Daily Traffic Trends Plaza 71 Illinois Route 26 East 4-19
4-AB Average Weekday Speed Distributions, Eastern Section—Eastbound 4-20
A-AC Average Weekday Speed Distributions, Eastern Section—Westbound 4-20
4-AD Average Weekday Speed Distributions, Western Section—Eastbound 4-20
4-AE Average Weekday Speed Distributions, Western Section—Westbound 4-20
4-AF Roadway Performance Measures, Eastern Section 4-21
4-AG Roadway Performance Measures, Western Section 4-22
4-AH Average Speed Contours, MP 117.0 to 140.0 4-23
SECTION 4 Reagan Memorial Tollway

4-3
Reagan Memorial Tollway
Illinois Tollway 2014 Traffic Data Report
This Page Is Intentionally Left Blank

4-4
Reagan Memorial Tollway
Illinois Tollway 2014 Traffic Data Report
TABLE 4-A: AVERAGE DAILY TRAFFIC VOLUMES BETWEEN INTERCHANGES 1980-2014 (WESTBOUND)
Eisenhower Expressway (I-290) 140.40.4 18,400 7.3 37,260 3.1 50,620 -0.7 47,270 3.1 53,430
Reagan Memorial Tollway (I-88) 140.01.1 24,050 5.4 40,610 3.6 57,780 2.0 70,480 -2.1 64,650
Harger (York) Road 138.90.2 24,690 5.5 42,130 3.6 60,170 1.8 71,920 -2.1 66,080
Tollway South Leg 138.7
Toll Plaza 51 138.1 0.9 31,790 5.7 55,350 3.1 75,420 0.4 78,160 2.5 86,200
Spring Road (PL53) 137.80.7 31,670 5.9 55,970 3.1 76,280 0.3 78,570 2.8 87,760
Kingery Highway (Illinois Route 83) 137.10.7 30,050 5.7 52,230 3.2 71,470 0.4 74,580 2.9 83,640
Midwest Road (PL55) 136.4
Toll Plaza 52 135.1 2.1 28,230 6.0 50,500 3.5 71,470 0.4 74,580 2.9 83,640
Highland Avenue (PL56) 134.31.1 21,780 8.2 47,890 3.7 69,030 0.5 72,210 2.7 80,400
Veterans Memorial Tollway (E. Int) 133.21.9 21,780 7.8 46,120 3.3 64,090 -0.2 62,720 1.5 66,680
Veterans Memorial Tollway (W. Int) 131.31.3 21,780 9.4 53,340 3.7 76,590 0.6 81,220 1.3 85,480
Illinois Route 53 130.02.4 15,840 11.0 44,890 4.2 68,020 0.8 73,810 1.3 77,830
Naperville Road (PL57) 127.62.4 13,130 10.1 34,280 5.7 59,400 1.4 68,510 1.0 71,180
Winfield Road (PL58) 125.21.9 13,130 10.1 34,280 3.8 49,840 2.4 63,030 1.7 67,340
Illinois Route 59 123.31.9 8,260 10.4 22,160 4.1 33,140 4.3 50,400 1.4 53,370
Eola Road (PL60) 121.42.2 8,260 10.4 22,160 4.1 33,140 3.9 48,470 1.0 50,370
Farnsworth Avenue (PL59) 119.2
Toll Plaza 61 117.8 2.2 6,870 9.4 16,900 4.0 24,970 4.4 38,250 1.5 40,590
Illinois Route 31 (PL63) 117.02.6 5,340 9.6 13,320 3.6 18,990 5.3 31,690 1.7 33,840
Orchard Road (PL64) 114.41.1 5,340 7.9 11,420 2.8 15,110 3.9 22,100 1.8 23,740
Illinois Route 56 113.34.0 3,170 7.7 6,680 3.8 9,710 3.5 13,740 2.4 15,110
Illinois Route 47 109.315.3 3,640 7.4 7,440 4.0 11,020 3.4 15,350 2.1 16,670
Peace Road (PL65) 94.00.7 2,550 7.4 5,230 5.2 8,680 3.7 12,440 1.3 13,080
DeKalb Oasis 93.31.9 2,550 7.4 5,230 5.2 8,680 3.7 12,440 1.3 13,080
Annie Glidden Road (PL67) 91.4
Toll Plaza 66 86.2 12.9 2,010 8.3 4,480 5.4 7,550 2.3 9,480 4.0 11,070
Interstate 39 78.52.4 2,010 8.4 4,500 4.8 7,200 1.8 8,610 0.9 8,910
U.S. Route 51 (Illinois Route 251) 76.1
Toll Plaza 69 56.4 22.2 2,350 5.5 4,030 5.0 6,570 1.3 7,460 0.4 7,590
Illinois Route 26 (Dixon) 53.99.7 2,510 4.3 3,820 4.5 5,920 2.0 7,220 0.5 7,360
U.S. Route 30 West Terminus 44.2
Subtotal 96.2 351,180 7.5 722,220 3.7 1,040,860 1.4 1,194,710 1.5 1,269,090
Reagan Connector 1.4 7,100 6.4 13,220 1.4 15,250 2.4 19,260 1.1 20,120
Grand Total 97.6 358,280 7.5 735,440 3.7 1,056,110 1.4 1,213,970 1.5 1,289,210
Average
Annual
Percent
Change
ADT
2014
Location Mile
Post
Miles
Btwn.
Int.
Average
Annual
Percent
Change
ADT
2010
ADT
1980
Average
Annual
Percent
Change
ADT
1990
Average
Annual
Percent
Change
ADT
2000
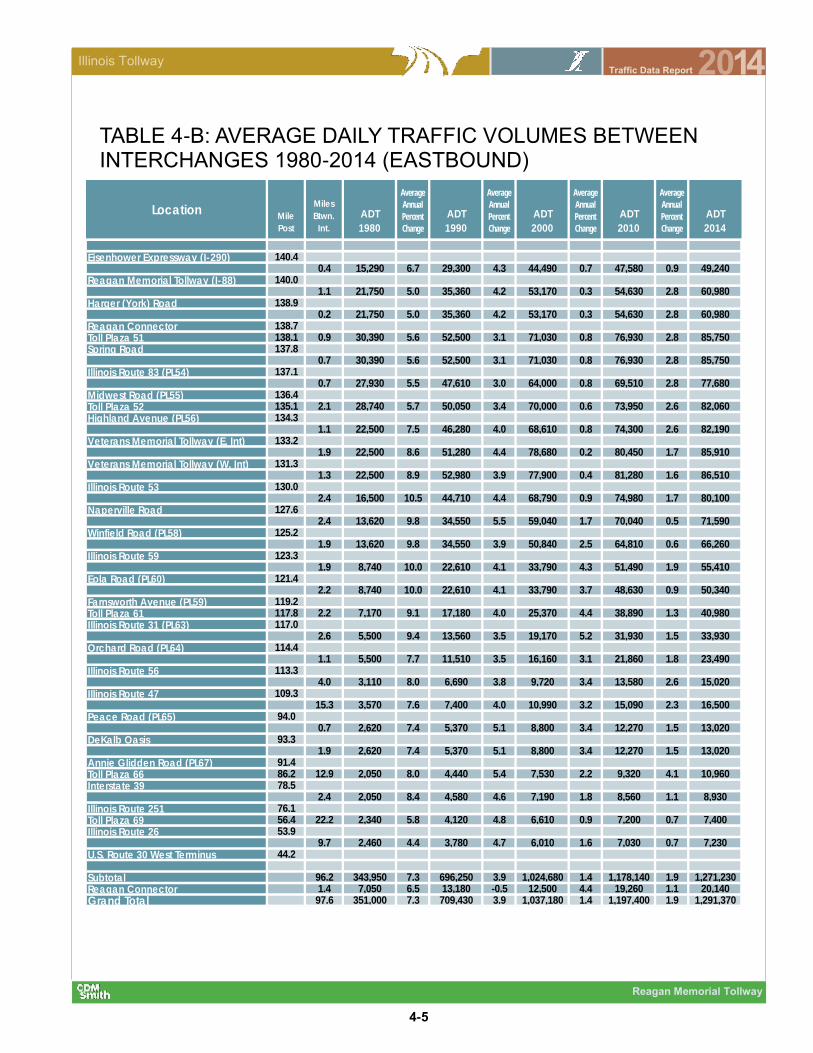
4-5
Reagan Memorial Tollway
Illinois Tollway 2014 Traffic Data Report
TABLE 4-B: AVERAGE DAILY TRAFFIC VOLUMES BETWEEN INTERCHANGES 1980-2014 (EASTBOUND)
Eisenhower Expressway (I-290) 140.40.4 15,290 6.7 29,300 4.3 44,490 0.7 47,580 0.9 49,240
Reagan Memorial Tollway (I-88) 140.01.1 21,750 5.0 35,360 4.2 53,170 0.3 54,630 2.8 60,980
Harger (York) Road 138.90.2 21,750 5.0 35,360 4.2 53,170 0.3 54,630 2.8 60,980
Reagan Connector 138.7
Toll Plaza 51 138.1 0.9 30,390 5.6 52,500 3.1 71,030 0.8 76,930 2.8 85,750
Spring Road 137.80.7 30,390 5.6 52,500 3.1 71,030 0.8 76,930 2.8 85,750
Illinois Route 83 (PL54) 137.10.7 27,930 5.5 47,610 3.0 64,000 0.8 69,510 2.8 77,680
Midwest Road (PL55) 136.4
Toll Plaza 52 135.1 2.1 28,740 5.7 50,050 3.4 70,000 0.6 73,950 2.6 82,060
Highland Avenue (PL56) 134.31.1 22,500 7.5 46,280 4.0 68,610 0.8 74,300 2.6 82,190
Veterans Memorial Tollway (E. Int) 133.21.9 22,500 8.6 51,280 4.4 78,680 0.2 80,450 1.7 85,910
Veterans Memorial Tollway (W. Int) 131.31.3 22,500 8.9 52,980 3.9 77,900 0.4 81,280 1.6 86,510
Illinois Route 53 130.02.4 16,500 10.5 44,710 4.4 68,790 0.9 74,980 1.7 80,100
Naperville Road 127.62.4 13,620 9.8 34,550 5.5 59,040 1.7 70,040 0.5 71,590
Winfield Road (PL58) 125.21.9 13,620 9.8 34,550 3.9 50,840 2.5 64,810 0.6 66,260
Illinois Route 59 123.31.9 8,740 10.0 22,610 4.1 33,790 4.3 51,490 1.9 55,410
Eola Road (PL60) 121.42.2 8,740 10.0 22,610 4.1 33,790 3.7 48,630 0.9 50,340
Farnsworth Avenue (PL59) 119.2
Toll Plaza 61 117.8 2.2 7,170 9.1 17,180 4.0 25,370 4.4 38,890 1.3 40,980
Illinois Route 31 (PL63) 117.02.6 5,500 9.4 13,560 3.5 19,170 5.2 31,930 1.5 33,930
Orchard Road (PL64) 114.41.1 5,500 7.7 11,510 3.5 16,160 3.1 21,860 1.8 23,490
Illinois Route 56 113.34.0 3,110 8.0 6,690 3.8 9,720 3.4 13,580 2.6 15,020
Illinois Route 47 109.315.3 3,570 7.6 7,400 4.0 10,990 3.2 15,090 2.3 16,500
Peace Road (PL65) 94.00.7 2,620 7.4 5,370 5.1 8,800 3.4 12,270 1.5 13,020
DeKalb Oasis 93.31.9 2,620 7.4 5,370 5.1 8,800 3.4 12,270 1.5 13,020
Annie Glidden Road (PL67) 91.4
Toll Plaza 66 86.2 12.9 2,050 8.0 4,440 5.4 7,530 2.2 9,320 4.1 10,960
Interstate 39 78.52.4 2,050 8.4 4,580 4.6 7,190 1.8 8,560 1.1 8,930
Illinois Route 251 76.1
Toll Plaza 69 56.4 22.2 2,340 5.8 4,120 4.8 6,610 0.9 7,200 0.7 7,400
Illinois Route 26 53.99.7 2,460 4.4 3,780 4.7 6,010 1.6 7,030 0.7 7,230
U.S. Route 30 West Terminus 44.2
Subtotal 96.2 343,950 7.3 696,250 3.9 1,024,680 1.4 1,178,140 1.9 1,271,230
Reagan Connector 1.4 7,050 6.5 13,180 -0.5 12,500 4.4 19,260 1.1 20,140
Grand Total 97.6 351,000 7.3 709,430 3.9 1,037,180 1.4 1,197,400 1.9 1,291,370
Average
Annual
Percent
Change
ADT
2014
LocationMile
Post
Miles
Btwn.
Int.
Average
Annual
Percent
Change
ADT
2010
ADT
1980
Average
Annual
Percent
Change
ADT
1990
Average
Annual
Percent
Change
ADT
2000
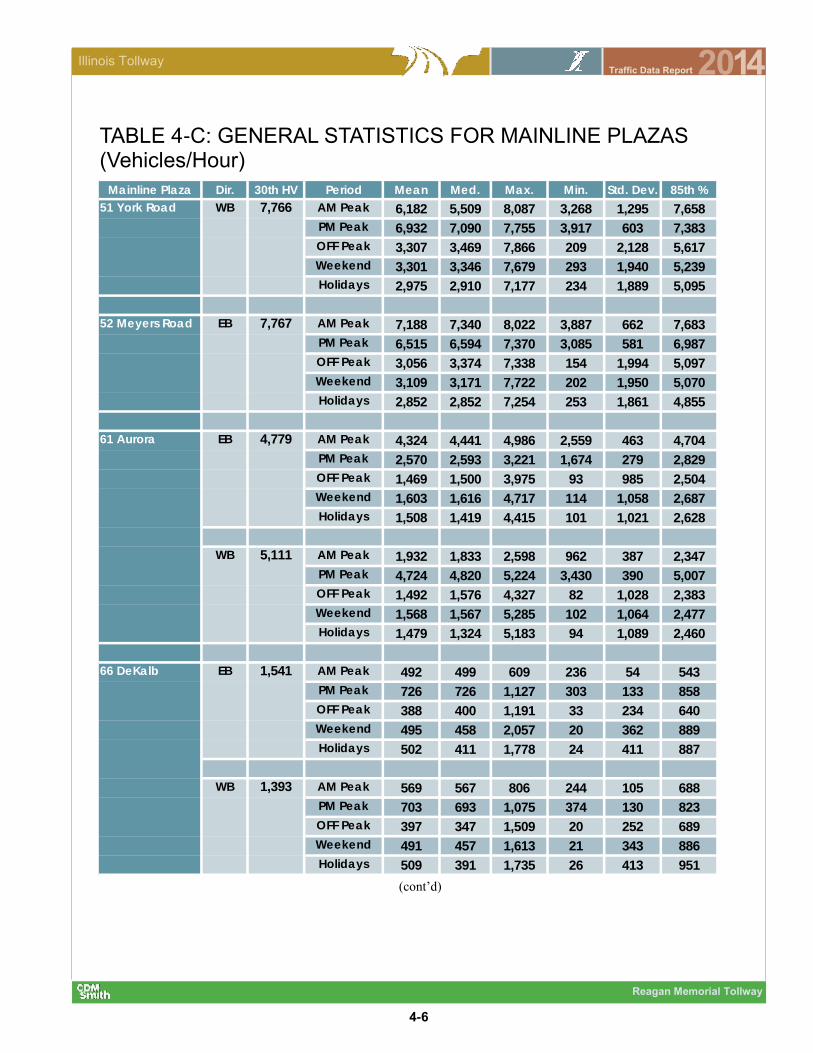
4-6
Reagan Memorial Tollway
Illinois Tollway 2014 Traffic Data Report
TABLE 4-C: GENERAL STATISTICS FOR MAINLINE PLAZAS (Vehicles/Hour)
(cont’d)
Mainline Plaza Dir. 30th HV Period Mean Med. Max. Min. Std. Dev. 85th %
7,766 AM Peak 6,182 5,509 8,087 3,268 1,295 7,658
PM Peak 6,932 7,090 7,755 3,917 603 7,383
OFF Peak 3,307 3,469 7,866 209 2,128 5,617
Weekend 3,301 3,346 7,679 293 1,940 5,239
Holidays 2,975 2,910 7,177 234 1,889 5,095
7,767 AM Peak 7,188 7,340 8,022 3,887 662 7,683
PM Peak 6,515 6,594 7,370 3,085 581 6,987
OFF Peak 3,056 3,374 7,338 154 1,994 5,097
Weekend 3,109 3,171 7,722 202 1,950 5,070
Holidays 2,852 2,852 7,254 253 1,861 4,855
4,779 AM Peak 4,324 4,441 4,986 2,559 463 4,704
PM Peak 2,570 2,593 3,221 1,674 279 2,829
OFF Peak 1,469 1,500 3,975 93 985 2,504
Weekend 1,603 1,616 4,717 114 1,058 2,687
Holidays 1,508 1,419 4,415 101 1,021 2,628
5,111 AM Peak 1,932 1,833 2,598 962 387 2,347
PM Peak 4,724 4,820 5,224 3,430 390 5,007
OFF Peak 1,492 1,576 4,327 82 1,028 2,383
Weekend 1,568 1,567 5,285 102 1,064 2,477
Holidays 1,479 1,324 5,183 94 1,089 2,460
1,541 AM Peak 492 499 609 236 54 543
PM Peak 726 726 1,127 303 133 858
OFF Peak 388 400 1,191 33 234 640
Weekend 495 458 2,057 20 362 889
Holidays 502 411 1,778 24 411 887
1,393 AM Peak 569 567 806 244 105 688
PM Peak 703 693 1,075 374 130 823
OFF Peak 397 347 1,509 20 252 689
Weekend 491 457 1,613 21 343 886
Holidays 509 391 1,735 26 413 951
66 DeKalb EB
WB
51 York Road WB
61 Aurora EB
WB
52 Meyers Road EB

4-7
Reagan Memorial Tollway
Illinois Tollway 2014 Traffic Data Report
TABLE 4-C: GENERAL STATISTICS FOR MAINLINE PLAZAS (Vehicles/Hour)
AM Peak = Weekday 6:00 AM To 8:00 AM Except Fridays PM Peak = Weekday 4:00 PM To 6:00 PM Except Fridays OFF Peak = Weekday 5:00 AM To 10:00 PM Except AM and PM Peak Periods Weekend = Fridays, Saturdays, and Sundays Holidays = See Page 1-6 for a list of Holidays
Mainline Plaza Dir. 30th HV Period Mean Med. Max. Min. Std. Dev. 85th %
987 AM Peak 291 292 369 172 34 325
PM Peak 477 468 805 220 91 565
OFF Peak 258 241 800 24 157 433
Weekend 344 309 1,316 12 249 626
Holidays 348 273 1,138 18 273 641
921 AM Peak 329 330 502 153 60 389
PM Peak 453 447 874 212 77 524
OFF Peak 271 247 787 27 162 455
Weekend 346 325 1,552 14 238 625
Holidays 356 287 1,204 18 278 688
69 Dixon EB
WB

4-8
Reagan Memorial Tollway
Illinois Tollway 2014 Traffic Data Report
TABLE 4-D: INDEXED MONTHLY VARIATION BY MAINLINE PLAZA
TABLE 4-E: INDEXED DAILY VARIATION BY MAINLINE PLAZA
Table 4-E includes Monthly Variation
Month York RoadMeyers
RoadAurora DeKalb Dixon
January 0.84 0.84 0.82 0.73 0.76
February 0.91 0.91 0.88 0.77 0.80
March 0.96 0.95 0.93 0.89 0.93
April 1.02 1.01 1.00 0.95 0.96
May 1.04 1.04 1.04 1.07 1.06
June 1.05 1.05 1.07 1.12 1.08
July 1.05 1.06 1.08 1.19 1.14
August 1.04 1.05 1.08 1.20 1.17
September 1.04 1.04 1.06 1.09 1.04
October 1.06 1.05 1.08 1.09 1.05
November 0.99 0.98 0.98 0.99 1.03
December 1.00 1.00 0.97 0.90 0.96
Month Day York RoadMeyers
RoadAurora DeKalb Dixon
Monday 1.06 1.07 1.09 1.17 1.14
Tuesday 1.04 1.04 1.06 1.15 1.14
Wednesday 1.07 1.08 1.09 1.18 1.16
Thursday 1.05 1.05 1.06 1.16 1.14
Friday 1.04 1.06 1.08 1.20 1.15
Saturday 1.03 1.05 1.08 1.21 1.18
Sunday 1.07 1.08 1.12 1.21 1.16
Monday 1.02 1.02 1.00 0.94 1.00
Tuesday 1.02 1.01 0.99 0.99 1.06
Wednesday 0.97 0.97 0.96 0.94 1.00
Thursday 0.94 0.95 0.93 0.88 0.92
Friday 0.98 0.98 0.94 0.87 0.94
Saturday 1.03 1.03 0.98 0.92 1.02
Sunday 1.00 0.99 0.92 0.81 0.88
August
December

4-9
Reagan Memorial Tollway
Illinois Tollway 2014 Traffic Data Report
TABLE 4-F: ANNUAL TOTAL TRANSACTIONS BY TOLL PLAZA
Plaza Percentage
Code* Change
51 York Road M1 30,675,719 31,463,195 2.6%
52 Meyers Road M1 29,152,784 29,958,704 2.8%
53 Spring Road R1 3,005,131 3,126,287 4.0%
54 Illinois Route 83 R1 2,874,063 2,947,026 2.5%
55 Midwest Road R1 1,353,232 1,450,110 7.2%
56 Highland Avenue R 5,468,453 5,370,460 -1.8%
57 Naperville Road R 3,962,347 3,904,117 -1.5%
58 Winfield Road R 2,775,511 2,819,715 1.6%
59 Farnsworth Avenue R 9,619,317 9,335,030 -3.0%
60 Eola Road E 3,420,987 4,113,492 20.2%
61 Aurora M 28,910,861 29,780,502 3.0%
63 Illinois Route 31 R 1,070,553 1,123,058 4.9%
64 Orchard Road R 1,415,867 1,519,484 7.3%
65 Peace Road R 3,132,876 3,217,498 2.7%
66 DeKalb M 7,369,152 8,045,022 9.2%
67 Annie Glidden Road R 1,842,420 1,867,730 1.4%
69 Dixon M 5,198,978 5,474,643 5.3%
Reagan Total 141,248,251 145,516,073 3.0%
* M=Mainline / R=Ramp / A=Attended Ramp Plaza / E=Electronic Toll Collection Only Ramp
1=Toll Collected in One Direction Only
Plaza 2013 2014

4-10
Reagan Memorial Tollway
Illinois Tollway 2014 Traffic Data Report
Average Trip
Vehicles Vehicle Miles Transactions Length (Miles)
1959 8,440 165,204 12,808 19.57
1960 12,276 203,116 16,744 16.55
1961 16,312 257,837 21,563 15.81
1962 17,764 288,501 24,029 16.24
1963 16,569 279,454 23,257 16.87
1964 16,995 264,758 21,574 15.58
1965 17,995 271,692 22,776 15.10
1966 17,947 285,535 25,748 15.91
1967 19,729 311,452 28,672 15.79
1968 22,809 341,062 31,370 14.95
1969 26,158 389,376 36,732 14.89
1970 29,164 429,270 41,225 14.72
1971 31,899 477,703 46,504 14.98
1972 37,858 538,511 52,714 14.22
1973 43,598 599,398 59,488 13.75
1974 41,427 634,698 61,858 15.32
1975 46,937 824,125 74,039 17.56
1976 51,443 907,679 80,957 17.64
1977 52,795 942,618 83,086 17.85
1978 62,128 1,141,523 98,673 18.37
1979 65,025 1,209,224 102,678 18.60
1980 66,901 1,237,492 106,458 18.50
1981 69,977 1,237,492 112,541 17.68
1982 73,089 1,366,570 124,900 18.70
1983 83,292 1,501,330 126,523 18.02
1984 89,716 1,619,407 137,718 18.05
1985 95,566 1,760,944 148,154 18.43
1986 104,972 1,933,134 166,784 18.42
1987 113,033 2,064,188 180,166 18.26
1988 118,956 2,211,706 190,996 18.59
1989 119,346 2,289,542 196,542 19.18
1990 129,849 2,587,888 212,457 19.93
1991 132,723 2,552,325 207,433 19.23
1992 139,437 2,722,109 216,466 19.52
1993 148,050 2,846,936 224,192 19.23
1994 154,551 3,146,111 246,079 20.36
1995 162,260 3,357,807 259,860 20.69
1996 167,010 3,477,775 275,061 20.82
1997 186,370 3,471,458 274,429 18.63
1998 200,930 3,492,638 274,660 17.38
1999 214,190 3,824,597 298,242 17.86
2000 218,150 3,900,147 305,567 17.88
2001 226,930 4,006,550 316,753 17.66
2002 232,780 4,288,781 341,362 18.42
2003 239,380 4,478,762 348,386 18.71
2004 243,640 4,606,017 359,964 18.91
2005 238,580 4,441,784 350,311 18.62
2006 240,500 4,540,450 359,564 18.88
2007 243,310 4,603,873 359,357 18.92
2008 239,410 4,344,648 333,079 18.15
2009 243,680 4,417,393 336,193 18.13
2010 239,680 4,650,235 372,523 19.40
2011 255,540 4,925,591 392,112 19.28
2012 242,590 4,596,370 373,479 18.95
2013 236,900 4,809,676 386,982 20.30
2014 239,890 4,999,058 398,674 20.84
YearAverage Daily Total
TABLE 4-G: AVERAGE DAILY TRAFFIC DATA

4-11
Reagan Memorial Tollway
Illinois Tollway 2014 Traffic Data Report
5,1
11
4,5
00
4,7
00
4,9
00
5,1
00
5,3
00
050
10
01
50
20
0
Volume
Ho
ur
PLA
ZA
61
WB
PLA
ZA
61 W
B3
0th
HV
FIG
UR
E 4
-C
7,7
67
7,2
00
7,4
00
7,6
00
7,8
00
8,0
00
8,2
00
8,4
00
050
10
01
50
20
0
Volume
Ho
ur
PLA
ZA
52
EB
PLA
ZA
52 E
B30th
HV
FIG
UR
E 4
-D
7,7
66
7,3
00
7,5
00
7,7
00
7,9
00
8,1
00
050
10
01
50
20
0
Volume
Ho
ur
PLA
ZA
51
WB
PLA
ZA
51 W
B3
0th
HV
FIG
UR
E 4
-A
4,7
79
4,3
00
4,5
00
4,7
00
4,9
00
5,1
00
050
10
01
50
20
0
Volume
Ho
ur
PLA
ZA
61
EB
PLA
ZA
61
EB
30th
HV
FIG
UR
E 4
-B
MA
INLIN
E P
LA
ZA
HIG
HE
ST
HO
UR
LY
VO
LU
ME
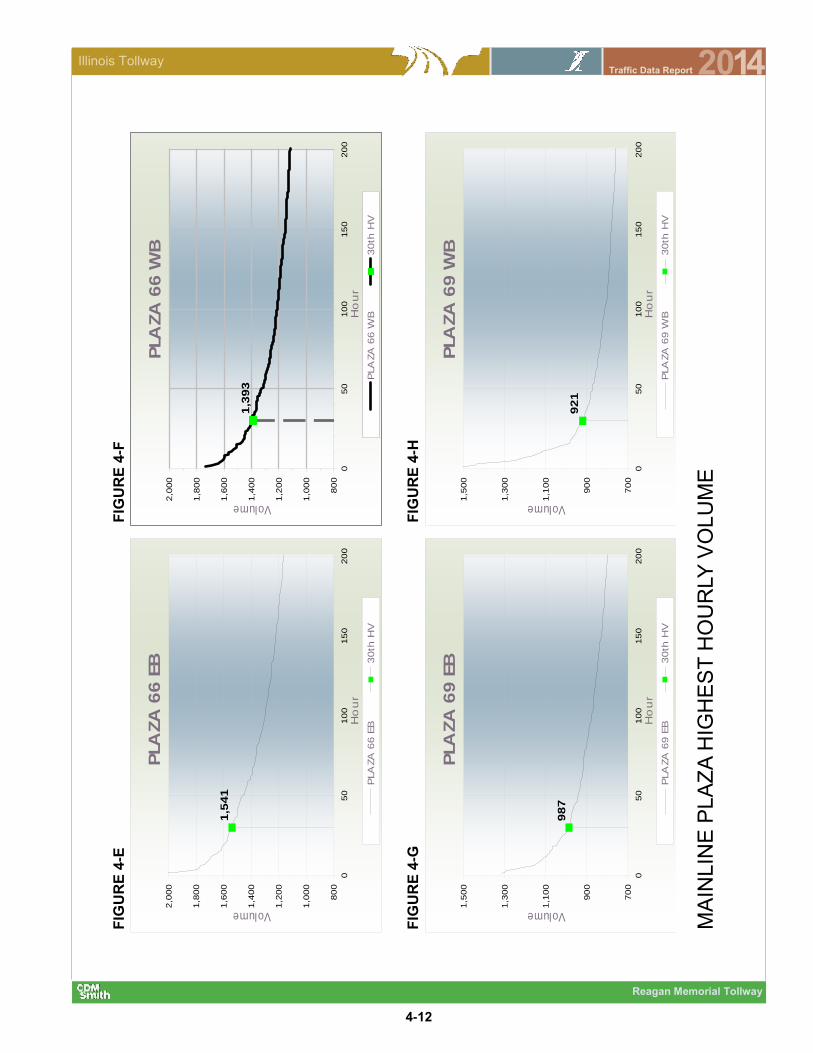
4-12
Reagan Memorial Tollway
Illinois Tollway 2014 Traffic Data Report
1,3
93
80
0
1,0
00
1,2
00
1,4
00
1,6
00
1,8
00
2,0
00
050
10
01
50
20
0
Volume
Ho
ur
PLA
ZA
66
WB
PLA
ZA
66 W
B3
0th
HV
98
7
70
0
90
0
1,1
00
1,3
00
1,5
00
050
10
01
50
20
0
Volume
Ho
ur
PLA
ZA
69
EB
PLA
ZA
69
EB
30th
HV
FIG
UR
E 4
-G
92
1
70
0
90
0
1,1
00
1,3
00
1,5
00
050
10
01
50
20
0
Volume
Ho
ur
PLA
ZA
69
WB
PLA
ZA
69 W
B3
0th
HV
FIG
UR
E 4
-H
1,5
41
80
0
1,0
00
1,2
00
1,4
00
1,6
00
1,8
00
2,0
00
050
10
01
50
20
0
Volume
Ho
ur
PLA
ZA
66
EB
PLA
ZA
66 E
B3
0th
HV
FIG
UR
E 4
-E
FIG
UR
E 4
-F
MA
INLIN
E P
LA
ZA
HIG
HE
ST
HO
UR
LY
VO
LU
ME

4-13
Reagan Memorial Tollway
Illinois Tollway 2014 Traffic Data Report
FIGURE 4-K
0
2
4
6
8
10
1980 1985 1990 1995 2000 2005 2010 2015
TRA
FFIC
(1
,000
s)
YEAR
PLAZA 53 SPRING ROAD
FIGURE 4-J
0
20
40
60
80
100
1980 1985 1990 1995 2000 2005 2010 2015
TRA
FFIC
(1,0
00s)
YEAR
PLAZA 52 MEYERS ROAD
FIGURE 4-I
0
20
40
60
80
100
120
140
160
180
1980 1985 1990 1995 2000 2005 2010 2015
TRA
FFIC
(1,0
00s)
YEAR
PLAZA 51 YORK ROAD
AVERAGE DAILY TRAFFIC TRENDS
The eastbound side of Plaza 51 closed in 2006 and was replaced by Plaza 52.
Plaza 52 opened in 2006 to replace eastbound Plaza 51.

4-14
Reagan Memorial Tollway
Illinois Tollway 2014 Traffic Data Report
FIGURE 4-N
0
5
10
15
20
1980 1985 1990 1995 2000 2005 2010 2015
TRA
FFIC
(1
,000
s)
YEAR
PLAZA 56 HIGHLAND AVENUE
FIGURE 4-M
0
2
4
6
8
10
12
1980 1985 1990 1995 2000 2005 2010 2015
TRA
FFIC
(1
,000
s)
YEAR
PLAZA 55 MIDWEST ROAD
FIGURE 4-L
0
2
4
6
8
10
12
1980 1985 1990 1995 2000 2005 2010 2015
TRA
FFIC
(1,0
00s)
YEAR
PLAZA 54 ILLINOIS ROUTE 83
AVERAGE DAILY TRAFFIC TRENDS
Plaza 54 opened in 2006 due to Plaza 51 reconfiguration.
Plaza 55 was moved from the exit ramp to the entrance ramp in 2006 due to Plaza 51 reconfiguration..

4-15
Reagan Memorial Tollway
Illinois Tollway 2014 Traffic Data Report
FIGURE 4-Q
0
5
10
15
20
25
30
1980 1985 1990 1995 2000 2005 2010 2015
TRA
FFIC
(1,0
00s)
YEAR
PLAZA 59 FARNSWORTH AVENUE
FIGURE 4-P
0
2
4
6
8
10
12
14
1980 1985 1990 1995 2000 2005 2010 2015
TRA
FFIC
(1,0
00s)
YEAR
PLAZA 58 WINFIELD ROAD
FIGURE 4-O
0
2
4
6
8
10
12
1980 1985 1990 1995 2000 2005 2010 2015
TRA
FFIC
(1,0
00s)
YEAR
PLAZA 57 NAPERVILLE ROAD
AVERAGE DAILY TRAFFIC TRENDS

4-16
Reagan Memorial Tollway
Illinois Tollway 2014 Traffic Data Report
FIGURE 4-T
0
1
2
3
4
5
1980 1985 1990 1995 2000 2005 2010 2015
TRA
FFIC
(1,0
00s)
YEAR
PLAZA 63 ILLINOIS ROUTE 31
FIGURE 4-S
0
20
40
60
80
100
1980 1985 1990 1995 2000 2005 2010 2015
TRA
FFIC
(1,0
00s)
YEAR
PLAZA 61 AURORA
0
2
4
6
8
10
1980 1985 1990 1995 2000 2005 2010 2015
TRA
FFIC
(1,0
00s)
YEAR
PLAZA 60 EOLA ROAD
FIGURE 4-R
AVERAGE DAILY TRAFFIC TRENDS
Plaza 60 opened in 2009.
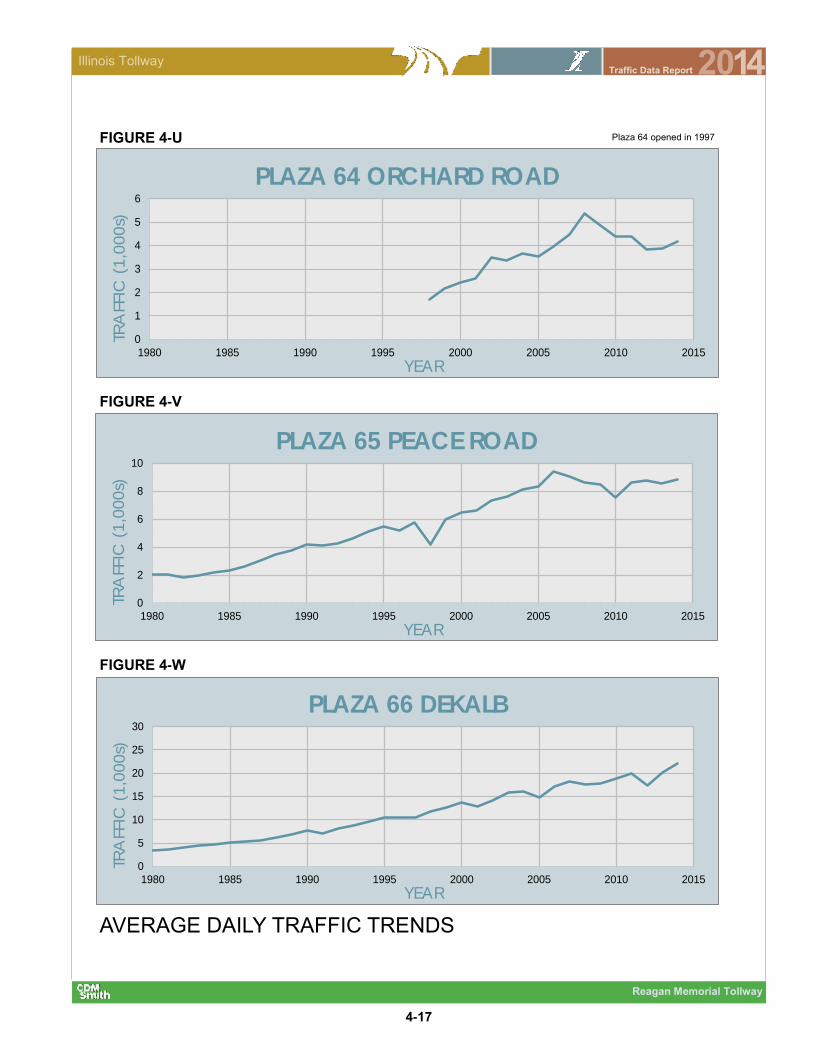
4-17
Reagan Memorial Tollway
Illinois Tollway 2014 Traffic Data Report
FIGURE 4-W
0
5
10
15
20
25
30
1980 1985 1990 1995 2000 2005 2010 2015
TRA
FFIC
(1,0
00s)
YEAR
PLAZA 66 DEKALB
FIGURE 4-V
0
2
4
6
8
10
1980 1985 1990 1995 2000 2005 2010 2015
TRA
FFIC
(1,0
00s)
YEAR
PLAZA 65 PEACE ROAD
0
1
2
3
4
5
6
1980 1985 1990 1995 2000 2005 2010 2015
TRA
FFIC
(1,0
00s)
YEAR
PLAZA 64 ORCHARD ROAD
FIGURE 4-U
AVERAGE DAILY TRAFFIC TRENDS
Plaza 64 opened in 1997

4-18
Reagan Memorial Tollway
Illinois Tollway 2014 Traffic Data Report
FIGURE 4-Z
0
0.5
1
1.5
2
1980 1985 1990 1995 2000 2005 2010 2015
TRA
FFIC
(1,0
00s)
YEAR
PLAZA 70 ILLINOIS ROUTE 26 WEST
FIGURE 4-Y
0
2
4
6
8
10
12
14
16
1980 1985 1990 1995 2000 2005 2010 2015
TRA
FFIC
(1,0
00s)
YEAR
PLAZA 69 DIXON
FIGURE 4-X
0
2
4
6
8
10
1980 1985 1990 1995 2000 2005 2010 2015
TRA
FFIC
(1,0
00s)
YEAR
PLAZA 67 ANNIE GLIDDEN ROAD
AVERAGE DAILY TRAFFIC TRENDS
Plaza 70 was removed in 2006.
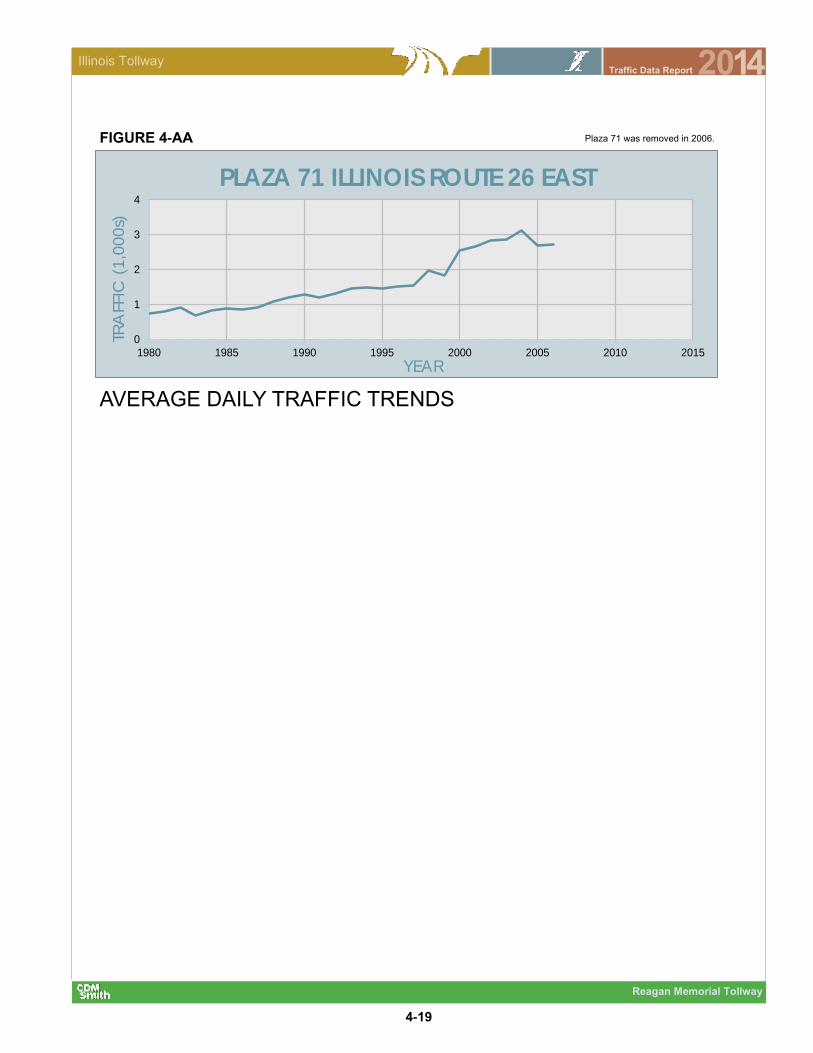
4-19
Reagan Memorial Tollway
Illinois Tollway 2014 Traffic Data Report
FIGURE 4-AA
0
1
2
3
4
1980 1985 1990 1995 2000 2005 2010 2015
TRA
FFIC
(1,0
00s)
YEAR
PLAZA 71 ILLINOIS ROUTE 26 EAST
AVERAGE DAILY TRAFFIC TRENDS
Plaza 71 was removed in 2006.

4-20
Reagan Memorial Tollway
Illinois Tollway 2014 Traffic Data Report
0%
20%
40%
60%
80%
100%
120%
0:0
0
2:0
0
4:0
0
6:0
0
8:0
0
10
:00
12
:00
14
:00
16
:00
18
:00
20
:00
22
:00
% o
f Fre
e F
low
Sp
ee
d
Westbound
15th Percentile Median 85th Percentile
0%
20%
40%
60%
80%
100%
120%
0:0
0
2:0
0
4:0
0
6:0
0
8:0
0
10
:00
12
:00
14
:00
16
:00
18
:00
20
:00
22
:00
% o
f Fre
e F
low
Sp
ee
d
Eastbound
15th Percentile Median 85th Percentile
0%
20%
40%
60%
80%
100%
120%
140%
0:0
0
2:0
0
4:0
0
6:0
0
8:0
0
10
:00
12
:00
14
:00
16
:00
18
:00
20
:00
22
:00
% o
f Fre
e F
low
Sp
ee
d
Westbound
15th Percentile Median 85th Percentile
0%
20%
40%
60%
80%
100%
120%
0:0
0
2:0
0
4:0
0
6:0
0
8:0
0
10
:00
12
:00
14
:00
16
:00
18
:00
20
:00
22
:00
% o
f Fre
e F
low
Sp
ee
d
Eastbound
15th Percentile Median 85th Percentile
FIGURE 4-AB
AVERAGE WEEKDAY SPEED DISTRIBUTIONS, EASTERN SECTION
FIGURE 4-AC
FIGURE 4-AD
AVERAGE WEEKDAY SPEED DISTRIBUTIONS, WESTERN SECTION
FIGURE 4-AE

4-21
Reagan Memorial Tollway
Illinois Tollway 2014 Traffic Data Report
AM
PM
AM
PM
AM
PM
AM
PM
AM
PM
AM
PM
1Ja
nu
ary
-M
arc
h56
56
1.0
71.0
71.4
81.5
92.3
1.9
1,7
67
1,3
99
35
38
2A
pril-
Ju
ne
59
58
1.0
21.0
31.2
51.2
31.7
1.4
1,3
08
1,0
83
29
39
3Ju
ly-S
ep
tem
be
r58
53
1.0
41.1
31.2
41.4
41.8
2.6
1,4
91
2,0
93
31
54
4O
cto
be
r-D
ec
em
be
r59
55
1.0
21.1
01.2
21.4
11.6
2.3
1,2
05
1,7
64
29
48
Tota
l20
14 E
ntire
Ye
ar
58
56
1.0
41.0
81.3
01.4
21.8
2.1
1,4
43
1,5
85
31
45
Qu
art
er
Ra
ng
e
Av
era
ge
Sp
ee
d (
mp
h)
Av
era
ge
Tra
ve
l Ti
me
Ind
ex
Pla
nn
ing
Tim
e I
nd
ex
Tota
l D
ela
y
(ve
h-h
rs /
100
0 V
MT)
Av
era
ge
Da
ily
De
lay
(ve
h-h
rs)
Pe
rce
nt
Co
ng
est
ed
Tra
ve
l
FIG
UR
E 4
-AF
: R
OA
DW
AY
PE
RF
OR
MA
NC
E M
EA
SU
RE
S—
EA
ST
ER
N S
EC
TIO
N
Road
wa
y p
erf
orm
ance m
easure
s s
ections a
nd t
erm
s a
re d
efin
ed o
n p
ages 1
-5 a
nd 1
-6.

4-22
Reagan Memorial Tollway
Illinois Tollway 2014 Traffic Data Report
AM
PM
AM
PM
AM
PM
AM
PM
AM
PM
AM
PM
1Ja
nu
ary
-M
arc
h64
67
0.9
30.9
01.0
30.9
70.5
0.3
104
67
18
11
2A
pri
l-Ju
ne
67
69
0.9
00.8
70.9
00.8
80.2
0.1
58
41
97
3Ju
ly-S
ep
tem
be
r67
69
0.9
00.8
70.9
10.8
70.3
0.1
78
34
95
4O
cto
be
r-D
ec
em
be
r67
69
0.9
00.8
70.8
90.8
90.3
0.1
65
46
97
Tota
l2
01
4 E
ntire
Ye
ar
66
69
0.9
10.8
80.9
30.9
00.3
0.2
76
47
11
8
Qu
art
er
Ra
ng
e
Av
era
ge
Da
ily
De
lay
(ve
h-h
rs)
Tota
l D
ela
y
(ve
h-h
rs /
10
00
VM
T)
Pla
nn
ing
Tim
e I
nd
ex
Av
era
ge
Sp
ee
d (
mp
h)
Av
era
ge
Tra
ve
l Ti
me
Ind
ex
Pe
rce
nt
Co
ng
est
ed
Tra
ve
l
FIG
UR
E 4
-AG
: R
OA
DW
AY
PE
RF
OR
MA
NC
E M
EA
SU
RE
S—
WE
ST
ER
N S
EC
TIO
N
Road
wa
y p
erf
orm
ance m
easure
s s
ections a
nd t
erm
s a
re d
efin
ed o
n p
ages 1
-5 a
nd 1
-6.
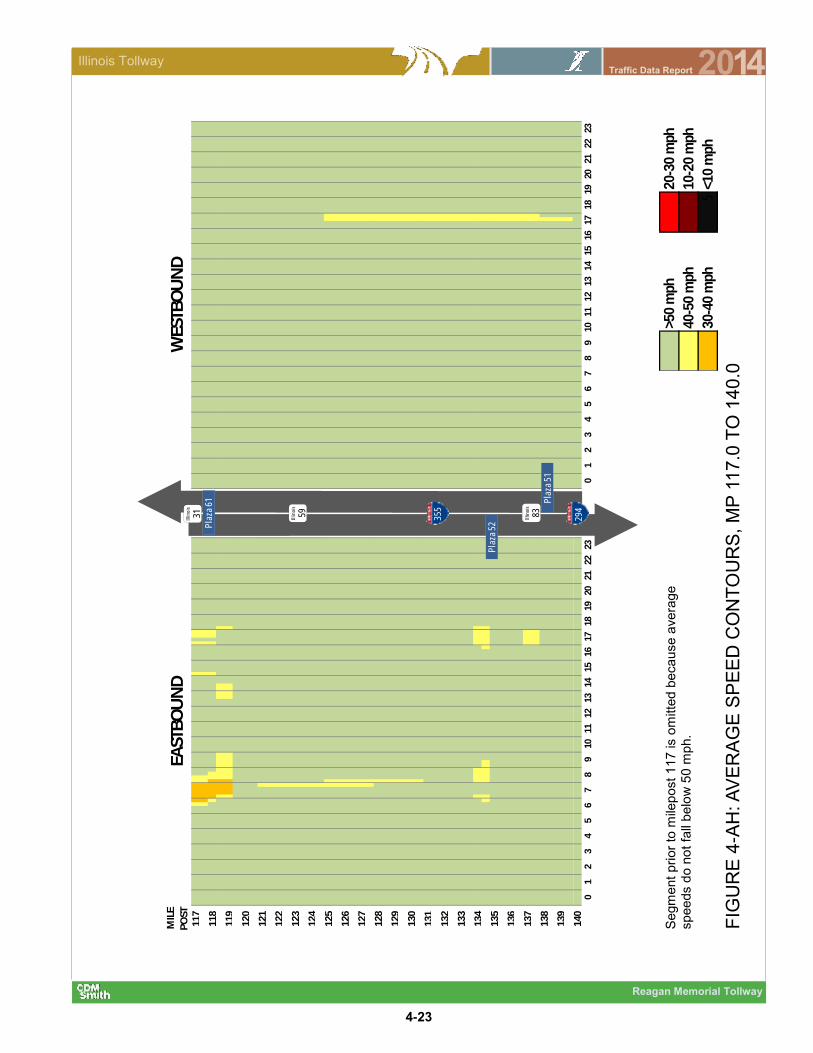
4-23
Reagan Memorial Tollway
Illinois Tollway 2014 Traffic Data Report
MIL
E
PO
ST11
7
118
119
120
121
122
123
124
125
126
127
128
129
130
131
132
133
134
135
136
137
138
139
140
13
EAST
BO
UN
DW
ESTB
OU
ND
01
23
45
67
89
1011
121
1415
1617
1819
2021
2223
013
23
45
67
89
1011
1220
2122
2314
1516
1718
19
355
294
Illin
ois
31 Illin
ois
83
Illin
ois
59
Pla
za 5
1
Pla
za 5
2Pla
za 6
1
Segm
ent pri
or
to m
ilep
ost 1
17 is o
mitte
d b
eca
use a
vera
ge
speeds d
o n
ot fa
ll be
low
50
mph.
51>5
0 m
ph25
20-3
0 m
ph
4540
-50
mph
1510
-20
mph
3530
-40
mph
5<1
0 m
ph
FIG
UR
E 4
-AH
: A
VE
RA
GE
SP
EE
D C
ON
TO
UR
S,
MP
11
7.0
TO
14
0.0

4-24
Reagan Memorial Tollway
Illinois Tollway 2014 Traffic Data Report
This Page Is Intentionally Left Blank

Section 5Veterans Memorial Tollway
2014
Veterans Memorial Tollway
Section 5
Veterans Mem
orial Tollw
ay

Veterans Memorial Tollway
5-1
Illinois Tollway 2014 Traffic Data Report
TABULATIONS TABLE PAGE
5-A Average Daily Traffic Volumes Between interchanges
1980 – 2014 (Northbound) 5-4
5-B Average Daily Traffic Volumes Between Interchanges
1980 – 2014 (Southbound) 5-5
5-C General Statistics for Mainline Plazas 5-6
5-D Indexed Monthly Variations by Mainline Plaza 5-7
5-E Indexed Daily Variation by Mainline Plaza 5-7
5-F Annual Total Transactions by Toll Plaza 5-8
5-G Average Daily Traffic Data 5-9
ILLUSTRATIONS FIGURE PAGE
5-A Mainline Plaza Highest Hourly Volume Plaza 73 NB 5-10
5-B Mainline Plaza Highest Hourly Volume Plaza 73 SB 5-10
5-C Mainline Plaza Highest Hourly Volume Plaza 89 NB 5-10
5-D Mainline Plaza Highest Hourly Volume Plaza 89 SB 5-10
5-E Mainline Plaza Highest Hourly Volume Plaza 99 NB 5-11
5-F Mainline Plaza Highest Hourly Volume Plaza 99 SB 5-11
5-G Average Daily Traffic Trends Plaza 73 Army Trail Road 5-12
5-H Average Daily Traffic Trends Plaza 75 North Avenue 5-12
5-I Average Daily Traffic Trends Plaza 77 Roosevelt Road 5-12
5-J Average Daily Traffic Trends Plaza 79 Butterfield Road 5-13
5-K Average Daily Traffic Trends Plaza 81 Ogden Avenue 5-13
5-L Average Daily Traffic Trends Plaza 83 Maple Avenue 5-13
5-M Average Daily Traffic Trends Plaza 85 63rd Street 5-14
5-N Average Daily Traffic Trends Plaza 87 75th Street 5-14
5-O Average Daily Traffic Trends Plaza 89 Boughton Road 5-14
5-P Average Daily Traffic Trends Plaza 90 Boughton Road Ramp 5-15
5-Q Average Daily Traffic Trends Plaza 93 127th Street 5-15
5-R Average Daily Traffic Trends Plaza 95 Archer Avenue/143rd Street 5-15
5-S Average Daily Traffic Trends Plaza 97 Illinois Route 7 5-15
5-T Average Daily Traffic Trends Plaza 99 Spring Creek 5-16
5-U Average Daily Traffic Trends Plaza 101 U.S. Route 6 5-16
5-V Average Weekday Speed Distributions, Northern Section—Northbound 5-17
5-W Average Weekday Speed Distributions, Northern Section—Southbound 5-17
5-X Average Weekday Speed Distributions, Central Section—Northbound 5-17
5-Y Average Weekday Speed Distributions, Central Section—Southbound 5-17
SECTION 5 Veterans Memorial Tollway

Veterans Memorial Tollway
5-2
Illinois Tollway 2014 Traffic Data Report
ILLUSTRATIONS (CONTINUED) FIGURE PAGE
5-Z Average Weekday Speed Distributions, Southern Section—Northbound 5-18
5-AA Average Weekday Speed Distributions, Southern Section—Southbound 5-18
5-AB Roadway Performance Measures, Northern Section 5-19
5-AC Roadway Performance Measures, Central Section 5-20
5-AD Roadway Performance Measures, Southern Section 5-21
5-AE Average Speed Contours, MP 1.5 to 29.5 5-22
SECTION 5 Veterans Memorial Tollway

5-3
Veterans Memorial Tollway
Illinois Tollway 2014 Traffic Data Report
This Page Is Intentionally Left Blank
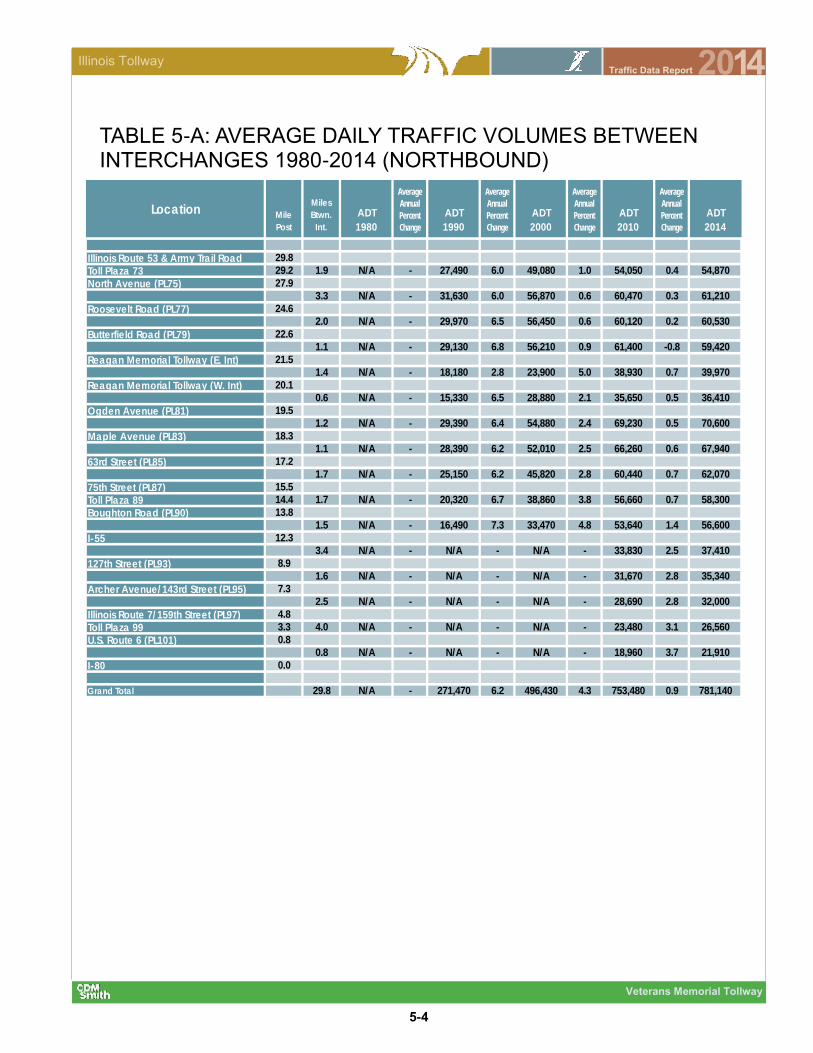
5-4
Veterans Memorial Tollway
Illinois Tollway 2014 Traffic Data Report
TABLE 5-A: AVERAGE DAILY TRAFFIC VOLUMES BETWEEN INTERCHANGES 1980-2014 (NORTHBOUND)
Illinois Route 53 & Army Trail Road 29.8
Toll Plaza 73 29.2 1.9 N/A - 27,490 6.0 49,080 1.0 54,050 0.4 54,870
North Avenue (PL75) 27.9
3.3 N/A - 31,630 6.0 56,870 0.6 60,470 0.3 61,210
Roosevelt Road (PL77) 24.6
2.0 N/A - 29,970 6.5 56,450 0.6 60,120 0.2 60,530
Butterfield Road (PL79) 22.6
1.1 N/A - 29,130 6.8 56,210 0.9 61,400 -0.8 59,420
Reagan Memorial Tollway (E. Int) 21.5
1.4 N/A - 18,180 2.8 23,900 5.0 38,930 0.7 39,970
Reagan Memorial Tollway (W. Int) 20.1
0.6 N/A - 15,330 6.5 28,880 2.1 35,650 0.5 36,410
Ogden Avenue (PL81) 19.5
1.2 N/A - 29,390 6.4 54,880 2.4 69,230 0.5 70,600
Maple Avenue (PL83) 18.3
1.1 N/A - 28,390 6.2 52,010 2.5 66,260 0.6 67,940
63rd Street (PL85) 17.2
1.7 N/A - 25,150 6.2 45,820 2.8 60,440 0.7 62,070
75th Street (PL87) 15.5
Toll Plaza 89 14.4 1.7 N/A - 20,320 6.7 38,860 3.8 56,660 0.7 58,300
Boughton Road (PL90) 13.8
1.5 N/A - 16,490 7.3 33,470 4.8 53,640 1.4 56,600
I-55 12.3
3.4 N/A - N/A - N/A - 33,830 2.5 37,410
127th Street (PL93) 8.9
1.6 N/A - N/A - N/A - 31,670 2.8 35,340
Archer Avenue/143rd Street (PL95) 7.3
2.5 N/A - N/A - N/A - 28,690 2.8 32,000
Illinois Route 7/159th Street (PL97) 4.8
Toll Plaza 99 3.3 4.0 N/A - N/A - N/A - 23,480 3.1 26,560
U.S. Route 6 (PL101) 0.8
0.8 N/A - N/A - N/A - 18,960 3.7 21,910
I-80 0.0
Grand Total 29.8 N/A - 271,470 6.2 496,430 4.3 753,480 0.9 781,140
Location Mile
Post
Miles
Btwn.
Int.
ADT
1980
Average
Annual
Percent
Change
ADT
1990
Average
Annual
Percent
Change
ADT
2000
Average
Annual
Percent
Change
ADT
2010
Average
Annual
Percent
Change
ADT
2014

5-5
Veterans Memorial Tollway
Illinois Tollway 2014 Traffic Data Report
TABLE 5-B: AVERAGE DAILY TRAFFIC VOLUMES BETWEEN INTERCHANGES 1980-2014 (SOUTHBOUND)
Illinois Route 53 & Army Trail Road 29.8
Toll Plaza 73 29.2 1.9 N/A - 27,380 6.2 49,870 0.8 54,110 0.7 55,710
North Avenue (PL75) 27.9
3.3 N/A - 31,280 6.4 58,060 0.4 60,560 0.5 61,870
Roosevelt Road (PL77) 24.6
2.0 N/A - 29,340 6.9 56,940 0.8 61,360 0.3 62,050
Butterfield Road (PL79) 22.6
1.1 N/A - 28,420 7.1 56,520 0.9 61,900 -0.9 59,650
Reagan Memorial Tollway (E. Int) 21.5
1.4 N/A - 24,240 7.1 48,220 1.3 55,070 1.1 57,640
Reagan Memorial Tollway (W. Int) 20.1
0.6 N/A - 26,770 6.8 51,540 2.0 62,870 1.2 65,910
Ogden Avenue (PL81) 19.5
1.2 N/A - 29,410 6.6 55,680 2.2 69,140 0.8 71,410
Maple Avenue (PL83) 18.3
1.1 N/A - 28,600 6.3 52,680 2.4 66,600 0.8 68,690
63rd Street (PL85) 17.2
1.7 N/A - 25,390 6.3 46,870 2.6 60,820 0.7 62,610
75th Street (PL87) 15.5
Toll Plaza 89 14.4 1.7 N/A - 20,530 6.8 39,640 3.8 57,420 0.7 59,160
Boughton Road (PL90) 13.8
1.5 N/A - 16,740 7.3 33,900 5.1 55,790 1.8 59,880
I-55 12.3
3.4 N/A - N/A - N/A - 33,800 1.9 36,460
127th Street (PL93) 8.9
1.6 N/A - N/A - N/A - 31,350 2.2 34,260
Archer Avenue/143rd Street (PL95) 7.3
2.5 N/A - N/A - N/A - 28,660 2.3 31,350
Illinois Route 7/159th Street (PL97) 4.8
Toll Plaza 99 3.3 4.0 N/A - N/A - N/A - 23,530 2.6 26,070
U.S. Route 6 (PL101) 0.8
0.8 N/A - N/A - N/A - 18,410 3.3 20,980
I-80 0.0
Grand Total 29.8 N/A - 288,100 6.7 549,920 3.8 801,390 1.0 833,700
Average
Annual
Percent
Change
ADT
2014
Average
Annual
Percent
Change
ADT
2010
ADT
1980
Average
Annual
Percent
Change
ADT
1990
Average
Annual
Percent
Change
ADT
2000
Location Mile
Post
Miles
Btwn.
Int.
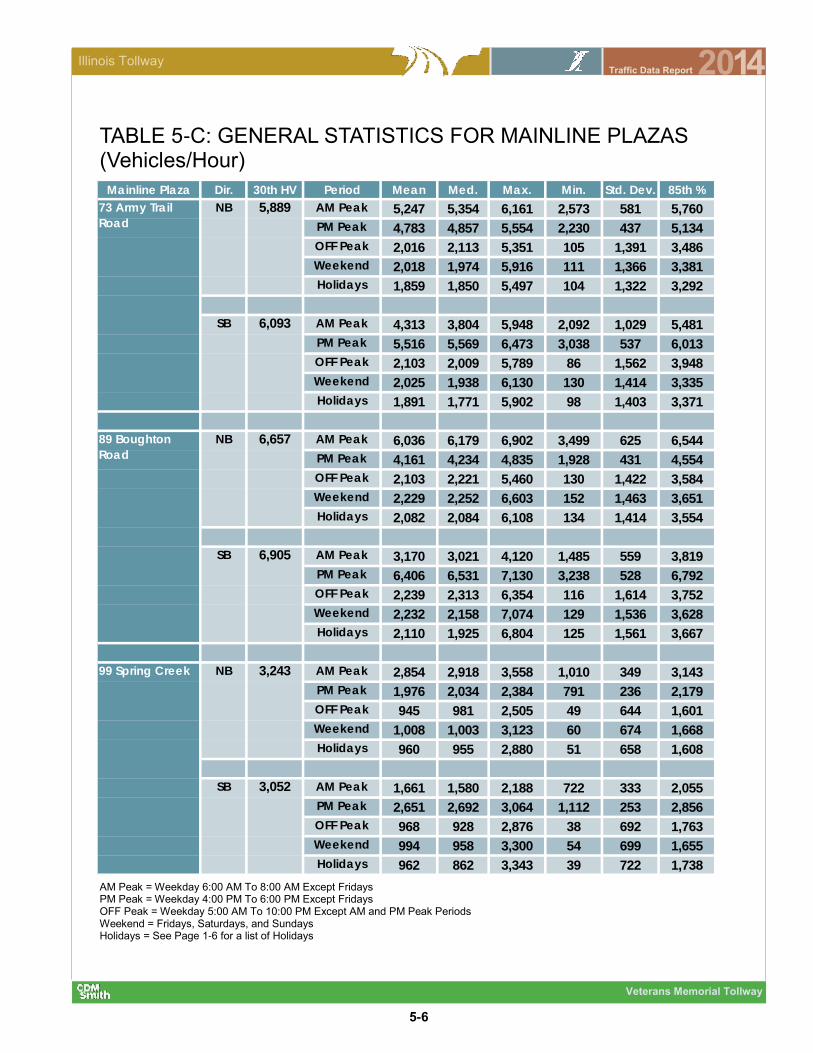
5-6
Veterans Memorial Tollway
Illinois Tollway 2014 Traffic Data Report
TABLE 5-C: GENERAL STATISTICS FOR MAINLINE PLAZAS (Vehicles/Hour)
AM Peak = Weekday 6:00 AM To 8:00 AM Except Fridays PM Peak = Weekday 4:00 PM To 6:00 PM Except Fridays OFF Peak = Weekday 5:00 AM To 10:00 PM Except AM and PM Peak Periods Weekend = Fridays, Saturdays, and Sundays Holidays = See Page 1-6 for a list of Holidays
Mainline Plaza Dir. 30th HV Period Mean Med. Max. Min. Std. Dev. 85th %
5,889 AM Peak 5,247 5,354 6,161 2,573 581 5,760
PM Peak 4,783 4,857 5,554 2,230 437 5,134
OFF Peak 2,016 2,113 5,351 105 1,391 3,486
Weekend 2,018 1,974 5,916 111 1,366 3,381
Holidays 1,859 1,850 5,497 104 1,322 3,292
6,093 AM Peak 4,313 3,804 5,948 2,092 1,029 5,481
PM Peak 5,516 5,569 6,473 3,038 537 6,013
OFF Peak 2,103 2,009 5,789 86 1,562 3,948
Weekend 2,025 1,938 6,130 130 1,414 3,335
Holidays 1,891 1,771 5,902 98 1,403 3,371
6,657 AM Peak 6,036 6,179 6,902 3,499 625 6,544
PM Peak 4,161 4,234 4,835 1,928 431 4,554
OFF Peak 2,103 2,221 5,460 130 1,422 3,584
Weekend 2,229 2,252 6,603 152 1,463 3,651
Holidays 2,082 2,084 6,108 134 1,414 3,554
6,905 AM Peak 3,170 3,021 4,120 1,485 559 3,819
PM Peak 6,406 6,531 7,130 3,238 528 6,792
OFF Peak 2,239 2,313 6,354 116 1,614 3,752
Weekend 2,232 2,158 7,074 129 1,536 3,628
Holidays 2,110 1,925 6,804 125 1,561 3,667
3,243 AM Peak 2,854 2,918 3,558 1,010 349 3,143
PM Peak 1,976 2,034 2,384 791 236 2,179
OFF Peak 945 981 2,505 49 644 1,601
Weekend 1,008 1,003 3,123 60 674 1,668
Holidays 960 955 2,880 51 658 1,608
3,052 AM Peak 1,661 1,580 2,188 722 333 2,055
PM Peak 2,651 2,692 3,064 1,112 253 2,856
OFF Peak 968 928 2,876 38 692 1,763
Weekend 994 958 3,300 54 699 1,655
Holidays 962 862 3,343 39 722 1,738
73 Army Trail
Road
NB
SB
99 Spring Creek NB
SB
89 Boughton
Road
NB
SB

5-7
Veterans Memorial Tollway
Illinois Tollway 2014 Traffic Data Report
TABLE 5-E: INDEXED DAILY VARIATION BY MAINLINE PLAZA
Table 5-E includes Monthly Variation
TABLE 5-D: INDEXED MONTHLY VARIATION BY MAINLINE PLAZA
MonthArmy Trail
Road
Boughton
Road
Spring
Creek
January 0.85 0.82 0.79
February 0.92 0.89 0.85
March 0.95 0.94 0.90
April 1.03 1.01 0.99
May 1.05 1.04 1.05
June 1.07 1.07 1.10
July 1.05 1.06 1.10
August 1.04 1.06 1.09
September 1.04 1.05 1.07
October 1.06 1.08 1.09
November 0.96 0.99 0.98
December 0.97 0.99 0.97
Month DayArmy Trail
Road
Boughton
Road
Spring
Creek
Monday 1.07 1.08 1.10
Tuesday 1.04 1.06 1.08
Wednesday 1.07 1.09 1.10
Thursday 1.04 1.06 1.08
Friday 1.05 1.07 1.10
Saturday 1.04 1.05 1.09
Sunday 1.09 1.08 1.14
Monday 1.01 1.03 1.02
Tuesday 0.98 1.01 1.00
Wednesday 0.95 0.98 0.96
Thursday 0.93 0.95 0.93
Friday 0.95 0.96 0.94
Saturday 0.99 1.00 0.99
Sunday 0.95 0.96 0.93
August
December

5-8
Veterans Memorial Tollway
Illinois Tollway 2014 Traffic Data Report
TABLE 5-F: ANNUAL TOTAL TRANSACTIONS BY TOLL PLAZA
Plaza Percentage
Code* Change
73 Army Trail Road M 40,026,579 40,368,515 0.9%
75 North Avenue R 10,127,080 10,369,753 2.4%
77 Roosevelt Road R 5,611,395 5,653,367 0.7%
79 Butterfield Road R 5,988,594 6,048,888 1.0%
81 Ogden Avenue R 1,622,924 1,510,690 -6.9%
83 Maple Avenue R 4,530,085 4,353,609 -3.9%
85 63rd Street R 6,152,557 6,146,712 -0.1%
87 75th Street R 6,020,093 6,078,959 1.0%
89 Boughton Mainline M 41,742,751 42,886,440 2.7%
90 Boughton Road R 4,447,988 4,501,771 1.2%
93 127th Street R 2,256,617 2,319,667 2.8%
95 Archer Avenue/143rd Street R 2,978,925 3,180,604 6.8%
97 Illinois Route 7 R 4,734,562 4,965,505 4.9%
99 Spring Creek M 18,138,074 19,223,948 6.0%
101 U.S. Route 6 R 1,454,642 1,506,682 3.6%
Veterans Memorial Total 155,832,866 159,115,110 2.1%
* M=Mainline / R=Ramp / A=Attended Ramp Plaza / E=Electronic Toll Collection Only Ramp
1=Toll Collected in One Direction Only
Plaza 2013 2014

5-9
Veterans Memorial Tollway
Illinois Tollway 2014 Traffic Data Report
Average Trip
Vehicles Vehicle Miles Transactions Length (Miles)1989 1,718 18,733 2,794 10.90
1990 116,106 913,325 148,394 7.87
1991 112,664 1,080,313 177,384 9.59
1992 125,446 1,203,491 198,723 9.59
1993 133,101 1,280,823 211,525 9.62
1994 135,381 1,297,315 214,764 9.58
1995 136,250 1,324,254 219,397 9.72
1996 140,780 1,397,726 230,871 9.93
1997 149,430 1,481,389 240,479 9.91
1998 153,670 1,524,455 253,551 9.92
1999 162,950 1,578,153 267,579 9.68
2000 174,040 1,712,671 281,509 9.84
2001 184,280 1,820,705 297,086 9.88
2002 192,155 1,916,090 313,813 9.97
2003 193,150 1,940,636 316,557 10.05
2004 202,630 2,006,635 329,275 9.90
2005 199,310 1,953,866 321,209 9.80
2006 205,210 1,972,819 327,759 9.61
2007 212,000 2,007,320 335,879 9.47
2008 248,120 2,705,470 418,865 10.90
2009 251,180 2,783,566 428,534 11.08
2010 246,290 2,740,256 425,576 11.13
2011 253,630 2,845,902 442,475 11.22
2012 245,530 2,767,855 425,669 11.27
2013 257,920 2,778,398 426,939 10.77
2014 260,710 2,863,237 435,932 10.98
YearAverage Daily Total
TABLE 5-G: AVERAGE DAILY TRAFFIC DATA
The South Extension to the Veterans Memorial Tollway opened in 2007.

5-10
Veterans Memorial Tollway
Illinois Tollway 2014 Traffic Data Report
6,9
05
6,4
00
6,6
00
6,8
00
7,0
00
7,2
00
050
10
015
020
0
Volume
Ho
ur
PLA
ZA
89
SB
PLA
ZA
89 S
B30th
HV
5,8
89
5,3
00
5,5
00
5,7
00
5,9
00
6,1
00
6,3
00
6,5
00
6,7
00
050
10
015
020
0
Volume
Ho
ur
PLA
ZA
73
NB
PLA
ZA
73 N
B30th
HV
FIG
UR
E 5
-C
6,0
93
5,5
00
5,7
00
5,9
00
6,1
00
6,3
00
6,5
00
6,7
00
050
10
015
020
0
Volume
Ho
ur
PLA
ZA
73
SB
PLA
ZA
73 S
B30th
HV
FIG
UR
E 5
-D
6,6
57
6,0
00
6,2
00
6,4
00
6,6
00
6,8
00
7,0
00
050
10
01
50
20
0
Volume
Ho
ur
PLA
ZA
89
NB
PLA
ZA
89 N
B30th
HV
FIG
UR
E 5
-A
FIG
UR
E 5
-B
MA
INLIN
E P
LA
ZA
HIG
HE
ST
HO
UR
LY
VO
LU
ME

5-11
Veterans Memorial Tollway
Illinois Tollway 2014 Traffic Data Report
MA
INLIN
E P
LA
ZA
HIG
HE
ST
HO
UR
LY
VO
LU
ME
3,0
52
2,5
00
2,7
00
2,9
00
3,1
00
3,3
00
3,5
00
050
10
015
020
0
Volume
Ho
ur
PLA
ZA
99
SB
PLA
ZA
99 S
B30th
HV
FIG
UR
E 5
-E
3,2
43
2,4
00
2,6
00
2,8
00
3,0
00
3,2
00
3,4
00
3,6
00
050
10
015
020
0
Volume
Ho
ur
PLA
ZA
99
NB
PLA
ZA
99 N
B30th
HV
FIG
UR
E 5
-F

5-12
Veterans Memorial Tollway
Illinois Tollway 2014 Traffic Data Report
FIGURE 5-I
0
5
10
15
20
1980 1985 1990 1995 2000 2005 2010 2015
TRA
FFIC
(1,0
00s)
YEAR
PLAZA 77 ROOSEVELT ROAD
FIGURE 5-H
0
10
20
30
40
1980 1985 1990 1995 2000 2005 2010 2015
TRA
FFIC
(1,0
00s)
YEAR
PLAZA 75 NORTH AVENUE
FIGURE 5-G
0
20
40
60
80
100
120
140
1980 1985 1990 1995 2000 2005 2010 2015
TRA
FFIC
(1,0
00s)
YEAR
PLAZA 73 ARMY TRAIL ROAD
AVERAGE DAILY TRAFFIC TRENDS

5-13
Veterans Memorial Tollway
Illinois Tollway 2014 Traffic Data Report
FIGURE 5-L
0
5
10
15
1980 1985 1990 1995 2000 2005 2010 2015
TRA
FFIC
(1,0
00s)
YEAR
PLAZA 83 MAPLE AVENUE
FIGURE 5-K
0
1
2
3
4
5
1980 1985 1990 1995 2000 2005 2010 2015
TRA
FFIC
(1,0
00s)
YEAR
PLAZA 81 OGDEN AVENUE
FIGURE 5-J
0
5
10
15
20
1980 1985 1990 1995 2000 2005 2010 2015
TRA
FFIC
(1
,000
s)
YEAR
PLAZA 79 BUTTERFIELD ROAD
AVERAGE DAILY TRAFFIC TRENDS
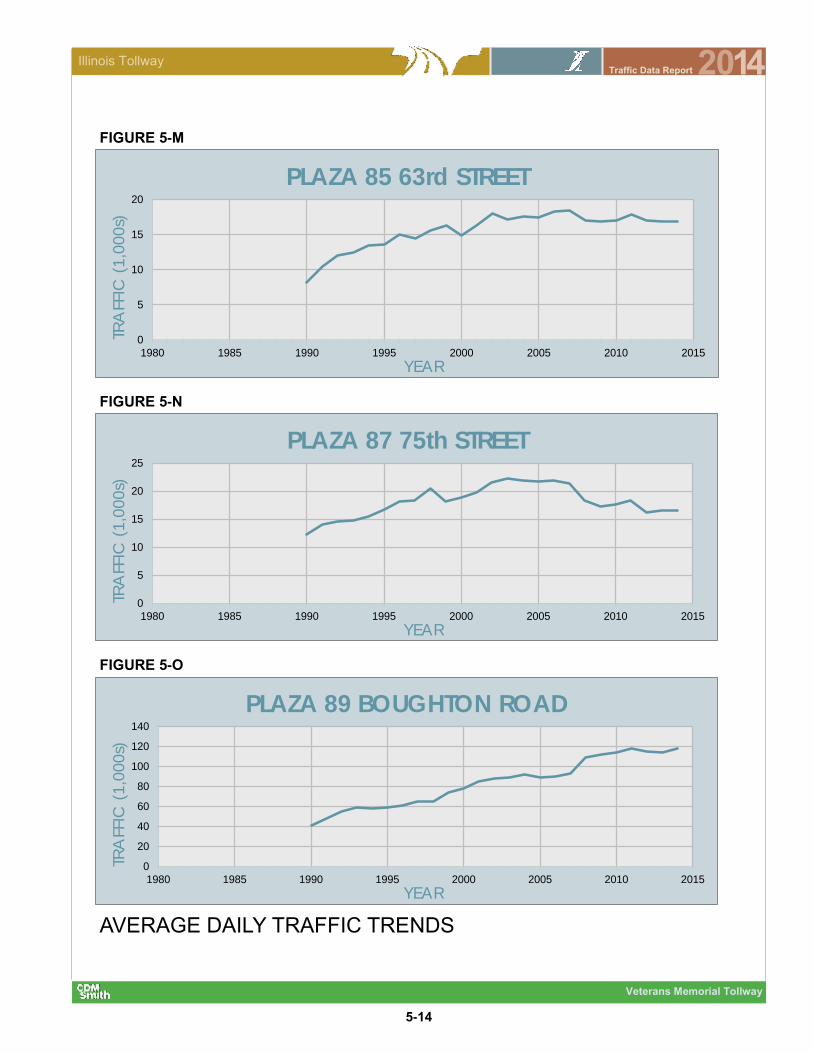
5-14
Veterans Memorial Tollway
Illinois Tollway 2014 Traffic Data Report
FIGURE 5-O
0
20
40
60
80
100
120
140
1980 1985 1990 1995 2000 2005 2010 2015
TRA
FFIC
(1,0
00s)
YEAR
PLAZA 89 BOUGHTON ROAD
FIGURE 5-N
0
5
10
15
20
25
1980 1985 1990 1995 2000 2005 2010 2015
TRA
FFIC
(1,0
00s)
YEAR
PLAZA 87 75th STREET
FIGURE 5-M
0
5
10
15
20
1980 1985 1990 1995 2000 2005 2010 2015
TRA
FFIC
(1,0
00s)
YEAR
PLAZA 85 63rd STREET
AVERAGE DAILY TRAFFIC TRENDS

5-15
Veterans Memorial Tollway
Illinois Tollway 2014 Traffic Data Report
0
2
4
6
8
10
1980 1985 1990 1995 2000 2005 2010 2015
TRA
FFIC
(1,0
00s)
YEAR
PLAZA 95 ARCHER AVENUE/143rd STREET
FIGURE 5-R
FIGURE 5-Q
0
2
4
6
8
10
1980 1985 1990 1995 2000 2005 2010 2015
TRA
FFIC
(1,0
00s)
YEAR
PLAZA 93 127th STREET
FIGURE 5-P
0
3
6
9
12
15
1980 1985 1990 1995 2000 2005 2010 2015
TRA
FFIC
(1,0
00s)
YEAR
PLAZA 90 BOUGHTON ROAD RAMP
AVERAGE DAILY TRAFFIC TRENDS
The South Extension opened in 2007.
The South Extension opened in 2007.
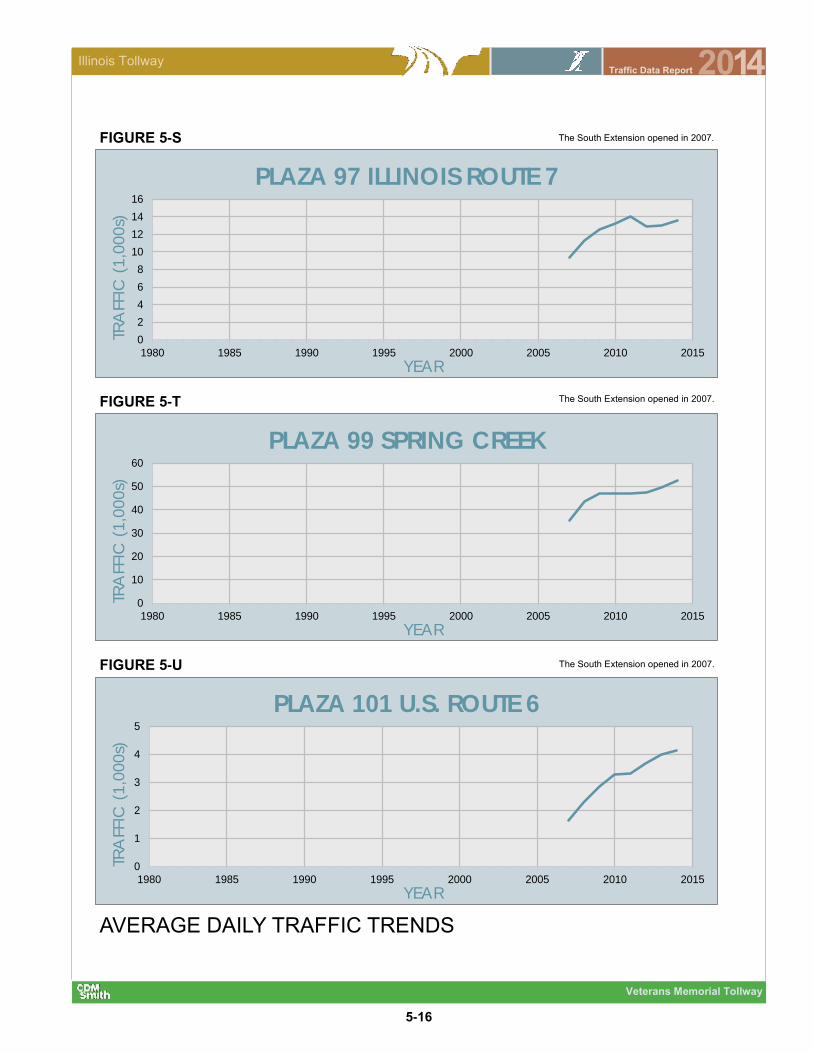
5-16
Veterans Memorial Tollway
Illinois Tollway 2014 Traffic Data Report
FIGURE 5-U
0
1
2
3
4
5
1980 1985 1990 1995 2000 2005 2010 2015
TRA
FFIC
(1,0
00s)
YEAR
PLAZA 101 U.S. ROUTE 6
FIGURE 5-T
0
10
20
30
40
50
60
1980 1985 1990 1995 2000 2005 2010 2015
TRA
FFIC
(1,0
00s)
YEAR
PLAZA 99 SPRING CREEK
0
2
4
6
8
10
12
14
16
1980 1985 1990 1995 2000 2005 2010 2015
TRA
FFIC
(1,0
00s)
YEAR
PLAZA 97 ILLINOIS ROUTE 7
FIGURE 5-S
AVERAGE DAILY TRAFFIC TRENDS
The South Extension opened in 2007.
The South Extension opened in 2007.
The South Extension opened in 2007.

5-17
Veterans Memorial Tollway
Illinois Tollway 2014 Traffic Data Report
0%
20%
40%
60%
80%
100%
120%
0:0
0
2:0
0
4:0
0
6:0
0
8:0
0
10
:00
12
:00
14
:00
16
:00
18
:00
20
:00
22
:00
% o
f Fre
e F
low
Sp
ee
d
Southbound
15th Percentile Median 85th Percentile
0%
20%
40%
60%
80%
100%
120%
0:0
0
2:0
0
4:0
0
6:0
0
8:0
0
10
:00
12
:00
14
:00
16
:00
18
:00
20
:00
22
:00
% o
f Fre
e F
low
Sp
ee
d
Northbound
15th Percentile Median 85th Percentile
0%
20%
40%
60%
80%
100%
120%
0:0
0
2:0
0
4:0
0
6:0
0
8:0
0
10
:00
12
:00
14
:00
16
:00
18
:00
20
:00
22
:00
% o
f Fre
e F
low
Sp
ee
d
Southbound
15th Percentile Median 85th Percentile
0%
20%
40%
60%
80%
100%
120%
0:0
0
2:0
0
4:0
0
6:0
0
8:0
0
10
:00
12
:00
14
:00
16
:00
18
:00
20
:00
22
:00
% o
f Fre
e F
low
Sp
ee
d
Northbound
15th Percentile Median 85th Percentile
FIGURE 5-V
AVERAGE WEEKDAY SPEED DISTRIBUTIONS, NORTHERN SECTION
FIGURE 5-W
FIGURE 5-X
AVERAGE WEEKDAY SPEED DISTRIBUTIONS, CENTRAL SECTION
FIGURE 5-Y

5-18
Veterans Memorial Tollway
Illinois Tollway 2014 Traffic Data Report
0%
20%
40%
60%
80%
100%
120%
0:0
0
2:0
0
4:0
0
6:0
0
8:0
0
10
:00
12
:00
14
:00
16
:00
18
:00
20
:00
22
:00
% o
f Fre
e F
low
Sp
ee
d
Southbound
15th Percentile Median 85th Percentile
FIGURE 5-Z
AVERAGE WEEKDAY SPEED DISTRIBUTIONS, SOUTHERN SECTION
FIGURE 5-AA
0%
20%
40%
60%
80%
100%
120%
0:0
0
2:0
0
4:0
0
6:0
0
8:0
0
10
:00
12
:00
14
:00
16
:00
18
:00
20
:00
22
:00
% o
f Fre
e F
low
Sp
ee
d
Northbound
15th Percentile Median 85th Percentile

5-19
Veterans Memorial Tollway
Illinois Tollway 2014 Traffic Data Report
AM PM AM PM AM PM AM PM AM PM AM PM
1 January -March 53 52 1.13 1.15 1.67 1.61 2.9 3.0 658 700 44 54
2 April-June 54 50 1.12 1.21 1.43 1.53 3.0 3.9 748 995 38 59
3 July-September 56 47 1.06 1.28 1.22 1.63 2.1 5.1 526 1,290 35 62
4 October-December 55 48 1.08 1.24 1.32 1.66 2.3 4.4 547 1,075 34 59
Total 2014 Entire Year 55 49 1.10 1.22 1.41 1.61 2.6 4.1 620 1,015 38 59
Quarter Range
Average
Speed (mph)
Average
Travel Time
Index
Planning
Time Index
Total Delay
(veh-hrs /
1000 VMT)
Average
Daily Delay
(veh-hrs)
Percent
Congested
Travel
Roadway performance measures sections and terms are defined on pages 1-5 and 1-6.
FIGURE 5-AB: ROADWAY PERFORMANCE MEASURES—NORTHERN SECTION
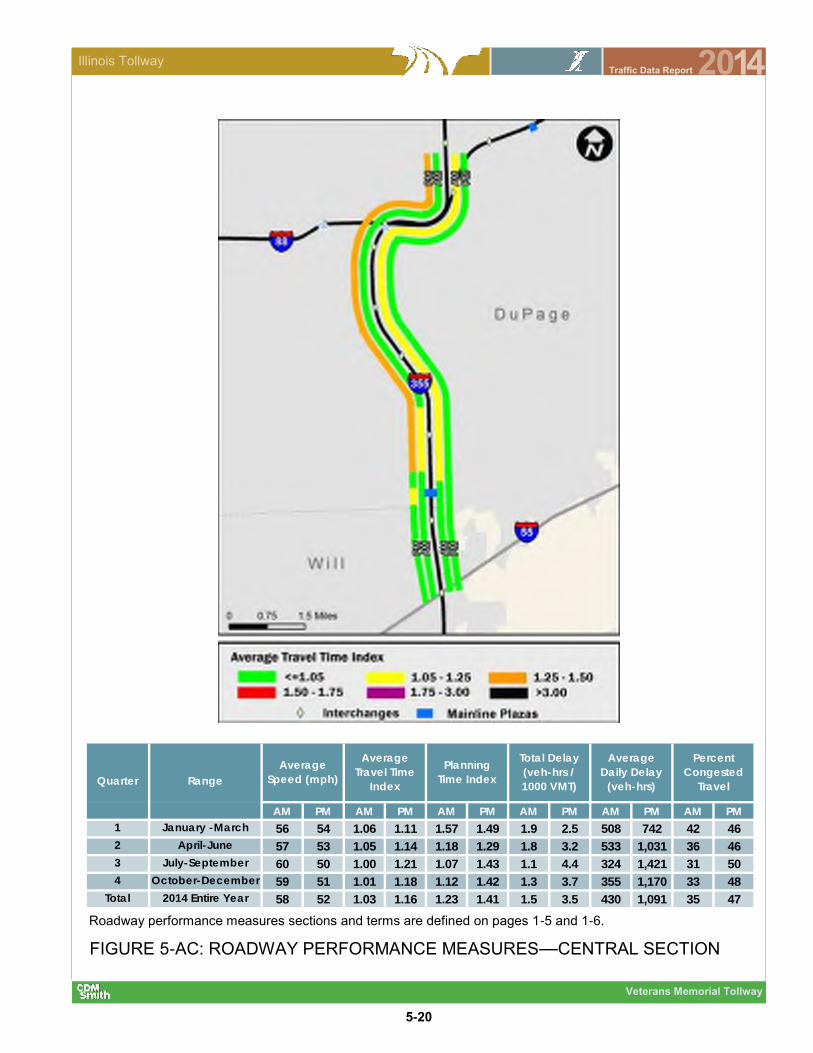
5-20
Veterans Memorial Tollway
Illinois Tollway 2014 Traffic Data Report
AM PM AM PM AM PM AM PM AM PM AM PM
1 January -March 56 54 1.06 1.11 1.57 1.49 1.9 2.5 508 742 42 46
2 April-June 57 53 1.05 1.14 1.18 1.29 1.8 3.2 533 1,031 36 46
3 July-September 60 50 1.00 1.21 1.07 1.43 1.1 4.4 324 1,421 31 50
4 October-December 59 51 1.01 1.18 1.12 1.42 1.3 3.7 355 1,170 33 48
Total 2014 Entire Year 58 52 1.03 1.16 1.23 1.41 1.5 3.5 430 1,091 35 47
Average
Speed (mph)
Average
Travel Time
Index
Total Delay
(veh-hrs /
1000 VMT)
Planning
Time IndexQuarter Range
Average
Daily Delay
(veh-hrs)
Percent
Congested
Travel
Roadway performance measures sections and terms are defined on pages 1-5 and 1-6.
FIGURE 5-AC: ROADWAY PERFORMANCE MEASURES—CENTRAL SECTION

5-21
Veterans Memorial Tollway
Illinois Tollway 2014 Traffic Data Report
AM PM AM PM AM PM AM PM AM PM AM PM
1 January -March 64 66 0.94 0.91 1.27 1.10 0.7 0.2 115 36 16 10
2 April-June 67 70 0.90 0.86 0.97 0.87 0.3 0.0 59 5 13 1
3 July-September 69 70 0.87 0.85 0.91 0.87 0.1 0.0 17 0 5 0
4 October-December 67 69 0.90 0.86 0.97 0.90 0.3 0.0 51 0 11 0
Total 2014 Entire Year 67 69 0.90 0.87 1.03 0.94 0.3 0.1 60 10 11 3
Total Delay
(veh-hrs /
1000 VMT)
Average
Daily Delay
(veh-hrs)
Percent
Congested
TravelQuarter Range
Average
Speed (mph)
Average
Travel Time
Index
Planning
Time Index
Roadway performance measures sections and terms are defined on pages 1-5 and 1-6.
FIGURE 5-AD: ROADWAY PERFORMANCE MEASURES—SOUTHERN SECTION
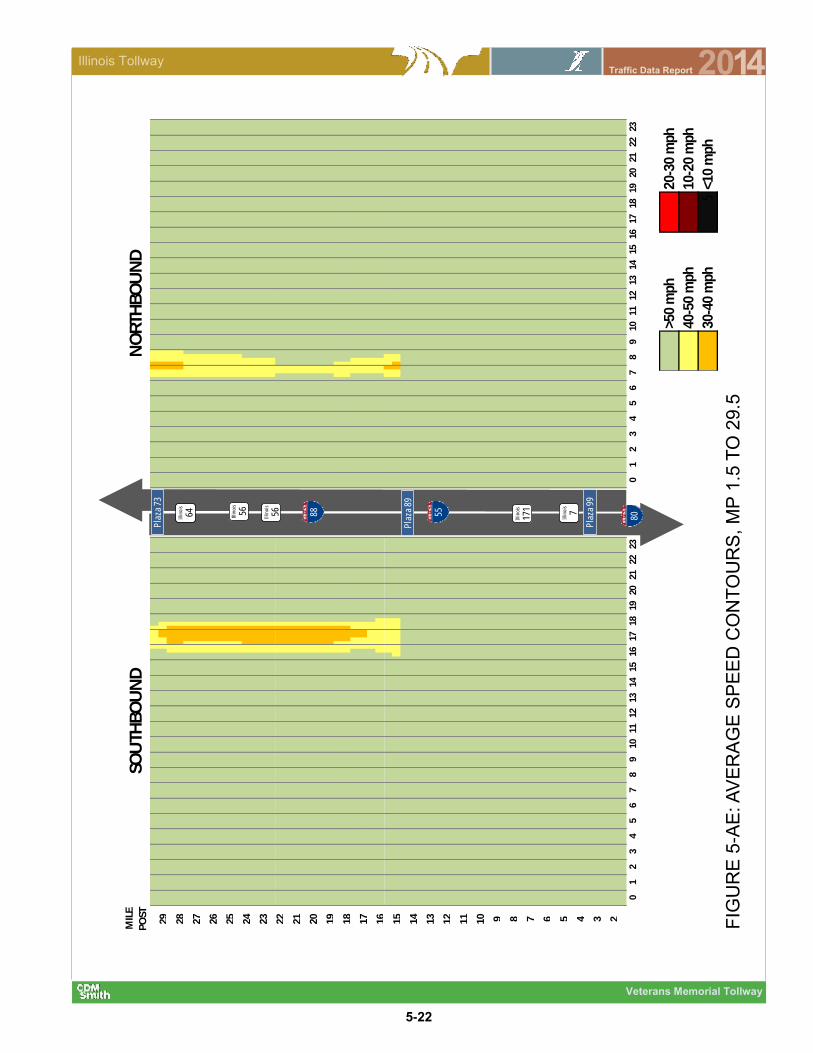
5-22
Veterans Memorial Tollway
Illinois Tollway 2014 Traffic Data Report
MIL
E
PO
ST
29 28 27 26 25 24 23 22 21 20 19 18 17 16 15 14 13 12 11 10 9 8 7 6 5 4 3 2
SOU
THB
OU
ND
NO
RTH
BO
UN
D
110
12
34
56
78
910
2312
1314
1516
1718
1920
2122
110
12
34
56
78
910
2312
1314
1516
1718
1920
2122
88 55
Illin
ois
7
80
Pla
za 9
9
Illin
ois
171
Pla
za 8
9
Illin
ois
56Illin
ois
56
Illin
ois
64
Pla
za 7
3
51>5
0 m
ph25
20-3
0 m
ph
4540
-50
mph
1510
-20
mph
3530
-40
mph
5<1
0 m
ph
FIG
UR
E 5
-AE
: A
VE
RA
GE
SP
EE
D C
ON
TO
UR
S,
MP
1.5
TO
29.5

Appendices
2014
Appendices
Section 6 Appendices

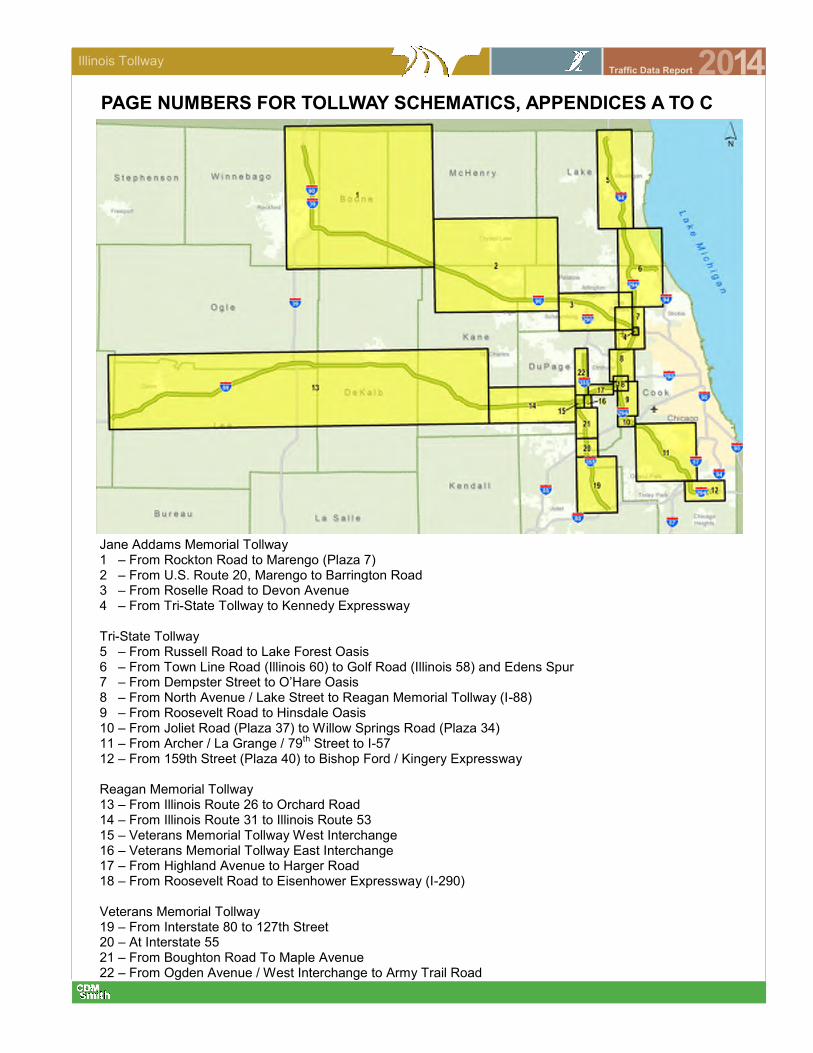
Illinois Tollway 2014 Traffic Data Report
Jane Addams Memorial Tollway 1 – From Rockton Road to Marengo (Plaza 7) 2 – From U.S. Route 20, Marengo to Barrington Road 3 – From Roselle Road to Devon Avenue 4 – From Tri-State Tollway to Kennedy Expressway Tri-State Tollway 5 – From Russell Road to Lake Forest Oasis 6 – From Town Line Road (Illinois 60) to Golf Road (Illinois 58) and Edens Spur 7 – From Dempster Street to O’Hare Oasis 8 – From North Avenue / Lake Street to Reagan Memorial Tollway (I-88) 9 – From Roosevelt Road to Hinsdale Oasis 10 – From Joliet Road (Plaza 37) to Willow Springs Road (Plaza 34) 11 – From Archer / La Grange / 79
th Street to I-57
12 – From 159th Street (Plaza 40) to Bishop Ford / Kingery Expressway Reagan Memorial Tollway 13 – From Illinois Route 26 to Orchard Road 14 – From Illinois Route 31 to Illinois Route 53 15 – Veterans Memorial Tollway West Interchange 16 – Veterans Memorial Tollway East Interchange 17 – From Highland Avenue to Harger Road 18 – From Roosevelt Road to Eisenhower Expressway (I-290) Veterans Memorial Tollway 19 – From Interstate 80 to 127th Street 20 – At Interstate 55 21 – From Boughton Road To Maple Avenue 22 – From Ogden Avenue / West Interchange to Army Trail Road
PAGE NUMBERS FOR TOLLWAY SCHEMATICS, APPENDICES A TO C


Section 2
Appendix A
Average Daily Traffi
c
2013 Systemwide Annual Average Daily Traffic
Schematics
Appendix A


25,860
19,220
17,390
28,120
28,650
27,020
16,020
24,300
24,330
24,350
25,600
19,070
23,760
15,870
27,480
17,31080
15,580
15,860
3,540 2,250 3,870 3,050 2,400
2,060
3,000
3,480 2,420 2,520
4,770 2,860 2,040
3,310
2,080
1,680
3,810
2,900
3,080
2,990
610
150
840
680
1,180
MainlineMarengoPlaza 7
BelvidereOasis
I-39/U.S. 20Cherry Valley
Rockton Rd.
Irene Road GenoaRoad
Illinois 173Plaza 4
East Riverside Blvd.Plaza 2IDOT ISTHA
U.S. Bus. 20Rockford
MainlineBelviderePlaza 5
MainlineSouth Beloit
Plaza 1
3 ORT Lanes
3 ORT Lanes
3 ORT Lanes
3 ORT Lanes
§̈¦39
§̈¦90
§̈¦90
9.4% CV87.3% I-PASS
17.8% CV79.3% I-PASS
29.8% CV71.5% I-PASS
12.0% CV86.5% I-PASS
22.0% CV79.8% I-PASS
MP 8.9MP 3.5MP 2.7
MP 20.8
MP 12.3
MP 37.8MP 25.0MP 24.2MP 23.3MP 17.4
MP 15.8TO
WISCONSIN
N
N
NN
N
NNN
NN
N
BA
A
A-1
2014 Annual Average Daily TrafficOn Jane Addams Memorial Tollway, from Rockton Road to Genoa Road
CV = Commercial VehiclesI-PASS = I-PASS Electronic Toll CollectionORT = Open Road Tolling LanesAET = All Electronic Tolling
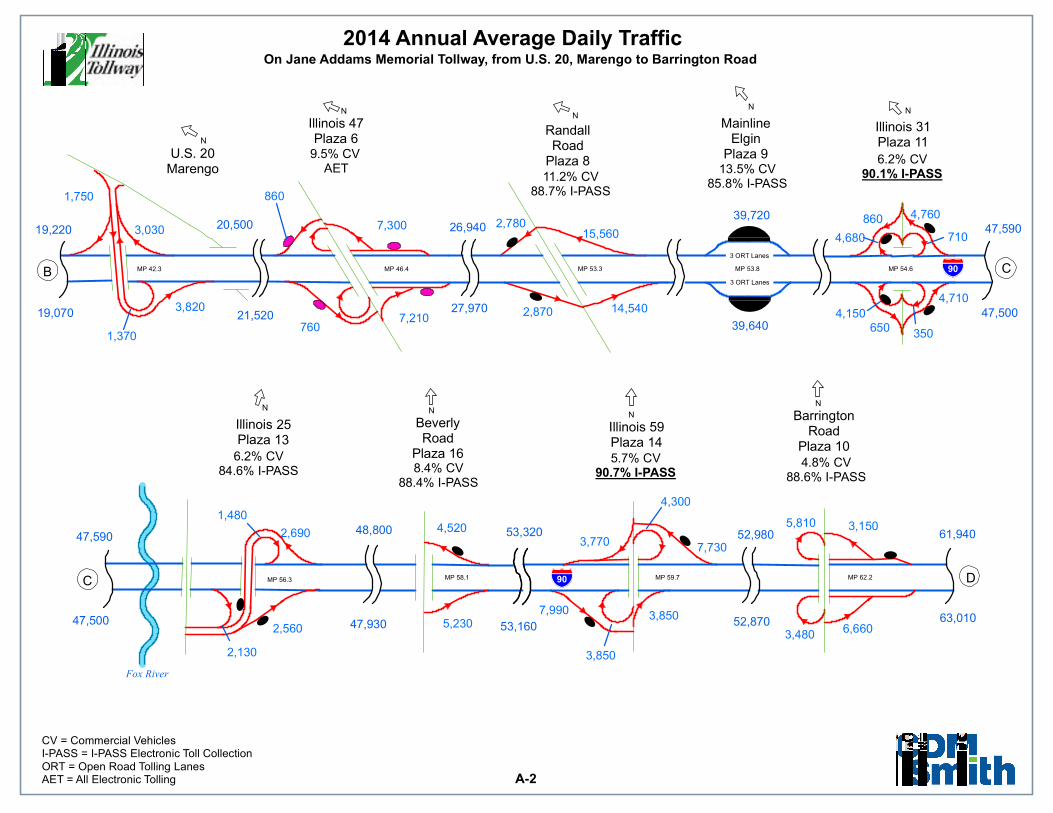
19,220
47,500
47,590
52,870
52,980
47,930
48,800 53,320
39,640
27,970
39,720
19,070
53,160
26,940
61,940
20,500
47,590
21,520
63,010
47,500
860
760
4,520
15,560
14,540
5,810
3,770
2,130
3,030
1,750
3,850
4,300
4,680 7,300
4,710
3,480
3,850
3,820
2,780
7,210
7,730
7,990
6,660
3,150 2,690
5,230
1,370
1,480
4,760
4,150
2,560
2,870
650 350
710
860
Fox River
BarringtonRoad
Plaza 10
RandallRoad
Plaza 8
Illinois 31Plaza 11
Illinois 25Plaza 13
Illinois 59Plaza 14
U.S. 20Marengo
BeverlyRoad
Plaza 16
Illinois 47Plaza 6
MainlineElgin
Plaza 9
3 ORT Lanes
3 ORT Lanes
§̈¦90
§̈¦90
5.7% CV90.7% I-PASS
6.2% CV90.1% I-PASS
9.5% CV AET
4.8% CV88.6% I-PASS
13.5% CV85.8% I-PASS
11.2% CV88.7% I-PASS
6.2% CV84.6% I-PASS 8.4% CV
88.4% I-PASS
MP 62.2MP 59.7MP 58.1MP 56.3
MP 54.6MP 53.8MP 53.3MP 46.4MP 42.3
NN
NN
NN
NN
N
C
CB
D
A-2
2014 Annual Average Daily TrafficOn Jane Addams Memorial Tollway, from U.S. 20, Marengo to Barrington Road
CV = Commercial VehiclesI-PASS = I-PASS Electronic Toll CollectionORT = Open Road Tolling LanesAET = All Electronic Tolling

72,520
61,120
80,390
63,010
76,060
76,950
62,25061,940
74,100 62,200
62,190
74,780
76,060
69,980
3,960
22,610
12,830
17,530
12,030
9,340
1,840
3,440
6,080
9,490 7,860
2,090 4,280 4,580
4,670
9,990 6,170
1,890 5,610
6,070
10,580
11,310
11,090
10,540
10,090
ElmhurstRoad
LeeStreet
ArlingtonHeightsRoad
Plaza 18
Des PlainesOasis
DevonAvenue
RoselleRoad
Plaza 12
Illinois 53/I-290Plaza 15
MainlineDevon Avenue
Plaza 17
4 ORT Lanes
§̈¦90
§̈¦290
§̈¦90
6.8% CV85.9% I-PASS
80.8% ORT
8.3% CV91.9% I-PASS4.3% CV
89.2% I-PASS
10.7% CV87.2% I-PASS
MP 77.3MP 77.1MP 76.1MP 74.4
MP 73.5MP 70.7MP 68.2MP 65.5
N
N
NN
N
N
N
N
E
ED
F
A-3
2014 Annual Average Daily TrafficOn Jane Addams Memorial Tollway, from Roselle Road to Devon Avenue
CV = Commercial VehiclesI-PASS = I-PASS Electronic Toll CollectionORT = Open Road Tolling LanesAET = All Electronic Tolling
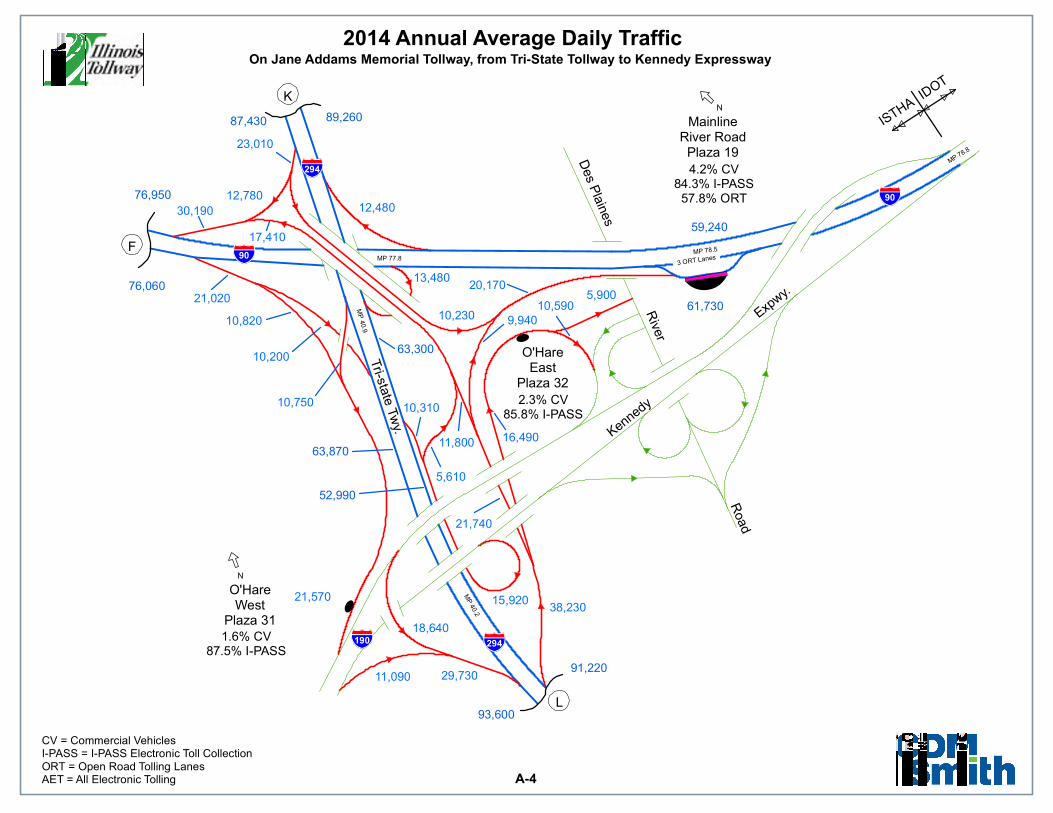
59,240
61,730
63,870
52,990
63,300
89,260
91,220
76,060
76,950
93,600
87,430
11,090
11,800
21,740
13,480
15,920
18,640
20,170
10,820
21,570
16,490
10,590
38,230
17,410
10,750
10,200
30,190
21,020
29,730
23,010
5,900
5,610
9,940
12,480 12,780
10,310
10,230
Des P
lain
es
Tri-s
tate
Tw
y. Kennedy
Exp
wy.
Rive
r
Road
IDOT
O'HareWest
Plaza 31
ISTHA
O'HareEast
Plaza 32
MainlineRiver RoadPlaza 19
3 ORT Lanes§̈¦90
§̈¦90
§̈¦190 §̈¦294
§̈¦294 4.2% CV84.3% I-PASS
57.8% ORT
1.6% CV87.5% I-PASS
2.3% CV85.8% I-PASS
MP 77.8
MP
40.2
MP
40.9
MP 78.8
MP 78.5
N
N
L
K
F
A-4
2014 Annual Average Daily TrafficOn Jane Addams Memorial Tollway, from Tri-State Tollway to Kennedy Expressway
CV = Commercial VehiclesI-PASS = I-PASS Electronic Toll CollectionORT = Open Road Tolling LanesAET = All Electronic Tolling

30,330
29,370
40,620
48,890
44,570
67,620
69,830
47,980
51,86031,190
65,620
63,18058,600
35,450
50,940
59,930 69,830
42,450
43,780
34,630
67,620
14,240
2,380
2,030
4,260
2,970
5,320
6,720 4,320
5,340
6,100
1,040
4,210 4,540
1,830
1,590
4,010 3,730
1,820
3,290
5,280
4,300
4,440
8,980
2,960 8,310
12,590
580
250
11,250
12,610
Edwards Road
LakeForestOasis
RussellRoad
Buckley Road(Illinois 137)
Plaza 20BelvidereRoad
(Illinois 120)
RocklandRoad
(Illinois 176)
GrandAvenue
(Illinois 132)
RosecransRoad
(Illinois 173)
SkokieHighway(U.S. 41)
IDOT ISTHA
MainlineWaukegan Road
Plaza 21
MilwaukeeAvenue
(Illinois 21)
3 ORT Lanes
3 ORT Lanes§̈¦94 §̈¦94
§̈¦94
To Wisconsin
7.6% CV90.9% I-PASS
19.9% CV81.8% I-PASS
MP 8.4MP 4.8MP 2.4
MP 18.1MP 16.0MP 13.8MP 11.2MP 10.1
MP 0.5
MP 1.4
N
N
N
NN
N
N
NN
N
G
HG
A-5
2014 Annual Average Daily TrafficOn Tri-State Tollway, from Russell Road to Lake Forest Oasis
CV = Commercial VehiclesI-PASS = I-PASS Electronic Toll CollectionORT = Open Road Tolling LanesAET = All Electronic Tolling
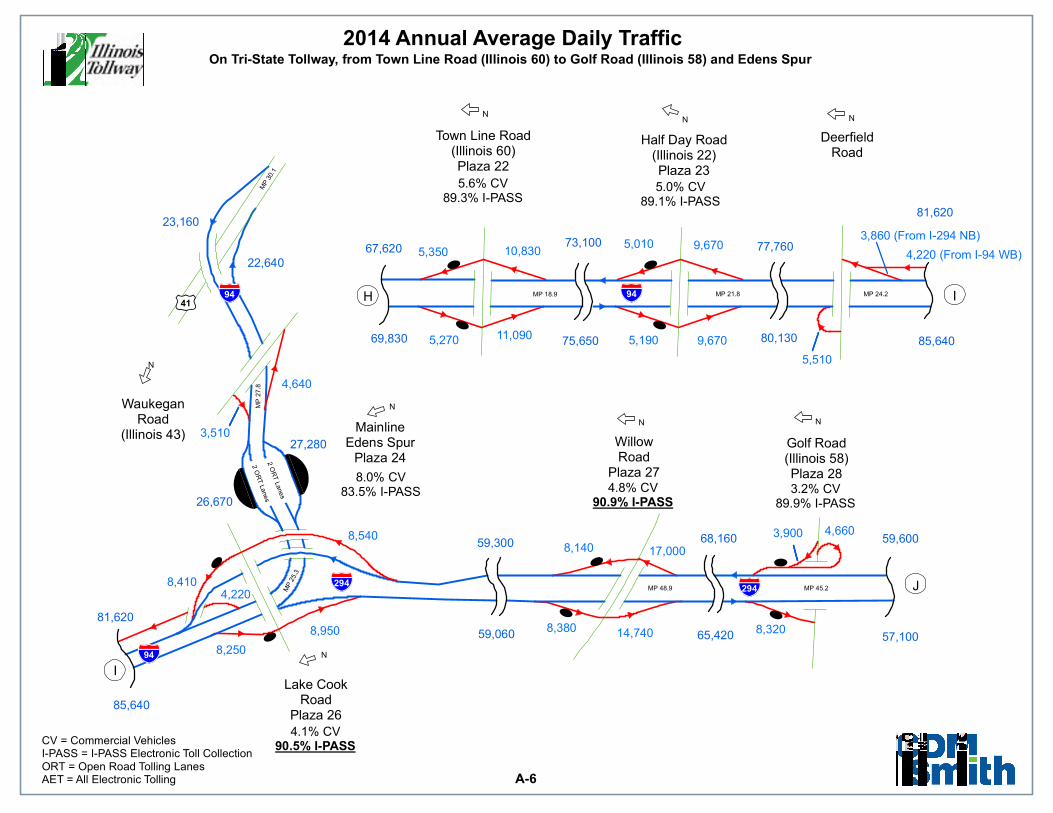
59,300
23,160
59,060
22,640
85,640
77,760
68,160
73,100
27,280
67,620
57,100
80,13075,650
65,420
81,620
81,620
85,640
59,600
26,670
69,830 11,090
3,860 (From I-294 NB)
10,830
14,740
17,000
4,220
8,140
8,950
4,640
8,410
8,320 8,380
8,250
5,190
5,010
5,270 9,670
4,660 3,900
5,510
3,510
5,350
8,540
9,670 4,220 (From I-94 WB)
DeerfieldRoad
WaukeganRoad
(Illinois 43)Golf Road(Illinois 58)Plaza 28
Half Day Road(Illinois 22)Plaza 23
Town Line Road(Illinois 60)Plaza 22
Lake CookRoad
Plaza 26
WillowRoad
Plaza 27
MainlineEdens Spur
Plaza 24
2 O
RT
Lanes
2 O
RT
Lanes
§̈¦294
§̈¦94
§̈¦294
§̈¦94 §̈¦94
£¤41
4.1% CV90.5% I-PASS
4.8% CV90.9% I-PASS
3.2% CV89.9% I-PASS
5.6% CV89.3% I-PASS
5.0% CV89.1% I-PASS
8.0% CV83.5% I-PASS
MP 45.2MP 48.9
MP 24.2MP 21.8MP 18.9
MP
25.3
MP
27
.8M
P 3
0.1
N
N
NN
N
NNN
I
I
J
H
A-6
2014 Annual Average Daily TrafficOn Tri-State Tollway, from Town Line Road (Illinois 60) to Golf Road (Illinois 58) and Edens Spur
CV = Commercial VehiclesI-PASS = I-PASS Electronic Toll CollectionORT = Open Road Tolling LanesAET = All Electronic Tolling
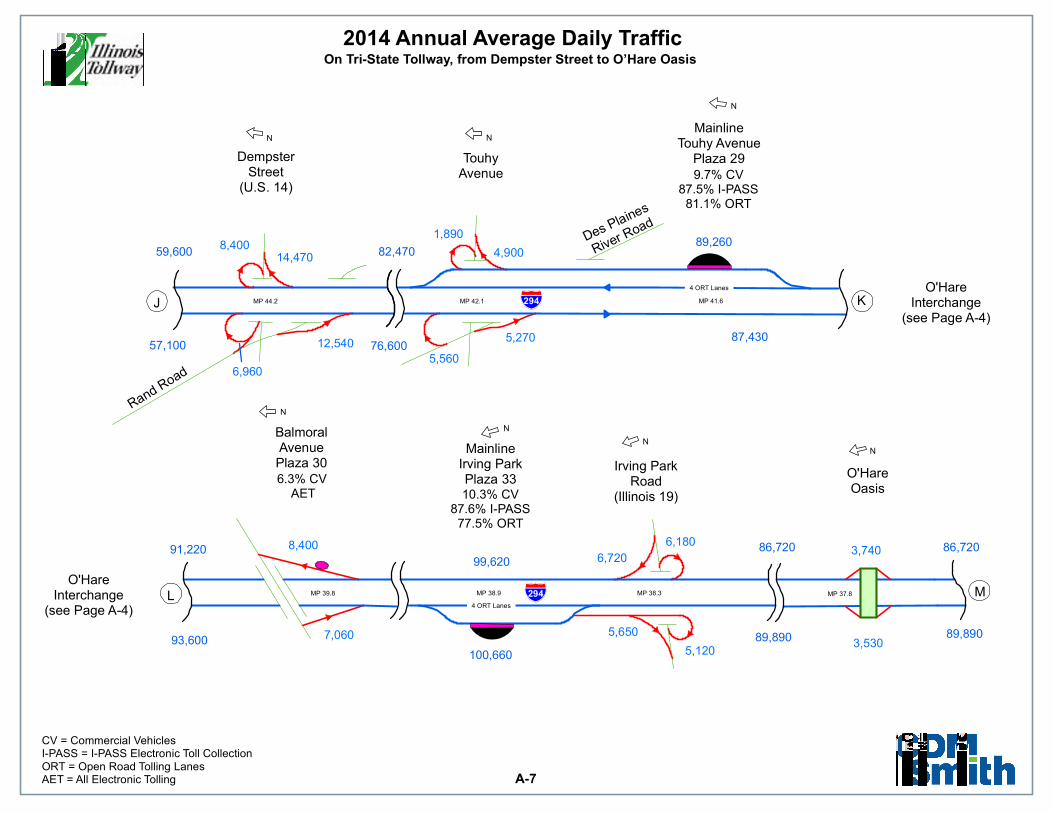
99,620
87,430
91,220
89,89093,600
82,47059,600
57,100
86,720
76,600
89,260
86,720
89,890
100,660
12,540
14,470 4,900
6,180
6,720
5,650
6,960
8,400
5,560
5,120 3,530
3,740
1,890
5,270
8,400
7,060
Des Plaines
River Road
Rand Road
BalmoralAvenuePlaza 30 Irving Park
Road(Illinois 19)
TouhyAvenue
O'HareOasis
DempsterStreet
(U.S. 14)
MainlineIrving ParkPlaza 33
MainlineTouhy Avenue
Plaza 29
O'HareInterchange
(see Page A-4)
O'HareInterchange
(see Page A-4)
4 ORT Lanes
4 ORT Lanes§̈¦294
§̈¦294
9.7% CV87.5% I-PASS
81.1% ORT
10.3% CV87.6% I-PASS
77.5% ORT
6.3% CV AET
MP 37.8MP 38.3MP 38.9MP 39.8
MP 41.6MP 42.1MP 44.2
N
N
NN
N
NN
L M
KJ
A-7
2014 Annual Average Daily TrafficOn Tri-State Tollway, from Dempster Street to O’Hare Oasis
CV = Commercial VehiclesI-PASS = I-PASS Electronic Toll CollectionORT = Open Road Tolling LanesAET = All Electronic Tolling
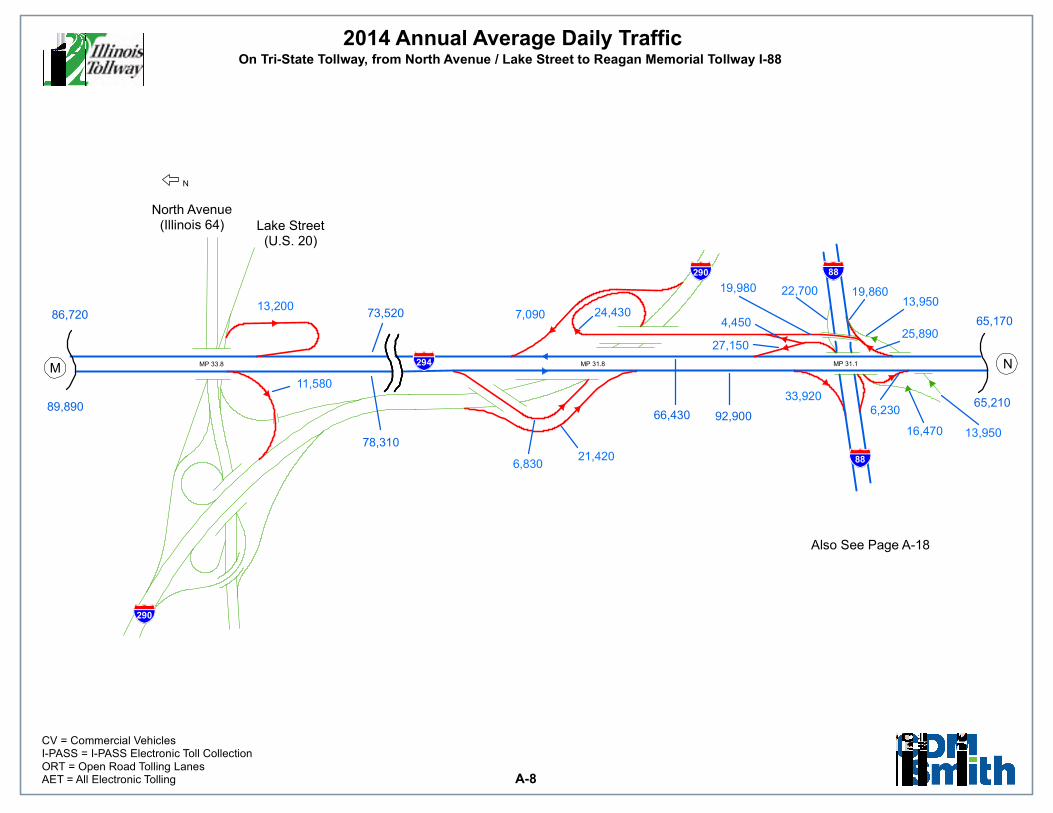
65,21066,430
78,310
92,900
73,52065,170
86,720
89,890
11,580
27,150
22,700
21,420
19,980
33,920
24,430
16,470
25,890
13,200
4,450
6,230
7,090
6,830
13,950
19,860 13,950
Lake Street(U.S. 20)
North Avenue
(Illinois 64)
Also See Page A-18
§̈¦294
§̈¦290
§̈¦88
§̈¦88
§̈¦290
MP 31.1MP 31.8MP 33.8
N
NM
A-8
2014 Annual Average Daily TrafficOn Tri-State Tollway, from North Avenue / Lake Street to Reagan Memorial Tollway I-88
CV = Commercial VehiclesI-PASS = I-PASS Electronic Toll CollectionORT = Open Road Tolling LanesAET = All Electronic Tolling

80,950
65,470
64,660
70,060
84,780 84,130
86,020
65,170
65,210
85,610 86,020
69,620
20,120
20,140
3,600
1,630
6,170
5,200
2,820
2,810
3,000
6,830
3,590
3,180 3,750
4,030
6,070
4,590
4,960
1,250
HinsdaleOasis
RooseveltRoad
(Illinois 38)
OgdenAvenue
(U.S. 34)
MainlineCermak Road
Plaza 35Cermak
Road(22nd Street)
Also See Page A-17
4 ORT Lanes
4 ORT Lanes
§̈¦294
§̈¦88
§̈¦294
TO
17.2% CV85.9% I-PASS
82.2% ORT
MP 25.0MP 27.4MP 29.1
MP 29.5MP 29.9MP 30.5
N N
N
N
N
PO
ON
A-9
2014 Annual Average Daily TrafficOn Tri-State Tollway, from Roosevelt Road to Hinsdale Oasis
CV = Commercial VehiclesI-PASS = I-PASS Electronic Toll CollectionORT = Open Road Tolling LanesAET = All Electronic Tolling
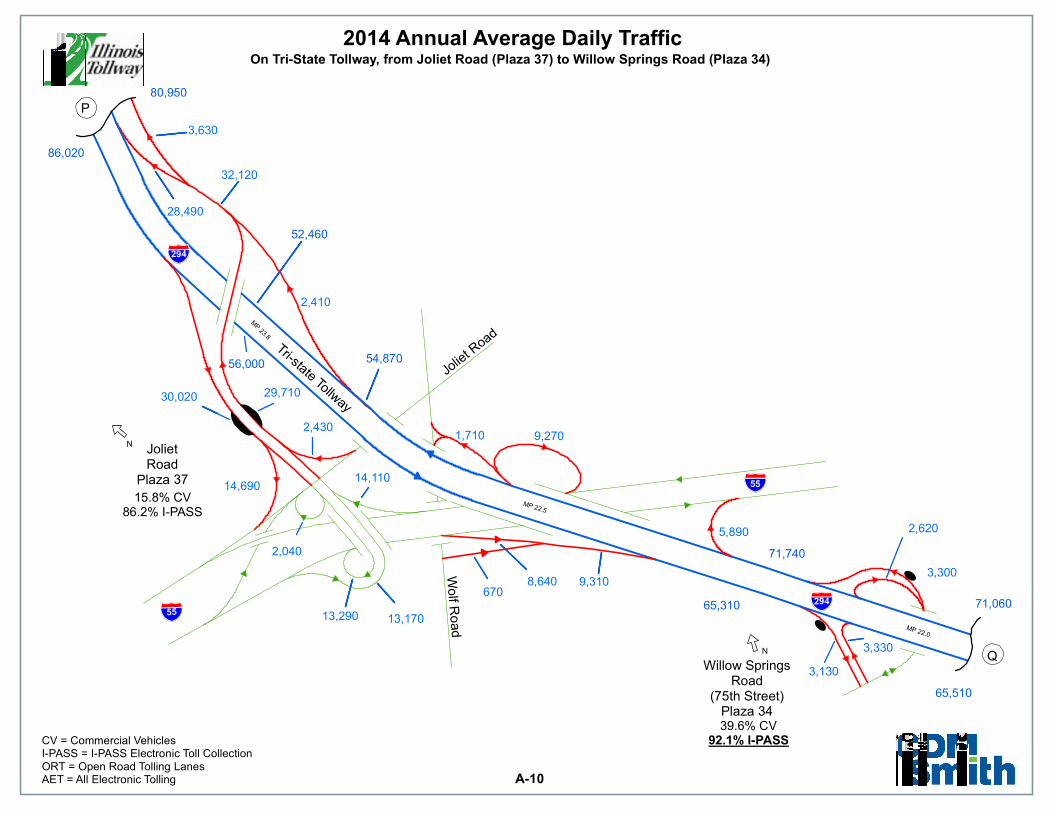
65,510
80,950
71,060
86,020
56,000
52,460
54,870
71,740
65,310
2,040
2,430
14,110 14,690
29,710
13,170
28,490
30,020
32,120
13,290
3,330
3,130
9,270
5,890
3,630
8,640 3,300
2,620
9,310
2,410
670
1,710
Jolie
t Road
Tri-state Tollway
JolietRoad
Plaza 37
Wolf R
oad
Willow SpringsRoad
(75th Street)Plaza 34
§̈¦294
§̈¦55 §̈¦294
§̈¦55
39.6% CV92.1% I-PASS
15.8% CV86.2% I-PASS
MP 22.0
MP 22.5
MP 23.8
N
N
Q
P
A-10
2014 Annual Average Daily TrafficOn Tri-State Tollway, from Joliet Road (Plaza 37) to Willow Springs Road (Plaza 34)
CV = Commercial VehiclesI-PASS = I-PASS Electronic Toll CollectionORT = Open Road Tolling LanesAET = All Electronic Tolling
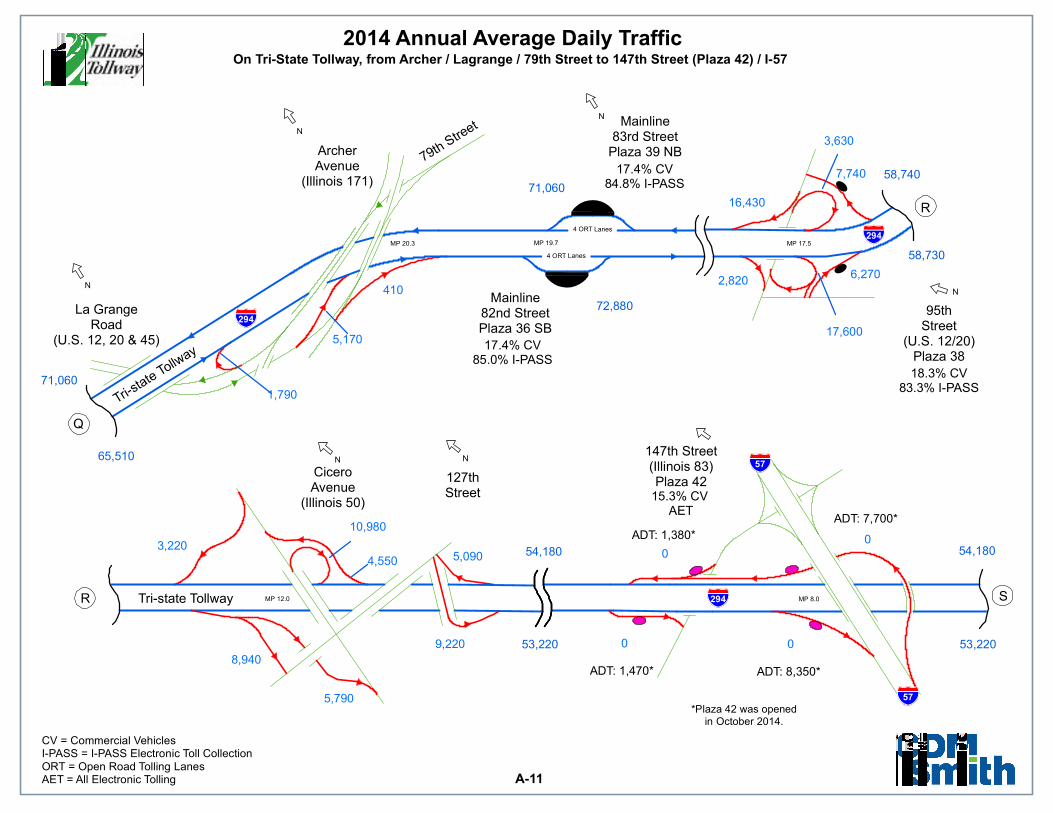
65,510
72,880
54,180
53,220
58,730
58,740
54,180
53,220
71,060
71,060
0
0 0
0
410
16,430
10,980
17,600
8,940
5,090 4,550
6,270
3,220
3,630
2,820
5,790
9,220
7,740
1,790
5,170
ADT: 8,350*
ADT: 1,380*
ADT: 7,700*
ADT: 1,470*
*Plaza 42 was openedin October 2014.
127thStreet
Tri-state Tollw
ay
CiceroAvenue
(Illinois 50)
79th Stre
et
ArcherAvenue
(Illinois 171)
La GrangeRoad
(U.S. 12, 20 & 45)
Mainline83rd Street
Plaza 39 NB
Mainline82nd StreetPlaza 36 SB
Tri-state Tollway
95thStreet
(U.S. 12/20)Plaza 38
147th Street(Illinois 83)Plaza 42
4 ORT Lanes
4 ORT Lanes
§̈¦294
§̈¦294
§̈¦294
§̈¦57
§̈¦57
15.3% CV AET
18.3% CV83.3% I-PASS
17.4% CV84.8% I-PASS
17.4% CV85.0% I-PASS
MP 8.0MP 12.0
MP 17.5MP 19.7MP 20.3
N N
N
N
N
N
SR
R
Q
A-11
2014 Annual Average Daily TrafficOn Tri-State Tollway, from Archer / Lagrange / 79th Street to 147th Street (Plaza 42) / I-57
CV = Commercial VehiclesI-PASS = I-PASS Electronic Toll CollectionORT = Open Road Tolling LanesAET = All Electronic Tolling
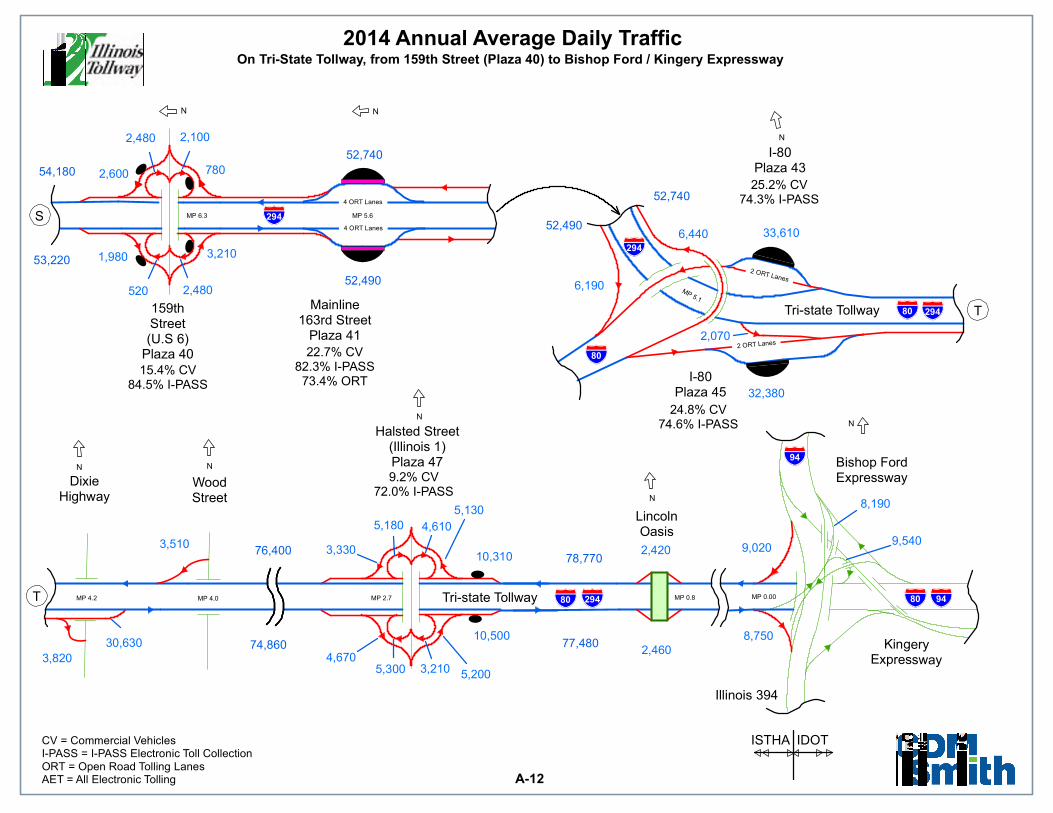
74,860
76,400
52,740
52,490
52,740
78,770
54,180
53,220
52,490
77,480
33,610
30,630
8,190
2,070
4,670
5,180
1,980
2,480
6,190
9,020
8,750
2,480
2,100
4,610
2,460
6,440
3,820
2,420 3,510
2,600
3,210
3,330 9,540
5,130
780
520
32,380
5,300 3,210 5,200
10,310
10,500
WoodStreet
Halsted Street(Illinois 1)Plaza 47
KingeryExpressway
Tri-state Tollway
Tri-state Tollway
LincolnOasis
Illinois 394
Bishop FordExpresswayDixie
Highway
I-80Plaza 45
I-80Plaza 43
ISTHA IDOT
159thStreet(U.S 6)
Plaza 40
Mainline163rd Street
Plaza 41
4 ORT Lanes
2 ORT Lanes
4 ORT Lanes
2 ORT Lanes
§̈¦294
§̈¦80 §̈¦94§̈¦80
§̈¦94
§̈¦80
§̈¦80
§̈¦294
§̈¦294
§̈¦294
22.7% CV82.3% I-PASS
73.4% ORT
9.2% CV72.0% I-PASS
24.8% CV74.6% I-PASS
15.4% CV84.5% I-PASS
25.2% CV74.3% I-PASS
MP 0.8MP 2.7MP 4.0MP 4.2
MP 5.6MP 6.3
MP 0.00
MP 5.1
N
N
N
N
N
N
N N
S
T
T
A-12
2014 Annual Average Daily TrafficOn Tri-State Tollway, from 159th Street (Plaza 40) to Bishop Ford / Kingery Expressway
CV = Commercial VehiclesI-PASS = I-PASS Electronic Toll CollectionORT = Open Road Tolling LanesAET = All Electronic Tolling
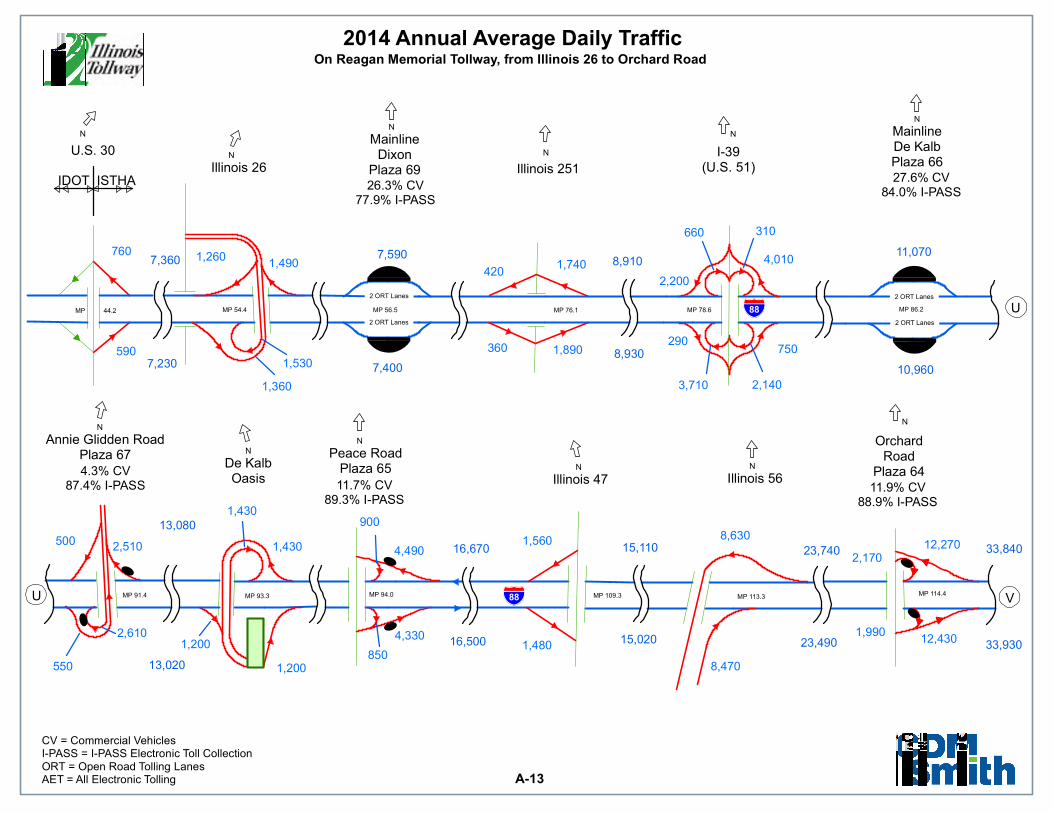
15,110
8,9107,590
7,400
8,9307,230
7,360
13,020
33,840
33,930
13,080
16,500
16,670 23,740
15,020 23,490
11,070
10,960
660
750
12,430 4,330
1,560
1,990 1,480
1,260
1,430
2,610
1,530
1,490
2,510
1,360
1,200
3,710
2,170
1,740
8,630
4,490
4,010
1,200 8,470
1,430 12,270
900
420
500
760
550 850
310
360 590 290
2,200
2,140
1,890
Illinois 56
Illinois 26
Illinois 47
OrchardRoad
Plaza 64
Illinois 251
Annie Glidden RoadPlaza 67 Peace Road
Plaza 65De KalbOasis
U.S. 30 I-39(U.S. 51)
IDOT ISTHA
MainlineDe KalbPlaza 66
MainlineDixon
Plaza 69
2 ORT Lanes 2 ORT Lanes
2 ORT Lanes 2 ORT Lanes
§̈¦88
§̈¦88
4.3% CV87.4% I-PASS 11.7% CV
89.3% I-PASS
27.6% CV84.0% I-PASS
11.9% CV88.9% I-PASS
26.3% CV77.9% I-PASS
MP 86.2MP 56.5 MP 78.6MP 76.1MP 54.4
MP 94.0MP 93.3MP 91.4 MP 114.4MP 113.3MP 109.3
MP 44.2
N
N
N N
NN
N
N
N
N
N
N
VU
U
A-13
2014 Annual Average Daily TrafficOn Reagan Memorial Tollway, from Illinois 26 to Orchard Road
CV = Commercial VehiclesI-PASS = I-PASS Electronic Toll CollectionORT = Open Road Tolling LanesAET = All Electronic Tolling
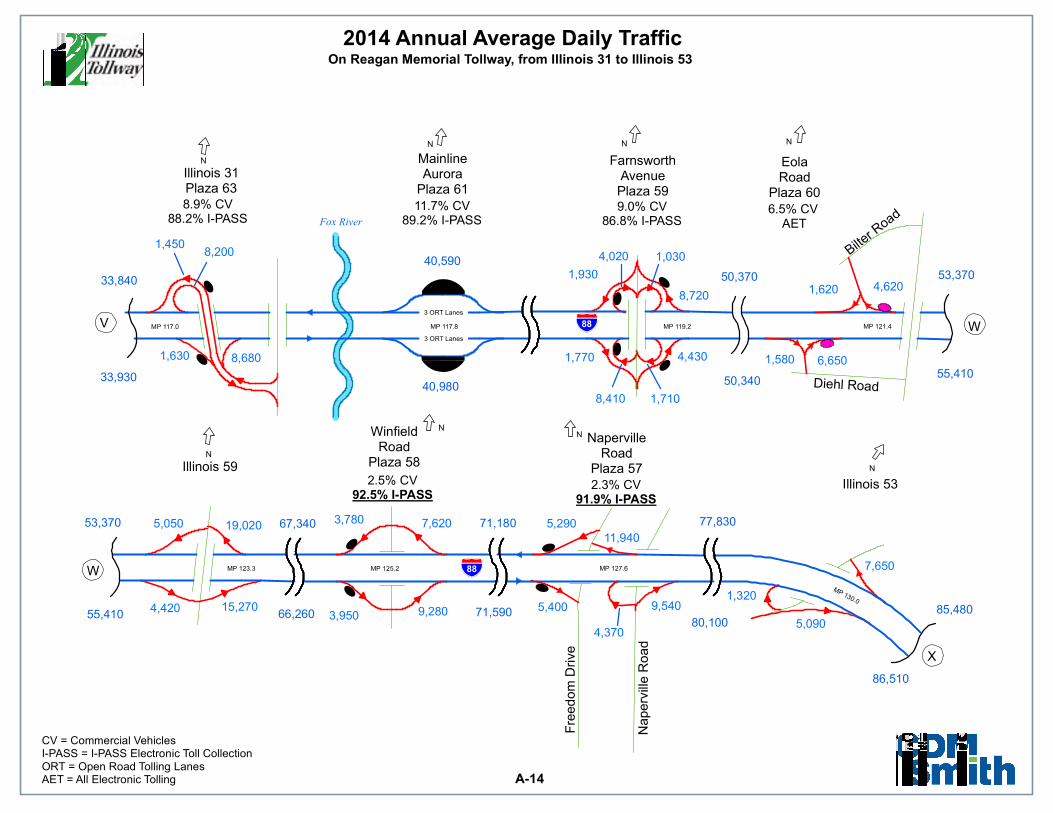
77,830
50,370
40,590
55,410
80,100
50,340
71,590
33,930
71,180
66,260
53,370
86,510
33,840
53,370
85,480
67,340
40,980
55,410
11,940
15,270
19,020
8,720
8,200 4,020
1,710 8,410
1,320
8,680
4,370
1,620
1,630
5,290
4,420
4,620
7,650
5,400
1,450
4,430
5,050
3,950 9,280
3,780 7,620
5,090
1,580 1,770 6,650
1,030
9,540
1,930
Fox River
Fre
ed
om
Dri
ve
Bilter R
oad
Naperv
ille R
oad
Diehl Road
FarnsworthAvenuePlaza 59
NapervilleRoad
Plaza 57
Illinois 53
Illinois 59
Illinois 31Plaza 63
WinfieldRoad
Plaza 58
EolaRoad
Plaza 60
MainlineAurora
Plaza 61
3 ORT Lanes
3 ORT Lanes
§̈¦88
§̈¦88
2.5% CV92.5% I-PASS
2.3% CV91.9% I-PASS
6.5% CV AET
8.9% CV88.2% I-PASS
11.7% CV89.2% I-PASS
9.0% CV86.8% I-PASS
MP 121.4
MP 127.6MP 125.2MP 123.3
MP 119.2MP 117.8MP 117.0
MP 130.0
N
NN
N
NNN
N
W
X
WV
A-14
2014 Annual Average Daily TrafficOn Reagan Memorial Tollway, from Illinois 31 to Illinois 53
CV = Commercial VehiclesI-PASS = I-PASS Electronic Toll CollectionORT = Open Road Tolling LanesAET = All Electronic Tolling

71,410
66,680
57,640
39,970
85,910
86,510
85,480
70,600
16,090
15,490
29,900
16,600
14,140
18,800
13,300
5,500
2,200
1,950
4,290
7,820
3,560
2,190
5,870
5,760
ISTHA CentralAdministration
Building
Ve
tera
ns M
em
oria
l Tollw
ay
Reagan Memorial Tollway
Ogden Avenue(U.S. 34)Plaza 81
§̈¦88
§̈¦355
§̈¦355
4.2% CV91.8% I-PASSM
P 1
9.5
MP 20.1
MP 131.3
MP 130.8
N
Y
X
AG
A-15
2014 Annual Average Daily TrafficOn Reagan Memorial Tollway, Veterans Memorial Tollway West Interchange
CV = Commercial VehiclesI-PASS = I-PASS Electronic Toll CollectionORT = Open Road Tolling LanesAET = All Electronic Tolling

73,390
58,030
52,490
82,190
85,910
42,200
38,220
44,950
57,640
39,970
80,400
66,680
8,650
14,470
15,440
12,520
21,430
8,800
6,930
3,980
7,540
Reagan Memorial Tollway
Veter
ans
Mem
oria
l Tol
lway
§̈¦355
§̈¦88
MP 2
1.7
MP 2
1.5
MP 20.8
MP 133.2
MP 132.4
N Z
Y
AH
A-16
2014 Annual Average Daily TrafficOn Reagan Memorial Tollway, Veterans Memorial Tollway East Interchange
CV = Commercial VehiclesI-PASS = I-PASS Electronic Toll CollectionORT = Open Road Tolling LanesAET = All Electronic Tolling

60,980
64,650
85,75077,680
54,460
83,640 87,760
82,06082,190
83,640
80,400
86,200
4,920 11,620
20,140 20,120
24,770
10,640
15,200
4,690
3,380
4,120
3,970 7,310 7,180
4,630
8,350
7,400
1,430
7,000 8,560
York
Roa
d
HargerRoad
Butterfield Road
HighlandAvenuePlaza 56
KingeryHighway
(Illinois 83)
MidwestRoad
Plaza 55
Cermak Road(22nd Street)
Plaza 52
SpringRoad
Plaza 53
Plaza 54
MainlineYork RoadPlaza 51
MainlineMeyers Road
Also See Page A-9
4 ORT Lanes
4 ORT Lanes§̈¦88
§̈¦294
§̈¦88
TO
6.9% CV88.2% I-PASS
80.8% ORT1.5% CV90.9% I-PASS
2.0% CV92.8% I-PASS
1.7% CV92.6% I-PASS
3.0% CV88.8% I-PASS
7.3% CV88.9% I-PASS
MP 135 MP 138.1MP 137.1MP 136.5MP 134.3
MP 138.7MP 138.9
N
NN
N
N
N
N
Z
ABAA
AA
A-17
2014 Annual Average Daily TrafficOn Reagan Memorial Tollway, from Highland Avenue to Harger Road
CV = Commercial VehiclesI-PASS = I-PASS Electronic Toll CollectionORT = Open Road Tolling LanesAET = All Electronic Tolling

67,990
65,210
53,430
66,430
60,980
64,650
49,240
69,620
70,060
92,900
31,600
24,430
19,860
16,470
27,150
25,890
19,980
33,920 22,700
2,820
1,630
4,450
6,230
3,600
13,950
1,250
Railroad R
oad
Roosevelt Road
(Illinois 38)
Reagan Mem
orial T
ollway
I.C.R
.R.
Tri-s
tate
Tol
lway
ISTHA IDOT
§̈¦290
§̈¦294
§̈¦88
MP 3
0.5
MP 140.3
N
AB
A-18
2014 Annual Average Daily TrafficOn Reagan Memorial Tollway, from Roosevelt Road to Eisenhower Expressway, I-290
CV = Commercial VehiclesI-PASS = I-PASS Electronic Toll CollectionORT = Open Road Tolling LanesAET = All Electronic Tolling
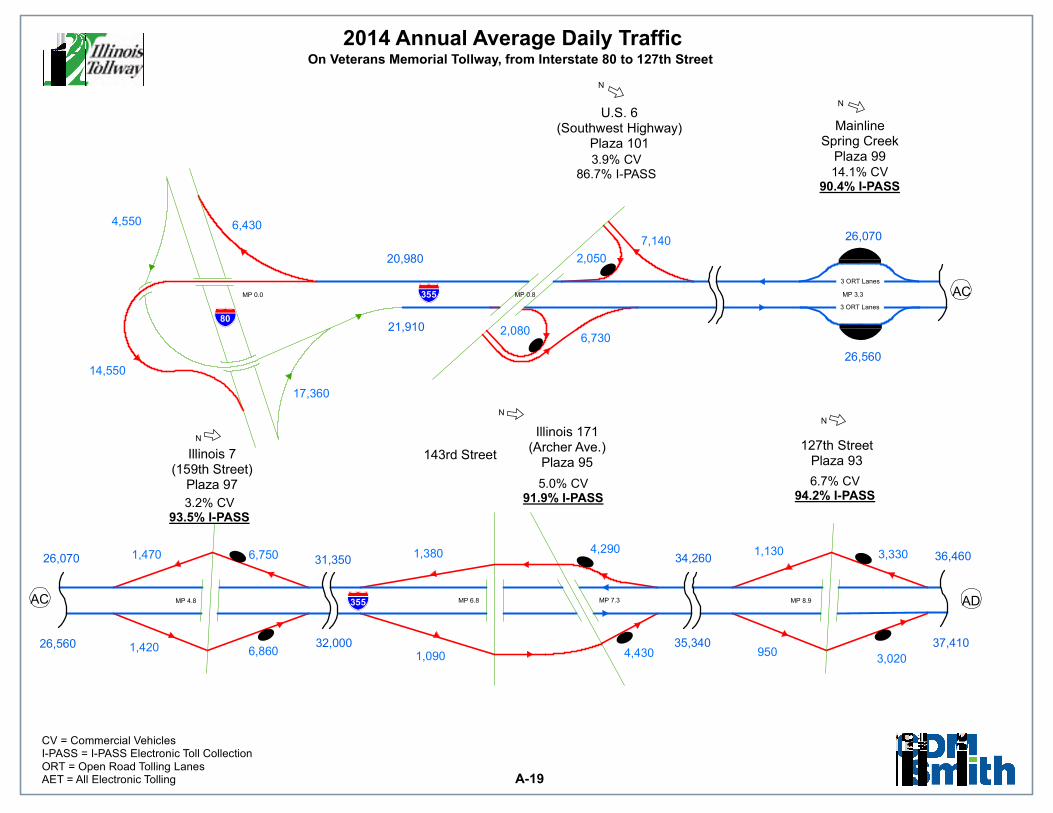
20,980
21,910
26,560
34,260
35,340
31,350
32,000
26,070
37,41026,560
36,460
26,070
17,360
14,550
4,290
6,430 4,550
6,730
3,020 6,860 4,430
7,140
3,330 1,130 1,470
1,420 1,090
6,750
2,050
2,080
1,380
950
143rd Street
Illinois 171(Archer Ave.)
Plaza 95
127th StreetPlaza 93
Illinois 7(159th Street)
Plaza 97
U.S. 6(Southwest Highway)
Plaza 101
MainlineSpring Creek
Plaza 99
3 ORT Lanes
3 ORT Lanes§̈¦355
§̈¦355
§̈¦80
3.2% CV93.5% I-PASS
14.1% CV90.4% I-PASS
6.7% CV94.2% I-PASS
5.0% CV91.9% I-PASS
3.9% CV86.7% I-PASS
MP 7.3MP 4.8 MP 6.8 MP 8.9
MP 3.3MP 0.0 MP 0.8
N
NN
N
N
ADAC
AC
A-19
2014 Annual Average Daily TrafficOn Veterans Memorial Tollway, from Interstate 80 to 127th Street
CV = Commercial VehiclesI-PASS = I-PASS Electronic Toll CollectionORT = Open Road Tolling LanesAET = All Electronic Tolling

36,460
37,41056,600
59,880
9,320
11,900
19,010
25,770
13,450
16,450
8,700
4,750
4,290
1,710
1,830
2,580 §̈¦55
§̈¦355MP 12.3
N
ADAE
A-20
2014 Annual Average Daily TrafficOn Veterans Memorial Tollway, At Interstate 55
CV = Commercial VehiclesI-PASS = I-PASS Electronic Toll CollectionORT = Open Road Tolling LanesAET = All Electronic Tolling

58,300
70,600
59,160
67,940
71,41062,610
62,070
68,69059,160
56,600
59,880
58,300
8,110
5,910
5,710
8,350
7,610
3,240
3,310 5,970
4,660
6,430
5,960 8,490
8,550 2,480
2,410
4,780
BoughtonRoad
Plaza 90
MapleAvenuePlaza 83
75thStreet
Plaza 87
63rdStreet
Plaza 85
MainlineBoughton Road
Plaza 89
3 ORT Lanes
3 ORT Lanes
10.5% CV90.2% I-PASS
80.1% ORT
3.6% CV93.6% I-PASS
2.7% CV93.1% I-PASS
2.3% CV94.0% I-PASS
3.0% CV88.4% I-PASS
MP 18.3MP 17.2MP 15.5
MP 14.4MP 13.8
NN
N
N
N
AG
AE
AF
AF
A-21
2014 Annual Average Daily TrafficOn Veterans Memorial Tollway, from Boughton Road to Maple Avenue
CV = Commercial VehiclesI-PASS = I-PASS Electronic Toll CollectionORT = Open Road Tolling LanesAET = All Electronic Tolling
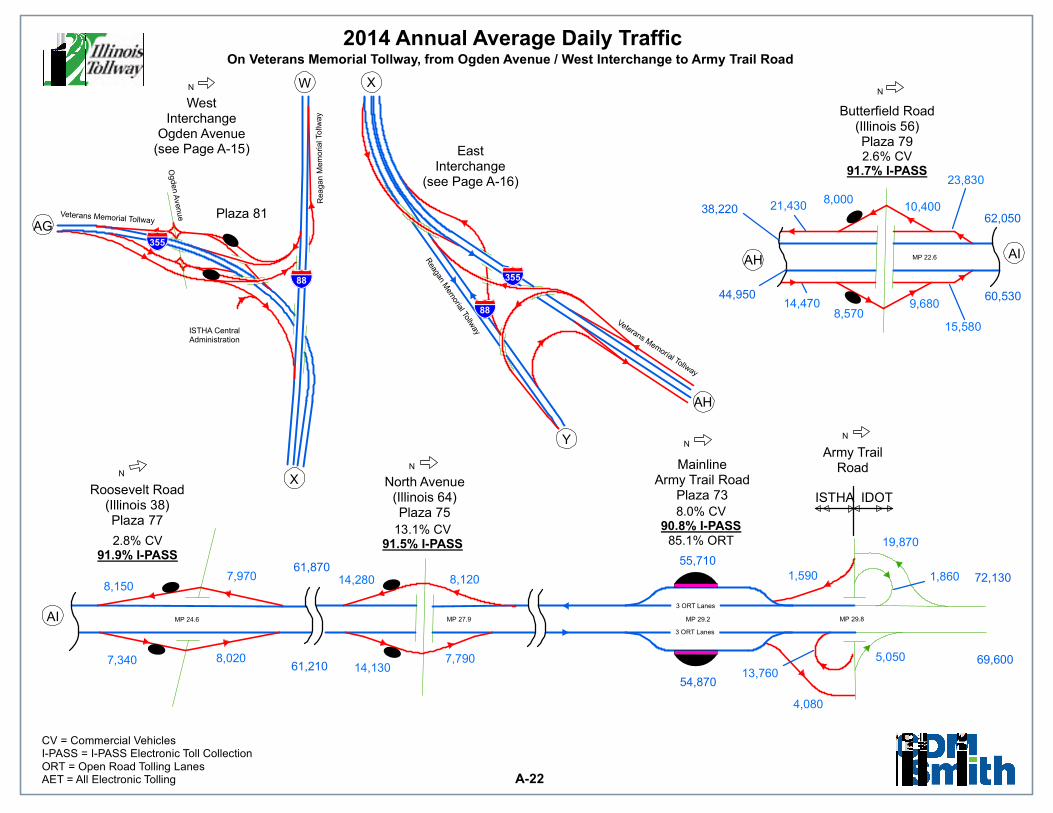
54,870
72,130
38,220
44,950
69,600
61,870
61,210
60,530
62,050
55,710
14,470
13,760
21,430 10,400
14,130
15,580
19,870
14,280 8,120 1,590
7,340
1,860 7,970 8,150
8,020 5,050
9,680
4,080
7,790
8,570
8,000
23,830
Rea
gan
Mem
oria
l To
llwa
y
Og
de
n A
venu
e
Reagan M
emorial To
llway
Veterans Memorial Tollway
Veterans Memorial Tollway
ISTHA CentralAdministration
Army TrailRoad
Plaza 81
ISTHA IDOT
Butterfield Road(Illinois 56)Plaza 79
Roosevelt Road(Illinois 38)Plaza 77
MainlineArmy Trail Road
Plaza 73North Avenue
(Illinois 64)Plaza 75
WestInterchange
Ogden Avenue(see Page A-15) East
Interchange(see Page A-16)
3 ORT Lanes
3 ORT Lanes
§̈¦355
§̈¦355§̈¦88
§̈¦88
8.0% CV90.8% I-PASS
85.1% ORT2.8% CV91.9% I-PASS
13.1% CV91.5% I-PASS
2.6% CV91.7% I-PASS
MP 29.8MP 29.2MP 27.9MP 24.6
MP 22.6
N
NN
NN
N
Y
X
XW
AI
AH
AIAH
AG
A-22
2014 Annual Average Daily TrafficOn Veterans Memorial Tollway, from Ogden Avenue / West Interchange to Army Trail Road
CV = Commercial VehiclesI-PASS = I-PASS Electronic Toll CollectionORT = Open Road Tolling LanesAET = All Electronic Tolling

Section 2
Appendix B
AM
/PM Peak H
our Traffic
2013 Systemwide A.M. and P.M. Peak
Hour Traffic Schematics
Appendix B


100(115)
205(245)
95(125)
330(350)
225(200)
425(325)
160(315)
365(190)
135(195)
420(225)
260(420)110
(335)
155(350)
355(215)
405(140)
210(240)
215(350)
120(490)
310(305)
305(395)
10(20)
40(35)
55(75)
70(85)
15(20)
1,335(1,255)
965(1,595)
125(115)
1,860(2,005)
1,955(2,070)
1,465(2,325)
1,470(2,435)
1,565(1,900)
1,490(1,815)
1,305(1,990)
1,345(2,210)
1,240(1,210)
1,245(1,935)
2,060(2,130)
960(1,185)
820(1,145)
900(1,600)
805(1,125)
950(1,165)
MainlineMarengoPlaza 7
BelvidereOasis
I-39/U.S. 20Cherry Valley
Rockton Rd.
Irene Road GenoaRoad
Illinois 173Plaza 4
East Riverside Blvd.Plaza 2IDOT ISTHA
U.S. Bus. 20Rockford
MainlineBelviderePlaza 5
MainlineSouth Beloit
Plaza 1
3 ORT Lanes
3 ORT Lanes
3 ORT Lanes
3 ORT Lanes
§̈¦39
§̈¦90
§̈¦90MP 8.9MP 3.5MP 2.7
MP 20.8
MP 12.3
MP 37.8MP 25.0MP 24.2MP 23.3MP 17.4
MP 15.8TO
WISCONSIN
N
N
NN
N
NNN
NN
N
BA
A
B-1
2014 A.M. & P.M. Peak Hour TrafficOn Jane Addams Memorial Tollway, from Rockton Road to Marengo (Plaza 7)
*,*** = A.M. Peak(*,***) = P.M. Peak
Note:The 2014 AM & PM peak-hour volumes aredefined as the 85th Percentile volumes occurringin the 6:00 to 8:00 AM and the 4:00 to 6:00 PMperiods respectively. Peak-hour volumes arecalculated from Monday through Thursday hourlytraffic volume data only, and exclude holidays.
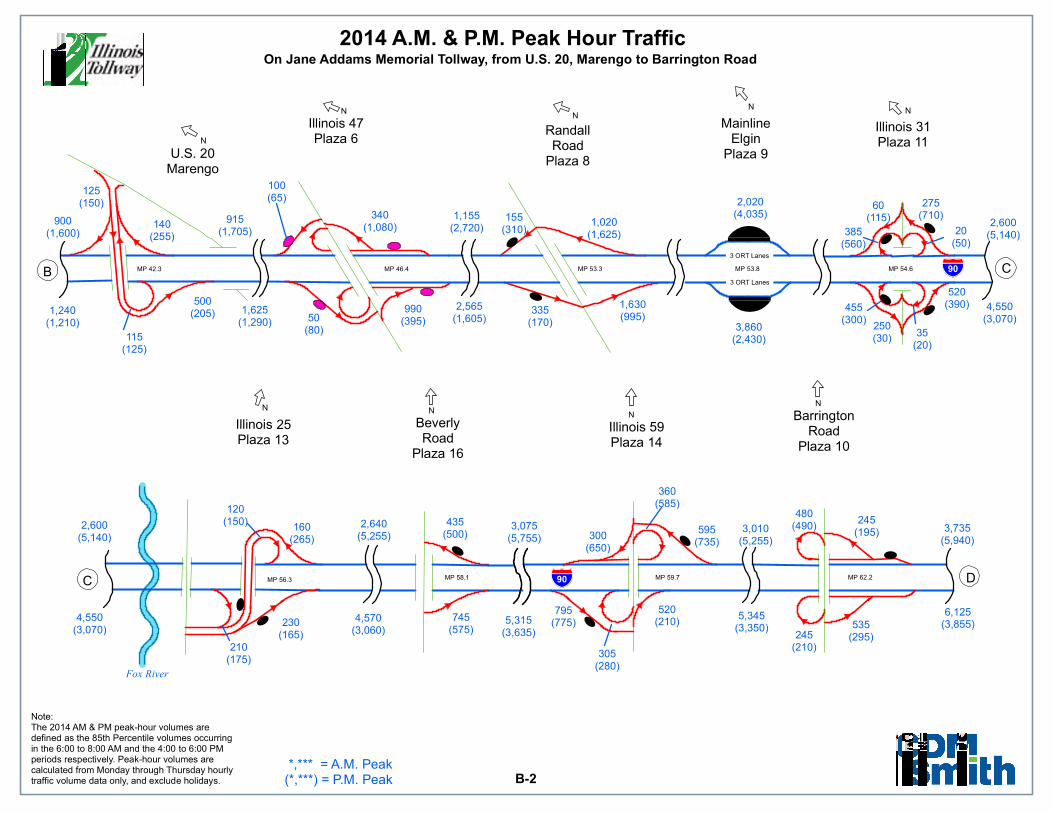
Fox River
100(65)
50(80)
435(500)
1,630(995)
480(490)
230(165)
500(205)
300(650)
210(175)
140(255)
125(150)
305(280)
360(585)
385(560)
520(390)
245(210)
520(210)
455(300)
155(310)
990(395)
595(735)
795(775) 535
(295)
245(195)
160(265)
745(575)
115(125)
120(150)
275(710)
335(170)
20(50)
35(20)
250(30)
1,020(1,625)
340(1,080)
60(115)
4,550(3,070)
1,625(1,290)
2,600(5,140)
5,345(3,350)
3,010(5,255)
4,570(3,060)
2,640(5,255)
3,075(5,755)
3,860(2,430)
2,565(1,605)
2,020(4,035)
1,240(1,210)
5,315(3,635)
1,155(2,720)
3,735(5,940)
2,600(5,140)
6,125(3,855)
4,550(3,070)
900(1,600)
915(1,705)
BarringtonRoad
Plaza 10
RandallRoad
Plaza 8
Illinois 31Plaza 11
Illinois 25Plaza 13
Illinois 59Plaza 14
U.S. 20Marengo
BeverlyRoad
Plaza 16
Illinois 47Plaza 6
MainlineElgin
Plaza 9
3 ORT Lanes
3 ORT Lanes
§̈¦90
§̈¦90
MP 62.2MP 59.7MP 58.1MP 56.3
MP 54.6MP 53.8MP 53.3MP 46.4MP 42.3
NN
NN
NN
NN
N
C
CB
D
B-2
2014 A.M. & P.M. Peak Hour TrafficOn Jane Addams Memorial Tollway, from U.S. 20, Marengo to Barrington Road
*,*** = A.M. Peak(*,***) = P.M. Peak
Note:The 2014 AM & PM peak-hour volumes aredefined as the 85th Percentile volumes occurringin the 6:00 to 8:00 AM and the 4:00 to 6:00 PMperiods respectively. Peak-hour volumes arecalculated from Monday through Thursday hourlytraffic volume data only, and exclude holidays.

750(960)
190(745)
1,005(690)
145(110)
115(105)
300(675)
280(625)
540(175) 570
(405)
120(290)
315(445)
365(315)
680(475)
590(650)
950(750)
430(530)
430(355)
810(785)
520(795)
1,115(905)
1,355(680)
1,385(760)
1,935(1,490)
845(1,080)
1,015(1,165)
4,485(6,900)
4,710(3,990)
5,895(6,060)
6,125(3,855)
5,690(5,425)
5,615(5,435)
4,355(5,125)
3,735(5,940)
7,240(4,760)
5,515(3,850)
4,115(5,915)
5,465(5,705)
5,690(5,425)5,390
(4,750)
ElmhurstRoad
LeeStreet
ArlingtonHeightsRoad
Plaza 18
Des PlainesOasis
DevonAvenue
RoselleRoad
Plaza 12
Illinois 53/I-290Plaza 15
MainlineDevon Avenue
Plaza 17
4 ORT Lanes
§̈¦90
§̈¦290
§̈¦90 MP 77.3MP 77.1MP 76.1MP 74.4
MP 73.5MP 70.7MP 68.2MP 65.5
N
N
NN
N
N
N
N
E
ED
F
B-3
2014 A.M. & P.M. Peak Hour TrafficOn Jane Addams Memorial Tollway, from Roselle Road to Devon Avenue
*,*** = A.M. Peak(*,***) = P.M. Peak
Note:The 2014 AM & PM peak-hour volumes aredefined as the 85th Percentile volumes occurringin the 6:00 to 8:00 AM and the 4:00 to 6:00 PMperiods respectively. Peak-hour volumes arecalculated from Monday through Thursday hourlytraffic volume data only, and exclude holidays.

990(840)
485(705)
405(435)
950(940)
845(665)
1,100(960)
1,000(705)
1,025(795)
785(600)
890(645)
585(405)
545(840)
370(780)
1,950(1,645)
1,260(1,425)
1,295(1,080)
1,800(1,895)
2,140(2,000)
2,550(2,135)
1,220(1,265)
2,620(2,105)
1,630(1,265)
2,100(1,665)
1,130(1,245)
1,655(1,295)
1,255(1,055)
4,090(4,095)
3,650(3,760)
5,555(5,585)
5,795(4,920)
6,165(5,700)
8,410(7,760)
8,415(7,025)
5,690(5,425)
5,615(5,435)
7,695(7,585)
7,505(7,500)
Des P
lain
es
Kennedy
Exp
wy.
Rive
r
Tri-S
tate
Tollw
ay
Road
O'HareWest
Plaza 31
IDOT
ISTHA
O'HareEast
Plaza 32
MainlineRiver RoadPlaza 19
3 ORT Lanes
§̈¦90
§̈¦190 §̈¦294
§̈¦294
§̈¦90 MP 77.8
MP
40.2
MP
40.9
MP 78.8
MP 78.5
N
N
L
K
F
B-4
2014 A.M. & P.M. Peak Hour TrafficOn Jane Addams Memorial Tollway, from Tri-State Tollway to Kennedy Expressway
*,*** = A.M. Peak(*,***) = P.M. Peak
Note:The 2014 AM & PM peak-hour volumes aredefined as the 85th Percentile volumes occurringin the 6:00 to 8:00 AM and the 4:00 to 6:00 PMperiods respectively. Peak-hour volumes arecalculated from Monday through Thursday hourlytraffic volume data only, and exclude holidays.
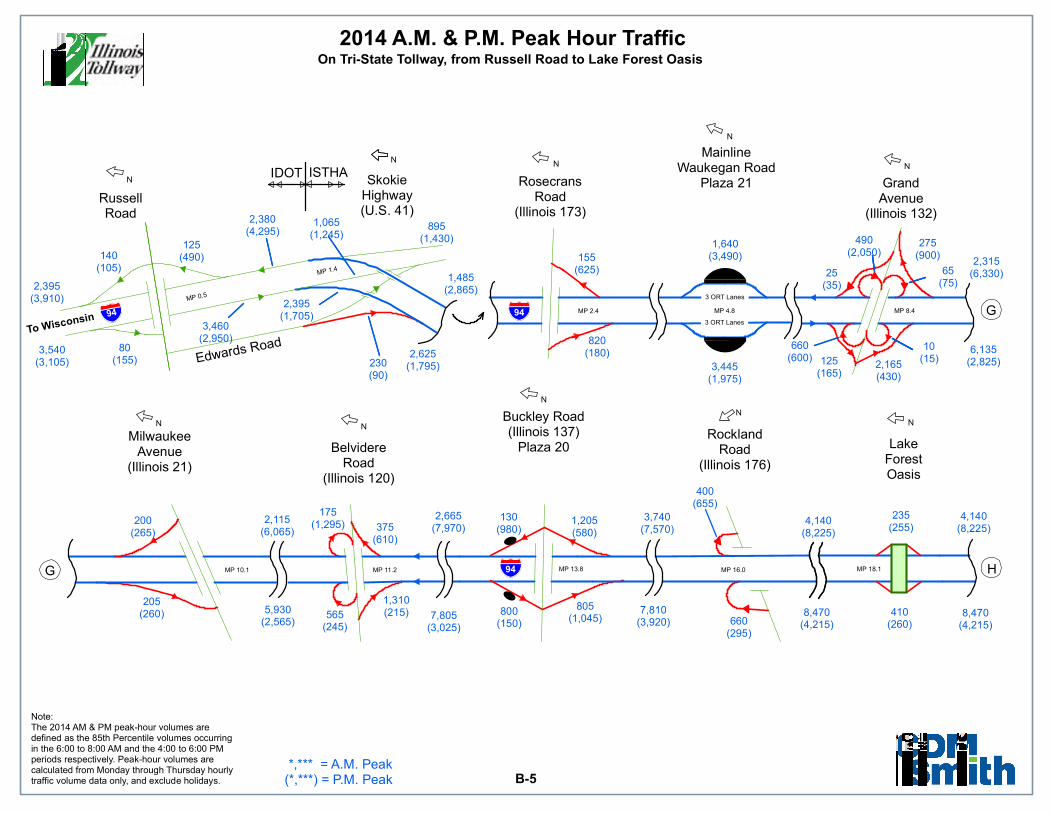
230(90)
65(75)
2,165(430)
130(980)
80(155)
235(255)
820(180)
140(105)
205(260)
275(900)
565(245)
660(600)
660(295)
410(260)
125(490)
125(165)
200(265)
800(150)
375(610)
155(625)
400(655)
1,205(580)
1,310(215)
10(15)
25(35)
895(1,430) 490
(2,050)
805(1,045)
175(1,295)
1,065(1,245)
1,485(2,865)
2,395(1,705)
3,460(2,950)
5,930(2,565)
2,380(4,295)
4,140(8,225)
8,470(4,215)
2,115(6,065)
6,135(2,825)
2,625(1,795)
7,810(3,920)
3,740(7,570)
2,665(7,970)
3,445(1,975)
2,315(6,330)
7,805(3,025)
8,470(4,215)
3,540(3,105)
2,395(3,910)
1,640(3,490)
4,140(8,225)
Edwards Road
LakeForestOasis
RussellRoad
Buckley Road(Illinois 137)
Plaza 20BelvidereRoad
(Illinois 120)
RocklandRoad
(Illinois 176)
GrandAvenue
(Illinois 132)
RosecransRoad
(Illinois 173)
SkokieHighway(U.S. 41)
IDOT ISTHA
MainlineWaukegan Road
Plaza 21
MilwaukeeAvenue
(Illinois 21)
3 ORT Lanes
3 ORT Lanes§̈¦94 §̈¦94
§̈¦94
To WisconsinMP 8.4MP 4.8MP 2.4
MP 18.1MP 16.0MP 13.8MP 11.2MP 10.1
MP 0.5
MP 1.4
N
N
N
NN
N
N
NN
N
G
HG
B-5
2014 A.M. & P.M. Peak Hour TrafficOn Tri-State Tollway, from Russell Road to Lake Forest Oasis
*,*** = A.M. Peak(*,***) = P.M. Peak
Note:The 2014 AM & PM peak-hour volumes aredefined as the 85th Percentile volumes occurringin the 6:00 to 8:00 AM and the 4:00 to 6:00 PMperiods respectively. Peak-hour volumes arecalculated from Monday through Thursday hourlytraffic volume data only, and exclude holidays.
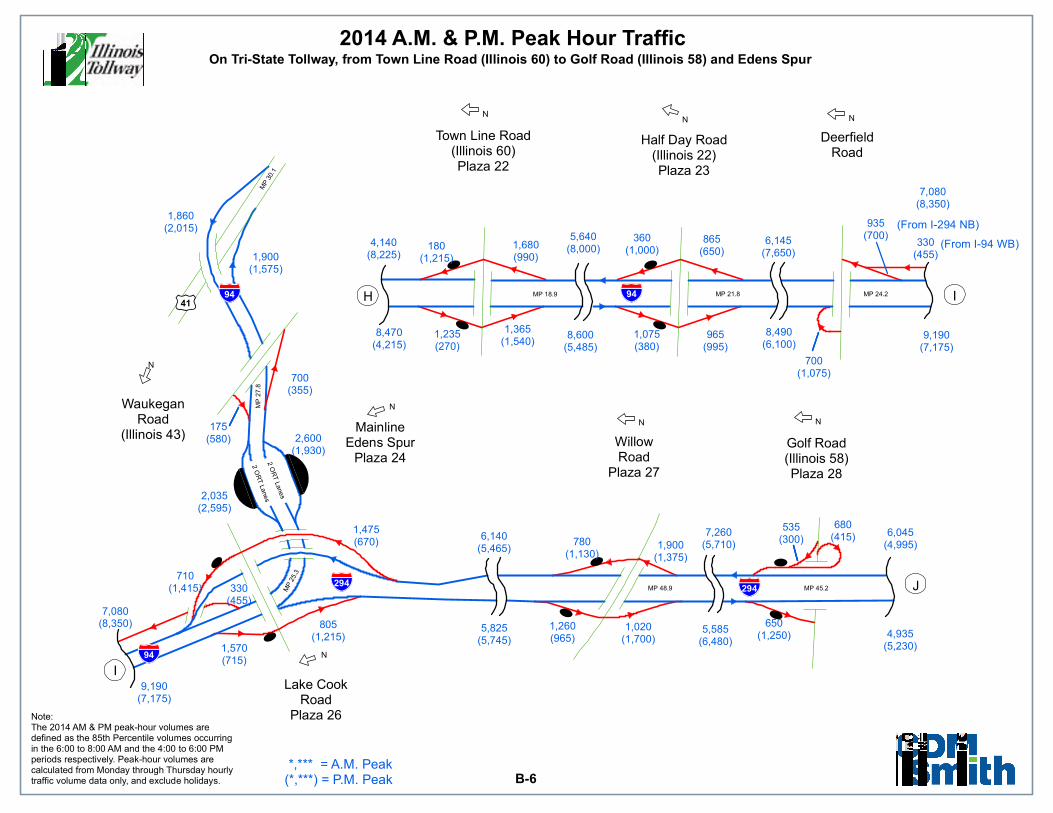
(From I-94 WB)
(From I-294 NB)
1,680(990)
935(700)
535(300)
865(650)
175(580)
330(455)
680(415)
965(995)
700(355)
1,475(670)
1,235(270)
1,260(965)
1,570(715)
1,075(380)
330(455)
1,900(1,375)
1,365(1,540)
1,020(1,700)
700(1,075)
710(1,415)
805(1,215)
780(1,130)
650(1,250)
360(1,000)180
(1,215)
6,140(5,465)
1,860(2,015)
5,825(5,745)
1,900(1,575)
9,190(7,175)
6,145(7,650)
7,260(5,710)
5,640(8,000)
2,600(1,930)
4,140(8,225)
4,935(5,230)
8,490(6,100)
8,600(5,485)
5,585(6,480)
7,080(8,350)
7,080(8,350)
9,190(7,175)
6,045(4,995)
2,035(2,595)
8,470(4,215)
DeerfieldRoad
WaukeganRoad
(Illinois 43)Golf Road(Illinois 58)Plaza 28
Half Day Road(Illinois 22)Plaza 23
Town Line Road(Illinois 60)Plaza 22
Lake CookRoad
Plaza 26
WillowRoad
Plaza 27
MainlineEdens Spur
Plaza 24
2 O
RT
Lanes
2 O
RT
Lanes
§̈¦294
§̈¦94
§̈¦294
§̈¦94 §̈¦94
£¤41
MP 45.2MP 48.9
MP 24.2MP 21.8MP 18.9
MP
25.3
MP
27
.8M
P 3
0.1
N
N
NN
N
NNN
I
I
J
H
B-6
2014 A.M. & P.M. Peak Hour TrafficOn Tri-State Tollway, from Town Line Road (Illinois 60) to Golf Road (Illinois 58) and Edens Spur
*,*** = A.M. Peak(*,***) = P.M. Peak
Note:The 2014 AM & PM peak-hour volumes aredefined as the 85th Percentile volumes occurringin the 6:00 to 8:00 AM and the 4:00 to 6:00 PMperiods respectively. Peak-hour volumes arecalculated from Monday through Thursday hourlytraffic volume data only, and exclude holidays.

725(930)
965(930)
820(500)
535(350)
640(540)
745(950)
585(455)
540(535)
255(285)
230(265)
145(160)
380(345)
455(465)
375(550)
465(715)
1,100(1,105)
9,140(7,955)
8,415(7,025)
7,170(7,485)
7,695(7,585)
7,890(7,050)
6,045(4,995)
7,505(7,500)
7,780(6,920)
6,540(6,700)
8,160(8,300)
8,410(7,760)
7,780(6,920)
7,170(7,485)
4,935(5,230)
O'HareInterchange
(see Page B-4)
O'HareInterchange
(see Page B-4)
Des Plaines
River Road
Rand Road
BalmoralAvenuePlaza 30 Irving Park
Road(Illinois 19)
TouhyAvenue
O'HareOasis
DempsterStreet
(U.S. 14)
MainlineIrving ParkPlaza 33
MainlineTouhy Avenue
Plaza 29
4 ORT Lanes
4 ORT Lanes§̈¦294
§̈¦294
MP 37.8MP 38.3MP 38.9MP 39.8
MP 41.6MP 42.1MP 44.2
N
N
NN
N
NN
L M
KJ
B-7
2014 A.M. & P.M. Peak Hour TrafficOn Tri-State Tollway, from Dempster Street to O’Hare Oasis
*,*** = A.M. Peak(*,***) = P.M. Peak
Note:The 2014 AM & PM peak-hour volumes aredefined as the 85th Percentile volumes occurringin the 6:00 to 8:00 AM and the 4:00 to 6:00 PMperiods respectively. Peak-hour volumes arecalculated from Monday through Thursday hourlytraffic volume data only, and exclude holidays.

520(0)
520(0)
870(925)
495(505)
430(295)
355(435)
380(400)
600(505)
1,460(1,580)
1,665(1,505)
1,820(1,840)2,735
(2,370)
1,310(1,070)
1,870(1,735)
3,005(3,355)
1,440(1,440)
925(1,020)
4,615(4,715)
6,255(5,395)
6,300(6,560)
7,265(7,635)
6,855(5,900) 5,340
(4,865)
7,780(6,920)
7,170(7,485)
Also See Page B-18
Lake Street(U.S. 20)
North Avenue
(Illinois 64)
§̈¦294
§̈¦290
§̈¦88
§̈¦88
§̈¦290
MP 31.1MP 31.8MP 33.8
N
NM
B-8
2014 A.M. & P.M. Peak Hour TrafficOn Tri-State Tollway, from North Avenue / Lake Street to Reagan Memorial Tollway I-88
*,*** = A.M. Peak(*,***) = P.M. Peak
Note:The 2014 AM & PM peak-hour volumes aredefined as the 85th Percentile volumes occurringin the 6:00 to 8:00 AM and the 4:00 to 6:00 PMperiods respectively. Peak-hour volumes arecalculated from Monday through Thursday hourlytraffic volume data only, and exclude holidays.
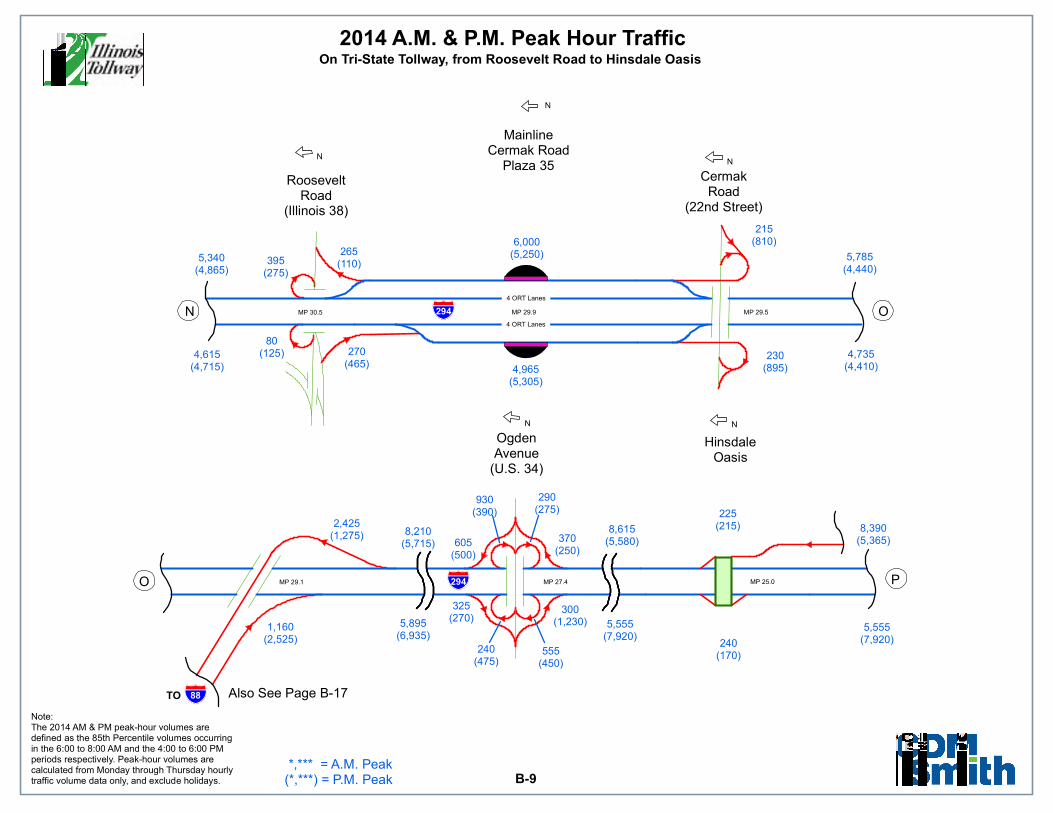
265(110)
240(170)
270(465)
930(390)
555(450)
395(275)
240(475)
370(250)
215(810)
225(215)
290(275)
325(270)
605(500)
230(895)
1,160(2,525)
2,425(1,275)
300(1,230)
80(125)
8,390(5,365)
4,735(4,410)
5,785(4,440)
4,965(5,305)
8,210(5,715)
8,615(5,580)
5,555(7,920)
5,340(4,865)
4,615(4,715)
5,895(6,935)
5,555(7,920)
6,000(5,250)
Also See Page B-17
HinsdaleOasis
RooseveltRoad
(Illinois 38)
OgdenAvenue
(U.S. 34)
MainlineCermak Road
Plaza 35Cermak
Road(22nd Street)
4 ORT Lanes
4 ORT Lanes
§̈¦294
§̈¦88
§̈¦294
TO
MP 25.0MP 27.4MP 29.1
MP 29.5MP 29.9MP 30.5
N N
N
N
N
PO
ON
B-9
2014 A.M. & P.M. Peak Hour TrafficOn Tri-State Tollway, from Roosevelt Road to Hinsdale Oasis
*,*** = A.M. Peak(*,***) = P.M. Peak
Note:The 2014 AM & PM peak-hour volumes aredefined as the 85th Percentile volumes occurringin the 6:00 to 8:00 AM and the 4:00 to 6:00 PMperiods respectively. Peak-hour volumes arecalculated from Monday through Thursday hourlytraffic volume data only, and exclude holidays.

600(880)
365(375)
660(380)
705(920)
1,095(715)
1,055(925)
710(790)
175(175)
205(255)
180(315)
625(610)
530(475)
200(195)
565(545)
320(245)
215(240)
60(65)
2,515(2,015)
2,690(2,190)
2,490(1,995)
1,965(2,180)
115(270)
4,240(6,290)
8,390(5,365)
7,325(5,075)
5,555(7,920)
3,590(5,740)
5,900(3,370)
6,075(3,545)
7,430(5,080)
4,215(6,350)
Jolie
t Road
JolietRoad
Plaza 37
Tri-State Tollway
Wolf R
oad
Willow SpringsRoad
(75th Street)Plaza 34
§̈¦294
§̈¦55 §̈¦294
§̈¦55
MP 22.0
MP 22.5
MP 23.8
N
N
Q
P
B-10
2014 A.M. & P.M. Peak Hour TrafficOn Tri-State Tollway, from Joliet Road (Plaza 37) to Willow Springs Road (Plaza 34)
*,*** = A.M. Peak(*,***) = P.M. Peak
Note:The 2014 AM & PM peak-hour volumes aredefined as the 85th Percentile volumes occurringin the 6:00 to 8:00 AM and the 4:00 to 6:00 PMperiods respectively. Peak-hour volumes arecalculated from Monday through Thursday hourlytraffic volume data only, and exclude holidays.

0(0)
0(0)
0(0)
0(0)
45(25)
1,085(635)
310(635)
640(905)
400(365)
480(310)
465(590)
455(230)
460(265)
155(290)
725(630)
1,840(1,280)
1,305(1,655)
610(1,050)
85(225)
285(560)
7,325(5,075)
5,090(3,970)
3,380(4,965)
5,090(3,970)
4,240(6,290)
3,380(4,965)
3,660(5,745)
5,750(4,160)
4,655(7,100)
7,325(5,075)
AM Peak: 80*PM Peak: 180*
AM Peak: 525*PM Peak: 910*
AM Peak: 165*PM Peak: 125*
AM Peak: 915*PM Peak: 575*
*Plaza 42 was openedin October 2014.
127thStreet
Tri-State To
llway
CiceroAvenue
(Illinois 50)
79th Stre
et
ArcherAvenue
(Illinois 171)
La GrangeRoad
(U.S. 12, 20 & 45)
Mainline83rd Street
Plaza 39 NB
Mainline82nd StreetPlaza 36 SB
Tri-State Tollway
95thStreet
(U.S. 12/20)Plaza 38
147th Street(Illinois 83)Plaza 42
4 ORT Lanes
4 ORT Lanes
§̈¦294
§̈¦294
§̈¦294
§̈¦57
§̈¦57
MP 8.0MP 12.0
MP 17.5MP 19.7MP 20.3
N N
N
N
N
N
SR
R
Q
B-11
2014 A.M. & P.M. Peak Hour TrafficOn Tri-State Tollway, from Archer / Lagrange / 79th Street to 147th Street (Plaza 42) / I-57
*,*** = A.M. Peak(*,***) = P.M. Peak
Note:The 2014 AM & PM peak-hour volumes aredefined as the 85th Percentile volumes occurringin the 6:00 to 8:00 AM and the 4:00 to 6:00 PMperiods respectively. Peak-hour volumes arecalculated from Monday through Thursday hourlytraffic volume data only, and exclude holidays.
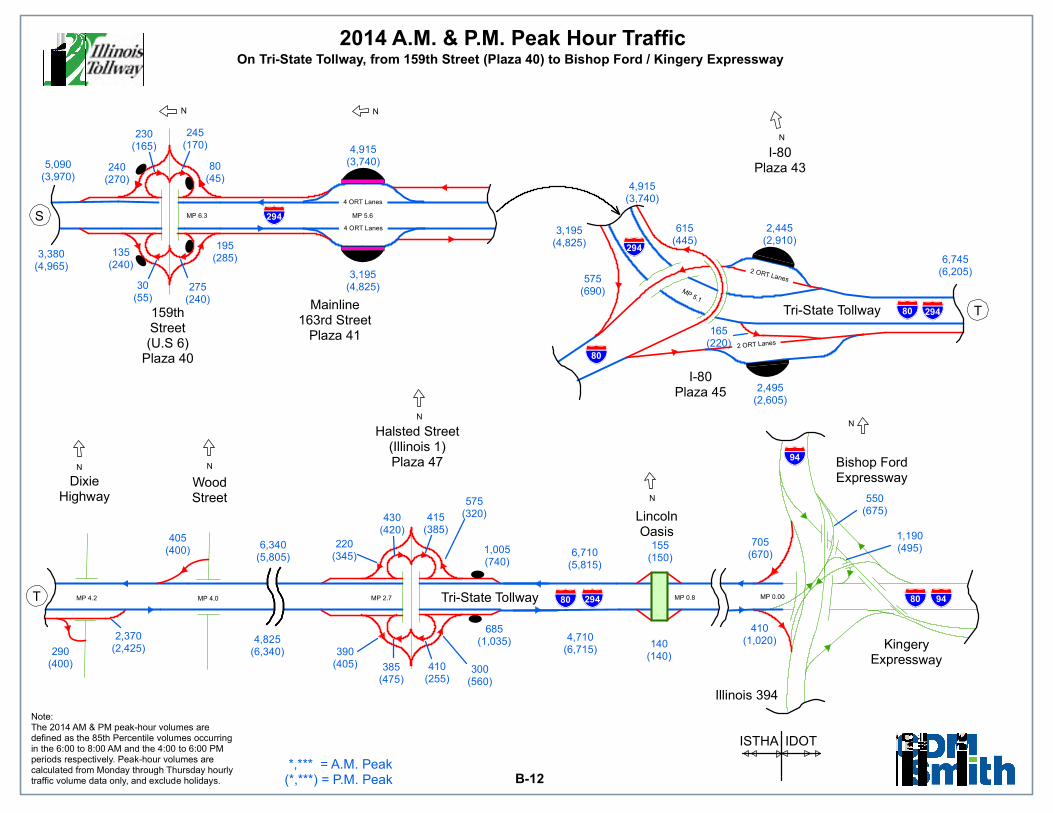
685(1,035)
1,005(740)
140(140)
430(420)
220(345)
390(405)
165(220)
135(240)
230(165)
615(445)
575(690)
705(670)
275(240)
245(170)
415(385)
575(320)
550(675)
290(400)
155(150)
405(400)
240(270)
195(285)
1,190(495)
80(45)
30(55)
300(560)
385(475)
410(255)
2,370(2,425)
2,445(2,910)
2,495(2,605)
410(1,020)
6,745(6,205)
3,380(4,965)
5,090(3,970)
4,915(3,740)
4,915(3,740)
6,710(5,815)
6,340(5,805)
4,825(6,340)
3,195(4,825)
4,710(6,715)
3,195(4,825)
WoodStreet
Halsted Street(Illinois 1)Plaza 47
KingeryExpressway
LincolnOasis
Tri-State Tollway
Tri-State Tollway
Illinois 394
Bishop FordExpresswayDixie
Highway
I-80Plaza 45
I-80Plaza 43
ISTHA IDOT
159thStreet(U.S 6)
Plaza 40
Mainline163rd Street
Plaza 41
4 ORT Lanes
2 ORT Lanes
4 ORT Lanes
2 ORT Lanes
§̈¦294
§̈¦80 §̈¦94§̈¦80
§̈¦94
§̈¦80
§̈¦80
§̈¦294
§̈¦294
§̈¦294
MP 0.8MP 2.7MP 4.0MP 4.2
MP 5.6MP 6.3
MP 0.00
MP 5.1
N
N
N
N
N
N
N N
S
T
T
B-12
2014 A.M. & P.M. Peak Hour TrafficOn Tri-State Tollway, from 159th Street (Plaza 40) to Bishop Ford / Kingery Expressway
*,*** = A.M. Peak(*,***) = P.M. Peak
Note:The 2014 AM & PM peak-hour volumes aredefined as the 85th Percentile volumes occurringin the 6:00 to 8:00 AM and the 4:00 to 6:00 PMperiods respectively. Peak-hour volumes arecalculated from Monday through Thursday hourlytraffic volume data only, and exclude holidays.

65(80)
65(80)
70(85)
30(55)
40(30)
70(85)
2,000(950)
130(100)
205(180)245
(250)
125(120)
175(255)
130(125)
210(215)
280(305)
155(220)
180(130)
330(530)
490(360)
310(370)
155(185)
80(135)
1,625(630)
30(40)
40(55)
25(30)
55(20)
45(50)
80(80)
50(80)
30(25)70
(55)
685(1,945)
555(1,580)
85(105)
150(165)
175(165)
140(145)
850(970)
530(605)
680(810)
535(865)
320(570)
405(695)320
(545)
425(500) 380
(515)
2,455(1,730)
830(1,100)
940(1,210)
4,250(2,500)
2,025(4,515)
1,075(1,350)
1,095(1,395)
1,495(2,790)
665(1,070)
Illinois 56
Illinois 26
Illinois 47
OrchardRoad
Plaza 64
Illinois 251
Annie Glidden RoadPlaza 67 Peace Road
Plaza 65De KalbOasis
U.S. 30 I-39(U.S. 51)
IDOT ISTHA
MainlineDe KalbPlaza 66
MainlineDixon
Plaza 69
2 ORT Lanes 2 ORT Lanes
2 ORT Lanes 2 ORT Lanes
§̈¦88
§̈¦88 MP 86.2MP 56.5 MP 78.6MP 76.1MP 54.4
MP 94.0MP 93.3MP 91.4 MP 114.4MP 113.3MP 109.3
MP 44.2
N
N
N N
NN
N
N
N
N
N
N
VU
U
B-13
2014 A.M. & P.M. Peak Hour TrafficOn Reagan Memorial Tollway, from Illinois 26 to Orchard Road
*,*** = A.M. Peak(*,***) = P.M. Peak
Note:The 2014 AM & PM peak-hour volumes aredefined as the 85th Percentile volumes occurringin the 6:00 to 8:00 AM and the 4:00 to 6:00 PMperiods respectively. Peak-hour volumes arecalculated from Monday through Thursday hourlytraffic volume data only, and exclude holidays.

Fox River
135(95)
290(545)
75(145)
90(285)
920(930)
110(250)
555(775)
415(655)
260(490)
195(125)
695(685)
710(455)
185(805)
270(120)
350(845)
455(280)
305(175)
810(885)
815(510)
100(175)
570(315)
355(575)
610(345)
250(665)
490(590)
225(135)
1,050(530)
1,060(890) 1,610
(1,170)
1,430(1,330)
1,390(1,585)
965(1,315)
6,275(7,685)
2,970(5,865)
2,340(4,995)
6,280(3,930)
7,900(7,175)
5,455(3,535)
7,610(5,950)
4,250(2,500)
5,015(7,360)
7,255(4,980)
3,170(6,125)
8,525(7,860)
2,025(4,515)
3,170(6,125)
7,085(8,570)
4,205(7,135)
4,690(2,835)
6,280(3,930)
Fre
ed
om
Dri
ve
Bilter R
oad
Naperv
ille R
oad
Diehl Road
FarnsworthAvenuePlaza 59
NapervilleRoad
Plaza 57
Illinois 53
Illinois 59
Illinois 31Plaza 63
WinfieldRoad
Plaza 58
EolaRoad
Plaza 60
MainlineAurora
Plaza 61
3 ORT Lanes
3 ORT Lanes
§̈¦88
§̈¦88 MP 121.4
MP 127.6MP 125.2MP 123.3
MP 119.2MP 117.8MP 117.0
MP 130.0
N
NN
N
NNN
N
W
X
WV
B-14
2014 A.M. & P.M. Peak Hour TrafficOn Reagan Memorial Tollway, from Illinois 31 to Illinois 53
*,*** = A.M. Peak(*,***) = P.M. Peak
Note:The 2014 AM & PM peak-hour volumes aredefined as the 85th Percentile volumes occurringin the 6:00 to 8:00 AM and the 4:00 to 6:00 PMperiods respectively. Peak-hour volumes arecalculated from Monday through Thursday hourlytraffic volume data only, and exclude holidays.
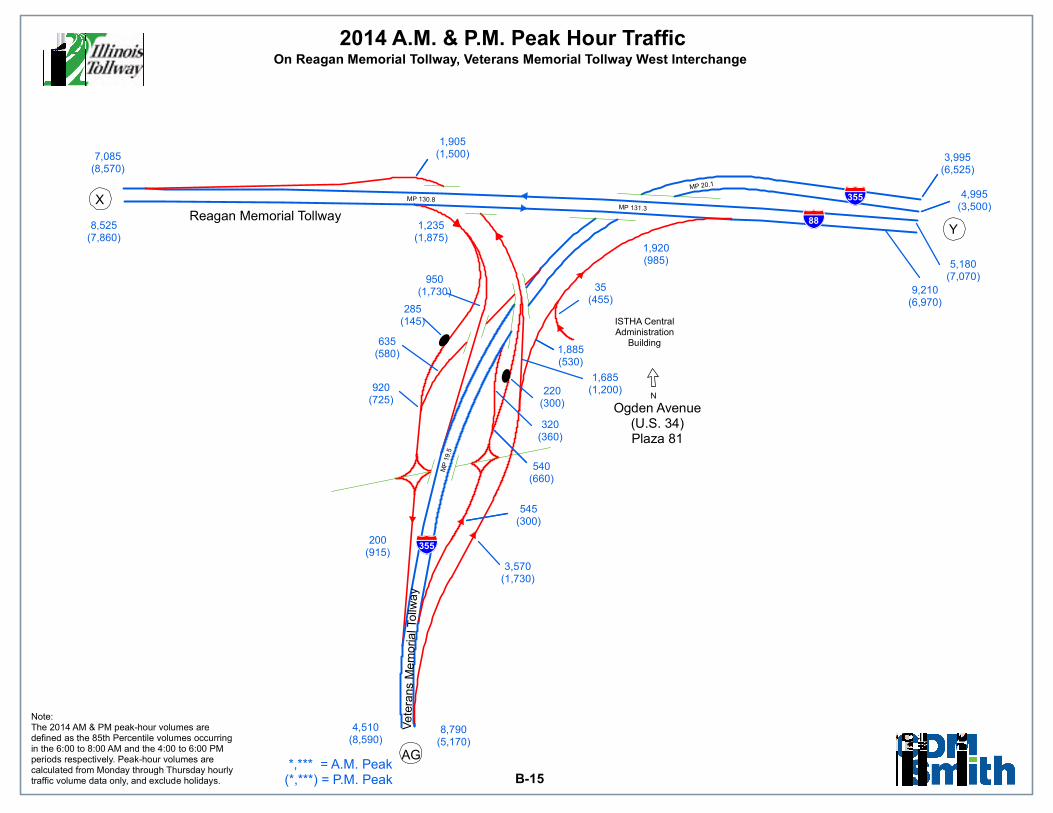
1,920(985)
1,885(530)
35(455)
545(300)
285(145)
540(660)
635(580)
320(360)
200(915)
220(300)
920(725)
1,235(1,875)
1,685(1,200)
1,905(1,500)
950(1,730)
3,570(1,730)
4,510(8,590)
5,180(7,070)
3,995(6,525)
4,995(3,500)
9,210(6,970)
8,525(7,860)
7,085(8,570)
8,790(5,170)
ISTHA CentralAdministration
Building
Ve
tera
ns M
em
oria
l Tollw
ay
Reagan Memorial Tollway
Ogden Avenue(U.S. 34)Plaza 81
§̈¦88
§̈¦355
§̈¦355
MP
19.5
MP 20.1
MP 131.3
MP 130.8
N
Y
X
AG
B-15
2014 A.M. & P.M. Peak Hour TrafficOn Reagan Memorial Tollway, Veterans Memorial Tollway West Interchange
*,*** = A.M. Peak(*,***) = P.M. Peak
Note:The 2014 AM & PM peak-hour volumes aredefined as the 85th Percentile volumes occurringin the 6:00 to 8:00 AM and the 4:00 to 6:00 PMperiods respectively. Peak-hour volumes arecalculated from Monday through Thursday hourlytraffic volume data only, and exclude holidays.

825(880)
110(520)
420(680)
1,190(510)
1,690(2,495)
755(1,095)
1,520(1,130)
1,610(1,190)
735(2,060)
4,425(5,975)
7,690(5,840)
6,515(4,630) 8,515
(6,720)
9,210(6,970)
3,260(4,465)
3,150(3,945)
5,325(4,120)
3,995(6,525)
4,995(3,500)
5,580(8,715)
5,180(7,070)
Reagan Memorial Tollway
Veter
ans
Mem
oria
l Tol
lway
§̈¦355
§̈¦88
MP 2
1.7
MP 2
1.5
MP 20.8
MP 133.2
MP 132.4
N Z
Y
AH
B-16
2014 A.M. & P.M. Peak Hour TrafficOn Reagan Memorial Tollway, Veterans Memorial Tollway East Interchange
*,*** = A.M. Peak(*,***) = P.M. Peak
Note:The 2014 AM & PM peak-hour volumes aredefined as the 85th Percentile volumes occurringin the 6:00 to 8:00 AM and the 4:00 to 6:00 PMperiods respectively. Peak-hour volumes arecalculated from Monday through Thursday hourlytraffic volume data only, and exclude holidays.

320(120)
1,540(685)
225(400)
240(355)
705(370)
340(855)
215(560)
955(735)265
(405)
145(330)
1,175(575)
1,165(590)
1,160(2,525)
1,265(1,220)
2,425(1,275)
1,865(2,895)
2,105(1,155)
390(1,780)
295(1,375)
5,330(4,830)
7,195(7,725)
6,730(6,970)
3,965(4,890)
6,825(8,025)
5,085(5,780)
7,090(8,430)
7,680(7,000)
8,515(6,720)
6,825(8,025)
5,580(8,715)
7,655(7,385)
Also See Page B-9
York
Roa
d
HargerRoad
Butterfield Road
HighlandAvenuePlaza 56
KingeryHighway
(Illinois 83)
MidwestRoad
Plaza 55
Cermak Road(22nd Street)
Plaza 52
SpringRoad
Plaza 53
Plaza 54
MainlineYork RoadPlaza 51
MainlineMeyers Road
4 ORT Lanes
4 ORT Lanes§̈¦88
§̈¦294
§̈¦88
TO
MP 135 MP 138.1MP 137.1MP 136.5MP 134.3
MP 138.7MP 138.9
N
NN
N
N
N
N
Z
ABAA
AA
B-17
2014 A.M. & P.M. Peak Hour TrafficOn Reagan Memorial Tollway, from Highland Avenue to Harger Road
*,*** = A.M. Peak(*,***) = P.M. Peak
Note:The 2014 AM & PM peak-hour volumes aredefined as the 85th Percentile volumes occurringin the 6:00 to 8:00 AM and the 4:00 to 6:00 PMperiods respectively. Peak-hour volumes arecalculated from Monday through Thursday hourlytraffic volume data only, and exclude holidays.
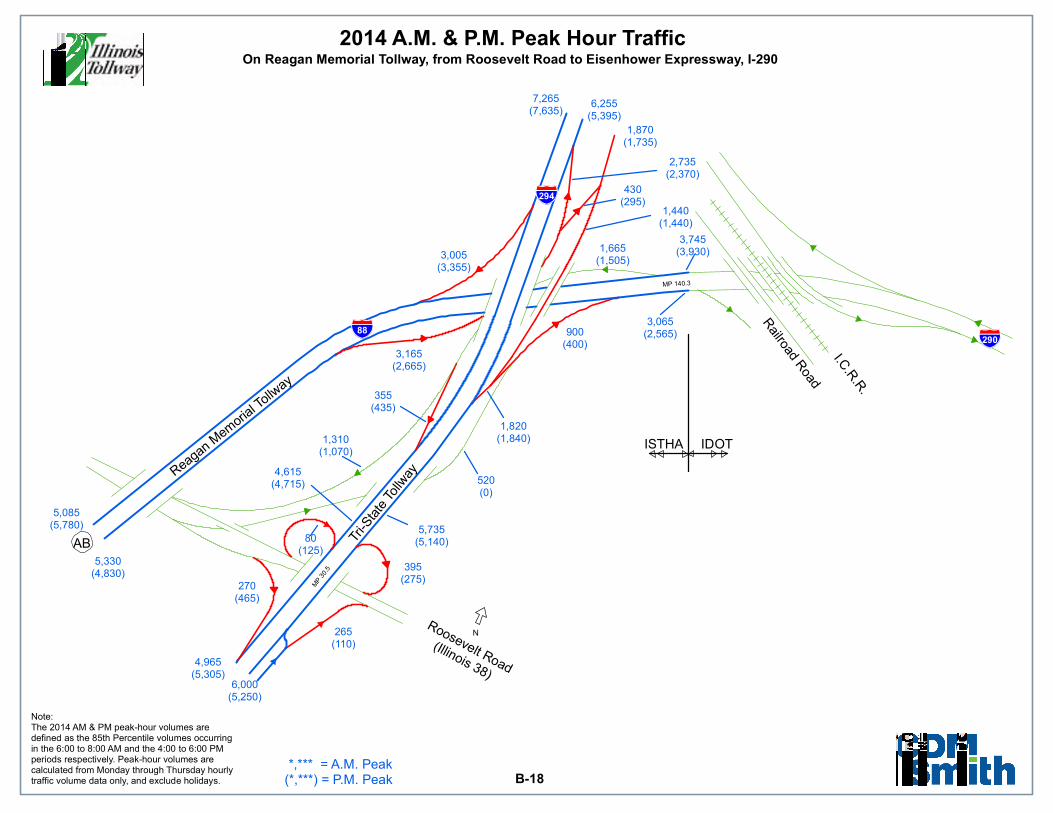
520(0)
900(400)
265(110)
355(435)
395(275)
430(295)
270(465)
1,870(1,735)
1,665(1,505)
3,165(2,665)
1,440(1,440)
1,820(1,840)
2,735(2,370)
1,310(1,070)
3,005(3,355)
80(125)
5,735(5,140)
4,615(4,715)
3,745(3,930)
6,255(5,395)
5,330(4,830)
5,085(5,780)
3,065(2,565)
6,000(5,250)
4,965(5,305)
7,265(7,635)
Railroad R
oad
Roosevelt Road
(Illinois 38)
Reagan Mem
orial T
ollway
I.C.R
.R.
Tri-S
tate
Tol
lway
ISTHA IDOT
§̈¦290
§̈¦294
§̈¦88
MP 3
0.5
MP 140.3
N
AB
B-18
2014 A.M. & P.M. Peak Hour TrafficOn Reagan Memorial Tollway, from Roosevelt Road to Eisenhower Expressway, I-290
*,*** = A.M. Peak(*,***) = P.M. Peak
Note:The 2014 AM & PM peak-hour volumes aredefined as the 85th Percentile volumes occurringin the 6:00 to 8:00 AM and the 4:00 to 6:00 PMperiods respectively. Peak-hour volumes arecalculated from Monday through Thursday hourlytraffic volume data only, and exclude holidays.

130(95)
160(415)
200(630)
555(655)
510(335)
905(490)
360(230)
970(395)
625(270)
450(900)
95(140)
185(120)
100(130)
295(965)
290(170)
140(235)
125(160)
145(70)
1,865(1,590)
1,335(1,475)
1,890(2,130)
2,375(1,925)
3,140(2,180)
2,235(4,175)
4,505(2,620)
2,160(3,705)
4,010(2,445)
2,050(2,860)
4,720(2,780)
3,140(2,180)
2,300(4,450)
2,050(2,860)
143rd Street
Illinois 171(Archer Ave.)
Plaza 95
127th StreetPlaza 93
Illinois 7(159th Street)
Plaza 97
U.S. 6(Southwest Highway)
Plaza 101
MainlineSpring Creek
Plaza 99
3 ORT Lanes
3 ORT Lanes§̈¦355
§̈¦355
§̈¦80
MP 7.3MP 4.8 MP 6.8 MP 8.9
MP 3.3MP 0.0 MP 0.8
N
NN
N
N
ADAC
AC
B-19
2014 A.M. & P.M. Peak Hour TrafficOn Veterans Memorial Tollway, from Interstate 80 to 127th Street
*,*** = A.M. Peak(*,***) = P.M. Peak
Note:The 2014 AM & PM peak-hour volumes aredefined as the 85th Percentile volumes occurringin the 6:00 to 8:00 AM and the 4:00 to 6:00 PMperiods respectively. Peak-hour volumes arecalculated from Monday through Thursday hourlytraffic volume data only, and exclude holidays.

645(885)
1,320(840)
395(650)
680(245)
240(315)
225(105)
640(595)
155(335)
2,290(2,195)
1,310(2,165)
885(1,200)
1,645(1,310)
2,300(4,450)
4,720(2,780) 6,105
(4,625)
3,855(6,560)
§̈¦55
§̈¦355MP 12.3
N
ADAE
B-20
2014 A.M. & P.M. Peak Hour TrafficOn Veterans Memorial Tollway, At Interstate 55
*,*** = A.M. Peak(*,***) = P.M. Peak
Note:The 2014 AM & PM peak-hour volumes aredefined as the 85th Percentile volumes occurringin the 6:00 to 8:00 AM and the 4:00 to 6:00 PMperiods respectively. Peak-hour volumes arecalculated from Monday through Thursday hourlytraffic volume data only, and exclude holidays.

145(240)
240(355)
415(660)
175(235)
250(375)
855(465)
375(565)
355(715)
810(495)
395(480)
330(300)
400(420)
1,015(590)
1,285(515)
455(1,035) 460
(1,070)
6,540(4,555)
8,790(5,170)
3,815(6,795)
8,265(5,005)
4,510(8,590)
4,020(7,455)
7,155(4,725)
4,335(8,285)
3,815(6,795)
6,105(4,625)
3,855(6,560)
6,540(4,555)
BoughtonRoad
Plaza 90
MapleAvenuePlaza 83
75thStreet
Plaza 87
63rdStreet
Plaza 85
MainlineBoughton Road
Plaza 89
3 ORT Lanes
3 ORT Lanes
MP 18.3MP 17.2MP 15.5
MP 14.4MP 13.8
NN
N
N
N
AG
AE
AF
AF
B-21
2014 A.M. & P.M. Peak Hour TrafficOn Veterans Memorial Tollway, from Boughton Road to Maple Avenue
*,*** = A.M. Peak(*,***) = P.M. Peak
Note:The 2014 AM & PM peak-hour volumes aredefined as the 85th Percentile volumes occurringin the 6:00 to 8:00 AM and the 4:00 to 6:00 PMperiods respectively. Peak-hour volumes arecalculated from Monday through Thursday hourlytraffic volume data only, and exclude holidays.

1,785(930)
1,070(830)
455(715)
690(515)
475(360)
460(495)
860(725)
715(650) 815
(925)
250(710)
165(155)
560(745)
1,250(630)
1,250(1,315)
1,690(2,495)
575(1,800)
1,685(1,570)
1,390(1,375)
1,610(1,190)
3,060(2,420)
215(1,240)
415(1,005)
5,745(5,130)
6,750(6,715)
3,150(3,945)
5,325(4,120)
6,800(6,095)
6,310(6,640)
6,305(5,930)
5,900(5,920)
6,210(6,365)
5,480(6,010)
WestInterchange
Ogden Avenue(see Page B-15) East
Interchange(see Page B-16)
Rea
gan
Mem
oria
l To
llwa
y
Og
de
n A
venu
e
Reagan M
emorial To
llway
Veterans Memorial Tollway
Veterans Memorial Tollway
ISTHA CentralAdministration
Army TrailRoad
Plaza 81
ISTHA IDOT
Butterfield Road(Illinois 56)Plaza 79
Roosevelt Road(Illinois 38)Plaza 77
MainlineArmy Trail Road
Plaza 73North Avenue
(Illinois 64)Plaza 75
3 ORT Lanes
3 ORT Lanes
§̈¦355
§̈¦355§̈¦88
§̈¦88
MP 29.8MP 29.2MP 27.9MP 24.6
MP 22.6
N
NN
NN
N
Z
Y
YX
AI
AH
AIAH
AG
B-22
2014 A.M. & P.M. Peak Hour TrafficOn Veterans Memorial Tollway, from Ogden Avenue / West Interchange to Army Trail Road
*,*** = A.M. Peak(*,***) = P.M. Peak
Note:The 2014 AM & PM peak-hour volumes aredefined as the 85th Percentile volumes occurringin the 6:00 to 8:00 AM and the 4:00 to 6:00 PMperiods respectively. Peak-hour volumes arecalculated from Monday through Thursday hourlytraffic volume data only, and exclude holidays.

Section 2
Appendix C
Lane Configuration
2013 Lane Configuration Schematics
Appendix C


Illinois Tollway 2014 Traffic Data Report
Start End Start End
ILLINOIS TOLLWAY
C-1 to
C-2I-90
Rebuilding/Widening
I-39 to Elgin Toll Plaza 17.4 53.7 Spring 2013 12/2014
C-2 to
C-4I-90
Rebuilding/Widening
Elgin Toll Plaza to Kennedy Expressway53.8 78.8 2014 2016
C-1 I-90Interchange Construction
Irene Road EB Entrance Ramp20.8 09/2014 12/2015
C-1 I-90Bridge & Interchange Reconstruction
Genoa Road25
Spring
2014
Summer
2015
C-2 I-90Bridge Reconstruction
Fox River Bridge55.6 2014 2016
C-2 I-90Interchange Reconstruction
Illinois Route 2556.3 04/2014
Fall
2015
N/A I-90Bridge Reconstruction
Higgins Road (Illinois Route 72)61.3
Summer
2014
Fall
2015
C-2 I-90Interchange Reconstruction
Barrington Road62.2
Summer
2014
Summer
2016
C-3 I-90Interchange Reconstruction
Roselle Road65.5
Summer
2014
Fall
2015
C-3 I-90Interchange Reconstruction
Meacham Road67
Spring
20142016
C-3 I-90Ramp Toll Plaza Reconstruction
Illinois Route 53 Plaza 15A68.2 05/2014
Fall
2014
C-3 I-90Ramp Toll Plaza Reconstruction
Arlington Heights Road Plaza 1870.7 05/2014
Fall
2014
C-3 I-90Interchange Reconstruction
Elmhurst Road 73.5
Summer
2014
Fall
2015
C-3 I-90Interchange Reconstruction
Lee Street76.1 04/2014
Spring
2015
C-4 I-90Ramp Toll Plaza Reconstruction
O'Hare Plaza 3177
Spring
2014
Spring
2014
C-5 I-94Interchange Ramp Improvements
Grand Avenue (Illinois Route 132)8.4
Summer
2014
Spring
2015
C-5 I-94Interchange Ramp Improvements
Belvidere Road (Illinois Route 120)11.2
Summer
2014
Fall
2014
Page # Facility DescriptionMilepost Construction Schedule
2014 CONSTRUCTION PROJECTS

Illinois Tollway 2014 Traffic Data Report
Start End Start End
ILLINOIS TOLLWAY
C-7 to
C-10I-294
Interchange Ramp Repairs at Irving Park
Road, I-290, Roosevelt Road, Ogden Avenue,
75th Street, and I-55
22.0
27.4
30.5
31.8
38.3
Summer
2014
Fall
2014
C-11 I-294Interchange Construction
I-57 and 147th Street7.6 8.2 2012
Fall
2014
N/A I-294
Bridge Repairs at Midlothian Turnpike, CSX
Railroad Bridge, Thornton Quarry and Thorn
Creek.
10.1
2.1
1.8
0.5
Summer
2014
Spring
2015
C-15,
C-19I-355
Ramp Repairs
I-80 and I-88
0.0
19.5
Fall
2013
Fall
2014
C-14 I-88Roadway Rehabilitation
Aurora Toll Plaza to Illinois Route 59117.8 123.3
Summer
2013
Spring
2014
N/A I-88Bridge Repairs at Harmon Road, Randall Road,
and Church Road
48.9
115.7
118.8
Spring
2014
Fall
2014
N/A I-390New I-390 Construction
Lake Street (U.S. Route 20) to Illinois Route 836.0 15.8
Late Fall
2013
Late Fall
2015
N/A I-390Interchange Reconstruction
I-390 at I-2905.0
Summer
20142017
IDOT EXPRESSWAY SYSTEM
N/A I-55Interchange Reconfiguration
I-55 at Arsenal Road244
Summer
2009
Fall
2014
N/A I-55Interchange Improvement
County Line Road 276
Winter
2014
Spring
2015
N/A I-55Interchange Improvement
Illinois Route 171282
Winter
20142017
C-11 I-57New Interchange Construction
I-57 at I-294350
Spring
2013
October
2014
N/A I-90/94Structure Replacement
Ohio Street50
Summer
2013
Fall
2014
N/A I-94Interchange Reconfiguration
Stony Island Avenue66
March
2014
October
2014
Page # Facility DescriptionMilepost Construction Schedule
2014 CONSTRUCTION PROJECTS
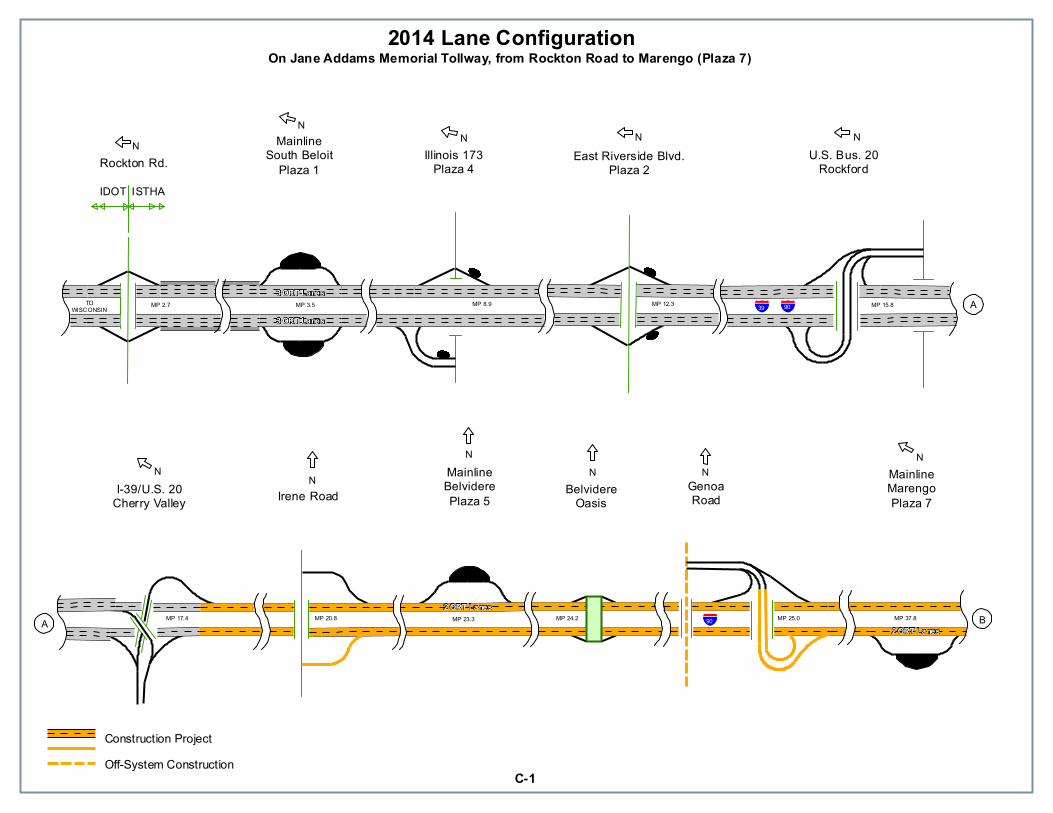
MainlineMarengoPlaza 7
BelvidereOasis
I-39/U.S. 20Cherry Valley
Rockton Rd.
Irene Road GenoaRoad
Illinois 173Plaza 4
East Riverside Blvd.Plaza 2
IDOT ISTHA
TU
U.S. Bus. 20Rockford
MainlineBelviderePlaza 5
MainlineSouth Beloit
Plaza 1
MP 8.9MP 3.5MP 2.7
MP 20.8
MP 12.3
MP 37.8MP 25.0MP 24.2MP 23.3MP 17.4
MP 15.8TOWISCONSIN
N
NN
NN
NNNN
N
N
BA
A3 ORT Lanes
2 ORT Lanes
3 ORT Lanes
2 ORT Lanes
§̈¦39
§̈¦90
§̈¦90
C-1
2014 Lane ConfigurationOn Jane Addams Memorial Tollway, from Rockton Road to Marengo (Plaza 7)
Construction ProjectOff-System Construction

BarringtonRoad
Plaza 10
RandallRoad
Plaza 8Illinois 47Plaza 6
Illinois 59Plaza 14
Illinois 25Plaza 13
Illinois 31Plaza 11
U.S. 20Marengo
BeverlyRoad
Plaza 16
9/20
MainlineElgin
Plaza 9
MP 62.2MP 59.7MP 58.1MP 56.3
MP 54.6MP 53.8MP 53.3MP 46.4MP 42.3
N NN
N
NNNNN
C
CB
D
3 ORT Lanes
3 ORT Lanes
§̈¦90
§̈¦90
Fox River
C-2
2014 Lane ConfigurationOn Jane Addams Memorial Tollway, from U.S. 20, Marengo to Barrington Road
Construction ProjectOff-System Construction
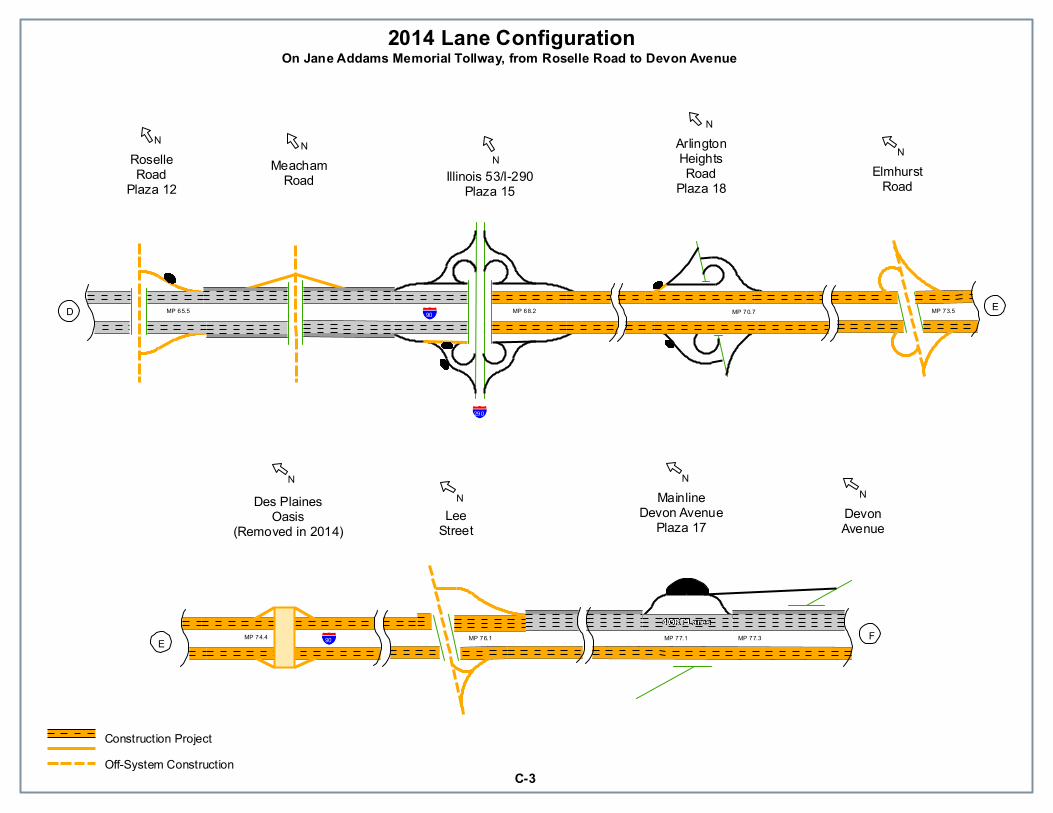
ElmhurstRoad
LeeStreet
ArlingtonHeightsRoad
Plaza 18
Des PlainesOasis
(Removed in 2014)DevonAvenue
RoselleRoad
Plaza 12Illinois 53/I-290
Plaza 15
MainlineDevon Avenue
Plaza 17
MeachamRoad
MP 77.3MP 77.1MP 76.1MP 74.4
MP 73.5MP 70.7MP 68.2MP 65.5
N
E
E
NN
NN
N
NN
N
D
F4 ORT Lanes
§̈¦290
§̈¦90
§̈¦90
C-3
2014 Lane ConfigurationOn Jane Addams Memorial Tollway, from Roselle Road to Devon Avenue
Construction ProjectOff-System Construction
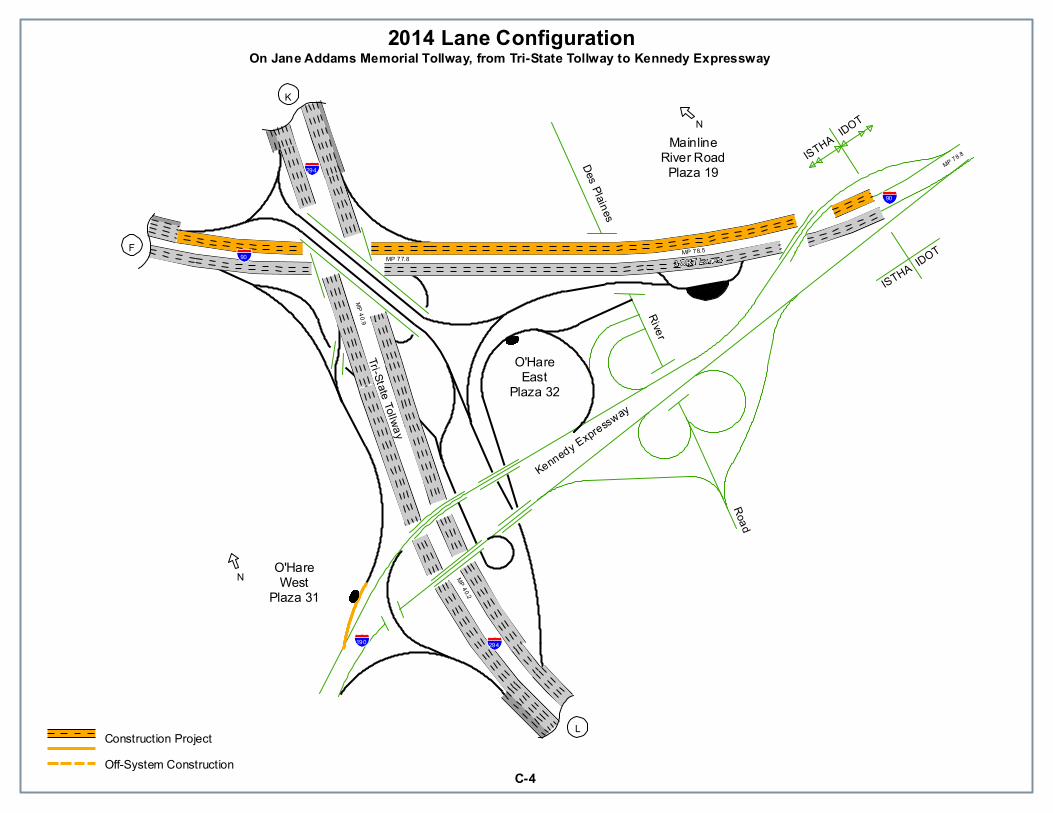
River
Road
MainlineRiver Road
Plaza 19Des Plaines
Tri-State Tollway
Kennedy Expressway
ISTHA
ISTHA IDOT
IDOT
O'HareEast
Plaza 32
O'HareWest
Plaza 31MP 40.2
MP 40.9
MP 78.8
MP 78.5MP 77.8
N
N
L
K
F3 ORT Lanes§̈¦90
§̈¦90
§̈¦190 §̈¦294
§̈¦294
C-4
2014 Lane ConfigurationOn Jane Addams Memorial Tollway, from Tri-State Tollway to Kennedy Expressway
Construction ProjectOff-System Construction

Edwards Road
Rockland Road(Illinois 176)
LakeForestOasis
RussellRoad
Buckley Road(Illinois 137)
Plaza 20
GrandAvenue
(Illinois 132)
BelvidereRoad
(Illinois 120)
RosecransRoad
(Illinois 173)SkokieHighway(U.S. 41)
IDOT ISTHA MainlineWaukegan Road
Plaza 21
MilwaukeeAvenue
(Illinois 21)
To WisconsinMP 8.4MP 4.8MP 2.4
MP 0.5
MP 1.4
MP 18.1MP 16.0MP 13.8MP 11.2MP 10.1
NNNNN
NNN
NN
G
HG
3 ORT Lanes
3 ORT Lanes§̈¦94 §̈¦94
§̈¦94
C-5
2014 Lane ConfigurationOn Tri-State Tollway, from Russell Road to Lake Forest Oasis
Construction ProjectOff-System Construction

DeerfieldRoad
Golf Road(Illinois 58)Plaza 28
Waukegan Road(Illinois 43)
Half Day Road(Illinois 22)Plaza 23
Town Line Road(Illinois 60)Plaza 22
Lake Cook RoadPlaza 26
Willow RoadPlaza 27
MainlineEdens Spur
Plaza 24
MP 45.2MP 48.9
MP 24.2MP 21.8MP 18.9MP 2
5.3
MP 27.8
MP 30.1
N
N
NN
N
NNN
I
I
J
H
2 ORT Lanes
2 ORT Lanes
§̈¦294§̈¦294
§̈¦94
§̈¦94
§̈¦94
£¤41
C-6
2014 Lane ConfigurationOn Tri-State Tollway, from Town Line Road (Illinois 60) to Golf Road (Illinois 58) and Edens Spur
Construction ProjectOff-System Construction
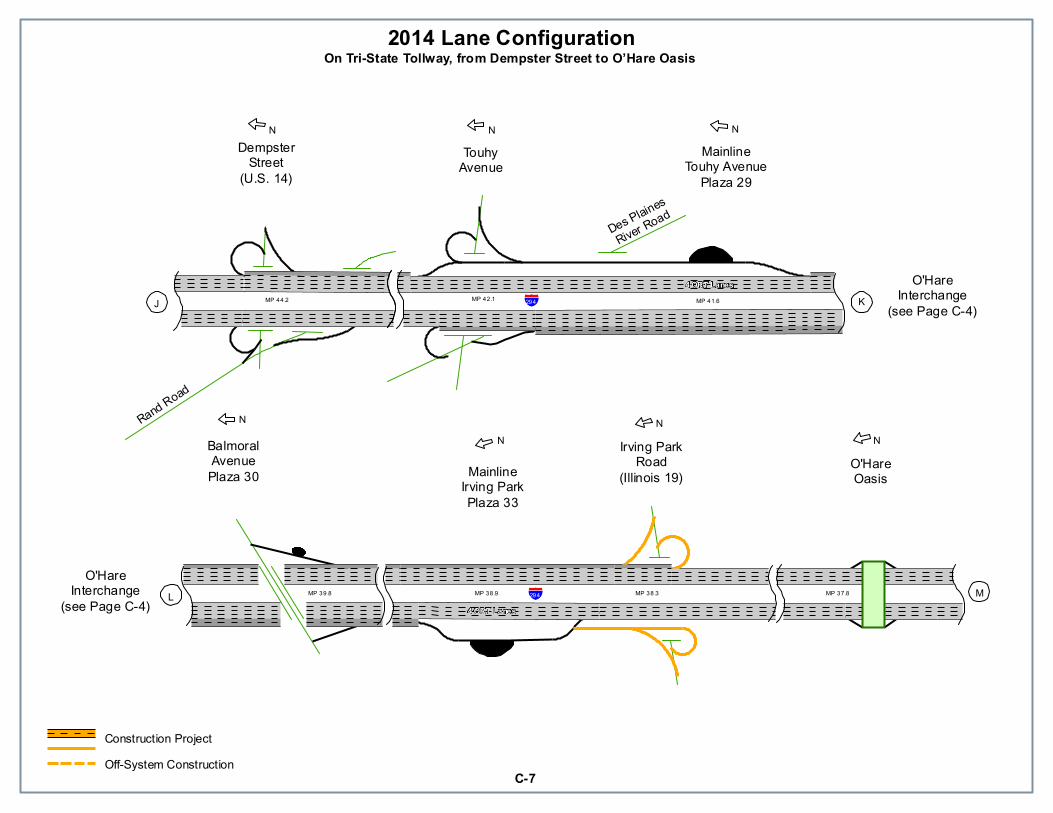
Des Plaines
River Road
BalmoralAvenuePlaza 30
Irving ParkRoad
(Illinois 19)
TouhyAvenue
O'HareOasis
O'HareInterchange
(see Page C-4)
O'HareInterchange
(see Page C-4)
DempsterStreet
(U.S. 14)
MainlineIrving ParkPlaza 33
MainlineTouhy Avenue
Plaza 29
Rand Road
MP 37.8MP 38.3MP 38.9MP 39.8
MP 41.6MP 42.1MP 44.2
NN
NN
NNN
L M
KJ4 ORT Lanes
4 ORT Lanes§̈¦294
§̈¦294
C-7
2014 Lane ConfigurationOn Tri-State Tollway , from Dempster Street to O’Hare Oasis
Construction ProjectOff-System Construction

Lake Street(U.S. 20)
North Avenue(Illinois 64)
Also See Page C-18
MP 31.1MP 31.8MP 33.8
N
NM §̈¦294
§̈¦290
§̈¦290
§̈¦88
§̈¦88
C-8
2014 Lane ConfigurationOn Tri-State Tollway, from North Avenue / Lake Street to Reagan Memorial Tollway (I-88)
Construction ProjectOff-System Construction

Also See Page C-17
HinsdaleOasis
RooseveltRoad
(Illinois 38)
OgdenAvenue
(U.S. 34)
MainlineCermak Road
Plaza 35Cermak
Road(22nd Street)
MP 25.0MP 27.4MP 29.1
MP 29.5MP 39.9MP 30.5
N
N
NNN
PO
ON4 ORT Lanes
4 ORT Lanes
§̈¦294
§̈¦88
§̈¦294
TO
C-9
2014 Lane ConfigurationOn Tri-State Tollway, from Roosevelt Road to Hinsdale Oasis
Construction ProjectOff-System Construction
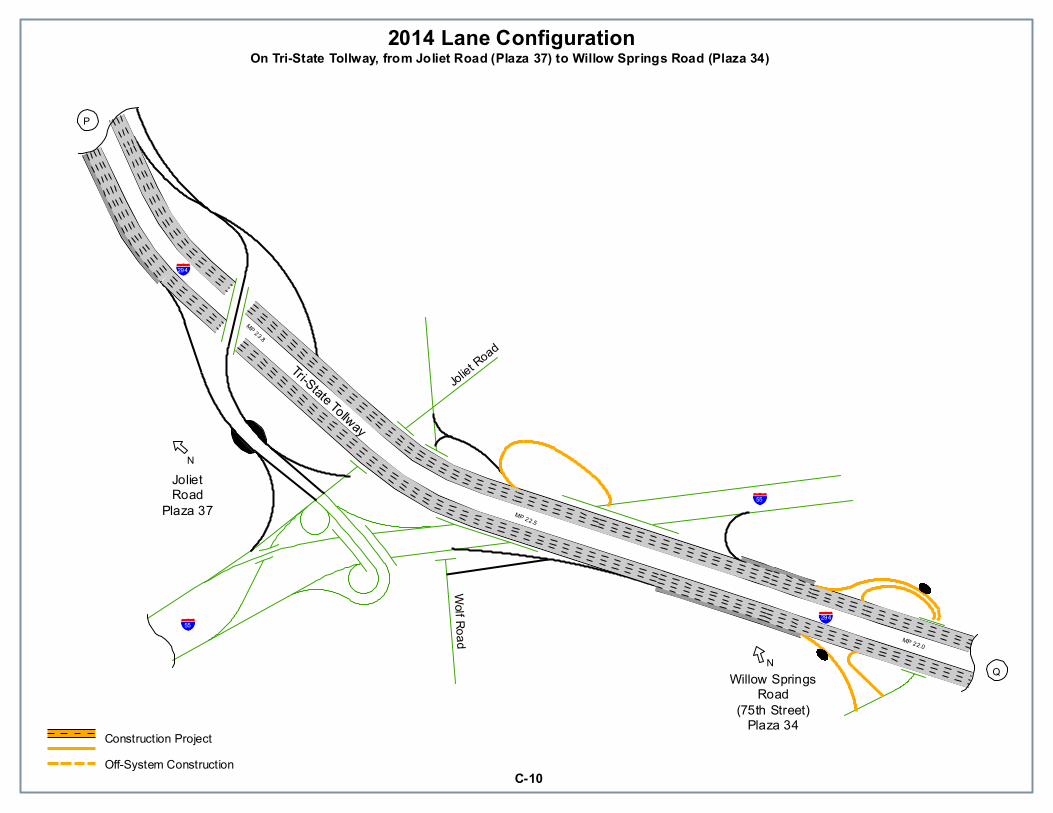
JolietRoad
Plaza 37
Willow SpringsRoad
(75th Street)Plaza 34
Joliet RoadTri-State Tollway
Wolf Road MP 22.0
MP 22.5
MP 23.8
N
N
Q
P
§̈¦294
§̈¦55 §̈¦294
§̈¦55
C-10
2014 Lane ConfigurationOn Tri-State Tollway, from Joliet Road (Plaza 37) to Willow Springs Road (Plaza 34)
Construction ProjectOff-System Construction
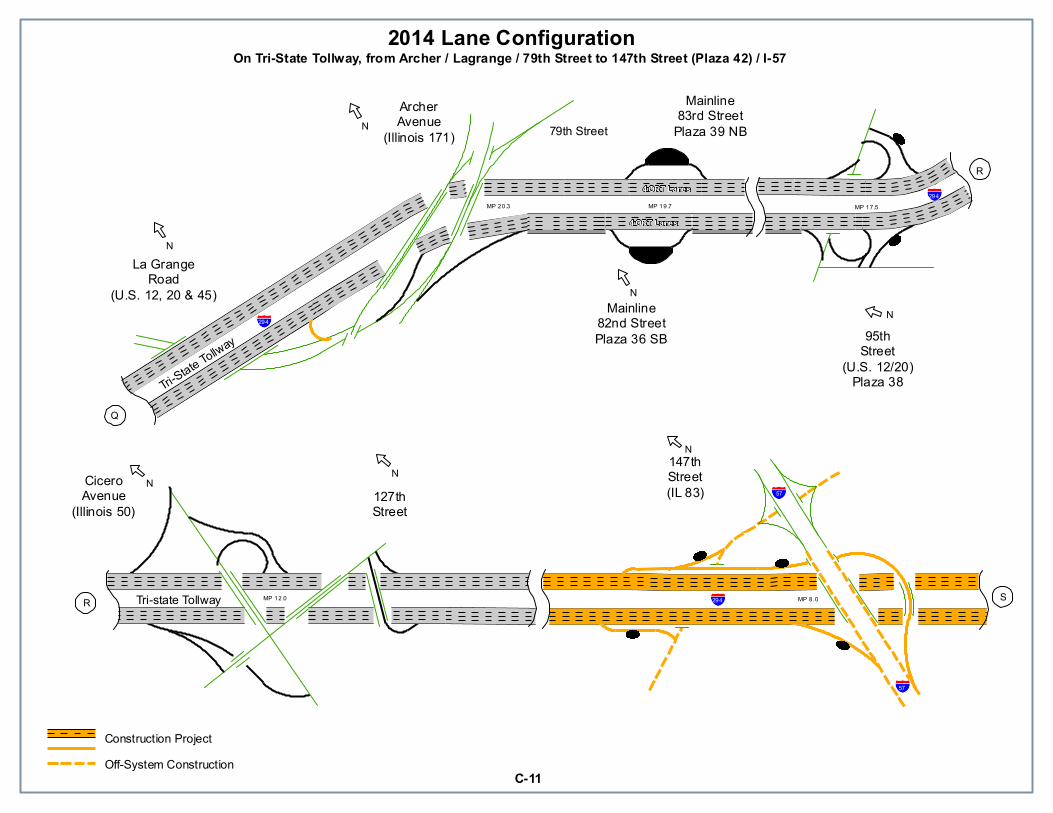
127thStreet
147thStreet(IL 83)
Tri-State Tollway
CiceroAvenue
(Illinois 50)
79th StreetArcherAvenue
(Illinois 171)
Tri-state Tollway
La GrangeRoad
(U.S. 12, 20 & 45)Mainline
82nd StreetPlaza 36 SB
Mainline83rd Street
Plaza 39 NB
95thStreet
(U.S. 12/20)Plaza 38
MP 8.0MP 12.0
MP 17.5MP 19.7MP 20.3
S
N
NN
NN
N
N
R
R
Q
4 ORT Lanes
4 ORT Lanes
§̈¦57
§̈¦57
§̈¦294
§̈¦294
§̈¦294
C-11
2014 Lane ConfigurationOn Tri-State Tollway, from Archer / Lagrange / 79th Street to 147th Street (Plaza 42) / I-57
Construction ProjectOff-System Construction

WoodStreet
Halsted Street(Illinois 1)Plaza 47
Tri-State Tollway
LincolnOasis
Kingery Expressway
Illinois 394
Bishop FordExpresswayDixie
Highway
159thStreet(U.S 6)
Plaza 40
I-80Plaza 45
I-80Plaza 43
ISTHA IDOT
Mainline163rd Street
Plaza 41
MP 0.0MP 0.8MP 2.7MP 4.0MP 4.2
MP 5.1
MP 5.6MP 6.3
N
N
N
N
N
N N
S
T
T
2 ORT Lanes
2 ORT Lanes
4 ORT Lanes
4 ORT Lanes
§̈¦294
§̈¦294
§̈¦294
§̈¦294
§̈¦80
§̈¦80
§̈¦94
§̈¦80 §̈¦94§̈¦80
C-12
2014 Lane ConfigurationOn Tri-State Tollway, from 159th Street (Plaza 40) to Bishop Ford / Kingery Expressway
Construction ProjectOff-System Construction

Illinois 56Illinois 47
Illinois 26
OrchardRoad
Plaza 64
Illinois 251
Annie Glidden RoadPlaza 67 Peace Road
Plaza 65De KalbOasis
I-39(U.S. 51)IDOT ISTHA
U.S. 30 MainlineDe KalbPlaza 66
MainlineDixon
Plaza 69
MP 86.0MP 56.5 MP 78.6MP 76.1MP 54.4MP 44.2
MP 94.0MP 93.3MP 91.4 MP 114.5MP 114.0MP 109.5
N N N NNN
NNN
NNN
VU
U2 ORT Lanes 2 ORT Lanes
2 ORT Lanes 2 ORT Lanes
§̈¦88
§̈¦88
C-13
2014 Lane ConfigurationOn Reagan Memorial Tollway, from Illinois 26 to Orchard Road
Construction ProjectOff-System Construction

Diehl Road
FarnsworthAvenuePlaza 59
NapervilleRoad
Plaza 57Illinois 53
Illinois 59
Illinois 31Plaza 63
WinfieldRoad
Plaza 58
EolaRoad
Plaza 60MainlineAurora
Plaza 61
Freed
om D
rive
Bilter Road
Nape
rville
Roa
d
MP 121.4
MP 130.0
MP 127.6MP 125.2MP 123.3
MP 119.2MP 117.8MP 117.0
N
N N
N
N
NNN
W
X
WV3 ORT Lanes
3 ORT Lanes
§̈¦88
§̈¦88
Fox River
C-14
2014 Lane ConfigurationOn Reagan Memorial Tollway, from Illinois 31 to Illinois 53
Construction ProjectOff-System Construction

Reagan Memorial Tollway
Ogden Avenue(U.S. 34)Plaza 81
ISTHA CentralAdministration
Building
Veter
ans M
emori
al To
llway
MP 19
.5
MP 20.1
MP 131.3MP 130.8
N
Y
X
AG
§̈¦355
§̈¦355
§̈¦88
C-15
2014 Lane ConfigurationOn Reagan Memorial Tollway, Veterans Memorial Tollway West Interchange
Construction ProjectOff-System Construction

Reagan Memorial Tollway
Veterans Memorial Tollway
MP 21.7
MP 21.5
MP 20.8
MP 133.2
MP 132.4
NZ
Y
AH
§̈¦355
§̈¦88
C-16
2014 Lane ConfigurationOn Reagan Memorial Tollway, Veterans Memorial Tollway East Interchange
Construction ProjectOff-System Construction

HargerRoad
Butterfield Road
HighlandAvenuePlaza 56
MidwestRoad
Plaza 55Cermak Road(22nd Street)
Also See Page C-9
SpringRoad
Plaza 53
KingeryHighway
(Illinois 83)Plaza 54
MainlineYork RoadPlaza 51
York R
oad
MainlineMeyers Road
Plaza 52
MP 135
MP 138.7MP 138.9
MP 138.1MP 137.1MP 136.5MP 134.3
N
NN
N
N
N
N
Z
AB
AA
AA4 ORT Lanes
4 ORT Lanes
§̈¦294
§̈¦88
§̈¦88
TO
C-17
2014 Lane ConfigurationOn Reagan Memorial Tollway, from Highland Avenue to Harger Road
Construction ProjectOff-System Construction

Roosevelt Road(Illinois 38)
ISTHA IDOT
Railroad Road
Reagan Memorial Tollway
I.C.R.R.
Tri-State
Tollway
MP 30.5
MP 140.3
N
AB
§̈¦290
§̈¦294
§̈¦88
C-18
2014 Lane ConfigurationOn Reagan Memorial Tollway, from Roosevelt Road to Eisenhower Expressway (I-290)
Construction ProjectOff-System Construction
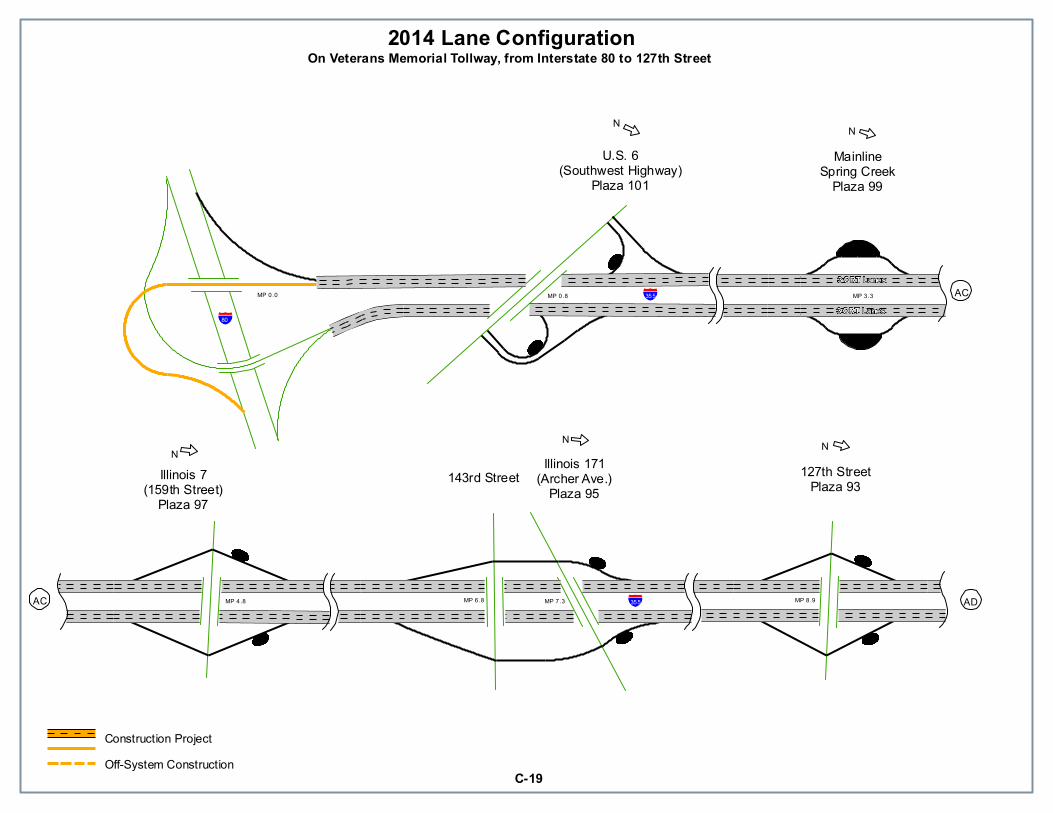
143rd StreetIllinois 171
(Archer Ave.)Plaza 95
127th StreetPlaza 93Illinois 7
(159th Street)Plaza 97
U.S. 6(Southwest Highway)
Plaza 101Mainline
Spring CreekPlaza 99
MP 7.3MP 4.8 MP 6.8 MP 8.9
MP 3.3MP 0.0 MP 0.8
NN N
NN
ADAC
AC3 ORT Lanes
3 ORT Lanes§̈¦355
§̈¦355
§̈¦80
C-19
2014 Lane ConfigurationOn Veterans Memorial Tollway, from Interstate 80 to 127th Street
Construction ProjectOff-System Construction

MP 1 2.3
N
ADAE
§̈¦355
§̈¦55
C-20
2014 Lane ConfigurationOn Veterans Memorial Tollway, At Interstate 55
Construction ProjectOff-System Construction
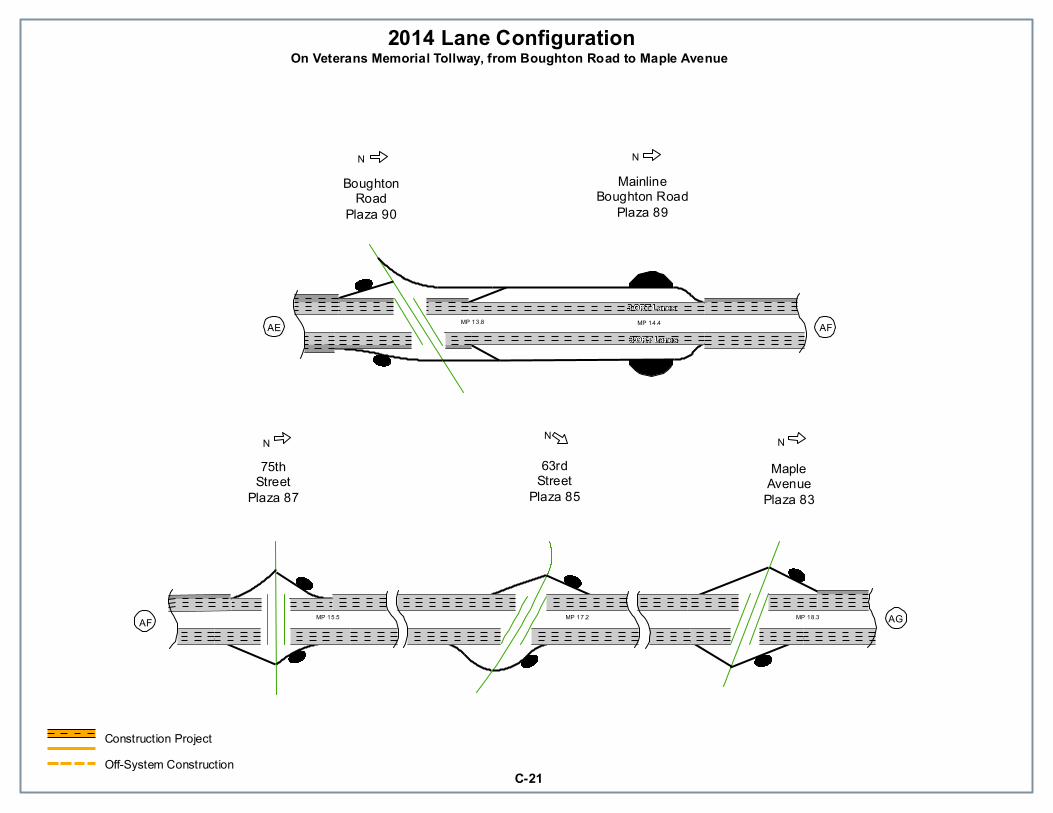
BoughtonRoad
Plaza 90
MapleAvenuePlaza 83
75thStreet
Plaza 87
63rdStreet
Plaza 85
MainlineBoughton Road
Plaza 89
MP 18.3MP 17.2MP 15.5
MP 14.4MP 13.8
NN N
N N
AG
AE
AF
AF3 ORT Lanes
3 ORT Lanes
C-21
2014 Lane ConfigurationOn Veterans Memorial Tollway, from Boughton Road to Maple Avenue
Construction ProjectOff-System Construction
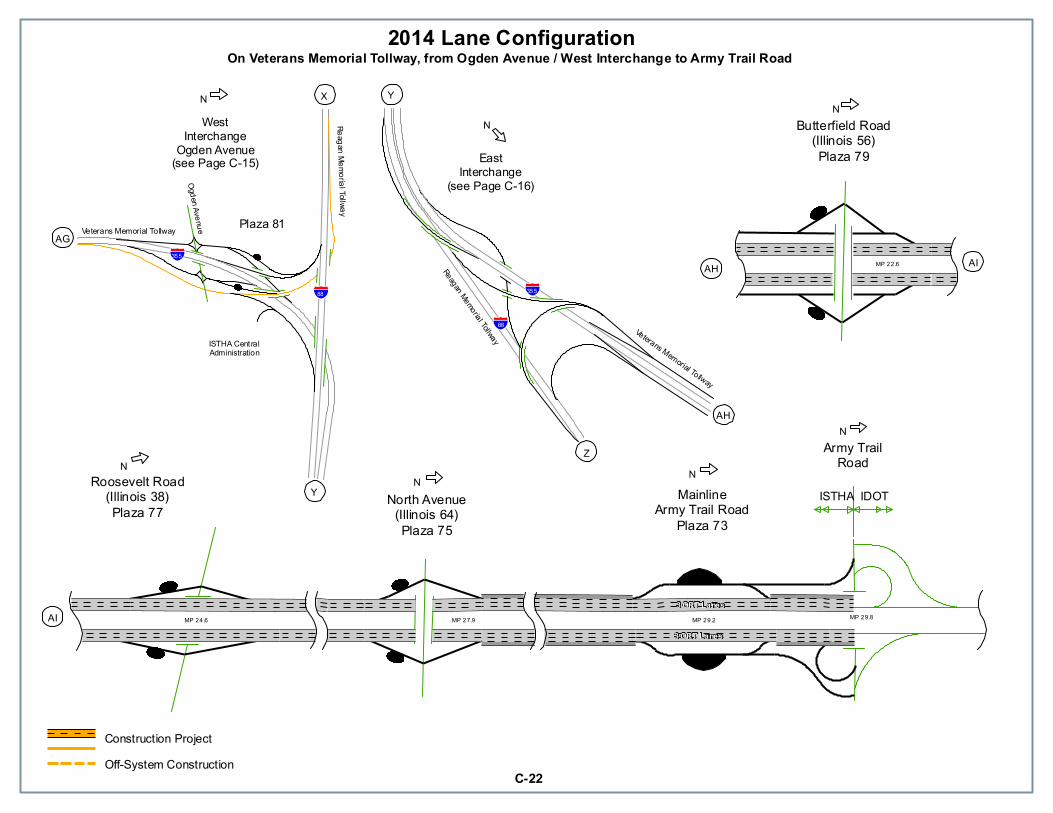
Army TrailRoad
WestInterchange
Ogden Avenue(see Page C-15)
Plaza 81
ISTHA IDOT
EastInterchange
(see Page C-16)
Butterfield Road(Illinois 56)Plaza 79
Roosevelt Road(Illinois 38)Plaza 77
MainlineArmy Trail Road
Plaza 73North Avenue
(Illinois 64)Plaza 75
Reagan Memorial Tollway
Ogden Avenue
Reagan Memorial Tollway
Veterans Memorial Tollway
Veterans Memorial Tollway
ISTHA CentralAdministration
MP 29.8MP 29.2MP 27.9MP 24.6
MP 22.6
NN
N
NNN
N
Z
Y
YX
AI
AH
AIAH
AG
3 ORT Lanes
3 ORT Lanes
§̈¦355
§̈¦355§̈¦88
§̈¦88
C-22
2014 Lane ConfigurationOn Veterans Memorial Tollway, from Ogden Avenue / West Interchange to Army Trail Road
Construction ProjectOff-System Construction

Section 2
Appendix D
Plaza Lane Listing
Plaza Lane Listing
Appendix D


D-1
JA
NE
AD
DA
MS
ME
MO
RIA
L T
OL
LW
AY
(I-
90)
P
LA
ZA
LA
NE
CO
NF
IGU
RA
TIO
N A
S O
F 1
1-1
2-2
014
No.
Nam
e][
1S
ou
th B
elo
it7
17
27
37
47
55
15
25
35
45
5][
61
62
63
64
65
81
82
83
84
85
5B
elv
ide
re][
55
54
53
52
51
73
72
71
7M
are
ng
o-H
am
psh
ire
75
74
71
72
73
51
52
53
54
55
][
9E
lgin
85
84
83
82
81
65
64
63
62
61
][5
55
45
35
25
17
57
47
37
27
1
17
Devo
n A
ven
ue
][5
65
55
45
35
25
17
67
57
47
37
27
1
19
Riv
er
Ro
ad
71
72
73
74
75
76
77
51
52
53
54
55
][
No.
Nam
e
2E
. R
ive
rsid
e B
ou
leva
rd3
4][
21
4Ill
ino
is R
ou
te 1
73
12
][3
4
6Ill
ino
is R
ou
te 4
76
16
26
3/\
64
65
55
54
/\5
35
25
1
8R
an
da
ll R
oa
d2
1][
43
10
Ba
rrin
gto
n R
oa
d][
43
21
11
Illin
ois
Ro
ute
31
2/\
3][
51
/\4
12
Rose
lle R
oa
d][
32
1
13
Illin
ois
Ro
ute
25
1][
2
14
Illin
ois
Ro
ute
59
65
4][
15
I-2
90
, Ill
ino
is R
ou
te 5
37
65
4 /
\1
23
][
16
aIll
ino
is R
ou
te 5
9][
98
7
16
bB
eve
rly
Ro
ad
][1
11
0
18
Arl
ing
ton
He
igh
ts R
oa
d6
54
][3
21
Ma
inlin
e P
laza
La
ne
Nu
mb
er
Note
s
EA
ST
WE
ST
Se
rve
s W
B t
raff
ic o
nly
. P
laza
bu
ildin
g lo
cate
d o
n w
est
bo
un
d s
ide
.
Se
rve
s E
B t
raff
ic o
nly
. P
laza
bu
ildin
g lo
cate
d o
n e
ast
bo
un
d s
ide
.
EA
ST
WE
ST
Pla
za b
uild
ing
on
ea
stb
ou
nd
sid
e
Pla
za b
uild
ing
loca
ted
on
we
stb
ou
nd
sid
e.
Se
rve
s W
B t
raff
ic o
nly
. P
laza
bu
ildin
g lo
cate
d o
n w
est
bo
un
d s
ide
.
Se
rve
s E
B o
nly
. P
laza
bu
ildin
g lo
cate
d o
n e
ast
bo
un
d s
ide
be
twe
en
lan
es
71
& 7
4.
La
ne
s 7
4
& 7
5 a
re s
ea
son
al l
an
es.
La
ne
Nu
mb
er
Note
s
La
ne
s 1
- 3
exi
t I-
90
EB
to
IL
53
NB
. L
an
e 3
is c
lose
d d
uri
ng
co
nst
ruct
ion
. L
an
es
4 -
7 e
xit
I-9
0
EB
to
IL
53
SB
. L
an
e 4
is c
lose
st t
o m
ain
line
.
La
ne
s 7
- 9
exi
t I-
90
WB
to
IL
59
. L
an
e 9
clo
sest
to
ma
inlin
e.
Sig
ne
d a
s 1
4 o
n p
laza
ca
no
py.
La
ne
s 1
0 &
11
exi
t I-
90
WB
to
Be
verl
y R
d.
Sig
ne
d a
s 1
4A
on
pla
za c
an
op
y.
La
ne
11
is
clo
sest
to
ma
inlin
e.
La
ne
s 1
- 3
en
ter
I-9
0 W
B f
rom
Arl
ing
ton
He
igh
ts R
d.
La
ne
1 is
no
rth
mo
st.
La
ne
s 4
- 6
exi
t I-
90
EB
to
Arl
ing
ton
He
igh
ts R
d.
Ram
p P
laza
La
ne
s 4
- 6
exi
t I-
90
EB
to
IL
59
. L
an
e 4
is c
lose
st t
o m
ain
line
.
La
ne
1 e
nte
rs I
-90
EB
fro
m I
L 2
5.
La
ne
2 e
xits
I-9
0 W
B t
o I
L 2
5.
La
ne
s 1
& 5
exi
t I-
90
WB
to
IL
31
NB
. L
an
e 2
en
ters
I-9
0 E
B f
rom
IL
31
NB
. L
an
e 3
en
ters
I-
90
EB
fro
m I
L 3
1 S
B.
La
ne
4 e
xits
I-9
0 W
B t
o I
L 3
1 S
B.
La
ne
s e
xit
I-9
0 W
B t
o R
ose
lle R
d.
La
ne
1 is
clo
sest
to
co
ntr
ol b
uild
ing
. L
an
e 3
(cl
ose
st t
o
ma
inlin
e)
is c
lose
d d
uri
ng
co
nst
ruct
ion
La
ne
s 3
& 4
exi
t I-
90
WB
to
IL
17
3.
La
ne
s 1
& 2
en
ter
I-9
0 E
B f
rom
IL
17
3.
La
ne
s 1
& 2
exi
t I-
90
WB
to
Ea
st R
ive
rsid
e B
lvd
. L
an
e 1
is e
ast
mo
st.
La
ne
s 3
& 4
en
ter
I-9
0
EB
fro
m E
ast
Riv
ers
ide
Blv
d.
La
ne
s 1
& 2
exi
t I-
90
EB
to
Ra
nd
all
Rd
. L
an
es
3 &
4 e
nte
r I-
90
WB
fro
m R
an
da
ll R
d.
La
ne
s e
xit
I-9
0 W
B t
o B
arr
ing
ton
Rd
. L
an
e 4
(cl
ose
st t
o t
he
ma
inlin
e)
is c
lose
d d
uri
ng
con
stru
ctio
n.
La
ne
s 5
4 &
55
en
ter
I-9
0 W
B.
La
ne
s 5
1-5
3 e
xit
I-9
0 W
B t
o I
L 4
7.
La
ne
s 6
4 a
nd
65
exi
t I-
90
EB
. L
an
es
61
-63
en
ter
I-9
0 E
B f
rom
IL
47
.
22
Op
en
Ro
ad
To
llin
g L
an
es
(OR
T)
Ma
nu
al L
an
e T
oll
(ML
T)
Sh
ou
lde
r
I-P
AS
S O
nly
La
ne
(IP
O)
Au
tom
atic
Co
in M
ach
ine
La
ne
(A
CM
)
- -][
= C
en
ter
lin
e/M
ain
lin
e
/\ =
Cha
ng
e in
Mo
vem
en
t/D
ire
ctio
n
3=
Clo
sed
Du
rin
g C
on
stru
ctio
n
Cou
nt
31
35
20
26

No
.N
am
e][
21
Wa
uke
ga
n8
58
48
38
28
16
56
46
36
26
1][
55
54
53
52
51
74
73
72
71
24
Ed
en
s S
pu
r7
17
27
37
45
15
25
35
4][
61
62
63
64
81
82
83
84
29
To
uh
y A
ven
ue
][5
65
55
45
35
25
17
77
67
57
47
37
27
17
0
33
Irvi
ng
Pa
rk R
oa
d7
17
27
37
47
57
67
75
15
25
35
45
55
6][
35
Ce
rma
k R
oa
d8
78
68
58
48
38
28
16
66
56
46
36
26
1][
56
55
54
53
52
51
77
76
75
74
73
72
71
36
82
nd
Str
ee
t7
17
27
37
47
57
65
15
25
35
45
55
6][
39
83
rd S
tre
et
][5
65
55
45
35
25
17
57
47
37
27
1
41
16
3rd
Str
ee
t8
58
48
38
28
16
66
56
46
36
26
1][
56
55
54
53
52
51
75
74
73
72
71
No
.N
am
e
20
Bu
ckle
y R
oa
d4
3][
21
22
To
wn
line
Ro
ad
43
][2
1
23
Ha
lf D
ay
Ro
ad
43
][2
1
26
La
ke C
oo
k R
oa
d7
89
][1
01
11
2
27
Will
ow
Ro
ad
14
13
12
][1
11
09
28
Go
lf R
oa
d6
54
][3
21
30
Ba
lmo
ral A
ven
ue
][5
35
25
1
31
O'H
are
We
st1
23
4][
32
O'H
are
Ea
st][
43
21
34
75
th S
tre
et
12
3][
45
6
37
I-5
51
23
45
][6
78
91
0
38
95
th S
tre
et
43
][2
1
40
15
9th
Str
ee
t8
7/\
65
][3
4/\
12
42
I-5
7 (
inte
rch
an
ge
)6
46
56
6/\
63
62
61
][5
65
55
4/\
53
52
51
43
I-8
0,
We
stb
ou
nd
][5
45
35
25
17
47
37
27
1
45
I-8
0,
Ea
stb
ou
nd
71
72
73
74
51
52
53
54
][
47
Ha
lste
d S
tre
et
65
4][
32
1
56
64
Op
en
Ro
ad
To
llin
g L
an
es
(OR
T)
Ma
nu
al L
an
e T
oll
(ML
T)
Lanes
1 &
2 e
xit
I-294 N
B.
Lane 1
is e
ast
most
. L
anes
3 &
4 e
nte
r I-
294 S
B.
Lane 4
is w
est
most
.
Lanes
1 &
2 e
nte
r N
B I
-294 f
rom
WB
159th
St.
Lanes
3 &
4 e
nte
r N
B I
-294 f
rom
EB
159th
St.
Lanes
5 &
6 e
xit
SB
I-2
94 t
o E
B 1
59th
St.
Lanes
7 &
8 e
xit
SB
I-2
94 t
o W
B 1
59th
St.
Pla
za t
o c
ontin
ue o
n I
-80 W
B f
rom
the s
outh
ern
most
port
ion o
f th
e T
ri-S
tate
Tollw
ay.
Lanes
1 -
3 e
xit
NB
I-2
94 t
o H
als
ted S
t.
Lane 1
is c
lose
st t
o t
he c
ontr
ol b
uild
ing (
nort
hm
ost
).
Lanes
4 -
5 e
nte
r
SB
I-2
94 f
rom
Hals
ted S
t.
Pla
za t
o e
nte
r th
e s
outh
ern
most
port
ion o
f th
e T
ri-S
tate
Tollw
ay
from
I-8
0 E
B.
Lanes
52-5
3 e
nte
r N
B I
-294 f
rom
147th
Str
eet.
Lanes
55-5
6 e
nte
r N
B I
-294 f
rom
NB
I-5
7.
Lanes
61-6
2 e
xit
SB
I-
294 t
o 1
47th
Str
eet.
Lanes
65-6
6 e
xit
SB
I-2
94 t
o S
B I
-57.
Se
rve
s N
B t
raff
ic o
nly
. P
laza
bu
ildin
g lo
cate
d o
n e
ast
sid
e.
Lane 1
is c
lose
st t
o t
he p
laza
build
ing (
nort
hm
ost
).
Lane 1
is c
lose
st t
o t
he p
laza
build
ing (
south
most
).
Lanes
1 -
3 e
xit
I-294 S
B.
Lanes
4 -
6 e
nte
r I-
294 N
B.
Lanes
1 -
5 e
xit
I-294 S
B.
Lane 1
is c
lose
st t
o t
he p
laza
build
ing (
west
most
).
Lanes
6 -
10 e
nte
r I-
294 N
B.
Lane
10 is
east
most
.
Lanes
1 &
2 e
nte
r I-
94 N
B.
Lane 1
is e
ast
most
. L
anes
3 &
4 e
xit
I-94 S
B.
Lane 4
is w
est
most
.
Lanes
10 -
12 e
nte
r I-
294 N
B.
Lane 1
2 is
east
most
. L
anes
7 -
9 e
xit
I-294 S
B.
Lane 7
west
most
.
Lanes
9 -
11 e
nte
r I-
294 N
B.
Lane 9
is e
ast
most
. L
anes
12 -
14 e
xit
I-294 S
B.
Lane 1
4 is
west
most
.
Lanes
1 -
3 e
nte
r I-
294 N
B.
Lane 1
is e
ast
most
. L
anes
4 -
6 e
xit
I-294 S
B.
Lane 6
is w
est
most
.
Lanes
51-5
3 e
xit
I-294 N
B.
Lane 5
3 is
west
most
.
Ma
inlin
e P
laza
La
ne
Nu
mb
er
No
tes
SO
UT
H /
EA
ST
NO
RT
H /
WE
ST
Pla
za b
uild
ing
loca
ted
on
ea
st s
ide
.
Pla
za b
uild
ing
loca
ted
on
so
uth
sid
e.
Se
rve
s N
B t
raff
ic o
nly
. P
laza
bu
ildin
g lo
cate
d o
n e
ast
sid
e.
Co
un
t
Au
tom
atic
Co
in M
ach
ine
La
ne
(A
CM
)
Ra
mp
Pla
zaL
an
e N
um
be
rN
ote
s
Pla
za b
uild
ing
loca
ted
on
ea
st s
ide
.
Ma
in p
laza
bu
ildin
g lo
cate
d o
n e
ast
sid
e.
SO
UT
H /
EA
ST
NO
RT
H /
WE
ST
Lanes
1 &
2 e
nte
r I-
94 N
B.
Lane 1
is e
ast
most
. L
anes
3 &
4 e
xit
I-94 S
B.
Lane 4
is w
est
most
.
Lanes
1 &
2 e
nte
r I-
94 N
B.
Lane 1
is e
ast
most
. L
anes
3 &
4 e
xit
I-94 S
B.
Lane 4
is w
est
most
.
Se
rve
s S
B t
raff
ic o
nly
. P
laza
bu
ildin
g lo
cate
d o
n w
est
sid
e.
Se
rve
s S
B t
raff
ic o
nly
. P
laza
bu
ildin
g lo
cate
d o
n w
est
sid
e.
Clo
sed
La
ne
/Oth
er
][ =
Ce
nte
r li
ne
/Ma
in l
ine
/\ =
Ch
an
ge
in M
ove
me
nt/
Dir
ect
ion
33
45
34 3 - -
I-P
AS
S O
nly
La
ne
(IP
O)
Sh
ou
lde
r
TR
I-S
TA
TE
T
OL
LW
AY
(I-
94
/I-2
94
)
PLA
ZA
LA
NE
CO
NF
IGU
RA
TIO
N A
S O
F 1
1-1
2-2
014
D-2

D-3
RE
AG
AN
ME
MO
RIA
L T
OLLW
AY
(I-
88)
P
LA
ZA
LA
NE
CO
NF
IGU
RA
TIO
N A
S O
F 1
1-1
2-2
014
No
.N
am
e][
51
Yo
rk R
oa
d][
51
52
53
54
55
56
75
74
73
72
71
52
Me
yers
Ro
ad
71
72
73
74
51
52
53
54
55
56
60
][
61
Au
rora
71
72
73
74
75
76
51
52
53
54
55
56
][6
16
26
36
46
56
68
18
28
38
48
58
6
66
De
Ka
lb7
17
27
35
15
25
35
4][
61
62
63
64
81
82
83
69
Dix
on
83
82
81
64
63
62
61
][5
45
35
25
17
37
27
1
No
.N
am
e
53
Sp
rin
g R
oa
d][
12
3
54
Illin
ois
Ro
ute
83
32
1][
55
Mid
we
st R
oa
d1
2][
56
Hig
hla
nd
Ave
nu
e4
3][
21
57
Na
pe
rvill
e R
oa
d1
23
][4
56
58
Win
field
Ro
ad
56
][8
7
59
Fa
rnsw
ort
h A
ven
ue
73
/\2
][5
1/\
4
60
Eo
la R
oa
d6
16
26
3][
53
52
51
63
Illin
ois
Ro
ute
31
2][
1
64
Orc
ha
rd R
oa
d3
4][
21
65
Pe
ace
Ro
ad
43
][2
1
67
An
nie
Glid
de
n R
oa
d1
2][
34
/\ =
Ch
an
ge
in M
ove
me
nt/
Dir
ect
ion
-
Clo
sed
La
ne
/Oth
er
I-P
AS
S O
nly
La
ne
(IP
O)
19
Au
tom
atic
Co
in M
ach
ine
La
ne
(A
CM
)2
2
La
ne
s 1
& 2
exi
t I-
88
WB
to
Pe
ace
Rd
. L
an
e 1
is n
ort
hm
ost
. L
an
es
3 &
4 e
nte
r I-
88
EB
fro
m
Pe
ace
Rd
. L
an
e 4
is s
ou
thm
ost
.
All
lan
es
en
ter
I-8
8 W
B f
rom
Sp
rin
g R
d.
La
ne
1 is
ea
stm
ost
.
All
lan
es
en
ter
I-8
8 E
B f
rom
IL
83
.
10
][ =
Ce
nte
r li
ne
/Ma
in l
ine
-
Ma
nu
al L
an
e T
oll
(ML
T)
28
Sh
ou
lde
r1
7
Co
un
t
Op
en
Ro
ad
To
llin
g L
an
es
(OR
T)
26
La
ne
s 3
& 4
exi
t I-
88
WB
to
An
nie
Glid
de
n R
d.
La
ne
s 1
& 2
en
ter
I-8
8 E
B f
rom
An
nie
Glid
de
n
Rd
.
All
lan
es
en
ter
I-8
8 E
B f
rom
Mid
we
st R
d.
La
ne
s 1
& 2
en
ter
I-8
8 W
B f
rom
Do
wn
ers
Dr.
L
an
e 1
is w
est
mo
st.
La
ne
s 3
& 4
exi
t I-
88
EB
to
Hig
hla
nd
Ave
. L
an
e 4
is s
ou
thm
ost
.
La
ne
s 1
& 2
en
ter
I-8
8 W
B f
rom
Orc
ha
rd R
d.
La
ne
2 is
no
rth
mo
st.
La
ne
s 3
& 4
exi
t I-
88
EB
to
Orc
ha
rd R
d.
La
ne
4 is
so
uth
mo
st.
La
ne
s 1
& 5
exi
t I-
88
WB
to
NB
Fa
rnsw
ort
h A
ve.
La
ne
2 e
nte
rs I
-88
EB
fro
m N
B F
arn
swo
rth
Ave
. L
an
es
3 a
nd
7 e
nte
r I-
88
EB
fro
m S
B F
arn
swo
rth
Ave
. L
an
e 4
exi
ts I
-88
WB
to
SB
Fa
rnsw
ort
h A
ve.
La
ne
1 e
nte
rs I
-88
WB
fro
m I
L 3
1.
La
ne
2 e
xits
I-8
8 E
B t
o I
L 3
1.
La
ne
s 4
& 5
en
ter
I-8
8 W
B f
rom
Na
pe
rvill
e R
d.
La
ne
s 2
& 3
exi
t I-
88
EB
to
Na
pe
rvill
e R
d.
La
ne
s 5
& 6
exi
t I-
88
EB
to
Win
field
Rd
. L
an
e 5
is s
ou
thm
ost
. L
an
es
7 &
8 e
nte
r I-
88
WB
fro
m
Win
field
Rd
. L
an
e 8
is c
lose
st t
o m
ain
line
.
La
ne
s 5
2 &
53
exi
t I-
88
WB
to
Bilt
er
Rd
. L
an
e 5
3 is
we
stm
ost
. L
an
es
62
& 6
3 e
nte
r I-
88
EB
fro
m D
ieh
l Rd
. L
an
e 6
3 is
we
stm
ost
.
EA
ST
WE
ST
Ma
inlin
e P
laza
La
ne
Nu
mb
er
No
tes
EA
ST
WE
ST
Pla
za b
uild
ing
loca
ted
on
so
uth
sid
e
Pla
za b
uild
ing
loca
ted
on
so
uth
sid
e
Pla
za b
uild
ing
loca
ted
on
no
rth
sid
e
Se
rve
s W
B t
raff
ic o
nly
. P
laza
bu
ildin
g lo
cate
d o
n n
ort
h s
ide
.
Se
rve
s E
B t
raff
ic o
nly
. P
laza
bu
ildin
g lo
cate
d o
n s
ou
th s
ide
.
Ra
mp
Pla
zaL
an
e N
um
be
rN
ote
s

D-4
VE
TE
RA
NS
ME
MO
RIA
L T
OLLW
AY
(I-
355)
P
LA
ZA
LA
NE
CO
NF
IGU
RA
TIO
N A
S O
F 1
1-1
2-2
014
No.
Nam
e][
73
Arm
y T
rail
71
72
73
74
75
76
51
52
53
54
55
][6
16
26
36
46
58
18
28
38
48
5
89
Bo
ug
hto
n R
oa
d7
17
27
37
47
57
65
15
25
35
45
5][
61
62
63
64
65
81
82
83
84
85
86
99
Sp
rin
g C
ree
k8
38
28
16
56
46
36
26
1][
55
54
53
52
51
73
72
71
No.
Nam
e
75
Nort
h A
ven
ue
65
4][
32
1
77
Roo
seve
lt R
oa
d1
2][
34
79
Bu
tte
rfie
ld R
oa
d1
2][
34
81
Og
de
n A
ven
ue
12
][3
4
83
Ma
ple
Ave
nu
e1
23
][4
56
85
63
rd S
tre
et
65
4][
32
1
87
75
th S
tre
et
65
4][
32
1
90
Bo
ug
hto
n R
oa
d1
2][
34
93
12
7th
Str
ee
t1
2][
34
95
Arc
he
r A
ven
ue
12
][3
4
97
15
9th
Str
ee
t1
2][
34
10
1U
.S.
Rou
te 6
34
][1
2
Op
en
Ro
ad
To
llin
g L
an
es
(OR
T)
Ma
nu
al L
an
e T
oll
(ML
T)
20
Sh
ou
lde
r1
2
18
/\ =
Cha
ng
e in
Mo
vem
en
t/D
ire
ctio
n-
Clo
sed
La
ne
/Oth
er
I-P
AS
S O
nly
La
ne
(IP
O)
37
Au
tom
atic
Co
in M
ach
ine
La
ne
(A
CM
)2
4 4
][ =
Cen
ter
lin
e/M
ain
lin
e-
La
ne
s 3
& 4
en
ter
I-3
55
SB
fro
m R
ou
te 6
. L
an
es
1 &
2 e
xit
I-3
55
NB
to
US
6.
La
ne
s 1
- 3
exi
t I-
35
5 S
B t
o M
ap
le A
ve.
La
ne
1 is
we
stm
ost
. L
an
es
4 -
6 e
nte
r I-
35
5 f
rom
Ma
ple
Ave
. L
an
e 6
is e
ast
mo
st.
La
ne
s 1
-3
en
ter
I-3
55
NB
fro
m 6
3rd
St.
L
an
e 1
is e
ast
mo
st.
La
ne
s 4
-6
exi
t I-
35
5 S
B t
o 6
3rd
St.
L
an
e 6
is w
est
mo
st.
La
ne
s 1
-3
en
ter
I-3
55
NB
fro
m 7
5th
St.
L
an
e 1
is e
ast
mo
st.
La
ne
s 4
-6
exi
t I-
35
5 S
B t
o 7
5th
St.
L
an
e 6
is w
est
mo
st.
La
ne
s 1
& 2
en
ter
I-3
55
SB
fro
m B
ou
gh
ton
Rd
. L
an
es
3 &
4 e
xit
I-3
55
NB
to
Bo
ug
hto
n R
d.
Pla
za b
uild
ing
loca
ted
on
we
st s
ide
.
Pla
za b
uild
ing
loca
ted
on
we
st s
ide
.
Ram
p P
laza
Cou
nt
La
ne
s 1
- 3
exi
t I-
35
5 N
B t
o N
ort
h A
ve.
La
ne
1 is
ea
stm
ost
.
La
ne
s 1
& 2
en
ter
I-3
55
SB
fro
m R
oo
seve
lt R
d.
La
ne
1 is
clo
sest
to
co
ntr
ol b
uild
ing
(we
stm
ost
).
La
ne
s 3
& 4
exi
t I-
35
5 N
B t
o R
oo
seve
lt R
d.
La
ne
4 is
ea
stm
ost
.
La
ne
s 1
& 2
en
ter
I-3
55
SB
fro
m B
utt
erf
ield
Rd
. L
an
e 1
is c
lose
st t
o c
on
tro
l bu
ildin
g
(we
stm
ost
).
La
ne
s 3
& 4
exi
t I-
35
5 N
B.
La
ne
4 is
ea
stm
ost
.
La
ne
s 1
& 2
exi
t I-
88
EB
to
Og
de
n A
ve.
La
ne
1 is
we
stm
ost
. L
an
es
3 &
4 e
nte
r I-
88
WB
fro
m
Og
de
n A
ve.
La
ne
4 is
ea
stm
ost
.
La
ne
Nu
mb
er
Note
s
SO
UT
HN
OR
TH
Pla
za b
uild
ing
loca
ted
on
ea
st s
ide
.
La
ne
s 3
& 4
en
ter
I-3
55
NB
fro
m 1
27
th S
t.
La
ne
s 1
& 2
exi
t I-
35
5 S
B t
o 1
27
th S
t.
La
ne
s 3
& 4
en
ter
I-3
55
NB
fro
m A
rch
er
Ave
. L
an
es
1 &
2 e
xit
I-3
55
SB
to
Arc
he
r A
ve.
La
ne
s 3
& 4
en
ter
I-3
55
NB
fro
m I
L 7
. L
an
es
1 &
2 e
xit
I-3
55
SB
to
IL
7.
Ma
inlin
e P
laza
La
ne
Nu
mb
er
Note
s
SO
UT
HN
OR
TH


Related Documents


