Yara Fertilizer Industry Handbook February 2014

Welcome message from author
This document is posted to help you gain knowledge. Please leave a comment to let me know what you think about it! Share it to your friends and learn new things together.
Transcript

Yara Fertilizer Industry Handbook February 2014
1
Yara Fertilizer Industry Handbook
This handbook describes the fertilizer industry and in particular the nitrogen part which isthe most relevant for Yara International.
The document does not describe Yara or its strategies. For information on Yara-specificissues please see the Capital Markets Day presentations.
Fertilizers are essential plant nutrients that are applied to a crop to achieve optimal yieldand quality. The following slides describe the value and characteristics of fertilizers inmodern food production.
2
3
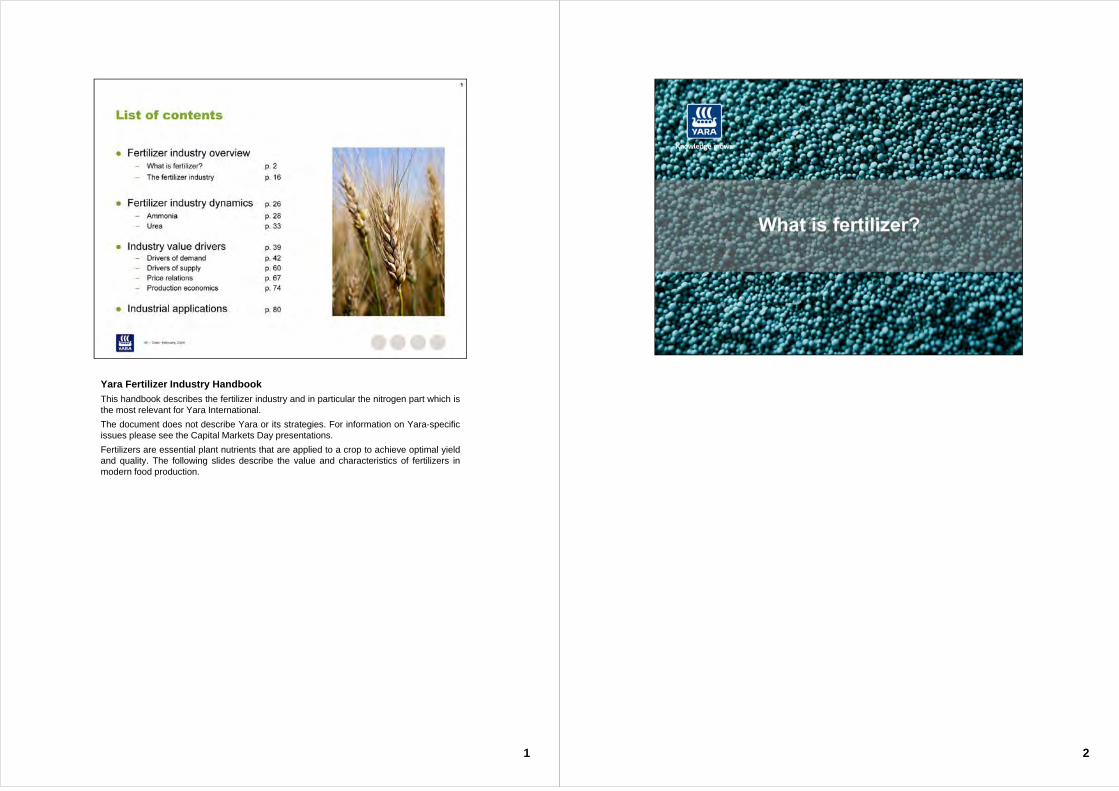
The law of minimum
The ‘law of minimum’ is often illustrated with a water barrel, with staves of differentlengths. The barrel`s capacity to hold water is determined by the shortest stave.Similarly, crop yields are frequently limited by shortages of nutrients or water. Once thelimiting factor (constraint) has been corrected, yield will increase until the next limitingfactor is encountered.
Nutrients are classified into three sub-groups based on plant growth needs. These are:
• Macro or primary nutrients: nitrogen (N), phosphorus (P), potassium (K)
• Major or secondary nutrients: calcium (Ca), magnesium (Mg) and sulphur (S)
• Micro nutrients or trace elements: chlorine (Cl), iron (Fe), manganese (Mn),boron (B), selenium (Se), zinc (Zn), copper (Cu), molybdenum (Mo) etc.
Yield responses to nitrogen are frequently observed, as nitrogen is often a limiting factorto crop production, but not the only factor. Balanced nutrition is used to obtain maximumyield and avoid shortages of nutrients.
4
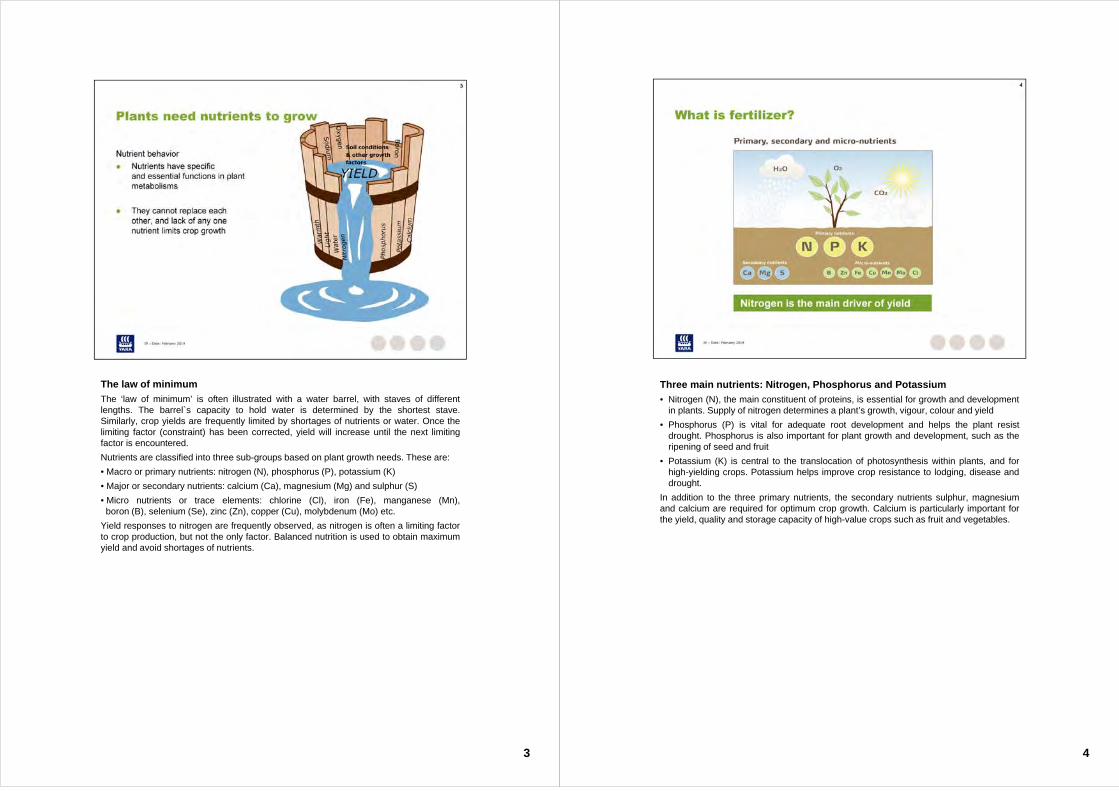
Three main nutrients: Nitrogen, Phosphorus and Potassium
• Nitrogen (N), the main constituent of proteins, is essential for growth and developmentin plants. Supply of nitrogen determines a plant’s growth, vigour, colour and yield
• Phosphorus (P) is vital for adequate root development and helps the plant resistdrought. Phosphorus is also important for plant growth and development, such as theripening of seed and fruit
• Potassium (K) is central to the translocation of photosynthesis within plants, and forhigh-yielding crops. Potassium helps improve crop resistance to lodging, disease anddrought.
In addition to the three primary nutrients, the secondary nutrients sulphur, magnesiumand calcium are required for optimum crop growth. Calcium is particularly important forthe yield, quality and storage capacity of high-value crops such as fruit and vegetables.
5
Nutrients are depleted with the harvest
As crops take up nutrients from the soil, a substantial proportion of these nutrients areremoved from the field when the crops are harvested. While some nutrients can bereturned to the field through crop residues and other organic matter, this alone cannotprovide optimum fertilization and crop yields over time.
Mineral fertilizers can provide an optimal nutrient balance, tailored to the demands of thespecific crop, soil and climate conditions, maximising crop yield and quality whilst alsominimizing environmental impacts.
6
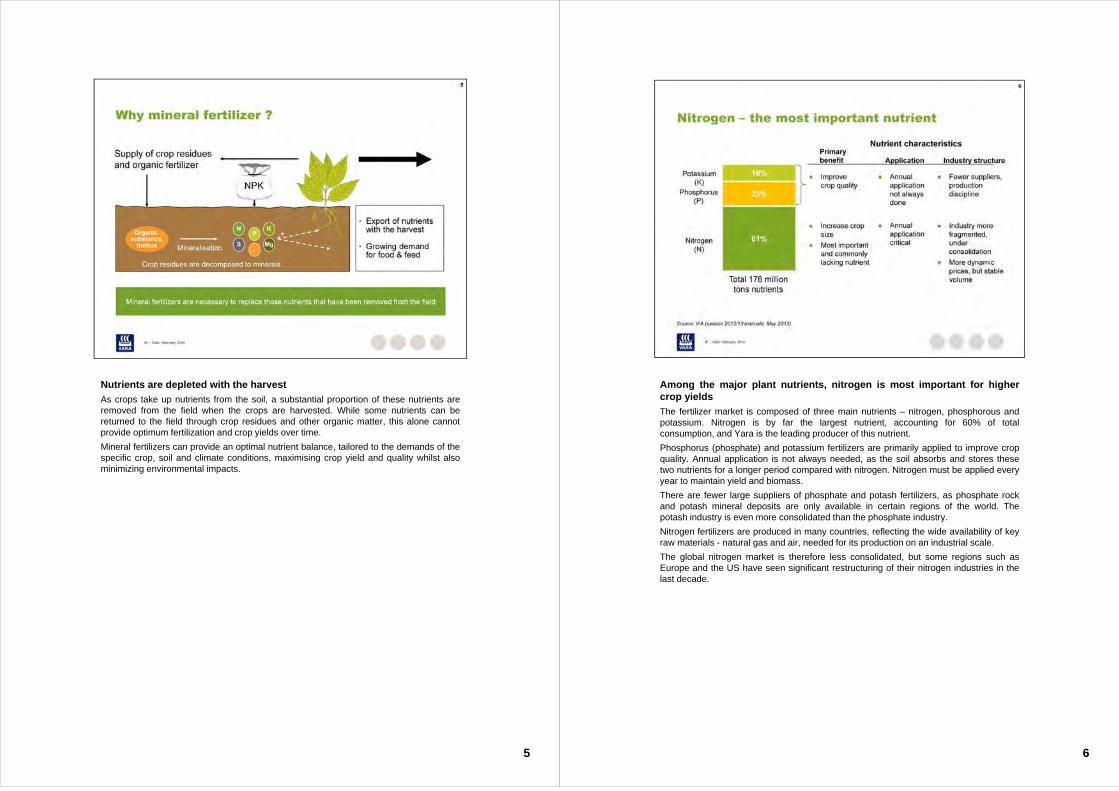
Among the major plant nutrients, nitrogen is most important for highercrop yields
The fertilizer market is composed of three main nutrients – nitrogen, phosphorous andpotassium. Nitrogen is by far the largest nutrient, accounting for 60% of totalconsumption, and Yara is the leading producer of this nutrient.
Phosphorus (phosphate) and potassium fertilizers are primarily applied to improve cropquality. Annual application is not always needed, as the soil absorbs and stores thesetwo nutrients for a longer period compared with nitrogen. Nitrogen must be applied everyyear to maintain yield and biomass.
There are fewer large suppliers of phosphate and potash fertilizers, as phosphate rockand potash mineral deposits are only available in certain regions of the world. Thepotash industry is even more consolidated than the phosphate industry.
Nitrogen fertilizers are produced in many countries, reflecting the wide availability of keyraw materials - natural gas and air, needed for its production on an industrial scale.
The global nitrogen market is therefore less consolidated, but some regions such asEurope and the US have seen significant restructuring of their nitrogen industries in thelast decade.
7
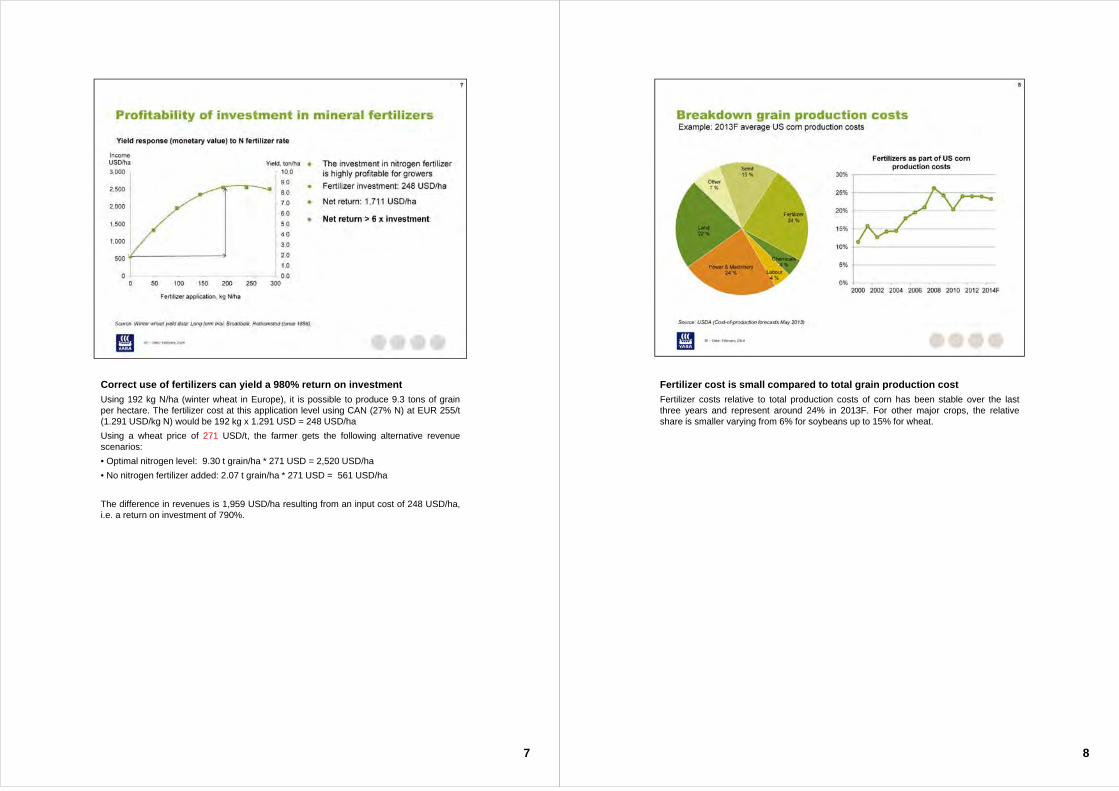
Correct use of fertilizers can yield a 980% return on investment
Using 192 kg N/ha (winter wheat in Europe), it is possible to produce 9.3 tons of grainper hectare. The fertilizer cost at this application level using CAN (27% N) at EUR 255/t(1.291 USD/kg N) would be 192 kg x 1.291 USD = 248 USD/ha
Using a wheat price of 271 USD/t, the farmer gets the following alternative revenuescenarios:
• Optimal nitrogen level: 9.30 t grain/ha * 271 USD = 2,520 USD/ha
• No nitrogen fertilizer added: 2.07 t grain/ha * 271 USD = 561 USD/ha
The difference in revenues is 1,959 USD/ha resulting from an input cost of 248 USD/ha,i.e. a return on investment of 790%.
8
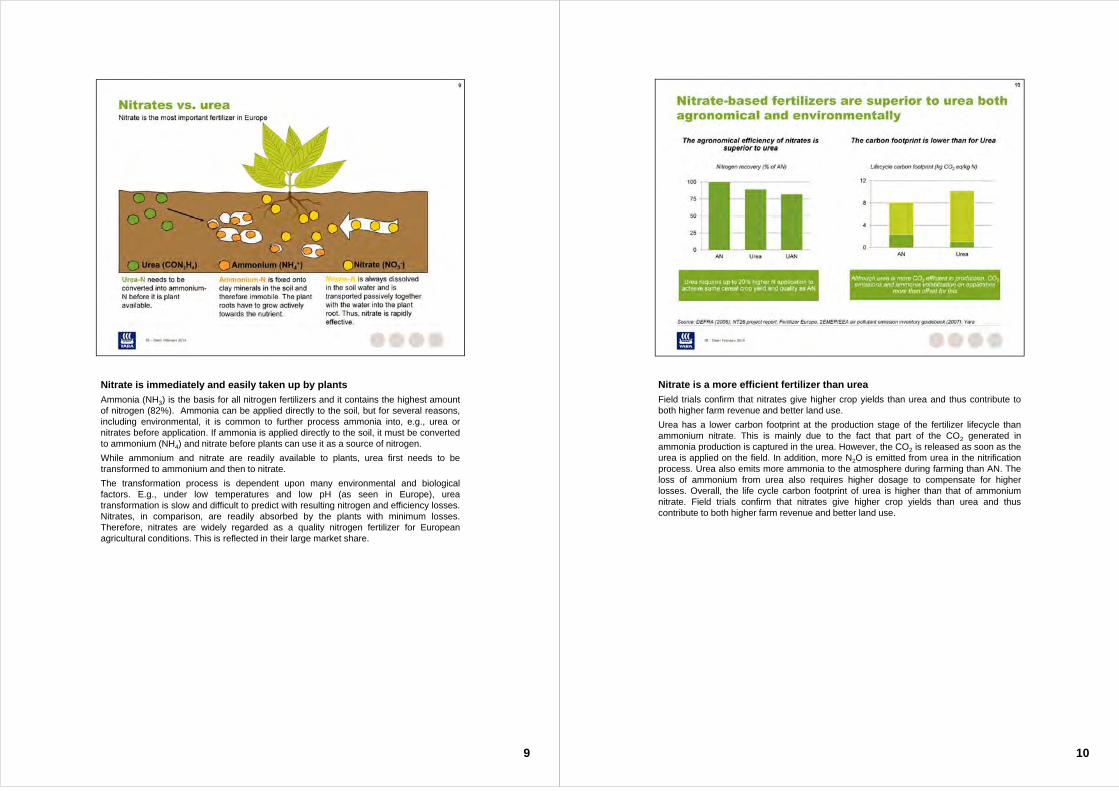
Fertilizer cost is small compared to total grain production cost
Fertilizer costs relative to total production costs of corn has been stable over the lastthree years and represent around 24% in 2013F. For other major crops, the relativeshare is smaller varying from 6% for soybeans up to 15% for wheat.
9
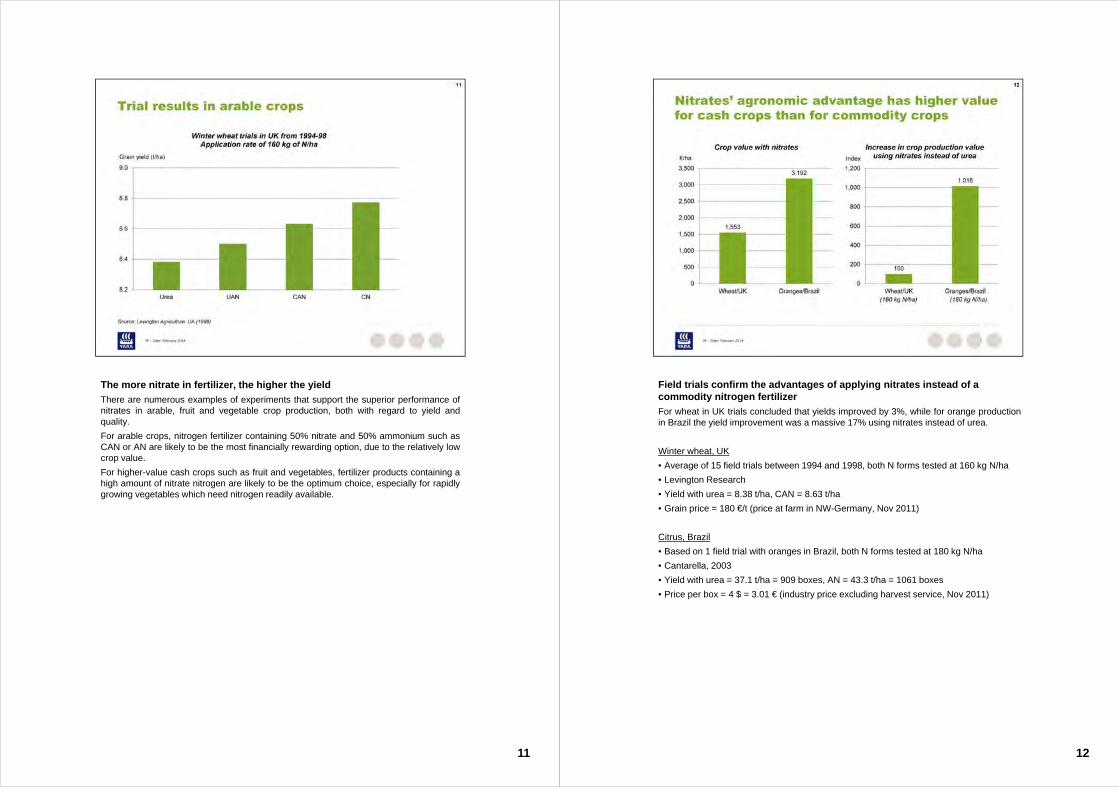
Nitrate is immediately and easily taken up by plants
Ammonia (NH3) is the basis for all nitrogen fertilizers and it contains the highest amountof nitrogen (82%). Ammonia can be applied directly to the soil, but for several reasons,including environmental, it is common to further process ammonia into, e.g., urea ornitrates before application. If ammonia is applied directly to the soil, it must be convertedto ammonium (NH4) and nitrate before plants can use it as a source of nitrogen.
While ammonium and nitrate are readily available to plants, urea first needs to betransformed to ammonium and then to nitrate.
The transformation process is dependent upon many environmental and biologicalfactors. E.g., under low temperatures and low pH (as seen in Europe), ureatransformation is slow and difficult to predict with resulting nitrogen and efficiency losses.Nitrates, in comparison, are readily absorbed by the plants with minimum losses.Therefore, nitrates are widely regarded as a quality nitrogen fertilizer for Europeanagricultural conditions. This is reflected in their large market share.
10
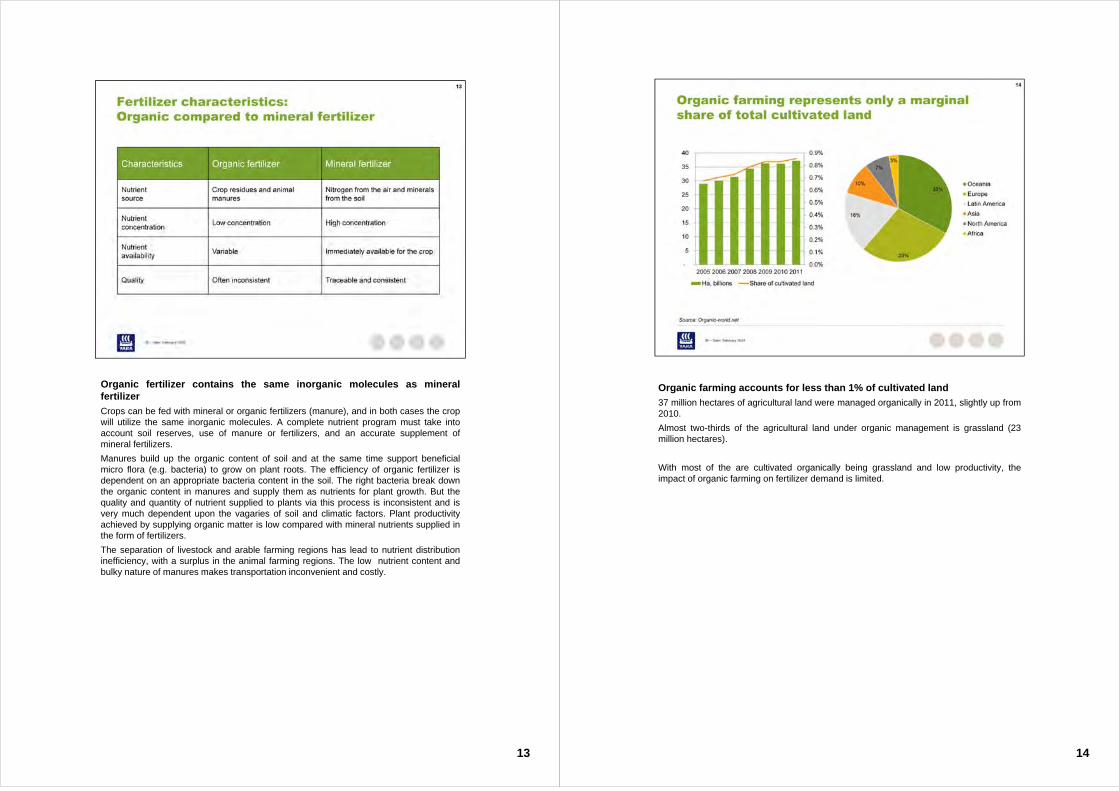
Nitrate is a more efficient fertilizer than urea
Field trials confirm that nitrates give higher crop yields than urea and thus contribute toboth higher farm revenue and better land use.
Urea has a lower carbon footprint at the production stage of the fertilizer lifecycle thanammonium nitrate. This is mainly due to the fact that part of the CO2 generated inammonia production is captured in the urea. However, the CO2 is released as soon as theurea is applied on the field. In addition, more N2O is emitted from urea in the nitrificationprocess. Urea also emits more ammonia to the atmosphere during farming than AN. Theloss of ammonium from urea also requires higher dosage to compensate for higherlosses. Overall, the life cycle carbon footprint of urea is higher than that of ammoniumnitrate. Field trials confirm that nitrates give higher crop yields than urea and thuscontribute to both higher farm revenue and better land use.
11
The more nitrate in fertilizer, the higher the yield
There are numerous examples of experiments that support the superior performance ofnitrates in arable, fruit and vegetable crop production, both with regard to yield andquality.
For arable crops, nitrogen fertilizer containing 50% nitrate and 50% ammonium such asCAN or AN are likely to be the most financially rewarding option, due to the relatively lowcrop value.
For higher-value cash crops such as fruit and vegetables, fertilizer products containing ahigh amount of nitrate nitrogen are likely to be the optimum choice, especially for rapidlygrowing vegetables which need nitrogen readily available.
Field trials confirm the advantages of applying nitrates instead of a commodity nitrogen fertilizer
For wheat in UK trials concluded that yields improved by 3%, while for orange productionin Brazil the yield improvement was a massive 17% using nitrates instead of urea.
Winter wheat, UK
• Average of 15 field trials between 1994 and 1998, both N forms tested at 160 kg N/ha
• Levington Research
• Yield with urea = 8.38 t/ha, CAN = 8.63 t/ha
• Grain price = 180 €/t (price at farm in NW-Germany, Nov 2011)
Citrus, Brazil
• Based on 1 field trial with oranges in Brazil, both N forms tested at 180 kg N/ha
• Cantarella, 2003
• Yield with urea = 37.1 t/ha = 909 boxes, AN = 43.3 t/ha = 1061 boxes
• Price per box = 4 $ = 3.01 € (industry price excluding harvest service, Nov 2011)
12
13
Organic fertilizer contains the same inorganic molecules as mineralfertilizer
Crops can be fed with mineral or organic fertilizers (manure), and in both cases the cropwill utilize the same inorganic molecules. A complete nutrient program must take intoaccount soil reserves, use of manure or fertilizers, and an accurate supplement ofmineral fertilizers.
Manures build up the organic content of soil and at the same time support beneficialmicro flora (e.g. bacteria) to grow on plant roots. The efficiency of organic fertilizer isdependent on an appropriate bacteria content in the soil. The right bacteria break downthe organic content in manures and supply them as nutrients for plant growth. But thequality and quantity of nutrient supplied to plants via this process is inconsistent and isvery much dependent upon the vagaries of soil and climatic factors. Plant productivityachieved by supplying organic matter is low compared with mineral nutrients supplied inthe form of fertilizers.
The separation of livestock and arable farming regions has lead to nutrient distributioninefficiency, with a surplus in the animal farming regions. The low nutrient content andbulky nature of manures makes transportation inconvenient and costly.
14
Organic farming accounts for less than 1% of cultivated land
37 million hectares of agricultural land were managed organically in 2011, slightly up from2010.
Almost two-thirds of the agricultural land under organic management is grassland (23million hectares).
With most of the are cultivated organically being grassland and low productivity, theimpact of organic farming on fertilizer demand is limited.
15
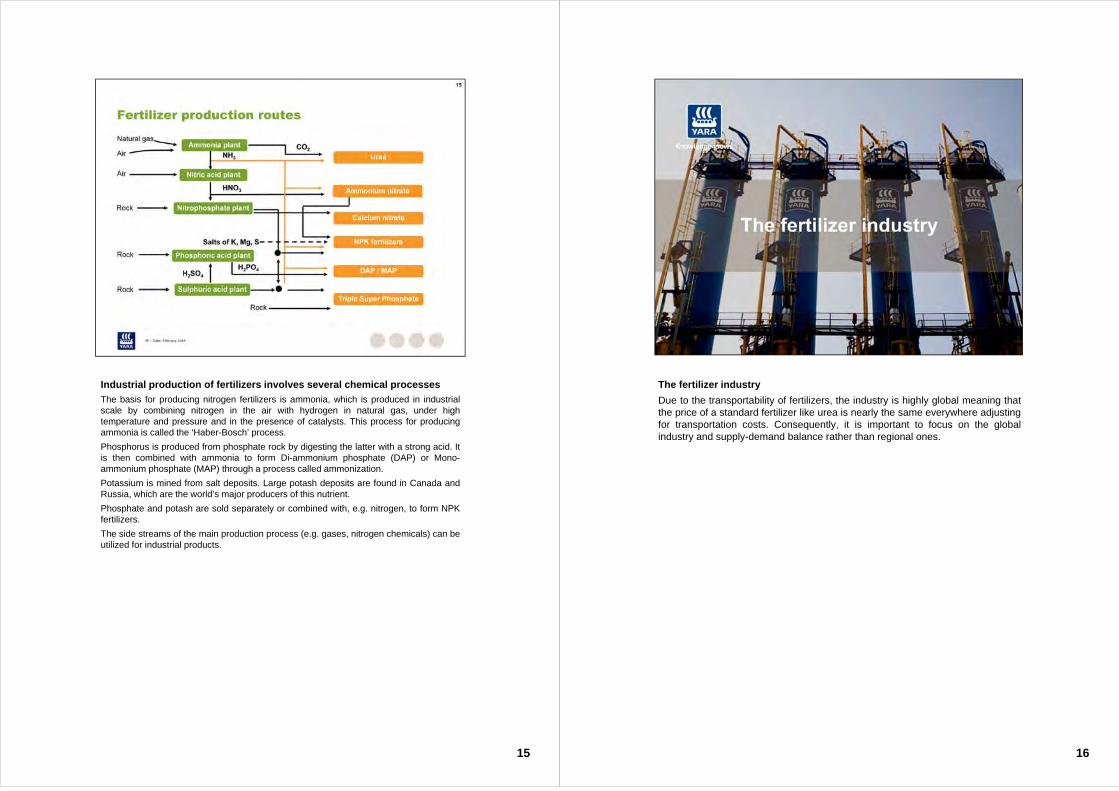
Industrial production of fertilizers involves several chemical processes
The basis for producing nitrogen fertilizers is ammonia, which is produced in industrialscale by combining nitrogen in the air with hydrogen in natural gas, under hightemperature and pressure and in the presence of catalysts. This process for producingammonia is called the ‘Haber-Bosch’ process.
Phosphorus is produced from phosphate rock by digesting the latter with a strong acid. Itis then combined with ammonia to form Di-ammonium phosphate (DAP) or Mono-ammonium phosphate (MAP) through a process called ammonization.
Potassium is mined from salt deposits. Large potash deposits are found in Canada andRussia, which are the world’s major producers of this nutrient.
Phosphate and potash are sold separately or combined with, e.g. nitrogen, to form NPKfertilizers.
The side streams of the main production process (e.g. gases, nitrogen chemicals) can beutilized for industrial products.
The fertilizer industry
Due to the transportability of fertilizers, the industry is highly global meaning thatthe price of a standard fertilizer like urea is nearly the same everywhere adjustingfor transportation costs. Consequently, it is important to focus on the globalindustry and supply-demand balance rather than regional ones.
16
17
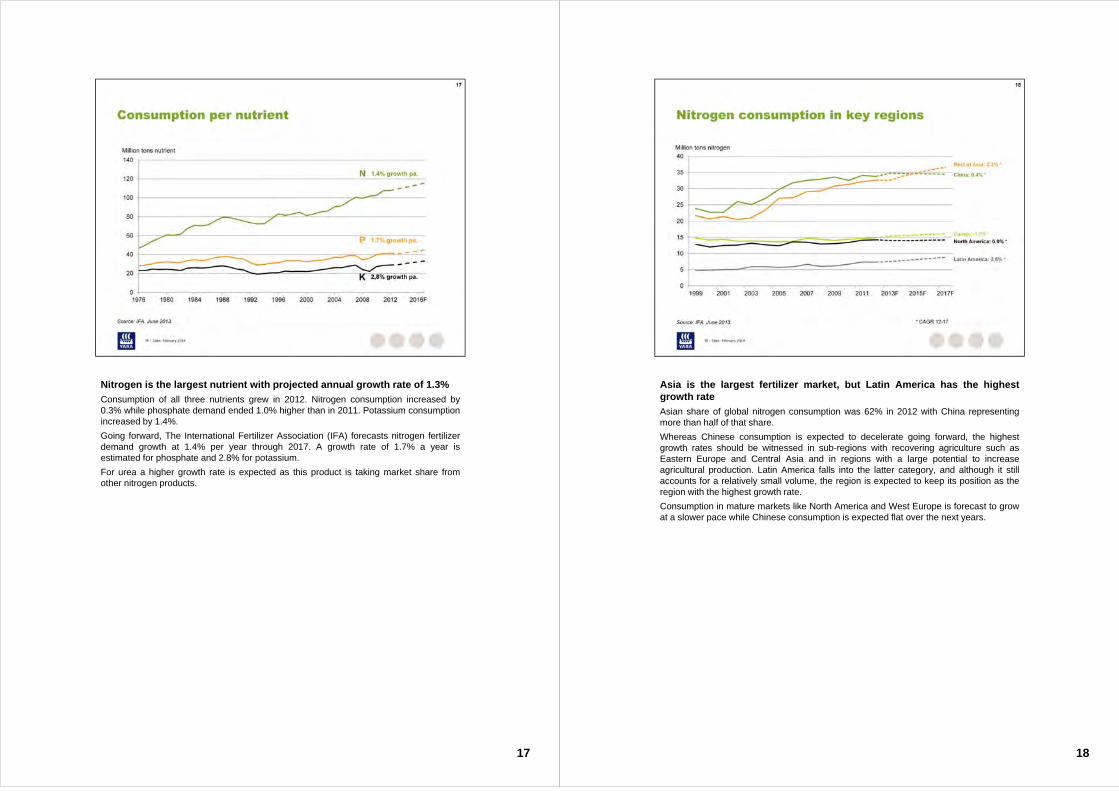
Nitrogen is the largest nutrient with projected annual growth rate of 1.3%
Consumption of all three nutrients grew in 2012. Nitrogen consumption increased by0.3% while phosphate demand ended 1.0% higher than in 2011. Potassium consumptionincreased by 1.4%.
Going forward, The International Fertilizer Association (IFA) forecasts nitrogen fertilizerdemand growth at 1.4% per year through 2017. A growth rate of 1.7% a year isestimated for phosphate and 2.8% for potassium.
For urea a higher growth rate is expected as this product is taking market share fromother nitrogen products.
18
Asia is the largest fertilizer market, but Latin America has the highestgrowth rate
Asian share of global nitrogen consumption was 62% in 2012 with China representingmore than half of that share.
Whereas Chinese consumption is expected to decelerate going forward, the highestgrowth rates should be witnessed in sub-regions with recovering agriculture such asEastern Europe and Central Asia and in regions with a large potential to increaseagricultural production. Latin America falls into the latter category, and although it stillaccounts for a relatively small volume, the region is expected to keep its position as theregion with the highest growth rate.
Consumption in mature markets like North America and West Europe is forecast to growat a slower pace while Chinese consumption is expected flat over the next years.
19
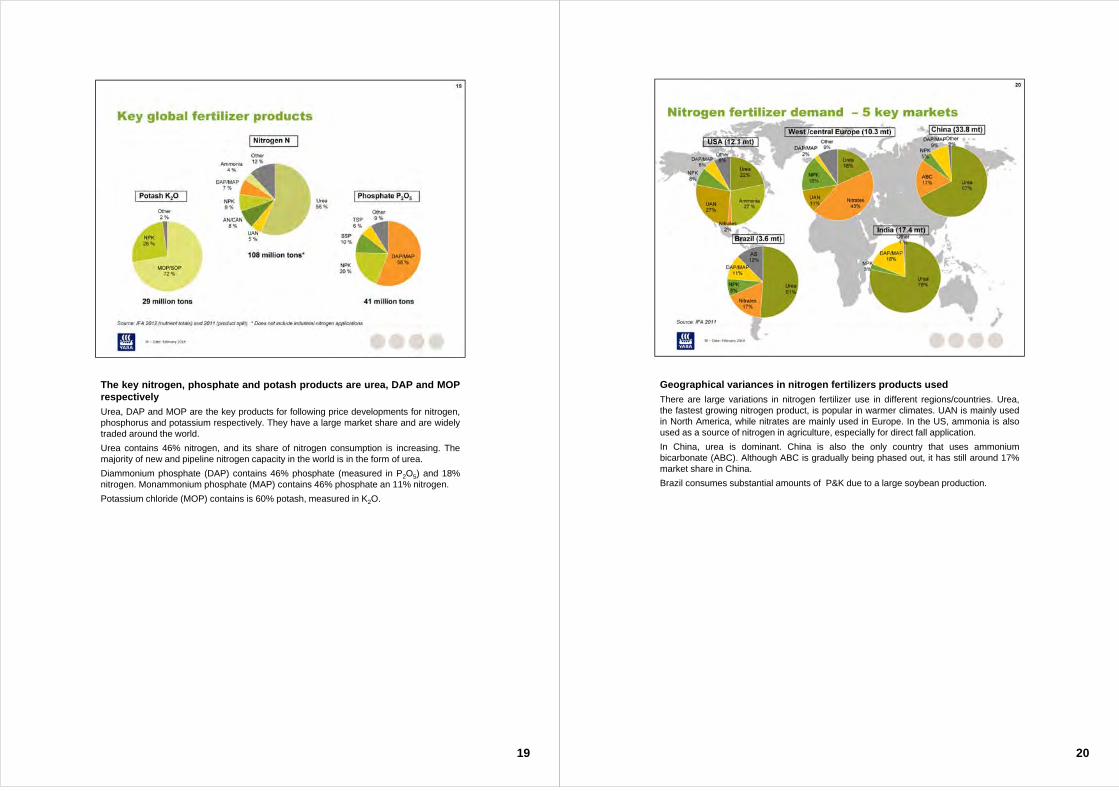
The key nitrogen, phosphate and potash products are urea, DAP and MOPrespectively
Urea, DAP and MOP are the key products for following price developments for nitrogen,phosphorus and potassium respectively. They have a large market share and are widelytraded around the world.
Urea contains 46% nitrogen, and its share of nitrogen consumption is increasing. Themajority of new and pipeline nitrogen capacity in the world is in the form of urea.
Diammonium phosphate (DAP) contains 46% phosphate (measured in P2O5) and 18%nitrogen. Monammonium phosphate (MAP) contains 46% phosphate an 11% nitrogen.
Potassium chloride (MOP) contains is 60% potash, measured in K2O.
20
Geographical variances in nitrogen fertilizers products used
There are large variations in nitrogen fertilizer use in different regions/countries. Urea,the fastest growing nitrogen product, is popular in warmer climates. UAN is mainly usedin North America, while nitrates are mainly used in Europe. In the US, ammonia is alsoused as a source of nitrogen in agriculture, especially for direct fall application.
In China, urea is dominant. China is also the only country that uses ammoniumbicarbonate (ABC). Although ABC is gradually being phased out, it has still around 17%market share in China.
Brazil consumes substantial amounts of P&K due to a large soybean production.
21
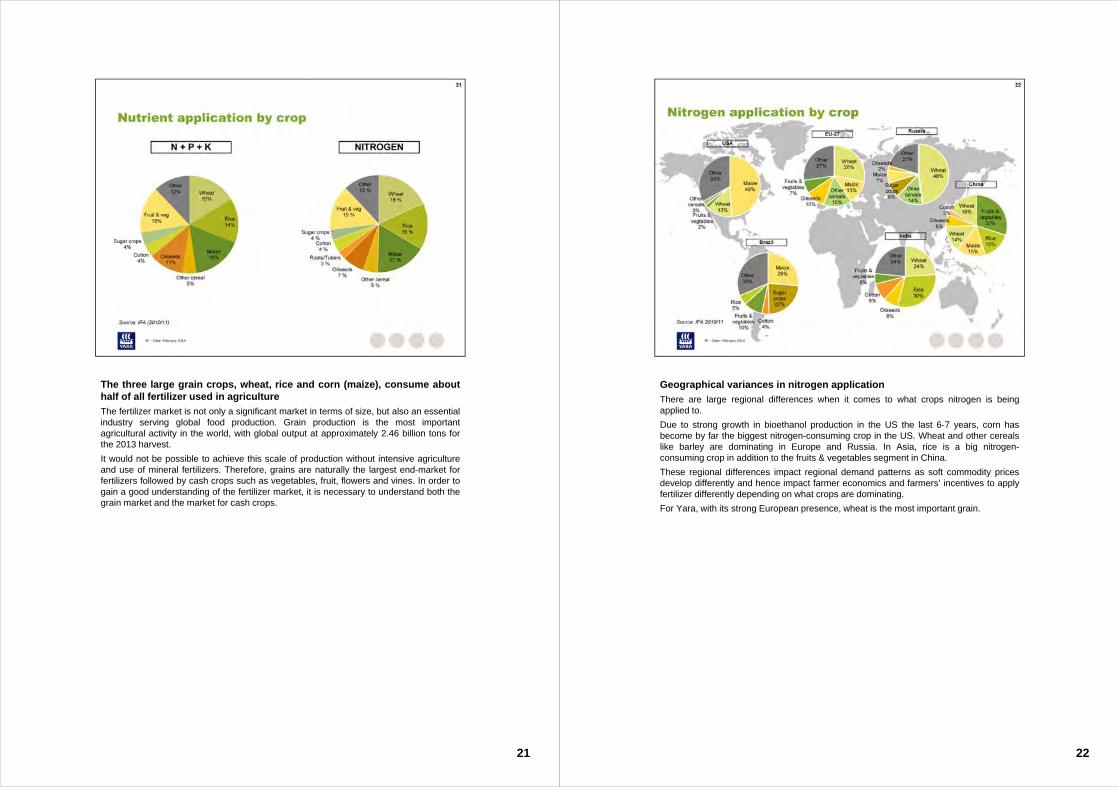
The three large grain crops, wheat, rice and corn (maize), consume abouthalf of all fertilizer used in agriculture
The fertilizer market is not only a significant market in terms of size, but also an essentialindustry serving global food production. Grain production is the most importantagricultural activity in the world, with global output at approximately 2.46 billion tons forthe 2013 harvest.
It would not be possible to achieve this scale of production without intensive agricultureand use of mineral fertilizers. Therefore, grains are naturally the largest end-market forfertilizers followed by cash crops such as vegetables, fruit, flowers and vines. In order togain a good understanding of the fertilizer market, it is necessary to understand both thegrain market and the market for cash crops.
22
Geographical variances in nitrogen application
There are large regional differences when it comes to what crops nitrogen is beingapplied to.
Due to strong growth in bioethanol production in the US the last 6-7 years, corn hasbecome by far the biggest nitrogen-consuming crop in the US. Wheat and other cerealslike barley are dominating in Europe and Russia. In Asia, rice is a big nitrogen-consuming crop in addition to the fruits & vegetables segment in China.
These regional differences impact regional demand patterns as soft commodity pricesdevelop differently and hence impact farmer economics and farmers’ incentives to applyfertilizer differently depending on what crops are dominating.
For Yara, with its strong European presence, wheat is the most important grain.
23
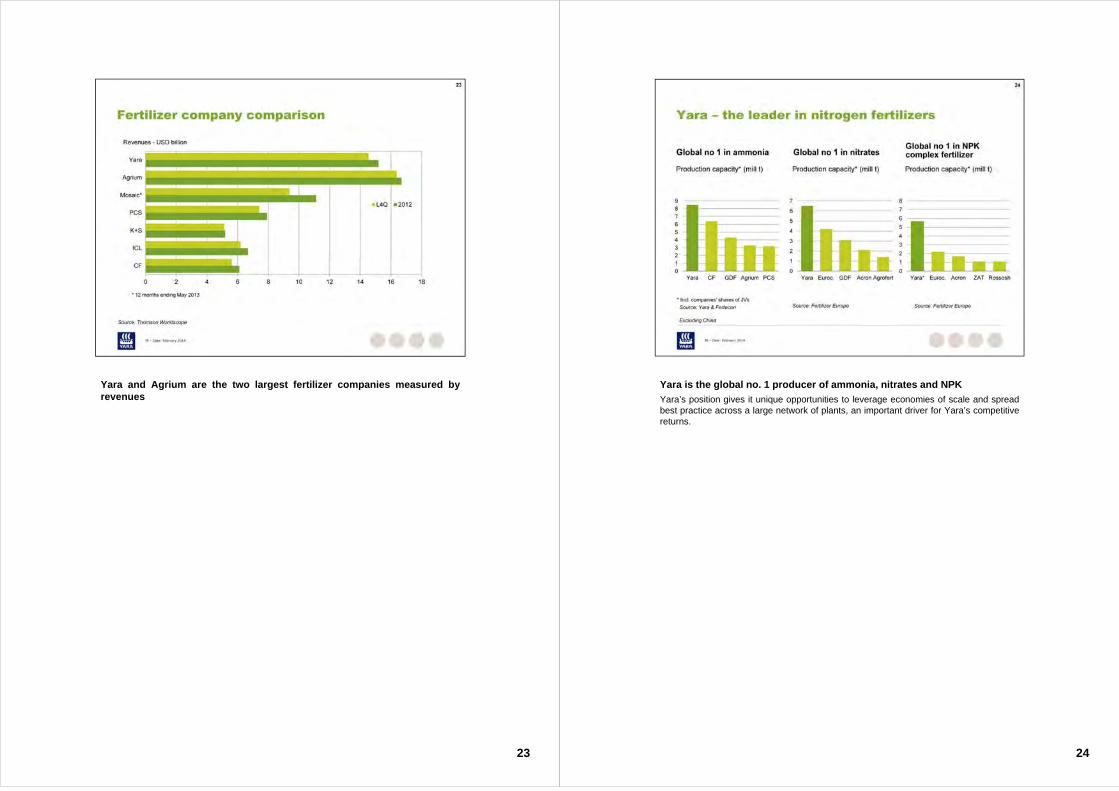
Yara and Agrium are the two largest fertilizer companies measured byrevenues
24
Yara is the global no. 1 producer of ammonia, nitrates and NPK
Yara’s position gives it unique opportunities to leverage economies of scale and spreadbest practice across a large network of plants, an important driver for Yara’s competitivereturns.
25
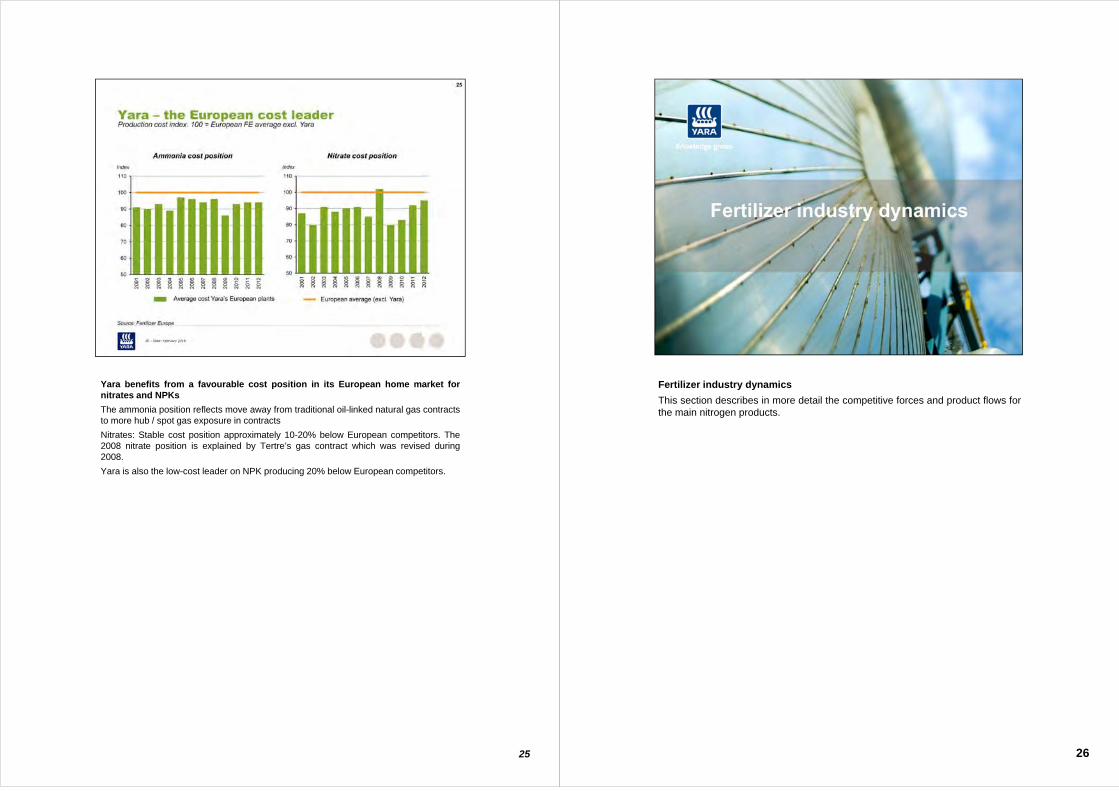
Yara benefits from a favourable cost position in its European home market fornitrates and NPKs
The ammonia position reflects move away from traditional oil-linked natural gas contractsto more hub / spot gas exposure in contracts
Nitrates: Stable cost position approximately 10-20% below European competitors. The2008 nitrate position is explained by Tertre’s gas contract which was revised during2008.
Yara is also the low-cost leader on NPK producing 20% below European competitors.
Fertilizer industry dynamics
This section describes in more detail the competitive forces and product flows forthe main nitrogen products.
26
27
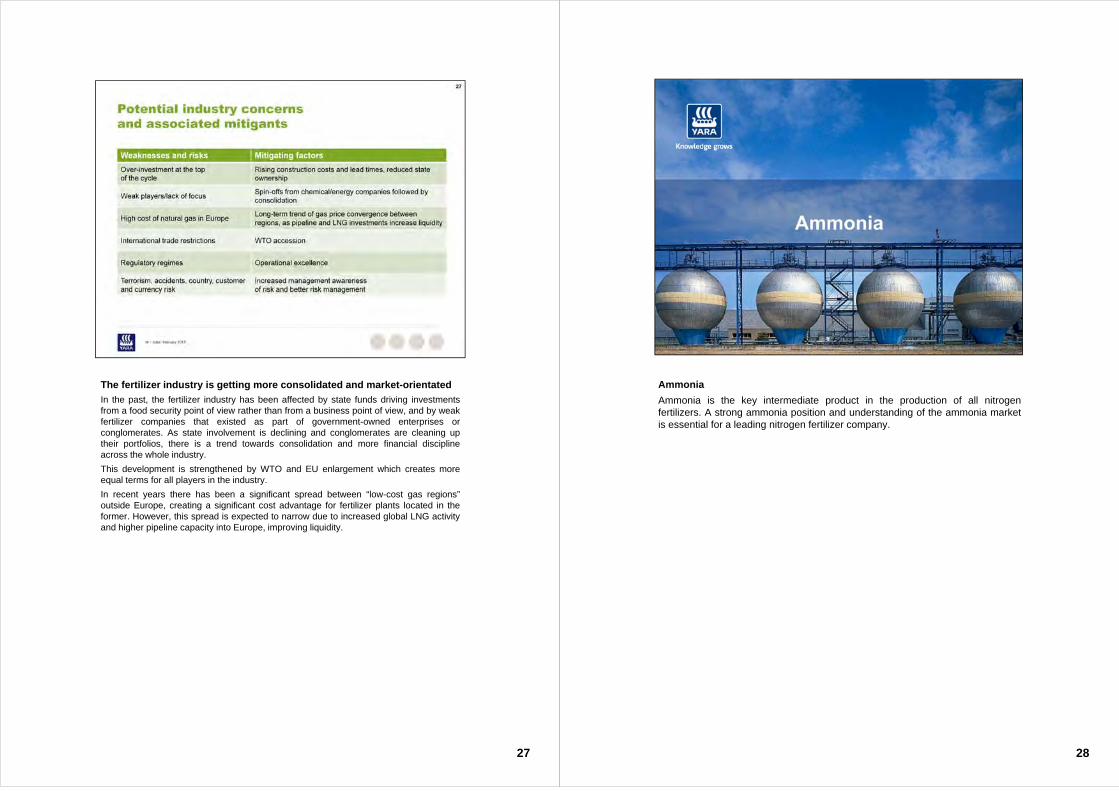
The fertilizer industry is getting more consolidated and market-orientated
In the past, the fertilizer industry has been affected by state funds driving investmentsfrom a food security point of view rather than from a business point of view, and by weakfertilizer companies that existed as part of government-owned enterprises orconglomerates. As state involvement is declining and conglomerates are cleaning uptheir portfolios, there is a trend towards consolidation and more financial disciplineacross the whole industry.
This development is strengthened by WTO and EU enlargement which creates moreequal terms for all players in the industry.
In recent years there has been a significant spread between “low-cost gas regions”outside Europe, creating a significant cost advantage for fertilizer plants located in theformer. However, this spread is expected to narrow due to increased global LNG activityand higher pipeline capacity into Europe, improving liquidity.
Ammonia
Ammonia is the key intermediate product in the production of all nitrogenfertilizers. A strong ammonia position and understanding of the ammonia marketis essential for a leading nitrogen fertilizer company.
28
29
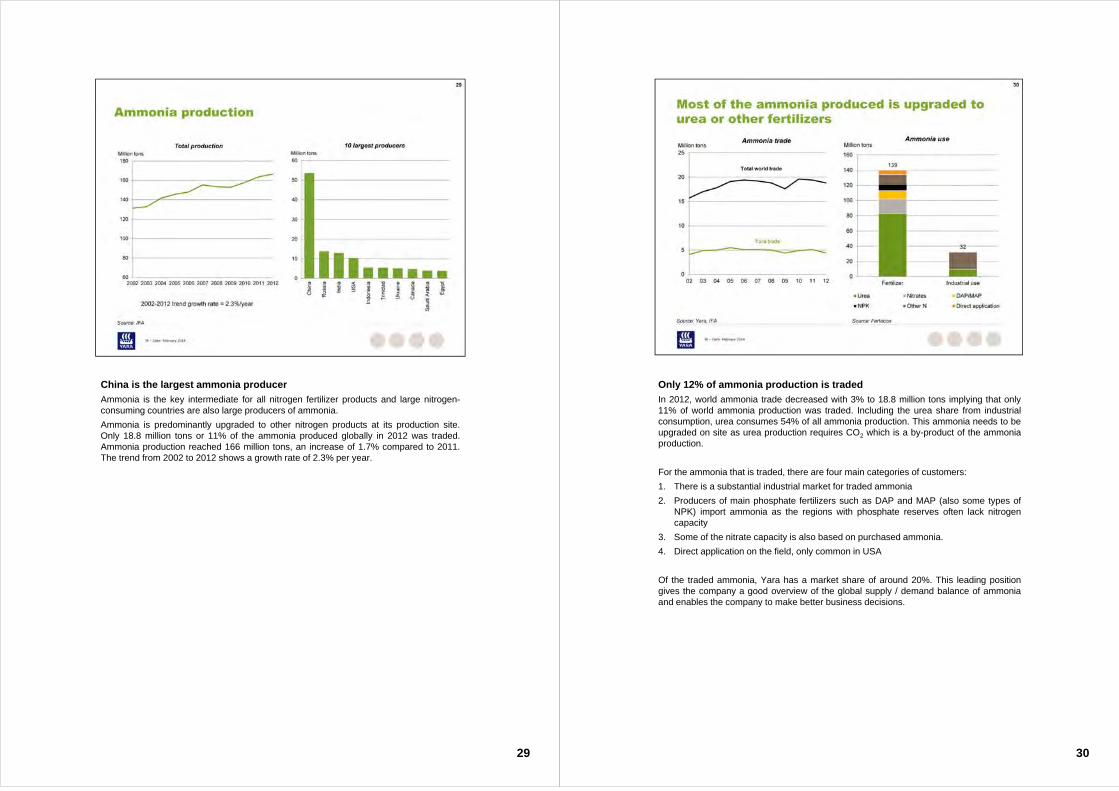
China is the largest ammonia producer
Ammonia is the key intermediate for all nitrogen fertilizer products and large nitrogen-consuming countries are also large producers of ammonia.
Ammonia is predominantly upgraded to other nitrogen products at its production site.Only 18.8 million tons or 11% of the ammonia produced globally in 2012 was traded.Ammonia production reached 166 million tons, an increase of 1.7% compared to 2011.The trend from 2002 to 2012 shows a growth rate of 2.3% per year.
Only 12% of ammonia production is traded
In 2012, world ammonia trade decreased with 3% to 18.8 million tons implying that only11% of world ammonia production was traded. Including the urea share from industrialconsumption, urea consumes 54% of all ammonia production. This ammonia needs to beupgraded on site as urea production requires CO2 which is a by-product of the ammoniaproduction.
For the ammonia that is traded, there are four main categories of customers:
1. There is a substantial industrial market for traded ammonia
2. Producers of main phosphate fertilizers such as DAP and MAP (also some types ofNPK) import ammonia as the regions with phosphate reserves often lack nitrogencapacity
3. Some of the nitrate capacity is also based on purchased ammonia.
4. Direct application on the field, only common in USA
Of the traded ammonia, Yara has a market share of around 20%. This leading positiongives the company a good overview of the global supply / demand balance of ammoniaand enables the company to make better business decisions.
30
31
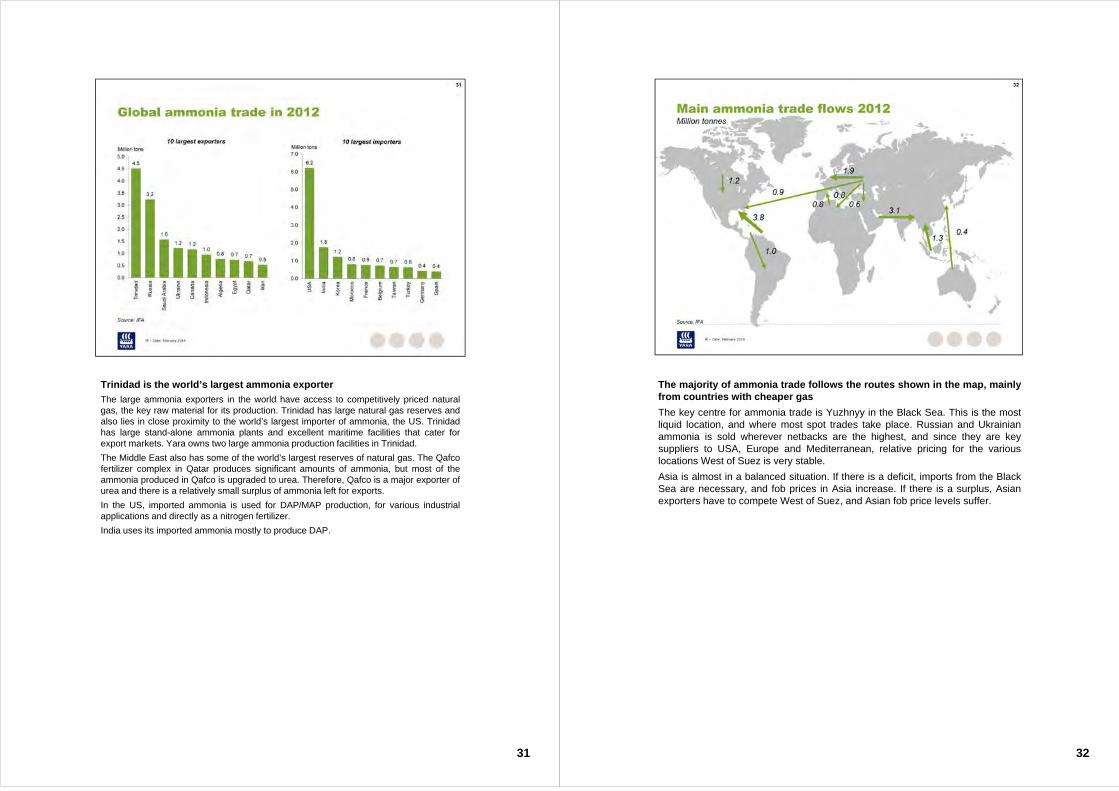
Trinidad is the world’s largest ammonia exporter
The large ammonia exporters in the world have access to competitively priced naturalgas, the key raw material for its production. Trinidad has large natural gas reserves andalso lies in close proximity to the world’s largest importer of ammonia, the US. Trinidadhas large stand-alone ammonia plants and excellent maritime facilities that cater forexport markets. Yara owns two large ammonia production facilities in Trinidad.
The Middle East also has some of the world’s largest reserves of natural gas. The Qafcofertilizer complex in Qatar produces significant amounts of ammonia, but most of theammonia produced in Qafco is upgraded to urea. Therefore, Qafco is a major exporter ofurea and there is a relatively small surplus of ammonia left for exports.
In the US, imported ammonia is used for DAP/MAP production, for various industrialapplications and directly as a nitrogen fertilizer.
India uses its imported ammonia mostly to produce DAP.
32
The majority of ammonia trade follows the routes shown in the map, mainlyfrom countries with cheaper gas
The key centre for ammonia trade is Yuzhnyy in the Black Sea. This is the mostliquid location, and where most spot trades take place. Russian and Ukrainianammonia is sold wherever netbacks are the highest, and since they are keysuppliers to USA, Europe and Mediterranean, relative pricing for the variouslocations West of Suez is very stable.
Asia is almost in a balanced situation. If there is a deficit, imports from the BlackSea are necessary, and fob prices in Asia increase. If there is a surplus, Asianexporters have to compete West of Suez, and Asian fob price levels suffer.

Urea
Urea is the largest finished nitrogen fertilizer product and is traded globally. Eventhough many markets prefer other nitrogen fertilizers for better agronomicproperties, urea is the commodity reference product with an important influenceon most other nitrogen fertilizer prices.
33 34
Urea is the main nitrogen fertilizer product
Urea production increased to 161.4 million tons in 2012, up 4.5% from 2011. During theyears 2002-2012, urea production grew on average at 3.5% per year. The largestproducers are also the largest consumers, namely China and India. China is self-sufficient on nitrogen fertilizer but India’s imports requirement is growing.
Most of the new nitrogen capacity in the world is urea, so it is natural thatproduction/consumption growth rates are higher for urea than for ammonia/total nitrogen.Lately, the difference has been quite large, since urea has taken market share,particularly from ammonium bicarbonate in China. In addition, a major share of thecapacity shutdowns in high energy cost regions have been stand-alone ammonia plants.
As urea has a high nitrogen content (46%), transport is relatively cheap. In addition,demand growth is to a large extent taking place in climates which favor urea use.
35
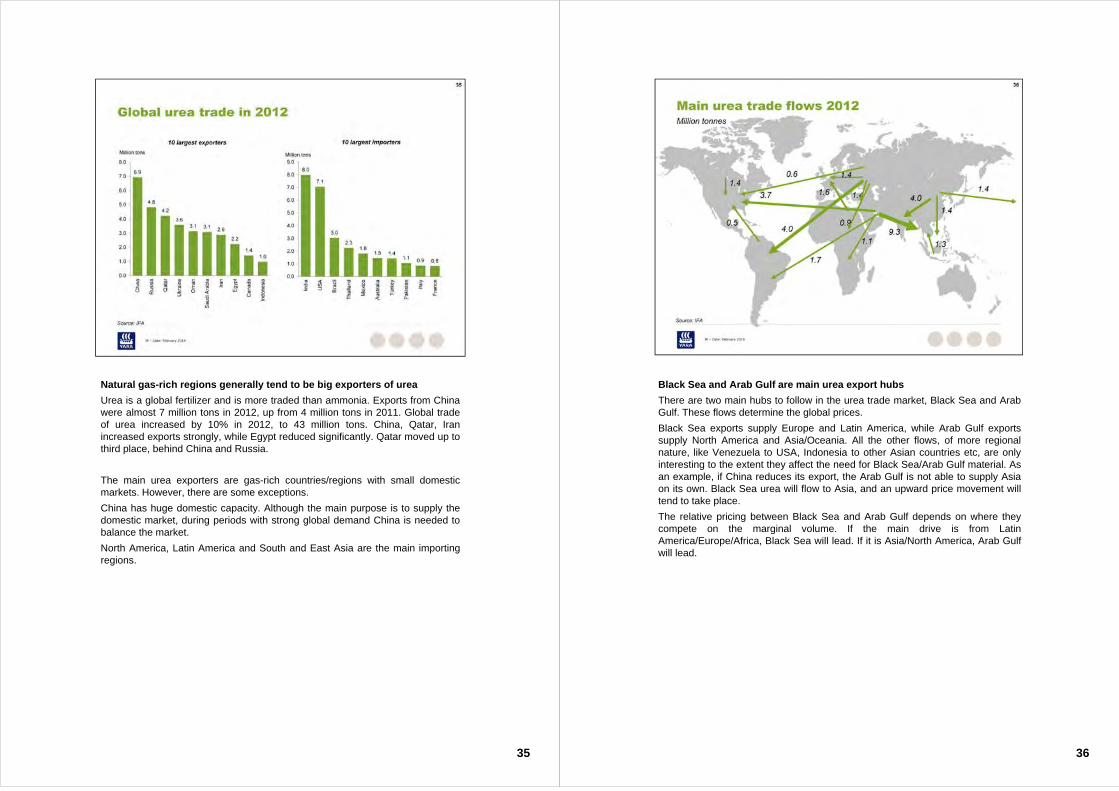
Natural gas-rich regions generally tend to be big exporters of urea
Urea is a global fertilizer and is more traded than ammonia. Exports from Chinawere almost 7 million tons in 2012, up from 4 million tons in 2011. Global tradeof urea increased by 10% in 2012, to 43 million tons. China, Qatar, Iranincreased exports strongly, while Egypt reduced significantly. Qatar moved up tothird place, behind China and Russia.
The main urea exporters are gas-rich countries/regions with small domesticmarkets. However, there are some exceptions.
China has huge domestic capacity. Although the main purpose is to supply thedomestic market, during periods with strong global demand China is needed tobalance the market.
North America, Latin America and South and East Asia are the main importingregions.
36
Black Sea and Arab Gulf are main urea export hubs
There are two main hubs to follow in the urea trade market, Black Sea and ArabGulf. These flows determine the global prices.
Black Sea exports supply Europe and Latin America, while Arab Gulf exportssupply North America and Asia/Oceania. All the other flows, of more regionalnature, like Venezuela to USA, Indonesia to other Asian countries etc, are onlyinteresting to the extent they affect the need for Black Sea/Arab Gulf material. Asan example, if China reduces its export, the Arab Gulf is not able to supply Asiaon its own. Black Sea urea will flow to Asia, and an upward price movement willtend to take place.
The relative pricing between Black Sea and Arab Gulf depends on where theycompete on the marginal volume. If the main drive is from LatinAmerica/Europe/Africa, Black Sea will lead. If it is Asia/North America, Arab Gulfwill lead.
37
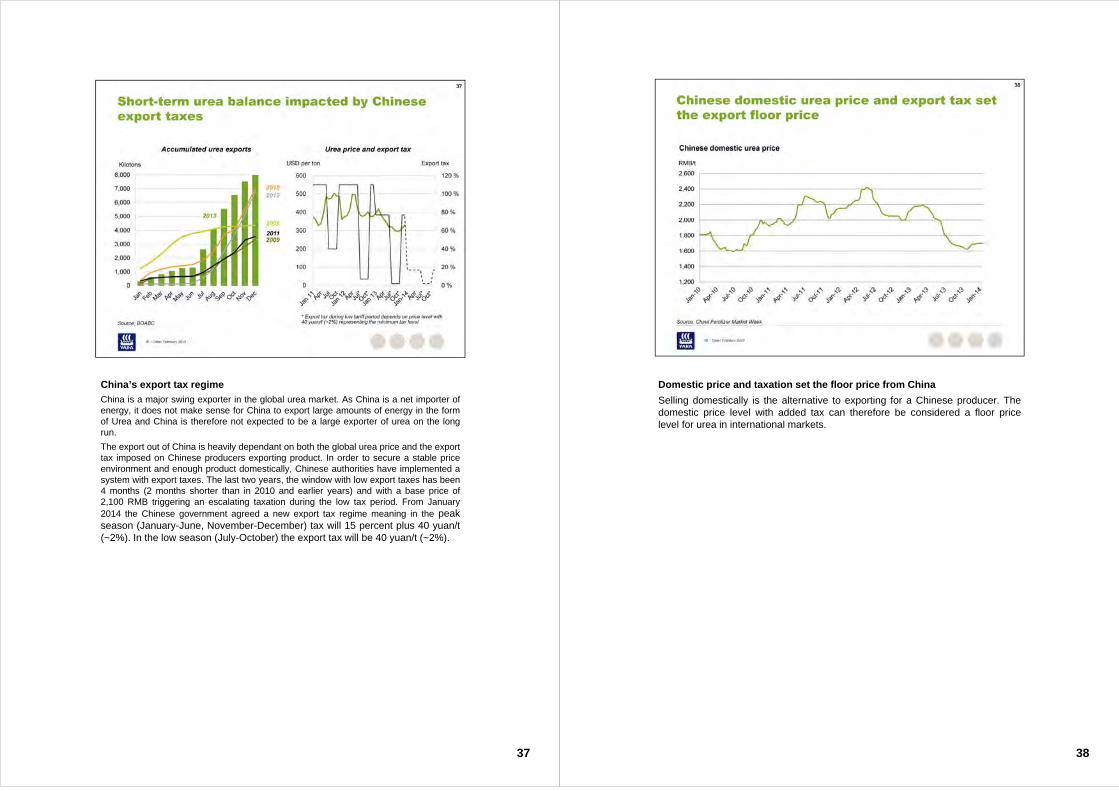
China’s export tax regime
China is a major swing exporter in the global urea market. As China is a net importer ofenergy, it does not make sense for China to export large amounts of energy in the formof Urea and China is therefore not expected to be a large exporter of urea on the longrun.
The export out of China is heavily dependant on both the global urea price and the exporttax imposed on Chinese producers exporting product. In order to secure a stable priceenvironment and enough product domestically, Chinese authorities have implemented asystem with export taxes. The last two years, the window with low export taxes has been4 months (2 months shorter than in 2010 and earlier years) and with a base price of2,100 RMB triggering an escalating taxation during the low tax period. From January2014 the Chinese government agreed a new export tax regime meaning in the peakseason (January-June, November-December) tax will 15 percent plus 40 yuan/t(~2%). In the low season (July-October) the export tax will be 40 yuan/t (~2%).
38
Domestic price and taxation set the floor price from China
Selling domestically is the alternative to exporting for a Chinese producer. Thedomestic price level with added tax can therefore be considered a floor pricelevel for urea in international markets.
Industry value drivers
This section describes how the economic mechanisms of the fertilizer industrywork and what determines fertilizer prices and company profits.
39 40
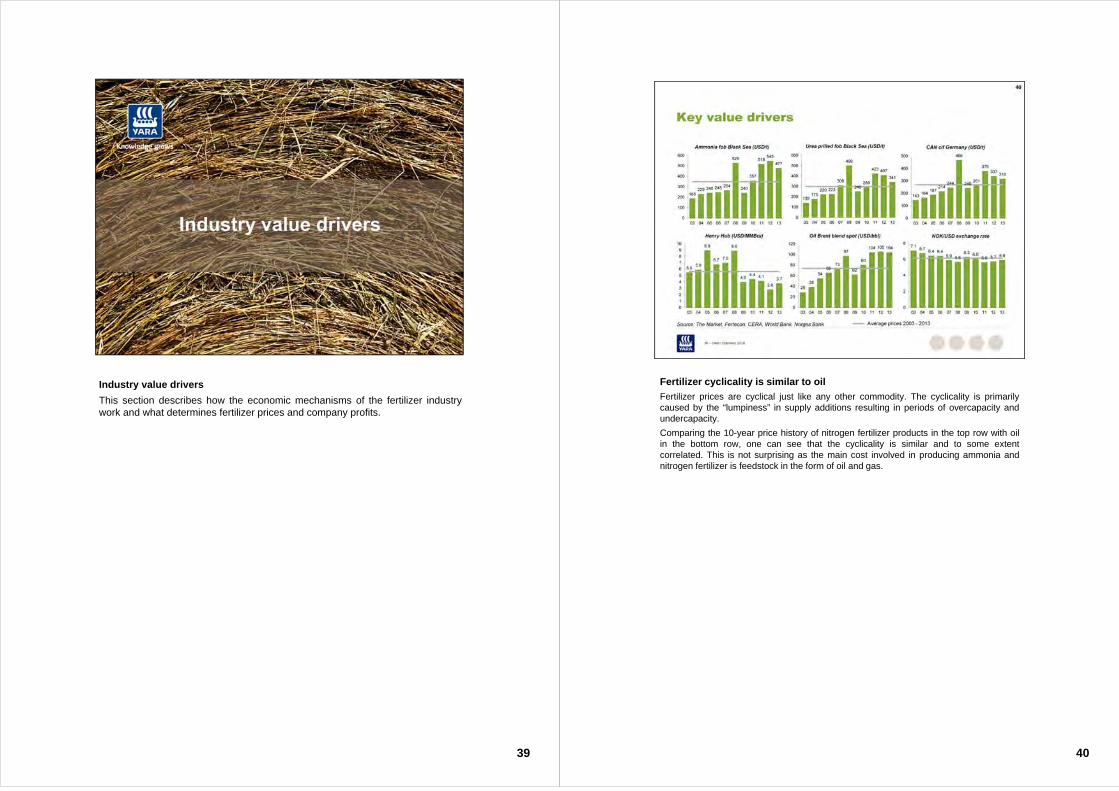
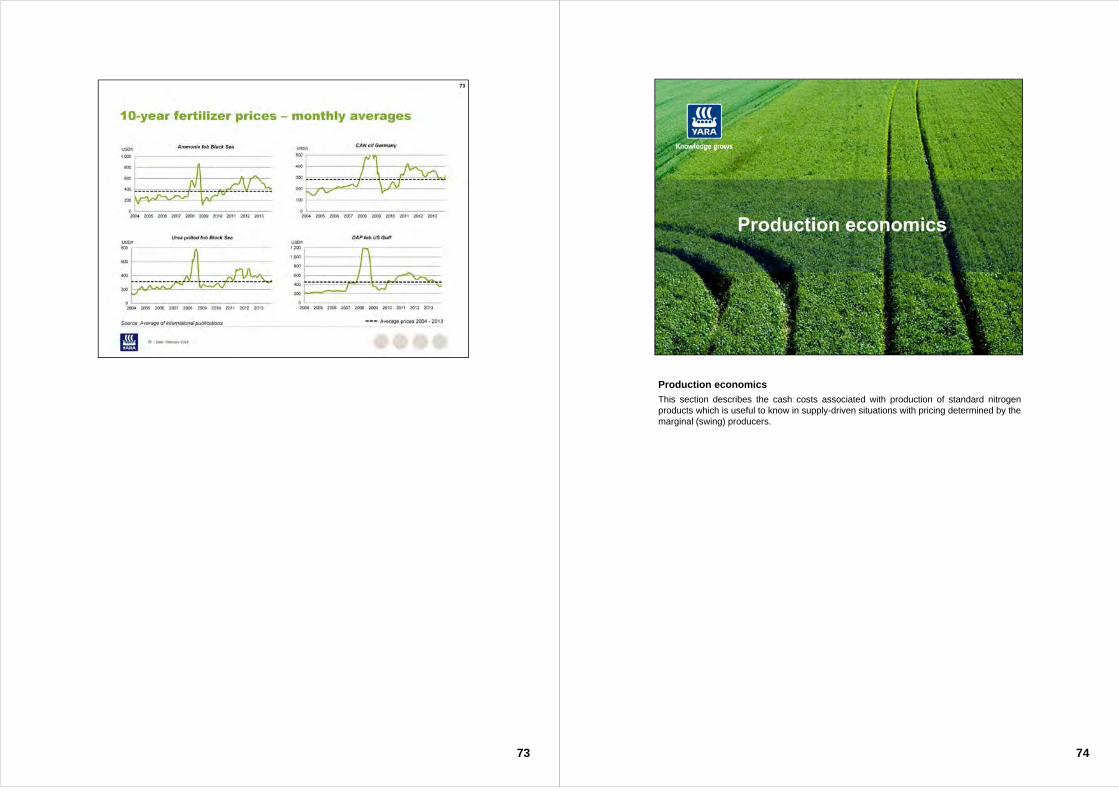
Fertilizer cyclicality is similar to oil
Fertilizer prices are cyclical just like any other commodity. The cyclicality is primarilycaused by the “lumpiness” in supply additions resulting in periods of overcapacity andundercapacity.
Comparing the 10-year price history of nitrogen fertilizer products in the top row with oilin the bottom row, one can see that the cyclicality is similar and to some extentcorrelated. This is not surprising as the main cost involved in producing ammonia andnitrogen fertilizer is feedstock in the form of oil and gas.
41
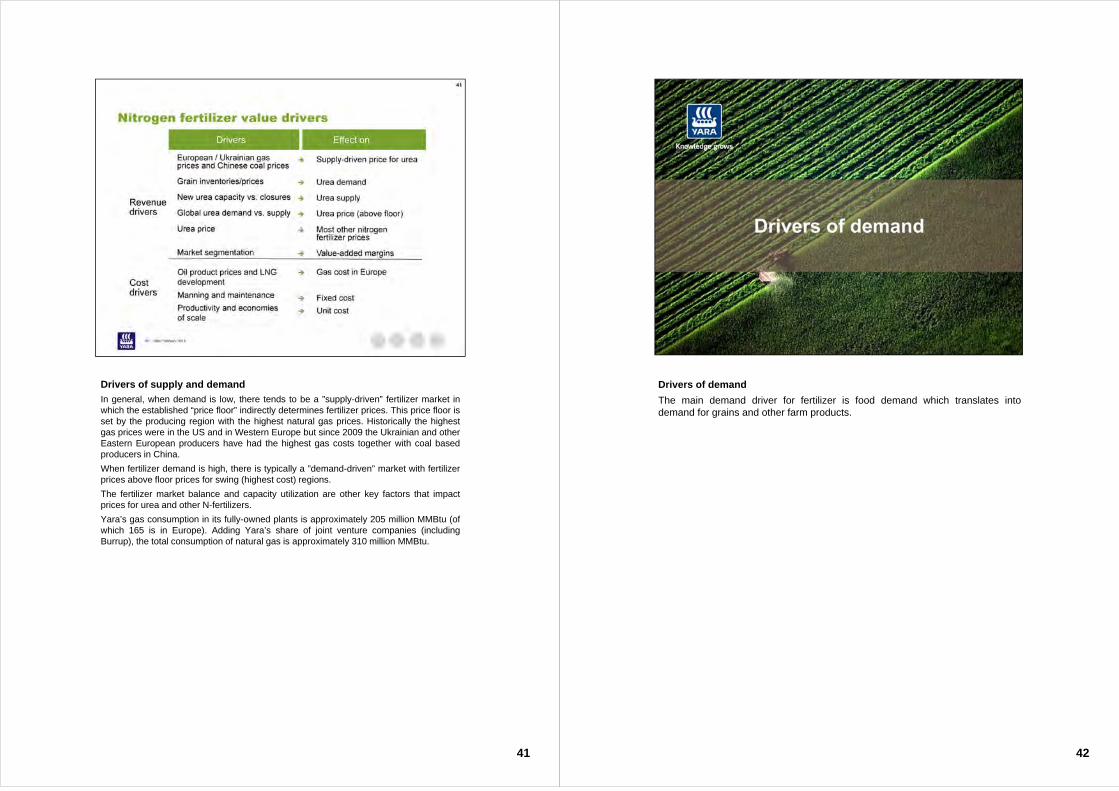
Drivers of supply and demand
In general, when demand is low, there tends to be a ”supply-driven” fertilizer market inwhich the established “price floor” indirectly determines fertilizer prices. This price floor isset by the producing region with the highest natural gas prices. Historically the highestgas prices were in the US and in Western Europe but since 2009 the Ukrainian and otherEastern European producers have had the highest gas costs together with coal basedproducers in China.
When fertilizer demand is high, there is typically a ”demand-driven” market with fertilizerprices above floor prices for swing (highest cost) regions.
The fertilizer market balance and capacity utilization are other key factors that impactprices for urea and other N-fertilizers.
Yara’s gas consumption in its fully-owned plants is approximately 205 million MMBtu (ofwhich 165 is in Europe). Adding Yara’s share of joint venture companies (includingBurrup), the total consumption of natural gas is approximately 310 million MMBtu.
Drivers of demand
The main demand driver for fertilizer is food demand which translates intodemand for grains and other farm products.
42
43
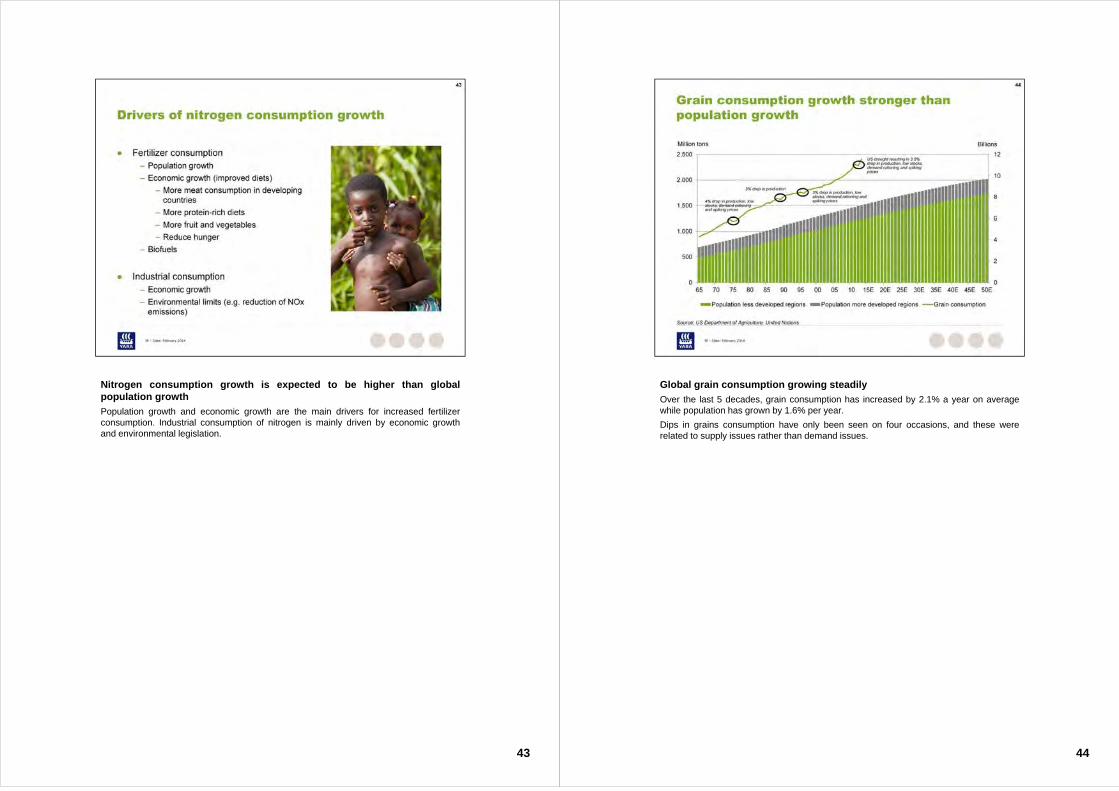
Nitrogen consumption growth is expected to be higher than globalpopulation growth
Population growth and economic growth are the main drivers for increased fertilizerconsumption. Industrial consumption of nitrogen is mainly driven by economic growthand environmental legislation.
44
Global grain consumption growing steadily
Over the last 5 decades, grain consumption has increased by 2.1% a year on averagewhile population has grown by 1.6% per year.
Dips in grains consumption have only been seen on four occasions, and these wererelated to supply issues rather than demand issues.
45
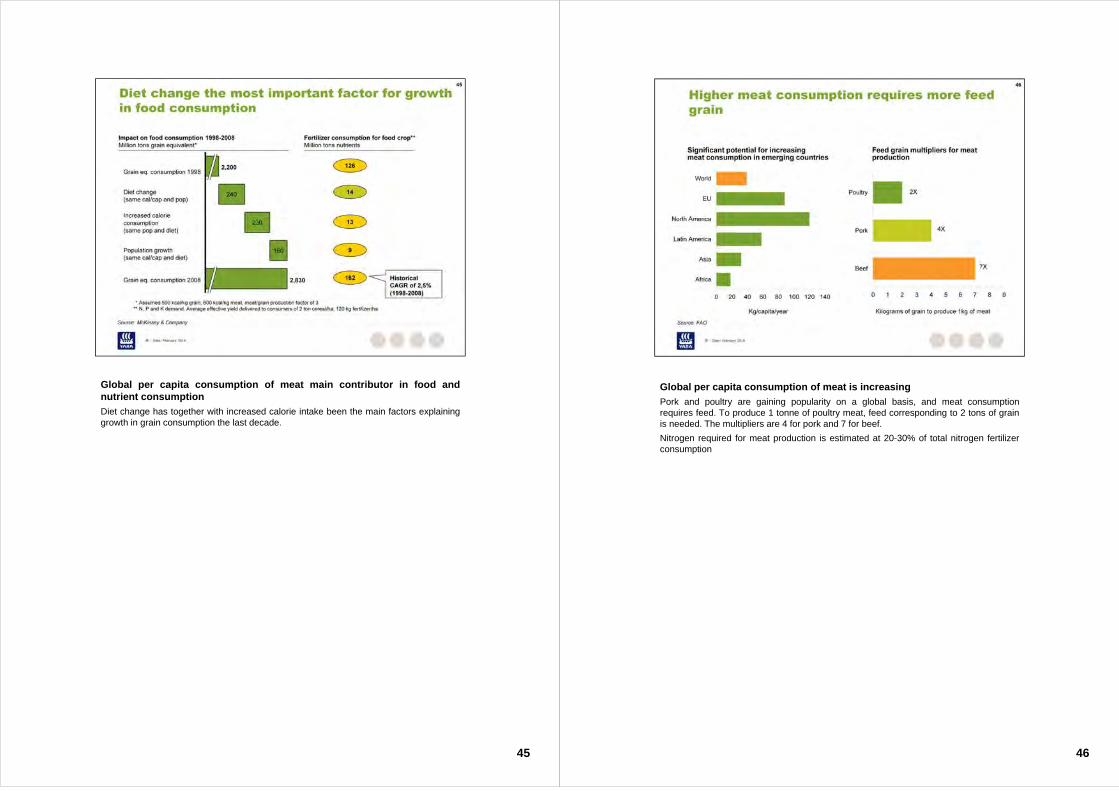
Global per capita consumption of meat main contributor in food andnutrient consumption
Diet change has together with increased calorie intake been the main factors explaininggrowth in grain consumption the last decade.
46
Global per capita consumption of meat is increasing
Pork and poultry are gaining popularity on a global basis, and meat consumptionrequires feed. To produce 1 tonne of poultry meat, feed corresponding to 2 tons of grainis needed. The multipliers are 4 for pork and 7 for beef.
Nitrogen required for meat production is estimated at 20-30% of total nitrogen fertilizerconsumption
47
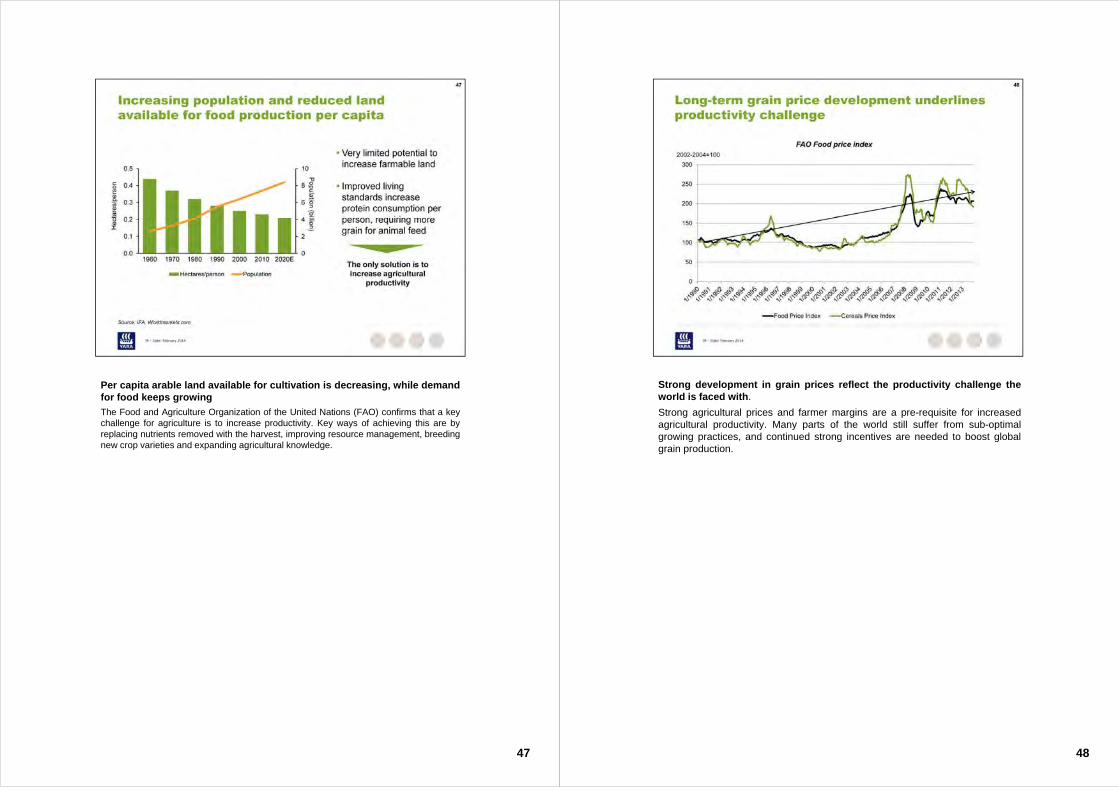
Per capita arable land available for cultivation is decreasing, while demandfor food keeps growing
The Food and Agriculture Organization of the United Nations (FAO) confirms that a keychallenge for agriculture is to increase productivity. Key ways of achieving this are byreplacing nutrients removed with the harvest, improving resource management, breedingnew crop varieties and expanding agricultural knowledge.
Strong development in grain prices reflect the productivity challenge theworld is faced with.
Strong agricultural prices and farmer margins are a pre-requisite for increasedagricultural productivity. Many parts of the world still suffer from sub-optimalgrowing practices, and continued strong incentives are needed to boost globalgrain production.
48
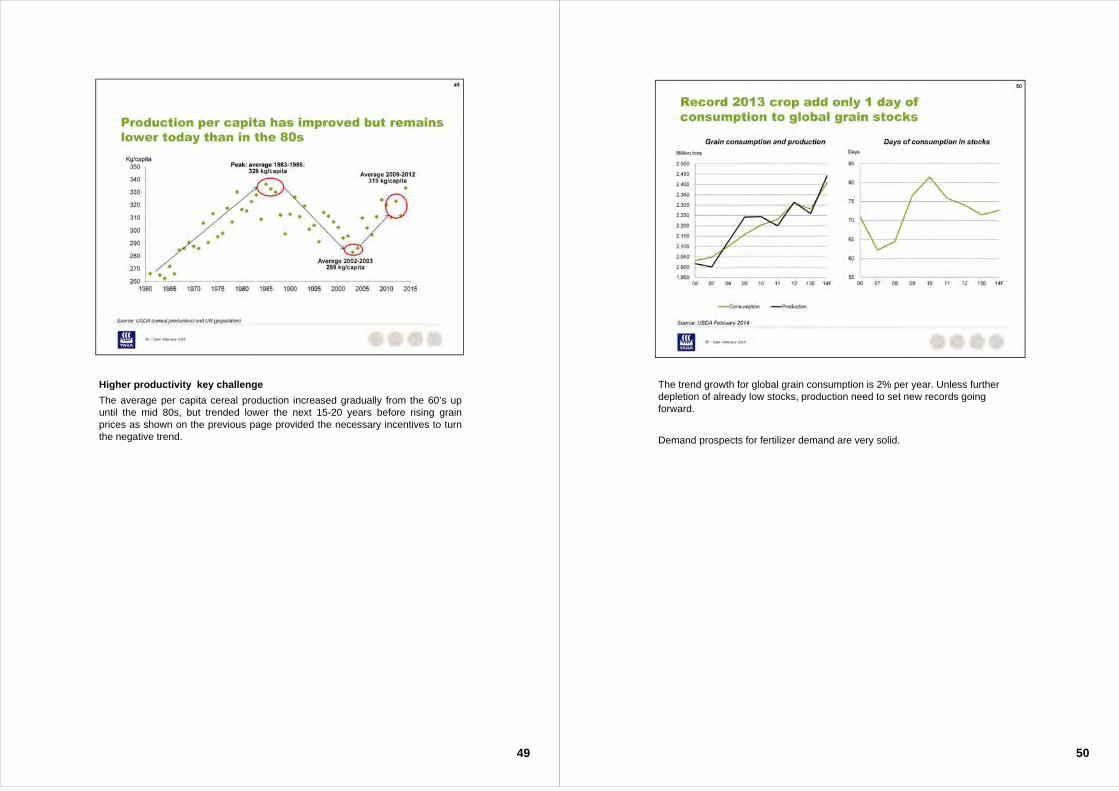
Higher productivity key challenge
The average per capita cereal production increased gradually from the 60’s upuntil the mid 80s, but trended lower the next 15-20 years before rising grainprices as shown on the previous page provided the necessary incentives to turnthe negative trend.
49 50
The trend growth for global grain consumption is 2% per year. Unless further depletion of already low stocks, production need to set new records going forward.
Demand prospects for fertilizer demand are very solid.
51
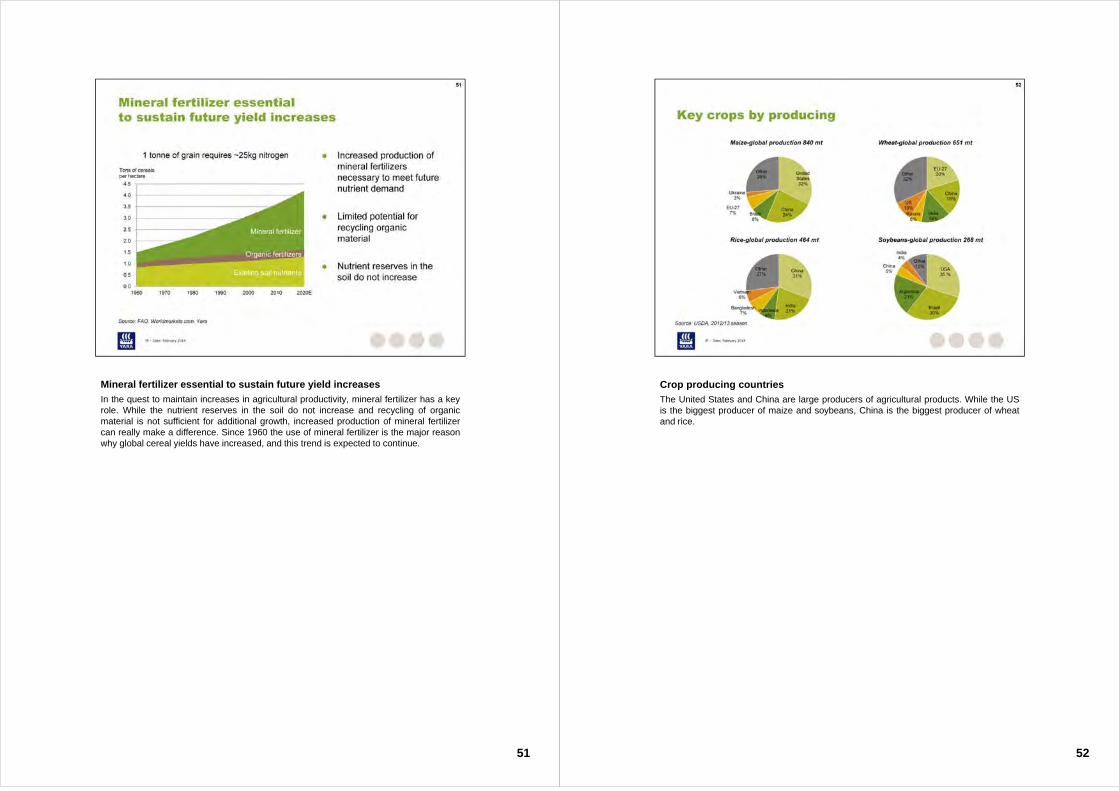
Mineral fertilizer essential to sustain future yield increases
In the quest to maintain increases in agricultural productivity, mineral fertilizer has a keyrole. While the nutrient reserves in the soil do not increase and recycling of organicmaterial is not sufficient for additional growth, increased production of mineral fertilizercan really make a difference. Since 1960 the use of mineral fertilizer is the major reasonwhy global cereal yields have increased, and this trend is expected to continue.
Crop producing countries
The United States and China are large producers of agricultural products. While the USis the biggest producer of maize and soybeans, China is the biggest producer of wheatand rice.
52
53
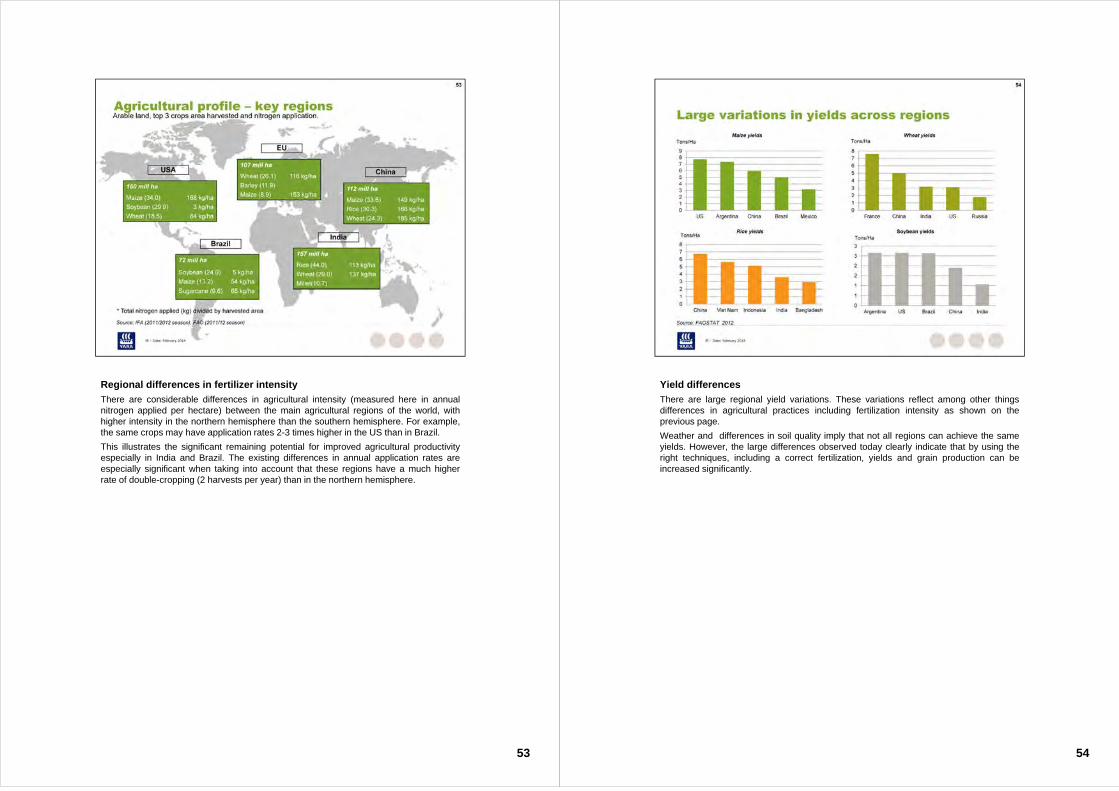
Regional differences in fertilizer intensity
There are considerable differences in agricultural intensity (measured here in annualnitrogen applied per hectare) between the main agricultural regions of the world, withhigher intensity in the northern hemisphere than the southern hemisphere. For example,the same crops may have application rates 2-3 times higher in the US than in Brazil.
This illustrates the significant remaining potential for improved agricultural productivityespecially in India and Brazil. The existing differences in annual application rates areespecially significant when taking into account that these regions have a much higherrate of double-cropping (2 harvests per year) than in the northern hemisphere.
Yield differences
There are large regional yield variations. These variations reflect among other thingsdifferences in agricultural practices including fertilization intensity as shown on theprevious page.
Weather and differences in soil quality imply that not all regions can achieve the sameyields. However, the large differences observed today clearly indicate that by using theright techniques, including a correct fertilization, yields and grain production can beincreased significantly.
54
55
Biofuel growth projected to continue
World biofuel output is projected to grow by 50% from 2013 to 2025, with the US andBrazil as the two dominant producers. The significant plans for biodiesel production inChina, India, Indonesia and Malaysia are subject to some uncertainty with regard toscope and timing.
56
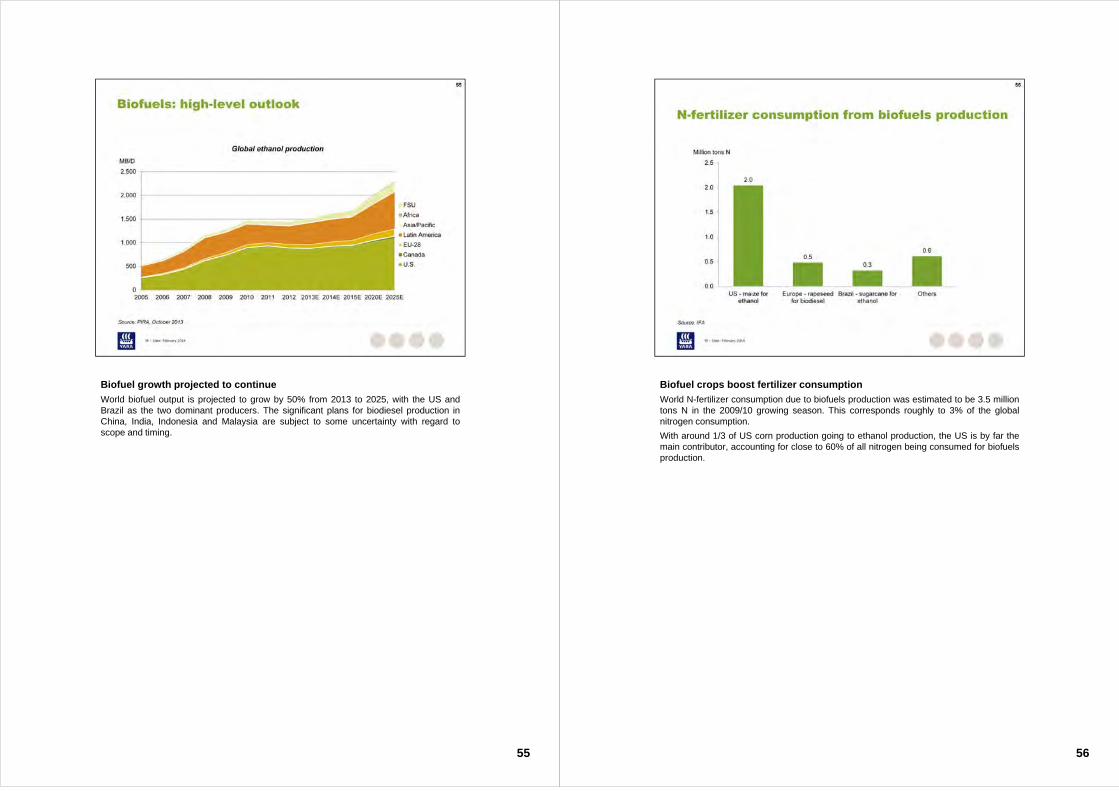
Biofuel crops boost fertilizer consumption
World N-fertilizer consumption due to biofuels production was estimated to be 3.5 milliontons N in the 2009/10 growing season. This corresponds roughly to 3% of the globalnitrogen consumption.
With around 1/3 of US corn production going to ethanol production, the US is by far themain contributor, accounting for close to 60% of all nitrogen being consumed for biofuelsproduction.
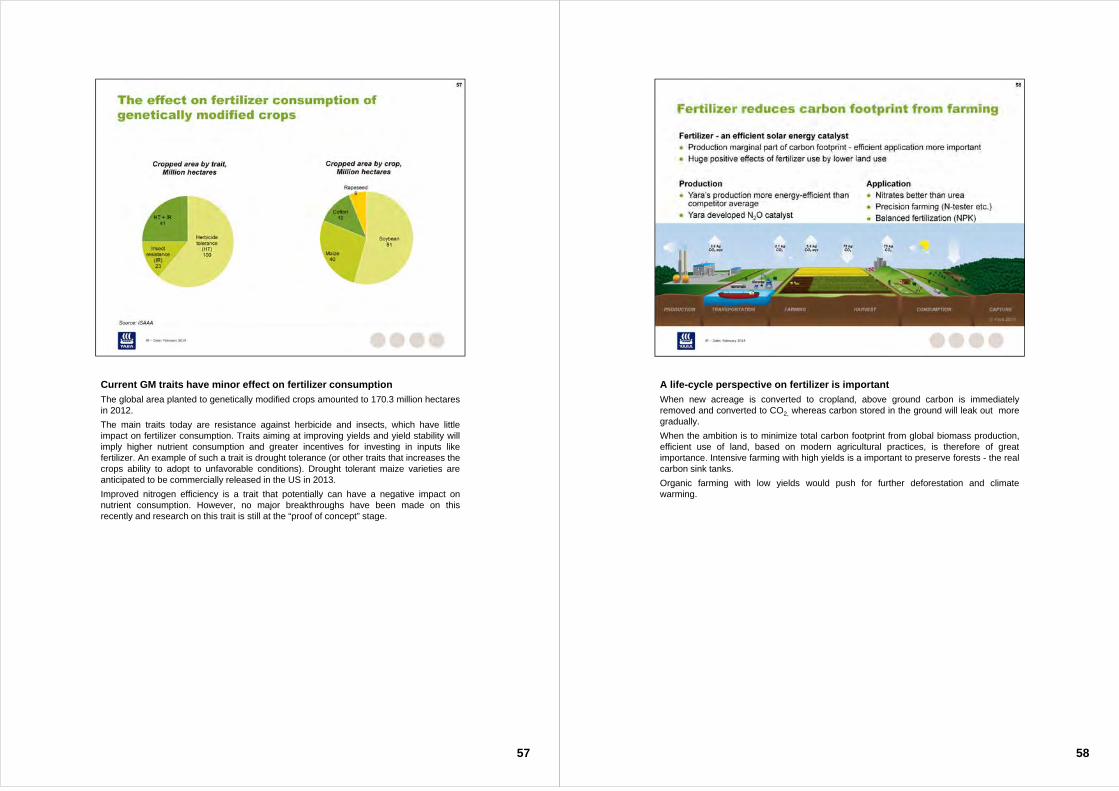
Current GM traits have minor effect on fertilizer consumption
The global area planted to genetically modified crops amounted to 170.3 million hectaresin 2012.
The main traits today are resistance against herbicide and insects, which have littleimpact on fertilizer consumption. Traits aiming at improving yields and yield stability willimply higher nutrient consumption and greater incentives for investing in inputs likefertilizer. An example of such a trait is drought tolerance (or other traits that increases thecrops ability to adopt to unfavorable conditions). Drought tolerant maize varieties areanticipated to be commercially released in the US in 2013.
Improved nitrogen efficiency is a trait that potentially can have a negative impact onnutrient consumption. However, no major breakthroughs have been made on thisrecently and research on this trait is still at the “proof of concept” stage.
57
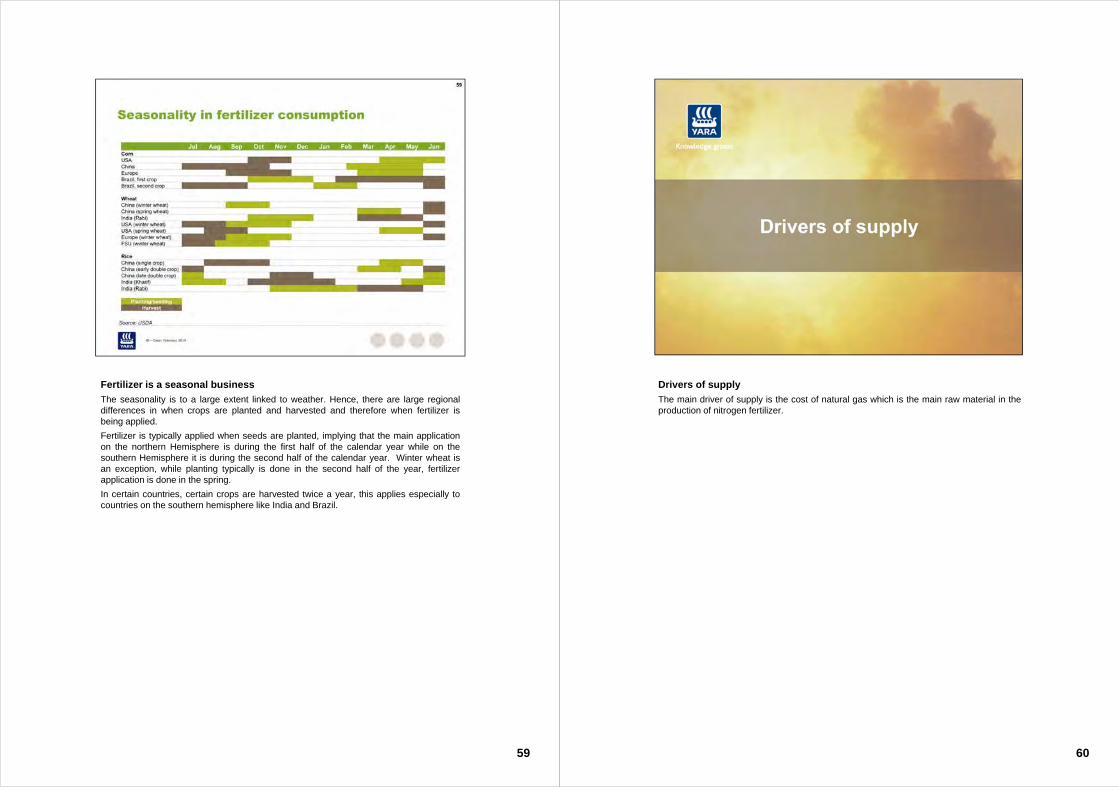
A life-cycle perspective on fertilizer is important
When new acreage is converted to cropland, above ground carbon is immediatelyremoved and converted to CO2, whereas carbon stored in the ground will leak out moregradually.
When the ambition is to minimize total carbon footprint from global biomass production,efficient use of land, based on modern agricultural practices, is therefore of greatimportance. Intensive farming with high yields is a important to preserve forests - the realcarbon sink tanks.
Organic farming with low yields would push for further deforestation and climatewarming.
58
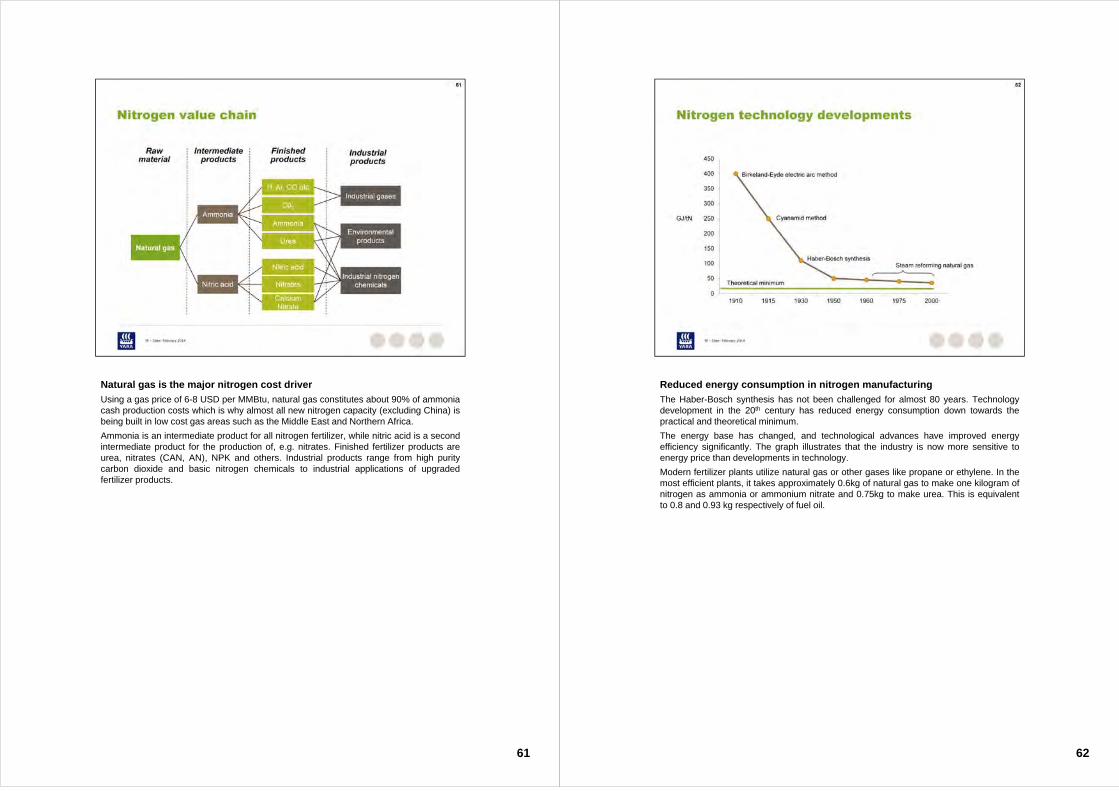
Fertilizer is a seasonal business
The seasonality is to a large extent linked to weather. Hence, there are large regionaldifferences in when crops are planted and harvested and therefore when fertilizer isbeing applied.
Fertilizer is typically applied when seeds are planted, implying that the main applicationon the northern Hemisphere is during the first half of the calendar year while on thesouthern Hemisphere it is during the second half of the calendar year. Winter wheat isan exception, while planting typically is done in the second half of the year, fertilizerapplication is done in the spring.
In certain countries, certain crops are harvested twice a year, this applies especially tocountries on the southern hemisphere like India and Brazil.
59
Drivers of supply
The main driver of supply is the cost of natural gas which is the main raw material in theproduction of nitrogen fertilizer.
60
61
Natural gas is the major nitrogen cost driver
Using a gas price of 6-8 USD per MMBtu, natural gas constitutes about 90% of ammoniacash production costs which is why almost all new nitrogen capacity (excluding China) isbeing built in low cost gas areas such as the Middle East and Northern Africa.
Ammonia is an intermediate product for all nitrogen fertilizer, while nitric acid is a secondintermediate product for the production of, e.g. nitrates. Finished fertilizer products areurea, nitrates (CAN, AN), NPK and others. Industrial products range from high puritycarbon dioxide and basic nitrogen chemicals to industrial applications of upgradedfertilizer products.
62
Reduced energy consumption in nitrogen manufacturing
The Haber-Bosch synthesis has not been challenged for almost 80 years. Technologydevelopment in the 20th century has reduced energy consumption down towards thepractical and theoretical minimum.
The energy base has changed, and technological advances have improved energyefficiency significantly. The graph illustrates that the industry is now more sensitive toenergy price than developments in technology.
Modern fertilizer plants utilize natural gas or other gases like propane or ethylene. In themost efficient plants, it takes approximately 0.6kg of natural gas to make one kilogram ofnitrogen as ammonia or ammonium nitrate and 0.75kg to make urea. This is equivalentto 0.8 and 0.93 kg respectively of fuel oil.
63
West European ammonia producers are highly energy efficient
Ammonia producers in Western Europe have invested heavily in energy-efficienttechnology due to the historically high cost of energy in the region. According to EFMA,several ammonia plants in West Europe run on the lowest feasible energy consumptionlevels and emit the lowest possible amount of CO2 per tonne of ammonia produced.
The Western European ammonia industry is on average more energy efficient thanammonia producers in other parts of the world. This is also driven by EU environmentalregulations for pollution control, which requires running plants at higher standards thanelsewhere.
64
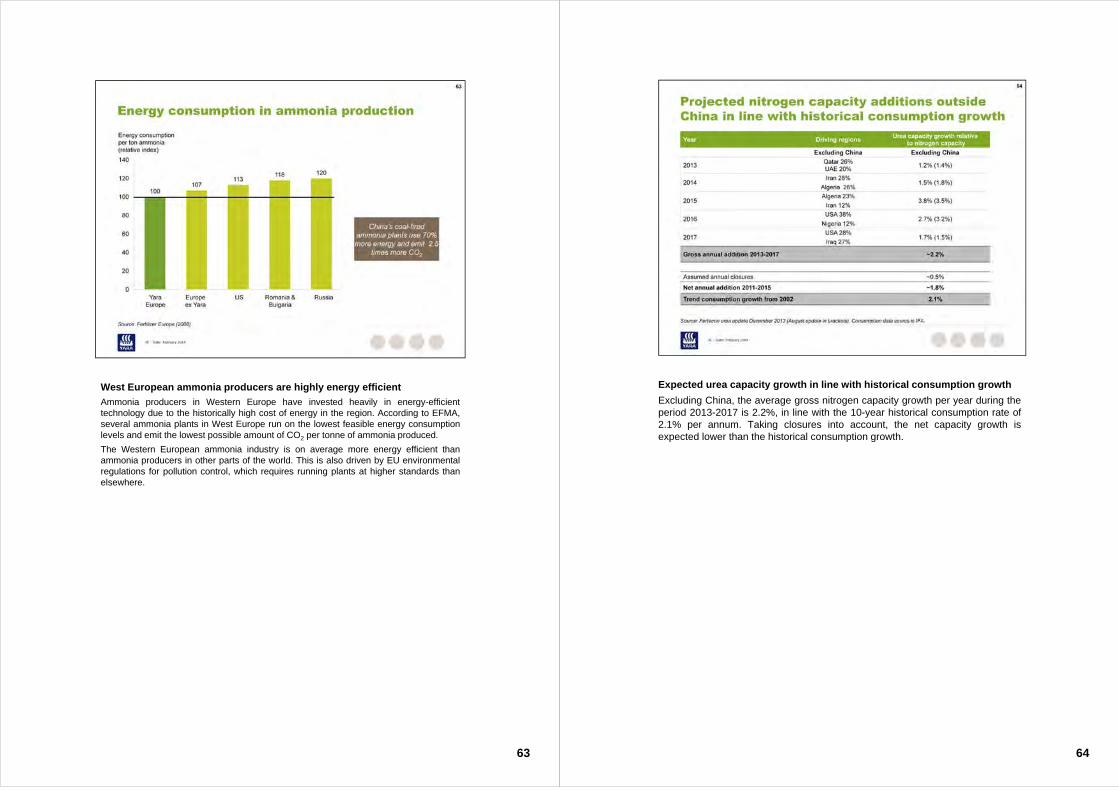
Expected urea capacity growth in line with historical consumption growth
Excluding China, the average gross nitrogen capacity growth per year during theperiod 2013-2017 is 2.2%, in line with the 10-year historical consumption rate of2.1% per annum. Taking closures into account, the net capacity growth isexpected lower than the historical consumption growth.
65
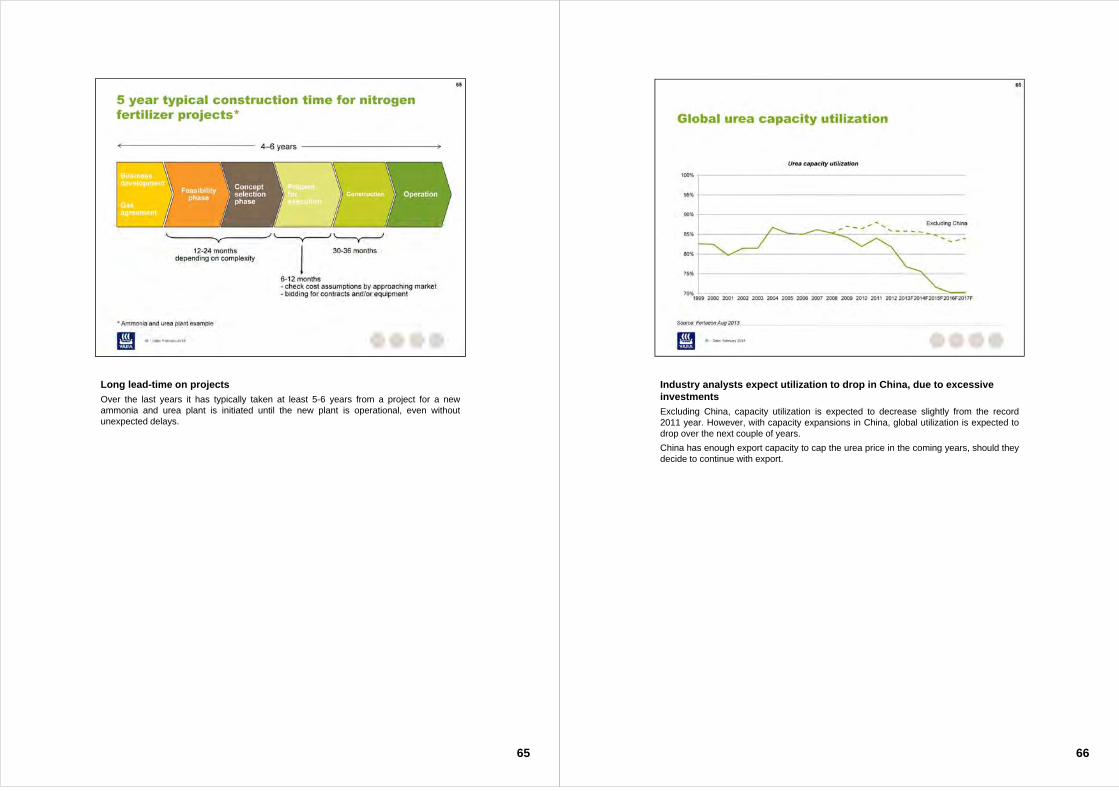
Long lead-time on projects
Over the last years it has typically taken at least 5-6 years from a project for a newammonia and urea plant is initiated until the new plant is operational, even withoutunexpected delays.
66
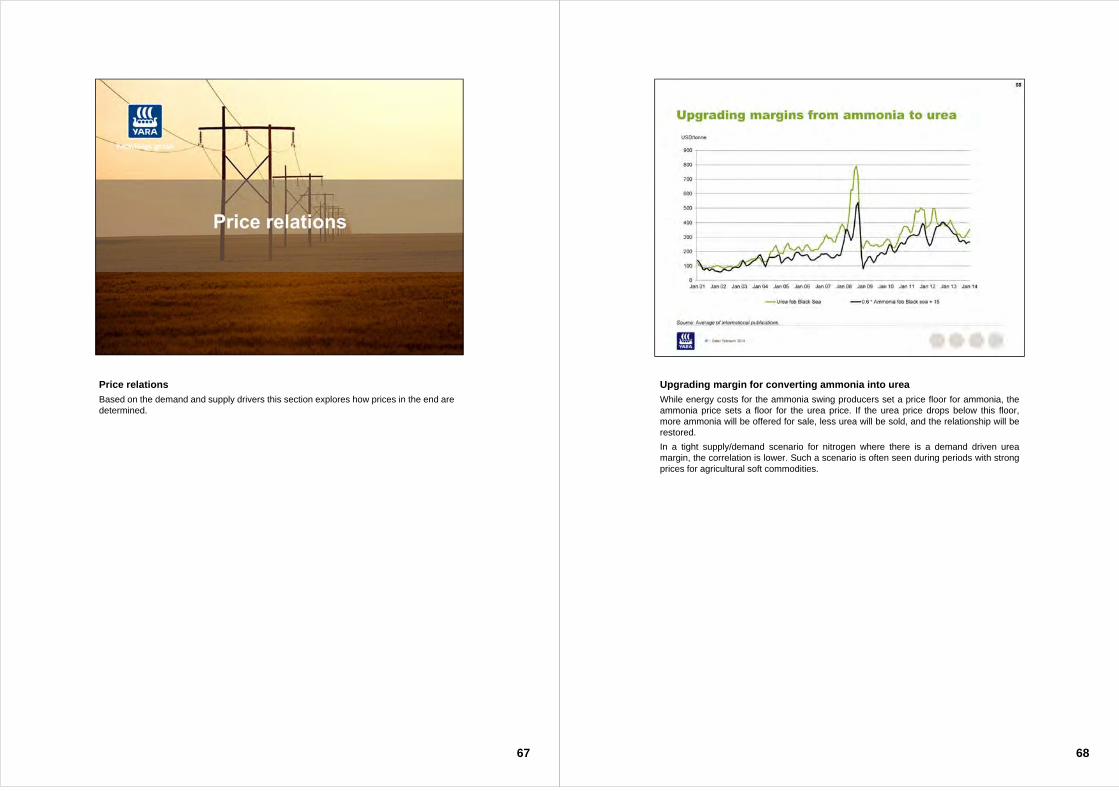
Industry analysts expect utilization to drop in China, due to excessive investments
Excluding China, capacity utilization is expected to decrease slightly from the record2011 year. However, with capacity expansions in China, global utilization is expected todrop over the next couple of years.
China has enough export capacity to cap the urea price in the coming years, should theydecide to continue with export.
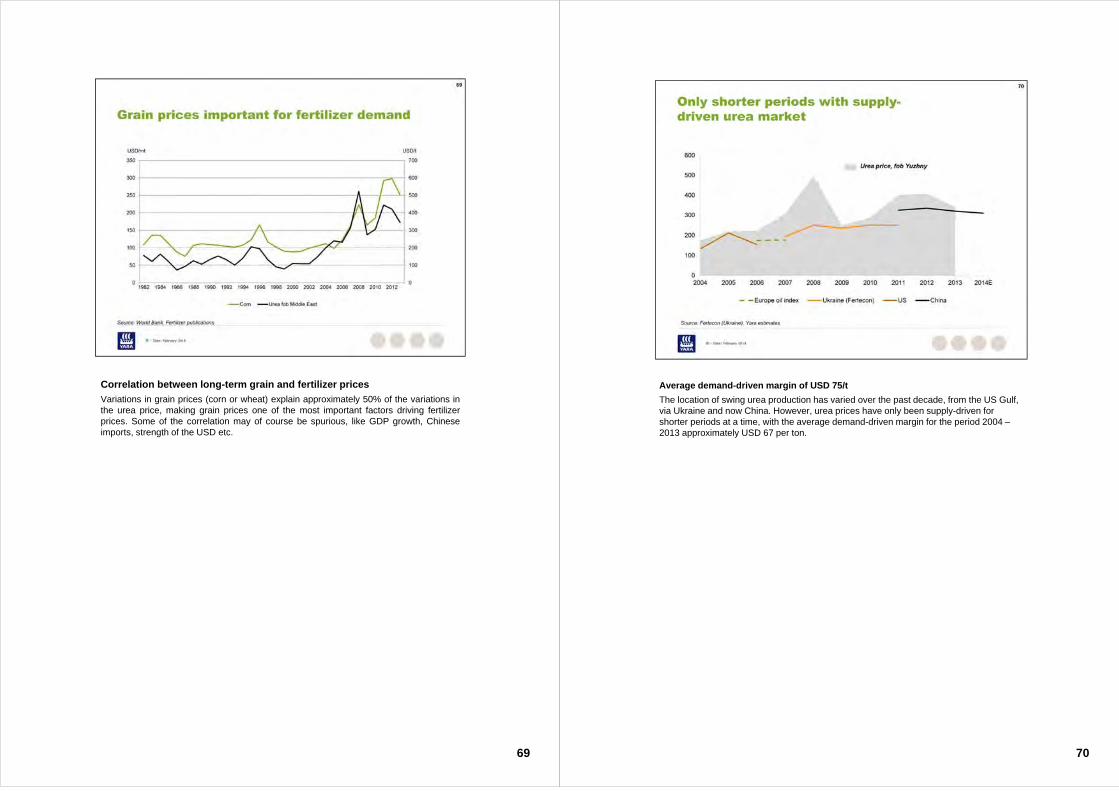
Price relations
Based on the demand and supply drivers this section explores how prices in the end are determined.
67 68
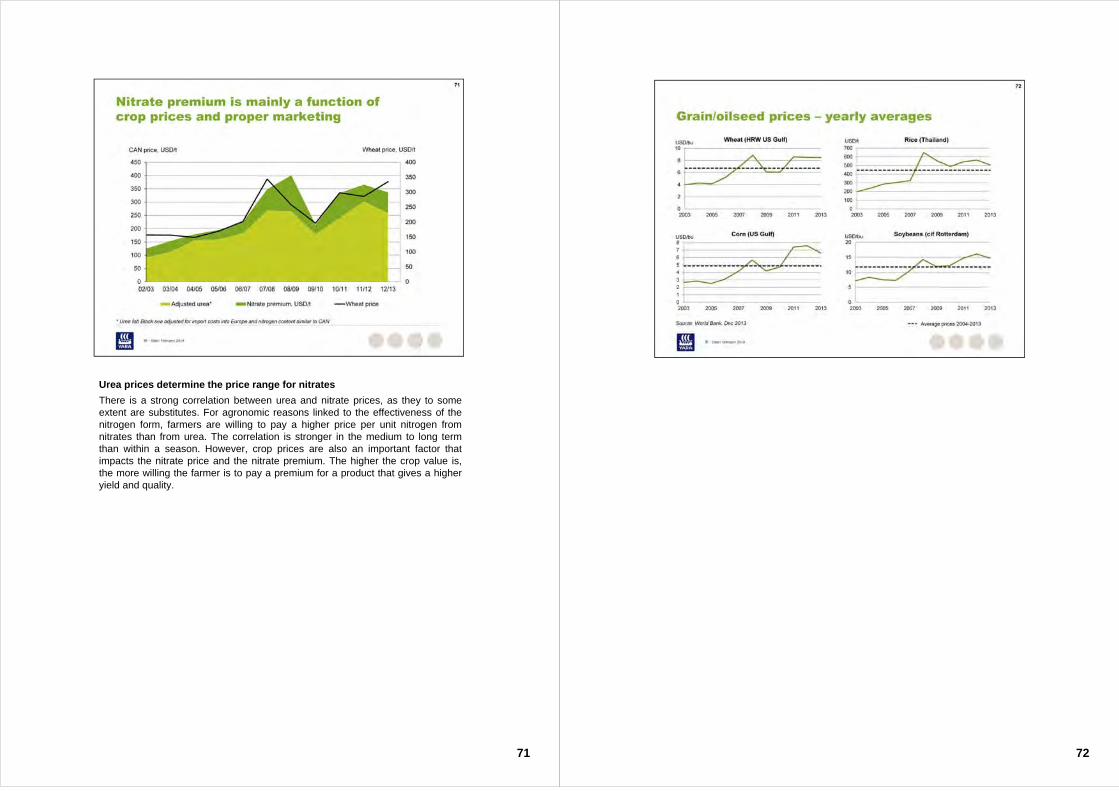
Upgrading margin for converting ammonia into urea
While energy costs for the ammonia swing producers set a price floor for ammonia, theammonia price sets a floor for the urea price. If the urea price drops below this floor,more ammonia will be offered for sale, less urea will be sold, and the relationship will berestored.
In a tight supply/demand scenario for nitrogen where there is a demand driven ureamargin, the correlation is lower. Such a scenario is often seen during periods with strongprices for agricultural soft commodities.
69
Correlation between long-term grain and fertilizer prices
Variations in grain prices (corn or wheat) explain approximately 50% of the variations inthe urea price, making grain prices one of the most important factors driving fertilizerprices. Some of the correlation may of course be spurious, like GDP growth, Chineseimports, strength of the USD etc.
70
Average demand-driven margin of USD 75/t
The location of swing urea production has varied over the past decade, from the US Gulf, via Ukraine and now China. However, urea prices have only been supply-driven for shorter periods at a time, with the average demand-driven margin for the period 2004 –2013 approximately USD 67 per ton.
Urea prices determine the price range for nitrates
There is a strong correlation between urea and nitrate prices, as they to someextent are substitutes. For agronomic reasons linked to the effectiveness of thenitrogen form, farmers are willing to pay a higher price per unit nitrogen fromnitrates than from urea. The correlation is stronger in the medium to long termthan within a season. However, crop prices are also an important factor thatimpacts the nitrate price and the nitrate premium. The higher the crop value is,the more willing the farmer is to pay a premium for a product that gives a higheryield and quality.
71 72
73
Production economics
This section describes the cash costs associated with production of standard nitrogenproducts which is useful to know in supply-driven situations with pricing determined by themarginal (swing) producers.
74
75
Production economics
90% of Yara’s operational cash costs are raw materials, energy and freight. A major partof these purchases can be terminated on short notice reducing the financialconsequences of delivery slow-downs.
Yara’s plants can be stopped at short notice and at low cost as response to decline indeliveries or to take advantage of cheaper imported ammonia.
76
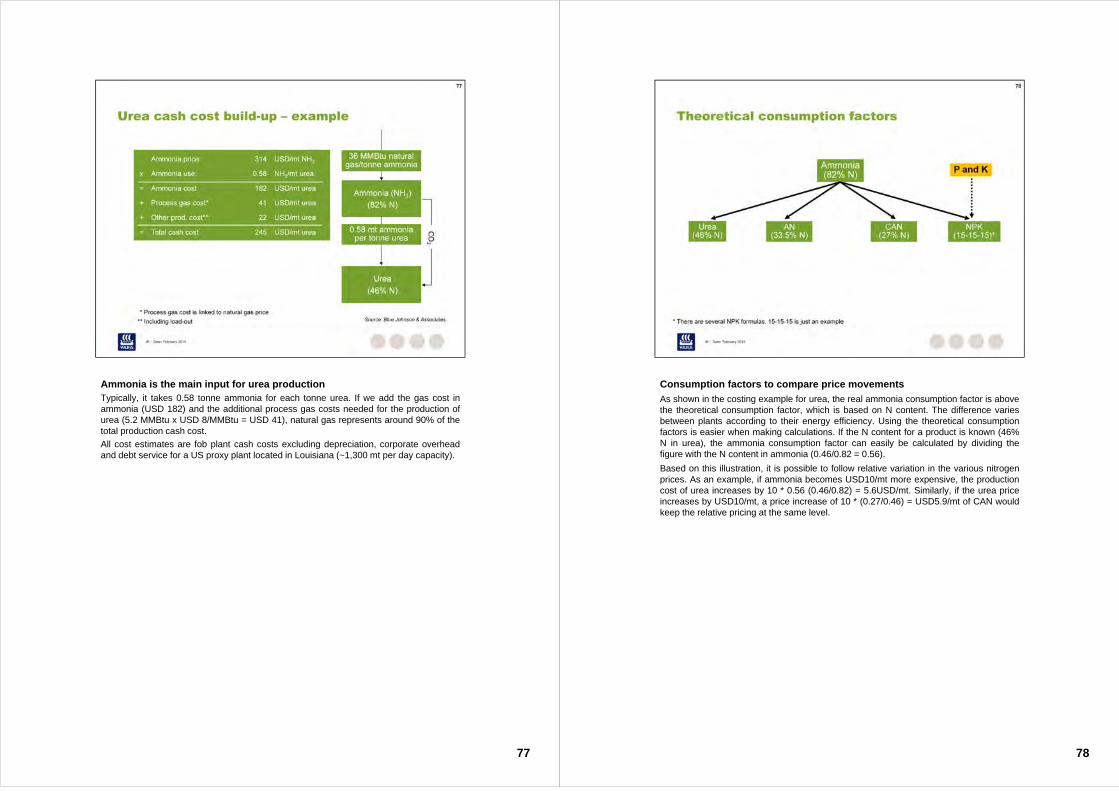
Natural gas costs the most important cost component
With a natural gas price of USD 8/MMBtu gas cost represents around 90% of theammonia production cash costs. In this example, one dollar increase in gas cost givesUSD 36 higher gas costs.
Most of the “other production costs” are fixed costs and therefore subject to scaleadvantages.
A new, highly efficient plant may use natural gas in the low thirties range to produce onetonne of ammonia; the corresponding figure for old, poorly maintained plants will be inthe mid-forties.
mt = metric tonne
All cost estimates are fob plant cash costs excluding load-out, depreciation, corporateoverhead and debt service for a US proxy plant located in Louisiana (ca. 1,300 metrictons per day capacity). In this example load-out barge is excluded.
77
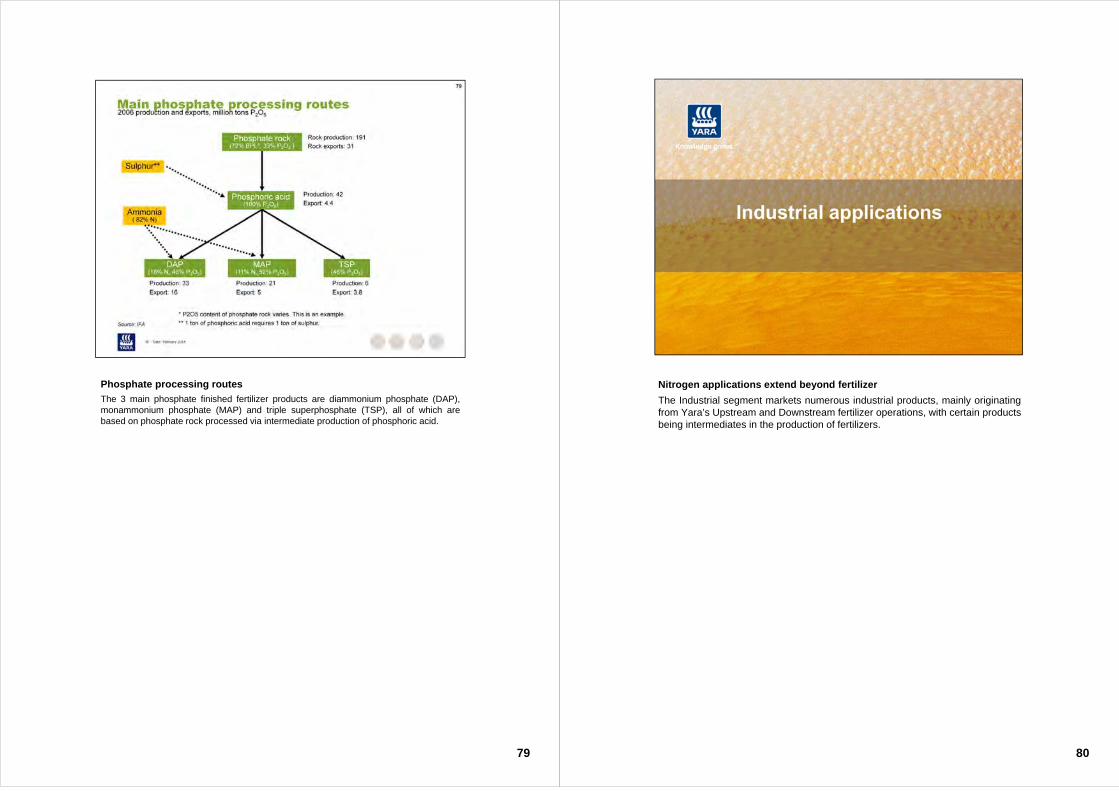
Ammonia is the main input for urea productionTypically, it takes 0.58 tonne ammonia for each tonne urea. If we add the gas cost inammonia (USD 182) and the additional process gas costs needed for the production ofurea (5.2 MMBtu x USD 8/MMBtu = USD 41), natural gas represents around 90% of thetotal production cash cost.
All cost estimates are fob plant cash costs excluding depreciation, corporate overheadand debt service for a US proxy plant located in Louisiana (~1,300 mt per day capacity).
78
Consumption factors to compare price movements
As shown in the costing example for urea, the real ammonia consumption factor is abovethe theoretical consumption factor, which is based on N content. The difference variesbetween plants according to their energy efficiency. Using the theoretical consumptionfactors is easier when making calculations. If the N content for a product is known (46%N in urea), the ammonia consumption factor can easily be calculated by dividing thefigure with the N content in ammonia (0.46/0.82 = 0.56).
Based on this illustration, it is possible to follow relative variation in the various nitrogenprices. As an example, if ammonia becomes USD10/mt more expensive, the productioncost of urea increases by 10 * 0.56 (0.46/0.82) = 5.6USD/mt. Similarly, if the urea priceincreases by USD10/mt, a price increase of 10 * (0.27/0.46) = USD5.9/mt of CAN wouldkeep the relative pricing at the same level.
79
Phosphate processing routes
The 3 main phosphate finished fertilizer products are diammonium phosphate (DAP),monammonium phosphate (MAP) and triple superphosphate (TSP), all of which arebased on phosphate rock processed via intermediate production of phosphoric acid.
Nitrogen applications extend beyond fertilizer
The Industrial segment markets numerous industrial products, mainly originatingfrom Yara’s Upstream and Downstream fertilizer operations, with certain productsbeing intermediates in the production of fertilizers.
80
81
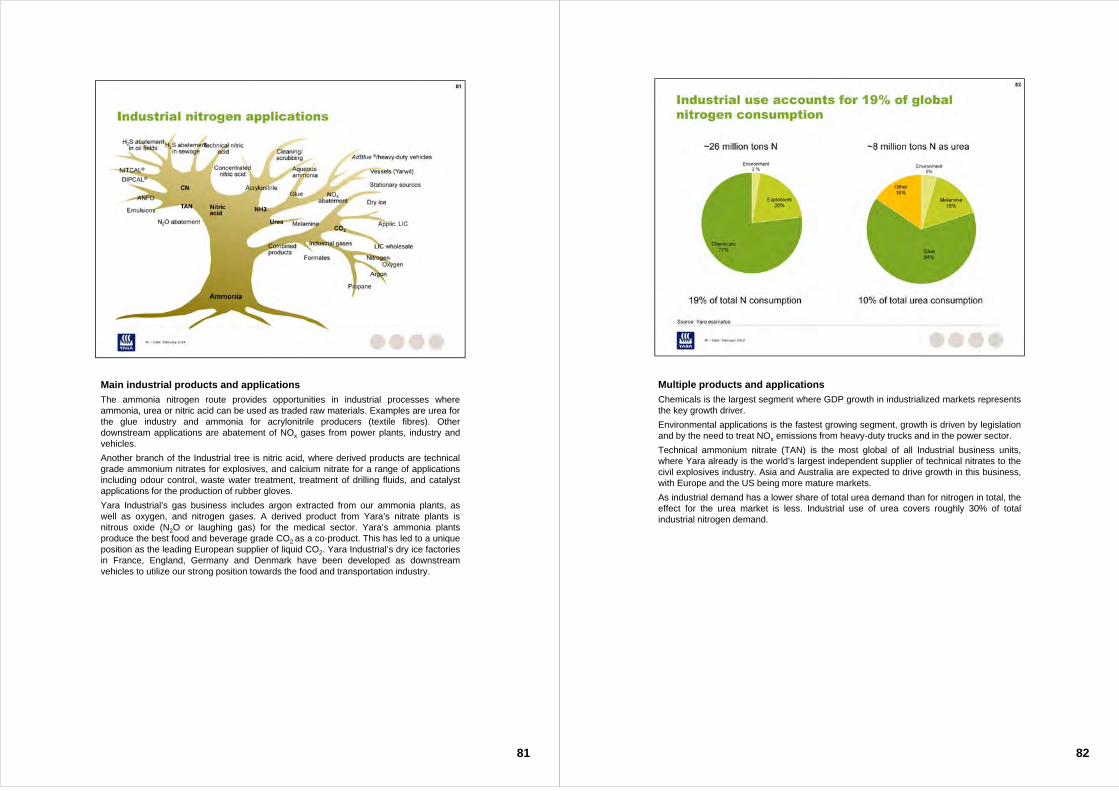
Main industrial products and applications
The ammonia nitrogen route provides opportunities in industrial processes whereammonia, urea or nitric acid can be used as traded raw materials. Examples are urea forthe glue industry and ammonia for acrylonitrile producers (textile fibres). Otherdownstream applications are abatement of NOx gases from power plants, industry andvehicles.
Another branch of the Industrial tree is nitric acid, where derived products are technicalgrade ammonium nitrates for explosives, and calcium nitrate for a range of applicationsincluding odour control, waste water treatment, treatment of drilling fluids, and catalystapplications for the production of rubber gloves.
Yara Industrial’s gas business includes argon extracted from our ammonia plants, aswell as oxygen, and nitrogen gases. A derived product from Yara’s nitrate plants isnitrous oxide (N2O or laughing gas) for the medical sector. Yara’s ammonia plantsproduce the best food and beverage grade CO2 as a co-product. This has led to a uniqueposition as the leading European supplier of liquid CO2. Yara Industrial’s dry ice factoriesin France, England, Germany and Denmark have been developed as downstreamvehicles to utilize our strong position towards the food and transportation industry.
82
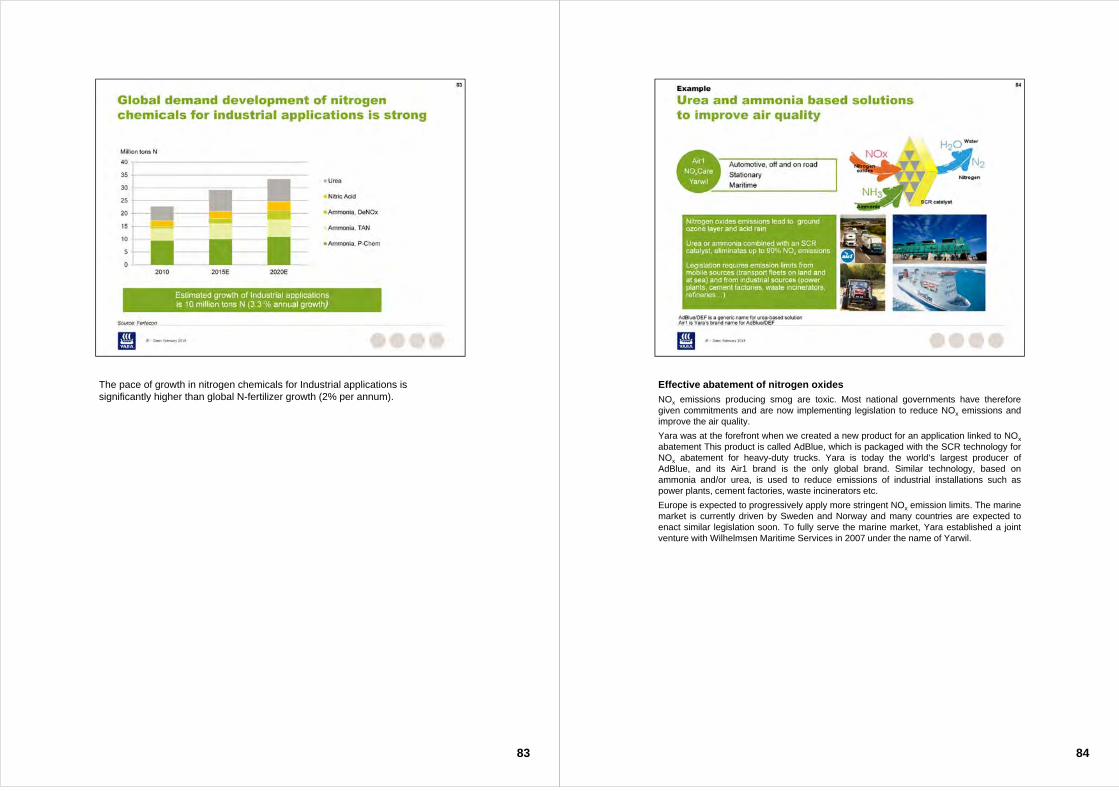
Multiple products and applications
Chemicals is the largest segment where GDP growth in industrialized markets representsthe key growth driver.
Environmental applications is the fastest growing segment, growth is driven by legislationand by the need to treat NOx emissions from heavy-duty trucks and in the power sector.
Technical ammonium nitrate (TAN) is the most global of all Industrial business units,where Yara already is the world’s largest independent supplier of technical nitrates to thecivil explosives industry. Asia and Australia are expected to drive growth in this business,with Europe and the US being more mature markets.
As industrial demand has a lower share of total urea demand than for nitrogen in total, theeffect for the urea market is less. Industrial use of urea covers roughly 30% of totalindustrial nitrogen demand.
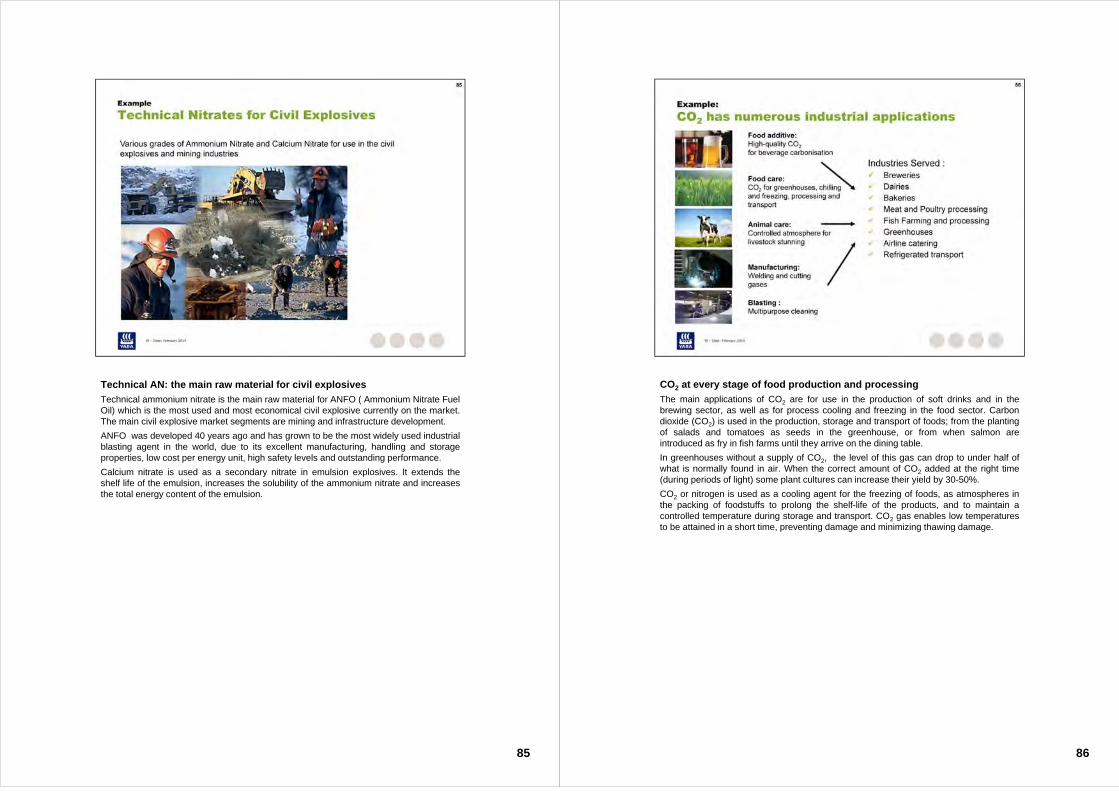
The pace of growth in nitrogen chemicals for Industrial applications is significantly higher than global N-fertilizer growth (2% per annum).
83
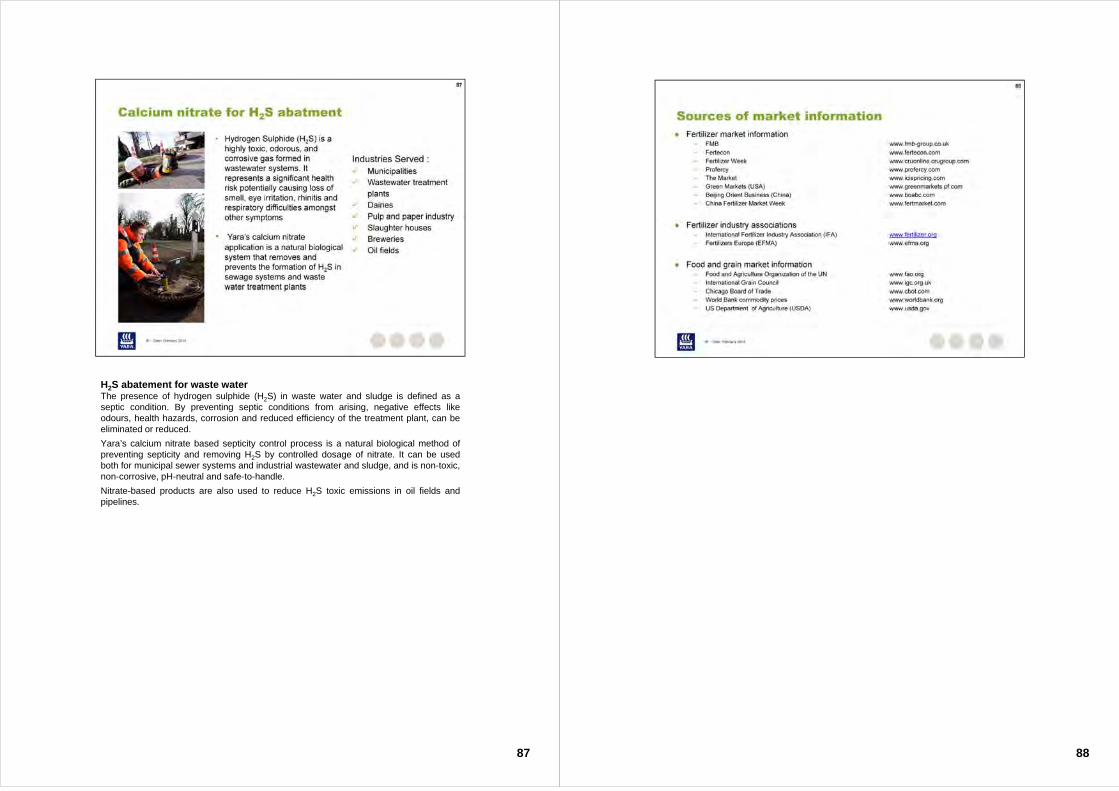
Effective abatement of nitrogen oxides
NOx emissions producing smog are toxic. Most national governments have thereforegiven commitments and are now implementing legislation to reduce NOx emissions andimprove the air quality.
Yara was at the forefront when we created a new product for an application linked to NOx
abatement This product is called AdBlue, which is packaged with the SCR technology forNOx abatement for heavy-duty trucks. Yara is today the world’s largest producer ofAdBlue, and its Air1 brand is the only global brand. Similar technology, based onammonia and/or urea, is used to reduce emissions of industrial installations such aspower plants, cement factories, waste incinerators etc.
Europe is expected to progressively apply more stringent NOx emission limits. The marinemarket is currently driven by Sweden and Norway and many countries are expected toenact similar legislation soon. To fully serve the marine market, Yara established a jointventure with Wilhelmsen Maritime Services in 2007 under the name of Yarwil.
84
85
Technical AN: the main raw material for civil explosives
Technical ammonium nitrate is the main raw material for ANFO ( Ammonium Nitrate FuelOil) which is the most used and most economical civil explosive currently on the market.The main civil explosive market segments are mining and infrastructure development.
ANFO was developed 40 years ago and has grown to be the most widely used industrialblasting agent in the world, due to its excellent manufacturing, handling and storageproperties, low cost per energy unit, high safety levels and outstanding performance.
Calcium nitrate is used as a secondary nitrate in emulsion explosives. It extends theshelf life of the emulsion, increases the solubility of the ammonium nitrate and increasesthe total energy content of the emulsion.
86
CO2 at every stage of food production and processing
The main applications of CO2 are for use in the production of soft drinks and in thebrewing sector, as well as for process cooling and freezing in the food sector. Carbondioxide (CO2) is used in the production, storage and transport of foods; from the plantingof salads and tomatoes as seeds in the greenhouse, or from when salmon areintroduced as fry in fish farms until they arrive on the dining table.
In greenhouses without a supply of CO2, the level of this gas can drop to under half ofwhat is normally found in air. When the correct amount of CO2 added at the right time(during periods of light) some plant cultures can increase their yield by 30-50%.
CO2 or nitrogen is used as a cooling agent for the freezing of foods, as atmospheres inthe packing of foodstuffs to prolong the shelf-life of the products, and to maintain acontrolled temperature during storage and transport. CO2 gas enables low temperaturesto be attained in a short time, preventing damage and minimizing thawing damage.
87
H2S abatement for waste waterThe presence of hydrogen sulphide (H2S) in waste water and sludge is defined as aseptic condition. By preventing septic conditions from arising, negative effects likeodours, health hazards, corrosion and reduced efficiency of the treatment plant, can beeliminated or reduced.
Yara’s calcium nitrate based septicity control process is a natural biological method ofpreventing septicity and removing H2S by controlled dosage of nitrate. It can be usedboth for municipal sewer systems and industrial wastewater and sludge, and is non-toxic,non-corrosive, pH-neutral and safe-to-handle.
Nitrate-based products are also used to reduce H2S toxic emissions in oil fields andpipelines.
88
89
Related Documents