Toyota Australia’s 2014 Sustainability Report

Welcome message from author
This document is posted to help you gain knowledge. Please leave a comment to let me know what you think about it! Share it to your friends and learn new things together.
Transcript
Toyota Australia’s 2014 Sustainability Report
2014 Sustainability Report toyota.com.au/toyota/sustainability
CONTENTSPresident’s Message 3
About Toyota Australia 4
Our Stakeholders 5
Why We Report 8
Strategy and Governance 11
Manufacturing Viability 16
Supplier Support 19
Economic Performance 22
Innovation – Cars of the Future 25
Managing Environmental Impacts 29
Our Employees 34
Community Partnerships 40
Assurance Statement 43
GRI Index 44
Contact / Feedback 47
2014 Sustainability Report toyota.com.au/toyota/sustainability
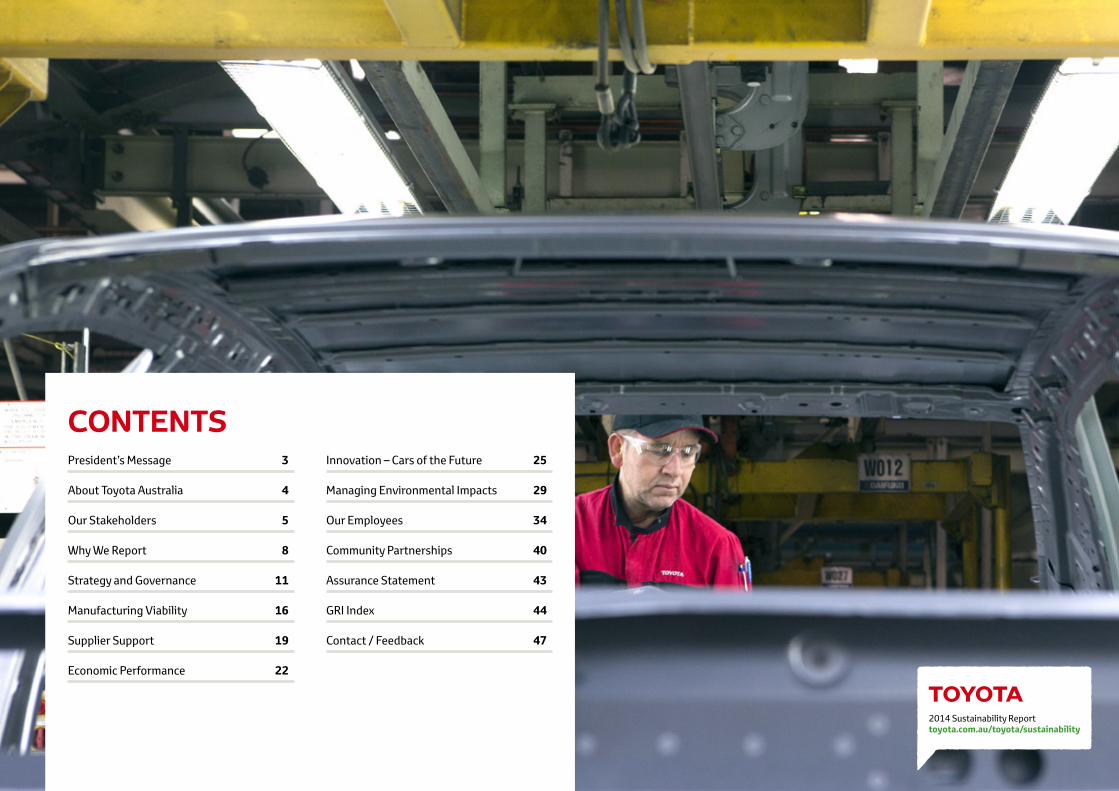
PRESIDENT’S MESSAGE
Our key priorities were to secure the future of our local manufacturing operations, continue to deliver exciting vehicles to our customers and contribute to the communities in which we operate.
To address the ongoing challenges facing the automotive manufacturing industry, we embarked on the second year of our company-wide transformation journey to strengthen our business.
This meant that every division in the company was tasked with finding new ways to improve productivity and reduce costs so that our company could be sustainable in the future.
All of our employees worked tirelessly to support this journey and exceeded our performance and cost reduction targets for the 2013/14 financial year.
Due to this hard work we were able to secure the investment for the new-look Camry, which will be built at our Altona manufacturing plant from 2015.
Despite this positive news however, factors such as an unfavourable Australian dollar, high costs of manufacturing and low economies of scale placed pressure on our manufacturing operations.
We did everything that we could do to strengthen our company but in February 2014 we made the difficult decision to stop building cars in Australia by the end of 2017.
This was one of the saddest days in Toyota’s history.
Since making this decision our immediate focus has shifted to supporting our employees and local suppliers as we transition to a national sales and distribution company.
We have established a dedicated team that will oversee the company’s transition and provide relevant training to impacted employees so that they can have more confidence about their future.
Together with the state and federal governments, we are also providing support to our local suppliers and assisting them in identifying opportunities to diversify their business.
This approach is based on the two pillars of the Toyota Way philosophy. The first pillar is respect for people, which is something that we endeavour to do in all aspects of our day to day business.
The second pillar is continuous improvement, which means that we are always looking for new ways to improve our business.
These principles will not only guide us during our transition period, but they will also be the foundation of all future activities.
Although we may not be building cars after 2017, the Australian market remains a key part of Toyota’s overall global strategy.
Our commitment to our people will never change and we will continue to deliver innovative new products to our customers that are cutting-edge and fun to drive.
Dave Buttner President, Toyota Australia
The past year was one of mixed emotions for everyone at Toyota Australia.
2014 Sustainability Report toyota.com.au/toyota/sustainability
Our corporate headquarters is located in Port Melbourne, Victoria and our manufacturing plant is in Altona, Victoria. Sales and marketing operations are managed from Woolooware Bay, New South Wales with regional offices located in all mainland Australian states, except Western Australia where an independent company distributes Toyota branded vehicles on behalf of Toyota. Toyota Australia distributes Lexus vehicles in Western Australia.
We have four key operating arms in Australia – sales and marketing, product planning and development, corporate services, and manufacturing and purchasing. Lexus is managed under Toyota Australia’s sales and marketing arm.
The Sydney City Toyota and Sydney City Lexus dealership is a wholly owned subsidiary of Toyota Australia. All other Toyota and Lexus dealers are independently owned.
The cars we sell are either imported or manufactured in Australia. Our customers are spread across the country and are serviced by our dealer network. We sell vehicles to private buyers and to private and government fleets.
We began our export program in 1986 with exports to New Zealand. Ten years later the program was expanded to include the Middle East. We now ship Australian made vehicles to Bahrain, Kuwait, Oman, Qatar, Saudi Arabia, United Arab Emirates, Yemen, New Zealand and the South Pacific Islands.
This report covers the activities and performance of all divisions and dealerships owned by Toyota Australia as described above.
ABOUT TOYOTA AUSTRALIAToyota Motor Corporation Australia Limited (Toyota Australia) is a wholly-owned subsidiary of Toyota Motor Corporation (TMC) in Japan. We are a leading manufacturer, distributor and exporter of vehicles under the Toyota and Lexus brands.
2014 Sustainability Report toyota.com.au/toyota/sustainability
Our stakeholders are those groups who are affected by or affect Toyota Australia. Our stakeholders have been identified as:
our shareholder - Toyota Motor Corporation (TMC)
employees
customers
dealers
suppliers
community groups
government
OUR STAKEHOLDERS
S2014 Sustainability Report toyota.com.au/toyota/sustainability
6 OUR STAKEHOLDERS
Both companies worked very closely on the issue of the future of manufacturing in Australia, and the decision to close operations in Altona was made jointly.
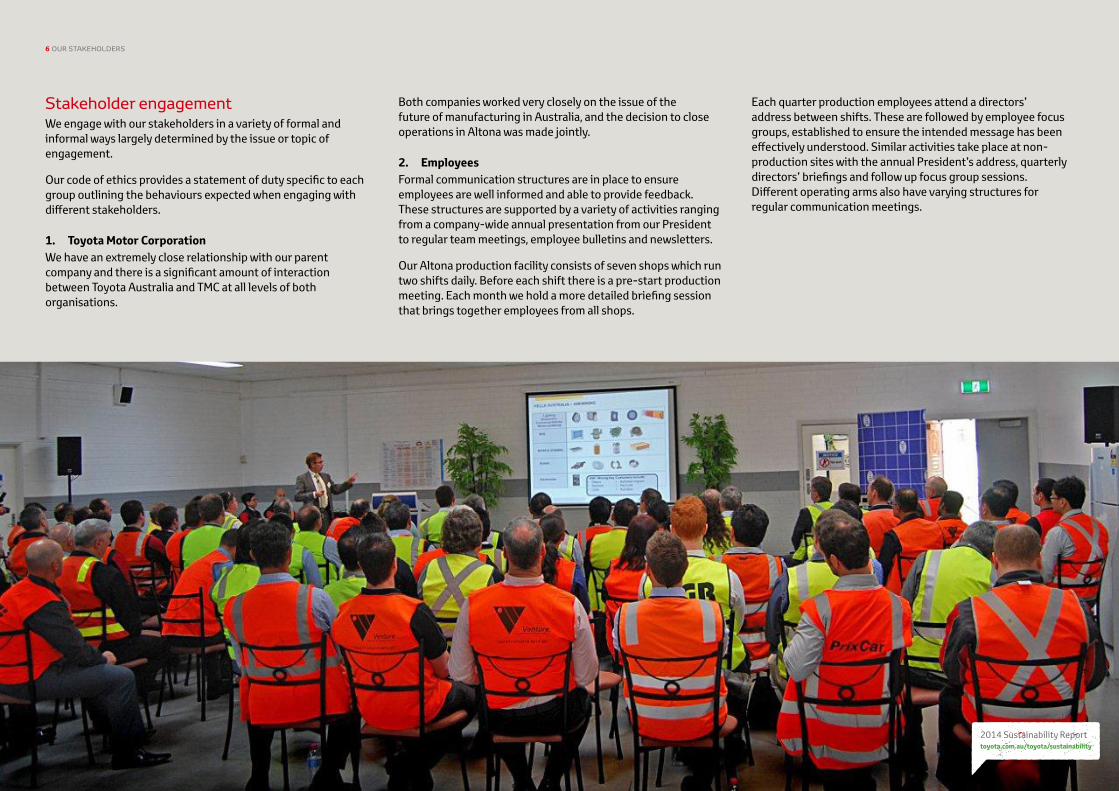
2. EmployeesFormal communication structures are in place to ensure employees are well informed and able to provide feedback. These structures are supported by a variety of activities ranging from a company-wide annual presentation from our President to regular team meetings, employee bulletins and newsletters.
Our Altona production facility consists of seven shops which run two shifts daily. Before each shift there is a pre-start production meeting. Each month we hold a more detailed briefing session that brings together employees from all shops.
Stakeholder engagementWe engage with our stakeholders in a variety of formal and informal ways largely determined by the issue or topic of engagement.
Our code of ethics provides a statement of duty specific to each group outlining the behaviours expected when engaging with different stakeholders.
1. Toyota Motor CorporationWe have an extremely close relationship with our parent company and there is a significant amount of interaction between Toyota Australia and TMC at all levels of both organisations.
Each quarter production employees attend a directors’ address between shifts. These are followed by employee focus groups, established to ensure the intended message has been effectively understood. Similar activities take place at non-production sites with the annual President’s address, quarterly directors’ briefings and follow up focus group sessions. Different operating arms also have varying structures for regular communication meetings.
1 Other than Sydney City Toyota and Sydney City Lexus which are owned by Toyota Australia. S2014 Sustainability Report toyota.com.au/toyota/sustainability
7 OUR STAKEHOLDERS
3. CustomersThe key point of contact with customers is our network of dealers located around Australia. They are supported by Toyota’s customer experience centre and the Lexus customer assistance centre which provide an interface for customers on issues ranging from new vehicle launches to vehicle recalls. We also have a customer satisfaction program which surveys customers who either purchased or serviced their vehicle at a Toyota dealership.
Another way in which we interact with the broader customer base is through our marketing and advertising presence and messaging. We aim to comply with all relevant laws and voluntary codes including the Competition and Consumer Act 2010 and the Federal Chamber of Automotive Industries’ voluntary code of practice for motor vehicle advertising.
4. DealersWhile independently owned1, our dealer network is an extension of Toyota Australia and integral to our success, providing an interface between the company and our customers.
There are 210 Toyota dealers, with a total of 277 outlets, and 19 Lexus dealers, with a total of 24 outlets, located across Australia employing more than 13,000 people.
Our support of dealers includes helping them to understand their environmental responsibilities, acknowledging outstanding customer service through the customer service excellence awards national skills contest and providing dealers with training and development opportunities.
We also have a formal structure in place to ensure dealers are engaged and updated. Regional offices coordinate monthly meetings with dealer principles in each of the five regions. The national sales team holds quarterly meetings and each year Toyota Australia’s president, directors and divisional managers spend several weeks visiting dealers. Dealers also have access to information through an internet portal.
5. SuppliersIn addition to our extensive supplier development program (as detailed in the section of this report – Our suppliers), we have regular interaction with our suppliers on a range of issues. Other formal engagement includes our annual supplier conference and supplier awards.
6. Community The Toyota Community Foundation (TFC) provides the basis for our engagement with the community. The work of the TFC is detailed extensively in the section of this report – Community partnerships.
7. GovernmentToyota Australia has a government affairs department which has regular discussions with federal and state governments on a wide range of public policy issues. Our approach is to either engage with government directly or through our industry association – the Federal Chamber of Automotive Industries (FCAI). The intention of our approach is to ensure issues specific to Toyota Australia and to the automotive industry are considered in public policy decisions.
Regular updates are provided to the board with more detailed briefings as required. The government affairs team also provides a fortnightly briefing to Toyota Australia’s president.
We are also members of the:
Australian Industry Group
Centre for Corporate Public Affairs
Committee for Economic Development of Australia
Federal Chamber of Automotive Industries
The Global Foundation
Manufacturing Excellence Taskforce Australia
The Victorian Employers’ Chamber of Commerce and Industry
ALL OUR CUSTOMER INTERACTIONS ARE GUIDED BY OUR CODE OF ETHICS.
2014 Sustainability Report toyota.com.au/toyota/sustainability
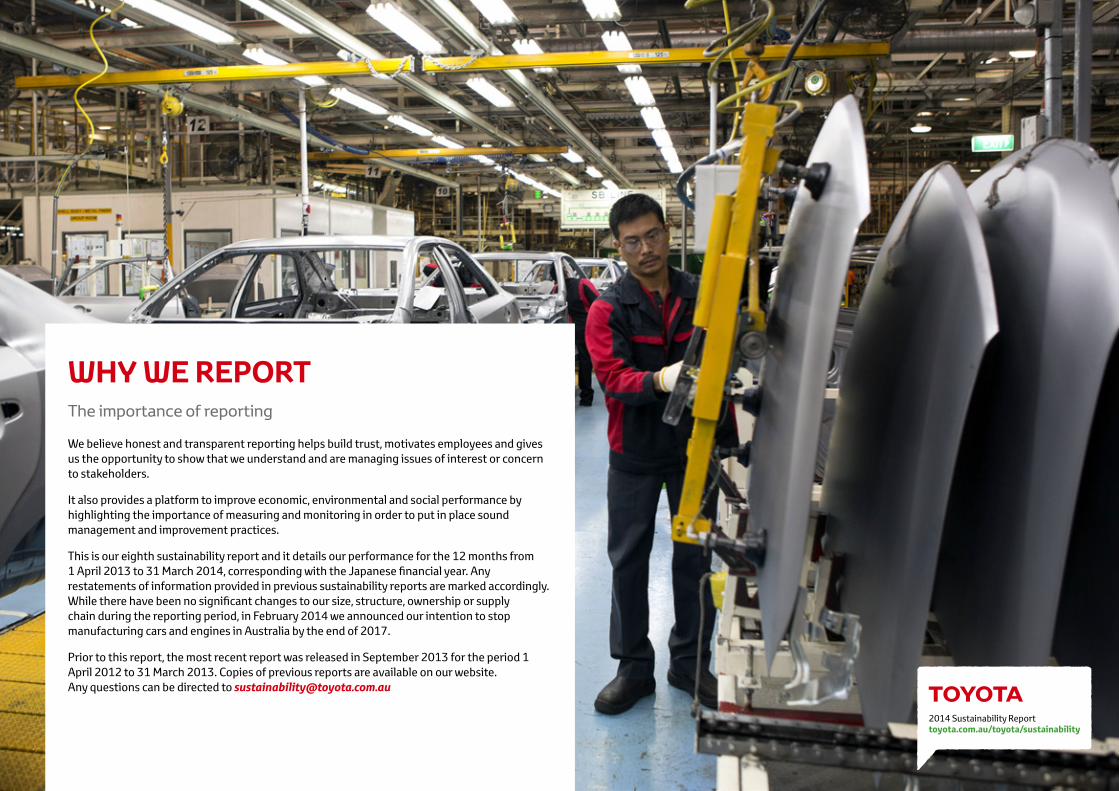
The importance of reporting
WHY WE REPORT
We believe honest and transparent reporting helps build trust, motivates employees and gives us the opportunity to show that we understand and are managing issues of interest or concern to stakeholders.
It also provides a platform to improve economic, environmental and social performance by highlighting the importance of measuring and monitoring in order to put in place sound management and improvement practices.
This is our eighth sustainability report and it details our performance for the 12 months from 1 April 2013 to 31 March 2014, corresponding with the Japanese financial year. Any restatements of information provided in previous sustainability reports are marked accordingly. While there have been no significant changes to our size, structure, ownership or supply chain during the reporting period, in February 2014 we announced our intention to stop manufacturing cars and engines in Australia by the end of 2017.
Prior to this report, the most recent report was released in September 2013 for the period 1 April 2012 to 31 March 2013. Copies of previous reports are available on our website. Any questions can be directed to [email protected]
S2014 Sustainability Report toyota.com.au/toyota/sustainability
9 WHY WE REPORT
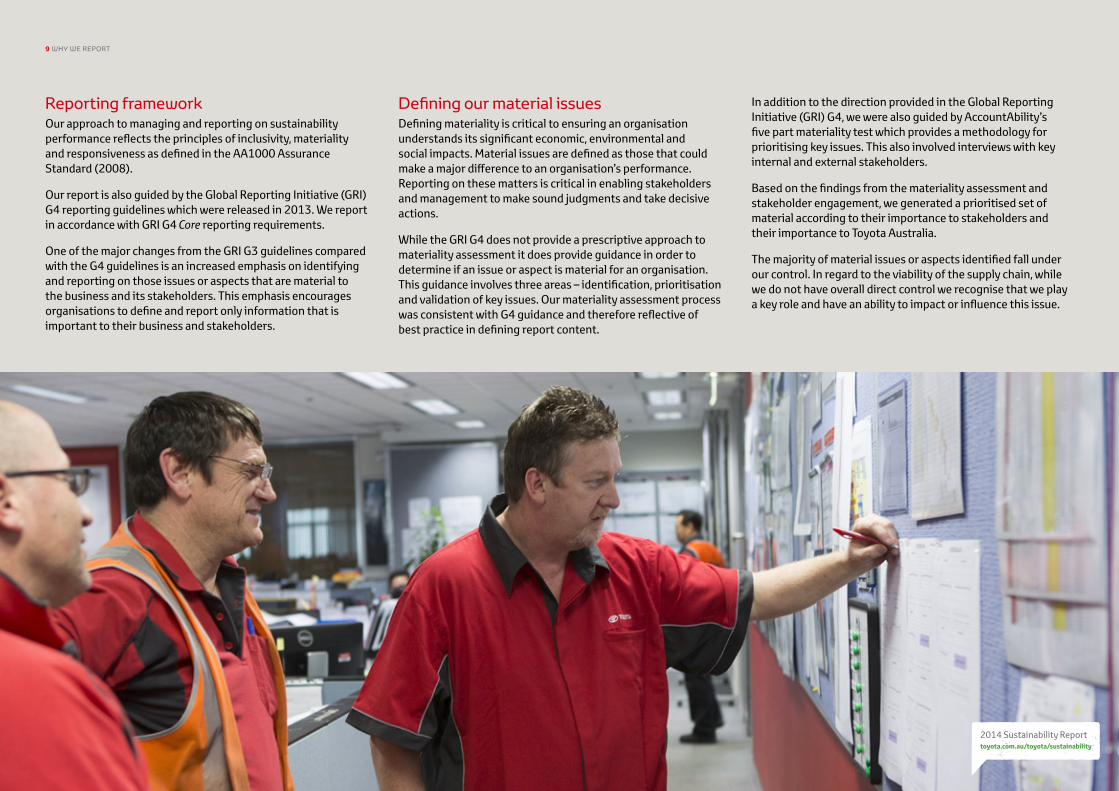
Reporting frameworkOur approach to managing and reporting on sustainability performance reflects the principles of inclusivity, materiality and responsiveness as defined in the AA1000 Assurance Standard (2008).
Our report is also guided by the Global Reporting Initiative (GRI) G4 reporting guidelines which were released in 2013. We report in accordance with GRI G4 Core reporting requirements.
One of the major changes from the GRI G3 guidelines compared with the G4 guidelines is an increased emphasis on identifying and reporting on those issues or aspects that are material to the business and its stakeholders. This emphasis encourages organisations to define and report only information that is important to their business and stakeholders.
Defining our material issuesDefining materiality is critical to ensuring an organisation understands its significant economic, environmental and social impacts. Material issues are defined as those that could make a major difference to an organisation’s performance. Reporting on these matters is critical in enabling stakeholders and management to make sound judgments and take decisive actions.
While the GRI G4 does not provide a prescriptive approach to materiality assessment it does provide guidance in order to determine if an issue or aspect is material for an organisation. This guidance involves three areas – identification, prioritisation and validation of key issues. Our materiality assessment process was consistent with G4 guidance and therefore reflective of best practice in defining report content.
In addition to the direction provided in the Global Reporting Initiative (GRI) G4, we were also guided by AccountAbility’s five part materiality test which provides a methodology for prioritising key issues. This also involved interviews with key internal and external stakeholders.
Based on the findings from the materiality assessment and stakeholder engagement, we generated a prioritised set of material according to their importance to stakeholders and their importance to Toyota Australia.
The majority of material issues or aspects identified fall under our control. In regard to the viability of the supply chain, while we do not have overall direct control we recognise that we play a key role and have an ability to impact or influence this issue.
S2014 Sustainability Report toyota.com.au/toyota/sustainability
10 WHY WE REPORT
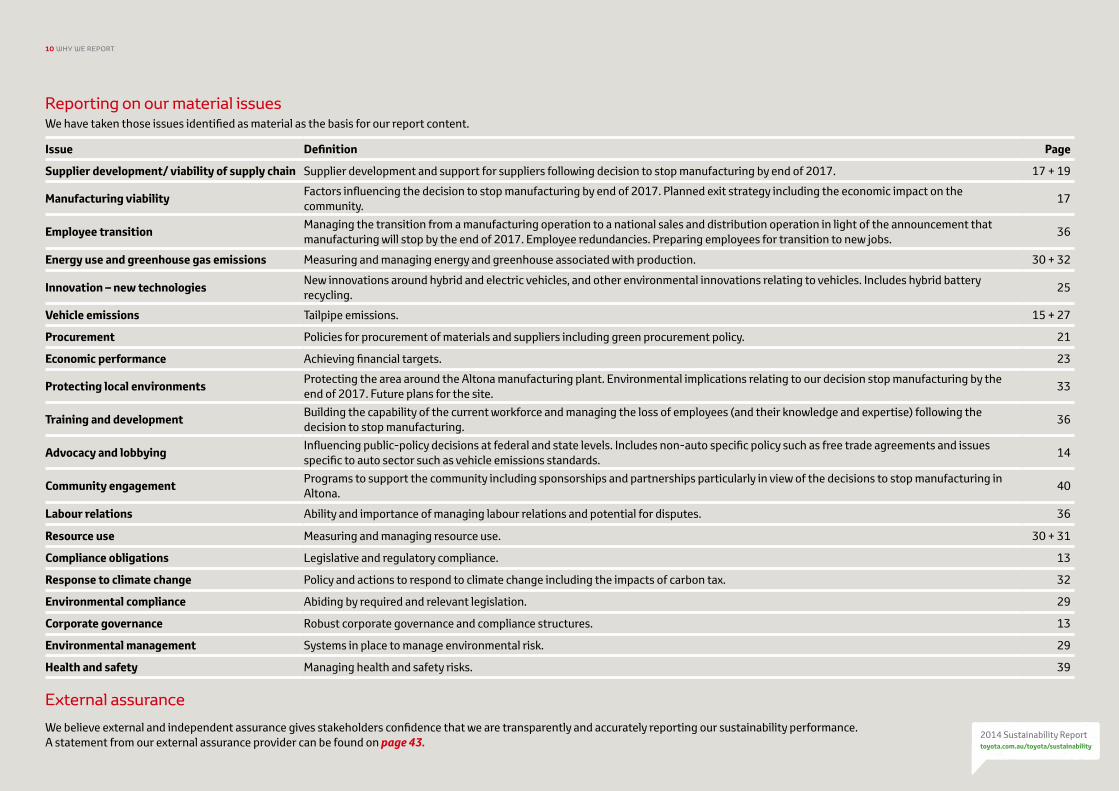
Reporting on our material issuesWe have taken those issues identified as material as the basis for our report content.
Issue Definition Page
Supplier development/ viability of supply chain Supplier development and support for suppliers following decision to stop manufacturing by end of 2017. 17 + 19
Manufacturing viability Factors influencing the decision to stop manufacturing by end of 2017. Planned exit strategy including the economic impact on the community. 17
Employee transition Managing the transition from a manufacturing operation to a national sales and distribution operation in light of the announcement that manufacturing will stop by the end of 2017. Employee redundancies. Preparing employees for transition to new jobs. 36
Energy use and greenhouse gas emissions Measuring and managing energy and greenhouse associated with production. 30 + 32
Innovation – new technologies New innovations around hybrid and electric vehicles, and other environmental innovations relating to vehicles. Includes hybrid battery recycling. 25
Vehicle emissions Tailpipe emissions. 15 + 27
Procurement Policies for procurement of materials and suppliers including green procurement policy. 21
Economic performance Achieving financial targets. 23
Protecting local environments Protecting the area around the Altona manufacturing plant. Environmental implications relating to our decision stop manufacturing by the end of 2017. Future plans for the site. 33
Training and development Building the capability of the current workforce and managing the loss of employees (and their knowledge and expertise) following the decision to stop manufacturing. 36
Advocacy and lobbying Influencing public-policy decisions at federal and state levels. Includes non-auto specific policy such as free trade agreements and issues specific to auto sector such as vehicle emissions standards. 14
Community engagement Programs to support the community including sponsorships and partnerships particularly in view of the decisions to stop manufacturing in Altona. 40
Labour relations Ability and importance of managing labour relations and potential for disputes. 36
Resource use Measuring and managing resource use. 30 + 31
Compliance obligations Legislative and regulatory compliance. 13
Response to climate change Policy and actions to respond to climate change including the impacts of carbon tax. 32
Environmental compliance Abiding by required and relevant legislation. 29
Corporate governance Robust corporate governance and compliance structures. 13
Environmental management Systems in place to manage environmental risk. 29
Health and safety Managing health and safety risks. 39
External assurance
We believe external and independent assurance gives stakeholders confidence that we are transparently and accurately reporting our sustainability performance. A statement from our external assurance provider can be found on page 43.
2014 Sustainability Report toyota.com.au/toyota/sustainability
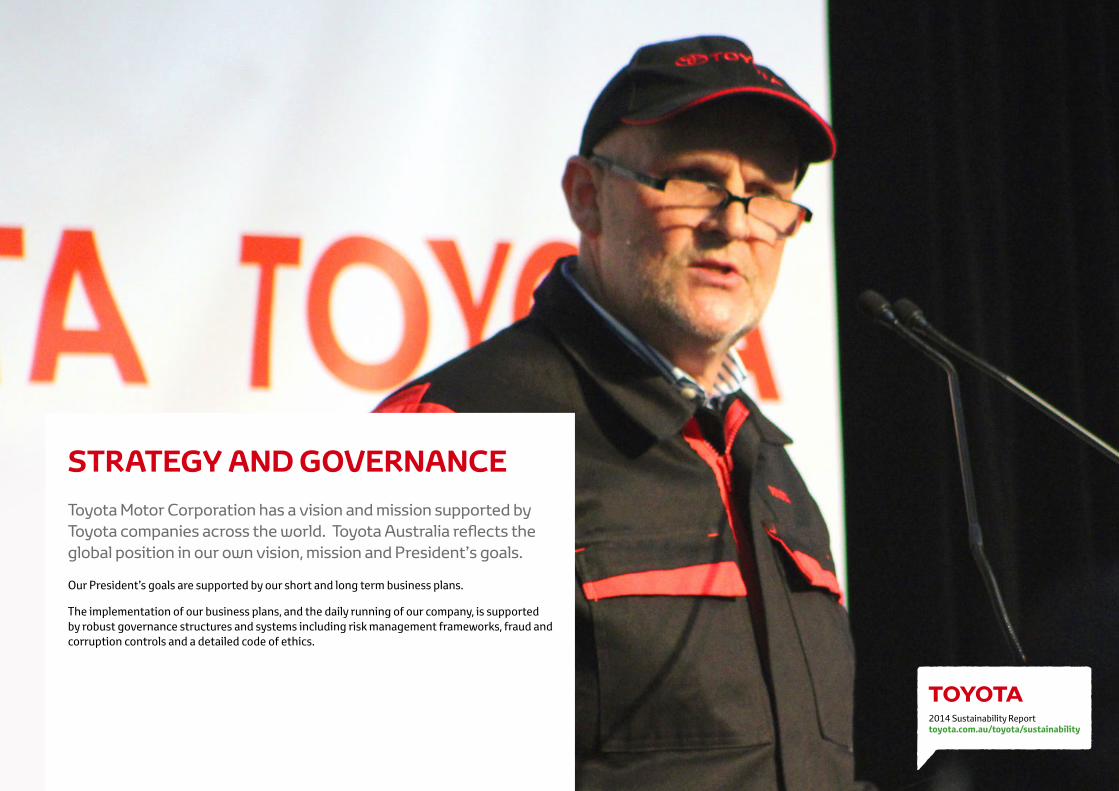
Toyota Motor Corporation has a vision and mission supported by Toyota companies across the world. Toyota Australia reflects the global position in our own vision, mission and President’s goals.
STRATEGY AND GOVERNANCE
Our President’s goals are supported by our short and long term business plans.
The implementation of our business plans, and the daily running of our company, is supported by robust governance structures and systems including risk management frameworks, fraud and corruption controls and a detailed code of ethics.
S2014 Sustainability Report toyota.com.au/toyota/sustainability
12 STRATEGY AND GOVERNANCE
Vision and missionGuiding Principles – Toyota MissionTMC’s seven Guiding Principles, which were adopted in 1992, define the company’s mission and underpin Toyota operations around the world.
1. Honour the language and spirit of the law of every nation and undertake open and fair business activities to be a good corporate citizen of the world.
2. Respect the culture and customs of every nation and contribute to economic and social development through corporate activities in their respective communities.
3. Dedicate our business to providing clean and safe products and to enhancing the quality of life everywhere through all of our activities.
4. Create and develop advanced technologies and provide outstanding products and services that fulfil the needs of customers worldwide.
5.
Foster a corporate culture that enhances both individual creativity and the value of teamwork, while honouring mutual trust and respect between labour and management.
6. Pursue growth through harmony with the global community via innovative management.
7.
Work with business partners in research and manufacture to achieve stable, long-term growth and mutual benefits, while keeping ourselves open to new partnerships.
The Toyota Way
The Toyota Way was introduced globally in 2001 to articulate the long standing values of the company. It is based on Toyota’s seven guiding principles which define the values and behaviours expected from Toyota employees. Central to the Toyota Way are two platforms – continuous improvement and respect for people.
Toyota Global VisionThe Toyota Global Vision outlines our aspirations as a company. It was developed in 2011 and details the values and actions required to unite Toyota for future prosperity.
The Global Vision has been developed to be similar to a tree in that its roots, the foundation of the company, are the Toyota values as articulated in the Guiding Principles and the Toyota Way. The trunk provides a stable base of business and the resulting fruits are always better cars and enriched communities. All of this exists within a structure of sustainable growth.
Strategic directionIn addition to our ongoing strategic and business planning processes, we continued to implement our transformation strategy during the reporting period. The transformation strategy was launched in 2011 with the aim of restructuring our business model to ensure profitability and sustainability with a particular focus on maintaining our manufacturing plant. Despite achieving key milestones it was determined that maintaining our manufacturing presence in Australia was not sustainable in the long term. In February 2014 we announced our decision to stop manufacturing in Australia by the end of 2017.
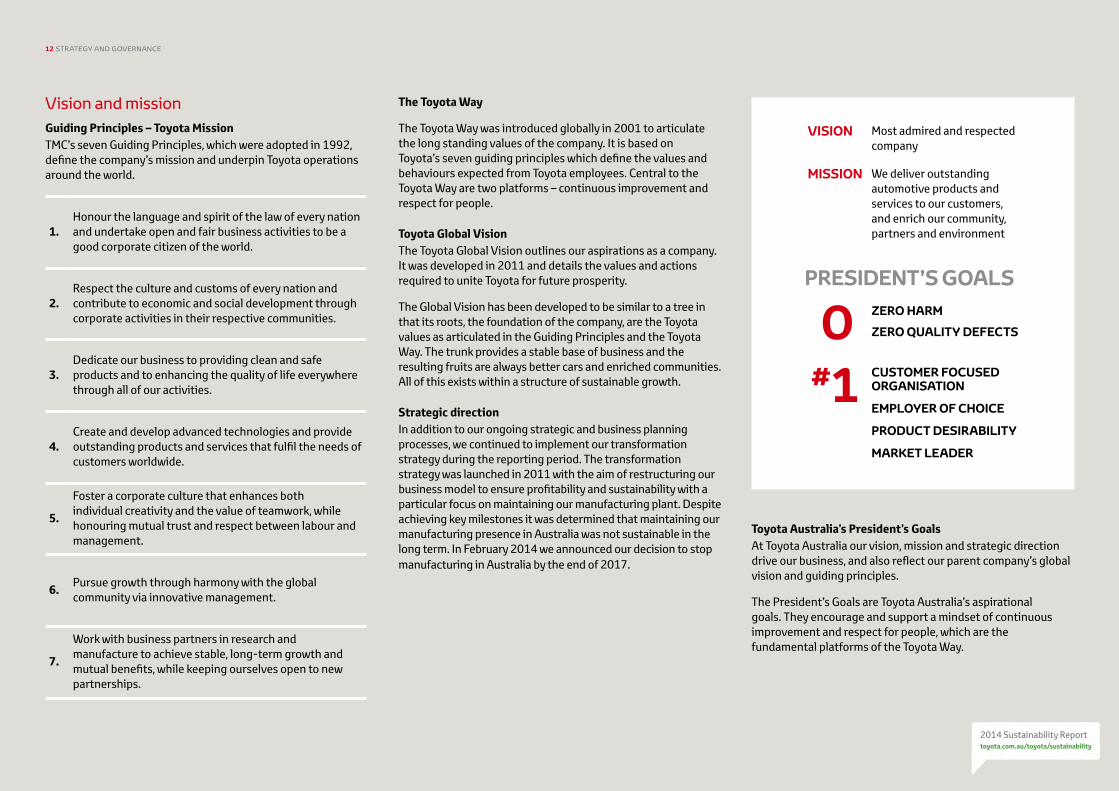
We deliver outstanding automotive products and services to our customers, and enrich our community, partners and environment
ZERO HARM
ZERO QUALITY DEFECTS
CUSTOMER FOCUSED ORGANISATION
EMPLOYER OF CHOICE
PRODUCT DESIRABILITY
MARKET LEADER
PRESIDENT’S GOALS
0#1
Most admired and respected company
VISION
MISSION
Toyota Australia’s President’s GoalsAt Toyota Australia our vision, mission and strategic direction drive our business, and also reflect our parent company’s global vision and guiding principles.
The President’s Goals are Toyota Australia’s aspirational goals. They encourage and support a mindset of continuous improvement and respect for people, which are the fundamental platforms of the Toyota Way.
S2014 Sustainability Report toyota.com.au/toyota/sustainability
13 STRATEGY AND GOVERNANCE
Corporate governanceToyota has robust systems in place to manage corporate governance including risk management frameworks, a fraud and corruption control program and a detailed code of ethics.
New Chairman and President announced On 2 April 2014 we announced that current President and Chief Executive Officer Max Yasuda had been appointed to the newly created role of Chairman of the Board of Toyota Australia, effective 1 May 2014.
Mr. Yasuda started his career at TMC Japan in 1972 and was appointed President and CEO of Toyota Australia in August 2007. Prior to this he spent four years as Chairman and CEO of Toyota France.
As a result of Mr. Yasuda’s appointment, Toyota Australia’s Executive Vice President and Chief Operating Officer Dave Buttner was promoted to President of Toyota Australia, also effective 1 May 2014.
Since joining Toyota Australia in 1987, Mr. Buttner has held various positions in manufacturing, production control, quality administration, production engineering, purchasing and sales and marketing. Before being appointed Executive Vice President in 2012, he was the Senior Executive Director of sales and marketing.
Board committeesToyota Australia has established a number of board committees to assist in the execution of the board’s duties and to allow detailed consideration of complex issues.
There are four board committees – Senior Management Committee, Corporate Compliance Committee, Human Resource Committee and Toyota Product Committee. Board committees are supported by a range of management sub-committees such as the Environment Committee which reports to the Corporate Compliance Committee.
We did not record any significant fines or non-monetary sanctions for non-compliance with laws and regulations during the reporting period.
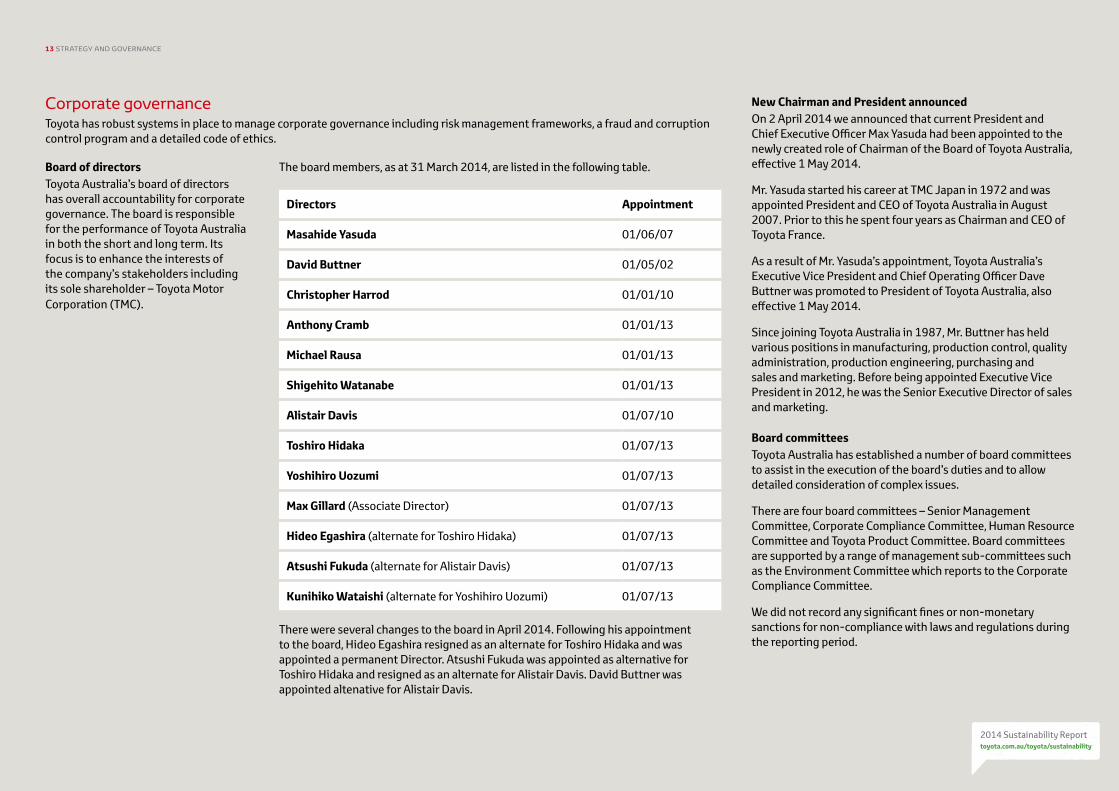
Board of directorsToyota Australia’s board of directors has overall accountability for corporate governance. The board is responsible for the performance of Toyota Australia in both the short and long term. Its focus is to enhance the interests of the company’s stakeholders including its sole shareholder – Toyota Motor Corporation (TMC).
The board members, as at 31 March 2014, are listed in the following table.
Directors Appointment
Masahide Yasuda 01/06/07
David Buttner 01/05/02
Christopher Harrod 01/01/10
Anthony Cramb 01/01/13
Michael Rausa 01/01/13
Shigehito Watanabe 01/01/13
Alistair Davis 01/07/10
Toshiro Hidaka 01/07/13
Yoshihiro Uozumi 01/07/13
Max Gillard (Associate Director) 01/07/13
Hideo Egashira (alternate for Toshiro Hidaka) 01/07/13
Atsushi Fukuda (alternate for Alistair Davis) 01/07/13
Kunihiko Wataishi (alternate for Yoshihiro Uozumi) 01/07/13
There were several changes to the board in April 2014. Following his appointment to the board, Hideo Egashira resigned as an alternate for Toshiro Hidaka and was appointed a permanent Director. Atsushi Fukuda was appointed as alternative for Toshiro Hidaka and resigned as an alternate for Alistair Davis. David Buttner was appointed altenative for Alistair Davis.
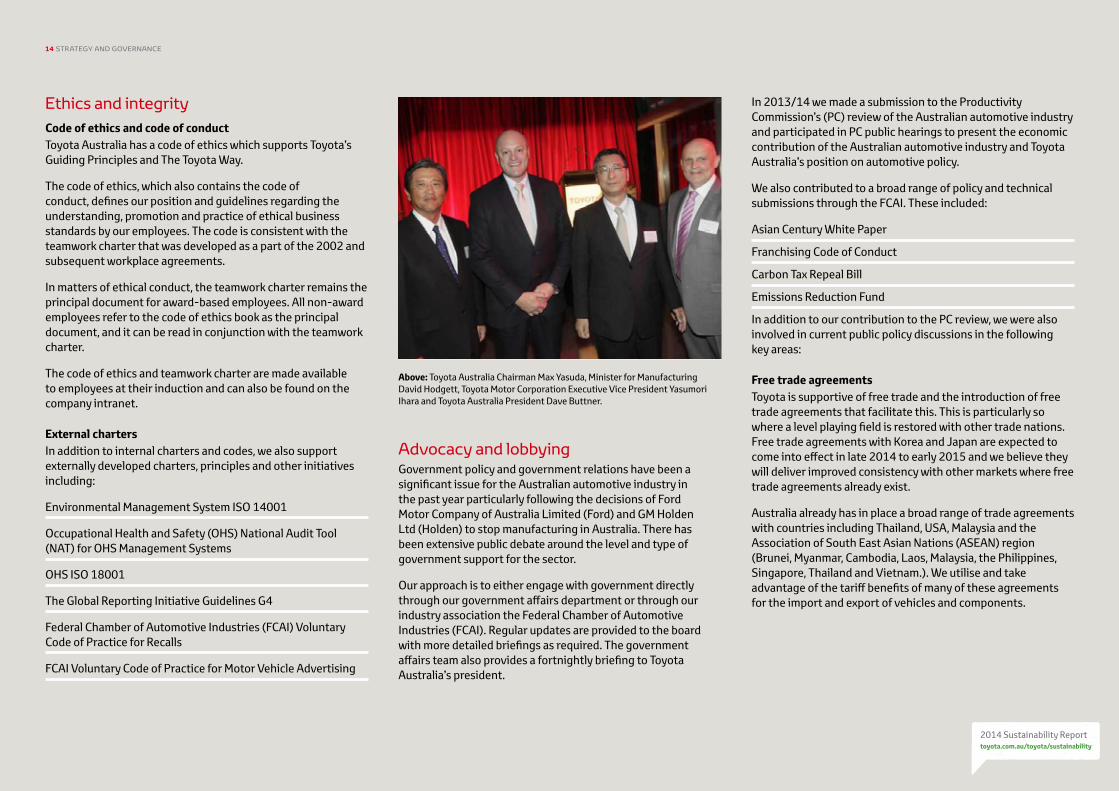
Above: Toyota Australia Chairman Max Yasuda, Minister for Manufacturing David Hodgett, Toyota Motor Corporation Executive Vice President Yasumori Ihara and Toyota Australia President Dave Buttner.
S2014 Sustainability Report toyota.com.au/toyota/sustainability
14 STRATEGY AND GOVERNANCE
Ethics and integrityCode of ethics and code of conductToyota Australia has a code of ethics which supports Toyota’s Guiding Principles and The Toyota Way.
The code of ethics, which also contains the code of conduct, defines our position and guidelines regarding the understanding, promotion and practice of ethical business standards by our employees. The code is consistent with the teamwork charter that was developed as a part of the 2002 and subsequent workplace agreements.
In matters of ethical conduct, the teamwork charter remains the principal document for award-based employees. All non-award employees refer to the code of ethics book as the principal document, and it can be read in conjunction with the teamwork charter.
The code of ethics and teamwork charter are made available to employees at their induction and can also be found on the company intranet.
External chartersIn addition to internal charters and codes, we also support externally developed charters, principles and other initiatives including:
Environmental Management System ISO 14001
Occupational Health and Safety (OHS) National Audit Tool (NAT) for OHS Management Systems
OHS ISO 18001
The Global Reporting Initiative Guidelines G4
Federal Chamber of Automotive Industries (FCAI) Voluntary Code of Practice for Recalls
FCAI Voluntary Code of Practice for Motor Vehicle Advertising
Advocacy and lobbyingGovernment policy and government relations have been a significant issue for the Australian automotive industry in the past year particularly following the decisions of Ford Motor Company of Australia Limited (Ford) and GM Holden Ltd (Holden) to stop manufacturing in Australia. There has been extensive public debate around the level and type of government support for the sector.
Our approach is to either engage with government directly through our government affairs department or through our industry association the Federal Chamber of Automotive Industries (FCAI). Regular updates are provided to the board with more detailed briefings as required. The government affairs team also provides a fortnightly briefing to Toyota Australia’s president.
In 2013/14 we made a submission to the Productivity Commission’s (PC) review of the Australian automotive industry and participated in PC public hearings to present the economic contribution of the Australian automotive industry and Toyota Australia’s position on automotive policy.
We also contributed to a broad range of policy and technical submissions through the FCAI. These included:
Asian Century White Paper
Franchising Code of Conduct
Carbon Tax Repeal Bill
Emissions Reduction Fund
In addition to our contribution to the PC review, we were also involved in current public policy discussions in the following key areas:
Free trade agreementsToyota is supportive of free trade and the introduction of free trade agreements that facilitate this. This is particularly so where a level playing field is restored with other trade nations. Free trade agreements with Korea and Japan are expected to come into effect in late 2014 to early 2015 and we believe they will deliver improved consistency with other markets where free trade agreements already exist.
Australia already has in place a broad range of trade agreements with countries including Thailand, USA, Malaysia and the Association of South East Asian Nations (ASEAN) region (Brunei, Myanmar, Cambodia, Laos, Malaysia, the Philippines, Singapore, Thailand and Vietnam.). We utilise and take advantage of the tariff benefits of many of these agreements for the import and export of vehicles and components.
S2014 Sustainability Report toyota.com.au/toyota/sustainability
15 STRATEGY AND GOVERNANCE
TaxesCarbon tax
The federal government’s climate change policy consists of two parts. The first is the repeal of the carbon pricing mechanism and the second is the implementation of its direct action plan. Direct action aims to reduce emissions by five per cent by 2020 based on 1990 levels. The government also announced an emissions reduction fund which will support investment in CO2 reduction activities by business and industry.
The repeal of the carbon tax will positively impact on Toyota Australia particularly in the areas of reducing the input cost of manufacturing as well as lower charges for refrigerant gas used in locally manufactured and import vehicles. On the basis of competitive market conditions, we absorbed these costs when the carbon tax was originally implemented rather than passing them on to the end customer.
Other taxes
The federal government has announced its intent for a comprehensive review of taxes via a tax white paper. The review is not expected to commence until the second half of 2014 and will cover a broad range of taxes including the goods and services tax, fringe benefits tax and luxury car tax. Toyota Australia will input into this process both directly and through the FCAI.
Vehicle EmissionsCO2 emissions
Vehicle emissions are a high profile issue for the industry and therefore for Toyota Australia. We seek to ensure a holistic approach to vehicle CO2 policy including the establishment of consumer incentives to purchase low emission vehicles as in other countries. We continue to support the identification and implementation of new technologies by our parent company.
While the federal government has not taken a formal position on vehicle CO2 emissions, Toyota Australia and other industry participants are continuing to implement new technologies and vehicles which deliver reduced CO2 emissions.
The National Transport Commission (NTC) publishes an annual report on CO2 emissions from new car sales. This information can be found at www.ntc.gov.au. The NTC 2013 report (published in May 2014) revealed CO2 emissions have been reducing across the automotive industry with Toyota Australia’s average falling from 210g/km in 2012 to 203g/km in 2013, a reduction of 3.3 percent1.
Grey importsAustralia currently has a low volume/specialty vehicle import scheme as well as a $12,000 tariff on imported used cars.
The federal government is expected to begin a review of the Motor Vehicle Standards Act 1989 in the latter half of 2014 which is expected to encompass grey imports as well as the consideration of opportunities to reduce the regulatory burden on business and enhance productivity without compromising achievement of the Act’s objectives.
Toyota Australia is cautious against expansion of the current vehicle import scheme and will present our position both directly and through the FCAI. Concerns include issues associated with the inability to support consumers with warranty, parts and servicing, and unclear consumer benefits. If a car is not made for local conditions, there may be increased safety risks and detrimental environmental impacts.
Political contributionsThe company’s position on political contributions is detailed in our code of ethics and states that no employee shall make a political contribution on behalf of Toyota Australia unless permitted by law and as approved, in writing, by Toyota Australia’s President. The term “contributions” includes giving of company funds, services, or assets. Toyota Australia did not make any political contributions in the reporting period.
1 Emissions vary depending on driving conditions / style, vehicle conditions and options / accessories.
TOYOTA IS SUPPORTIVE OF FREE TRADE AND THE INTRODUCTION OF FREE TRADE AGREEMENTS THAT FACILITATE THIS
2014 Sustainability Report toyota.com.au/toyota/sustainability
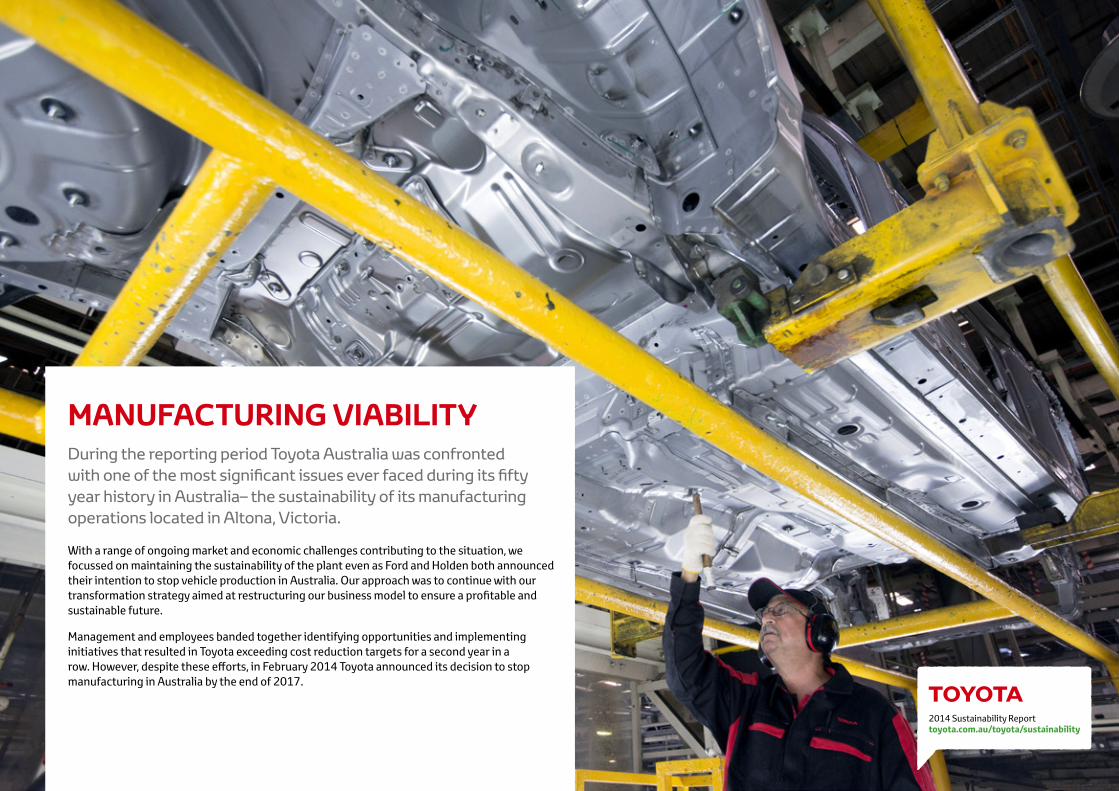
During the reporting period Toyota Australia was confronted with one of the most significant issues ever faced during its fifty year history in Australia– the sustainability of its manufacturing operations located in Altona, Victoria.
MANUFACTURING VIABILITY
With a range of ongoing market and economic challenges contributing to the situation, we focussed on maintaining the sustainability of the plant even as Ford and Holden both announced their intention to stop vehicle production in Australia. Our approach was to continue with our transformation strategy aimed at restructuring our business model to ensure a profitable and sustainable future.
Management and employees banded together identifying opportunities and implementing initiatives that resulted in Toyota exceeding cost reduction targets for a second year in a row. However, despite these efforts, in February 2014 Toyota announced its decision to stop manufacturing in Australia by the end of 2017.
S2014 Sustainability Report toyota.com.au/toyota/sustainability
17 MANUFACTURING VIABILITY
Announcement of closureThe announcement to stop building cars in Australia by the end of 2017 and transition to a national sales and distribution company was extremely difficult. The decision was not based on any single factor but driven by a range of external influences including the unfavourable Australian dollar making exports unviable, the high costs of manufacturing and low economies of scale for vehicle production and our local supplier base. For these reasons, combined with Australia being one of the most open and fragmented automotive markets in the world and increased competitiveness due to current and future free trade agreements, it was determined it was no longer viable for Toyota to continue building cars in Australia.
Impact on stakeholdersWe acknowledge that our decision to stop manufacturing will have a significant impact on stakeholders. Our focus is to work with our employees and suppliers, and support government as we transition to a national sales and distribution company.
As we prepare for the end of vehicle manufacturing in Australia we need to ensure our local suppliers and employees can plan for their future. We also need to guarantee the continued production of high quality vehicles and engines for our domestic and export customers until the closure of our manufacturing operations.
EmployeesApproximately 2,500 employees directly involved with manufacturing will be impacted when the plant stops building cars by the end of 2017. There will also be changes to the company’s corporate divisions with a process commencing in 2014 to determine those corporate roles and functions which will remain and where they will be located. A decision is expected in late 2014.
Following the announcement to stop building cars by the end of 2017, support services have been made available to our employees and we will do everything that we can to minimise the impact of this decision on them. Details of employee support are included in the section of this report – Our employees.
SuppliersWe have always treated our suppliers as partners and we work closely with them to help identify and implement opportunities to improve the efficiency and productivity of their operations. We will continue to work closely with our suppliers to assist them during this transition period. More details of our supplier support can be found in the section of this report – Supplier support.
GovernmentWe will work with government to determine how best to provide support to the automotive industry including suppliers as the sector prepares for end of vehicle manufacturing in Australia.
Local communitiesWe will continue to be involved in local communities as we employ thousands of people both directly and indirectly via our extensive dealership network.
We are also involved in many community partnerships and sponsorships. While we are yet to determine whether there will be any impact on our engagement approach, we will continue to provide a high level of community support even after we transition to a national sales and distribution company. More information on our partnerships can be found in the section of this report – Community partnerships.
AS WE PREPARE FOR THE END OF VEHICLE MANUFACTURING IN AUSTRALIA WE NEED TO ENSURE OUR LOCAL SUPPLIERS AND EMPLOYEES CAN PLAN FOR THEIR FUTURE.
S2014 Sustainability Report toyota.com.au/toyota/sustainability
18 STAKEHOLDER ENGAGEMENT
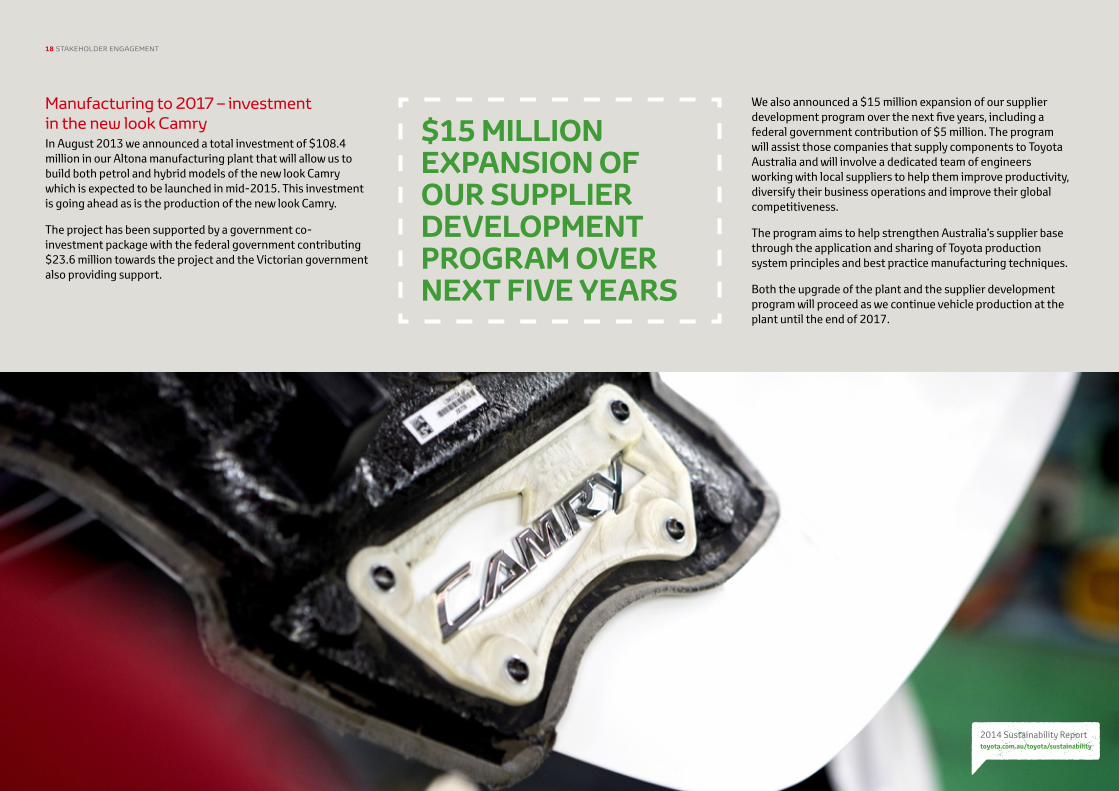
Manufacturing to 2017 – investment in the new look CamryIn August 2013 we announced a total investment of $108.4 million in our Altona manufacturing plant that will allow us to build both petrol and hybrid models of the new look Camry which is expected to be launched in mid-2015. This investment is going ahead as is the production of the new look Camry.
The project has been supported by a government co-investment package with the federal government contributing $23.6 million towards the project and the Victorian government also providing support.
We also announced a $15 million expansion of our supplier development program over the next five years, including a federal government contribution of $5 million. The program will assist those companies that supply components to Toyota Australia and will involve a dedicated team of engineers working with local suppliers to help them improve productivity, diversify their business operations and improve their global competitiveness.
The program aims to help strengthen Australia’s supplier base through the application and sharing of Toyota production system principles and best practice manufacturing techniques.
Both the upgrade of the plant and the supplier development program will proceed as we continue vehicle production at the plant until the end of 2017.
$15 MILLION EXPANSION OF OUR SUPPLIER DEVELOPMENT PROGRAM OVER NEXT FIVE YEARS
2014 Sustainability Report toyota.com.au/toyota/sustainability
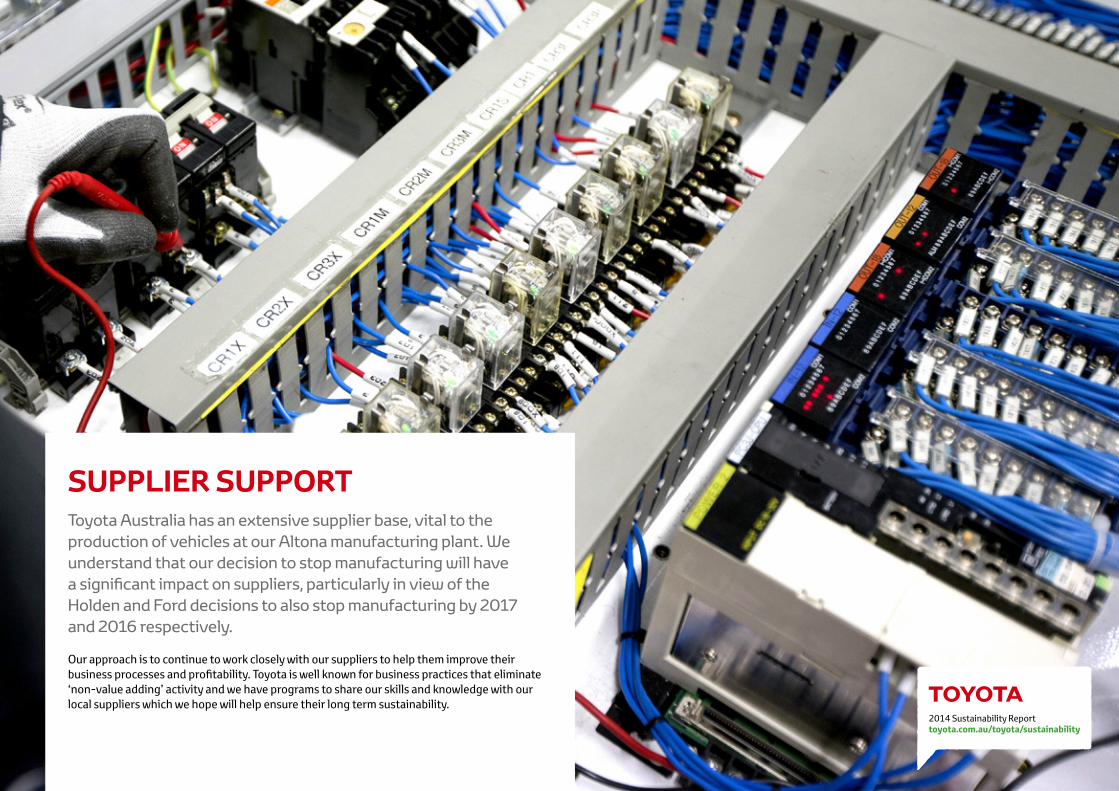
Toyota Australia has an extensive supplier base, vital to the production of vehicles at our Altona manufacturing plant. We understand that our decision to stop manufacturing will have a significant impact on suppliers, particularly in view of the Holden and Ford decisions to also stop manufacturing by 2017 and 2016 respectively.
SUPPLIER SUPPORT
Our approach is to continue to work closely with our suppliers to help them improve their business processes and profitability. Toyota is well known for business practices that eliminate ‘non-value adding’ activity and we have programs to share our skills and knowledge with our local suppliers which we hope will help ensure their long term sustainability.
S2014 Sustainability Report toyota.com.au/toyota/sustainability
S
S
20 SUPPLIER SUPPORT
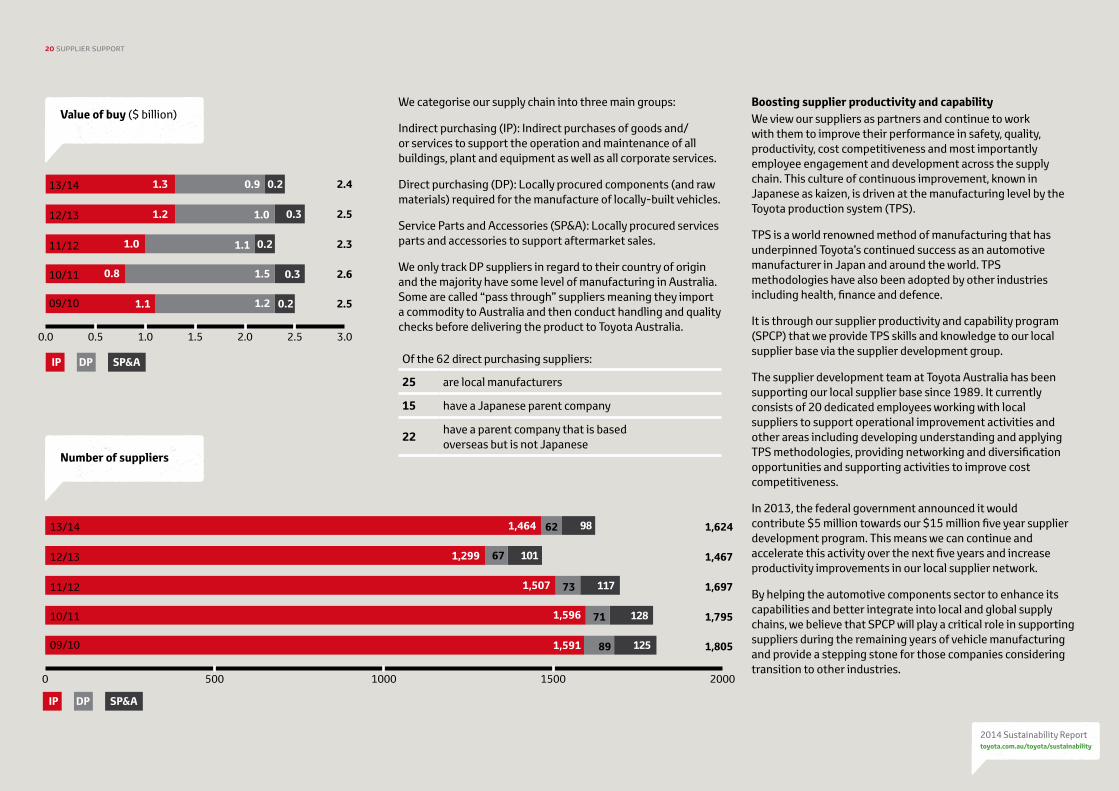
We categorise our supply chain into three main groups:
Indirect purchasing (IP): Indirect purchases of goods and/or services to support the operation and maintenance of all buildings, plant and equipment as well as all corporate services.
Direct purchasing (DP): Locally procured components (and raw materials) required for the manufacture of locally-built vehicles.
Service Parts and Accessories (SP&A): Locally procured services parts and accessories to support aftermarket sales.
We only track DP suppliers in regard to their country of origin and the majority have some level of manufacturing in Australia. Some are called “pass through” suppliers meaning they import a commodity to Australia and then conduct handling and quality checks before delivering the product to Toyota Australia.
Of the 62 direct purchasing suppliers:
25 are local manufacturers
15 have a Japanese parent company
22 have a parent company that is based overseas but is not Japanese
Boosting supplier productivity and capabilityWe view our suppliers as partners and continue to work with them to improve their performance in safety, quality, productivity, cost competitiveness and most importantly employee engagement and development across the supply chain. This culture of continuous improvement, known in Japanese as kaizen, is driven at the manufacturing level by the Toyota production system (TPS).
TPS is a world renowned method of manufacturing that has underpinned Toyota’s continued success as an automotive manufacturer in Japan and around the world. TPS methodologies have also been adopted by other industries including health, finance and defence.
It is through our supplier productivity and capability program (SPCP) that we provide TPS skills and knowledge to our local supplier base via the supplier development group.
The supplier development team at Toyota Australia has been supporting our local supplier base since 1989. It currently consists of 20 dedicated employees working with local suppliers to support operational improvement activities and other areas including developing understanding and applying TPS methodologies, providing networking and diversification opportunities and supporting activities to improve cost competitiveness.
In 2013, the federal government announced it would contribute $5 million towards our $15 million five year supplier development program. This means we can continue and accelerate this activity over the next five years and increase productivity improvements in our local supplier network.
By helping the automotive components sector to enhance its capabilities and better integrate into local and global supply chains, we believe that SPCP will play a critical role in supporting suppliers during the remaining years of vehicle manufacturing and provide a stepping stone for those companies considering transition to other industries.
Value of buy ($ billion)
Number of suppliers
0.0 0.5 1.0 1.5 2.0 2.5 3.0
13/14
IP DP SP&A
IP DP SP&A
12/13
11/12
10/11
09/10
1.3 0.20.9
1.0
1.1
1.5
1.2
0.3
0.2
0.3
0.2
2.4
2.5
2.3
2.6
2.5
1,624
1,467
1,697
1,795
1,805
98
101
117
128
125
62
67
73
71
89
1.2
1.0
0.8
1.1
13/14
12/13
11/12
10/11
09/10
1,464
1,299
1,507
1,596
1,591
0 500 1000 1500 2000
S2014 Sustainability Report toyota.com.au/toyota/sustainability
21 SUPPLIER SUPPORT
QC A S E S T U D Y
Green purchasingOur stakeholders continue to focus on the importance of environmentally sound purchase decisions, understanding that environmental compliance and performance has the potential to present a key risk in the supply chain. In order to provide safe and clean products, it is essential that all our business partners make an effort to tackle environmental issues.
In 2013 we issued updated green purchasing guidelines (GPG) to key suppliers. The GPG provides guidance on environmental initiatives to reduce carbon footprint and the use of substances of concern throughout the vehicle manufacturing process from design through to production, packaging and logistics.
During the reporting period we also worked with suppliers to help secure approval from Toyota Motor Corporation to build the new look Camry. As part of this process, we requested that suppliers demonstrate certification to environmental management system ISO14001 in addition to following the GPG.
In addition it was highlighted at the annual supplier management one-on-one meetings that all suppliers are expected to comply with the GPG by signing a document confirming their intent.
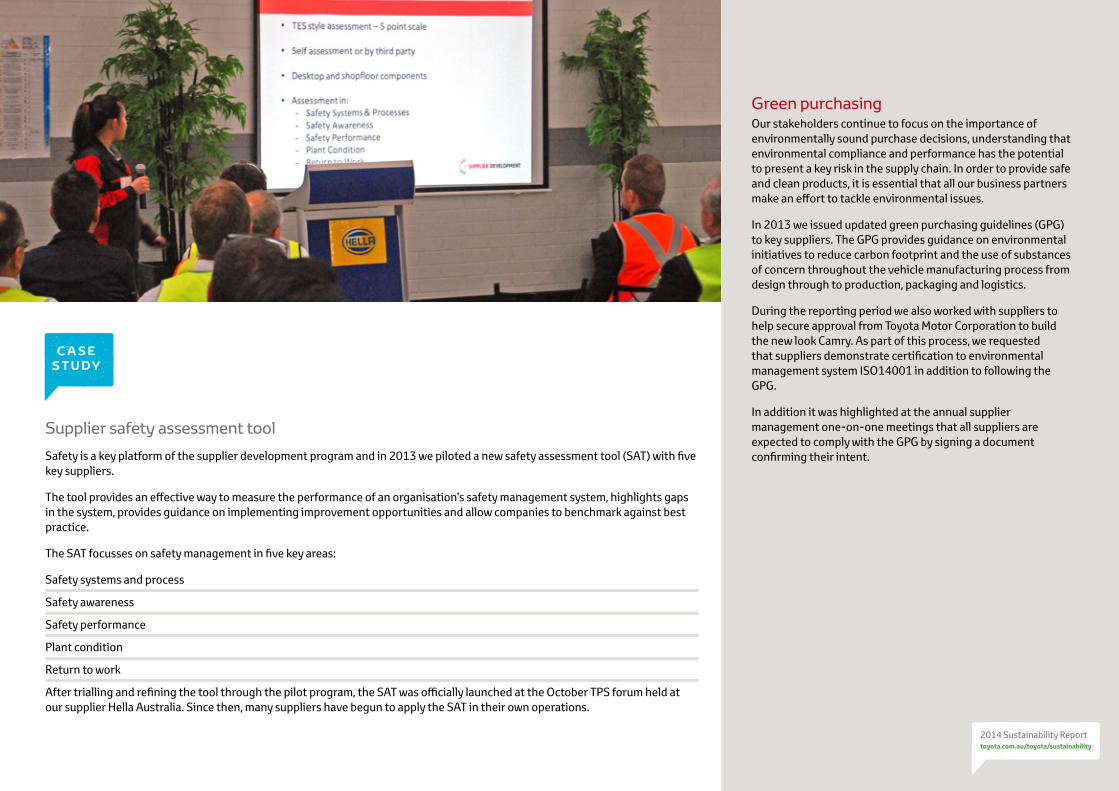
Supplier safety assessment tool
Safety is a key platform of the supplier development program and in 2013 we piloted a new safety assessment tool (SAT) with five key suppliers.
The tool provides an effective way to measure the performance of an organisation’s safety management system, highlights gaps in the system, provides guidance on implementing improvement opportunities and allow companies to benchmark against best practice.
The SAT focusses on safety management in five key areas:
Safety systems and process
Safety awareness
Safety performance
Plant condition
Return to work
After trialling and refining the tool through the pilot program, the SAT was officially launched at the October TPS forum held at our supplier Hella Australia. Since then, many suppliers have begun to apply the SAT in their own operations.
2014 Sustainability Report toyota.com.au/toyota/sustainability
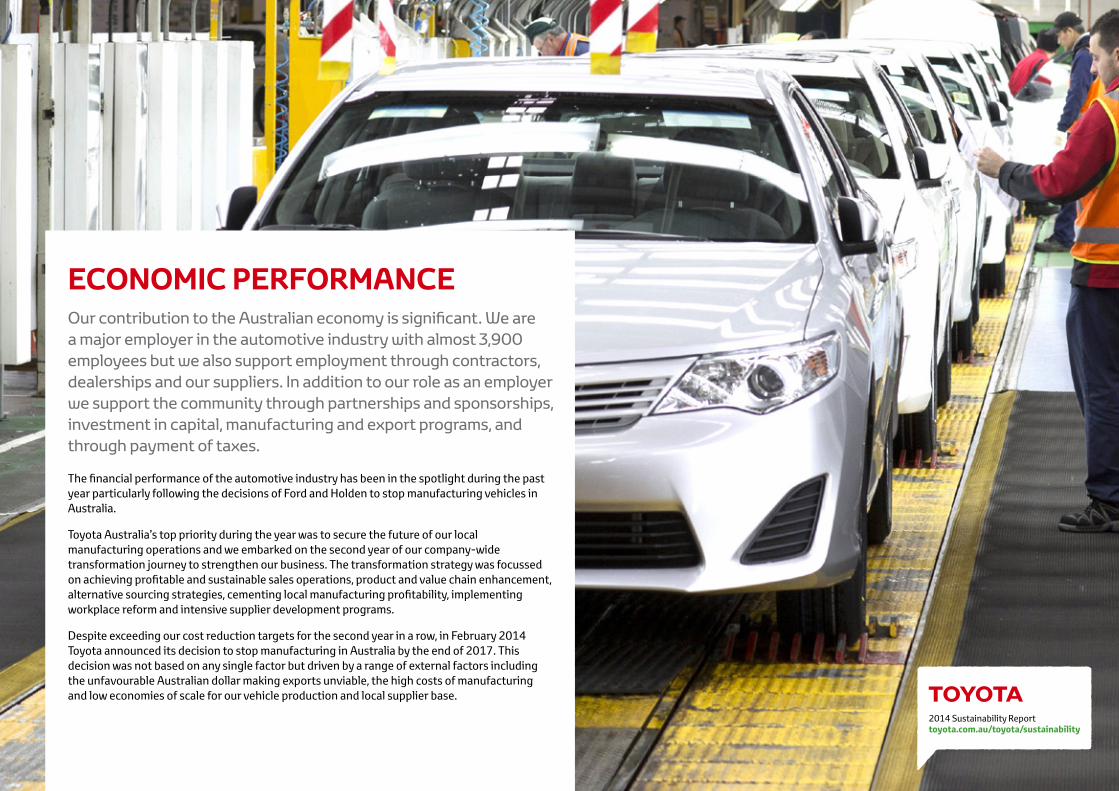
ECONOMIC PERFORMANCEOur contribution to the Australian economy is significant. We are a major employer in the automotive industry with almost 3,900 employees but we also support employment through contractors, dealerships and our suppliers. In addition to our role as an employer we support the community through partnerships and sponsorships, investment in capital, manufacturing and export programs, and through payment of taxes.
The financial performance of the automotive industry has been in the spotlight during the past year particularly following the decisions of Ford and Holden to stop manufacturing vehicles in Australia.
Toyota Australia’s top priority during the year was to secure the future of our local manufacturing operations and we embarked on the second year of our company-wide transformation journey to strengthen our business. The transformation strategy was focussed on achieving profitable and sustainable sales operations, product and value chain enhancement, alternative sourcing strategies, cementing local manufacturing profitability, implementing workplace reform and intensive supplier development programs.
Despite exceeding our cost reduction targets for the second year in a row, in February 2014 Toyota announced its decision to stop manufacturing in Australia by the end of 2017. This decision was not based on any single factor but driven by a range of external factors including the unfavourable Australian dollar making exports unviable, the high costs of manufacturing and low economies of scale for our vehicle production and local supplier base.
S2014 Sustainability Report toyota.com.au/toyota/sustainability
23 ECONOMIC PERFORMANCE
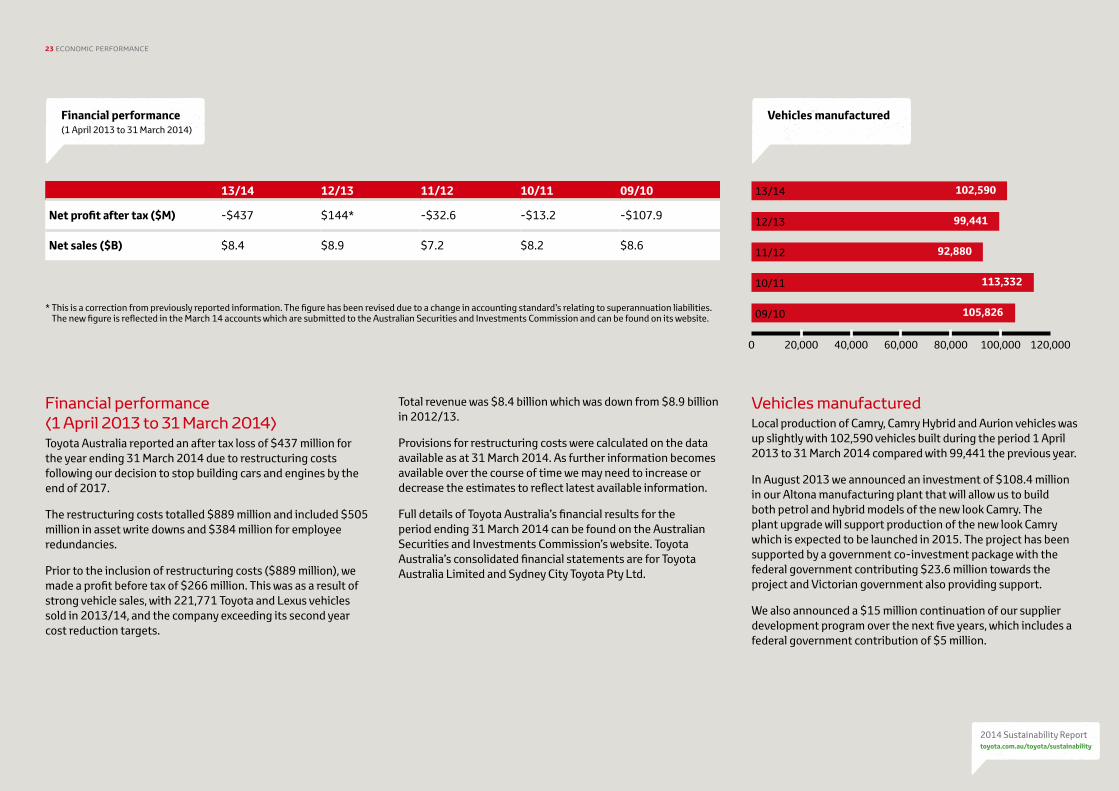
Financial performance (1 April 2013 to 31 March 2014)Toyota Australia reported an after tax loss of $437 million for the year ending 31 March 2014 due to restructuring costs following our decision to stop building cars and engines by the end of 2017.
The restructuring costs totalled $889 million and included $505 million in asset write downs and $384 million for employee redundancies.
Prior to the inclusion of restructuring costs ($889 million), we made a profit before tax of $266 million. This was as a result of strong vehicle sales, with 221,771 Toyota and Lexus vehicles sold in 2013/14, and the company exceeding its second year cost reduction targets.
Total revenue was $8.4 billion which was down from $8.9 billion in 2012/13.
Provisions for restructuring costs were calculated on the data available as at 31 March 2014. As further information becomes available over the course of time we may need to increase or decrease the estimates to reflect latest available information.
Full details of Toyota Australia’s financial results for the period ending 31 March 2014 can be found on the Australian Securities and Investments Commission’s website. Toyota Australia’s consolidated financial statements are for Toyota Australia Limited and Sydney City Toyota Pty Ltd.
Vehicles manufacturedLocal production of Camry, Camry Hybrid and Aurion vehicles was up slightly with 102,590 vehicles built during the period 1 April 2013 to 31 March 2014 compared with 99,441 the previous year.
In August 2013 we announced an investment of $108.4 million in our Altona manufacturing plant that will allow us to build both petrol and hybrid models of the new look Camry. The plant upgrade will support production of the new look Camry which is expected to be launched in 2015. The project has been supported by a government co-investment package with the federal government contributing $23.6 million towards the project and Victorian government also providing support.
We also announced a $15 million continuation of our supplier development program over the next five years, which includes a federal government contribution of $5 million.
* This is a correction from previously reported information. The figure has been revised due to a change in accounting standard’s relating to superannuation liabilities. The new figure is reflected in the March 14 accounts which are submitted to the Australian Securities and Investments Commission and can be found on its website.
-500 -400 -300 -200 -100 0 100 200
Vehicles manufactured
Vehicles sold
Vehicles exported
221,771
225,599
187,521
217,365
214,465
-$437
$144*
-$32.6
-$13.2
$8.4
$8.9
$7.2
$8.2
$8.6-$107.9
67,056
69,676
61,352
79,979
68,659
102,590
99,441
92,880
113,332
105,826
0 20,000 40,000 60,000 80,000 100,000 120,000
0 50,000 100,000 150,000 200,000 250,000
0 10,000 20,000 30,000 40,000 50,000 60,000 70,000 80,000
13/14
12/13
11/12
10/11
09/10
13/14
12/13
11/12
10/11
09/10
13/14
12/13
11/12
10/11
09/10
13/14
12/13
11/12
10/11
09/10
Net sales ($B) Net profit after tax
SVehicles manufacturedSFinancial performance (1 April 2013 to 31 March 2014)
13/14 12/13 11/12 10/11 09/10
Net profit after tax ($M) -$437 $144* -$32.6 -$13.2 -$107.9
Net sales ($B) $8.4 $8.9 $7.2 $8.2 $8.6
S2014 Sustainability Report toyota.com.au/toyota/sustainability
24 ECONOMIC PERFORMANCE
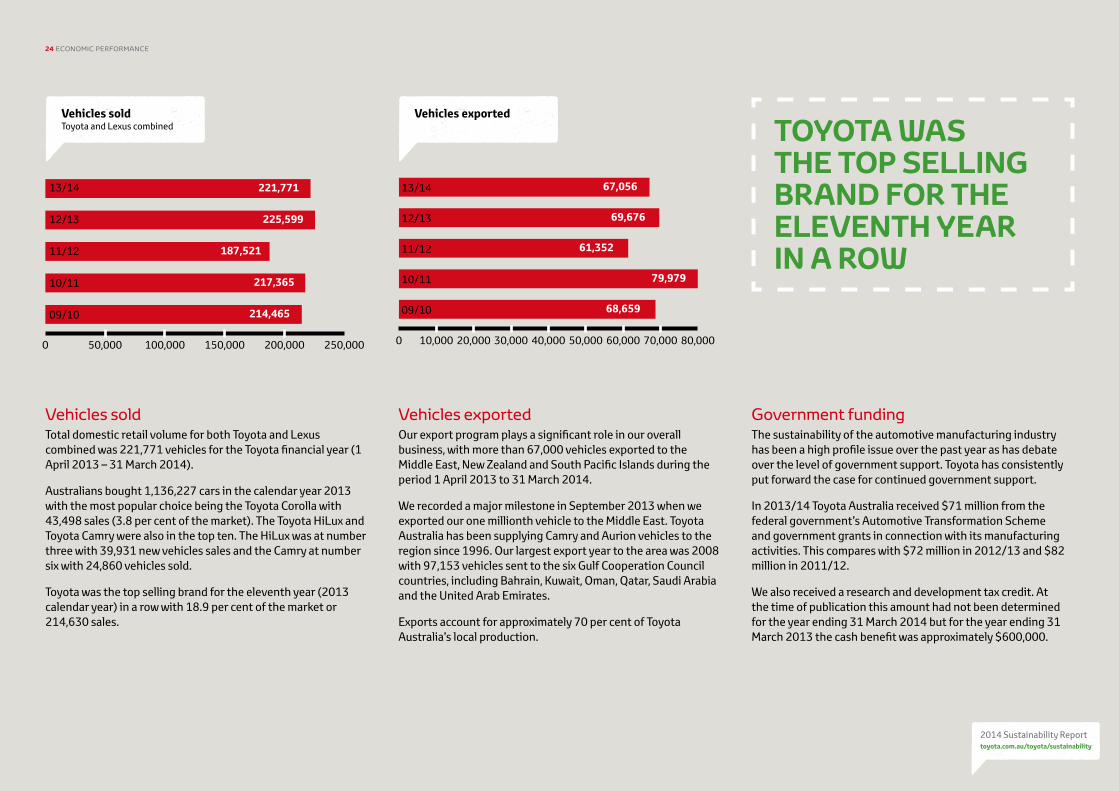
Vehicles soldTotal domestic retail volume for both Toyota and Lexus combined was 221,771 vehicles for the Toyota financial year (1 April 2013 – 31 March 2014).
Australians bought 1,136,227 cars in the calendar year 2013 with the most popular choice being the Toyota Corolla with 43,498 sales (3.8 per cent of the market). The Toyota HiLux and Toyota Camry were also in the top ten. The HiLux was at number three with 39,931 new vehicles sales and the Camry at number six with 24,860 vehicles sold.
Toyota was the top selling brand for the eleventh year (2013 calendar year) in a row with 18.9 per cent of the market or 214,630 sales.
Vehicles exportedOur export program plays a significant role in our overall business, with more than 67,000 vehicles exported to the Middle East, New Zealand and South Pacific Islands during the period 1 April 2013 to 31 March 2014.
We recorded a major milestone in September 2013 when we exported our one millionth vehicle to the Middle East. Toyota Australia has been supplying Camry and Aurion vehicles to the region since 1996. Our largest export year to the area was 2008 with 97,153 vehicles sent to the six Gulf Cooperation Council countries, including Bahrain, Kuwait, Oman, Qatar, Saudi Arabia and the United Arab Emirates.
Exports account for approximately 70 per cent of Toyota Australia’s local production.
Government fundingThe sustainability of the automotive manufacturing industry has been a high profile issue over the past year as has debate over the level of government support. Toyota has consistently put forward the case for continued government support.
In 2013/14 Toyota Australia received $71 million from the federal government’s Automotive Transformation Scheme and government grants in connection with its manufacturing activities. This compares with $72 million in 2012/13 and $82 million in 2011/12.
We also received a research and development tax credit. At the time of publication this amount had not been determined for the year ending 31 March 2014 but for the year ending 31 March 2013 the cash benefit was approximately $600,000.
TOYOTA WAS THE TOP SELLING BRAND FOR THE ELEVENTH YEAR IN A ROW
-500 -400 -300 -200 -100 0 100 200
Vehicles manufactured
Vehicles sold
Vehicles exported
221,771
225,599
187,521
217,365
214,465
-$437
$144*
-$32.6
-$13.2
$8.4
$8.9
$7.2
$8.2
$8.6-$107.9
67,056
69,676
61,352
79,979
68,659
102,590
99,441
92,880
113,332
105,826
0 20,000 40,000 60,000 80,000 100,000 120,000
0 50,000 100,000 150,000 200,000 250,000
0 10,000 20,000 30,000 40,000 50,000 60,000 70,000 80,000
13/14
12/13
11/12
10/11
09/10
13/14
12/13
11/12
10/11
09/10
13/14
12/13
11/12
10/11
09/10
13/14
12/13
11/12
10/11
09/10
Net sales ($B) Net profit after tax
S SVehicles sold Vehicles exportedToyota and Lexus combined
2014 Sustainability Report toyota.com.au/toyota/sustainability
Toyota is committed to innovation and to producing safe and sustainable vehicles. Our global mission is to lead the way in developing safe and responsible means of transport.
We are continually looking at opportunities to reduce the environmental impact of our vehicles. This takes many forms including the introduction of new technologies, improving recycling, increasing fuel efficiency and reducing tail-pipe emissions.
Our global leadership in innovation and sustainability is well recognised. In June 2013 we were named the world’s best global green brand for the third year in a row in Interbrand’s Best Global Green Brands which surveys 10,000 consumers. In May 2013 Toyota was named the world’s most valuable automotive brand in the BrandZ™ Top 100 Most Valuable Global Brands 2013 report.
Our parent company has a global innovation vision that through improvements of conventional technology, as well as pioneering efforts in the application of new technologies, Toyota is taking great steps to develop eco-cars which will help us become a low carbon society. For the year ending 31 March 2013, Toyota Motor Corporation (TMC) invested A$8.85 billion on research and development.
The Toyota global website www.toyota-global.com details the latest developments in environmental technology, safety technology, intelligent transport systems and smart grid as well as the latest development in vehicles powered by hydrogen fuel cells.
INNOVATION – CARS OF THE FUTURE
S2014 Sustainability Report toyota.com.au/toyota/sustainability
26 INNOVATION
Investment in technologyPlug-In PriusWe have been involved in the Victorian government’s electric vehicle trial, the most significant trial of grid-connected vehicles in Australia to date. We supplied four Prius Plug-In vehicles which have been available for public hire through GoGet Carshare.
The Prius Plug-In features a larger battery that can be charged when parked, providing an enhanced all-electric driving range. When charged using low or zero-carbon electricity, the Prius Plug-In offers lower carbon emissions1 than the standard Prius, and a significantly longer all-electric range.
1 Emissions vary depending on driving conditions / style, vehicle conditions and options / accessories.
Hydrogen carsIn late 2013, TMC unveiled a concept version of its ground-breaking hydrogen-powered car, which is due to go into production in late 2014. In June 2014 it unveiled the final production car which will go on sale in 2015.
TMC has been developing fuel cell vehicles in-house for more than 20 years. Significant improvements have been made to the fuel-cell system since 2002. The fuel-cell sedan unveiled in June has a cruising range similar to a petrol-engine vehicle and a refueling time of roughly three minutes. When driven, it emits only the water vapour produced by the reaction between hydrogen and oxygen.
TMC’s commitment to environmentally-friendly vehicles is based on three basic principles: embracing diverse energy sources; developing efficient, low-emission vehicles; and driving environmental change by popularising these vehicles.
Hybrid milestoneWe achieved a significant hybrid milestone in Australia at the end of February 2014, selling our 50,000th hybrid car.
Toyota launched the first mass-produced hybrid passenger vehicle – the Prius – in Australia in 2001, followed by other Toyota and Lexus hybrids including the locally-built Camry Hybrid in 2010. Hybrids run on a combination of petrol and electric power.
The Australian built Camry accounts for more than half of the total of 50,671 Toyota-badged hybrids sold in Australia. Cumulative sales of Camry Hybrid have topped 25,400 since it was launched in 2010. Australians have bought more than 18,600 Prius hybrids since the nameplate was introduced here in 2001, and it remains the world’s best-selling hybrid car.
Global sales of Toyota and Lexus hybrid vehicles passed a cumulative total of six million in December 2013. TMC estimates its hybrid vehicles have cut carbon-dioxide emissions by more than 41 million tonnes* and saved at least 15 million kilolitres* of fuel compared with vehicles of similar size and driving performance using petrol-only engines.
In 2013 Toyota Australia launched a product stewardship scheme with the aim of recovering all hybrid HV batteries. Primarily this scheme is aimed at increasing hybrid HV battery recycling from auto recyclers, independent workshops and panel shops at the end of a vehicle’s life. More details can be found at http://www.toyota.com.au/hybrid-battery-recycling
* Number of registered vehicles × distance travelled × fuel efficiency (actual fuel efficiency in each country) × CO2 conversion factor. Fuel consumption varies depending on driving conditions / style, vehicle conditions and options / accessories.
WE ACHIEVED A SIGNIFICANT HYBRID MILESTONE IN AUSTRALIA AT THE END OF FEBRUARY 2014, SELLING OUR 50,000TH HYBRID CAR.
Hydrogen is a promising alternative fuel as it can be produced from a wide variety of primary energy sources including solar and wind power.
While Japan, the UK and USA have announced plans to sell hydrogen vehicles in 2015 there are no current plans to introduce hydrogen vehicles in Australia. Before we can sell hydrogen vehicles on a commercial scale we need to have sufficient local demand and relevant infrastructure.
S2014 Sustainability Report toyota.com.au/toyota/sustainability
27 INNOVATION
Fuel efficiency and tail pipe emissionsThe main tailpipe emissions from motor vehicles include methane-based hydrocarbons, non-methane hydrocarbons, carbon monoxide, particulate matter and carbon dioxide. Improved vehicle fuel efficiency technology and alternative fuel sources can reduce these emissions. Toyota understands there is a high level of interest in this issue and our approach is to work with government and industry regarding standards and policy in the Australian context.
Vehicle carbon emissionsWe support in principle a mandatory vehicle carbon emissions standard suitable for the unique Australia market with the voluntary code for national average carbon emissions (NACE) ending in 2010.
The National Transport Commission publishes an annual report on CO2 emissions from new car sales. This information can be found at www.ntc.gov.au
Air pollutantsAs part of our commitment to reduce air pollution emissions, all our vehicles meet or exceed Australian design rules.
The European Union has developed the Euro Standards limiting emissions of pollutants such as carbon monoxide and oxides of nitrogen from vehicles. The latest Australian standard –
ADR 79/04 Emission Control for Light Vehicles – requires manufacturers to comply with the Euro 5 Standard. The Euro 5 emissions standard was introduced on 1 November 2013 (for new vehicles) and 1 November 2016 (for all models).
We are working with the industry to contribute to the federal government’s review of sulphur levels in petrol, as there is a direct link between fuel quality standards and emission reductions, including the need to lower sulphur limits to meet stricter Euro targets. The government has a timetable for Euro 6 to be applied from 1 July 2017 (for new models) and 1 July 2018 (for all models).
Green vehicle guideThe federal government has a green vehicle guide which provides information on vehicle fuel efficiency and CO2 emissions for all new vehicles in Australia. The information helps customers compare different vehicles. The guide can be found at www.greenvehicleguide.gov.au
Product safetyToyota strives to provide the safest vehicles for the Australian automotive market. The priority is to prevent or mitigate the likelihood of accidents, while also reducing impacts if an accident does occur. Information on Toyota’s safety initiatives can be found at www.toyota-global.com/innovation/safety_technology/
All of our products sold in Australia are tested for safety compliance. Processes are in place to ensure all vehicles supplied to the market have received the required federal government compliance approvals. To do this we work with a range of stakeholders including the Federal Chamber of Automotive Industries’ technical committee and federal and state departments of transport.
There are many ways to test safety and we recognise the Australasian New Car Assessment Program’s (ANCAP) rating system as providing one measure. ANCAP is a subsidiary of the global New Car Assessment Program and has corresponding bodies across the world which implement its crash testing program.
ANCAP works on a star system where vehicles are given different star ratings depending on test results. Toyota is committed to having all new model Toyota and Lexus vehicles sold in Australia capable of achieving five stars.
Information about Toyota and Lexus branded vehicles sold in Australia, including specifications and safety features, can be found on our website at www.toyota.com.au or www.lexus.com.au
2014 Sustainability Report toyota.com.au/toyota/sustainability
Sound environmental management is a key issue for all manufacturing based industries in particular the automotive sector with its reliance on key resources and its potential to impact its surrounds.
MANAGING ENVIRONMENTAL IMPACTS
From Toyota’s global vision and principles to the Toyota Earth Charter and statement of environmental responsibility, our approach is to make a positive contribution to the community and minimise our environmental impacts.
S2014 Sustainability Report toyota.com.au/toyota/sustainability
29 MANAGING ENVIRONMENTAL IMPACTS
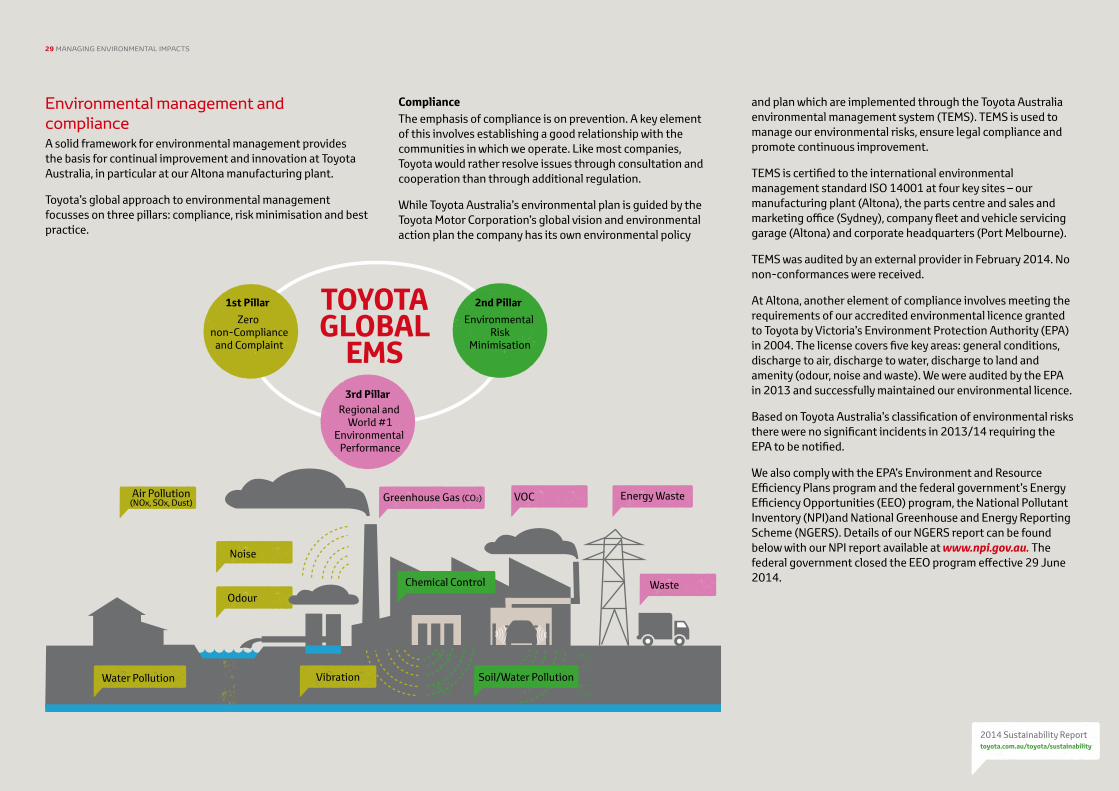
Environmental management and complianceA solid framework for environmental management provides the basis for continual improvement and innovation at Toyota Australia, in particular at our Altona manufacturing plant.
Toyota’s global approach to environmental management focusses on three pillars: compliance, risk minimisation and best practice.
ComplianceThe emphasis of compliance is on prevention. A key element of this involves establishing a good relationship with the communities in which we operate. Like most companies, Toyota would rather resolve issues through consultation and cooperation than through additional regulation.
While Toyota Australia’s environmental plan is guided by the Toyota Motor Corporation’s global vision and environmental action plan the company has its own environmental policy
and plan which are implemented through the Toyota Australia environmental management system (TEMS). TEMS is used to manage our environmental risks, ensure legal compliance and promote continuous improvement.
TEMS is certified to the international environmental management standard ISO 14001 at four key sites – our manufacturing plant (Altona), the parts centre and sales and marketing office (Sydney), company fleet and vehicle servicing garage (Altona) and corporate headquarters (Port Melbourne).
TEMS was audited by an external provider in February 2014. No non-conformances were received.
At Altona, another element of compliance involves meeting the requirements of our accredited environmental licence granted to Toyota by Victoria’s Environment Protection Authority (EPA) in 2004. The license covers five key areas: general conditions, discharge to air, discharge to water, discharge to land and amenity (odour, noise and waste). We were audited by the EPA in 2013 and successfully maintained our environmental licence.
Based on Toyota Australia’s classification of environmental risks there were no significant incidents in 2013/14 requiring the EPA to be notified.
We also comply with the EPA’s Environment and Resource Efficiency Plans program and the federal government’s Energy Efficiency Opportunities (EEO) program, the National Pollutant Inventory (NPI)and National Greenhouse and Energy Reporting Scheme (NGERS). Details of our NGERS report can be found below with our NPI report available at www.npi.gov.au. The federal government closed the EEO program effective 29 June 2014.S
SS
S
z zz
S
Air Pollution(NOx, SOx, Dust) Greenhouse Gas (CO2)
Noise
Odour
Water Pollution Vibration Soil/Water Pollution
Waste
Energy WasteVOC
Chemical Control
3rd Pillar
2nd Pillar1st PillarZero
non-Complianceand Complaint
Environmental Risk
Minimisation
Regional and World #1
Environmental Performance
TOYOTAGLOBAL
EMS
S2014 Sustainability Report toyota.com.au/toyota/sustainability
30 MANAGING ENVIRONMENTAL IMPACTS
Risk minimisationThe second pillar looks to minimise environmental risk specifically in the areas of chemical control, and ground water and soil contamination.
In chemical control, the Altona plant goes beyond local legal requirements to comply with European recycling standards making sure that chemicals used in parts for locally built vehicles meet strict overseas criteria.
The Altona site’s list of banned chemicals has been developed from European and Japanese environmental protection standards.
Our risk mitigation approach reflects the precautionary principle as detailed in the United Nations Declaration Principle 15 that states that where there are threats of serious or irreversible damage, lack of full scientific certainty shall not be used as a reason for postponing cost-effective measures to prevent environmental degradation.
Best practice resource useThe third pillar calls for best practice resource use for energy, water, waste and volatile organic compounds (VOCs). The Toyota production system (TPS) defines waste not just in the traditional sense but also in wasted effort. The TPS principles of just in time and jidoka are applied across all three pillars of environmental management at our manufacturing plant. This creates a framework for monitoring, measuring and correcting any imbalance.
Our response to climate change is best demonstrated under this third pillar. We understand that climate change is an issue of concern and importance to stakeholders and has a particularly high profile especially in view of government policy and managing the impacts of policy. This issue is managed through our carbon working group which reports to the environment
committee. Our identification and management of best practice resource use also allows us to mitigate against climate change impacts including reducing water consumption, waste and energy.
We acknowledge that we are a high energy user, which is why Toyota globally is committed to leading the way with environmental research and technologies. As we will still be building cars and engines in Australia until the end of 2017, it is important that we continue to engage in new programs to reduce our carbon footprint.
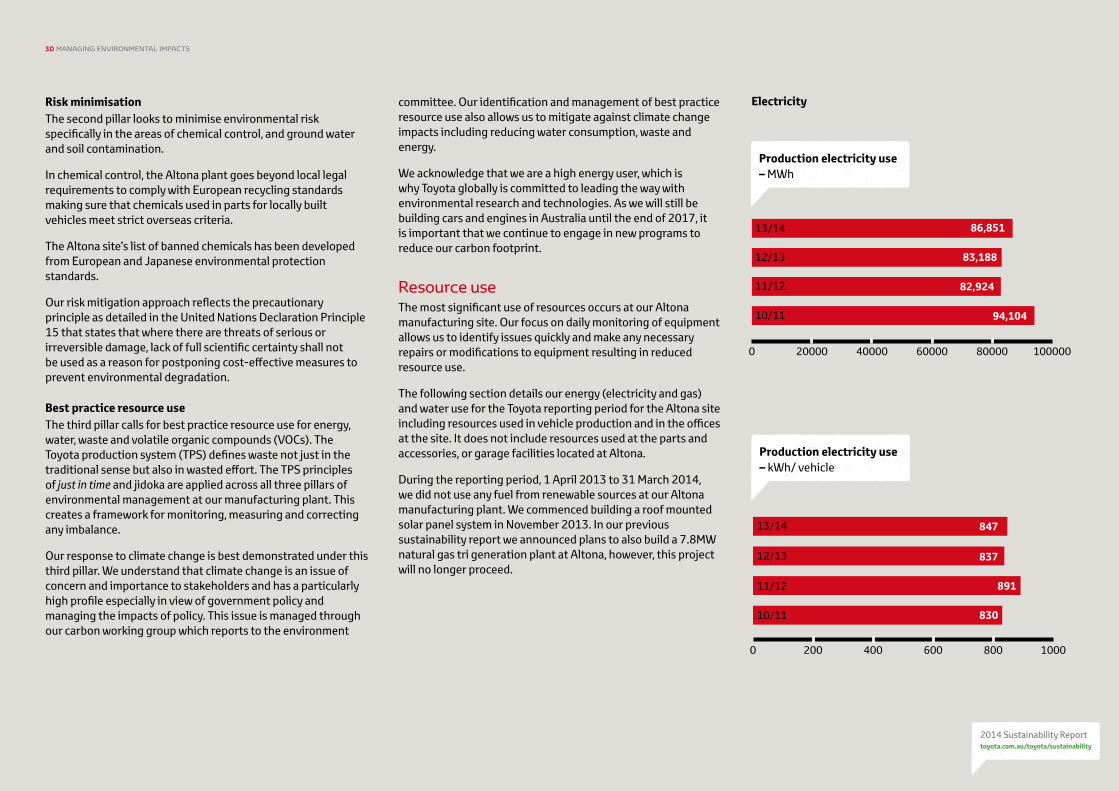
Resource useThe most significant use of resources occurs at our Altona manufacturing site. Our focus on daily monitoring of equipment allows us to identify issues quickly and make any necessary repairs or modifications to equipment resulting in reduced resource use.
The following section details our energy (electricity and gas) and water use for the Toyota reporting period for the Altona site including resources used in vehicle production and in the offices at the site. It does not include resources used at the parts and accessories, or garage facilities located at Altona.
During the reporting period, 1 April 2013 to 31 March 2014, we did not use any fuel from renewable sources at our Altona manufacturing plant. We commenced building a roof mounted solar panel system in November 2013. In our previous sustainability report we announced plans to also build a 7.8MW natural gas tri generation plant at Altona, however, this project will no longer proceed.
0 500 1000 1500 2000
0 200 400 600 800 1000
0 1 2 3 4 5 6
Production electricity use
Production gas use GJ
Electricity tCO@-e
Water use kL
Total TMCA tCO2e Gas tCO2-e
Transport tCO2_e VOC
water use vehicle manufactured
Engine testing
Production electricity use - KWH
0 20000 40000 60000 80000 100000
0 100000 200000 300000 400000 500000 600000
0 500 1000 1500 2000 2500 3000 3500 40000 30000 60000 90000 120000 150000
0 100000 200000 300000 400000 500000 0.0 0.5 1.0 1.5 2.0 2.5 3.0 3.5 4.0
0 50000 100000 150000 200000
0 5000 10000 15000 20000 25000 30000 35000
0 1000 2000 3000 4000 5000 6000 7000 8000
86,851 847
837
891
830
83,188
82,924
94,104
531,252
353,784
153,270
147,070
164,722
170,261
4,290 1,740
963
1,011
902
5,237
6,591
6,692
2,118
2,063
2,247
3,676
117,238
112,343
124,339
128,132
27,866
30,534
30,858
26,463
3.5
3.8
3.8
3.5
3.9
377,165
355,611
392,163
405,829
534,900
502,540
598,880
5.4
5.4
5.2
5.3
13/14
12/13
11/12
10/11
13/14
12/13
11/12
10/11
13/14
12/13
11/12
10/11
13/14
12/13
11/12
10/11
13/14
12/13
11/12
10/11
09/10
13/14
12/13
11/12
10/11
13/14
12/13
11/12
10/11
13/14
12/13
11/12
10/11
13/14
12/13
11/12
10/11
13/14
12/13
11/12
10/11
13/14
12/13
11/12
10/11
13/14
12/13
11/12
10/11
09/10
Electricity
S
S
Production electricity use – kWh/ vehicle
Production electricity use – MWh
S2014 Sustainability Report toyota.com.au/toyota/sustainability
31 MANAGING ENVIRONMENTAL IMPACTS
S
S
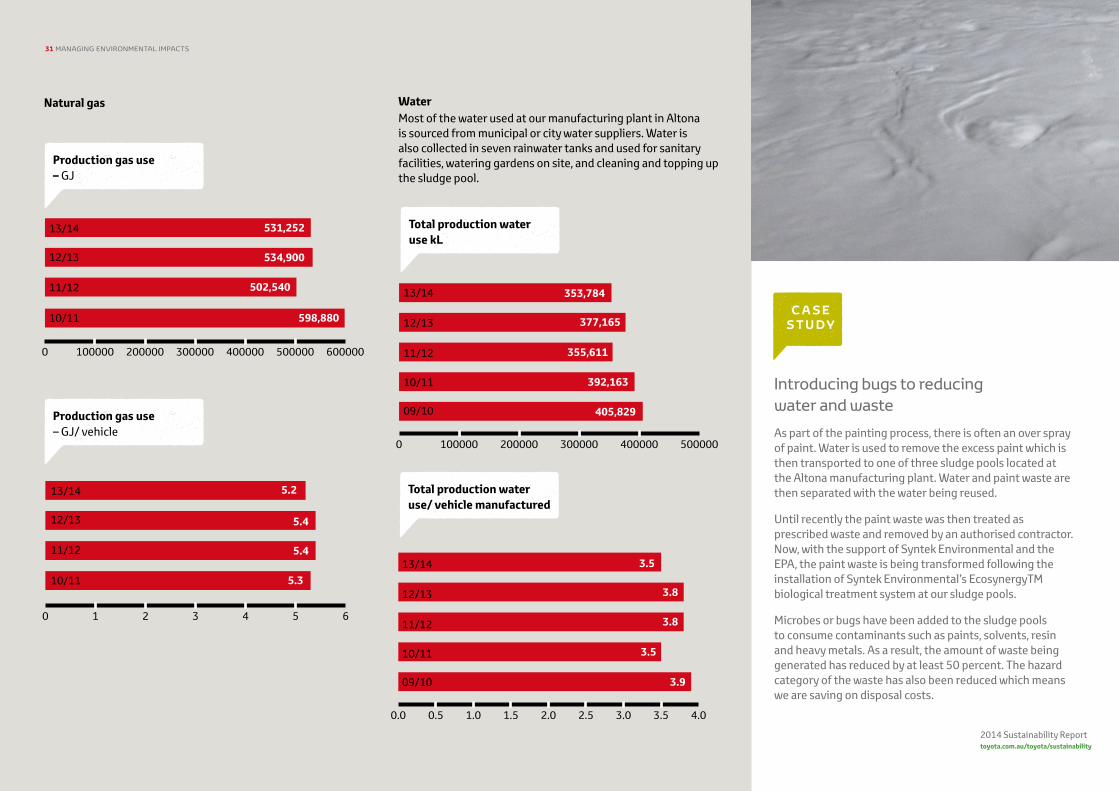
SProduction gas use – GJ/ vehicle
Total production water use kL
Total production water use/ vehicle manufactured
0 500 1000 1500 2000
0 200 400 600 800 1000
0 1 2 3 4 5 6
Production electricity use
Production gas use GJ
Electricity tCO@-e
Water use kL
Total TMCA tCO2e Gas tCO2-e
Transport tCO2_e VOC
water use vehicle manufactured
Engine testing
Production electricity use - KWH
0 20000 40000 60000 80000 100000
0 100000 200000 300000 400000 500000 600000
0 500 1000 1500 2000 2500 3000 3500 40000 30000 60000 90000 120000 150000
0 100000 200000 300000 400000 500000 0.0 0.5 1.0 1.5 2.0 2.5 3.0 3.5 4.0
0 50000 100000 150000 200000
0 5000 10000 15000 20000 25000 30000 35000
0 1000 2000 3000 4000 5000 6000 7000 8000
86,851 847
837
891
830
83,188
82,924
94,104
531,252
353,784
153,270
147,070
164,722
170,261
4,290 1,740
963
1,011
902
5,237
6,591
6,692
2,118
2,063
2,247
3,676
117,238
112,343
124,339
128,132
27,866
30,534
30,858
26,463
3.5
3.8
3.8
3.5
3.9
377,165
355,611
392,163
405,829
534,900
502,540
598,880
5.4
5.4
5.2
5.3
13/14
12/13
11/12
10/11
13/14
12/13
11/12
10/11
13/14
12/13
11/12
10/11
13/14
12/13
11/12
10/11
13/14
12/13
11/12
10/11
09/10
13/14
12/13
11/12
10/11
13/14
12/13
11/12
10/11
13/14
12/13
11/12
10/11
13/14
12/13
11/12
10/11
13/14
12/13
11/12
10/11
13/14
12/13
11/12
10/11
13/14
12/13
11/12
10/11
09/10
WaterMost of the water used at our manufacturing plant in Altona is sourced from municipal or city water suppliers. Water is also collected in seven rainwater tanks and used for sanitary facilities, watering gardens on site, and cleaning and topping up the sludge pool.
0 500 1000 1500 2000
0 200 400 600 800 1000
0 1 2 3 4 5 6
Production electricity use
Production gas use GJ
Electricity tCO@-e
Water use kL
Total TMCA tCO2e Gas tCO2-e
Transport tCO2_e VOC
water use vehicle manufactured
Engine testing
Production electricity use - KWH
0 20000 40000 60000 80000 100000
0 100000 200000 300000 400000 500000 600000
0 500 1000 1500 2000 2500 3000 3500 40000 30000 60000 90000 120000 150000
0 100000 200000 300000 400000 500000 0.0 0.5 1.0 1.5 2.0 2.5 3.0 3.5 4.0
0 50000 100000 150000 200000
0 5000 10000 15000 20000 25000 30000 35000
0 1000 2000 3000 4000 5000 6000 7000 8000
86,851 847
837
891
830
83,188
82,924
94,104
531,252
353,784
153,270
147,070
164,722
170,261
4,290 1,740
963
1,011
902
5,237
6,591
6,692
2,118
2,063
2,247
3,676
117,238
112,343
124,339
128,132
27,866
30,534
30,858
26,463
3.5
3.8
3.8
3.5
3.9
377,165
355,611
392,163
405,829
534,900
502,540
598,880
5.4
5.4
5.2
5.3
13/14
12/13
11/12
10/11
13/14
12/13
11/12
10/11
13/14
12/13
11/12
10/11
13/14
12/13
11/12
10/11
13/14
12/13
11/12
10/11
09/10
13/14
12/13
11/12
10/11
13/14
12/13
11/12
10/11
13/14
12/13
11/12
10/11
13/14
12/13
11/12
10/11
13/14
12/13
11/12
10/11
13/14
12/13
11/12
10/11
13/14
12/13
11/12
10/11
09/10
SProduction gas use – GJ
Natural gas
Introducing bugs to reducing water and waste
As part of the painting process, there is often an over spray of paint. Water is used to remove the excess paint which is then transported to one of three sludge pools located at the Altona manufacturing plant. Water and paint waste are then separated with the water being reused.
Until recently the paint waste was then treated as prescribed waste and removed by an authorised contractor. Now, with the support of Syntek Environmental and the EPA, the paint waste is being transformed following the installation of Syntek Environmental’s EcosynergyTM biological treatment system at our sludge pools.
Microbes or bugs have been added to the sludge pools to consume contaminants such as paints, solvents, resin and heavy metals. As a result, the amount of waste being generated has reduced by at least 50 percent. The hazard category of the waste has also been reduced which means we are saving on disposal costs.
QC A S E S T U D Y
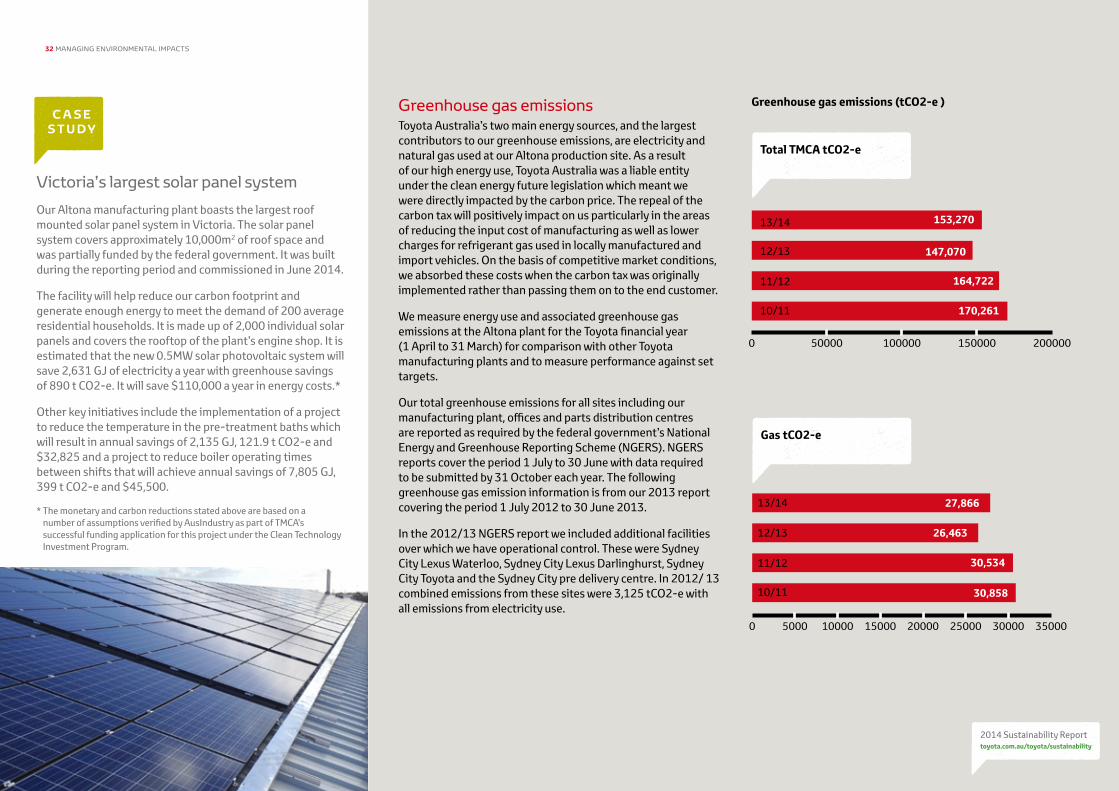
S2014 Sustainability Report toyota.com.au/toyota/sustainability
32 MANAGING ENVIRONMENTAL IMPACTS
Greenhouse gas emissions Toyota Australia’s two main energy sources, and the largest contributors to our greenhouse emissions, are electricity and natural gas used at our Altona production site. As a result of our high energy use, Toyota Australia was a liable entity under the clean energy future legislation which meant we were directly impacted by the carbon price. The repeal of the carbon tax will positively impact on us particularly in the areas of reducing the input cost of manufacturing as well as lower charges for refrigerant gas used in locally manufactured and import vehicles. On the basis of competitive market conditions, we absorbed these costs when the carbon tax was originally implemented rather than passing them on to the end customer.
We measure energy use and associated greenhouse gas emissions at the Altona plant for the Toyota financial year (1 April to 31 March) for comparison with other Toyota manufacturing plants and to measure performance against set targets.
Our total greenhouse emissions for all sites including our manufacturing plant, offices and parts distribution centres are reported as required by the federal government’s National Energy and Greenhouse Reporting Scheme (NGERS). NGERS reports cover the period 1 July to 30 June with data required to be submitted by 31 October each year. The following greenhouse gas emission information is from our 2013 report covering the period 1 July 2012 to 30 June 2013.
In the 2012/13 NGERS report we included additional facilities over which we have operational control. These were Sydney City Lexus Waterloo, Sydney City Lexus Darlinghurst, Sydney City Toyota and the Sydney City pre delivery centre. In 2012/ 13 combined emissions from these sites were 3,125 tCO2-e with all emissions from electricity use.
Greenhouse gas emissions (tCO2-e )
S
S
Total TMCA tCO2-e
Gas tCO2-e
0 500 1000 1500 2000
0 200 400 600 800 1000
0 1 2 3 4 5 6
Production electricity use
Production gas use GJ
Electricity tCO@-e
Water use kL
Total TMCA tCO2e Gas tCO2-e
Transport tCO2_e VOC
water use vehicle manufactured
Engine testing
Production electricity use - KWH
0 20000 40000 60000 80000 100000
0 100000 200000 300000 400000 500000 600000
0 500 1000 1500 2000 2500 3000 3500 40000 30000 60000 90000 120000 150000
0 100000 200000 300000 400000 500000 0.0 0.5 1.0 1.5 2.0 2.5 3.0 3.5 4.0
0 50000 100000 150000 200000
0 5000 10000 15000 20000 25000 30000 35000
0 1000 2000 3000 4000 5000 6000 7000 8000
86,851 847
837
891
830
83,188
82,924
94,104
531,252
353,784
153,270
147,070
164,722
170,261
4,290 1,740
963
1,011
902
5,237
6,591
6,692
2,118
2,063
2,247
3,676
117,238
112,343
124,339
128,132
27,866
30,534
30,858
26,463
3.5
3.8
3.8
3.5
3.9
377,165
355,611
392,163
405,829
534,900
502,540
598,880
5.4
5.4
5.2
5.3
13/14
12/13
11/12
10/11
13/14
12/13
11/12
10/11
13/14
12/13
11/12
10/11
13/14
12/13
11/12
10/11
13/14
12/13
11/12
10/11
09/10
13/14
12/13
11/12
10/11
13/14
12/13
11/12
10/11
13/14
12/13
11/12
10/11
13/14
12/13
11/12
10/11
13/14
12/13
11/12
10/11
13/14
12/13
11/12
10/11
13/14
12/13
11/12
10/11
09/10
Victoria’s largest solar panel system
Our Altona manufacturing plant boasts the largest roof mounted solar panel system in Victoria. The solar panel system covers approximately 10,000m2 of roof space and was partially funded by the federal government. It was built during the reporting period and commissioned in June 2014.
The facility will help reduce our carbon footprint and generate enough energy to meet the demand of 200 average residential households. It is made up of 2,000 individual solar panels and covers the rooftop of the plant’s engine shop. It is estimated that the new 0.5MW solar photovoltaic system will save 2,631 GJ of electricity a year with greenhouse savings of 890 t CO2-e. It will save $110,000 a year in energy costs.*
Other key initiatives include the implementation of a project to reduce the temperature in the pre-treatment baths which will result in annual savings of 2,135 GJ, 121.9 t CO2-e and $32,825 and a project to reduce boiler operating times between shifts that will achieve annual savings of 7,805 GJ, 399 t CO2-e and $45,500.
* The monetary and carbon reductions stated above are based on a number of assumptions verified by AusIndustry as part of TMCA’s successful funding application for this project under the Clean Technology Investment Program.
QC A S E S T U D Y
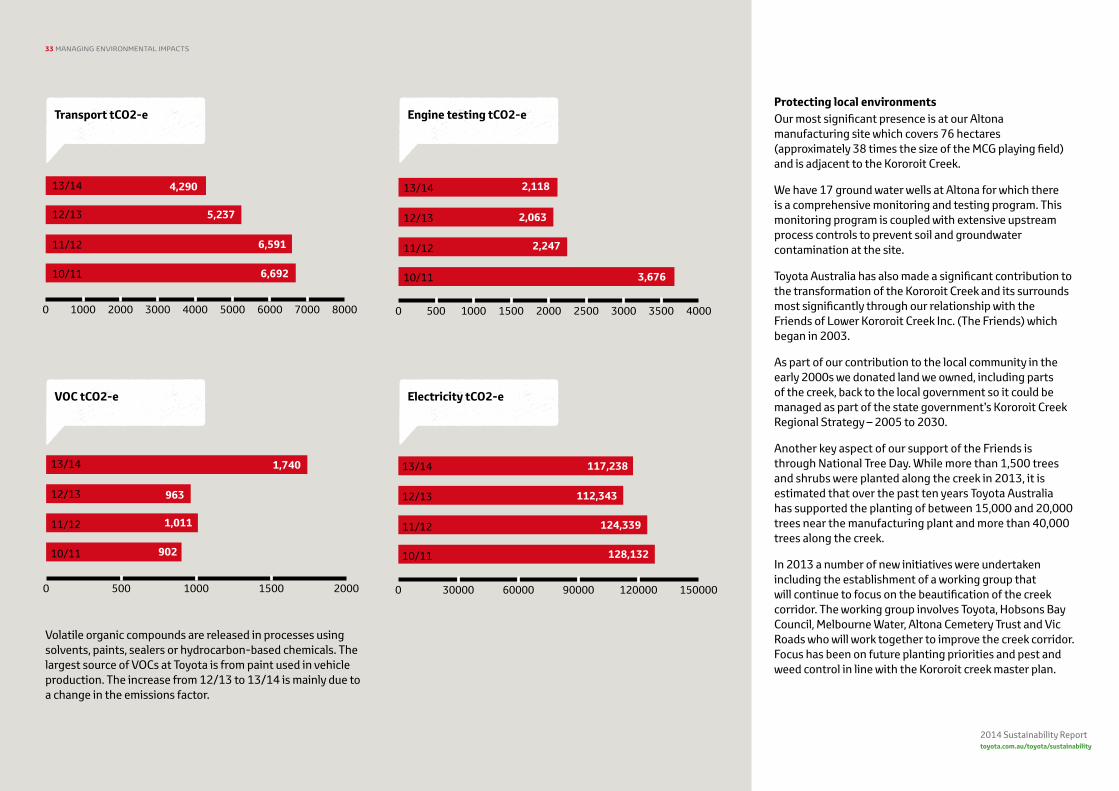
S2014 Sustainability Report toyota.com.au/toyota/sustainability
33 MANAGING ENVIRONMENTAL IMPACTS
Volatile organic compounds are released in processes using solvents, paints, sealers or hydrocarbon-based chemicals. The largest source of VOCs at Toyota is from paint used in vehicle production. The increase from 12/13 to 13/14 is mainly due to a change in the emissions factor.
S S
S S
Transport tCO2-e Engine testing tCO2-e
VOC tCO2-e Electricity tCO2-e
0 500 1000 1500 2000
0 200 400 600 800 1000
0 1 2 3 4 5 6
Production electricity use
Production gas use GJ
Electricity tCO@-e
Water use kL
Total TMCA tCO2e Gas tCO2-e
Transport tCO2_e VOC
water use vehicle manufactured
Engine testing
Production electricity use - KWH
0 20000 40000 60000 80000 100000
0 100000 200000 300000 400000 500000 600000
0 500 1000 1500 2000 2500 3000 3500 40000 30000 60000 90000 120000 150000
0 100000 200000 300000 400000 500000 0.0 0.5 1.0 1.5 2.0 2.5 3.0 3.5 4.0
0 50000 100000 150000 200000
0 5000 10000 15000 20000 25000 30000 35000
0 1000 2000 3000 4000 5000 6000 7000 8000
86,851 847
837
891
830
83,188
82,924
94,104
531,252
353,784
153,270
147,070
164,722
170,261
4,290 1,740
963
1,011
902
5,237
6,591
6,692
2,118
2,063
2,247
3,676
117,238
112,343
124,339
128,132
27,866
30,534
30,858
26,463
3.5
3.8
3.8
3.5
3.9
377,165
355,611
392,163
405,829
534,900
502,540
598,880
5.4
5.4
5.2
5.3
13/14
12/13
11/12
10/11
13/14
12/13
11/12
10/11
13/14
12/13
11/12
10/11
13/14
12/13
11/12
10/11
13/14
12/13
11/12
10/11
09/10
13/14
12/13
11/12
10/11
13/14
12/13
11/12
10/11
13/14
12/13
11/12
10/11
13/14
12/13
11/12
10/11
13/14
12/13
11/12
10/11
13/14
12/13
11/12
10/11
13/14
12/13
11/12
10/11
09/10
Protecting local environmentsOur most significant presence is at our Altona manufacturing site which covers 76 hectares (approximately 38 times the size of the MCG playing field) and is adjacent to the Kororoit Creek.
We have 17 ground water wells at Altona for which there is a comprehensive monitoring and testing program. This monitoring program is coupled with extensive upstream process controls to prevent soil and groundwater contamination at the site.
Toyota Australia has also made a significant contribution to the transformation of the Kororoit Creek and its surrounds most significantly through our relationship with the Friends of Lower Kororoit Creek Inc. (The Friends) which began in 2003.
As part of our contribution to the local community in the early 2000s we donated land we owned, including parts of the creek, back to the local government so it could be managed as part of the state government’s Kororoit Creek Regional Strategy – 2005 to 2030.
Another key aspect of our support of the Friends is through National Tree Day. While more than 1,500 trees and shrubs were planted along the creek in 2013, it is estimated that over the past ten years Toyota Australia has supported the planting of between 15,000 and 20,000 trees near the manufacturing plant and more than 40,000 trees along the creek.
In 2013 a number of new initiatives were undertaken including the establishment of a working group that will continue to focus on the beautification of the creek corridor. The working group involves Toyota, Hobsons Bay Council, Melbourne Water, Altona Cemetery Trust and Vic Roads who will work together to improve the creek corridor. Focus has been on future planting priorities and pest and weed control in line with the Kororoit creek master plan.
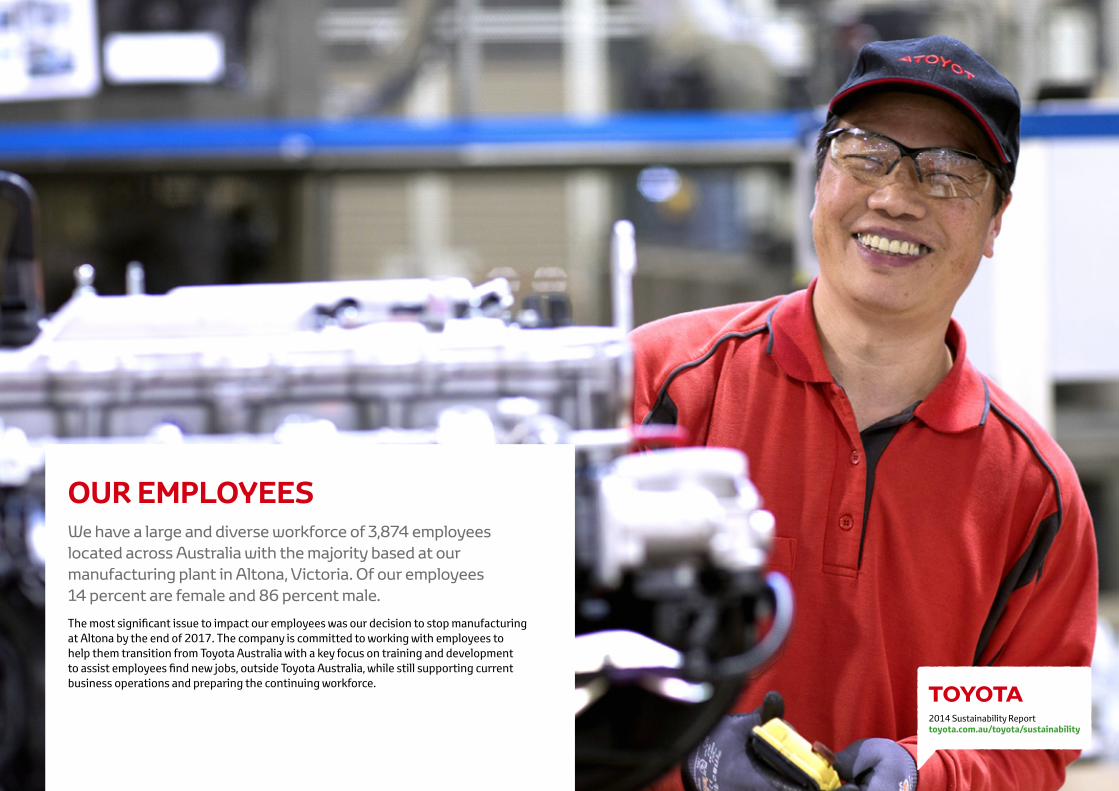
2014 Sustainability Report toyota.com.au/toyota/sustainability
OUR EMPLOYEESWe have a large and diverse workforce of 3,874 employees located across Australia with the majority based at our manufacturing plant in Altona, Victoria. Of our employees 14 percent are female and 86 percent male.
The most significant issue to impact our employees was our decision to stop manufacturing at Altona by the end of 2017. The company is committed to working with employees to help them transition from Toyota Australia with a key focus on training and development to assist employees find new jobs, outside Toyota Australia, while still supporting current business operations and preparing the continuing workforce.
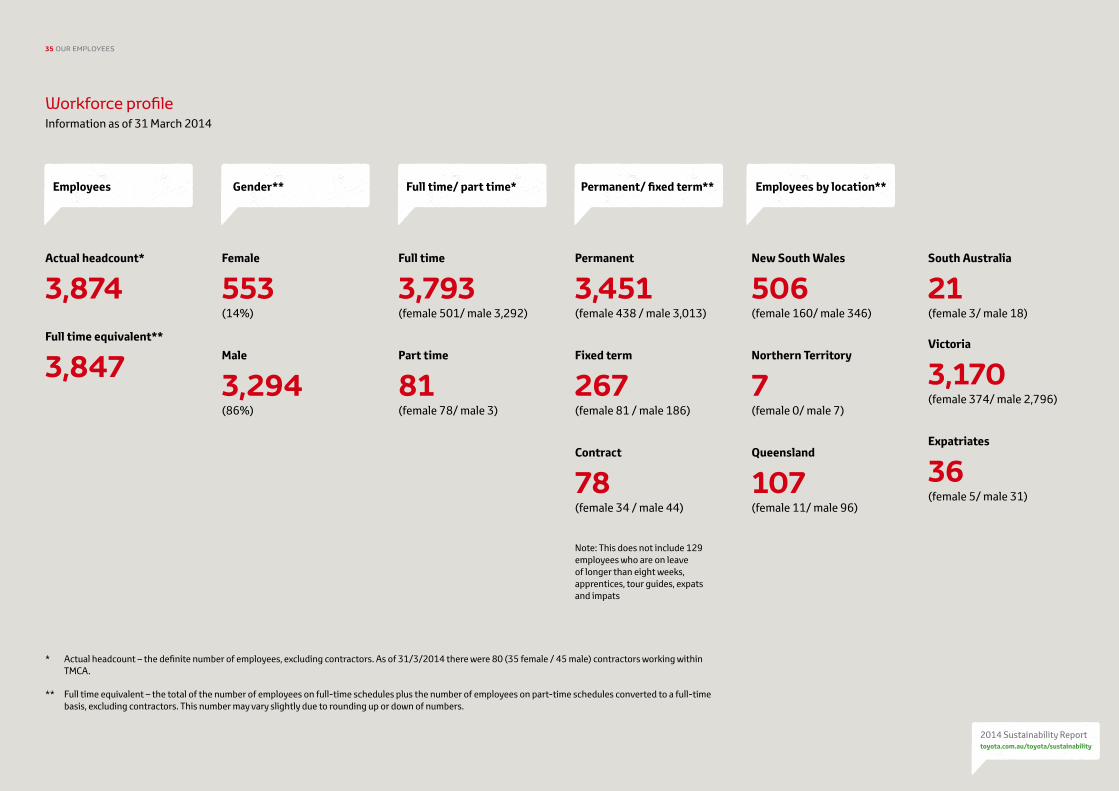
S2014 Sustainability Report toyota.com.au/toyota/sustainability
35 OUR EMPLOYEES
Workforce profileInformation as of 31 March 2014
Female
553 (14%)
Male
3,294 (86%)
Permanent
3,451 (female 438 / male 3,013)
Fixed term
267 (female 81 / male 186)
Contract
78 (female 34 / male 44)
Full time
3,793 (female 501/ male 3,292)
Part time
81 (female 78/ male 3)
New South Wales
506 (female 160/ male 346)
Northern Territory
7 (female 0/ male 7)
Queensland
107 (female 11/ male 96)
S S SSSEmployees Gender** Full time/ part time* Permanent/ fixed term** Employees by location**
Actual headcount*
3,874Full time equivalent**
3,847
* Actual headcount – the definite number of employees, excluding contractors. As of 31/3/2014 there were 80 (35 female / 45 male) contractors working within TMCA.
** Full time equivalent – the total of the number of employees on full-time schedules plus the number of employees on part-time schedules converted to a full-time basis, excluding contractors. This number may vary slightly due to rounding up or down of numbers.
Note: This does not include 129 employees who are on leave of longer than eight weeks, apprentices, tour guides, expats and impats
South Australia
21 (female 3/ male 18)
Victoria
3,170 (female 374/ male 2,796)
Expatriates
36 (female 5/ male 31)
S2014 Sustainability Report toyota.com.au/toyota/sustainability
36 OUR EMPLOYEES
Industrial relationsIndustrial relations was an important issue during the reporting period even prior to our announcement to stop manufacturing. With 74 percent of our employees (or 2,582 full time equivalent employees) covered by an award, the 2011 Toyota Australia Workplace Agreement, it is vital that we apply a considered and systematic approach to managing our relationship with the unions that represent our employees.
While the most significant issue during the reporting period related to the decision to stop manufacturing at Altona, there were also other industrial relations impacts during the year.
In October 2013 we announced there would be up to 100 voluntary redundancies at the plant. This decision was in response to a drop in export orders, making it unsustainable to maintain the size of the manufacturing workforce.
During the reporting period we also sought a variation to the terms and conditions of our Workplace Agreement, however, this was not successful with the Federal Court ruling at the time that Toyota Australia could not proceed with a planned employee vote on the proposed changes. The Federal Court overturned this ruling in July 2014.
The most significant issue to impact our employees was our decision to stop manufacturing at Altona by the end of 2017. While approximately 2,500 employees directly involved with manufacturing will be effected, there will also be an impact on the company’s corporate divisions. A process to determine what roles and functions will remain is being undertaken in 2014 with a decision expected in late 2014.
Following our announcement and a period of consultation with employees and the union, a redundancy package was announced in May 2014. Key elements of the redundancy package include four weeks notice for employees aged under 45 years, five weeks notice for employees aged 45 years and over, severance pay of four weeks per years of service (capped at 90 weeks), loyalty pay of one week per year of service (uncapped) and 75 per cent of sick leave as at the date of redundancy.
Our general workplace agreement for award employees specifies a minimum notice period of between two and four weeks depending on years of service. Award employees over the age of 45 who have a minimum of two years’ service are given an additional one week notice period.
Training and developmentTraining and development is often in the spotlight especially in organisations such as Toyota Australia which have such large and diverse workforces. The issue has become increasingly important following the recent announcement to stop manufacturing by the end of 2017. A key focus of training and development will be to assist employees’ transition to new jobs, outside Toyota Australia, while still supporting current business operations and preparing the continuing workforce.
Our approach to training and development can be divided into two key areas – our ongoing development policy and activity to continue to ‘up-skill’ employees to succeed in roles and activity to ‘re-skill’ employees for re-employment, post manufacturing closure.
Training and developmentManagement of training and development is divided into four key areas:
delivery of global Toyota programs to ensure that company values and methods are understood and practiced worldwide;
manager and leadership training;
training specific to operations, including manufacturing operations at our plant in Altona and operations at our national warehouses; and
training for dealers and service providers.
The global development programs are designed to give new employees an understanding of the Toyota Way so that these values can be applied in their daily work. The programs provide guidance on:
The history, foundation and application of the Toyota Way;
Ensuring continuous improvement in employees’ daily work by applying the principles of Plan Do Check Act;
Building consensus through effective report writing; and
Identifying and solving simple and complex problems in daily work.
In addition to this, we also support training specific to an employee’s job. This may involve on the job training, short courses and seminars, or further education.
A program of promotions and rotations (P&R) is undertaken across the business. This provides development opportunities for employees by aligning business needs with employees who possess the required skills and abilities. P&R also provides the company with an effective system for managing career progression and development opportunities for employees.
The company supports regular performance and career development reviews for all non-award and award-covered employees, in professional, technical and supervisory roles. In 2013 we introduced team member assessments for all award shop floor workers. They are evaluated and given feedback on their strengths and opportunities for improvement.
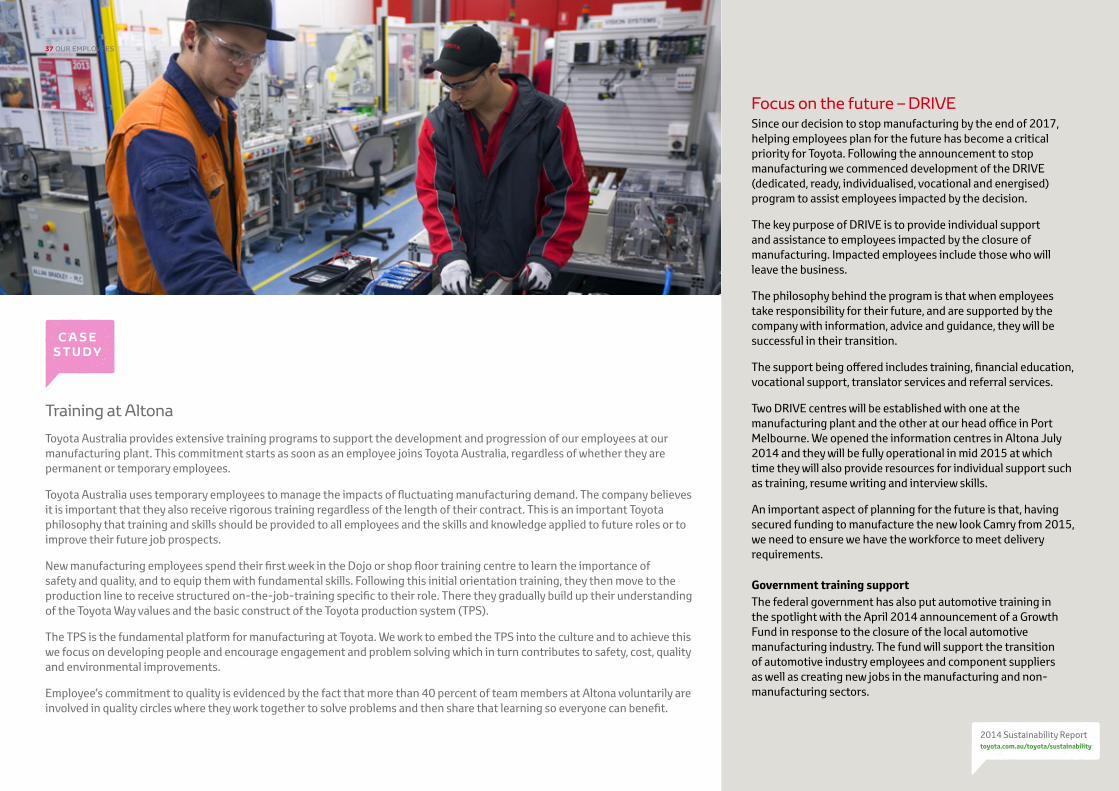
S2014 Sustainability Report toyota.com.au/toyota/sustainability
37 OUR EMPLOYEES
QC A S E S T U D Y
Training at Altona
Toyota Australia provides extensive training programs to support the development and progression of our employees at our manufacturing plant. This commitment starts as soon as an employee joins Toyota Australia, regardless of whether they are permanent or temporary employees.
Toyota Australia uses temporary employees to manage the impacts of fluctuating manufacturing demand. The company believes it is important that they also receive rigorous training regardless of the length of their contract. This is an important Toyota philosophy that training and skills should be provided to all employees and the skills and knowledge applied to future roles or to improve their future job prospects.
New manufacturing employees spend their first week in the Dojo or shop floor training centre to learn the importance of safety and quality, and to equip them with fundamental skills. Following this initial orientation training, they then move to the production line to receive structured on-the-job-training specific to their role. There they gradually build up their understanding of the Toyota Way values and the basic construct of the Toyota production system (TPS).
The TPS is the fundamental platform for manufacturing at Toyota. We work to embed the TPS into the culture and to achieve this we focus on developing people and encourage engagement and problem solving which in turn contributes to safety, cost, quality and environmental improvements.
Employee’s commitment to quality is evidenced by the fact that more than 40 percent of team members at Altona voluntarily are involved in quality circles where they work together to solve problems and then share that learning so everyone can benefit.
Focus on the future – DRIVESince our decision to stop manufacturing by the end of 2017, helping employees plan for the future has become a critical priority for Toyota. Following the announcement to stop manufacturing we commenced development of the DRIVE (dedicated, ready, individualised, vocational and energised) program to assist employees impacted by the decision.
The key purpose of DRIVE is to provide individual support and assistance to employees impacted by the closure of manufacturing. Impacted employees include those who will leave the business.
The philosophy behind the program is that when employees take responsibility for their future, and are supported by the company with information, advice and guidance, they will be successful in their transition.
The support being offered includes training, financial education, vocational support, translator services and referral services.
Two DRIVE centres will be established with one at the manufacturing plant and the other at our head office in Port Melbourne. We opened the information centres in Altona July 2014 and they will be fully operational in mid 2015 at which time they will also provide resources for individual support such as training, resume writing and interview skills.
An important aspect of planning for the future is that, having secured funding to manufacture the new look Camry from 2015, we need to ensure we have the workforce to meet delivery requirements.
Government training supportThe federal government has also put automotive training in the spotlight with the April 2014 announcement of a Growth Fund in response to the closure of the local automotive manufacturing industry. The fund will support the transition of automotive industry employees and component suppliers as well as creating new jobs in the manufacturing and non-manufacturing sectors.
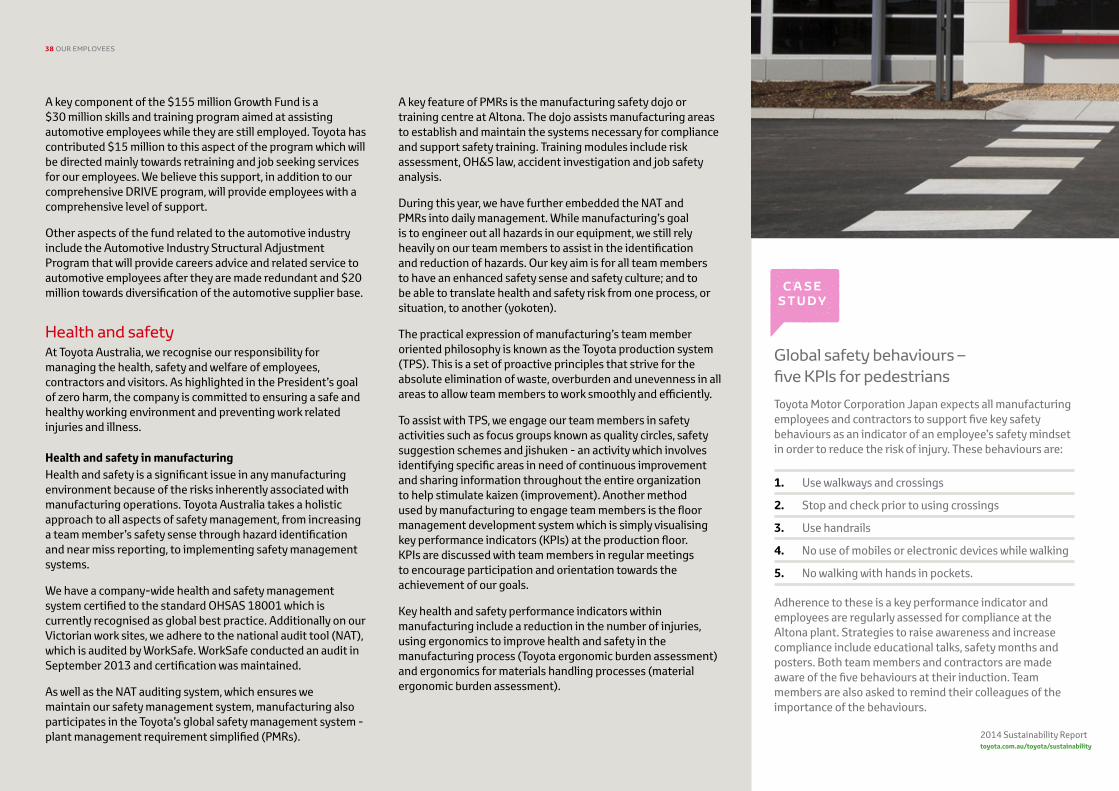
S2014 Sustainability Report toyota.com.au/toyota/sustainability
38 OUR EMPLOYEES
A key component of the $155 million Growth Fund is a $30 million skills and training program aimed at assisting automotive employees while they are still employed. Toyota has contributed $15 million to this aspect of the program which will be directed mainly towards retraining and job seeking services for our employees. We believe this support, in addition to our comprehensive DRIVE program, will provide employees with a comprehensive level of support.
Other aspects of the fund related to the automotive industry include the Automotive Industry Structural Adjustment Program that will provide careers advice and related service to automotive employees after they are made redundant and $20 million towards diversification of the automotive supplier base.
Health and safetyAt Toyota Australia, we recognise our responsibility for managing the health, safety and welfare of employees, contractors and visitors. As highlighted in the President’s goal of zero harm, the company is committed to ensuring a safe and healthy working environment and preventing work related injuries and illness.
Health and safety in manufacturingHealth and safety is a significant issue in any manufacturing environment because of the risks inherently associated with manufacturing operations. Toyota Australia takes a holistic approach to all aspects of safety management, from increasing a team member’s safety sense through hazard identification and near miss reporting, to implementing safety management systems.
We have a company-wide health and safety management system certified to the standard OHSAS 18001 which is currently recognised as global best practice. Additionally on our Victorian work sites, we adhere to the national audit tool (NAT), which is audited by WorkSafe. WorkSafe conducted an audit in September 2013 and certification was maintained.
As well as the NAT auditing system, which ensures we maintain our safety management system, manufacturing also participates in the Toyota’s global safety management system - plant management requirement simplified (PMRs).
A key feature of PMRs is the manufacturing safety dojo or training centre at Altona. The dojo assists manufacturing areas to establish and maintain the systems necessary for compliance and support safety training. Training modules include risk assessment, OH&S law, accident investigation and job safety analysis.
During this year, we have further embedded the NAT and PMRs into daily management. While manufacturing’s goal is to engineer out all hazards in our equipment, we still rely heavily on our team members to assist in the identification and reduction of hazards. Our key aim is for all team members to have an enhanced safety sense and safety culture; and to be able to translate health and safety risk from one process, or situation, to another (yokoten).
The practical expression of manufacturing’s team member oriented philosophy is known as the Toyota production system (TPS). This is a set of proactive principles that strive for the absolute elimination of waste, overburden and unevenness in all areas to allow team members to work smoothly and efficiently.
To assist with TPS, we engage our team members in safety activities such as focus groups known as quality circles, safety suggestion schemes and jishuken - an activity which involves identifying specific areas in need of continuous improvement and sharing information throughout the entire organization to help stimulate kaizen (improvement). Another method used by manufacturing to engage team members is the floor management development system which is simply visualising key performance indicators (KPIs) at the production floor. KPIs are discussed with team members in regular meetings to encourage participation and orientation towards the achievement of our goals.
Key health and safety performance indicators within manufacturing include a reduction in the number of injuries, using ergonomics to improve health and safety in the manufacturing process (Toyota ergonomic burden assessment) and ergonomics for materials handling processes (material ergonomic burden assessment).
Global safety behaviours – five KPIs for pedestrians
Toyota Motor Corporation Japan expects all manufacturing employees and contractors to support five key safety behaviours as an indicator of an employee’s safety mindset in order to reduce the risk of injury. These behaviours are:
1. Use walkways and crossings
2. Stop and check prior to using crossings
3. Use handrails
4. No use of mobiles or electronic devices while walking
5. No walking with hands in pockets.
Adherence to these is a key performance indicator and employees are regularly assessed for compliance at the Altona plant. Strategies to raise awareness and increase compliance include educational talks, safety months and posters. Both team members and contractors are made aware of the five behaviours at their induction. Team members are also asked to remind their colleagues of the importance of the behaviours.
QC A S E S T U D Y
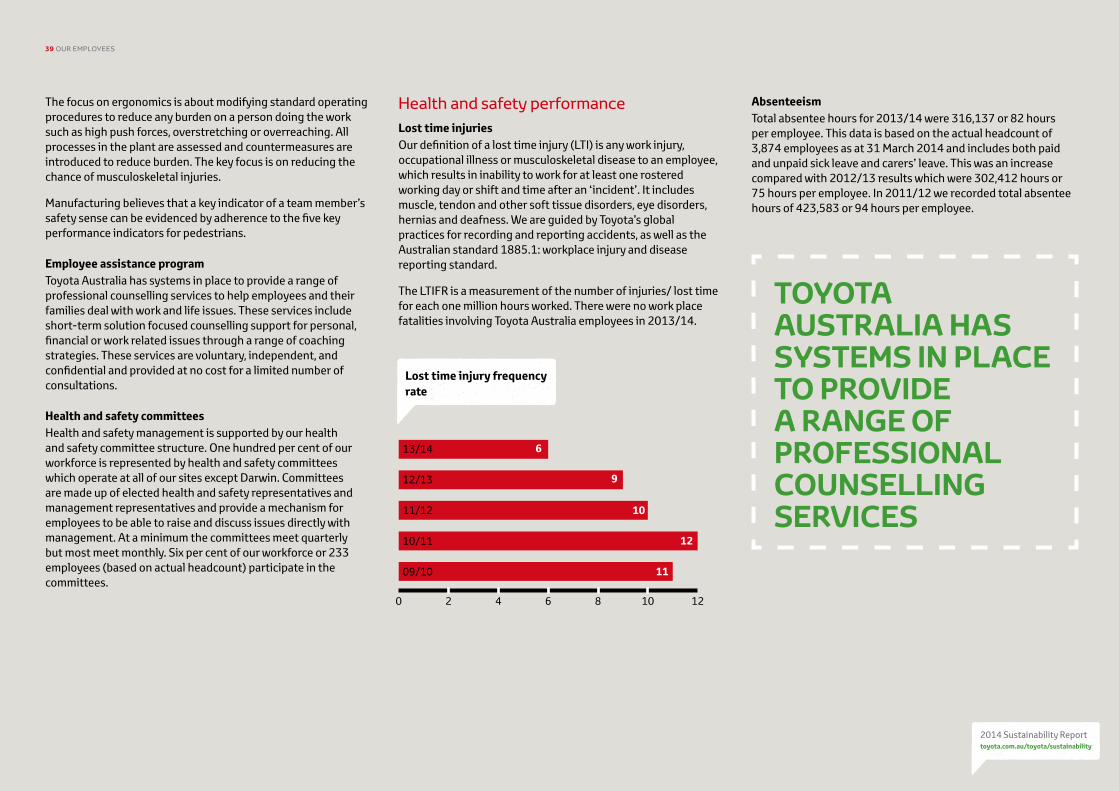
S2014 Sustainability Report toyota.com.au/toyota/sustainability
39 OUR EMPLOYEES
The focus on ergonomics is about modifying standard operating procedures to reduce any burden on a person doing the work such as high push forces, overstretching or overreaching. All processes in the plant are assessed and countermeasures are introduced to reduce burden. The key focus is on reducing the chance of musculoskeletal injuries.
Manufacturing believes that a key indicator of a team member’s safety sense can be evidenced by adherence to the five key performance indicators for pedestrians.
Employee assistance programToyota Australia has systems in place to provide a range of professional counselling services to help employees and their families deal with work and life issues. These services include short-term solution focused counselling support for personal, financial or work related issues through a range of coaching strategies. These services are voluntary, independent, and confidential and provided at no cost for a limited number of consultations.
Health and safety committeesHealth and safety management is supported by our health and safety committee structure. One hundred per cent of our workforce is represented by health and safety committees which operate at all of our sites except Darwin. Committees are made up of elected health and safety representatives and management representatives and provide a mechanism for employees to be able to raise and discuss issues directly with management. At a minimum the committees meet quarterly but most meet monthly. Six per cent of our workforce or 233 employees (based on actual headcount) participate in the committees.
Health and safety performanceLost time injuriesOur definition of a lost time injury (LTI) is any work injury, occupational illness or musculoskeletal disease to an employee, which results in inability to work for at least one rostered working day or shift and time after an ‘incident’. It includes muscle, tendon and other soft tissue disorders, eye disorders, hernias and deafness. We are guided by Toyota’s global practices for recording and reporting accidents, as well as the Australian standard 1885.1: workplace injury and disease reporting standard.
The LTIFR is a measurement of the number of injuries/ lost time for each one million hours worked. There were no work place fatalities involving Toyota Australia employees in 2013/14.
Lost time
Male/femal Full time part time
Permanent fixed term
location
6
9
10
11
12
13/14
12/13
11/12
10/11
09/10
0 2 4 6 8 10 12
AbsenteeismTotal absentee hours for 2013/14 were 316,137 or 82 hours per employee. This data is based on the actual headcount of 3,874 employees as at 31 March 2014 and includes both paid and unpaid sick leave and carers’ leave. This was an increase compared with 2012/13 results which were 302,412 hours or 75 hours per employee. In 2011/12 we recorded total absentee hours of 423,583 or 94 hours per employee.
SLost time injury frequency rate
TOYOTA AUSTRALIA HAS SYSTEMS IN PLACE TO PROVIDE A RANGE OF PROFESSIONAL COUNSELLING SERVICES
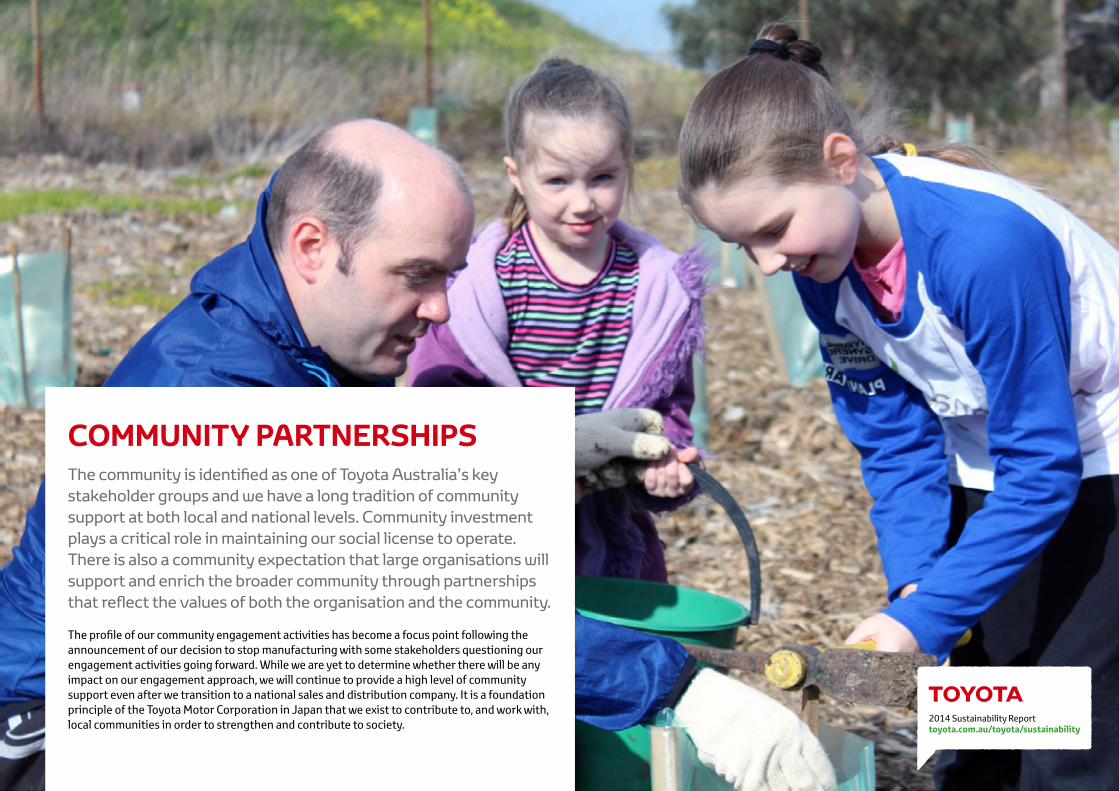
2014 Sustainability Report toyota.com.au/toyota/sustainability
The community is identified as one of Toyota Australia’s key stakeholder groups and we have a long tradition of community support at both local and national levels. Community investment plays a critical role in maintaining our social license to operate. There is also a community expectation that large organisations will support and enrich the broader community through partnerships that reflect the values of both the organisation and the community.
COMMUNITY PARTNERSHIPS
The profile of our community engagement activities has become a focus point following the announcement of our decision to stop manufacturing with some stakeholders questioning our engagement activities going forward. While we are yet to determine whether there will be any impact on our engagement approach, we will continue to provide a high level of community support even after we transition to a national sales and distribution company. It is a foundation principle of the Toyota Motor Corporation in Japan that we exist to contribute to, and work with, local communities in order to strengthen and contribute to society.
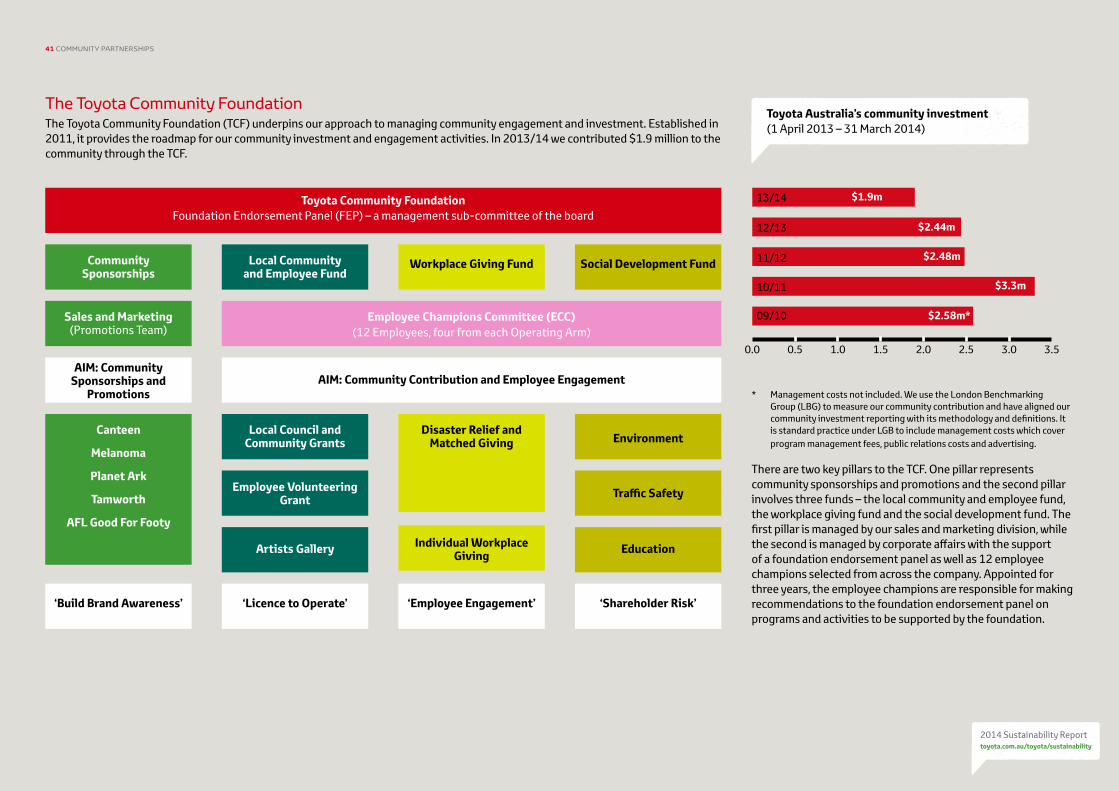
S2014 Sustainability Report toyota.com.au/toyota/sustainability
41 COMMUNITY PARTNERSHIPS
The Toyota Community FoundationThe Toyota Community Foundation (TCF) underpins our approach to managing community engagement and investment. Established in 2011, it provides the roadmap for our community investment and engagement activities. In 2013/14 we contributed $1.9 million to the community through the TCF.
Toyota Community FoundationFoundation Endorsement Panel (FEP) – a management sub-committee of the board
Community Sponsorships
Sales and Marketing (Promotions Team)
AIM: Community Sponsorships and
Promotions
Canteen
Melanoma
Planet Ark
Tamworth
AFL Good For Footy
Local Community and Employee Fund
Employee Champions Committee (ECC) (12 Employees, four from each Operating Arm)
AIM: Community Contribution and Employee Engagement
Disaster Relief and Matched Giving
Employee Volunteering Grant
Local Council and Community Grants
Artists Gallery
‘Licence to Operate’‘Build Brand Awareness’
Individual Workplace Giving
‘Employee Engagement’
Education
‘Shareholder Risk’
Traffic Safety
Environment
Workplace Giving Fund Social Development Fund
* Management costs not included. We use the London Benchmarking Group (LBG) to measure our community contribution and have aligned our community investment reporting with its methodology and definitions. It is standard practice under LGB to include management costs which cover program management fees, public relations costs and advertising.
There are two key pillars to the TCF. One pillar represents community sponsorships and promotions and the second pillar involves three funds – the local community and employee fund, the workplace giving fund and the social development fund. The first pillar is managed by our sales and marketing division, while the second is managed by corporate affairs with the support of a foundation endorsement panel as well as 12 employee champions selected from across the company. Appointed for three years, the employee champions are responsible for making recommendations to the foundation endorsement panel on programs and activities to be supported by the foundation.
13/14
12/13
11/12
10/11
09/10
0.0 0.5 1.0 1.5 2.0 2.5 3.0 3.5
$2.44m
$1.9m
$2.48m
$3.3m
$2.58m*
Toyota Australia’s community investment(1 April 2013 – 31 March 2014)
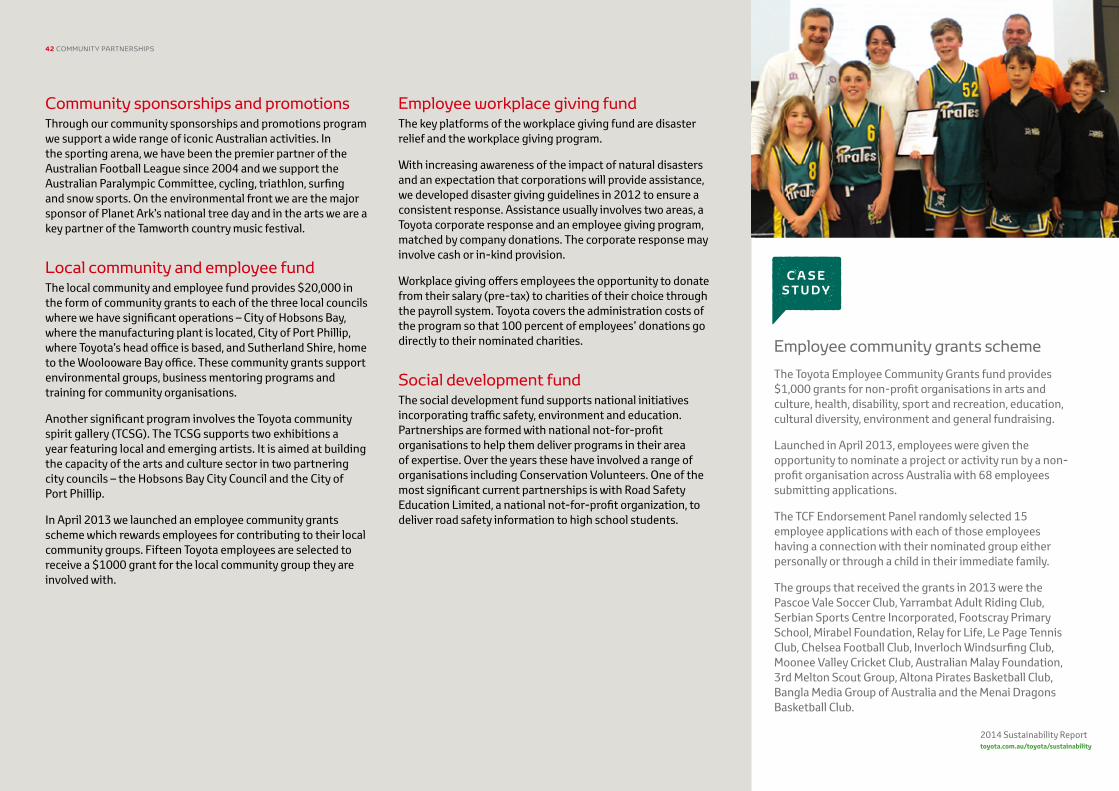
S2014 Sustainability Report toyota.com.au/toyota/sustainability
42 COMMUNITY PARTNERSHIPS
Employee community grants scheme
The Toyota Employee Community Grants fund provides $1,000 grants for non-profit organisations in arts and culture, health, disability, sport and recreation, education, cultural diversity, environment and general fundraising.
Launched in April 2013, employees were given the opportunity to nominate a project or activity run by a non-profit organisation across Australia with 68 employees submitting applications.
The TCF Endorsement Panel randomly selected 15 employee applications with each of those employees having a connection with their nominated group either personally or through a child in their immediate family.
The groups that received the grants in 2013 were the Pascoe Vale Soccer Club, Yarrambat Adult Riding Club, Serbian Sports Centre Incorporated, Footscray Primary School, Mirabel Foundation, Relay for Life, Le Page Tennis Club, Chelsea Football Club, Inverloch Windsurfing Club, Moonee Valley Cricket Club, Australian Malay Foundation, 3rd Melton Scout Group, Altona Pirates Basketball Club, Bangla Media Group of Australia and the Menai Dragons Basketball Club.
Community sponsorships and promotionsThrough our community sponsorships and promotions program we support a wide range of iconic Australian activities. In the sporting arena, we have been the premier partner of the Australian Football League since 2004 and we support the Australian Paralympic Committee, cycling, triathlon, surfing and snow sports. On the environmental front we are the major sponsor of Planet Ark’s national tree day and in the arts we are a key partner of the Tamworth country music festival.
Local community and employee fundThe local community and employee fund provides $20,000 in the form of community grants to each of the three local councils where we have significant operations – City of Hobsons Bay, where the manufacturing plant is located, City of Port Phillip, where Toyota’s head office is based, and Sutherland Shire, home to the Woolooware Bay office. These community grants support environmental groups, business mentoring programs and training for community organisations.
Another significant program involves the Toyota community spirit gallery (TCSG). The TCSG supports two exhibitions a year featuring local and emerging artists. It is aimed at building the capacity of the arts and culture sector in two partnering city councils – the Hobsons Bay City Council and the City of Port Phillip.
In April 2013 we launched an employee community grants scheme which rewards employees for contributing to their local community groups. Fifteen Toyota employees are selected to receive a $1000 grant for the local community group they are involved with.
Employee workplace giving fundThe key platforms of the workplace giving fund are disaster relief and the workplace giving program.
With increasing awareness of the impact of natural disasters and an expectation that corporations will provide assistance, we developed disaster giving guidelines in 2012 to ensure a consistent response. Assistance usually involves two areas, a Toyota corporate response and an employee giving program, matched by company donations. The corporate response may involve cash or in-kind provision.
Workplace giving offers employees the opportunity to donate from their salary (pre-tax) to charities of their choice through the payroll system. Toyota covers the administration costs of the program so that 100 percent of employees’ donations go directly to their nominated charities.
Social development fundThe social development fund supports national initiatives incorporating traffic safety, environment and education. Partnerships are formed with national not-for-profit organisations to help them deliver programs in their area of expertise. Over the years these have involved a range of organisations including Conservation Volunteers. One of the most significant current partnerships is with Road Safety Education Limited, a national not-for-profit organization, to deliver road safety information to high school students.
QC A S E S T U D Y
S2014 Sustainability Report toyota.com.au/toyota/sustainability
Areas for improvement:• Materiality principle: Greater transparency on data and any
weightings used to develop the materiality matrix, including the outcomes of the validation step.
• Inclusivity principle: Enhanced external stakeholder interview program to include representation from suppliers and customers.
• Responsiveness principle: No areas for improvement were identified for this principle.
• Performance information: Consistency in the number of decimal points to which data are reported throughout the Sustainability Report . Inclusion of training data, such as the number of hours training per employee. Consistency in employee data reporting in relation to full-time equivalents (FTEs) or head count.
Beca congratulates Toyota Australia on its continued commitment to sustainability reporting.
Beca Pty Ltd, 15 August 2014, Melbourne, Australia
Beca Pty Ltd (Beca) is an independent employee-owned engineering and related consultancy services group in the Asia Pacific region. Beca has prepared this statement for Toyota Australia in accordance with Beca’s standard terms and the standard practised by members of the consulting profession performing this type of service at the same time. No other warranty, express or implied, is given by Beca as a result of the provision of this statement. To the extent permitted by law, this statement is provided for informational purposes only, without the right to rely, and Beca will not be liable for any reliance which may be placed on this statement by a third party. This statement may not be used by any third party without Beca’s express written permission.
43 ASSURANCE STATEMENT
ASSURANCE STATEMENTBeca Pty Ltd Independent Assurance Report to Toyota Australia
Beca Pty Ltd (Beca) was engaged by Toyota Australia to provide independent Type 2 moderate assurance of its 2014 Sustainability Report to the scope of work below.
Scope of WorkThis assurance report was prepared for Toyota Australia and its stakeholders. The 2014 Sustainability Report (the Report) covers Toyota Australia’s operations from 1 April 2013 to 31 March 2014, unless stated otherwise in the text. This work was performed using Beca’s assurance methodology to AA1000AS (2008), AccountAbility’s Assurance Standard. To do this, Beca interviewed a number of personnel and reviewed relevant information at Toyota Australia’s offices in Port Melbourne and the Altona manufacturing plant. Data collation processes were reviewed, including sighting a sample of original records, interrogating spreadsheets and re-performing some calculations. The following subject matter was evaluated against criteria defined in Assurance Principles Standard AA1000APS (2008) and Guidance for AA1000AS (2008) Assurance Providers:
• Adherence to the AA1000AS (2008) principles of materiality, inclusivity and responsiveness.
• Reliability of specific performance information: manufacturing viability (including stakeholder impact data), supplier support (including supplier numbers and spend), our employees (including workforce profile data), training and development and product safety.
Beca’s IndependenceToyota Australia was responsible for preparing the Report. Beca is one of the largest employee-owned engineering and related consultancy groups in Asia Pacific. Beca assurance auditors, led by Jo Cain, experienced in the determination of materiality and the assurance of sustainability data were responsible for expressing assurance conclusions in line with the scope of work agreed with Toyota Australia. During the reporting period, Beca did not work with Toyota Australia on other consulting.
Our ConclusionBeca concludes that, based on the scope of work and related limitations, for the specified subject matter, Toyota Australia’s 2014 Sustainability Report adheres to the AA1000AS (2008) principles of inclusivity, materiality and responsiveness and reports reliable performance information, based on the limitations outlined above, for 1 April 2013 to 31 March 2014. In addition, Beca has provided a management report to Toyota Australia.
Key ObservationsBased on the scope of work, and without affecting our assurance conclusion, Beca makes the following observations:
Good practice:
• Materiality principle: The materiality determination process is based on best practice guidance, a review of the context in which Toyota Australia operates and presentation of material issues and their relative rankings in a materiality matrix.
• Inclusivity principle: The stakeholder interview program includes balanced internal and external stakeholder representation as part of the materiality determination process.
• Responsiveness principle: Those material issues ranked highest by stakeholders and identified through stakeholder assurance interviews, form the basis of the Report, demonstrating responsiveness to stakeholders on the issues of most concern to them.
• Performance information: Supplier data reporting is both comprehensive and accurate. Employee data reporting is in-depth and accurate. Data owners demonstrated a high level of awareness, responsiveness and openness in sharing information during the assurance process.
000-121
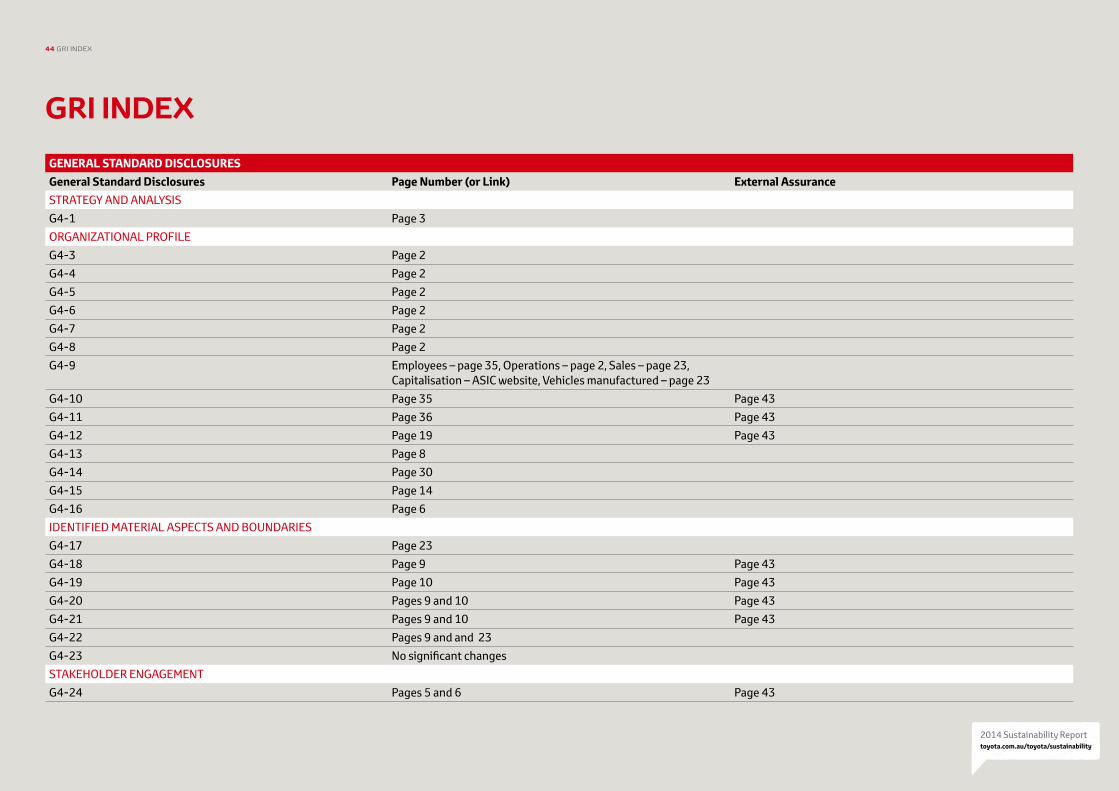
S2014 Sustainability Report toyota.com.au/toyota/sustainability
44 GRI INDEX
GRI INDEXGENERAL STANDARD DISCLOSURESGeneral Standard Disclosures Page Number (or Link) External AssuranceSTRATEGY AND ANALYSISG4-1 Page 3 ORGANIZATIONAL PROFILEG4-3 Page 2 G4-4 Page 2G4-5 Page 2 G4-6 Page 2 G4-7 Page 2G4-8 Page 2 G4-9 Employees – page 35, Operations – page 2, Sales – page 23,
Capitalisation – ASIC website, Vehicles manufactured – page 23G4-10 Page 35 Page 43G4-11 Page 36 Page 43G4-12 Page 19 Page 43G4-13 Page 8G4-14 Page 30G4-15 Page 14G4-16 Page 6IDENTIFIED MATERIAL ASPECTS AND BOUNDARIESG4-17 Page 23G4-18 Page 9 Page 43G4-19 Page 10 Page 43G4-20 Pages 9 and 10 Page 43G4-21 Pages 9 and 10 Page 43G4-22 Pages 9 and and 23G4-23 No significant changesSTAKEHOLDER ENGAGEMENTG4-24 Pages 5 and 6 Page 43
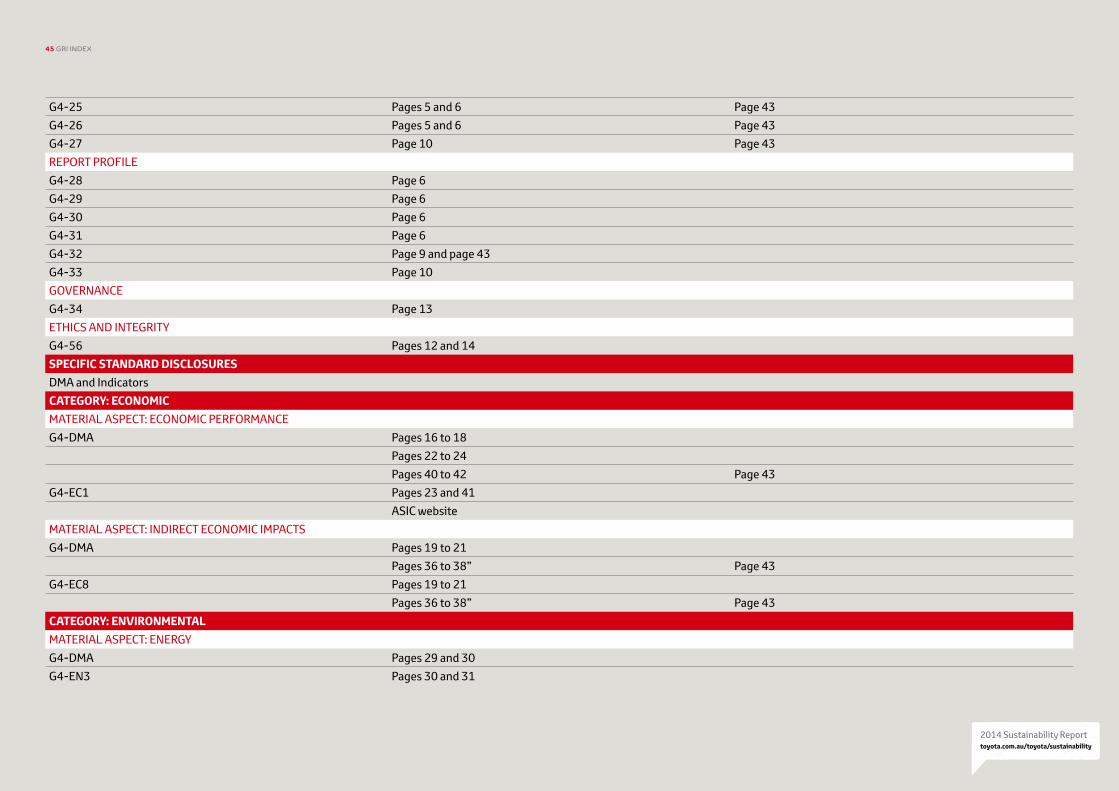
S2014 Sustainability Report toyota.com.au/toyota/sustainability
45 GRI INDEX
G4-25 Pages 5 and 6 Page 43G4-26 Pages 5 and 6 Page 43G4-27 Page 10 Page 43REPORT PROFILEG4-28 Page 6G4-29 Page 6G4-30 Page 6G4-31 Page 6G4-32 Page 9 and page 43G4-33 Page 10GOVERNANCEG4-34 Page 13ETHICS AND INTEGRITYG4-56 Pages 12 and 14SPECIFIC STANDARD DISCLOSURESDMA and IndicatorsCATEGORY: ECONOMICMATERIAL ASPECT: ECONOMIC PERFORMANCEG4-DMA Pages 16 to 18
Pages 22 to 24Pages 40 to 42 Page 43
G4-EC1 Pages 23 and 41ASIC website
MATERIAL ASPECT: INDIRECT ECONOMIC IMPACTSG4-DMA Pages 19 to 21
Pages 36 to 38” Page 43G4-EC8 Pages 19 to 21
Pages 36 to 38” Page 43CATEGORY: ENVIRONMENTALMATERIAL ASPECT: ENERGYG4-DMA Pages 29 and 30G4-EN3 Pages 30 and 31
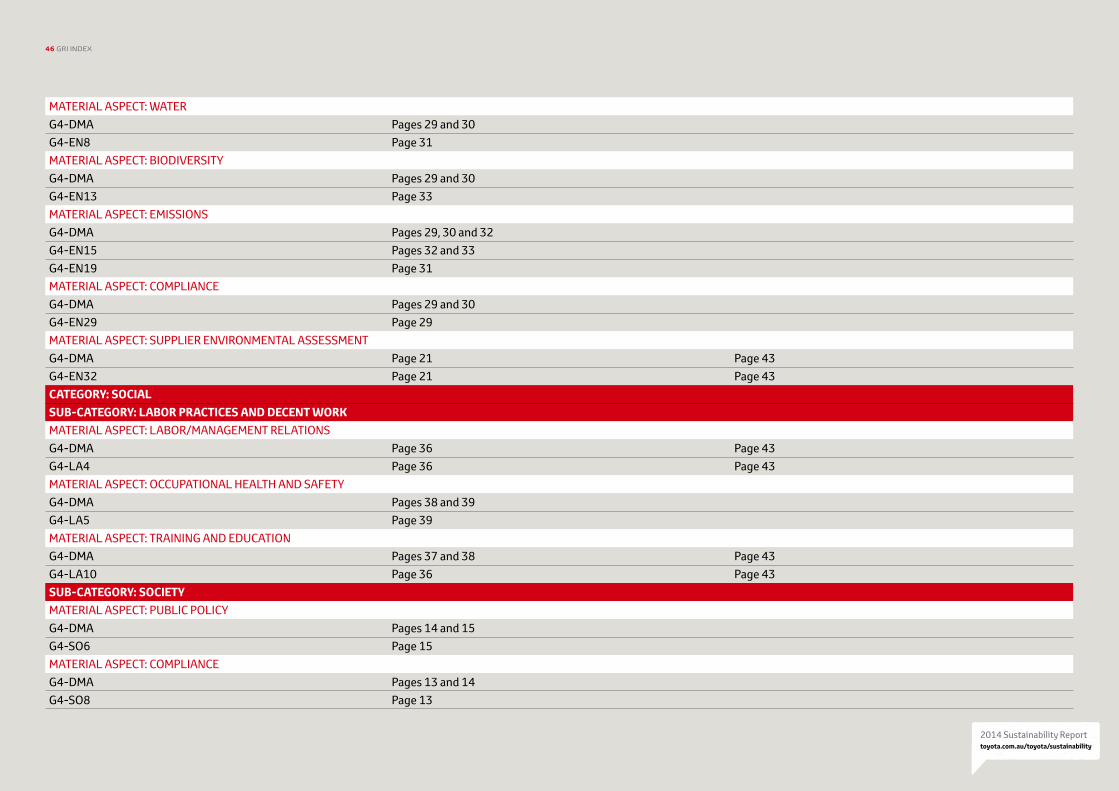
S2014 Sustainability Report toyota.com.au/toyota/sustainability
46 GRI INDEX
MATERIAL ASPECT: WATERG4-DMA Pages 29 and 30G4-EN8 Page 31MATERIAL ASPECT: BIODIVERSITYG4-DMA Pages 29 and 30G4-EN13 Page 33MATERIAL ASPECT: EMISSIONSG4-DMA Pages 29, 30 and 32G4-EN15 Pages 32 and 33G4-EN19 Page 31MATERIAL ASPECT: COMPLIANCEG4-DMA Pages 29 and 30G4-EN29 Page 29MATERIAL ASPECT: SUPPLIER ENVIRONMENTAL ASSESSMENTG4-DMA Page 21 Page 43G4-EN32 Page 21 Page 43CATEGORY: SOCIALSUB-CATEGORY: LABOR PRACTICES AND DECENT WORKMATERIAL ASPECT: LABOR/MANAGEMENT RELATIONSG4-DMA Page 36 Page 43G4-LA4 Page 36 Page 43MATERIAL ASPECT: OCCUPATIONAL HEALTH AND SAFETYG4-DMA Pages 38 and 39G4-LA5 Page 39MATERIAL ASPECT: TRAINING AND EDUCATIONG4-DMA Pages 37 and 38 Page 43G4-LA10 Page 36 Page 43SUB-CATEGORY: SOCIETYMATERIAL ASPECT: PUBLIC POLICYG4-DMA Pages 14 and 15G4-SO6 Page 15MATERIAL ASPECT: COMPLIANCEG4-DMA Pages 13 and 14G4-SO8 Page 13
S2014 Sustainability Report toyota.com.au/toyota/sustainability
47 STAKEHOLDER ENGAGEMENT
Copies of the report The 2014 Sustainability Report and supporting documentation can be viewed online at toyota.com.au/toyota/sustainability. If you would like a printed copy of the report, please email [email protected].
Feedback Give us your feedback so we can continue to improve on our approach to sustainability and reporting. If you have any comments, ideas or questions, please visit toyota.com.au/toyota/sustainability or email [email protected] to provide feedback.
Contact Head Office Toyota Motor Corporation Australia Limited 155 Bertie Street, Port Melbourne, VIC 3207
T (03) 9647 4444 E [email protected]
Related Documents