__________________________________________________________________ 2014 Southern Ute Indian Tribe Title V Point Source Air Emissions Inventory for Criteria and Hazardous Air Pollutants __________________________________________________________________ Prepared for: United States Environmental Protection Agency Region VIII 1595 Wynkoop Street Denver, Colorado 80202 Prepared by: Southern Ute Indian Tribe Environmental Programs Division Air Quality Program P.O. Box 737, MS# 84 Ignacio, Colorado 81137 (970) 563-4705 June 6 th , 2016

Welcome message from author
This document is posted to help you gain knowledge. Please leave a comment to let me know what you think about it! Share it to your friends and learn new things together.
Transcript

__________________________________________________________________
2014 Southern Ute Indian Tribe Title V Point Source Air
Emissions Inventory for Criteria and Hazardous Air
Pollutants __________________________________________________________________
Prepared for:
United States Environmental Protection Agency
Region VIII
1595 Wynkoop Street
Denver, Colorado 80202
Prepared by:
Southern Ute Indian Tribe
Environmental Programs Division
Air Quality Program
P.O. Box 737, MS# 84
Ignacio, Colorado 81137
(970) 563-4705
June 6th, 2016

Table of Contents
List of Appendices ......................................................................................................................... 2
List of Figures ................................................................................................................................ 2
List of Tables ................................................................................................................................. 2
List of Acronyms ........................................................................................................................... 3
I. Executive Summary ................................................................................................................. 1
1.1 Purpose of Inventory ....................................................................................................... 1
1.2 General Methodology ..................................................................................................... 1
1.3 Source Classification ...................................................................................................... 1
1.4 Spatial Coverage ............................................................................................................. 2
1.5 Base-Year ........................................................................................................................ 2
II. Introduction .............................................................................................................................. 2
2.1 General Description ........................................................................................................ 2
2.2 Geology ........................................................................................................................... 2
2.3 Climate ............................................................................................................................ 3
III. .............................................................................................................................. Point Sources
......................................................................................................................................................... 3
3.1 Title V Sources ............................................................................................................... 3
3.2 Data Collection ............................................................................................................... 4
3.3 Results ............................................................................................................................. 4
IV. ...................................................................................................................... Quality Assurance
......................................................................................................................................................... 7
4.1 Point Source QA Methodology ....................................................................................... 7
References ...................................................................................................................................... 8
List of Appendices
Appendix A. 2014 Title V Sources Operating on the Southern Ute Indian Reservation .............. 9
List of Figures
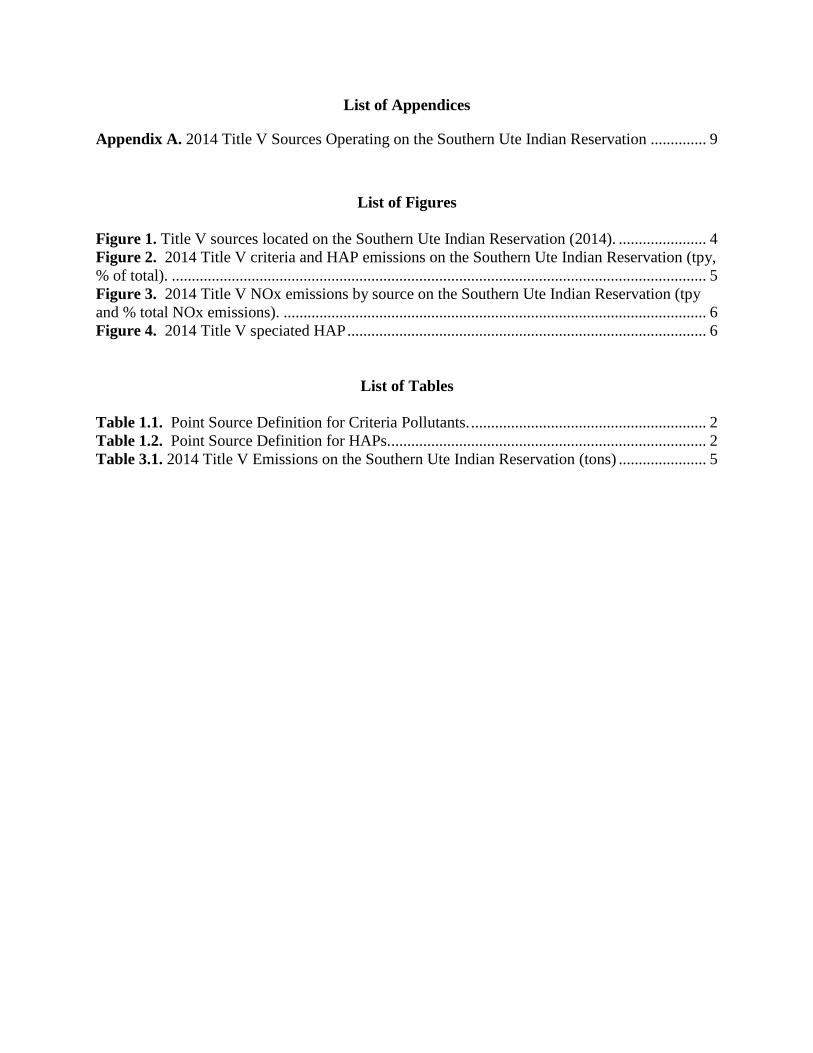
Figure 1. Title V sources located on the Southern Ute Indian Reservation (2014). ...................... 4 Figure 2. 2014 Title V criteria and HAP emissions on the Southern Ute Indian Reservation (tpy,
% of total). ...................................................................................................................................... 5
Figure 3. 2014 Title V NOx emissions by source on the Southern Ute Indian Reservation (tpy
and % total NOx emissions). .......................................................................................................... 6
Figure 4. 2014 Title V speciated HAP .......................................................................................... 6
List of Tables
Table 1.1. Point Source Definition for Criteria Pollutants. ........................................................... 2
Table 1.2. Point Source Definition for HAPs................................................................................ 2 Table 3.1. 2014 Title V Emissions on the Southern Ute Indian Reservation (tons) ...................... 5

List of Acronyms
AP-42 Compilation of Air Pollutant Emission Factors
AQP Air Quality Program
CAA Clean Air Act
CO Carbon Monoxide
CFR Code of Federal Regulations
CY Calendar Year
EI Emissions Inventory
EPA United States Environmental Protection Agency
HAP Hazardous Air Pollutants
NEI National Emissions Inventory
NMHC Non-methane Hydrocarbons
NMOC Non-methane Organic Compounds
NOx Oxides of Nitrogen
O3 Ozone
Pb Lead
PM10 Particulate Matter 10 microns and smaller
PM2.5 Particulate Matter 2.5 microns and smaller
QA Quality Assurance
SO2 Sulfur Dioxide
SUIT Southern Ute Indian Tribe
THC Total Hydrocarbons
TMNSR Tribal Minor New Source Review
TPY Tons per Year
VOC Volatile Organic Compounds

Southern Ute Indian Tribe
2014 Air Emissions Inventory
Page | 1
I. Executive Summary 1.1 Purpose of Inventory
The Southern Ute Indian Tribe (SUIT) Air Quality Program (AQP) prepared this Emissions
Inventory (inventory) to update baseline emissions data for the 2014 calendar year (CY) for all
quantifiable air emissions from Title V sources located within the exterior boundaries of the
Southern Ute Indian Reservation (Reservation). The inventory will be used to track total
emissions within the Reservation boundaries and may be used for future air quality planning
purposes.
The air pollutants included in this inventory are oxides of nitrogen (NOx), Carbon Monoxide
(CO), Particulate Matter (PM10), Volatile Organic Compounds (VOCs), and Hazardous Air
Pollutants (HAPs).
This inventory was developed to meet the following objectives:
Identify and quantify air emissions from Title V sources emitted within the
Reservation boundaries.
Satisfy EPA recommendation that tribes conduct an emissions inventory.
Fulfill the Fiscal Year 2015 Clean Air Act§103 grant of the Southern Ute Indian
Tribe Air Quality Program’s Work Plan Component 2.7, as follows:
a) Collect CY2014 Title V emission inventory and prepare a final 2014
emission inventory report for the Environmental Protection Agency.
b) Submit emissions data to the National Emission Inventory (NEI).
1.2 General Methodology
Data for this inventory were obtained from the Environmental Protection Agency (EPA)
administered 40 CFR Part 71 program and Southern Ute Indian Tribe administered 40 CFR Part
70 fee calculation worksheets for calendar year 2014. The data collection responsibilities were
divided among the Air Quality Technical Manager and Air Quality Analyst.
The AQP populated an internal database with emission totals for each Title V emission point.
Data was reviewed for quality assurance (QA) and imported into the EPA bridge tool where an
additional set of QA checks were run. The data was then uploaded to EPA’s National Emissions
Inventory database using EPA’s Exchange Network Web Client v2.0. Prior to being accepted
into the final NEI database, EPA performed a final data QA and verification.
1.3 Source Classification
Air pollutants have been separated into two Title V point source categories for the purpose of
this inventory. Tables 1.1 and 1.2 explain the definitions for a Title V point source for both
criteria pollutants and HAPs.

Southern Ute Indian Tribe
2014 Title V Air Emissions Inventory
Page | 2
Table 1.1. Title V Point Source Definition for Criteria Pollutants.
Table 1.2. Title V Point Source Definition for HAPs.
1.4 Spatial Coverage
This inventory encompasses the Title V sources operating within the exterior boundaries of the
Reservation in 2014 (Figure 1).
1.5 Base-Year
The Title V emission inventory presented in this report spans the period from January 1, 2014
through December 31, 2014. There were 365 days in this period.
II. Introduction 2.1 General Description
The Reservation is located in southwestern Colorado. The Reservation land area covers 1,066
square miles in three counties (La Plata, Archuleta, and Montezuma) and borders New Mexico to
the south. The total area covered by this inventory is approximately 682,590 acres, which
encompasses all land within the external boundaries of the Reservation. The Tribe and/or Tribal
Members own approximately 320,000 acres, while the remaining land mass is comprised of non-
Indian and government land in a checkerboard fashion. The primary land use is agricultural and
the predominant industry is natural gas production. As of December 2014, there were 42 Title V
sources that operated within its exterior boundaries.
2.2 Geology
The Reservation is located at the northern edge of the San Juan Basin, an asymmetrical
paleogeographic low measuring approximately 100 miles at its widest point. The basin is
located in northwestern New Mexico and southwestern Colorado and encompasses an area of
about 22,000 square miles. The basin is a tectonic feature that was formed as a result of crustal
flexure. At its deepest point, in the northeastern corner, the sedimentary rocks of the San Juan
Basin reach a thickness of approximately 15,000 feet. The San Juan and Rocky Mountain
ranges, as well as other Laramide age uplifts, supplied the sediment from which the Mesozoic
Age sedimentary rocks within the basin were formed. This sedimentary package contains both
the source rocks from which the hydrocarbons were formed and the reservoir rocks in which the
hydrocarbons are contained. Reservoir rocks have the ability to store hydrocarbons due to
certain physical properties such as permeability and porosity.
Category Definition
Criteria Pollutants
Six specific air pollutants for which the EPA has set national ambient air quality
standards including NOx, CO, ground-level ozone (secondary pollutant from the
chemical reaction of VOC, NOx and sunlight), sulfur dioxide (SO2), lead (Pb), and
particulate matter (PM).
Point sources Stationary sources of air pollutants which directly emit or have the potential to emit
100 tons per year or more of any criteria pollutant, including VOC.
Category Definition
HAPs Hazardous air pollutants known, or suspected, to cause cancer or other serious health
or environmental effects as identified under Clean Air Act Section 112(b).
Point sources Stationary sources of air pollutants which directly emit or have the potential to emit 10
tons per or more of any single HAP or 25 tons per year of any combination of HAPs.

Southern Ute Indian Tribe
2014 Title V Air Emissions Inventory
Page | 3
Natural gas and oil is produced by conventional methods from Cretaceous age sandstone
formations and unconventional methods from the Cretaceous age Fruitland Coal.
2.3 Climate
The Reservation remains generally semi-arid throughout the year. Sitting directly north of New
Mexico desert land and south of the Colorado alpines, the average temperature range during the
winter months is between twenty and forty degrees Fahrenheit. Freezing temperatures are fairly
common throughout the winter months (December – February) with December being the coldest
month with a low of -2 degrees Fahrenheit and a monthly average of 29.3 degrees Fahrenheit.
During the summer months (June – August) the temperature usually remains in the high eighties
to nineties. The warmest month of 2014 was July with a high of 92 degrees Fahrenheit, and a
monthly average of 70.1 degrees Fahrenheit.
Rain is the dominant form of precipitation on the Reservation. Snowfall is more common in
higher elevations. During the 2014 calendar year, the winter months on the Reservation recorded
0.95 inches of precipitation. During summer months 2.73 inches of rainfall precipitated.
Overall, the Reservation received 9.36 inches of precipitation during 2014. The driest months
for the 2014 calendar year were January and June.
III. Point Sources 3.1 Title V Sources
Forty-two Title V sources operated on the Reservation during CY2014. These sources consisted
of natural gas compressor stations, natural gas treatment plants, natural gas processing plants, a
salt water disposal facility, and a municipal waste landfill. All of these sources operated in
CY2014 under a Part 71 Title V program administered by EPA Region 8 or the Part 70 Title V
program administered by the Tribe (Appendix A). In March 2012, the Tribe received full
delegation of the Title V program and during calendar year 2014 the Tribe was in the process of
transitioning EPA issued Part 71 permits to Tribe issued Part 70 permits. Concurrently, EPA was
issuing synthetic minor permits under the newly promulgated Tribal Minor New Source Review
(TMNSR) program to transfer legally and practically enforceable emission limitations previously
established in the Part 71 permits. The TMNSR permit program enabled four sources to synthetic
minor out of the Title V program in CY2014. Additionally, in CY2014 three sources were
decommissioned and two sources removed equipment to lower emissions below Title V
thresholds. At the end on CY2014 twenty-seven sources were operating under Tribe issued Part
70 permits and six sources were operating under EPA Part 71 permits, for a total of thirty-three
Title V sources.

Southern Ute Indian Tribe
2014 Title V Air Emissions Inventory
Page | 4
Figure 1. Title V sources located on the Southern Ute Indian Reservation (2014).
3.2 Data Collection The Title V source emissions were collected from the fee calculation worksheets submitted by
each source to EPA Region 8 or the Tribe for the 2014 calendar year. For all of the Title V
sources emissions data, the compilation was done by Air Quality Program staff.
Title V sources are required to pay annual emission fees for each ton of regulated air pollutant,
except for carbon monoxide. However, some of the Title V sources included the actual CO
emissions in the supporting documents attached as appendices to the fee calculation worksheets.
Therefore, CO emissions for 37 Title V sources were reported for the 2014 calendar year.
3.3 Results
Table 3.1 below shows the total criteria air pollutant and HAP emissions from Title V sources
for the 2014 calendar year.

Southern Ute Indian Tribe
2014 Title V Air Emissions Inventory
Page | 5
Table 3.1 2014 Title V Emissions on the Southern Ute Indian Reservation (tons) Source
Type
Emission
Source CO1 NOx VOC PM10 SO2 HAP2
Point
Sources
Title V
sources 2,146.9 3, 324.0 1,472.7 79.4 53.1 349.7
1The actual CO emissions were obtained from the fee calculation worksheet, if the Title V source included the CO actual emissions. There were
37 Title V sources that included the actual CO emissions for the 2014 calendar year. 2The total HAP emissions include any of the hazardous air pollutants listed under Clean Air Act Section 112(b) and emitted by the Title V
sources. This does not include any THC, NMOC, or NMHC since these may consist of an unknown ratio of hazardous air pollutants and other
compounds.
Total criteria pollutant emissions from Title V sources for the 2014 year were 5,603.4 tons while
VOC and HAP emissions were 1,472.7 tons and 349.7 tons, respectively. CO, VOC, and NOx
emissions account for 29%, 20%, and 45%, of the sum of all Title V source emissions
respectively (Figure 2). Most of the Title V sources within the Reservation contribute
approximately 3% to 5% toward the total annual NOX emission rate for the airshed. However,
the Williams Ignacio Gas Plant alone contributed 686.00 tons of NOX emissions. This annual
emission rate is approximately 21% of the total 3,324.0 tpy of NOx emissions emitted from all
Title V sources permitted on the Reservation and this equates to about an additional nine Title V
sources for emissions of NOx (Figure 3).
The Williams Ignacio Gas Plant completed a compression upgrade project in CY2014, replacing
seven 1950’s era, 2,000 hp, natural gas-fired, two-cycle engines and three dated natural gas-fired
turbines with five new natural gas-fired turbines. Emissions of NOx from this facility decreased
from 1924.4 tons to 686.0 tons, a 36% decrease in NOx emission for CY2014.
Figure 2. 2014 Title V criteria and HAP emissions on the Southern Ute Indian Reservation (tpy, % of total).
Total HAP, 349.74, 4%
CO, 2,146.89, 29%
NOx, 3,324.04, 45%
PM10-PRI, 79.42, 1%
PM25-PRI, 0.00, 0%
SO2, 53.07, 1%VOC, 1,472.74, 20%

Southern Ute Indian Tribe
2014 Title V Air Emissions Inventory
Page | 6
Figure 3. 2014 Title V NOx emissions by source on the Southern Ute Indian Reservation (tpy and % total NOx
emissions).
Title V speciated HAP emissions for the 2014 calendar year were estimated at 263.61 tons.
Formaldehyde, Xylene, Toluene, and Benzene account for 77%, 9%, 7%, and 3% respectively
(Figure 4).
Figure 4. 2014 Title V speciated HAP emissions (tpy, % total HAP emissions).
Bondad Compressor Station, El Paso Natural
Gas, 155.09, 5%
Arkansas Loop Treating Plant, Red Cedar
Gathering CO., 216.20, 7%
Jaques Compressor Station, Samson
Resources, 120.40, 4%
South Ignacio Central Delivery Point, Samson Resources, 169.45, 5%
Worford Ridge Compressor Station, Samson Resources,
108.10, 3%
Ignacio Gas Plant, Williams Field Services
CO. , 686.00, 21%
Acetaldehyde, 5.57, 2%Acrolein, 3.28, 1%
Benzene, 7.01, 3%
Ethyl Benzene, 0.45, 0%
Formaldehyde, 202.52, 77%
Hexane, 1.57, 1%
Methanol, 0.41, 0%
Toluene, 19.17, 7%
Xylenes (Mixed Isomers), 23.63, 9%

Southern Ute Indian Tribe
2014 Title V Air Emissions Inventory
Page | 7
IV. Quality Assurance Quality assurance procedures for this EI consist of the following:
Check of emissions factors and calculations used for appropriateness
Review of Part 71 and Part 70 fee calculation worksheets
Reality checks (believability in a real world setting)
Double checking calculations for accuracy and reproducibility
4.1 Point Source QA Methodology
All the Title V source emissions data were collected from either Part 71 or Part 70 fee
calculation worksheets completed by source operators and submitted to either the EPA Region 8
or SUIT AQP, respectively. The emission inventory data were compiled and reviewed by the
SUIT AQP staff.
Southern Ute Indian Tribe
2014 Title V Air Emissions Inventory
Page | 8
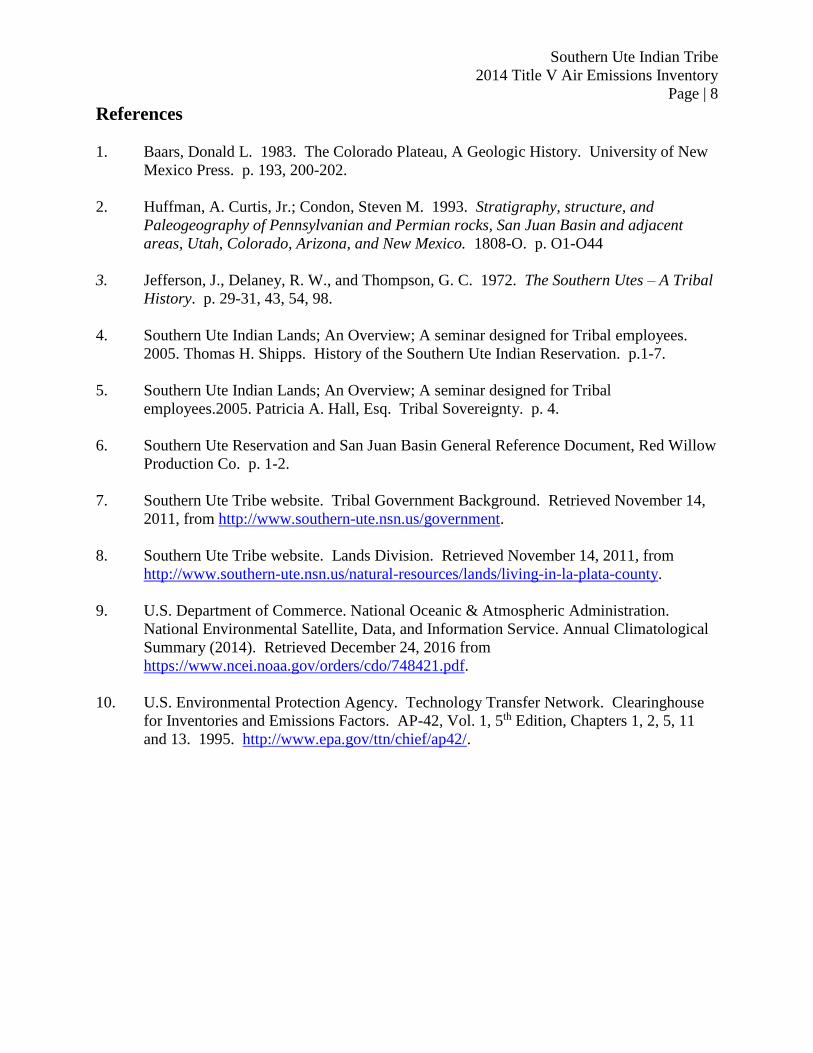
References
1. Baars, Donald L. 1983. The Colorado Plateau, A Geologic History. University of New
Mexico Press. p. 193, 200-202.
2. Huffman, A. Curtis, Jr.; Condon, Steven M. 1993. Stratigraphy, structure, and
Paleogeography of Pennsylvanian and Permian rocks, San Juan Basin and adjacent
areas, Utah, Colorado, Arizona, and New Mexico. 1808-O. p. O1-O44
3. Jefferson, J., Delaney, R. W., and Thompson, G. C. 1972. The Southern Utes – A Tribal
History. p. 29-31, 43, 54, 98.
4. Southern Ute Indian Lands; An Overview; A seminar designed for Tribal employees.
2005. Thomas H. Shipps. History of the Southern Ute Indian Reservation. p.1-7.
5. Southern Ute Indian Lands; An Overview; A seminar designed for Tribal
employees.2005. Patricia A. Hall, Esq. Tribal Sovereignty. p. 4.
6. Southern Ute Reservation and San Juan Basin General Reference Document, Red Willow
Production Co. p. 1-2.
7. Southern Ute Tribe website. Tribal Government Background. Retrieved November 14,
2011, from http://www.southern-ute.nsn.us/government.
8. Southern Ute Tribe website. Lands Division. Retrieved November 14, 2011, from
http://www.southern-ute.nsn.us/natural-resources/lands/living-in-la-plata-county.
9. U.S. Department of Commerce. National Oceanic & Atmospheric Administration.
National Environmental Satellite, Data, and Information Service. Annual Climatological
Summary (2014). Retrieved December 24, 2016 from
https://www.ncei.noaa.gov/orders/cdo/748421.pdf.
10. U.S. Environmental Protection Agency. Technology Transfer Network. Clearinghouse
for Inventories and Emissions Factors. AP-42, Vol. 1, 5th Edition, Chapters 1, 2, 5, 11
and 13. 1995. http://www.epa.gov/ttn/chief/ap42/.

Southern Ute Indian Tribe
2014 Title V Air Emissions Inventory
Page | 9
Appendix A
2014 Title V Sources Operating on the Southern Ute Indian Reservation
BP America Production Company
Dry Creek Central Delivery Point
Florida River Central Delivery Point
Four Queens Central Delivery Point
Iron Horse Central Delivery Point
Miera Central Delivery Point
Salvador I / II Central Delivery Point
Treating Site #1 Central Delivery Point
Treating Site #2 Central Delivery Point
Treating Site #4 Central Delivery Point
Treating Site #6 Central Delivery Point
Treating Site #8 Central Delivery Point
Wolf Point Central Delivery Point
ConocoPhillips
Argenta Compressor Station
Sunnyside Compressor Station
Ute Compressor Station
Elm Ridge Exploration Company
Ignacio Gas Treating Plant
El Paso Natural Gas Company. LLC
Bondad Compressor Station
Northwest Pipeline, LLC
La Plata B Compressor Station
Public Service Company of Colorado
Tiffany Compressor Station
Red Cedar Gathering Company
Animas Compressor Station
Arkansas Loop and Simpson Treating Plants
Bondad Compressor Station
Capote Compressor Station
Coyote Gulch Treating Plant
Diamondback Compressor Station
Elk Point Compressor Station
Homestead Compressor Station
La Posta Compressor Stations
Outlaw Compressor Station
Ponderosa Compressor Station
Pump Canyon Compressor Station
Sambrito Compressor Station
Spring Creek Compressor Station
Trail Canyon Compressor Station

Southern Ute Indian Tribe
2014 Title V Air Emissions Inventory
Page | 10
Red Willow Production Company
33-9 #22 Central Delivery Point
Samson Resources Company
Howard Salt Water Disposal Facility
Jaques Compressor Station
South Ignacio Central Delivery Point
Worford Ridge Compressor Station
Transit Waste, LLC
Bondad Recycling Center and Depository
Transwestern Pipeline Company
La Plata A Compressor Station
Williams Four Corners, LLC
Ignacio Gas Plant
Related Documents