The Economy is Safe, But a Wild Ride Ahead Stephen Slifer NumberNomics www.NumberNomics.com

2014 Residential Market Update Presentation. Stephen Slifer
Jul 13, 2015
Welcome message from author
This document is posted to help you gain knowledge. Please leave a comment to let me know what you think about it! Share it to your friends and learn new things together.
Transcript

The Economy is Safe,But a Wild Ride Ahead
Stephen SliferNumberNomicswww.NumberNomics.com
The Highlights
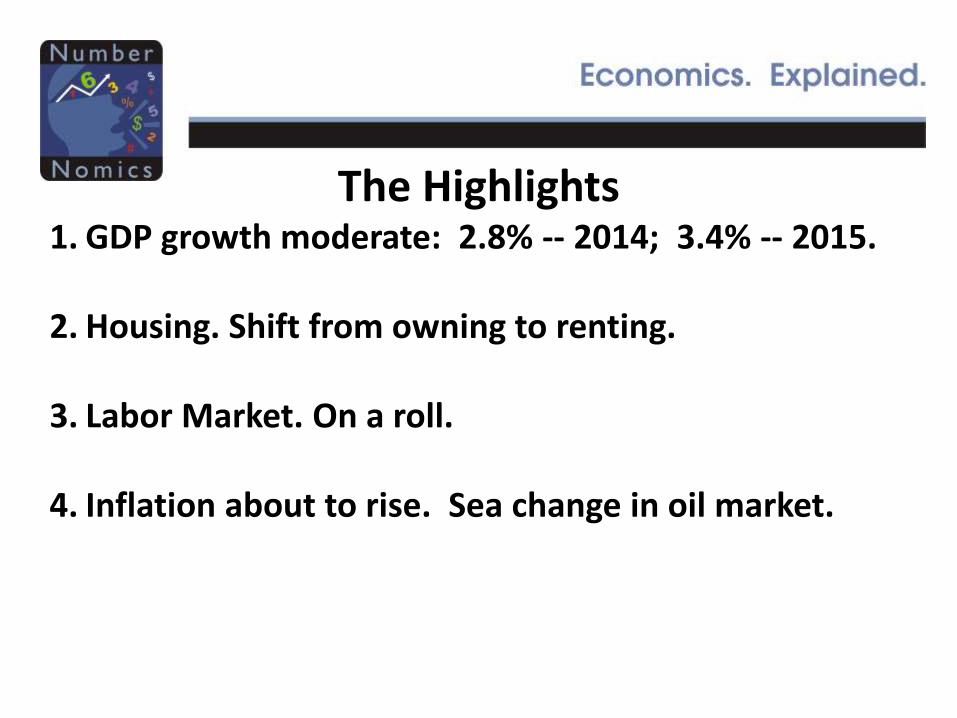
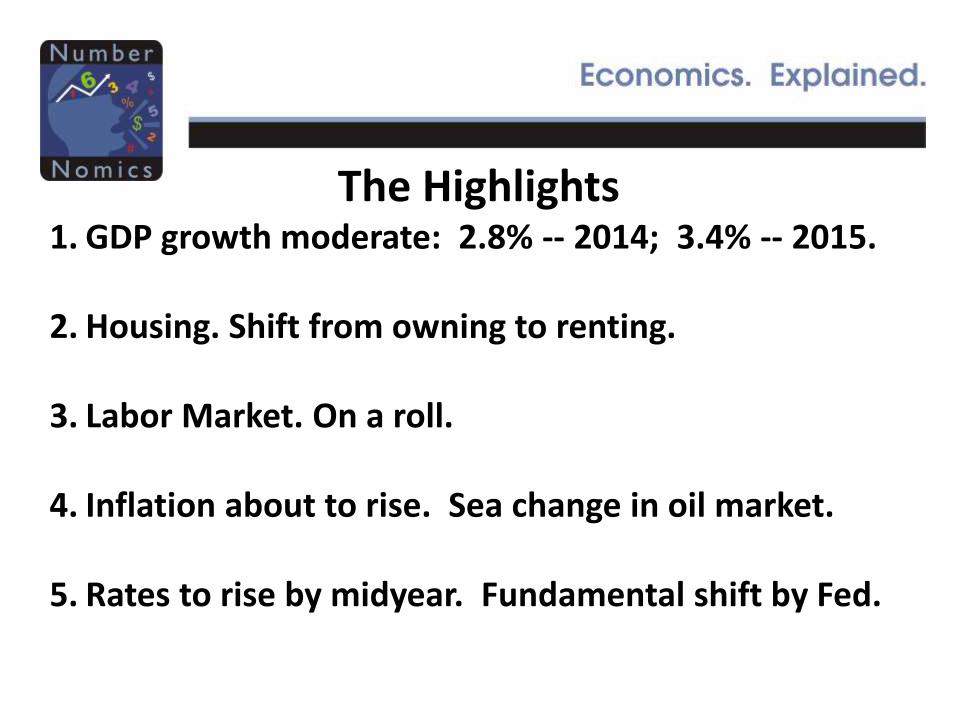
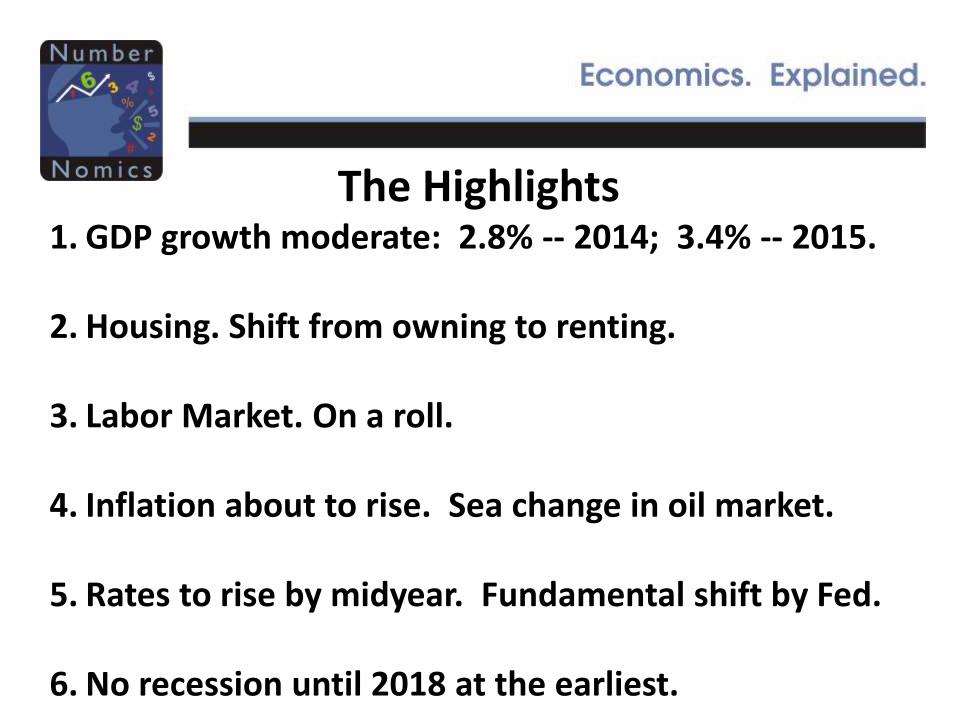
The Highlights1. GDP growth moderate: 2.8% -- 2014; 3.4% -- 2015.
The Highlights1. GDP growth moderate: 2.8% -- 2014; 3.4% -- 2015.
2. Housing. Shift from owning to renting.
The Highlights1. GDP growth moderate: 2.8% -- 2014; 3.4% -- 2015.
2. Housing. Shift from owning to renting.
3. Labor Market. On a roll.
The Highlights1. GDP growth moderate: 2.8% -- 2014; 3.4% -- 2015.
2. Housing. Shift from owning to renting.
3. Labor Market. On a roll.
4. Inflation about to rise. Sea change in oil market.
The Highlights1. GDP growth moderate: 2.8% -- 2014; 3.4% -- 2015.
2. Housing. Shift from owning to renting.
3. Labor Market. On a roll.
4. Inflation about to rise. Sea change in oil market.
5. Rates to rise by midyear. Fundamental shift by Fed.
The Highlights1. GDP growth moderate: 2.8% -- 2014; 3.4% -- 2015.
2. Housing. Shift from owning to renting.
3. Labor Market. On a roll.
4. Inflation about to rise. Sea change in oil market.
5. Rates to rise by midyear. Fundamental shift by Fed.
6. No recession until 2018 at the earliest.

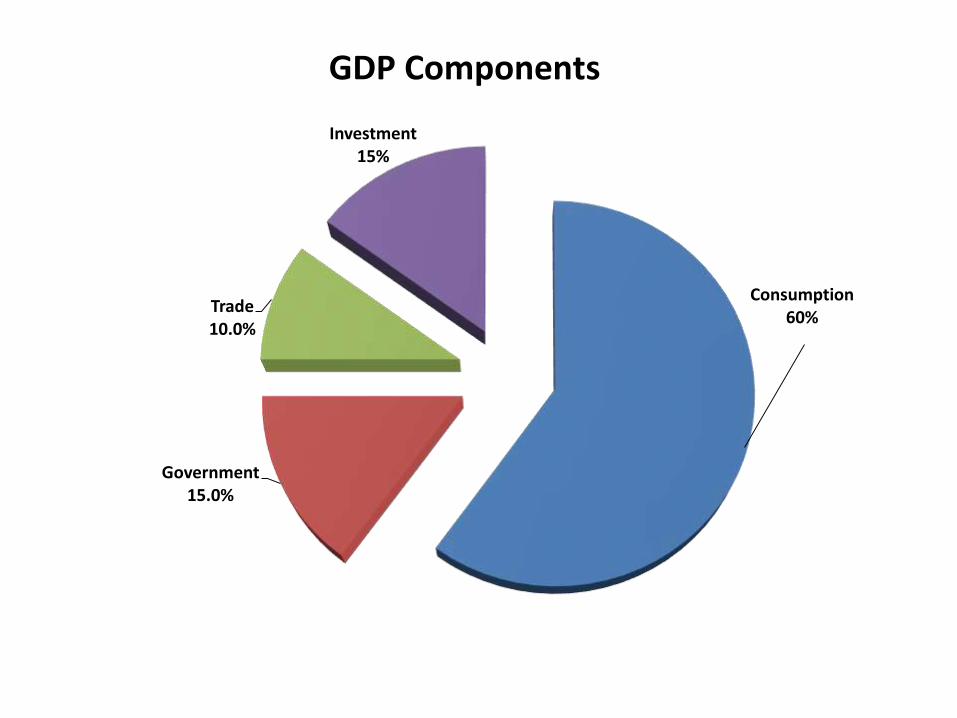
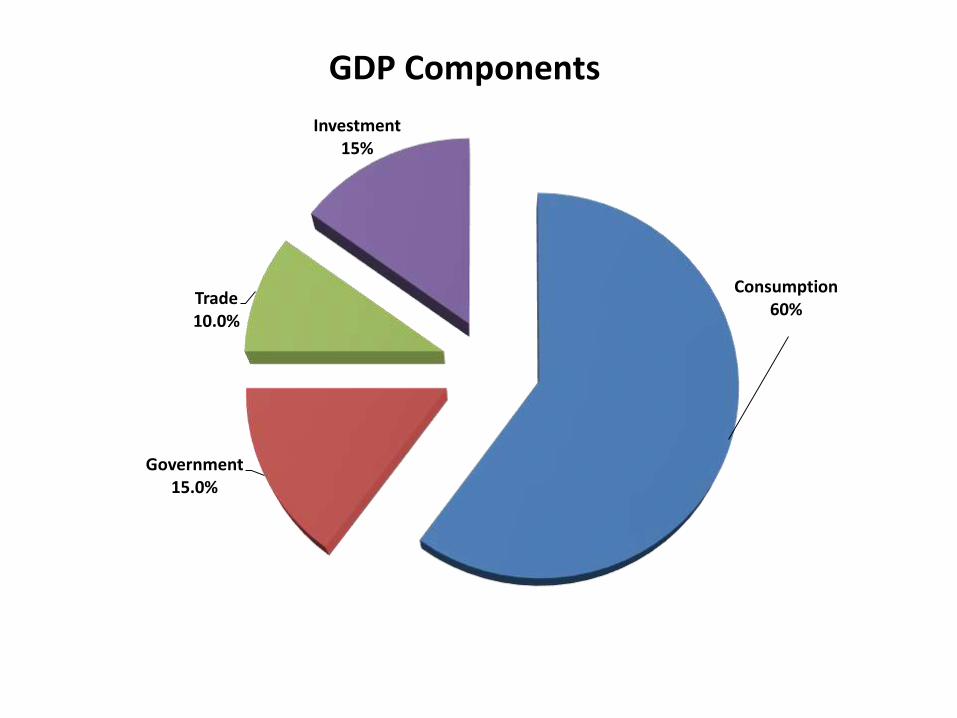
Consumption60%
Government15.0%
Trade10.0%
Investment15%
GDP Components
50.0
55.0
60.0
65.0
70.0
75.0
80.0
85.0
90.0
95.0
100.0
Jan
20
07
Ap
r 2
00
7
Jul 2
00
7
Oct
20
07
Jan
20
08
Ap
r 2
00
8
Jul 2
00
8
Oct
20
08
Jan
20
09
Ap
r 2
00
9
Jul 2
00
9
Oct
20
09
Jan
20
10
Ap
r 2
01
0
Jul 2
01
0
Oct
20
10
Jan
20
11
Ap
r 2
01
1
Jul 2
01
1
Oct
20
11
Jan
20
12
Ap
r 2
01
2
Jul 2
01
2
Oct
20
12
Jan
20
13
Ap
r 2
01
3
Jul 2
01
3
Oct
20
13
Jan
20
14
Ap
r 2
01
4
Jul 2
01
4
Oct
20
14
Jan
20
15
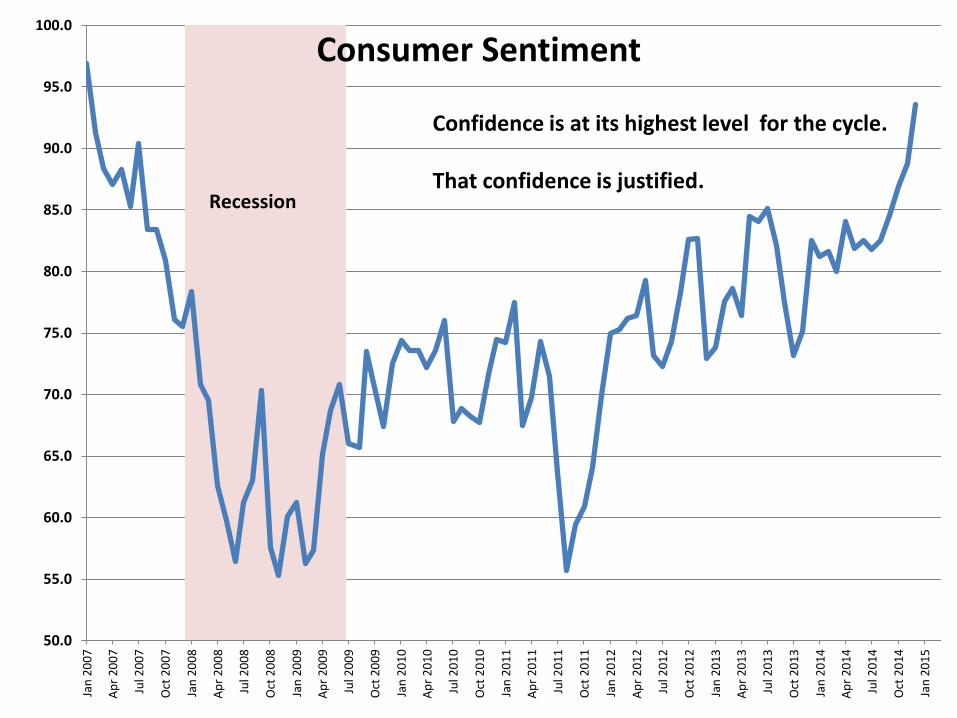
Consumer Sentiment
Recession
Confidence is at its highest level for the cycle.
That confidence is justified.
$40.0
$45.0
$50.0
$55.0
$60.0
$65.0
$70.0
$75.0
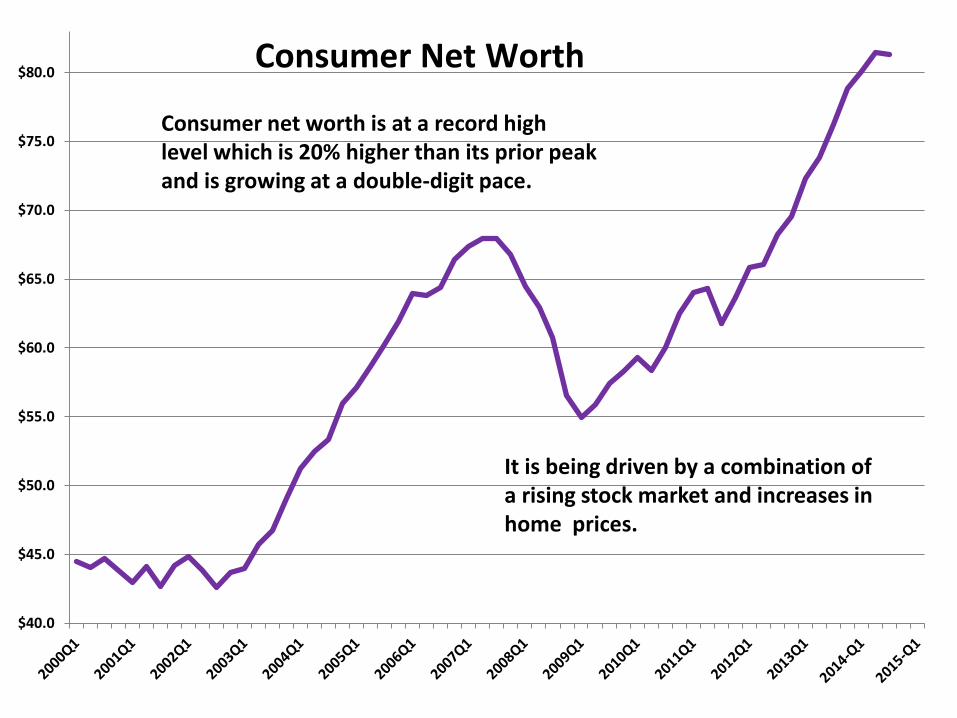
$80.0Consumer Net Worth
Consumer net worth is at a record highlevel which is 20% higher than its prior peakand is growing at a double-digit pace.
It is being driven by a combination ofa rising stock market and increases in home prices.
600
800
1000
1200
1400
1600
1800
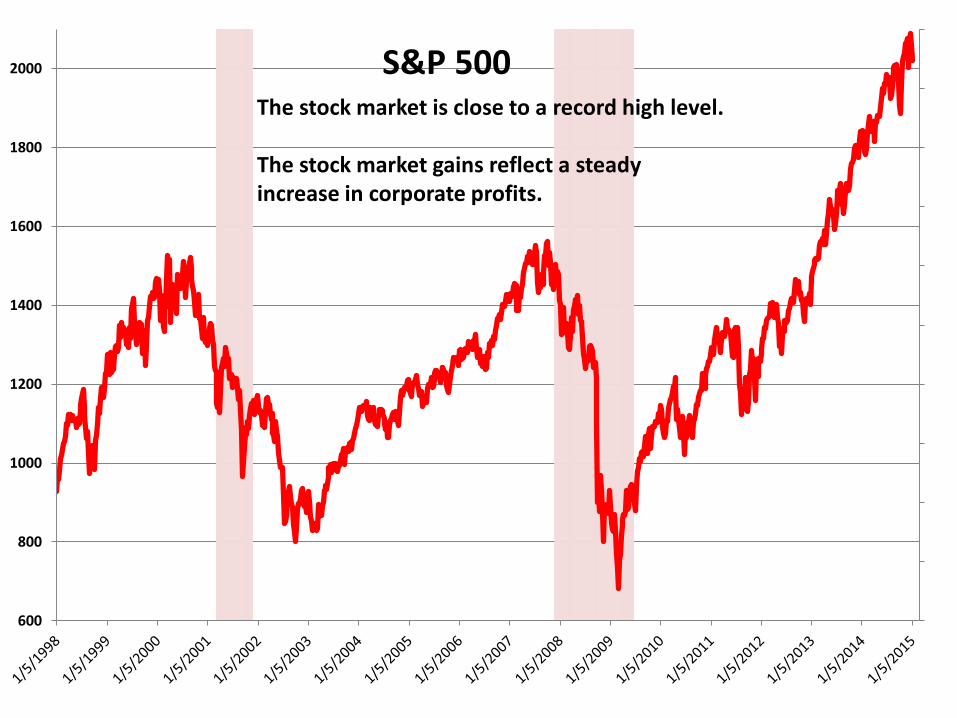
2000 S&P 500The stock market is close to a record high level.
The stock market gains reflect a steadyincrease in corporate profits.
10
30
50
70
90
110
130
Jan2000
Jan2001
Jan2002
Jan2003
Jan2004
Jan2005
Jan2006
Jan2007
Jan2008
Jan2009
Jan2010
Jan2011
Jan2012
Jan2013
Jan2014
Jan2015
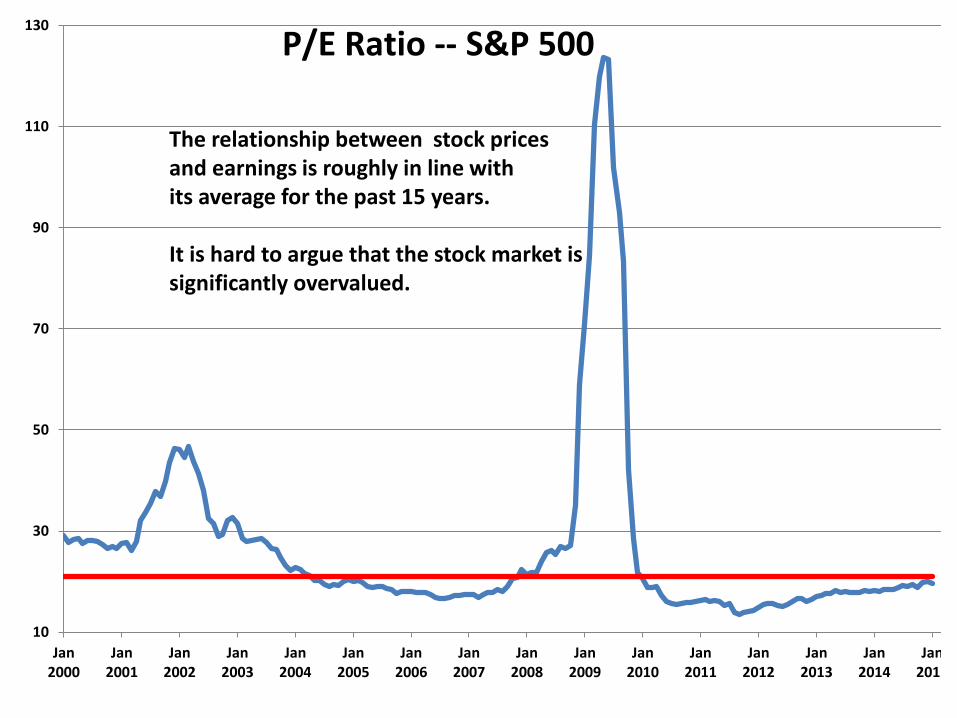
P/E Ratio -- S&P 500
The relationship between stock pricesand earnings is roughly in line withits average for the past 15 years.
It is hard to argue that the stock market issignificantly overvalued.
-20.0%
-15.0%
-10.0%
-5.0%
0.0%
5.0%
10.0%
-2.7%
-1.7%
-0.7%
0.3%
1.3%
2.3%
Home Prices
Year-Over-Year (R)
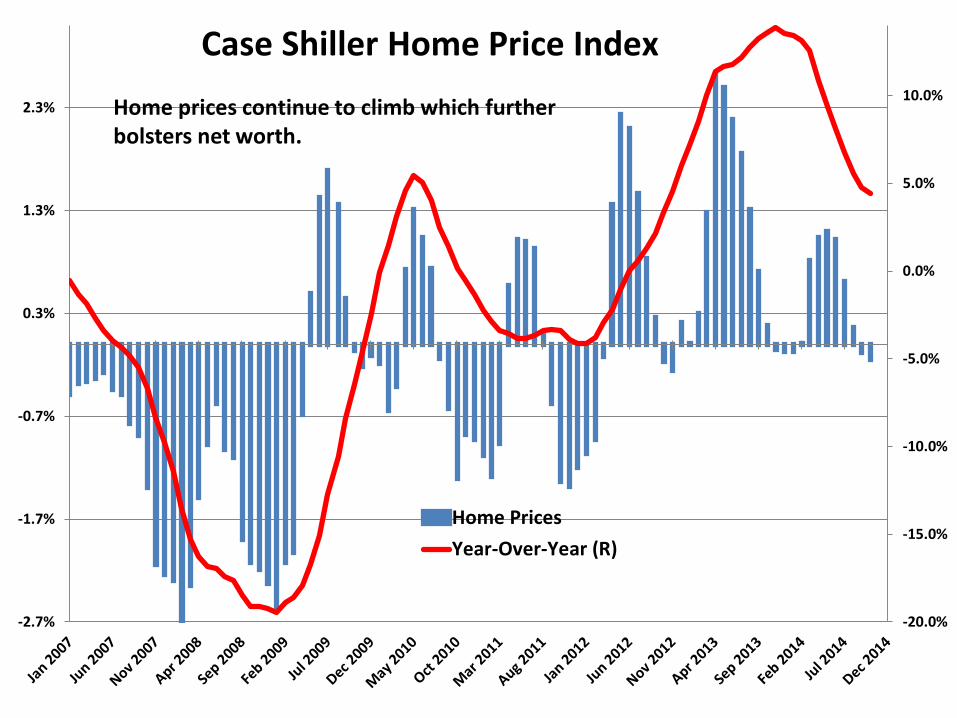
Case Shiller Home Price Index
Home prices continue to climb which furtherbolsters net worth.
14.5
15.0
15.5
16.0
16.5
17.0
17.5
18.0
18.5
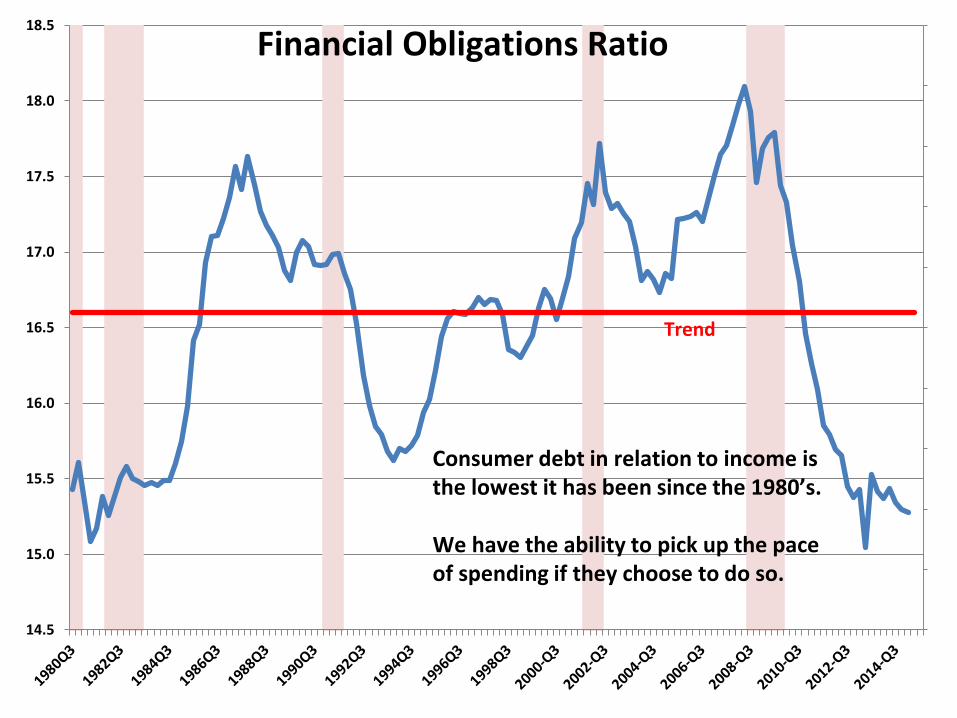
Financial Obligations Ratio
Trend
Consumer debt in relation to income isthe lowest it has been since the 1980’s.
We have the ability to pick up the paceof spending if they choose to do so.
2.9
3.9
4.9
5.9
6.9
7.9
8.9
9.9
10.9
Jan
-90
Oct
-90
Jul-
91
Ap
r-9
2
Jan
-93
Oct
-93
Jul-
94
Ap
r-9
5
Jan
-96
Oct
-96
Jul-
97
Ap
r-9
8
Jan
-99
Oct
-99
Jul-
00
Ap
r-0
1
Jan
-02
Oct
-02
Jul-
03
Ap
r-0
4
Jan
-05
Oct
-05
Jul-
06
Ap
r-0
7
Jan
-08
Oct
-08
Jul-
09
Ap
r-1
0
Jan
-11
Oct
-11
Jul-
12
Ap
r-1
3
Jan
-14
Oct
-14
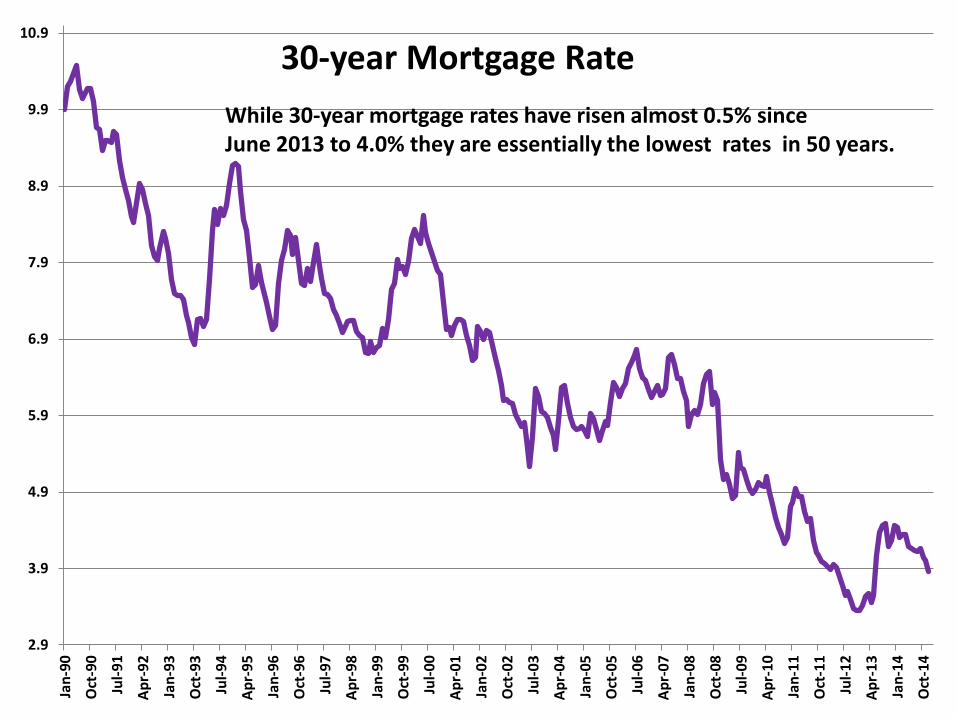
30-year Mortgage Rate
While 30-year mortgage rates have risen almost 0.5% sinceJune 2013 to 4.0% they are essentially the lowest rates in 50 years.
-900
-700
-500
-300
-100
100
300
500
Jan
-05
Ap
r-0
5
Jul-
05
Oct
-05
Jan
-06
Ap
r-0
6
Jul-
06
Oct
-06
Jan
-07
Ap
r-0
7
Jul-
07
Oct
-07
Jan
-08
Ap
r-0
8
Jul-
08
Oct
-08
Jan
-09
Ap
r-0
9
Jul-
09
Oct
-09
Jan
-10
Ap
r-1
0
Jul-
10
Oct
-10
Jan
-11
Ap
r-1
1
Jul-
11
Oct
-11
Jan
-12
Ap
r-1
2
Jul-
12
Oct
-12
Jan
-13
Ap
r-1
3
Jul-
13
Oct
-13
Jan
-14
Ap
r-1
4
Jul-
14
Oct
-14
Jan
-15
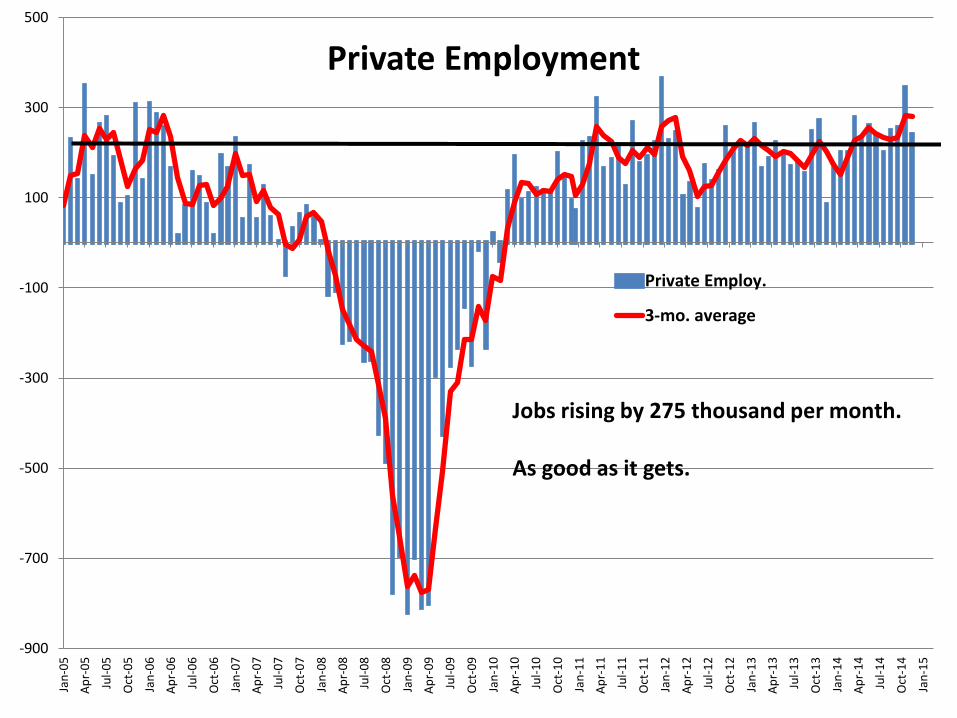
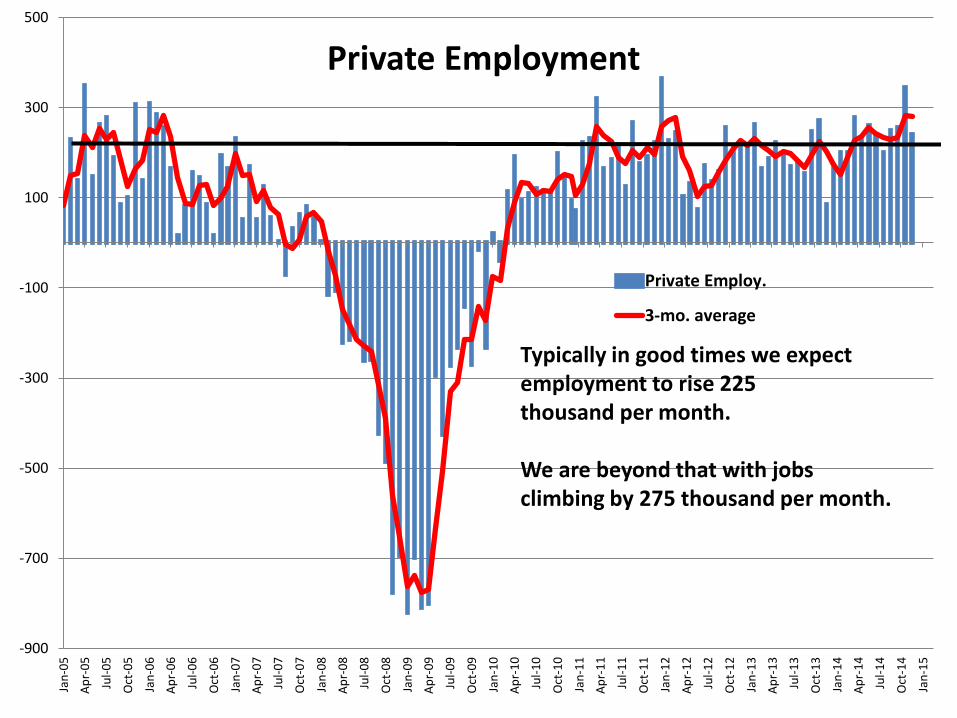
Private Employment
Private Employ.
3-mo. average
Jobs rising by 275 thousand per month.
As good as it gets.
3.0
4.0
5.0
6.0
7.0
8.0
9.0
10.0
11.0
Jan-99 Jan-00 Jan-01 Jan-02 Jan-03 Jan-04 Jan-05 Jan-06 Jan-07 Jan-08 Jan-09 Jan-10 Jan-11 Jan-12 Jan-13 Jan-14 Jan-15
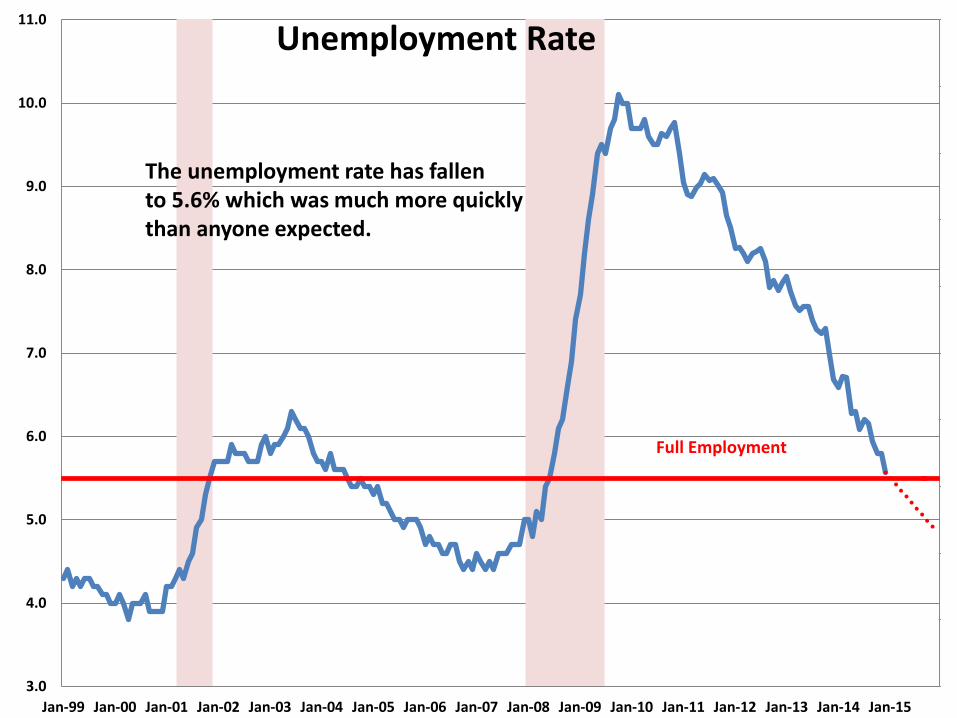
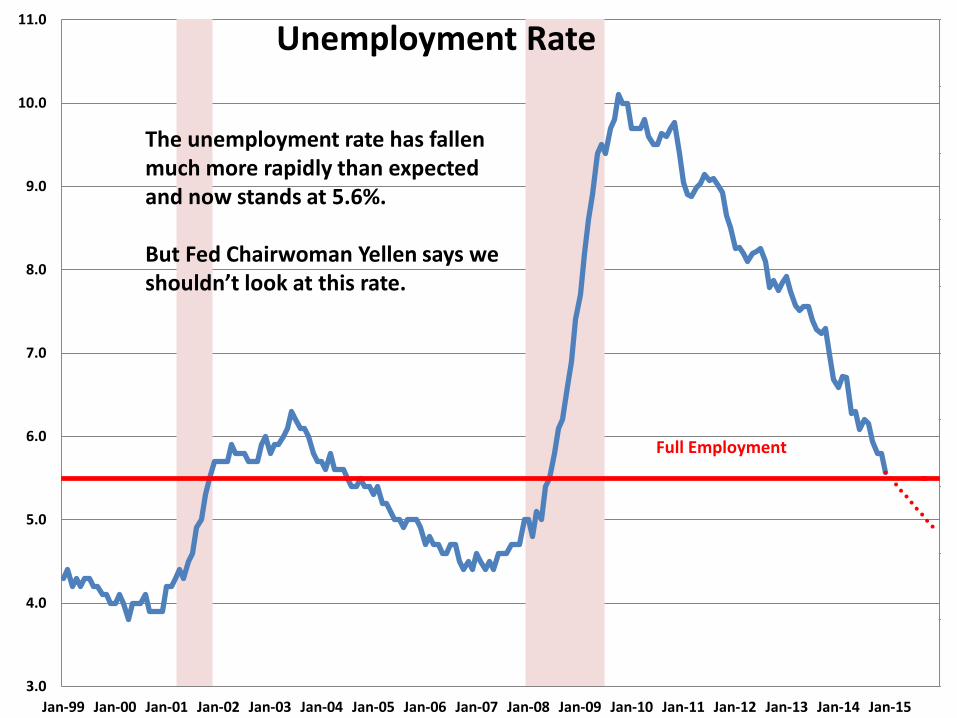
Unemployment Rate
Full Employment
The unemployment rate has fallento 5.6% which was much more quicklythan anyone expected.
$2.00
$2.50
$3.00
$3.50
$4.00
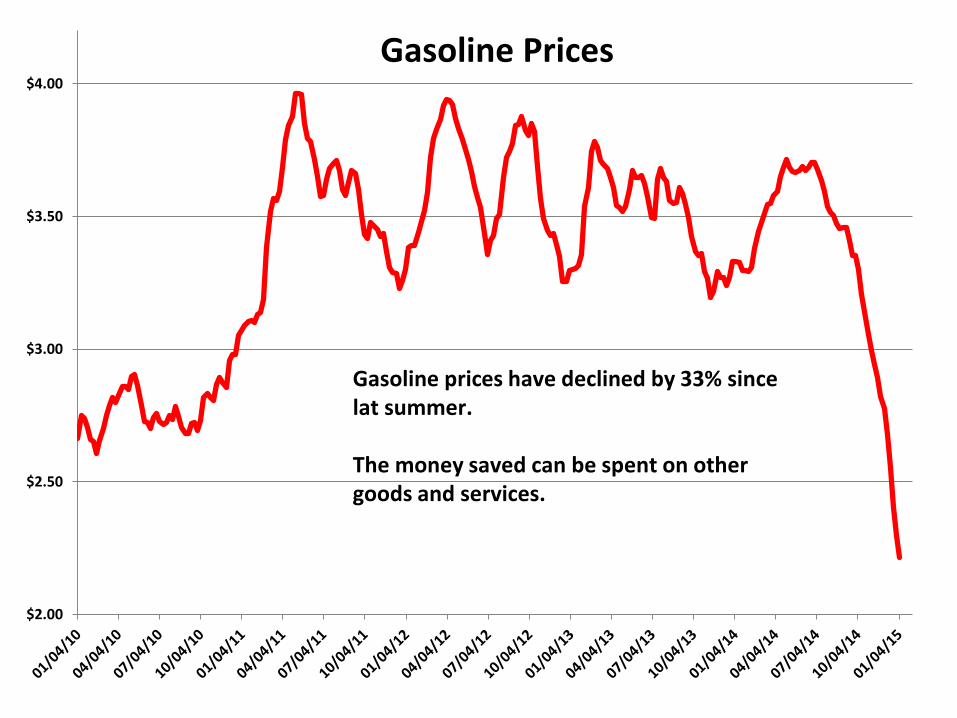
Gasoline Prices
Gasoline prices have declined by 33% sincelat summer.
The money saved can be spent on othergoods and services.
1. Stock market climb boosts confidence.
2. Net worth is at a record high level.
3. Debt burden is quite comfortable.
4. Jobs growth is robust.
5. Unemployment rate low.
6. Gas prices have fallen dramatically.

-6.0%
-4.0%
-2.0%
0.0%
2.0%
4.0%
Consumption spending
Year-over-Year
Consumption Spending (%)
For all of these reasons we expect consumerspending to pick up to 3.0% in 2015.
What is the Outlook for Housing?
500
700
900
1100
1300
1500
1700
1900
Jan 2006 Jan 2007 Jan 2008 Jan 2009 Jan 2010 Jan 2011 Jan 2012 Jan 2013 Jan 2014 Jan 2015
Housing Starts
Trend
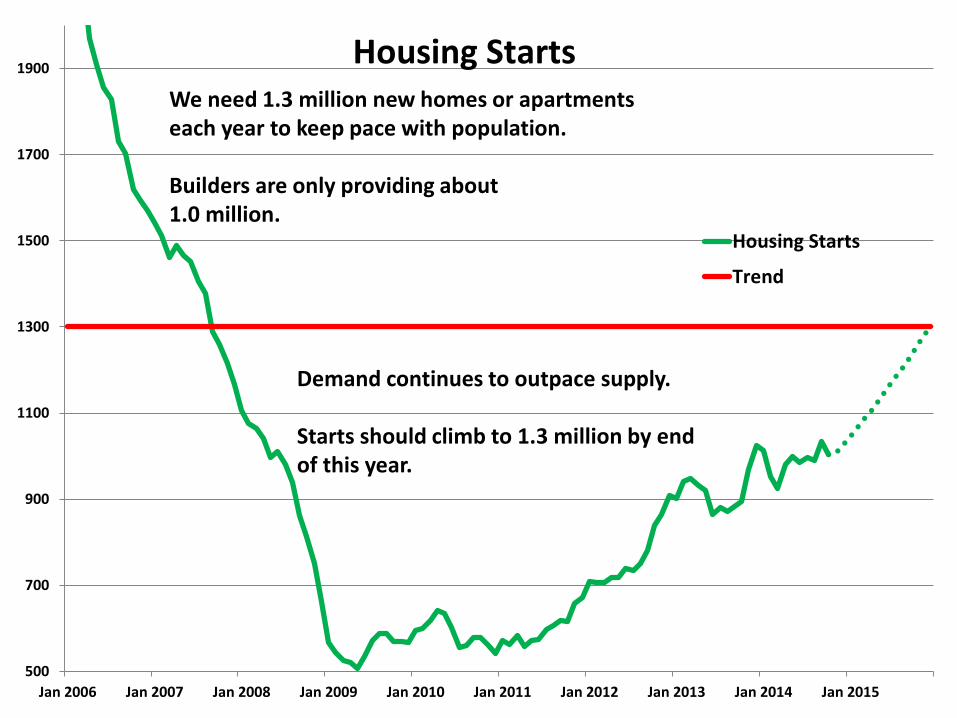
Housing StartsWe need 1.3 million new homes or apartmentseach year to keep pace with population.
Builders are only providing about1.0 million.
Demand continues to outpace supply.
Starts should climb to 1.3 million by endof this year.
4.0
5.0
6.0
7.0
8.0
9.0
10.0
11.0
12.0
13.0
Jan
20
09
Mar
20
09
May
20
09
Jul 2
00
9
Sep
20
09
No
v 2
00
9
Jan
20
10
Mar
20
10
May
20
10
Jul 2
01
0
Sep
20
10
No
v 2
01
0
Jan
20
11
Mar
20
11
May
20
11
Jul 2
01
1
Sep
20
11
No
v 2
01
1
Jan
20
12
Mar
20
12
May
20
12
Jul 2
01
2
Sep
20
12
No
v 2
01
2
Jan
20
13
Mar
20
13
May
20
13
Jul 2
01
3
Sep
20
13
No
v 2
01
3
Jan
20
14
Mar
20
14
May
20
14
Jul 2
01
4
Sep
20
14
No
v 2
01
4
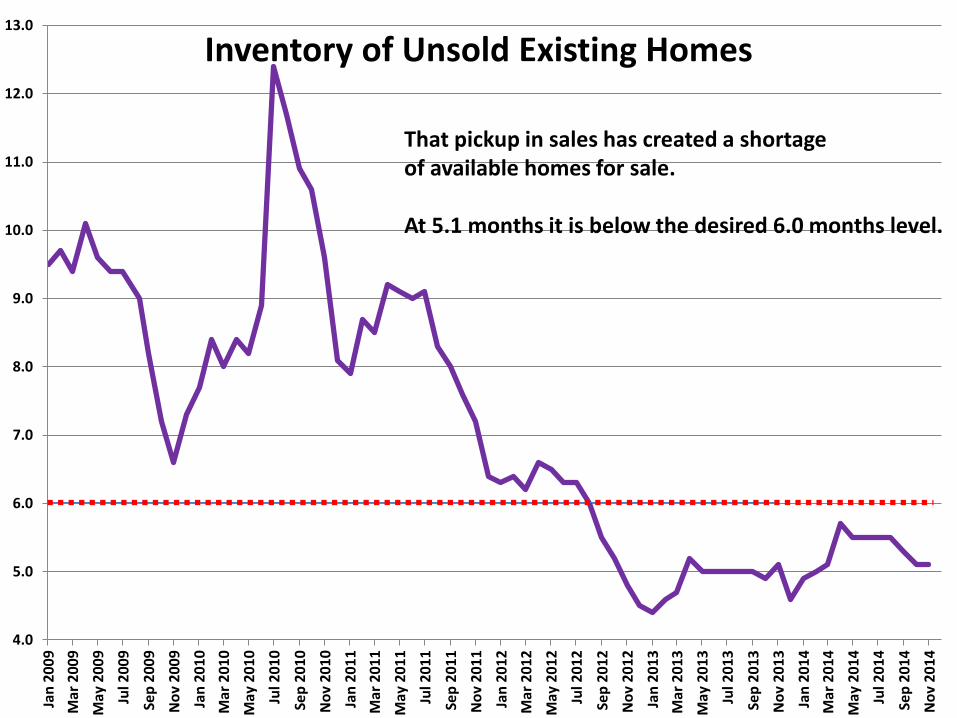
Inventory of Unsold Existing Homes
That pickup in sales has created a shortageof available homes for sale.
At 5.1 months it is below the desired 6.0 months level.
63.0
64.0
65.0
66.0
67.0
68.0
69.0
70.0
1980:Q1 1985:Q1 1990:Q1 1995:Q1 2000:Q1 2005:Q1 2010:Q1
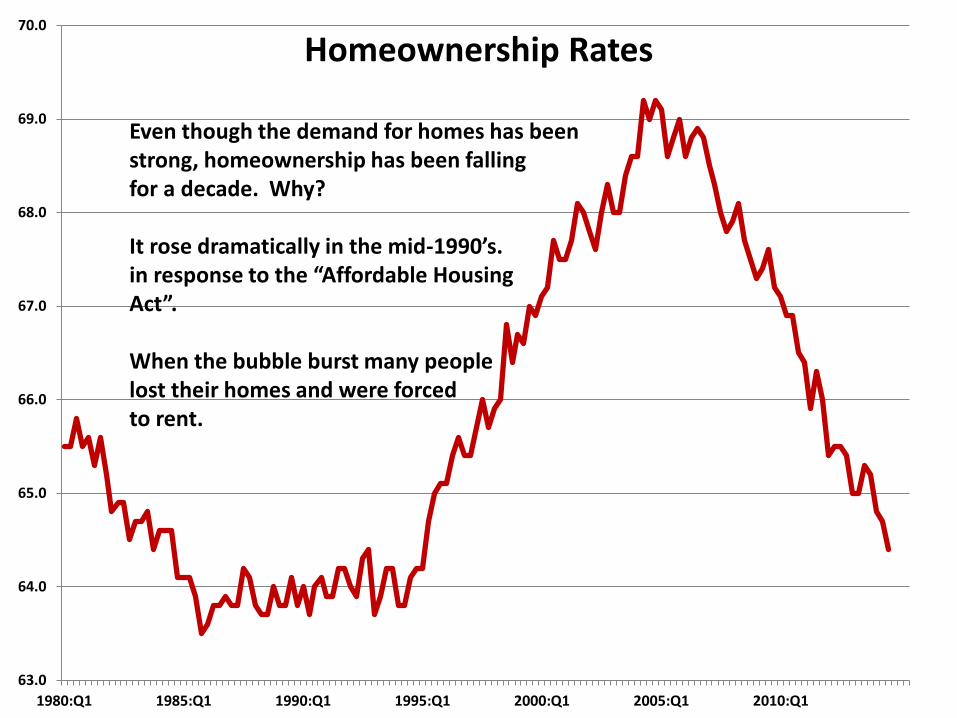
Homeownership Rates
Even though the demand for homes has beenstrong, homeownership has been fallingfor a decade. Why?
It rose dramatically in the mid-1990’s.in response to the “Affordable HousingAct”.
When the bubble burst many peoplelost their homes and were forcedto rent.
$20,000
$70,000
$120,000
$170,000
$220,000
$270,000
Jan 1970 Jan 1975 Jan 1980 Jan 1985 Jan 1990 Jan 1995 Jan 2000 Jan 2005 Jan 2010
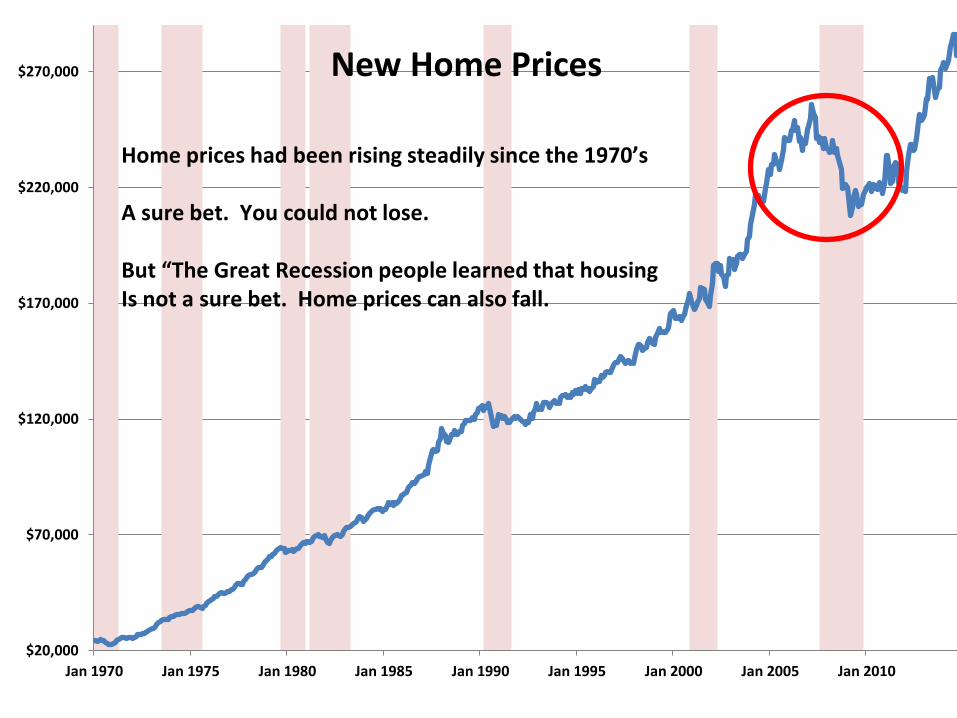
New Home Prices
Home prices had been rising steadily since the 1970’s
A sure bet. You could not lose.
But “The Great Recession people learned that housingIs not a sure bet. Home prices can also fall.
-11.0
-9.0
-7.0
-5.0
-3.0
-1.0
U.S Under 35 35-44 45-54 55-64 65+
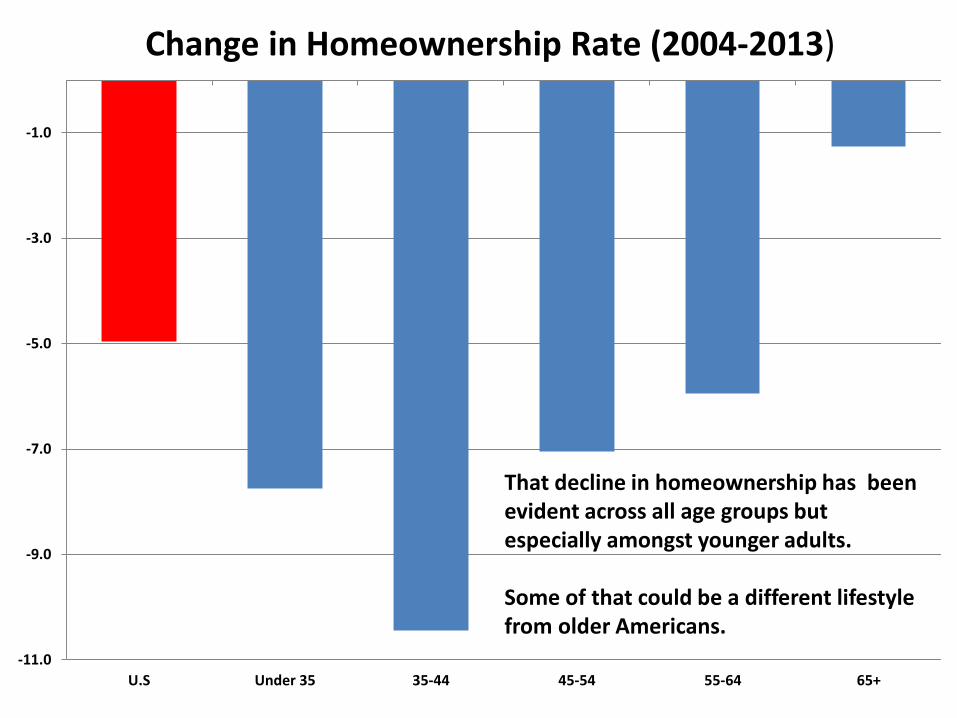
Change in Homeownership Rate (2004-2013)
That decline in homeownership has beenevident across all age groups butespecially amongst younger adults.
Some of that could be a different lifestylefrom older Americans.
600
650
700
750
800
850
900
Au
g 2
009
Oct
20
09
Dec
20
09
Feb
20
10
Ap
r 2
010
Jun
20
10
Au
g 2
010
Oct
20
10
Dec
20
10
Feb
20
11
Ap
r 2
011
Jun
20
11
Au
g 2
011
Oct
20
11
Dec
20
11
Feb
20
12
Ap
r 2
012
Jun
20
12
Au
g 2
012
Oct
20
12
Dec
20
12
Feb
20
13
Ap
r 2
013
Jun
20
13
Au
g 2
013
Oct
20
13
Dec
20
13
Feb
20
14
Ap
r 2
014
Jun
20
14
Au
g 2
014
Oct
20
14
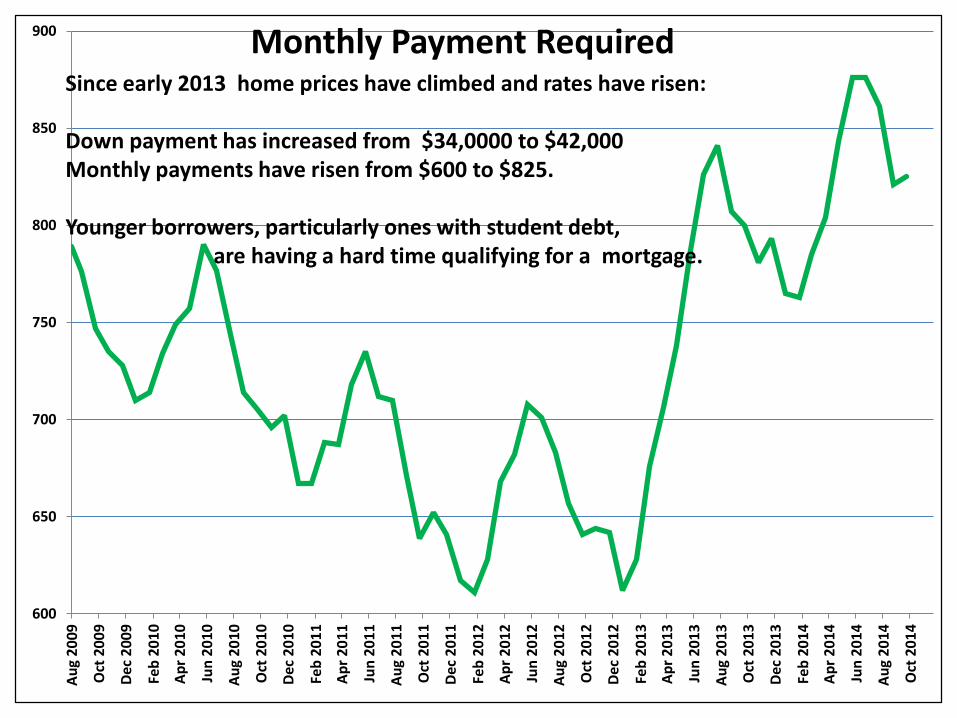
Monthly Payment RequiredSince early 2013 home prices have climbed and rates have risen:
Down payment has increased from $34,0000 to $42,000Monthly payments have risen from $600 to $825.
Younger borrowers, particularly ones with student debt,are having a hard time qualifying for a mortgage.
4.5
5.5
6.5
7.5
8.5
9.5
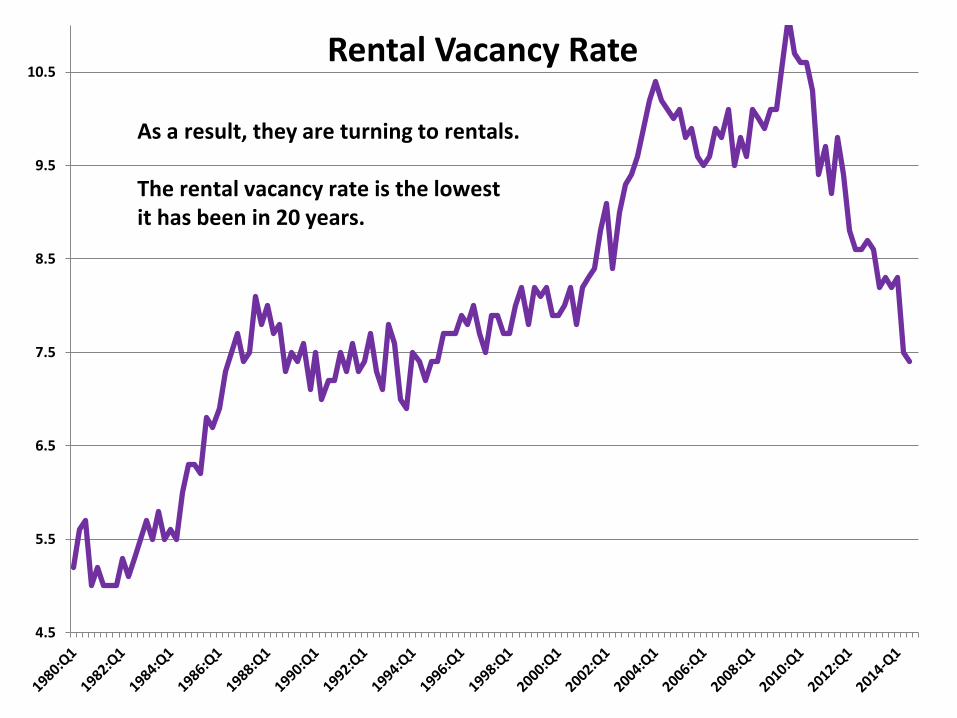
10.5Rental Vacancy Rate
As a result, they are turning to rentals.
The rental vacancy rate is the lowestit has been in 20 years.

525
725
925
1125
1325
1525
1725
1925
Jan 2006 Jan 2007 Jan 2008 Jan 2009 Jan 2010 Jan 2011 Jan 2012 Jan 2013 Jan 2014 Jan 2015
Housing Starts
Trend
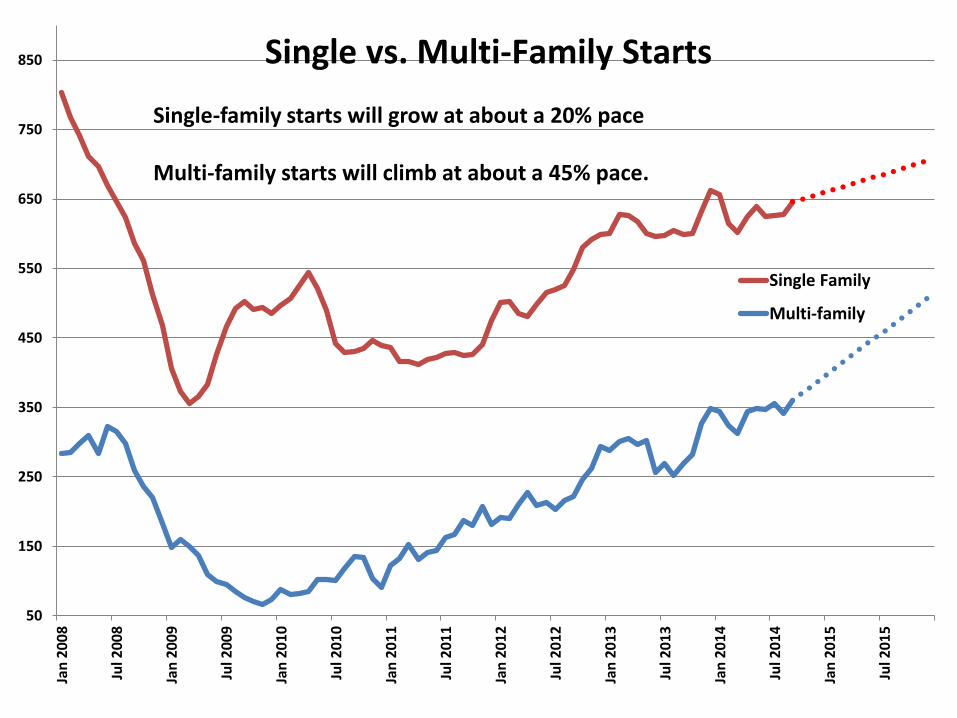
Housing Starts
Starts should climb to 1.3 million by endof next year.
But multi-family starts will climb farmore rapidly than single-family.
50
150
250
350
450
550
650
750
850Ja
n 2
00
8
Jul 2
00
8
Jan
20
09
Jul 2
00
9
Jan
20
10
Jul 2
01
0
Jan
20
11
Jul 2
01
1
Jan
20
12
Jul 2
01
2
Jan
20
13
Jul 2
01
3
Jan
20
14
Jul 2
01
4
Jan
20
15
Jul 2
01
5
Single Family
Multi-family
Single vs. Multi-Family Starts
Single-family starts will grow at about a 20% pace
Multi-family starts will climb at about a 45% pace.
Let’s Talk Jobs
-900
-700
-500
-300
-100
100
300
500
Jan
-05
Ap
r-0
5
Jul-
05
Oct
-05
Jan
-06
Ap
r-0
6
Jul-
06
Oct
-06
Jan
-07
Ap
r-0
7
Jul-
07
Oct
-07
Jan
-08
Ap
r-0
8
Jul-
08
Oct
-08
Jan
-09
Ap
r-0
9
Jul-
09
Oct
-09
Jan
-10
Ap
r-1
0
Jul-
10
Oct
-10
Jan
-11
Ap
r-1
1
Jul-
11
Oct
-11
Jan
-12
Ap
r-1
2
Jul-
12
Oct
-12
Jan
-13
Ap
r-1
3
Jul-
13
Oct
-13
Jan
-14
Ap
r-1
4
Jul-
14
Oct
-14
Jan
-15
Private Employment
Private Employ.
3-mo. average
Typically in good times we expectemployment to rise 225thousand per month.
We are beyond that with jobs climbing by 275 thousand per month.
3.0
4.0
5.0
6.0
7.0
8.0
9.0
10.0
11.0
Jan-99 Jan-00 Jan-01 Jan-02 Jan-03 Jan-04 Jan-05 Jan-06 Jan-07 Jan-08 Jan-09 Jan-10 Jan-11 Jan-12 Jan-13 Jan-14 Jan-15
Unemployment Rate
Full Employment
The unemployment rate has fallenmuch more rapidly than expectedand now stands at 5.6%.
But Fed Chairwoman Yellen says weshouldn’t look at this rate.
60.0
61.0
62.0
63.0
64.0
65.0
66.0
67.0
68.0
Jan 1970 Jan 1973 Jan 1976 Jan 1979 Jan 1982 Jan 1985Jan 1988 Jan 1991 Jan 1994 Jan 1997 Jan 2000 Jan 2003 Jan 2006 Jan 2009 Jan 2012 Jan 2015
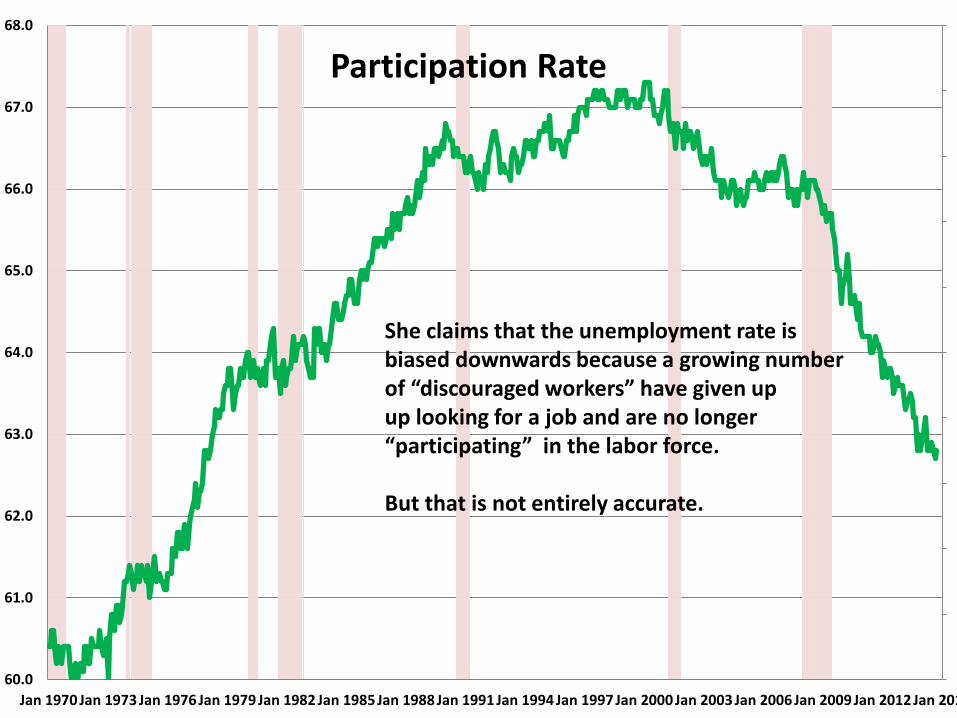
Participation Rate
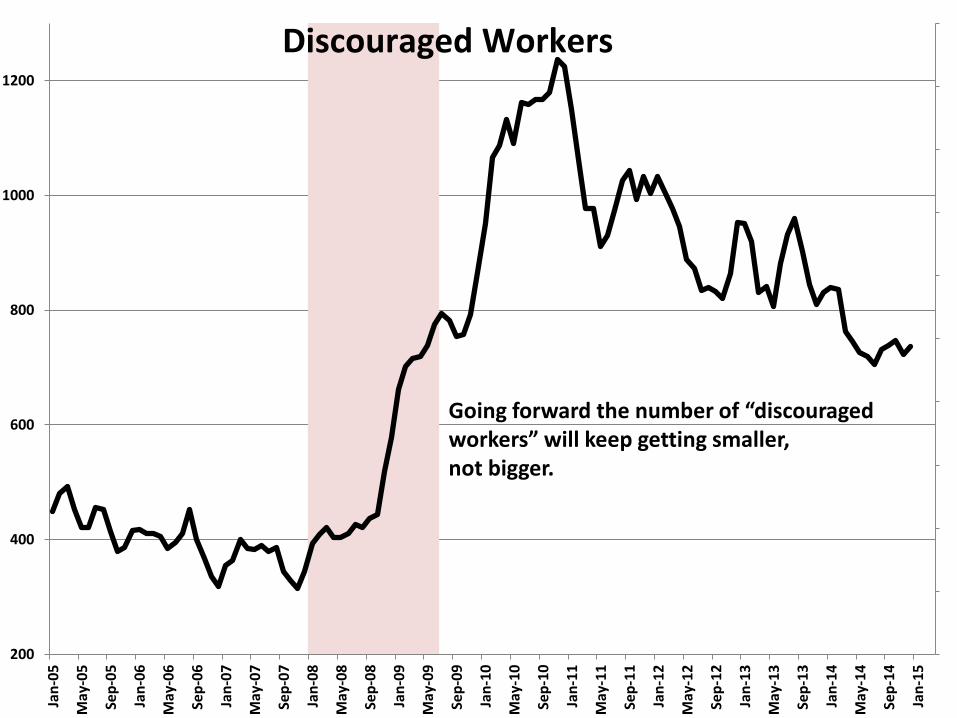
She claims that the unemployment rate isbiased downwards because a growing numberof “discouraged workers” have given upup looking for a job and are no longer“participating” in the labor force.
But that is not entirely accurate.
200
400
600
800
1000
1200
Jan
-05
May
-05
Sep
-05
Jan
-06
May
-06
Sep
-06
Jan
-07
May
-07
Sep
-07
Jan
-08
May
-08
Sep
-08
Jan
-09
May
-09
Sep
-09
Jan
-10
May
-10
Sep
-10
Jan
-11
May
-11
Sep
-11
Jan
-12
May
-12
Sep
-12
Jan
-13
May
-13
Sep
-13
Jan
-14
May
-14
Sep
-14
Jan
-15
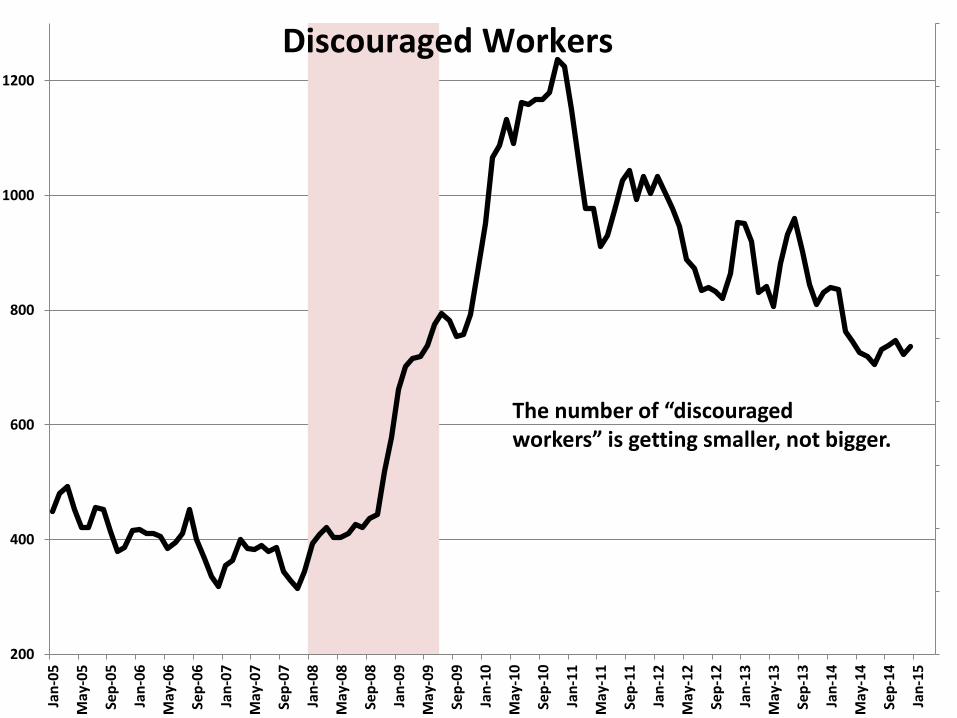
Discouraged Workers
The number of “discouragedworkers” is getting smaller, not bigger.
60.0
61.0
62.0
63.0
64.0
65.0
66.0
67.0
68.0
Jan 1970 Jan 1973 Jan 1976 Jan 1979 Jan 1982 Jan 1985Jan 1988 Jan 1991 Jan 1994 Jan 1997 Jan 2000 Jan 2003 Jan 2006 Jan 2009 Jan 2012 Jan 2015
Participation Rate
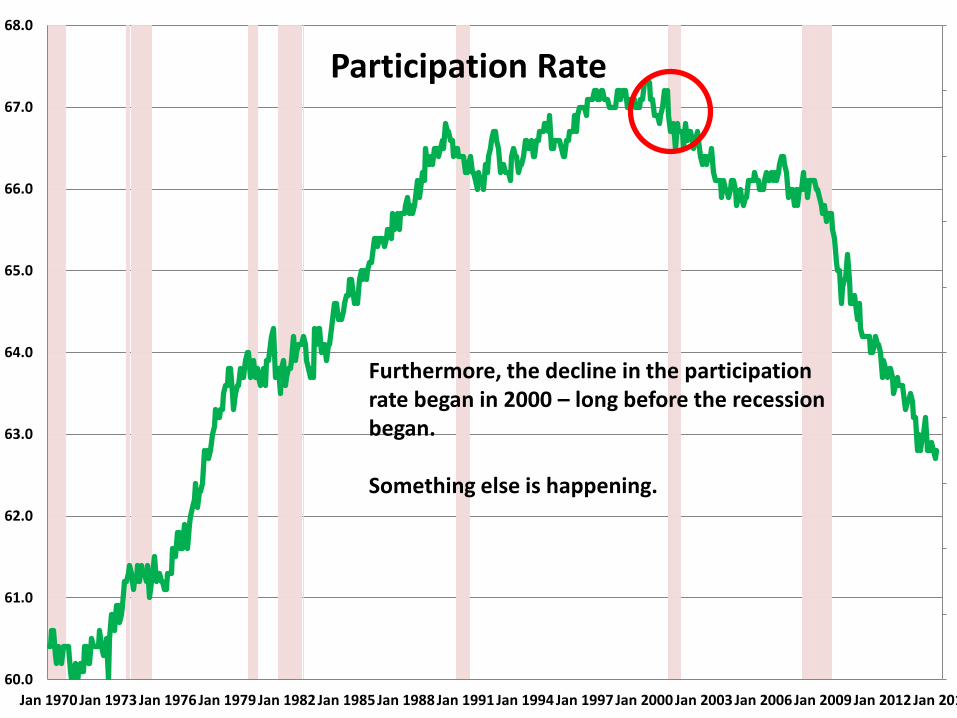
Furthermore, the decline in the participationrate began in 2000 – long before the recessionbegan.
Something else is happening.
60.0
61.0
62.0
63.0
64.0
65.0
66.0
67.0
68.0
Jan 1970 Jan 1973 Jan 1976 Jan 1979 Jan 1982 Jan 1985Jan 1988 Jan 1991 Jan 1994 Jan 1997 Jan 2000 Jan 2003 Jan 2006 Jan 2009 Jan 2012 Jan 2015
Participation Rate
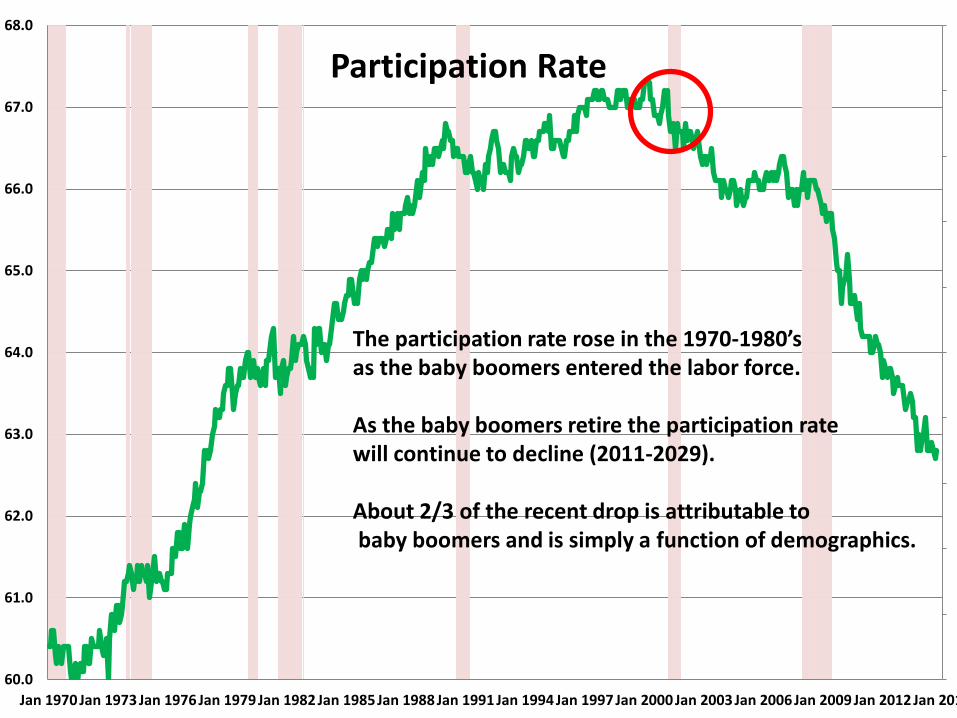
The participation rate rose in the 1970-1980’sas the baby boomers entered the labor force.
As the baby boomers retire the participation ratewill continue to decline (2011-2029).
About 2/3 of the recent drop is attributable tobaby boomers and is simply a function of demographics.
3.0
5.0
7.0
9.0
11.0
13.0
15.0
17.0
Jan-99 Jan-00 Jan-01 Jan-02 Jan-03 Jan-04 Jan-05 Jan-06 Jan-07 Jan-08 Jan-09 Jan-10 Jan-11 Jan-12 Jan-13 Jan-14 Jan-15
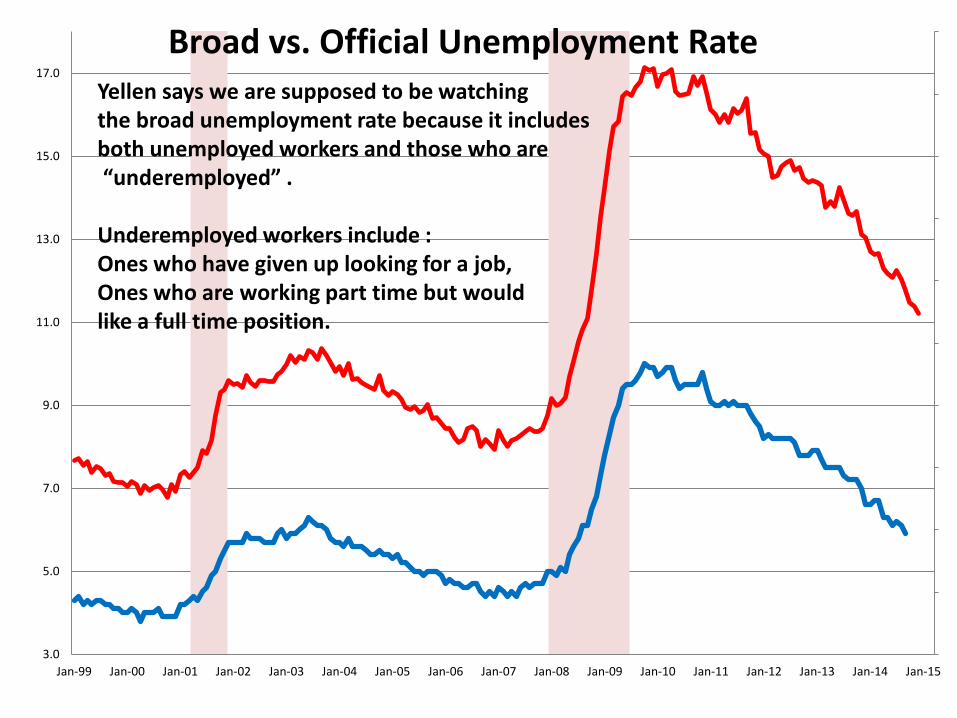
Broad vs. Official Unemployment RateYellen says we are supposed to be watchingthe broad unemployment rate because it includesboth unemployed workers and those who are“underemployed” .
Underemployed workers include :Ones who have given up looking for a job,Ones who are working part time but wouldlike a full time position.
3.0
5.0
7.0
9.0
11.0
13.0
15.0
17.0
Jan-99 Jan-00 Jan-01 Jan-02 Jan-03 Jan-04 Jan-05 Jan-06 Jan-07 Jan-08 Jan-09 Jan-10 Jan-11 Jan-12 Jan-13 Jan-14 Jan-15
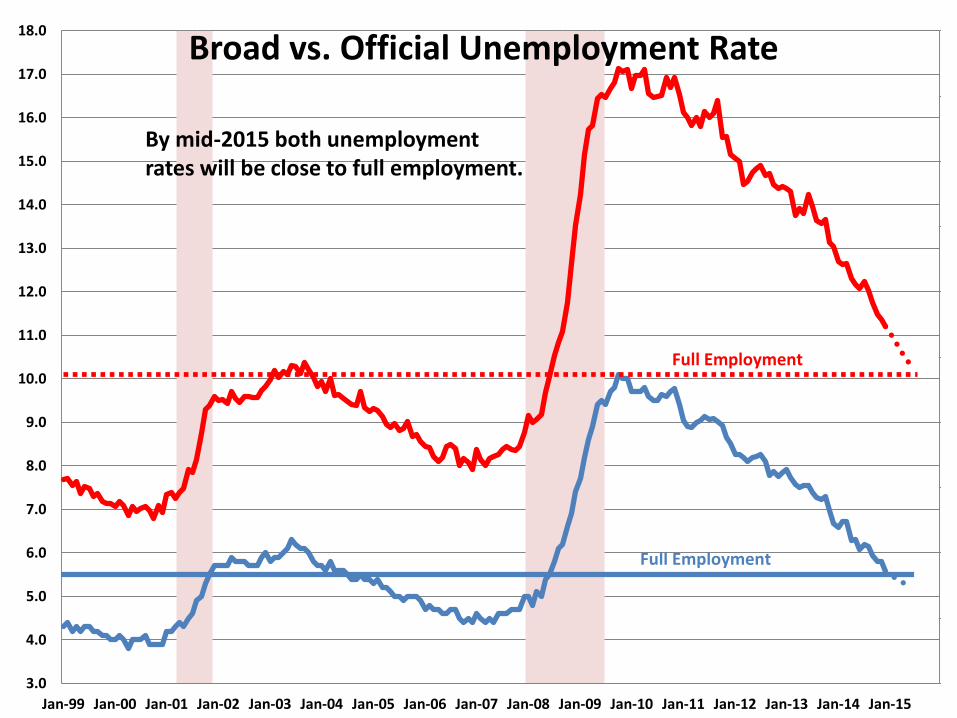
Broad vs. Official Unemployment Rate
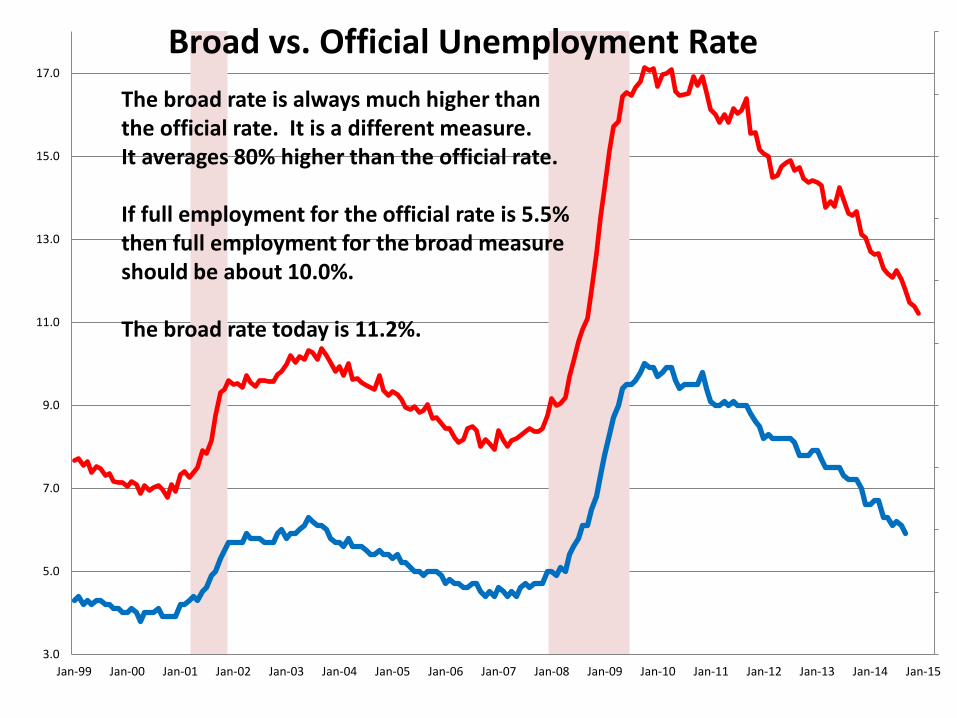
The broad rate is always much higher thanthe official rate. It is a different measure.It averages 80% higher than the official rate.
If full employment for the official rate is 5.5%then full employment for the broad measureshould be about 10.0%.
The broad rate today is 11.2%.
200
400
600
800
1000
1200
Jan
-05
May
-05
Sep
-05
Jan
-06
May
-06
Sep
-06
Jan
-07
May
-07
Sep
-07
Jan
-08
May
-08
Sep
-08
Jan
-09
May
-09
Sep
-09
Jan
-10
May
-10
Sep
-10
Jan
-11
May
-11
Sep
-11
Jan
-12
May
-12
Sep
-12
Jan
-13
May
-13
Sep
-13
Jan
-14
May
-14
Sep
-14
Jan
-15
Discouraged Workers
Going forward the number of “discouragedworkers” will keep getting smaller, not bigger.
16.5%
17.0%
17.5%
18.0%
18.5%
19.0%
19.5%
20.0%
20.5%
Jan
-05
May
-05
Sep
-05
Jan
-06
May
-06
Sep
-06
Jan
-07
May
-07
Sep
-07
Jan
-08
May
-08
Sep
-08
Jan
-09
May
-09
Sep
-09
Jan
-10
May
-10
Sep
-10
Jan
-11
May
-11
Sep
-11
Jan
-12
May
-12
Sep
-12
Jan
-13
May
-13
Sep
-13
Jan
-14
May
-14
Sep
-14
Jan
-15
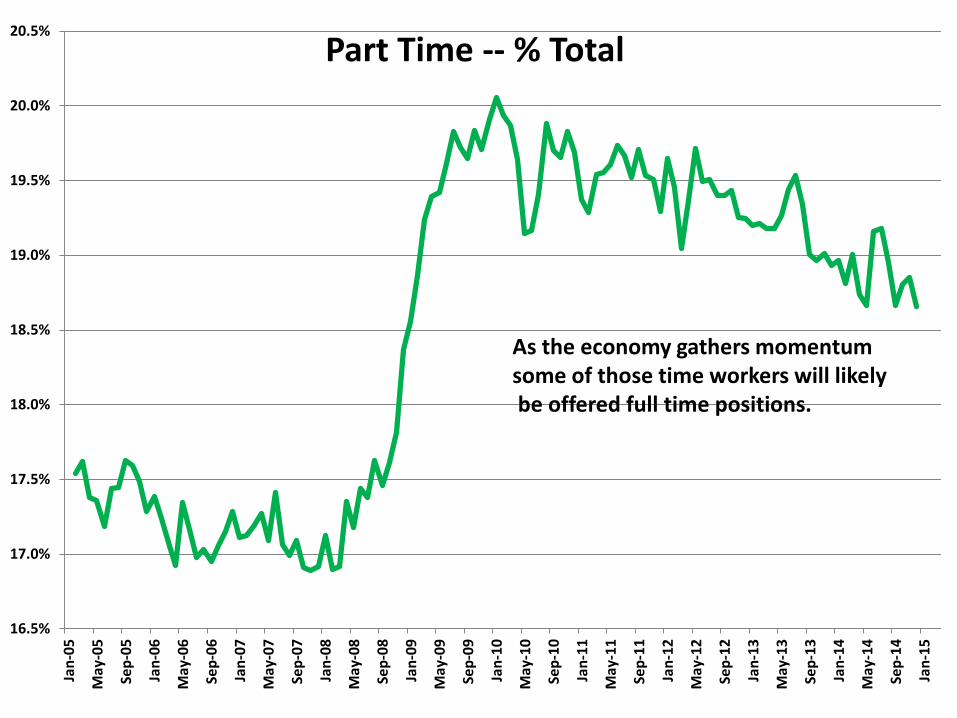
Part Time -- % Total
As the economy gathers momentumsome of those time workers will likelybe offered full time positions.
3.0
4.0
5.0
6.0
7.0
8.0
9.0
10.0
11.0
12.0
13.0
14.0
15.0
16.0
17.0
18.0
Jan-99 Jan-00 Jan-01 Jan-02 Jan-03 Jan-04 Jan-05 Jan-06 Jan-07 Jan-08 Jan-09 Jan-10 Jan-11 Jan-12 Jan-13 Jan-14 Jan-15
Broad vs. Official Unemployment Rate
Full Employment
Full Employment
By mid-2015 both unemploymentrates will be close to full employment.
1.5
2.0
2.5
3.0
3.5
4.0
Jan
20
07
Ap
r 2
007
Jul 2
00
7
Oct
20
07
Jan
20
08
Ap
r 2
008
Jul 2
00
8
Oct
20
08
Jan
20
09
Ap
r 2
009
Jul 2
00
9
Oct
20
09
Jan
20
10
Ap
r 2
010
Jul 2
01
0
Oct
20
10
Jan
20
11
Ap
r 2
011
Jul 2
01
1
Oct
20
11
Jan
20
12
Ap
r 2
012
Jul 2
01
2
Oct
20
12
Jan
20
13
Ap
r 2
013
Jul 2
01
3
Oct
20
13
Jan
20
14
Ap
r 2
014
Jul 2
01
4
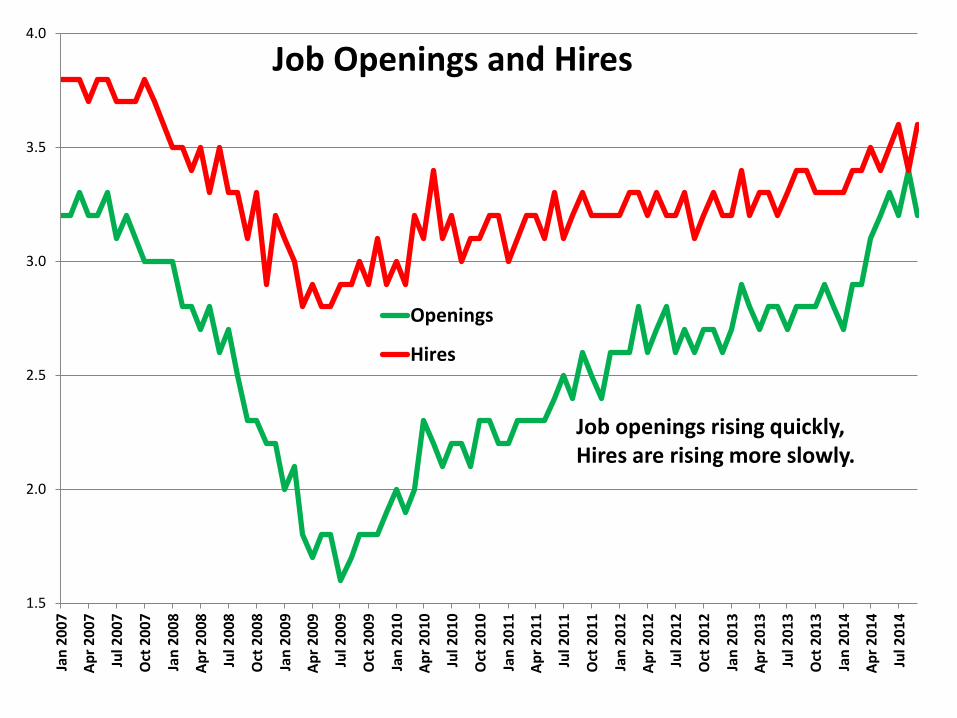
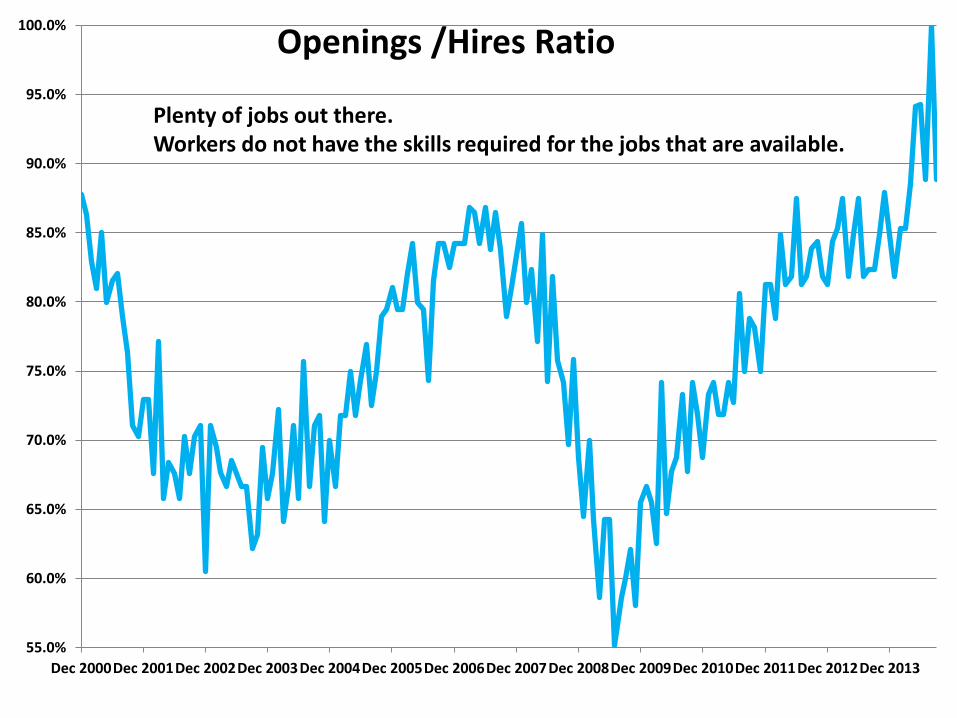
Job Openings and Hires
Openings
Hires
Job openings rising quickly,Hires are rising more slowly.
55.0%
60.0%
65.0%
70.0%
75.0%
80.0%
85.0%
90.0%
95.0%
100.0%
Dec 2000Dec 2001Dec 2002Dec 2003Dec 2004Dec 2005Dec 2006Dec 2007Dec 2008Dec 2009Dec 2010Dec 2011Dec 2012Dec 2013
Openings /Hires Ratio
Plenty of jobs out there. Workers do not have the skills required for the jobs that are available.
55.0%
60.0%
65.0%
70.0%
75.0%
80.0%
85.0%
90.0%
95.0%
100.0%
Dec 2000Dec 2001Dec 2002Dec 2003Dec 2004Dec 2005Dec 2006Dec 2007Dec 2008Dec 2009Dec 2010Dec 2011Dec 2012Dec 2013
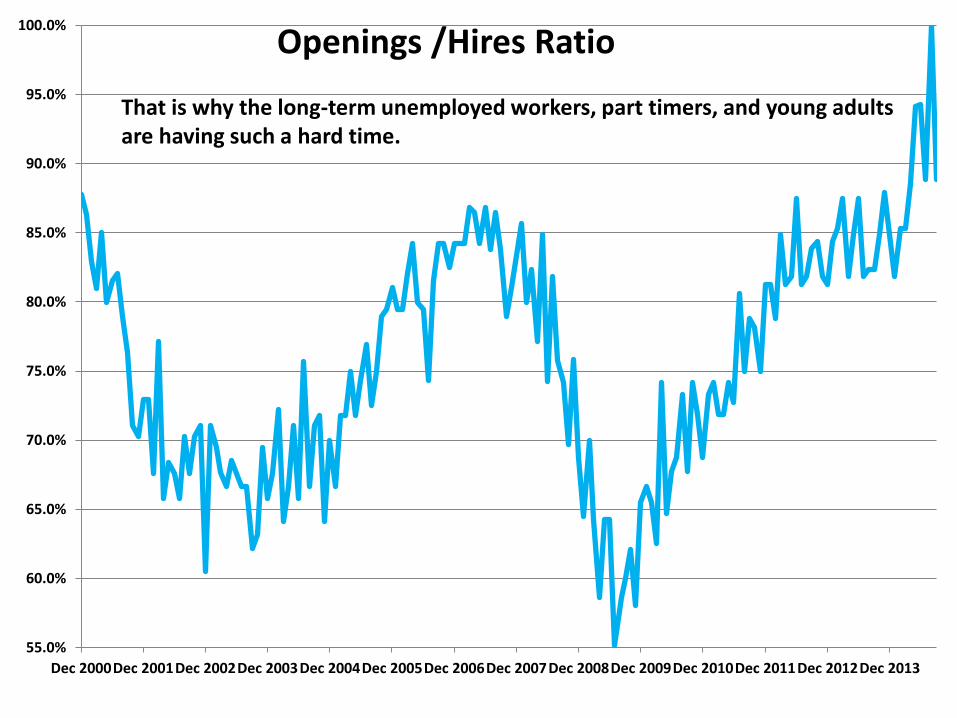
Openings /Hires Ratio
That is why the long-term unemployed workers, part timers, and young adultsare having such a hard time.
55.0%
60.0%
65.0%
70.0%
75.0%
80.0%
85.0%
90.0%
95.0%
100.0%
Dec 2000Dec 2001Dec 2002Dec 2003Dec 2004Dec 2005Dec 2006Dec 2007Dec 2008Dec 2009Dec 2010Dec 2011Dec 2012Dec 2013
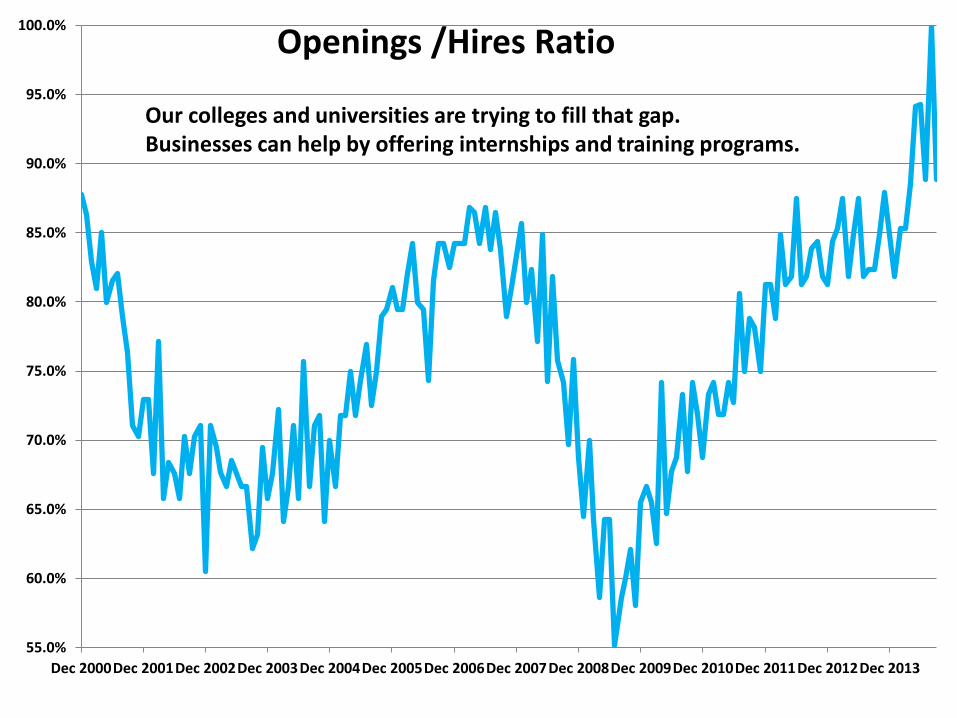
Openings /Hires Ratio
Our colleges and universities are trying to fill that gap.Businesses can help by offering internships and training programs.
1.0%
1.5%
2.0%
2.5%
3.0%
3.5%
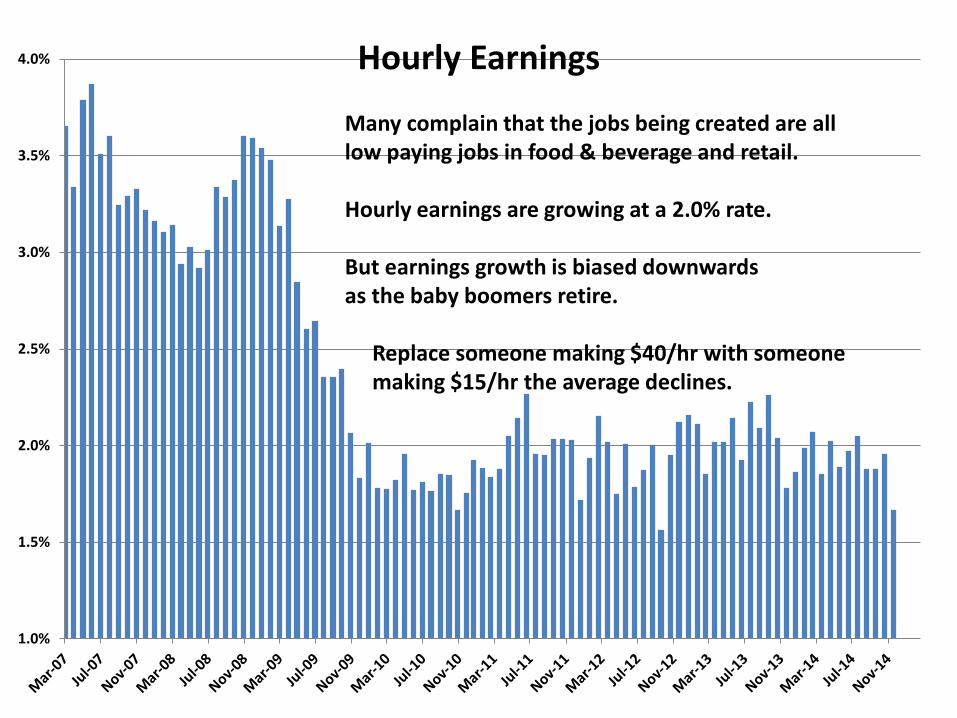
4.0% Hourly Earnings
Many complain that the jobs being created are alllow paying jobs in food & beverage and retail.
Hourly earnings are growing at a 2.0% rate.
But earnings growth is biased downwards as the baby boomers retire.
Replace someone making $40/hr with someonemaking $15/hr the average declines.

Consumption60%
Government15.0%
Trade10.0%
Investment15%
GDP Components
49
52
55
58
61
64
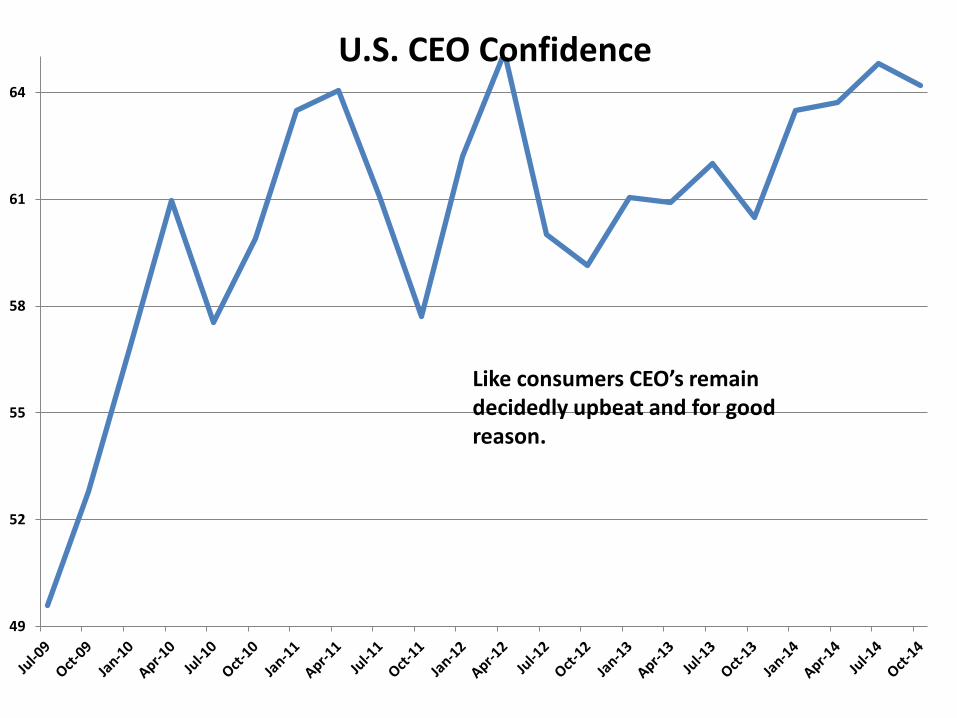
U.S. CEO Confidence
Like consumers CEO’s remaindecidedly upbeat and for goodreason.
-35.0%
-15.0%
5.0%
25.0%
45.0%
65.0%
85.0%
800
1000
1200
1400
1600
1800
2000
2200
2400
2600
20
0…
20
0…
20
0…
20
0…
20
0…
20
0…
20
0…
20
0…
20
0…
20
0…
20
1…
20
1…
20
1…
20
1…
20
1…
20
1…
20
1…
20
1…
20
1…
20
1…
20
1…
20
1…
20
1…
20
1…
20
1…
20
1…
20
1…
20
1…
20
1…
20
1…
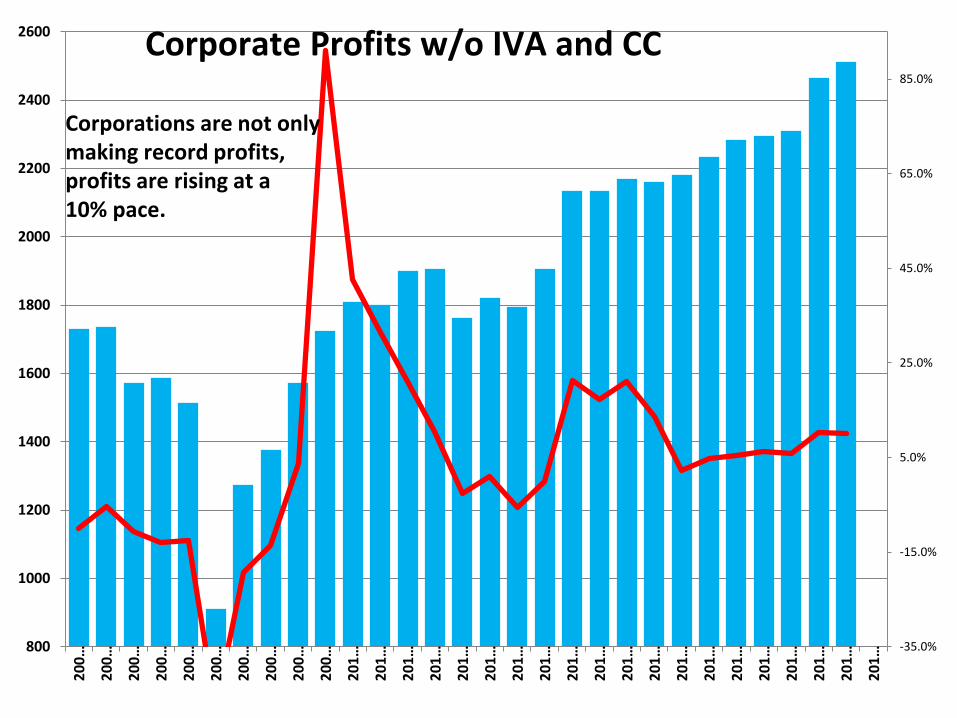
Corporate Profits w/o IVA and CC
Corporations are not onlymaking record profits, profits are rising at a10% pace.
3.0
4.0
5.0
6.0
7.0
8.0
9.0
10.0
11.0
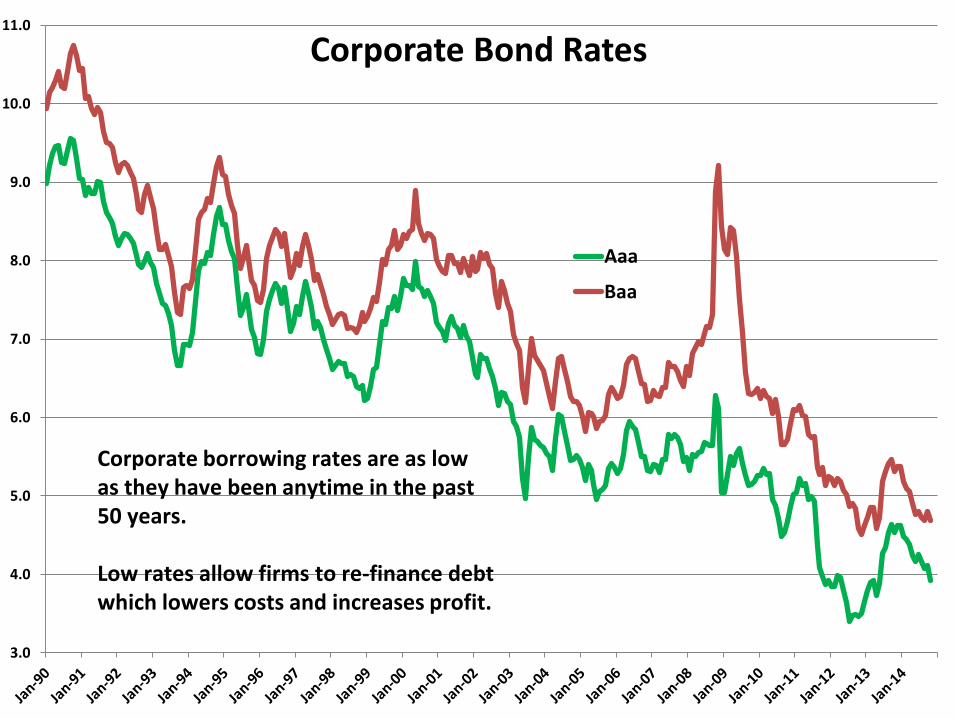
Corporate Bond Rates
Aaa
Baa
Corporate borrowing rates are as lowas they have been anytime in the past50 years.
Low rates allow firms to re-finance debtwhich lowers costs and increases profit.
-20.0%
-15.0%
-10.0%
-5.0%
0.0%
5.0%
10.0%
15.0%
-30.0%
-20.0%
-10.0%
0.0%
10.0%
20.0%
30.0%
Jan
20
10
Ap
r 2
01
0
Jul 2
01
0
Oct
20
10
Jan
20
11
Ap
r 2
01
1
Jul 2
01
1
Oct
20
11
Jan
20
12
Ap
r 2
01
2
Jul 2
01
2
Oct
20
12
Jan
20
13
Ap
r 2
01
3
Jul 2
01
3
Oct
20
13
Jan
20
14
Ap
r 2
01
4
Jul 2
01
4
Oct
20
14
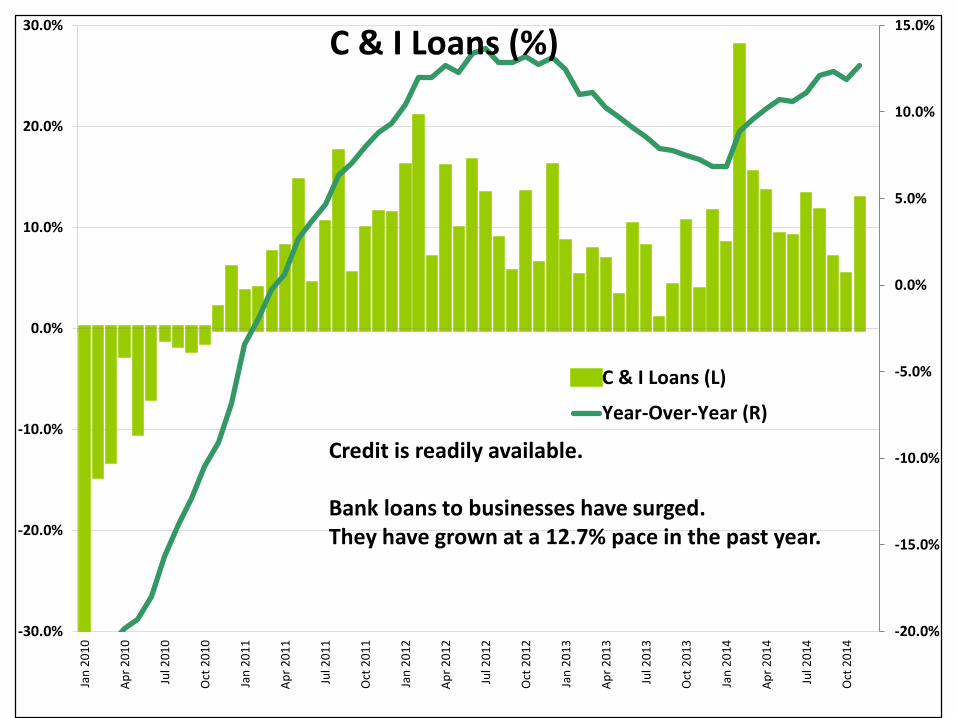
C & I Loans (L)
Year-Over-Year (R)
C & I Loans (%)
Credit is readily available.
Bank loans to businesses have surged.They have grown at a 12.7% pace in the past year.
8.0%
8.5%
9.0%
9.5%
10.0%
10.5%
20
07
-Q1
20
07
-Q2
20
07
-Q3
20
07
-Q4
20
08
-Q1
20
08
-Q2
20
08
-Q3
20
08
-Q4
20
09
-Q1
20
09
-Q2
20
09
-Q3
20
09
-Q4
20
10
-Q1
20
10
-Q2
20
10
-Q3
20
10
-Q4
20
11
-Q1
20
11
-Q2
20
11
-Q3
20
11
-Q4
20
12
-Q1
20
12
-Q2
20
12
-Q3
20
12
-Q4
20
13
-Q1
20
13
-Q2
20
13
-Q3
20
13
-Q4
20
14
-Q1
20
14
-Q2
20
14
-Q3
20
14
-Q4
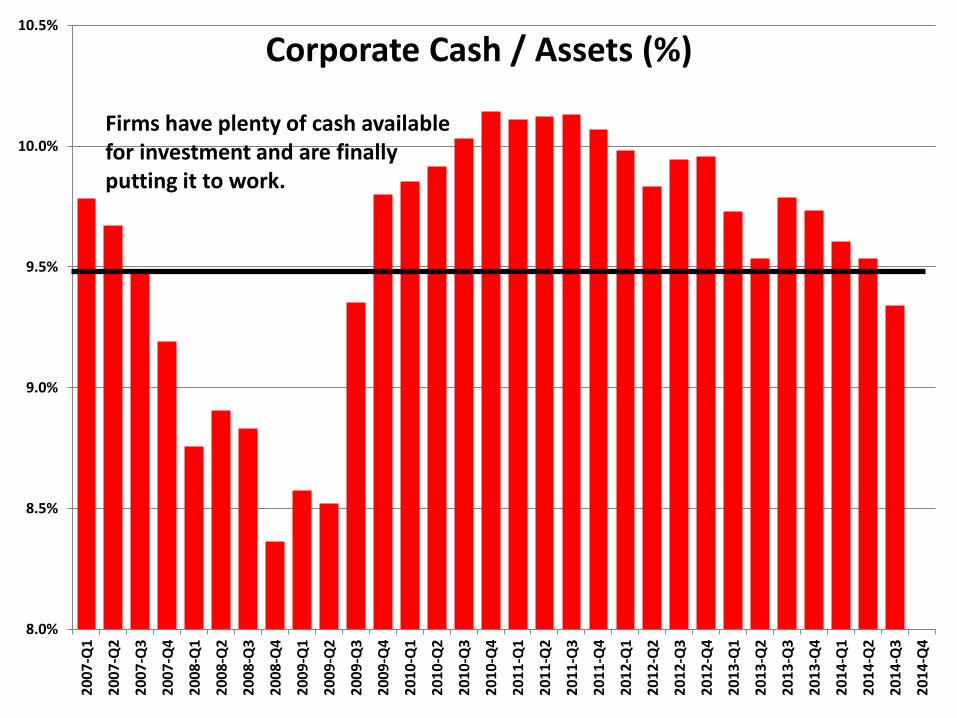
Corporate Cash / Assets (%)
Firms have plenty of cash availablefor investment and are finallyputting it to work.
64
66
68
70
72
74
76
78
80
82
Jan1999
Jan2000
Jan2001
Jan2002
Jan2003
Jan2004
Jan2005
Jan2006
Jan2007
Jan2008
Jan2009
Jan2010
Jan2011
Jan2012
Jan2013
Jan2014
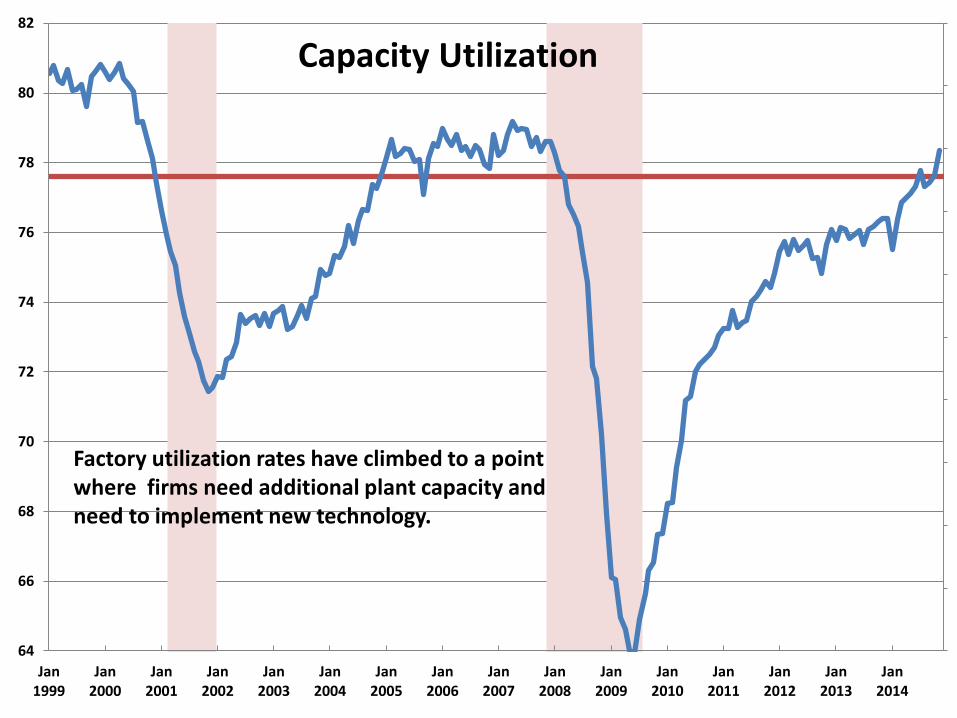
Capacity Utilization
Factory utilization rates have climbed to a pointwhere firms need additional plant capacity andneed to implement new technology.
1. CEO’s feel relatively confident.
2. Profits are soaring.
3. Interest rates are near record low levels.
4. Credit is readily available.
5. Firms have accumulated a mountain of cash.
6. Need additional plant capacity.
-30.0%
-20.0%
-10.0%
0.0%
10.0%
20.0%
Nonresidential Invest.
Year-over-year
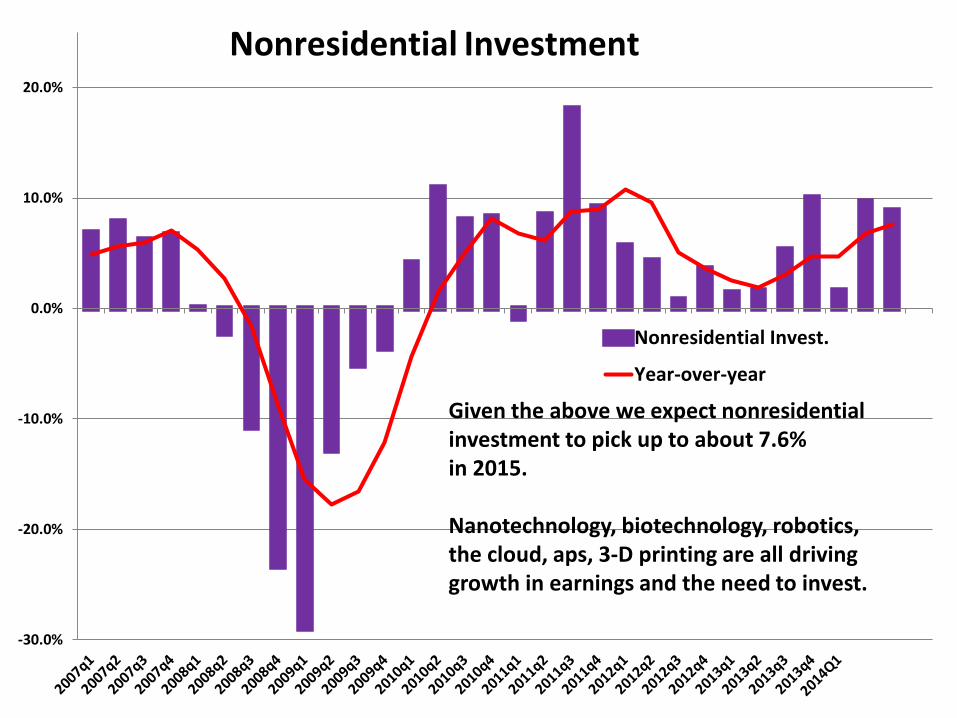
Nonresidential Investment
Given the above we expect nonresidentialinvestment to pick up to about 7.6%in 2015.
Nanotechnology, biotechnology, robotics, the cloud, aps, 3-D printing are all drivinggrowth in earnings and the need to invest.
Consumption60%
Government15.0%
Trade10.0%
Investment15%
GDP Components
-470
-450
-430
-410
-390
-370
-350
-3302
01
1q
1
20
11
q3
20
12
q1
20
12
q3
20
13
q1
20
13
q3
20
14
Q1
20
14
Q3
20
15
Q1
20
15
Q3
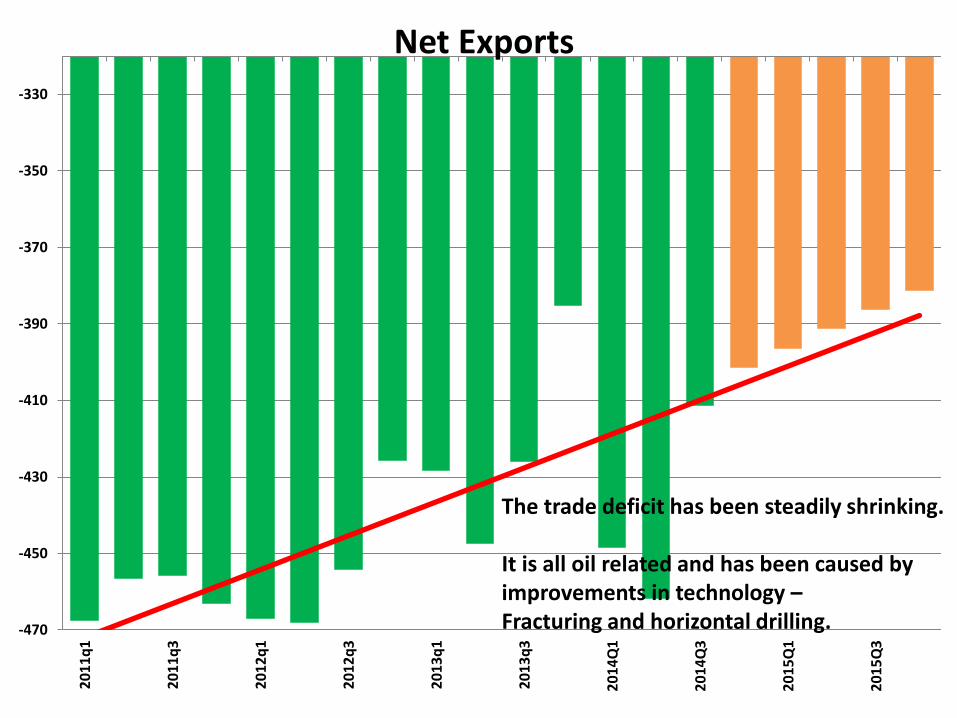
Net Exports
The trade deficit has been steadily shrinking.
It is all oil related and has been caused byimprovements in technology –Fracturing and horizontal drilling.
2,000
3,000
4,000
5,000
6,000
7,000
8,000
9,000
Jan 2007 Jan 2008 Jan 2009 Jan 2010 Jan 2011 Jan 2012 Jan 2013 Jan 2014 Jan 2015
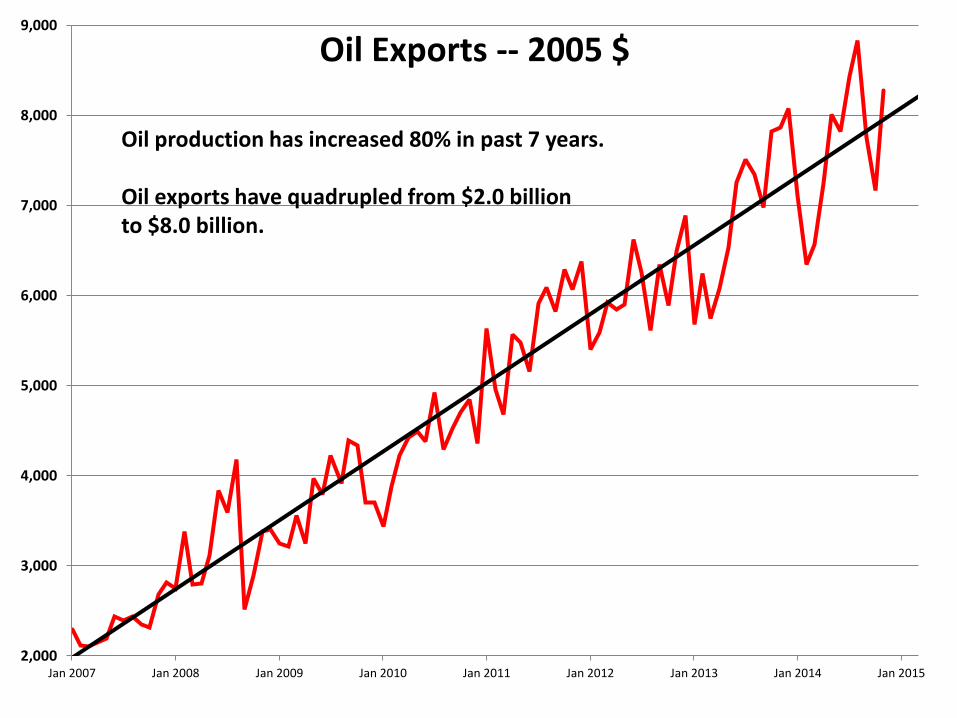
Oil Exports -- 2005 $
Oil production has increased 80% in past 7 years.
Oil exports have quadrupled from $2.0 billionto $8.0 billion.
15,500
16,500
17,500
18,500
19,500
20,500
21,500
22,500
Jan 2007 Jan 2008 Jan 2009 Jan 2010 Jan 2011 Jan 2012 Jan 2013 Jan 2014 Jan 2015
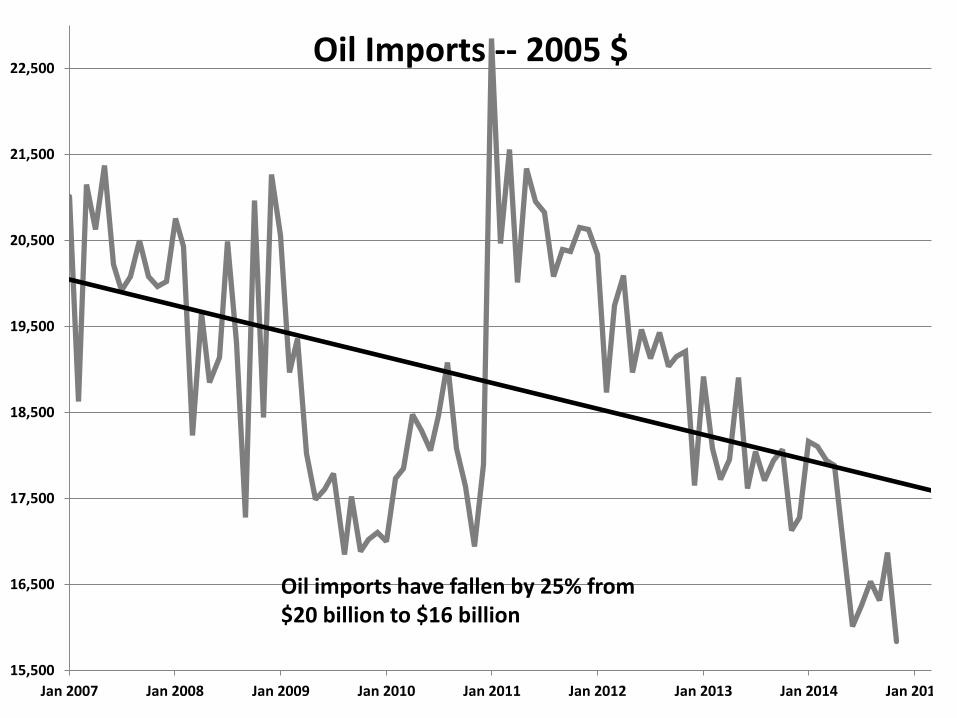
Oil Imports -- 2005 $
Oil imports have fallen by 25% from $20 billion to $16 billion
-19,000
-17,000
-15,000
-13,000
-11,000
-9,000
-7,000
Jan 2007 Jan 2008 Jan 2009 Jan 2010 Jan 2011 Jan 2012 Jan 2013 Jan 2014 Jan 2015
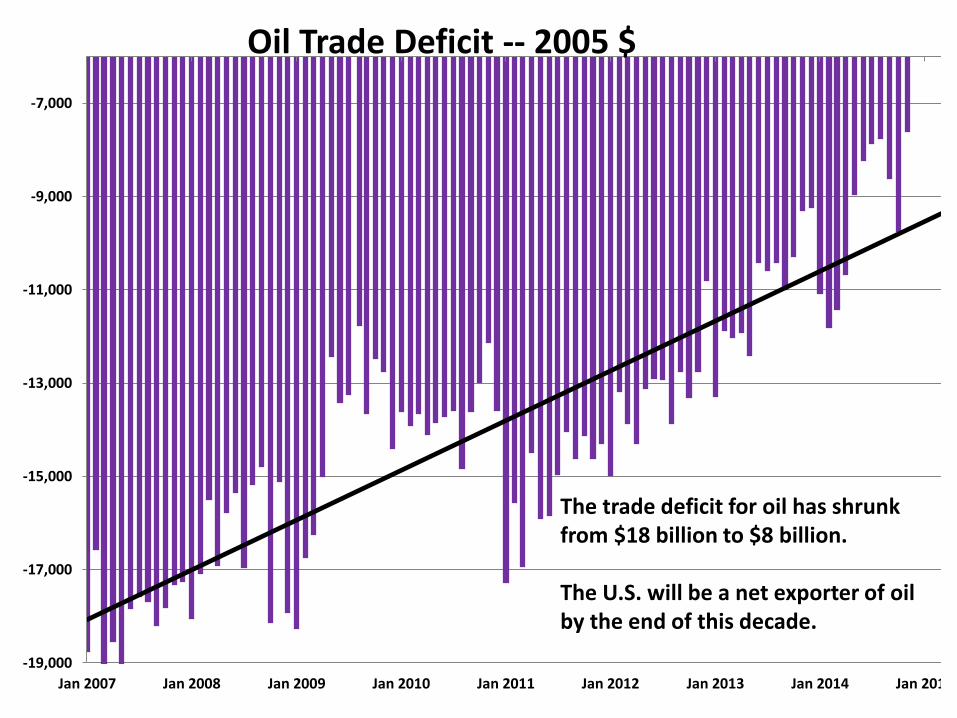
Oil Trade Deficit -- 2005 $
The trade deficit for oil has shrunk from $18 billion to $8 billion.
The U.S. will be a net exporter of oil by the end of this decade.
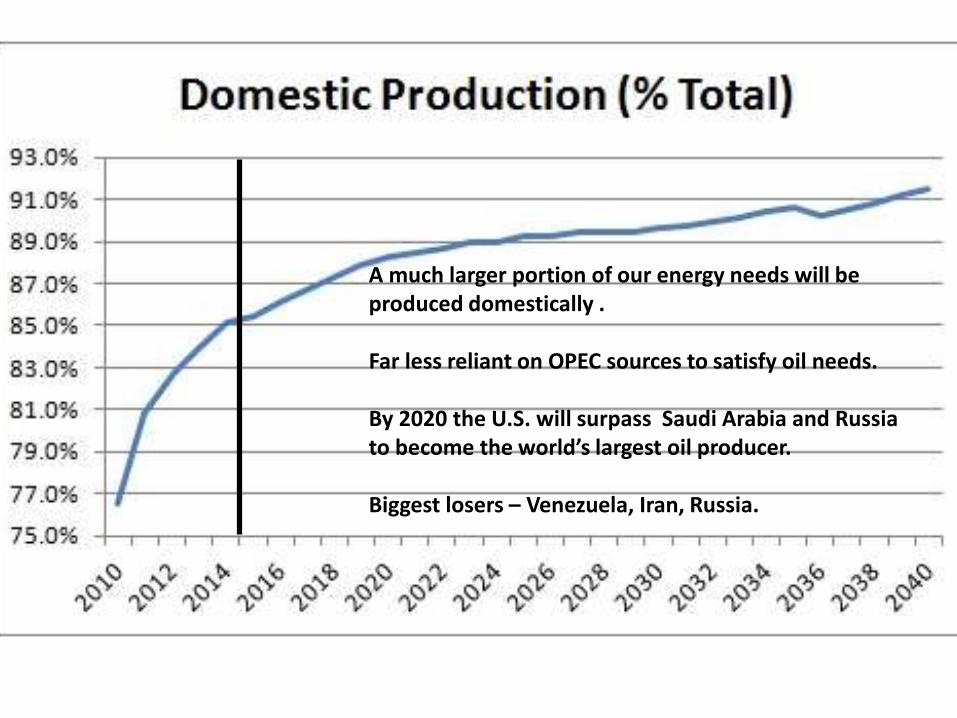
A much larger portion of our energy needs will beproduced domestically .
Far less reliant on OPEC sources to satisfy oil needs.
By 2020 the U.S. will surpass Saudi Arabia and Russia to become the world’s largest oil producer.
Biggest losers – Venezuela, Iran, Russia.
-470
-450
-430
-410
-390
-370
-350
-3302
01
1q
1
20
11
q3
20
12
q1
20
12
q3
20
13
q1
20
13
q3
20
14
Q1
20
14
Q3
20
15
Q1
20
15
Q3
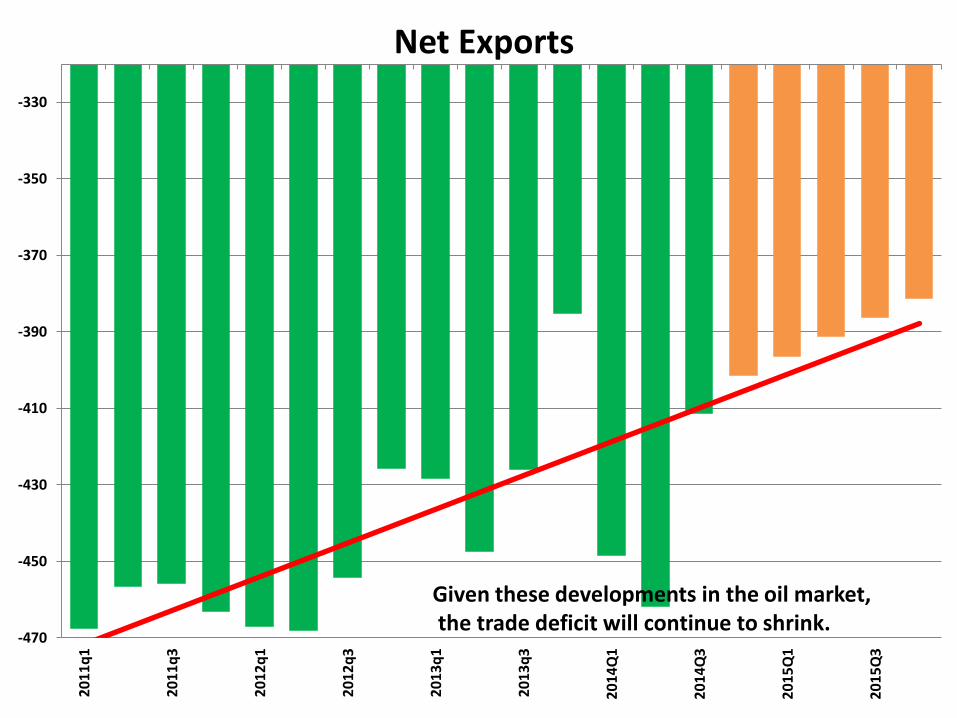
Net Exports
Given these developments in the oil market, the trade deficit will continue to shrink.
Consumption60%
Government15.0%
Trade10.0%
Investment15%
GDP Components
-17.0%
-12.0%
-7.0%
-2.0%
3.0%
8.0%
13.0%
Federal Government
Year-over-year
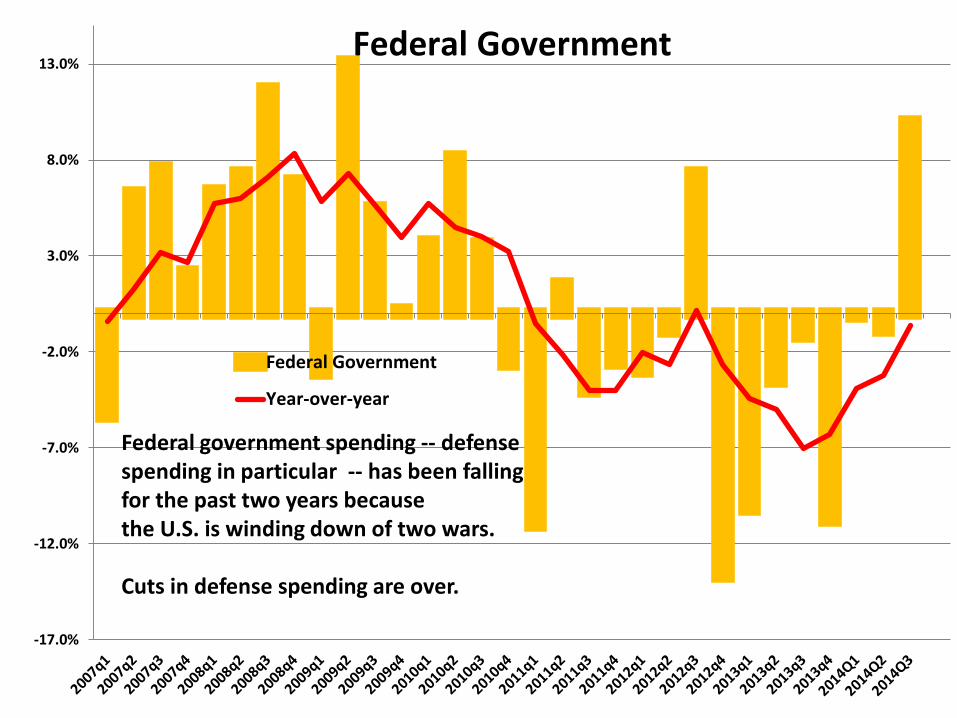
Federal Government
Federal government spending -- defensespending in particular -- has been fallingfor the past two years because the U.S. is winding down of two wars.
Cuts in defense spending are over.

Consumption60%
Government15.0%
Trade10.0%
Investment15%
GDP Components

2014-2015 Forecasts2013 2014 2015
GDP 3.1% 2.8% 3.4%Unemploy. Rate 6.7% 5.6% 4.9%Inflation Rate 1.5% 1.8% 2.8%Fed Funds Rate 0.1% 0.1% 1.4%10-year Note 2.9% 2.2% 2.7%30-year Mortgage 4.3% 3.9% 4.5%
How About Inflation?
-2.0%
-1.0%
0.0%
1.0%
2.0%
3.0%
4.0%
5.0%
6.0%
Jan
20
07
Ap
r 2
007
Jul 2
00
7
Oct
20
07
Jan
20
08
Ap
r 2
008
Jul 2
00
8
Oct
20
08
Jan
20
09
Ap
r 2
009
Jul 2
00
9
Oct
20
09
Jan
20
10
Ap
r 2
010
Jul 2
01
0
Oct
20
10
Jan
20
11
Ap
r 2
011
Jul 2
01
1
Oct
20
11
Jan
20
12
Ap
r 2
012
Jul 2
01
2
Oct
20
12
Jan
20
13
Ap
r 2
013
Jul 2
01
3
Oct
20
13
Jan
20
14
Ap
r 2
014
Jul 2
01
4
Oct
20
14
CPIEx Food & Energy
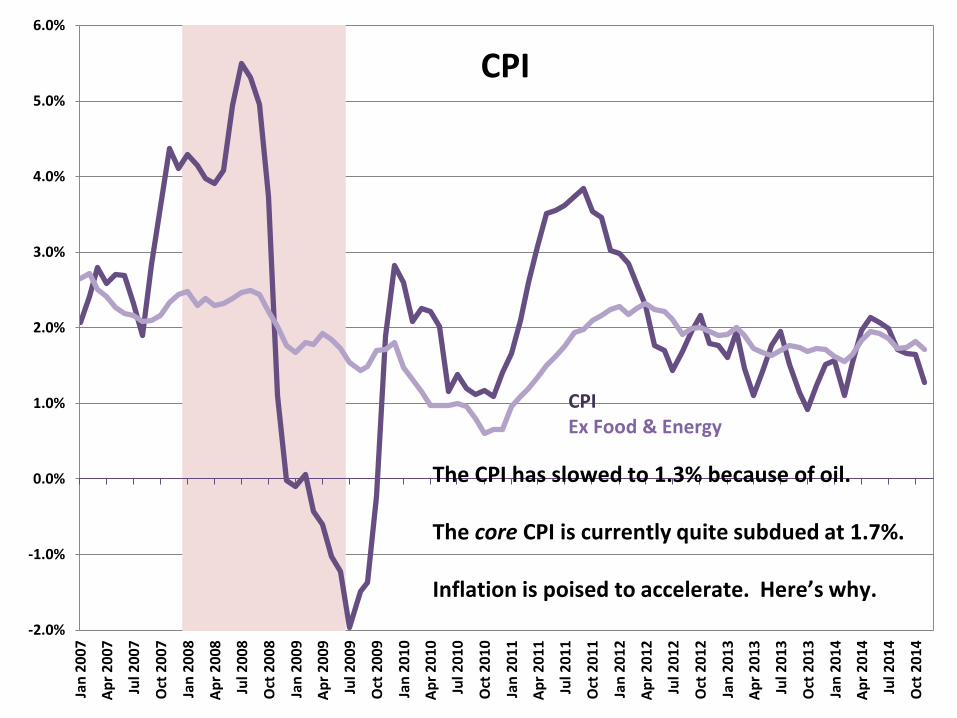
CPI
The CPI has slowed to 1.3% because of oil.
The core CPI is currently quite subdued at 1.7%.
Inflation is poised to accelerate. Here’s why.
$2.30
$2.50
$2.70
$2.90
$3.10
$3.30
$3.50
$3.70
$3.90
$4.10 Gasoline Prices
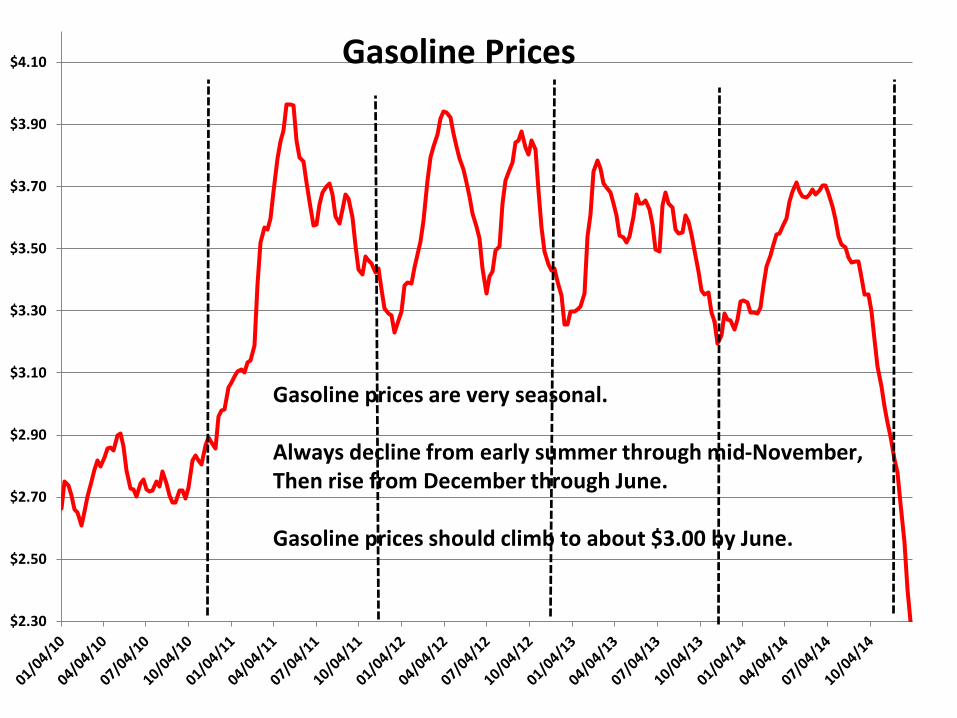
Gasoline prices are very seasonal.
Always decline from early summer through mid-November,Then rise from December through June.
Gasoline prices should climb to about $3.00 by June.
-1.0%
0.0%
1.0%
2.0%
3.0%
4.0%Ja
n 2
007
Ap
r 2
007
Jul 2
007
Oct
20
07
Jan
20
08
Ap
r 2
008
Jul 2
008
Oct
20
08
Jan
20
09
Ap
r 2
009
Jul 2
009
Oct
20
09
Jan
20
10
Ap
r 2
010
Jul 2
010
Oct
20
10
Jan
20
11
Ap
r 2
011
Jul 2
011
Oct
20
11
Jan
20
12
Ap
r 2
012
Jul 2
012
Oct
20
12
Jan
20
13
Ap
r 2
013
Jul 2
013
Oct
20
13
Jan
20
14
Ap
r 2
014
Jul 2
014
Oct
20
14
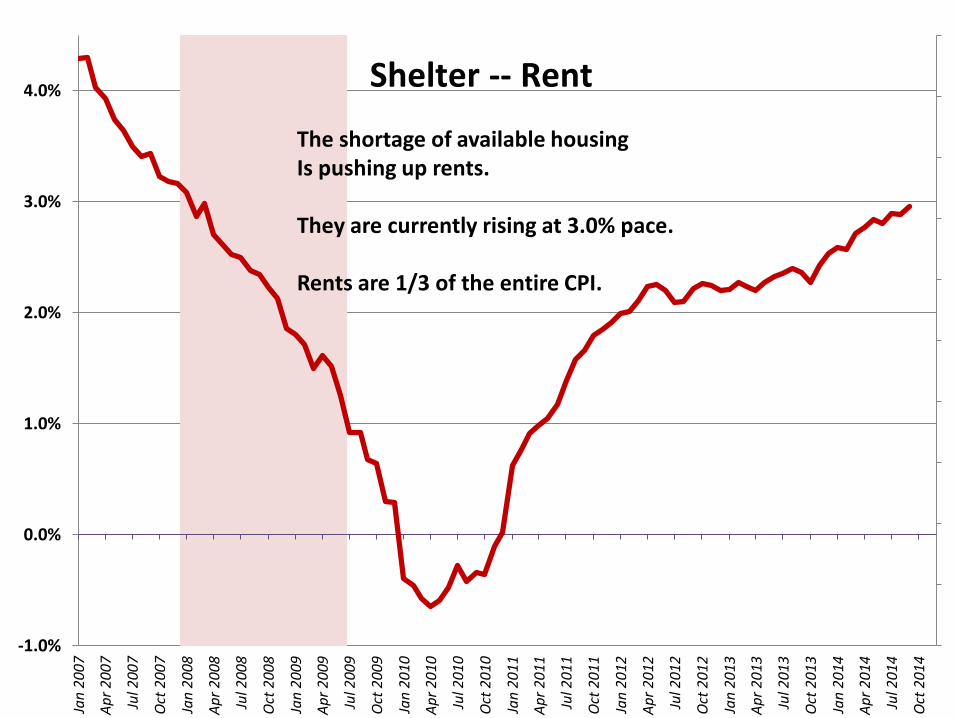
Shelter -- Rent
The shortage of available housing Is pushing up rents.
They are currently rising at 3.0% pace.
Rents are 1/3 of the entire CPI.
3.0
4.0
5.0
6.0
7.0
8.0
9.0
10.0
11.0
12.0
13.0
14.0
15.0
16.0
17.0
18.0
Jan-99 Jan-00 Jan-01 Jan-02 Jan-03 Jan-04 Jan-05 Jan-06 Jan-07 Jan-08 Jan-09 Jan-10 Jan-11 Jan-12 Jan-13 Jan-14 Jan-15
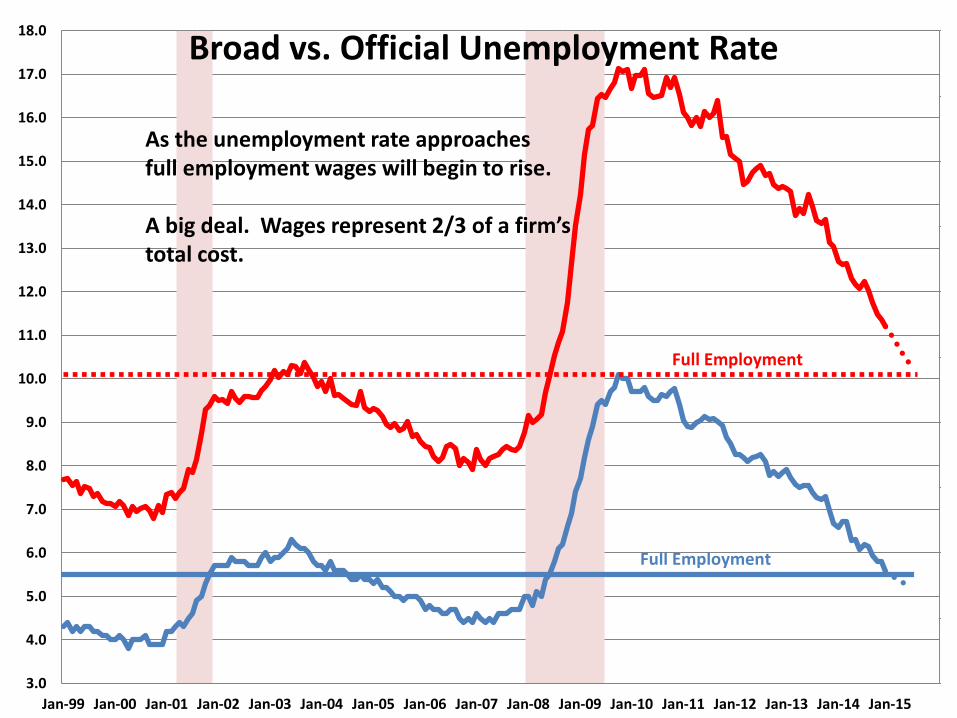
Broad vs. Official Unemployment Rate
Full Employment
Full Employment
As the unemployment rate approachesfull employment wages will begin to rise.
A big deal. Wages represent 2/3 of a firm’s total cost.
0.5%
1.0%
1.5%
2.0%
2.5%
3.0%
3.5%
4.0%
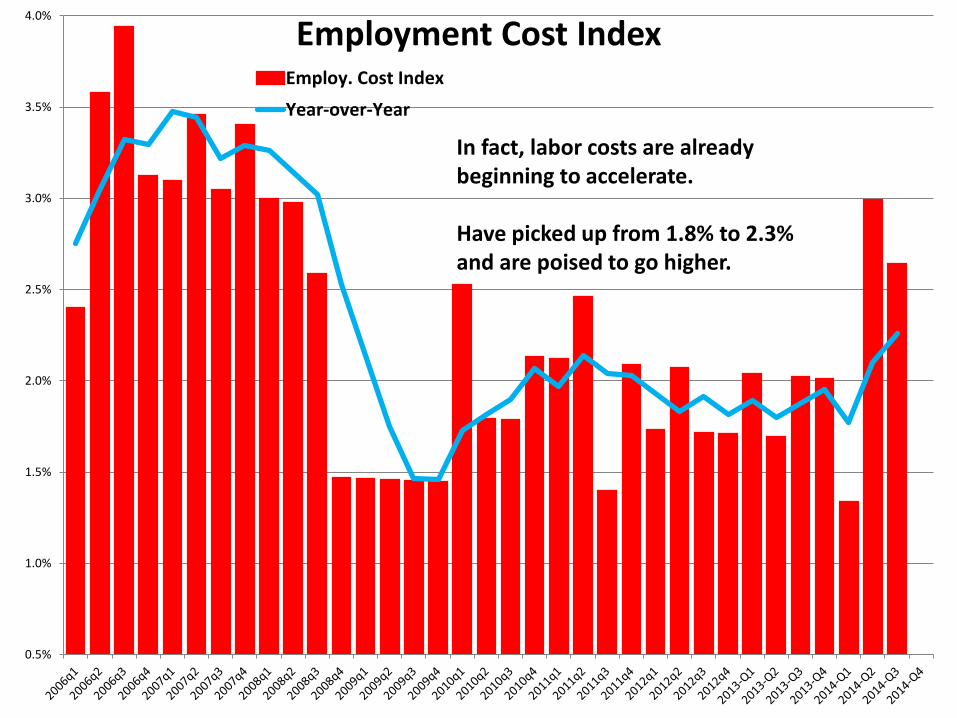
Employment Cost IndexEmploy. Cost Index
Year-over-Year
In fact, labor costs are alreadybeginning to accelerate.
Have picked up from 1.8% to 2.3%and are poised to go higher.
-2.0%
-1.0%
0.0%
1.0%
2.0%
3.0%
4.0%
5.0%
6.0%
Jan
20
07
Ap
r 2
007
Jul 2
00
7
Oct
20
07
Jan
20
08
Ap
r 2
008
Jul 2
00
8
Oct
20
08
Jan
20
09
Ap
r 2
009
Jul 2
00
9
Oct
20
09
Jan
20
10
Ap
r 2
010
Jul 2
01
0
Oct
20
10
Jan
20
11
Ap
r 2
011
Jul 2
01
1
Oct
20
11
Jan
20
12
Ap
r 2
012
Jul 2
01
2
Oct
20
12
Jan
20
13
Ap
r 2
013
Jul 2
01
3
Oct
20
13
Jan
20
14
Ap
r 2
014
Jul 2
01
4
Oct
20
14
Jan
20
15
Ap
r 2
015
Jul 2
01
5
Oct
20
15
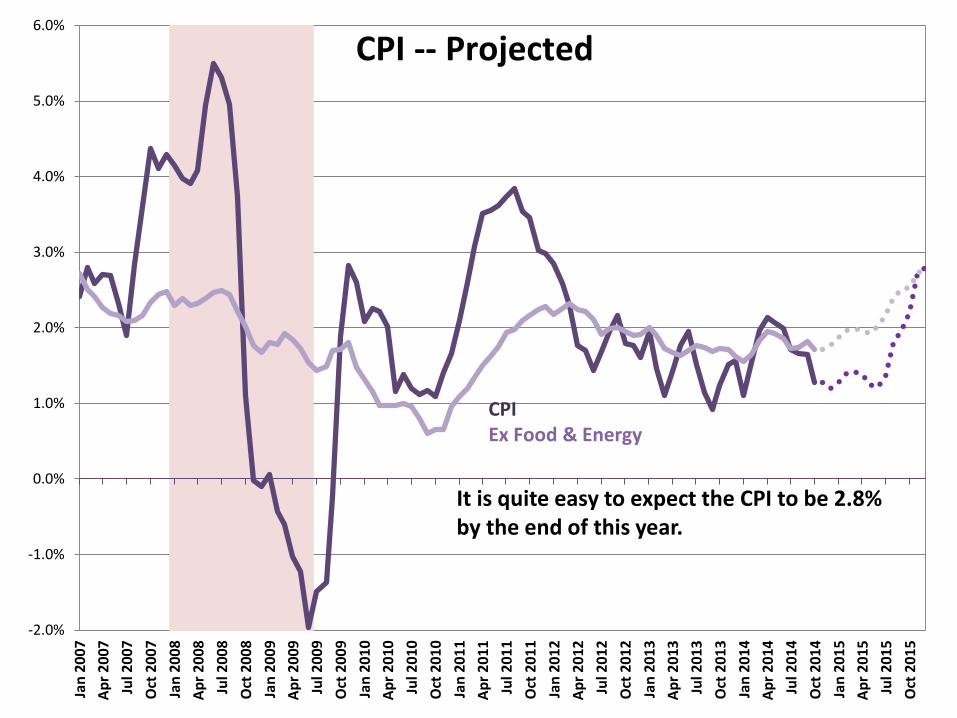
CPIEx Food & Energy
CPI -- Projected
It is quite easy to expect the CPI to be 2.8% by the end of this year.

2014-2015 Forecasts2013 2014 2015
GDP 3.1% 2.8% 3.4%Unemploy. Rate 6.7% 5.6% 4.9%Inflation Rate 1.5% 1.8% 2.8%Fed Funds Rate 0.1% 0.1% 1.4%10-year Note 2.9% 2.2% 2.7%30-year Mortgage 4.3% 3.9% 4.5%
What About the Fed?
The Fed Should Raise Rates by June
Rates Will Rise Slowly Thereafter
But the Fed Will Completely Change
The Way It Conducts Policy
0
1
2
3
4
5
6
7
8
Jan-98 Jan-99 Jan-00 Jan-01 Jan-02 Jan-03 Jan-04 Jan-05 Jan-06 Jan-07 Jan-08 Jan-09 Jan-10 Jan-11 Jan-12 Jan-13 Jan-14
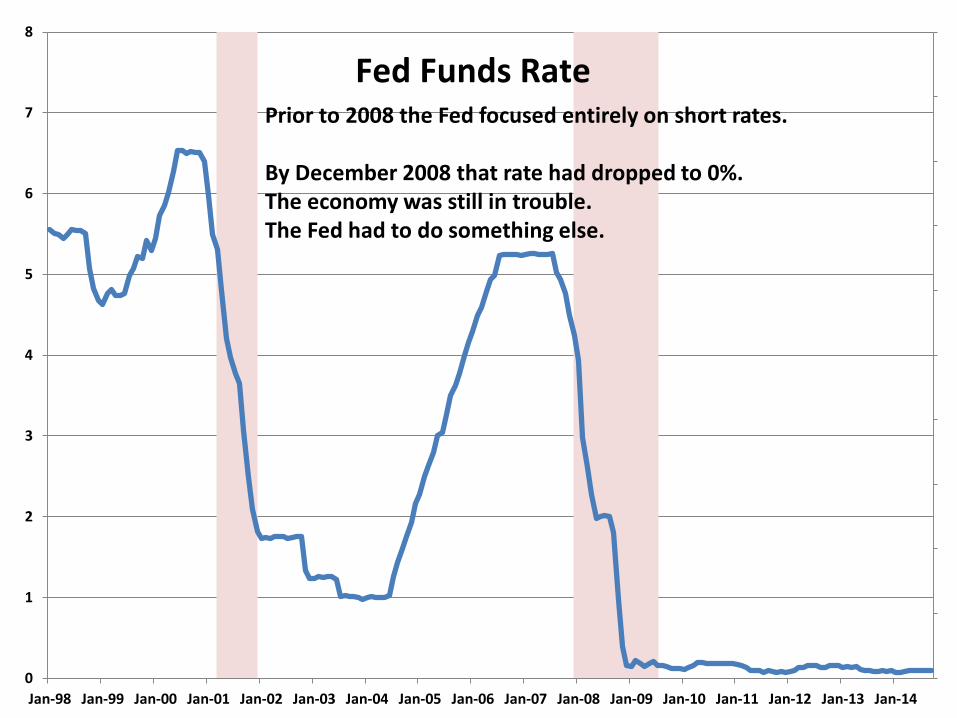
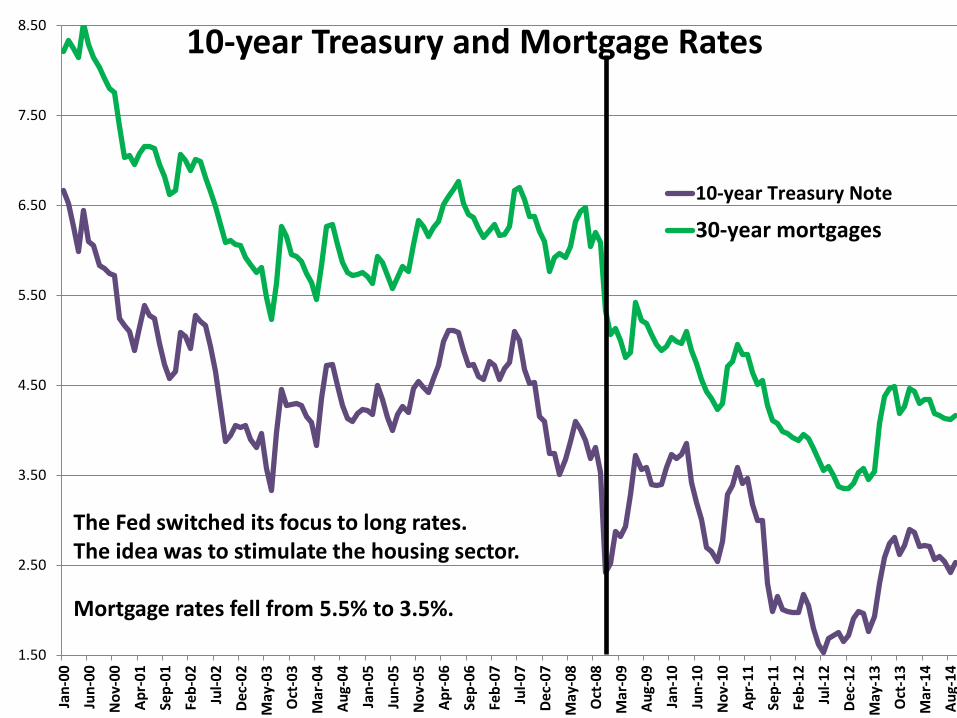
Fed Funds RatePrior to 2008 the Fed focused entirely on short rates.
By December 2008 that rate had dropped to 0%.The economy was still in trouble.The Fed had to do something else.
1.50
2.50
3.50
4.50
5.50
6.50
7.50
8.50
Jan
-00
Jun
-00
No
v-0
0
Ap
r-0
1
Sep
-01
Feb
-02
Jul-
02
Dec
-02
May
-03
Oct
-03
Mar
-04
Au
g-0
4
Jan
-05
Jun
-05
No
v-0
5
Ap
r-0
6
Sep
-06
Feb
-07
Jul-
07
Dec
-07
May
-08
Oct
-08
Mar
-09
Au
g-0
9
Jan
-10
Jun
-10
No
v-1
0
Ap
r-1
1
Sep
-11
Feb
-12
Jul-
12
Dec
-12
May
-13
Oct
-13
Mar
-14
Au
g-1
4
10-year Treasury and Mortgage Rates
10-year Treasury Note
30-year mortgages
The Fed switched its focus to long rates.The idea was to stimulate the housing sector.
Mortgage rates fell from 5.5% to 3.5%.
0
500
1,000
1,500
2,000
2,500Ja
n 2
00
8
Ap
r 2
008
Jul 2
00
8
Oct
20
08
Jan
20
09
Ap
r 2
009
Jul 2
00
9
Oct
20
09
Jan
20
10
Ap
r 2
010
Jul 2
01
0
Oct
20
10
Jan
20
11
Ap
r 2
011
Jul 2
01
1
Oct
20
11
Jan
20
12
Ap
r 2
012
Jul 2
01
2
Oct
20
12
Jan
20
13
Ap
r 2
013
Jul 2
01
3
Oct
20
13
Jan
20
14
Ap
r 2
014
Jul 2
01
4
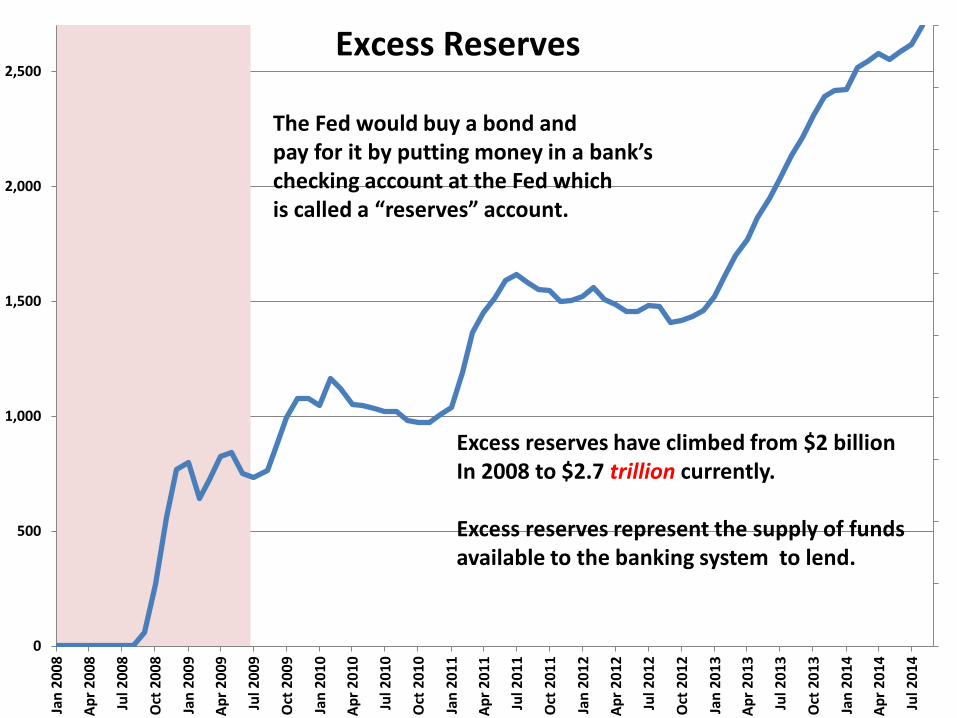
Excess Reserves
The Fed would buy a bond andpay for it by putting money in a bank’s checking account at the Fed whichis called a “reserves” account.
Excess reserves have climbed from $2 billionIn 2008 to $2.7 trillion currently.
Excess reserves represent the supply of fundsavailable to the banking system to lend.
0
500
1,000
1,500
2,000
2,500Ja
n 2
00
8
Ap
r 2
008
Jul 2
00
8
Oct
20
08
Jan
20
09
Ap
r 2
009
Jul 2
00
9
Oct
20
09
Jan
20
10
Ap
r 2
010
Jul 2
01
0
Oct
20
10
Jan
20
11
Ap
r 2
011
Jul 2
01
1
Oct
20
11
Jan
20
12
Ap
r 2
012
Jul 2
01
2
Oct
20
12
Jan
20
13
Ap
r 2
013
Jul 2
01
3
Oct
20
13
Jan
20
14
Ap
r 2
014
Jul 2
01
4
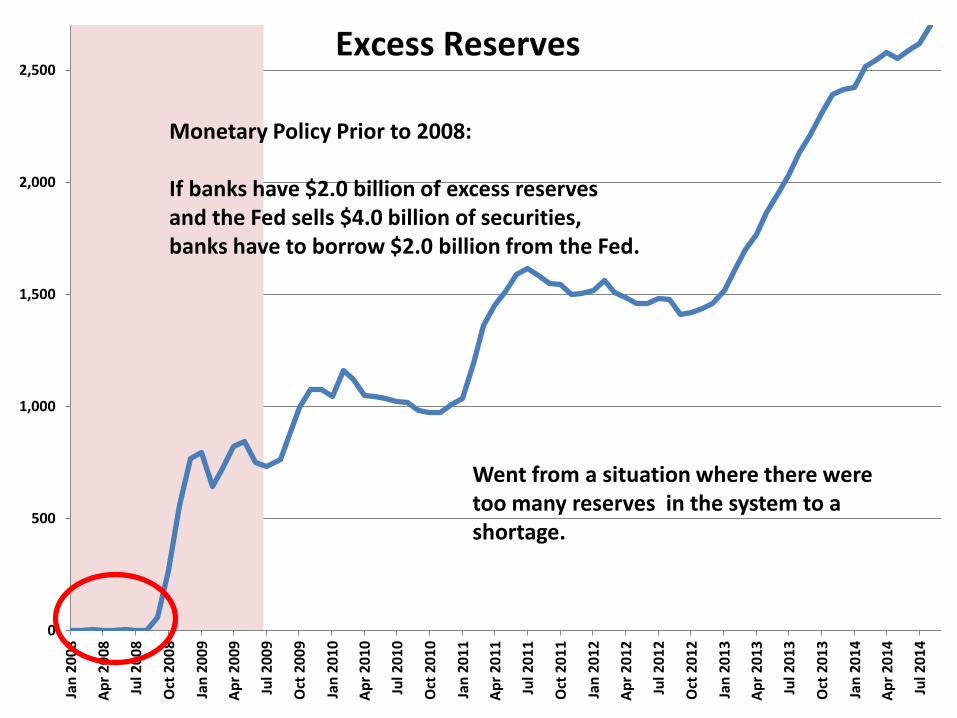
Excess Reserves
Monetary Policy Prior to 2008:
If banks have $2.0 billion of excess reservesand the Fed sells $4.0 billion of securities,banks have to borrow $2.0 billion from the Fed.
Went from a situation where there weretoo many reserves in the system to a shortage.
0
500
1,000
1,500
2,000
2,500Ja
n 2
00
8
Ap
r 2
008
Jul 2
00
8
Oct
20
08
Jan
20
09
Ap
r 2
009
Jul 2
00
9
Oct
20
09
Jan
20
10
Ap
r 2
010
Jul 2
01
0
Oct
20
10
Jan
20
11
Ap
r 2
011
Jul 2
01
1
Oct
20
11
Jan
20
12
Ap
r 2
012
Jul 2
01
2
Oct
20
12
Jan
20
13
Ap
r 2
013
Jul 2
01
3
Oct
20
13
Jan
20
14
Ap
r 2
014
Jul 2
01
4
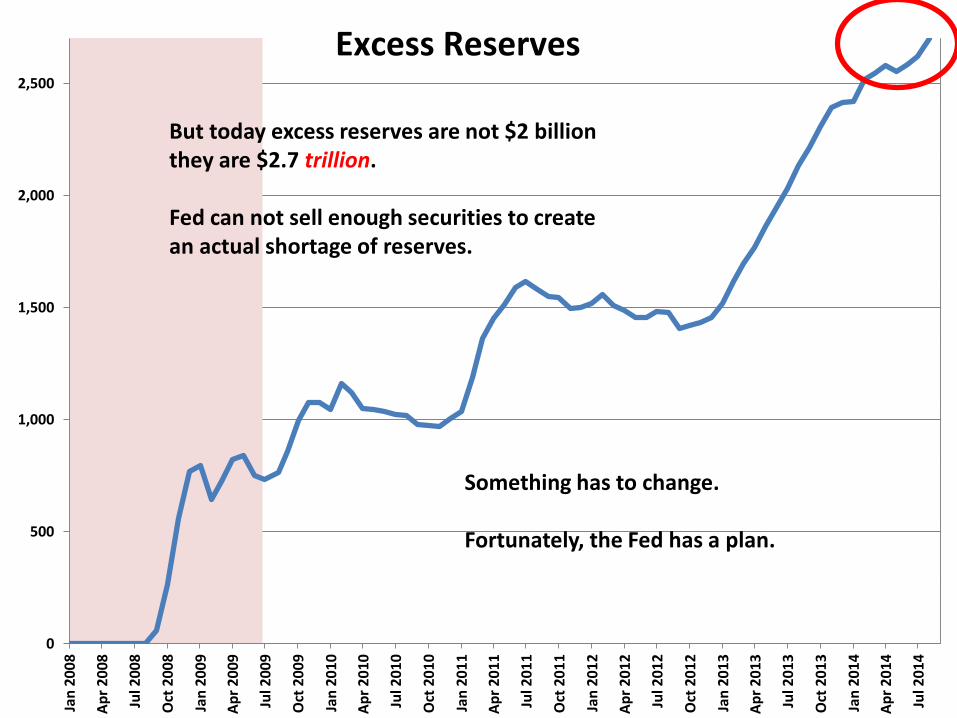
Excess Reserves
But today excess reserves are not $2 billionthey are $2.7 trillion.
Fed can not sell enough securities to createan actual shortage of reserves.
Something has to change.
Fortunately, the Fed has a plan.
0
500
1,000
1,500
2,000
2,500
3,000
Jan
20
08
Jun
20
08
No
v 2
00
8
Ap
r 2
009
Sep
20
09
Feb
20
10
Jul 2
01
0
Dec
20
10
May
20
11
Oct
20
11
Mar
20
12
Au
g 2
012
Jan
20
13
Jun
20
13
No
v 2
01
3
Ap
r 2
014
Sep
20
14
Feb
20
15
Jul 2
01
5
Dec
20
15
May
20
16
Oct
20
16
Mar
20
17
Au
g 2
017
Jan
20
18
Jun
20
18
No
v 2
01
8
Ap
r 2
019
Sep
20
19
Feb
20
20
Jul 2
02
0
Dec
20
20
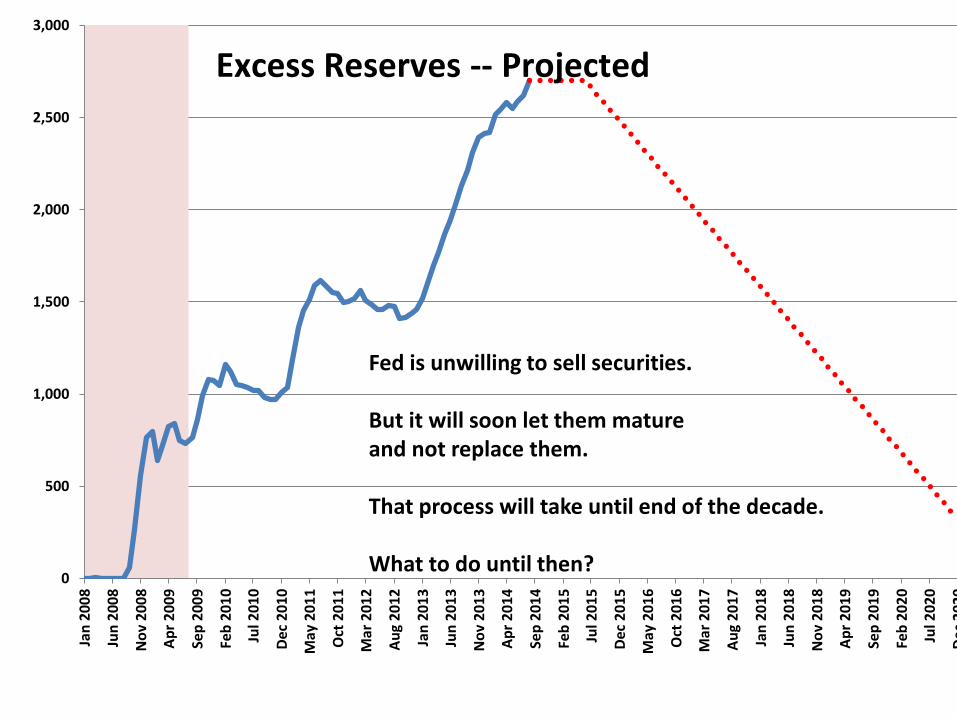
Excess Reserves -- Projected
Fed is unwilling to sell securities.
But it will soon let them matureand not replace them.
That process will take until end of the decade.
What to do until then?
0
500
1,000
1,500
2,000
2,500Ja
n 2
00
8
Ap
r 2
008
Jul 2
00
8
Oct
20
08
Jan
20
09
Ap
r 2
009
Jul 2
00
9
Oct
20
09
Jan
20
10
Ap
r 2
010
Jul 2
01
0
Oct
20
10
Jan
20
11
Ap
r 2
011
Jul 2
01
1
Oct
20
11
Jan
20
12
Ap
r 2
012
Jul 2
01
2
Oct
20
12
Jan
20
13
Ap
r 2
013
Jul 2
01
3
Oct
20
13
Jan
20
14
Ap
r 2
014
Jul 2
01
4
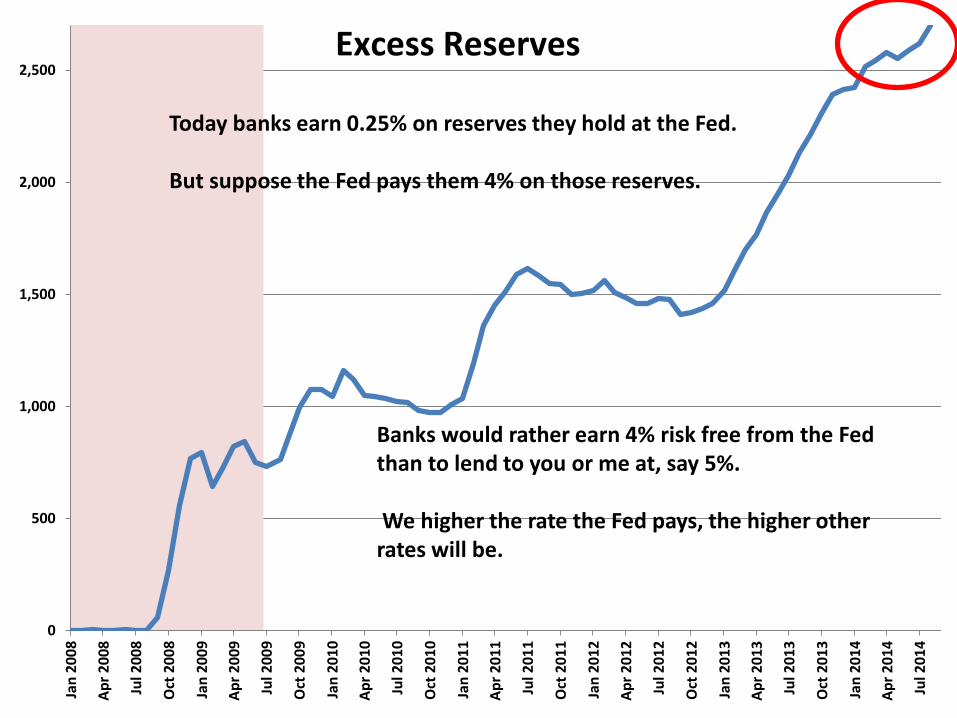
Excess Reserves
Today banks earn 0.25% on reserves they hold at the Fed.
But suppose the Fed pays them 4% on those reserves.
Banks would rather earn 4% risk free from the Fedthan to lend to you or me at, say 5%.
We higher the rate the Fed pays, the higher otherrates will be.
0
500
1,000
1,500
2,000
2,500Ja
n 2
00
8
Ap
r 2
008
Jul 2
00
8
Oct
20
08
Jan
20
09
Ap
r 2
009
Jul 2
00
9
Oct
20
09
Jan
20
10
Ap
r 2
010
Jul 2
01
0
Oct
20
10
Jan
20
11
Ap
r 2
011
Jul 2
01
1
Oct
20
11
Jan
20
12
Ap
r 2
012
Jul 2
01
2
Oct
20
12
Jan
20
13
Ap
r 2
013
Jul 2
01
3
Oct
20
13
Jan
20
14
Ap
r 2
014
Jul 2
01
4
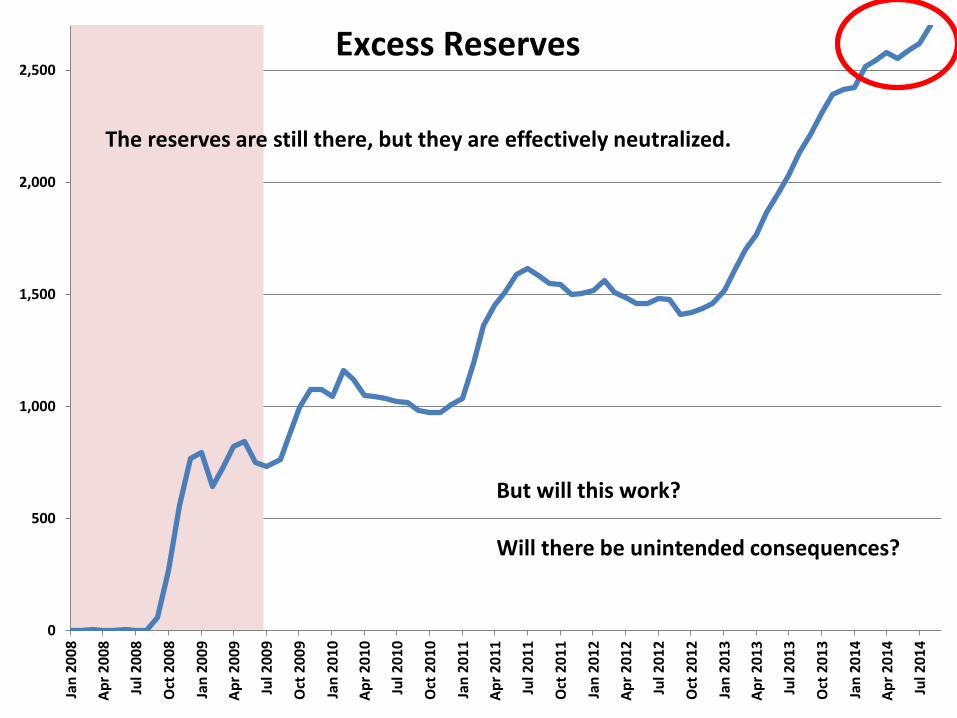
Excess Reserves
The reserves are still there, but they are effectively neutralized.
But will this work?
Will there be unintended consequences?
When Will the Fed Begin to Raise Rates?
3.0
4.0
5.0
6.0
7.0
8.0
9.0
10.0
11.0
12.0
13.0
14.0
15.0
16.0
17.0
18.0
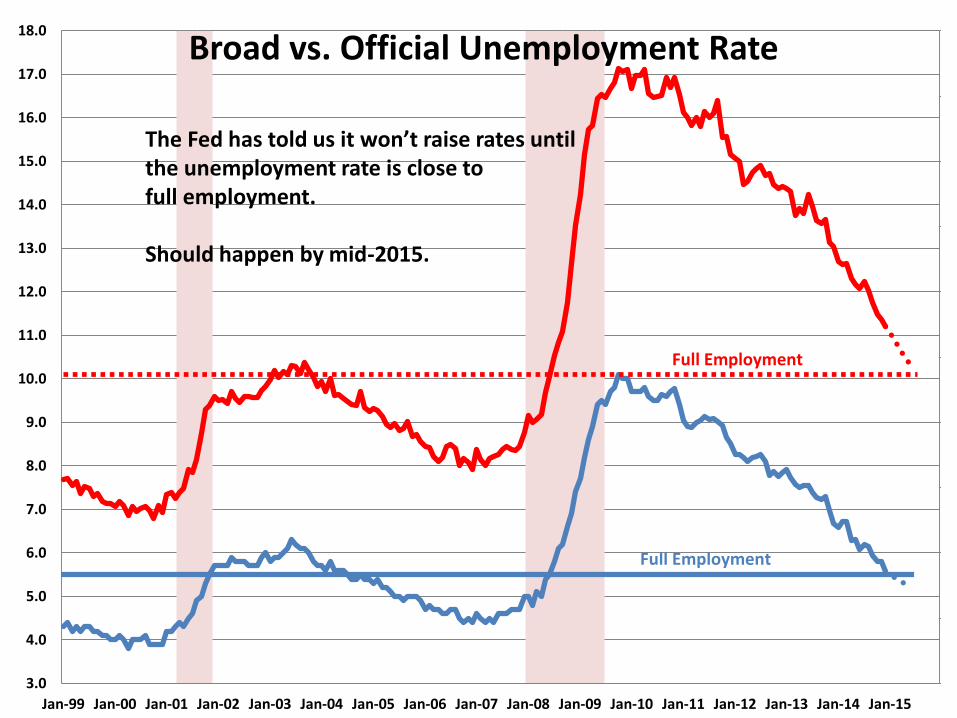
Jan-99 Jan-00 Jan-01 Jan-02 Jan-03 Jan-04 Jan-05 Jan-06 Jan-07 Jan-08 Jan-09 Jan-10 Jan-11 Jan-12 Jan-13 Jan-14 Jan-15
Broad vs. Official Unemployment Rate
Full Employment
Full Employment
The Fed has told us it won’t raise rates untilthe unemployment rate is close to full employment.
Should happen by mid-2015.
-2.0%
-1.0%
0.0%
1.0%
2.0%
3.0%
4.0%
5.0%
6.0%
Jan
20
07
Ap
r 2
007
Jul 2
00
7
Oct
20
07
Jan
20
08
Ap
r 2
008
Jul 2
00
8
Oct
20
08
Jan
20
09
Ap
r 2
009
Jul 2
00
9
Oct
20
09
Jan
20
10
Ap
r 2
010
Jul 2
01
0
Oct
20
10
Jan
20
11
Ap
r 2
011
Jul 2
01
1
Oct
20
11
Jan
20
12
Ap
r 2
012
Jul 2
01
2
Oct
20
12
Jan
20
13
Ap
r 2
013
Jul 2
01
3
Oct
20
13
Jan
20
14
Ap
r 2
014
Jul 2
01
4
Oct
20
14
Jan
20
15
Ap
r 2
015
Jul 2
01
5
Oct
20
15
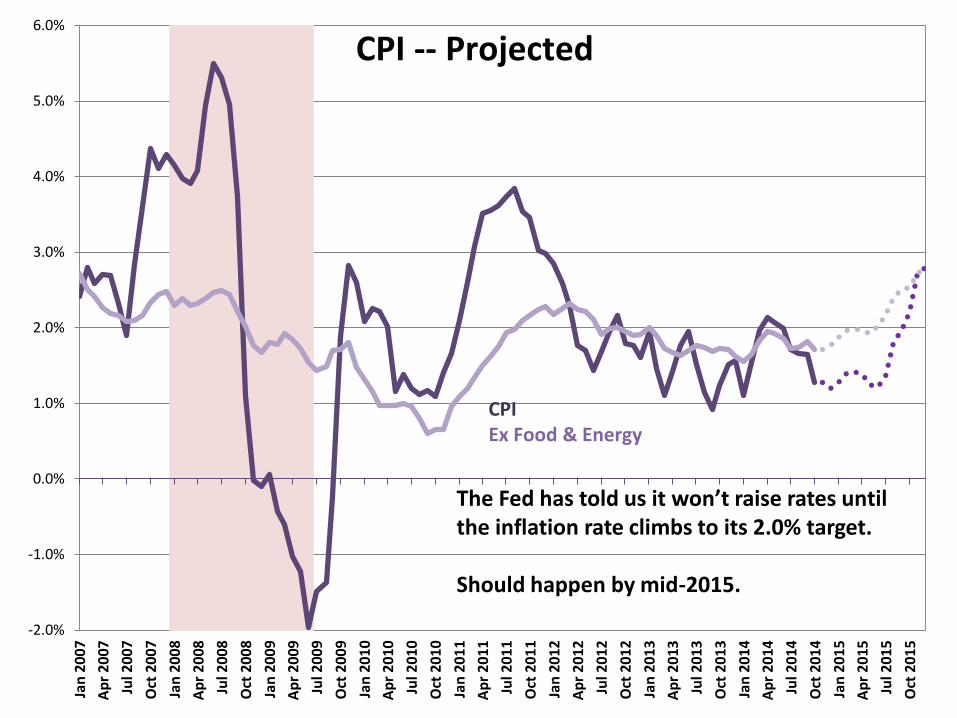
CPIEx Food & Energy
CPI -- Projected
The Fed has told us it won’t raise rates untilthe inflation rate climbs to its 2.0% target.
Should happen by mid-2015.
0
1
2
3
4
5
6
7
8
9
Jan
-90
Jan
-91
Jan
-92
Jan
-93
Jan
-94
Jan
-95
Jan
-96
Jan
-97
Jan
-98
Jan
-99
Jan
-00
Jan
-01
Jan
-02
Jan
-03
Jan
-04
Jan
-05
Jan
-06
Jan
-07
Jan
-08
Jan
-09
Jan
-10
Jan
-11
Jan
-12
Jan
-13
Jan
-14
Jan
-15
Jan
-16
Jan
-17
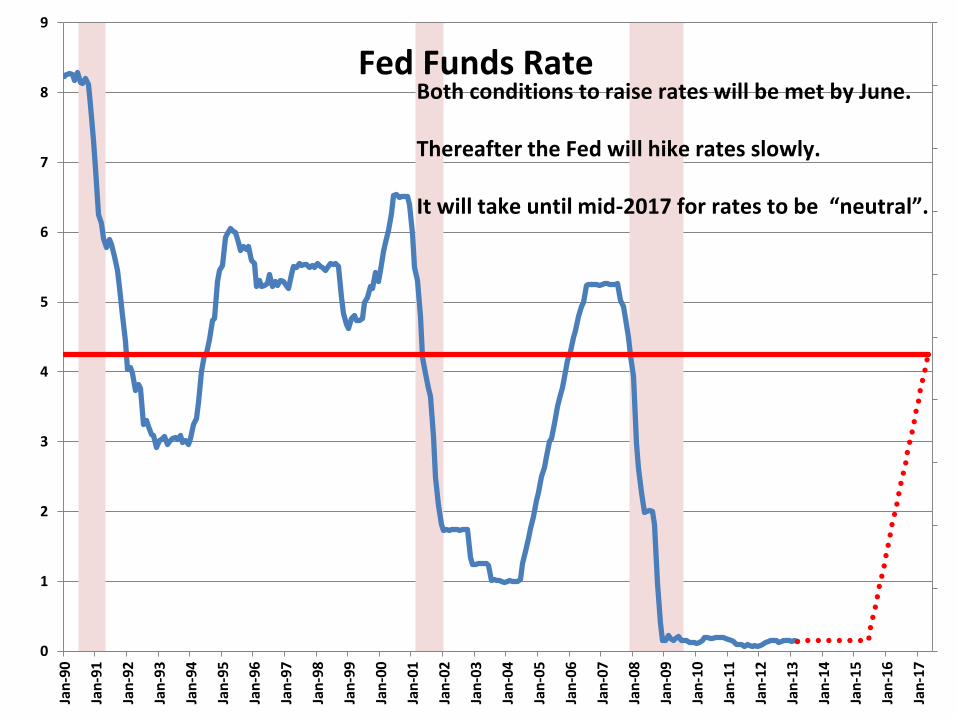
Fed Funds RateBoth conditions to raise rates will be met by June.
Thereafter the Fed will hike rates slowly.
It will take until mid-2017 for rates to be “neutral”.
0.0
5.0
10.0
15.0
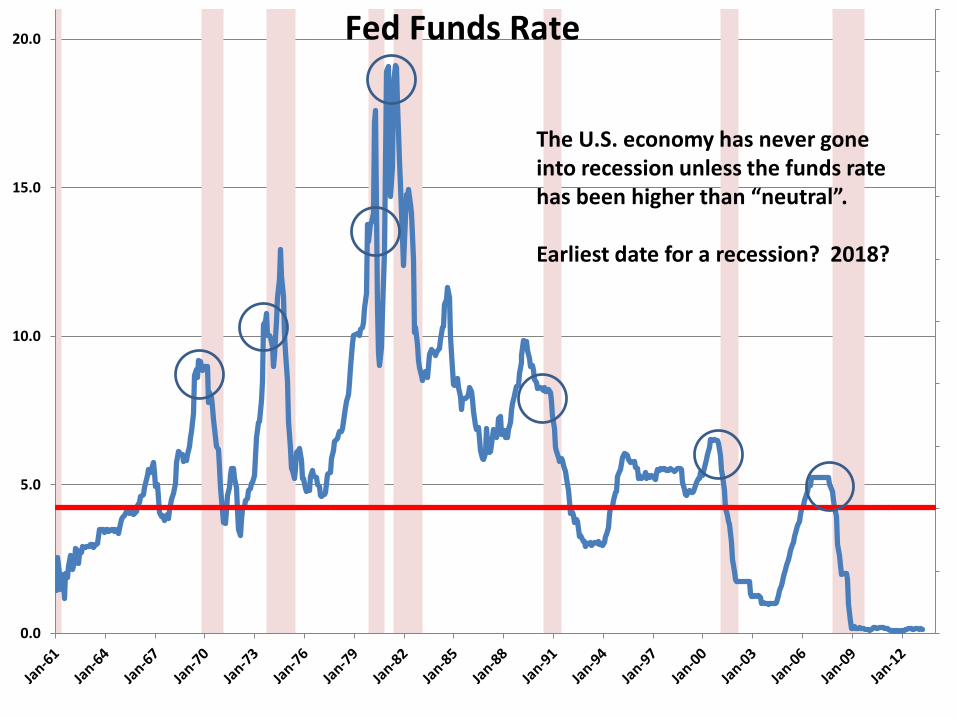
20.0 Fed Funds Rate
The U.S. economy has never goneinto recession unless the funds ratehas been higher than “neutral”.
Earliest date for a recession? 2018?
In Conclusion
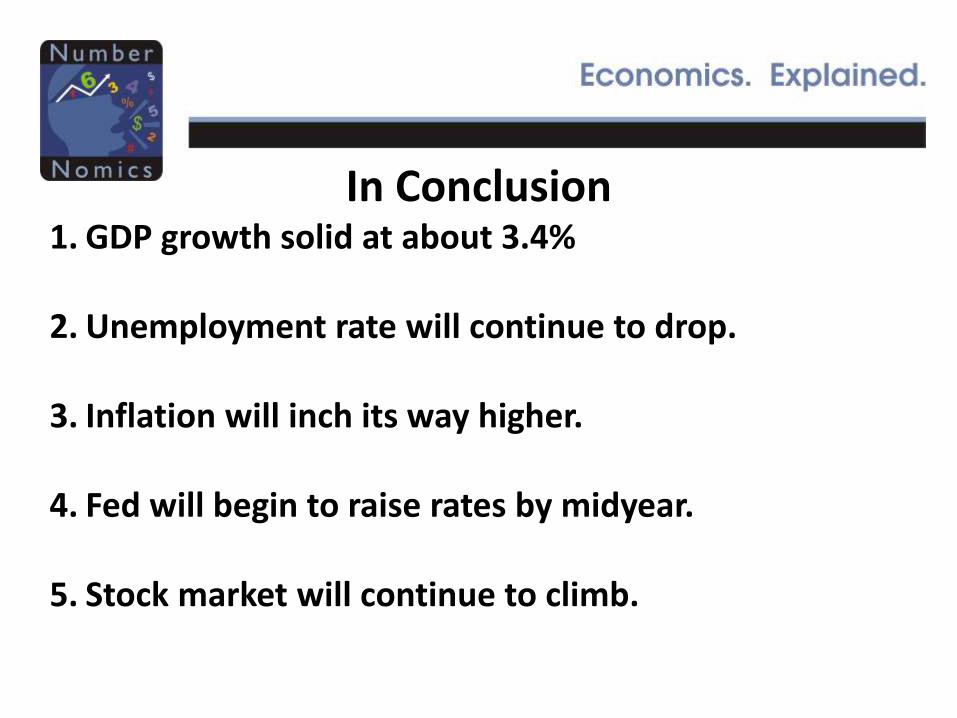
In Conclusion1. GDP growth solid at about 3.4%
In Conclusion1. GDP growth solid at about 3.4%
2. Unemployment rate will continue to drop.
In Conclusion1. GDP growth solid at about 3.4%
2. Unemployment rate will continue to drop.
3. Inflation will inch its way higher.

In Conclusion1. GDP growth solid at about 3.4%
2. Unemployment rate will continue to drop.
3. Inflation will inch its way higher.
4. Fed will begin to raise rates by midyear.
In Conclusion1. GDP growth solid at about 3.4%
2. Unemployment rate will continue to drop.
3. Inflation will inch its way higher.
4. Fed will begin to raise rates by midyear.
5. Stock market will continue to climb.

In Conclusion1. GDP growth solid at about 3.4%
2. Unemployment rate will continue to drop.
3. Inflation will inch its way higher.
4. Fed will begin to raise rates by midyear.
5. Stock market will continue to climb.
6. No recession for at least another three years.
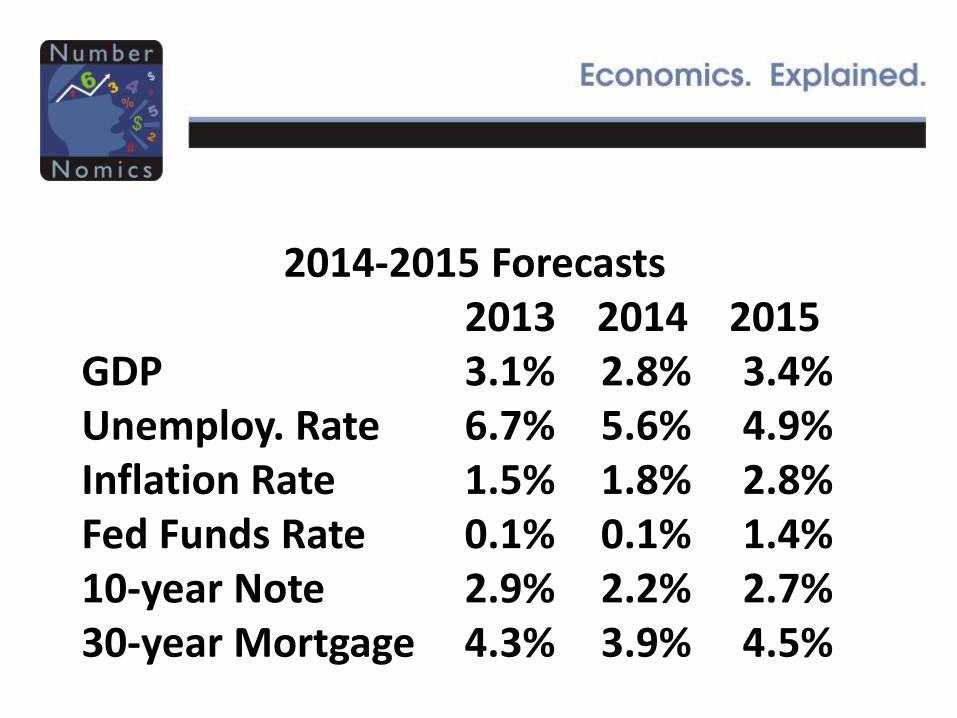
2014-2015 Forecasts2013 2014 2015
GDP 3.1% 2.8% 3.4%Unemploy. Rate 6.7% 5.6% 4.9%Inflation Rate 1.5% 1.8% 2.8%Fed Funds Rate 0.1% 0.1% 1.4%10-year Note 2.9% 2.2% 2.7%30-year Mortgage 4.3% 3.9% 4.5%
But Volatility is Back!
But Volatility is Back!
1. Fed raising rates – 1st time in 8 years.
But Volatility is Back!
1. Fed raising rates – 1st time in 8 years.2. Fed policy is totally different.
But Volatility is Back!
1. Fed raising rates – 1st time in 8 years.2. Fed policy is totally different.3. Fed, Bank of England vs. ECB and BOJ.
But Volatility is Back!
1. Fed raising rates – 1st time in 8 years.2. Fed policy is totally different.3. Fed, Bank of England vs. ECB and BOJ.4. Oil market being transformed.
But Volatility is Back!
1. Fed raising rates – 1st time in 8 years.2. Fed policy is totally different.3. Fed, Bank of England vs. ECB and BOJ.4. Oil market being transformed.
Expect wild swings – stocks, bonds,currencies and commodities
Economy Good, but a Wild Ride!
Stephen SliferNumberNomicswww.NumberNomics.com
Related Documents