1 BOQ PRELIMINARY FINAL REPORT 2014 2014 PRELIMINARY FINAL REPORT BANK OF QUEENSLAND LIMITED ABN 32 009 656 740. AFSL NO. 244616.

Welcome message from author
This document is posted to help you gain knowledge. Please leave a comment to let me know what you think about it! Share it to your friends and learn new things together.
Transcript
1
BOQ PRELIMINARY FINAL REPORT 2014
2014 PRELIMINARY FINAL REPORT
BANK OF QUEENSLAND LIMITED ABN 32 009 656 740. AFSL NO. 244616.

2
Bank of Queensland Limited and its Controlled Entities A.B.N. 32 009 656 740.
THIS PAGE HAS BEEN INTENTIONALLY LEFT BLANK.

3
BOQ PRELIMINARY FINAL REPORT 2014
FINANCIAL INFORMATIONFor the year ended 31 August 2014
TABLE OF CONTENTS Page
Income Statements 4
Statements of Comprehensive Income 5
Balance Sheets 6
Statements of Changes in Equity 7
Statements of Cashflows 11
Notes supporting the financial information
Section 1 Basis of preparation
1.1 Reporting entity 12
1.2 Basis of accounting 12
1.3 Use of estimates and judgements 12
Section 2 Financial performance
2.1 Operating income 13
2.2 Expenses 14
2.3 Income tax expense and deferred tax 15
2.4 Earnings per share 17
2.5 Dividends 18
2.6 Segment reporting 19
Section 3 Capital and balance sheet management
3.1 Cash and liquid assets 21
3.2 Deposits 22
3.3 Financial assets 22
3.4 Loans and advances at amortised cost 23
3.5 Borrowings including subordinated notes 25
3.6 Risk management 26
3.7 Financial instruments 36
3.8 Derivative financial instruments 40
3.9 Capital management 43
3.10 Capital and reserves 44
Section 4 Other assets and liabilities
4.1 Intangible assets 46
4.2 Provisions 48
Section 5 Insurance business
5.1 Insurance business 49
Section 6 Other notes
6.1 Employee benefits 54
6.2 Commitments 55
6.3 Contingent liabilities 56
6.4 Related parties information 56
6.5 Controlled entities 58
6.6 Deed of cross guarantee 61
6.7 Investments in joint arrangements 63
6.8 Auditor’s remuneration 64
6.9 Events subsequent to balance date 64
6.10 Significant accounting policies and new accounting standards 65
Shareholding details 69

4
Bank of Queensland Limited and its Controlled Entities A.B.N. 32 009 656 740.
INCOME STATEMENTS
For the year ended 31 August 2014
Section
Consolidated Bank
2014 $m
2013 $m
2014 $m
2013 $m
Interest income 2.1 2,112.0 2,297.4 2,026.1 2,236.6
Less: Interest expense 2.1 1,351.2 1,604.3 1,437.5 1,711.1
Net interest income 2.1 760.8 693.1 588.6 525.5
Other operating income 2.1 136.2 122.5 233.9 218.8
Net banking operating income 897.0 815.6 822.5 744.3
Premiums from insurance contracts 70.4 70.2 - -
Investment revenue 4.9 5.8 - -
Less: Claims and policyholder liability expense from insurance contracts 33.7 35.7 - -
Net insurance operating income 2.1 41.6 40.3 - -
Total operating income 2.1 938.6 855.9 822.5 744.3
Less: Expenses 2.2 469.4 465.5 421.4 418.9
Less: Impairment on loans and advances 3.4 86.2 114.6 62.8 87.2
Profit before income tax 383.0 275.8 338.3 238.2
Less: Income tax expense 2.3 122.5 90.0 100.7 68.5
Profit for the year 260.5 185.8 237.6 169.7
Profit attributable to:
Equity holders of the parent 260.5 185.8 237.6 169.7
Basic earnings per share - Ordinary shares (cents) 2.4 77.4 57.6
Diluted earnings per share - Ordinary shares (cents) 2.4 75.9 56.5
The income statements should be read in conjunction with the accompanying notes.

5
BOQ PRELIMINARY FINAL REPORT 2014
STATEMENTS OF COMPREHENSIVE INCOME
For the year ended 31 August 2014Consolidated Bank
2014 $m
2013 $m
2014 $m
2013 $m
Profit for the year 260.5 185.8 237.6 169.7
Other comprehensive income, net of income tax
Items that may be reclassified subsequently to profit or loss
Cash flow hedges:
Net (losses) / gains taken to equity (26.9) 11.9 (26.1) (3.1)
Net gains transferred to profit and loss (0.5) (0.9) (0.5) (0.9)
Foreign currency translation differences on foreign operations 0.4 1.6 - -
Net losses on hedge of net investment in foreign operation (0.5) (1.6) - -
Change in fair value of assets available for sale 28.9 (4.2) 28.4 (3.9)
Other comprehensive income / (expense) for the year, net of income tax 1.4 6.8 1.8 (7.9)
Total comprehensive income for the year 261.9 192.6 239.4 161.8
Total comprehensive income attributable to:
Equity holders of the parent 261.9 192.6 239.4 161.8
The statements of comprehensive income should be read in conjunction with the accompanying notes.

6
Bank of Queensland Limited and its Controlled Entities A.B.N. 32 009 656 740.
BALANCE SHEETS
For the year ended 31 August 2014
Section
Consolidated Bank
2014 $m
2013 $m
2014 $m
2013 $m
Assets
Cash and liquid assets 3.1 1,033.6 873.2 397.0 242.2
Due from other financial institutions - Term deposits 92.8 118.5 15.0 23.8
Financial assets available-for-sale 3.3 3,864.4 1,066.8 3,348.9 1,268.4
Financial assets held for trading 3.3 2,473.1 4,334.6 2,473.1 4,334.6
Derivative financial assets 3.8 160.3 260.4 131.9 234.0
Loans and advances at amortised cost 3.4 38,135.5 34,989.3 32,035.2 31,491.2
Other assets 131.4 129.1 242.5 276.7
Shares in controlled entities 6.5 - - 1,527.2 975.7
Property, plant and equipment 53.6 37.8 40.8 26.4
Deferred tax assets 2.3 112.2 104.5 101.3 95.5
Intangible assets 4.1 827.2 592.7 101.5 71.5
Investments in joint arrangements 6.7 20.5 21.4 - -
Total assets 46,904.6 42,528.3 40,414.4 39,040.0
Liabilities
Due to other financial institutions - Accounts payable at call 207.5 201.1 207.5 201.1
Deposits 3.2 35,935.8 31,698.7 34,068.7 31,785.5
Derivative financial liabilities 3.8 248.7 137.4 207.0 109.5
Accounts payable and other liabilities 399.1 362.0 336.4 320.7
Current tax liabilities 71.5 23.0 71.4 23.1
Provisions 4.2 104.1 78.9 88.2 68.7
Insurance policy liabilities 5.1 63.0 72.5 - -
Borrowings including subordinated notes 3.5 6,534.4 7,136.9 947.9 1,312.8
Amounts due to controlled entities - - 1,224.1 2,457.5
Total liabilities 43,564.1 39,710.5 37,151.2 36,278.9
Net assets 3,340.5 2,817.8 3,263.2 2,761.1
Equity
Issued capital 3,020.6 2,562.6 3,024.1 2,564.2
Reserves 114.4 111.1 99.0 95.3
Retained profits 205.5 144.1 140.1 101.6
Total Equity 3,340.5 2,817.8 3,263.2 2,761.1
The balance sheets should be read in conjunction with the accompanying notes.
7
BOQ PRELIMINARY FINAL REPORT 2014
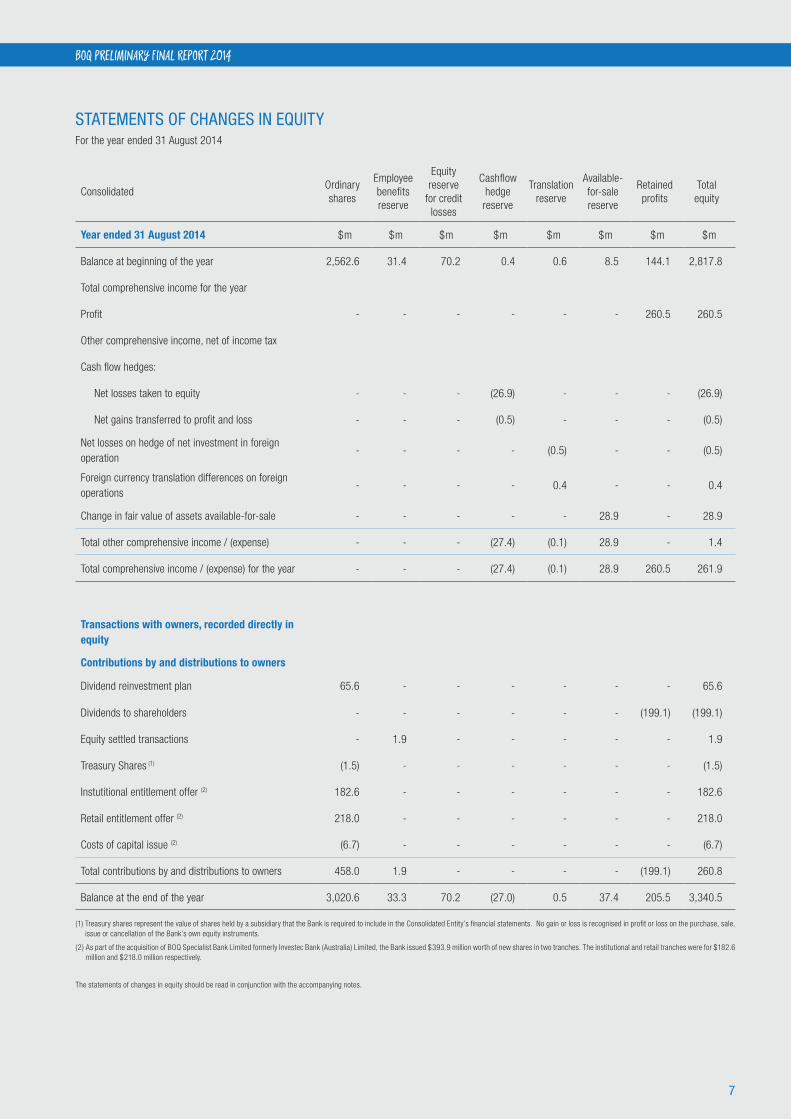
STATEMENTS OF CHANGES IN EQUITYFor the year ended 31 August 2014
ConsolidatedOrdinary shares
Employee benefits reserve
Equity reserve
for credit losses
Cashflow hedge reserve
Translation reserve
Available-for-sale reserve
Retained profits
Total equity
Year ended 31 August 2014 $m $m $m $m $m $m $m $m
Balance at beginning of the year 2,562.6 31.4 70.2 0.4 0.6 8.5 144.1 2,817.8
Total comprehensive income for the year
Profit - - - - - - 260.5 260.5
Other comprehensive income, net of income tax
Cash flow hedges:
Net losses taken to equity - - - (26.9) - - - (26.9)
Net gains transferred to profit and loss - - - (0.5) - - - (0.5)
Net losses on hedge of net investment in foreign operation
- - - - (0.5) - - (0.5)
Foreign currency translation differences on foreign operations
- - - - 0.4 - - 0.4
Change in fair value of assets available-for-sale - - - - - 28.9 - 28.9
Total other comprehensive income / (expense) - - - (27.4) (0.1) 28.9 - 1.4
Total comprehensive income / (expense) for the year - - - (27.4) (0.1) 28.9 260.5 261.9
Transactions with owners, recorded directly in equity
Contributions by and distributions to owners
Dividend reinvestment plan 65.6 - - - - - - 65.6
Dividends to shareholders - - - - - - (199.1) (199.1)
Equity settled transactions - 1.9 - - - - - 1.9
Treasury Shares (1) (1.5) - - - - - - (1.5)
Instutitional entitlement offer (2) 182.6 - - - - - - 182.6
Retail entitlement offer (2) 218.0 - - - - - - 218.0
Costs of capital issue (2) (6.7) - - - - - - (6.7)
Total contributions by and distributions to owners 458.0 1.9 - - - - (199.1) 260.8
Balance at the end of the year 3,020.6 33.3 70.2 (27.0) 0.5 37.4 205.5 3,340.5
(1) Treasury shares represent the value of shares held by a subsidiary that the Bank is required to include in the Consolidated Entity’s financial statements. No gain or loss is recognised in profit or loss on the purchase, sale, issue or cancellation of the Bank’s own equity instruments.
(2) As part of the acquisition of BOQ Specialist Bank Limited formerly Investec Bank (Australia) Limited, the Bank issued $393.9 million worth of new shares in two tranches. The institutional and retail tranches were for $182.6 million and $218.0 million respectively.
The statements of changes in equity should be read in conjunction with the accompanying notes.
8
Bank of Queensland Limited and its Controlled Entities A.B.N. 32 009 656 740.
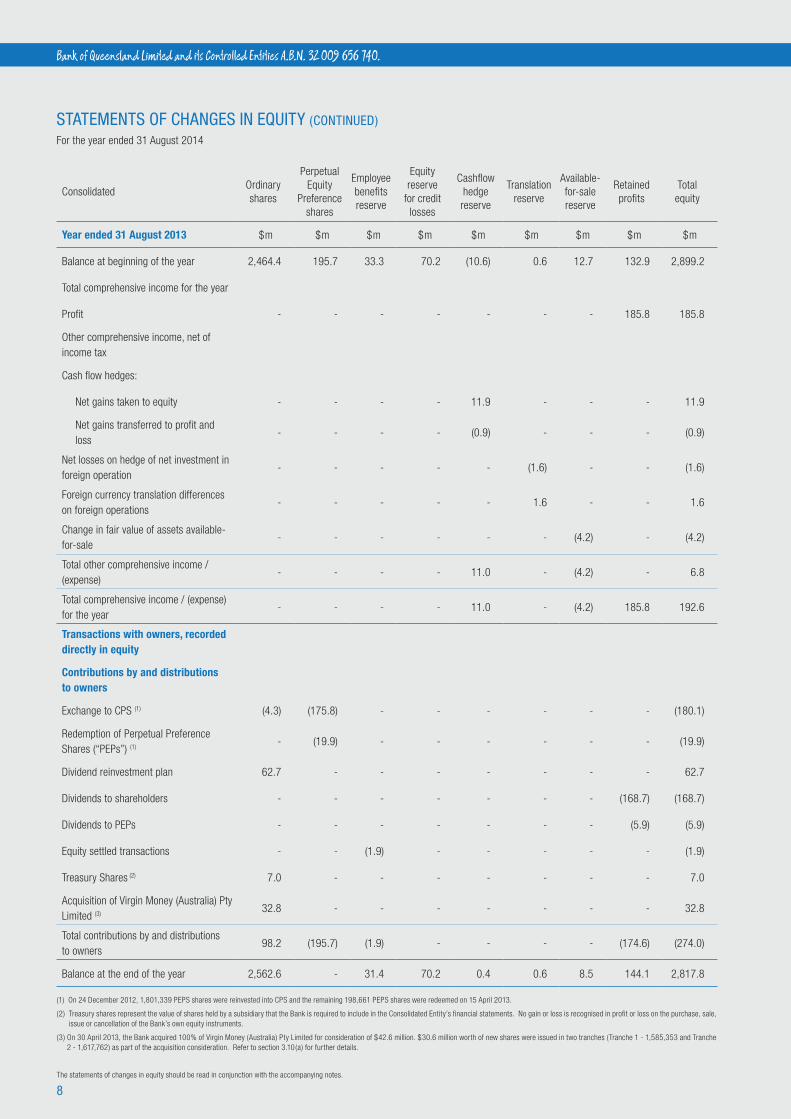
STATEMENTS OF CHANGES IN EQUITY (CONTINUED)
For the year ended 31 August 2014
ConsolidatedOrdinary shares
Perpetual Equity
Preference shares
Employee benefits reserve
Equity reserve
for credit losses
Cashflow hedge reserve
Translation reserve
Available-for-sale reserve
Retained profits
Total equity
Year ended 31 August 2013 $m $m $m $m $m $m $m $m $m
Balance at beginning of the year 2,464.4 195.7 33.3 70.2 (10.6) 0.6 12.7 132.9 2,899.2
Total comprehensive income for the year
Profit - - - - - - - 185.8 185.8
Other comprehensive income, net of income tax
Cash flow hedges:
Net gains taken to equity - - - - 11.9 - - - 11.9
Net gains transferred to profit and loss
- - - - (0.9) - - - (0.9)
Net losses on hedge of net investment in foreign operation
- - - - - (1.6) - - (1.6)
Foreign currency translation differences on foreign operations
- - - - - 1.6 - - 1.6
Change in fair value of assets available-for-sale
- - - - - - (4.2) - (4.2)
Total other comprehensive income / (expense)
- - - - 11.0 - (4.2) - 6.8
Total comprehensive income / (expense) for the year
- - - - 11.0 - (4.2) 185.8 192.6
Transactions with owners, recorded directly in equity
Contributions by and distributions to owners
Exchange to CPS (1) (4.3) (175.8) - - - - - - (180.1)
Redemption of Perpetual Preference Shares (“PEPs”) (1)
- (19.9) - - - - - - (19.9)
Dividend reinvestment plan 62.7 - - - - - - - 62.7
Dividends to shareholders - - - - - - - (168.7) (168.7)
Dividends to PEPs - - - - - - - (5.9) (5.9)
Equity settled transactions - - (1.9) - - - - - (1.9)
Treasury Shares (2) 7.0 - - - - - - - 7.0
Acquisition of Virgin Money (Australia) Pty Limited (3)
32.8 - - - - - - - 32.8
Total contributions by and distributions to owners
98.2 (195.7) (1.9) - - - - (174.6) (274.0)
Balance at the end of the year 2,562.6 - 31.4 70.2 0.4 0.6 8.5 144.1 2,817.8
(1) On 24 December 2012, 1,801,339 PEPS shares were reinvested into CPS and the remaining 198,661 PEPS shares were redeemed on 15 April 2013.
(2) Treasury shares represent the value of shares held by a subsidiary that the Bank is required to include in the Consolidated Entity’s financial statements. No gain or loss is recognised in profit or loss on the purchase, sale, issue or cancellation of the Bank’s own equity instruments.
(3) On 30 April 2013, the Bank acquired 100% of Virgin Money (Australia) Pty Limited for consideration of $42.6 million. $30.6 million worth of new shares were issued in two tranches (Tranche 1 - 1,585,353 and Tranche 2 - 1,617,762) as part of the acquisition consideration. Refer to section 3.10(a) for further details.
The statements of changes in equity should be read in conjunction with the accompanying notes.
9
BOQ PRELIMINARY FINAL REPORT 2014
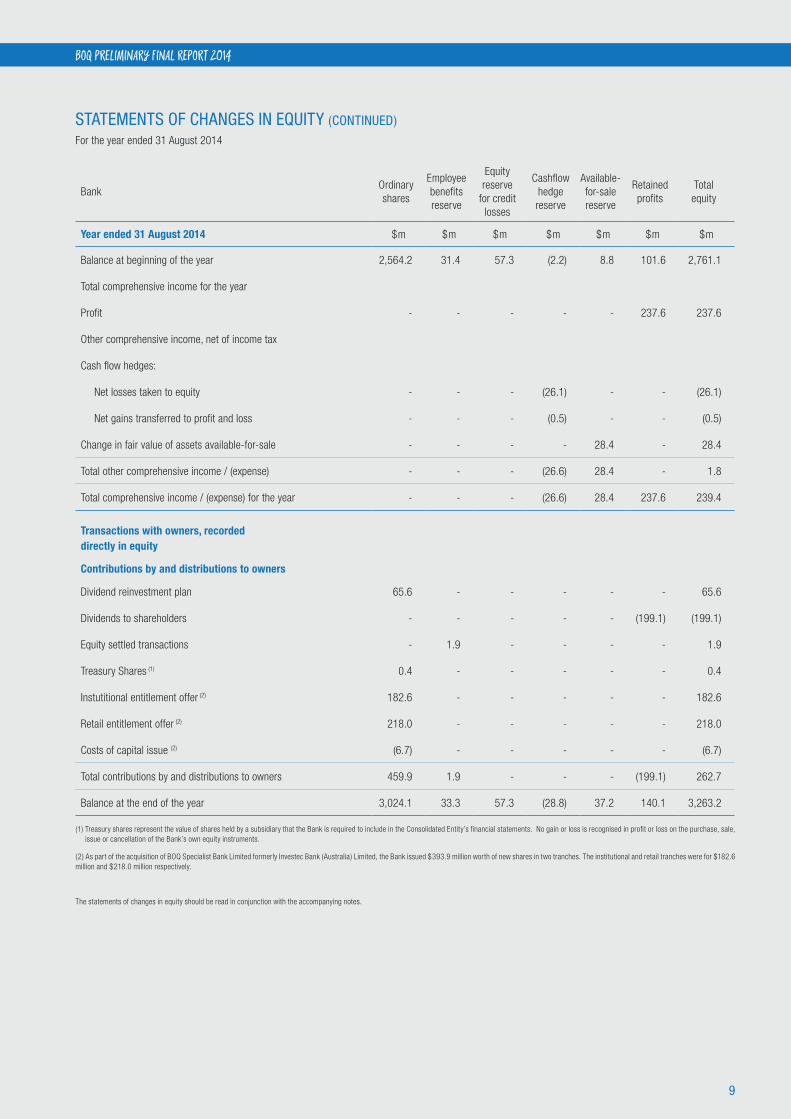
STATEMENTS OF CHANGES IN EQUITY (CONTINUED)
For the year ended 31 August 2014
BankOrdinary shares
Employee benefits reserve
Equity reserve
for credit losses
Cashflow hedge reserve
Available-for-sale reserve
Retained profits
Total equity
Year ended 31 August 2014 $m $m $m $m $m $m $m
Balance at beginning of the year 2,564.2 31.4 57.3 (2.2) 8.8 101.6 2,761.1
Total comprehensive income for the year
Profit - - - - - 237.6 237.6
Other comprehensive income, net of income tax
Cash flow hedges:
Net losses taken to equity - - - (26.1) - - (26.1)
Net gains transferred to profit and loss - - - (0.5) - - (0.5)
Change in fair value of assets available-for-sale - - - - 28.4 - 28.4
Total other comprehensive income / (expense) - - - (26.6) 28.4 - 1.8
Total comprehensive income / (expense) for the year - - - (26.6) 28.4 237.6 239.4
Transactions with owners, recorded directly in equity
Contributions by and distributions to owners
Dividend reinvestment plan 65.6 - - - - - 65.6
Dividends to shareholders - - - - - (199.1) (199.1)
Equity settled transactions - 1.9 - - - - 1.9
Treasury Shares (1) 0.4 - - - - - 0.4
Instutitional entitlement offer (2) 182.6 - - - - - 182.6
Retail entitlement offer (2) 218.0 - - - - - 218.0
Costs of capital issue (2) (6.7) - - - - - (6.7)
Total contributions by and distributions to owners 459.9 1.9 - - - (199.1) 262.7
Balance at the end of the year 3,024.1 33.3 57.3 (28.8) 37.2 140.1 3,263.2
(1) Treasury shares represent the value of shares held by a subsidiary that the Bank is required to include in the Consolidated Entity’s financial statements. No gain or loss is recognised in profit or loss on the purchase, sale, issue or cancellation of the Bank’s own equity instruments.
(2) As part of the acquisition of BOQ Specialist Bank Limited formerly Investec Bank (Australia) Limited, the Bank issued $393.9 million worth of new shares in two tranches. The institutional and retail tranches were for $182.6 million and $218.0 million respectively.
The statements of changes in equity should be read in conjunction with the accompanying notes.
10
Bank of Queensland Limited and its Controlled Entities A.B.N. 32 009 656 740.
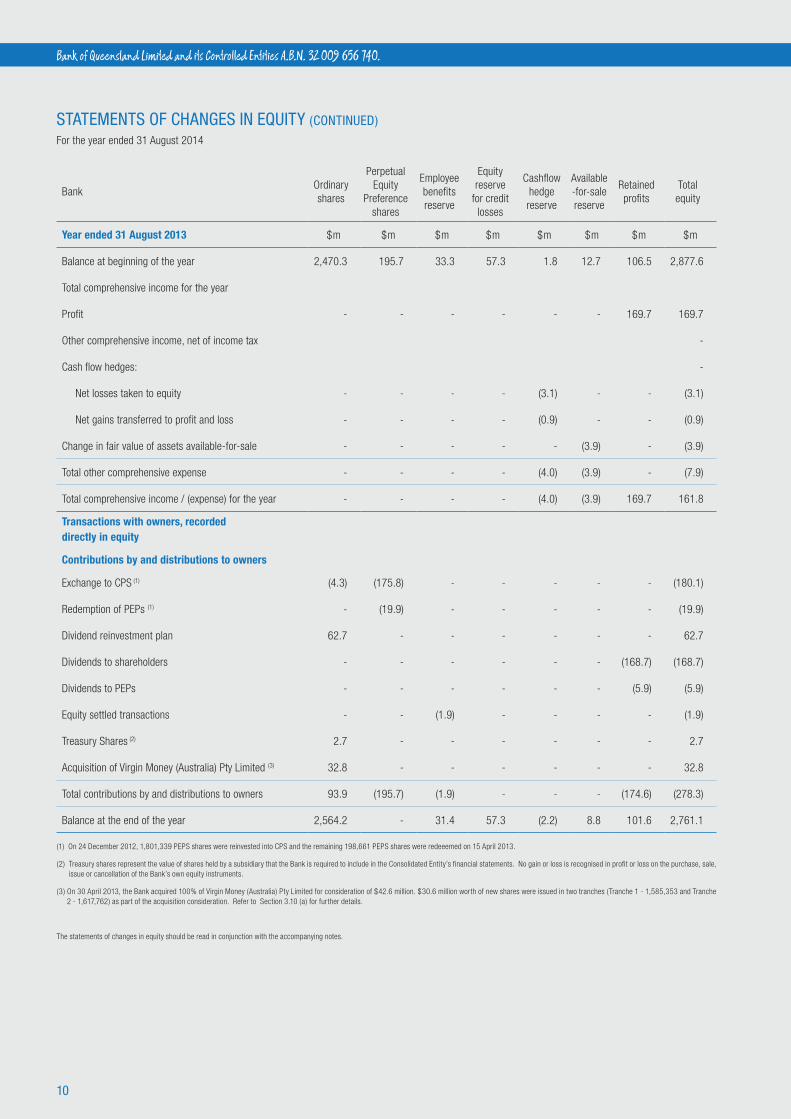
STATEMENTS OF CHANGES IN EQUITY (CONTINUED)
For the year ended 31 August 2014
BankOrdinary shares
Perpetual Equity
Preference shares
Employee benefits reserve
Equity reserve
for credit losses
Cashflow hedge reserve
Available -for-sale reserve
Retained profits
Total equity
Year ended 31 August 2013 $m $m $m $m $m $m $m $m
Balance at beginning of the year 2,470.3 195.7 33.3 57.3 1.8 12.7 106.5 2,877.6
Total comprehensive income for the year
Profit - - - - - - 169.7 169.7
Other comprehensive income, net of income tax -
Cash flow hedges: -
Net losses taken to equity - - - - (3.1) - - (3.1)
Net gains transferred to profit and loss - - - - (0.9) - - (0.9)
Change in fair value of assets available-for-sale - - - - - (3.9) - (3.9)
Total other comprehensive expense - - - - (4.0) (3.9) - (7.9)
Total comprehensive income / (expense) for the year - - - - (4.0) (3.9) 169.7 161.8
Transactions with owners, recorded directly in equity
Contributions by and distributions to owners
Exchange to CPS (1) (4.3) (175.8) - - - - - (180.1)
Redemption of PEPs (1) - (19.9) - - - - - (19.9)
Dividend reinvestment plan 62.7 - - - - - - 62.7
Dividends to shareholders - - - - - - (168.7) (168.7)
Dividends to PEPs - - - - - - (5.9) (5.9)
Equity settled transactions - - (1.9) - - - - (1.9)
Treasury Shares (2) 2.7 - - - - - - 2.7
Acquisition of Virgin Money (Australia) Pty Limited (3) 32.8 - - - - - - 32.8
Total contributions by and distributions to owners 93.9 (195.7) (1.9) - - - (174.6) (278.3)
Balance at the end of the year 2,564.2 - 31.4 57.3 (2.2) 8.8 101.6 2,761.1
(1) On 24 December 2012, 1,801,339 PEPS shares were reinvested into CPS and the remaining 198,661 PEPS shares were redeeemed on 15 April 2013.
(2) Treasury shares represent the value of shares held by a subsidiary that the Bank is required to include in the Consolidated Entity’s financial statements. No gain or loss is recognised in profit or loss on the purchase, sale, issue or cancellation of the Bank’s own equity instruments.
(3) On 30 April 2013, the Bank acquired 100% of Virgin Money (Australia) Pty Limited for consideration of $42.6 million. $30.6 million worth of new shares were issued in two tranches (Tranche 1 - 1,585,353 and Tranche 2 - 1,617,762) as part of the acquisition consideration. Refer to Section 3.10 (a) for further details.
The statements of changes in equity should be read in conjunction with the accompanying notes.
11
BOQ PRELIMINARY FINAL REPORT 2014
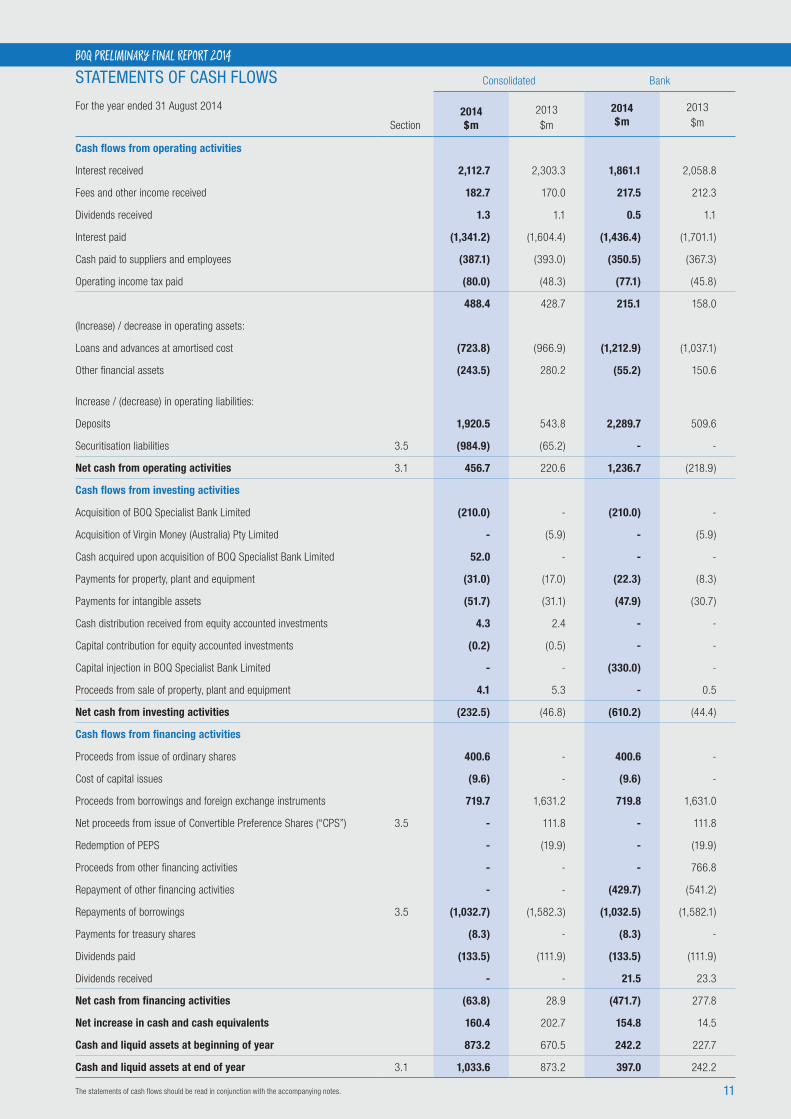
STATEMENTS OF CASH FLOWS
For the year ended 31 August 2014
Section
Consolidated Bank
2014 $m
2013 $m
2014 $m
2013 $m
Cash flows from operating activities
Interest received 2,112.7 2,303.3 1,861.1 2,058.8
Fees and other income received 182.7 170.0 217.5 212.3
Dividends received 1.3 1.1 0.5 1.1
Interest paid (1,341.2) (1,604.4) (1,436.4) (1,701.1)
Cash paid to suppliers and employees (387.1) (393.0) (350.5) (367.3)
Operating income tax paid (80.0) (48.3) (77.1) (45.8)
488.4 428.7 215.1 158.0
(Increase) / decrease in operating assets:
Loans and advances at amortised cost (723.8) (966.9) (1,212.9) (1,037.1)
Other financial assets (243.5) 280.2 (55.2) 150.6
Increase / (decrease) in operating liabilities:
Deposits 1,920.5 543.8 2,289.7 509.6
Securitisation liabilities 3.5 (984.9) (65.2) - -
Net cash from operating activities 3.1 456.7 220.6 1,236.7 (218.9)
Cash flows from investing activities
Acquisition of BOQ Specialist Bank Limited (210.0) - (210.0) -
Acquisition of Virgin Money (Australia) Pty Limited - (5.9) - (5.9)
Cash acquired upon acquisition of BOQ Specialist Bank Limited 52.0 - - -
Payments for property, plant and equipment (31.0) (17.0) (22.3) (8.3)
Payments for intangible assets (51.7) (31.1) (47.9) (30.7)
Cash distribution received from equity accounted investments 4.3 2.4 - -
Capital contribution for equity accounted investments (0.2) (0.5) - -
Capital injection in BOQ Specialist Bank Limited - - (330.0) -
Proceeds from sale of property, plant and equipment 4.1 5.3 - 0.5
Net cash from investing activities (232.5) (46.8) (610.2) (44.4)
Cash flows from financing activities
Proceeds from issue of ordinary shares 400.6 - 400.6 -
Cost of capital issues (9.6) - (9.6) -
Proceeds from borrowings and foreign exchange instruments 719.7 1,631.2 719.8 1,631.0
Net proceeds from issue of Convertible Preference Shares (“CPS”) 3.5 - 111.8 - 111.8
Redemption of PEPS - (19.9) - (19.9)
Proceeds from other financing activities - - - 766.8
Repayment of other financing activities - - (429.7) (541.2)
Repayments of borrowings 3.5 (1,032.7) (1,582.3) (1,032.5) (1,582.1)
Payments for treasury shares (8.3) - (8.3) -
Dividends paid (133.5) (111.9) (133.5) (111.9)
Dividends received - - 21.5 23.3
Net cash from financing activities (63.8) 28.9 (471.7) 277.8
Net increase in cash and cash equivalents 160.4 202.7 154.8 14.5
Cash and liquid assets at beginning of year 873.2 670.5 242.2 227.7
Cash and liquid assets at end of year 3.1 1,033.6 873.2 397.0 242.2
The statements of cash flows should be read in conjunction with the accompanying notes.

12
Bank of Queensland Limited and its Controlled Entities A.B.N. 32 009 656 740.
NOTES TO THE FINANCIAL STATEMENTSFor the year ended 31 August 2014
SECTION 1. BASIS OF PREPARATION
1.1. REPORTING ENTITYBank of Queensland Limited (the “Bank”) is a company domiciled in Australia. The address of the Bank’s registered office is Level 17, 259 Queen Street, Brisbane, QLD, 4000 (+61 7 3336 2420). The consolidated financial report of the Bank for the financial year ended 31 August 2014 comprises the Bank and its subsidiaries (together referred to as the “Consolidated Entity”) and the Consolidated Entity’s interest in equity accounted investments. The Bank is a for-profit entity primarily involved in retail banking, leasing finance and insurance products.
1.2. BASIS OF ACCOUNTING
(a) Statement of compliance These general purpose financial statements have been prepared in accordance with Australian Accounting Standards and interpretations issued by the Australian Accounting Standards Board (“AASB”) and the Corporations Act 2001. The consolidated financial statements and notes thereto also comply with International Financial Reporting Standards (“IFRS”) as issued by the International Accounting Standards Board (“IASB”). The consolidated financial report was authorised for issue by the Directors on 8 October 2014.
(b) Basis of measurement The financial report is prepared on the historical cost basis with the exception of the following assets and liabilities which are stated at their fair value:
• derivative financial instruments;
• financial instruments designated at fair value;
• financial instruments classified as available-for-sale;
• assets and liabilities acquired through business combinations; and
• insurance policy liabilities.
(c) Functional and presentation currency The consolidated financial statements are presented in Australian dollars, which is the Bank’s functional currency.
(d) Rounding The Consolidated Entity is of a kind referred to in ASIC Class Order 98/100 dated 10 July 1998 and in accordance with that Class Order, amounts in this financial report and Directors’ report have been rounded off to the nearest million dollars, unless otherwise stated.
1.3. USE OF ESTIMATES AND JUDGEMENTS The preparation of a financial report in conformity with Australian Accounting Standards requires management to make judgements, estimates and assumptions that affect the application of policies and reported amounts of assets, liabilities, income and expenses. These estimates and associated assumptions are based on historical experience and various other factors that are believed to be reasonable under the circumstances, the results of which form the basis of making the judgements about carrying values of assets and liabilities that are not readily apparent from other sources. Actual results may differ from these estimates. These accounting policies have been consistently applied by each entity in the Consolidated Entity.
The estimates and underlying assumptions are reviewed on an ongoing basis. Revisions to accounting estimates are recognised in the period in
which the estimates are revised if the revision only affects that period, or
in the period of the revision and future periods if the revision affects both
current and future periods.
Information about significant areas of estimation uncertainty and critical
judgements in applying accounting policies that have the most significant
effect on the amounts recognised in the financial statements are described
below:
• Provisions for impairment – Section 3.4;
• Financial instruments - Section 3.7;
• Intangible assets - Section 4.1;
• Provisions - Section 4.2;
• Insurance policy liabilities – Section 5.1; and
• Contingent liabilities – Section 6.3.
13
BOQ PRELIMINARY FINAL REPORT 2014
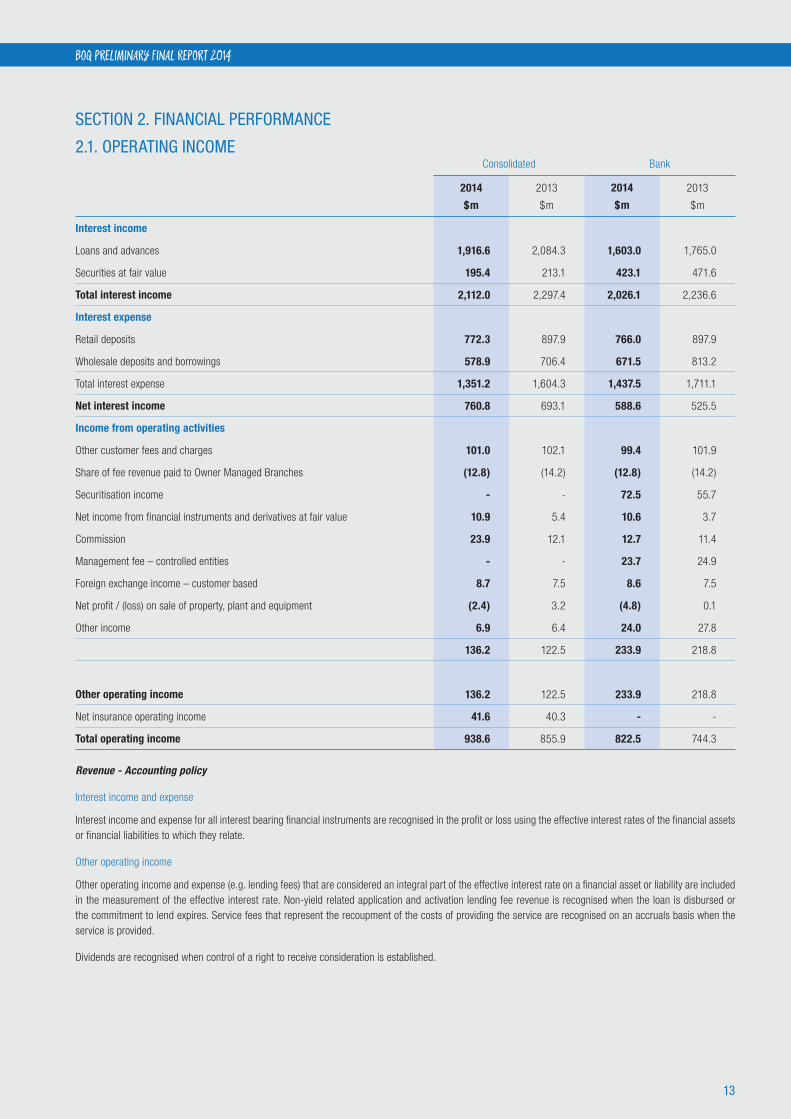
SECTION 2. FINANCIAL PERFORMANCE
2.1. OPERATING INCOME Consolidated Bank
2014
$m
2013
$m
2014
$m
2013
$m
Interest income
Loans and advances 1,916.6 2,084.3 1,603.0 1,765.0
Securities at fair value 195.4 213.1 423.1 471.6
Total interest income 2,112.0 2,297.4 2,026.1 2,236.6
Interest expense
Retail deposits 772.3 897.9 766.0 897.9
Wholesale deposits and borrowings 578.9 706.4 671.5 813.2
Total interest expense 1,351.2 1,604.3 1,437.5 1,711.1
Net interest income 760.8 693.1 588.6 525.5
Income from operating activities
Other customer fees and charges 101.0 102.1 99.4 101.9
Share of fee revenue paid to Owner Managed Branches (12.8) (14.2) (12.8) (14.2)
Securitisation income - - 72.5 55.7
Net income from financial instruments and derivatives at fair value 10.9 5.4 10.6 3.7
Commission 23.9 12.1 12.7 11.4
Management fee – controlled entities - - 23.7 24.9
Foreign exchange income – customer based 8.7 7.5 8.6 7.5
Net profit / (loss) on sale of property, plant and equipment (2.4) 3.2 (4.8) 0.1
Other income 6.9 6.4 24.0 27.8
136.2 122.5 233.9 218.8
Other operating income 136.2 122.5 233.9 218.8
Net insurance operating income 41.6 40.3 - -
Total operating income 938.6 855.9 822.5 744.3
Revenue - Accounting policy
Interest income and expense
Interest income and expense for all interest bearing financial instruments are recognised in the profit or loss using the effective interest rates of the financial assets or financial liabilities to which they relate.
Other operating income
Other operating income and expense (e.g. lending fees) that are considered an integral part of the effective interest rate on a financial asset or liability are included in the measurement of the effective interest rate. Non-yield related application and activation lending fee revenue is recognised when the loan is disbursed or the commitment to lend expires. Service fees that represent the recoupment of the costs of providing the service are recognised on an accruals basis when the service is provided.
Dividends are recognised when control of a right to receive consideration is established.
14
Bank of Queensland Limited and its Controlled Entities A.B.N. 32 009 656 740.
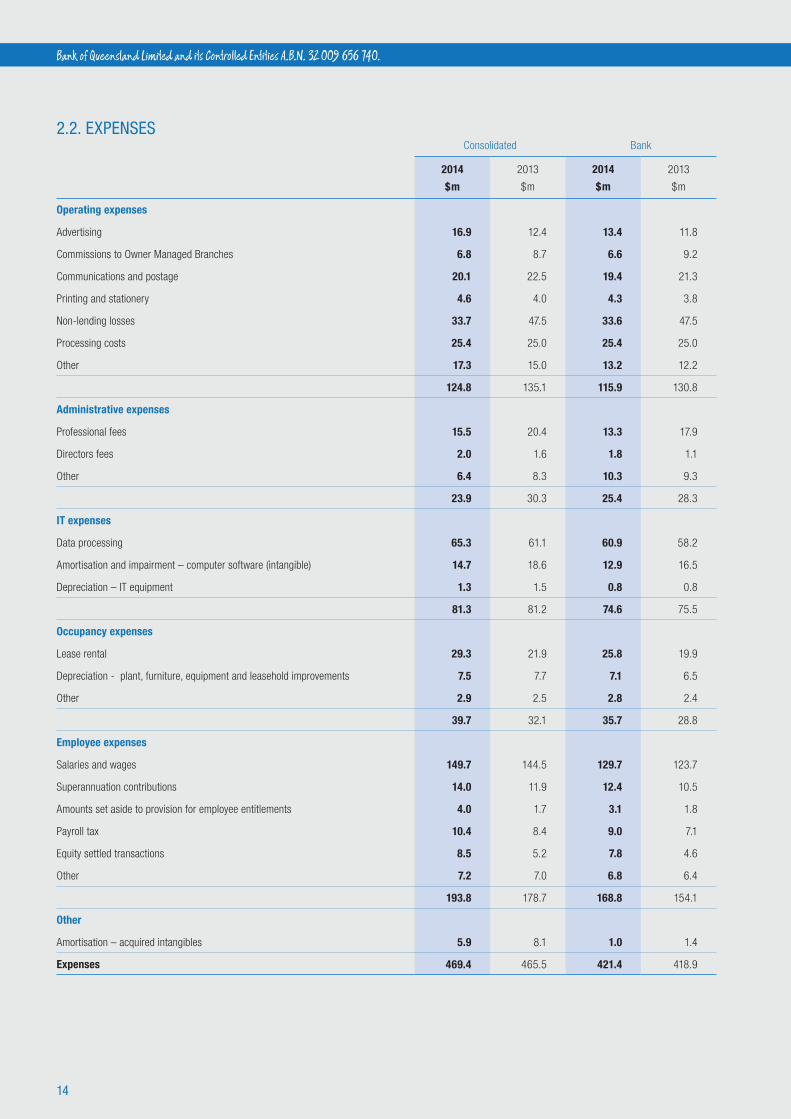
2.2. EXPENSESConsolidated Bank
2014
$m
2013
$m
2014
$m
2013
$m
Operating expenses
Advertising 16.9 12.4 13.4 11.8
Commissions to Owner Managed Branches 6.8 8.7 6.6 9.2
Communications and postage 20.1 22.5 19.4 21.3
Printing and stationery 4.6 4.0 4.3 3.8
Non-lending losses 33.7 47.5 33.6 47.5
Processing costs 25.4 25.0 25.4 25.0
Other 17.3 15.0 13.2 12.2
124.8 135.1 115.9 130.8
Administrative expenses
Professional fees 15.5 20.4 13.3 17.9
Directors fees 2.0 1.6 1.8 1.1
Other 6.4 8.3 10.3 9.3
23.9 30.3 25.4 28.3
IT expenses
Data processing 65.3 61.1 60.9 58.2
Amortisation and impairment – computer software (intangible) 14.7 18.6 12.9 16.5
Depreciation – IT equipment 1.3 1.5 0.8 0.8
81.3 81.2 74.6 75.5
Occupancy expenses
Lease rental 29.3 21.9 25.8 19.9
Depreciation - plant, furniture, equipment and leasehold improvements 7.5 7.7 7.1 6.5
Other 2.9 2.5 2.8 2.4
39.7 32.1 35.7 28.8
Employee expenses
Salaries and wages 149.7 144.5 129.7 123.7
Superannuation contributions 14.0 11.9 12.4 10.5
Amounts set aside to provision for employee entitlements 4.0 1.7 3.1 1.8
Payroll tax 10.4 8.4 9.0 7.1
Equity settled transactions 8.5 5.2 7.8 4.6
Other 7.2 7.0 6.8 6.4
193.8 178.7 168.8 154.1
Other
Amortisation – acquired intangibles 5.9 8.1 1.0 1.4
Expenses 469.4 465.5 421.4 418.9

15
BOQ PRELIMINARY FINAL REPORT 2014
2.3. INCOME TAX EXPENSE AND DEFERRED TAX
Income tax expense
The major components of income tax expense for the years ended 31 August 2014 and 2013 along with a reconciliation between pre-tax profit and tax expense are detailed below:
Consolidated Bank
2014
$m
2013
$m
2014
$m
2013
$m
Current tax expense
Current year 140.4 75.3 112.0 58.0
Adjustments for prior years (8.4) (3.2) (5.9) (1.8)
132.0 72.1 106.1 56.2
Deferred tax expense
Origination and reversal of temporary differences (9.5) 17.9 (5.4) 12.3
(9.5) 17.9 (5.4) 12.3
Total income tax expense 122.5 90.0 100.7 68.5
Attributable to:
Continuing operations 122.5 90.0 100.7 68.5
Deferred tax recognised in equity
Equity raising costs (2.9) - (2.9) -
Cash flow hedge reserve (8.9) 5.1 (9.5) (1.3)
Other 11.3 (1.8) 12.2 (1.7)
(0.5) 3.3 (0.2) (3.0)
Numerical reconciliations between tax expense and pre-tax profit
Profit before tax – continuing operations 383.0 275.8 338.3 238.2
Profit before tax 383.0 275.8 338.3 238.2
Income tax using the domestic corporate tax rate of 30% (2013: 30%) 114.9 82.7 101.5 71.5
Increase in income tax expense due to:
Non-deductible expenses 9.5 8.3 6.6 4.8
Decrease in income tax expense due to:
Other (1) (0.9) (0.4) (6.4) (7.3)
123.5 90.6 101.7 69.0
Under / (Over) provided in prior years (1.0) (0.6) (1.0) (0.5)
Income tax expense on pre-tax net profit 122.5 90.0 100.7 68.5
(1) In the Bank, this includes the impact of dividends received from subsidiary Group members which are eliminated at a Group level and franking credits.

16
Bank of Queensland Limited and its Controlled Entities A.B.N. 32 009 656 740.
2.3. INCOME TAX EXPENSE AND DEFERRED TAX (CONTINUED)
Recognised deferred tax assets and liabilities
Deferred tax assets and liabilities are attributable to the following:
Assets Liabilities Net
Consolidated
2014
$m
2013
$m
2014
$m
2013
$m
2014
$m
2013
$m
Accruals 5.3 5.0 - - 5.3 5.0
Capitalised expenditure - - (3.2) (11.4) (3.2) (11.4)
Provision for impairment 94.5 104.1 - - 94.5 104.1
Other provisions 22.9 10.3 - - 22.9 10.3
Equity reserves - - (5.9) (3.6) (5.9) (3.6)
Other 7.4 7.0 (8.8) (6.9) (1.4) 0.1
Tax assets / (liabilities) 130.1 126.4 (17.9) (21.9) 112.2 104.5
Bank
Accruals 2.3 3.1 - - 2.3 3.1
Capitalised expenditure - - (1.1) (9.6) (1.1) (9.6)
Provision for impairment 81.5 91.3 - - 81.5 91.3
Other provisions 19.5 9.6 - - 19.5 9.6
Equity reserves - - (5.3) (2.7) (5.3) (2.7)
Other 7.9 6.9 (3.5) (3.1) 4.4 3.8
Tax assets / (liabilities) 111.2 110.9 (9.9) (15.4) 101.3 95.5
Income tax - Accounting policy
Income tax expense comprises current and deferred tax. Income tax is recognised in profit or loss in the Income Statement except to the extent that it relates to items recognised directly in equity, or other comprehensive income.
Current tax is the expected tax payable / receivable on the taxable income / loss for the year and any adjustment to the tax payable / receivable in respect of previous years. It is measured using tax rates enacted or substantially enacted at the reporting date.
Deferred tax is recognised in respect of temporary differences between the carrying amounts of assets and liabilities for financial reporting purposes and the amounts used for taxation purposes.
Deferred tax assets are recognised for unused tax losses and deductible temporary differences to the extent that it is probable that future taxable profits will be available against which they can be utilised. Deferred tax assets are reviewed at each reporting date and are reduced to the extent that it is no longer probable that the related tax benefit will be realised.
Deferred tax is measured at the tax rates that are expected to be applied to temporary differences when they reverse, using tax rates enacted or substantially enacted at the reporting date. The measurement of deferred tax reflects the tax consequences that would follow the manner in which the Consolidated Entity expects, at the reporting date, to recover or settle the carrying amount of its assets and liabilities.
Tax Consolidation
The Bank is the head entity in the tax consolidated group comprising all the Australian wholly-owned subsidiaries. The implementation date for the tax-consolidated group was 1 September 2003.
Current tax expense / income, deferred tax liabilities and deferred tax assets arising from temporary differences of the members of the tax-consolidated group are recognised in the separate financial statements of the members of the tax-consolidated group using a ‘group allocation’ approach by reference to the carrying amounts in the separate financial statements of each entity and the tax values applying under tax consolidation.
Any current tax liabilities (or assets) and deferred tax assets arising from unused tax losses of the subsidiaries is assumed by the head entity in the tax-consolidated group and are recognised as amounts payable / (receivable) to / (from) other entities in the tax-consolidated group in conjunction with any tax funding arrangement amounts (refer below). Any difference between these amounts is recognised by the Bank as an equity contribution, or distribution from the subsidiary.
Any subsequent period amendments to deferred tax assets arising from unused tax losses as a result of revised assessment of the probability of recoverability is recognised by the head entity only.

17
BOQ PRELIMINARY FINAL REPORT 2014
2.3. INCOME TAX EXPENSE AND DEFERRED TAX (CONTINUED)
Nature of tax funding and tax sharing arrangements
The Bank, in conjunction with other members of the tax-consolidated group, has entered into a tax funding agreement which sets out the funding obligations of members of the tax-consolidated group in respect of tax amounts. The tax funding agreement requires payments to / from the head entity equal to the current tax liability (asset) assumed by the head entity and any tax-loss deferred tax asset assumed by the head entity, resulting in the Bank recognising an inter-entity payable (receivable) equal in amount to the tax liability (asset) assumed.
Contributions to fund the current tax liabilities are payable as per the Tax Funding Arrangement and reflect the timing of the head entity’s obligation to make payments for tax liabilities to the relevant tax authorities.
The Bank, in conjunction with other members of the tax-consolidated group, has also entered into a Tax Sharing Agreement (“TSA”). The TSA provides for the determination of the allocation of income tax liabilities between the entities should the head entity default on its tax payment obligations. No amounts have been recognised in the financial statements in respect of this agreement as payment of any amounts under the TSA is considered remote.
Taxation of Financial Arrangements (“TOFA”)
TOFA began to apply to the tax-consolidated group on 1 July 2010. The regime aims to align the tax and accounting treatment of financial arrangements.
The tax-consolidated group made a transitional election to bring pre-existing arrangements into TOFA. The deferred tax in relation to the transitional adjustment that this created was fully amortised in the 31 August 2014 financial year.
2.4. EARNINGS PER SHARE
Basic Earnings Per Share (“EPS”) is calculated by dividing the relevant earnings by the average weighted number of shares on issue. Diluted EPS takes into account the dilutive effect of all outstanding share rights vesting as ordinary shares.
Consolidated
2014
cents
2013 (2)
cents
Basic earnings per share - Ordinary shares (cents) 77.4 57.6
Diluted earnings per share - Ordinary shares (cents) 75.9 56.5
Earnings reconciliation $m $m
Net profit 260.5 185.8
Less other equity instrument dividends (1) - (2.7)
Basic earnings 260.5 183.1
Effect of PEPS (1) - 2.7
Effect of distributions on CPS 16.4 11.8
Effect of convertible notes - 0.6
Diluted earnings 276.9 198.2
Weighted average number of shares used as the denominator
2014
Number
2013
Number
Number for basic earnings per share
Ordinary shares 336,579,927 317,717,540
Number for diluted earnings per share
Ordinary shares 336,579,927 317,717,540
Effect of award rights 2,930,399 2,414,842
Effect of PEPS - 7,360,404
Effect of CPS 25,448,063 21,988,604
Effect of convertible notes - 1,277,927
364,958,389 350,759,317
(1) PEPS distribution on an accrual basis.(2) Comparatives for basic and diluted earnings per share have been adjusted for the effect of the rights issue that occurred during the current financial year.
18
Bank of Queensland Limited and its Controlled Entities A.B.N. 32 009 656 740.
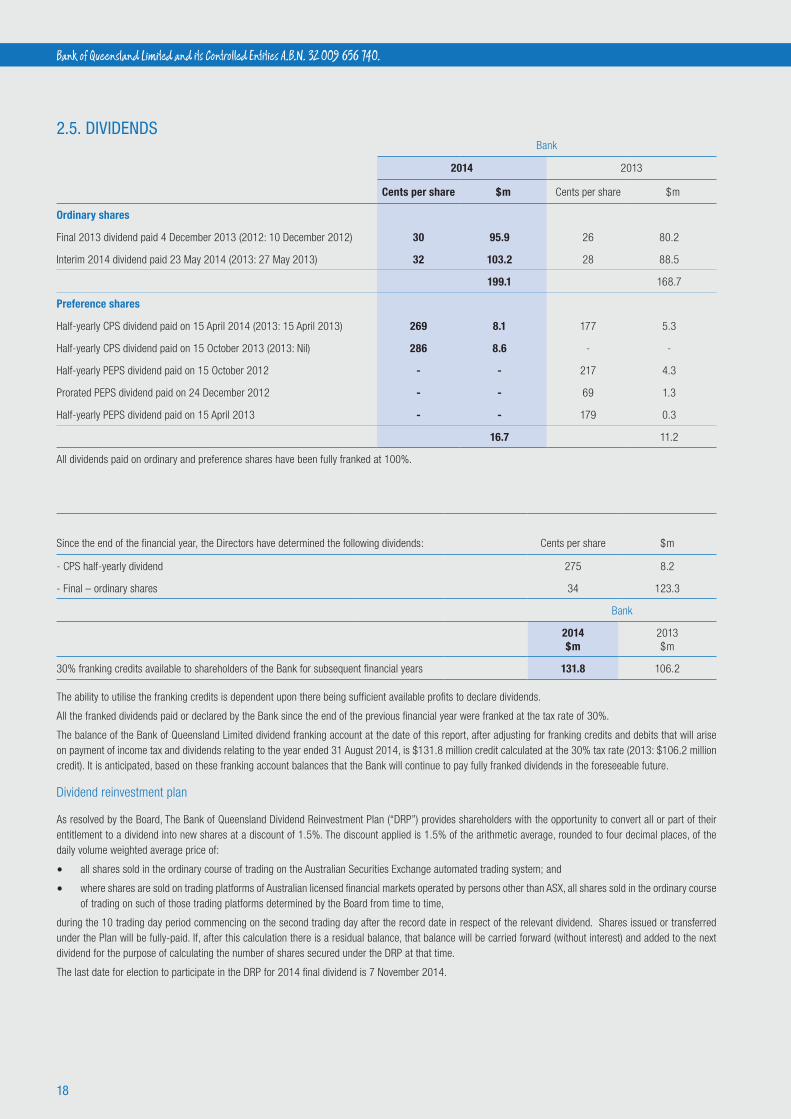
2.5. DIVIDENDSBank
2014 2013
Cents per share $m Cents per share $m
Ordinary shares
Final 2013 dividend paid 4 December 2013 (2012: 10 December 2012) 30 95.9 26 80.2
Interim 2014 dividend paid 23 May 2014 (2013: 27 May 2013) 32 103.2 28 88.5
199.1 168.7
Preference shares
Half-yearly CPS dividend paid on 15 April 2014 (2013: 15 April 2013) 269 8.1 177 5.3
Half-yearly CPS dividend paid on 15 October 2013 (2013: Nil) 286 8.6 - -
Half-yearly PEPS dividend paid on 15 October 2012 - - 217 4.3
Prorated PEPS dividend paid on 24 December 2012 - - 69 1.3
Half-yearly PEPS dividend paid on 15 April 2013 - - 179 0.3
16.7 11.2
All dividends paid on ordinary and preference shares have been fully franked at 100%.
Since the end of the financial year, the Directors have determined the following dividends: Cents per share $m
- CPS half-yearly dividend 275 8.2
- Final – ordinary shares 34 123.3
Bank
2014$m
2013$m
30% franking credits available to shareholders of the Bank for subsequent financial years 131.8 106.2
The ability to utilise the franking credits is dependent upon there being sufficient available profits to declare dividends.
All the franked dividends paid or declared by the Bank since the end of the previous financial year were franked at the tax rate of 30%.
The balance of the Bank of Queensland Limited dividend franking account at the date of this report, after adjusting for franking credits and debits that will arise on payment of income tax and dividends relating to the year ended 31 August 2014, is $131.8 million credit calculated at the 30% tax rate (2013: $106.2 million credit). It is anticipated, based on these franking account balances that the Bank will continue to pay fully franked dividends in the foreseeable future.
Dividend reinvestment plan
As resolved by the Board, The Bank of Queensland Dividend Reinvestment Plan (“DRP”) provides shareholders with the opportunity to convert all or part of their entitlement to a dividend into new shares at a discount of 1.5%. The discount applied is 1.5% of the arithmetic average, rounded to four decimal places, of the daily volume weighted average price of:
• all shares sold in the ordinary course of trading on the Australian Securities Exchange automated trading system; and
• where shares are sold on trading platforms of Australian licensed financial markets operated by persons other than ASX, all shares sold in the ordinary course of trading on such of those trading platforms determined by the Board from time to time,
during the 10 trading day period commencing on the second trading day after the record date in respect of the relevant dividend. Shares issued or transferred under the Plan will be fully-paid. If, after this calculation there is a residual balance, that balance will be carried forward (without interest) and added to the next dividend for the purpose of calculating the number of shares secured under the DRP at that time.
The last date for election to participate in the DRP for 2014 final dividend is 7 November 2014.

19
BOQ PRELIMINARY FINAL REPORT 2014
2.6. SEGMENT REPORTING
Segment informationThe Bank determines and presents operating segments based on the information that is provided internally to the Managing Director, who is the Bank’s Chief Operating Decision Maker.
An operating segment is a component of the Bank that engages in business activities from which it may earn revenues and incur expenses, including revenues and expenses that relate to transactions with any of the Bank’s other components. All operating segments’ operating results are regularly reviewed by the Bank’s Managing Director to make decisions about resources to be allocated to the segment and assess its performance, and for which discrete financial information is available.
Segment results that are reported to the Managing Director include items directly attributable to a segment as well as those that can be allocated on a reasonable basis. The Bank has determined and presented the following two segments based on information provided to the Chief Operating Decision Maker.
Banking Retail banking, commercial, personal, small business loans, equipment, debtor finance, treasury, savings and transaction accounts.
Insurance Consumer credit insurance, life insurance, accidental death insurance, funeral insurance and motor vehicle gap insurance.
Management monitors the operating results of its business units separately for the purpose of making decisions about resource allocation and performance assessment. Segment performance is evaluated based on operating profit or loss which in certain respects is measured differently from operating profit or loss in the consolidated financial statements. Income taxes are managed within the individual operating segments and thus disclosed this way.
Transfer prices between operating segments are on an arm’s length basis in a manner similar to transactions with third parties.
No revenue from transactions with a single external customer or counterparty amounted to 10% or more of the Bank’s total revenue in 2014 or 2013.
The Consolidated Entity’s business segments operate principally in Australia.
The following table presents income and profit and certain asset and liability information regarding the Bank’s operating segments.
Banking Insurance Segment Total
2014$m
2013 (1)
$m2014$m
2013 (1)
$m2014$m
2013 (1)
$m
Income
External 897.4 816.5 41.2 39.4 938.6 855.9
Inter-segment 4.5 5.7 (1.5) (0.7) 3.0 5.0
Total operating income 901.9 822.2 39.7 38.7 941.6 860.9
Segment profit before income tax 351.8 248.7 31.2 27.1 383.0 275.8
Income tax expense 113.1 81.9 9.4 8.1 122.5 90.0
Segment profit after income tax 238.7 166.8 21.8 19.0 260.5 185.8
Results
Interest income 2,112.0 2,297.4 - - 2,112.0 2,297.4
Interest expense 1,351.2 1,604.3 - - 1,351.2 1,604.3
Depreciation and amortisation 23.5 27.8 - - 23.5 27.8
Impairment losses 86.2 114.6 - - 86.2 114.6
Assets 46,834.4 42,438.1 125.8 122.9 46,960.2 42,561.0
Liabilities 43,528.9 39,657.4 86.1 82.7 43,615.0 39,740.1
(1) The prior year has been restated so that the amounts are comparable to the current year.

20
Bank of Queensland Limited and its Controlled Entities A.B.N. 32 009 656 740.
2.6. SEGMENT REPORTING (CONTINUED)
The following table sets out the reconciliation between the operating segments and the consolidated entity:
2014$m
2013 (1)
$m2014$m
2013 (1)
$m
Revenue Profit before tax
Segment total 941.6 861.6 383.0 275.8
Elimination of inter-segment revenue (3.0) (5.7) - -
Consolidated total 938.6 855.9 383.0 275.8
Assets Liabilities
Segment total 46,960.2 42,561.0 43,615.0 39,740.1
Elimination of inter-segment bank accounts (55.1) (33.9) (55.1) (33.9)
Adjustment for other consolidation eliminations (0.5) 1.2 4.2 4.3
Consolidated total 46,904.6 42,528.3 43,564.1 39,710.5
(1) The prior year has been restated so that the amounts are comparable to the current year.

21
BOQ PRELIMINARY FINAL REPORT 2014
SECTION 3. CAPITAL AND BALANCE SHEET MANAGEMENT
3.1. CASH AND LIQUID ASSETS
Consolidated Bank
2014 $m
2013 $m
2014 $m
2013 $m
Notes, coins and cash at bank 904.8 712.8 268.2 81.8
Remittances in transit 128.8 160.4 128.8 160.4
1,033.6 873.2 397.0 242.2
Notes to the statements of cash flows
Reconciliation of profit for the year to net cash provided by operating activities.
Profit from ordinary activities after income tax 260.5 185.8 237.6 169.7
Add / (less) items classified as investing / financing activities or non-cash items
Depreciation 16.9 16.1 7.9 7.3
Amortisation 11.3 16.0 1.0 1.4
Dividends received from subsidiaries - - (21.5) (23.3)
Software amortisation 14.7 18.6 12.9 16.5
Investments equity accounted (3.2) 1.1 - -
Equity settled transactions 8.5 5.2 7.8 4.6
(Profit) / loss on sale of property, plant and equipment 2.4 (3.2) 4.8 (0.1)
(Increase) / decrease in due from other financial institutions 25.7 1.2 8.8 (0.3)
(Increase) / decrease in financial assets (269.2) 288.0 (97.3) 174.0
Increase in loans and advances at amortised cost (619.8) (741.6) (499.6) (741.5)
(Increase) / decrease in derivatives 45.3 (25.4) 40.0 (25.3)
Decrease in provision for impairment (22.4) (100.5) (44.4) (95.1)
(Increase) / decrease in deferred tax asset 12.7 41.4 (1.7) 23.1
(Increase) / decrease in other assets 10.9 (16.7) 32.2 (1.8)
Decrease in amounts due from controlled entities - - (772.2) (212.3)
Increase in due to other financial institutions 6.4 23.3 6.4 23.3
Increase in deposits 1,914.2 518.3 2,283.3 488.2
Decrease in accounts payable and other liabilities (17.3) (75.2) (12.9) (75.3)
Increase in current tax liabilities 48.5 23.3 28.1 24.3
Increase in provisions 25.2 35.9 19.5 35.2
Decrease in deferred tax liabilities (17.8) (18.8) (4.0) (11.5)
Decrease in insurance policy liabilities (9.5) (1.0) - -
Increase / (decrease) in borrowings including subordinated notes (986.5) 28.8 - -
Net cash from operating activities 456.7 220.6 1,236.7 (218.9)
Accounting policy
Cash and liquid assets comprise cash at branches, cash on deposit and balances with the Reserve Bank of Australia. Cash flows from the following activities are presented on a net basis in the statements of cash flows:
• Sales and purchases of investment securities;• Customer deposits in and withdrawals from deposit accounts; and• Loan drawdowns and repayments.
22
Bank of Queensland Limited and its Controlled Entities A.B.N. 32 009 656 740.
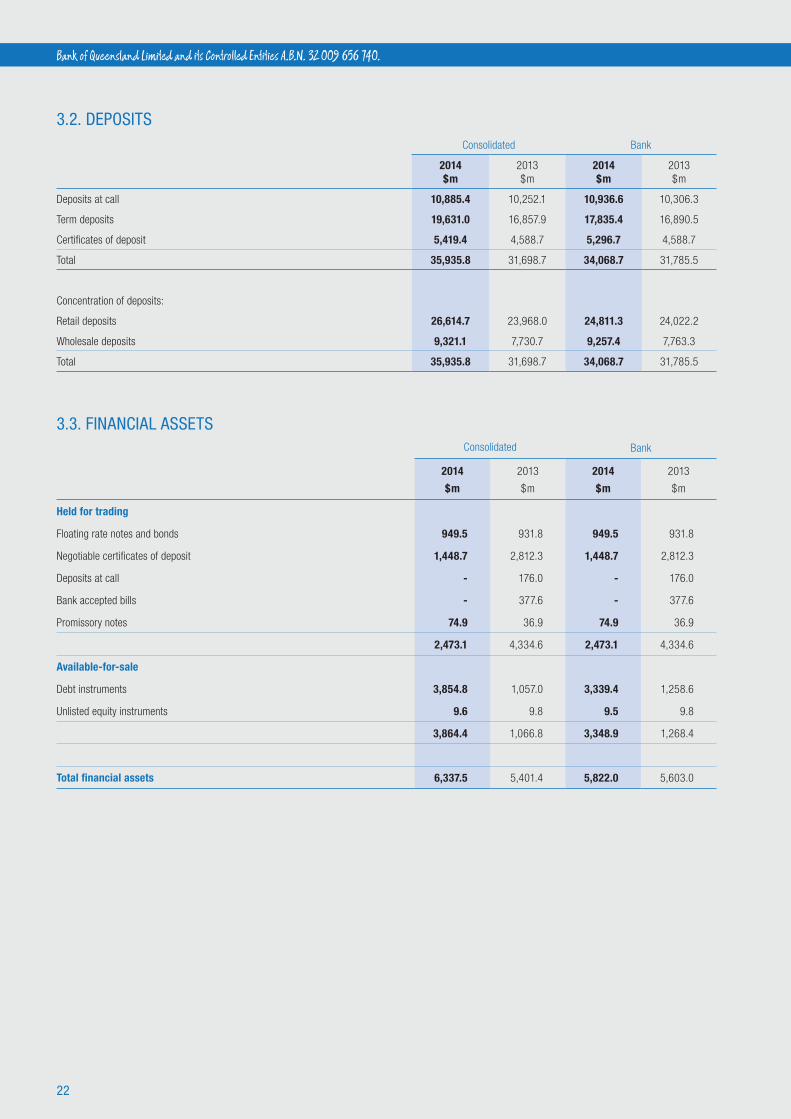
3.2. DEPOSITSConsolidated Bank
2014 $m
2013 $m
2014 $m
2013 $m
Deposits at call 10,885.4 10,252.1 10,936.6 10,306.3
Term deposits 19,631.0 16,857.9 17,835.4 16,890.5
Certificates of deposit 5,419.4 4,588.7 5,296.7 4,588.7
Total 35,935.8 31,698.7 34,068.7 31,785.5
Concentration of deposits:
Retail deposits 26,614.7 23,968.0 24,811.3 24,022.2
Wholesale deposits 9,321.1 7,730.7 9,257.4 7,763.3
Total 35,935.8 31,698.7 34,068.7 31,785.5
3.3. FINANCIAL ASSETSConsolidated Bank
2014
$m
2013
$m
2014
$m
2013
$m
Held for trading
Floating rate notes and bonds 949.5 931.8 949.5 931.8
Negotiable certificates of deposit 1,448.7 2,812.3 1,448.7 2,812.3
Deposits at call - 176.0 - 176.0
Bank accepted bills - 377.6 - 377.6
Promissory notes 74.9 36.9 74.9 36.9
2,473.1 4,334.6 2,473.1 4,334.6
Available-for-sale
Debt instruments 3,854.8 1,057.0 3,339.4 1,258.6
Unlisted equity instruments 9.6 9.8 9.5 9.8
3,864.4 1,066.8 3,348.9 1,268.4
Total financial assets 6,337.5 5,401.4 5,822.0 5,603.0

23
BOQ PRELIMINARY FINAL REPORT 2014
3.4. LOANS AND ADVANCES AT AMORTISED COST
Consolidated Bank
2014
$m
2013
$m
2014
$m
2013
$m
Residential property loans – secured by mortgages 19,284.5 18,577.0 19,124.9 18,577.0
Securitised residential property loans – secured by mortgages 7,224.1 7,571.9 7,223.3 7,571.9
Total residential property loans – secured by mortgages 26,508.6 26,148.9 26,348.2 26,148.9
Personal loans 288.2 180.7 161.6 180.7
Overdrafts 330.2 387.3 330.2 387.3
Commercial loans 7,174.2 5,079.4 5,425.7 5,049.3
Credit cards 53.6 - - -
Leasing finance 4,527.0 3,909.6 - -
Gross loans and advances at amortised cost 38,881.8 35,705.9 32,265.7 31,766.2
Less:
Unearned lease finance income (456.3) (404.3) - -
Specific provision for impairment (152.7) (174.8) (127.6) (162.7)
Collective provision for impairment (137.3) (137.5) (102.9) (112.3)
Total loans and advances at amortised cost 38,135.5 34,989.3 32,035.2 31,491.2
Accounting policyLoans and advances at amortised cost Loans and advances are originated by the Bank and are recognised upon cash being advanced to the borrower. Loans and advances are initially recognised at fair value plus incremental direct transaction costs and subsequently measured at each reporting date at amortised cost using the effective interest method. Refer to the table below for impairment of loans and advances.
Provision for impairmentConsolidated Bank
2014
$m
2013
$m
2014
$m
2013
$m
Specific provision:
Balance at the beginning of the year 174.8 220.3 162.7 204.3
Add: Expensed during the year 93.5 151.6 69.6 122.6
Acquired during the year 7.6 - - -
Less: Bad debts written off net of recoveries (115.7) (195.1) (97.6) (162.8)
Transfers from collective provision 2.5 14.5 2.5 14.5
Unwind of discount (10.0) (16.5) (9.6) (15.9)
Balance at the end of the year 152.7 174.8 127.6 162.7
Collective provision:
Balance at the beginning of the year 137.5 192.6 112.3 165.8
Add: Released during the year (7.3) (37.0) (6.8) (35.4)
Acquired during the year 6.9 - - -
Impairment losses provided for / (written off) 2.7 (3.6) (0.1) (3.6)
Transfers to specific provision (2.5) (14.5) (2.5) (14.5)
Balance at the end of the year 137.3 137.5 102.9 112.3
Total provisions for impairment 290.0 312.3 230.5 275.0
24
Bank of Queensland Limited and its Controlled Entities A.B.N. 32 009 656 740.
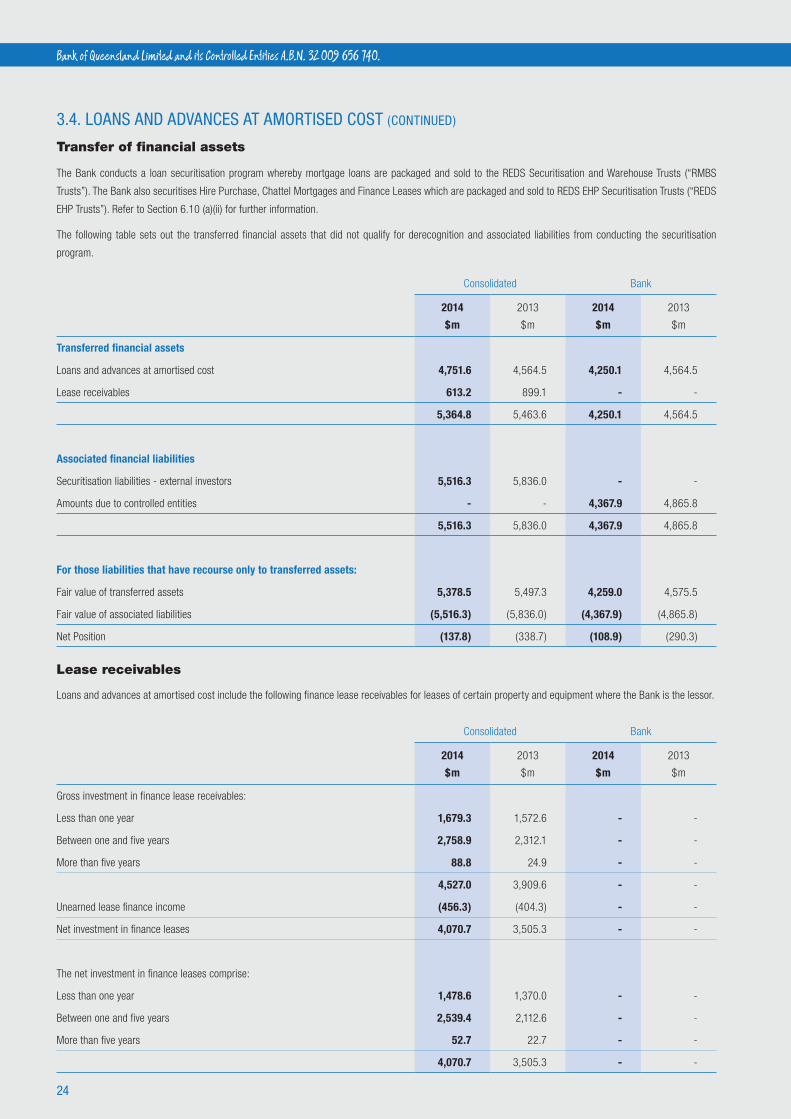
3.4. LOANS AND ADVANCES AT AMORTISED COST (CONTINUED)
Transfer of financial assets
The Bank conducts a loan securitisation program whereby mortgage loans are packaged and sold to the REDS Securitisation and Warehouse Trusts (“RMBS
Trusts”). The Bank also securitises Hire Purchase, Chattel Mortgages and Finance Leases which are packaged and sold to REDS EHP Securitisation Trusts (“REDS
EHP Trusts”). Refer to Section 6.10 (a)(ii) for further information.
The following table sets out the transferred financial assets that did not qualify for derecognition and associated liabilities from conducting the securitisation
program.
Consolidated Bank
2014
$m
2013
$m
2014
$m
2013
$m
Transferred financial assets
Loans and advances at amortised cost 4,751.6 4,564.5 4,250.1 4,564.5
Lease receivables 613.2 899.1 - -
5,364.8 5,463.6 4,250.1 4,564.5
Associated financial liabilities
Securitisation liabilities - external investors 5,516.3 5,836.0 - -
Amounts due to controlled entities - - 4,367.9 4,865.8
5,516.3 5,836.0 4,367.9 4,865.8
For those liabilities that have recourse only to transferred assets:
Fair value of transferred assets 5,378.5 5,497.3 4,259.0 4,575.5
Fair value of associated liabilities (5,516.3) (5,836.0) (4,367.9) (4,865.8)
Net Position (137.8) (338.7) (108.9) (290.3)
Lease receivables
Loans and advances at amortised cost include the following finance lease receivables for leases of certain property and equipment where the Bank is the lessor.
Consolidated Bank
2014
$m
2013
$m
2014
$m
2013
$m
Gross investment in finance lease receivables:
Less than one year 1,679.3 1,572.6 - -
Between one and five years 2,758.9 2,312.1 - -
More than five years 88.8 24.9 - -
4,527.0 3,909.6 - -
Unearned lease finance income (456.3) (404.3) - -
Net investment in finance leases 4,070.7 3,505.3 - -
The net investment in finance leases comprise:
Less than one year 1,478.6 1,370.0 - -
Between one and five years 2,539.4 2,112.6 - -
More than five years 52.7 22.7 - -
4,070.7 3,505.3 - -
25
BOQ PRELIMINARY FINAL REPORT 2014
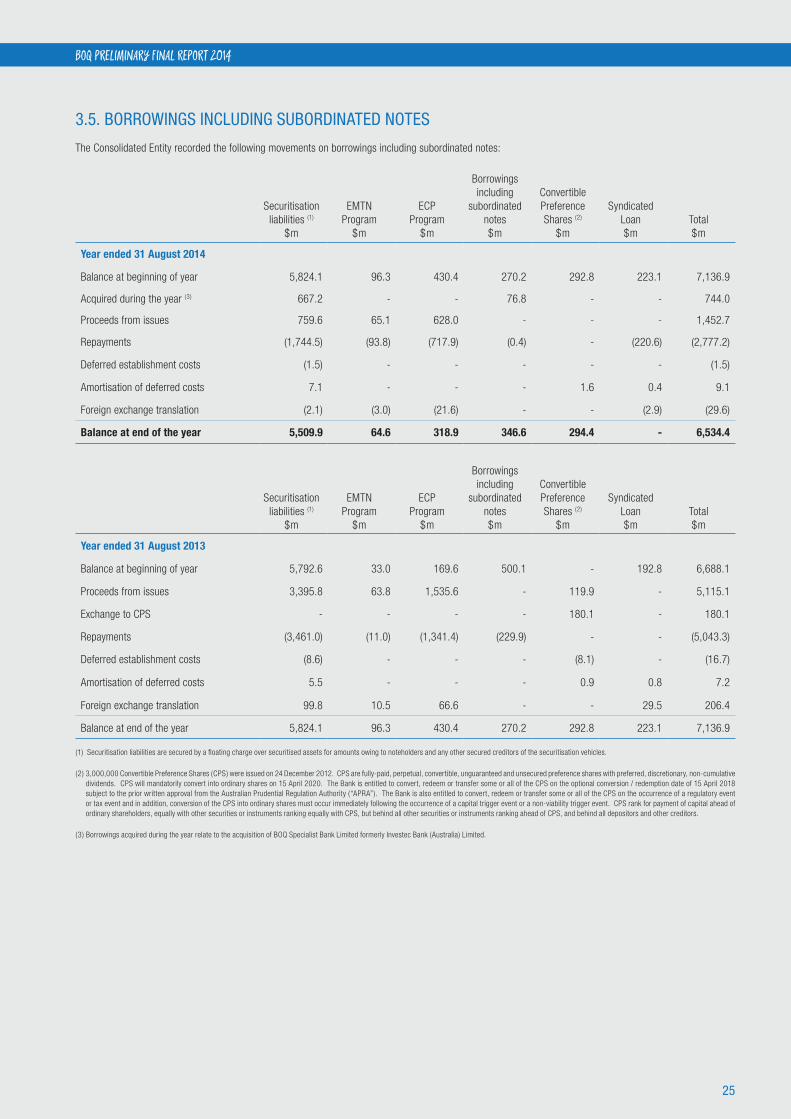
3.5. BORROWINGS INCLUDING SUBORDINATED NOTES
The Consolidated Entity recorded the following movements on borrowings including subordinated notes:
Securitisation liabilities (1)
$m
EMTN Program
$m
ECP Program
$m
Borrowings including
subordinated notes$m
Convertible Preference Shares (2)
$m
Syndicated Loan$m
Total$m
Year ended 31 August 2014
Balance at beginning of year 5,824.1 96.3 430.4 270.2 292.8 223.1 7,136.9
Acquired during the year (3) 667.2 - - 76.8 - - 744.0
Proceeds from issues 759.6 65.1 628.0 - - - 1,452.7
Repayments (1,744.5) (93.8) (717.9) (0.4) - (220.6) (2,777.2)
Deferred establishment costs (1.5) - - - - - (1.5)
Amortisation of deferred costs 7.1 - - - 1.6 0.4 9.1
Foreign exchange translation (2.1) (3.0) (21.6) - - (2.9) (29.6)
Balance at end of the year 5,509.9 64.6 318.9 346.6 294.4 - 6,534.4
Securitisation liabilities (1)
$m
EMTN Program
$m
ECP Program
$m
Borrowings including
subordinated notes$m
Convertible Preference Shares (2)
$m
Syndicated Loan$m
Total$m
Year ended 31 August 2013
Balance at beginning of year 5,792.6 33.0 169.6 500.1 - 192.8 6,688.1
Proceeds from issues 3,395.8 63.8 1,535.6 - 119.9 - 5,115.1
Exchange to CPS - - - - 180.1 - 180.1
Repayments (3,461.0) (11.0) (1,341.4) (229.9) - - (5,043.3)
Deferred establishment costs (8.6) - - - (8.1) - (16.7)
Amortisation of deferred costs 5.5 - - - 0.9 0.8 7.2
Foreign exchange translation 99.8 10.5 66.6 - - 29.5 206.4
Balance at end of the year 5,824.1 96.3 430.4 270.2 292.8 223.1 7,136.9
(1) Securitisation liabilities are secured by a floating charge over securitised assets for amounts owing to noteholders and any other secured creditors of the securitisation vehicles.
(2) 3,000,000 Convertible Preference Shares (CPS) were issued on 24 December 2012. CPS are fully-paid, perpetual, convertible, unguaranteed and unsecured preference shares with preferred, discretionary, non-cumulative dividends. CPS will mandatorily convert into ordinary shares on 15 April 2020. The Bank is entitled to convert, redeem or transfer some or all of the CPS on the optional conversion / redemption date of 15 April 2018 subject to the prior written approval from the Australian Prudential Regulation Authority (“APRA”). The Bank is also entitled to convert, redeem or transfer some or all of the CPS on the occurrence of a regulatory event or tax event and in addition, conversion of the CPS into ordinary shares must occur immediately following the occurrence of a capital trigger event or a non-viability trigger event. CPS rank for payment of capital ahead of ordinary shareholders, equally with other securities or instruments ranking equally with CPS, but behind all other securities or instruments ranking ahead of CPS, and behind all depositors and other creditors.
(3) Borrowings acquired during the year relate to the acquisition of BOQ Specialist Bank Limited formerly Investec Bank (Australia) Limited.
26
Bank of Queensland Limited and its Controlled Entities A.B.N. 32 009 656 740.
3.5. BORROWINGS INCLUDING SUBORDINATED NOTES (CONTINUED)
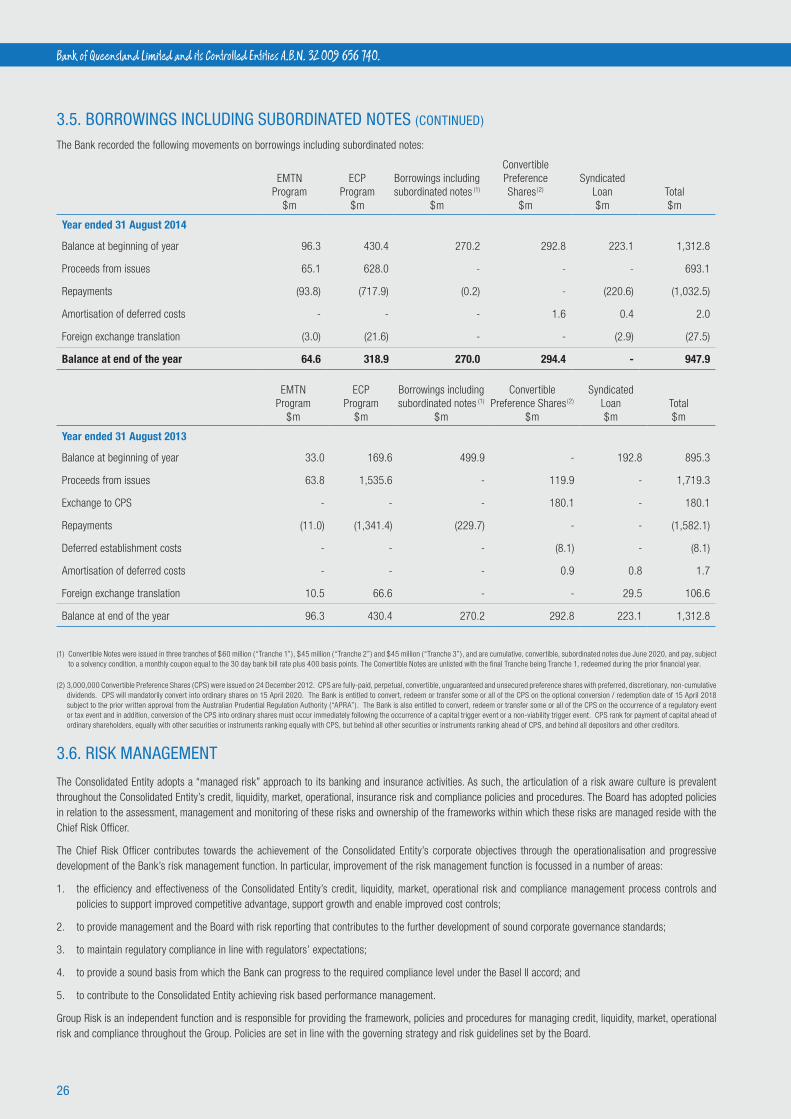
The Bank recorded the following movements on borrowings including subordinated notes:
EMTN Program
$m
ECP Program
$m
Borrowings including subordinated notes (1)
$m
Convertible Preference Shares(2)
$m
Syndicated Loan$m
Total$m
Year ended 31 August 2014
Balance at beginning of year 96.3 430.4 270.2 292.8 223.1 1,312.8
Proceeds from issues 65.1 628.0 - - - 693.1
Repayments (93.8) (717.9) (0.2) - (220.6) (1,032.5)
Amortisation of deferred costs - - - 1.6 0.4 2.0
Foreign exchange translation (3.0) (21.6) - - (2.9) (27.5)
Balance at end of the year 64.6 318.9 270.0 294.4 - 947.9
EMTN Program
$m
ECP Program
$m
Borrowings including subordinated notes (1)
$m
Convertible Preference Shares(2)
$m
Syndicated Loan$m
Total$m
Year ended 31 August 2013
Balance at beginning of year 33.0 169.6 499.9 - 192.8 895.3
Proceeds from issues 63.8 1,535.6 - 119.9 - 1,719.3
Exchange to CPS - - - 180.1 - 180.1
Repayments (11.0) (1,341.4) (229.7) - - (1,582.1)
Deferred establishment costs - - - (8.1) - (8.1)
Amortisation of deferred costs - - - 0.9 0.8 1.7
Foreign exchange translation 10.5 66.6 - - 29.5 106.6
Balance at end of the year 96.3 430.4 270.2 292.8 223.1 1,312.8
(1) Convertible Notes were issued in three tranches of $60 million (“Tranche 1”), $45 million (“Tranche 2”) and $45 million (“Tranche 3”), and are cumulative, convertible, subordinated notes due June 2020, and pay, subject to a solvency condition, a monthly coupon equal to the 30 day bank bill rate plus 400 basis points. The Convertible Notes are unlisted with the final Tranche being Tranche 1, redeemed during the prior financial year.
(2) 3,000,000 Convertible Preference Shares (CPS) were issued on 24 December 2012. CPS are fully-paid, perpetual, convertible, unguaranteed and unsecured preference shares with preferred, discretionary, non-cumulative dividends. CPS will mandatorily convert into ordinary shares on 15 April 2020. The Bank is entitled to convert, redeem or transfer some or all of the CPS on the optional conversion / redemption date of 15 April 2018 subject to the prior written approval from the Australian Prudential Regulation Authority (“APRA”). The Bank is also entitled to convert, redeem or transfer some or all of the CPS on the occurrence of a regulatory event or tax event and in addition, conversion of the CPS into ordinary shares must occur immediately following the occurrence of a capital trigger event or a non-viability trigger event. CPS rank for payment of capital ahead of ordinary shareholders, equally with other securities or instruments ranking equally with CPS, but behind all other securities or instruments ranking ahead of CPS, and behind all depositors and other creditors.
3.6. RISK MANAGEMENT
The Consolidated Entity adopts a “managed risk” approach to its banking and insurance activities. As such, the articulation of a risk aware culture is prevalent throughout the Consolidated Entity’s credit, liquidity, market, operational, insurance risk and compliance policies and procedures. The Board has adopted policies in relation to the assessment, management and monitoring of these risks and ownership of the frameworks within which these risks are managed reside with the Chief Risk Officer.
The Chief Risk Officer contributes towards the achievement of the Consolidated Entity’s corporate objectives through the operationalisation and progressive development of the Bank’s risk management function. In particular, improvement of the risk management function is focussed in a number of areas:
1. the efficiency and effectiveness of the Consolidated Entity’s credit, liquidity, market, operational risk and compliance management process controls and policies to support improved competitive advantage, support growth and enable improved cost controls;
2. to provide management and the Board with risk reporting that contributes to the further development of sound corporate governance standards;
3. to maintain regulatory compliance in line with regulators’ expectations;
4. to provide a sound basis from which the Bank can progress to the required compliance level under the Basel II accord; and
5. to contribute to the Consolidated Entity achieving risk based performance management.
Group Risk is an independent function and is responsible for providing the framework, policies and procedures for managing credit, liquidity, market, operational risk and compliance throughout the Group. Policies are set in line with the governing strategy and risk guidelines set by the Board.

27
BOQ PRELIMINARY FINAL REPORT 2014
3.6. RISK MANAGEMENT (CONTINUED)
Monitoring
The Consolidated Entity’s enterprise risk management framework incorporates active management and monitoring of a range of risks including (but not limited to):
1. Market
2. Credit
3. Liquidity
4. Insurance
(a) Market risk
Market risk is the risk that movements in market rates and prices will result in profits or losses to the Bank. The objective of market risk management is to manage
and control market risk.
(i) Interest Rate Risk management
The operations of the Bank are subject to the risk of interest rate fluctuations as a result of mismatches in the timing of the repricing of interest rates on the Bank’s
assets and liabilities.
The figures in the table below indicate the potential increase in net interest income for an ensuing 12 month period of a 1% parallel shock increase to the yield
curve. A 1% decrease in the yield curve has an equal but opposite impact.
2014
%
2013
%
2014
$m
2013
$m
Exposure at the end of the year 1.16 0.90 8.6 6.2
Average monthly exposure during the year 1.19 0.78 8.8 5.4
High month exposure during the year 2.16 1.41 15.9 9.7
Low month exposure during the year (0.03) 0.16 (0.2) 1.1
(ii) Foreign exchange risk
It is the Bank’s policy not to carry material foreign exchange rate exposures. At balance date there are no material foreign exchange rate exposures.
The Bank uses cross currency swaps and foreign exchange forwards to hedge its exchange rate exposures arising from borrowing off-shore in foreign currencies. The Bank uses forward foreign exchange contracts to hedge potential exchange rate exposures created by customer-originated foreign currency transactions.
The Bank’s investment in its New Zealand subsidiary is hedged by forward foreign exchange contracts which mitigate the currency risk arising from the subsidiary’s net assets.
(iii) Traded market risk
Market risks attributable to trading activities are primarily measured using a parametric Value-at-Risk (“VaR”) based on historical data. The Bank estimates VaR as the potential loss in earnings from adverse market movements and is calculated over a 1-day time horizon to a 99% confidence level using 2 years of historical data. VaR takes account of all material market variables that may cause a change in the value of the trading portfolio. Although an important tool for the measurement of market risk, the assumptions underlying the model have some limitations:
• VaR typically understates the losses that may occur beyond the 99% confidence level;
• The reliance on historical data may prove insufficient to predict the severity of possible outcomes; and
• A 1-day holding period assumes that it is possible to hedge or dispose of positions within that period. For certain illiquid assets or in certain market situations this might not be possible.

28
Bank of Queensland Limited and its Controlled Entities A.B.N. 32 009 656 740.
3.6. RISK MANAGEMENT (CONTINUED)
(iii) Traded market risk (continued)
As VaR is a statistical measure and only attempts to cover losses to a 99% confidence level, the Bank supplements this analysis with stress testing. Stress testing attempts to adequately assess the risks inherent in its trading activities by applying appropriate scenario analyses, whilst not addressing the likelihood of those outcomes.
As an overlay, the individual market risks of interest rate, foreign exchange, credit and equity sensitivities are monitored and measured against limits delegated by the Asset-Liability Committee (“ALCO”).
The portfolio (interest rate, foreign exchange, credit and equity) VaR for the Bank’s trading portfolio for the year was as follows:
Trading VaR
2014
$m
2013
$m
Average 0.65 0.80
Maximum 1.33 1.67
Minimum 0.28 0.35
(b) Credit risk Credit risk arises in the business from lending activities, the provision of guarantees including letters of credit and commitments to lend, investment in bonds and notes, financial market transactions and other associated activities. Credit risk is the potential loss arising from the possibility that customers or counterparties fail to meet contractual payment obligations to the Bank as they fall due.
The Board of Directors have implemented a structured framework of systems and controls to monitor and manage credit risk comprising:
• documented credit risk management principles which are disseminated to all staff involved with the lending process;
• documented policies;
• a process for approving risk, based on tiered delegated approval authorities, whereby the largest exposures are assessed by a committee consisting of Group Executives and senior risk managers chaired by the Chief Risk Officer;
• risk grading the Bank’s commercial exposures for facilities greater than $100,000 based on items inclusive of financial performance and stability, organisational structure, industry segment and security support. Exposures within this segment of the portfolio are generally subject to annual review including reassessment of the assigned risk grade;
• an automated scorecard approval model for the Bank’s retail portfolio inclusive of home loans, personal loans, and lines of credit. This model is supported by experienced Risk Assessment Managers; and
• a series of management reports detailing industry concentrations, counterparty concentrations, loan grades and security strength ratings.
The Consolidated Entity uses derivative financial instruments to hedge its exposure to foreign exchange and interest rate risks arising from operating, financing and investing activities. In accordance with its treasury policy, the Consolidated Entity can hold derivative financial instruments for trading purposes. Credit risk on derivative contracts used for these purposes is minimised as counterparties are recognised financial intermediaries with acceptable credit ratings determined by a recognised rating agency.
Maximum exposure to credit risk
The amounts disclosed are the maximum exposure to credit risk, before taking account of any collateral held or other credit enhancements. For financial assets recognised on the Balance Sheet, the exposure to credit risk equals their carrying amount. For customer commitments, the maximum exposure to credit risk is the full amount of the committed facilities as at the reporting date.

29
BOQ PRELIMINARY FINAL REPORT 2014
3.6. RISK MANAGEMENT (CONTINUED)
(b) Credit risk (continued)
Maximum exposure to credit risk (continued)
The carrying amount of the Consolidated Entity’s and Bank’s financial assets represents the maximum credit exposure. The maximum exposure to credit risk at the reporting date was:
Consolidated Bank
2014 $m
2013 $m
2014 $m
2013 $m
Cash and liquid assets 1,033.6 873.2 397.0 242.2
Due from other financial institutions 92.8 118.5 15.0 23.8
Other financial assets (including accrued interest) 6,398.7 5,462.5 5,881.9 5,662.6
Derivative financial instruments 160.3 260.4 131.9 234.0
Financial assets other than loans and advances 7,685.4 6,714.6 6,425.8 6,162.6
Gross loans and advances at amortised cost 38,881.8 35,705.9 32,265.7 31,766.2
Total financial assets 46,567.2 42,420.5 38,691.5 37,928.8
Customer commitments (1) 1,897.9 1,470.3 1,024.4 921.7
Total potential exposure to credit risk 48,465.1 43,890.8 39,715.9 38,850.5
(1) Refer to Note Section 6.2 for full details of customer commitments.
Distribution of financial assets by credit quality
Consolidated Bank
2014 $m
2013 $m
2014 $m
2013 $m
Neither past due or impaired
Gross loans and advances at amortised cost 37,459.1 33,958.4 31,003.7 30,134.1
Financial assets other than loans and advances 7,685.4 6,714.6 6,425.8 6,162.6
Past due but not impaired
Gross loans and advances at amortised cost 1,129.8 1,365.9 999.0 1,269.7
Impaired
Gross loans and advances at amortised cost 292.9 381.6 263.0 362.4
46,567.2 42,420.5 38,691.5 37,928.8
There is no individual exposure included in impaired assets which exceeds 5% of shareholders’ equity (2013: nil).
The Bank holds collateral against loans and advances to customers in the form of mortgage interest over property, other registered securities over assets and guarantees and mortgage insurance. To mitigate credit risk, the Bank can take possession of the security held against the loans and advances as a result of customer default. To ensure reduced exposure to losses, the collateral held by the Bank as mortgagee in possession is realised promptly.
Estimates of fair value are based on the value of collateral assessed at the time of borrowing, and generally are not updated except when a loan is individually assessed as impaired. An estimate of the collateral held against past due but not impaired and impaired loans and advances at amortised cost is outlined below. It is not practicable to determine the fair value of collateral held against performing loans.
Consolidated Bank
2014 $m
2013 $m
2014 $m
2013 $m
Held against past due but not impaired assets 1,593.2 1,679.0 1,485.8 1,608.1
Held against impaired assets 202.3 260.4 186.0 252.1
30
Bank of Queensland Limited and its Controlled Entities A.B.N. 32 009 656 740.
3.6. RISK MANAGEMENT (CONTINUED)
(b) Credit risk (continued)
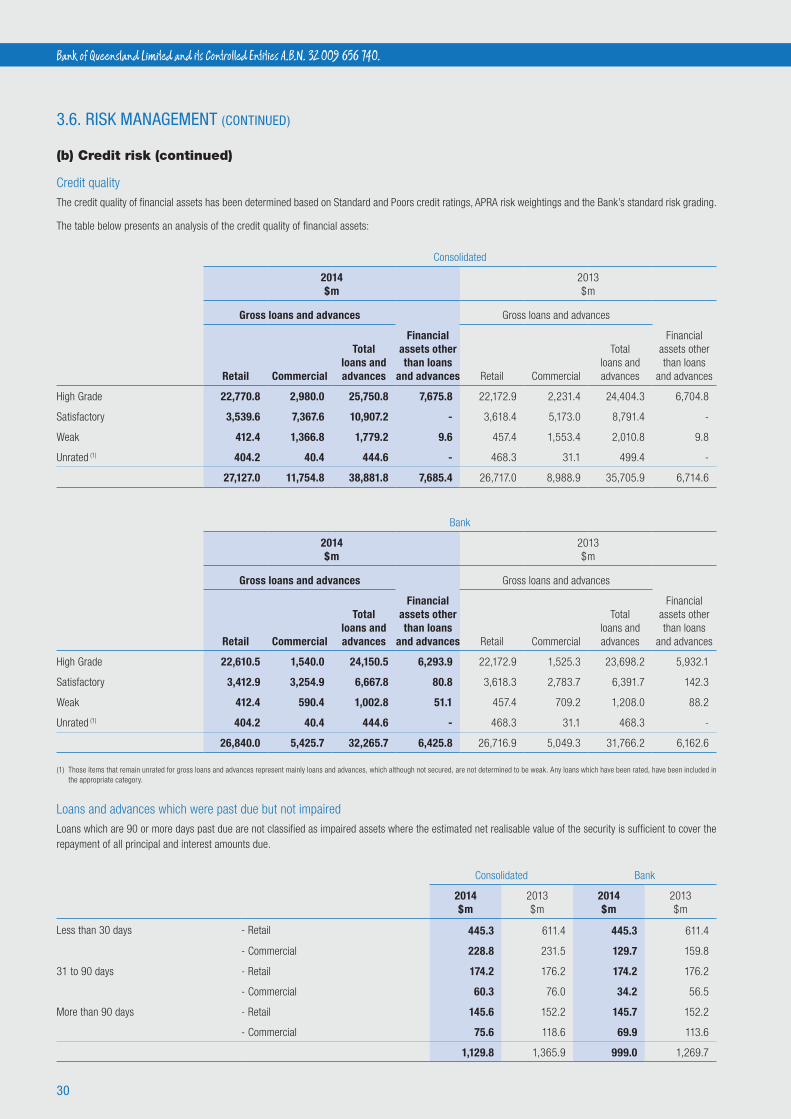
Credit quality
The credit quality of financial assets has been determined based on Standard and Poors credit ratings, APRA risk weightings and the Bank’s standard risk grading.
The table below presents an analysis of the credit quality of financial assets:
Consolidated
2014 $m
2013 $m
Gross loans and advances Gross loans and advances
Retail Commercial
Total loans and advances
Financial assets other than loans
and advances Retail Commercial
Total loans and advances
Financial assets other than loans
and advances
High Grade 22,770.8 2,980.0 25,750.8 7,675.8 22,172.9 2,231.4 24,404.3 6,704.8
Satisfactory 3,539.6 7,367.6 10,907.2 - 3,618.4 5,173.0 8,791.4 -
Weak 412.4 1,366.8 1,779.2 9.6 457.4 1,553.4 2,010.8 9.8
Unrated (1) 404.2 40.4 444.6 - 468.3 31.1 499.4 -
27,127.0 11,754.8 38,881.8 7,685.4 26,717.0 8,988.9 35,705.9 6,714.6
Bank
2014 $m
2013 $m
Gross loans and advances Gross loans and advances
Retail Commercial
Total loans and advances
Financial assets other than loans
and advances Retail Commercial
Total loans and advances
Financial assets other than loans
and advances
High Grade 22,610.5 1,540.0 24,150.5 6,293.9 22,172.9 1,525.3 23,698.2 5,932.1
Satisfactory 3,412.9 3,254.9 6,667.8 80.8 3,618.3 2,783.7 6,391.7 142.3
Weak 412.4 590.4 1,002.8 51.1 457.4 709.2 1,208.0 88.2
Unrated (1) 404.2 40.4 444.6 - 468.3 31.1 468.3 -
26,840.0 5,425.7 32,265.7 6,425.8 26,716.9 5,049.3 31,766.2 6,162.6
(1) Those items that remain unrated for gross loans and advances represent mainly loans and advances, which although not secured, are not determined to be weak. Any loans which have been rated, have been included in the appropriate category.
Loans and advances which were past due but not impaired
Loans which are 90 or more days past due are not classified as impaired assets where the estimated net realisable value of the security is sufficient to cover the repayment of all principal and interest amounts due.
Consolidated Bank
2014 $m
2013 $m
2014 $m
2013 $m
Less than 30 days - Retail 445.3 611.4 445.3 611.4
- Commercial 228.8 231.5 129.7 159.8
31 to 90 days - Retail 174.2 176.2 174.2 176.2
- Commercial 60.3 76.0 34.2 56.5
More than 90 days - Retail 145.6 152.2 145.7 152.2
- Commercial 75.6 118.6 69.9 113.6
1,129.8 1,365.9 999.0 1,269.7

31
BOQ PRELIMINARY FINAL REPORT 2014
3.6. RISK MANAGEMENT (CONTINUED)
(b) Credit risk (continued)
Concentration of exposure for gross loans and advances at amortised cost
Concentration of credit risk exists when a number of counterparties are engaged in similar activities, or operate in the same geographical areas or industry sectors and have similar economic characteristics so that their ability to meet contractual obligations is similarly affected by changes in economic, political or other conditions.
The Bank monitors concentrations of credit risk by geographical location for loans and advances. An analysis of these concentrations of credit risk at the reporting date is shown below:
Consolidated Bank
Geographical concentration of credit risk for loans and advances at amortised cost (before provisions and unearned income):
2014 $m
2013 $m
2014 $m
2013 $m
Queensland 20,911.8 20,580.5 18,899.3 19,169.4
New South Wales 6,903.8 5,387.8 4,948.9 4,517.2
Victoria 6,185.2 5,659.0 4,854.0 4,849.3
Northern Territory 260.4 237.2 255.6 231.7
Australian Capital Territory 313.8 347.2 241.2 227.0
Western Australia 3,519.3 2,885.1 2,778.0 2,458.7
South Australia 369.7 213.8 110.7 120.3
Tasmania 182.9 196.9 178.0 192.6
International (New Zealand) 234.9 198.4 - -
38,881.8 35,705.9 32,265.7 31,766.2

32
Bank of Queensland Limited and its Controlled Entities A.B.N. 32 009 656 740.
3.6. RISK MANAGEMENT (CONTINUED)
(c) Liquidity riskLiquidity risk arises from the possibility that the Bank is unable to meet its financial obligations as they fall due. Liquidity risk is managed through a series of detailed policies, including the management of cash flow mismatches, the maintenance of a stable, core retail deposits base, the diversification of the funding base and the retention of adequate levels of high quality liquid assets.
The Consolidated Entity manages liquidity risk by maintaining adequate reserves and facilities by continuously monitoring forecast and actual cash flows, matching maturity profiles of financial assets and liabilities and liquidity scenario analysis.
Consolidated 2014
Carrying amount
$mAt Call
$m3 mths or less
$m3 to 12 mths
$m1 to 5 years
$mOver 5 years
$mPolicyholder
$m
Total contractual cash flows
$m
Financial liabilities
Due to other financial institutions 207.5 207.5 - - - - - 207.5
Deposits 35,935.8 12,301.2 12,969.3 8,371.0 2,917.8 16.8 - 36,576.1
Derivative financial instruments (1) 5.0 - 1.9 1.8 2.0 - - 5.7
Accounts payable and other liabilities 399.1 - 399.1 - - - - 399.1
Securitisation liabilities (2) 5,509.9 - 932.7 1,692.6 2,549.4 871.4 - 6,046.1
Borrowings including subordinated notes 1,024.5 - 69.7 347.6 723.7 - - 1,141.0
Insurance policy liabilities 63.0 - - - - - 63.0 63.0
Total 43,144.8 12,508.7 14,372.7 10,413.0 6,192.9 888.2 63.0 44,438.5
Derivative financial instruments (hedging relationship)
Contractual amounts payable - - 419.7 774.3 826.7 396.2 - 2,416.9
Contractual amounts receivable - - (408.3) (737.3) (724.8) (321.4) - (2,191.8)
112.6 - 11.4 37.0 101.9 74.8 - 225.1
Off balance sheet positions
Guarantees, indemnities and letters of credit - 252.2 - - - - - 252.2
Customer funding commitments - 1,645.7 - - - - - 1,645.7
- 1,897.9 - - - - - 1,897.9
Consolidated 2013
Carrying amount
$mAt Call
$m3 mths or less
$m3 to 12 mths
$m1 to 5 years
$mOver 5 years
$mPolicyholder
$m
Total contractual cash flows
$m
Financial liabilities
Due to other financial institutions 201.1 201.1 - - - - - 201.1
Deposits 31,698.7 10,310.4 13,627.5 6,601.0 1,657.9 - - 32,196.8
Derivative financial instruments (1) 3.4 - 1.4 1.2 1.1 - - 3.7
Accounts payable and other liabilities 362.0 - 362.0 - - - - 362.0
Securitisation liabilities (2) 5,824.1 - 868.4 1,087.7 3,379.9 1,227.7 - 6,563.7
Borrowings including subordinated notes 1,312.8 - 313.7 474.5 672.6 - - 1,460.8
Insurance policy liabilities 72.5 - - - - - 72.5 72.5
Total 39,474.6 10,511.5 15,173.0 8,164.4 5,711.5 1,227.7 72.5 40,860.6
(1) Derivative financial instruments other than those designated in a cashflow hedge relationship. (2) Repayment of securitisation bonds is forecast based on the expected repayment profile of the underlying assets of the Trusts.

33
BOQ PRELIMINARY FINAL REPORT 2014
3.6. RISK MANAGEMENT (CONTINUED)
(c) Liquidity risk (continued)
Consolidated 2013
Carrying amount
$mAt Call
$m3 mths or less
$m3 to 12 mths
$m1 to 5 years
$mOver 5 years
$mPolicyholder
$m
Total contractual cash flows
$m
Derivative financial instruments (hedging relationship)
Contractual amounts payable - - 485.7 772.4 620.0 224.0 - 2,102.1
Contractual amounts receivable - - (533.7) (802.1) (582.0) (225.6) - (2,143.4)
(103.3) - (48.0) (29.7) 38.0 (1.6) - (41.3)
Off balance sheet positions
Guarantees, indemnities and letters of credit - 235.7 - - - - - 235.7
Customer funding commitments - 1,234.6 - - - - - 1,234.6
- 1,470.3 - - - - - 1,470.3
Bank 2014
Carrying amount
$mAt Call
$m3 mths or less
$m3 to 12 mths
$m1 to 5 years
$mOver 5 years
$m
Total contractual cash flows
$m
Financial liabilities
Due to other financial institutions 207.5 207.5 - - - - 207.5
Deposits 34,068.7 12,333.8 11,925.3 7,705.7 2,690.9 - 34,655.7
Derivative financial instruments (1) 5.0 - 1.9 1.8 2.0 - 5.7
Accounts payable and other liabilities 336.4 - 336.4 - - - 336.4
Borrowings including subordinated notes 947.9 - 68.3 324.2 663.8 - 1,056.3
Amounts due to controlled entities 1,224.1 1,224.1 - - - - 1,224.1
Total 36,789.6 13,765.4 12,331.9 8,031.7 3,356.7 - 37,485.7
Derivative financial instruments (hedging relationship)
Contractual amounts payable - - 309.7 709.2 696.5 207.9 1,923.3
Contractual amounts receivable - - (314.8) (677.8) (618.1) (116.8) (1,727.5)
100.3 - (5.1) 31.4 78.4 91.1 195.8
Off balance sheet positions
Guarantees, indemnities and letters of credit - 227.7 - - - - 227.7
Customer funding commitments - 796.7 - - - - 796.7
- 1,024.4 - - - - 1,024.4
(1) Derivative financial instruments other than those designated in a cashflow hedge relationship.
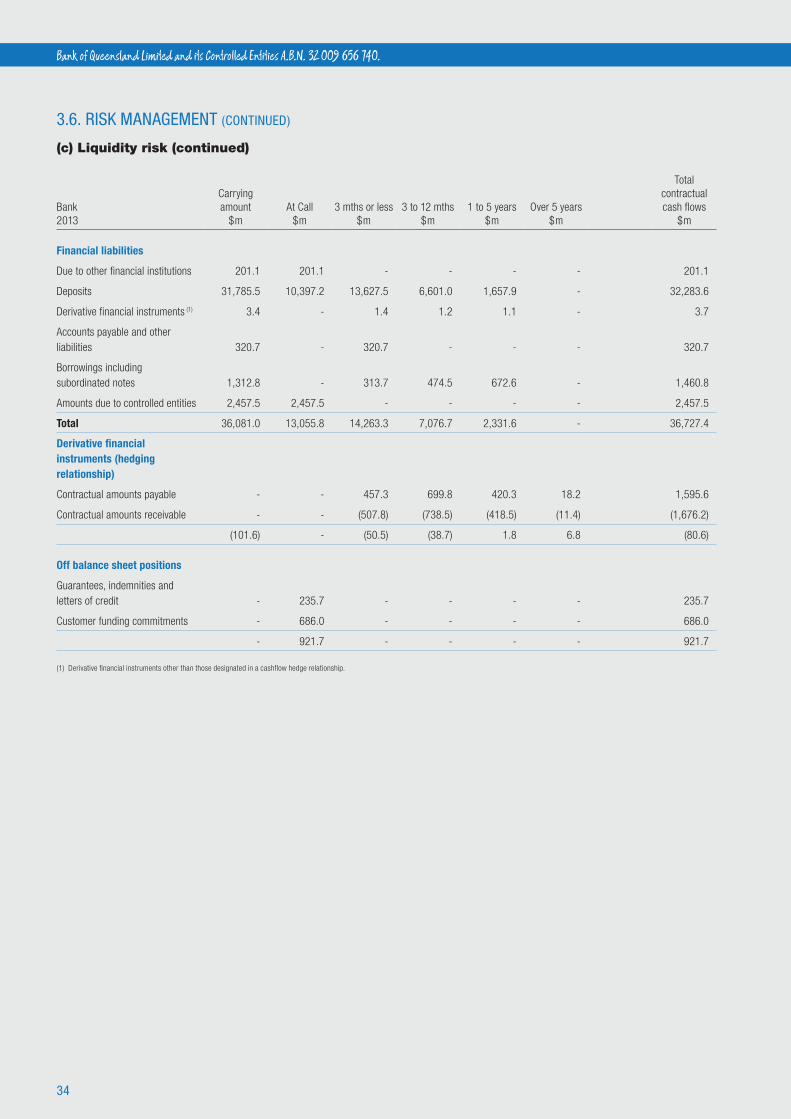
34
Bank of Queensland Limited and its Controlled Entities A.B.N. 32 009 656 740.
3.6. RISK MANAGEMENT (CONTINUED)
(c) Liquidity risk (continued)
Bank 2013
Carrying amount
$mAt Call
$m3 mths or less
$m3 to 12 mths
$m1 to 5 years
$mOver 5 years
$m
Total contractual cash flows
$m
Financial liabilities
Due to other financial institutions 201.1 201.1 - - - - 201.1
Deposits 31,785.5 10,397.2 13,627.5 6,601.0 1,657.9 - 32,283.6
Derivative financial instruments (1) 3.4 - 1.4 1.2 1.1 - 3.7
Accounts payable and other liabilities 320.7 - 320.7 - - - 320.7
Borrowings including subordinated notes 1,312.8 - 313.7 474.5 672.6 - 1,460.8
Amounts due to controlled entities 2,457.5 2,457.5 - - - - 2,457.5
Total 36,081.0 13,055.8 14,263.3 7,076.7 2,331.6 - 36,727.4
Derivative financial instruments (hedging relationship)
Contractual amounts payable - - 457.3 699.8 420.3 18.2 1,595.6
Contractual amounts receivable - - (507.8) (738.5) (418.5) (11.4) (1,676.2)
(101.6) - (50.5) (38.7) 1.8 6.8 (80.6)
Off balance sheet positions
Guarantees, indemnities and letters of credit - 235.7 - - - - 235.7
Customer funding commitments - 686.0 - - - - 686.0
- 921.7 - - - - 921.7
(1) Derivative financial instruments other than those designated in a cashflow hedge relationship.

35
BOQ PRELIMINARY FINAL REPORT 2014
3.6. RISK MANAGEMENT (CONTINUED).
(d) Insurance risk
(i) Risk management objectives and policies for risk mitigation
Insurance risks are controlled through the use of underwriting procedures, adequate premium rates and policy charges and sufficient reinsurance arrangements, all of which are approved through a Board approved governance structure. Controls are also maintained over claims management practices to assure the correct and timely payment of insurance claims.
(ii) Strategy for managing insurance risk
Portfolio of risks
The Bank’s insurance subsidiaries issue consumer credit insurance, term life insurance, group life insurance, accidental death insurance and motor vehicle gap insurance contracts. The performance of the Bank’s insurance subsidiaries and its continuing ability to write business depends on its ability to pre-empt and control risks. The Bank’s insurance subsidiaries have a risk management strategy which has been approved by their respective Board’s. It summarises the approach to risk and risk management.
Risk strategy
In compliance with contractual and regulatory requirements, a strategy is in place to ensure that the risks underwritten satisfy objectives whilst not adversely affecting the Consolidated Entity’s ability to pay benefits and claims when due. The strategy involves the identification of risks by type, impact and likelihood, the implementation of processes and controls to mitigate the risks, and continuous monitoring and improvement of the procedures in place to minimise the chance of an adverse compliance or operational risk event occurring. Included in this strategy is the process for underwriting and product pricing to ensure products are appropriately priced. Capital management is also a key aspect of the Consolidated Entity’s risk management strategy. Capital requirements take account of all of the various regulatory reporting requirements to which the Consolidated Entity is subject.
Prudential capital requirements
Prudential capital requirements established by the APRA are in place to safeguard policyholders’ interests, which are primarily the ability to meet future claim payments to policyholders. These require the Company’s Capital Base to exceed the Prudential Capital Requirement throughout the year, not just at year end. The level of capital requirements also take into account specific risks faced by the Bank’s insurance subsidiaries.
(iii) Methods to limit or transfer insurance risk exposures
Reinsurance
The insurance subsidiary uses reinsurance arrangements to pass on or cede to reinsurers, risks that are outside of the subsidiary’s risk appetite.
Underwriting procedures
Strategic underwriting decisions are put into effect using the underwriting procedures detailed in the Bank’s insurance subsidiary’s Underwriting Policy. Such procedures include limits to delegated authorities and signing powers.
Claims management
Strict claims management procedures ensure timely and correct payment of claims in accordance with policy conditions.
Asset and liability management techniques
Assets are allocated to different classes of business using a risk based approach. The Bank’s insurance subsidiary has a mix of short and long term business and invests accordingly. Market risk is managed through investing in cash and deposits, bank issued commercial bills, cash management trusts and managed income funds. No more than 35% of shareholder funds and funds backing insurance policy liabilities can be invested with any one counterparty subject to counterparty credit ratings.
(v) Concentration of insurance risk
Insurance risks associated with human life events
The Bank’s insurance subsidiary aims to maintain a stable age profile and mix of the sexes within its portfolio of policyholders. This policy maintains a balance between the current and future profitability of the life business, and exposure to the significant external events. Despite the inevitable growth in policyholders at the age of retirement, the age profile and mix of sexes within the population of policyholders is sufficiently spread so that the risk concentration in relation to any particular age group is minimal.

36
Bank of Queensland Limited and its Controlled Entities A.B.N. 32 009 656 740.
3.7. FINANCIAL INSTRUMENTS
(a) Financial instrument classificationsIn addition to Loans and Advances and financial liabilities at amortised cost the Bank classifies its financial instruments into one of the following four categories upon initial recognition:
(i) Financial assets held for trading
Financial assets that are held as part of the Bank’s Trading Book (refer Section 3.3) are designated at fair value through the profit and loss. The Bank manages such financial assets and makes purchase and sale decisions based on their fair value in accordance with the Bank’s documented risk management or investment strategy. Upon initial recognition attributable transaction costs are recognised in profit or loss in the Income Statement when incurred. Financial instruments at fair value through the profit and loss are measured at fair value, and changes therein are recognised in profit or loss in the Income Statement.
(ii) Available-for-sale financial assets
Assets that are intended to be held for an indefinite period of time but which may be sold in response to changes in interest rates, exchange rates and liquidity needs are classified as available-for-sale. These assets are initially measured at fair value plus any directly attributable transaction costs, with any changes in fair value other than impairment losses (refer section 3.4), being recognised in other comprehensive income and accumulated in reserves in equity until the asset is sold. Interest income received on these assets is recorded as net interest income and any realised gains or losses recorded in other income in the Income Statement.
(iii) Receivables due from other financial institutions
Receivables due from other financial institutions are recognised and measured at amortised cost and include nostro balances (an account held with a foreign bank usually in a foreign currency) and settlement account balances.
(iv) Derivative financial instruments
The Consolidated Entity uses derivative financial instruments to hedge its exposure to foreign exchange and interest rate risks arising from operating, financing and investing activities. Refer to Section 3.8 for further information on Derivative Financial Instruments.
(b) Fair value of financial instrumentsThe financial assets and liabilities listed below are recognised and measured at fair value and therefore their carrying value equates to their face value:
• Available-for-sale financial assets;
• Financial assets and liabilities designated at fair value through the profit and loss;
• Derivatives; and
• Insurance policy liabilities.
The fair value estimates for instruments carried at amortised cost are based on the following methodologies and assumptions:
Cash and liquid assets, due from and to other financial institutions, accounts payable and other liabilities
The fair value approximates their carrying value as they are short term in nature or are receivable or payable on demand.
Loans and advances
Loans and advances are net of specific and collective provisions for doubtful debts and unearned income. The fair values of loans and advances that reprice within six months of year end are assumed to equate to the carrying value. The fair values of all other loans and advances are calculated using discounted cash flow models based on the maturity of the loans and advances. The discount rates applied are based on the current interest rates at the reporting date for similar types of loans and advances, if the loans and advances were performing at the reporting date. The differences between estimated fair values of loans and advances and carrying value reflect changes in interest rates and creditworthiness of borrowers since loan or advance origination.
Deposits
The fair value of non-interest bearing, call and variable rate deposits and fixed rate deposits repricing within six months is the carrying value. The fair value of other term deposits is calculated using discounted cash flow models based on the deposit type and its related maturity.
Borrowings including subordinated notes
The fair values are calculated based on a discounted cash flow model using a yield curve appropriate to the remaining maturity of the instruments.
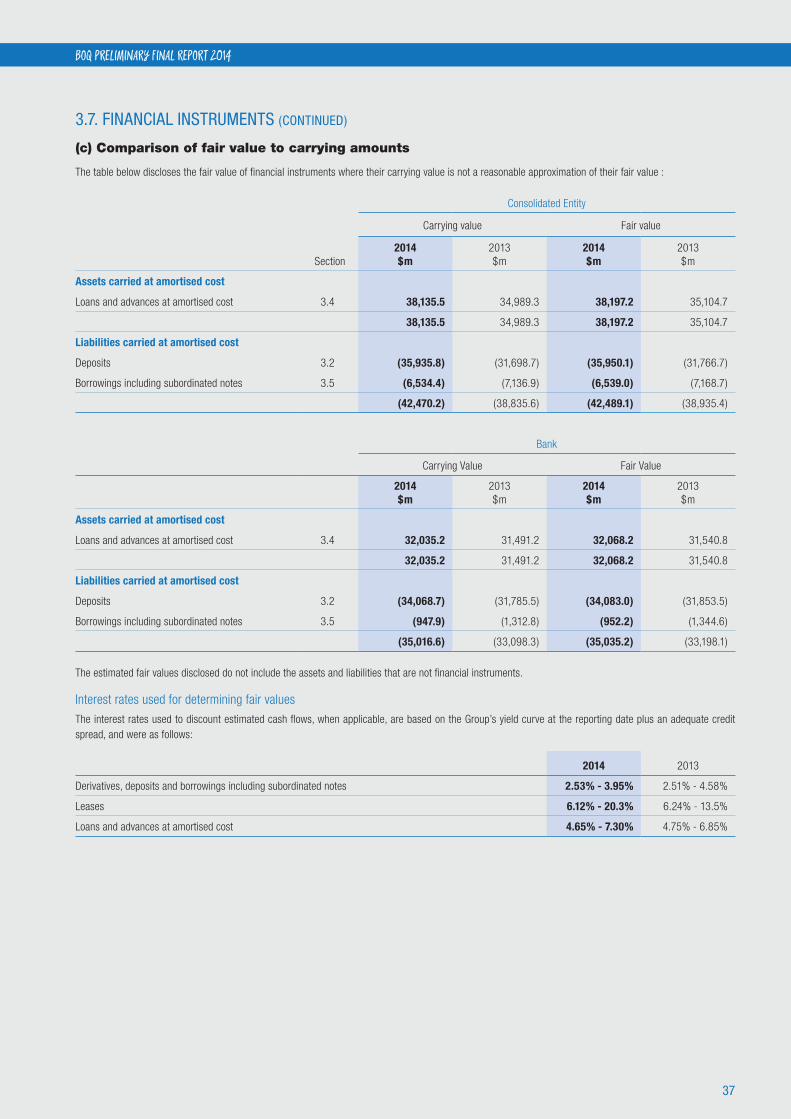
37
BOQ PRELIMINARY FINAL REPORT 2014
3.7. FINANCIAL INSTRUMENTS (CONTINUED)
(c) Comparison of fair value to carrying amounts
The table below discloses the fair value of financial instruments where their carrying value is not a reasonable approximation of their fair value :
Consolidated Entity
Carrying value Fair value
Section2014 $m
2013 $m
2014 $m
2013 $m
Assets carried at amortised cost
Loans and advances at amortised cost 3.4 38,135.5 34,989.3 38,197.2 35,104.7
38,135.5 34,989.3 38,197.2 35,104.7
Liabilities carried at amortised cost
Deposits 3.2 (35,935.8) (31,698.7) (35,950.1) (31,766.7)
Borrowings including subordinated notes 3.5 (6,534.4) (7,136.9) (6,539.0) (7,168.7)
(42,470.2) (38,835.6) (42,489.1) (38,935.4)
Bank
Carrying Value Fair Value
2014 $m
2013 $m
2014 $m
2013 $m
Assets carried at amortised cost
Loans and advances at amortised cost 3.4 32,035.2 31,491.2 32,068.2 31,540.8
32,035.2 31,491.2 32,068.2 31,540.8
Liabilities carried at amortised cost
Deposits 3.2 (34,068.7) (31,785.5) (34,083.0) (31,853.5)
Borrowings including subordinated notes 3.5 (947.9) (1,312.8) (952.2) (1,344.6)
(35,016.6) (33,098.3) (35,035.2) (33,198.1)
The estimated fair values disclosed do not include the assets and liabilities that are not financial instruments.
Interest rates used for determining fair values
The interest rates used to discount estimated cash flows, when applicable, are based on the Group’s yield curve at the reporting date plus an adequate credit spread, and were as follows:
2014 2013
Derivatives, deposits and borrowings including subordinated notes 2.53% - 3.95% 2.51% - 4.58%
Leases 6.12% - 20.3% 6.24% - 13.5%
Loans and advances at amortised cost 4.65% - 7.30% 4.75% - 6.85%

38
Bank of Queensland Limited and its Controlled Entities A.B.N. 32 009 656 740.
3.7. FINANCIAL INSTRUMENTS (CONTINUED)
(d) Fair value hierarchy
The Consolidated Entity measures fair values using the following fair value hierarchy, which reflects the significance of the inputs used in making the measurements:
• Level 1: inputs that are quoted market prices (unadjusted) in active markets for identical instruments.
• Level 2: inputs other than quoted prices included within level 1 that are observable either directly or indirectly.
• Level 3: inputs that are unobservable i.e. there is no observable market data.
The table below analyses financial instruments carried at fair value, by valuation method. There were no material movements in Level 3 during the year.
2014
Consolidated EntityLevel 1
$mLevel 2
$mLevel 3
$mTotal $m
Instruments carried at fair value
Available-for-sale financial assets 1,893.0 1,961.8 9.6 3,864.4
Financial assets designated at fair value through profit and loss - 2,473.1 - 2,473.1
Derivative assets - 160.3 - 160.3
1,893.0 4,595.2 9.6 6,497.8
Derivative liabilities - (248.7) - (248.7)
1,893.0 4,346.5 9.6 6,249.1
2013
Consolidated EntityLevel 1
$mLevel 2
$mLevel 3
$mTotal $m
Instruments carried at fair value
Available-for-sale financial assets 426.2 630.8 9.8 1,066.8
Financial assets designated at fair value through profit and loss 134.2 4,200.4 - 4,334.6
Derivative assets - 260.4 - 260.4
560.4 5,091.6 9.8 5,661.8
Derivative liabilities - (137.4) - (137.4)
560.4 4,954.2 9.8 5,524.4
The fair value hierarchy classification of instruments in Section 3.7 (c) is Loans and advances level 3, Deposits and Borrowings including subordinated notes level 2.
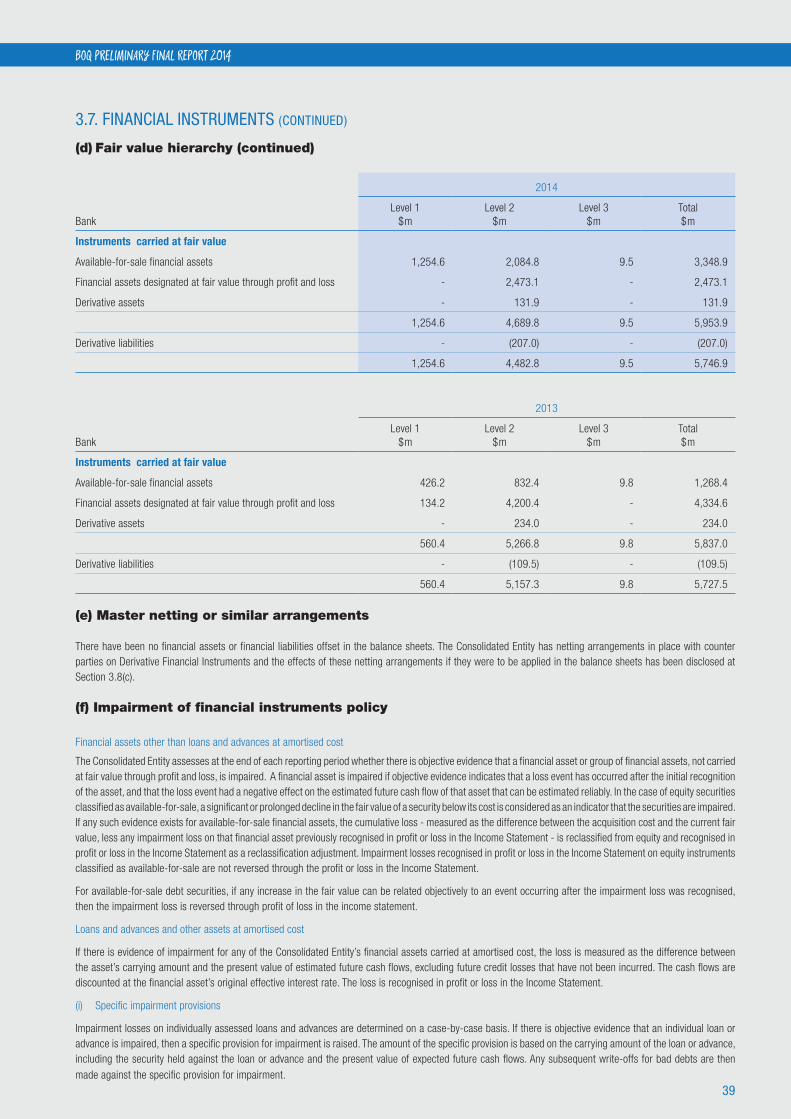
39
BOQ PRELIMINARY FINAL REPORT 2014
3.7. FINANCIAL INSTRUMENTS (CONTINUED)
(d) Fair value hierarchy (continued)
2014
Bank Level 1
$mLevel 2
$mLevel 3
$mTotal $m
Instruments carried at fair value
Available-for-sale financial assets 1,254.6 2,084.8 9.5 3,348.9
Financial assets designated at fair value through profit and loss - 2,473.1 - 2,473.1
Derivative assets - 131.9 - 131.9
1,254.6 4,689.8 9.5 5,953.9
Derivative liabilities - (207.0) - (207.0)
1,254.6 4,482.8 9.5 5,746.9
2013
Bank Level 1
$mLevel 2
$mLevel 3
$mTotal $m
Instruments carried at fair value
Available-for-sale financial assets 426.2 832.4 9.8 1,268.4
Financial assets designated at fair value through profit and loss 134.2 4,200.4 - 4,334.6
Derivative assets - 234.0 - 234.0
560.4 5,266.8 9.8 5,837.0
Derivative liabilities - (109.5) - (109.5)
560.4 5,157.3 9.8 5,727.5
(e) Master netting or similar arrangements
There have been no financial assets or financial liabilities offset in the balance sheets. The Consolidated Entity has netting arrangements in place with counter parties on Derivative Financial Instruments and the effects of these netting arrangements if they were to be applied in the balance sheets has been disclosed at Section 3.8(c).
(f) Impairment of financial instruments policy
Financial assets other than loans and advances at amortised cost
The Consolidated Entity assesses at the end of each reporting period whether there is objective evidence that a financial asset or group of financial assets, not carried at fair value through profit and loss, is impaired. A financial asset is impaired if objective evidence indicates that a loss event has occurred after the initial recognition of the asset, and that the loss event had a negative effect on the estimated future cash flow of that asset that can be estimated reliably. In the case of equity securities classified as available-for-sale, a significant or prolonged decline in the fair value of a security below its cost is considered as an indicator that the securities are impaired. If any such evidence exists for available-for-sale financial assets, the cumulative loss - measured as the difference between the acquisition cost and the current fair value, less any impairment loss on that financial asset previously recognised in profit or loss in the Income Statement - is reclassified from equity and recognised in profit or loss in the Income Statement as a reclassification adjustment. Impairment losses recognised in profit or loss in the Income Statement on equity instruments classified as available-for-sale are not reversed through the profit or loss in the Income Statement.
For available-for-sale debt securities, if any increase in the fair value can be related objectively to an event occurring after the impairment loss was recognised, then the impairment loss is reversed through profit of loss in the income statement.
Loans and advances and other assets at amortised cost
If there is evidence of impairment for any of the Consolidated Entity’s financial assets carried at amortised cost, the loss is measured as the difference between the asset’s carrying amount and the present value of estimated future cash flows, excluding future credit losses that have not been incurred. The cash flows are discounted at the financial asset’s original effective interest rate. The loss is recognised in profit or loss in the Income Statement.
(i) Specific impairment provisions
Impairment losses on individually assessed loans and advances are determined on a case-by-case basis. If there is objective evidence that an individual loan or advance is impaired, then a specific provision for impairment is raised. The amount of the specific provision is based on the carrying amount of the loan or advance, including the security held against the loan or advance and the present value of expected future cash flows. Any subsequent write-offs for bad debts are then made against the specific provision for impairment.

40
Bank of Queensland Limited and its Controlled Entities A.B.N. 32 009 656 740.
3.7. FINANCIAL INSTRUMENTS (CONTINUED)
(f) Impairment of financial instruments policy (continued)
(ii) Collective impairment provisions
Where no evidence of impairment has been identified for loans and advances, these loans and advances are grouped together on the basis of similar credit characteristics for the purpose of calculating a collective impairment loss. Collective impairment provisions are based on historical loss experience adjusted for current observable data. The amount required to bring the collective provision for impairment to its required level is charged to profit or loss in the Income Statement.
3.8. DERIVATIVE FINANCIAL INSTRUMENTS
(a) Accounting for derivatives
The Consolidated Entity and Bank used derivative financial instruments for both hedging and trading purposes in the current year. Refer to Section 3.6(a) for an explanation of the Consolidated Entity’s and Bank’s risk management framework.
The Consolidated Entity uses derivative financial instruments to hedge its exposure to foreign exchange and interest rate risks arising from operating, financing and investing activities. In accordance with its Treasury policy, the Consolidated Entity can hold derivative financial instruments for trading purposes. Derivatives that do not qualify for hedge accounting are accounted for as trading instruments.
Derivative financial instruments are recognised initially at trade date fair value and are subsequently remeasured at fair value at the reporting date. The gain or loss on re-measurement is recognised immediately in profit or loss in the Income Statement. However, when derivatives qualify for hedge accounting, recognition of any resultant gain or loss depends on the nature of the hedge relationship as discussed below.
The fair value of interest rate swaps is the estimated amount that the Consolidated Entity would receive or pay to terminate the swap at the reporting date, taking into account current interest rates and the current creditworthiness of the swap counterparties. The fair value of forward exchange contracts is their quoted market price at the reporting date, being the present value of the quoted forward price. The fair value of futures contracts is their quoted market price.
Cash flow hedges
Where a derivative financial instrument is designated as a hedge of the variability of the cash flows of a recognised asset or liability, or a highly probable forecasted transaction, the effective part of any gain or loss on the derivative financial instrument is recognised directly in other comprehensive income and accumulated in reserves in equity. The ineffective portion of any gain or loss is recognised immediately in profit or loss in the Income Statement. If a hedge of a forecast transaction subsequently results in the recognition of a financial asset or a financial liability, then the associated gains and losses that were recognised directly in other comprehensive income are reclassified into profit or loss in the Income Statement in the same period or periods in which the asset acquired or liability assumed affects the Income Statement (i.e. when interest income or expense is recognised).
When a hedging instrument expires or is sold, terminated or exercised, or the Consolidated Entity revokes designation of the hedge relationship but if the hedged forecast transaction is still expected to occur, the cumulative gain or loss at that point remains in other comprehensive income and is recognised in accordance with the above policy when the transaction occurs. If the hedged transaction is no longer expected to take place, then the cumulative unrealised gain or loss is recognised immediately in profit or loss in the Income Statement.
Net investment hedge
Hedges of net investments in foreign operations are accounted for similarly to cash flow hedges. Any foreign currency gain or loss on the hedging instrument relating to the effective portion of the hedge is recognised in other comprehensive income and accumulated in reserves in equity. To the extent the hedge is ineffective, a portion is recognised immediately in the Income Statement within other income or other expenses.
Derivatives that do not qualify for hedge accounting
Certain derivative instruments do not qualify for hedge accounting. Changes in the fair value of any derivative instrument that does not qualify for hedge accounting are recognised immediately in the Income Statement and are included in other income. The Bank has not designated any hedges as fair value hedges.
(b) Fair value of derivatives
The following table summarises the notional and fair value of the Consolidated Entity’s and Bank’s commitments to derivative financial instruments at reporting date. Fair value in relation to derivative financial instruments is estimated using net present value techniques. The table on the following page set out the fair values of the derivative financial instruments at 31 August 2014.
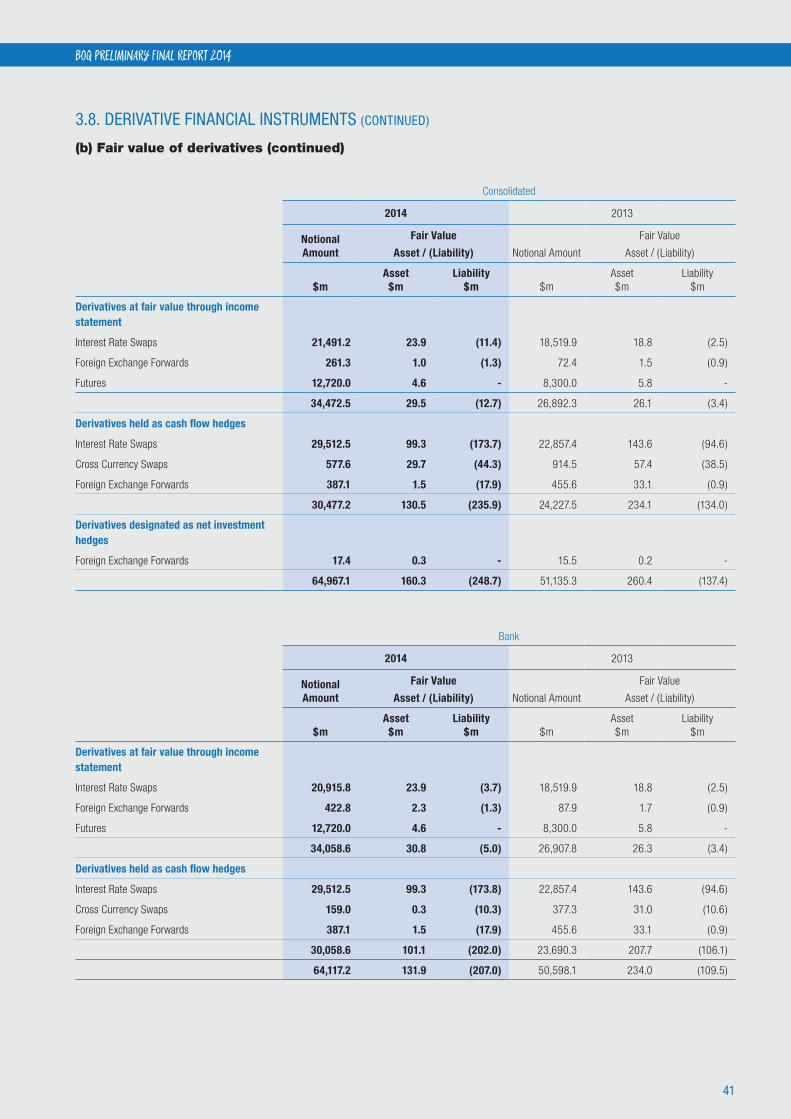
41
BOQ PRELIMINARY FINAL REPORT 2014
3.8. DERIVATIVE FINANCIAL INSTRUMENTS (CONTINUED)
(b) Fair value of derivatives (continued)
Consolidated
2014 2013
Notional Amount
Fair Value
Asset / (Liability) Notional Amount
Fair Value
Asset / (Liability)
$m Asset
$mLiability
$m $m Asset $m
Liability $m
Derivatives at fair value through income statement
Interest Rate Swaps 21,491.2 23.9 (11.4) 18,519.9 18.8 (2.5)
Foreign Exchange Forwards 261.3 1.0 (1.3) 72.4 1.5 (0.9)
Futures 12,720.0 4.6 - 8,300.0 5.8 -
34,472.5 29.5 (12.7) 26,892.3 26.1 (3.4)
Derivatives held as cash flow hedges
Interest Rate Swaps 29,512.5 99.3 (173.7) 22,857.4 143.6 (94.6)
Cross Currency Swaps 577.6 29.7 (44.3) 914.5 57.4 (38.5)
Foreign Exchange Forwards 387.1 1.5 (17.9) 455.6 33.1 (0.9)
30,477.2 130.5 (235.9) 24,227.5 234.1 (134.0)
Derivatives designated as net investment hedges
Foreign Exchange Forwards 17.4 0.3 - 15.5 0.2 -
64,967.1 160.3 (248.7) 51,135.3 260.4 (137.4)
Bank
2014 2013
Notional Amount
Fair Value
Asset / (Liability) Notional Amount
Fair Value
Asset / (Liability)
$m Asset
$mLiability
$m $m Asset $m
Liability $m
Derivatives at fair value through income statement
Interest Rate Swaps 20,915.8 23.9 (3.7) 18,519.9 18.8 (2.5)
Foreign Exchange Forwards 422.8 2.3 (1.3) 87.9 1.7 (0.9)
Futures 12,720.0 4.6 - 8,300.0 5.8 -
34,058.6 30.8 (5.0) 26,907.8 26.3 (3.4)
Derivatives held as cash flow hedges
Interest Rate Swaps 29,512.5 99.3 (173.8) 22,857.4 143.6 (94.6)
Cross Currency Swaps 159.0 0.3 (10.3) 377.3 31.0 (10.6)
Foreign Exchange Forwards 387.1 1.5 (17.9) 455.6 33.1 (0.9)
30,058.6 101.1 (202.0) 23,690.3 207.7 (106.1)
64,117.2 131.9 (207.0) 50,598.1 234.0 (109.5)

42
Bank of Queensland Limited and its Controlled Entities A.B.N. 32 009 656 740.
3.8 DERIVATIVE FINANCIAL INSTRUMENTS (CONTINUED)
(c) Master netting or similar arrangements
The Consolidated Entity enters into derivative transactions under International Swaps and Derivatives Association (ISDA) master netting agreements. Amounts owed by each counterparty are aggregated into a single net amount that is payable by one party to another. The Consolidated Entity has not offset these amounts in the Balance Sheets and the following table sets out the effect of netting arrangements on derivative financial assets and derivative financial liabilities if they were to be applied. The Consolidated Entity normally settles on a net basis or realises the derivative assets and liabilities simultaneously.
The Consolidated Entity receives and gives collateral in the form of cash in respect of derivatives and such collateral is subject to standard industry terms.
2014
Gross amounts as presented in the Balance
Sheets
Net amounts of recognised assets and
liabilities offsetCash collateral
Net amounts if offsetting applied in the
balance sheets
Derivative financial assets 160.3 (84.0) - 76.3
Derivative financial liabilities (248.7) 84.0 51.2 (113.5)
2013
Gross amounts as presented in the Balance
Sheets
Net amounts of recognised assets and
liabilities offsetCash collateral
Net amounts if offsetting applied in the
balance sheets
Derivative financial assets 260.4 (71.5) - 188.9
Derivative financial liabilities (137.4) 71.5 - (65.9)

43
BOQ PRELIMINARY FINAL REPORT 2014
3.9. CAPITAL MANAGEMENTThe Bank and Consolidated Entity’s capital management strategy aims to ensure adequate capital levels are maintained to protect deposit holders and to maximise shareholder return. The Bank’s capital is measured and managed in line with Prudential Standards issued by APRA. The capital management plan is updated annually and submitted to the Board for approval. The approval process is designed to ensure the plan is consistent with the overall business plan and for managing capital levels on an ongoing basis.
The Board has set the Common Equity Tier 1 capital target range to be between 8.0% and 9.0% of risk weighted assets and the total capital range to be between 11.5% and 12.5% of risk weighted assets. As at August 2014:
• Common Equity Tier 1 capital was 8.6%; and
• Total capital adequacy ratio was 12.0%.
Consolidated
Qualifying capital2014 $m
2013 $m
Common Equity Tier 1 Capital
Paid-up ordinary share capital 3,020.6 2,562.6
Reserves 58.0 41.7
Retained profits, including current year profits 207.0 149.6
Total Common Equity Tier 1 Capital 3,285.6 2,753.9
Regulatory adjustments
Deferred expenditure (122.1) (124.5)
Goodwill and intangibles (824.6) (586.8)
Other deductions (177.6) (182.0)
Total Regulatory adjustments (1,124.3) (893.3)
Net Common Equity Tier 1 Capital 2,161.3 1,860.6
Additional Tier 1 Capital 300.0 300.0
Net Tier 1 Capital 2,461.3 2,160.6
Tier 2 Capital
Tier 2 Capital 340.2 270.0
General Reserve for Credit Losses 207.4 207.7
Net Tier 2 Capital 547.6 477.7
Capital Base 3,008.9 2,638.3
Risk Weighted Assets 25,031.7 21,551.7
Capital Adequacy Ratio 12.0% 12.2%
Prepared in accordance with APS 110.
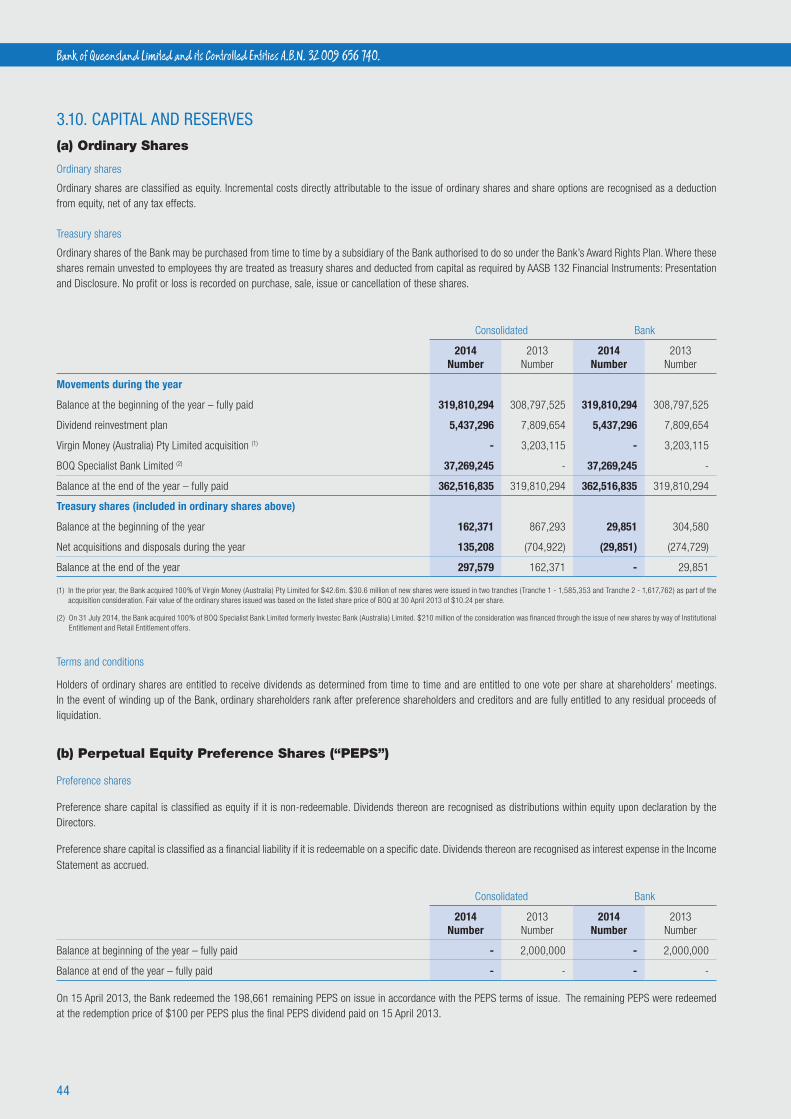
44
Bank of Queensland Limited and its Controlled Entities A.B.N. 32 009 656 740.
3.10. CAPITAL AND RESERVES
(a) Ordinary Shares
Ordinary shares
Ordinary shares are classified as equity. Incremental costs directly attributable to the issue of ordinary shares and share options are recognised as a deduction from equity, net of any tax effects.
Treasury shares
Ordinary shares of the Bank may be purchased from time to time by a subsidiary of the Bank authorised to do so under the Bank’s Award Rights Plan. Where these shares remain unvested to employees thy are treated as treasury shares and deducted from capital as required by AASB 132 Financial Instruments: Presentation and Disclosure. No profit or loss is recorded on purchase, sale, issue or cancellation of these shares.
Consolidated Bank
2014 Number
2013 Number
2014 Number
2013 Number
Movements during the year
Balance at the beginning of the year – fully paid 319,810,294 308,797,525 319,810,294 308,797,525
Dividend reinvestment plan 5,437,296 7,809,654 5,437,296 7,809,654
Virgin Money (Australia) Pty Limited acquisition (1) - 3,203,115 - 3,203,115
BOQ Specialist Bank Limited (2) 37,269,245 - 37,269,245 -
Balance at the end of the year – fully paid 362,516,835 319,810,294 362,516,835 319,810,294
Treasury shares (included in ordinary shares above)
Balance at the beginning of the year 162,371 867,293 29,851 304,580
Net acquisitions and disposals during the year 135,208 (704,922) (29,851) (274,729)
Balance at the end of the year 297,579 162,371 - 29,851
(1) In the prior year, the Bank acquired 100% of Virgin Money (Australia) Pty Limited for $42.6m. $30.6 million of new shares were issued in two tranches (Tranche 1 - 1,585,353 and Tranche 2 - 1,617,762) as part of the acquisition consideration. Fair value of the ordinary shares issued was based on the listed share price of BOQ at 30 April 2013 of $10.24 per share.
(2) On 31 July 2014, the Bank acquired 100% of BOQ Specialist Bank Limited formerly Investec Bank (Australia) Limited. $210 million of the consideration was financed through the issue of new shares by way of Institutional Entitlement and Retail Entitlement offers.
Terms and conditions
Holders of ordinary shares are entitled to receive dividends as determined from time to time and are entitled to one vote per share at shareholders’ meetings. In the event of winding up of the Bank, ordinary shareholders rank after preference shareholders and creditors and are fully entitled to any residual proceeds of liquidation.
(b) Perpetual Equity Preference Shares (“PEPS”)
Preference shares
Preference share capital is classified as equity if it is non-redeemable. Dividends thereon are recognised as distributions within equity upon declaration by the Directors.
Preference share capital is classified as a financial liability if it is redeemable on a specific date. Dividends thereon are recognised as interest expense in the Income Statement as accrued.
Consolidated Bank
2014 Number
2013 Number
2014 Number
2013 Number
Balance at beginning of the year – fully paid - 2,000,000 - 2,000,000
Balance at end of the year – fully paid - - - -
On 15 April 2013, the Bank redeemed the 198,661 remaining PEPS on issue in accordance with the PEPS terms of issue. The remaining PEPS were redeemed at the redemption price of $100 per PEPS plus the final PEPS dividend paid on 15 April 2013.

45
BOQ PRELIMINARY FINAL REPORT 2014
3.10. CAPITAL AND RESERVES (CONTINUED)
(c) Nature and purpose of reservesEmployee benefits reserve
The employee equity benefits reserve is used to record the value of share based payments provided to employees, including key management personnel, as part of their remuneration. Refer to Section 6.1 for further details of these plans.
Equity reserve for credit losses
Refer to significant accounting policies Section 6.10 (h).
Available-for-sale reserve
Changes in the fair value of investments, such as bonds and floating rate notes classified as available-for-sale financial assets, are recognised in other comprehensive income as described in Section 3.7 (a)(ii) and accumulated in a separate reserve within equity. Amounts are reclassified to profit or loss when the associated assets are sold or impaired.
Cash flow hedge reserve
The hedging reserve is used to record gains or losses on a hedging instrument in a cash flow hedge that are recognised in other comprehensive income, as described in Section 3.8 (a). Amounts are reclassified to profit or loss when the associated hedged transaction affects profit or loss.
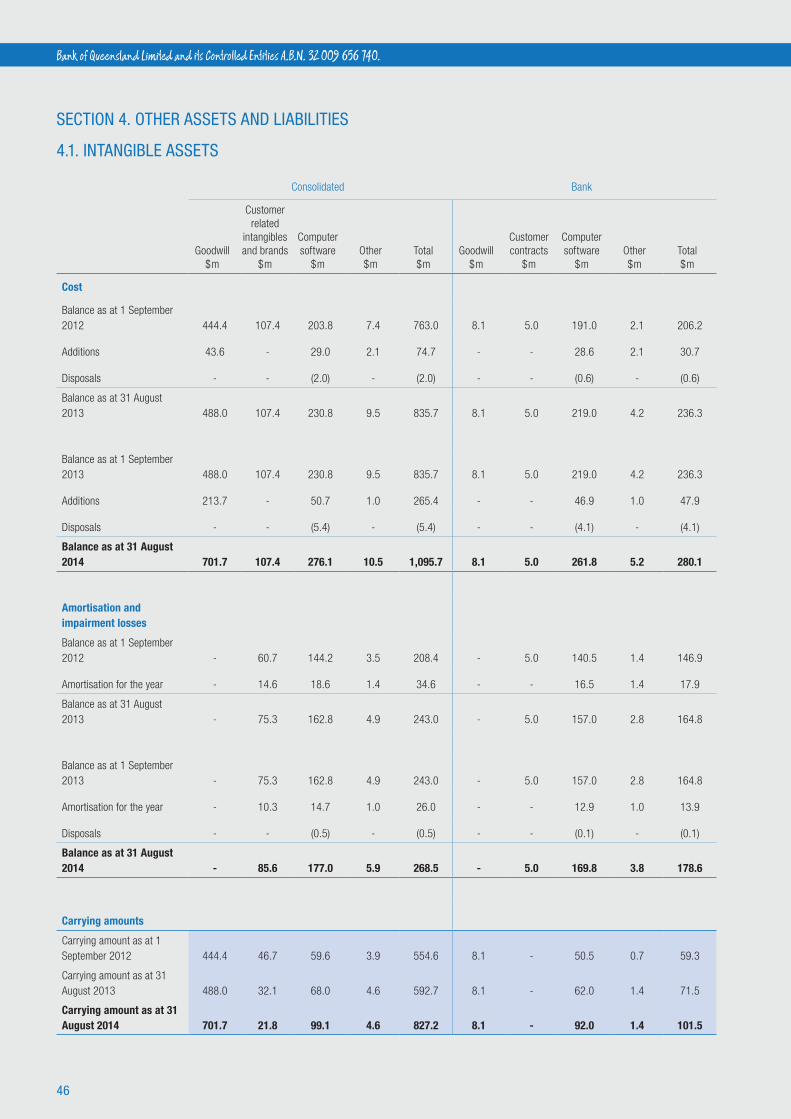
46
Bank of Queensland Limited and its Controlled Entities A.B.N. 32 009 656 740.
SECTION 4. OTHER ASSETS AND LIABILITIES
4.1. INTANGIBLE ASSETS
Consolidated Bank
Goodwill$m
Customer related
intangibles and brands
$m
Computer software
$mOther$m
Total$m
Goodwill$m
Customer contracts
$m
Computer software
$mOther$m
Total$m
Cost
Balance as at 1 September 2012 444.4 107.4 203.8 7.4 763.0 8.1 5.0 191.0 2.1 206.2
Additions 43.6 - 29.0 2.1 74.7 - - 28.6 2.1 30.7
Disposals - - (2.0) - (2.0) - - (0.6) - (0.6)
Balance as at 31 August 2013 488.0 107.4 230.8 9.5 835.7 8.1 5.0 219.0 4.2 236.3
Balance as at 1 September 2013 488.0 107.4 230.8 9.5 835.7 8.1 5.0 219.0 4.2 236.3
Additions 213.7 - 50.7 1.0 265.4 - - 46.9 1.0 47.9
Disposals - - (5.4) - (5.4) - - (4.1) - (4.1)
Balance as at 31 August 2014 701.7 107.4 276.1 10.5 1,095.7 8.1 5.0 261.8 5.2 280.1
Amortisation and impairment losses
Balance as at 1 September 2012 - 60.7 144.2 3.5 208.4 - 5.0 140.5 1.4 146.9
Amortisation for the year - 14.6 18.6 1.4 34.6 - - 16.5 1.4 17.9
Balance as at 31 August 2013 - 75.3 162.8 4.9 243.0 - 5.0 157.0 2.8 164.8
Balance as at 1 September 2013 - 75.3 162.8 4.9 243.0 - 5.0 157.0 2.8 164.8
Amortisation for the year - 10.3 14.7 1.0 26.0 - - 12.9 1.0 13.9
Disposals - - (0.5) - (0.5) - - (0.1) - (0.1)
Balance as at 31 August 2014 - 85.6 177.0 5.9 268.5 - 5.0 169.8 3.8 178.6
Carrying amounts
Carrying amount as at 1 September 2012 444.4 46.7 59.6 3.9 554.6 8.1 - 50.5 0.7 59.3
Carrying amount as at 31 August 2013 488.0 32.1 68.0 4.6 592.7 8.1 - 62.0 1.4 71.5
Carrying amount as at 31 August 2014 701.7 21.8 99.1 4.6 827.2 8.1 - 92.0 1.4 101.5

47
BOQ PRELIMINARY FINAL REPORT 2014
4.1. INTANGIBLE ASSETS (CONTINUED)
Impairment testing of the cash generating units containing goodwill
Consolidated Bank
The aggregate carrying amounts of goodwill are:
2014
$m
2013
$m
2014
$m
2013
$m
BOQ Equipment Finance Limited 12.9 12.9 - -
Orix debtor finance division 8.1 8.1 8.1 8.1
Pioneer Permanent Building Society Limited 24.0 24.0 - -
Home Building Society Ltd 399.4 399.4 - -
Virgin Money (Australia) Pty Ltd 43.0 43.6 - -
BOQ Specialist Bank Limited 214.3 - - -
701.7 488.0 8.1 8.1
Goodwill on acquisition of all of the above entities has been allocated to the Banking cash generating unit (“CGU”). The impairment test for goodwill is performed by comparing the CGU’s carrying amount with its recoverable amount. The recoverable amount is based on the CGU’s value in use for both CGU’s. The excess of the recoverable amount over the carrying amount was $640.9 million (2013: $1,297.3 million).
Value in use was determined by discounting the future cash flows generated from the continued use of the CGU and was based on the following assumptions:
• cash flows based on the banking segment’s 3 year projections (2013: 3 years);
• a medium term growth rate of 9% (2013: 9%) for the 7 years (2013: 7 years) subsequent to these projections;
• a terminal value at year 10 based on a long term growth rate of 3% (2013: 3%) and a terminal price earnings multiple of 11.7 (2013: 13.6) times earnings; and
• a pre tax discount rate of 15.8% (2013: 14.8%).
The values assigned to the key assumptions represent management’s assessments of future trends in banking and are based on both external and internal sources. In assessing the volatility of these assumptions management has identified two key assumptions that if a reasonably possible change occurred could cause the carrying amount of the Banking CGU to exceed the recoverable amount. The two assumptions identified are set out below along with the amount by which each would need to change in order for the estimated recoverable amount to be equal to the carrying amount.
2014
%
2013
%
Pre tax discount rate 18.0 18.7
Medium term growth rate 6.0 3.7
Accounting policy
Initial recognition and measurement Intangible assets are stated at cost less any accumulated amortisation and any impairment losses. Expenditure on internally generated goodwill, research costs and brands is recognised in the Income Statement as an expense as incurred.
Subsequent expenditure Subsequent expenditure on intangible assets is capitalised only when it increases the future economic benefits embodied in the specific asset to which it relates. All other expenditure is expensed as incurred. Consideration transferred included the fair values of the assets transferred, liabilities incurred by the Consolidated Entity to the previous owners of the acquired entity, and equity interests issued by the Consolidated Entity.
GoodwillGoodwill is the excess of the cost of acquisition over the fair value of the Bank’s share of the identifiable net assets of the acquired subsidiary. Any goodwill is tested annually for impairment, with any impairment taken directly to the profit or loss in the Income Statement. Consideration transferred included the fair values of the assets transferred, liabilities incurred by the Consolidated Entity to the previous owners of the acquired entity, and equity interests issued by the Consolidated Entity.
Amortisation Except for goodwill, amortisation is charged to profit or loss in the Income Statement on a straight-line basis over the estimated useful life of the intangible asset unless the life of the intangible asset is indefinite. Where applicable, intangible assets are amortised from the date they are available for use. The amortisation period and method are reviewed on an annual basis. The amortisation rates used in the current and comparative periods are as follows: Years
Computer software 3-10
Customer related intangibles and brands 3-10

48
Bank of Queensland Limited and its Controlled Entities A.B.N. 32 009 656 740.
4.2. PROVISIONS Consolidated Bank
2014 $m
2013 $m
2014 $m
2013 $m
Employee benefits (1) 21.5 15.4 15.3 13.1
Leases 5.3 0.8 3.1 0.4
Product Review (2) 36.4 44.6 36.4 44.6
Provision for non-lending loss (3) 34.0 10.6 33.4 10.6
Other (4) 6.9 7.5 - -
Total 104.1 78.9 88.2 68.7
(1) Employee benefits provisions consist of annual leave and long service leave entitlements for employees. (2) Product review provision for customer refunds and review costs. (3) Included within the Non-lending losses provision is $31.5m in respect of the Storm Financial settlement. On 22 September 2014, the Bank announced an agreement to settle the outstanding Storm Financial proceedings which had been brought against the Bank by the Australia Securities and Investment Commission (ASIC) and a class action on behalf of borrowers advised by Storm Financial. Timing of settlement is unknown and subject to court approval of the agreed settlement provisions. (4) Other provisions include provision for non-lending losses and in the Consolidated Entity, insurance claims reserves.
Movements in provisions Movements in each class of provision during the year, other than employee benefits, are as follows:
Consolidated Bank
2014Leases
$m
Product Review
$mNon-lending
lossOther $m
Leases $m
Product Review
$mNon-lending
lossOther $m
Carrying amount at beginning of year 0.8 44.6 10.6 7.5 0.4 44.6 10.6 -
Additional provision recognised 5.6 - 33.0 (0.6) 3.6 - 32.5 -
Amounts utilised during the year (1.1) (8.2) (9.6) - (0.9) (8.2) (9.7) -
Carrying amount at end of year 5.3 36.4 34.0 6.9 3.1 36.4 33.4 -
Accounting policy
A provision is recognised in the Balance Sheet when the Consolidated Entity has a present legal or constructive obligation as a result of a past event, and it is probable that an outflow of economic benefits will be required to settle the obligation. If the effect is material, provisions are determined by discounting the expected future cash flows at a pre-tax rate that reflects current market assessments of the time value of money and, when appropriate, the risks specific to the liability.
49
BOQ PRELIMINARY FINAL REPORT 2014
SECTION 5. INSURANCE BUSINESS
5.1. INSURANCE BUSINESS
(a) Basis of preparation
The effective date of the actuarial report on life insurance policy liabilities and regulatory capital requirements, is 31 August 2014. The actuarial report was prepared by Mr Wayne Kenafacke, Fellow of the Institute of Actuaries of Australia. This report indicates that Mr Kenafacke is satisfied as to the accuracy of the data upon which policy liabilities have been determined.The amount of policy liabilities have been determined in accordance with methods and assumptions disclosed in this financial report and the requirements of applicable accounting standards. Specifically, policy liabilities for life insurance contracts are determined in accordance with AASB 1038 Life Insurance Contracts and LPS: 340 Valuation of Policy Liabilities. These require policy liabilities to be calculated in a way which allows for the systematic release of planned margins as services are provided to policyholders and premiums are received.
Accumulation methods have been used to estimate the policy liabilities, as the provision for unearned premium reserve less a deferred acquisition cost component. Outstanding claims liabilities and Incurred But Not Reported (IBNR) liabilities are included in provisions.
Premium earning pattern
For single premium products, the Unearned Premium Reserve (“UPR”) is based on a premium earning pattern that is similar to the pattern of expected future claim payments. The future claim payments are based on an assessment of the future sum insured (e.g. outstanding loan balances for mortgage and loan protection) and future claims frequencies. Past experience is used to set these assumptions. This earning pattern is also used to recognise commissions incurred.
For regular premium products, the UPR is based on the unearned proportion of premium for the given premium payment frequency.
Mortality and morbidity
Mortality and morbidity assumptions used in determining IBNR, pending and continuing claims provisions have been based on the experience of similar products issued by the Company and recent experience. The disputed claims provision is based on individual claim estimates and an assumed 50% probability of disputed claims being incurred.
(b) Processes used to determine actuarial assumptions
Sensitivity analysis
As a result of using an accumulation approach in the determination of policy liabilities, changes of assumptions will not affect the policy liabilities in the current period. As at 31 August 2014, no Related Product Groups were in loss recognition. Changes in the underlying variables and assumptions will give rise to a difference in the emergence of profit margins in the future.
Changes in assumptions relating to claims provisions would affect policy liabilities in the current period.
Variable Impact of movement in underlying variable
Mortality rates For contracts providing death benefits, greater mortality rates would lead to higher levels of claims occurring sooner than anticipated, increasing associated claims cost and therefore reducing profit and shareholder equity.
Morbidity rates The cost of disability related claims depends on both the incidence of policyholders becoming disabled and the duration which they remain so. Higher than expected incidence and duration would be likely to increase claim costs, reducing profit and shareholder’s equity.

50
Bank of Queensland Limited and its Controlled Entities A.B.N. 32 009 656 740.
5.1. INSURANCE BUSINESS (CONTINUED)
(c) Reconciliation of movements
2014 $m
2013 $m
Reconciliation of movements in insurance policy liabilities
Life Insurance contract policy liabilities
Gross life insurance contract liabilities at the beginning of the financial year 60.7 62.6
Decrease in life insurance contract policy liabilities (i) (8.8) (1.9)
Gross life insurance contract liabilities at the end of the financial year 51.9 60.7
Liabilities ceded under reinsurance
Opening balance at the beginning of the financial year (2.3) (2.8)
Decrease in life reinsurance assets (ii) 0.4 0.5
Closing balance at the end of the financial year (1.9) (2.3)
Net life policy liabilities at the end of the financial year 50.0 58.4
(i) plus (ii) = change in life insurance contract liabilities reflected in the Income Statement (8.4) (1.4)
Components of net life insurance contract liabilities
Future policy benefits 75.9 81.4
Future charges for acquisition costs (25.9) (23.0)
Total net life insurance contract policy liabilities 50.0 58.4
Components of general insurance liabilities
Unearned Premium Liability 12.1 13.3
Outstanding Claims Liability 0.9 0.8
13.0 14.1
Total Insurance Policy Liabilities 63.0 72.5
Note: Future policy benefits include the unearned premium components of the liability. The accumulation method has been used to calculate policy liabilities and components relating to expenses and profits are not separately calculated.
(d) Life Insurance Regulatory Capital requirements
The regulatory capital requirement of each fund and for the subsidiary in total is the amount required to be held in accordance with LPS 110: Capital Adequacy. These are amounts required to meet the prudential standards prescribed by the Life Insurance Act 1995 to provide protection against the impact of fluctuations and unexpected adverse circumstances on the life company.
The methodology and bases for determining the Capital Base and regulatory capital requirements are in accordance with relevant Prudential Requirements.
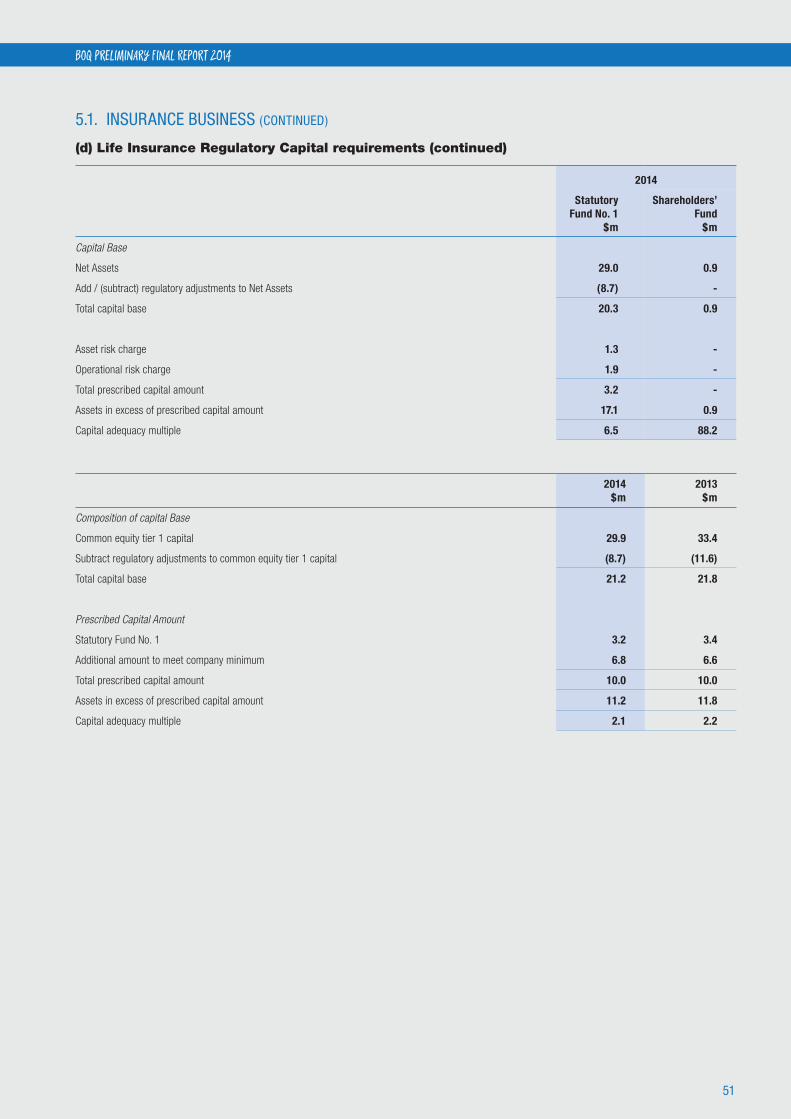
51
BOQ PRELIMINARY FINAL REPORT 2014
5.1. INSURANCE BUSINESS (CONTINUED)
(d) Life Insurance Regulatory Capital requirements (continued)
2014
Statutory Fund No. 1
$m
Shareholders’ Fund
$m
Capital Base
Net Assets 29.0 0.9
Add / (subtract) regulatory adjustments to Net Assets (8.7) -
Total capital base 20.3 0.9
Asset risk charge 1.3 -
Operational risk charge 1.9 -
Total prescribed capital amount 3.2 -
Assets in excess of prescribed capital amount 17.1 0.9
Capital adequacy multiple 6.5 88.2
2014 $m
2013 $m
Composition of capital Base
Common equity tier 1 capital 29.9 33.4
Subtract regulatory adjustments to common equity tier 1 capital (8.7) (11.6)
Total capital base 21.2 21.8
Prescribed Capital Amount
Statutory Fund No. 1 3.2 3.4
Additional amount to meet company minimum 6.8 6.6
Total prescribed capital amount 10.0 10.0
Assets in excess of prescribed capital amount 11.2 11.8
Capital adequacy multiple 2.1 2.2
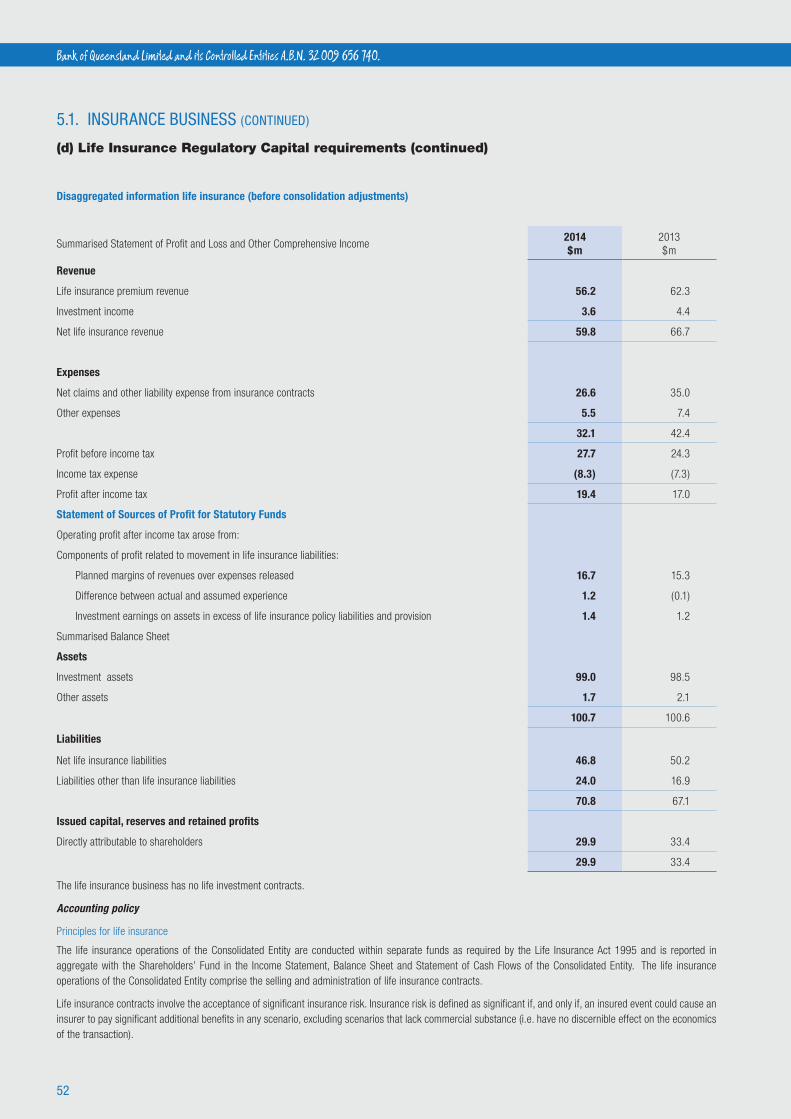
52
Bank of Queensland Limited and its Controlled Entities A.B.N. 32 009 656 740.
5.1. INSURANCE BUSINESS (CONTINUED)
(d) Life Insurance Regulatory Capital requirements (continued)
Disaggregated information life insurance (before consolidation adjustments)
Summarised Statement of Profit and Loss and Other Comprehensive Income2014 $m
2013 $m
Revenue
Life insurance premium revenue 56.2 62.3
Investment income 3.6 4.4
Net life insurance revenue 59.8 66.7
Expenses
Net claims and other liability expense from insurance contracts 26.6 35.0
Other expenses 5.5 7.4
32.1 42.4
Profit before income tax 27.7 24.3
Income tax expense (8.3) (7.3)
Profit after income tax 19.4 17.0
Statement of Sources of Profit for Statutory Funds
Operating profit after income tax arose from:
Components of profit related to movement in life insurance liabilities:
Planned margins of revenues over expenses released 16.7 15.3
Difference between actual and assumed experience 1.2 (0.1)
Investment earnings on assets in excess of life insurance policy liabilities and provision 1.4 1.2
Summarised Balance Sheet
Assets
Investment assets 99.0 98.5
Other assets 1.7 2.1
100.7 100.6
Liabilities
Net life insurance liabilities 46.8 50.2
Liabilities other than life insurance liabilities 24.0 16.9
70.8 67.1
Issued capital, reserves and retained profits
Directly attributable to shareholders 29.9 33.4
29.9 33.4
The life insurance business has no life investment contracts.
Accounting policy
Principles for life insurance
The life insurance operations of the Consolidated Entity are conducted within separate funds as required by the Life Insurance Act 1995 and is reported in aggregate with the Shareholders’ Fund in the Income Statement, Balance Sheet and Statement of Cash Flows of the Consolidated Entity. The life insurance operations of the Consolidated Entity comprise the selling and administration of life insurance contracts.
Life insurance contracts involve the acceptance of significant insurance risk. Insurance risk is defined as significant if, and only if, an insured event could cause an insurer to pay significant additional benefits in any scenario, excluding scenarios that lack commercial substance (i.e. have no discernible effect on the economics of the transaction).

53
BOQ PRELIMINARY FINAL REPORT 2014
5.1. INSURANCE BUSINESS (CONTINUED)
Accounting policy (continued)
Any products sold that do not meet the definition of a life insurance contract are classified as life investment contracts. Insurance contracts include those where the insured benefit is payable on the occurrence of a specified event such as death, injury or disability caused by accident or illness. The insured benefit is either not linked or only partly linked to the market value of the investments held by the Consolidated Entity, and the financial risks are substantially borne by the Consolidated Entity.
Monies held in the statutory fund are subject to distribution and transfer restrictions and other requirements of the Life Insurance Act 1995.
Under AASB 1038, the financial statements must include all assets, liabilities, revenues, expenses and equity, irrespective of whether they are designated as relating to shareholders or policy owners. Therefore, the Consolidated Entity’s financial statements comprise the total of all statutory funds and the Shareholders’ Fund.
Insurance contract liability
Profits of the insurance contract business are brought to account on a Margin on Services (“MoS”) basis in accordance with guidance provided by LPS 1.04: Valuation of Policy Liabilities as determined by APRA. Under MoS, profit is recognised as fees are received and services are provided to policyholders. When fees are received but the service has not been provided, the profit is deferred. Losses are expensed when identified.
Consistent with the principle of deferring unearned profit is the requirement to defer expenditure associated with the deferred profit. MoS permits costs associated with the acquisition of policies to be charged to profit or loss in the Income Statement over the period that the policy will generate profits. Costs may only be deferred to the extent that a policy is expected to be profitable.
Profit arising from life insurance is based on actuarial assumptions, and calculated as the excess of premiums and investment earnings less claims, operating expenses and the amortisation of acquisition costs that will be incurred over the estimated life of the policies. The profit is systematically recognised over the estimated time period the policy will remain in force.
Under MoS, insurance contract liabilities may be valued using an accumulation approach where this does not result in a material difference to the projection approach. The accumulation approach is deemed appropriate by the Directors and the appointed actuary. Under this approach, premiums received are deferred and earned in accordance with the underlying incidence of risk. Costs of acquiring insurance contracts, both direct and indirect, are deferred to the extent that related product groups are expected to be profitable. Where a related product group is not expected to be profitable, the insurance contract liability is increased by the excess of the present value of future expenses over future revenues.
Revenue Recognition
Premiums in respect of life insurance contracts are recognised as revenue in the Income Statement from the date of attachment of risk. Premiums with no due date are recognised as revenue on a received basis. Premiums with a regular due date are recognised as revenue on an accruals basis. Unpaid premiums are only recognised as revenue during the days of grace or where secured by the surrender value of the policy and are included in the intergroup balance in the Balance Sheet.
Investment income is recognised on an accruals basis. Realised and unrealised gains and losses are included in the Income Statement as investment income.
Claims expense – insurance contracts
Claims incurred all relate to the provision of services, including the bearing of risks, and are treated as expenses.
Claims are recognised when the liability to the policyholder under the policy contract has been established. Claims recognition is based upon:
• cost estimates for losses reported to the close of the financial year; and
• estimated incurred, but not reported losses, based upon past experience.
Deferred acquisition costs - Life insurance contracts
The fixed and variable costs of acquiring new life insurance business are deferred to the extent that such costs are deemed recoverable from future premiums or policy charges. These costs include commission, policy issue and underwriting costs, certain advertising costs and other sales costs. Acquisition costs deferred are limited to the lesser of the actual costs incurred and the allowance for the recovery of such costs in the premium or policy charges. The actual acquisition costs incurred are recorded in profit or loss in the Income Statement. The value and future recovery of these costs are assessed in determining policy liabilities. This has the effect that acquisition costs are deferred within the policy liability balance and amortised over the period that they will be recovered from premiums or policy charges.
Critical Accounting Judgements and Estimates:
The Consolidated Entity’s insurance subsidiary makes estimates and assumptions that affect the reported amounts of assets and liabilities within the next financial year. Estimates and judgements are continually evaluated and are based on historical experience and other factors, including expectations of future events that are believed to be reasonable under the circumstances. The areas where critical accounting judgements and estimates are applied are noted below.
Policy liabilities
Policy liabilities for life insurance contracts are computed using statistical or mathematical methods, which are expected to give approximately the same results as if an individual liability was calculated for each contract. The computations are made by suitably qualified personnel on the basis of recognised actuarial methods, with due regard to relevant actuarial principles. The methodology takes into account the risks and uncertainties of the particular classes of life insurance business written. The key factors that affect the estimation of these liabilities and related assets are:
• The cost of providing benefits and administering these insurance contracts;
• Mortality and morbidity experience on life insurance products, including enhancements to policyholder benefits; and
• Discontinuance experience, which affects the Bank’s ability to recover the cost of acquiring new business over the lives of the contracts.
In addition, factors such as regulation, competition, interest rates, taxes, securities market conditions and general economic conditions affect the level of these liabilities.
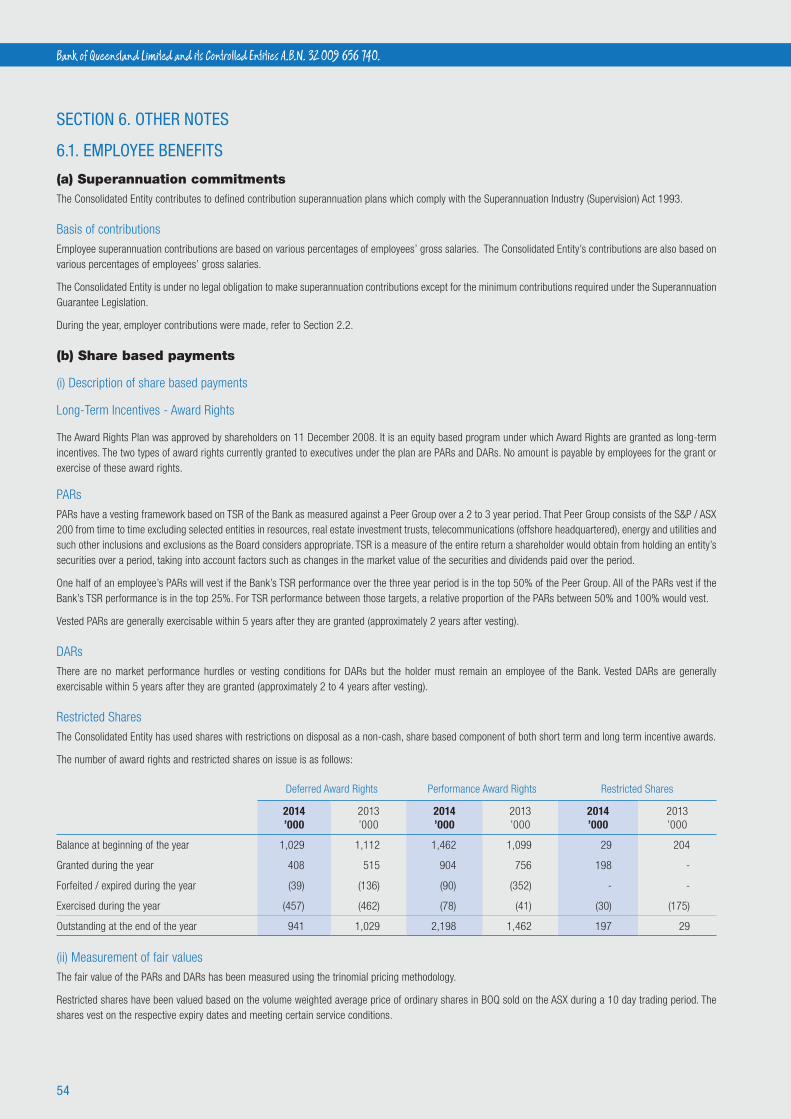
54
Bank of Queensland Limited and its Controlled Entities A.B.N. 32 009 656 740.
SECTION 6. OTHER NOTES
6.1. EMPLOYEE BENEFITS
(a) Superannuation commitmentsThe Consolidated Entity contributes to defined contribution superannuation plans which comply with the Superannuation Industry (Supervision) Act 1993.
Basis of contributions
Employee superannuation contributions are based on various percentages of employees’ gross salaries. The Consolidated Entity’s contributions are also based on various percentages of employees’ gross salaries.
The Consolidated Entity is under no legal obligation to make superannuation contributions except for the minimum contributions required under the Superannuation Guarantee Legislation.
During the year, employer contributions were made, refer to Section 2.2.
(b) Share based payments
(i) Description of share based payments
Long-Term Incentives - Award Rights
The Award Rights Plan was approved by shareholders on 11 December 2008. It is an equity based program under which Award Rights are granted as long-term incentives. The two types of award rights currently granted to executives under the plan are PARs and DARs. No amount is payable by employees for the grant or exercise of these award rights.
PARs
PARs have a vesting framework based on TSR of the Bank as measured against a Peer Group over a 2 to 3 year period. That Peer Group consists of the S&P / ASX 200 from time to time excluding selected entities in resources, real estate investment trusts, telecommunications (offshore headquartered), energy and utilities and such other inclusions and exclusions as the Board considers appropriate. TSR is a measure of the entire return a shareholder would obtain from holding an entity’s securities over a period, taking into account factors such as changes in the market value of the securities and dividends paid over the period.
One half of an employee’s PARs will vest if the Bank’s TSR performance over the three year period is in the top 50% of the Peer Group. All of the PARs vest if the Bank’s TSR performance is in the top 25%. For TSR performance between those targets, a relative proportion of the PARs between 50% and 100% would vest.
Vested PARs are generally exercisable within 5 years after they are granted (approximately 2 years after vesting).
DARs
There are no market performance hurdles or vesting conditions for DARs but the holder must remain an employee of the Bank. Vested DARs are generally exercisable within 5 years after they are granted (approximately 2 to 4 years after vesting).
Restricted Shares
The Consolidated Entity has used shares with restrictions on disposal as a non-cash, share based component of both short term and long term incentive awards.
The number of award rights and restricted shares on issue is as follows:
Deferred Award Rights Performance Award Rights Restricted Shares
2014 ’000
2013 ’000
2014 ’000
2013 ’000
2014 ’000
2013 ’000
Balance at beginning of the year 1,029 1,112 1,462 1,099 29 204
Granted during the year 408 515 904 756 198 -
Forfeited / expired during the year (39) (136) (90) (352) - -
Exercised during the year (457) (462) (78) (41) (30) (175)
Outstanding at the end of the year 941 1,029 2,198 1,462 197 29
(ii) Measurement of fair values
The fair value of the PARs and DARs has been measured using the trinomial pricing methodology.
Restricted shares have been valued based on the volume weighted average price of ordinary shares in BOQ sold on the ASX during a 10 day trading period. The shares vest on the respective expiry dates and meeting certain service conditions.
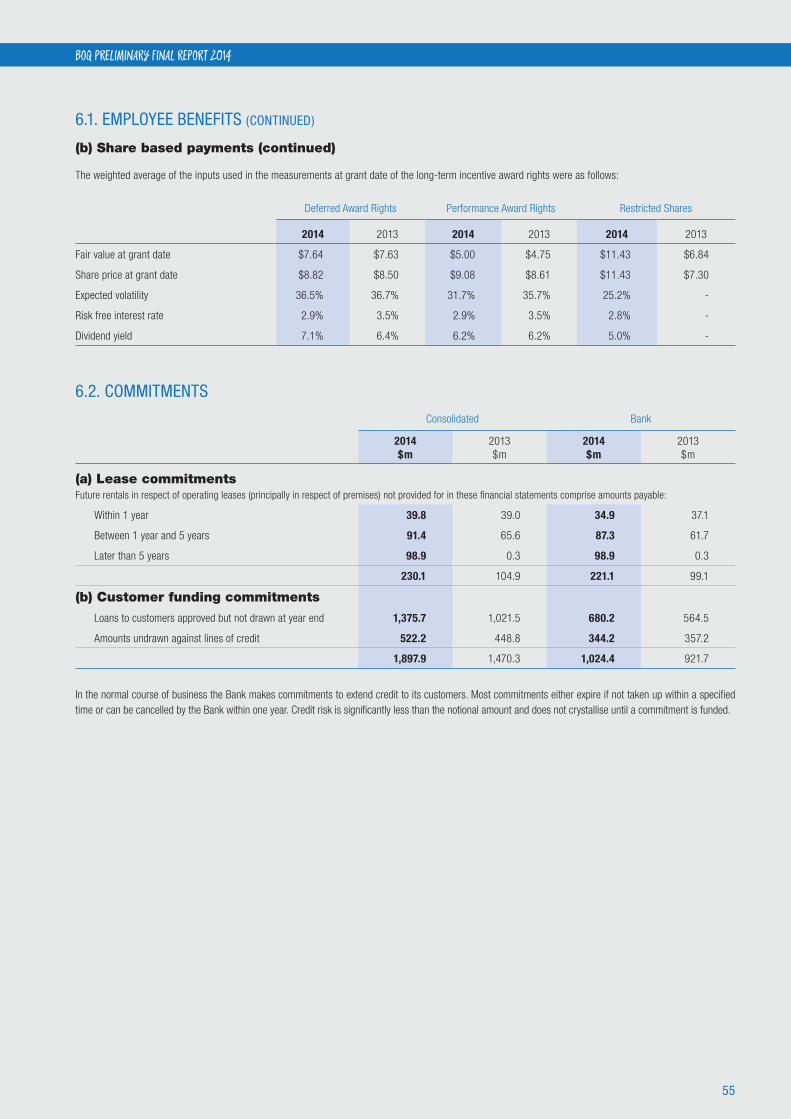
55
BOQ PRELIMINARY FINAL REPORT 2014
6.1. EMPLOYEE BENEFITS (CONTINUED)
(b) Share based payments (continued)
The weighted average of the inputs used in the measurements at grant date of the long-term incentive award rights were as follows:
Deferred Award Rights Performance Award Rights Restricted Shares
2014 2013 2014 2013 2014 2013
Fair value at grant date $7.64 $7.63 $5.00 $4.75 $11.43 $6.84
Share price at grant date $8.82 $8.50 $9.08 $8.61 $11.43 $7.30
Expected volatility 36.5% 36.7% 31.7% 35.7% 25.2% -
Risk free interest rate 2.9% 3.5% 2.9% 3.5% 2.8% -
Dividend yield 7.1% 6.4% 6.2% 6.2% 5.0% -
6.2. COMMITMENTS
Consolidated Bank
2014 $m
2013 $m
2014 $m
2013 $m
(a) Lease commitmentsFuture rentals in respect of operating leases (principally in respect of premises) not provided for in these financial statements comprise amounts payable:
Within 1 year 39.8 39.0 34.9 37.1
Between 1 year and 5 years 91.4 65.6 87.3 61.7
Later than 5 years 98.9 0.3 98.9 0.3
230.1 104.9 221.1 99.1
(b) Customer funding commitments
Loans to customers approved but not drawn at year end 1,375.7 1,021.5 680.2 564.5
Amounts undrawn against lines of credit 522.2 448.8 344.2 357.2
1,897.9 1,470.3 1,024.4 921.7
In the normal course of business the Bank makes commitments to extend credit to its customers. Most commitments either expire if not taken up within a specified time or can be cancelled by the Bank within one year. Credit risk is significantly less than the notional amount and does not crystallise until a commitment is funded.

56
Bank of Queensland Limited and its Controlled Entities A.B.N. 32 009 656 740.
6.3. CONTINGENT LIABILITIES
Consolidated Bank
2014 $m
2013 $m
2014 $m
2013 $m
Guarantees 239.9 227.3 215.4 227.3
Letters of credit 12.3 8.4 12.3 8.4
252.2 235.7 227.7 235.7
Guarantees, indemnities and letters of credit
There are contingent liabilities arising in the normal course of business for which there are equal and opposite contingent assets and against which no loss is
anticipated. Guarantees are provided to third parties on behalf of customers. The credit risks of such facilities are similar to the credit risks of loans and advances.
Legal proceedings
On 13 February 2014 judgement was given in favour of the Bank for proceedings involving the Bank by a number of former Owner-Managers in NSW. An appeal
has been filed in relation to this judgement. At this stage no estimate of any potential liability can be made.
6.4. RELATED PARTIES INFORMATION
(a) Controlled entities
Details of interests in material controlled entities are set out in Section 6.5.
During the year there have been transactions between the Bank and all of its controlled entities. The Bank conducted normal banking business with its operating
controlled entities. Amounts owing to or from controlled entities do not attract interest, except in respect of BOQ Equipment Finance Limited, St Andrew’s Australia
Services Pty Ltd, BOQ Finance (Aust) Ltd, BOQ Finance (NZ) Ltd and Virgin Money (Australia) Pty Limited where interest is charged on normal terms and conditions.
The Bank receives management fees from B.Q.L. Management Pty Ltd and BOQ Equipment Finance Limited.
The Bank has a related party relationship with equity accounted joint ventures, refer to Section 6.7.
(b) Key management personnel compensation
Key management personnel have authority and responsibility for planning, directing and controlling the activities of the Bank and the Consolidated Entity, including
Directors and other executives.
Key management personnel compensation included in ‘administrative expenses’ and ‘employee expenses’ (refer to Section 2.2) is as follows:
Consolidated and Bank
2014 $
2013 $
Short-term employee benefits 9,599,506 9,343,008
Post-employment benefits 298,792 263,992
Long term employee benefits 25,703 11,446
Termination benefits - 755,978
Share based employment benefits 5,192,081 3,554,972
15,116,082 13,929,396
Individual Directors and executives compensation disclosures
Information regarding individual Directors and executives compensation and some equity instruments disclosures as permitted by Corporations Regulation 2M.3.03
is provided in the Remuneration Report section of the Directors’ report.
Apart from the details disclosed in the Remuneration Report, no Director has entered into a material contract with the Bank since the end of the previous financial
year and there were no material contracts involving Directors’ interest existing at year end.

57
BOQ PRELIMINARY FINAL REPORT 2014
6.4. RELATED PARTIES INFORMATION (CONTINUED)
(c) Other financial instrument transactions with key management personnel and personally-related entities
A number of key management personnel or their related parties hold positions in other entities that result in them having control or significant influence over the financial or operating policies of those entities. Financial instrument transactions with key management personnel and personally-related entities during the financial year arise out of the provision of banking services, the acceptance of funds on deposit, the granting of loans and other associated financial activities. The terms and conditions of the transactions with management personnel and their related parties were no more favourable than those available, or which might reasonably be expected to be available on similar transactions to non-Director related entities on an arm’s length basis.
The following are transactions undertaken between the Consolidated Entity and key management personnel as at 31 August 2014:
Balance as at For the period (1)
01/09/13$
31/08/14$
Total Loan Repayments
$
Total LoanRedraws /
Further Advances
$
Total Loan / Overdraft interest
$
Total Fees on Loans /
Overdraft$
Term Products (Loans / Advances) (2,292,172) (3,619,345) 791,954 (1,965,439) (153,368) (320)
Balance as at For the period (1)
01/09/12 (2)
$31/08/13
$
Total Loan Repayments
$
Total LoanRedraws /
Further Advances
$
Total Loan / Overdraft interest
$
Total Fees on Loans /
Overdraft$
Term Products (Loans / Advances) (1,210,036) (2,292,172) 493,850 (2,603,395) (91,740) (113)
(1) Amounts are included only for the period that the Director / Executive is classified as a member of the key management personnel.
(2) Balance as at 1 September 2012 will not equal 31 August 2012 closing balance due to changes in key management personnel during the year.
Other transactions
Transactions between the Consolidated Entity and Key Management Personnel (other than loans/advances and shares) during the financial year related to personal banking, investment and deposit transactions. These transactions are considered trivial or domestic in nature, were on normal commercial terms and conditions and in the ordinary course of business.
Transactions between the Consolidated Entity and other related parties of Key Management Personnel relate to loans on normal commercial terms and conditions. Details of loans outstanding at the reporting date to other related parties of Directors and Senior Executives are as follows:
2014
Balance at 1 September
2013$
Interest paid and
payable during the year
$
Balance at
31 August 2014
$
Highest balance during
the year$
Richard Haire Related Party 191,000 9,148 191,000 191,777
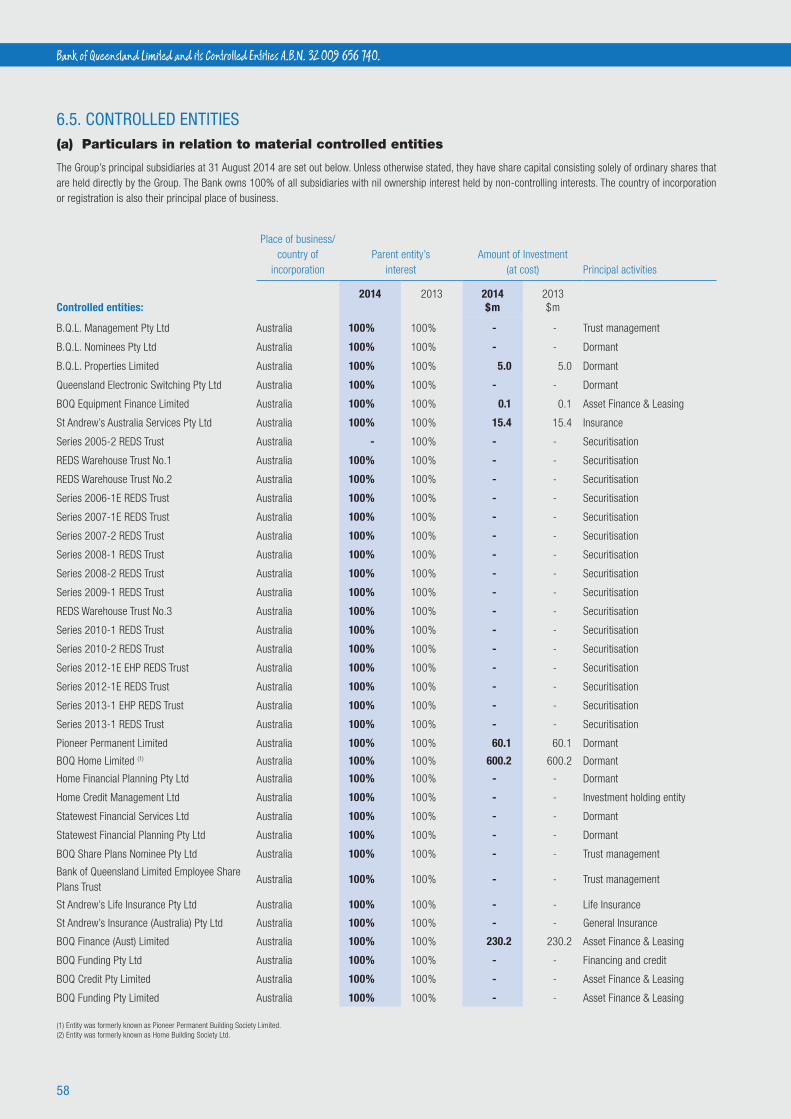
58
Bank of Queensland Limited and its Controlled Entities A.B.N. 32 009 656 740.
6.5. CONTROLLED ENTITIES (a) Particulars in relation to material controlled entities
The Group’s principal subsidiaries at 31 August 2014 are set out below. Unless otherwise stated, they have share capital consisting solely of ordinary shares that are held directly by the Group. The Bank owns 100% of all subsidiaries with nil ownership interest held by non-controlling interests. The country of incorporation or registration is also their principal place of business.
Place of business/country of
incorporationParent entity’s
interestAmount of Investment
(at cost) Principal activities
Controlled entities:2014 2013 2014
$m2013$m
B.Q.L. Management Pty Ltd Australia 100% 100% - - Trust management
B.Q.L. Nominees Pty Ltd Australia 100% 100% - - Dormant
B.Q.L. Properties Limited Australia 100% 100% 5.0 5.0 Dormant
Queensland Electronic Switching Pty Ltd Australia 100% 100% - - Dormant
BOQ Equipment Finance Limited Australia 100% 100% 0.1 0.1 Asset Finance & Leasing
St Andrew’s Australia Services Pty Ltd Australia 100% 100% 15.4 15.4 Insurance
Series 2005-2 REDS Trust Australia - 100% - - Securitisation
REDS Warehouse Trust No.1 Australia 100% 100% - - Securitisation
REDS Warehouse Trust No.2 Australia 100% 100% - - Securitisation
Series 2006-1E REDS Trust Australia 100% 100% - - Securitisation
Series 2007-1E REDS Trust Australia 100% 100% - - Securitisation
Series 2007-2 REDS Trust Australia 100% 100% - - Securitisation
Series 2008-1 REDS Trust Australia 100% 100% - - Securitisation
Series 2008-2 REDS Trust Australia 100% 100% - - Securitisation
Series 2009-1 REDS Trust Australia 100% 100% - - Securitisation
REDS Warehouse Trust No.3 Australia 100% 100% - - Securitisation
Series 2010-1 REDS Trust Australia 100% 100% - - Securitisation
Series 2010-2 REDS Trust Australia 100% 100% - - Securitisation
Series 2012-1E EHP REDS Trust Australia 100% 100% - - Securitisation
Series 2012-1E REDS Trust Australia 100% 100% - - Securitisation
Series 2013-1 EHP REDS Trust Australia 100% 100% - - Securitisation
Series 2013-1 REDS Trust Australia 100% 100% - - Securitisation
Pioneer Permanent Limited Australia 100% 100% 60.1 60.1 Dormant
BOQ Home Limited (1) Australia 100% 100% 600.2 600.2 Dormant
Home Financial Planning Pty Ltd Australia 100% 100% - - Dormant
Home Credit Management Ltd Australia 100% 100% - - Investment holding entity
Statewest Financial Services Ltd Australia 100% 100% - - Dormant
Statewest Financial Planning Pty Ltd Australia 100% 100% - - Dormant
BOQ Share Plans Nominee Pty Ltd Australia 100% 100% - - Trust management
Bank of Queensland Limited Employee Share Plans Trust
Australia 100% 100% - - Trust management
St Andrew’s Life Insurance Pty Ltd Australia 100% 100% - - Life Insurance
St Andrew’s Insurance (Australia) Pty Ltd Australia 100% 100% - - General Insurance
BOQ Finance (Aust) Limited Australia 100% 100% 230.2 230.2 Asset Finance & Leasing
BOQ Funding Pty Ltd Australia 100% 100% - - Financing and credit
BOQ Credit Pty Limited Australia 100% 100% - - Asset Finance & Leasing
BOQ Funding Pty Limited Australia 100% 100% - - Asset Finance & Leasing
(1) Entity was formerly known as Pioneer Permanent Building Society Limited.(2) Entity was formerly known as Home Building Society Ltd.
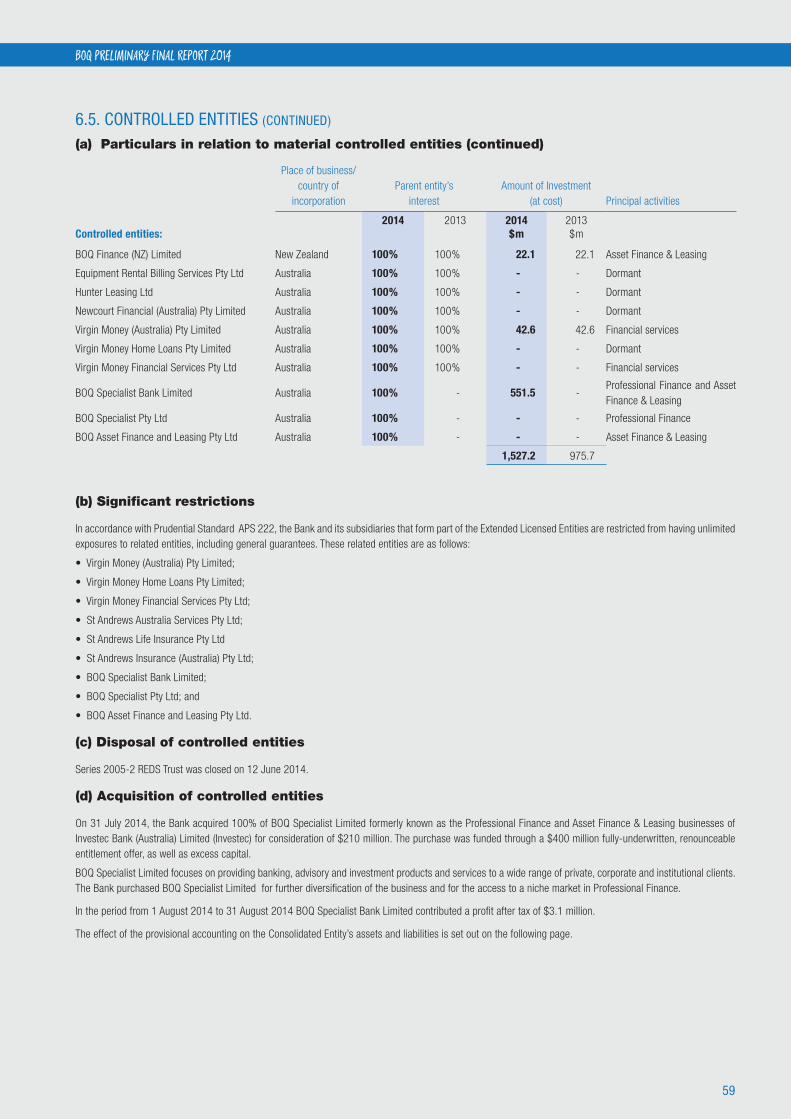
59
BOQ PRELIMINARY FINAL REPORT 2014
6.5. CONTROLLED ENTITIES (CONTINUED)
(a) Particulars in relation to material controlled entities (continued)
Place of business/country of
incorporationParent entity’s
interestAmount of Investment
(at cost) Principal activities
Controlled entities:2014 2013 2014
$m2013$m
BOQ Finance (NZ) Limited New Zealand 100% 100% 22.1 22.1 Asset Finance & Leasing
Equipment Rental Billing Services Pty Ltd Australia 100% 100% - - Dormant
Hunter Leasing Ltd Australia 100% 100% - - Dormant
Newcourt Financial (Australia) Pty Limited Australia 100% 100% - - Dormant
Virgin Money (Australia) Pty Limited Australia 100% 100% 42.6 42.6 Financial services
Virgin Money Home Loans Pty Limited Australia 100% 100% - - Dormant
Virgin Money Financial Services Pty Ltd Australia 100% 100% - - Financial services
BOQ Specialist Bank Limited Australia 100% - 551.5 -Professional Finance and Asset Finance & Leasing
BOQ Specialist Pty Ltd Australia 100% - - - Professional Finance
BOQ Asset Finance and Leasing Pty Ltd Australia 100% - - - Asset Finance & Leasing
1,527.2 975.7
(b) Significant restrictions
In accordance with Prudential Standard APS 222, the Bank and its subsidiaries that form part of the Extended Licensed Entities are restricted from having unlimited exposures to related entities, including general guarantees. These related entities are as follows:
• Virgin Money (Australia) Pty Limited;
• Virgin Money Home Loans Pty Limited;
• Virgin Money Financial Services Pty Ltd;
• St Andrews Australia Services Pty Ltd;
• St Andrews Life Insurance Pty Ltd
• St Andrews Insurance (Australia) Pty Ltd;
• BOQ Specialist Bank Limited;
• BOQ Specialist Pty Ltd; and
• BOQ Asset Finance and Leasing Pty Ltd.
(c) Disposal of controlled entities
Series 2005-2 REDS Trust was closed on 12 June 2014.
(d) Acquisition of controlled entities
On 31 July 2014, the Bank acquired 100% of BOQ Specialist Limited formerly known as the Professional Finance and Asset Finance & Leasing businesses of Investec Bank (Australia) Limited (Investec) for consideration of $210 million. The purchase was funded through a $400 million fully-underwritten, renounceable entitlement offer, as well as excess capital.
BOQ Specialist Limited focuses on providing banking, advisory and investment products and services to a wide range of private, corporate and institutional clients. The Bank purchased BOQ Specialist Limited for further diversification of the business and for the access to a niche market in Professional Finance.
In the period from 1 August 2014 to 31 August 2014 BOQ Specialist Bank Limited contributed a profit after tax of $3.1 million.
The effect of the provisional accounting on the Consolidated Entity’s assets and liabilities is set out on the following page.
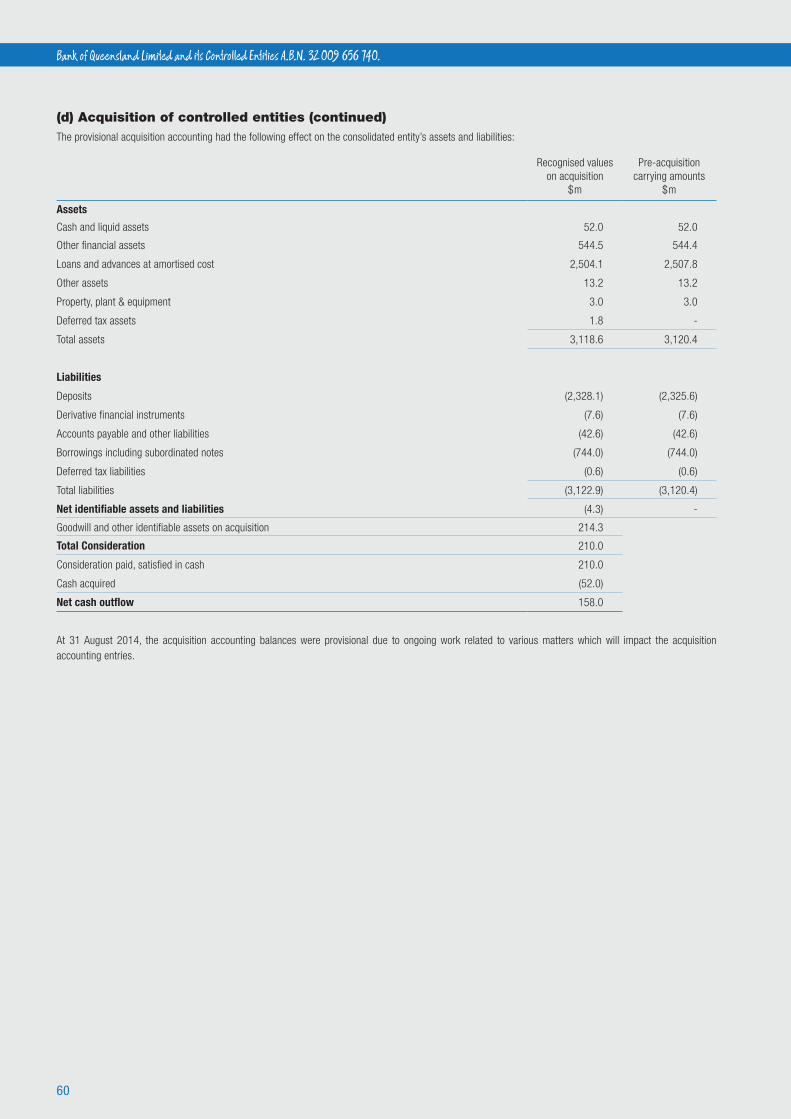
60
Bank of Queensland Limited and its Controlled Entities A.B.N. 32 009 656 740.
(d) Acquisition of controlled entities (continued)The provisional acquisition accounting had the following effect on the consolidated entity’s assets and liabilities:
Recognised values on acquisition
$m
Pre-acquisition carrying amounts
$m
Assets
Cash and liquid assets 52.0 52.0
Other financial assets 544.5 544.4
Loans and advances at amortised cost 2,504.1 2,507.8
Other assets 13.2 13.2
Property, plant & equipment 3.0 3.0
Deferred tax assets 1.8 -
Total assets 3,118.6 3,120.4
Liabilities
Deposits (2,328.1) (2,325.6)
Derivative financial instruments (7.6) (7.6)
Accounts payable and other liabilities (42.6) (42.6)
Borrowings including subordinated notes (744.0) (744.0)
Deferred tax liabilities (0.6) (0.6)
Total liabilities (3,122.9) (3,120.4)
Net identifiable assets and liabilities (4.3) -
Goodwill and other identifiable assets on acquisition 214.3
Total Consideration 210.0
Consideration paid, satisfied in cash 210.0
Cash acquired (52.0)
Net cash outflow 158.0
At 31 August 2014, the acquisition accounting balances were provisional due to ongoing work related to various matters which will impact the acquisition accounting entries.
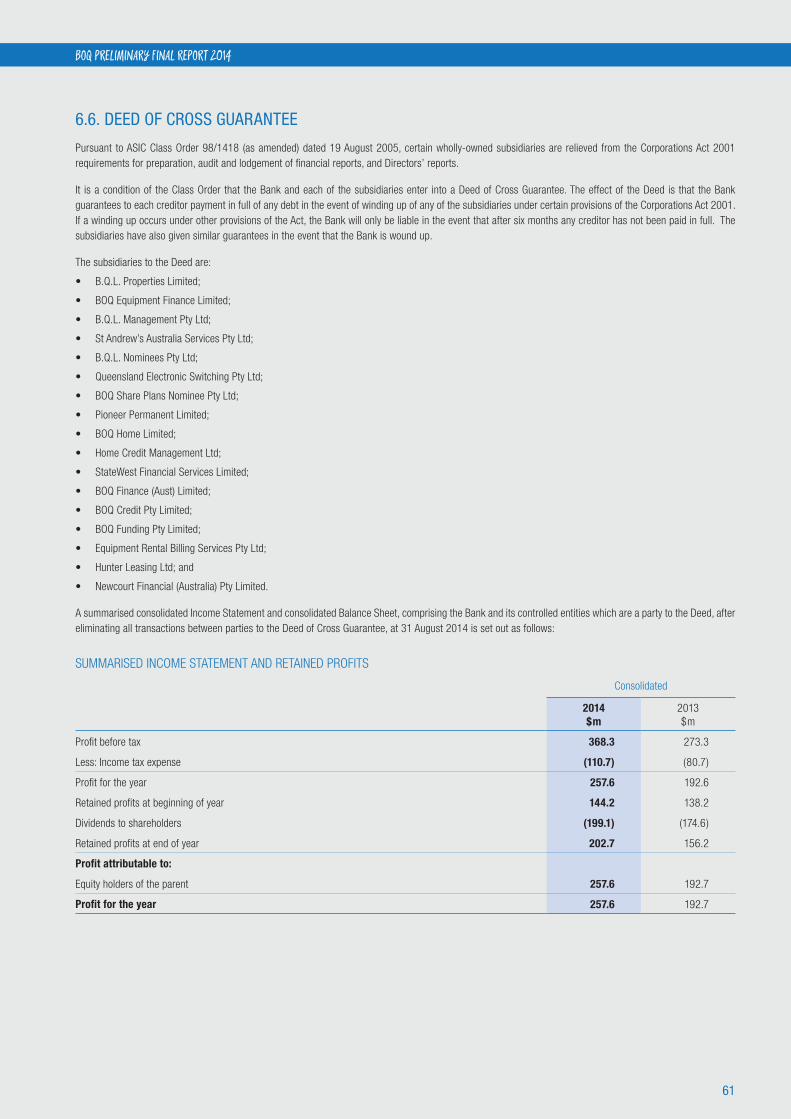
61
BOQ PRELIMINARY FINAL REPORT 2014
6.6. DEED OF CROSS GUARANTEE
Pursuant to ASIC Class Order 98/1418 (as amended) dated 19 August 2005, certain wholly-owned subsidiaries are relieved from the Corporations Act 2001 requirements for preparation, audit and lodgement of financial reports, and Directors’ reports.
It is a condition of the Class Order that the Bank and each of the subsidiaries enter into a Deed of Cross Guarantee. The effect of the Deed is that the Bank guarantees to each creditor payment in full of any debt in the event of winding up of any of the subsidiaries under certain provisions of the Corporations Act 2001. If a winding up occurs under other provisions of the Act, the Bank will only be liable in the event that after six months any creditor has not been paid in full. The subsidiaries have also given similar guarantees in the event that the Bank is wound up.
The subsidiaries to the Deed are:
• B.Q.L. Properties Limited;
• BOQ Equipment Finance Limited;
• B.Q.L. Management Pty Ltd;
• St Andrew’s Australia Services Pty Ltd;
• B.Q.L. Nominees Pty Ltd;
• Queensland Electronic Switching Pty Ltd;
• BOQ Share Plans Nominee Pty Ltd;
• Pioneer Permanent Limited;
• BOQ Home Limited;
• Home Credit Management Ltd;
• StateWest Financial Services Limited;
• BOQ Finance (Aust) Limited;
• BOQ Credit Pty Limited;
• BOQ Funding Pty Limited;
• Equipment Rental Billing Services Pty Ltd;
• Hunter Leasing Ltd; and
• Newcourt Financial (Australia) Pty Limited.
A summarised consolidated Income Statement and consolidated Balance Sheet, comprising the Bank and its controlled entities which are a party to the Deed, after eliminating all transactions between parties to the Deed of Cross Guarantee, at 31 August 2014 is set out as follows:
SUMMARISED INCOME STATEMENT AND RETAINED PROFITS
Consolidated
2014 $m
2013 $m
Profit before tax 368.3 273.3
Less: Income tax expense (110.7) (80.7)
Profit for the year 257.6 192.6
Retained profits at beginning of year 144.2 138.2
Dividends to shareholders (199.1) (174.6)
Retained profits at end of year 202.7 156.2
Profit attributable to:
Equity holders of the parent 257.6 192.7
Profit for the year 257.6 192.7
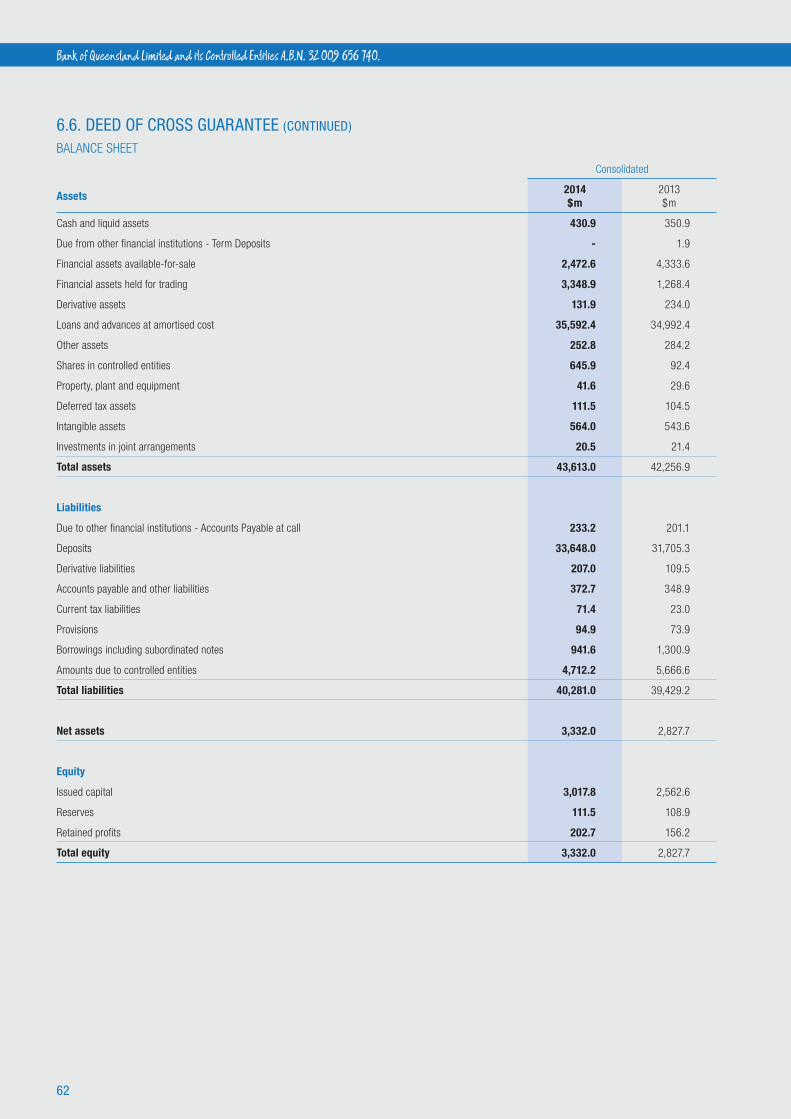
62
Bank of Queensland Limited and its Controlled Entities A.B.N. 32 009 656 740.
6.6. DEED OF CROSS GUARANTEE (CONTINUED)
BALANCE SHEET
Consolidated
Assets 2014 $m
2013 $m
Cash and liquid assets 430.9 350.9
Due from other financial institutions - Term Deposits - 1.9
Financial assets available-for-sale 2,472.6 4,333.6
Financial assets held for trading 3,348.9 1,268.4
Derivative assets 131.9 234.0
Loans and advances at amortised cost 35,592.4 34,992.4
Other assets 252.8 284.2
Shares in controlled entities 645.9 92.4
Property, plant and equipment 41.6 29.6
Deferred tax assets 111.5 104.5
Intangible assets 564.0 543.6
Investments in joint arrangements 20.5 21.4
Total assets 43,613.0 42,256.9
Liabilities
Due to other financial institutions - Accounts Payable at call 233.2 201.1
Deposits 33,648.0 31,705.3
Derivative liabilities 207.0 109.5
Accounts payable and other liabilities 372.7 348.9
Current tax liabilities 71.4 23.0
Provisions 94.9 73.9
Borrowings including subordinated notes 941.6 1,300.9
Amounts due to controlled entities 4,712.2 5,666.6
Total liabilities 40,281.0 39,429.2
Net assets 3,332.0 2,827.7
Equity
Issued capital 3,017.8 2,562.6
Reserves 111.5 108.9
Retained profits 202.7 156.2
Total equity 3,332.0 2,827.7
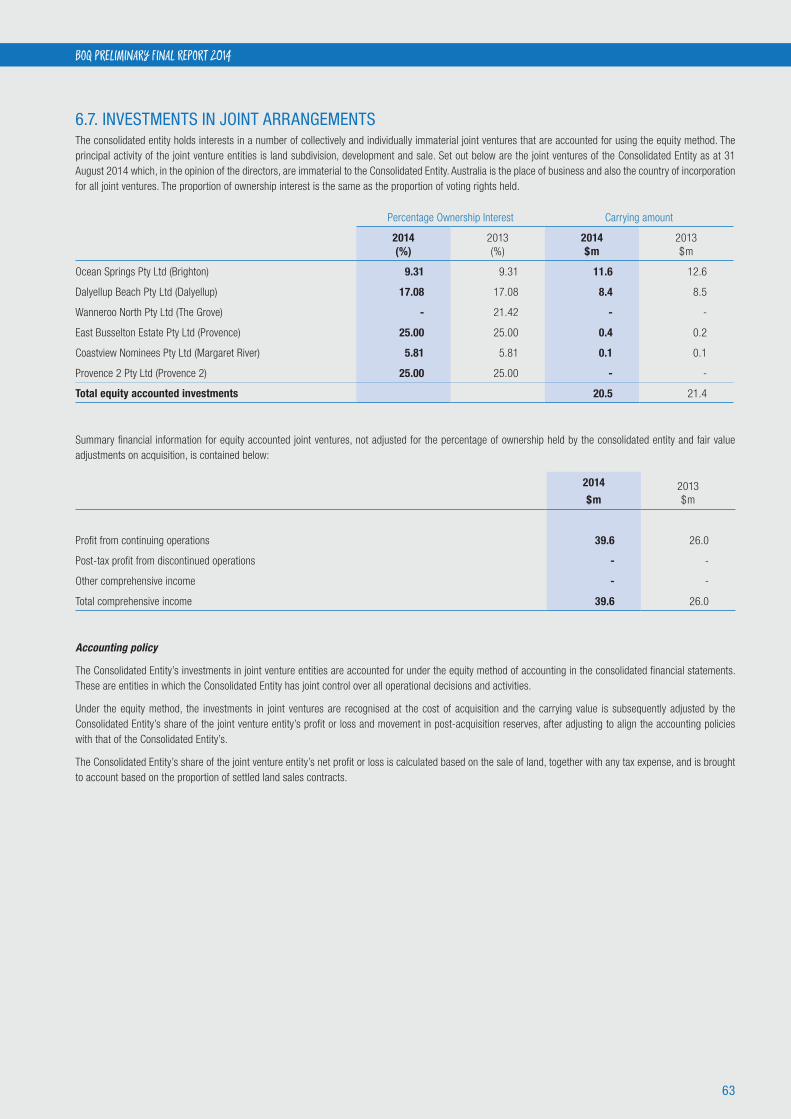
63
BOQ PRELIMINARY FINAL REPORT 2014
6.7. INVESTMENTS IN JOINT ARRANGEMENTSThe consolidated entity holds interests in a number of collectively and individually immaterial joint ventures that are accounted for using the equity method. The principal activity of the joint venture entities is land subdivision, development and sale. Set out below are the joint ventures of the Consolidated Entity as at 31 August 2014 which, in the opinion of the directors, are immaterial to the Consolidated Entity. Australia is the place of business and also the country of incorporation for all joint ventures. The proportion of ownership interest is the same as the proportion of voting rights held.
Percentage Ownership Interest Carrying amount
2014 (%)
2013 (%)
2014 $m
2013 $m
Ocean Springs Pty Ltd (Brighton) 9.31 9.31 11.6 12.6
Dalyellup Beach Pty Ltd (Dalyellup) 17.08 17.08 8.4 8.5
Wanneroo North Pty Ltd (The Grove) - 21.42 - -
East Busselton Estate Pty Ltd (Provence) 25.00 25.00 0.4 0.2
Coastview Nominees Pty Ltd (Margaret River) 5.81 5.81 0.1 0.1
Provence 2 Pty Ltd (Provence 2) 25.00 25.00 - -
Total equity accounted investments 20.5 21.4
Summary financial information for equity accounted joint ventures, not adjusted for the percentage of ownership held by the consolidated entity and fair value adjustments on acquisition, is contained below:
2014
$m2013 $m
Profit from continuing operations 39.6 26.0
Post-tax profit from discontinued operations - -
Other comprehensive income - -
Total comprehensive income 39.6 26.0
Accounting policy
The Consolidated Entity’s investments in joint venture entities are accounted for under the equity method of accounting in the consolidated financial statements. These are entities in which the Consolidated Entity has joint control over all operational decisions and activities.
Under the equity method, the investments in joint ventures are recognised at the cost of acquisition and the carrying value is subsequently adjusted by the Consolidated Entity’s share of the joint venture entity’s profit or loss and movement in post-acquisition reserves, after adjusting to align the accounting policies with that of the Consolidated Entity’s.
The Consolidated Entity’s share of the joint venture entity’s net profit or loss is calculated based on the sale of land, together with any tax expense, and is brought to account based on the proportion of settled land sales contracts.
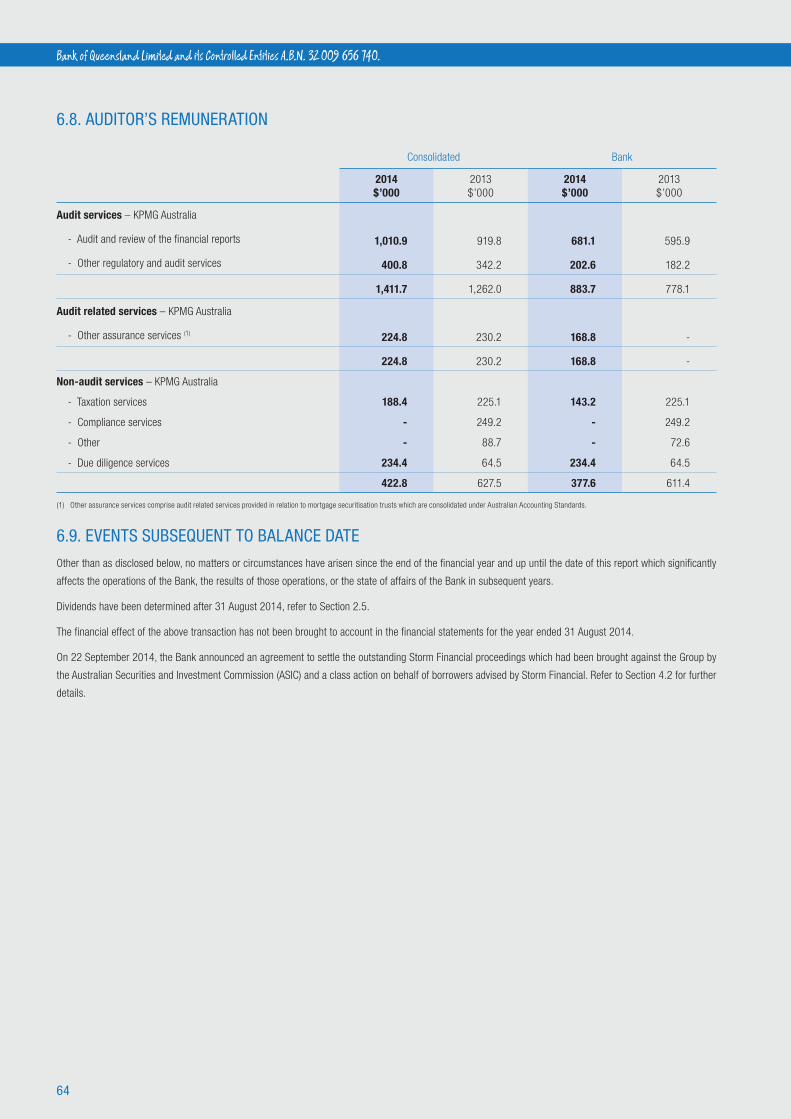
64
Bank of Queensland Limited and its Controlled Entities A.B.N. 32 009 656 740.
6.8. AUDITOR’S REMUNERATION
Consolidated Bank
2014 $’000
2013 $’000
2014 $’000
2013 $’000
Audit services – KPMG Australia
- Audit and review of the financial reports 1,010.9 919.8 681.1 595.9
- Other regulatory and audit services 400.8 342.2 202.6 182.2
1,411.7 1,262.0 883.7 778.1
Audit related services – KPMG Australia
- Other assurance services (1) 224.8 230.2 168.8 -
224.8 230.2 168.8 -
Non-audit services – KPMG Australia
- Taxation services 188.4 225.1 143.2 225.1
- Compliance services - 249.2 - 249.2
- Other - 88.7 - 72.6
- Due diligence services 234.4 64.5 234.4 64.5
422.8 627.5 377.6 611.4
(1) Other assurance services comprise audit related services provided in relation to mortgage securitisation trusts which are consolidated under Australian Accounting Standards.
6.9. EVENTS SUBSEQUENT TO BALANCE DATE
Other than as disclosed below, no matters or circumstances have arisen since the end of the financial year and up until the date of this report which significantly
affects the operations of the Bank, the results of those operations, or the state of affairs of the Bank in subsequent years.
Dividends have been determined after 31 August 2014, refer to Section 2.5.
The financial effect of the above transaction has not been brought to account in the financial statements for the year ended 31 August 2014.
On 22 September 2014, the Bank announced an agreement to settle the outstanding Storm Financial proceedings which had been brought against the Group by
the Australian Securities and Investment Commission (ASIC) and a class action on behalf of borrowers advised by Storm Financial. Refer to Section 4.2 for further
details.

65
BOQ PRELIMINARY FINAL REPORT 2014
6.10. SIGNIFICANT ACCOUNTING POLICIES & NEW ACCOUNTING STANDARDS
The accounting policies set out below have been applied consistently to all periods presented in the consolidated financial report, and have been applied consistently across the Consolidated Entity.
(a) Basis of consolidation
(i) Subsidiaries
Subsidiaries are entities controlled by the Bank. Control exists when the Bank has the power, directly or indirectly, to govern the financial and operating policies of an entity so as to benefit from its activities. In assessing control, potential voting rights that presently are exercisable or convertible are taken into account. The financial statements of subsidiaries are included in the consolidated financial report from the date that control commences until the date that control ceases. In the Bank’s financial statements, investments in subsidiaries are carried at cost.
(ii) Securitisation
The Bank conducts a loan securitisation program whereby mortgage loans are packaged and sold to the REDS Securitisation and Warehouse Trusts (“RMBS Trusts”). The Bank also securitises Hire Purchase, Chattel Mortgages and Finance Leases which are packaged and sold to REDS EHP Securitisation Trusts (“REDS EHP Trusts”).
Consolidated Entity
The Consolidated Entity receives the residual income distributed by the RMBS and REDS EHP Trusts after all payments due to investors and associated costs of the program have been met and as a result the Consolidated Entity is considered to retain the risks and rewards of the RMBS Trusts and as a result do not meet the de-recognition criteria of AASB 139 Financial Instruments: Recognition and Measurement.
The RMBS Trusts fund their purchase of the loans by issuing floating-rate debt securities. The securities are issued by the RMBS Trusts. These are represented as borrowings of the Consolidated Entity however the Consolidated Entity does not stand behind the capital value or the performance of the securities or the assets of the RMBS Trusts. The Consolidated Entity does not guarantee the payment of interest or the repayment of principal due on the securities. The loans subject to the securitisation program have been pledged as security for the securities issued by the RMBS Trusts. The Consolidated Entity is not obliged to support any losses that may be suffered by investors and does not intend to provide such support.
The Bank does however provide the securitisation programs with arm’s length services and facilities including the management and servicing of the leases securitised. The Bank has no right to repurchase any of the securitised assets and no obligation to do so, other than in certain circumstances where there is a breach of warranty within 120 days of the sale or when certain criteria are met under the Clean up Provision per the Trust Deed Supplement.
The transferred assets are equitably assigned to the securitisation trusts. The investors in the securities issued by the Trusts have full recourse to the assets transferred to the Trusts. The Bank receives the residual income distributed by the Trusts after all payments due to investors and associated costs of the program have been met and as a result the Bank is considered to retain the risks and rewards of the Trusts.
Bank
Interest rate risk from the RMBS and REDS EHP Trusts is transferred back to the Bank by way of interest rate and basis swaps. Accordingly, under AASB 139 the original sale of the mortgages from the Bank to the RMBS
Trusts does not meet the de-recognition criteria set out in AASB 139. The
Bank continues to reflect the securitised loans in their entirety and also
recognises a financial liability to the RMBS Trusts. The interest payable
on the intercompany financial asset / liability represents the return on an
imputed loan between the Bank and the Trusts and is based on the interest
income under the mortgages, the fees payable by the Trusts and the interest
income or expense not separately recognised under the interest rate and
basis swaps transactions between the Bank and the Trusts.
All transactions between the Bank and the Trusts are eliminated on
consolidation.
(iii) Transactions eliminated on consolidation
Intra-group balances, and any unrealised gains and losses or income and
expenses arising from intra-group transactions, are eliminated in preparing
the consolidated financial statements.
Unrealised losses are eliminated in the same way as unrealised gains, but
only to the extent that there is no evidence of impairment.
(iv) Derecognition of financial assets and liabilities
Financial assets are derecognised when the contractual rights to receive
cash flows from the assets have expired, or where the Bank has transferred
its contractual rights to receive the cash flows of the financial assets and
substantially all the risks and rewards of ownership. Financial liabilities
are derecognised when they are extinguished, i.e. when the obligation is
discharged, cancelled or expired.
(b) Foreign currency
Foreign currency transactions
Transactions in foreign currencies are translated at the foreign exchange
rate ruling at the date of the transaction. Monetary assets and liabilities
denominated in foreign currencies at the reporting date are translated into
Australian dollars at the foreign exchange rate ruling at that date. Non-
monetary items in a foreign currency that are measured at historical cost
are translated using the exchange rate at the date of the transaction. Foreign
exchange differences arising on translation are recognised in the profit and
loss.
Where a foreign currency transaction is part of a hedge relationship it is
accounted for as above, subject to the Hedge Accounting rules set out in
Section 3.8, Derivative financial instruments.
Foreign operations
The consolidated entity has no foreign operations, all overseas activities are
carried out through non-incorporated branches.
(c) New accounting standards
The following, are the amendments to standards and interpretations
applicable for the first time to the current year:
• AASB 10 Consolidated Financial Statements - Establishes a new
control model and broadens the situations when an entity is
considered to be controlled. The standard replaces the guidance on
control and consolidation of AASB 127 Consolidated and Separate
and Separate Financial Statements. This new standard did not have
a material impact on the Consolidated Entity, as assessments made
identified that there are no new entities under the new control model
which were not previously consolidated.

66
Bank of Queensland Limited and its Controlled Entities A.B.N. 32 009 656 740.
6.10. SIGNIFICANT ACCOUNTING POLICIES & NEW ACCOUNTING STANDARDS (CONTINUED)
(c) New accounting standards (continued)
• AASB 11 Joint Arrangements - This standard replaces AASB 131 Interests in Joint Ventures and introduces a principles based approach to joint arrangements accounting. The standard uses the principle of control in AASB 10 to define joint control. Accounting for a joint arrangement is dependent on the nature of the rights and obligations arising from the joint arrangement. This new standard did not have a material impact on the Consolidated Entity.
• AASB 12 Disclosure of Interests in Other Entities - This standard includes all disclosures relating to an entity’s interests in subsidiaries, joint arrangements, associates and structured entities. The Consolidated Entity has assessed all of its interests in subsidiaries and joint arrangements and has adequately disclosed the details of these in the financial statements. This new standard did not have a material impact on the Consolidated Entity.
• AASB 13 Fair Value Measurement - Establishes a new single framework for measuring fair value and making disclosures about fair value measurement. AASB 13 also expands the disclosure requirements for all assets or liabilities carried at fair value. The Consolidated Entity has recorded additional fair value hierarchy disclosures in the financial statements regarding financial assets and liabilities and level 3 assets and liabilities.
• AASB 119 Employee Benefits - The main change introduced by this standard is to revise the accounting for defined benefit plans. The amendment removes the options for accounting for the liability, and requires that the liabilities arising from such plans is recognised in full with actuarial gains and losses being recognised in other comprehensive income. The standard also changes the definition of short-term employee benefits. The distinction between short-term and other long-term employee benefits is now based on whether the benefits are expected to be settled wholly within 12 months after the reporting date. From 1 July 2013 the Consolidated Entity changed the basis for determining the classification of annual leave between ‘short-term employee benefits’ and ‘other long-term employee benefits’. This change did not result in a material impact to the Consolidated Entity.
• AASB 2012-2 Amendments to Australian Accounting Standards - Disclosures: Offsetting Financial Assets and Financial Liabilities - Amends AASB 7 Financial Instruments: Disclosures to require disclosure of the effect or potential effect of netting arrangements, including rights of set-off associated with the entity’s recognised financial assets and financial liabilities, on the entity’s financial position, when all the offsetting criteria of AASB 132 are not met. The result of these amendments has been an expansion to the Consolidated Entitiy’s disclosures with respect to the offsetting of financial assets and financial liabilities in Sections 3.6 and 3.7.
All other amendments to standards applicable for the 2014 year end do not impact the Consolidated Entity.
The following standards and amendments have been identified as those which may impact the Bank and the majority were available for early adoption at 31 August 2014 but have not been applied in these financial statements.
• AASB 9 Financial Instruments was issued and introduces changes in the classification and measurement of financial assets and financial liabilities. The standard also introduces new requirements for hedge accounting that align hedge accounting more closely with risk management. This standard becomes mandatory for the
Consolidated Entity’s 31 August 2018 financial statements. The potential effects on adoption of the amendments are yet to be determined.
• AASB 2012-3 Amendments to Australian Accounting Standards - Offsetting Financial Assets and Financial Liabilities - This amendment adds application guidance to AASB 132 Financial Instruments: Presentation to address inconsistencies identified in applying some of the offsetting criteria of AASB 132. The potential effects on adoption of the amendments are yet to be determined.
(d) Business combinations
Acquisitions on or after 1 July 2009
The Consolidated Entity has adopted revised AASB 3 Business Combinations (2008) for business combinations occurring in the financial year starting 1 July 2009. All business combinations occurring on or after 1 July 2009 are accounted for by applying the acquisition method. The Consolidated Entity has also adopted AASB 10 Consolidated Financial Statements (2013) which has superseded AASB 127 Consolidated and Separate Financial Statements (2018).
For every business combination, the Group identifies the acquirer, which is the combining entity that obtains control of the other combining entities or businesses. The Group controls an entity if it is exposed to, or has rights to, variable returns from its involvement with the entity and has the ability to affect those returns through its power over the investee.
Contingent Liabilities
A contingent liability of the acquiree is assumed in a business combination only if such a liability represents a present obligation and arises from a past event, and its fair value can be measured reliably.
Transactions Costs
Transaction costs that the Group incurs in connection with a business combination, such as a finders fee, legal fees, due diligence fees and other professional and consulting fees are expensed as incurred.
(e) Impairment of non-financial assets
Non-financial assets other than deferred tax assets are reviewed for impairment whenever events or changes in circumstances indicate that the carrying amount may not be recoverable. For goodwill, and intangible assets with an indefinite life, the recoverable amount is estimated each year at the same time.
The Bank conducts an annual internal review of non-financial asset values to assess for any indicators of impairment. If any indication of impairment exists, an estimate of the asset’s recoverable amount is calculated.
For the purposes of assessing impairment, assets are grouped at the lowest levels for which there are separately identifiable cash inflows that are largely independent of the cash inflows from other assets or groups of assets - Cash Generating Units (“CGU”). An impairment loss is recognised in profit or loss in the Income Statement for the amount by which the asset’s carrying amount exceeds its recoverable amount. Impairment losses recognised in respect of CGUs are allocated first to reduce the carrying amount of goodwill allocated to the units, and then to reduce the carrying amounts of the other assets in the unit on a pro rata basis.
This grouping is subject to an operating segment ceiling test. Non-financial assets, other than goodwill, that suffered impairment are tested for possible reversal of the impairment whenever events or changes in circumstances indicate that the impairment may have reversed. An impairment loss in respect of goodwill is not reversed.

67
BOQ PRELIMINARY FINAL REPORT 2014
6.10. OTHER ACCOUNTING POLICIES (CONTINUED)
(e) Impairment of non-financial assets (continued)
Calculation of recoverable amount
The recoverable amount of a non-financial asset or CGU is the greater of their fair value less costs to sell and value in use. In assessing value in use, the estimated future cash flows are discounted to their present value using a pre-tax discount rate that reflects current market assessments of the time value of money and the risks specific to the asset.
(f) Leases Finance Leases
Finance leases in which the Bank is the lessor, are recorded in the Balance Sheet as loans and advances at amortised cost. They are recorded on the commencement of the lease as the net investment in the lease, being the present value of the minimum lease payments.
The Consolidated Entity does not have finance leases as lessee.
Operating Leases
Operating leases in which the Bank is the lessee, are expensed on a straight-line basis over the term of the lease, except where an alternative basis is more representative of the pattern of benefits to be derived from the leased property. When an operating lease terminates before the lease period expires, any payment required to be made to the lessor by way of penalty is recognised as an expense in the period in which termination takes place.
(g) Goods and services taxRevenues, expenses and assets are recognised net of the amount of goods and services tax (“GST”), except where the amount of GST incurred is not recoverable from the Australian Tax Office (“ATO”). In these circumstances the GST is recognised as part of the cost of acquisition of the asset or as part of the expense.
(h) Equity reserve for credit losses The Bank is required by APRA to maintain a general provision for credit losses. As the Bank is unable to hold a general provision under current accounting standards, the Bank has created an equity reserve for credit losses. The equity reserve for credit losses and the eligible component of the collective provision for impairment are aggregated for the purpose of satisfying the APRA requirement for a general reserve for credit losses. Receivables and payables are stated with the amount of GST included.
The net amount of GST recoverable from, or payable to, the ATO is included as a current asset or liability in the Balance Sheet.
Cash flows are included in the Statements of Cash Flows on a gross basis. The GST components of cash flows arising from investing and financing activities which are recoverable from, or payable to, the ATO are classified as operating cash flows.
(i) Employee benefits
(i) Wages, Salaries and Annual Leave
Liabilities for employee benefits for wages, salaries and annual leave represents present obligations resulting from employees’ services provided up to the reporting date, calculated at discounted amounts based on remuneration wage and salary rates that the Bank expects to pay as at reporting date including related on-costs.
(ii) Long Service Leave
The provision for employee benefits to long service leave represents the present value of the estimated future cash outflows to be made resulting from employees’ services provided to reporting date. The provision is calculated using expected future increases in wage and salary rates including related on-costs, and expected settlement dates based on turnover history and is discounted using the rates attached to national government bonds at reporting date which most closely match the terms of maturity of the related liabilities.
(iii) Superannuation plan
The Bank contributes to a number of defined contribution superannuation plans which comply with the Superannuation Industry (Supervision) Act 1993. Contributions are charged to profit or loss in the Income Statement as they are made.
(iv) Share based payments
The Consolidated Entity currently operates an Award Rights Plan for equity-settled compensation. The plan allows Consolidated Entity employees to acquire shares in the Bank. The fair value of options and rights granted is recognised as an employee expense with a corresponding increase to the Employee Benefits Reserve. The fair value is measured at grant date and spread over the period during which the employees become unconditionally entitled to the options and rights. The fair value of the options and rights granted is measured using industry accepted option pricing methodologies, taking into account the terms and conditions upon which the options and rights are granted. The fair value of the options and rights is expensed over the vesting period. Where options and rights do not vest due to failure to meet a non market condition (e.g. employee service period) the expense is reversed. Where options and rights do not vest due to failure to meet a market condition (e.g. Total Shareholder Return test) the expense is not reversed.
(j) Property, plant & equipment
Recognition and initial measurement
Items of property, plant and equipment are stated at cost or deemed cost less accumulated depreciation and accumulated impairment losses. The cost of self-constructed assets includes the cost of materials, direct labour and an appropriate proportion of production overheads.
Subsequent Costs
Subsequent additional costs are only capitalised when it is probable that future economic benefits in excess of the originally assessed performance of the assets will flow to the Bank in future years. Where these costs represent separate components, they are accounted for as separate assets and are separately depreciated over their useful lives. Costs that do not meet the criteria for subsequent capitalisation are expensed as incurred.
Subsequent Measurement
The Bank has elected to use the cost model to measure property, plant and equipment after recognition. The carrying value is the initial cost less accumulated depreciation and any accumulated impairment losses.
68
Bank of Queensland Limited and its Controlled Entities A.B.N. 32 009 656 740.
6.10. OTHER ACCOUNTING POLICIES (CONTINUED)
(j) Property, plant & equipment (continued)
Depreciation
Depreciation is charged to the profit or loss in the Income Statement on a straight-line basis over the estimated useful lives of each part of an item of property, plant and equipment. Land is not depreciated.
The estimated useful lives are as follows:
Years
IT Equipment 3-10
Plant, furniture and equipment 3-25
Leasehold improvements 11 (or term of lease if less)
The residual value if not significant, is reassessed annually.
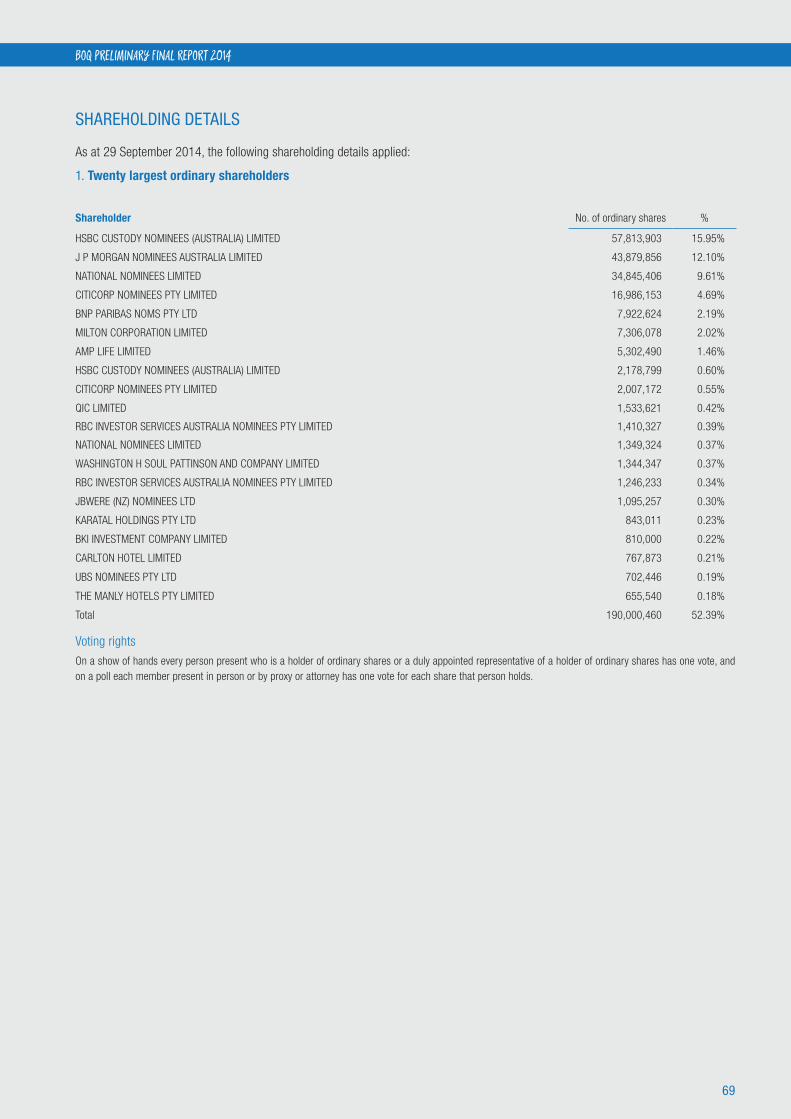
69
BOQ PRELIMINARY FINAL REPORT 2014
SHAREHOLDING DETAILS
As at 29 September 2014, the following shareholding details applied:
1. Twenty largest ordinary shareholders
Shareholder No. of ordinary shares %
HSBC CUSTODY NOMINEES (AUSTRALIA) LIMITED 57,813,903 15.95%
J P MORGAN NOMINEES AUSTRALIA LIMITED 43,879,856 12.10%
NATIONAL NOMINEES LIMITED 34,845,406 9.61%
CITICORP NOMINEES PTY LIMITED 16,986,153 4.69%
BNP PARIBAS NOMS PTY LTD 7,922,624 2.19%
MILTON CORPORATION LIMITED 7,306,078 2.02%
AMP LIFE LIMITED 5,302,490 1.46%
HSBC CUSTODY NOMINEES (AUSTRALIA) LIMITED 2,178,799 0.60%
CITICORP NOMINEES PTY LIMITED 2,007,172 0.55%
QIC LIMITED 1,533,621 0.42%
RBC INVESTOR SERVICES AUSTRALIA NOMINEES PTY LIMITED 1,410,327 0.39%
NATIONAL NOMINEES LIMITED 1,349,324 0.37%
WASHINGTON H SOUL PATTINSON AND COMPANY LIMITED 1,344,347 0.37%
RBC INVESTOR SERVICES AUSTRALIA NOMINEES PTY LIMITED 1,246,233 0.34%
JBWERE (NZ) NOMINEES LTD 1,095,257 0.30%
KARATAL HOLDINGS PTY LTD 843,011 0.23%
BKI INVESTMENT COMPANY LIMITED 810,000 0.22%
CARLTON HOTEL LIMITED 767,873 0.21%
UBS NOMINEES PTY LTD 702,446 0.19%
THE MANLY HOTELS PTY LIMITED 655,540 0.18%
Total 190,000,460 52.39%
Voting rights
On a show of hands every person present who is a holder of ordinary shares or a duly appointed representative of a holder of ordinary shares has one vote, and on a poll each member present in person or by proxy or attorney has one vote for each share that person holds.

70
Bank of Queensland Limited and its Controlled Entities A.B.N. 32 009 656 740.
SHAREHOLDING DETAILS (CONTINUED)
As at 29 September 2014, the following shareholding details applied:
2. Twenty largest CPS shareholders
Shareholder No. of ordinary shares %
J P MORGAN NOMINEES AUSTRALIA LIMITED 102,078 3.40%
MILTON CORPORATION LIMITED 50,000 1.67%
NATIONAL NOMINEES LIMITED 44,738 1.49%
NAVIGATOR AUSTRALIA LTD 42,231 1.41%
HSBC CUSTODY NOMINEES (AUSTRALIA) LIMITED 41,858 1.40%
UBS WEALTH MANAGEMENT AUSTRALIA NOMINEES PTY LTD 37,542 1.25%
DOMER MINING CO PTY LTD 32,200 1.07%
NULIS NOMINEES (AUSTRALIA) LIMITED 25,746 0.86%
MR JOHN HARRISON VALDER & MRS KAY ORMONDE VALDER 19,500 0.65%
BNP PARIBAS NOMS PTY LTD 16,400 0.55%
WENTHOR PTY LTD 15,000 0.50%
CITICORP NOMINEES PTY LIMITED 11,393 0.38%
F & B INVESTMENTS PTY LIMITED 10,000 0.33%
EASTCOTE PTY LTD 10,000 0.33%
THE AUSTRALIAN NATIONAL UNIVERSITY 10,000 0.33%
SOUTHERN METROPOLITAN CEMETERIES 10,000 0.33%
JILLIBY PTY LTD 9,500 0.32%
CANTALA PTY LTD 9,150 0.31%
BCITF (QLD) 8,800 0.29%
BAPTIST INVESTMENTS AND FINANCE LTD 8,546 0.28%
Total 514,682 17.96%
Voting rights
The CPS do not give the holders any voting rights at any general shareholders meetings, except in certain circumstances.
3. Distribution of equity security holders
Ordinary Shares CPS
Category 2014 2013 2014 2013
1 - 1,000 56,165 56,120 6,214 6,332
1,001 - 5,000 26,067 24,722 355 355
5,001 - 10,000 4,847 4,164 19 22
10,001 - 100,000 2,463 2,134 11 15
100,000 - and over 71 77 1 -
Total 89,613 87,217 6,600 6,724
The number of ordinary shareholders holding less than a marketable parcel is 3,246.
The number of convertible preference shareholders holding less than a marketable parcel is nil.

71
BOQ PRELIMINARY FINAL REPORT 2014
SHAREHOLDING DETAILS (CONTINUED)
4. Partly Paid Shares
There are no partly paid shares.
5. There are currently no substantial shareholders in the Bank.
6. Stock exchange listing
The shares of Bank of Queensland Limited (“BoQ”) and CPS (“BOQPD”) are quoted on the Australian Securities Exchange.
7. Options
At 31 August 2014 there were no options over unissued ordinary shares.
8. On market buy-back
There is no current on market buy-back.
9. Other information
Bank of Queenland Limited is a publicly listed company limited by shares and is incorporated and domiciled in Australia.
Related Documents