2014 National Citizen Survey Results

2014 National Citizen Survey Results. 2014 Citizen Survey results Implementing Our Vision Background Areas of Significant Change Trends over Time Special.
Dec 28, 2015
Welcome message from author
This document is posted to help you gain knowledge. Please leave a comment to let me know what you think about it! Share it to your friends and learn new things together.
Transcript

2014 National Citizen Survey Results

2014 Citizen Survey results
• Implementing
Our Vision
• Background
• Areas of
Significant
Change
• Trends over
Time
• Special Topics
• What’s Next?

Implementing Our Vision
• Tool for monitoring citizen feedback, trends
• Part of Annual Progress Report and Budget Report
• Identifies strengths and weaknesses
• Helps City staff plan, allocate resources – for improved services, enhanced civic engagement, greater quality of life and stronger public trust
• Utilized for Strategic Action Plan – Budget Process

Background
• 12th year – National Citizen Survey
• Customized for City, developed with staff
• Successful delivery to 1,106 randomly selected households
• 361 responses – 33% response rate
• 5% margin of error – plus or minus

Respondents
1: 32% 2: 36%
3: 32%
4: 30%

Approaching the Data
• Eight Focus Areas into three pillars of a livable community:
Community Characteristics, Governance and Participation
• Significant statistical changes (>7 %) from year-to-year
• Report design and results modified from previous years
• Benchmarks the City to 500 + communities across in U.S.
• 22% are located in the South• 28 cities and counties in Florida
Education and Enrichment
Built Environment
Natural Environment Safety
Recreation and Wellness Mobility
Community Engagement Economy

2014 Most Favorable (>80% excellent / good) : Paths and walking trails Safe downtown/commercial area Safe in neighborhood Overall natural environment Cleanliness Air Quality Fire services Ambulance / EMS services Garbage and recycling services Yard waste pick-up City parks
2014 Least (<20% excellent / good): Employment opportunities Place to work

2014 Statistically Significant Changes
Areas considered within Governance influence
Areas considered outside Governance influence
Storm drainage 8%Sewer services 8%Special events* 8%Land use, planning and zoning 9%
Economy will have positive impact on
income 8%Did not observe a code violation*
10%
* = Only 2013 and 2014 data available
Vibrant downtown/commercial area* 7%Employment opportunities 7%Cultural/arts/music activities 8%Value of services for taxes paid 8%Traffic flow on major streets
9%Fire prevention 9%Welcoming citizen involvement 10%Animal control 10%Used Palm Coast recreation centers 10%Open space*11%Business and services12%
Stocked supplies for an emergency* 7%Cost of living* 8%Adult education* 10%Availability of affordable quality food 13%Availability of affordable quality mental health care*
13%Watched a local public meeting 18%Child care/preschool 19%

A Closer Look
70%
BM
Fire Prevention Fire services Ambulance/EMS Services0
10
20
30
40
50
60
70
80
90
100
Safety
2002200320042005200620072008200920102011201220132014
93% 91%

A Closer Look
57%
BM
89% 92%
Animal Control Safe downtown Safe in neighborhood0
10
20
30
40
50
60
70
80
90
100
Safety
2002200320042005200620072008200920102011201220132014

A Closer Look
47%BM
81%
Traffic flow on major streets Paths and walking trails0
10
20
30
40
50
60
70
80
90
100
Mobility
2002200320042005200620072008200920102011201220132014

Storm drainage Sewer services Land use, planning and zoning
0
10
20
30
40
50
60
70
80
90
100
Built Environment
2002200320042005200620072008200920102011201220132014
A Closer Look
BM
51% 50%73%

A Closer Look
87%
BM
85% 85%
Overall natural en-vironment
Cleanliness Air Quality0
10
20
30
40
50
60
70
80
90
100
Natural Environment
2008200920102011201220132014

A Closer Look
87%
BM87% 86%
Garbage Recycling Yard waste pick-up0
10
20
30
40
50
60
70
80
90
100
WasteServices
2002200320042005200620072008200920102011201220132014

A Closer Look
38%
BM
46%
Welcoming citizen involvement Value of services for taxes paid0
10
20
30
40
50
60
70
80
90
100
2002200320042005200620072008200920102011201220132014

A Closer Look
50%
BM
83% 41%Used Palm Coast recreation centers City parks Cultural/arts/music activities
0
10
20
30
40
50
60
70
80
90
100
Recreation & Wellness, Education & Enrichment, Community Engangement
2002200320042005200620072008200920102011201220132014

A Closer Look
44%
BM
6% 18%Business and services Employment opportunities Place to work
0
10
20
30
40
50
60
70
80
90
100
Economy
20042005200620072008200920102011201220132014

How important, if at all, do you think it is for the Palm Coast community to focus on each of the following in the upcoming two years?:
Focus Essential (%)
Very Important (%)
Total (%)
Overall feeling of safety 54 43 97
Overall economic health of Palm Coast 61 33 94
Health and wellness opportunities 37 47 84Overall ease of getting to places usually
visited 30 54 84
Quality of overall natural environment 33 51 84
Sense of community 35 49 84Overall opportunities for education and
enrichment 40 40 80
Overall "built environment" 26 48 74

Special Topics – Customer Service
Customer Service0
102030405060708090
65 6671
65 68 66 70 7479 77
68 66 67
2002 2003 2004 2005 2006 2007 20082009 2010 2011 2012 2013 2014
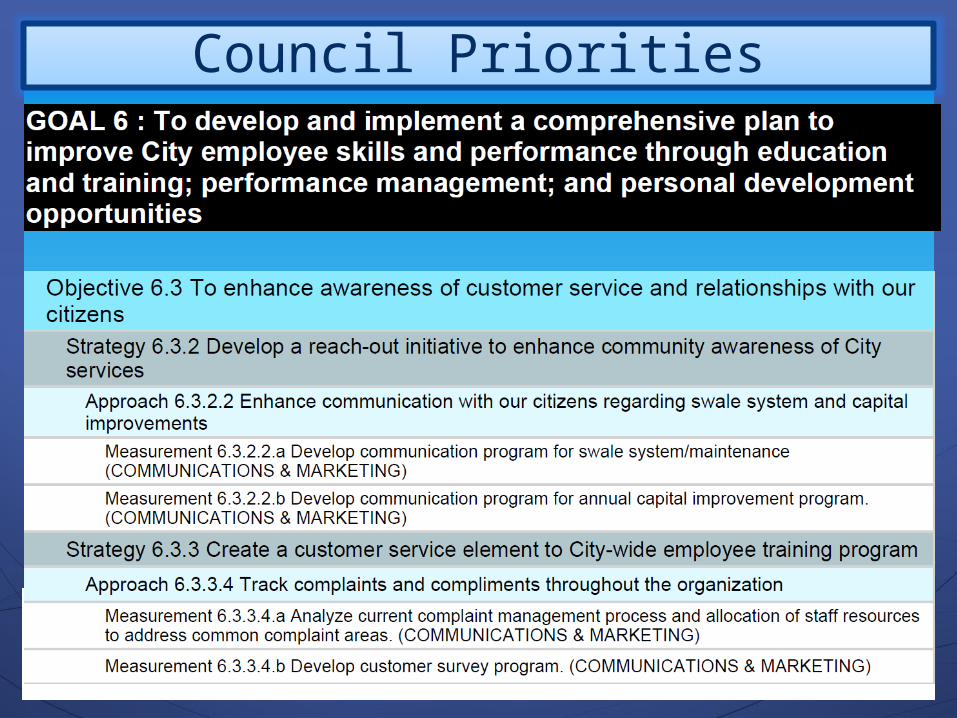
Council Priorities

Custom QuestionsCitizens were asked if they had contact with City employee(s) by phone, in person, via email or online within the last 12 months.Although you may not have had any recent contact, we would like to know your impression of how City employees treat Palm Coast residents. Please rate City employees on each of the items below:
Perception Question: 36% Responding

Custom Questions64 % of the respondents had contact with City employee(s) by phone, in person, via email or online within the last 12 months.Thinking about your most recent contact, please rate City employee(s) on each off the items below:
Reality Question:
29% 55% 84%
28% 39% 68%
24% 40% 64%

Next Steps
Team recommendations for 2015 survey: Press release in October 2015 Social media push Enhance text on survey envelope
What’s Next?
Related Documents


