2014 Demographic Profile of Maine Demographic Profile of Minority Populations 2014 Minorities Based on the 2010 U.S. Census data, Maine has a small minority population that is geographically spread across the state with concentrations in the urbanized areas served by direct recipient transit systems. The summary table below shows white and non-white populations for each of the counties. Non-white populations include Black or African American, American Indian and Alaska Native, Asian, Native Hawaiian and Other Pacific Islander, and Some Other Race. Maine as a whole has a minority population of 3.3%. Approximately 70% of Maine’s minority population lives in four counties: Androscoggin County: 5,732 people, of whom 5,017 people, or 88%, live in Auburn and Lewiston Cumberland County: 15,502 people, of whom 11,790, or 76%, live in Portland, Westbrook, South Portland and Scarborough. Penobscot County: 4,882, of whom 3,035, or 62%, live in Bangor, Brewer, Old Town, Orono, Veazie and Hampden. York County: 4,443 people, of whom 1,536, or 35%, live in Biddeford, Saco and Old Orchard Beach. Outside of these populated areas, there is only one county that exceeds the 5% threshold in its county. That is Washington County where larger concentrations of Native American communities exist. Washington County has a larger rate of minority population because of Passamaquoddy Nation and some Penobscot and Maliseet presence. Census tract data shows that there are also concentrations in Aroostook County where the Maliseet Nation is located. The Penobscot Nation is located in Penobscot County. State of Maine

Welcome message from author
This document is posted to help you gain knowledge. Please leave a comment to let me know what you think about it! Share it to your friends and learn new things together.
Transcript

2014 Demographic Profile of Maine
Demographic Profile of Minority Populations 2014
Minorities
Based on the 2010 U.S. Census data, Maine has a small minority population that is geographically spread across the state with concentrations in the urbanized areas served by direct recipient transit systems. The summary table below shows white and non-white populations for each of the counties. Non-white populations include Black or African American, American Indian and Alaska Native, Asian, Native Hawaiian and Other Pacific Islander, and Some Other Race. Maine as a whole has a minority population of 3.3%.
Approximately 70% of Maine’s minority population lives in four counties:
Androscoggin County: 5,732 people, of whom 5,017 people, or 88%, live in Auburn and Lewiston
Cumberland County: 15,502 people, of whom 11,790, or 76%, live in Portland, Westbrook, South Portland and Scarborough.
Penobscot County: 4,882, of whom 3,035, or 62%, live in Bangor, Brewer, Old Town, Orono, Veazie and Hampden.
York County: 4,443 people, of whom 1,536, or 35%, live in Biddeford, Saco and Old Orchard Beach.
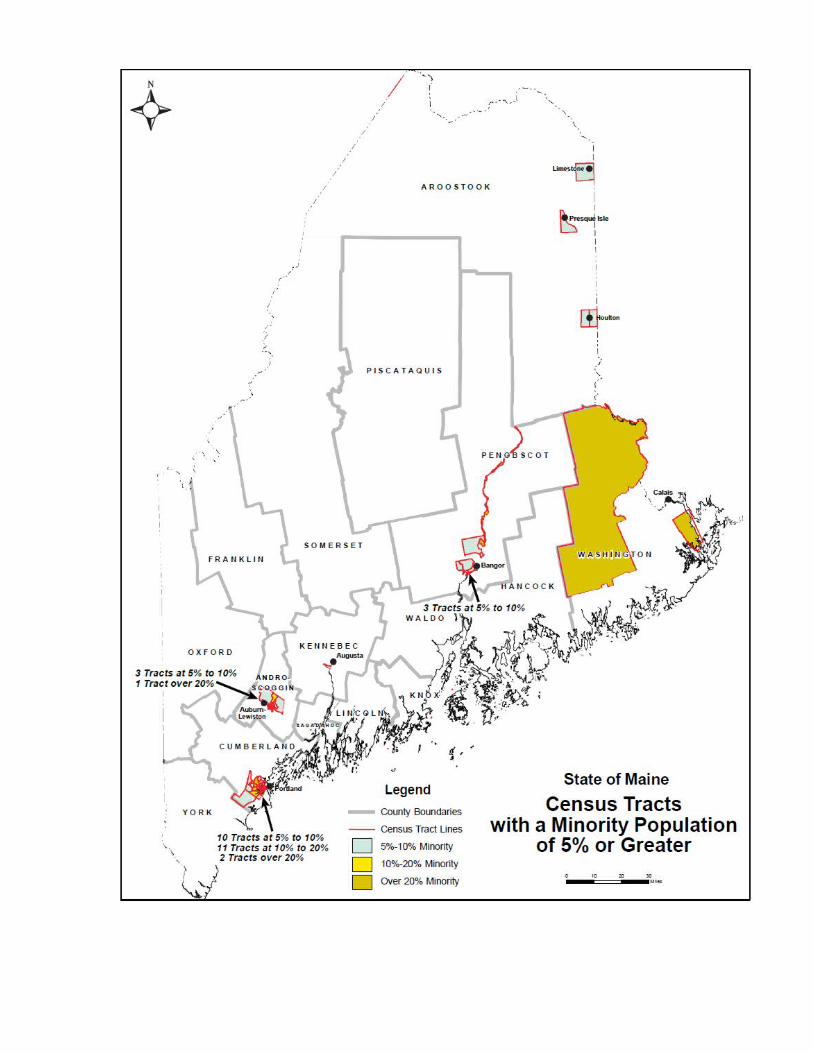
Outside of these populated areas, there is only one county that exceeds the 5% threshold in its county. That is Washington County where larger concentrations of Native American communities exist. Washington County has a larger rate of minority population because of Passamaquoddy Nation and some Penobscot and Maliseet presence. Census tract data shows that there are also concentrations in Aroostook County where the Maliseet Nation is located. The Penobscot Nation is located in Penobscot County.
State of MaineRace Demographics by State/County
CountyTotal
PopulationWhite
#Minority
#Minority
%Maine 1,328,361 1,284,877 43,484 3.3%
Androscoggin 107,702 101,970 5,732 5.3%Aroostook 71,870 69,692 2,178 3.0%
Cumberland 281,674 266,172 15,502 5.5%Franklin 30,768 30,381 387 1.3%Hancock 54,418 53,349 1,069 2.0%Kennebec 122,151 119,479 2,672 2.2%
Knox 39,736 39,120 616 1.6%Lincoln 34,457 34,002 455 1.3%Oxford 57,833 56,850 983 1.7%
Penobscot 153,923 149,041 4,882 3.2%

Piscataquis 17,535 17,202 333 1.9%Sagadahoc 35,293 34,527 766 2.2%Somerset 52,228 51,399 829 1.6%
Waldo 38,786 38,216 570 1.5%Washington 32,856 30,789 2,067 6.3%
York 197,131 192,688 4,443 2.6%2010 Census File QT-P5

The following Map identifies minority populations by county.
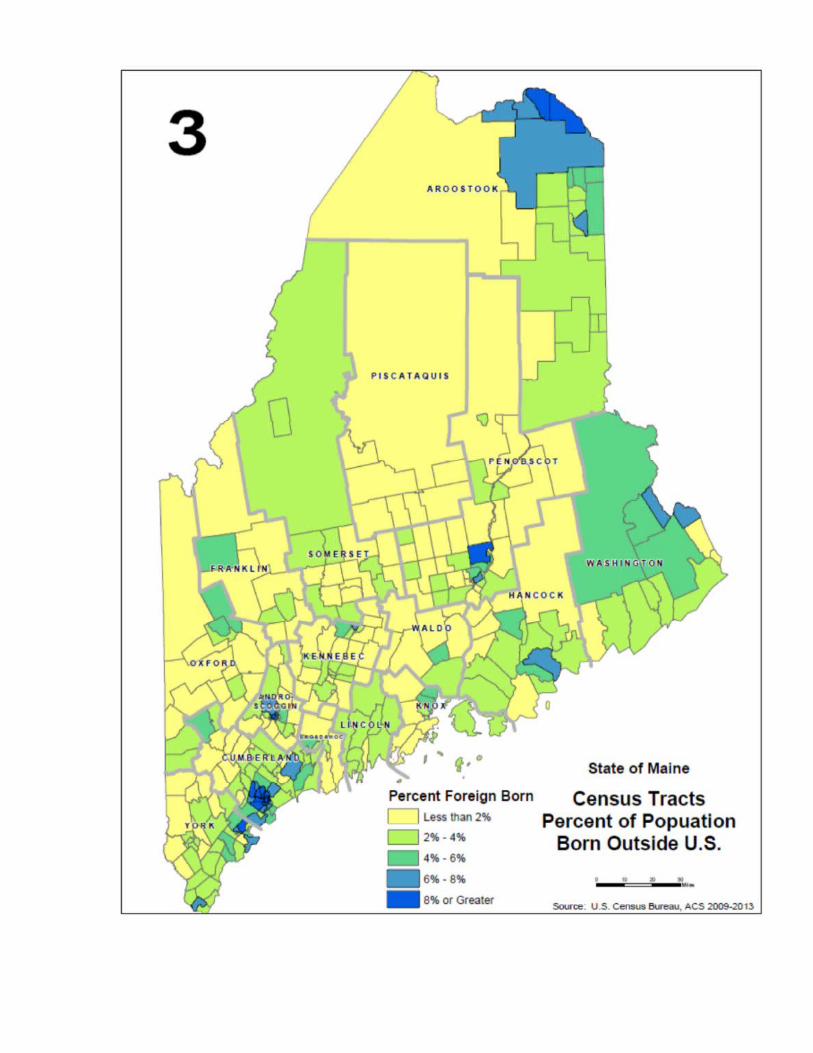
Non-American National OriginThe map representing data on the national origin of Maine residents is similar in many ways to the maps of minorities. The core of Cumberland County again has the highest totals and the whole southern area has higher numbers than the rest of the state. The Saint John River Valley also has several towns in the upper categories. Towns along the Canadian border show up more prominently in this map than the minorities map, reflecting a higher representation of French Canadians. The map of concentrations of non-American born residents shows many of these Canadian border towns with percentages higher than the state average, though most of these towns are sparsely populated. Cumberland and Androscoggin Counties have concentrations of non-natives, due to the Maine Refugee Resettlement Program centered in Portland (Cumberland County.) and Lewiston (Androscoggin County). There are relatively few towns in the western and eastern areas of the state with concentrations of non-natives, other than clusters around Augusta and Bangor.
State of MaineNative and Foreign Born Population
CountyTotal
PopulationNative Born
#Native Born
%Foreign Born
#Foreign
Born%
Maine 1,328,320 1,283,035 96.6% 45,285 3.4%Androscoggin
107,634 107,634 96.9% 3,356 3.1%
Aroostook 71,230 67,949 95.4% 3,281 4.6%Cumberland 283,046 266,523 94.2% 16,523 5.8%Franklin 30,660 30,016 97.9% 644 2.1%Hancock 54,557 52,918 97.0% 1,639 3.0%Kennebec 121,757 118,963 97.7% 2,794 2.3%Knox 39,694 38,639 97.3% 1,055 2.7%Lincoln 34,297 33,459 97.6% 838 2.4%Oxford 57,657 56,531 98.0% 1,126 2.0%Penobscot 153,649 149,559 97.3% 4,090 2.7%Piscataquis 17,343 17,123 98.7% 220 1.3%Sagadahoc 35,194 34,408 97.8% 786 2.2%Somerset 51,942 51,044 98.3% 898 1.7%Waldo 38,819 38,039 98.0% 780 2.0%Washington 32,621 31,446 96.4% 1,175 3.6%York 198,220 192,140 96.9% 6,080 3.1%
Source: 2009-2013 American Community Survey, File DP02

The following Map identifies non-native populations by county.

Low IncomeAs a rural state without a large base of high-paying jobs—outside of Cumberland and Androscoggin Counties— poverty is more widespread in Maine than any of the other factors considered in the Title VI program. In the 2009-2013 American Community Survey some 180,652 people are estimated to be in households that have incomes below the federal poverty threshold. (In dollar terms, that threshold varies by household size). This number represents about 13% of the population for whom it is possible to determine poverty status. In comparison, 4.7% of residents are minorities, and 3.3 % of residents were not born in the United States. The highest concentration of low income people reside in Cumberland County with 32,267 people. The cost of living and more urban settings reflect higher service needs in these areas.
In spite of the high number of low-income people in Cumberland and Androscoggin Counties the percentages of people in poverty in most of these communities is below the state average. The highest percentages of low income per county are the rural counties of Washington, Piscataquis and Aroostook.
State of MaineLow-income Levels
CountyTotal Population # Persons below
Poverty Level *% Persons below
Poverty LevelMaine 1,328,320 180,652 13.6%
Androscoggin 107,634 16,791 15.6%Aroostook 71,230 11,610 16.3%Cumberland 283,046 32,267 11.4%Franklin 30,660 4,783 15.6%Hancock 54,557 7,638 14.0%Kennebec 121,757 16,315 13.4%Knox 39,694 4,287 10.8%Lincoln 34,297 4,013 11.7%Oxford 57,657 8,591 14.9%Penobscot 153,649 26,120 17.0%Piscataquis 17,343 3,208 18.5%Sagadahoc 35,194 3,907 11.1%Somerset 51,942 9,246 17.8%Waldo 38,819 6,366 16.4%Washington 32,621 6,361 19.5%York 198,220 18,831 9.5%
Source: 2009-2013 American Community Survey, File DP03 *number calculated from percentage in File DP03
The following Map identifies low-income populations by county.
Related Documents