Emerging Markets Private Equity 2014 Annual Fundraising and Investment Review March 2015

2014 Annual Fundraising and Investment Review
Jul 15, 2015
Welcome message from author
This document is posted to help you gain knowledge. Please leave a comment to let me know what you think about it! Share it to your friends and learn new things together.
Transcript
Emerging Markets Private Equity 2014 Annual Fundraising and Investment ReviewMarch 2015

To learn more about EMPEA or to request a membership application, please send an email to [email protected].
About EMPEA
EMPEA is the global industry association for private capital in emerging markets. We are an independent non-profit organization with over 300 member firms, comprising institutional investors, fund managers and industry advisors, who together manage more than US$1 trillion of assets and have offices in more than 100 countries across the globe. Our members share EMPEA’s belief that private capital is a highly suited investment strategy in emerging markets, delivering attractive long-term investment returns and promoting the sustainable growth of companies and economies. We support our members through global authoritative intelligence, conferences, networking, education and advocacy. For more information, visit empea.org.
Publication Editorial Team
Lead ContributorsJeff Schlapinski, Manager, ResearchMolly Brister, Senior Research AnalystBrady Jewett, Research AnalystLuke Moderhack, Research AnalystRae Winborn, Research Analyst
Additional Editorial and Research ContributorsRobert W. van Zwieten, President and CEOMaryam Haque, Senior Director, Research
Production AssistancePhil Zelnar
EMPEA’s Board of Directors
Robert Petty, Chair Managing Partner & Co-Founder Clearwater Capital Partners
Teresa Barger, Vice Chair Senior Managing Director, Cartica Capital LLC
Rebecca Xu, Vice Chair Co-Founder and Managing Director Asia Alternatives Management LLC
Tom Barry President and Chief Executive Officer Zephyr Management, L.P.
Michael Calvey Founder and Senior Partner Baring Vostok Capital Partners
Okechukwu Enelamah Chief Executive Officer, African Capital Alliance
Paul Fletcher Senior Partner, Actis
Mark Kenderdine-Davies General Counsel and Company Secretary CDC Group plc
Roger S. Leeds Professor, Johns Hopkins University, SAIS
H. Jeffrey Leonard President and Chief Executive Officer Global Environment Fund
Piero Minardi Managing Partner, Warburg Pincus
Sanjay Nayar Member & Head, KKR India Advisors Pvt. Ltd.
Ziad Oueslati Founding Partner, AfricInvest
Nicolas Rohatyn Chief Executive Officer and Chief Investment Officer The Rohatyn Group (TRG)
Jean Eric Salata Chief Executive and Founding Partner Baring Private Equity Asia
Mani Saluja Partner and Co-Head, Emerging Markets Private Equity Quilvest
George W. Siguler Managing Director & Founding Partner Siguler Guff & Company
Tom Speechley Partner, The Abraaj Group
Yichen Zhang Chairman and Chief Executive Officer, CITIC Capital
1077 30th Street NW • Suite 100 • Washington, DC 20007 USAPhone: +1.202.333.8171 • Fax: +1.202.333.3162 • Web: empea.org

2014 Emerging Markets Private Equity Fundraising and Investment Review 1
Contents
EMPEA Methodology ........................................................2
2014 Fundraising and Investment Summary .............3
2014 EM PE Fundraising Detail
Regional Totals ................................................................6
Fundraising Analysis .....................................................7
2014 EM PE Investment Detail
Regional Totals ................................................................8
Sector Analysis ................................................................9
Venture Capital ..............................................................10
Private Equity (ex. Venture Capital) ............................11
Regional Summaries and Country Spotlights
Emerging Asia ...............................................................12
Spotlight: China, India and Singapore .................15
CEE and CIS ..................................................................16
Spotlight: Poland, Russia and Turkey ...................19
Latin America ................................................................20
Spotlight: Brazil, Colombia and Mexico ................23
Middle East and North Africa......................................24
Spotlight: Egypt, Morocco and UAE ......................27
Sub-Saharan Africa ......................................................28
Spotlight: Kenya, Nigeria and South Africa ..........31
Appendix
Investment Penetration ................................................32
Emerging Markets Private Equity 2014 Annual Fundraising and Investment Review
© EMPEA March 2015. All rights reserved.2
This report provides an overview of trends in fundraising and investment among private equity and venture capital funds investing in the emerging markets of Africa, Asia, Europe, Latin America and the Middle East. The data and statistics presented here are drawn from EMPEA’s database of funds and transactions, FundLink, and are based on information obtained from press releases and trade publications, as well as from communications with industry participants and regional and country-focused venture capital associations. EMPEA updates historical data as we receive fund and investment information from fund managers on a quarterly basis via FundLink.
Unless stated otherwise, “private equity” or “PE” referenced alone encompasses the following strategies: buyout, growth, PIPE, mezzanine, special situations and venture capital.
Fundraising totals reported herein reflect only official closes (interim and/or final) as reported in public sources and by the firms themselves. Capital commitments accruing prior to or between official closes are not included. Investment totals included in the report reflect total equity amounts for transactions in which financial details have been reported. For both fundraising and investment data, amounts have been confirmed wherever possible through information provided by the fund managers themselves.
The statistics in this report are based on the “market” approach—EMPEA categorizes activity based on the countries or regions in which fund managers intend to invest (in the case of fundraising) or the country headquarters of the investee company (in the case of investments). In the case of global or multi-regional funds, only those funds investing primarily in emerging markets are included in the totals (e.g., pan-Asia funds with a significant portion of capital intended for investment in China and India). Country-dedicated fundraising analytics reflect only those funds with a single-country strategy or mandate. Target allocations to individual markets within a broader global or regional fund are not attributed to single-country fundraising totals.
Regions in this report are defined as:
• Emerging Asia: all Asia, excluding Japan, Australia and/or New Zealand (JANZ).
• Latin America: Central and South America and the Caribbean region (excluding Puerto Rico).
• Central & Eastern Europe (CEE) & Commonwealth of Independent States (CIS): European Union accession countries, Turkey, the Baltics and Balkans, as well as Commonwealth of Independent States (CIS) countries, including Russia.
• Middle East & North Africa (MENA): Gulf Cooperation Council (GCC), Afghanistan, Iran, Iraq, Jordan, Lebanon, Pakistan, Palestinian Territories, Syria and Yemen, as well as North Africa (Algeria, Egypt, Libya, Morocco, Sudan and Tunisia).
• Sub-Saharan Africa: all Africa, excluding North Africa.
Statistics in this publication exclude real estate funds and funds of funds. Infrastructure funds managed by private equity firms and making private equity-style investments are included in this analysis. Infrastructure funds and investments that fit the “core” model are not included. Secondary investments are also excluded.
EMPEA fund and company sector classifications are based on the Industry Classification Benchmark (ICB), which is owned by FTSE International Limited (FTSE). FTSE® is a trademark of the London Stock Exchange Group companies and is used by FTSE under license. FTSE does not accept any liability to any person for any loss or damage arising out of any error or omission in the ICB.
Abbreviations commonly used in this report:
EM – Emerging markets PE – Private equity VC – Venture capital GP – General partner (fund manager) LP – Limited partner (fund investor)
In some exhibits, percentage labels may not sum to 100% due to rounding. In all tables in which it appears, “N/A” denotes an undisclosed value.
Disclaimer: This information is intended to provide an indication of industry activity based on best information available from public and proprietary sources. EMPEA has taken measures to validate the information presented herein but cannot guarantee the ultimate accuracy or completeness of the data provided. EMPEA is not responsible for any decision made or action taken based on information drawn from this report.
EMPEA Methodology

2014 Emerging Markets Private Equity Fundraising and Investment Review 3
2014 Fundraising and Investment Summary
Emerging markets private equity fundraising increased 16% from US$39 billion in 2013 to US$45 billion in 2014, while capital invested reached a record US$34 billion, the largest annual total since EMPEA began tracking investment data in 2008. Accordingly, 2014 was a banner year for EM PE, but it was not without its challenges. Fund managers navigated the spillover effects of the U.S. Federal Reserve’s tapering of quantitative easing in 2013 and subsequent currency adjustments in many countries; the economic slowdown in China; the geopolitical crisis in Ukraine; general elections in Brazil, India, South Africa, Indonesia and Turkey; and the steep decline in oil prices. Despite this adversity, and in some cases because of, savvy investors continued to find opportunity across emerging markets.
In 2014, all five major emerging market regions—Emerging Asia, Central and Eastern Europe and the Commonwealth of Independent States (CEE and CIS), Latin America, the Middle East and North Africa (MENA) and Sub-Saharan Africa—recorded increases in fundraising totals. In contrast, fundraising for Western Europe declined sharply. Partly as a result of this downturn, emerging markets’ share of global fundraising rose to 14% in 2014, up from 11% the previous year. Large regional EM funds also contributed to the increase, as the largest fund reaching a close in each emerging market region had a regional remit and closed over US$1 billion in 2014, with the exception of MENA, which saw its largest close reach US$750 million.
The prominence of large regional vehicles corresponded to an increasing proportion of capital concentrated in the hands of fewer managers. For funds that reached a final close in 2014, 11 had a final fund size of more than US$1 billion. These funds collectively raised US$26 billion, or 56% of the total capital raised for all closed funds—the largest total and share since 2008. Conversely, smaller funds faced a more difficult fundraising environment. In 2014 only 32 funds reached a final close of less than US$100 million—the fewest number of funds closed in this segment since before 2008. The prominence of large regional funds suggests that limited partners may be increasingly willing to commit large sums to the most established emerging market fund managers, but this may pose a challenge to the future growth and sustainability of the industry.
Across emerging markets, capital invested reached a seven-year high in 2014, led by Emerging Asia, which accounted for US$26 billion, or 78% of total EM PE investment. China alone accounted for 46% of total EM PE investment, the highest share since EMPEA began tracking investment data. Investment levels varied considerably across regions, however, with CEE and CIS, Latin America and MENA seeing year-on-year declines in capital invested. Nonetheless, emerging markets as a whole grew as a share of global private equity investment—up from 9% in 2013 to 11% in 2014—even in the context of a year-on-year increase in capital invested in developed markets.
Fundraising Increased Across All Five Emerging Market Regions in 2014; Capital Invested Hit Seven-Year High

© EMPEA March 2015. All rights reserved.4
EM PE Fundraising and Investment, 2010–2014
$50
$40
$30
$20
$10
$02010 2011 2012 2013 2014
US$
Billi
ons
45
34
n Funds Raised n Capital Invested
39
27
45
27
47
2930
25
25%
20%
15%
10%
5%
0%
EM PE Fundraising and Investment as a Percentage of Global Total, 2010–2014
2010 2011 2012 2013 2014
% o
f Glo
bal T
otal
14
11119
20
9
20
10
18
9
n Funds Raised n Capital Invested
Global PE Fundraising by Region, 2010-2014 (US$B)
2010 2011 2012 2013 2014
Developed Asia (JANZ) 2.9 2.5 3.1 3.2 4.3
United States 108 133 145 226 220
Western Europe 26 52 31 73 42
Emerging Markets 30 47 45 39 45
Global PE Investment by Region, 2010-2014 (US$B)
2010 2011 2012 2013 2014
Developed Asia (JANZ) 10 15 8.9 8.0 10
United States 184 197 196 198 215
Western Europe 57 61 50 52 47
Emerging Markets 25 29 27 27 34
Sources: Emerging Markets – EMPEA; Developed Asia (Japan, Australia, New Zealand) – Asia Private Equity Review; United States – PitchBook; Western Europe – EVCA.
The overall increase in capital invested coincided with a gradual shift in the type of deals executed in emerging markets. Since 2010, the number of growth deals—the strategy traditionally associated with EM PE—has declined on an annual basis, while the number of VC deals has increased steadily. Growth capital, despite declining in number of deals, increased its overall share of total capital invested to 38%, up from 34% in 2013, led by a US$1.8 billion growth capital investment in China—the largest EM PE investment recorded since EMPEA began tracking investment statistics in 2008. VC deal sizes also increased, with five of the ten largest VC deals recorded since 2008 taking place in 2014. Overall emerging markets VC activity in 2014, both by number of deals and total capital invested, was the highest since EMPEA began tracking investment data. Fund managers invested US$6.9 billion and completed 705 VC deals, accounting for 20% of total capital invested and 57% of all deals completed, compared to 10% and 46%, respectively, in 2013.
Heightened EM VC activity in 2014 mirrored the global trend for this stage of investment, notably in the United States, with many in the industry hinting at an imminent bubble. Companies in the technology
and consumer services sectors continued to attract VC attention, particularly in Emerging Asia. Like overall fundraising and investment activity, China also dominated VC investment, accounting for eight of the ten largest VC deals in 2014, and 69% of overall VC capital invested in emerging markets. Of the ten largest EM VC investments completed in emerging markets last year, seven involved e-commerce companies, including a US$300 million round for China-based online retail platform operator Meituan, which represented the largest VC deal in emerging markets since EMPEA began tracking investment data.
Across all strategies, fund managers have increasingly targeted companies in the consumer services industry. In 2014, the consumer services sector accounted for 34% of the number of private equity investments in emerging markets—more than any other sector. For fund managers, consumer services companies offer the opportunity to gain exposure to an industry that is not well represented on public market indices, as well as capitalize on growing middle classes and consumer spending in developing economies. Companies in the consumer services sector accounted for less than 10% of publicly-listed firms on the FTSE Emerging Markets Index as of 31 December 2014.
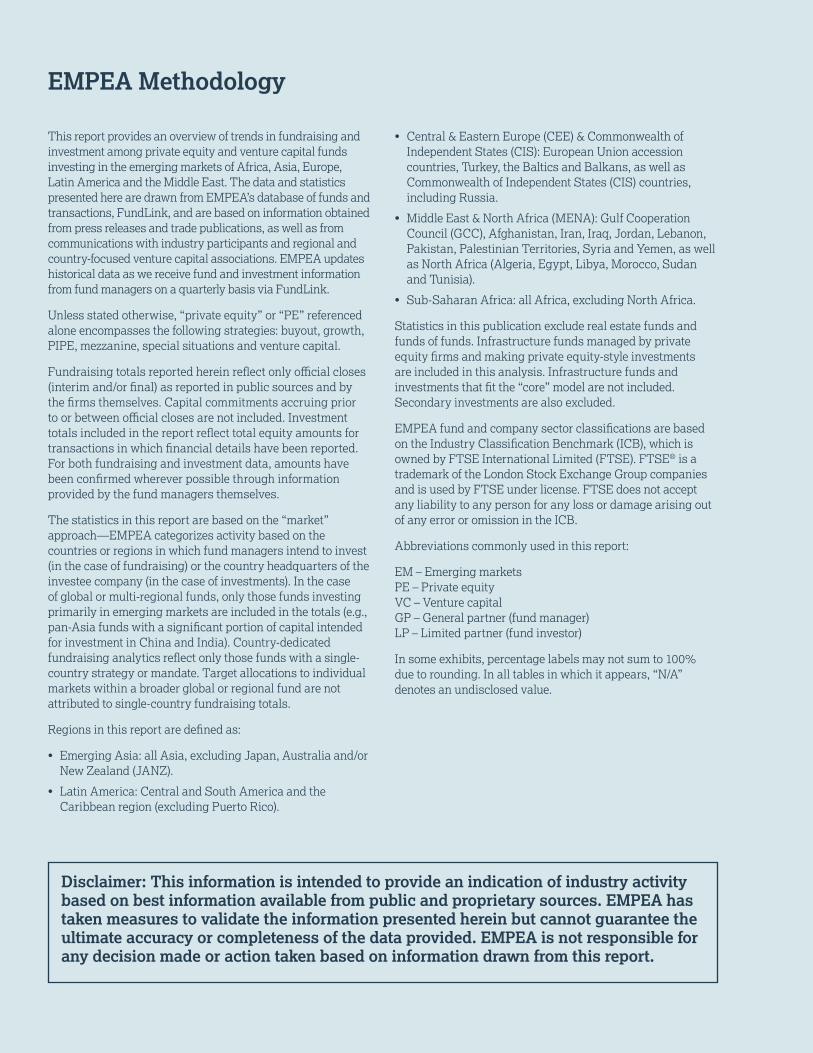
“We are currently leveraging EMPEA data to
better understand where venture capital flows
in emerging markets, which markets/sectors
have demonstrated the most significant growth,
and how venture capital has grown as a percent
of total private equity in emerging markets. The
data and support from the EMPEA research team
has been enormously helpful in answering these
research questions.” - Omidyar Network
(Limited Partner, EMPEA Member)
REVIEW Your Data Here...
FundLink A comprehensive, proprietary database of EM PE fundraising and transactions
...And Be SEEN In Front of OurGlobal Network of 7,000+ LPs, and Here...
Takes
10 minutes!
GET STARTED AT EMPEAFUNDLINK.ORGTo learn more, please contact [email protected] call us at +1.202.333.8171
CNBC • CNN • The Economist • Financial Times • New York Times
Pensions & Investments • Private Equity International (PEI) • Reuters • Wall Street Journal
...and many more international financial media outlets where
EMPEA data and market intelligence is featured

© EMPEA March 2015. All rights reserved.6
2014 EM PE Fundraising Detail
Fund managers raised US$45 billion for 183 EM-focused vehicles in 2014, corresponding to 16% and 6% increases, respectively, compared with 2013. Large funds with a regional or multi-country remit accounted for a significant share of capital raised for emerging markets in 2014. Nine of the 11 largest EM funds holding a close in 2014 were regionally focused, and represented 38% of total capital raised. Fundraising increased across all of the major EM regions, with Latin America, Sub-Saharan Africa and MENA experiencing the most pronounced year-on-year fundraising increases.
Latin America-focused vehicles raised US$7.8 billion in 2014, more than double the region’s 2013 total, and the region’s share of EM PE fundraising increased from 10% in 2013 to 18% in 2014. In Sub-Saharan Africa, fundraising totals for the region reached US$4 billion in 2014, more than triple the region’s annual total in 2013 and the highest recorded since EMPEA began tracking fundraising statistics in 2006. MENA attracted US$1.1 billion in funds raised, nearly double the region’s 2013 total and a new record for capital raised for the region since the 2008 global financial crisis. In CEE and CIS, despite a difficult
Largest Known EM-focused PE Funds Achieving a Final Close in 2014
Fund Manager Fund NameVintage
YearFund
Currency Fund TypeGeographic
FocusTotal Capital
Raised (US$m)
The Carlyle Group Carlyle Asia Partners IV 2012 USD Buyout Asia 3,900
Affinity Equity Partners Affinity Asia Pacific Fund IV 2013 USD Buyout Asia 3,800
CVC Capital Partners CVC Capital Partners Asia Pacific IV 2013 USD Buyout Asia 3,500
TPG TPG Asia VI 2012 USD Buyout Asia 3,300
CDH Investments CDH China Fund V 2013 USD Growth China 2,550
Advent International Latin American Private Equity Fund VI 2014 USD Buyout Latin America 2,100
Patria Investimentos Patria Brazilian Private Equity Fund V 2014 USD Buyout Brazil 1,800
Morgan Stanley Private Equity Asia (MSPEA) Morgan Stanley Private Equity Asia IV 2012 USD Growth Asia 1,700
Yunfeng Capital Yunfeng Fund II 2013 USD Venture Capital China 1,100
Mid Europa Partners Mid Europa Fund IV 2014 EUR Buyout CEE 1,095
EM PE Fundraising by Region, 2010–2014 (US$m)
2010 2011 2012 2013 2014
Emerging Asia 17,699 33,079 28,121 27,277 29,428
China 8,607 21,611 11,380 10,277 9,686
India 3,225 2,647 2,604 1,235 2,123
CEE and CIS 1,263 1,924 5,244 1,442 1,958
Russia 75 262 575 601 313
Latin America 6,935 8,894 5,248 3,780 7,844
Brazil 2,465 7,169 2,844 1,598 4,146
MENA 773 444 578 568 1,076
Sub-Saharan Africa 1,512 1,916 1,993 1,246 4,030
Multi-region 1,635 585 3,892 4,401 389
Emerging Markets 29,817 46,843 45,075 38,715 44,724
Note: Country-specific fundraising totals only capture single-country funds, not country al-locations or targets from regional or global funds. Regional totals include the underlying single-market values.
59%71% 70% 66%62%
29%
20%
23%
EM PE Fundraising by Region, 2010–2014 (% of Total Capital Raised)
100%
80%
60%
40%
20%
0%
% o
f Tot
al C
apita
l Rai
sed
2010 2011 2012 2013 2014
11%
46%
19%
6%
19%
25%
31%
12%
22%
39%
18%
27%
41%
10%
11%
n Chinan Indian Emerging Asia, ex-China and India*
n CEE and CISn Latin American MENAn Sub-Saharan Africa
n Multi-region
* This category includes regional funds.
6%
12%
9% 9%
2014 Emerging Markets Private Equity Fundraising and Investment Review 7
geopolitical environment, fundraising increased from US$1.4 billion in 2013 to US$2 billion in 2014.
Emerging Asia-focused funds raised US$29 billion in 2014, up from US$27 billion in the previous year. However, despite this absolute increase, Emerging Asia’s relative share of total funds raised for emerging markets decreased slightly from 70% in 2013 to 66% in 2014. Funds with a pan-Asia remit attracted the majority of capital raised for the region, increasing from US$11 billion to US$15 billion between 2013 and 2014, and comprised 51% of all Emerging Asia fundraising in 2014.
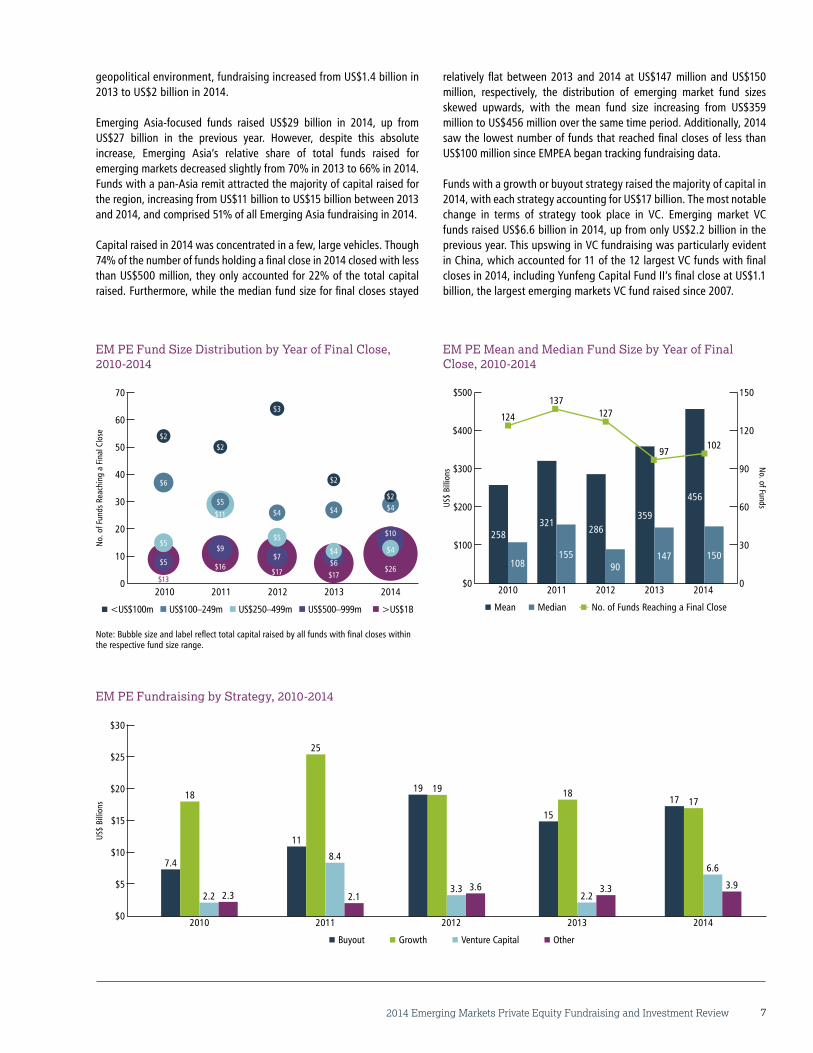
Capital raised in 2014 was concentrated in a few, large vehicles. Though 74% of the number of funds holding a final close in 2014 closed with less than US$500 million, they only accounted for 22% of the total capital raised. Furthermore, while the median fund size for final closes stayed
relatively flat between 2013 and 2014 at US$147 million and US$150 million, respectively, the distribution of emerging market fund sizes skewed upwards, with the mean fund size increasing from US$359 million to US$456 million over the same time period. Additionally, 2014 saw the lowest number of funds that reached final closes of less than US$100 million since EMPEA began tracking fundraising data.
Funds with a growth or buyout strategy raised the majority of capital in 2014, with each strategy accounting for US$17 billion. The most notable change in terms of strategy took place in VC. Emerging market VC funds raised US$6.6 billion in 2014, up from only US$2.2 billion in the previous year. This upswing in VC fundraising was particularly evident in China, which accounted for 11 of the 12 largest VC funds with final closes in 2014, including Yunfeng Capital Fund II’s final close at US$1.1 billion, the largest emerging markets VC fund raised since 2007.
EM PE Fundraising by Strategy, 2010-2014
$30
$25
$20
$15
$10
$5
$02010 2011 2012 2013 2014
US$
Billi
ons
n Buyout n Growth n Venture Capital n Other
7.4
18
2.2 2.3
11
25
8.4
2.1
19 19
3.3 3.6
15
18
2.23.3
17 17
6.6
3.9
US$
Billi
ons
n Mean n Median -n- No. of Funds Reaching a Final Close
150
120
90
60
30
0
No. of Funds
456
102
2010 2011 2012 2013 2014
150
359
97
147
286
127
90
321
137
155
258
124
108
EM PE Mean and Median Fund Size by Year of Final Close, 2010-2014
EM PE Fund Size Distribution by Year of Final Close, 2010-2014
70
60
50
40
30
20
10
0
No.
of F
unds
Rea
chin
g a
Fina
l Clo
se
2010 2011 2012 2013 2014
$9
$2
$16$17
$7
$5
$4
$3
$2
$4$5
$4$6
$17
$11
$2
$4
$6
$5
$5
$13
$2$4
$10
$26
n <US$100m n US$100–249m n US$250–499m n US$500–999m n >US$1B
Note: Bubble size and label reflect total capital raised by all funds with final closes within the respective fund size range.
$500
$400
$300
$200
$100
$0

© EMPEA March 2015. All rights reserved.8
2014 EM PE Investment Detail
Capital invested across emerging markets increased 26% year-on-year to US$34 billion in 2014, and the number of deals increased 18% to 1,246 over the same period. Both figures—capital invested and number of investments—represent the highest totals since EMPEA began tracking investment statistics in 2008. Emerging Asia drove this trend, as fund managers deployed US$26 billion and completed 857 deals in the region, accounting for 78% of total capital invested and 69% of the number of deals completed in emerging markets.
China alone accounted for nearly half of the total capital invested in emerging markets, with two deals each exceeding US$1 billion. Of the ten largest investments completed across emerging markets in 2014, Emerging Asia attracted all but two.
Sub-Saharan Africa was the only other major emerging market region in which capital invested increased, year-on-year. Fund managers deployed US$2 billion across the region in 2014, the most capital
EM PE Investment by Region, 2012–2014
2012 2013 2014
No. of Deals
Capital Invested (US$m)
No. of Deals
Capital Invested (US$m)
No. of Deals
Capital Invested (US$m)
Emerging Asia 583 15,513 668 17,901 857 26,255
China 239 7,256 277 7,443 403 15,659
India 251 3,825 280 3,817 295 3,985
CEE and CIS 145 2,425 112 2,034 138 973
Russia 55 1,314 32 272 31 80
Latin America 156 5,874 135 4,709 114 4,196
Brazil 83 4,578 70 3,229 54 2,724
MENA 52 1,662 54 409 43 381
Sub-Saharan Africa 78 1,131 89 1,724 94 1,950
Emerging Markets 1,014 26,605 1,058 26,776 1,246 33,756
Note: Regional totals include underlying single-market values.
67%58%
78%
EM PE Investment by Region, 2012–2014 (% of Total Capital Invested)
100%
80%
60%
40%
20%
0%
% o
f Tot
al C
apita
l Inv
este
d
2012 2013 2014
46%
20%
12%
12%
28%
25%
18%
14%
8%
27%
17%
22%
14%
9%
6%
n Chinan Indian Emerging Asia, ex-China and India
n CEE and CISn Latin America
n MENAn Sub-Saharan Africa
6%6%
Largest Known EM PE Investments in 2014
Fund Manager(s) Company Name ICB Sector CountryInvestment
TypeInvestment
Amount (US$m)Investment
Date
China International Capital Corp (CICC), Hopu Investment Management, RRJ Capital Sinopec Marketing Oil & Gas Producers China Growth 1,777 Dec-14
DST Global, Hopu Investment Management, Yunfeng Capital Xiaomi Software & Computer
Services China Growth 1,100 Dec-14
Bain Capital Grupo Notre Dame Intermedica (GNDI) Life Insurance Brazil Buyout 861 Mar-14
Baring Private Equity Asia, CDH Investments, Hony Capital Giant Interactive Group Leisure Goods China Buyout 808 Jul-14
The Blackstone Group Tamarind Energy Oil & Gas Producers Malaysia Growth 800 Jul-14
The Carlyle Group Tyco Fire & Security Services Korea (ADT Korea) Support Services South Korea Buyout 760 May-14
Warburg Pincus, China International Capital Corp (CICC), Goldman Sachs Merchant Banking Division (MBD)
China Huarong Asset Management Financial Services China Growth 700 Aug-14
Affinity Equity Partners Leong Hup Holdings Food Producers Malaysia Growth 600 Sep-14
CDH Investments Fujian Nanping Nanfu Battery
Household Goods & Home Construction China Buyout 600 Dec-14
KKR Aceco TI Technology Hardware & Equipment Brazil Buyout 572 Apr-14
2014 Emerging Markets Private Equity Fundraising and Investment Review 9
invested in Sub-Saharan Africa since 2008. Capital invested in Nigeria in 2014 increased nearly four-fold, year-on-year, with a total of US$612 million deployed in the country.
For CEE and CIS, Latin America and MENA, investment activity decreased year-on-year in 2014. Total capital invested in CEE and CIS fell to US$1 billion for the first time since EMPEA began tracking investment statistics in 2008. However, the number of deals increased by 23% due to a surge in venture capital activity. Latin America experienced a year-on-year decrease in both number of deals and total capital invested by 15% and 11%, respectively. This decrease was partly due to a drop in investment totals in Brazil and Chile, though capital invested in both Mexico and Colombia increased from 2013. Finally, total capital invested in MENA declined slightly from US$409 million in 2013 to US$381 million.
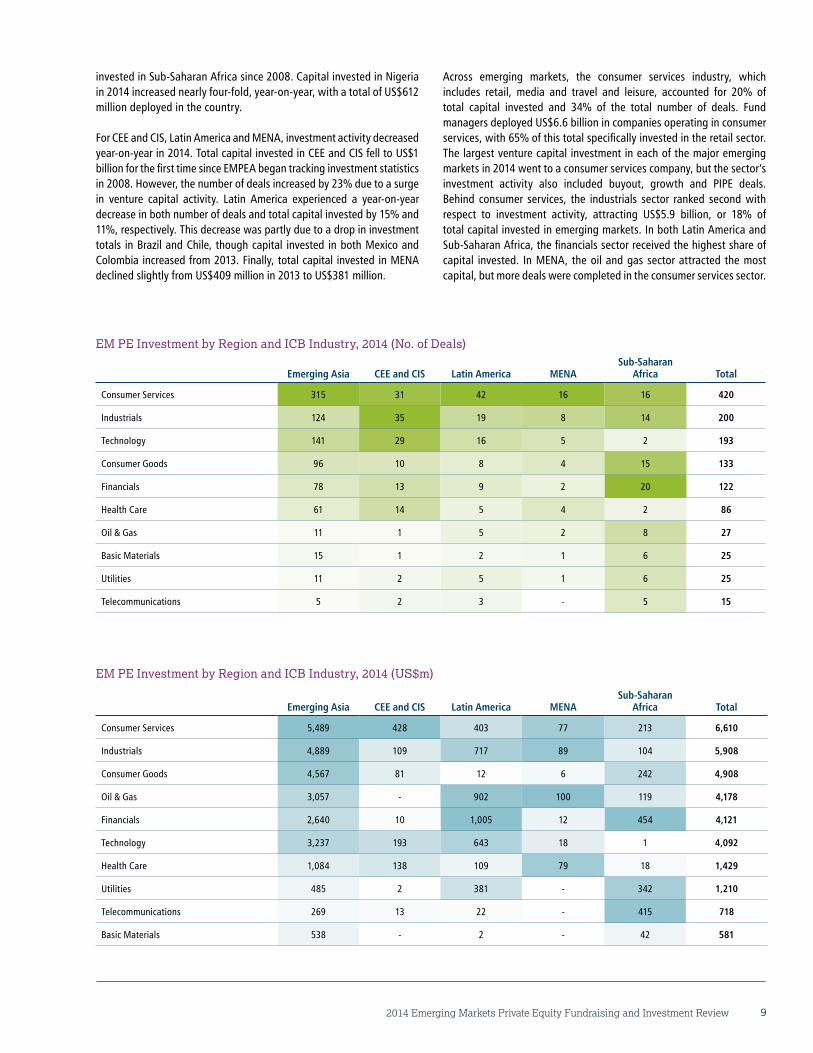
Across emerging markets, the consumer services industry, which includes retail, media and travel and leisure, accounted for 20% of total capital invested and 34% of the total number of deals. Fund managers deployed US$6.6 billion in companies operating in consumer services, with 65% of this total specifically invested in the retail sector. The largest venture capital investment in each of the major emerging markets in 2014 went to a consumer services company, but the sector’s investment activity also included buyout, growth and PIPE deals. Behind consumer services, the industrials sector ranked second with respect to investment activity, attracting US$5.9 billion, or 18% of total capital invested in emerging markets. In both Latin America and Sub-Saharan Africa, the financials sector received the highest share of capital invested. In MENA, the oil and gas sector attracted the most capital, but more deals were completed in the consumer services sector.
EM PE Investment by Region and ICB Industry, 2014 (No. of Deals)
Emerging Asia CEE and CIS Latin America MENASub-Saharan
Africa Total
Consumer Services 315 31 42 16 16 420
Industrials 124 35 19 8 14 200
Technology 141 29 16 5 2 193
Consumer Goods 96 10 8 4 15 133
Financials 78 13 9 2 20 122
Health Care 61 14 5 4 2 86
Oil & Gas 11 1 5 2 8 27
Basic Materials 15 1 2 1 6 25
Utilities 11 2 5 1 6 25
Telecommunications 5 2 3 - 5 15
EM PE Investment by Region and ICB Industry, 2014 (US$m)
Emerging Asia CEE and CIS Latin America MENASub-Saharan
Africa Total
Consumer Services 5,489 428 403 77 213 6,610
Industrials 4,889 109 717 89 104 5,908
Consumer Goods 4,567 81 12 6 242 4,908
Oil & Gas 3,057 - 902 100 119 4,178
Financials 2,640 10 1,005 12 454 4,121
Technology 3,237 193 643 18 1 4,092
Health Care 1,084 138 109 79 18 1,429
Utilities 485 2 381 - 342 1,210
Telecommunications 269 13 22 - 415 718
Basic Materials 538 - 2 - 42 581

© EMPEA March 2015. All rights reserved.10
Emerging markets venture capital* investment activity reached new highs in 2014, mirroring a multi-year global trend of resurgent interest in investing in young, innovative companies. From 2010 to 2014, capital invested and deals completed in the VC segment both increased by more than three-fold. Fund managers deployed US$6.9 billion in EM VC investments, spanning seed to late-stage, and completed 705 such deals in 2014. Both figures represent the highest VC totals recorded by EMPEA. China and India, with 299 and 180 VC investments, respectively, accounted for an aggregate 68% of EM VC deals in 2014. Deals from the most prolific VC investors in emerging markets over the last several years, including Sequoia Capital, Blume
Ventures, Matrix Partners and IDG Capital Partners (IDGVC), were heavily concentrated in Emerging Asia. Though a distant third among emerging markets with 28 deals completed in 2014, Brazil has also emerged as a VC investment destination in recent years, while in Russia, the most active VC market in CEE and CIS, fund managers executed 23 VC deals, on par with totals from previous years despite Russia’s escalating economic and geopolitical complications. In MENA and Sub-Saharan Africa, venture capital ecosystems are still coalescing and dealmaking is in its earliest stages, but both regions boast growing numbers of tech-savvy consumers and thus hold promise for VC investors.
2014 EM Venture Capital Spotlight
$20
$15
$10
$5
$0
Note: The 1st quartile range captures the smallest 25% of deals, the 2nd and 3rd quartile ranges capture the middle 50% of deals, and the 4th quartile range captures the largest 25% of deals; the 1st and 4th quartile ranges have been omitted to enhance readability and remove outliers.
US$
mill
ions
Size Distribution of EM VC Investments by Region, 2012-2014
No. of Deals w/ Disclosed Trans. Amt.
2nd & 3rd Quartile Range (w/ median)
n 2012 n 2013 n 2014
Regions
Emerging Asia
187 258 366
China
84 124 197
India
88 111 129
CEE and CIS
23 37 49
Russia
17 19 16
Latin America
21 27 30
Brazil
7 12 20
MENA
10 14 9
Sub-Saharan Africa
1 2 8
Emerging Markets
242 338 462
Most Active EM VC Dealmakers, 2012–2014
Fund Manager No. of Deals
Sequoia Capital 110
Blume Ventures 86
Matrix Partners 69
IDG Capital Partners (IDGVC) 68
Accel Partners 50
Tiger Global Management 46
Morningside Ventures 37
Shenzhen Capital Group (SCGC) 35
Kalaari Capital 32
SAIF Partners 31
$8
$6
$4
$2
$0
EM VC Investment, 2010-2014
US$
Billi
ons
n Capital Invested -n- No. of VC Deals
800
600
400
200
0
No. of Deals6.9
705
2010 2011 2012 2013 2014
2.8
482
2.2
359
3.6
347
1.9
217
*Venture capital includes seed, early-stage and late-stage investments.

2014 Emerging Markets Private Equity Fundraising and Investment Review 11
While buyout, growth, mezzanine and PIPE investments—collectively referred to here as private equity excluding venture capital (PE ex. VC)—have not experienced the same dramatic surge in activity as the VC subset in recent years, the amount of capital invested through PE ex. VC deals reached a post-financial crisis high in 2014. Fund managers deployed US$27 billion, an increase of 12% year-on-year. However, the number of deals completed in 2014 (541) was down 6% year-on-year and 25% compared to 2010, suggesting a trend towards fewer, larger growth and buyout transactions, just as a larger share of capital raised for emerging markets has accrued to a smaller group of such funds. Emerging Asia accounted for a majority of EM
fundraising—especially among the very largest funds—in 2014, and the situation was no different in terms of PE ex. VC deal activity. The region was home to a vast majority of the largest investments in emerging markets in 2014. The median PE ex. VC deal size increased in China and Brazil, but declined in emerging markets overall from US$21 million in 2013 to US$18 million in 2014. Among all EM regions, CEE and CIS suffered the sharpest decline in median deal size, falling 57%, year-on-year, to just US$14 million in 2014. Across all emerging markets, The Abraaj Group was the most active PE ex. VC fund manager from 2012 through 2014, completing 34 investments across 21 different EM countries.
2014 EM Private Equity (ex. VC) Spotlight
Most Active EM Private Equity (ex. VC) Dealmakers, 2012–2014
Fund Manager(s) No. of Deals
The Abraaj Group 34
Warburg Pincus 30
The Carlyle Group 26
Actis 25
IFC Asset Management Company (AMC) 24
AfricInvest Group 23
Sequoia Capital 23
XSML 20
Goldman Sachs Merchant Banking Division (MBD) 19
KKR, SAIF Partners, TPG 18
$40
$30
$20
$10
$0
EM Private Equity (ex. VC) Investment, 2010-2014
US$
Billi
ons
n Growth ($)* n Buyout ($) n PIPE ($) -n- No. of PE (ex VC) Deals
800
600
400
200
0
No. of Deals
13
541
2010 2011 2012 2013 2014
9
576
13
655
13
701
14
725
11
126.57.14.0
3.13.44.55.6
4.8
$160
$120
$80
$40
$0
Note: The 1st quartile range captures the smallest 25% of deals, the 2nd and 3rd quartile ranges capture the middle 50% of deals, and the 4th quartile range captures the largest 25% of deals; the 1st and 4th quartile ranges have been omitted to enhance readability and remove outliers.
US$
mill
ions
Size Distribution of EM Private Equity (ex. VC) Investments by Region, 2012-2014
No. of Deals w/ Disclosed Trans. Amt.
2nd & 3rd Quartile Range (w/ median)
n 2012 n 2013 n 2014
Regions
Emerging Asia
250 236 226
China
86 70 74
India
120 113 99
CEE and CIS
50 28 26
Russia
17 5 1
Latin America
66 49 34
Brazil
37 26 16
MENA
18 21 15
Sub-Saharan Africa
48 51 59
Emerging Markets
432 385 360
*Includes mezzanine investments.

© EMPEA March 2015. All rights reserved.12
Emerging Asia Fundraising and Investment, 2014
Despite Chinese GDP growth dipping to its lowest level in 25 years, resurgent private equity activity in China drove year-on-year increases in capital invested and deals completed of 47% and 28%, respectively, in 2014 for the Emerging Asia region. Investments of more than US$1 billion in China-based Sinopec Marketing and Xiaomi were the largest completed across all emerging markets. Fund managers also deployed significant capital in Malaysia, where The Blackstone Group’s US$800 million investment in Tamarind Energy helped push capital invested in Southeast Asia to US$3.7 billion. Total capital invested in India held
steady, year-on-year, but fundraising for India-dedicated vehicles increased 72% to US$2.1 billion in 2014. Fundraising for the region as a whole increased 8% year-on-year to US$29 billion, but skewed towards larger funds with regional, rather than country-specific mandates. Pan-Asia funds—led by The Carlyle Group and Affinity Equity Partners—accounted for 51% of capital raised for the region. Moreover, the bevy of US$1 billion-plus regional funds closed in 2014 drove the mean final fund size for Emerging Asia to US$557 million, up from US$398 million in 2013.
Emerging Asia Fundraising by Geographic Focus, 2010–2014 (US$m)
2010 2011 2012 2013 2014
Pan-Asia 4,162 6,232 10,917 10,667 14,878
China 8,607 21,611 11,380 10,277 9,686
India 3,225 2,647 2,604 1,235 2,123
Southeast Asia 1,478 1,638 1,546 2,989 1,216
Other 228 952 1,673 2,110 1,525
Total 17,699 33,079 28,121 27,277 29,428
Note: Pan-Asia regional funds exclude funds whose primary investment focus is Japan, Aus-tralia and/or New Zealand. Country-specific fundraising totals only capture single-country funds, not country allocations or targets from regional or global funds.
Emerging Asia Investment by Country, 2012–2014
2012 2013 2014
No. of Deals
Capital Invested (US$m)
No. of Deals
Capital Invested (US$m)
No. of Deals
Capital Invested (US$m)
China 239 7,256 277 7,443 403 15,659
India 251 3,825 280 3,817 295 3,985
South Korea 19 2,668 18 3,306 28 2,654
Singapore 34 745 43 2,024 46 1,688
Malaysia 9 263 13 477 10 1,618
Indonesia 7 455 13 41 28 149
Other 24 301 24 793 47 502
Total 583 15,513 668 17,901 857 26,255
Emerging Asia Investment by Country, 2012–2014 (US$B, No. of Deals)
51+19+14+7+4+2+3n Chinan Indian South Korean Singaporen Malaysian Indonesian Other
Total: US$60B, 2,108 Investments
US$30B, 919
US$12B, 826
US$8.6B, 65
US$1.6B, 95US$0.6B, 48
US$2.4B, 32US$4.5B, 123
Emerging Asia Fundraising and Investment, 2010–2014
$40
$30
$20
$10
$02010 2011 2012 2013 2014
US$
Billi
ons
2926
n Funds Raised n Capital Invested
27
18
28
16
33
2018
15
Emerging Asia Investment Activity by Half-Year, 2011–2014
$20
$15
$10
$5
$01H 2H 1H 2H 1H 2H 1H 2H
US$
Billi
ons
n Capital Invested -n- No. of Deals
500
400
300
200
100
0
No. of Deals
8.76.7
8.8 7.311 11
1511
2011 2012 2013 2014
353320 328
255306
362391
466
24%
49%
18%
8%
19%
65%
8%
39%
40%
9%
39%
38%
8%11%
Emerging Asia Fundraising by Geographic Focus, 2010–2014 (% of Total Capital Raised)
100%
80%
60%
40%
20%
0%
% o
f Tot
al C
apita
l Rai
sed
2010 2011 2012 2013 2014
n Pan-Asia n China n India n Southeast Asia n Other
51%
33%
7%

Singapore
2014 Emerging Markets Private Equity Fundraising and Investment Review 13
50+26-4911-256-101-50
Emerging Asia Investment by Country, 2014 (No. of Deals)

© EMPEA March 2015. All rights reserved.14
Largest Known Emerging Asia PE Funds Achieving a Final Close Since 2008
Fund Manager Fund NameVintage
YearFund
Currency Fund Type Geographic FocusTotal Capital
Raised (US$m)
KKR KKR Asian Fund II 2012 USD Buyout Asia 6,000
CVC Capital Partners CVC Capital Partners Asia Pacific III 2008 USD Buyout Asia 4,120
The Carlyle Group Carlyle Asia Partners IV 2012 USD Buyout Asia 3,900
TPG TPG Asia V 2008 USD Buyout Asia 3,841
Affinity Equity Partners Affinity Asia Pacific Fund IV 2013 USD Buyout Asia 3,800
Largest Known Emerging Asia PE Funds Achieving a Final Close in 2014
Fund Manager Fund NameVintage
YearFund
Currency Fund Type Geographic FocusTotal Capital
Raised (US$m)
The Carlyle Group Carlyle Asia Partners IV 2012 USD Buyout Asia 3,900
Affinity Equity Partners Affinity Asia Pacific Fund IV 2013 USD Buyout Asia 3,800
CVC Capital Partners CVC Capital Partners Asia Pacific IV 2013 USD Buyout Asia 3,500
TPG TPG Asia VI 2012 USD Buyout Asia 3,300
CDH Investments CDH China Fund V 2013 USD Growth China 2,550
Morgan Stanley Private Equity Asia (MSPEA)
Morgan Stanley Private Equity Asia IV 2012 USD Growth Asia 1,700
Yunfeng Capital Yunfeng Fund II 2013 USD Venture Capital China 1,100
Orchid Asia Group Management Orchid Asia VI 2014 USD Growth China 920
Largest Known Emerging Asia PE Investments Since 2008
Fund Manager(s) Company Name ICB Sector CountryInvestment
TypeInvestment
Amount (US$m)Investment
Date
China International Capital Corp (CICC), Hopu Investment Management, RRJ Capital
Sinopec Marketing Oil & Gas Producers China Growth 1,777 Dec-14
The Carlyle Group, CITIC Capital Partners, FountainVest Partners Focus Media Media China Buyout 1,131 Apr-13
DST Global, Hopu Investment Management, Yunfeng Capital Xiaomi Software & Computer
Services China Growth 1,100 Dec-14
Affinity Equity Partners, Baring Private Equity Asia, IMM Private Equity Kyobo Life Insurance Financial Services South
Korea Growth 1,060 Sep-12
MBK Partners Woongjin Coway Household Goods & Home Construction
South Korea Buyout 1,050 Nov-12
Largest Known Emerging Asia PE Investments in 2014
Fund Manager(s) Company Name ICB Sector CountryInvestment
TypeInvestment
Amount (US$m)Investment
Date
China International Capital Corp (CICC), Hopu Investment Management, RRJ Capital
Sinopec Marketing Oil & Gas Producers China Growth 1,777 Dec-14
DST Global, Hopu Investment Management, Yunfeng Capital Xiaomi Software & Computer
Services China Growth 1,100 Dec-14
Baring Private Equity Asia, CDH Investments, Hony Capital Giant Interactive Group Leisure Goods China Buyout 808 Jul-14
The Blackstone Group Tamarind Energy Oil & Gas Producers Malaysia Growth 800 Jul-14
The Carlyle Group Tyco Fire & Security Services Korea (ADT Korea) Support Services South Korea Buyout 760 May-14
Warburg Pincus, China International Capital Corp (CICC), Goldman Sachs Merchant Banking Division (MBD)
China Huarong Asset Management Financial Services China Growth 700 Aug-14
Affinity Equity Partners Leong Hup Holdings Food Producers Malaysia Growth 600 Sep-14
CDH Investments Fujian Nanping Nanfu Battery Household Goods & Home Construction China Buyout 600 Dec-14
2014 Emerging Markets Private Equity Fundraising and Investment Review 15
Spotlight: China, India and Singapore
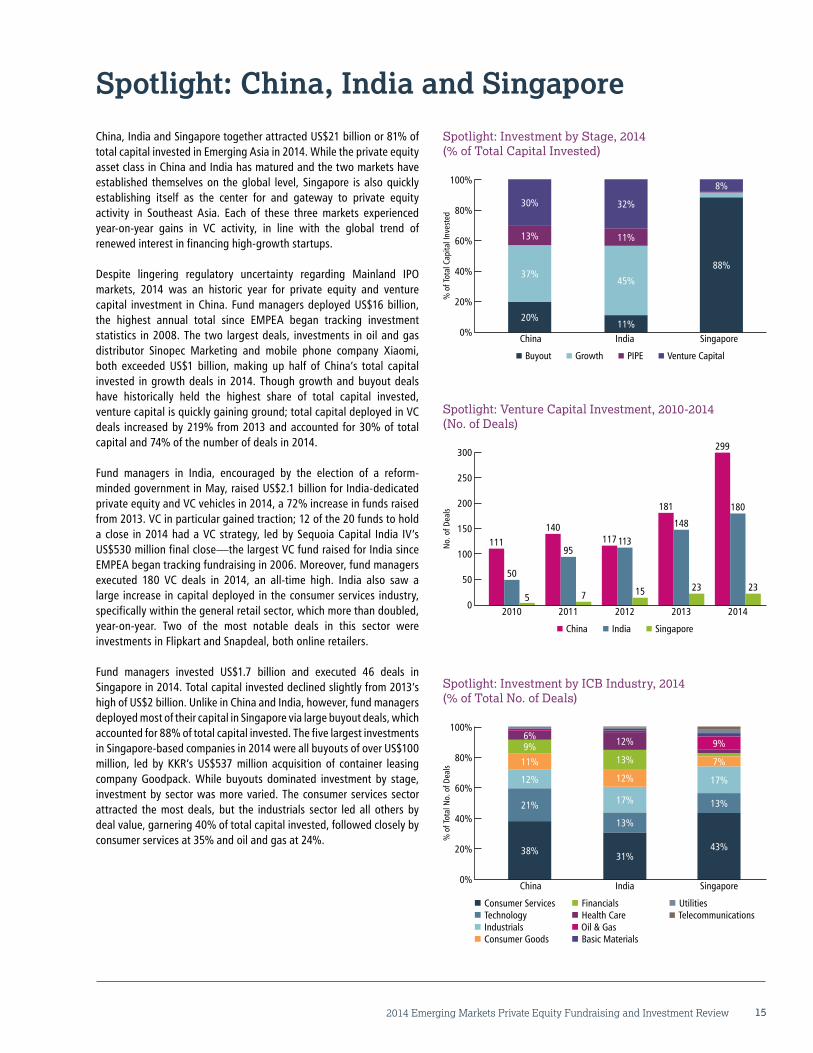
China, India and Singapore together attracted US$21 billion or 81% of total capital invested in Emerging Asia in 2014. While the private equity asset class in China and India has matured and the two markets have established themselves on the global level, Singapore is also quickly establishing itself as the center for and gateway to private equity activity in Southeast Asia. Each of these three markets experienced year-on-year gains in VC activity, in line with the global trend of renewed interest in financing high-growth startups.
Despite lingering regulatory uncertainty regarding Mainland IPO markets, 2014 was an historic year for private equity and venture capital investment in China. Fund managers deployed US$16 billion, the highest annual total since EMPEA began tracking investment statistics in 2008. The two largest deals, investments in oil and gas distributor Sinopec Marketing and mobile phone company Xiaomi, both exceeded US$1 billion, making up half of China’s total capital invested in growth deals in 2014. Though growth and buyout deals have historically held the highest share of total capital invested, venture capital is quickly gaining ground; total capital deployed in VC deals increased by 219% from 2013 and accounted for 30% of total capital and 74% of the number of deals in 2014.
Fund managers in India, encouraged by the election of a reform-minded government in May, raised US$2.1 billion for India-dedicated private equity and VC vehicles in 2014, a 72% increase in funds raised from 2013. VC in particular gained traction; 12 of the 20 funds to hold a close in 2014 had a VC strategy, led by Sequoia Capital India IV’s US$530 million final close—the largest VC fund raised for India since EMPEA began tracking fundraising in 2006. Moreover, fund managers executed 180 VC deals in 2014, an all-time high. India also saw a large increase in capital deployed in the consumer services industry, specifically within the general retail sector, which more than doubled, year-on-year. Two of the most notable deals in this sector were investments in Flipkart and Snapdeal, both online retailers.
Fund managers invested US$1.7 billion and executed 46 deals in Singapore in 2014. Total capital invested declined slightly from 2013’s high of US$2 billion. Unlike in China and India, however, fund managers deployed most of their capital in Singapore via large buyout deals, which accounted for 88% of total capital invested. The five largest investments in Singapore-based companies in 2014 were all buyouts of over US$100 million, led by KKR’s US$537 million acquisition of container leasing company Goodpack. While buyouts dominated investment by stage, investment by sector was more varied. The consumer services sector attracted the most deals, but the industrials sector led all others by deal value, garnering 40% of total capital invested, followed closely by consumer services at 35% and oil and gas at 24%.
Spotlight: Investment by Stage, 2014 (% of Total Capital Invested)
100%
80%
60%
40%
20%
0%
% o
f Tot
al C
apita
l Inv
este
d
China India Singapore
88%
11%
11%
45%
32%
20%
13%
37%
30%
8%
n Buyout n Growth n PIPE n Venture Capital
Spotlight: Investment by ICB Industry, 2014 (% of Total No. of Deals)
100%
80%
60%
40%
20%
0%
% o
f Tot
al N
o. o
f Dea
ls
China India Singapore
38%
12%
9%
21%
11%
n Consumer Servicesn Technologyn Industrialsn Consumer Goods
n Financialsn Health Caren Oil & Gasn Basic Materials
n Utilitiesn Telecommunications
6%
31%
17%
13%
13%
12%
12%
43%
17%
13%
7%
Spotlight: Venture Capital Investment, 2010-2014 (No. of Deals)
2010 2011 2012 2013 2014
No.
of D
eals
n China n India n Singapore
140
95117 113
15
181
148
23
299
180
23
111
50
5 7
300
250
200
150
100
50
0
9%

© EMPEA March 2015. All rights reserved.16
CEE and CIS Fundraising and Investment, 2014
The Ukraine conflict dominated political and economic headlines in CEE and CIS during 2014. The resulting economic sanctions against Russia and a sharp decline in oil prices in the last six months of 2014 destabilized the Russian financial system and broader economy, contributing to a decline in private equity fundraising for the country. Fundraising in Russia fell by 48%, year-on-year, to US$313 million in 2014, and while overall fundraising in CEE and CIS rose 36%, year-on-year, to US$2 billion in 2014, Mid Europa Fund IV’s July close with US$1.1 billion in
capital commitments accounted for over half of all fundraising in the region. Investment totals in 2014 declined throughout CEE and CIS, with the decrease most pronounced in Russia, where capital invested fell 70%, year-on-year, to US$80 million. Conversely, GPs invested US$327 million in the Czech Republic, its highest total since 2009 and the largest single-country total in CEE and CIS during 2014. Overall, however, total capital invested in CEE and CIS fell to just under US$1 billion for the first time since EMPEA began tracking investment statistics in 2008.
CEE and CIS Investment by Country, 2012-2014
2012 2013 2014
No. of Deals
Capital Invested (US$m)
No. of Deals
Capital Invested (US$m)
No. of Deals
Capital Invested (US$m)
Russia 55 1,314 32 272 31 80
Poland 17 373 21 462 26 276
Turkey 28 331 17 380 12 143
Serbia 2 N/A 3 712 2 N/A
Czech Republic 5 6 6 1 10 327
Bulgaria 4 232 2 43 2 4
Other 34 168 31 875 55 144
Total 145 2,425 112 2,034 138 973
CEE and CIS Investment by Country, 2012-2014 (US$B, No. of Deals)
31+20+16+13+6+5+9n Russian Polandn Turkeyn Serbian Czech Republicn Bulgarian Other
Total: US$5.4B, 395 Investments
US$1.7B, 118
US$0.9B, 57
US$0.7B, 7
US$0.5B, 120US$0.3B, 8
US$0.3B, 21
CEE and CIS Fundraising and Investment, 2010–2014
$6
$4
$2
$02010 2011 2012 2013 2014
US$
Billi
ons
2.0
1.0
n Funds Raised n Capital Invested
1.42.0
5.2
2.41.9
3.5
1.31.7
CEE and CIS Investment Activity by Half-Year, 2011-2014
$3
$2
$1
$01H 2H 1H 2H 1H 2H 1H 2H
US$
Billi
ons
n Capital Invested -n- No. of Deals
100
80
60
40
20
0
No. of Deals
1.5 1.50.9
0.6
1.5
0.5 0.5
2.0
2011 2012 2013 2014
81
53
7075
5359
86
52
CEE and CIS Fundraising by Geographic Focus, 2010-2014 (US$m)
2010 2011 2012 2013 2014
CEE and CIS Regional 184 236 154 - 100
CEE 808 896 805 611 1,385
Turkey 50 219 1,990 55 -
CIS 145 311 1,719 174 160
Russia 75 262 575 601 313
Total 1,263 1,924 5,244 1,442 1,958
Note: Country-specific fundraising totals only capture single-country funds. “CEE and CIS Regional” captures funds investing across the entire region, while “CEE” and “CIS” capture all other funds raised for the respective sub-regions.
15%
64%
11%
12%
47%
11%
15%
38%
42%
42%
12%
CEE and CIS Fundraising by Geographic Focus, 2010-2014 (% of Total Capital Raised)
100%
80%
60%
40%
20%
0%
% o
f Tot
al C
apita
l Rai
sed
2010 2011 2012 2013 2014
n CEE and CIS Regional n CEE n Turkey n CIS n Russia
71%
6%
16%
14%
33%
11% 16%
8%
US$1.1B, 64
2014 Emerging Markets Private Equity Fundraising and Investment Review 17
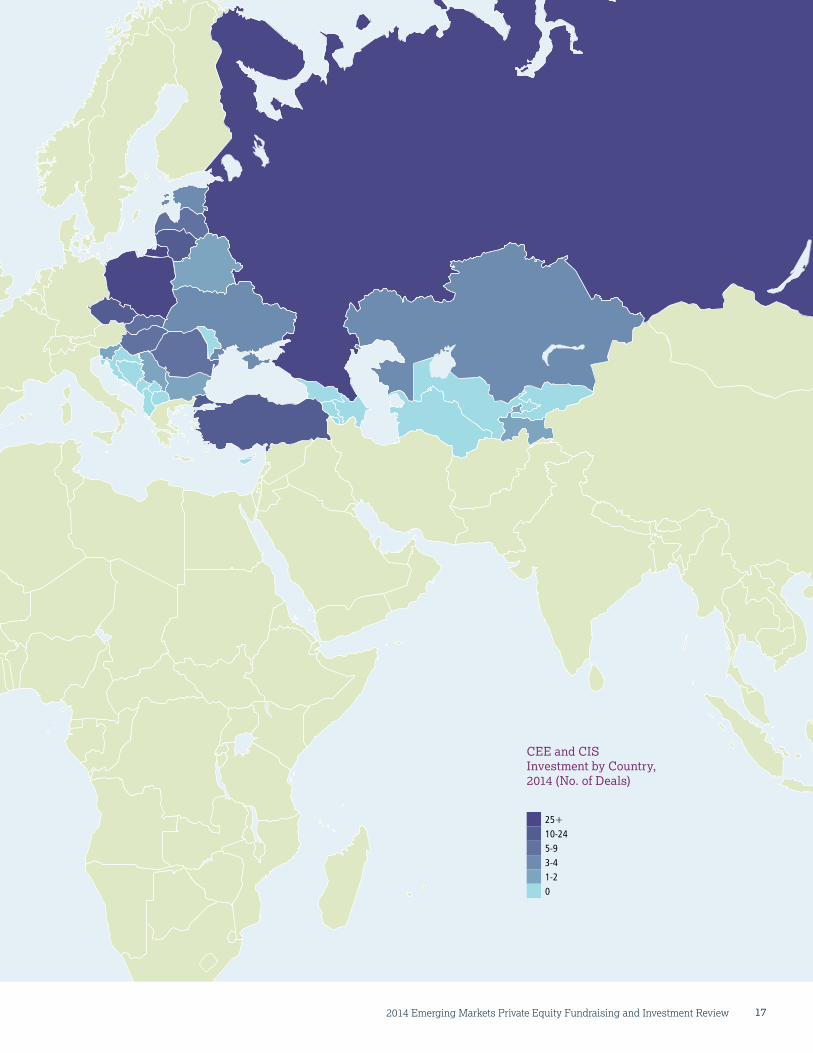
25+10-245-93-41-20
CEE and CIS Investment by Country, 2014 (No. of Deals)

© EMPEA March 2015. All rights reserved.18
Largest Known CEE and CIS PE Funds Achieving a Final Close Since 2008
Fund Manager Fund NameVintage
YearFund
Currency Fund Type Geographic FocusTotal Capital
Raised (US$m)
Baring Vostok Capital Partners Baring Vostok Private Equity Fund V* 2012 USD Growth CIS, Russia 1,632
Advent International Advent Central & Eastern Europe IV 2008 EUR Buyout CEE 1,562
Actera Group Actera Partners II 2012 USD Buyout Turkey 1,100
Mid Europa Partners Mid Europa Fund IV 2014 EUR Buyout CEE 1,095
Turkven Turkish Private Equity Fund III 2012 USD Buyout Turkey 840*Baring Vostok Private Equity Fund V fundraising total includes Supplemental Fund.
Largest Known CEE and CIS PE Funds Achieving a Final Close in 2014
Fund Manager Fund NameVintage
YearFund
Currency Fund Type Geographic FocusTotal Capital
Raised (US$m)
Mid Europa Partners Mid Europa Fund IV 2014 EUR Buyout CEE 1,095
Elbrus Capital Elbrus Capital Fund II 2012 USD Buyout Russia 550
EMSA Capital CEE Special Situations Fund 2011 EUR Special Situations CEE 132
CapMan CapMan Russia Fund II 2013 EUR Growth Russia 129
Unicorn Capital Partners Unicorn Capital Partners Fund I 2013 USD Buyout CIS 100
Third Rome Black River Ventures Russian Internet Technology Fund 2014 USD Venture Capital Russia 50
Buran Venture Capital Buran Venture Capital Fund 2012 USD Venture Capital CIS, Russia 50
Practica Capital Practica Venture Capital Fund 2014 EUR Venture Capital Lithuania 21
Largest Known CEE and CIS PE Investments Since 2008
Fund Manager(s) Company Name ICB Sector CountryInvestment
TypeInvestment
Amount (US$m)Investment
Date
DeA Capital, BC Partners, Turkven Migros Food & Drug Retailers Turkey Buyout 1,482 May-08
CVC Capital Partners StarBev Beverages Czech Republic Buyout 1,231 Oct-09
TPG, VTB Capital Lenta Food & Drug Retailers Russia Buyout 970 Aug-11
KKR SBB/Telemach Group Fixed Line Telecommunications Serbia Buyout 712 Oct-13
Lion Capital, Goldman Sachs Merchant Banking Division (MBD), UFG Asset Management
Russian Alcohol Group Beverages Russia Buyout 600 Jul-08
Largest Known CEE and CIS PE Investments in 2014
Fund Manager(s) Company Name ICB Sector CountryInvestment
TypeInvestment
Amount (US$m)Investment
Date
Abris Capital Partners AAA AUTO Group General Retailers Czech Republic Buyout 276 Nov-14
Innova Capital, MCI Management Grupa Wirtualna Polska Software & Computer Services Poland Buyout 123 Feb-14
Innova Capital Rieber Foods Polska Food Producers Poland Buyout 39 Jul-14
NBK Capital Yatsan Household Goods & Home Construction Turkey Growth 37 Jun-14
Insight Venture Partners, Accel Partners Vinted General Retailers Lithuania Venture
Capital 27 Feb-14
Index Ventures, Earlybird Venture Capital Socialbakers Software & Computer
ServicesCzech
RepublicVenture Capital 26 Feb-14
The Gores Group Fotona Health Care Equipment & Services Slovenia Buyout 25 Jan-14
Syntaxis Capital Glass Team Construction & Materials Poland Mezzanine 20 Aug-14

2014 Emerging Markets Private Equity Fundraising and Investment Review 19
Spotlight: Poland, Russia and Turkey
Over the past five years, Russia, Poland and Turkey have attracted the majority of private equity investment activity in CEE and CIS. Russia has been the most active market for private equity investment during that period; however, in 2014, more capital was invested in both Poland and Turkey than in Russia for the second consecutive year, despite investment totals in Poland and Turkey each posting year-on-year declines.
In 2014, investment in Russia fell to US$80 million, declining for the third consecutive year from US$1.6 billion in 2011. Though capital invested declined sharply in 2014, the 31 deals completed in Russia remained relatively constant with the number of deals in 2013 and 2011. As a result, average deal size in Russia was significantly lower than in previous years, with 82% of deals completed worth less than US$10 million. Despite the less-than-favorable political and economic conditions in Russia and the CIS region as a whole, investors have reason to be optimistic going forward. While some GPs exercised caution and patience in deploying capital in 2014, partly due to the macroeconomic uncertainty surrounding the country, many have significant amounts of uncalled capital remaining from their fundraising efforts in 2012 and 2013, and these fund managers will likely look to deploy larger amounts of capital in 2015.
From 2008 to 2014, Poland attracted the largest number of private equity deals in the CEE region. Fund managers executed 26 deals in Poland in 2014, second only to the 27 deals completed in 2010. However, capital invested declined in 2014, falling to US$276 million. Innova Capital and MCI Management’s US$123 million buyout of software company Grupa Wirtualna Polska accounted for 45% of capital invested and was the largest deal in 2014. Despite the 40% year-on-year decline in total capital invested in Poland, investment in venture capital deals rose 154%, year-on-year, to US$31 million.
While Poland has attracted the most private equity deals in CEE since 2008, Turkey has accounted for the largest amount of capital deployed in the region. However, recent economic difficulties caused in part by rising interest rates and instability in neighboring countries Iraq and Syria have caused concern for investors. 2014 proved to be a challenging year for private equity in Turkey, with both capital invested and number of deals completed falling to five-year lows at US$143 million and 12 deals, respectively. Looking forward, falling oil prices stand to benefit Turkey and aid its economic recovery. In addition, fundraising levels may also rebound in 2015, as some of the country’s larger fund managers prepare to re-enter the market, having last raised funds in 2012.
Spotlight: Investment by Country, 2010-2014 (US$m)
$1,800
$1,500
$1,200
$900
$600
$300
02010 2011 2012 2013 2014
US$
Mill
ions
n Poland n Russia n Turkey
682
373 331462
272380
276143
369
658769
17380
1,314
1,628
Spotlight: Investment by Country, 2010-2014 (No. of Deals)
60
50
40
30
20
10
02010 2011 2012 2013 2014
No.
of D
eals
-n- Poland -n- Russia -n- Turkey
41
34
55
32 3127
17
32
17
28
1721
17
26
12
Spotlight: Investment by ICB Industry, 2014 (% of Total No. of Deals)
100%
80%
60%
40%
20%
0%
% o
f Tot
al N
o. o
f Dea
ls
Poland Russia Turkey
23%
27%
23%
12%
n Consumer Servicesn Technologyn Industrials
n Financialsn Consumer Goods n Health Care
n Utilitiesn Telecommunications
8%
39%
23%
23%
6%10%
17%
8%
25%
17%
25%
8%

© EMPEA March 2015. All rights reserved.20
Latin America Fundraising and Investment, 2014
Fundraising in Latin America reached US$7.8 billion in 2014, increasing 107% from US$3.8 billion in 2013 and representing the highest annual total since 2011. Advent International, Patria Investimentos and Gavea Investimentos all closed US$1 billion-plus funds, together accounting for over half of total Latin America fundraising. However, investment activity did not follow suit, with total capital invested in Latin America falling to US$4.2 billion in 2014, despite the fact that capital invested in deals of US$300 million or more increased 76%, year-on-year, to
US$2.8 billion. Investments between US$100-299 million declined from US$1.8 billion in 2013 to only US$687 million in 2014, a 62% year-on-year decrease, while smaller venture and growth investments composed a large share of overall investment activity. Over half of all deals completed in Latin America in 2014 were worth less than US$10 million, while in the previous three years deals worth less than US$10 million fluctuated between 34% and 37% of total capital invested annually in the region.
Latin America Fundraising by Geographic Focus, 2010-2014 (US$m)
2010 2011 2012 2013 2014
Regional 3,700 788 1,419 343 3,334
Brazil 2,465 7,169 2,844 1,598 4,146
Mexico 316 430 798 800 190
Andes 454 507 137 962 174
Other - - 50 77 -
Total 6,935 8,894 5,248 3,780 7,844
Note: Country-specific fundraising totals only capture single-country funds, not country allocations or targets from regional or global funds. “Andes” includes all Peru- and Colom-bia-dedicated funds.
Latin America Investment by Country, 2012-2014
2012 2013 2014
No. of Deals
Capital Invested (US$m)
No. of Deals
Capital Invested (US$m)
No. of Deals
Capital Invested (US$m)
Brazil 83 4,578 70 3,229 54 2,724
Mexico 16 194 20 407 23 782
Chile 13 223 7 652 3 2
Colombia 12 119 13 179 16 496
Peru 11 140 7 53 4 20
Other 21 621 18 188 14 172
Total 156 5,874 135 4,709 114 4,196
Latin America Investment by Country, 2012-2014 (US$B, No. of Deals)
71+9+6+5+1+8 n Braziln Mexicon Chilen Colombian Perun Other
Total: US$15B, 405 Investments
US$11B, 207
US$1.4B, 59
US$1.0B, 53US$0.2B, 22
US$0.8B, 41US$0.9B, 23
Latin America Fundraising and Investment, 2010–2014
$10
$8
$6
$4
$2
$02010 2011 2012 2013 2014
US$
Billi
ons
7.8
4.2
n Funds Raised n Capital Invested
3.84.7
5.25.9
8.9
4.0
6.9 6.5
Latin America Investment Activity by Half-Year, 2011-2014
$5
$4
$3
$2
$1
$01H 2H 1H 2H 1H 2H 1H 2H
US$
Billi
ons
n Capital Invested -n- No. of Deals
100
80
60
40
20
0
No. of Deals
2.1 2.0
3.8
1.6
3.22.3 1.91.9
2011 2012 2013 2014
62
7771
85
69 6658 56
53%
36%
7%
9%
81%
27%
54%
15%
9%
42%
25%
Latin America Fundraising by Geographic Focus, 2010-2014 (% of Total Capital Raised)
100%
80%
60%
40%
20%
0%
% o
f Tot
al C
apita
l Rai
sed
2010 2011 2012 2013 2014
n Regional n Brazil n Mexico n Andes n Other
43%
53%21%
6%

2014 Emerging Markets Private Equity Fundraising and Investment Review 21
25+10-245-93-41-20
Latin America Investment by Country, 2014 (No. of Deals)

© EMPEA March 2015. All rights reserved.22
Largest Known Latin America PE Funds Achieving a Final Close Since 2008
Fund Manager Fund NameVintage
YearFund
Currency Fund Type Geographic FocusTotal Capital
Raised (US$m)
Advent International Latin American Private Equity Fund VI 2014 USD Buyout Latin America 2,100
Gavea Investimentos GIF IV 2011 USD Growth Brazil 1,900
Patria Investimentos Patria Brazilian Private Equity Fund V 2014 USD Buyout Brazil 1,800
Southern Cross Group Southern Cross Latin America Private Equity IV 2010 USD Buyout Latin America 1,680
Advent International Latin American Private Equity Fund V 2009 USD Buyout Latin America 1,650
Largest Known Latin America PE Funds Achieving a Final Close in 2014
Fund Manager Fund NameVintage
YearFund
Currency Fund Type Geographic FocusTotal Capital
Raised (US$m)
Advent International Latin American Private Equity Fund VI 2014 USD Buyout Latin America 2,100
Patria Investimentos Patria Brazilian Private Equity Fund V 2014 USD Buyout Brazil 1,800
Gavea Investimentos GIF V 2014 USD Growth Brazil 1,060
ACON Investments ACON Latin America Opportunities Fund IV 2014 USD Buyout Latin America 515
NSG Capital NSG Retail and Food 2014 BRL Buyout Brazil 172
The Carlyle Group Fundo Brasil de Internacionalizacao de Empresas II 2014 BRL Buyout Brazil 169
Alta Growth Capital Alta Growth Capital Mexico Fund II 2012 USD Growth Mexico 152
Largest Known Latin America PE Investments Since 2008
Fund Manager(s) Company Name ICB Sector CountryInvestment
TypeInvestment
Amount (US$m)Investment
Date
BTG Pactual, EIG Global Energy Partners Sete Brasil Oil Equipment, Services
& Distribution Brazil Growth 1,232 Jul-12
The Carlyle Group Grupo Qualicorp Nonlife Insurance Brazil Buyout 913 Sep-10
Bain Capital Grupo Notre Dame Intermedica (GNDI) Life Insurance Brazil Buyout 861 Mar-14
BTG Pactual Brasil Telecom Cabos Submarinos (GlobeNet)
Fixed Line Telecommunications Brazil Buyout 768 Jul-13
KKR Aceco TI Technology Hardware & Equipment Brazil Buyout 572 Apr-14
Largest Known Latin America PE Investments in 2014
Fund Manager(s) Company Name ICB Sector CountryInvestment
TypeInvestment
Amount (US$m)Investment
Date
Bain Capital Grupo Notre Dame Intermedica (GNDI) Life Insurance Brazil Buyout 861 Mar-14
KKR Aceco TI Technology Hardware & Equipment Brazil Buyout 572 Apr-14
Brookfield Asset Management VLI Industrial Transportation Brazil Buyout 500 Aug-14
Riverstone Holdings, EnCap Investments Sierra Oil & Gas Oil & Gas Producers Mexico Growth 450 Sep-14
Darby Private Equity Oleoducto Central (Ocensa) Oil Equipment, Services & Distribution Colombia Growth 385 Mar-14
Actis Zuma Energia Electricity Mexico Growth 250 Sep-14
Southern Cross Group Ultrapetrol Industrial Transportation South America Growth 118 Jul-14

2014 Emerging Markets Private Equity Fundraising and Investment Review 23
Spotlight: Brazil, Colombia and Mexico
In 2014, Brazil remained the dominant market for private equity activity in Latin America, followed by Mexico and Colombia. Together, the three markets attracted 82% of deals by number and 95% of all capital invested in Latin America during 2014. Brazil accounted for 65% of capital invested in the region and 53% of capital raised for Latin America in 2014.
Despite a turbulent 2014, which included a divisive presidential election, an ongoing corruption scandal involving state-controlled oil and gas company Petrobras and plummeting oil prices, Brazil-dedicated private equity funds raised US$4.1 billion in 2014, the highest annual total since US$7.2 billion was raised in 2011. Large, established private equity firms raising follow-on funds dominated fundraising in 2014, with Patria’s Brazilian Private Equity Fund V and Gavea Investimentos’ GIF V reaching final closes at US$1.8 billion and US$1.06 billion, respectively. Although capital invested in Brazil declined by 16%, year-on-year, capital invested in venture deals quadrupled, reaching US$197 million and accounting for 7% of total capital invested in the country in 2014. In the previous four years, venture capital investment had never exceeded US$51 million or accounted for more than 2% of total capital invested annually in Brazil.
Capital invested in Colombia reached US$496 million in 2014, a 177% increase, year-on-year, and the highest annual total since fund managers invested US$631 million in the country in 2010. The most popular sector for investment in Colombia by number of deals completed was consumer services, mirroring a global emerging markets trend for 2014. However, the oil and gas sector attracted the largest investment in Colombia: Darby Private Equity’s US$385 million acquisition of a 5% stake in Oleoducto Central, which manages Colombia’s largest oil pipeline.
Perhaps the most noteworthy 2014 investment in Latin America was Riverstone Holdings and Encap Investments’ US$450 million investment in Sierra Oil & Gas, Mexico’s first independent oil and gas company. This investment, which accounted for 58% of total capital invested in Mexico in 2014, came to fruition as a result of Mexico’s historic energy sector reforms, which ended state-owned Pemex’s monopoly and allowed for foreign investment in the energy sector. While the recent decline in oil prices may have diminished the attractiveness of Mexico’s energy sector, especially its difficult-to-exploit shale fields, there remains significant interest in the country’s oil and gas projects.
Spotlight: Investment by ICB Industry, 2014 (% of Total No. of Deals)
100%
80%
60%
40%
20%
0%
% o
f Tot
al N
o. o
f Dea
ls
Brazil Colombia Mexico
39%
22%
7%
15%
6%
n Consumer Servicesn Industrialsn Technologyn Consumer Goods
n Oil & Gasn Financialsn Health Caren Utilities
n Telecommunicationsn Basic Materials
31%
13%
6%
19%
13%
13%
6%
43%
9%
9%9%9%
13%
Spotlight: Year-on-year % Change, 2011-2014 (Total Capital Invested)
200%
150%
100%
50%
0%
-50%
-100%2011 2012 2013 2014
% C
hang
e
n Brazil n Colombia n Mexico
-33-33 -37
-72
60
2151
-29
110
177
-16
92
Spotlight: Year-on-year % Change, 2011-2014 (No. of Deals)
60%
40%
20%
0%
-20%
-40%2011 2012 2013 2014
% C
hang
e
n Brazil n Colombia n Mexico
-33
-5
-24
19
8
-16
25 23
-23
15
50
3

© EMPEA March 2015. All rights reserved.24
MENA Fundraising and Investment, 2014
Private equity fund managers raised US$1.1 billion for MENA in 2014, setting a new record for capital raised in the post-2008 global financial crisis era. Gulf Capital’s US$750 million final close on GC Equity Partners III in the fourth quarter was the largest MENA-focused fund closed in 2014, followed by NBK Capital Equity Partners Fund II, which closed with US$310 million in capital commitments in Q3. Total capital invested in the region, on the other hand, declined slightly
from US$409 million invested in 2013 to US$381 million in 2014. An especially slow fourth quarter, in which fund managers deployed only US$15 million, coincided with falling oil prices and volatility in the GCC’s public markets. Looking forward, the influx of fresh capital from this year’s fundraising efforts and evidence of fund managers’ ability to return capital will help to build the case for MENA private equity and attract greater investor interest in the region.
MENA Fundraising by Geographic Focus, 2010-2014 (US$m)
2010 2011 2012 2013 2014
Pan-MENA 630 24 413 317 193
Middle East 10 101 - - 750
North Africa 83 137 27 224 34
Country-dedicated 50 182 138 27 99
Total 773 444 578 568 1,076
Note: Country-dedicated fundraising totals only capture single-country funds, not country allocations or targets from regional or global funds.
MENA Investment by Country, 2012-2014
2012 2013 2014
No. of Deals
Capital Invested (US$m)
No. of Deals
Capital Invested (US$m)
No. of Deals
Capital Invested (US$m)
United Arab Emirates 12 1,077 13 122 8 74
Morocco 10 339 10 26 8 39
Saudi Arabia 2 148 5 52 2 N/A
Egypt 7 35 5 112 5 40
Tunisia 4 39 10 85 5 35
Other 17 24 11 12 15 193
Total 52 1,662 54 409 43 381
MENA Investment by Country, 2012-2014 (US$B, No. of Deals)
52+16+8+8+6+10 n United Arab Emiratesn Moroccon Saudi Arabian Egyptn Tunisian Other
Total: US$2.5B, 149 Investments
US$1.3B, 33
US$0.4B, 28
US$0.2B, 9
US$0.2B, 43US$0.2B, 19
US$0.2B, 17
MENA Fundraising and Investment, 2010–2014
$2
$1
$02010 2011 2012 2013 2014
US$
Billi
ons
1.1
0.4
n Funds Raised n Capital Invested
0.60.4
0.6
1.7
0.4 0.4
0.8 0.8
MENA Investment Activity by Half-Year, 2011-2014
$2
$1
$01H 2H 1H 2H 1H 2H 1H 2H
US$
Billi
ons
n Capital Invested -n- No. of Deals
40
30
20
10
0
No. of Deals
0.61.1
0.3 0.30.3
2011 2012 2013 2014
12
18
30
2226
28
19
24
0.1 0.1 0.1
82%
11%6%
23%
31%71%
56%
11%
MENA Fundraising by Geographic Focus, 2010-2014 (% of Total Capital Raised)
100%
80%
60%
40%
20%
0%
% o
f Tot
al C
apita
l Rai
sed
2010 2011 2012 2013 2014
n Pan-MENA n Middle East n North Africa n Country-dedicated
18%
70%
39%41%24%
9%

2014 Emerging Markets Private Equity Fundraising and Investment Review 25
8+6-74-52-310
MENA Investment by Country, 2014 (No. of Deals)

© EMPEA March 2015. All rights reserved.26
Largest Known MENA PE Funds Achieving a Final Close Since 2008
Fund Manager Fund NameVintage
YearFund
Currency Fund Type Geographic FocusTotal Capital
Raised (US$m)
The Abraaj Group Abraaj Private Equity Fund IV 2008 USD Buyout MENA 1,600
Investcorp Gulf Opportunity Fund I 2007 USD Growth Middle East 1,000
Gulf Capital GC Equity Partners Fund III 2014 USD Buyout Middle East 750
Gulf Capital GC Equity Partners Fund II 2008 AED Buyout MENA 544
Global Capital Management (GIH) Global Buyout Fund 2007 USD Buyout Middle East 527
Largest Known MENA PE Funds Achieving a Final Close in 2014
Fund Manager Fund NameVintage
YearFund
Currency Fund Type Geographic FocusTotal Capital
Raised (US$m)
Gulf Capital GC Equity Partners Fund III 2014 USD Buyout Middle East 750
NBK Capital NBK Capital Equity Partners Fund II 2013 USD Growth MENA 310
Largest Known MENA PE Investments Since 2008
Fund Manager(s) Company Name ICB Sector CountryInvestment
TypeInvestment
Amount (US$m)Investment
Date
CHAMP Private Equity, Castle Harlan, Lime Rock Partners Shelf Drilling Oil & Gas Producers United Arab
Emirates Buyout 855 Nov-12
The Abraaj Group Network International Support Services United Arab Emirates Buyout 539 Dec-10
The Abraaj Group Karachi Electric Supply Company (KESC) Electricity Pakistan Buyout 361 May-08
Invest AD, Delta Partners Capital Mobiserve (OrasInvest) Mobile Telecommunications Egypt Buyout 180 Dec-08
The Abraaj Group Integrated Diagnostics Holdings (Al Borg)
Health Care Equipment & Services Egypt Buyout 151 May-08
Largest Known MENA PE Investments in 2014
Fund Manager(s) Company Name ICB Sector CountryInvestment
TypeInvestment
Amount (US$m)Investment
Date
Kerogen Capital HKN Holding Oil & Gas Producers Iraq Growth 100 Apr-14
Olympus Capital Asia, India Value Fund Advisors (IVFA) Aster DM Healthcare Health Care Equipment
& ServicesUnited Arab
Emirates Growth 60 May-14
NBK Capital Al Faysal Bakery Food & Drug Retailers Kuwait Mezzanine 23 Jan-14
Gulf Capital Middle East Glass Manufacturing (MEG) General Industrials Egypt PIPE 21 Sep-14
Development Partners International Universite Privee de Marrakech (UPM) General Retailers Morocco Growth 20 May-14
The Abraaj Group Cairo Medical Center Health Care Equipment & Services Egypt PIPE 15 Jul-14
AfricInvest Group One Tech Software & Computer Services Tunisia Growth 15 May-14
The Abraaj Group Assad Group Electronic & Electrical Equipment Tunisia PIPE 15 Aug-14
Summit Partners Namshi General Retailers United Arab Emirates
Venture Capital 13 May-14
Swicorp Al Quds for Development (Luminus Group) General Retailers Jordan Growth 9 Jun-14

2014 Emerging Markets Private Equity Fundraising and Investment Review 27
Spotlight: Egypt, Morocco and United Arab Emirates
In 2014, the most popular markets for private equity investment in the MENA region were Egypt, Morocco and the United Arab Emirates (UAE). Historically, these three markets have been the most prominent—attracting more than 75% of the total capital invested and more than 50% of the total number of deals in the region from 2010 to 2014. While all three markets offer investors compelling investment opportunities—eight of the MENA region’s ten largest deals in the last five years took place in Egypt, Morocco and the UAE—recent macroeconomic and political events have affected local private equity industries in varying ways.
In Egypt, private equity investors have demonstrated that opportunities remain even throughout periods of political and economic instability. Fund managers mitigated risk during the Arab Spring by focusing on defensive sectors, such as food products and healthcare, and opportunities in these sectors persist. Healthcare attracted the most interest in 2014, exemplified by The Abraaj Group’s investment in Cairo Medical Center and TVM Capital Healthcare Partner’s acquisition of a minority stake in Ameco Medical Industries, both publicly-listed healthcare companies. The Abraaj Group also made headlines in 2014 in a bidding war with Kellogg for Egyptian baked goods and confectionery manufacturer BiscoMisr. The transparent bidding process validates growing interest in the country and is a positive sign for Egypt’s long-term investment prospects.
The UAE itself did not experience significant unrest during the Arab Spring, yet nevertheless investment totals dipped dramatically to just two deals in 2011. In the following years, however, private equity investors executed more deals in the UAE than in any other country in MENA. Perhaps because it was one of the more stable markets in the region during that period, the UAE attracted 25 deals—more than 20% of the region’s investments—between 2012 and 2013. While total number of deals fell in 2014, the country attracted US$74 million in capital invested, almost double the annual totals for both Egypt and Morocco.
The western Maghreb also did not experience the same level of unrest as Egypt, but the region’s uprisings coincided with subdued deal making in Morocco—there were only five reported deals in Morocco in 2011. Like the UAE, Morocco received an uptick in the number of private equity deals in 2012 and 2013, and in 2014, Morocco and the UAE led the region in terms of number of deals with eight each. Compared to Egypt and the UAE, however, Morocco’s private equity activity was relatively wide-ranging; fund managers executed investments across five sectors—consumer services, industrials, technology, consumer goods and financials—demonstrating the diversity of opportunities available.
Spotlight: Investment by Country, 2010-2014 (No. of Deals)
15
10
5
02010 2011 2012 2013 2014
No.
of D
eals
-n- Egypt -n- Morocco -n- UAE
45
10 10
6
10
2
7
12
5
13
8
5
Spotlight: Investment by ICB Industry, 2014 (% of Total No. of Deals)
100%
80%
60%
40%
20%
0%
% o
f Tot
al N
o. o
f Dea
ls
Egypt Morocco UAE
20%
20%
20%
40%
n Consumer Servicesn Health Caren Technology
n Industrialsn Consumer Goodsn Basic Materials
n Financialsn Oil & Gas
25%
13%
25%
25%
13%
63%
13%
13%
13%
Spotlight: Investment by Country, 2010-2014 (US$m)
$1,200
$900
$600
$300
$02010 2011 2012 2013 2014
US$
Mill
ions
n Egypt n Morocco n UAE
88 112 12274
666
1
1,077
339
12137 35 26 40 39

© EMPEA March 2015. All rights reserved.28
Sub-Saharan Africa Fundraising and Investment, 2014
Sub-Saharan Africa Investment by Country, 2012-2014
2012 2013 2014
No. of Deals
Capital Invested (US$m)
No. of Deals
Capital Invested (US$m)
No. of Deals
Capital Invested (US$m)
Nigeria 15 246 13 160 15 612
Kenya 5 49 11 622 19 189
South Africa 15 165 14 204 18 340
Ethiopia 3 79 2 24 1 200
Ghana 4 67 6 15 13 179
Tanzania 2 211 2 7 3 0.3
Other 34 314 41 690 25 429
Total 78 1,131 89 1,724 94 1,950
Sub-Saharan Africa Investment by Country, 2012-2014 (US$B, No. of Deals)
21+18+15+6+5+5+30n Nigerian Kenyan South African Ethiopian Ghanan Tanzinian Other
Total: US$4.8B, 261 Investments
US$1B, 43
US$0.7B, 47
US$1.4B, 100
US$0.3B, 6US$0.3B, 23US$0.2B, 7
Sub-Saharan Africa Fundraising and Investment, 2010–2014
$5
$4
$3
$2
$1
$02010 2011 2012 2013 2014
US$
Billi
ons
4.0
1.9
n Funds Raised n Capital Invested
1.21.7
2.0
1.1
1.91.41.5
0.7
Sub-Saharan Africa Investment Activity by Half-Year, 2011-2014
$2
$1
$01H 2H 1H 2H 1H 2H 1H 2H
US$
Billi
ons
n Capital Invested -n- No. of Deals
60
40
20
0
No. of Deals
1.10.6 0.5
1.2
0.6
1.4
0.60.3
2011 2012 2013 2014
36 3641
3742
47 4549
After two years of Sub-Saharan Africa being ranked as one of the top three most attractive emerging markets for GP investment in EMPEA’s Global Limited Partners Survey, fundraising totals for the region have begun to reflect LP sentiment. Private equity managers raised US$4 billion for Sub-Saharan Africa-focused vehicles in 2014, the highest annual total since EMPEA began tracking fundraising in 2006, and more than 1.5 times the previous record of US$2.6 billion raised in 2006. An interim close of more than US$1 billion by Helios
Investment Partners and a US$698 million final close for The Carlyle Group’s maiden Sub-Saharan Africa vehicle led the way. Several global players also announced their first transactions in the region, including KKR’s US$200 million buyout of Ethiopia-based Afriflora. For a market historically associated with relatively small ticket sizes, the recent interest from global fund managers and the surge in US$500 million-plus funds will likely bring diversity to the region’s investment activity and add significant depth to the Sub-Saharan Africa fund pool.
Sub-Saharan Africa Fundraising by Geographic Focus, 2010-2014 (US$m)
2010 2011 2012 2013 2014
Pan-SSA 856 1,452 1,069 1,154 3,543
Central and East Africa 46 268 41 3 182
Southern Africa 470 39 861 50 97
West Africa 140 157 21 40 208
Total 1,512 1,916 1,993 1,246 4,03057%
31%
9%
76%
14%
54%
43%
93%
8%
Sub-Saharan Africa Fundraising by Geographic Focus, 2010-2014 (% of Total Capital Raised)
100%
80%
60%
40%
20%
0%
% o
f Tot
al C
apita
l Rai
sed
2010 2011 2012 2013 2014
n Pan-SSA n Central and East Africa n Southern Africa n West Africa
88%
US$0.9B, 35

2014 Emerging Markets Private Equity Fundraising and Investment Review 29
16+9-154-82-310
Sub-Saharan Africa Investment by Country, 2014 (No. of Deals)
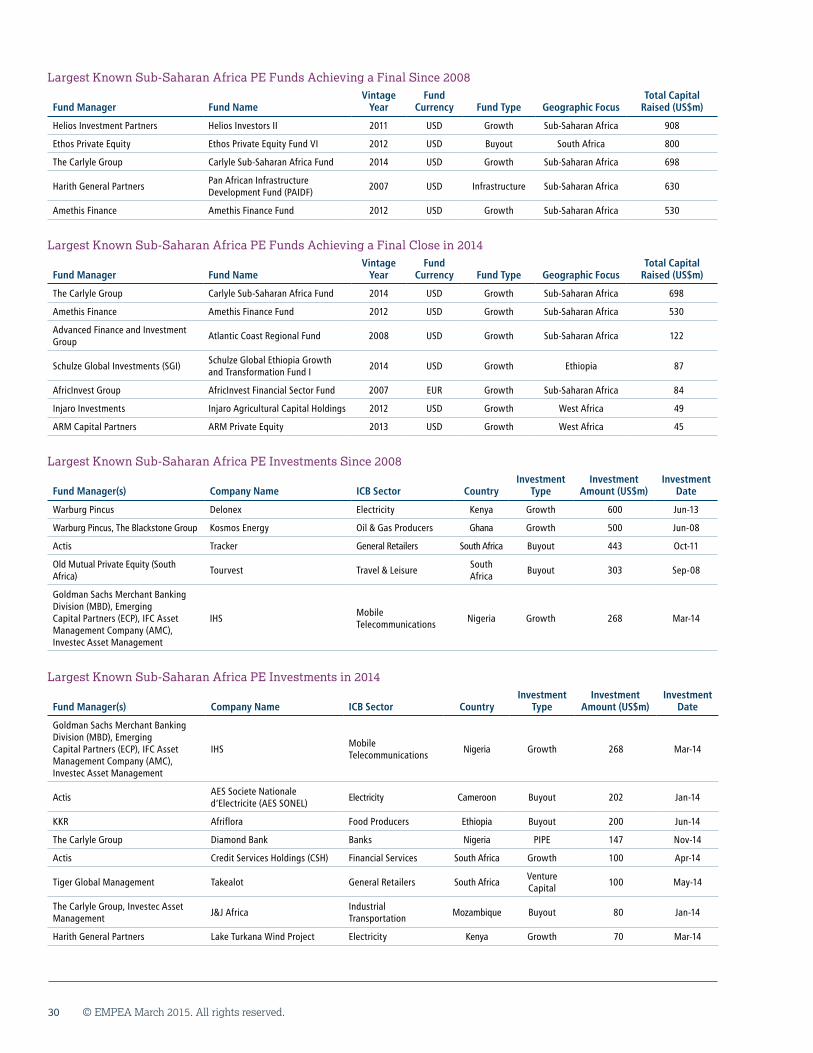
© EMPEA March 2015. All rights reserved.30
Largest Known Sub-Saharan Africa PE Funds Achieving a Final Since 2008
Fund Manager Fund NameVintage
YearFund
Currency Fund Type Geographic FocusTotal Capital
Raised (US$m)
Helios Investment Partners Helios Investors II 2011 USD Growth Sub-Saharan Africa 908
Ethos Private Equity Ethos Private Equity Fund VI 2012 USD Buyout South Africa 800
The Carlyle Group Carlyle Sub-Saharan Africa Fund 2014 USD Growth Sub-Saharan Africa 698
Harith General Partners Pan African Infrastructure Development Fund (PAIDF) 2007 USD Infrastructure Sub-Saharan Africa 630
Amethis Finance Amethis Finance Fund 2012 USD Growth Sub-Saharan Africa 530
Largest Known Sub-Saharan Africa PE Funds Achieving a Final Close in 2014
Fund Manager Fund NameVintage
YearFund
Currency Fund Type Geographic FocusTotal Capital
Raised (US$m)
The Carlyle Group Carlyle Sub-Saharan Africa Fund 2014 USD Growth Sub-Saharan Africa 698
Amethis Finance Amethis Finance Fund 2012 USD Growth Sub-Saharan Africa 530
Advanced Finance and Investment Group Atlantic Coast Regional Fund 2008 USD Growth Sub-Saharan Africa 122
Schulze Global Investments (SGI) Schulze Global Ethiopia Growth and Transformation Fund I 2014 USD Growth Ethiopia 87
AfricInvest Group AfricInvest Financial Sector Fund 2007 EUR Growth Sub-Saharan Africa 84
Injaro Investments Injaro Agricultural Capital Holdings 2012 USD Growth West Africa 49
ARM Capital Partners ARM Private Equity 2013 USD Growth West Africa 45
Largest Known Sub-Saharan Africa PE Investments Since 2008
Fund Manager(s) Company Name ICB Sector CountryInvestment
TypeInvestment
Amount (US$m)Investment
Date
Warburg Pincus Delonex Electricity Kenya Growth 600 Jun-13
Warburg Pincus, The Blackstone Group Kosmos Energy Oil & Gas Producers Ghana Growth 500 Jun-08
Actis Tracker General Retailers South Africa Buyout 443 Oct-11
Old Mutual Private Equity (South Africa) Tourvest Travel & Leisure South
Africa Buyout 303 Sep-08
Goldman Sachs Merchant Banking Division (MBD), Emerging Capital Partners (ECP), IFC Asset Management Company (AMC), Investec Asset Management
IHS Mobile Telecommunications Nigeria Growth 268 Mar-14
Largest Known Sub-Saharan Africa PE Investments in 2014
Fund Manager(s) Company Name ICB Sector CountryInvestment
TypeInvestment
Amount (US$m)Investment
Date
Goldman Sachs Merchant Banking Division (MBD), Emerging Capital Partners (ECP), IFC Asset Management Company (AMC), Investec Asset Management
IHS Mobile Telecommunications Nigeria Growth 268 Mar-14
Actis AES Societe Nationale d’Electricite (AES SONEL) Electricity Cameroon Buyout 202 Jan-14
KKR Afriflora Food Producers Ethiopia Buyout 200 Jun-14
The Carlyle Group Diamond Bank Banks Nigeria PIPE 147 Nov-14
Actis Credit Services Holdings (CSH) Financial Services South Africa Growth 100 Apr-14
Tiger Global Management Takealot General Retailers South Africa Venture Capital 100 May-14
The Carlyle Group, Investec Asset Management J&J Africa Industrial
Transportation Mozambique Buyout 80 Jan-14
Harith General Partners Lake Turkana Wind Project Electricity Kenya Growth 70 Mar-14

2014 Emerging Markets Private Equity Fundraising and Investment Review 31
Spotlight: Kenya, Nigeria and South Africa
Regional funds attracted the majority of capital raised for Sub-Saharan Africa in 2014, but in taking a closer look at how investors are accessing the region, three local private equity markets—Nigeria, Kenya and South Africa, arguably the financial hubs of West Africa, East Africa and Southern Africa, respectively—stand above the rest. Together, these three markets attracted more than 50% of both total capital invested and number of deals in Sub-Saharan Africa between 2010 and 2014.
Compared to the rest of Sub-Saharan African markets, South Africa is home to a relatively mature private equity industry that is differentiated both in terms of the relative ease of access to debt and a comparatively liquid public equity market. While historically South Africa has been the most active private equity market in Sub-Saharan Africa, in the last few years fund managers have increasingly diversified their investment locations. South Africa accounted for more than 40% of the number of deals in Sub-Saharan Africa between 2008 and 2009, compared to less than 20% between 2012 and 2014. The trend was even more pronounced in total capital invested; South Africa accounted for 59% and 61% of total capital invested in the region in 2008 and 2009, respectively, compared to 17% or less of total capital invested each year between 2012 and 2014.
Kenya, on the other hand, has increased its share of overall deals completed and capital deployed in the region, particularly in the last two years. In 2014, Kenya outpaced South Africa for the first time in terms of deal activity, attracting more investments than any other country in Sub-Saharan Africa. This followed a record year in 2013 for capital invested, in which Kenya attracted US$622 million—the most of any Sub-Saharan African market that year—driven by Warburg Pincus’s US$600 million investment in Delonex. Local private equity players have gained traction in Kenya, even attracting capital from Kenyan pension funds, a positive sign for international LPs that may look to commit to the country.
In Nigeria, a US$268 million consortium investment in telecommunications company IHS and a US$147 million deployment in Diamond Bank by The Carlyle Group pushed capital invested in 2014 to US$612 million, more than in any other Sub-Saharan African country. Investments in the capital-intensive oil and gas and financials sectors loomed large, accounting for an aggregate 40% of the number of deals in 2014. With the decline of oil prices in the latter half of the year, this concentration may disperse going into 2015 as investors look to tap into other segments of Nigeria’s economy. This may dovetail with an increasing interest in retail, hospitality and food and beverage opportunities in West Africa; between 2008 and 2012, the consumer goods and consumer services industries accounted for 11% of the number of deals or fewer in Nigeria, compared to 38% in 2013 and 27% in 2014.
612
Spotlight: Investment by Country, 2010-2014 (US$m)
$800
$600
$400
$200
$02010 2011 2012 2013 2014
US$
Mill
ions
n Kenya n Nigeria n South Africa
159176
49
246
165
622
160204 189
340
224
715
5828
Spotlight: Investment by Country, 2010-2014 (No. of Deals)
25
20
15
10
5
02010 2011 2012 2013 2014
No.
of D
eals
-n- Kenya -n- Nigeria -n- South Africa
22
1312
9
17
5
15
11
14
19
9
18
15
Spotlight: Investment by ICB Industry, 2014 (% of Total No. of Deals)
100%
80%
60%
40%
20%
0%
% o
f Tot
al N
o. o
f Dea
ls
Kenya Nigeria South Africa
26%
21%
21%
16%
n Consumer Servicesn Financialsn Industrials
n Consumer Goodsn Oil & Gasn Telecommunications
n Basic Materials n Technologyn Utilities
13%
7%
13%
20%
13%
20%
7%
28%
11%
11%
22%
11%
11%7%6%

© EMPEA March 2015. All rights reserved.32
Israel led all other markets in private equity investment as a percentage of GDP in 2014, with the United States and the United Kingdom following in second and third place, respectively, in the global rankings. With Israel characterized by an advanced venture capital ecosystem and the United States and the United Kingdom home to the world’s leading financial markets, their positions in this ranking are perhaps no surprise. Private equity penetration rates in all three of these countries remain an order of magnitude greater than those in emerging markets.
China experienced the biggest year-on-year increase in private equity penetration among emerging markets, up from 0.08% of GDP in 2013 to 0.15% in 2014, with South Africa’s jump from 0.06% to 0.1% over the same period not far behind. Despite a slight decline from 2013, India led all emerging markets in private equity penetration in 2014 at 0.19% of GDP. In South Korea, 2013’s EM leader, investment as a percentage of GDP fell from 0.25% to 0.18%, while Brazil, Poland, Turkey and Russia also recorded year-on-year decreases.
Investment Penetration
1.47
1.64
Methodology: Annual private equity investment divided by annual gross domestic product.Sources: EMPEA, IMF, Center for Management Buy-Out Research, Pitchbook, Israel Venture Capital Research Center, Asia Private Equity Review.
2.0
1.6
1.2
0.8
0.4
0.0Israel United
StatesUnited
KingdomIndia South
KoreaChina Japan Brazil Sub-Saharan
AfricaSouth Africa
Poland Turkey MENA Russia
PE In
vest
men
t/GDP
(%)
n 2013
n 2014
1.181.23
0.99
0.81
0.20 0.190.25
0.180.15
0.08 0.040.12 0.14 0.12 0.11 0.12 0.10
0.06 0.090.05 0.05 0.02 0.01 0.01 0.01 0.004
Global Private Equity Penetration, 2013–2014

2014 Emerging Markets Private Equity Fundraising and Investment Review 33
Acknowledgements
Data and analysis presented in EMPEA publications is derived from EMPEA’s proprietary industry database, FundLink, made possible with generous support from the following institutions: CDC, DBSA, DEG and FMO. We gratefully acknowledge their contributions.
EMPEA would also like to acknowledge the information provided by a number of industry sources: Asia Private Equity Review, Asian Venture Capital Journal, Dow Jones, China Money Network, e27, East-West Digital News, The Economic Times, Greater China Private Equity Review, PE HUB, Pitchbook, Preqin, Private Equity International, RusBase, Startupi, Tech in Asia, TechNode, unquote”, Valor Economico, VCCircle, Wamda, Zawya and Zero2IPO.
Most importantly, EMPEA is grateful to our more than 300 members for their ongoing support in building one of the most actively verified datasets in the global private equity industry. The scope and accuracy of EMPEA’s figures would not be possible without the crucial input and generous assistance of our members. Members are encouraged to provide feedback by contacting EMPEA Research Staff at +1 202 333 8171 or at [email protected].

Related Documents