2014 ABCs of School Choice Paul DiPerna [email protected] International School Choice and Reform Academic Conference January 18, 2014 Ft. Lauderdale, FL

2014 ABCs of School Choice: Comparative Views on Choice in Districts and States (2014)
Jul 14, 2015
Welcome message from author
This document is posted to help you gain knowledge. Please leave a comment to let me know what you think about it! Share it to your friends and learn new things together.
Transcript
2014 ABCs of School Choice
Paul DiPerna
International School Choice
and Reform Academic Conference
January 18, 2014
Ft. Lauderdale, FL
About the Friedman Foundation
edchoice.org
• Est. in 1996 by Milton & Rose Friedman
• Based Indianapolis, IN
• Annual Activities/Services in 30+ states
• 501(c)(3) / Nonpartisan / Nonprofit
• What do we do?
Outreach ~ Education
Research ~ Data Analysis
Advocacy ~ Marketing
Overview
1. Defining school choice, program types
2. Data challenges/limitations
3. National snapshots
4. Program indicators and comparisons
= eligibility, participation, funding, regulations
≠ academic outcomes; fiscal/financial outcomes; civic outcomes
5. Takeaways
What we mean by “school choice”
• Separate the public education funding
mechanism from the administration and
operation of schools, and minimize the inherent
conflict of interest in such arrangements.
• The direction and flow of education funding
should follow the student to whichever school –
public or private – that family feels is best to meet
the child’s needs and priorities.
Types of School Choice Programs
• Vouchers – funds typically expended by the state and/or school district
would be allocated to a participating family in the form of a voucher to pay partial
or full tuition for their child’s private school, including both religious and non-
religious options.
• Education Savings Accounts (ESAs) – allow
parents to withdraw their children from public district and receive a deposit of
public funds into government-authorized savings accounts that can apply toward
private school tuition/fees, online learning, private tutoring, and post-secondary
education expenses
• Tax-Credit Scholarships – eligible individual/corporate
taxpayers can receive full or partial tax credits when they donate to nonprofits
that provide private school scholarships.
• Individual Tax Credits/Deductions – tax relief for
educational expenses such as private school tuition, books, etc.
Data Challenges & Limitations
• Staff turnover in DOE’s and DOR’s. Loss of program and institutional
knowledge and/or data protocols. About half of contacts “lost” from last year’s
data collection.
• State agencies with a dedicated “school choice office” made communication
and cooperation much easier with contacts and making new contacts. More
timely response.
• Official data requests (Open Records, FOIA, etc.) necessary for some
programs, particularly for the individual tax credits/deductions.
• DOEs were typically more responsive than DORs. (though for some reason
the folks at LA DOE thought it more important to respond to the US DOJ's
data requests…)
• Significant challenge estimating eligibility for programs with income limits for
specific populations (failing schools, special needs, etc.).
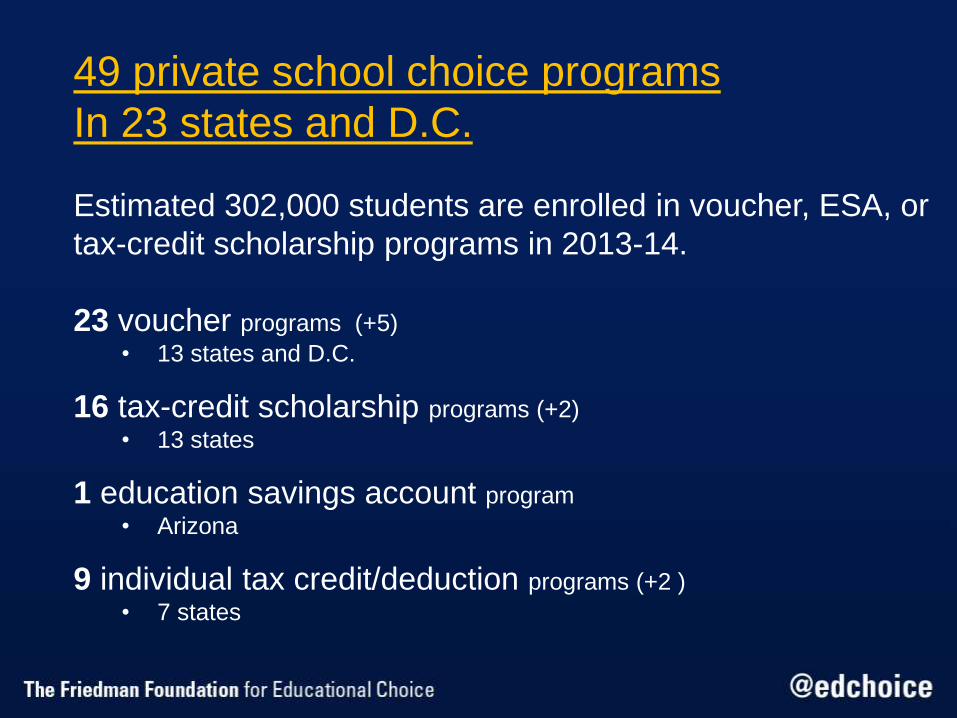
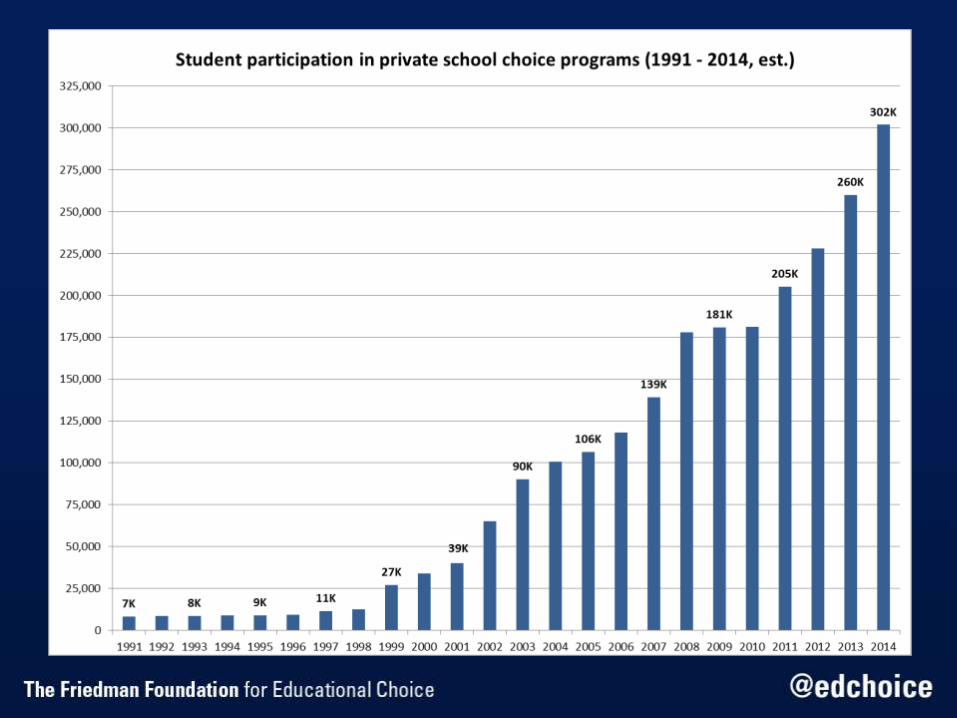
49 private school choice programs
In 23 states and D.C.
Estimated 302,000 students are enrolled in voucher, ESA, or
tax-credit scholarship programs in 2013-14.
23 voucher programs (+5)
• 13 states and D.C.
16 tax-credit scholarship programs (+2)
• 13 states
1 education savings account program
• Arizona
9 individual tax credit/deduction programs (+2 )
• 7 states
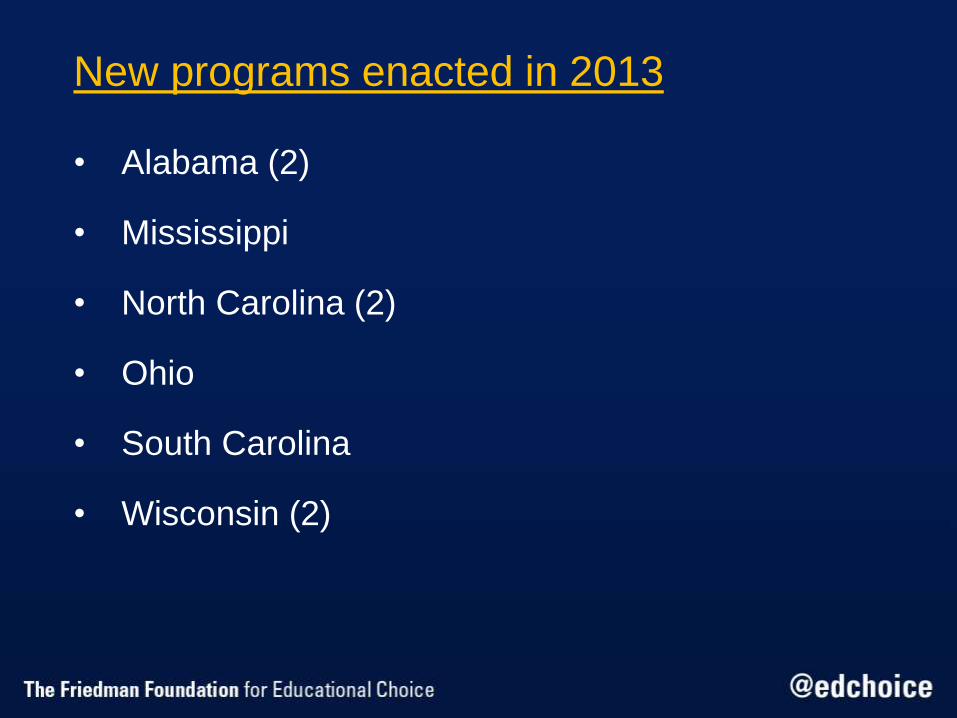
New programs enacted in 2013
• Alabama (2)
• Mississippi
• North Carolina (2)
• Ohio
• South Carolina
• Wisconsin (2)
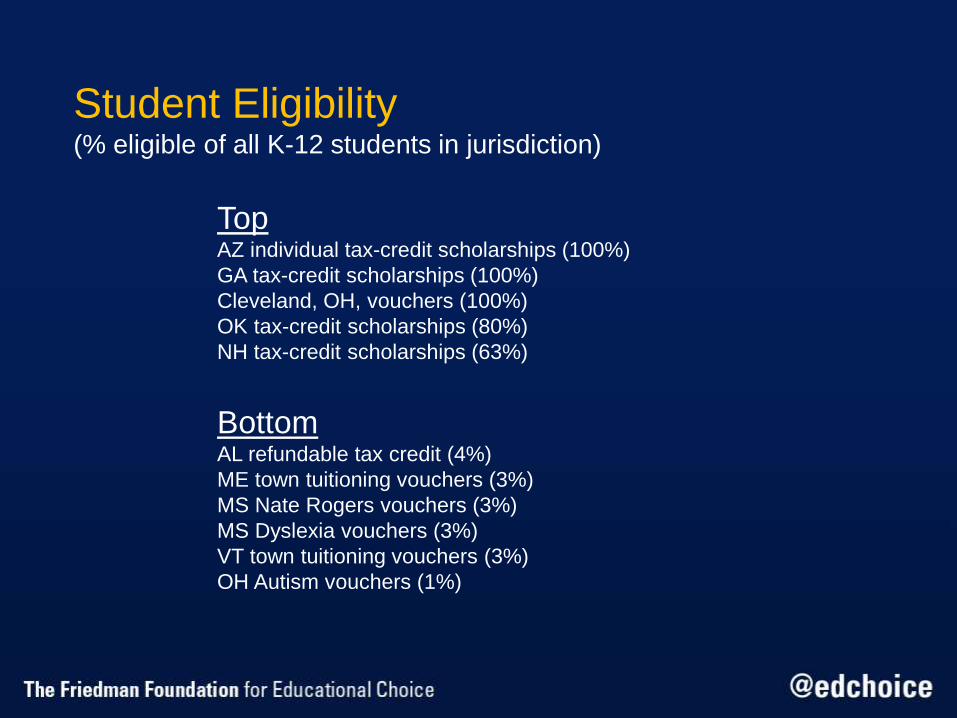
Student Eligibility (% eligible of all K-12 students in jurisdiction)
TopAZ individual tax-credit scholarships (100%)
GA tax-credit scholarships (100%)
Cleveland, OH, vouchers (100%)
OK tax-credit scholarships (80%)
NH tax-credit scholarships (63%)
BottomAL refundable tax credit (4%)
ME town tuitioning vouchers (3%)
MS Nate Rogers vouchers (3%)
MS Dyslexia vouchers (3%)
VT town tuitioning vouchers (3%)
OH Autism vouchers (1%)
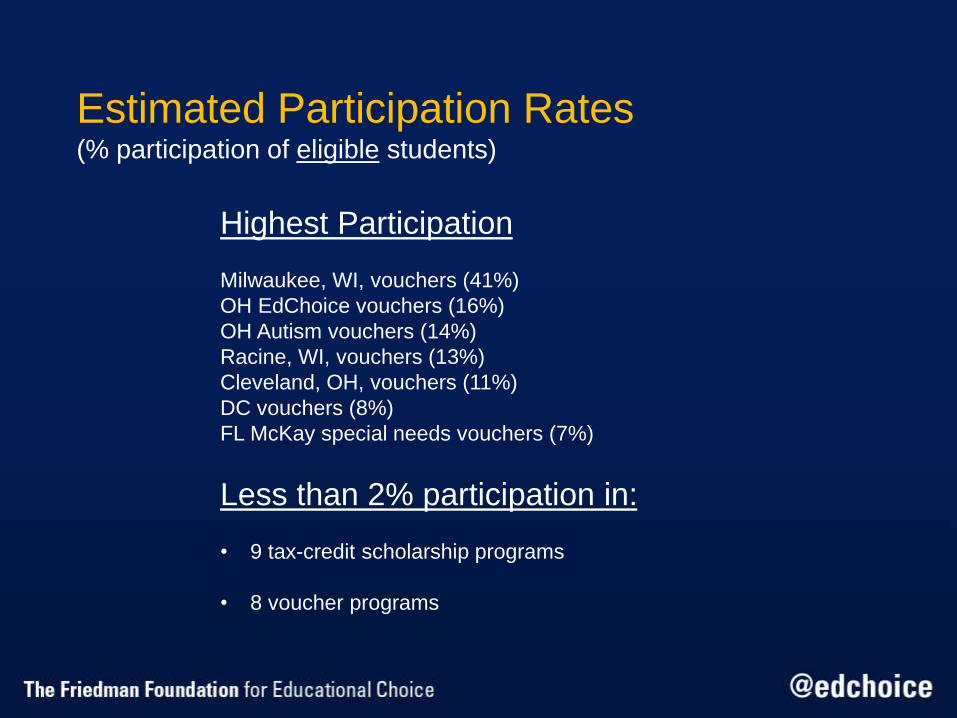
Estimated Participation Rates(% participation of eligible students)
Highest Participation
Milwaukee, WI, vouchers (41%)
OH EdChoice vouchers (16%)
OH Autism vouchers (14%)
Racine, WI, vouchers (13%)
Cleveland, OH, vouchers (11%)
DC vouchers (8%)
FL McKay special needs vouchers (7%)
Less than 2% participation in:
• 9 tax-credit scholarship programs
• 8 voucher programs
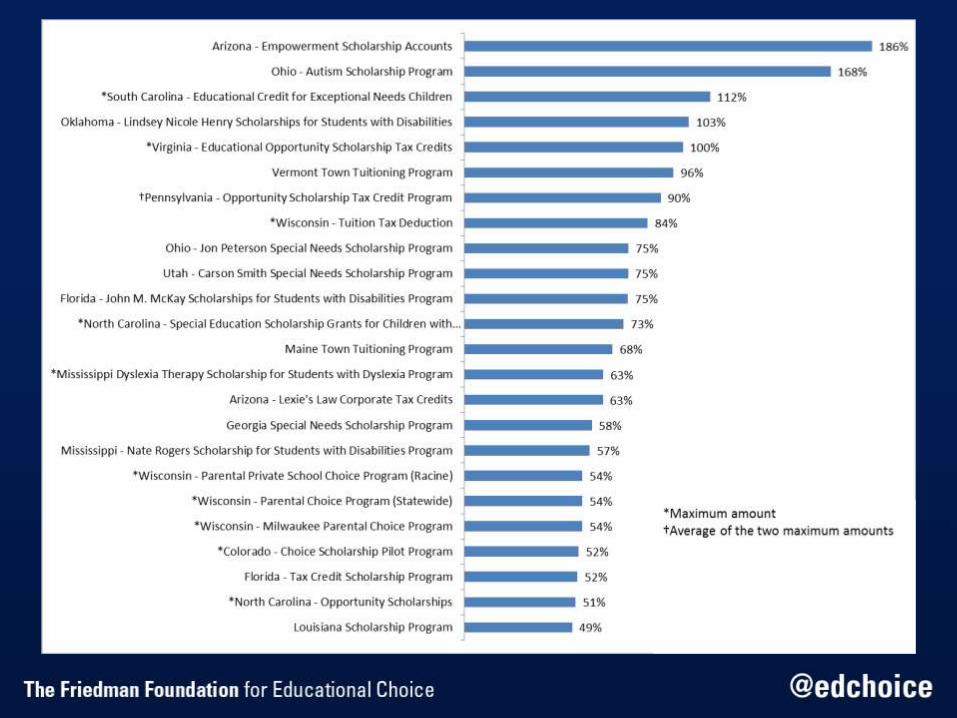
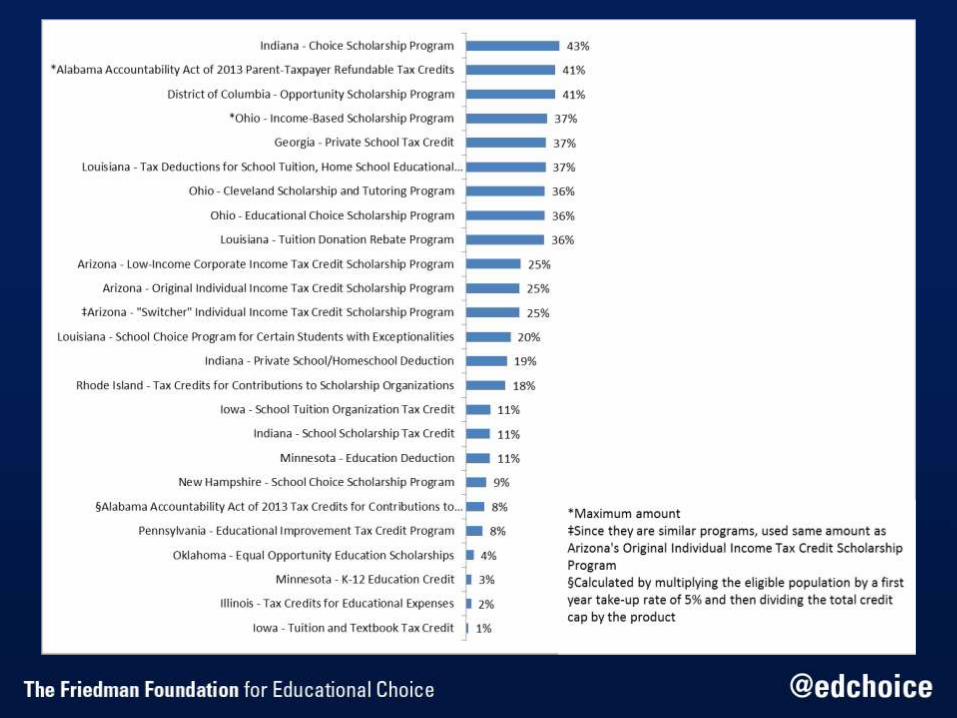
Student Funding(considering the average voucher/scholarship value
as percentage of state’s total per-student spending)
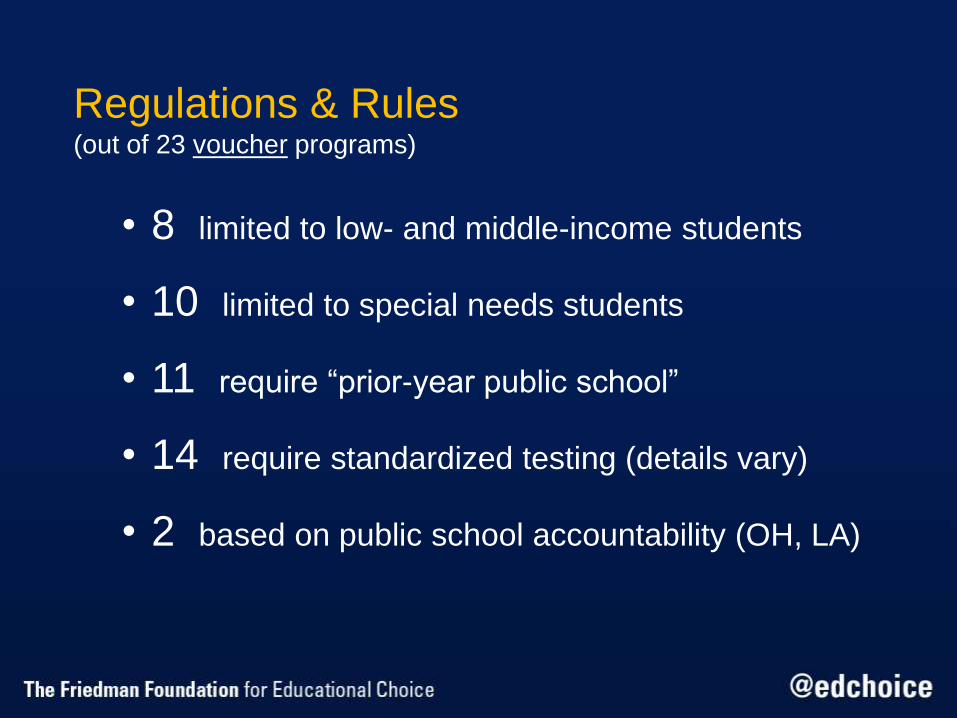
Regulations & Rules(out of 23 voucher programs)
• 8 limited to low- and middle-income students
• 10 limited to special needs students
• 11 require “prior-year public school”
• 14 require standardized testing (details vary)
• 2 based on public school accountability (OH, LA)
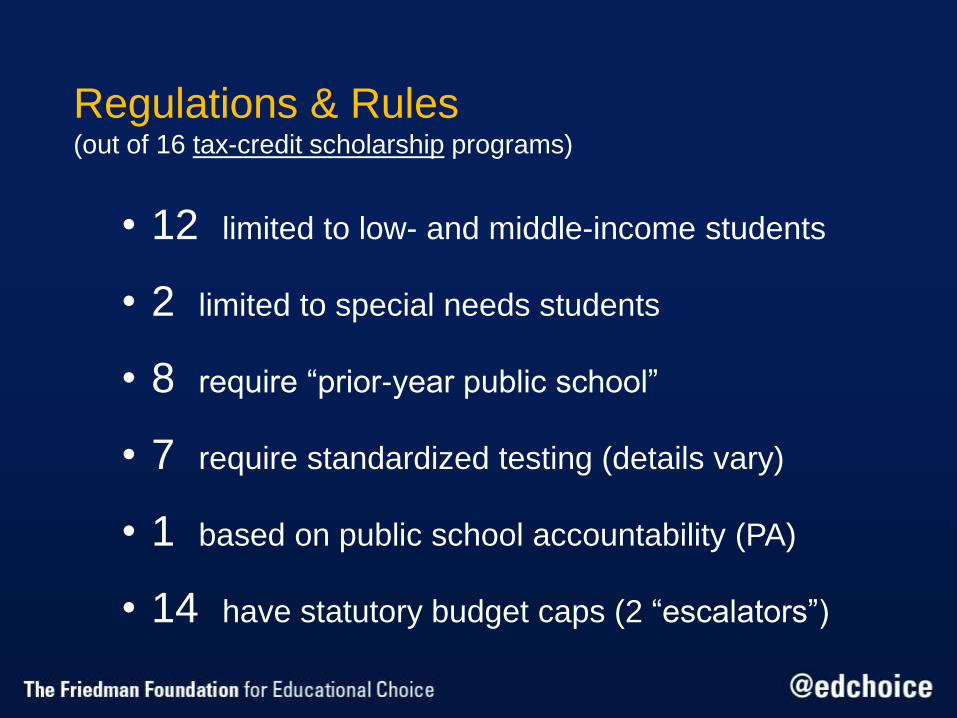
Regulations & Rules(out of 16 tax-credit scholarship programs)
• 12 limited to low- and middle-income students
• 2 limited to special needs students
• 8 require “prior-year public school”
• 7 require standardized testing (details vary)
• 1 based on public school accountability (PA)
• 14 have statutory budget caps (2 “escalators”)
Takeaways I
• Third year in a row that we see at least several
new programs enacted.
• Very large participation growth since 2010-11.
• ABCs data collection and quality control continue
to be a challenge, especially for newer programs;
state agencies with high turnover, small staff,
and/or time constraints; many of the tax
credit/deduction programs.
Takeaways II
• Vast majority of voucher and tax-credit scholarship programs are
designed to prioritize disadvantaged populations of students.
• Vouchers continue to perform better wrt participation rates and average
levels of student funding. Relative maturity of the programs may
provide partial explanation.
• Tax-credit scholarships have relatively larger populations of eligible
children to serve.
• Voucher and tax-credit scholarship programs are about equally likely to
require some form of standardized testing.
• Voucher and tax-credit scholarship programs are about equally likely to
require prior-year public school enrollment.
• Tax-credit scholarship programs are more likely to have hard budget
caps specified in law, thus making less responsive to demand-and-
supply issues.
Related Documents