2014 - 2015 CALIFORNIA ECONOMIC & MARKET OUTLOOK October 29,2014 SILVAR Leslie Appleton-Young, Chief Economist

2014 - 2015 California Economic & Market Outlook
Aug 05, 2015
Welcome message from author
This document is posted to help you gain knowledge. Please leave a comment to let me know what you think about it! Share it to your friends and learn new things together.
Transcript

2014 - 2015 CALIFORNIA ECONOMIC & MARKET
OUTLOOK October 29,2014
SILVAR
Leslie Appleton-Young, Chief Economist
OVERVIEW
• Economic Outlook
• California Housing Market Outlook
• Housing Affordability
• Regional Market
• 2015 Forecast

ECONOMIC OUTLOOK
-4%
-3%
-2%
-1%
0%
1%
2%
3%
4%
5%
200
5
200
6
200
7
200
8
200
9
2010
2011
2012
2013
2014
P
Q2
-10
Q3-
10
Q4
-10
Q1-
11
Q2
-11
Q3-
11
Q4
-11
Q1-
12
Q2
-12
Q3-
12
Q4
-12
Q1-
13
Q2
-13
Q3-
13
Q4
-13
Q1-
14
Q2
-14
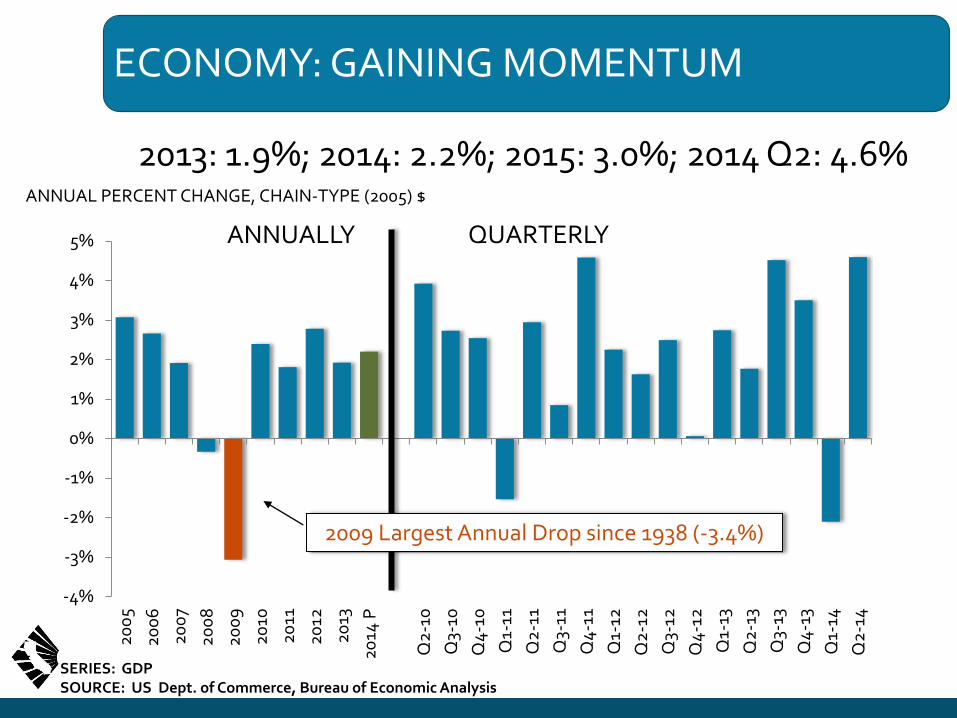
ECONOMY: GAINING MOMENTUM
2013: 1.9%; 2014: 2.2%; 2015: 3.0%; 2014 Q2: 4.6% ANNUAL PERCENT CHANGE, CHAIN-TYPE (2005) $
ANNUALLY QUARTERLY
2009 Largest Annual Drop since 1938 (-3.4%)
SERIES: GDP SOURCE: US Dept. of Commerce, Bureau of Economic Analysis
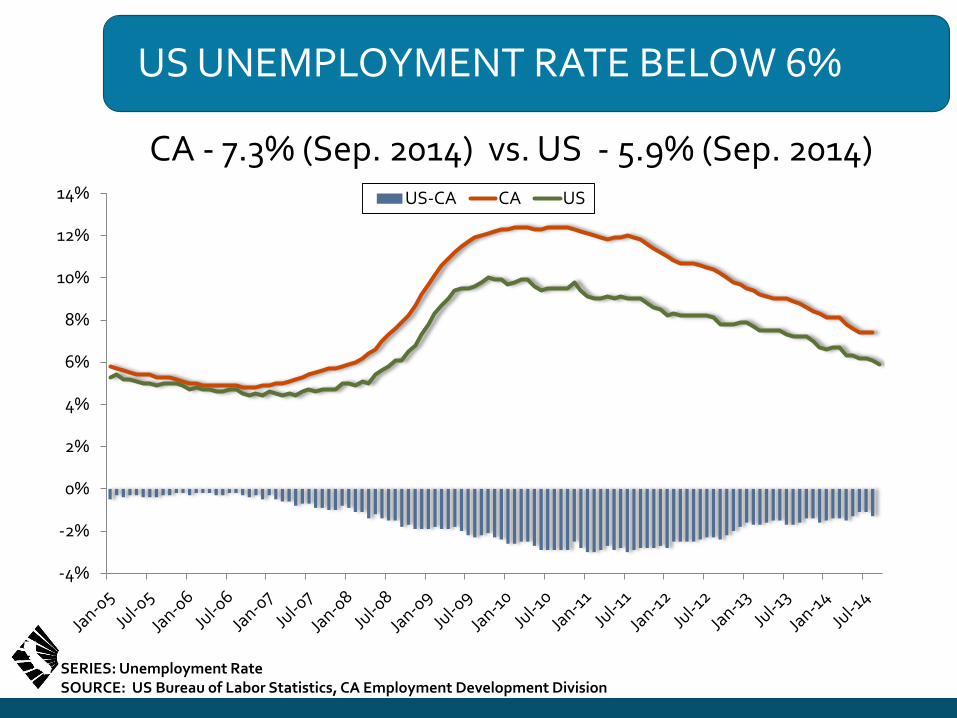
US UNEMPLOYMENT RATE BELOW 6%
CA - 7.3% (Sep. 2014) vs. US - 5.9% (Sep. 2014)
-4%
-2%
0%
2%
4%
6%
8%
10%
12%
14% US-CA CA US
SERIES: Unemployment Rate SOURCE: US Bureau of Labor Statistics, CA Employment Development Division
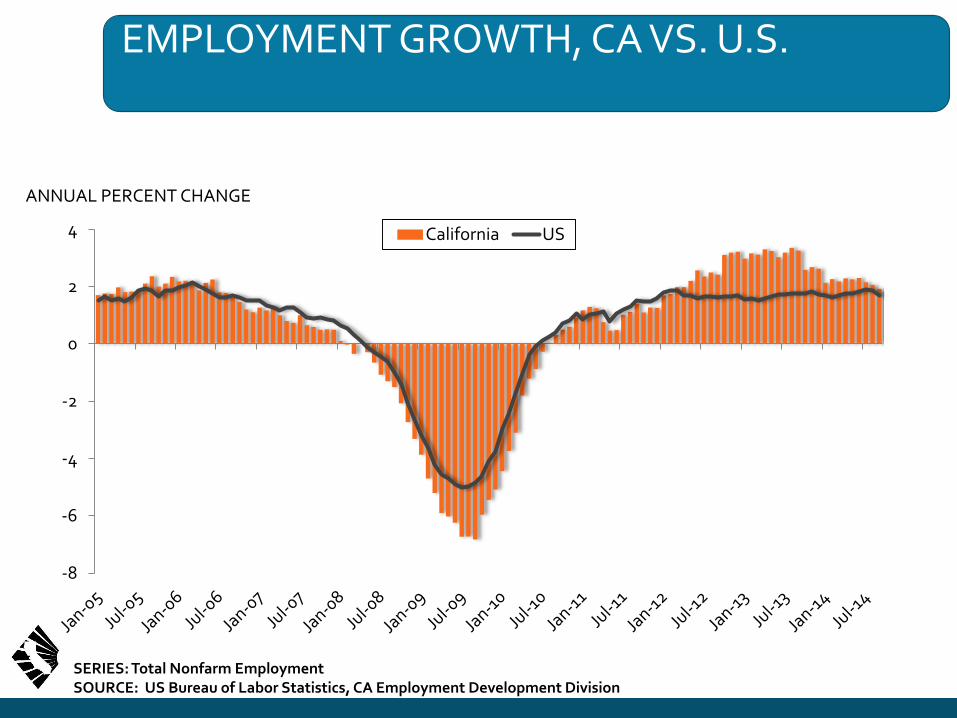
EMPLOYMENT GROWTH, CA VS. U.S.
-8
-6
-4
-2
0
2
4 California US
ANNUAL PERCENT CHANGE
SERIES: Total Nonfarm Employment SOURCE: US Bureau of Labor Statistics, CA Employment Development Division

PERCENT JOB LOSSES PRIOR RECESSIONS – RECENT CYCLE WORST BY FAR

EMPLOYMENT GROWTH, BY INDUSTRY
-25%
-20%
-15%
-10%
-5%
0%
5%
10%
15%
Jan
-05
Jul-
05
Jan
-06
Jul-
06
Jan
-07
Jul-
07
Jan
-08
Jul-
08
Jan
-09
Jul-
09
Jan
-10
Jul-
10
Jan
-11
Jul-
11
Jan
-12
Jul-
12
Jan
-13
Jul-
13
Jan
-14
Jul-
14
Construction Manufacturing Service
ANNUAL PERCENT CHANGE
SERIES: Total Nonfarm Employment By Industry SOURCE: CA Employment Development Division
September 2014: CA +2.3%, +390,600
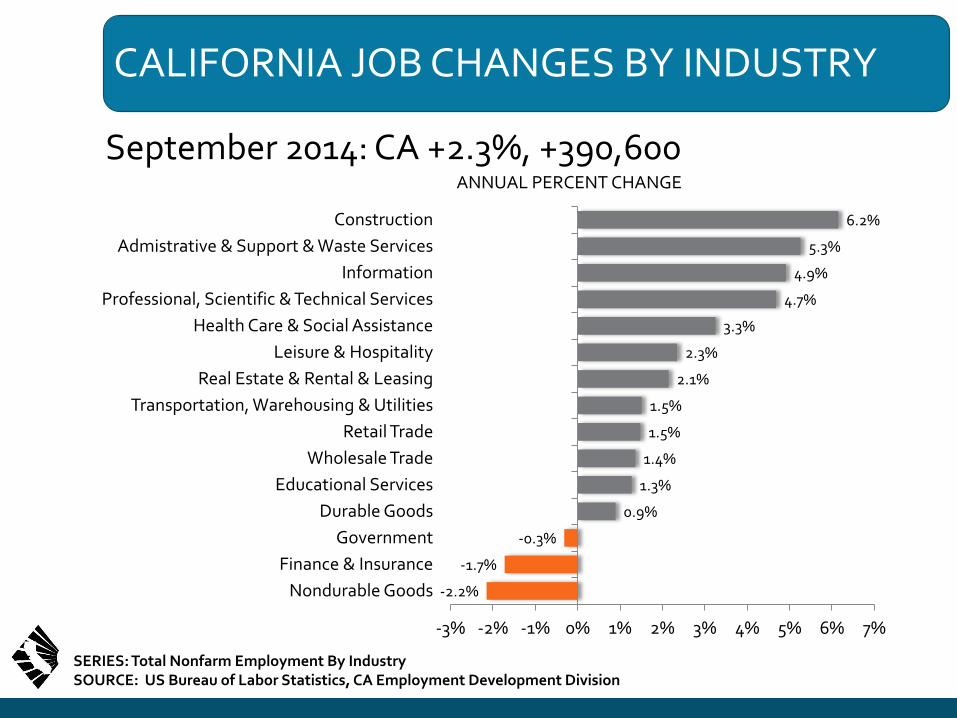
CALIFORNIA JOB CHANGES BY INDUSTRY
-2.2%
-1.7%
-0.3%
0.9%
1.3%
1.4%
1.5%
1.5%
2.1%
2.3%
3.3%
4.7%
4.9%
5.3%
6.2%
-3% -2% -1% 0% 1% 2% 3% 4% 5% 6% 7%
Nondurable Goods
Finance & Insurance
Government
Durable Goods
Educational Services
Wholesale Trade
Retail Trade
Transportation, Warehousing & Utilities
Real Estate & Rental & Leasing
Leisure & Hospitality
Health Care & Social Assistance
Professional, Scientific & Technical Services
Information
Admistrative & Support & Waste Services
Construction
SERIES: Total Nonfarm Employment By Industry SOURCE: US Bureau of Labor Statistics, CA Employment Development Division
September 2014: CA +2.3%, +390,600 ANNUAL PERCENT CHANGE

JOB TRENDS BY CALIFORNIA METRO AREA
1.1%
1.3%
1.7%
1.8%
1.9%
2.0%
2.0%
2.1%
2.5%
2.5%
3.5%
3.7%
0.0% 0.5% 1.0% 1.5% 2.0% 2.5% 3.0% 3.5% 4.0%
Modesto
Stockton MSA
Bakersfield
Los Angeles
Orange …
Ventura
Oakland
Sacramento
Fresno MSA
San Diego
San Jose
San Francisco
SERIES: Total Nonfarm Employment SOURCE: CA Employment Development Division
AN
NU
AL
PE
RC
EN
T C
HA
NG
E
September 2014: CA +2.3%, +390,600
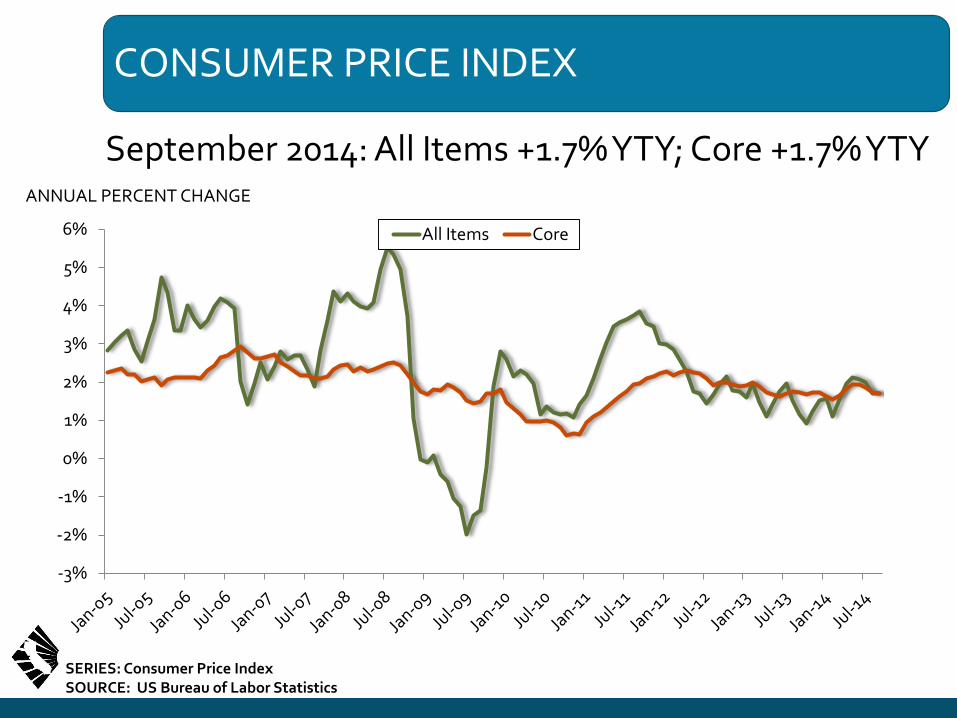
CONSUMER PRICE INDEX
September 2014: All Items +1.7% YTY; Core +1.7% YTY
-3%
-2%
-1%
0%
1%
2%
3%
4%
5%
6% All Items Core
ANNUAL PERCENT CHANGE
SERIES: Consumer Price Index SOURCE: US Bureau of Labor Statistics

CONSUMER CONFIDENCE: UNCERTAINTY October 2014: 94.5
INDEX, 100=1985
SERIES: Consumer Confidence SOURCE: The Conference Board
0
20
40
60
80
100
120

0%
1%
2%
3%
4%
5%
6%
200
9/0
1
200
9/0
4
200
9/0
7
200
9/1
0
2010
/01
2010
/04
2010
/07
2010
/10
2011
/01
2011
/04
2011
/07
2011
/10
2012
/01
2012
/04
2012
/07
2012
/10
2013
/01
2013
/04
2013
/07
2013
/10
2014
/01
2014
/04
2014
/07
8.2
8.1
4
9.1
8.1
4
FRM
ARM
MORTGAGE RATES: WHAT HAPPENED?
January 2009 – October 2014
MONTHLY WEEKLY
SERIES: 30Yr FRM, 1Yr ARM SOURCE: Federal Home Loan Mortgage Corporation
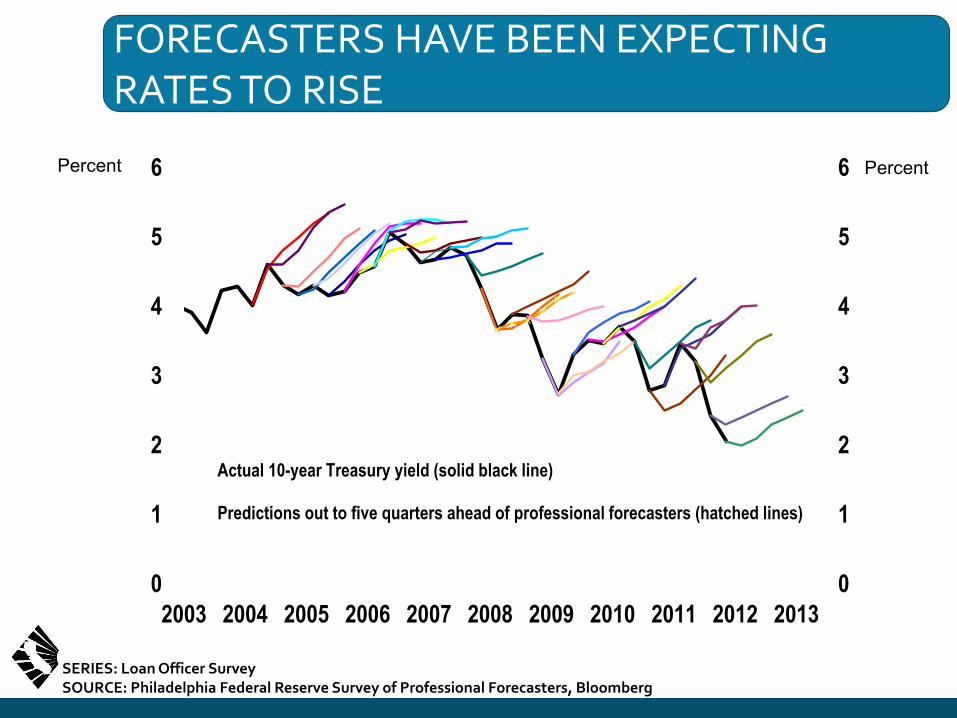
FORECASTERS HAVE BEEN EXPECTING RATES TO RISE
Percent
0
1
2
3
4
5
6
0
1
2
3
4
5
6
2003 2004 2005 2006 2007 2008 2009 2010 2011 2012 2013
Actual 10-year Treasury yield (solid black line)
Predictions out to five quarters ahead of professional forecasters (hatched lines)
Percent
SERIES: Loan Officer Survey SOURCE: Philadelphia Federal Reserve Survey of Professional Forecasters, Bloomberg

MORTGAGE RATES + 1% SPRING 2013 ACTUAL TAPERING? NO IMPACT?
0%
1%
2%
3%
4%
5%
6%
7%
8% FRM ARM Federal Funds
SERIES: 30Yr FRM, 1Yr ARM, Federal Funds SOURCE: Federal Home Loan Mortgage Corporation

U.S. DEPOSITORY INSTITUTIONS: HIGH LEVEL OF EXCESS RESERVES SINCE 9/08
$0
$500
$1,000
$1,500
$2,000
$2,500
$3,000
SERIES: Excess Reserves of Depository Institutions SOURCE: Federal Reserve Bank of Saint Louis
$ BILLIONS

U.S. ECONOMIC FORECAST
Gross Domestic Product
Nonfarm Job Growth
Unemployment Rate
Consumer Price Index
Real Disposable Income, % Change
2011
1.8%
1.2%
8.9%
3.1%
1.3%
2012
2.8%
1.7%
8.1%
2.1%
1.5%
2013
1.9%
1.7%
7.4%
1.5%
0.7%
2014 P
2.2%
1.8%
6.2%
2.0%
2.6%
2015 F
3.0%
2.2%
5.8%
2.2%
2.6%
SERIES: U.S. Economic Outlook SOURCE: CALIFORNIA ASSOCIATION OF REALTORS®
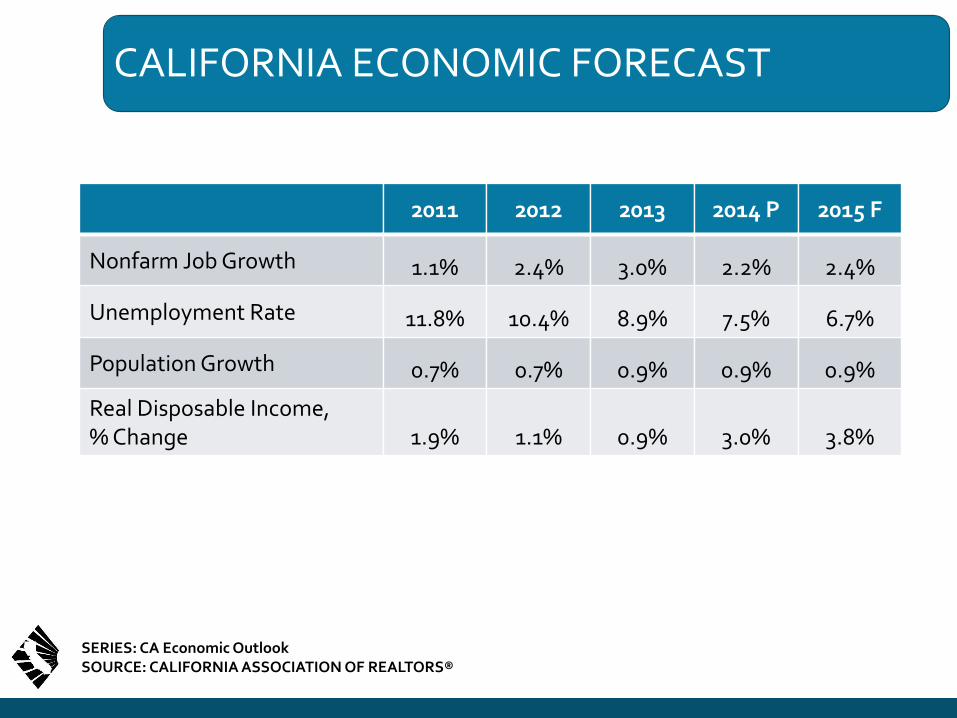
CALIFORNIA ECONOMIC FORECAST
SERIES: CA Economic Outlook SOURCE: CALIFORNIA ASSOCIATION OF REALTORS®
Nonfarm Job Growth
Unemployment Rate
Population Growth
Real Disposable Income, % Change
2011
1.1%
11.8%
0.7%
1.9%
2012
2.4%
10.4%
0.7%
1.1%
2013
3.0%
8.9%
0.9%
0.9%
2014 P
2.2%
7.5%
0.9%
3.0%
2015 F
2.4%
6.7%
0.9%
3.8%

CALIFORNIA HOUSING MARKET OUTLOOK

TODAY’S MARKET
• Clearly well on the road to recovering - Bay Area strongest regional market
• Volume – A bit down, still reliant on investment sales
• Prices up sharply, but increases slowing in most markets
• Inventory remains tight but up from last year
• Pent-up/unrealized demand not yet translating into sales
• Affordability challenges emerging once again…
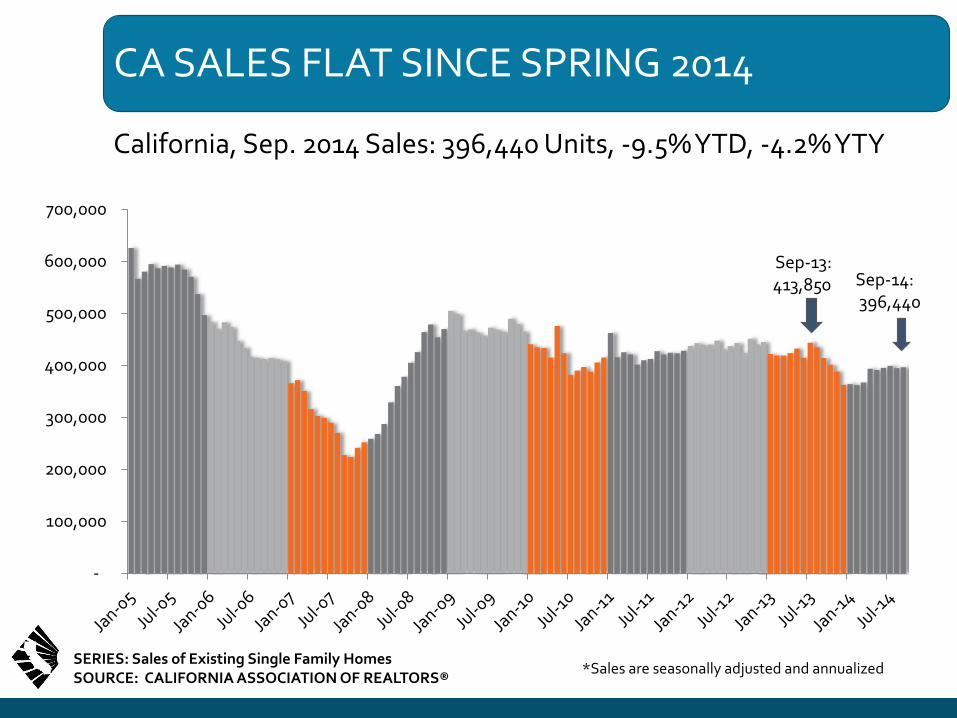
CA SALES FLAT SINCE SPRING 2014
California, Sep. 2014 Sales: 396,440 Units, -9.5% YTD, -4.2% YTY
-
100,000
200,000
300,000
400,000
500,000
600,000
700,000
*Sales are seasonally adjusted and annualized SERIES: Sales of Existing Single Family Homes SOURCE: CALIFORNIA ASSOCIATION OF REALTORS®
Sep-14: 396,440
Sep-13: 413,850
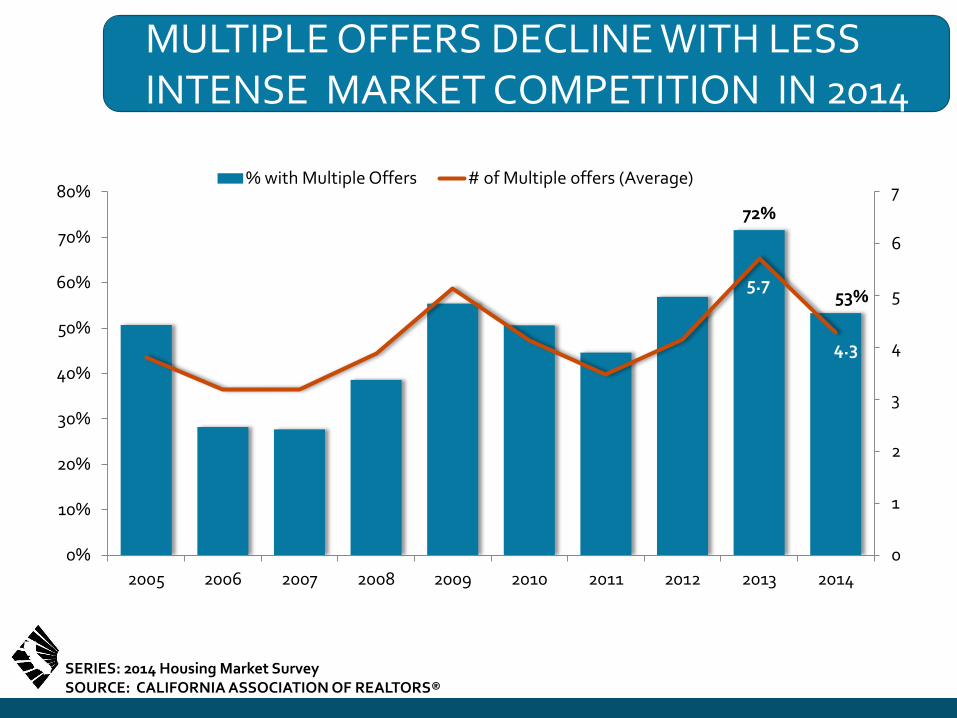
MULTIPLE OFFERS DECLINE WITH LESS INTENSE MARKET COMPETITION IN 2014 AFTER PEAKING IN 2013
72%
53% 5.7
4.3
0
1
2
3
4
5
6
7
0%
10%
20%
30%
40%
50%
60%
70%
80%
2005 2006 2007 2008 2009 2010 2011 2012 2013 2014
% with Multiple Offers # of Multiple offers (Average)
SERIES: 2014 Housing Market Survey SOURCE: CALIFORNIA ASSOCIATION OF REALTORS®

49 % SOLD BELOW ASKING IN 2014
7%
11%
28%
54%
0% 20% 40% 60%
20% or more
10% to 19.99%
5% to 9.99%
Less than 5%
% of Price Reduction (Properties Sold Below Asking Price)
49%
18%
33%
Sale Price to Asking Price
Below Asking Price At Asking Price Above Asking Price
SERIES: 2014 Housing Market Survey SOURCE: CALIFORNIA ASSOCIATION OF REALTORS®
Median Reduction: 4.5% of List Price

50%
33%
0%
10%
20%
30%
40%
50%
60%
2005 2006 2007 2008 2009 2010 2011 2012 2013 2014
% of Sales above Asking Price
Long Run Average = 19%
FEWER HOMES SOLD ABOVE THE ASKING PRICE AS MARKET COMPETITION COOLED IN 2014
0
2
4
6
8
10
12
14
16
0%
1%
2%
3%
4%
5%
6%
7%
8%
9%
10%
2005 2006 2007 2008 2009 2010 2011 2012 2013 2014
Med. Price Discount
Med. Weeks on MLS
0%, 2.1
weeks
Median Price Discount & Weeks on Market
QUESTION: What was the original list sales price of the property? What was the final sales price of the property? How many weeks did the property remain on the MLS? SERIES: 2014 Housing Market Survey SOURCE: CALIFORNIA ASSOCIATION OF REALTORS®
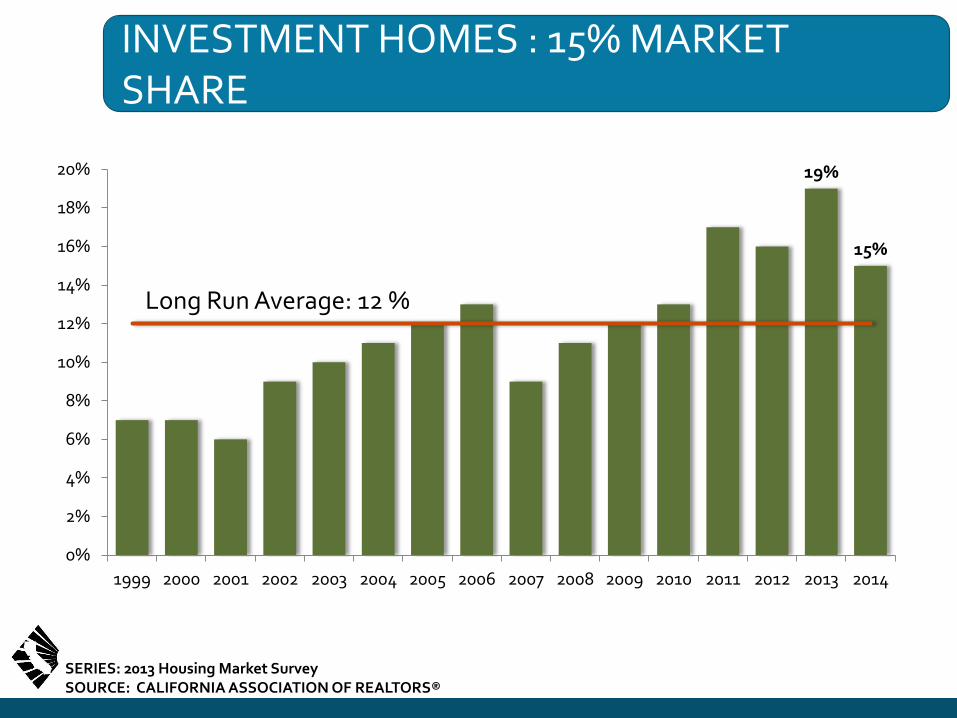
INVESTMENT HOMES : 15% MARKET SHARE
19%
15%
0%
2%
4%
6%
8%
10%
12%
14%
16%
18%
20%
1999 2000 2001 2002 2003 2004 2005 2006 2007 2008 2009 2010 2011 2012 2013 2014
Long Run Average: 12 %
SERIES: 2013 Housing Market Survey SOURCE: CALIFORNIA ASSOCIATION OF REALTORS®
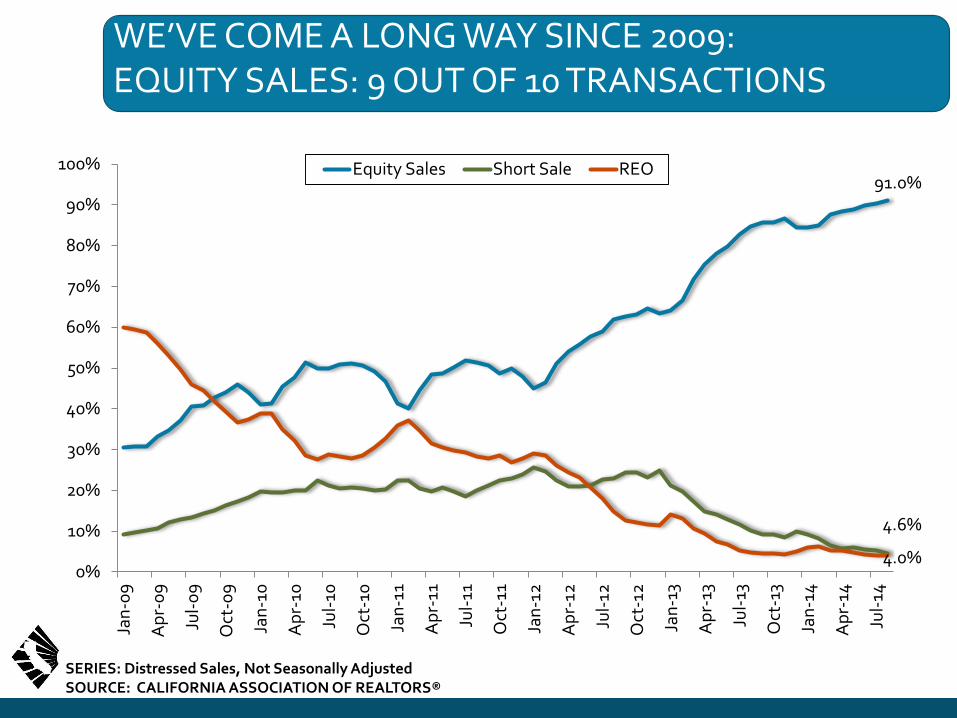
WE’VE COME A LONG WAY SINCE 2009: EQUITY SALES: 9 OUT OF 10 TRANSACTIONS
91.0%
4.6%
4.0% 0%
10%
20%
30%
40%
50%
60%
70%
80%
90%
100%
Jan
-09
Ap
r-0
9
Jul-
09
Oct
-09
Jan
-10
Ap
r-10
Jul-
10
Oct
-10
Jan
-11
Ap
r-11
Jul-
11
Oct
-11
Jan
-12
Ap
r-12
Jul-
12
Oct
-12
Jan
-13
Ap
r-13
Jul-
13
Oct
-13
Jan
-14
Ap
r-14
Jul-
14
Equity Sales Short Sale REO
SERIES: Distressed Sales, Not Seasonally Adjusted SOURCE: CALIFORNIA ASSOCIATION OF REALTORS®
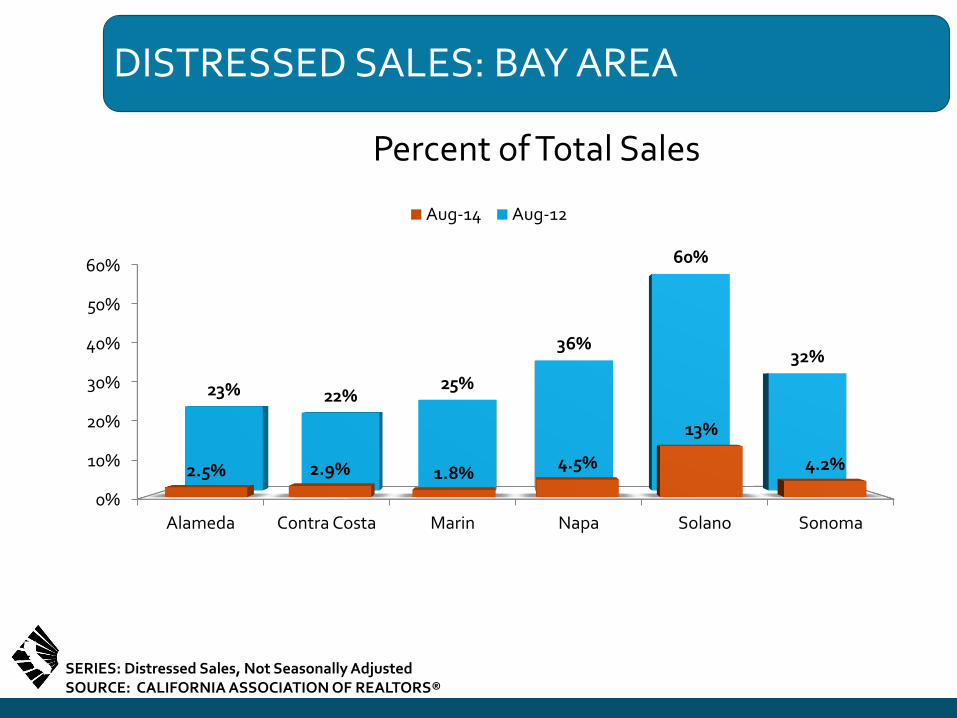
DISTRESSED SALES: BAY AREA
Percent of Total Sales
0%
10%
20%
30%
40%
50%
60%
Alameda Contra Costa Marin Napa Solano Sonoma
2.5% 2.9% 1.8% 4.5%
13%
4.2%
23% 22% 25%
36%
60%
32%
Aug-14 Aug-12
SERIES: Distressed Sales, Not Seasonally Adjusted SOURCE: CALIFORNIA ASSOCIATION OF REALTORS®
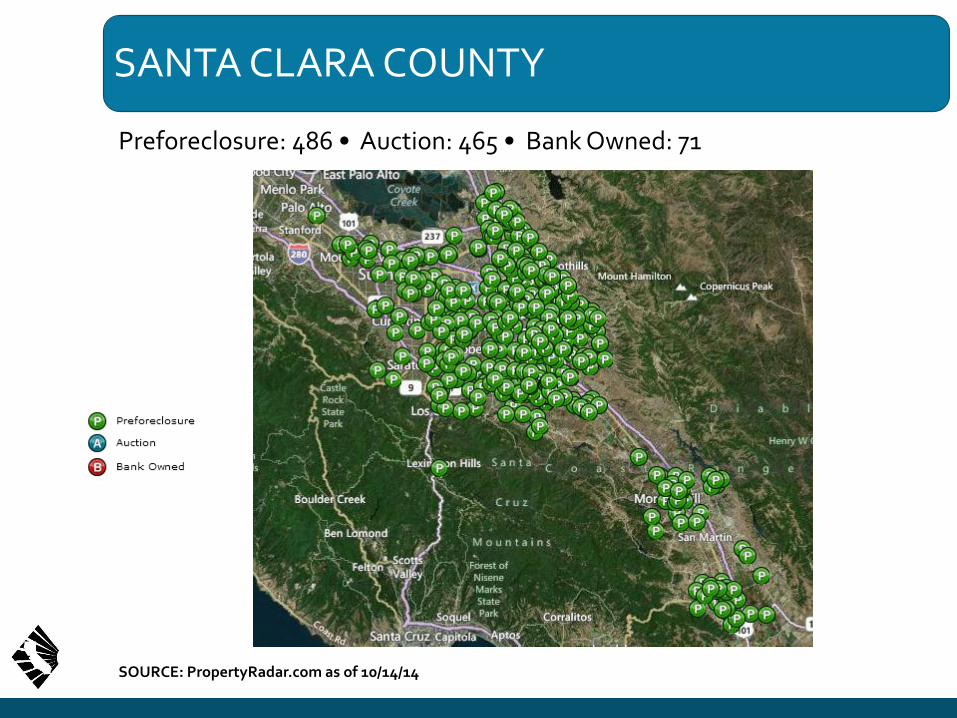
SANTA CLARA COUNTY
Preforeclosure: 486 • Auction: 465 • Bank Owned: 71
SOURCE: PropertyRadar.com as of 10/14/14

SANTA CLARA COUNTY
Preforeclosure: 486 • Auction: 465 • Bank Owned: 71
SOURCE: PropertyRadar.com as of 10/14/14

SANTA CLARA COUNTY
Preforeclosure: 486 • Auction: 465 • Bank Owned: 71
SOURCE: PropertyRadar.com as of 10/14/14

SAN JOSE
Preforeclosure: 326 • Auction: 321 • Bank Owned: 51
SOURCE: PropertyRadar.com as of 10/14/14
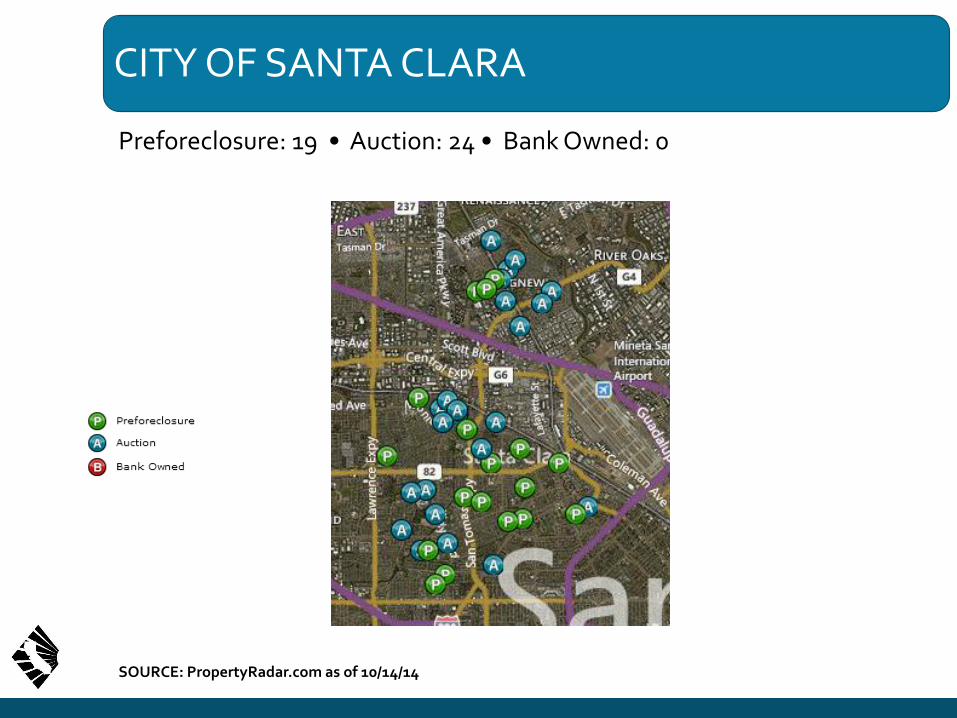
CITY OF SANTA CLARA
Preforeclosure: 19 • Auction: 24 • Bank Owned: 0
SOURCE: PropertyRadar.com as of 10/14/14

PALO ALTO
Preforeclosure: 1 • Auction: 2 • Bank Owned: 0
SOURCE: PropertyRadar.com as of 10/14/14

SALES GROWING IN HIGHER PRICE RANGES
SERIES: Sales of Existing Detached Homes SOURCE: CALIFORNIA ASSOCIATION OF REALTORS®
-22.9%
-0.7% -2.9%
4.9% 5.9% 2.8%
18.5%
28.3%
-30%
-20%
-10%
0%
10%
20%
30%
40%
Sep-14 Year-over-Year % Chg. in Sales

CHANGE IN SALES BY PRICE RANGE
(Year-to-Year)
-22.9%
9.0%
-0.7%
-2.9%
4.9%
-60%
-50%
-40%
-30%
-20%
-10%
0%
10%
20%
30%
40%
50%
60%
70%
$0 - $200k $500k+ $200 - $300k $300 - $400k $400 - $500k
SERIES: Sales of Existing Detached Homes SOURCE: CALIFORNIA ASSOCIATION OF REALTORS®

PRICE PLATEAU AHEAD; ANNUAL GAINS SLOWING
California, Sep. 2014: $460,940, Up 7.6% YTY
SERIES: Median Price of Existing Single Family Homes SOURCE: CALIFORNIA ASSOCIATION OF REALTORS®
Sep-14: $460,940
Sep-13: $428,290
$-
$100,000
$200,000
$300,000
$400,000
$500,000
$600,000
$700,000
Jan
-05
Jul-
05
Jan
-06
Jul-
06
Jan
-07
Jul-
07
Jan
-08
Jul-
08
Jan
-09
Jul-
09
Jan
-10
Jul-
10
Jan
-11
Jul-
11
Jan
-12
Jul-
12
Jan
-13
Jul-
13
Jan
-14
Jul-
14
P: May-07 $594,530
T: Feb-09 $245,230 -59% from peak
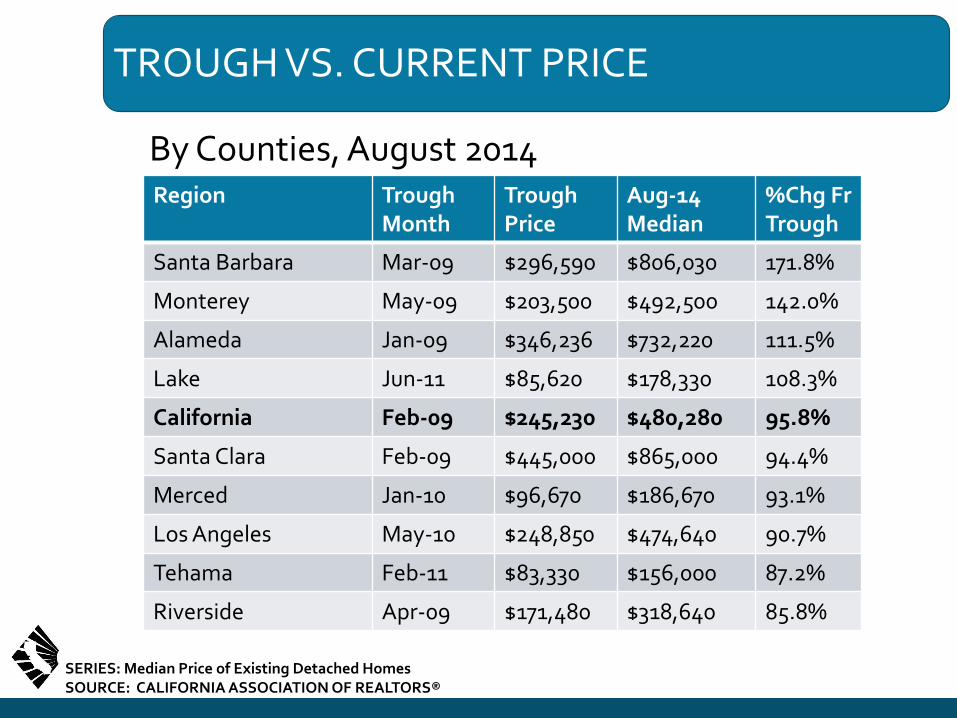
TROUGH VS. CURRENT PRICE
By Counties, August 2014
SERIES: Median Price of Existing Detached Homes SOURCE: CALIFORNIA ASSOCIATION OF REALTORS®
Region Trough Month
Trough Price
Aug-14 Median
%Chg Fr Trough
Santa Barbara Mar-09 $296,590 $806,030 171.8%
Monterey May-09 $203,500 $492,500 142.0%
Alameda Jan-09 $346,236 $732,220 111.5%
Lake Jun-11 $85,620 $178,330 108.3%
California Feb-09 $245,230 $480,280 95.8%
Santa Clara Feb-09 $445,000 $865,000 94.4%
Merced Jan-10 $96,670 $186,670 93.1%
Los Angeles May-10 $248,850 $474,640 90.7%
Tehama Feb-11 $83,330 $156,000 87.2%
Riverside Apr-09 $171,480 $318,640 85.8%

$-
$100,000
$200,000
$300,000
$400,000
$500,000
$600,000 California US
CALIFORNIA VS. U.S. MEDIAN PRICES
1970-2014
SOURCE: CALIFORNIA ASSOCIATION OF REALTORS®
SERIES: Median Price of Existing Single Family Homes SOURCE: CALIFORNIA ASSOCIATION OF REALTORS®
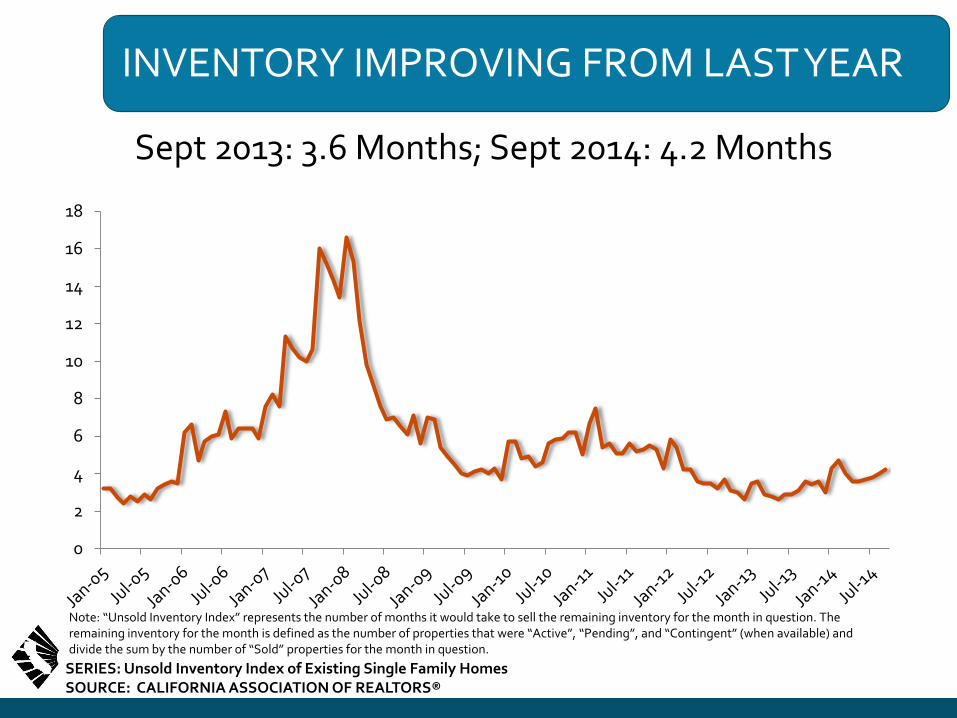
INVENTORY IMPROVING FROM LAST YEAR
Sept 2013: 3.6 Months; Sept 2014: 4.2 Months
Note: “Unsold Inventory Index” represents the number of months it would take to sell the remaining inventory for the month in question. The remaining inventory for the month is defined as the number of properties that were “Active”, “Pending”, and “Contingent” (when available) and divide the sum by the number of “Sold” properties for the month in question.
0
2
4
6
8
10
12
14
16
18
SERIES: Unsold Inventory Index of Existing Single Family Homes SOURCE: CALIFORNIA ASSOCIATION OF REALTORS®

INVENTORY HIGHER AT UPPER PRICE RANGES
Note: “Unsold Inventory Index” represents the number of months it would take to sell the remaining inventory for the month in question. The remaining inventory for the month is defined as the number of properties that were “Active”, “Pending”, and “Contingent” (when available) and divide the sum by the number of “Sold” properties for the month in question.
SERIES: Unsold Inventory Index of Existing Single Family Homes SOURCE: CALIFORNIA ASSOCIATION OF REALTORS®
Price Range (Thousand) Sep-14 Aug-14 Sep-13
$1,000K+ 5.5 5.0 5.9
$750-999K 4.3 3.9 3.7
$500-749K 3.9 3.8 3.5
$400-499K 3.9 3.8 3.3
$300-399K 4.1 4.0 3.3
$200-299K 4.0 4.0 3.2
$0-199K 3.9 3.8 3.2

WHY WAS/IS INVENTORY SO LOW?
• Demand Side – Housing affordability was at historic highs – Low rates hurt investment alternatives – International buyers
• Supply Side – Little new construction for last 5 years – Underwater homeowners are stuck – Mortgage Lock-In Effect – No inventory to move up – Foreclosure pipeline drying up – Investors are renting instead of flipping – Off-market (aka “pocket’) listings

BUYING TO RENT V. FLIP; CHANGE IN PREFERRED INVESTMENT STRATEGY
Investment to Flip
Rental Property
SERIES: 2014 Housing Market Survey SOURCE: CALIFORNIA ASSOCIATION OF REALTORS®

HOUSING AFFORDABILITY

REAL ENEMY OF THE FUTURE OF CALIFORNIA?
• Housing Affordability
• The Achilles Heel of the California Economy
• What happens when housing costs are too high?
• Impact on jobs and economic growth
• Impact on neighborhoods and family stability

HOUSING AFFORDABILITY DOWN SHARPLY SINCE Q1 2012
% OF HOUSEHOLDS THAT CAN BUY A MEDIAN-PRICED HOME
SERIES: Housing Affordability Index of Traditional Buyers SOURCE: CALIFORNIA ASSOCIATION OF REALTORS®
0%
10%
20%
30%
40%
50%
60%
70%
80% CA US
California vs. U.S. – 1984-2014
Annual Quarterly

SOME GOOD NEWS:MEDIAN CA HOUSE PAYMENT WELL BELOW PEAK PEAK
$-
$500
$1,000
$1,500
$2,000
$2,500
$3,000
$3,500
$4,000
Jan-80 Jan-83 Jan-86 Jan-89 Jan-92 Jan-95 Jan-98 Jan-01 Jan-04 2009 Q1
SERIES: Housing Affordability Index SOURCE: CALIFORNIA ASSOCIATION OF REALTORS®
PITI/Month
Peak: $3,668/mo (2007 Q2)
Latest: $2,340/mo (2014 Q2)

… MINIMUM QUALIFYING INCOME ALSO WELL BELOW PEAK
$-
$20,000
$40,000
$60,000
$80,000
$100,000
$120,000
$140,000
$160,000
Jan-80 Jan-82 Jan-84 Jan-86 Jan-88 Jan-90 Jan-92 Jan-94 Jan-96
Jan-98 Jan-00 Jan-02 Jan-04 2006 Q1
2012 Q1
Min. Income Peak: $146,701/yr (2007 Q2)
Latest: $93,593/yr (2014 Q2)
SERIES: Housing Affordability Index SOURCE: CALIFORNIA ASSOCIATION OF REALTORS®

HOUSE PAYMENT (INFLATION ADJUSTED) IS AT LATE 1970’S LEVEL
SERIES: Housing Affordability Index SOURCE: CALIFORNIA ASSOCIATION OF REALTORS®
PITI/Month (ADJUSTED FOR INFLATION)
Peak: $928/mo (2006)
Latest: $458/mo (2013)
$-
$100
$200
$300
$400
$500
$600
$700
$800
$900
$1,000
1975 1978 1981 1984 1987 1990 1993 1996 1999 2002 2005 2008 2011

MINIMUM QUALIFYING INCOME IS THE SAME AS 35 YEARS AGO
SERIES: Housing Affordability Index SOURCE: CALIFORNIA ASSOCIATION OF REALTORS®
Min. Income (Adjusted for Inflation) Peak: $37,122 (2006)
Latest: $18,337 (2013)
$-
$5,000
$10,000
$15,000
$20,000
$25,000
$30,000
$35,000
$40,000
1975 1978 1981 1984 1987 1990 1993 1996 1999 2002 2005 2008 2011
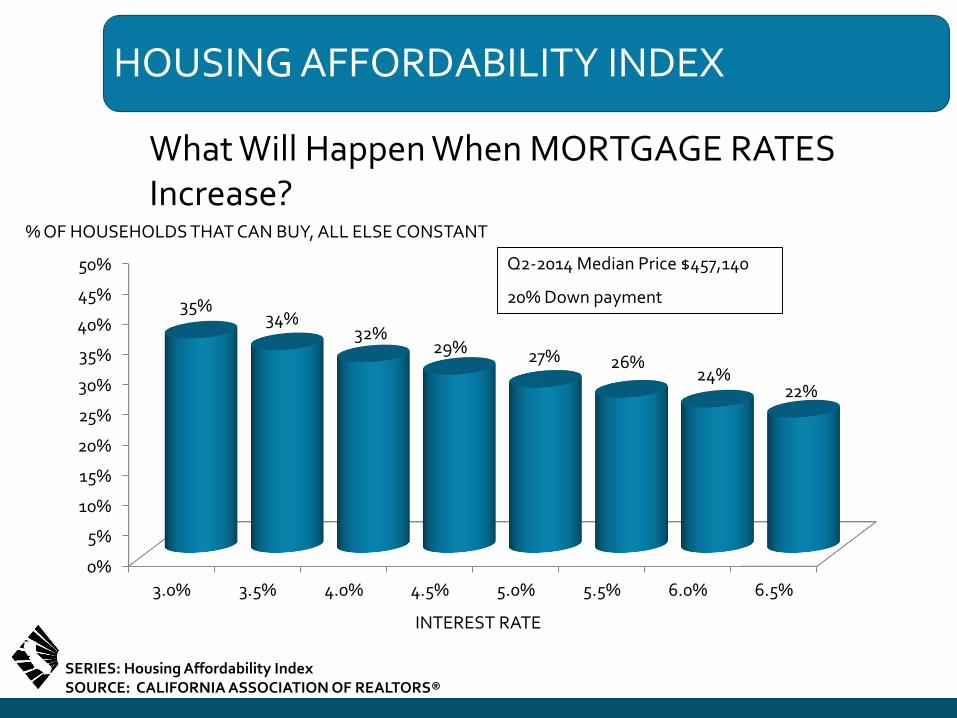
HOUSING AFFORDABILITY INDEX
What Will Happen When MORTGAGE RATES Increase?
0%
5%
10%
15%
20%
25%
30%
35%
40%
45%
50%
3.0% 3.5% 4.0% 4.5% 5.0% 5.5% 6.0% 6.5%
35% 34%
32% 29% 27% 26%
24% 22%
Q2-2014 Median Price $457,140
20% Down payment
INTEREST RATE
% OF HOUSEHOLDS THAT CAN BUY, ALL ELSE CONSTANT
SERIES: Housing Affordability Index SOURCE: CALIFORNIA ASSOCIATION OF REALTORS®

MEDIAN MONTHLY MORTGAGE PAYMENT
What Will Happen When Mortgage Rates Increase?
$0
$400
$800
$1,200
$1,600
$2,000
$2,400
3.0% 3.5% 4.0% 4.5% 5.0% 5.5% 6.0% 6.5%
$1,542 $1,642
$1,746 $1,853 $1,963
$2,076 $2,193
$2,312
INTEREST RATE
MONTHLY MORTGAGE
SERIES: Housing Affordability Index SOURCE: CALIFORNIA ASSOCIATION OF REALTORS®
Q2-2014 Median Price $457,140
20% Down payment

MINIMUM QUALIFYING INCOME
What Will Happen When Mortgage Rates Increase?
$0
$20,000
$40,000
$60,000
$80,000
$100,000
$120,000
3.0% 3.5% 4.0% 4.5% 5.0% 5.5% 6.0% 6.5%
$82,703 $86,717
$90,867 $95,149 $99,557
$104,087 $108,734
$113,490
INTEREST RATE
MONTHLY MORTGAGE
SERIES: Housing Affordability Index SOURCE: CALIFORNIA ASSOCIATION OF REALTORS®
Q2-2014 Median Price $457,140
20% Down payment

INCOME REQUIRED TO BUY A MEDIAN-PRICED HOME IN CA: (PEAK VS. CURRENT)
$56,324
$93,593
$0
$20,000
$40,000
$60,000
$80,000
$100,000
2012 Q1 2014 Q2
• Change in minimum required income: $37,269
• Increase in income attributed to interest rate increase: $836 (2.2% of total change)
• Increase in income attributed to price increase : $36,433 (97.8% of total change)
SERIES: Housing Affordability Index SOURCE: CALIFORNIA ASSOCIATION OF REALTORS®

SHARE OF FIRST-TIME BUYERS UP BUT STILL BELOW LONG-RUN AVERAGE
28.1% 30.5%
0%
10%
20%
30%
40%
50%
2005 2006 2007 2008 2009 2010 2011 2012 2013 2014
% First-Time Home Buyers Long Run Average
Long Run Average = 38%
QUESTION: Was the buyer a first-time buyer? SERIES: 2014 Housing Market Survey SOURCE: CALIFORNIA ASSOCIATION OF REALTORS®
WHY DO WE CARE ABOUT LOW LEVEL OF FIRST-TIME BUYER?
• It signals a constrained flow of new households in the housing market
• Trade-up market cannot be replenished in the long run
• First-time buyers represent the main impulse that drives the state’s homeownership rate

FINANCIAL CHARACTERISTICS: FIRST-TIME VS. REPEAT
SERIES: 2014 Housing Market Survey SOURCE: CALIFORNIA ASSOCIATION OF REALTORS®
First-time Buyers Repeat Buyers All Buyers
Median Household Income $80,000 $120,000 $100,000
Median Monthly Mortgage Payment $1,477 $1,868 $1,800
Median Downpayment (in $$) $32,500 $100,000 $70,000
Median Downpayment (in % to Price) 10% 20% 19.7%

REASONS FOR RENTING INSTEAD OF BUYING
SERIES: 2013 Renter Survey SOURCE: CALIFORNIA ASSOCIATION OF REALTORS®
44%
9%
6%
6%
6%
5%
5%
3%
2%
Can't afford to buy
Poor credit / Can't qualify
Renting is easier
Young/Starting out/Not ready
Flexibility/Freedom if renting
Cost/Upkeep/Responsibility
Plan to / Saving for down
Never considered it/No interest
Disabled/On disability

STUDENT LOAN DEBT AN ISSUE FOR 25% OF RENTERS
SERIES: 2013 Renter Survey SOURCE: CALIFORNIA ASSOCIATION OF REALTORS®
Yes, 23%
No, 75%
Refused, 2%
Student Loan Debt
78%
8%
6%
3%
2%
2%
<$10,000
$10-$20K
$20-$50K
$50-$100K
> $100K
Refused
Amount of Debt
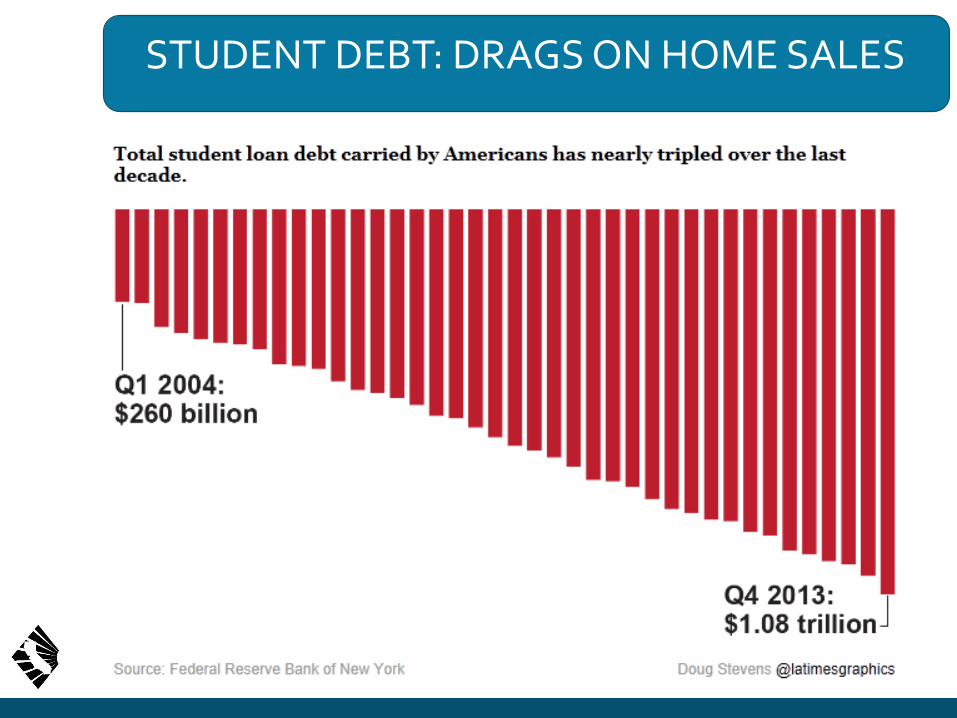
STUDENT DEBT: DRAGS ON HOME SALES
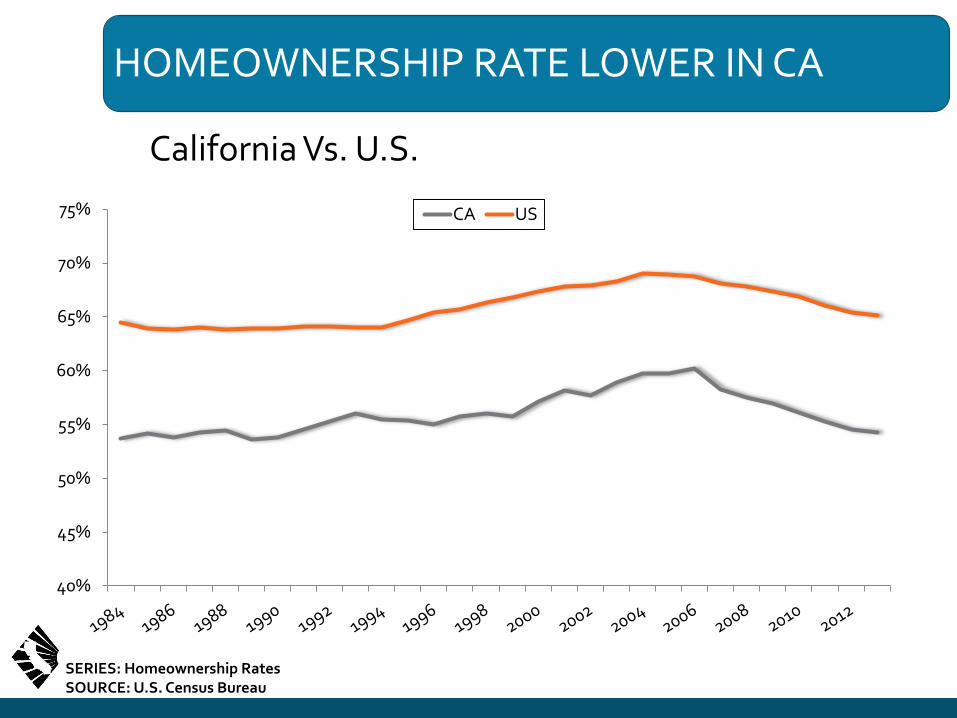
HOMEOWNERSHIP RATE LOWER IN CA
California Vs. U.S.
40%
45%
50%
55%
60%
65%
70%
75% CA US
SERIES: Homeownership Rates SOURCE: U.S. Census Bureau
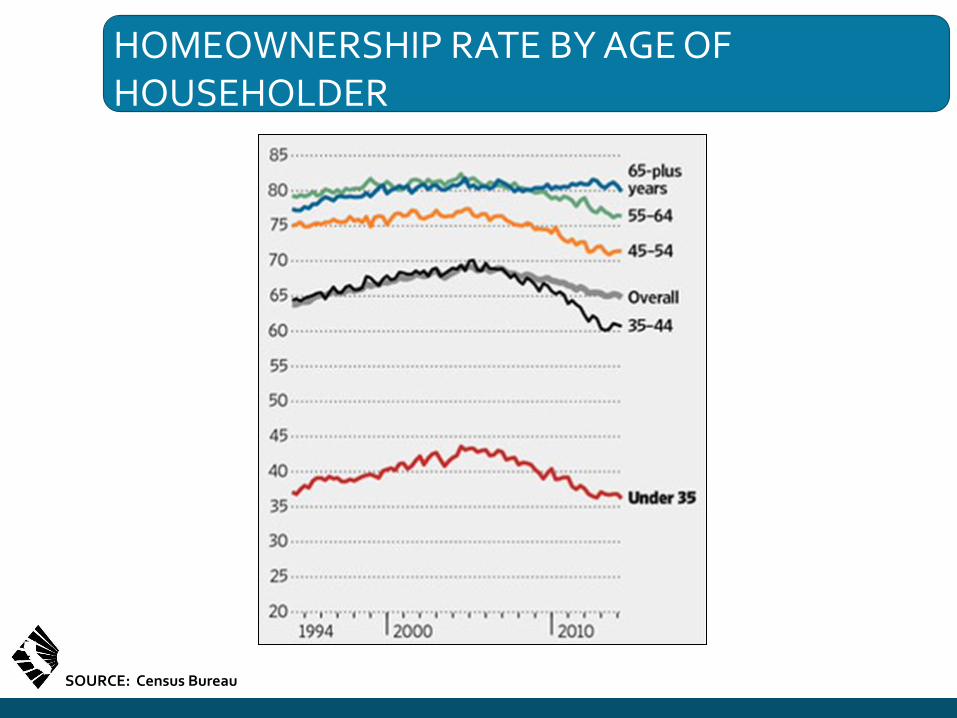
HOMEOWNERSHIP RATE BY AGE OF HOUSEHOLDER
SOURCE: Census Bureau

MILLENNIAL HOMEOWNERSHIP FALLING
SOURCE: Census Bureau

CALIFORNIA’S HOUSING DELEMMA
• Even with everything (or at least most things) going right, our homeownership market is in trouble…
• The rental market, even with the conversion of 500,000 SFH’s, is still exhibiting inadequate supply

HOW TO MAKE IT MORE AFFORDABLE? ONE WORD: SUPPLY
• CA Housing Needs = Minimally 165,000 Units Annually
– Regulatory Problem
– Impact Fees
– Public Attitudes

CA PERMITS UP BUT MORE UNITS NEEDED
2013: 57,496 Units, Up 43.0% from 2012
SERIES: New Housing Permits SOURCE: Construction Industry Research Board
0
50000
100000
150000
200000
250000
300000
350000 Single Family Multi-Family
Household Growth: 220,000-250,000/yr

REGIONAL HOUSING MARKETS

SANTA CLARA COUNTY

SALES OF RESIDENTIAL HOMES
Santa Clara County, September 2014: 844 Units
Down 9.8% MTM, Down 11.9% YTY
SOURCE: Clarus Market Metrics

MEDIAN PRICE OF RESIDENTIAL HOMES
Santa Clara County, September 2014: $852,500
Down 0.9% MTM, Up 10.0% YT
SOURCE: Clarus Market Metrics
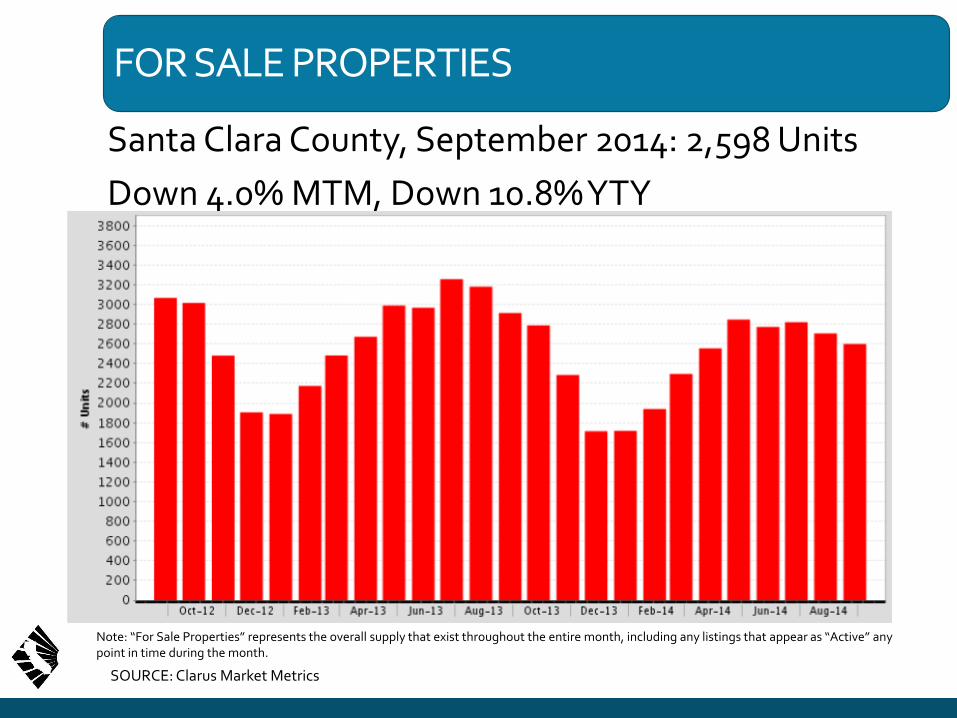
FOR SALE PROPERTIES
Santa Clara County, September 2014: 2,598 Units
Down 4.0% MTM, Down 10.8% YTY
Note: “For Sale Properties” represents the overall supply that exist throughout the entire month, including any listings that appear as “Active” any point in time during the month.
SOURCE: Clarus Market Metrics

MONTH’S SUPPLY OF INVENTORY
Santa Clara County, September 2014: 1.5 Months
Note: “Month’s Supply of Inventory” represents the number of months it would take to sell the remaining inventory for the month in question. The remaining inventory for the month is defined as the number of properties that were “For Sale” on the last day of the month in question. The inventory figure is then divided by the number of properties that went Under Contract during the month.
SOURCE: Clarus Market Metrics

CITY OF SANTA CLARA

SALES OF RESIDENTIAL HOMES
City of Santa Clara, September 2014: 57 Units
Up 21.3% MTM, Up 16.3% YTY
SOURCE: Clarus Market Metrics

MEDIAN PRICE OF RESIDENTIAL HOMES
City of Santa Clara, September 2014: $840,000
Down 4.1% MTM, Up 14.9% YTY
SOURCE: Clarus Market Metrics
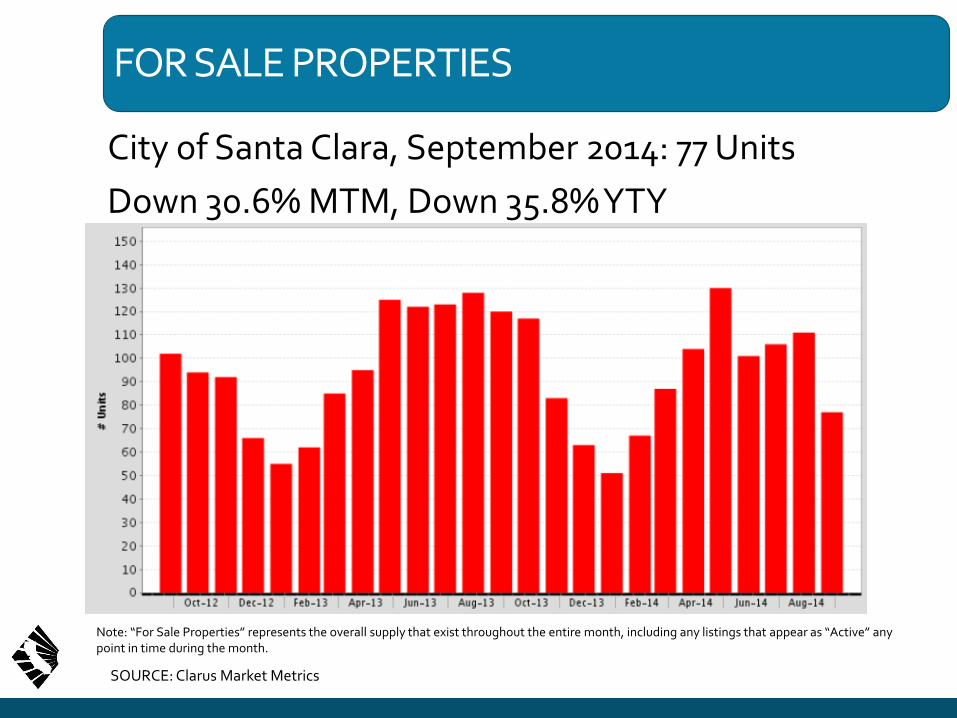
FOR SALE PROPERTIES
City of Santa Clara, September 2014: 77 Units
Down 30.6% MTM, Down 35.8% YTY
Note: “For Sale Properties” represents the overall supply that exist throughout the entire month, including any listings that appear as “Active” any point in time during the month.
SOURCE: Clarus Market Metrics

MONTH’S SUPPLY OF INVENTORY
City of Santa Clara, September 2014: 0.9 Months
Note: “Month’s Supply of Inventory” represents the number of months it would take to sell the remaining inventory for the month in question. The remaining inventory for the month is defined as the number of properties that were “For Sale” on the last day of the month in question. The inventory figure is then divided by the number of properties that went Under Contract during the month.
SOURCE: Clarus Market Metrics

SAN JOSE
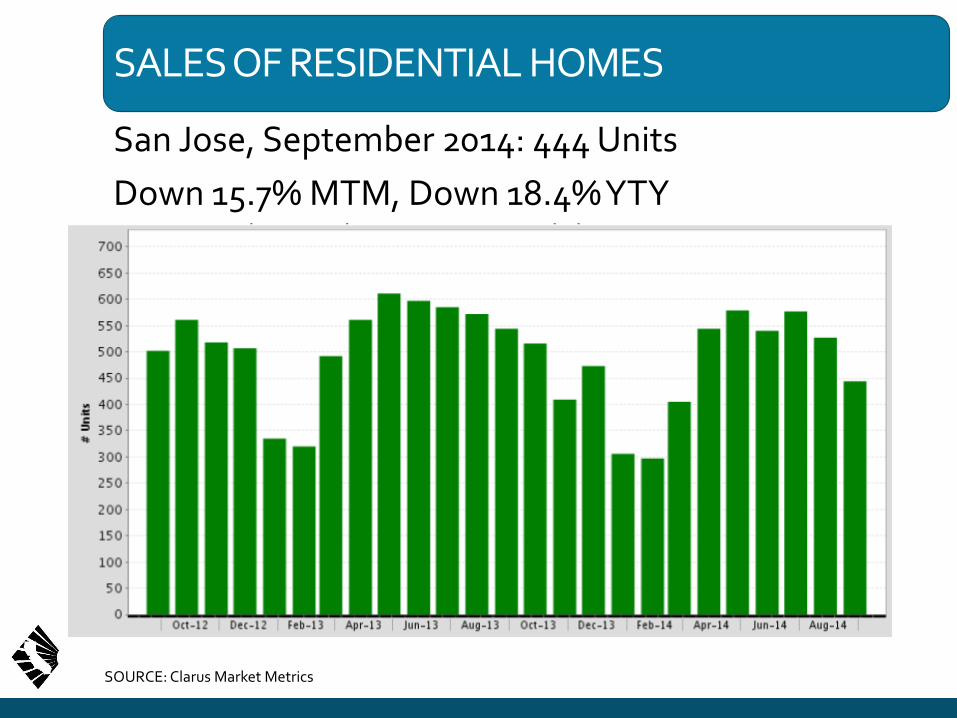
SALES OF RESIDENTIAL HOMES
San Jose, September 2014: 444 Units
Down 15.7% MTM, Down 18.4% YTY
SOURCE: Clarus Market Metrics
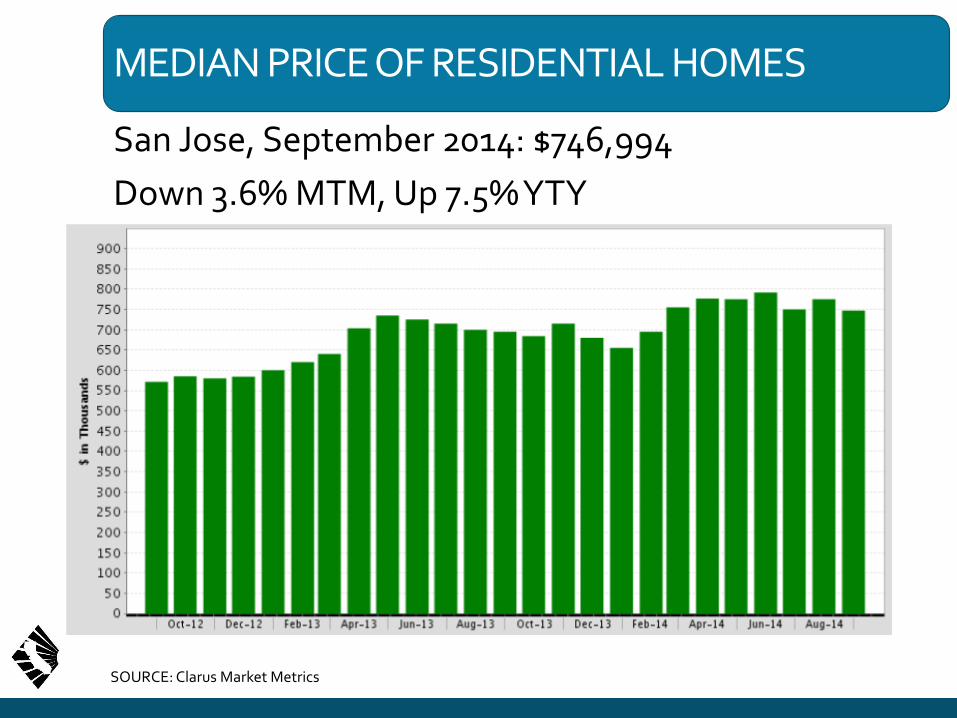
MEDIAN PRICE OF RESIDENTIAL HOMES
San Jose, September 2014: $746,994
Down 3.6% MTM, Up 7.5% YTY
SOURCE: Clarus Market Metrics

FOR SALE PROPERTIES
San Jose, September 2014: 1,396 Units
Down 5.7% MTM, Down 12.2% YTY
Note: “For Sale Properties” represents the overall supply that exist throughout the entire month, including any listings that appear as “Active” any point in time during the month.
SOURCE: Clarus Market Metrics
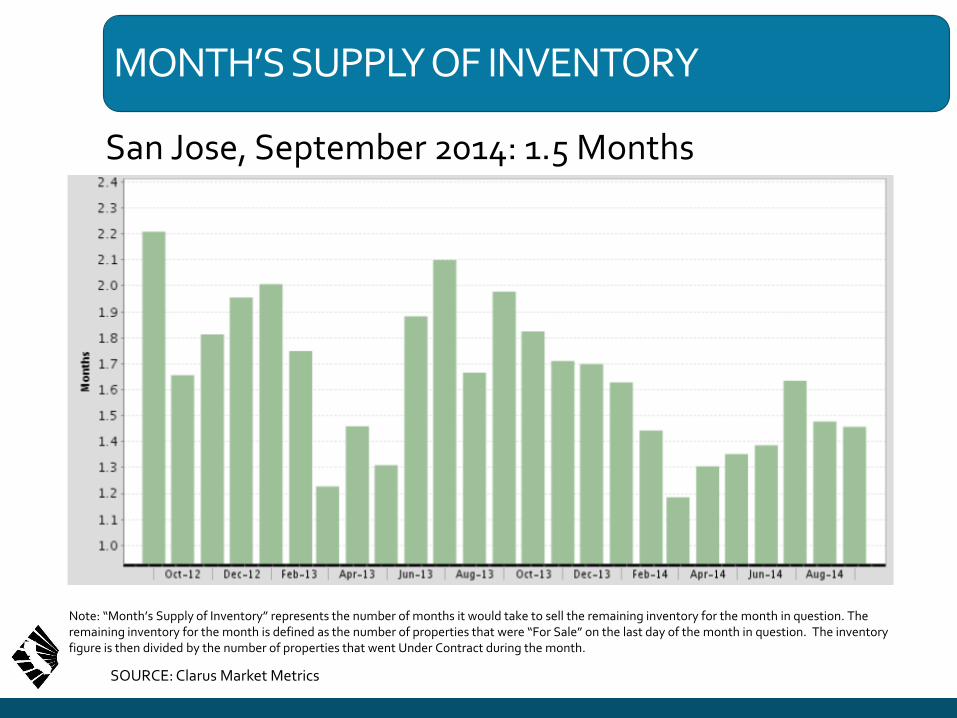
MONTH’S SUPPLY OF INVENTORY
San Jose, September 2014: 1.5 Months
Note: “Month’s Supply of Inventory” represents the number of months it would take to sell the remaining inventory for the month in question. The remaining inventory for the month is defined as the number of properties that were “For Sale” on the last day of the month in question. The inventory figure is then divided by the number of properties that went Under Contract during the month.
SOURCE: Clarus Market Metrics

PALO ALTO
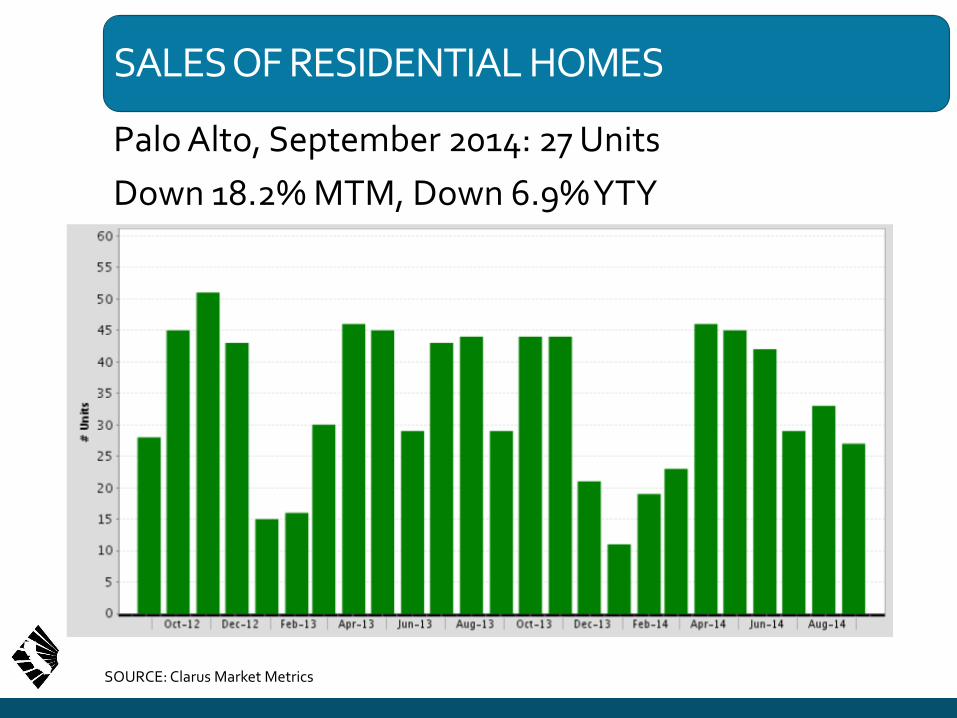
SALES OF RESIDENTIAL HOMES
Palo Alto, September 2014: 27 Units
Down 18.2% MTM, Down 6.9% YTY
SOURCE: Clarus Market Metrics

MEDIAN PRICE OF RESIDENTIAL HOMES
Palo Alto, September 2014: $2,999,890
Up 25.0% MTM, Up 58.9% YTY
SOURCE: Clarus Market Metrics
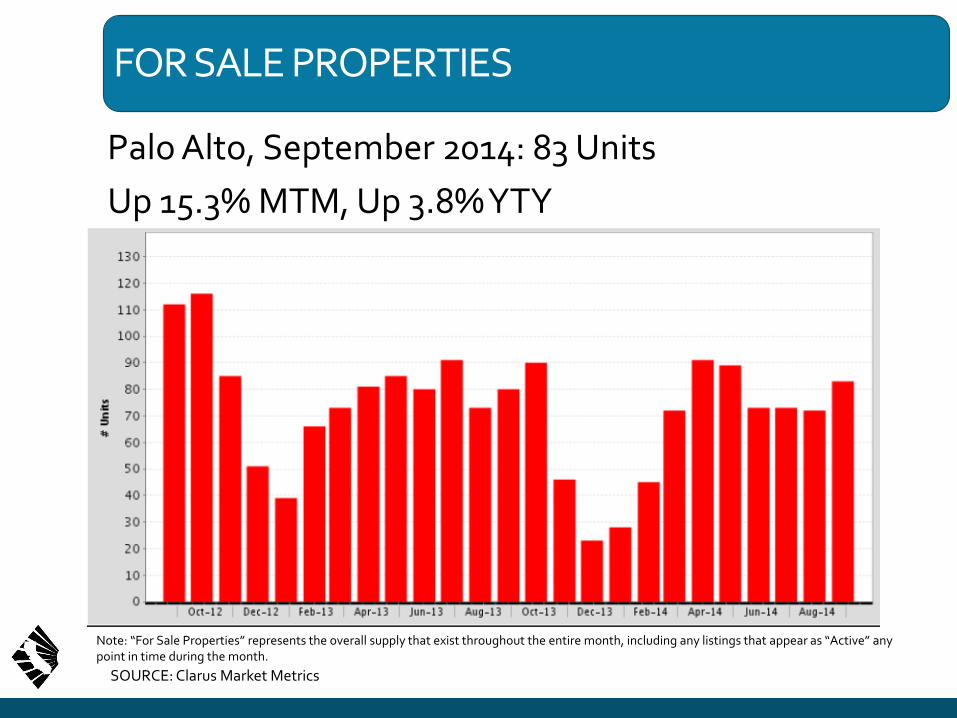
FOR SALE PROPERTIES
Palo Alto, September 2014: 83 Units
Up 15.3% MTM, Up 3.8% YTY
Note: “For Sale Properties” represents the overall supply that exist throughout the entire month, including any listings that appear as “Active” any point in time during the month.
SOURCE: Clarus Market Metrics

MONTH’S SUPPLY OF INVENTORY
Palo Alto, September 2014: 1.1 Months
Note: “Month’s Supply of Inventory” represents the number of months it would take to sell the remaining inventory for the month in question. The remaining inventory for the month is defined as the number of properties that were “For Sale” on the last day of the month in question. The inventory figure is then divided by the number of properties that went Under Contract during the month.
SOURCE: Clarus Market Metrics

2015 FORECAST
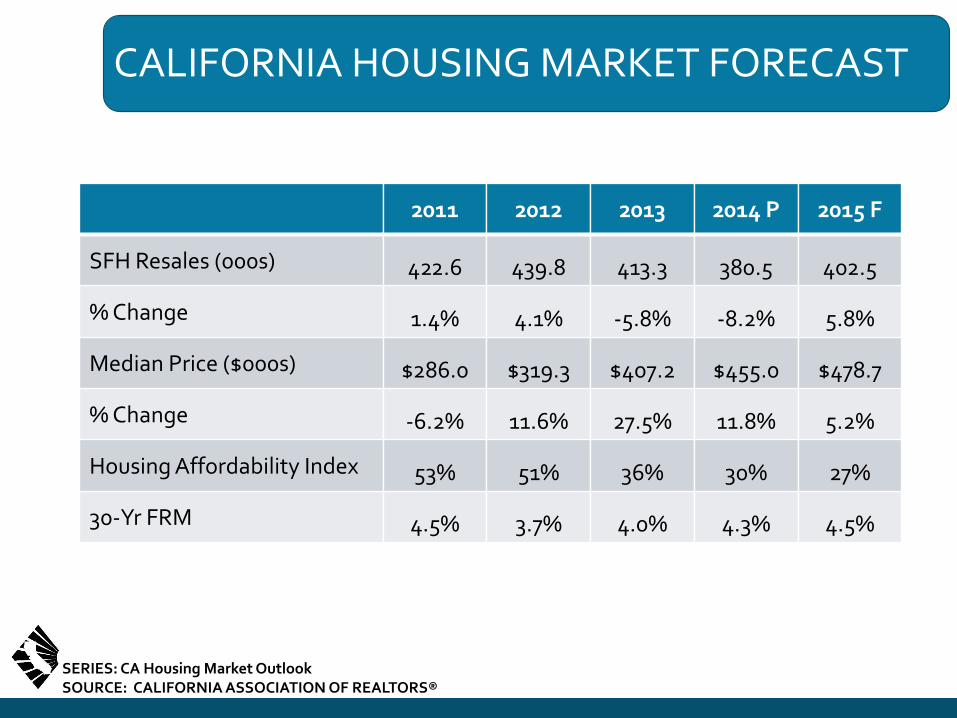
CALIFORNIA HOUSING MARKET FORECAST
SERIES: CA Housing Market Outlook SOURCE: CALIFORNIA ASSOCIATION OF REALTORS®
SFH Resales (000s)
% Change
Median Price ($000s)
% Change
Housing Affordability Index
30-Yr FRM
2011
422.6
1.4%
$286.0
-6.2%
53%
4.5%
2012
439.8
4.1%
$319.3
11.6%
51%
3.7%
2013
413.3
-5.8%
$407.2
27.5%
36%
4.0%
2014 P
380.5
-8.2%
$455.0
11.8%
30%
4.3%
2015 F
402.5
5.8%
$478.7
5.2%
27%
4.5%
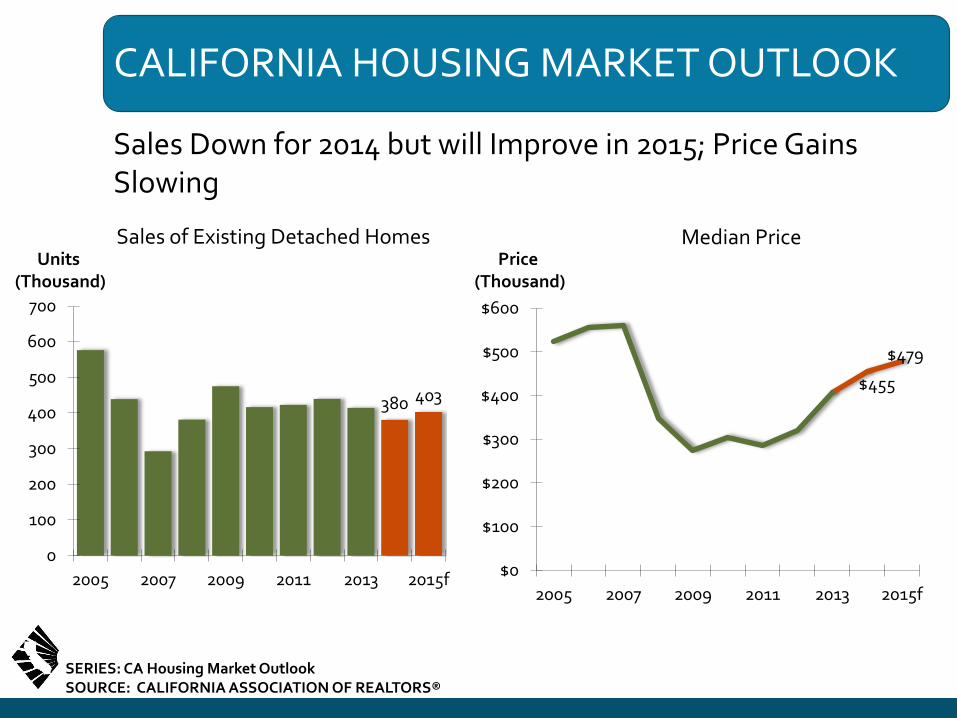
CALIFORNIA HOUSING MARKET OUTLOOK
Sales Down for 2014 but will Improve in 2015; Price Gains Slowing
Units (Thousand)
380 403
0
100
200
300
400
500
600
700
2005 2007 2009 2011 2013 2015f
Sales of Existing Detached Homes
$455
$479
$0
$100
$200
$300
$400
$500
$600
2005 2007 2009 2011 2013 2015f
Median Price Price
(Thousand)
SERIES: CA Housing Market Outlook SOURCE: CALIFORNIA ASSOCIATION OF REALTORS®
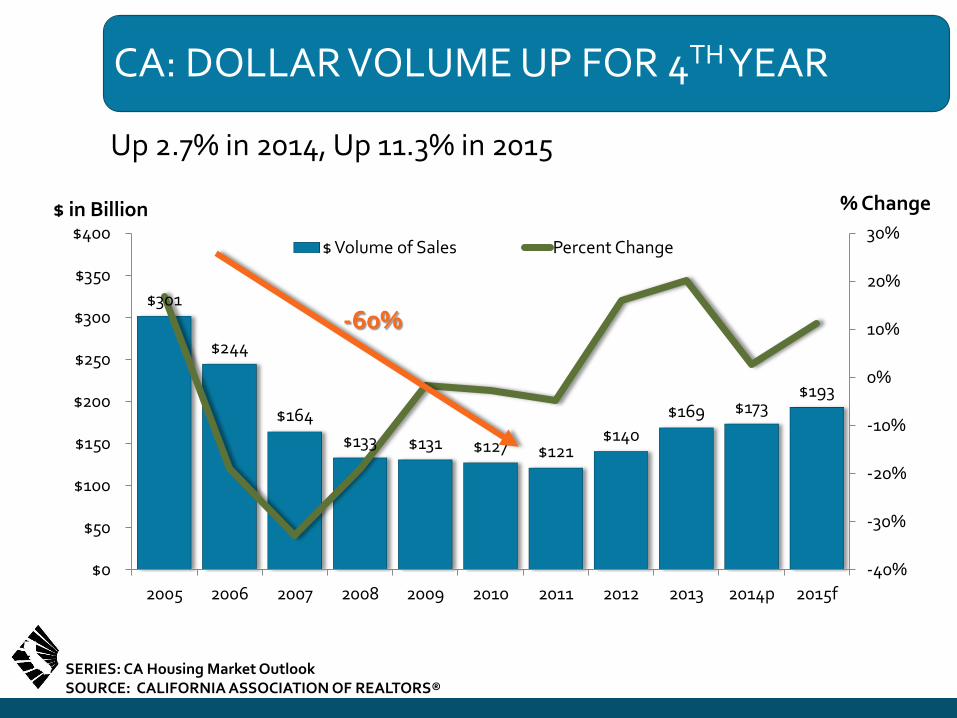
CA: DOLLAR VOLUME UP FOR 4TH YEAR
$301
$244
$164
$133 $131 $127 $121 $140
$169 $173 $193
-40%
-30%
-20%
-10%
0%
10%
20%
30%
$0
$50
$100
$150
$200
$250
$300
$350
$400
2005 2006 2007 2008 2009 2010 2011 2012 2013 2014p 2015f
$ Volume of Sales Percent Change
% Change $ in Billion
-60%
SERIES: CA Housing Market Outlook SOURCE: CALIFORNIA ASSOCIATION OF REALTORS®
Up 2.7% in 2014, Up 11.3% in 2015

REAL ESTATE IS CONSIDERED THE BEST LONG TERM INVESTMENT
SOURCE: Gallup

“Make no mistake about it, the way that working-class people build wealth is through
homeownership, not the stock market, not their 401(k) and not a pension.”
John Taylor, President of the National Community Reinvestment Coalition,
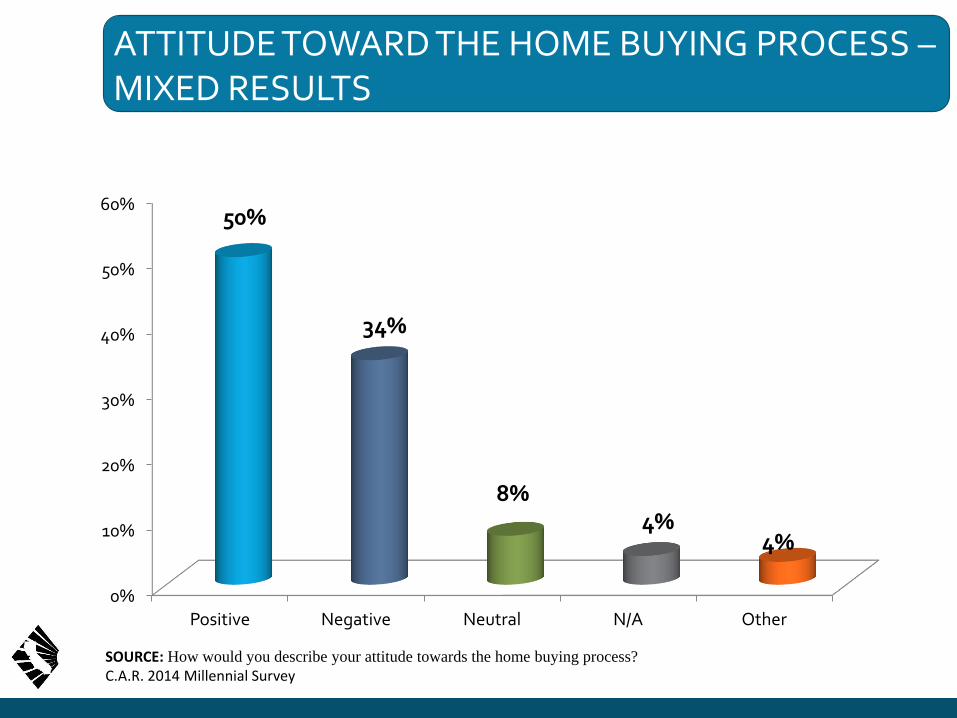
ATTITUDE TOWARD THE HOME BUYING PROCESS – MIXED RESULTS
SOURCE: How would you describe your attitude towards the home buying process?
C.A.R. 2014 Millennial Survey
0%
10%
20%
30%
40%
50%
60%
Positive Negative Neutral N/A Other
50%
34%
8% 4%
4%
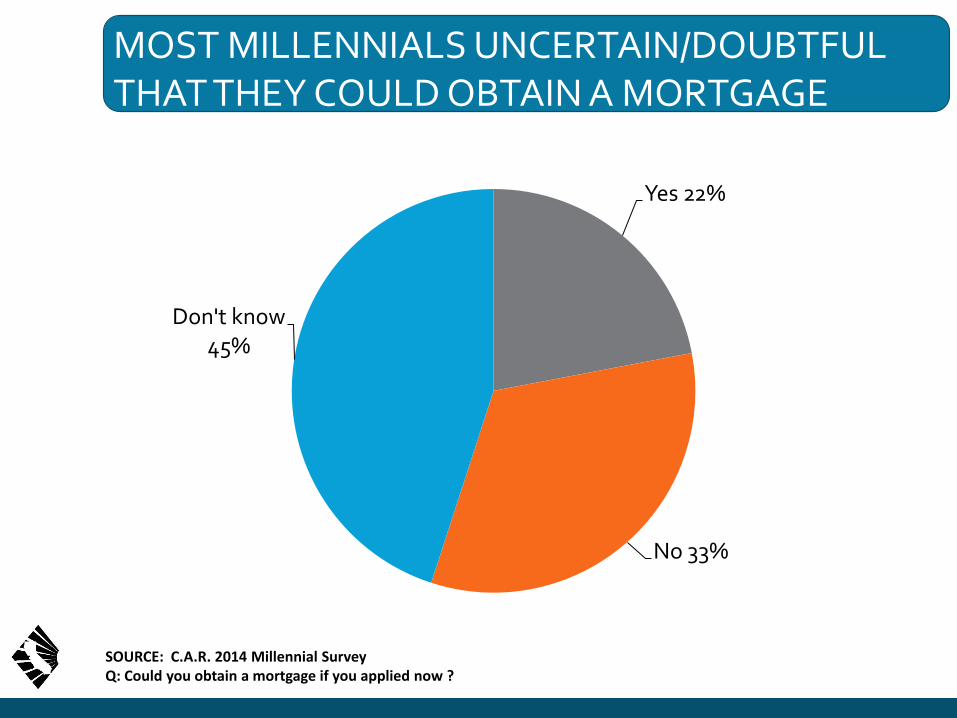
MOST MILLENNIALS UNCERTAIN/DOUBTFUL THAT THEY COULD OBTAIN A MORTGAGE NOW?AMILLENNIAL ETHNICITY
SOURCE: C.A.R. 2014 Millennial Survey Q: Could you obtain a mortgage if you applied now ?
Yes 22%
No 33%
Don't know 45%
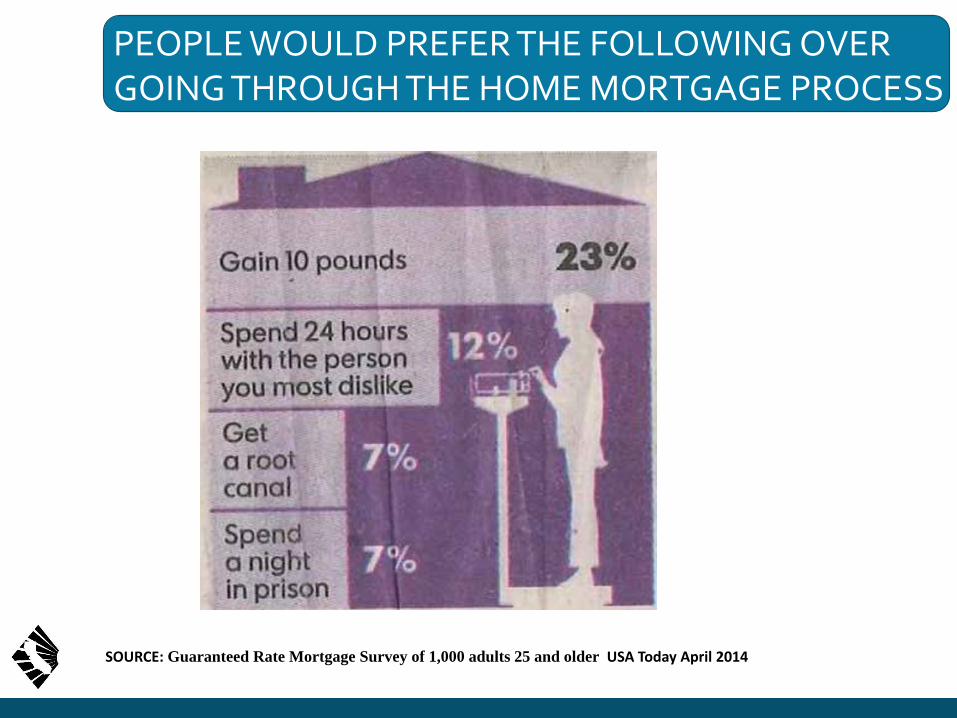
PEOPLE WOULD PREFER THE FOLLOWING OVER GOING THROUGH THE HOME MORTGAGE PROCESS AGAIN:
SOURCE: Guaranteed Rate Mortgage Survey of 1,000 adults 25 and older USA Today April 2014

C.A.R. Strategic Planning Books

Related Documents