1 PENNSYLVANIA DON EICHHORN SCHOOLS: SCHOOLS TO WATCH 2014-2015 Application for Re-Designation The National Forum to Accelerate Middle-Grades Reform in collaboration with the Pennsylvania Association for Middle Level Education, Pennsylvania Department of Education, Duquesne University, Edinboro University of Pennsylvania, Shippensburg University and The Horace-Mann Companies The PA Don Eichhorn Schools: Schools to Watch program (PA STW) affirms that exemplary schools are schools involved in an on-going journey of excellence. To this end, a program of continuous evaluation for all schools recognized as PA Don Eichhorn Schools has been established. In order to maintain status as a PA STW school, at the end of three years schools must submit an application for re- designation and host a one day site visit to ascertain the progress of the school since the original recognition.

Welcome message from author
This document is posted to help you gain knowledge. Please leave a comment to let me know what you think about it! Share it to your friends and learn new things together.
Transcript

1
PENNSYLVANIA DON EICHHORN SCHOOLS:
SCHOOLS TO WATCH
2014-2015 Application for Re-Designation
The National Forum to Accelerate Middle-Grades Reform in collaboration with the
Pennsylvania Association for Middle Level Education,
Pennsylvania Department of Education,
Duquesne University, Edinboro University of Pennsylvania,
Shippensburg University
and The Horace-Mann Companies
The PA Don Eichhorn Schools: Schools to Watch program (PA STW) affirms that
exemplary schools are schools involved in an on-going journey of excellence. To this
end, a program of continuous evaluation for all schools recognized as PA Don
Eichhorn Schools has been established. In order to maintain status as a PA STW
school, at the end of three years schools must submit an application for re-
designation and host a one day site visit to ascertain the progress of the school
since the original recognition.

2
The application portion of the re-designation process asks for the following specific
information:
A narrative reflection of school progress and programs in each of the four domains
An explanation of any significant changes that have occurred since the initial designation,
specifically in the areas of leadership, school size and/or demographics, district
mandates, program, structure, and test data
A list of any special recognition awarded to your school since your designation as a PA Don
Eichhorn School
A description of any research projects, grant awards, articles, and projects of which your
school has been the subject or recipient in the past three years
The identification of several “stretch goals” that will move your school to the next
level. Goals may be, but are not limited to, the following areas:
Efforts to move from teacher-directed to student-centered classrooms
Institution of more authentic and varied measures of student progress
More integrative approach to learning
More effective use of data in planning instructional improvement
The establishment of instructional coaches
Transitions in and out of the middle school
Increased involvement in the arts and humanities
Included in this report must be an analysis of your last three years of AYP scores/subgroup
target scores and your progress towards improving overall student performance. In
addition, it is required that all schools applying for re-designation have their entire
faculty and staff complete the Schools to Watch Self Study and Rating Rubric online
and analyze results as part of their reflection narrative.
The application is to be completed by a team of administrators and teachers chosen by the
school and mailed to:
Mr. Bruce Vosburgh
Director, Pennsylvania Don Eichhorn Schools: Schools to Watch
1905 Lenape Unionville Road
Kennett Square, PA 19348
ALL MATERIALS MUST BE RECEIVED on or before, AUGUST 25, 2014.

3
Part One Please provide a brief narrative reflection of progress and programs in each of the
following domains:
Academic Excellence
Developmental Responsiveness
Social Equity
Organizational Structures and Processes
Narratives in 12 point font, type one to two pages per domain, should reflect the indicators
involved in each domain. Refer to your original application and visitation team report in
assessing growth and need for continued improvement. Reference your original Future
Initiatives and how they have been addressed and adjusted. Include any new initiatives you
have adopted. Include an analysis of the results of the STW Self Study and Rating Rubric.
Part Two Describe any significant changes that may have occurred in the school during the past
three years in:
Leadership
Size
Faculty
Student demographics
District mandates
Overall program and structure
Test data
Part Three What special recognitions have been awarded to your school or faculty members since
your designation as a School to Watch three years ago. (maximum length, one page)
Part Four A description of any research projects, grant awards, articles, and projects or any
other significant acknowledgment of which your school has been the subject or
recipient in the past three years. (maximum length, one page)
4
Part Five
Identify several “stretch goals” that will move your school to the next level. Goals may
be, but are not limited to, the following areas:
Efforts to move from teacher-directed to student-centered classrooms;
Institution of more authentic and varied measures of student progress;
More integrative approach to learning;
More effective use of data in planning instructional improvement;
The establishment of instructional coaches;
Transitions in and out of the middle school;
Increased involvement in the arts and humanities;
Advancing literacy education across the curriculum.
(maximum length, one page)
APPLICATION DATA
Complete the PA Don Eichhorn Schools: Schools to Watch Application Data. Your
information must be entered on this or a similar locally created form, upon agreement of
the PA STW Director, using Microsoft Word. Your completed form must be included
as the final portion of the Schools to Watch Re-Designation Application. The National
Forum will also access this information
DOCUMENTATION OF YOUR SCHOOL’S ACADEMIC PERFORMANCE Behind the last page of this application, attach the last three years state report scores on
the following tests:
PSSA
Any other standardized test instruments
Disaggregated data is important when submitting these scores.

5
The National Forum to Accelerate Middle-Grades Reform
PENNSYLVANIA DON EICHHORN SCHOOLS: SCHOOLS TO
WATCH
2014-2015 Application for Re-Designation
CONTACT INFORMATION
School Name: Cambria Heights Middle School
Street Address: 414 Glendale Lake Road
City: Patton State: PA Zip: 16668
Phone: 814-674-6920 Fax: 814-674-5054 Web site: www.chsd1.org
Name of Principal: Mr. David Caldwell
Principal’s email: [email protected] Years as Principal at this site: 10
School District: Cambria Heights School District
PAMLE Institutional Membership #300 312 Intermediate Unit # 8
Members of Application Writing Team:
Name Position
1. Nathaniel Wharton Science Teacher
2. Tammy Scott English Teacher
3. Kenneth Kerchenske Assistant Principal
4. Cathy Knupp Family Consumer Science Teacher
5. Christina Fesko Science Teacher
6. Rhonda Sprenger Guidance Counselor
7. David Caldwell Middle School Principal
(List additional team members as needed)
Applications prepared by external grant writers or paid consultants will not be accepted.
SCHOOL CHARACTERISTICS
1. What grades are included in your school? 6th, 7th, and 8th Grade
2. What is your total school enrollment? 350
3. What is the total number of students in your school district? 1423
6
The National Forum to Accelerate Middle-Grades Reform
PENNSYLVANIA DON EICHHORN SCHOOLS: SCHOOLS TO WATCH
Application Checklist
School Name: Cambria Heights Middle School
Please review the Pennsylvania Don Eichhorn: Schools to Watch application procedures
packet to assure you have completed each step of the application process according to
directions. Only information requested will be accepted.
Use the following checklist and check to see that each item is complete. Number each
page throughout your application and assemble in the following order.
__1. Contact Information
__2. School Characteristics
__3. Online completion of the Self Study and Rating Rubric
__4. Completed parts 1-5
__5. Application Data
__6. Documentation of your school’s academic performance
__7. Signature and Permission
Make ONE complete packet for your records and mail TWO complete packets
and ONE CD of your application (all parts must be WORD documents) to:
Mr. Bruce Vosburgh
Director, Pennsylvania Don Eichhorn Schools: Schools to Watch
1905 Lenape Unionville Road
Kennett Square, PA 19348
ALL MATERIALS MUST BE RECEIVED on or before, August 25, 2014.
Selection Timeline:
August 25, 2014 Applications due
Confirmation of receipt of application sent via e-mail
September 22, 2014 All schools informed of the status of their application
Selected schools will be scheduled for visitations between
October and January.
By January 6, 2015 Announcement of 2012-2013 Pennsylvania Don Eichhorn
Schools
February 2015 PA STW are schools honored and featured as presenters
at the Annual PMSA PDI – State College, PA

7
SIGNATURE AND PERMISSION
We are aware that applications prepared by external grant writers or paid consultants will
not be accepted and certify that this application was a collaborative process involving site
administrators, teachers and other key stakeholders. We understand that the Pennsylvania
Don Eichhorn Schools: Schools to Watch State Team may conduct a site visit to the school
between September 2014 and January 2015. We will gladly host such a visit and provide
meals for the visiting team. If selected as a Pennsylvania Don Eichhorn School: A documentation team may visit the school in order to gather further information for a case
study, such as written, photographic and/or videotaped documentation. District and school
staff would cooperate to the fullest extent possible and would assist in obtaining any
necessary releases.
Visits from other educators and media publicity would result. We will gladly participate in a
network of middle-level practitioners, share our knowledge and experience with others in
order to accelerate middle-grades reform and document these mentorship experiences using
simple forms provided by Pennsylvania Don Eichhorn Schools: Schools to Watch.
I/we would agree to participate as presenters and participants in the following:
- PMSA Professional Development Institute, February/March 2015
- National Schools to Watch Conference, June 2015
In addition, I/we would:
- Provide pertinent materials to be posted to the PAMLE and National STW websites
- Attend state training and serve as member(s) of the Pennsylvania Don Eichhorn
Schools: Schools to Watch State Team (activities include reading applications,
visiting potential Pennsylvania Don Eichhorn School sites, coaching future applicants,
etc.)
- Agree that if there is a change of principal leadership at the school, the new
principal will fulfill the obligations and take Pennsylvania Don Eichhorn Schools:
Schools to Watch training at the earliest opportunity
- Agree to annually review our programs and to keep Pennsylvania Don Eichhorn
Schools: Schools to Watch apprised of our continuous improvement
We certify that our school is currently and if re-designated will continue to be an
Institutional member of Pennsylvania Association for Middle Level Education, not in school
Program Improvement or a school being monitored and we have a well defined plan included in
future initiatives. We further certify that the Office of Civil Rights does not have any
outstanding findings of civil rights statute violations by the school or district which may
affect the school and that there are no pending suites by the Department of Justice against
the district alleging that the school, or the district as a whole, has violated one or more of
the civil rights statutes or the Constitution’s equal protection clauses.
______________________________________________________________
Principal’s Signature Date
______________________________________________________________
District Administrator’s (Superintendent or Designee) Signature Date

8
PA Don Eichhorn Schools: Schools to Watch Re-designation Application Data*
School Year 2014-2015 *Recognized Schools will be required to submit these data elements annually.
SPECIFIC INSTRUCTIONS: Your information must be entered on this or a similar locally created form, upon agreement of the PA STW Co-Director, using Microsoft Word. Your completed form must be included as the final portion of the Schools to Watch Application. Some of the data may not be applicable to your school, so those cells may be empty. If you have any questions about your “Application Data,” please contact Bruce Vosburgh, PA STW Director [email protected]
School/Student Demographics
General School Information School Name: Cambria Heights Middle School District Name: Cambria Heights School District Street Address: 414 Glendale Lake Road City/State/Zip: Patton, PA 16668 Phone with Area Code: 814-674-6290 Fax: 814-674-5054 Website: www.chsd1.org Grades in School: 6-8 Name of the Principal: David Caldwell Email: [email protected] School Community: Urban Rural Suburban
Student Information
Enrollment Data Student Populations
5th
6th
7th
8th
9th
Total Students
Percent of Total
Enrollment African American 1 1 .3 Asian Caucasian 107 115 122 344 99.1 Latino (a)/Hispanic 1 1 .3 Native American Other 1 1 .3
Total 107 117 123 100% Male Students 52 62 65 179 52% Female Students 55 55 58 168 48% Free/Reduced Lunch Students
38 33 44 115 33%
Identified Special Education Students
22 9 11 42 12%
English Language Learner Students
0 0 0 0

9
What was the average attendance rate (percent of all students) in your school during the last full school year? 94%
Would you define your student population as “mobile” or “stable”? Mobile Stable
Suspension Data, School Year: 2013-2014 In-School Suspensions
1-5 Days 6-10 Days
Student Populations
Total Number of Students in
School
Percent of Different Students
(Unduplicated Count)
Percent of
Cases (Duplicated
Count)
Percent of Different Students
(Unduplicated Count)
Percent of
Cases (Duplicated
Count)
All Students 347 3% 12% African American
1
Asian Caucasian 344 4% 12% Latino (a)/Hispanic
1
Native American Other 1 Male Students 179 2% 12% Female Students 168 2% 12% Free/Reduced Lunch Students
115
Special Education Students
42
English Language Learner Students
0
Out of School Suspensions
1-5 Days 6-10 Days
Student Populations
Total Number of Students in
School
Percent of Different Students
(Unduplicated Count)
Percent of
Cases (Duplicated
Count)
Percent of Different Students
(Unduplicated Count)
Percent of
Cases (Duplicated
Count)
All Students 347 African American
1
Asian Caucasian 344 Latino 1
10
(a)/Hispanic
Native American Other 1 Male Students 179 Female Students 168 Free/Reduced Lunch Students
115
Special Education Students
42
English Language Learner Students
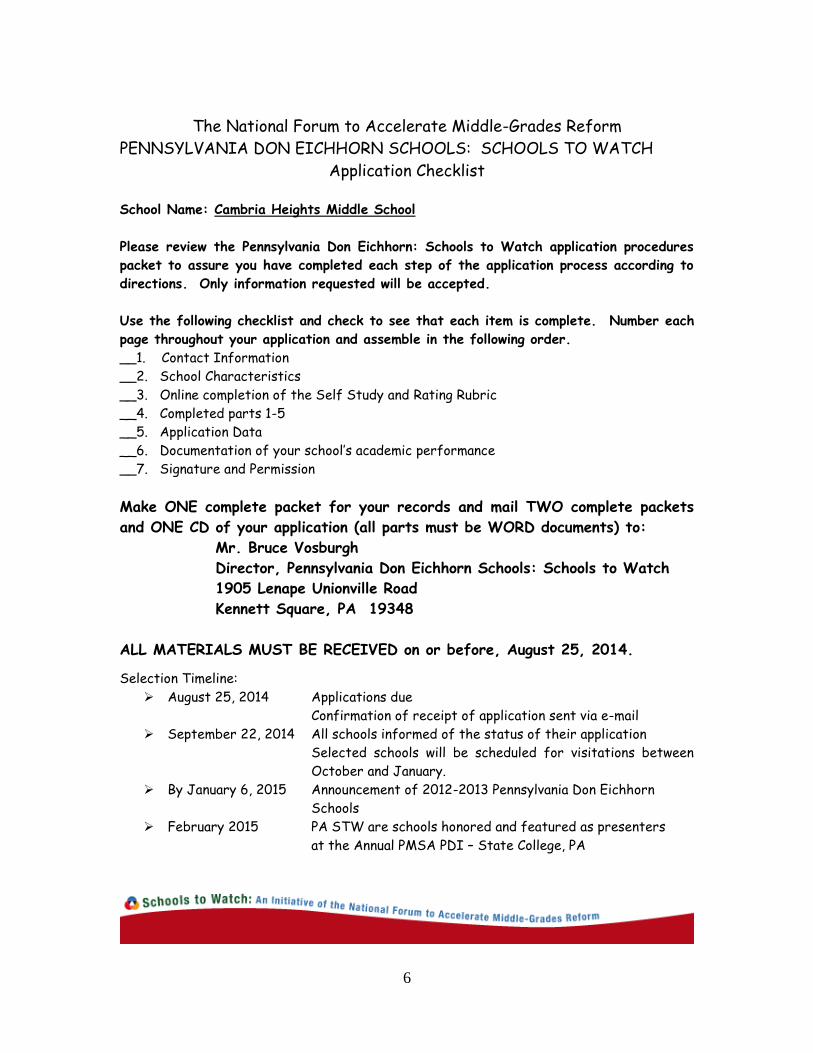
Were there any students suspended for more than 10 days? Yes No Were there any student expulsions during the last school year? Yes No How many of your students were not promoted to the next grade at the end of the last school year? (Include actual number and the percent of the total enrollment for the grade level.)
Students Not Promoted (Retained) at the End of the Last School Year Student Populations
Grade 5
Grade 6
Grade 7
Grade 8
Grade 9
Number Not
Promoted
Percent Of Total In Grade
Number Not
Promoted
Percent Of Total In Grade
Number Not
Promoted
Percent Of Total In Grade
Number Not
Promoted
Percent Of Total In Grade
Number Not
Promoted
Percent Of Total In Grade
All Students
0 0 0
African American
Asian
Latino (a)/ Hispanic
Native American
Caucasian
Other
Male Students
Female Students
Free/ Reduced Lunch Students
Special Education Students
English Language Learner Students

11
Student Achievement Data
Adequate Yearly Progress (AYP)
Adequate Yearly Progress (AYP), Year: 2012 Student Populations
English Language Arts Mathematics
YES NO YES NO
All Students x x African American x x Asian/Asian American
Caucasian x x Latino (a)/Hispanic x x Native American Multiracial* x x Students with Disabilities*
x x
Limited English Proficient*
Economically Disadvantaged*
x x
*Terms used on NCLB reports of AYP.
State Testing Data, 2011-2012 School Year, State: PA
Name of Test: Pennsylvania System of School Assessment
Percent of Students Passing State Assessment at the “Meets” or “Exceeds” Level (Combine Your School’s Data for “Meets” and “Exceeds” and Enter on this Chart)
5th Grade Student Populations
Language Arts
Mathematics Science Social Studies
Reading Other: Writing
Other:
All Students African American
Asian Latino (a)/Hispanic
Native American Caucasian Other Male Students Female Students
Free/Reduced Lunch Students
Special Education Students

12
English Language Learner Students
6th Grade Student Populations
Language Arts
Mathematics Science Social Studies
Reading Other:
Other:
All Students 80.7 82.3 African American
NA NA
Asian NA NA Latino (a)/Hispanic
100 100
Native American NA NA Caucasian 80.6 82.2 Other NA NA Male Students 78.0 79.3 Female Students
83.7 85.5
Free/Reduced Lunch Students
77.5 79.4
Special Education Students
66.7 63.7
English Language Learner Students
NA NA
7th Grade Student Populations
Language Arts
Mathematics Science Social Studies
Reading Other:
Other:
All Students 92.6 90 African American
100 100
Asian 100 100 Latino (a)/Hispanic
NA NA
Native American NA NA Caucasian 92.5 90.5 Other NA NA Male Students 94.1 86.3 Female Students
91.2 94.7
Free/Reduced Lunch Students
82.8 82.8
Special Education Students
58.3 50.0
13
English Language Learner Students
NA NA
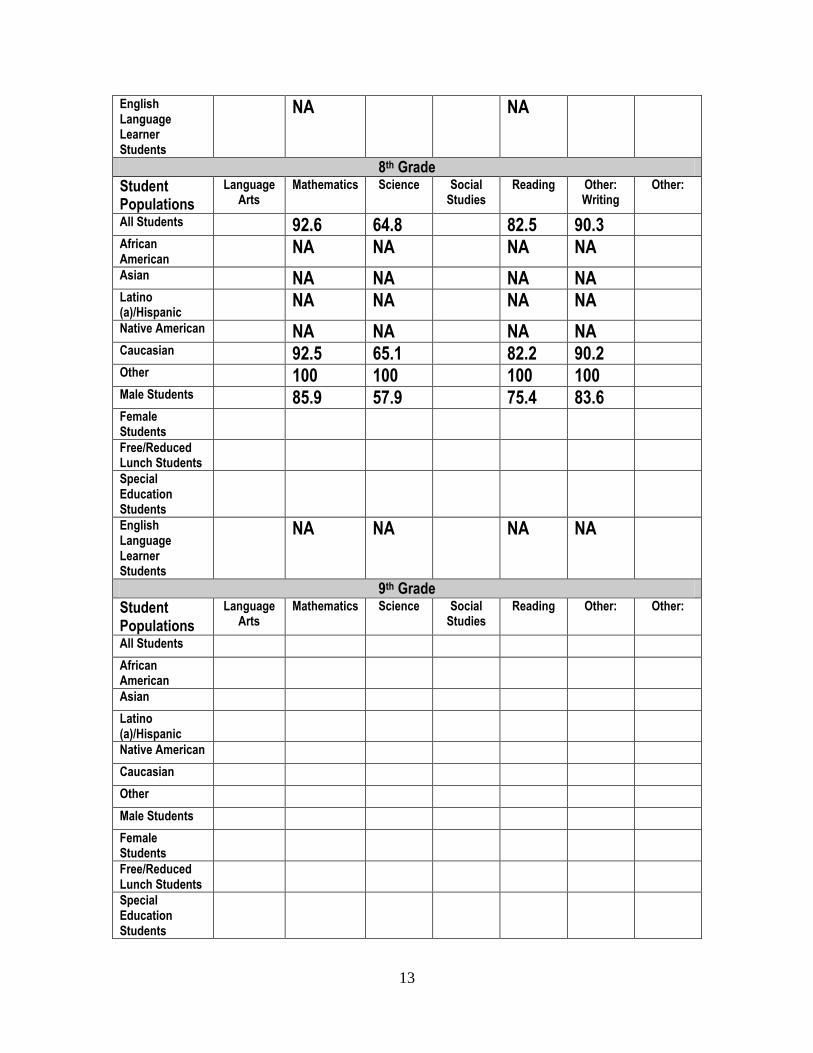
8th Grade Student Populations
Language Arts
Mathematics Science Social Studies
Reading Other: Writing
Other:
All Students 92.6 64.8 82.5 90.3 African American
NA NA NA NA
Asian NA NA NA NA Latino (a)/Hispanic
NA NA NA NA
Native American NA NA NA NA Caucasian 92.5 65.1 82.2 90.2 Other 100 100 100 100 Male Students 85.9 57.9 75.4 83.6 Female Students
Free/Reduced Lunch Students
Special Education Students
English Language Learner Students
NA NA NA NA
9th Grade Student Populations
Language Arts
Mathematics Science Social Studies
Reading Other:
Other:
All Students African American
Asian Latino (a)/Hispanic
Native American Caucasian Other Male Students Female Students
Free/Reduced Lunch Students
Special Education Students

14
English Language Learner Students
State Testing Data, 2012-2013 School Year, State: Pennsylvania
Name of Test: PSSA
Percent of Students Passing State Assessment at the “Meets” or “Exceeds” Level (Combine Your School’s Data for “Meets” and “Exceeds” and Enter on this Chart)
5th Grade Student Populations
Language Arts
Mathematics Science Social Studies
Reading Other:
Other:
All Students African American
Asian Latino (a)/Hispanic
Native American Caucasian Other Male Students Female Students
Free/Reduced Lunch Students
Special Education Students
English Language Learner Students
6th Grade Student Populations
Language Arts
Mathematics Science Social Studies
Reading Other:
Other:
All Students 80.9 85.2 African American
0 100
Asian NA NA Latino (a)/Hispanic
NA NA
Native American NA NA Caucasian 82.3 85.9 Other 0 0 Male Students 83.3 78.3
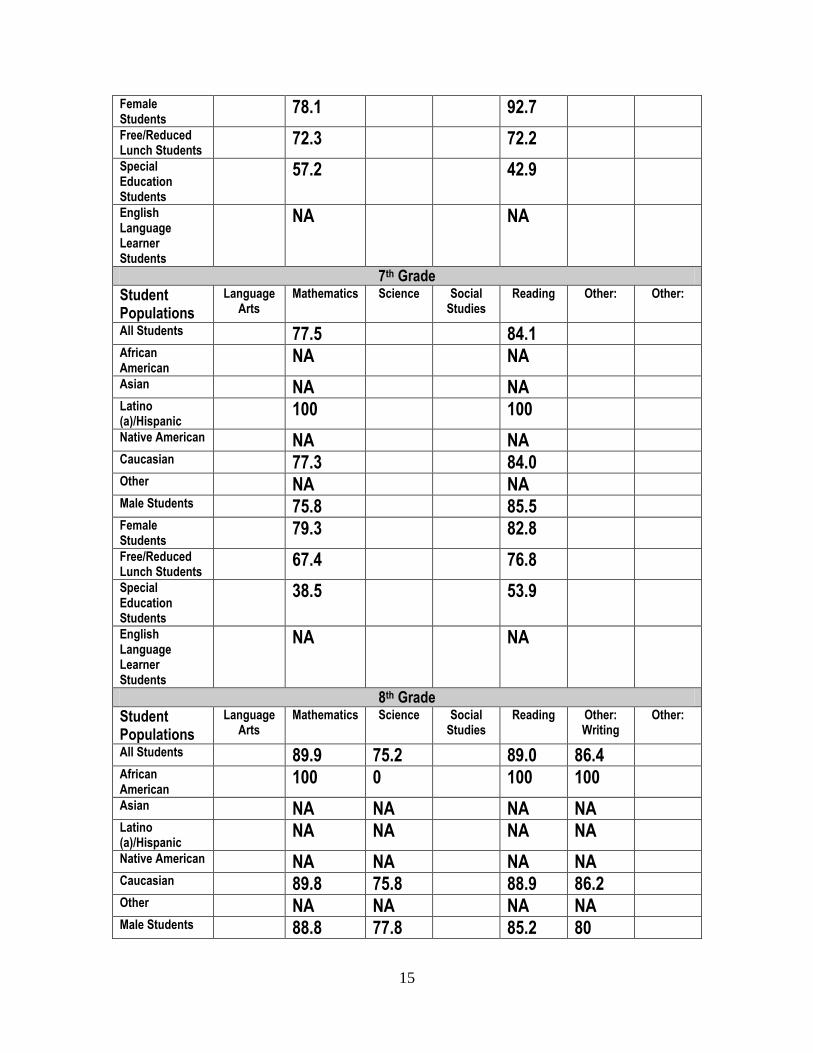
15
Female Students
78.1 92.7
Free/Reduced Lunch Students
72.3 72.2
Special Education Students
57.2 42.9
English Language Learner Students
NA NA
7th Grade Student Populations
Language Arts
Mathematics Science Social Studies
Reading Other:
Other:
All Students 77.5 84.1 African American
NA NA
Asian NA NA Latino (a)/Hispanic
100 100
Native American NA NA Caucasian 77.3 84.0 Other NA NA Male Students 75.8 85.5 Female Students
79.3 82.8
Free/Reduced Lunch Students
67.4 76.8
Special Education Students
38.5 53.9
English Language Learner Students
NA NA
8th Grade Student Populations
Language Arts
Mathematics Science Social Studies
Reading Other: Writing
Other:
All Students 89.9 75.2 89.0 86.4 African American
100 0 100 100
Asian NA NA NA NA Latino (a)/Hispanic
NA NA NA NA
Native American NA NA NA NA Caucasian 89.8 75.8 88.9 86.2 Other NA NA NA NA Male Students 88.8 77.8 85.2 80

16
Female Students
90.9 72.7 92.7 92.8
Free/Reduced Lunch Students
82.9 68.3 80.5 46.2
Special Education Students
46.2 30.8 30.8 78.6
English Language Learner Students
NA NA NA NA
9th Grade Student Populations
Language Arts
Mathematics Science Social Studies
Reading Other:
Other:
All Students African American
Asian Latino (a)/Hispanic
Native American Caucasian Other Male Students Female Students
Free/Reduced Lunch Students
Special Education Students
English Language Learner Students
State Testing Data, 2013-2014 School Year, State:
Name of Test:
Percent of Students Passing State Assessment at the “Meets” or “Exceeds” Level (Combine Your School’s Data for “Meets” and “Exceeds” and Enter on this Chart)
5th Grade

17
Student Populations
Language Arts
Mathematics Science Social Studies
Reading Other:
Other:
All Students African American
Asian Latino (a)/Hispanic
Native American Caucasian Other Male Students Female Students
Free/Reduced Lunch Students
Special Education Students
English Language Learner Students
6th Grade Student Populations
Language Arts
Mathematics Science Social Studies
Reading Other:
Other:
All Students African American
Asian Latino (a)/Hispanic
Native American Caucasian Other Male Students Female Students
Free/Reduced Lunch Students
Special Education Students
English Language Learner Students
7th Grade

18
Student Populations
Language Arts
Mathematics Science Social Studies
Reading Other:
Other:
All Students African American
Asian Latino (a)/Hispanic
Native American Caucasian Other Male Students Female Students
Free/Reduced Lunch Students
Special Education Students
English Language Learner Students
8th Grade Student Populations
Language Arts
Mathematics Science Social Studies
Reading Other:
Other:
All Students African American
Asian Latino (a)/Hispanic
Native American Caucasian Other Male Students Female Students
Free/Reduced Lunch Students
Special Education Students
English Language Learner Students
9th Grade
19
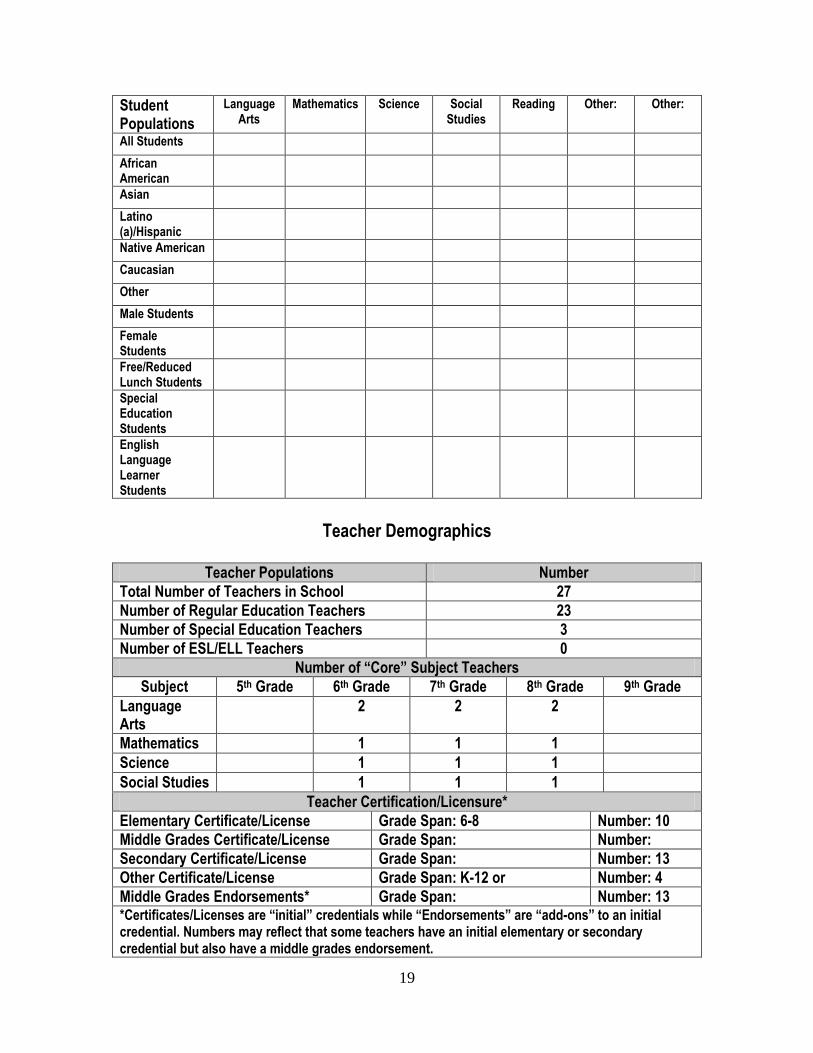
Student Populations
Language Arts
Mathematics Science Social Studies
Reading Other:
Other:
All Students African American
Asian Latino (a)/Hispanic
Native American Caucasian Other Male Students Female Students
Free/Reduced Lunch Students
Special Education Students
English Language Learner Students
Teacher Demographics
Teacher Populations Number
Total Number of Teachers in School 27
Number of Regular Education Teachers 23
Number of Special Education Teachers 3
Number of ESL/ELL Teachers 0
Number of “Core” Subject Teachers
Subject 5th Grade 6th Grade 7th Grade 8th Grade 9th Grade
Language Arts
2 2 2
Mathematics 1 1 1
Science 1 1 1
Social Studies 1 1 1
Teacher Certification/Licensure*
Elementary Certificate/License Grade Span: 6-8 Number: 10
Middle Grades Certificate/License Grade Span: Number:
Secondary Certificate/License Grade Span: Number: 13
Other Certificate/License Grade Span: K-12 or Number: 4
Middle Grades Endorsements* Grade Span: Number: 13 *Certificates/Licenses are “initial” credentials while “Endorsements” are “add-ons” to an initial credential. Numbers may reflect that some teachers have an initial elementary or secondary credential but also have a middle grades endorsement.

20
Test data for the 2014-2015 school year is requested and should be provided as soon as
available to Bruce Vosburgh [email protected]
2/2014 revised – PA Schools to Watch
Related Documents