1 PROSPEK DAN TANTANGAN PROSPEK DAN TANTANGAN PEREKONOMIAN INDONESIA PEREKONOMIAN INDONESIA Faisal Basri 2 2 Desember Desember 2013 2013 Bagian Bagian I I Ancaman Ancaman Middle Middle- -Income Trap Income Trap

Welcome message from author
This document is posted to help you gain knowledge. Please leave a comment to let me know what you think about it! Share it to your friends and learn new things together.
Transcript

1
PROSPEK DAN TANTANGAN PROSPEK DAN TANTANGAN PEREKONOMIAN INDONESIAPEREKONOMIAN INDONESIA
Faisal Basri
2 2 DesemberDesember 20132013
BagianBagian IIAncamanAncaman MiddleMiddle--Income TrapIncome Trap
2
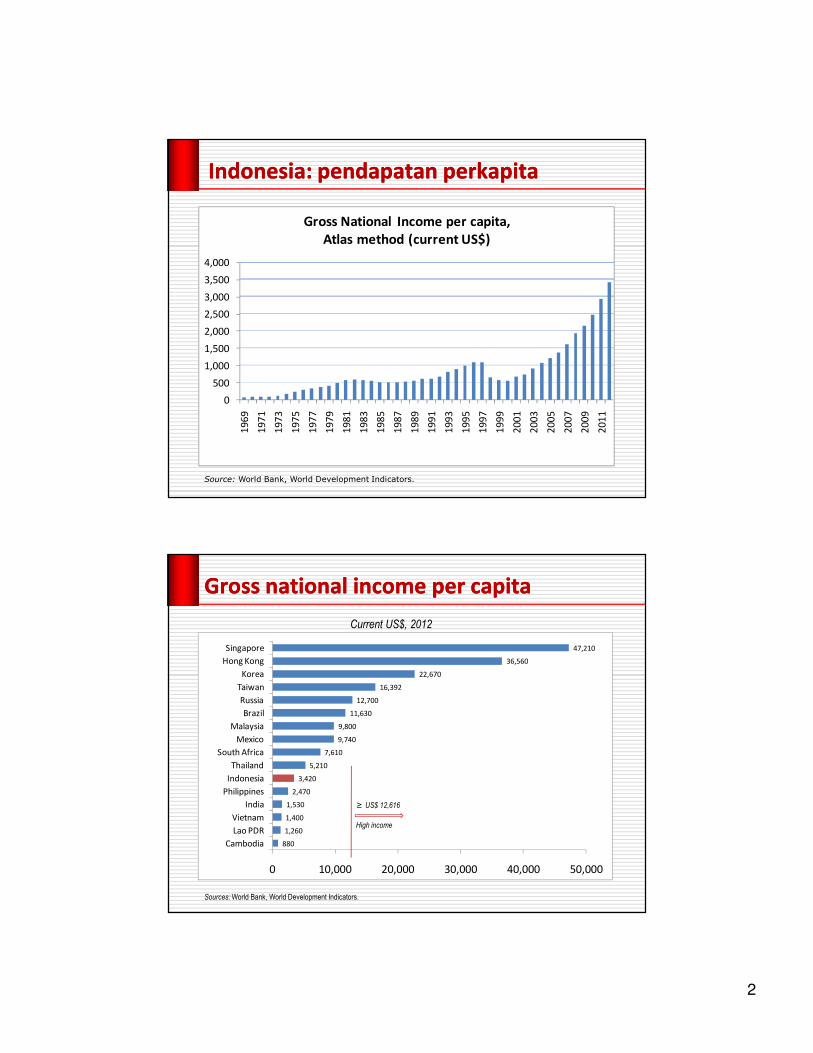
Source: World Bank, World Development Indicators.
Indonesia: Indonesia: pendapatanpendapatan perkapitaperkapita
0
500
1,000
1,500
2,000
2,500
3,000
3,500
4,000
19
69
19
71
19
73
19
75
19
77
19
79
19
81
19
83
19
85
19
87
19
89
19
91
19
93
19
95
19
97
19
99
20
01
20
03
20
05
20
07
20
09
20
11
Gross National Income per capita,
Atlas method (current US$)
Gross national income per capitaGross national income per capita
880
1,260
1,400
1,530
2,470
3,420
5,210
7,610
9,740
9,800
11,630
12,700
16,392
22,670
36,560
47,210
0 10,000 20,000 30,000 40,000 50,000
Cambodia
Lao PDR
Vietnam
India
Philippines
Indonesia
Thailand
South Africa
Mexico
Malaysia
Brazil
Russia
Taiwan
Korea
Hong Kong
Singapore
Sources: World Bank, World Development Indicators.
High income
Current US$, 2012
≥ US$ 12,616
3
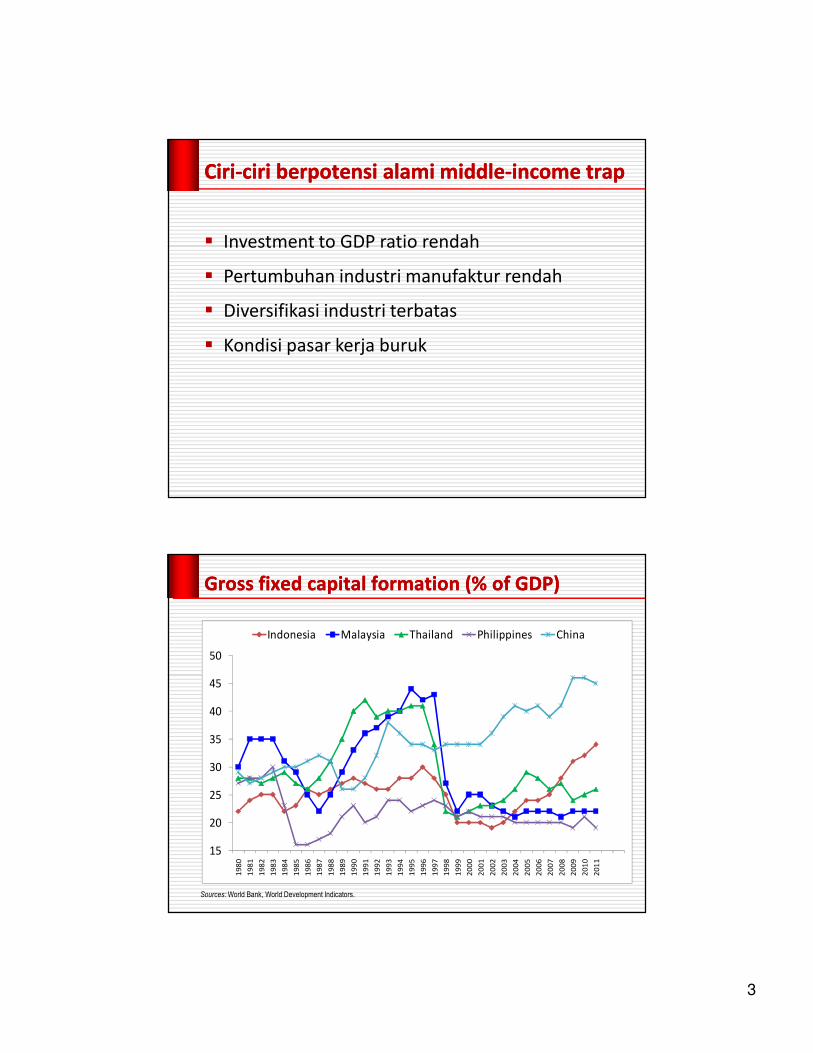
CiriCiri--ciriciri berpotensiberpotensi alamialami middlemiddle--income trapincome trap
� Investment to GDP ratio rendah
� Pertumbuhan industri manufaktur rendah
� Diversifikasi industri terbatas
� Kondisi pasar kerja buruk
Gross fixed capital formation (% of GDP)Gross fixed capital formation (% of GDP)
15
20
25
30
35
40
45
50
19
80
19
81
19
82
19
83
19
84
19
85
19
86
19
87
19
88
19
89
19
90
19
91
19
92
19
93
19
94
19
95
19
96
19
97
19
98
19
99
20
00
20
01
20
02
20
03
20
04
20
05
20
06
20
07
20
08
20
09
20
10
20
11
Indonesia Malaysia Thailand Philippines China
Sources: World Bank, World Development Indicators.
4
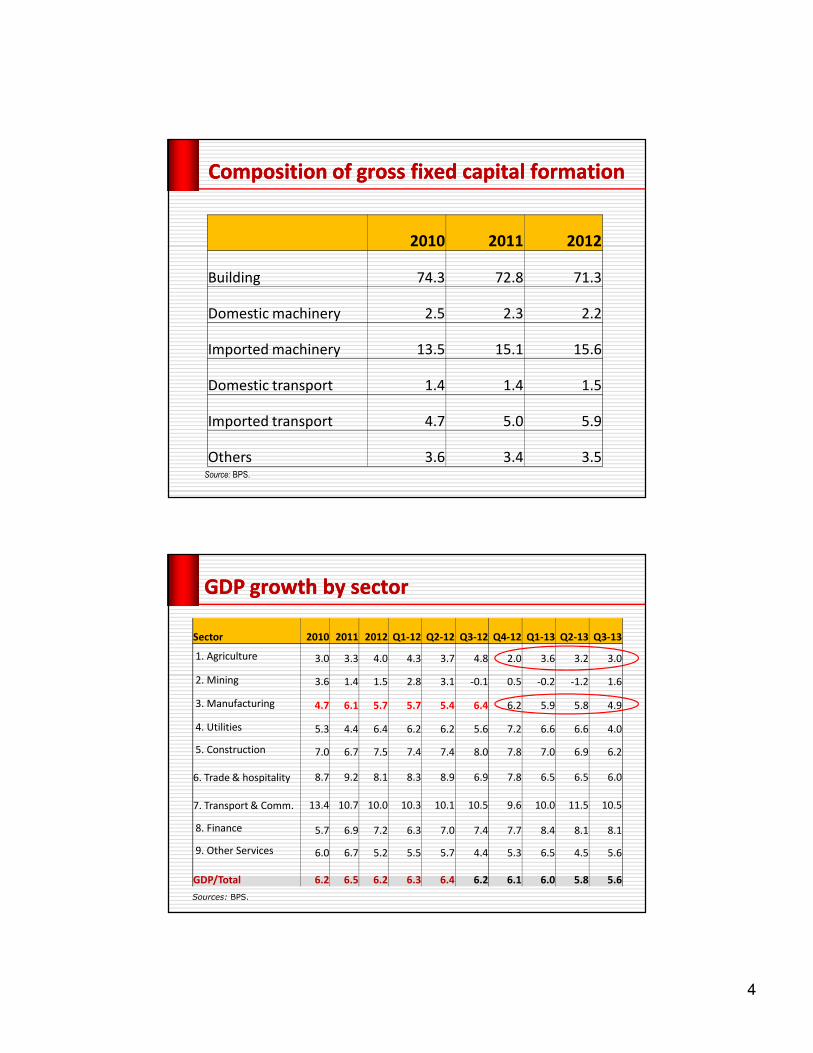
Composition of gross fixed capital formationComposition of gross fixed capital formation
Source: BPS.
2010 2011 2012
Building 74.3 72.8 71.3
Domestic machinery 2.5 2.3 2.2
Imported machinery 13.5 15.1 15.6
Domestic transport 1.4 1.4 1.5
Imported transport 4.7 5.0 5.9
Others 3.6 3.4 3.5
Sector 2010 2011 2012 Q1-12 Q2-12 Q3-12 Q4-12 Q1-13 Q2-13 Q3-13
1. Agriculture 3.0 3.3 4.0 4.3 3.7 4.8 2.0 3.6 3.2 3.0
2. Mining 3.6 1.4 1.5 2.8 3.1 -0.1 0.5 -0.2 -1.2 1.6
3. Manufacturing 4.7 6.1 5.7 5.7 5.4 6.4 6.2 5.9 5.8 4.9
4. Utilities 5.3 4.4 6.4 6.2 6.2 5.6 7.2 6.6 6.6 4.0
5. Construction 7.0 6.7 7.5 7.4 7.4 8.0 7.8 7.0 6.9 6.2
6. Trade & hospitality 8.7 9.2 8.1 8.3 8.9 6.9 7.8 6.5 6.5 6.0
7. Transport & Comm. 13.4 10.7 10.0 10.3 10.1 10.5 9.6 10.0 11.5 10.5
8. Finance 5.7 6.9 7.2 6.3 7.0 7.4 7.7 8.4 8.1 8.1
9. Other Services 6.0 6.7 5.2 5.5 5.7 4.4 5.3 6.5 4.5 5.6
GDP/Total 6.2 6.5 6.2 6.3 6.4 6.2 6.1 6.0 5.8 5.6
Sources: BPS.
GDP growth by sectorGDP growth by sector
5
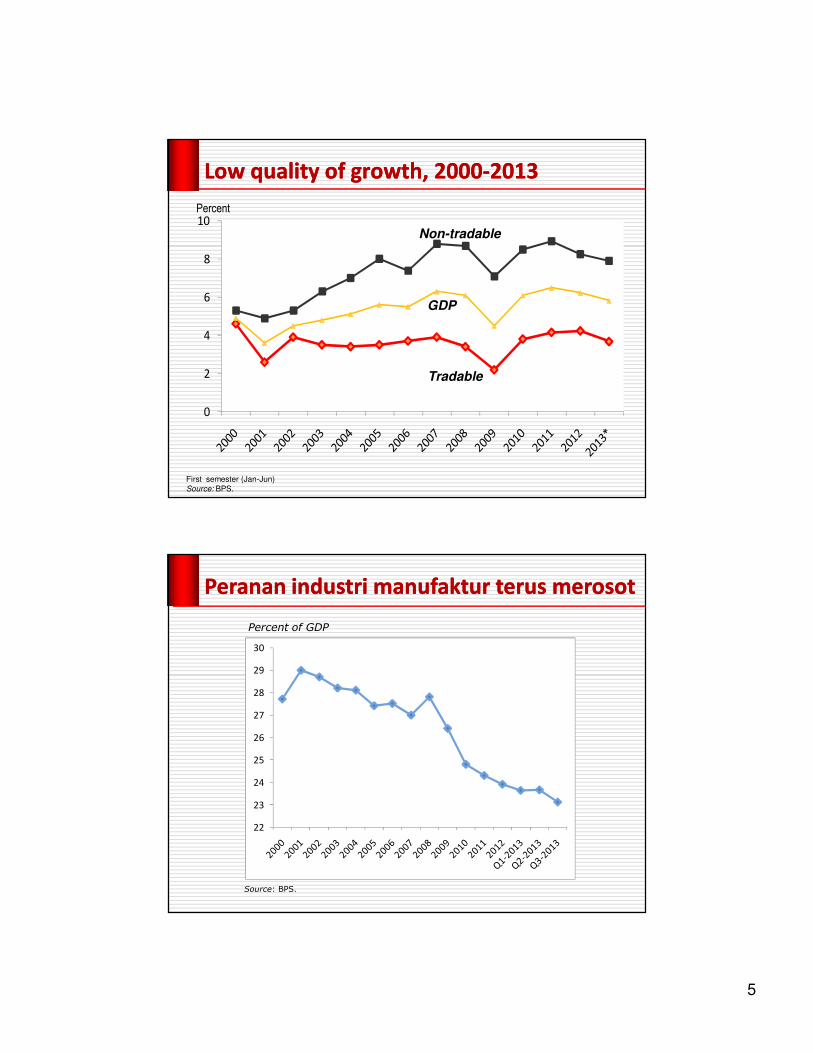
0
2
4
6
8
10
First semester (Jan-Jun)
Source: BPS.
Non-tradable
GDP
Tradable
Low quality of growth, 2000Low quality of growth, 2000--20132013
Percent
Source: BPS.
PerananPeranan industriindustri manufakturmanufaktur terusterus merosotmerosot
22
23
24
25
26
27
28
29
30
Percent of GDP
6
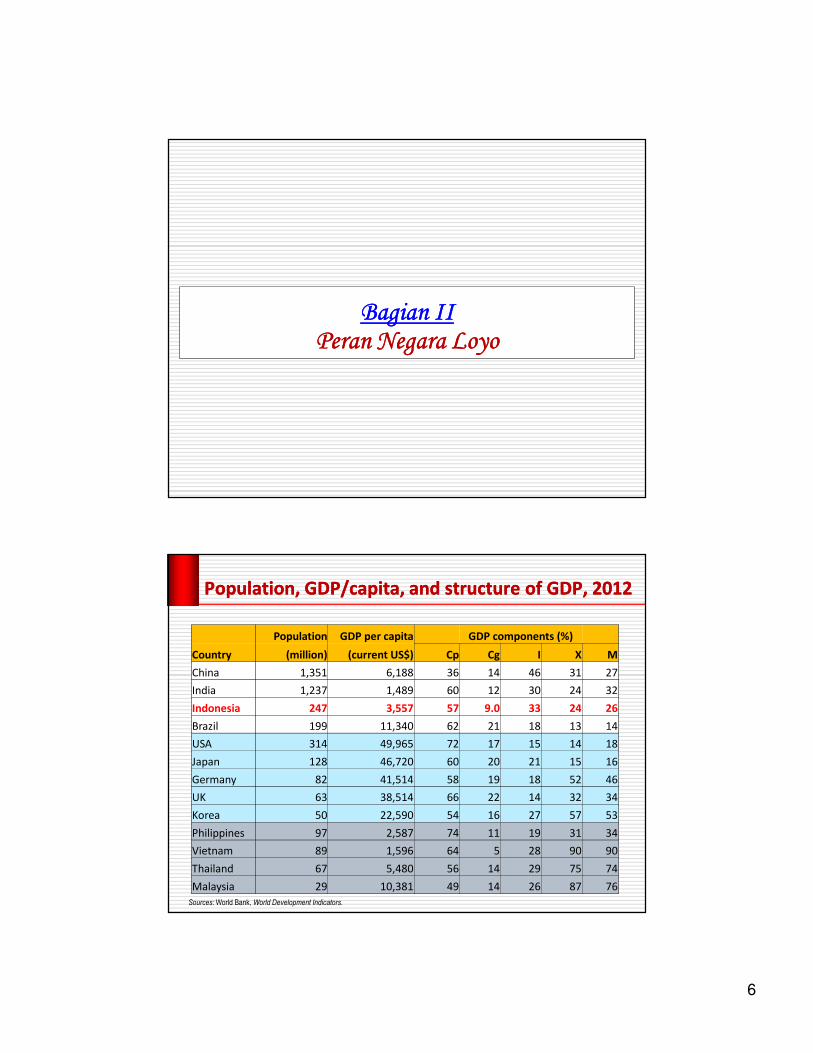
BagianBagian IIIIPeranPeran Negara Negara LoyoLoyo
Population, GDP/capita, and structure of GDP, 2012Population, GDP/capita, and structure of GDP, 2012
Sources: World Bank, World Development Indicators.
Population GDP per capita GDP components (%)
Country (million) (current US$) Cp Cg I X M
China 1,351 6,188 36 14 46 31 27
India 1,237 1,489 60 12 30 24 32
Indonesia 247 3,557 57 9.0 33 24 26
Brazil 199 11,340 62 21 18 13 14
USA 314 49,965 72 17 15 14 18
Japan 128 46,720 60 20 21 15 16
Germany 82 41,514 58 19 18 52 46
UK 63 38,514 66 22 14 32 34
Korea 50 22,590 54 16 27 57 53
Philippines 97 2,587 74 11 19 31 34
Vietnam 89 1,596 64 5 28 90 90
Thailand 67 5,480 56 14 29 75 74
Malaysia 29 10,381 49 14 26 87 76
7
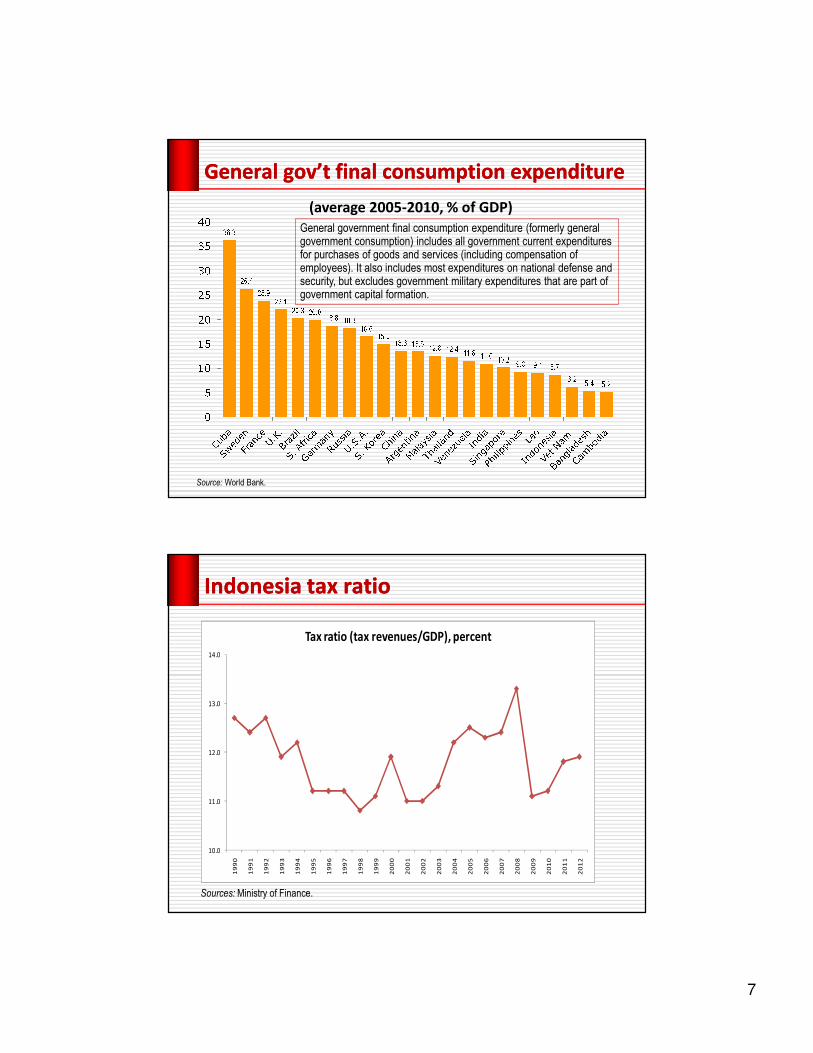
(average 2005-2010, % of GDP)
General General gov’tgov’t final consumption expenditurefinal consumption expenditure
Source: World Bank.
General government final consumption expenditure (formerly general government consumption) includes all government current expenditures for purchases of goods and services (including compensation of employees). It also includes most expenditures on national defense and security, but excludes government military expenditures that are part of government capital formation.
Indonesia tax ratioIndonesia tax ratio
Sources: Ministry of Finance.
10.0
11.0
12.0
13.0
14.0
19
90
19
91
19
92
19
93
19
94
19
95
19
96
19
97
19
98
19
99
20
00
20
01
20
02
20
03
20
04
20
05
20
06
20
07
20
08
20
09
20
10
20
11
20
12
Tax ratio (tax revenues/GDP), percent
8
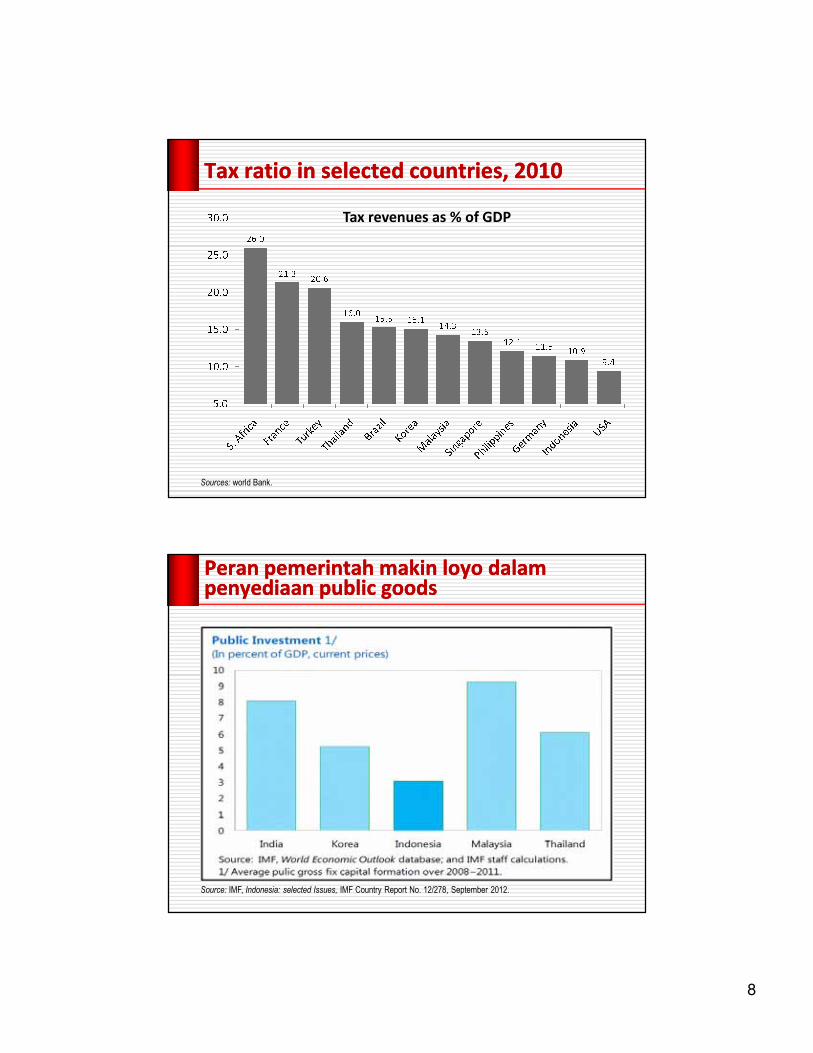
Tax ratio in selected countries, 2010Tax ratio in selected countries, 2010
Sources: world Bank.
Tax revenues as % of GDP
PeranPeran pemerintahpemerintah makinmakin loyoloyo dalamdalampenyediaanpenyediaan public goodspublic goods
Source: IMF, Indonesia: selected Issues, IMF Country Report No. 12/278, September 2012.
9
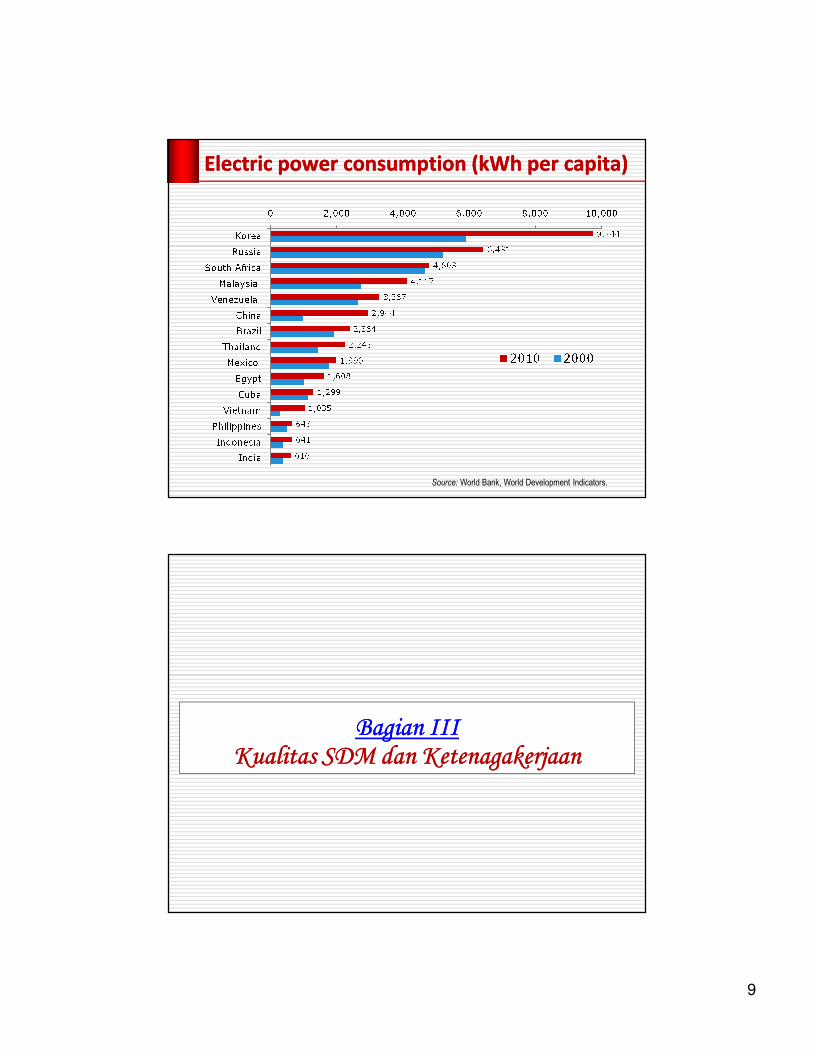
Source: World Bank, World Development Indicators.
Electric power consumption (kWh per capita)Electric power consumption (kWh per capita)
BagianBagian IIIIIIKualitasKualitas SDM SDM dandan KetenagakerjaanKetenagakerjaan
10
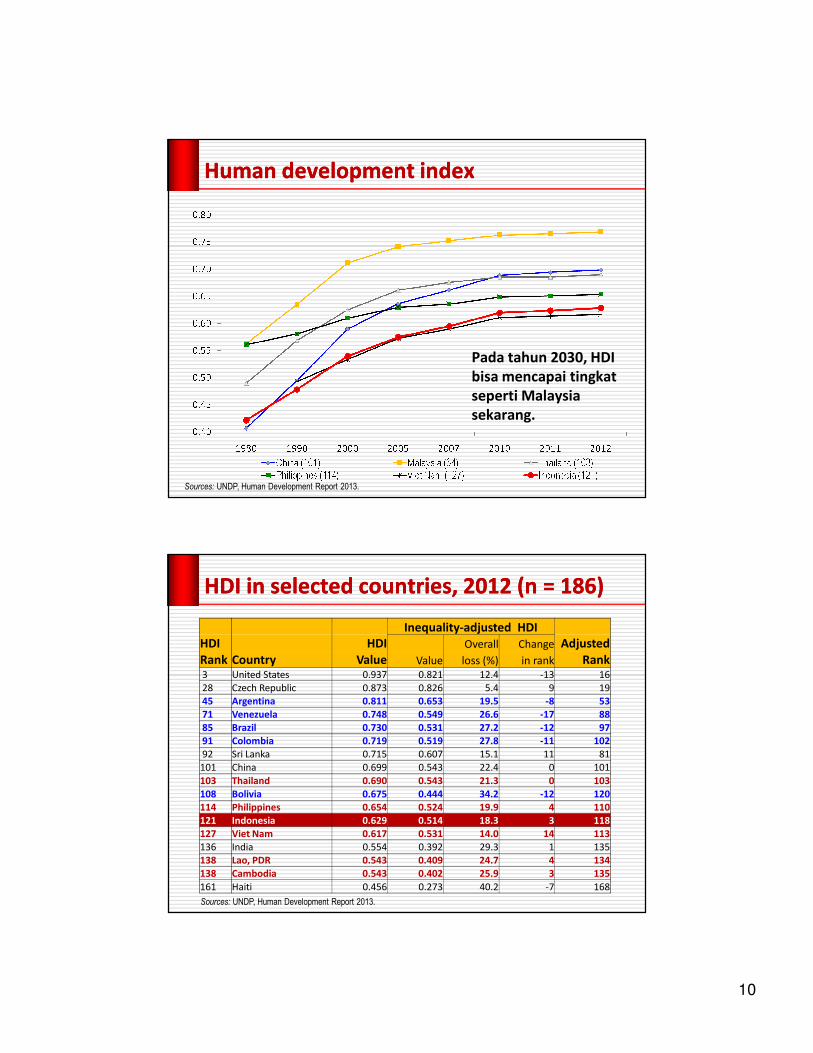
Human development indexHuman development index
Sources: UNDP, Human Development Report 2013.
Pada tahun 2030, HDI
bisa mencapai tingkat
seperti Malaysia
sekarang.
HDI in selected countries, 2012 (n = 186)HDI in selected countries, 2012 (n = 186)
Sources: UNDP, Human Development Report 2013.
HDI HDI Overall Change Adjusted
Rank Country Value Value loss (%) in rank Rank3 United States 0.937 0.821 12.4 -13 16
28 Czech Republic 0.873 0.826 5.4 9 19
45 Argentina 0.811 0.653 19.5 -8 53
71 Venezuela 0.748 0.549 26.6 -17 88
85 Brazil 0.730 0.531 27.2 -12 97
91 Colombia 0.719 0.519 27.8 -11 102
92 Sri Lanka 0.715 0.607 15.1 11 81
101 China 0.699 0.543 22.4 0 101
103 Thailand 0.690 0.543 21.3 0 103
108 Bolivia 0.675 0.444 34.2 -12 120
114 Philippines 0.654 0.524 19.9 4 110
121 Indonesia 0.629 0.514 18.3 3 118
127 Viet Nam 0.617 0.531 14.0 14 113
136 India 0.554 0.392 29.3 1 135
138 Lao, PDR 0.543 0.409 24.7 4 134
138 Cambodia 0.543 0.402 25.9 3 135
161 Haiti 0.456 0.273 40.2 -7 168
Inequality-adjusted HDI
11
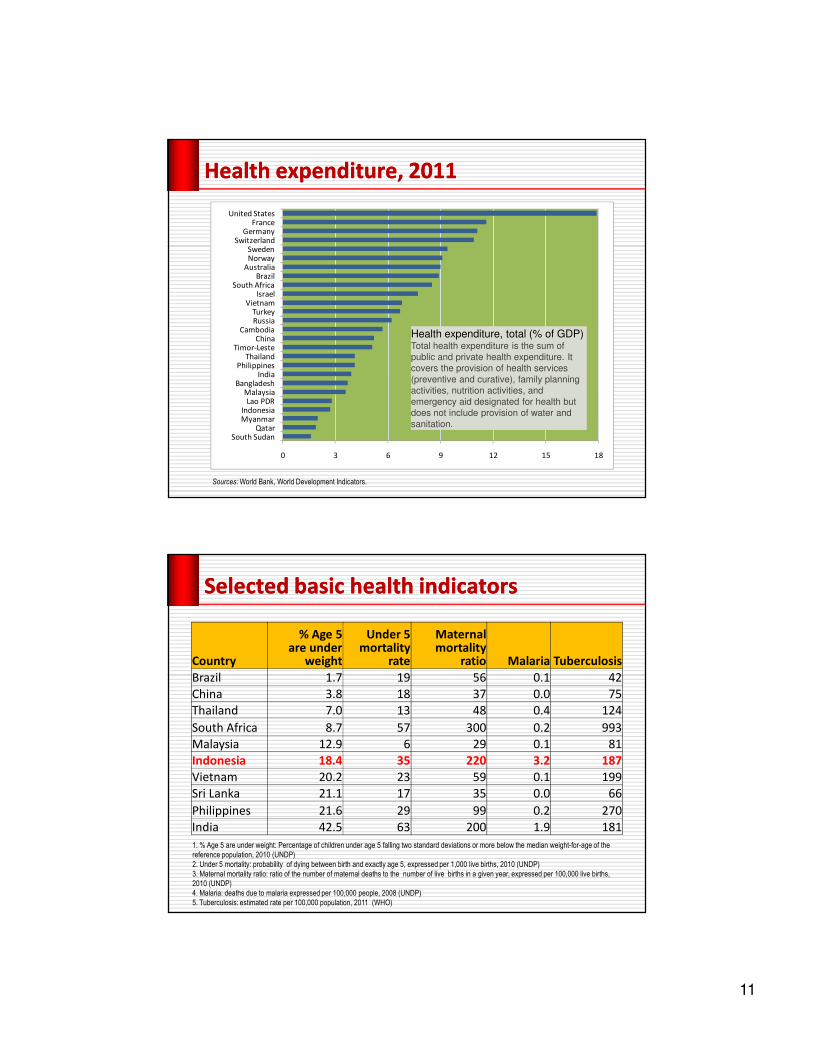
Health expenditure, 2011Health expenditure, 2011
0 3 6 9 12 15 18
South SudanQatar
MyanmarIndonesia
Lao PDRMalaysia
BangladeshIndia
PhilippinesThailand
Timor-LesteChina
CambodiaRussiaTurkey
VietnamIsrael
South AfricaBrazil
AustraliaNorwaySweden
SwitzerlandGermany
FranceUnited States
Health expenditure, total (% of GDP)Total health expenditure is the sum of
public and private health expenditure. It
covers the provision of health services
(preventive and curative), family planning
activities, nutrition activities, and
emergency aid designated for health but
does not include provision of water and
sanitation.
Sources: World Bank, World Development Indicators.
Selected basic health indicatorsSelected basic health indicators
1. % Age 5 are under weight: Percentage of children under age 5 falling two standard deviations or more below the median weight-for-age of the
reference population, 2010 (UNDP)
2. Under 5 mortality: probability of dying between birth and exactly age 5, expressed per 1,000 live births, 2010 (UNDP)
3. Maternal mortality ratio: ratio of the number of maternal deaths to the number of live births in a given year, expressed per 100,000 live births,
2010 (UNDP)
4. Malaria: deaths due to malaria expressed per 100,000 people, 2008 (UNDP)
5. Tuberculosis: estimated rate per 100,000 population, 2011 (WHO)
Country
% Age 5are under
weight
Under 5 mortality
rate
Maternal mortality
ratio Malaria Tuberculosis
Brazil 1.7 19 56 0.1 42
China 3.8 18 37 0.0 75
Thailand 7.0 13 48 0.4 124
South Africa 8.7 57 300 0.2 993
Malaysia 12.9 6 29 0.1 81
Indonesia 18.4 35 220 3.2 187
Vietnam 20.2 23 59 0.1 199
Sri Lanka 21.1 17 35 0.0 66
Philippines 21.6 29 99 0.2 270
India 42.5 63 200 1.9 181

12
23
Sumber: BPS.
PekerjaPekerja dandan penganggurpenganggur menurutmenurut pendidikanpendidikan
Agustus 2011
13
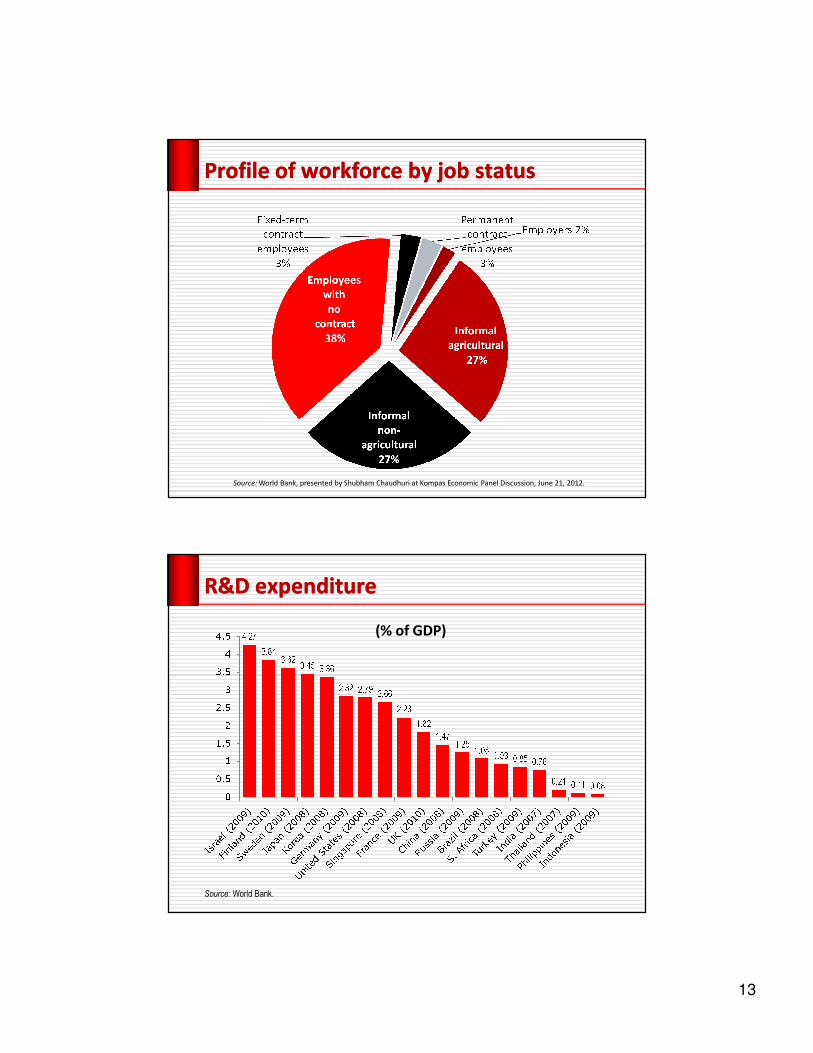
Profile of workforce by job statusProfile of workforce by job status
Source: World Bank, presented by Shubham Chaudhuri at Kompas Economic Panel Discussion, June 21, 2012.
(% of GDP)
R&D expenditureR&D expenditure
Source: World Bank.

14
Glo
ba
l inn
ov
atio
n in
de
x 20
12
(n=
14
1)
Glo
ba
l inn
ov
atio
n in
de
x 20
12
(n=
14
1)
Source: IN
SE
AD
,The G
lobal Innovation Index 2012.
68.2
64.8
63.5
61.8
61.2
60.5
59.9
58.7
58.7
57.7
56.4
56.2
56.0
53.9
51.7
45.9
45.4
44.4
41.1
39.5
39.3
37.9
37.7
37.4
36.9
36.6
35.7
33.9
29.0
28.1
16.8
Switzerland (1)
Sweden (2)
Singapore (3)
Finland (4)
UK (5)
Netherlands (6)
Denmark (7)
Hong Kong (8)
Ireland (9)
USA (10)
Norway (14)
Germany (15)
Israel (17)
Korea (21)
Japan (25)
Malaysia (32)
China (34)
UAE (37)
Bahrain (41)
Oman (47)
Saudi Arabia (48)
Russian Federation …
Brunei Darussalam …
South Africa (54)
Thailand (57)
Brazil (58)
India (64)
Viet Nam (76)
Philippines (95)
Indonesia (100)
Sudan (141)
Bagian
Bagian
IVIVP
erkuatP
erkuatJantungJantung
Perekonom
ianP
erekonomian

15
Financial inclusion index: Financial inclusion index:
Financial deepeningFinancial deepening
Indonesia has yet to optimize its domestic resourcesIndonesia has yet to optimize its domestic resources
Source: Solana (WEF) based on World Bank dan IMF
16
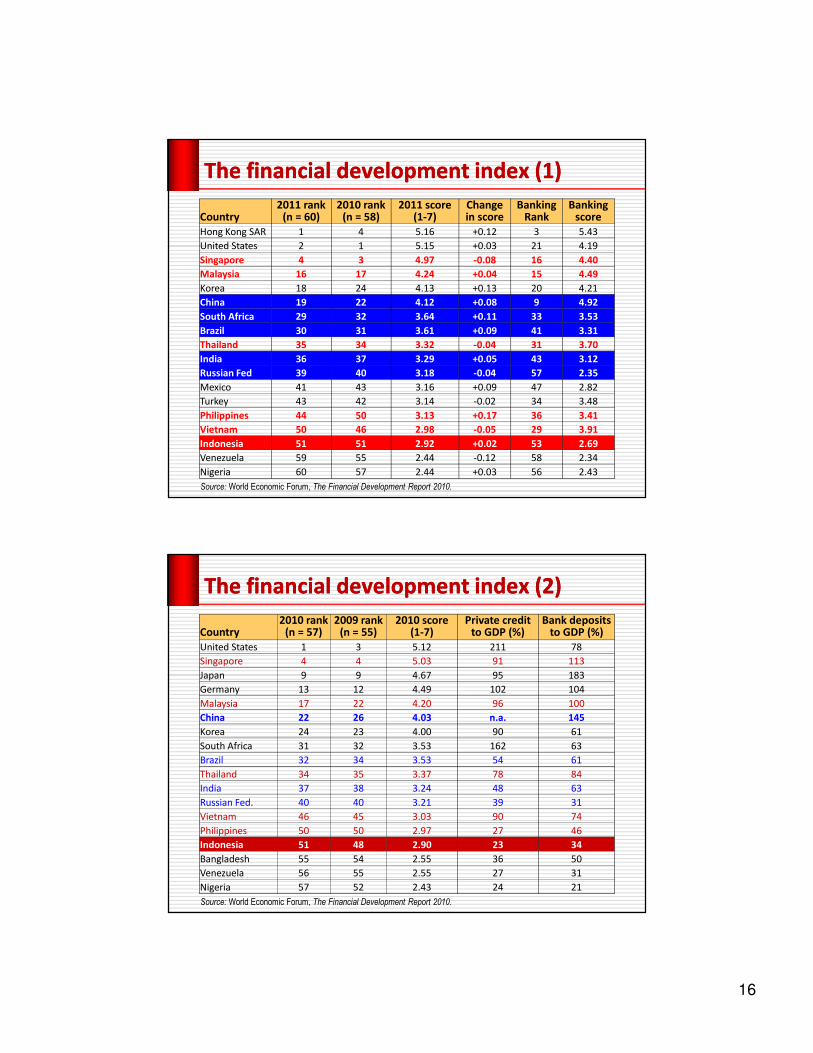
The financial development index (1)The financial development index (1)
Source: World Economic Forum, The Financial Development Report 2010.
Country2011 rank
(n = 60)2010 rank
(n = 58)2011 score
(1-7)Change in score
BankingRank
Banking score
Hong Kong SAR 1 4 5.16 +0.12 3 5.43
United States 2 1 5.15 +0.03 21 4.19
Singapore 4 3 4.97 -0.08 16 4.40
Malaysia 16 17 4.24 +0.04 15 4.49
Korea 18 24 4.13 +0.13 20 4.21
China 19 22 4.12 +0.08 9 4.92
South Africa 29 32 3.64 +0.11 33 3.53
Brazil 30 31 3.61 +0.09 41 3.31
Thailand 35 34 3.32 -0.04 31 3.70
India 36 37 3.29 +0.05 43 3.12
Russian Fed 39 40 3.18 -0.04 57 2.35
Mexico 41 43 3.16 +0.09 47 2.82
Turkey 43 42 3.14 -0.02 34 3.48
Philippines 44 50 3.13 +0.17 36 3.41
Vietnam 50 46 2.98 -0.05 29 3.91
Indonesia 51 51 2.92 +0.02 53 2.69
Venezuela 59 55 2.44 -0.12 58 2.34
Nigeria 60 57 2.44 +0.03 56 2.43
The financial development index (2)The financial development index (2)
Source: World Economic Forum, The Financial Development Report 2010.
Country2010 rank
(n = 57)2009 rank
(n = 55)2010 score
(1-7)Private credit
to GDP (%)Bank deposits
to GDP (%)
United States 1 3 5.12 211 78
Singapore 4 4 5.03 91 113
Japan 9 9 4.67 95 183
Germany 13 12 4.49 102 104
Malaysia 17 22 4.20 96 100
China 22 26 4.03 n.a. 145
Korea 24 23 4.00 90 61
South Africa 31 32 3.53 162 63
Brazil 32 34 3.53 54 61
Thailand 34 35 3.37 78 84
India 37 38 3.24 48 63
Russian Fed. 40 40 3.21 39 31
Vietnam 46 45 3.03 90 74
Philippines 50 50 2.97 27 46
Indonesia 51 48 2.90 23 34
Bangladesh 55 54 2.55 36 50
Venezuela 56 55 2.55 27 31
Nigeria 57 52 2.43 24 21

17
Source: World Bank.
Domestic credit provided by the banking sector includes all credit to various sectors on a
gross basis, with the exception of credit to the central government, which is net. The
banking sector includes monetary authorities and deposit money banks, as well as other
banking institutions where data are available (including institutions that do not accept
transferable deposits but do incur such liabilities as time and savings deposits). Examples
of other banking institutions are savings and mortgage loan institutions and building and
loan associations.
Domestic credit provided by banking sectorDomestic credit provided by banking sector
Source: Asian Development Bank.
Size of local currency bonds market (1)Size of local currency bonds market (1)
200
4962 53 60
40 35 33 3214 11
18
77 43
33 1632
20 13 5
0 2
0
50
100
150
200
250
Government bonds Corporate bonds
% of GDP, June 2013
18
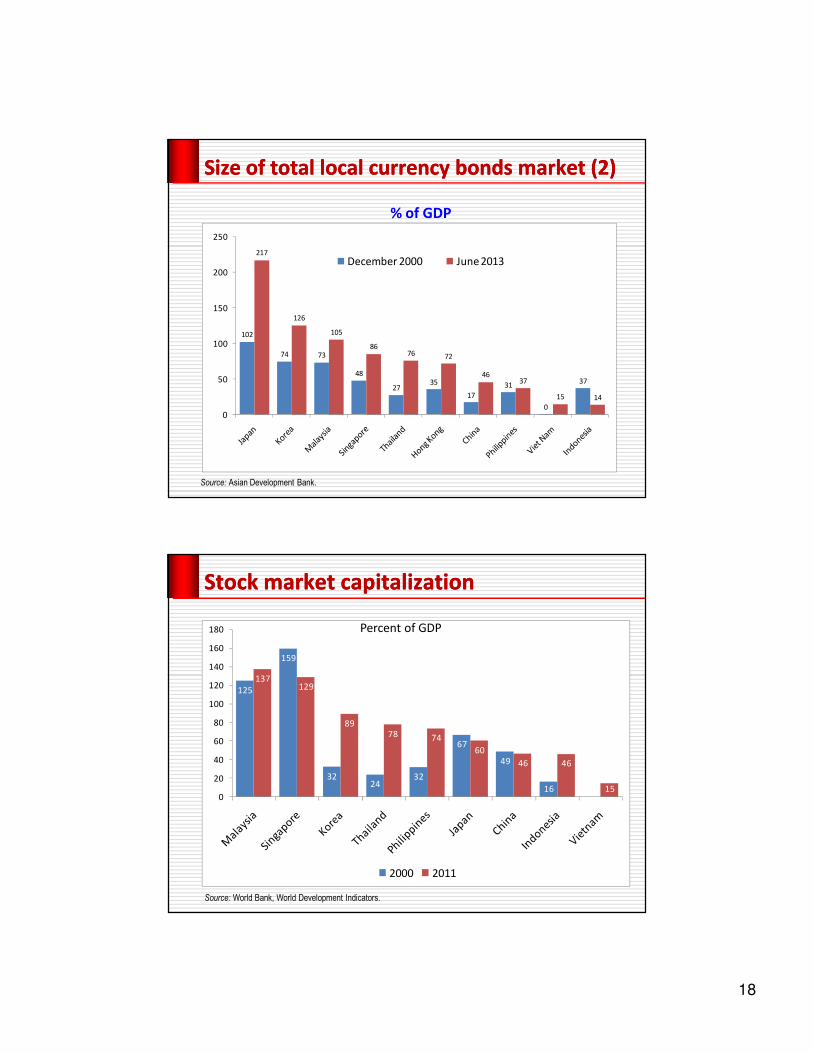
Source: Asian Development Bank.
Size of total local currency bonds market (2)Size of total local currency bonds market (2)
% of GDP
102
74 73
48
2735
17
31
0
37
217
126
105
8676 72
4637
15 14
0
50
100
150
200
250
December 2000 June 2013
Source: World Bank, World Development Indicators.
Stock market capitalizationStock market capitalization
125
159
3224
32
67
49
16
137129
8978 74
60
46 46
150
20
40
60
80
100
120
140
160
180
2000 2011
Percent of GDP
19
BagianBagian VVPerlindunganPerlindungan dandan SistemSistem JaminanJaminan SosialSosial
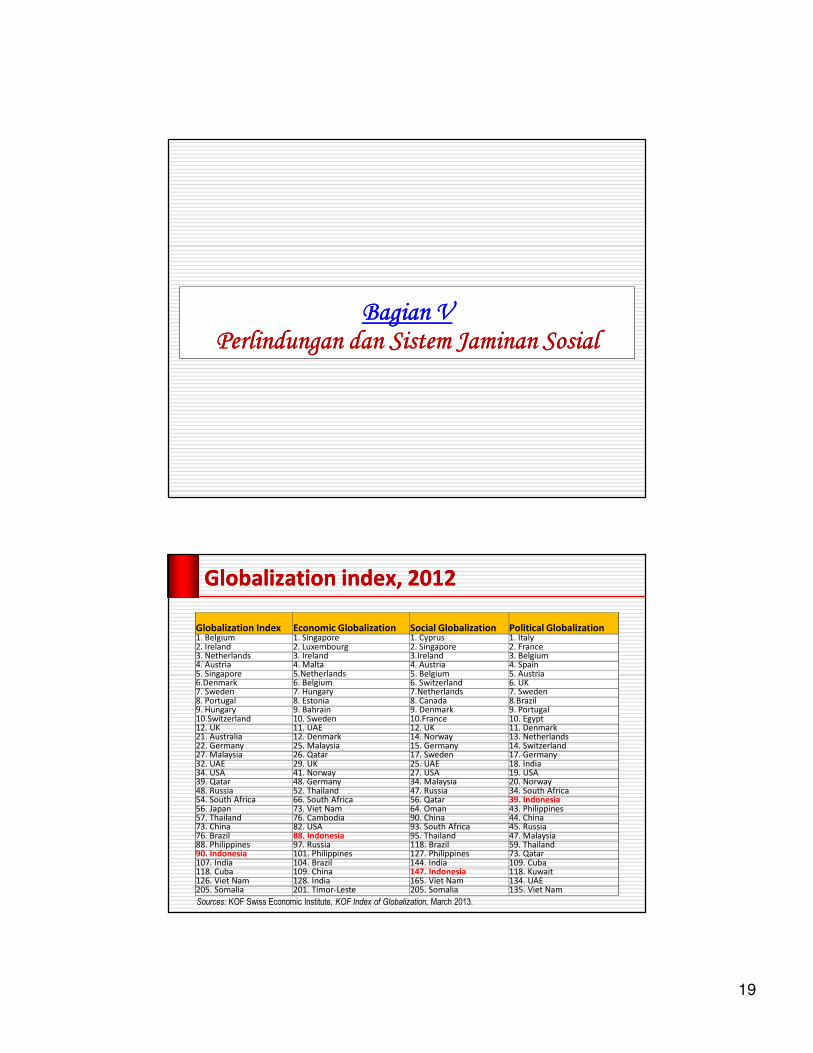
Sources: KOF Swiss Economic Institute, KOF Index of Globalization, March 2013.
Globalization index, 2012Globalization index, 2012
Globalization Index Economic Globalization Social Globalization Political Globalization1. Belgium 1. Singapore 1. Cyprus 1. Italy2. Ireland 2. Luxembourg 2. Singapore 2. France3. Netherlands 3. Ireland 3.Ireland 3. Belgium4. Austria 4. Malta 4. Austria 4. Spain5. Singapore 5.Netherlands 5. Belgium 5. Austria6.Denmark 6. Belgium 6. Switzerland 6. UK7. Sweden 7. Hungary 7.Netherlands 7. Sweden8. Portugal 8. Estonia 8. Canada 8.Brazil9. Hungary 9. Bahrain 9. Denmark 9. Portugal10.Switzerland 10. Sweden 10.France 10. Egypt12. UK 11. UAE 12. UK 11. Denmark21. Australia 12. Denmark 14. Norway 13. Netherlands22. Germany 25. Malaysia 15. Germany 14. Switzerland27. Malaysia 26. Qatar 17. Sweden 17. Germany32. UAE 29. UK 25. UAE 18. India34. USA 41. Norway 27. USA 19. USA39. Qatar 48. Germany 34. Malaysia 20. Norway48. Russia 52. Thailand 47. Russia 34. South Africa54. South Africa 66. South Africa 56. Qatar 39. Indonesia56. Japan 73. Viet Nam 64. Oman 43. Philippines57. Thailand 76. Cambodia 90. China 44. China73. China 82. USA 93. South Africa 45. Russia76. Brazil 88. Indonesia 95. Thailand 47. Malaysia88. Philippines 97. Russia 118. Brazil 59. Thailand90. Indonesia 101. Philippines 127. Philippines 73. Qatar107. India 104. Brazil 144. India 109. Cuba118. Cuba 109. China 147. Indonesia 118. Kuwait126. Viet Nam 128. India 165. Viet Nam 134. UAE205. Somalia 201. Timor-Leste 205. Somalia 135. Viet Nam
20
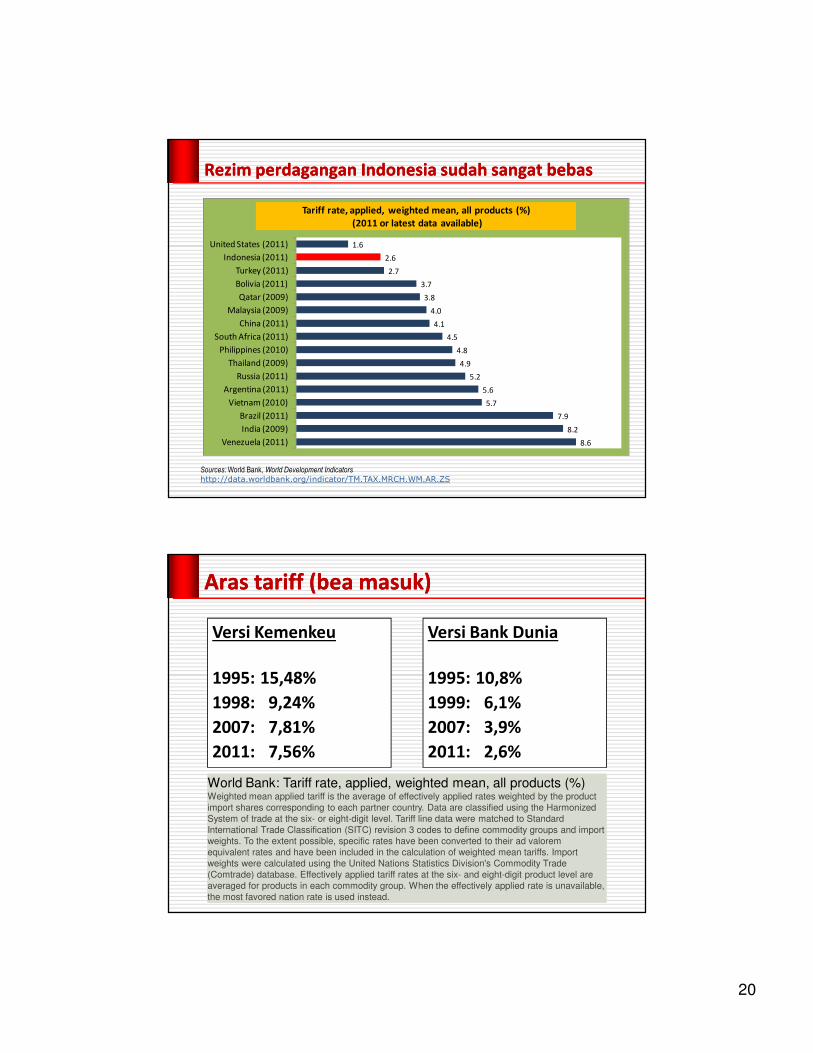
RezimRezim perdaganganperdagangan Indonesia Indonesia sudahsudah sangatsangat bebasbebas
8.6
8.2
7.9
5.7
5.6
5.2
4.9
4.8
4.5
4.1
4.0
3.8
3.7
2.7
2.6
1.6
Venezuela (2011)
India (2009)
Brazil (2011)
Vietnam (2010)
Argentina (2011)
Russia (2011)
Thailand (2009)
Philippines (2010)
South Africa (2011)
China (2011)
Malaysia (2009)
Qatar (2009)
Bolivia (2011)
Turkey (2011)
Indonesia (2011)
United States (2011)
Tariff rate, applied, weighted mean, all products (%)
(2011 or latest data available)
Sources: World Bank, World Development Indicatorshttp://data.worldbank.org/indicator/TM.TAX.MRCH.WM.AR.ZS
Aras tariff (Aras tariff (beabea masukmasuk))
Versi Kemenkeu
1995: 15,48%
1998: 9,24%
2007: 7,81%
2011: 7,56%
Versi Bank Dunia
1995: 10,8%
1999: 6,1%
2007: 3,9%
2011: 2,6%
World Bank: Tariff rate, applied, weighted mean, all products (%)Weighted mean applied tariff is the average of effectively applied rates weighted by the product
import shares corresponding to each partner country. Data are classified using the Harmonized
System of trade at the six- or eight-digit level. Tariff line data were matched to Standard
International Trade Classification (SITC) revision 3 codes to define commodity groups and import
weights. To the extent possible, specific rates have been converted to their ad valorem
equivalent rates and have been included in the calculation of weighted mean tariffs. Import
weights were calculated using the United Nations Statistics Division's Commodity Trade
(Comtrade) database. Effectively applied tariff rates at the six- and eight-digit product level are
averaged for products in each commodity group. When the effectively applied rate is unavailable,
the most favored nation rate is used instead.
21
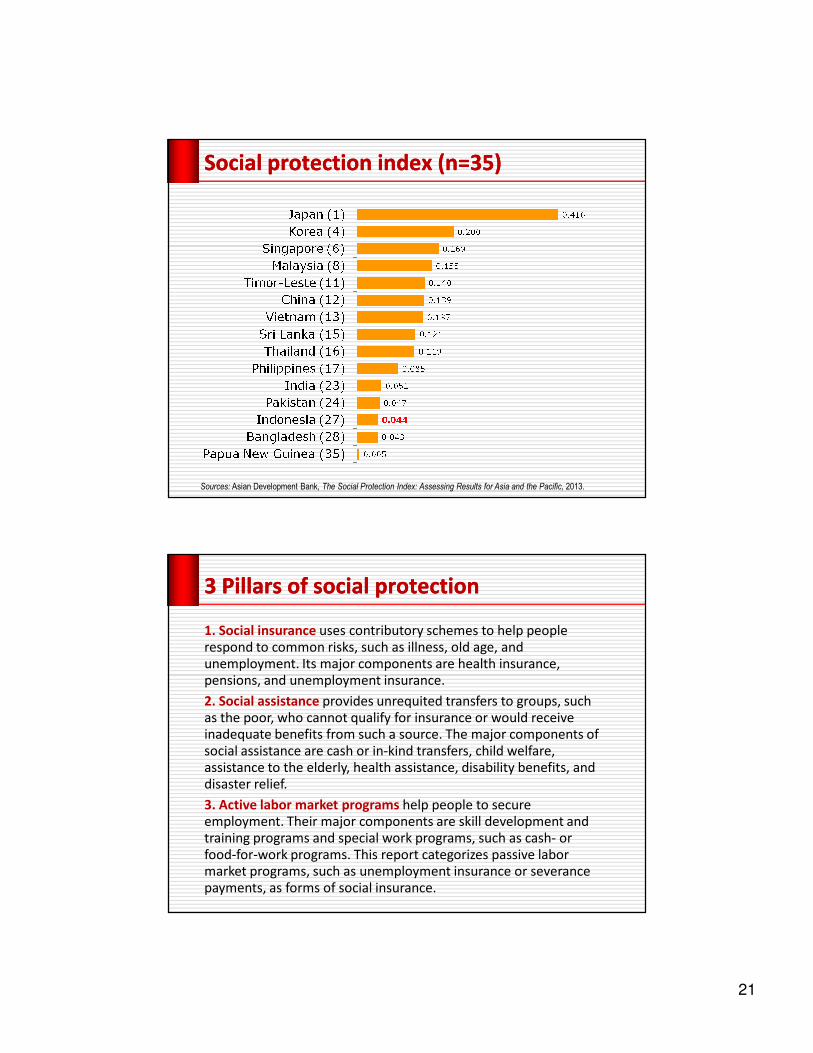
Sources: Asian Development Bank, The Social Protection Index: Assessing Results for Asia and the Pacific, 2013.
Social protection index (n=35)Social protection index (n=35)
3 Pillars of social protection3 Pillars of social protection
1. Social insurance uses contributory schemes to help people
respond to common risks, such as illness, old age, and
unemployment. Its major components are health insurance,
pensions, and unemployment insurance.
2. Social assistance provides unrequited transfers to groups, such
as the poor, who cannot qualify for insurance or would receive
inadequate benefits from such a source. The major components of
social assistance are cash or in-kind transfers, child welfare,
assistance to the elderly, health assistance, disability benefits, and
disaster relief.
3. Active labor market programs help people to secure
employment. Their major components are skill development and
training programs and special work programs, such as cash- or
food-for-work programs. This report categorizes passive labor
market programs, such as unemployment insurance or severance
payments, as forms of social insurance.
22
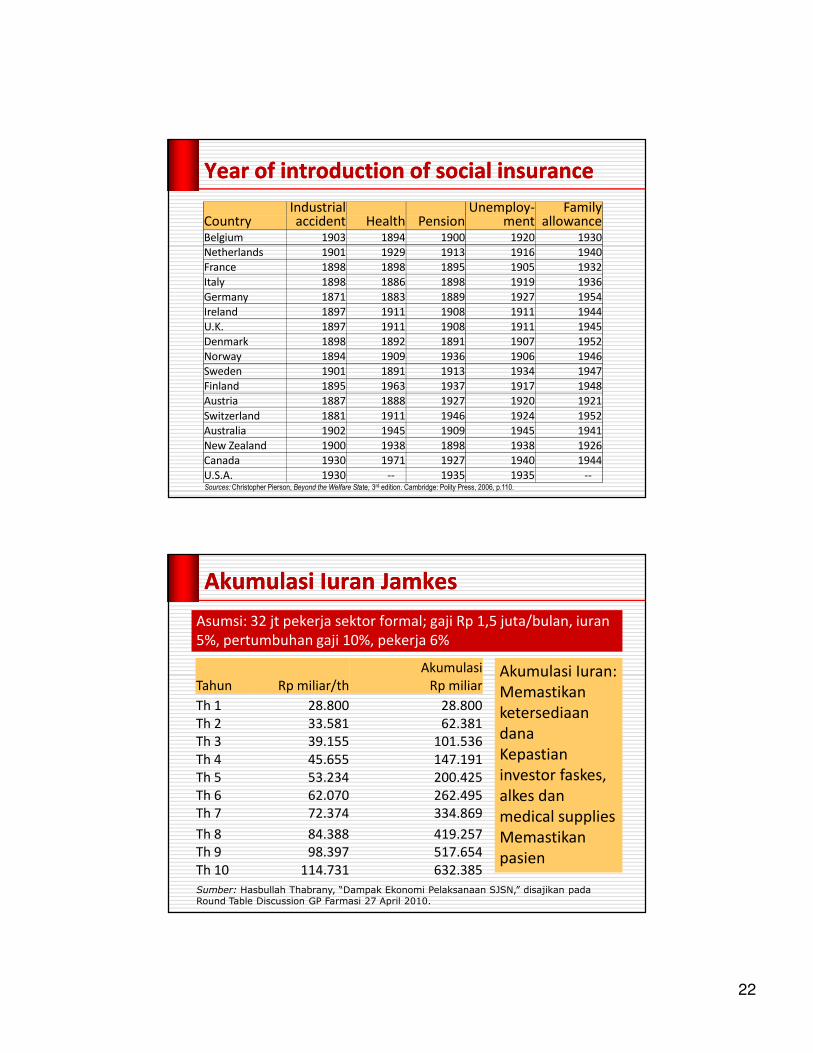
Year of introduction of social insuranceYear of introduction of social insurance
Industrial Unemploy- FamilyCountry accident Health Pension ment allowanceBelgium 1903 1894 1900 1920 1930
Netherlands 1901 1929 1913 1916 1940
France 1898 1898 1895 1905 1932
Italy 1898 1886 1898 1919 1936
Germany 1871 1883 1889 1927 1954
Ireland 1897 1911 1908 1911 1944
U.K. 1897 1911 1908 1911 1945
Denmark 1898 1892 1891 1907 1952
Norway 1894 1909 1936 1906 1946
Sweden 1901 1891 1913 1934 1947
Finland 1895 1963 1937 1917 1948
Austria 1887 1888 1927 1920 1921
Switzerland 1881 1911 1946 1924 1952
Australia 1902 1945 1909 1945 1941
New Zealand 1900 1938 1898 1938 1926
Canada 1930 1971 1927 1940 1944
U.S.A. 1930 -- 1935 1935 --Sources: Christopher Pierson, Beyond the Welfare State, 3rd edition. Cambridge: Polity Press, 2006, p.110.
Asumsi: 32 jt pekerja sektor formal; gaji Rp 1,5 juta/bulan, iuran
5%, pertumbuhan gaji 10%, pekerja 6%
Tahun Rp miliar/th
Akumulasi
Rp miliar
Th 1 28.800 28.800
Th 2 33.581 62.381
Th 3 39.155 101.536
Th 4 45.655 147.191
Th 5 53.234 200.425
Th 6 62.070 262.495
Th 7 72.374 334.869
Th 8 84.388 419.257
Th 9 98.397 517.654
Th 10 114.731 632.385
Akumulasi Iuran:
Memastikan
ketersediaan
dana
Kepastian
investor faskes,
alkes dan
medical supplies
Memastikan
pasien
AkumulasiAkumulasi IuranIuran JamkesJamkes
Sumber: Hasbullah Thabrany, “Dampak Ekonomi Pelaksanaan SJSN,” disajikan pada Round Table Discussion GP Farmasi 27 April 2010.

23
JaminanJaminan harihari tuatua//pensiunpensiun ((iuraniuran 6%)6%)
Jaminan hari
tua/Pensiun
merupakan
sumber dana
investasi
jangka
panjang yang
luar biasa
besar.
Tahun
Iuran/th
Rp miliar
Akumulasi
Rp miliar
Th 1 34.560 34.560
Th 2 40.297 74.857
Th 3 46.986 121.843
Th 4 54.786 176.629
Th 5 63.880 240.509
Th 6 74.485 314.994
Th 7 86.849 401.843
Th 8 101.266 503.109
Th 9 118.076 621.185
Th 10 137.677 758.862
Sumber: Hasbullah Thabrany, “Dampak Ekonomi Pelaksanaan SJSN,” disajikan pada Round Table Discussion GP Farmasi 27 April 2010.
BagianBagian VIVIKembaliKembali keke JatiJati DiriDiri
24
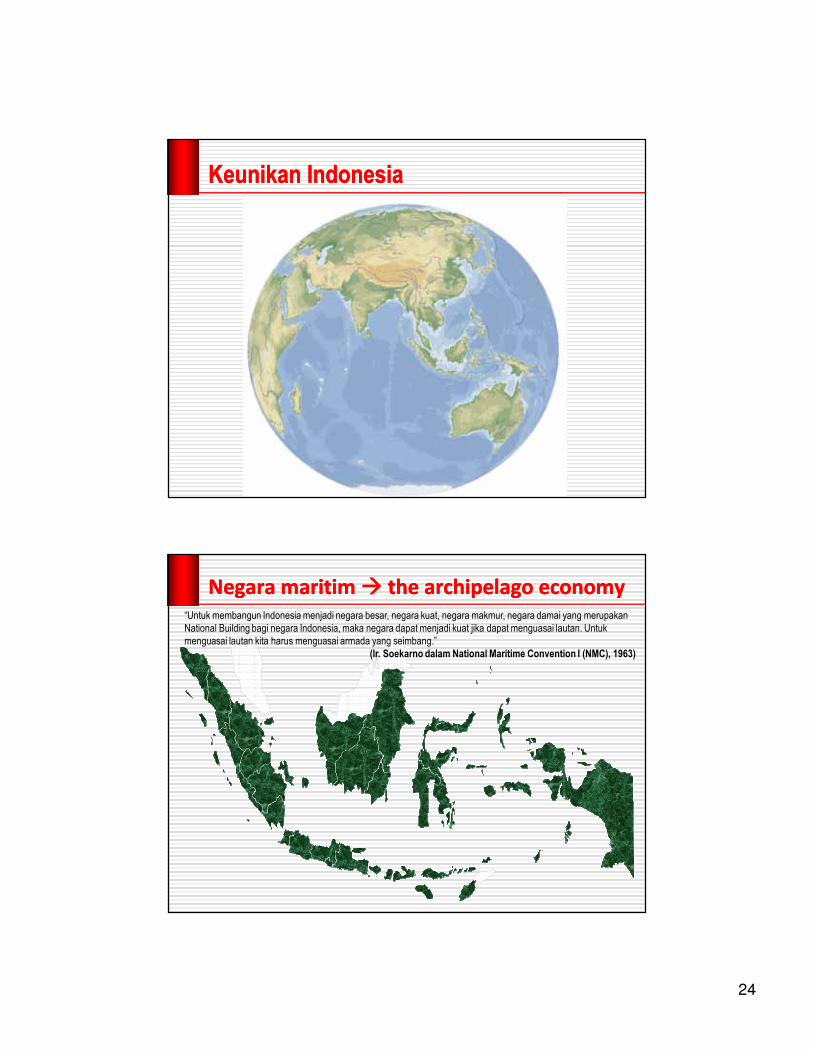
KeunikanKeunikan IndonesiaIndonesia
Negara Negara maritimmaritim �� the archipelago economythe archipelago economy“Untuk membangun Indonesia menjadi negara besar, negara kuat, negara makmur, negara damai yang merupakan
National Building bagi negara Indonesia, maka negara dapat menjadi kuat jika dapat menguasai lautan. Untuk
menguasai lautan kita harus menguasai armada yang seimbang.”
(Ir. Soekarno dalam National Maritime Convention I (NMC), 1963)
25
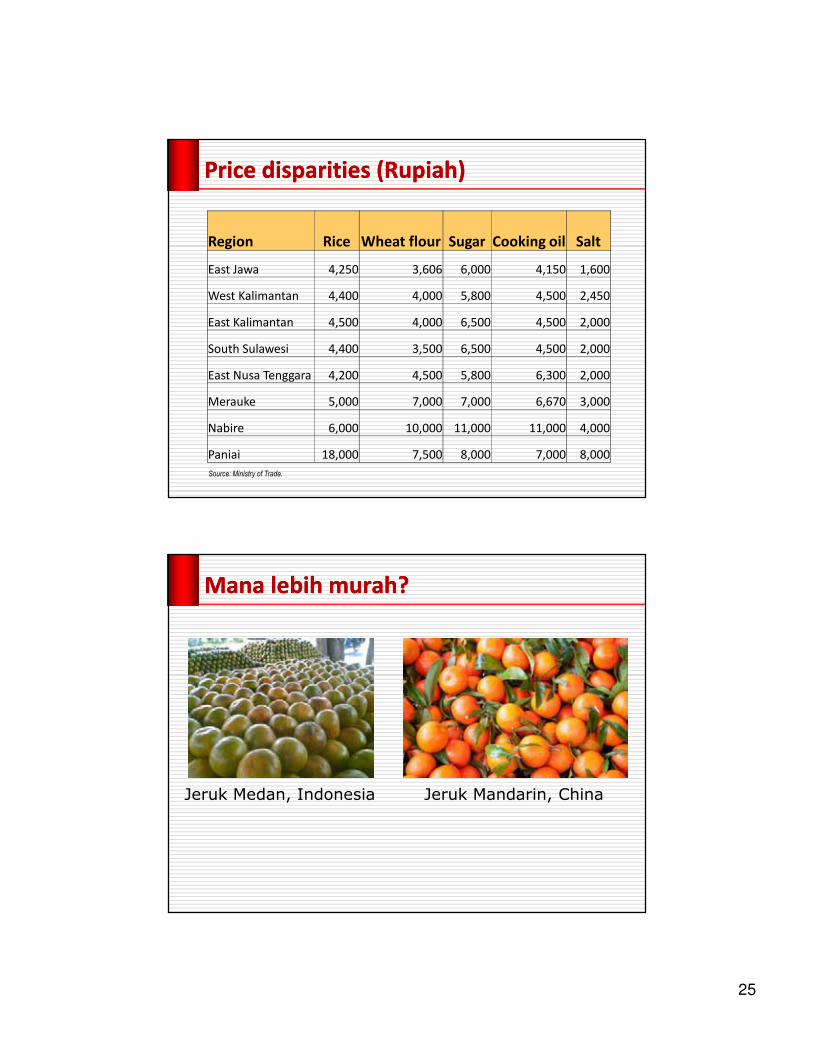
Price disparities (Rupiah)Price disparities (Rupiah)
Region Rice Wheat flour Sugar Cooking oil Salt
East Jawa 4,250 3,606 6,000 4,150 1,600
West Kalimantan 4,400 4,000 5,800 4,500 2,450
East Kalimantan 4,500 4,000 6,500 4,500 2,000
South Sulawesi 4,400 3,500 6,500 4,500 2,000
East Nusa Tenggara 4,200 4,500 5,800 6,300 2,000
Merauke 5,000 7,000 7,000 6,670 3,000
Nabire 6,000 10,000 11,000 11,000 4,000
Paniai 18,000 7,500 8,000 7,000 8,000
Source: Ministry of Trade.
ManaMana lebihlebih murahmurah??
Jeruk Medan, Indonesia Jeruk Mandarin, China

26
Prices of oranges…Prices of oranges…
� Prices were measured in a supermarket in Jakarta
� Jeruk Medan……Rp. 20,000 per kg
� Jeruk China…………..Rp. 17,000 per kg
� WHY IS THIS THE CASE?
This explains why oranges from Medan are This explains why oranges from Medan are more expensive to some extent….more expensive to some extent….

27
Cement in Papua is 20 times more expensive than in Jakarta because of shipping costs
Container Shipment cost:
Padang – Jakarta = US$600 Jakarta – Singapore = US$185
FaktaFakta lain yang lain yang membuatmembuat mirismiris
Source: R.J. Lino’s presentatatiom, March 2011.
JarakJarak ekonomiekonomi makinmakin jauhjauh
Source: R.J. Lino’s presentatatiom, March 2011.

28
The sea unites IndonesiaThe sea unites Indonesia
Logistics performance index, 2012, n=155Logistics performance index, 2012, n=155
Source: World Bank, Logistic Performance Index: LPI Results 2012 (http://lpisurvey.worldbank.org/)
Country
LPI
rank
LPI
score Customs
Infra-
structure
International
shipments
Logistic
competence
Tracking &
tracing
Time-
liness
Singapore 1 4.13 4.10 4.15 3.99 4.07 4.07 4.39
Hong Kong 2 4.12 3.97 4.12 4.18 4.08 4.09 4.28
China 26 3.52 3.25 3.61 3.46 3.47 3.52 3.80
Malaysia 29 3.49 3.28 3.43 3.40 3.45 3.54 3.86
Thailand 38 3.18 2.96 3.08 3.21 2.98 3.18 3.63
Brazil 45 3.13 2.51 3.07 3.12 3.12 3.42 3.55
India 46 3.08 2.77 2.87 2.98 3.14 3.09 3.58
Philippines 52 3.02 2.62 2.80 2.97 3.14 3.30 3.30
Vietnam 53 3.00 2.65 2.68 3.14 2.68 3.16 3.64
Indonesia 59 2.94 2.53 2.54 2.97 2.85 3.12 3.61
Cambodia 101 2.56 2.30 2.20 2.61 2.50 2.77 2.95
Lao, PDR 109 2.50 2.38 2.40 2.40 2.49 2.49 2.82
Myanmar 129 2.37 2.24 2.10 2.47 2.42 2.34 2.59
29
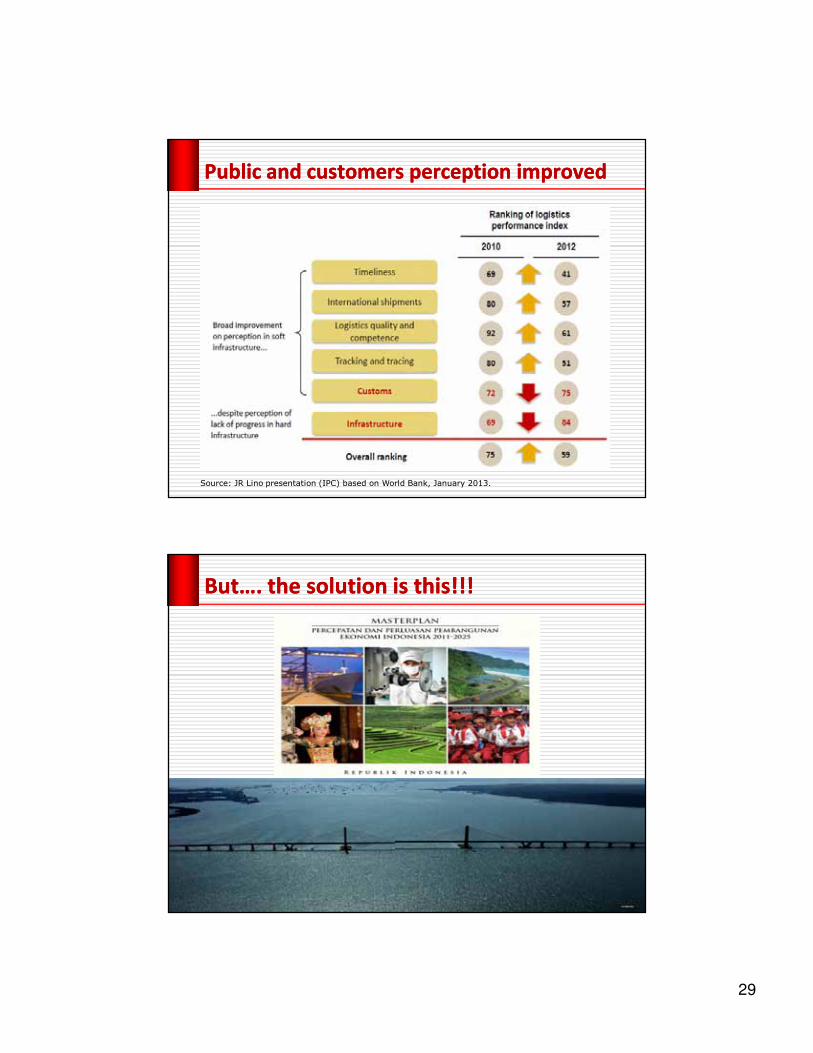
Public and customers perception improvedPublic and customers perception improved
Source: JR Lino presentation (IPC) based on World Bank, January 2013.
But…. the solution is this!!!But…. the solution is this!!!
30
BagianBagian VIIVIIMomentum Momentum AkselerasiAkselerasi
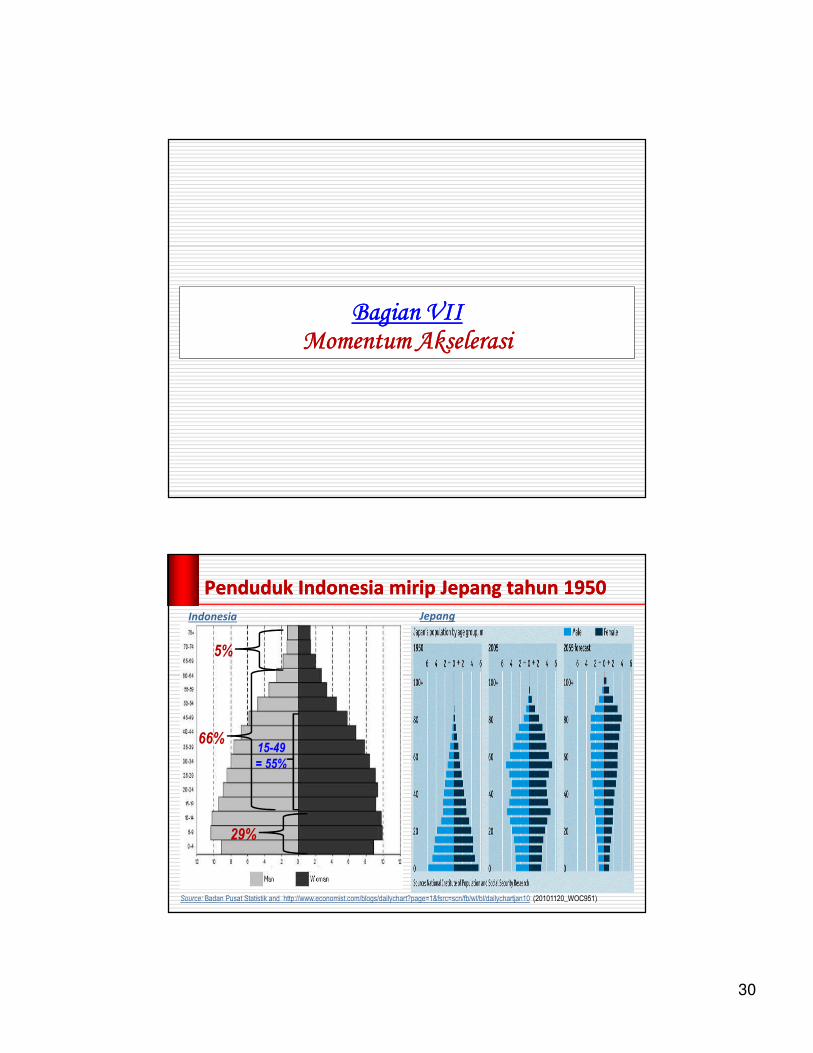
PendudukPenduduk Indonesia Indonesia miripmirip JepangJepang tahuntahun 19501950
Source: Badan Pusat Statistik and http://www.economist.com/blogs/dailychart?page=1&fsrc=scn/fb/wl/bl/dailychartjan10 (20101120_WOC951)
Indonesia Jepang
66%
29%
5%
15-49
= 55%
31
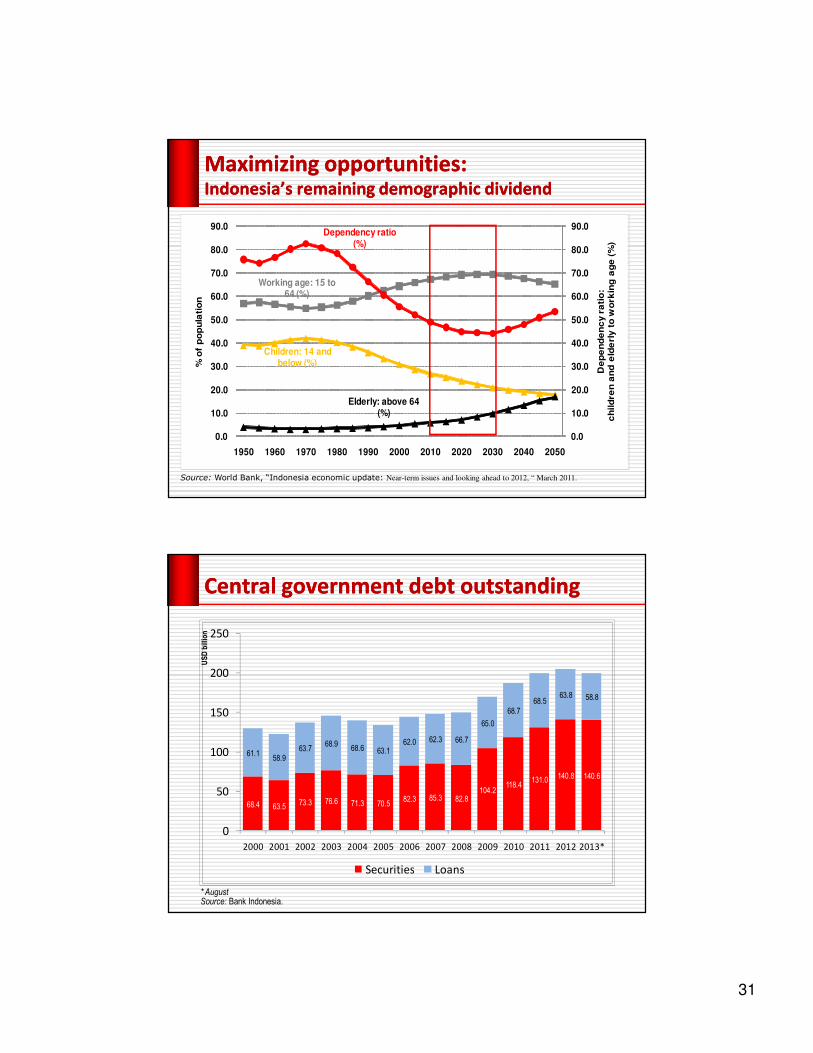
Maximizing opportunities: Maximizing opportunities: Indonesia’s remaining demographic dividendIndonesia’s remaining demographic dividend
Children: 14 and below (%)
Elderly: above 64 (%)
Working age: 15 to 64 (%)
Dependency ratio (%)
0.0
10.0
20.0
30.0
40.0
50.0
60.0
70.0
80.0
90.0
0.0
10.0
20.0
30.0
40.0
50.0
60.0
70.0
80.0
90.0
1950 1960 1970 1980 1990 2000 2010 2020 2030 2040 2050
De
pe
nd
en
cy r
ati
o:
ch
ild
ren
an
d e
lde
rly t
o w
ork
ing
ag
e (
%)
% o
f p
op
ula
tio
n
Source: World Bank, “Indonesia economic update: Near-term issues and looking ahead to 2012, “ March 2011.
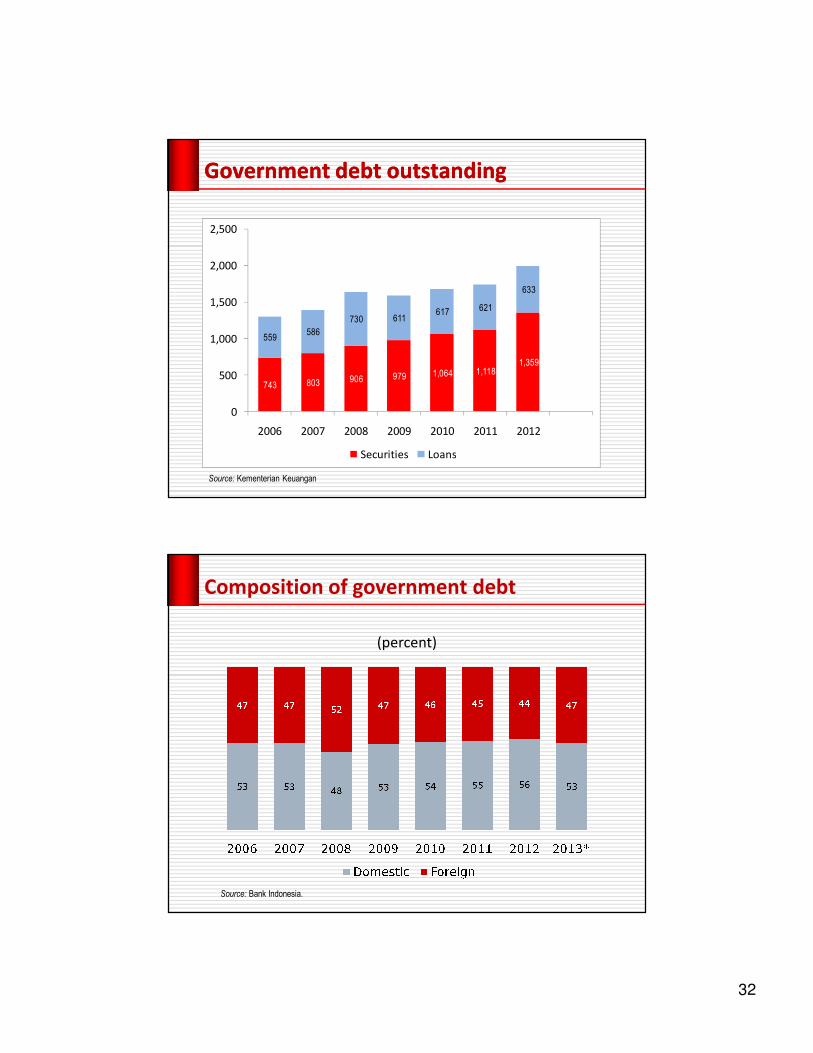
* AugustSource: Bank Indonesia.
Central government debt outstandingCentral government debt outstanding
68.4 63.573.3 76.6 71.3 70.5
82.3 85.3 82.8104.2
118.4131.0
140.8 140.6
61.158.9
63.768.9
68.6 63.162.0 62.3 66.7
65.0
68.7
68.563.8 58.8
0
50
100
150
200
250
2000 2001 2002 2003 2004 2005 2006 2007 2008 2009 2010 2011 2012 2013*
Securities Loans
US
D b
illio
n
32
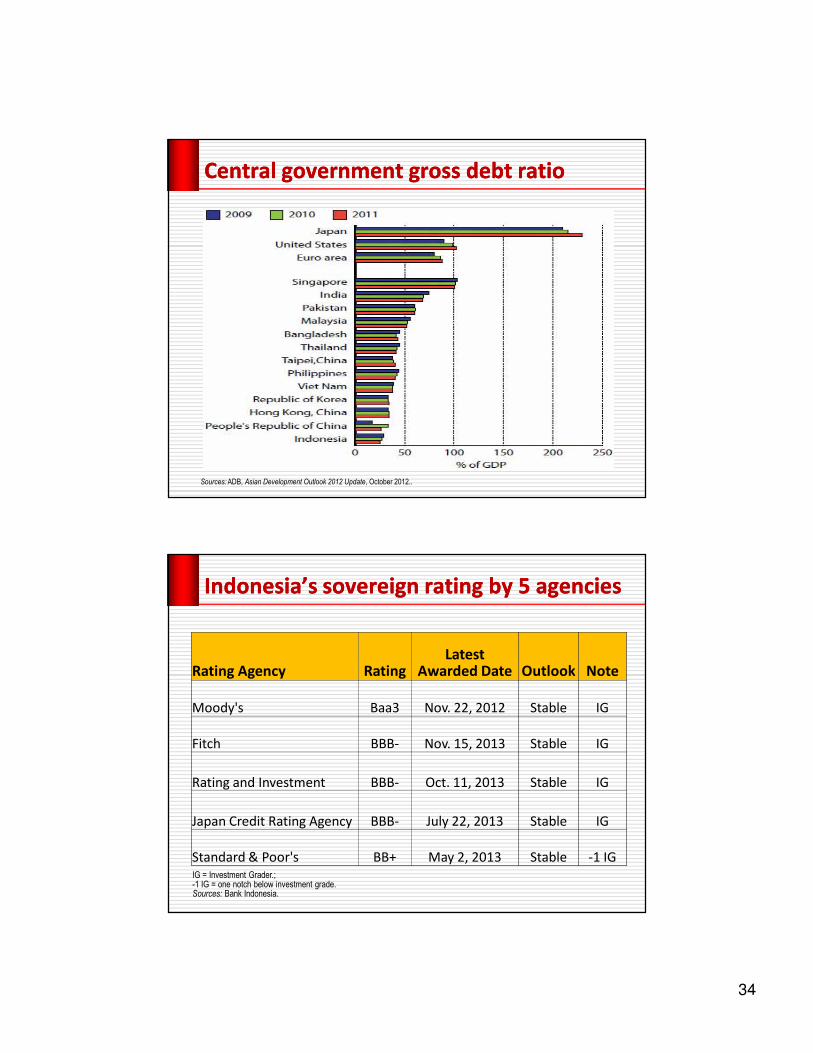
Source: Kementerian Keuangan
Government debt outstandingGovernment debt outstanding
743 803 906 979 1,064 1,1181,359
559586
730 611617 621
633
0
500
1,000
1,500
2,000
2,500
2006 2007 2008 2009 2010 2011 2012
Securities Loans
Source: Bank Indonesia.
Composition of government debt
(percent)

33
Holders of tradable domestic government securities (percent)
Continued increasing proportion of foreign Continued increasing proportion of foreign ownership of government securitiesownership of government securities
Foreign ownership of domestic government securities by maturity (percent)
* October
Source: Bank Indonesia.
* SeptemberSource: World Bank for 1990-2000, and Bank Indonesia and Ministry of Finance for 2001-2012.
41.9
32.3
97.9
77.0
67.461.3
56.4
47.1
39.035.2 33.1
28.4 26.1 24.4 24.0 23.4
0
20
40
60
80
100
120
Government debt to GDP ratioGovernment debt to GDP ratio
percent
34
Central government gross debt ratioCentral government gross debt ratio
Sources: ADB, Asian Development Outlook 2012 Update, October 2012..
Indonesia’s sovereign rating by 5 agenciesIndonesia’s sovereign rating by 5 agencies
IG = Investment Grader.;-1 IG = one notch below investment grade.Sources: Bank Indonesia.
Rating Agency RatingLatest
Awarded Date Outlook Note
Moody's Baa3 Nov. 22, 2012 Stable IG
Fitch BBB- Nov. 15, 2013 Stable IG
Rating and Investment BBB- Oct. 11, 2013 Stable IG
Japan Credit Rating Agency BBB- July 22, 2013 Stable IG
Standard & Poor's BB+ May 2, 2013 Stable -1 IG

35
Terima Kasih
Email: [email protected]: @faisalbasri
Infografis: visuallyconomic.comBlog: kompasiana.com/faisalbasriBlog: faisalbasri01.wordpress.com
PosturPostur pemerintahanpemerintahan
� Tak perlu ada Menko.
� Bappenas jadi westwing
� Likuidasi kementerian: pernanan perempuan, pemuda &
olahraga, kemensos.
� Reposisi kementerian: agama, kominfo, kemenkeu (pajak
dan bea cukai dikeluarkan)
� Kemenlu
Related Documents


![|W ]¶ £1 > 新西蘭牛肉101 - New Zealand Trade Centrenewzealandtradecentre.com/cn/images/2014/01/20131202.pdf鐵質分兩種:血質鐵(來自牛肉、羊肉、 牛羊副產品、豬肉、雞肉和海產)和非血](https://static.cupdf.com/doc/110x72/5fee9e040ead774c5c2f2d99/w-1-eece101-new-zealand-trade-centren-eecieeeiecece.jpg)