Int. J. Reliability and Safety, Vol. 7, No. 3, 2013 235 Copyright © 2013 Inderscience Enterprises Ltd. Reliability prediction of distributed systems using Monte Carlo method Indra Gunawan School of Applied Sciences and Engineering, Monash University, Gippsland Campus, Churchill, VIC 3842, Australia Email: [email protected] Abstract: Distributed systems consist of layers of switching elements connected together in a predefined topology providing the connectivity between the set of processors and the set of memory modules. Reliability prediction is important as it determines the usability and efficiency of the network to provide services. This paper presents reliability analysis of Shuffle-Exchange Network (SEN) systems using Monte Carlo method with stratified sampling. A SEN, a specific type of distributed systems that consists of 2 2 switching elements, has been widely considered a practical interconnection system. Confidence interval of the point estimate is then derived using non-parametric bootstrapping. Keywords: distributed systems; Monte Carlo; reliability; shuffle-exchange network; switching element. Reference to this paper should be made as follows: Gunawan, I. (2013) ‘Reliability prediction of distributed systems using Monte Carlo method’, Int. J. Reliability and Safety, Vol. 7, No. 3, pp.235–248. Biographical notes: Indra Gunawan is a Senior Lecturer and Coordinator of Postgraduate Programes in Maintenance and Reliability Engineering at the School of Applied Sciences and Engineering in Monash University, Australia. He obtained his PhD degree in Industrial Engineering from Northeastern University, USA. His main areas of research are reliability engineering, production and operations management, application of operations research, applied statistics, probability modelling and project management. His work has appeared in many peer-reviewed journals and international conferences. 1 Introduction The demand for even more computing power has never stopped. A number of important problems have been identified in the areas of defence, aerospace, automotive applications, weather forecasting, map making, aerodynamic simulations, chemical reaction simulations, seismic data processing, air traffic control, robot vision and science, whose solution requires tremendous amount of computational power. There are fundamental considerations as speed of computer device reaches a limit and an execution rate required simply beyond

Welcome message from author
This document is posted to help you gain knowledge. Please leave a comment to let me know what you think about it! Share it to your friends and learn new things together.
Transcript

Int. J. Reliability and Safety, Vol. 7, No. 3, 2013 235
Copyright © 2013 Inderscience Enterprises Ltd.
Reliability prediction of distributed systems using Monte Carlo method
Indra Gunawan School of Applied Sciences and Engineering, Monash University, Gippsland Campus, Churchill, VIC 3842, Australia Email: [email protected]
Abstract: Distributed systems consist of layers of switching elements connected together in a predefined topology providing the connectivity between the set of processors and the set of memory modules. Reliability prediction is important as it determines the usability and efficiency of the network to provide services. This paper presents reliability analysis of Shuffle-Exchange Network (SEN) systems using Monte Carlo method with stratified sampling. A SEN, a specific type of distributed systems that consists of 2 2 switching elements, has been widely considered a practical interconnection system. Confidence interval of the point estimate is then derived using non-parametric bootstrapping.
Keywords: distributed systems; Monte Carlo; reliability; shuffle-exchange network; switching element.
Reference to this paper should be made as follows: Gunawan, I. (2013) ‘Reliability prediction of distributed systems using Monte Carlo method’, Int. J. Reliability and Safety, Vol. 7, No. 3, pp.235–248.
Biographical notes: Indra Gunawan is a Senior Lecturer and Coordinator of Postgraduate Programes in Maintenance and Reliability Engineering at the School of Applied Sciences and Engineering in Monash University, Australia. He obtained his PhD degree in Industrial Engineering from Northeastern University, USA. His main areas of research are reliability engineering, production and operations management, application of operations research, applied statistics, probability modelling and project management. His work has appeared in many peer-reviewed journals and international conferences.
1 Introduction
The demand for even more computing power has never stopped. A number of important problems have been identified in the areas of defence, aerospace, automotive applications, weather forecasting, map making, aerodynamic simulations, chemical reaction simulations, seismic data processing, air traffic control, robot vision and science, whose solution requires tremendous amount of computational power. There are fundamental considerations as speed of computer device reaches a limit and an execution rate required simply beyond

236 I. Gunawan
the capabilities of current large computer systems. Hence, these facts result that the system performance in the future can only be significantly increased through additional concurrent processing. As a result, parallel computers with multiple processors can supply the support essential to meeting the computational performance goals for all these applications. The means for communication among processors, memory modules and other devices of a parallel computer is the interconnection network.
Interconnection networks are a natural result of advances in computer technology that provide the need in the improved system performance. As computer systems evolved, the hardware costs were a significant limiting factor. However, interconnection technology is creating an entirely new atmosphere; it is now economically feasible to construct a multiple-processor computer system by interconnecting a large number of processors and memory modules. Interconnection networks are currently being used for many different applications such as telephone switches, processor/memory interconnects for supercomputer, networks for industrial application and wide area computer networks. Therefore, concept, design and implementation of interconnection networks are crucial factors at this point in time.
Multistage Interconnection Network (MIN) falls within the category of indirect network. It has been used in both circuit switching and packet switching networks with the introduction of buffered switches. These include multiprocessor and communication network environments such as Ultracomputer (Gottlied, 1987), NEC Cenju-3, Cenju-4 (NEC Corporation, 1997), IBM RP3, ATM switches (Sibal and Zhang, 1995), Gigabit Ethernet (Yu, 1998) and optical network (Yang, 2000). The number of stages, interconnection design and the type of Switching Element (SE) used in the network configuration differentiate each MIN, for example Shuffle-Exchange Network (SEN), gamma network (Vama and Raghavendra, 1985), extra stage gamma network (Lee and Hegazy, 1988), delta network, Tandem-Banyan network (Sibal and Zhang, 1995) and multilayer MIN (Tutsch and Gunter, 2003).
The variety and the extensive usage MIN prompt for a method that could provide efficient evaluation of various MIN reliabilities in order to select the best MIN topology. Various methods have been used to evaluate the reliability of a network such as neural network (Srivaree-ratana and Smith, 2002), derivation of bounds (Konak and Smith, 1998; Gunawan, 2008) and sum of disjoint product (Chua and Kuo, 1994). This paper presents a method to estimate the reliability of MIN based on Monte Carlo method as the exact reliability calculation for larger networks are very complex.
A single type of MIN, known as SEN with an additional stage (SEN+) that is specifically for multiprocessor environment is discussed. The layout of the MIN topology is shown in Figure 1 with number of inputs, N = 8. The rectangles in Figure 1 represent the 2 2 SEs which provide the interconnection between inputs and outputs. The SE can either transmit the inputs straight or has crossed connections. Hence, a working SE can be in any of the four connection patterns as shown in Figure 2. The SEN+ system has N inputs and N outputs. There are two paths between each source-destination pair. It has n = (log2 N) + 1 stages and each stage has N/2 switching elements. In general, the switch complexity for the N N SEN+ is N/2 (log2 N + 1). Thus, the additional cost of the SEN+ is N/2 switches or a fractional increase of 1/log2 N is small for a large N.

Reliability prediction of distributed systems 237
Figure 1 8 8 SEN+ topology
Figure 2 Connection pattern for 2 2 SE
The control strategy allows a switching element in stage 0 to use the T (straight) setting until a failure in a SE along the path from a given S to a given D is detected. At that time, the SE in stage 0 is placed in the X (exchange) setting for all future accesses between that S-D pair. In this way, it is shown that two paths between each S-D pair given that the failures occur only in the intermediate stages of the SEN+. It is recognised that in actual implementations, the network should be reconfigured to reduce congestion.
SEN+ is a hybrid of generic SEN with higher failure tolerance than SEN. It has two disjoint redundant paths in the intermediate stages thus able to tolerate a single path failure.
The problem of determining the reliability of a complex system, whose components are subject to failure, has received considerable attention in the statistical, engineering and operations research literature. Indeed, in certain situations, improving the reliability of a system can be more consequential than reducing its cost. Reliability analysis can be applied to a variety of practical systems, ranging from large-scale telecommunication, transportation and mechanical systems, to the microelectronic scale of integrated circuits.
Network reliability is commonly arises from the interconnection of various elements in the form of a network or a graph. For example, the nodes of a multistage interconnection network might represent the physical locations of switching elements and its edges might represent existing communication links between switching elements. In realistic settings, the elements of a network, its nodes or edges or both, are subject to failure, but in most analysis only the links are considered as failing components. At any stage, each element is either working or failed; as a result, the network itself is also either working or failed. In the multistage interconnection networks example, working might mean that a distinguished input switching element and distinguished output switching element are able to communicate over operational links of the network, while failure means that there is no complete transmission path in the system.

238 I. Gunawan
In the next sections, reliability parameters (terminal, broadcast and network reliability) are discussed, Monte Carlo (MC) method and algorithm to calculate the point estimate and bound reliability are presented and numerical results are shown to prove the applicability of the proposed method with the exact reliability.
2 Reliability parameters
Reliability of the network is concerned with the ability of a network to carry out its desired network operation successfully. In our case, interconnection networks for processor-processor and processor-memory information exchanges in multiprocessing parallel processing systems, contribute appreciably to the performance as well as the reliability of the overall system. The reliability measures of particular interest are: Terminal Reliability (TR), Broadcast Reliability (BR) and Network Reliability (NR).
1 Terminal Reliability (TR): Terminal reliability, generally used as a measure of robustness of a MIN, is the probability of existence of at least one fault free path between a designated pair of input and output terminals (two terminals).
2 Broadcast Reliability (BR): Another useful measure of the reliability of a MIN is its ability to broadcast data from a given input terminal to all the output terminals of the network. A network is said to have failed when a connection cannot be made from the given input terminal to at least one of the output terminals.
3 Network Reliability (NR): The network reliability is defined as the probability that there exists a connection between each input to all outputs (all terminals).
Exact reliability of SEN+ can be determined by evaluating all possible SE states but it is NP-hard due to the huge possibilities of SE states as the number of inputs increases. Monte Carlo method is able to provide a point estimate of SEN+ reliability without evaluating every possible SE state. It is based on the adaptation of a method proposed by Fishman (1996). Monte Carlo method enables estimation of SEN+ reliability via random sampling of SE states.
3 Monte Carlo method
Monte Carlo method provides estimation based on sampling randomisation. Results generated from crude Monte Carlo method might not be accurate. In this section, the benefit accrued from applying stratified sampling is explored. Crude Monte Carlo method (without any variance reduction) is based on random sampling of SEs’s states and then is evaluated for its connectivity. This process is repeated for a specific number of times as defined by nr. It does not require any partitioning as it being done in stratified sampling. Crude Monte Carlo method has an inherent weakness which is the sampling performed may be weighted to certain number of working SE samples, which may cause the result to be imprecise (Fishman, 1996).

Reliability prediction of distributed systems 239
The following assumptions are defined to facilitate the estimation of SEN+ reliability:
1 A SE can only have two states; working = 1 or failed = 0.
2 All SE failures are statistically independent and random. A SE is assumed failed when it could not be in any of the four connection patterns; lower broadcast, upper broadcast, straight or exchange pattern (see Figure 2).
3 SE is assumed to be less reliable than the link and cannot be repaired.
4 All SEs have identical reliability.
5 All SEs in the first and last stages are assumed to be working.
Algorithm 1: Monte Carlo Method (MC) for SEN+
Parameters:
1 Number of SEs in the intermediate stages, nim
2 SE reliability, r(t)
3 Number of inputs, N
4 Number of replications, nr
5 Number of SE in the first and last stages, nfl.
6 Reliability of SEN+, R
Procedure:
1 SET accumulated reliability, Rac = 0
SET number of working switches, nworking = 1
SET number of SE in intermediate stages, nim
SET total number of samplings, nsampled = 0
SET total connected network, nconnected = 0
2 REPEAT
Note: Calculate the stratum sampling size for each stratum. Number of stratum depends on the number of working SEs in the intermediate stages.
SET number of sampling for stratum i (i = nworking),
_ 1im
stratum size r im workingworking
nn n r t n r t n
n
SET nsampled = nsampled + nstratum_size
Note: Evaluate only when the number of working SEs in the intermediate stages is at least half of the total number of the SEs in the intermediate stages. The SEN+ fails when the number of working SEs in the intermediate stages is less than half of its total.
IF nworking ≥ nim 0.5 THEN

240 I. Gunawan
Note: The interconnection still functions even there is a single SE failure. Evaluation is skipped as the interconnection is functioning when there is only a single SE failure.
IF nworking nim –1 THEN
Note: Generated SE states are dependent on the type of interconnection; terminal, broadcast or network.
Randomly generate SE states in intermediate stages in array state[nim]
Note: Evaluation of SEN+ network is dependent on the type of interconnection; terminal, broadcast or network. This is done by evaluating the array state[nim].
IF the SEN+ network is connected THEN
nconnected = nconnected + 1
END IF
ELSE
nconnected = nconnected + nstratum_size
END IF
nworking = nworking + 1
UNTIL (nworking ≤ nim)
3 The estimated reliability for intermediate stages is multiplied with all the SE reliability for first and last stages to calculate the overall estimated reliability.
RETURN R = (nconnected / nsampled). r(t) nfl
Algorithm 1 shows the procedure to perform Monte Carlo method with stratified sampling. Stratified sampling allows us to achieve better approximation of the exact SEN+ reliability. It partitions the sample into several stratums, where each stratum contains homogenous elements. This allows sampling to be performed on important stratums and ignores irrelevant ones, thus improving the accuracy and efficiency of the estimation. Stratum sampling size is based on proportional allocation derived from binomial probability distribution which is defined as:
_ 1im
stratum size r im workingworking
nn n r t n r t n
n
4 Confidence interval for Monte Carlo point estimate
Confidence interval (Upper Limit: UL and Lower Limit: LL) of the point estimate reliability value using Monte Carlo method is derived using statistical non-parametric bootstrapping method (Efron and Tibshirani, 1993; Wang and Rao, 1997). Non-parametric bootstrapping does not require any assumptions being made on the distribution pattern thus removing any errors that may result biased outcome. The bootstrapping method used to estimate the confidence interval in this paper is based on Efron’s percentile confidence limit.
Reliability prediction of distributed systems 241
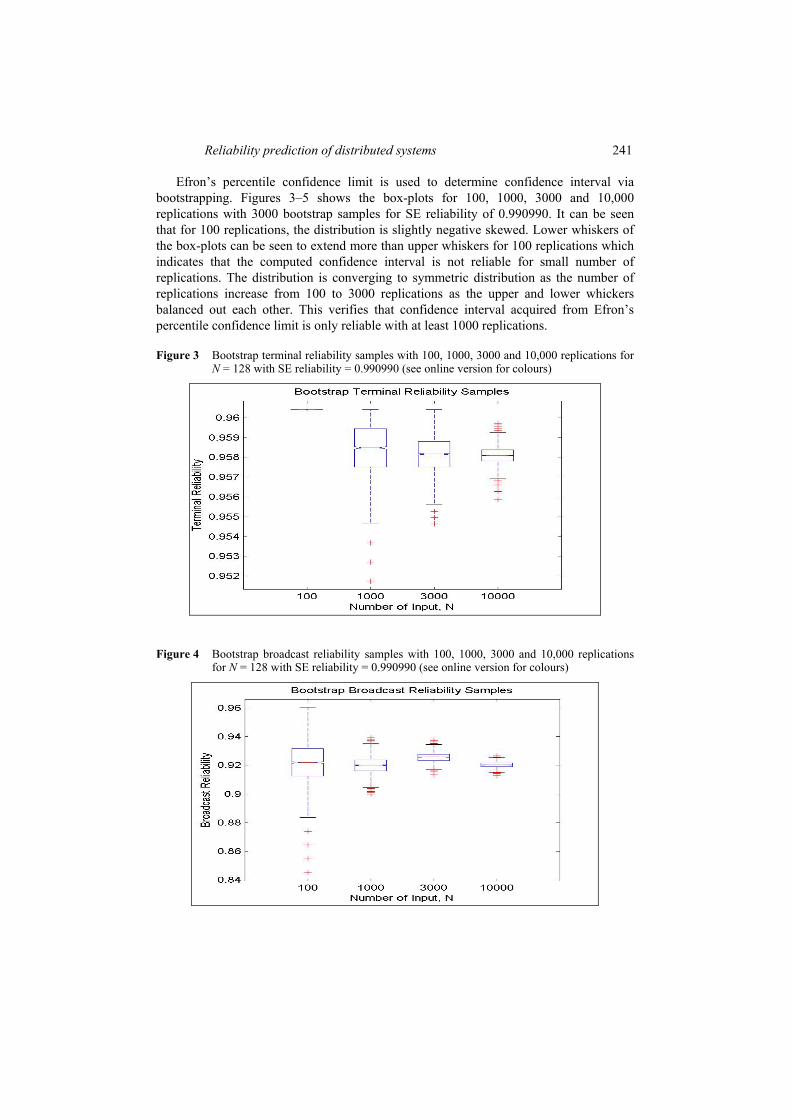
Efron’s percentile confidence limit is used to determine confidence interval via bootstrapping. Figures 3–5 shows the box-plots for 100, 1000, 3000 and 10,000 replications with 3000 bootstrap samples for SE reliability of 0.990990. It can be seen that for 100 replications, the distribution is slightly negative skewed. Lower whiskers of the box-plots can be seen to extend more than upper whiskers for 100 replications which indicates that the computed confidence interval is not reliable for small number of replications. The distribution is converging to symmetric distribution as the number of replications increase from 100 to 3000 replications as the upper and lower whickers balanced out each other. This verifies that confidence interval acquired from Efron’s percentile confidence limit is only reliable with at least 1000 replications.
Figure 3 Bootstrap terminal reliability samples with 100, 1000, 3000 and 10,000 replications for N = 128 with SE reliability = 0.990990 (see online version for colours)
Figure 4 Bootstrap broadcast reliability samples with 100, 1000, 3000 and 10,000 replications for N = 128 with SE reliability = 0.990990 (see online version for colours)

242 I. Gunawan
Figure 5 Bootstrap network reliability samples with 100, 1000, 3000 and 10,000 replications for N = 128 with SE reliability = 0.990990 (see online version for colours)
Similar settings for the box-plots with SE reliability of 0.990990 were used to generate histograms, as depicted in Figures 6–8. It can be seen that the distributions are converging to bell-curved shape as the number of replication increases with. This means that simulation with larger samples size will likely to be distributed normally, thus producing a more reliable confidence interval. Based on this assertion, comparison made between Monte Carlo method and other methods in the later sections will be based on 6000 replications to ensure the results generated are reliable.
Figure 6 Histograms of 3000 bootstrap samples for terminal reliability with 100, 1000, 3000 and 10,000 elements for N = 128 with SE reliability = 0.990990 (see online version for colours)

Reliability prediction of distributed systems 243
Figure 7 Histograms of 3000 bootstrap samples for broadcast reliability with 100, 1000, 3000 and 10,000 elements for N = 128 with SE reliability = 0.990990 (see online version for colours)
Figure 8 Histograms of 3000 bootstrap samples for network reliability with 100, 1000, 3000 and 10,000 elements for N = 128 with SE reliability = 0.990990 (see online version for colours)
5 Numerical results
We implemented several other methods on single software platform to gauge our level of accuracy by comparing the results. These include exact terminal reliability of SEN+

244 I. Gunawan
calculated using the mathematical (Math) approach (Thanawastien, 1982; Gunawan, 2008), Fard and Gunawan’s method (2005) to calculate exact broadcast and network reliabilities up to N = 16 inputs and Blake and Trivedi’s (1989) network reliability bounds. For higher number of inputs, we compare our results against Cheng and Ibe’s results (1992) published in their paper. For the MC method we will use 6000 replications with 95% level of confidence based on 5000 bootstrap samples for the estimated point reliability value.
A measurement parameter to measure the accurateness of our method is used, known as the percentage of difference . It measures the difference between the Monte Carlo point estimate and the exact reliability value.
Estimated value Exact value100%
Exact value
(1)
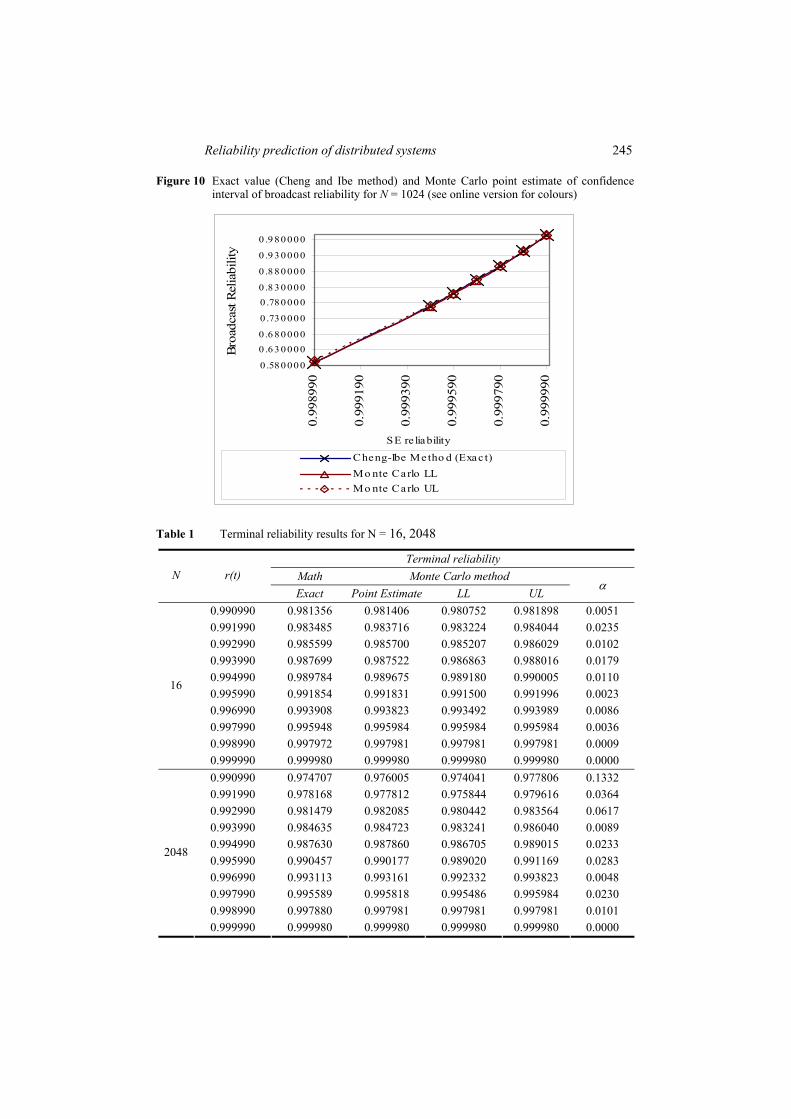
Figure 9 shows that the confidence interval for Monte Carlo point estimate of terminal reliability envelopes all the exact values for N = 2048 inputs. Table 1 depicts the percentage of difference for terminal reliability is less than 0.024% for N = 16 inputs and 0.134% for N = 2048 inputs. Similar results are shown based on Monte Carlo point estimate for broadcast reliability. The confidence interval of Monte Carlo point estimate covers the exact reliability values for N = 1024 inputs, shown in Figure 10. The percentage of difference for broadcast reliability as in Table 2 is less than 0.210% for N = 128 and 0.100% for N = 1024.
Figure 9 Exact value (Thanawastien and Gunawan’s methods) and Monte Carlo point estimate of confidence interval of terminal reliability for N = 2048 (see online version for colours)
0.971000
0.976000
0.981000
0.986000
0.991000
0.996000
0.99
0990
0.99
1990
0.99
2990
0.99
3990
0.99
4990
0.99
5990
0.99
6990
0.99
7990
0.99
8990
0.99
9990
SE re liability
Ter
min
al r
elia
bilit
y
Exac t Reliability Mo nte Carlo LL
Mo nte Carlo UL
Reliability prediction of distributed systems 245
Figure 10 Exact value (Cheng and Ibe method) and Monte Carlo point estimate of confidence interval of broadcast reliability for N = 1024 (see online version for colours)
0 .58 0 00 0
0 .6 3 0 00 0
0 .6 8 0 00 0
0 .73 0 00 0
0 .78 0 00 0
0 .8 3 0 00 0
0 .8 8 0 00 0
0 .9 3 0 00 0
0 .9 8 0 00 0
0.99
8990
0.99
9190
0.99
9390
0.99
9590
0.99
9790
0.99
9990
SE re liability
Bro
adca
st R
elia
bilit
y
Cheng-Ibe Metho d (Exac t)
Mo nte Carlo LL
Mo nte Carlo UL
Table 1 Terminal reliability results for N = 16, 2048
Terminal reliability
Math Monte Carlo method N r(t)
Exact Point Estimate LL UL
0.990990 0.981356 0.981406 0.980752 0.981898 0.0051
0.991990 0.983485 0.983716 0.983224 0.984044 0.0235
0.992990 0.985599 0.985700 0.985207 0.986029 0.0102
0.993990 0.987699 0.987522 0.986863 0.988016 0.0179
0.994990 0.989784 0.989675 0.989180 0.990005 0.0110
0.995990 0.991854 0.991831 0.991500 0.991996 0.0023
0.996990 0.993908 0.993823 0.993492 0.993989 0.0086
0.997990 0.995948 0.995984 0.995984 0.995984 0.0036
0.998990 0.997972 0.997981 0.997981 0.997981 0.0009
16
0.999990 0.999980 0.999980 0.999980 0.999980 0.0000
0.990990 0.974707 0.976005 0.974041 0.977806 0.1332
0.991990 0.978168 0.977812 0.975844 0.979616 0.0364
0.992990 0.981479 0.982085 0.980442 0.983564 0.0617
0.993990 0.984635 0.984723 0.983241 0.986040 0.0089
0.994990 0.987630 0.987860 0.986705 0.989015 0.0233
0.995990 0.990457 0.990177 0.989020 0.991169 0.0283
0.996990 0.993113 0.993161 0.992332 0.993823 0.0048
0.997990 0.995589 0.995818 0.995486 0.995984 0.0230
0.998990 0.997880 0.997981 0.997981 0.997981 0.0101
2048
0.999990 0.999980 0.999980 0.999980 0.999980 0.0000

246 I. Gunawan
Table 2 Broadcast reliability results for N = 128, 1024
Cheng and Ibe method
Monte Carlo method N r(t)
Exact Point estimate LL UL
0.990990 0.532779 0.531665 0.528796 0.534349 0.2091
0.991990 0.573588 0.573420 0.570653 0.575990 0.0293
0.992990 0.616968 0.616774 0.614137 0.619306 0.0314
0.993990 0.663012 0.662531 0.660053 0.664896 0.0725
0.994990 0.711806 0.711006 0.708721 0.713170 0.1124
0.995990 0.763430 0.764500 0.762832 0.766168 0.1402
0.996990 0.817951 0.818495 0.817125 0.819728 0.0665
0.997990 0.875423 0.874923 0.873754 0.875947 0.0571
0.998990 0.935883 0.936115 0.935647 0.936428 0.0248
128
0.999990 0.999350 0.999350 0.999350 0.999350 0.0000
0.998990 0.591132 0.591707 0.590417 0.592897 0.0973
0.999490 0.768262 0.768718 0.767948 0.769360 0.0594
0.999590 0.809266 0.809201 0.808391 0.809887 0.0080
0.999690 0.852334 0.852097 0.851386 0.852665 0.0278
0.999790 0.897560 0.897111 0.896363 0.897710 0.0500
0.999890 0.945043 0.945130 0.945130 0.945130 0.0092
1024
0.999990 0.994882 0.994883 0.994883 0.994883 0.0001
The Monte Carlo point estimate confidence interval for network reliability falls below Cheng and Ibe’s lower bound as shown in Figure 11. But it falls within the bounds of Blake and Trivedi’s method. Nevertheless, Monte Carlo point estimate can be used as a source of network reliability estimation as the risk of overestimating the network reliability is lower than Cheng and Ibe’s method. The percentage of difference for network reliability with N = 16 inputs is less than 0.084% as shown in Table 3.
Table 3 Network reliability results for N = 16
Fard and Gunawan method
Monte Carlo method N r(t)
Actual Point estimate LB UB
0.990990 0.860108 0.860425 0.858700 0.86201 0.0369
0.991990 0.875158 0.875888 0.874420 0.87721 0.0834
0.992990 0.890339 0.89057 0.889230 0.89176 0.0260
0.993990 0.905644 0.905785 0.904570 0.90684 0.0155
0.994990 0.921071 0.921091 0.920010 0.92201 0.0022
0.995990 0.936613 0.936327 0.935390 0.93711 0.0305
0.996990 0.952267 0.952594 0.952120 0.95291 0.0344
0.997990 0.968026 0.967997 0.967510 0.96832 0.0030
0.998990 0.983886 0.983798 0.983470 0.98396 0.0089
16
0.999990 0.999840 0.999840 0.999840 0.99984 0.0000

Reliability prediction of distributed systems 247
Figure 11 Bounds (Cheng and Ibe’s and Blake and Trivedi’s methods) and Monte Carlo point estimate of confidence interval of network reliability for N = 1024 (see online version for colours)
0.000000
0.100000
0.200000
0.300000
0.400000
0.500000
0.600000
0.700000
0.800000
0.900000
1.000000
0.99
8990
0.99
9190
0.99
9390
0.99
9590
0.99
9790
0.99
9990
SE re liability
Net
wor
k R
elia
bilit
y
Cheng-Ibe LB Cheng-Ibe UB
Blake-Trivedi LB Blake-Trivedi UB
Mo nte Carlo LL Mo nte Carlo UL
6 Conclusion
In this paper, it is shown that Monte Carlo method with stratified sampling is capable of providing a good estimation on large SEN systems reliability. Low percentage of difference and the coverage of the confidence interval prove the applicability of Monte Carlo method.
As the Monte Carlo method is based on randomised sampling, results produced in each run may be different. Therefore, the mean of several runs can be used to have a better approximation value.
Some future work of the research would include the analysis of other types of MIN such as gamma network because the exact reliability of this network is difficult to get due to its complicated topology. Then, Monte Carlo method can be applied to resolve this difficulty.
References
Blake, J. and Trivedi, K.S. (1989) ‘Multistage interconnection network reliability’, IEEE Transactions on Computer, Vol. 38, No. 11, pp.1600–1604.
Cheng, X. and Ibe, O.C. (1992) ‘Reliability of class of multistage interconnection networks’, IEEE Transactions on Parallel and Distributed Systems, Vol. 3, No. 2, pp.241–246.
Chua, P.J. and Kuo, C.L. (1994) ‘A simple approach to the evaluation of multistage interconnection network reliability’, Proceedings of the 37th Midwest Symp, Circuits and Systems, pp.313–316.

248 I. Gunawan
Efron, B. and Tibshirani, R.J. (1993) An Introduction to the Bootstrap, Chapman and Hall, New York, USA.
Fard, N.S. and Gunawan, I. (2005) ‘Terminal reliability improvement of shuffle-exchange network systems’, International Journal of Reliability, Quality and Safety Engineering, Vol. 12, No. 1, pp.51–60.
Fishman, S.G. (1996) Monte Carlo: Concepts, Algorithms and Applications, Springer, New York, USA.
Gottlied, A. (1987) An Overview of the NYU Ultra Computer Project, Technical report (TR-086-U100), Department of Computer Science, New York University, USA.
Gunawan, I. (2008) ‘Reliability analysis of shuffle-exchange network systems’, Reliability Engineering and System Safety, Vol. 93, No. 2, pp.271–276.
Konak, A. and Smith, A.E. (1998) An Improved General Upper Bound for All-Terminal Network Reliability. Available online at: http://www.pitt.edu/~aesmith/postscript/bound.pdf (accessed on 14 August 2003).
Lee, K.Y. and Hegazy, W. (1988) ‘The extra stage gamma network’, IEEE Transactions on Computers, Vol. 37, No. 11, pp.1445–1449.
NEC Corporation (1997) NEC releases highly parallel computer based on new memory architecture. Available online at: http://www.nec.co.jp/press/en/9707/2801.html (accessed on 14 August 2003).
Sibal, S. and Zhang, J. (1995) ‘On a class of banyan networks and tandem banyan switching fabrics’, IEEE Transactions on Communications, Vol. 43, No.7, pp.2231–2240.
Srivaree-ratana, C. and Smith, A.E. (2002) ‘Estimation of all-terminal reliability using an artificial neural network’, Computers & Operations Research, Vol. 29, No. 7, pp.849–868.
Thanawastien, S. (1982) ‘The shuffle/exchange-plus networks’, Proceedings of the 20th Annual Southeast Regional Conference, pp.89–96.
Tutsch, D. and Gunter, H. (2003) ‘Multilayer multistage interconnection networks’, Proceedings of 2003 Design, Analysis, and Simulation of Distributed Systems (DASD’03), Orlando, USA, pp.155–162.
Vama, A. and Raghavendra, C.S. (1985) ‘Performance analysis of redundant path interconnection networks’, Proceedings of International Conference of Parallel Processing, pp.474–479.
Wang, J. and Rao, R.J. (1997) ‘Weighted jackknife-after-bootstrap: a heuristic approach’, Proceedings of the 1997 Winter Simulation Conference, pp.240–245.
Yang, Y. (2000) ‘Permutation capability of optical multistage interconnection networks’, Journal of Parallel and Distributed Computing, Vol. 60, pp.72–91.
Yu, B.Y. (1998) Analysis of a Dual-Receiver Node with High Fault Tolerance for Ultrafast OTDM Packet Switched Shuffle Networks, Technical Paper, 3COM.
Related Documents


![RELIABILITY PREDICTION FORwiki.solid-run.com/...clearfog_base-rev1.1-mtbf.pdf · The reliability prediction was performed in accordance with: Telcordia SR-332 [Ref. 1] Reliability](https://static.cupdf.com/doc/110x72/5f2c74ebfe515469053bf545/reliability-prediction-the-reliability-prediction-was-performed-in-accordance-with.jpg)