Welcome message from author
This document is posted to help you gain knowledge. Please leave a comment to let me know what you think about it! Share it to your friends and learn new things together.
Transcript

2013 MANAGEMENT REPORT : EDP RENOVÁVEIS
NEV
ER
EN
DIN
G E
NER
GY
1

2013 MANAGEMENT REPORT : EDP RENOVÁVEIS
2
2013 MANAGEMENT REPORT : EDP RENOVÁVEIS
NEV
ER
EN
DIN
G E
NER
GY
3
Index
FIRST THINGS FIRST 4 Message from the Chairman 4
Interview with the CEO 6 EDPR Snapshot 11
Company Presentation 12 Business Model 18
Strategy 20 Risk Management 22
Share Performance 24
WHY INVEST IN RENEWABLES? 28 Business Case 28
Competitiveness of Mature Technologies 29 Price vs. Cost 29
Investments and New Technologies 30
EDPR INTEGRATED OPERATIONS 34 Premium Assets 34
Excellence in Operations 39
FINANCIAL PERFORMANCE 52
GRI INFORMATION 62
ANNEX 79
01

2013 MANAGEMENT REPORT : EDP RENOVÁVEIS
4
MESSAGE FROM THE CHAIRMAN
ANTÓNIO MEXIA
Chairman
of the Board of Directors
2013 MANAGEMENT REPORT : EDP RENOVÁVEIS
NEV
ER
EN
DIN
G E
NER
GY
5
DEAR SHAREHOLDERS,
2013 was a year marked with numerous challenges for EDP Renováveis. However, our vision remains intact and our ability to achieve our targets, yet again, is a testament to the strength and focus of our team. Strategic initiatives implemented in 2012 were successfully executed in 2013 and will serve as the foundation of our growth moving forward. Regulatory changes in Spain changed the investment landscape in one of our core markets and due to the extension of the PTCs, the US placed itself as the growth pillar of EDPR for the upcoming years. The development of the renewable energy sector into a mature sector is unstoppable, becoming increasingly cost-competitive, and we believe we are well positioned to capture value and deliver it to our shareholders.
Marking the five year anniversary of becoming a publicly traded company, 2013 was a year of record performance. Our renewable energy portfolio reached 8.5 GW, produced 19.9 TWh of clean energy, delivered leading operational and financial metrics and all while maintaining the highest levels of sustainability principles.
EDPR shares the DNA of the EDP group, in what regards maintaining a low risk profile as a core priority. Our low risk profile was key to implement a successful self-funding business model – reducing exposure to the volatility of financial markets – which is based on the asset rotation program. Yielding EDPR 620 million euros of value crystallization through several transactions, the program success was determinant. CTG has also been instrumental in this success by recognizing the high quality of our assets and generating interest from our other partners. During the year, EDPR successfully closed its first transaction with CTG and signed a memorandum of understanding (MoU) for an investment in our ENEOP projects. This agreement provided further evidence of the successful implementation of the Strategic Partnership.
The wind energy sector is becoming increasingly competitive. Alongside with increased competitiveness, renewables have clear benefits in terms of reducing carbon emissions, creating local jobs, and securing national energy demands. Clearly there is a paradigm shift and in regions with solid renewable resources, wind is already the most competitive technology representing a significant portion of the production mix. For example, in the UK, the entrance price for new nuclear power stations can be 20%-30% above the cost for onshore wind. Also, the outcome of the energy auctions in Brazil showcased the strength of wind as it competed with conventional technologies and secured the bulk of the new long-term contracts. Towards the end of 2013, a record number of wind power MW were under construction in the United States and renewables was the overall leader for new installations in Europe. All this facts are testimonial to the significance of renewable energy, its increased competitiveness and sustainability. Now it is time to debate at a European level the importance of adopting a new Market Design, one that properly answers to the current challenges of the whole electric sector, where the cost of capital is a key factor of competitiveness and where fixed costs are increasingly dominant, as is the case with renewables.
As the sector continues to change and mature, it's important for us to maintain a flexible strategy. Given the inherent quality of our assets EDPR signed over 1,200 MW of long term power purchase agreements in the United States, providing visibility of our growth three years in advance. Because of its diversified portfolio, EDPR additionally secured long-term agreements in Italy and Brazil, an exceptional achievement in our growth markets. But we cannot afford to be careless and must maintain a prudent approach to the business. Inspired by our vision and confident of the long-term value of investing in renewables we continue to explore new markets and new technologies. On the solar side, 2013 was the first year of production of our newly installed plants and we will continue to search for opportunities and capture their potential as their costs continue to decline. In offshore wind, we partnered with GDF Suez and presented ourselves to the French Offshore Round II licenses program. The offshore market showed considerable growth in Europe during the year and looks to be an increasing source of growth in the long-term.
The Company’s policy of investing in a diverse portfolio aims to generate consistent returns over the long term. We are pleased with our consistent performance despite the poor economic environment since 2008. We therefore view the next year with a mixture of caution and optimism as we continue to believe that good quality assets in which we invest can prosper even in the current tough environment.
The company continues to execute its strategy to develop and operate a worldwide fleet that generates clean and CO2-free electricity. Respect for biodiversity and supporting the society are decisive contributors to achieve a leadership position in the global arena of sustainability. We continued our commitment with the UN Global Compact to align our operations with the ten principles in the areas of human rights, labour, environment, and anti-corruption. This year, EDPR was distinguished with the number one worldwide position in the FTSE4Good Index and contributed to EDP’s leading position in the Dow Jones Sustainability Index.
It takes the performance and dedication of our employees and their strong relationships with our stakeholders to achieve these humbling recognitions. I would like to openly praise their determination in overcoming challenges and capturing new growth opportunities. Based on their assessment, the company was selected as a Best Place to Work in several countries and I along with my colleagues of the Board, will make sure the Company keeps with the highest standards of health and safety, ethics and diversity, while providing challenging career opportunities for our employees.
I would also like to express my confidence in the work developed by the executive team and to give thanks to my fellow board directors for their support and supervisory role. The company has come a long way in five years as a public company. It is now a mature company facing increased challenges. We need to make sure we continue to operate our assets with premium metrics and continue to define our own growth path.
Sincerely,
2013 MANAGEMENT REPORT : EDP RENOVÁVEIS
6
INTERVIEW WITH THE CEO
JOÃO MANSO NETO
CEO of
EDP Renováveis
2013 MANAGEMENT REPORT : EDP RENOVÁVEIS
NEV
ER
EN
DIN
G E
NER
GY
7
Q: WHAT WERE THE MAIN DEVELOPMENTS OF THE RENEWABLE ENERGY SECTOR IN 2013?
JMN: My first comment when I analyse 2013 is that throughout the year we were able to confirm onshore wind technology as a competitive source of electricity. The question is no longer only about being green, but it is also about being competitive when comparing against other sources of generation. The tender for new nuclear power in the UK brought to public knowledge what is the price of a technology. Nuclear is commonly argued to have a lower cost versus renewables, yet the price awarded in this nuclear tender was 20% to 30% higher than the price of onshore wind energy in France or Portugal.
Based on this increased competitiveness, onshore wind continues to lead the number of annual installations worldwide. Excluding Europe, the development of new onshore wind projects increased in the relevant markets. Although installations in the US were drastically lower, once the PTC was extended in the beginning of the year, activity ramped up so that 2014 is now set up to be a solid year of growth due to the record figure of projects already under construction or in a ready-to-build state.
Europe – which is the worldwide leader in the wind energy industry – is lagging in terms of growth due to the increased discussions about the sustainability of renewables. By incorrectly identifying renewables as the cause of the increase in electricity prices, the region’s economic competitiveness has declined. This discussion was particularly exacerbated in Spain where the Government unilaterally intervened in the sector’s financial stability by changing the regulatory framework for wind energy projects built in the past 20 years.
However, 2013 also confirmed the strong appetite from institutional investors in gaining direct exposure to the solid visible returns provided by wind energy assets that are well managed and remunerated under long-term schemes.
Q: BUT PEOPLE CONTINUE TO PERCEIVE RENEWABLE AS A LUXURY THAT WILL ONLY SURVIVE WITH THE SUPPORT OF SUBSIDIES…
JMN: There are several persistent myths about renewable energy that have penetrated public opinion and are influencing the political landscape around the world. The idea that renewable energy is much more expensive than fossil fuel generation and will always rely on subsidies to be competitive is completely outdated.
When looking to the different investment costs, economic agents need to always analyse what are the total costs of each technology and the truth is that onshore wind with quality load factors is already competitive with all the other electricity generation technologies.
Typically renewable energy is perceived as being expensive because its total cost is compared to wholesale prices, and this is not correct. No technology is profitable based on existing wholesale electricity prices and this demands a restructuring of the electricity market in Europe.
The price gap between the European and the US electricity market is not driven by renewable energies but from the boom in production of shale gas in North America.
Q: WHAT WAS EDPR’S ACTION PLAN FOR THIS CHANGING ENVIRONMENT?
JMN: We decided to implement a rapid shift in investments for the upcoming years. Leveraging on our highly competitive and diversified pipeline of projects, and also on the more favourable business environment in the US, we placed the US at the centre of the company’s growth.
In Europe, the management of the regulatory agenda and actively participating in the public debate intensified. This was not only specific to renewable energy but also for other sources of electricity.
I’m always focused on making sure EDPR continues to deliver premium operating metrics, for example in availability and load factors, and that financial sustainability and cost control continues to be a priority for all. With this mind-set we will continue to deliver premium returns.
We also continued our asset rotation strategy of selling minority stakes in operating projects. This allowed us to take advantage of the increased number of low-cost-of-capital financial investors looking to the fundamentals of the wind energy business and its solid low-risk profile.
Q: DOES THIS SHIFT TOWARDS THE US MARKET MEAN EUROPE IS A MARKET WITHOUT GROWTH?
JMN: No. Wind energy is economically competitive and contributes to the de-carbonization and energy independence of the European economy. Europe wants to reduce its CO2 emissions by 40% and just reinforced its objective of having 27% of electricity production coming from renewable sources by 2030. Countries like the UK and Poland will need new power generation capacity as several coal plants are slated to retire in the upcoming years. But one does not need to go that far out in the future to justify the demand as several European markets still need to install new renewables to achieve the 20% renewable energy target by 2020.
EDPR has been operating wind energy assets in the region since the 90’s and is currently present in 8 European markets, so we are long-term investors and will continue to look for new opportunities.
Q: HOW IS EDPR PLACED IN THIS NEW COMPETITIVE SCENARIO?
JMN: We really believe in the competitiveness of the projects originated by our teams, and the quality of our portfolio of assets is the most evident proof of it. Based on our knowledge in maximizing wind farms output, we will focus our growth in projects which can sell their production through long-term contracts, typically 15 to 20 years, with terms defined based on competitive systems.
We believe that investments in such a capital intensive business need to have long-term visibility on returns. In our opinion the best way to provide visibility and to deliver the most competitive price to end consumers, is to
2013 MANAGEMENT REPORT : EDP RENOVÁVEIS
8
introduce ex-ante competition to award contracts for new installations. This competition can exist through energy auctions, organized on a national/regional basis, or through private negotiations with off-takers.
This competition is already a reality in some markets, such as the United States, Portugal and Brazil. It’s also gaining traction in several other markets, most recently in Italy, and others are planning to introduce this mechanism for their future capacity additions, like Poland.
Q: LET’S NOW MOVE TO EDPR’S 2013 PERFOMANCE. WHAT WERE THE MAIN HIGHLIGHTS?
JMN: In 2013, the company again delivered quality growth. We met our growth targets with the addition of 502 MW to our portfolio that now reaches 8.5 GW. The high quality assets produced 19.9 GWh of clean electricity and resulted in revenues of 1.4 billion euros.
The additional capacity was concentrated in our growth markets, mainly in Central Eastern Europe which contributed 70% of the new capacity. This included building our largest wind farm in Romania, adding to our leading presence in Poland, and installing our first project in Canada.
The financial results for the year were clearly impacted by the regulatory changes in Spain. What is encouraging is that despite these cumulative changes, which negatively impacted results by 71 million euros, EDPR was still able to deliver financial growth, thus showing the benefits of its diversified portfolio and resilient business model.
Our EBITDA was up 1% year over year, our Net Profit increased 5% and operational cash-flow increased by 5%. Based on these figures and in line with our commitment, the EDPR Board of Directors will propose to distribute 26% of the consolidated Net Profit as dividend.
Q: IN THIS CHANGING ENVIRONMENT IS THE VISION OF THE COMPANY CHANGING FOR THE FUTURE?
JMN: No. When we first identified the potential of renewables, specifically onshore wind, we understood its competitiveness would quickly increase and become cost competitive with alternative options and thus represent an important share of the world’s generation mix. This vision materialized and we continue to be strongly committed to it. We continue to see a crucial role of renewable’s energy in the energy matrix and its increased competitiveness provides a bright future for the sector.
EDPR is a top worldwide player in renewables and is a long-term investor in the industry. We are experts in the development and operation of wind farms and we want to capitalize on our core capabilities and structural competitive advantages to deliver long-term value to our shareholders and stakeholders.
To obtain long-term value in this industry, EDPR has a strategy structured around three pillars: (i) delivering increased profitability supported by the performance of EDPR’s premium wind farms; (ii) selective and profitable growth, and; (iii) a self-funded business model. My commitment to the company is to deliver this strategic agenda.
We need to continue to achieve premium operating figures and to maximize value from the assets already in operation. To achieve this excellence in operations we will continue to execute performance optimization initiatives to increase efficiency and maintain strong control over costs.
Looking for new investments, as I said previously, we introduced in 2013 a shift of the growth towards the United States and the company is committed to adding new value accretive projects to its portfolio. It is also relevant to maintain our self-funded business model and to achieve this we will continue to execute asset rotation transactions and re-invest proceeds in visible projects.
I would like to stress that the company’s growth will be focused in markets where the project’s output is sold through long-term, low-risk-profile contracts that deliver predictable and recurrent cash-flows and guarantee the stability of the project’s return. With this approach, EDPR will be able to define its own future and continue to lead the renewable energy sector.
Q: WHAT IS THE CURRENT STATUS OF THE ASSET ROTATION TRANSACTIONS ALREADY EXECUTED AND WHAT IS THE ROLE OF CHINA THREE GORGES?
JMN: Since we started the asset rotation strategy we have executed 4 transactions and entered into a MoU for a fifth transaction.
Our first partner in the asset rotation strategy was Borealis for a portfolio of US wind farms. The second transaction in the US was with Fiera Axium involving a single wind farm. In Europe, we signed an agreement with Axpo for a portfolio of wind farms in France. And lastly, we signed two agreements with CTG for the assets in Portugal (the first concluded in June 2013 and the second – a MoU – regarding a future transaction including the ENEOP project which is on its way to conclusion).
But what is more important than the number of transactions or the names of the players involved, is the amount invested by our new partners. The first four transactions totalled 620 million euros. This is a remarkable success of the execution of this strategy as it is almost equivalent to a full year of investments for the company.
We will continue to execute new asset rotation transactions as it is a key source of funding for the company and allows it to maintain equilibrium between growth and financial discipline.
Q: IS EDPR LOOKING TO OTHER RENEWABLE TECHNOLOGIES OR WILL IT CONTINUE TO BE WIND COMPANY?
JMN: Onshore wind is our priority. It is the most competitive renewable technology and EDPR has continuously delivered premium operating metrics as a worldwide market leader.
Looking ahead, offshore wind is a natural extension of our strong competences in wind energy. We are actively participating in the UK offshore wind market and we partnered with GDF Suez for an offshore wind tender in France. The main challenge for the offshore projects is to increase its competitiveness and reduce costs.

2013 MANAGEMENT REPORT : EDP RENOVÁVEIS
NEV
ER
EN
DIN
G E
NER
GY
9
We are also involved in the solar PV space but the growth and opportunities will always be more limited. We will base our strategy on having an opportunistic approach and implementing a dual strategy where solar is an extension of our developments in wind.
Q; WHAT MAKES EDPR A GREAT PLACE TO WORK?
JMN: First and foremost are our people. It takes a dedicated team of experienced and driven individuals in order to continuously deliver on targets in this incredibly fast paced environment.
In 2014, I will continue to maintain a close relationship and direct contact with each of our employees, listening to their comments and suggestions, explaining the strategic decisions made by the management and continuing the activities developed in 2012 and 2013.
We have received several recognitions and this is a significant achievement for the company. We accept these recognitions with great pride and it is crucial that our employees are happy in their place of work, which in turn contributes to the strong performance of the company.
Beyond that, I believe we offer great training opportunities, competitive benefits, and simply have a group of people who are dedicated to realizing the vision of our company, which is to be a leading renewable energy company in terms of performance and sustainability.
Q: WOULD YOU LIKE TO LEAVE A FINAL MESSAGE?
JMN: I would like to say to our shareholders that we have a good company with high quality assets and a team which is grounded in solid principles and values. We are ambitious but not unrealistic, so we are going to base our growth in areas that fit our low risk investment profile and we are going to fund this growth by executing our strategic agenda. Renewable energy is one of the most competitive sources of energy and has an excellent and important future.
With that said, I would like to thank our employees for their hard work and dedication and our shareholders for their continuing trust and belief in our mission.

2013 MANAGEMENT REPORT : EDP RENOVÁVEIS
10
NEV
ER
EN
DIN
G E
NER
GY
2013 MANAGEMENT REPORT : EDP RENOVÁVEIS
NEV
ER
EN
DIN
G E
NER
GY
11

2013 MANAGEMENT REPORT : EDP RENOVÁVEIS
12
NEV
ER
EN
DIN
G E
NER
GY
COMPANY PRESENTATION EDPR is a leading renewable energy company, an expert in the development, construction and operation of wind farms and solar plants.
Incorporated in 2007 with the clear objective of supplying a growing number of countries with CO2 free and renewable energy, EDPR has quickly grown to become a global company and a front-runner in this market. With an installed capacity of 8.5 GW and 19.9 TWh generated in 2013, EDPR is the third largest producer of wind energy in the world.
02. BRAZIL
24 EMPLOYEES 84 INSTALLED CAPACITY (EBITDA MW) 230 GENERATION (GWh) 0 UNDER CONSTRUCTION (MW)
01. NORTH AMERICA
United States, Canada 300 EMPLOYEES 3,667 INSTALLED CAPACITY (EBITDA MW) 10,146 GENERATION (GWh) 200 UNDER CONSTRUCTION (MW)
2013 MANAGEMENT REPORT: EDP RENOVÁVEIS
NEV
ER
EN
DIN
G E
NER
GY
13
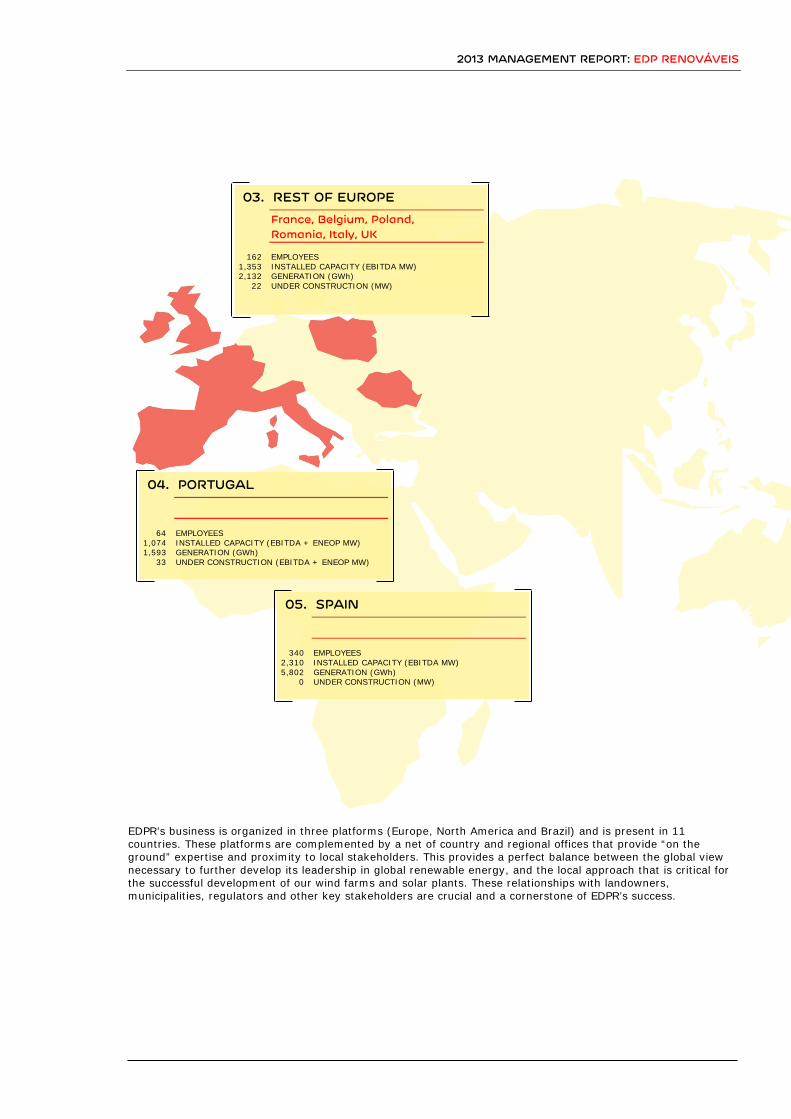
EDPR’s business is organized in three platforms (Europe, North America and Brazil) and is present in 11 countries. These platforms are complemented by a net of country and regional offices that provide “on the ground” expertise and proximity to local stakeholders. This provides a perfect balance between the global view necessary to further develop its leadership in global renewable energy, and the local approach that is critical for the successful development of our wind farms and solar plants. These relationships with landowners, municipalities, regulators and other key stakeholders are crucial and a cornerstone of EDPR’s success.
05. SPAIN
340 EMPLOYEES 2,310 INSTALLED CAPACITY (EBITDA MW) 5,802 GENERATION (GWh) 0 UNDER CONSTRUCTION (MW)
03. REST OF EUROPE
France, Belgium, Poland, Romania, Italy, UK
162 EMPLOYEES 1,353 INSTALLED CAPACITY (EBITDA MW) 2,132 GENERATION (GWh) 22 UNDER CONSTRUCTION (MW)
04. PORTUGAL
64 EMPLOYEES 1,074 INSTALLED CAPACITY (EBITDA + ENEOP MW) 1,593 GENERATION (GWh) 33 UNDER CONSTRUCTION (EBITDA + ENEOP MW)

2013 MANAGEMENT REPORT: EDP RENOVÁVEIS
NEV
ER
EN
DIN
G E
NER
GY
14
VISION, VALUES, AND COMMITTMENTS
VISION A global renewable energy company,
leader in value creation, innovation,
and sustainability
VALUES INITIATIVE Demonstrated through
the behaviour and
attitude of our people.
TRUST Of shareholders,
customers, suppliers and
other stakeholders.
EXCELLENCE In the way
we perform.
SUSTAINABILITY Aimed at improving the
quality of life for present
and future generations.
INNOVATION With the objective of creating
value within the various areas
in which we operate.
COMMITTMENTS
SUSTAINABILITY We assume the social and environmental responsibilities that result from our performance thus contributing toward the development of the regions in which we are operating.
We avoid specific greenhouse gas emissions with the energy we produce.
Ensure the participatory, competent and honest governance of our business.
PEOPLE We join conduct and professional rigour to enthusiasm and initiative, emphasizing team work.
We promote the development of skills and merit.
We believe that the balance between private and professional life is fundamental in order to be successful.
RESULTS We fulfil the commitments that we embraced in the presence of our shareholders.
We are leaders due to our capacity of anticipating and implementing.
We demand excellence in everything that we do.
STAKEHOLDERS We place ourselves in our Stakeholders’ shoes whenever a decision has to be made.
We listen to our Stakeholders and answer in a simple and clear manner.
We surprise our Stakeholders by anticipating their needs.
2013 MANAGEMENT REPORT: EDP RENOVÁVEIS
NEV
ER
EN
DIN
G E
NER
GY
15
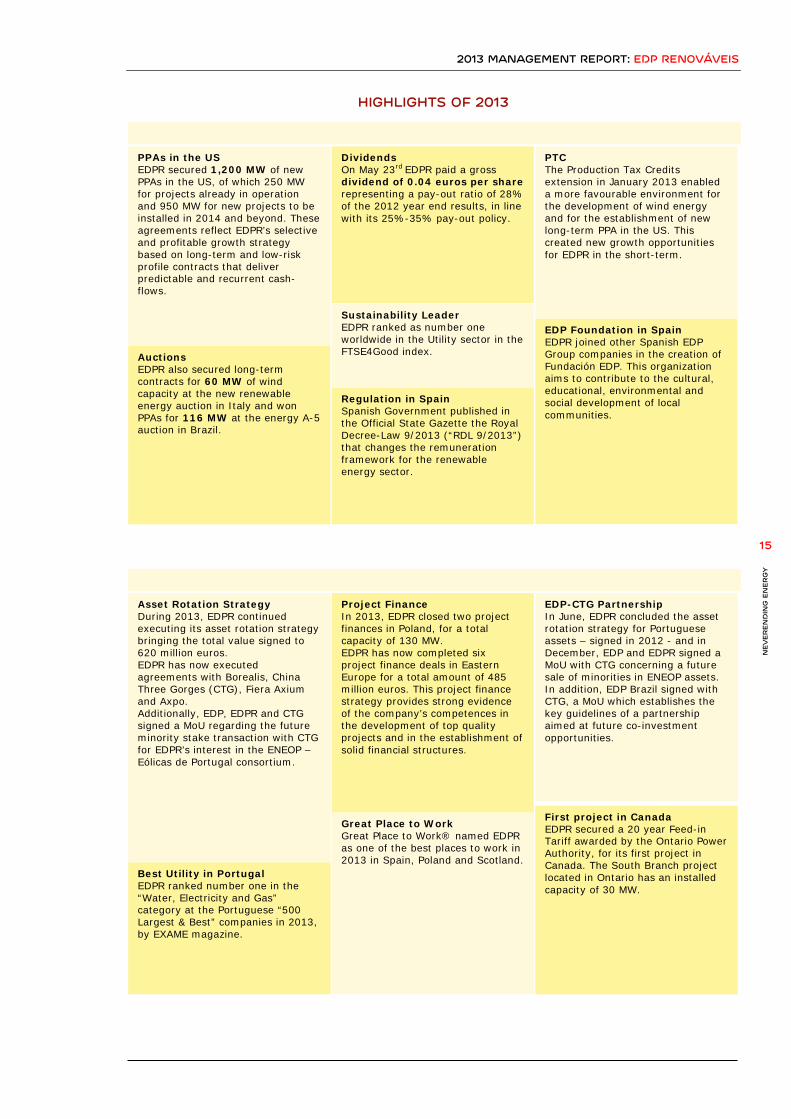
HIGHLIGHTS OF 2013
PPAs in the US EDPR secured 1,200 MW of new PPAs in the US, of which 250 MW for projects already in operation and 950 MW for new projects to be installed in 2014 and beyond. These agreements reflect EDPR’s selective and profitable growth strategy based on long-term and low-risk profile contracts that deliver predictable and recurrent cash-flows.
Auctions EDPR also secured long-term contracts for 60 MW of wind capacity at the new renewable energy auction in Italy and won PPAs for 116 MW at the energy A-5 auction in Brazil.
Dividends On May 23rd EDPR paid a gross dividend of 0.04 euros per share representing a pay-out ratio of 28% of the 2012 year end results, in line with its 25%-35% pay-out policy.
Sustainability Leader EDPR ranked as number one worldwide in the Utility sector in the FTSE4Good index.
Regulation in Spain Spanish Government published in the Official State Gazette the Royal Decree-Law 9/2013 (“RDL 9/2013”) that changes the remuneration framework for the renewable energy sector.
PTC The Production Tax Credits extension in January 2013 enabled a more favourable environment for the development of wind energy and for the establishment of new long-term PPA in the US. This created new growth opportunities for EDPR in the short-term.
EDP Foundation in Spain EDPR joined other Spanish EDP Group companies in the creation of Fundación EDP. This organization aims to contribute to the cultural, educational, environmental and social development of local communities.
Asset Rotation Strategy During 2013, EDPR continued executing its asset rotation strategy bringing the total value signed to 620 million euros. EDPR has now executed agreements with Borealis, China Three Gorges (CTG), Fiera Axium and Axpo. Additionally, EDP, EDPR and CTG signed a MoU regarding the future minority stake transaction with CTG for EDPR’s interest in the ENEOP – Eólicas de Portugal consortium.
Best Utility in Portugal EDPR ranked number one in the “Water, Electricity and Gas” category at the Portuguese “500 Largest & Best” companies in 2013, by EXAME magazine.
Project Finance In 2013, EDPR closed two project finances in Poland, for a total capacity of 130 MW. EDPR has now completed six project finance deals in Eastern Europe for a total amount of 485 million euros. This project finance strategy provides strong evidence of the company’s competences in the development of top quality projects and in the establishment of solid financial structures.
Great Place to Work Great Place to Work® named EDPR as one of the best places to work in 2013 in Spain, Poland and Scotland.
EDP-CTG Partnership In June, EDPR concluded the asset rotation strategy for Portuguese assets – signed in 2012 - and in December, EDP and EDPR signed a MoU with CTG concerning a future sale of minorities in ENEOP assets. In addition, EDP Brazil signed with CTG, a MoU which establishes the key guidelines of a partnership aimed at future co-investment opportunities.
First project in Canada EDPR secured a 20 year Feed-in Tariff awarded by the Ontario Power Authority, for its first project in Canada. The South Branch project located in Ontario has an installed capacity of 30 MW.
2013 MANAGEMENT REPORT : EDP RENOVÁVEIS
NEV
ER
EN
DIN
G E
NER
GY
16
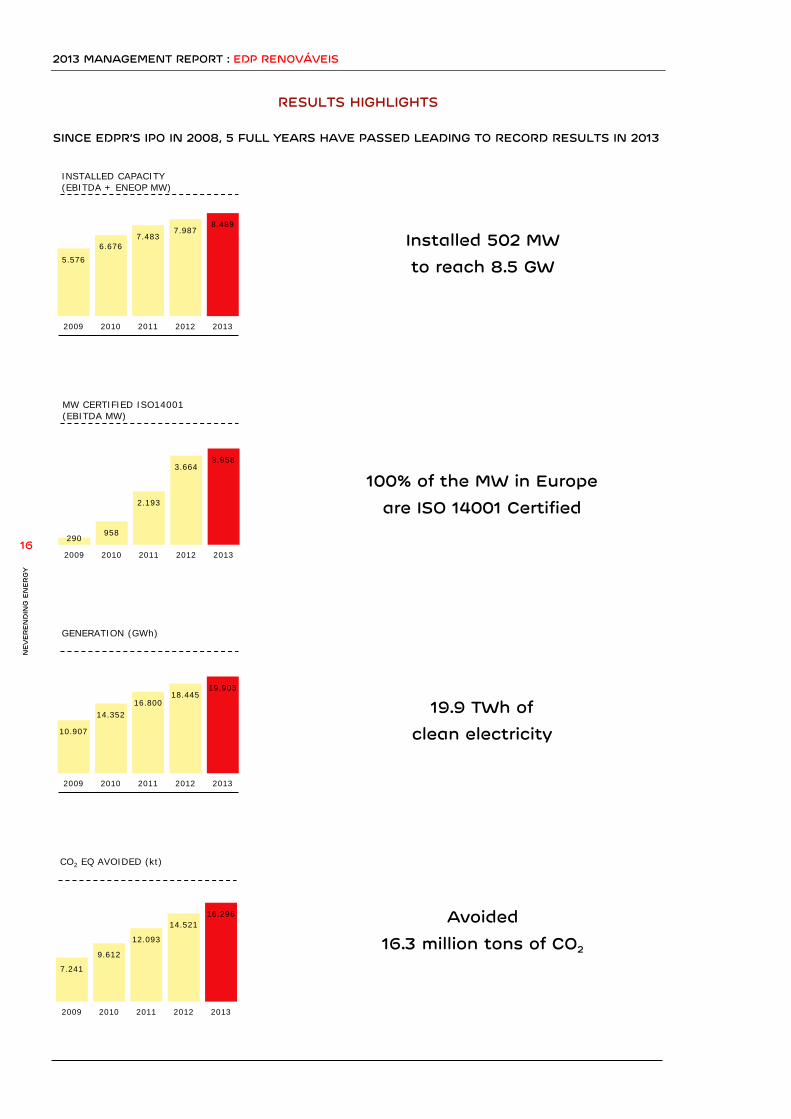
RESULTS HIGHLIGHTS
SINCE EDPR’S IPO IN 2008, 5 FULL YEARS HAVE PASSED LEADING TO RECORD RESULTS IN 2013
16.296 14.521
12.093
9.612
7.241
20132012201120102009
CO2 EQ AVOIDED (kt)
8.489 7.987
7.483 6.676
5.576
20132012201120102009
INSTALLED CAPACITY (EBITDA + ENEOP MW)
3.958 3.664
2.193
958 290
20132012201120102009
MW CERTIFIED ISO14001 (EBITDA MW)
19.903 18.445
16.800 14.352
10.907
20132012201120102009
GENERATION (GWh)
Installed 502 MW to reach 8.5 GW
100% of the MW in Europe
are ISO 14001 Certified
19.9 TWh of clean electricity
Avoided
16.3 million tons of CO2
2013 MANAGEMENT REPORT : EDP RENOVÁVEIS
NEV
ER
EN
DIN
G E
NER
GY
17
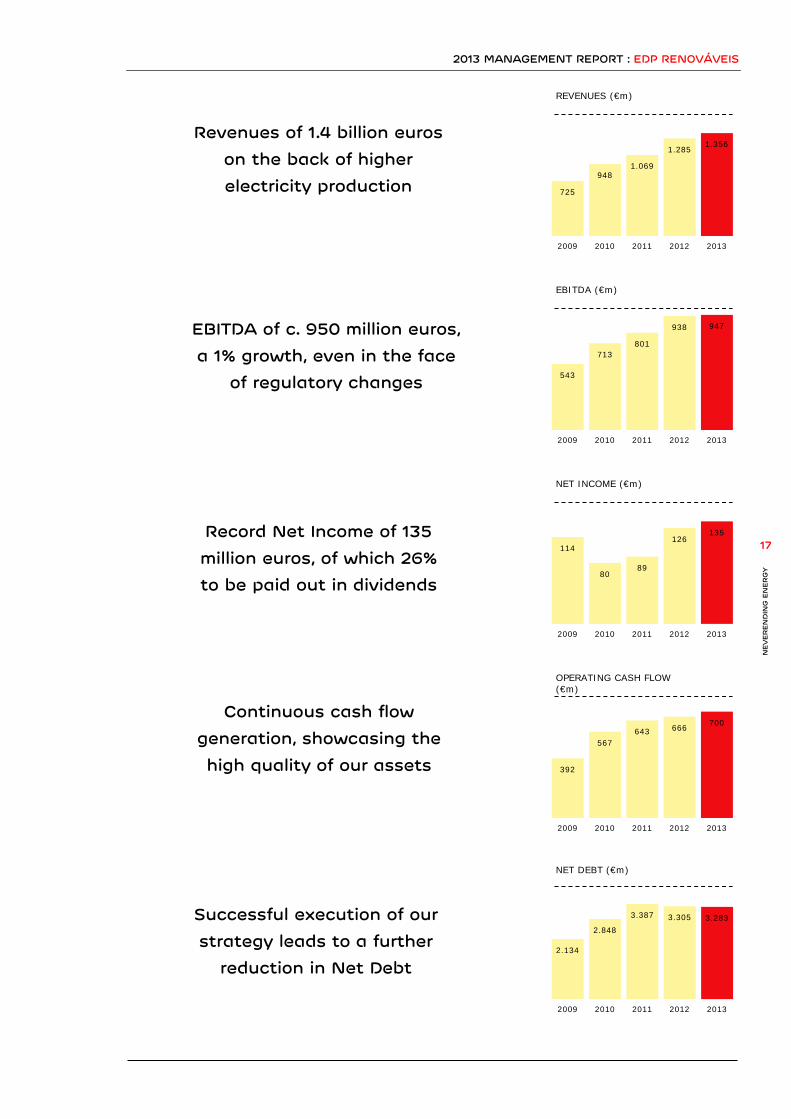
700 666 643 567
392
20132012201120102009
OPERATING CASH FLOW (€m)
135 126
89 80
114
20132012201120102009
NET INCOME (€m)
947 938
801 713
543
20132012201120102009
EBITDA (€m)
1.356 1.285
1.069 948
725
20132012201120102009
REVENUES (€m)
Successful execution of our
strategy leads to a further reduction in Net Debt
Continuous cash flow
generation, showcasing the
high quality of our assets
Record Net Income of 135
million euros, of which 26% to be paid out in dividends
EBITDA of c. 950 million euros,
a 1% growth, even in the face of regulatory changes
Revenues of 1.4 billion euros
on the back of higher
electricity production
3.283 3.305 3.387
2.848
2.134
20132012201120102009
NET DEBT (€m)

2013 MANAGEMENT REPORT : EDP RENOVÁVEIS
NEV
ER
EN
DIN
G E
NER
GY
18
1.2. BUSINESS MODEL
EDPR’S GOAL IS TO BUILD THE SAFEST, MOST EFFICIENT AND COST COMPETITIVE PROJECTS. WHICH FACTORS ARE RELEVANT WHEN CHOOSING A SITE?
To guarantee premium performance of its assets, EDPR carefully analyses the site in terms of the quality of renewable resources, topography, type of soil, and assesses the proximity to transmission lines in order to deliver electricity generated to the grid. The historical data of the renewable resource, such as wind direction, speed and density, and solar radiance, is critical to successfully develop a project.
HOW LONG DOES IT TAKE TO COLLECT THE DATA?
To capture and record the most accurate data, EDPR installs sensors and meteorological masts and uses internal models and software tools to analyse the data collected. The process of collecting and analysing data varies from project to project but usually takes about 2 years. The data will then be used to design the most efficient wind farm layout and choose the most suitable generator model.
IS WIND FARM LAYOUT CRITICAL FOR OPERATIONAL PERFORMANCE?
The wind farm layout is key to optimizing the energy that can be captured from the wind. To maximize the electricity that can be produced and maintain cost efficiency, EDPR’s energy assessment team designs the layout considering meteorological fundamentals, thermal and topographic effects and variations in wind due to turbine height.
HOW LONG DOES IT TAKE TO BUILD A WIND FARM?
The construction of a wind farm typically last from six months to one year, depending on the size of the project and soil conditions. The civil infrastructure of a wind farm includes the turbine foundation, permanent and temporary access roads, temporary crane walk paths, erection crane pads and improvements to public roads. Along with the civil infrastructure, medium voltage collection systems and the main transformer substation are also built in order to transfer the electricity from the wind farm to the grid.
2013 MANAGEMENT REPORT : EDP RENOVÁVEIS
NEV
ER
EN
DIN
G E
NER
GY
19
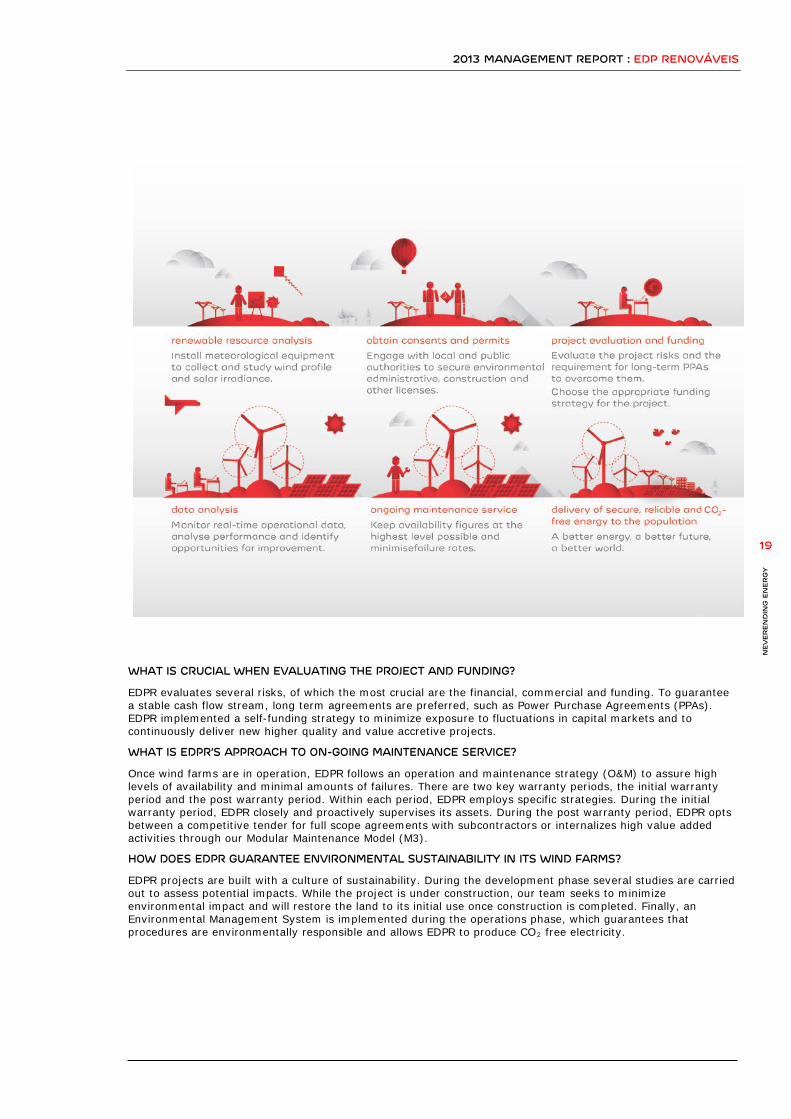
WHAT IS CRUCIAL WHEN EVALUATING THE PROJECT AND FUNDING?
EDPR evaluates several risks, of which the most crucial are the financial, commercial and funding. To guarantee a stable cash flow stream, long term agreements are preferred, such as Power Purchase Agreements (PPAs). EDPR implemented a self-funding strategy to minimize exposure to fluctuations in capital markets and to continuously deliver new higher quality and value accretive projects.
WHAT IS EDPR’S APPROACH TO ON-GOING MAINTENANCE SERVICE?
Once wind farms are in operation, EDPR follows an operation and maintenance strategy (O&M) to assure high levels of availability and minimal amounts of failures. There are two key warranty periods, the initial warranty period and the post warranty period. Within each period, EDPR employs specific strategies. During the initial warranty period, EDPR closely and proactively supervises its assets. During the post warranty period, EDPR opts between a competitive tender for full scope agreements with subcontractors or internalizes high value added activities through our Modular Maintenance Model (M3).
HOW DOES EDPR GUARANTEE ENVIRONMENTAL SUSTAINABILITY IN ITS WIND FARMS?
EDPR projects are built with a culture of sustainability. During the development phase several studies are carried out to assess potential impacts. While the project is under construction, our team seeks to minimize environmental impact and will restore the land to its initial use once construction is completed. Finally, an Environmental Management System is implemented during the operations phase, which guarantees that procedures are environmentally responsible and allows EDPR to produce CO2 free electricity.

2013 MANAGEMENT REPORT : EDP RENOVÁVEIS
NEV
ER
EN
DIN
G E
NER
GY
20
30% 29%
20132012
NET CAPACITY FACTOR (%)
98% 97%
20132012
TECHNICAL AVAILABILITY (%)
1.3. STRATEGY
EDPR’S STRATEGY IS BASED IN THREE MAIN PILLARS
EDPR’s strategy is based in delivering higher profitability supported by the performance of its premium assets and selective and profitable growth through a self-funded business model.
To capture new growth opportunities and expand operations, it is important to successfully select the best projects and to minimize dependence on external sources of funding.
QUALITY ASSETS DELIVERING INCREASED PROFITABILITY As of December 2013, EDPR managed a global portfolio of 8.5 GW spread over 10 countries, of which 8.0 GW fully consolidated (EBITDA MW) with additional 455 MW equity consolidated through its interest in the Eólicas de Portugal consortium. EDPR’s portfolio has low exposure to electricity market volatility as 93% of the installed capacity has pre-defined remuneration schemes with a long-term profile and only 7% is exposed to US spot wholesale electricity markets.
Optimizing performance throughout a project’s life-cycle is a key priority at EDPR. EDPR’s superior know-how and expertise guided by internal models drives operational metrics above the market, resulting in premium net capacity factors and high levels of availability. EDPR’s focus on high operational efficiency metrics, with a comprehensive O&M strategy, is crucial to keep costs under control and key to achieve quality financial metrics.
INCREASED PROFITABILITY
SELECTIVE GROWTH
SELF-FUNDED BUSINESS MODEL
Premium load factors
Efficient operations
Cost control
Credibility on targets
Successful growth shift
Over 1,200 MW of new PPA
Solid operating cash-flow
Long-term fixed debt
Asset rotation strategy
46 47
20132012
OPEX/MW* (€k)
* Excludes levies & write-offs

2013 MANAGEMENT REPORT : EDP RENOVÁVEIS
NEV
ER
EN
DIN
G E
NER
GY
21
SELECTIVE AND PROFITABLE GROWTH To grow profitably and create solid value, EDPR has a low risk strategy when it comes to energy prices. By entering markets with predictable prices through long-term power purchase agreements, EDPR is able to define its future in advance and achieve solid visibility of the projects’ stable cash-flow stream.
1,200 MW of new PPAs secured in the US
Since the extension of the PTCs in the United States in early 2013, EDPR secured 1,200 MW of PPAs in the US market with 950 MW for new projects to be installed in 2014 and beyond. The successful outcome from securing long-term PPA agreements reinforces EDPR’s shift to markets with a low risk profile.
Besides United States, EDPR was also granted during 2013 with new 20-year contracts for projects to be installed in Italy (60 MW) and Brazil (116 MW). The new long-term contract in Brazil, adds to a total of 236 MW of capacity already awarded in Brazil, reinforcing the growth potential of this market. France remains a market where EDPR will continue to grow by taking advantage of its low risk remuneration system.
EDPR continues to pursue new long-term PPAs along with contracts awarded in energy auctions, as these provide predictable prices over the useful life of the projects, allowing the company to define its future in advance and to create value thought projects with solid and visible cash flows.
SELF-FUNDED BUSINESS MODEL In 2012, EDPR implemented a financial policy that embraces being independent from external funding sources to pursue its growth strategy. In capital intensive businesses, such as renewable energy, it is crucial to have visibility on the company’s ability to raise funds to add new value accretive projects when a project is still in the final stages of development. With this mind-set it is of the upmost importance to make sure the operating cash-flow of the assets already installed is maximized as this will be the main source of funds for the company’s growth.
In order to achieve this strategic pillar, while maximizing the execution of growth opportunities, EDPR implemented its Asset Rotation Strategy. The purpose is to sell minority stakes in operational assets with a low risk profile and reinvest the proceeds in new higher value accretive projects. With the successful execution, EDPR also crystallizes the value of the asset upfront and accelerates the value growth cycle.
620 million euros already signed with Borealis, CTG, Fiera Axium and Axpo
Since the asset rotation strategy was implemented, EDPR has successfully executed four transactions totalling 620 million euros and signed a MoU envisaging an additional one. This remarkable track record in the Asset Rotation strategy, besides being crucial to continue adding news projects to the company’s portfolio, also provides a good benchmark of the value of EDPR’s assets to the capital markets.
In 2013, EDPR concluded the transactions structured in December 2012 with China Three Gorges (CTG) covering EDPR’s wind farms in Portugal (613 MW) and executed deals with Fiera Axium for a 97 MW wind farm in the United States and with Axpo Power for a portfolio of 100 MW in France. Also in 2013 EDPR signed a MoU with CTG envisaging an asset rotation strategy in relation with EDPR’s interest in the ENEOP consortium, which is to amount to 535 MW when the construction of the project is finalized.
EDPR’s asset rotation strategy leverages on critical expertise in creating value in the project’s initial stages, transforming high risk projects into low risk profile assets with a long useful life and stable and visible cash flows. This strategy allows EDPR to monetize the value of the project’s future cash flows, while maintaining operating control of the wind farms, and re-investing the proceeds in the development of new higher quality and value accretive projects.
MW
Duration
State
PPAS SIGNED In Operations 250 MW 20 Years Oklahoma 2014 Projects 300 MW 20 Years Indiana/California 2015 Projects 200 MW 20 Years Oklahoma/California 2016 Projects 450 MW 15/20 Years Maine/Kansas

2013 MANAGEMENT REPORT : EDP RENOVÁVEIS
NEV
ER
EN
DIN
G E
NER
GY
22
1.4. RISK MANAGEMENT
Consistent with the maintaining a controlled and low risk profile, EDPR has a Risk Management Process that defines the mechanisms for evaluation and management of risks and opportunities impacting the business. This process increases the likelihood of EDPR achieving its operational and financial targets, by minimizing fluctuations of financial results without compromising returns.
RISK MANAGEMENT PROCESS EDPR’s Risk Management Process is an integrated and transversal management model that ensures the implementation of best practices of Corporate Governance and transparency in the communication to the market and shareholders. This process is closely followed and supervised by the Audit and Control Committee, an independent supervisory body composed of non-executive members.
The purpose of the Risk Management process is to ensure the alignment of EDPR’s risk exposure with the company’s desired risk profile. It consists of the identification and prioritization of risks, the development of adequate risk management policies, and their implementation. Risk management policies are aimed to mitigate risks, without ignoring potential opportunities, thus, optimizing return versus risk exposure.
Risk management is endorsed by the Executive Committee, supported by the Risk Committee and implemented in day-to-day decisions by all managers of the company. It is supported by three distinct organizational functions, each one with a different role: Strategy (Risk Profiler), Management (Risk Manager) and Controlling (Risk Controller).
These three risk functions work together and meet in the Risk Committee, the forum to discuss global risk policies to be implemented and to control the risk exposure of the company.
RISK AREAS AND MAIN RISK FACTORS Risk Management at EDPR is focused on covering the market, credit and operational risks of the company. In order to have a holistic view of risks, they were grouped into Risk Areas spanning the three phases of our business model. Within each Risk Area, risks are classified in Risk Groups and finally into Risk Factors. Risk factors are the source of the risk and the purpose of Risk Management at EDPR is to measure, control and eventually mitigate all risk factors that affect the company.
During 2013, EDPR defined or reviewed four new Global Risk Policies: Energy Price Hedging Policy, Counterparty Credit Risk Policy, Country Risk Policy and FX Risk Policy. These policies are already implemented or will be implemented throughout 2014. They tackled those Risk Groups with highest impact in EDPR’s financial results.
NEW FOCUS ON COUNTERPARTY CREDIT RISK AT EDPR WHAT IS COUNTERPARTY CREDIT RISK?
Counterparty credit risk is the risk that the counterparty of a transaction could default before the final settlement of the transaction’s cash flows. An economic loss could occur if the transactions or portfolio of transactions with the counterparty has a positive economic value at the time of default.
WHO ARE EDPR’S COUNTERPARTIES?
From a credit risk perspective, EDPR classifies its counterparties in to three different groups: Energy off-takers, suppliers (developers, partners, WTG suppliers and O&M suppliers) and financial institutions.
COUNTERPARTY CREDIT RISK POLICY AT EDPR
During 2013, EDPR introduced a new Global Counterparty Credit Risk Policy. To control credit risk at EDPR, thresholds of Expected Loss and Unexpected Loss are established, as defined under Basel Standards, and re-evaluated monthly. If threshold is surpassed by any counterparty or by the company as a whole, mitigation measures are implemented in order to remain within the pre-established limit.
Expected Loss threshold by counterparty
Energy/Suppliers/Financial
2013 MANAGEMENT REPORT : EDP RENOVÁVEIS
NEV
ER
EN
DIN
G E
NER
GY
23
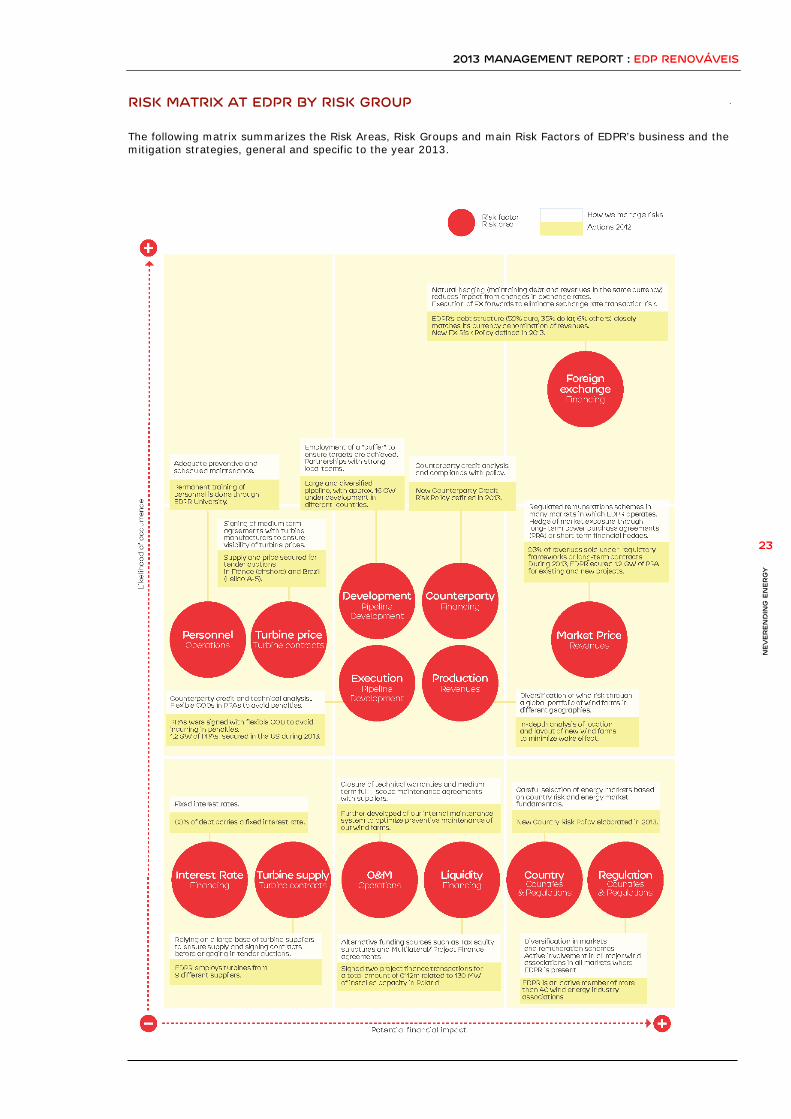
RISK MATRIX AT EDPR BY RISK GROUP The following matrix summarizes the Risk Areas, Risk Groups and main Risk Factors of EDPR’s business and the mitigation strategies, general and specific to the year 2013.
2013 MANAGEMENT REPORT : EDP RENOVÁVEIS
NEV
ER
EN
DIN
G E
NER
GY
24
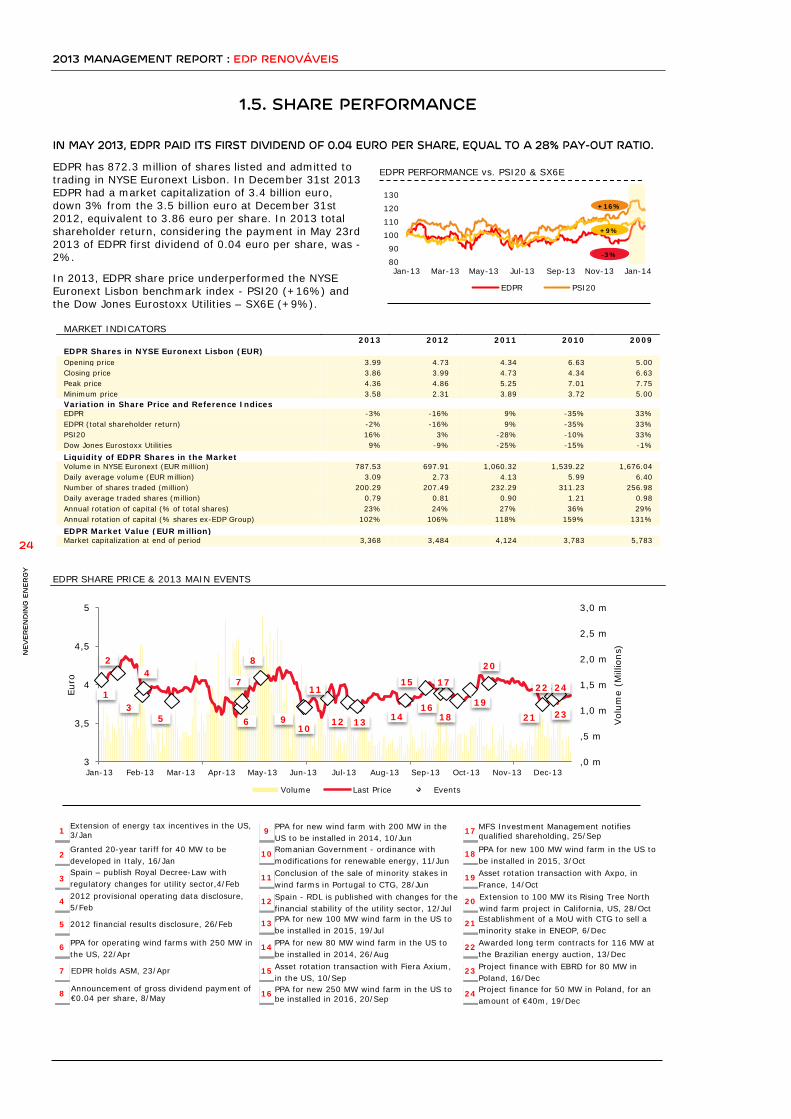
1.5. SHARE PERFORMANCE IN MAY 2013, EDPR PAID ITS FIRST DIVIDEND OF 0.04 EURO PER SHARE, EQUAL TO A 28% PAY-OUT RATIO.
EDPR has 872.3 million of shares listed and admitted to trading in NYSE Euronext Lisbon. In December 31st 2013 EDPR had a market capitalization of 3.4 billion euro, down 3% from the 3.5 billion euro at December 31st 2012, equivalent to 3.86 euro per share. In 2013 total shareholder return, considering the payment in May 23rd 2013 of EDPR first dividend of 0.04 euro per share, was -2%.
In 2013, EDPR share price underperformed the NYSE Euronext Lisbon benchmark index - PSI20 (+16%) and the Dow Jones Eurostoxx Utilities – SX6E (+9%).
EDPR SHARE PRICE & 2013 MAIN EVENTS
MARKET INDICATORS
2013 2012 2011 2010 2009
EDPR Shares in NYSE Euronext Lisbon (EUR) Opening price 3.99 4.73 4.34 6.63 5.00 Closing price 3.86 3.99 4.73 4.34 6.63 Peak price 4.36 4.86 5.25 7.01 7.75 Minimum price 3.58 2.31 3.89 3.72 5.00 Variation in Share Price and Reference Indices
EDPR -3% -16% 9% -35% 33% EDPR (total shareholder return) -2% -16% 9% -35% 33% PSI20 16% 3% -28% -10% 33% Dow Jones Eurostoxx Utilities 9% -9% -25% -15% -1% Liquidity of EDPR Shares in the Market
Volume in NYSE Euronext (EUR million) 787.53 697.91 1,060.32 1,539.22 1,676.04 Daily average volume (EUR million) 3.09 2.73 4.13 5.99 6.40 Number of shares traded (million) 200.29 207.49 232.29 311.23 256.98 Daily average traded shares (million) 0.79 0.81 0.90 1.21 0.98 Annual rotation of capital (% of total shares) 23% 24% 27% 36% 29% Annual rotation of capital (% shares ex-EDP Group) 102% 106% 118% 159% 131% EDPR Market Value (EUR million)
Market capitalization at end of period 3,368 3,484 4,124 3,783 5,783
1
2
3
4
5
6
7
8
Granted 20-year tariff for 40 MW to be developed in Italy, 16/Jan Spain – publish Royal Decree-Law with regulatory changes for utility sector,4/Feb 2012 provisional operating data disclosure, 5/Feb
2012 financial results disclosure, 26/Feb
PPA for operating wind farms with 250 MW in the US, 22/Apr
EDPR holds ASM, 23/Apr
Extension of energy tax incentives in the US, 3/Jan
Announcement of gross dividend payment of €0.04 per share, 8/May
9
10
11
12
13
14
15
16
Spain - RDL is published with changes for the financial stability of the utility sector, 12/Jul
PPA for new wind farm with 200 MW in the US to be installed in 2014, 10/Jun Romanian Government - ordinance with modifications for renewable energy, 11/Jun Conclusion of the sale of minority stakes in wind farms in Portugal to CTG, 28/Jun
PPA for new 100 MW wind farm in the US to be installed in 2015, 19/Jul PPA for new 80 MW wind farm in the US to be installed in 2014, 26/Aug Asset rotation transaction with Fiera Axium, in the US, 10/Sep PPA for new 250 MW wind farm in the US to be installed in 2016, 20/Sep
17
18
19
20
21
22
24
23
MFS Investment Management notifies qualified shareholding, 25/Sep PPA for new 100 MW wind farm in the US to be installed in 2015, 3/Oct Asset rotation transaction with Axpo, in France, 14/Oct Extension to 100 MW its Rising Tree North wind farm project in California, US, 28/Oct Establishment of a MoU with CTG to sell a minority stake in ENEOP, 6/Dec Awarded long term contracts for 116 MW at the Brazilian energy auction, 13/Dec Project finance with EBRD for 80 MW in Poland, 16/Dec Project finance for 50 MW in Poland, for an amount of €40m, 19/Dec
8090
100110120130
Jan-13 Mar-13 May-13 Jul-13 Sep-13 Nov-13 Jan-14
EDPR PERFORMANCE vs. PSI20 & SX6E
EDPR PSI20
-3% +9% +16%
3
3,5
4
4,5
5
,0 m
,5 m
1,0 m
1,5 m
2,0 m
2,5 m
3,0 m
Jan-13 Feb-13 Mar-13 Apr-13 May-13 Jun-13 Jul-13 Aug-13 Sep-13 Oct-13 Nov-13 Dec-13
Euro
Vol
ume
(Mill
ions
)
Volume Last Price Events
3
11
10 9
8
6
7
5
4 2
17 15
14 13 12
19 18
20
21 16
24
23
22 1

2013 MANAGEMENT REPORT : EDP RENOVÁVEIS
NEV
ER
EN
DIN
G E
NER
GY
25
At the Annual Shareholders’ meeting of 2010, the Board of Directors was authorized, during a term of five years from the date of the General Shareholders Meeting, for the derivative acquisition and sale of own shares by the Company and/or other affiliate companies, to the maximum limit established by the Law and in accordance with its terms. EDPR has not executed any acquisition and consequently any trade of its own shares.

2013 MANAGEMENT REPORT : EDP RENOVÁVEIS
NEV
ER
EN
DIN
G E
NER
GY
26

2013 MANAGEMENT REPORT : EDP RENOVÁVEIS
NEV
ER
EN
DIN
G E
NER
GY
27
Index
WHY INVEST IN RENEWABLES? 28 Business Case 28
Competitiveness of Mature Technologies 29 Price vs. Cost 29
Investments and New Technologies 30
02
2013 MANAGEMENT REPORT : EDP RENOVÁVEIS
NEV
ER
EN
DIN
G E
NER
GY
28
2. WHY INVEST IN RENEWABLES?
2.1. BUSINESS CASE
RENEWABLE ENERGY PROVIDES SUBSTANTIAL BENEFITS FOR OUR ECONOMY, CLIMATE AND HEALTH.
BENEFITS FOR OUR ECONOMY Renewable energy brings benefits for our economy, mainly from three angles: enhanced security of supply, lower energy bills for end-consumers and job creation.
Enhanced security of supply: Access to cheap energy has become essential to the wealth of modern economies. However, the unbalanced distribution of fossil fuel supplies among countries has led to significant vulnerabilities. Threats to global energy security include political instability of energy producing countries, fluctuating energy supplies, competition over energy resources, among others. Energy dependence puts many countries in a very vulnerable position as it introduces a risk in the price of the imported fuels as well as a potential exposure on its future availability. For example, European’s oil and gas import bills in 2012 was estimated at €470 billion which corresponded to 3.4% of the EU’s GDP. In contrast, renewable sources use endogenous and unlimited resources such as wind, sun, plant residues, heat from the earth and fast-moving water, which enhance the security of supply, hence removing exposure to fluctuations of fuel prices and concerns about the availability of external supply.
Lower energy bills: Energy-consumers may benefit from lower energy bills as renewables reduce electricity prices. Renewable energy provides affordable electricity as these technologies have negligible variable costs which contributes to reduced wholesale prices. This is in stark contrast to conventional plants which have more expensive fuel costs. Although the cost of investment is high, on a unitary basis, future costs are expected to decline as technology becomes more efficient.
Job creation: Studies show that renewable energy is associated with significant job creation. Although countries that manufacture, install and export renewable energy technologies are likely to create the largest share of gross jobs, countries without this local industry will also benefit from new jobs related to development, construction and, once renewable plants are commissioned, operation and maintenance activities. Compared to conventional technologies, the renewable energy industry is more labour-intensive, meaning that, on average, more jobs are created for each unit of electricity generated from renewables than from conventional technologies.
According to the Political Economy Research Institute at the University of Massachusetts, investing in renewable energy is around 300 per cent more effective than investing in fossil fuel or nuclear jobs. This study concludes that for every million dollars invested in the wind sector it creates 13 jobs. In contrast, only 5 jobs would be created in the natural gas sector and 7 in the coal sector.
BENEFITS FOR OUR CLIMATE Renewable energy plants produce zero to few greenhouse gases (GHG) emissions. In contrast, conventional energy generation is responsible for most of the human-produced GHG emissions, which trap heat in the atmosphere, driving up our planet’s temperature, raising the level of our oceans (“global warming”) and provoking harmful consequences on our health, climate and environment.
Therefore, increasing the deployment of renewable energy is probably the most effective way to fight global warming as it allows the replacement of fuel-burning plants with cleaner energy facilities.
BENEFITS FOR OUR HEALTH Renewable energy sources promote a cleaner air space since they avoid GHG emissions coming from thermal generation. Also, renewable energy sources reduce the amount of oil, gas and coal mining necessary, and therefore, reduce the likelihood of accidental spills and nuclear accidents that these activities may cause. In addition, renewables technologies typically don´t require water to operate and therefore neither pollute water resources, nor compete for them.
2013 MANAGEMENT REPORT : EDP RENOVÁVEIS
NEV
ER
EN
DIN
G E
NER
GY
29
2.2. COMPETITIVENESS OF MATURE TECHNOLOGIES
ARE RENEWABLE ENERGIES A LUXURY? When one needs to decide which electricity generation technology to invest in, to support or to be used to cope with the incremental electricity demand, there is a divide between renewable energies and conventional technologies. This division is also very commonly discussed in daily conversations between people around the world.
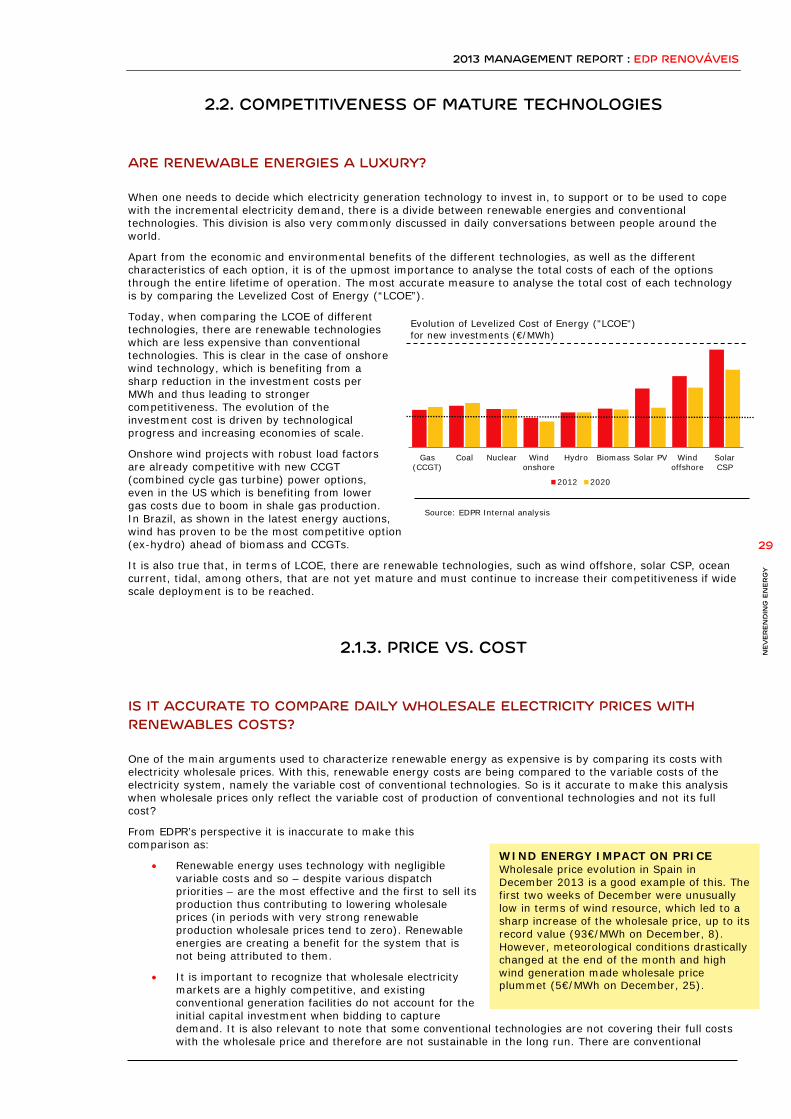
Apart from the economic and environmental benefits of the different technologies, as well as the different characteristics of each option, it is of the upmost importance to analyse the total costs of each of the options through the entire lifetime of operation. The most accurate measure to analyse the total cost of each technology is by comparing the Levelized Cost of Energy (“LCOE”).
Today, when comparing the LCOE of different technologies, there are renewable technologies which are less expensive than conventional technologies. This is clear in the case of onshore wind technology, which is benefiting from a sharp reduction in the investment costs per MWh and thus leading to stronger competitiveness. The evolution of the investment cost is driven by technological progress and increasing economies of scale.
Onshore wind projects with robust load factors are already competitive with new CCGT (combined cycle gas turbine) power options, even in the US which is benefiting from lower gas costs due to boom in shale gas production. In Brazil, as shown in the latest energy auctions, wind has proven to be the most competitive option (ex-hydro) ahead of biomass and CCGTs.
It is also true that, in terms of LCOE, there are renewable technologies, such as wind offshore, solar CSP, ocean current, tidal, among others, that are not yet mature and must continue to increase their competitiveness if wide scale deployment is to be reached.
2.1.3. PRICE VS. COST
IS IT ACCURATE TO COMPARE DAILY WHOLESALE ELECTRICITY PRICES WITH RENEWABLES COSTS? One of the main arguments used to characterize renewable energy as expensive is by comparing its costs with electricity wholesale prices. With this, renewable energy costs are being compared to the variable costs of the electricity system, namely the variable cost of conventional technologies. So is it accurate to make this analysis when wholesale prices only reflect the variable cost of production of conventional technologies and not its full cost?
From EDPR’s perspective it is inaccurate to make this comparison as:
• Renewable energy uses technology with negligible variable costs and so – despite various dispatch priorities – are the most effective and the first to sell its production thus contributing to lowering wholesale prices (in periods with very strong renewable production wholesale prices tend to zero). Renewable energies are creating a benefit for the system that is not being attributed to them.
• It is important to recognize that wholesale electricity markets are a highly competitive, and existing conventional generation facilities do not account for the initial capital investment when bidding to capture demand. It is also relevant to note that some conventional technologies are not covering their full costs with the wholesale price and therefore are not sustainable in the long run. There are conventional
WIND ENERGY IMPACT ON PRICE Wholesale price evolution in Spain in December 2013 is a good example of this. The first two weeks of December were unusually low in terms of wind resource, which led to a sharp increase of the wholesale price, up to its record value (93€/MWh on December, 8). However, meteorological conditions drastically changed at the end of the month and high wind generation made wholesale price plummet (5€/MWh on December, 25).
Gas(CCGT)
Coal Nuclear Windonshore
Hydro Biomass Solar PV Windoffshore
SolarCSP
Evolution of Levelized Cost of Energy ("LCOE") for new investments (€/MWh)
2012 2020
Source: EDPR Internal analysis
2013 MANAGEMENT REPORT : EDP RENOVÁVEIS
NEV
ER
EN
DIN
G E
NER
GY
30
technologies that receive additional revenue on top of the wholesale price, including capacity payments and payments for ancillary grid-support services.
• The average life of the different assets in the energy mix distorts the analyses as comparisons are made between renewable assets with few years of operation with conventional facilities where the investment costs are already partially or fully amortised.
The problem of market prices not reflecting the cost structure of energy facilities is not specific to renewable energy. Electricity generation is generally a capital-intensive industry and the variable price obtained in wholesale energy markets is not sufficient to cover the full cost structure, as wholesale markets only create competition and pressure on the company’s variable costs. To reduce the high risk attributed by investors to this type of investments – due to the volatility of wholesale markets and the low visibility on the recapture of fixed cost component –regulatory systems were established.
In order to improve competition and to provide investor visibility on returns, ex-ante competition should be introduced to attribute licenses for new generation facilities. With this process, only the best and most efficient projects would be installed.
EDPR believes that long-term contracting is the most efficient way to remunerate generators as it entails the lowest possible cost for consumers by reducing the investment risk for operators and providing long-term visibility on returns.
The rationale is that, as electricity generation investments are capital-intensive, they require stability and visibility. When the regulatory framework doesn´t allow for this stability and visibility (for example, when participating in the wholesale spot market), investors will require a higher risk-premium. On the contrary, schemes providing higher visibility entail lower risk for the equity investor, lower financing costs for the financing entities that will allow lower cost of capital, and therefore lower the required profitability. Lower required profitability will translate into lower required remuneration, which will be passed to the final consumers that will benefit from lower electricity tariffs for the same level of renewable penetration.
2.4. INVESTMENTS AND NEW TECHNOLOGIES
In 2013, according to the Global Wind Energy Council (“GWEC”) 35.5 GW of new wind capacity were installed. China remains the main driver of global growth by adding 16.5 GW, nearly half of the total global new wind capacity, and reached 91 GW of installed capacity. According to the European Wind Energy Association (“EWEA”), 11.7 GW were installed in Europe during 2013, bringing the total installed capacity in the region to 121 GW, while based on the American Wind Energy Association (“AWEA”) only 1.1 GW were installed in the US reaching a total installed capacity of 61 GW.
EUROPE In the European Union (EU-28) the total wind capacity by the end of 2013 amounted to 117.3 GW and the electricity produced covered 8% of electricity demand. The year was marked by an increase in offshore technologies.
An annual addition of 11.1 GW, according to EWEA, represents a year over year decrease of 8%. The lower growth rate is reflection of the regulatory and political uncertainty in some European markets. However, despite the slowdown in yearly additions, wind power was the technology which installed the most, accounting for 32% of the new additions.
The new installations were mainly concentrated in two countries, Germany (3.2 GW) and the UK (1.9 GW), with an increasing presence in offshore wind. Germany continues to lead the European market in terms of installed capacity. Rounding out the top 5 are Poland (894 MW), Sweden (724 MW), and Romania (695 MW). EDPR is well positioned in several of these top markets.
Traditional large markets of Spain, Italy, and France saw their rate of new wind projects decrease in 2013, by 84%, 65% and 24% respectively, where regulatory changes in Spain drove the significant decline.
The offshore market in Europe had a record year in terms of new installation by adding an additional 1.6 GW, representing a 34% increase from 2012. For the year, Europe reached 6.6 GW of offshore wind installed capacity spread across 11 countries with the UK alone adding 733 MW, strengthening its worldwide offshore leadership, followed by Denmark (350 MW), Germany (240 MW), Belgium (192 MW) and Sweden (48 MW).
AMERICAS Uncertainty regarding the extension of the Production Tax Credit (“PTC”) and Investment Tax Credit (“ITC”) led to a dramatic 92% decrease in installed capacity to 1.1 GW in the United States. However, once the extensions were received, a flurry of construction activity ensued resulting in a record 12 GW of new projects under construction by year end, according to AWEA. 2014 will be a solid year for growth as these projects come online.
2013 MANAGEMENT REPORT : EDP RENOVÁVEIS
NEV
ER
EN
DIN
G E
NER
GY
31
For the rest of the region, Canada installed 1.6 GW of wind additions, including EDPR’s first project with 30 MW, while in Mexico 623 MW were added. Latin America was strongly represented by Brazil, another EDPR market, as it installed 948 MW, followed by Chile (130 MW), and Argentina (76 MW).
The renewable energy market is a growing and increasingly competitive arena which should continue to do well as investment costs decline and regulatory and general support is achieved.
2013 MANAGEMENT REPORT : EDP RENOVÁVEIS
NEV
ER
EN
DIN
G E
NER
GY
32
2013 MANAGEMENT REPORT : EDP RENOVÁVEIS
NEV
ER
EN
DIN
G E
NER
GY
33
Index
EDPR INTEGRATED OPERATIONS 34 PREMIUM ASSETS 34
Capacity 34 Generation 36
Selling Price 37 EXCELLENCE IN OPERATIONS 39
Development 40 Engineering and Construction 41
Operations 42 Human Capital 45
03
2013 MANAGEMENT REPORT : EDP RENOVÁVEIS
NEV
ER
EN
DIN
G E
NER
GY
34
3. EDPR INTEGRATED OPERATIONS
3.1. PREMIUM ASSETS
3.1.1. CAPACITY EDPR IS A WORLDWIDE MARKET LEADER
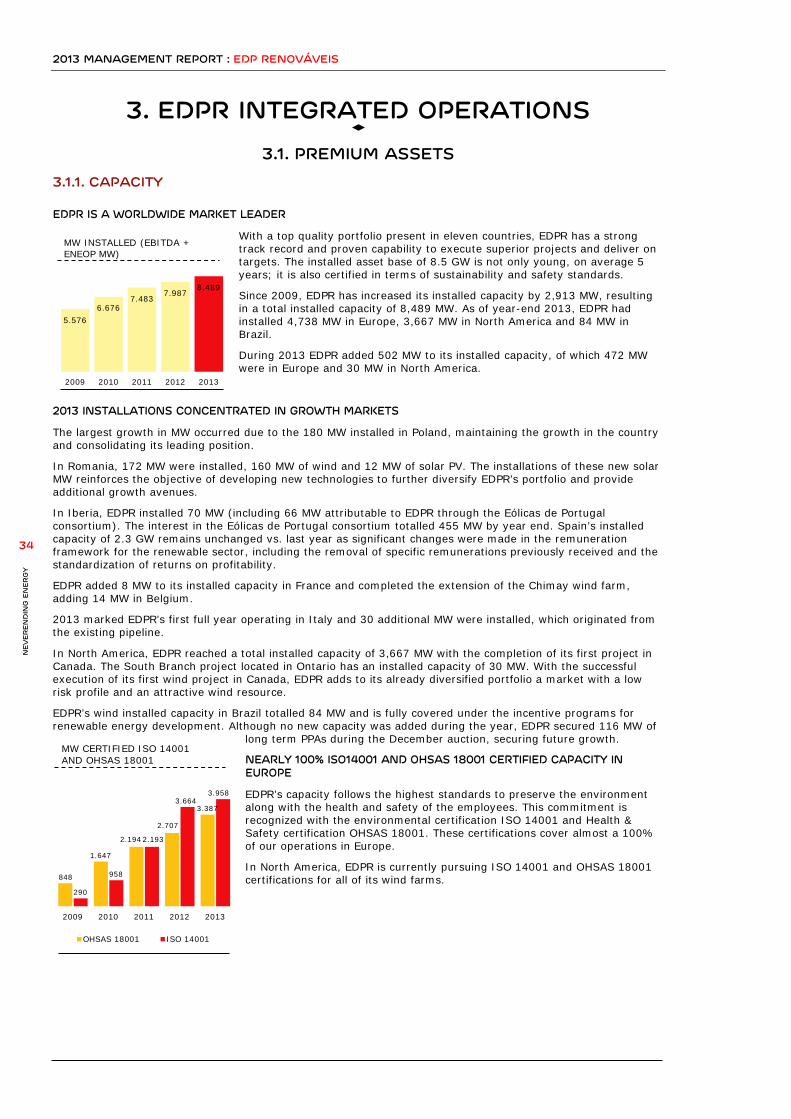
With a top quality portfolio present in eleven countries, EDPR has a strong track record and proven capability to execute superior projects and deliver on targets. The installed asset base of 8.5 GW is not only young, on average 5 years; it is also certified in terms of sustainability and safety standards.
Since 2009, EDPR has increased its installed capacity by 2,913 MW, resulting in a total installed capacity of 8,489 MW. As of year-end 2013, EDPR had installed 4,738 MW in Europe, 3,667 MW in North America and 84 MW in Brazil.
During 2013 EDPR added 502 MW to its installed capacity, of which 472 MW were in Europe and 30 MW in North America.
2013 INSTALLATIONS CONCENTRATED IN GROWTH MARKETS
The largest growth in MW occurred due to the 180 MW installed in Poland, maintaining the growth in the country and consolidating its leading position.
In Romania, 172 MW were installed, 160 MW of wind and 12 MW of solar PV. The installations of these new solar MW reinforces the objective of developing new technologies to further diversify EDPR’s portfolio and provide additional growth avenues.
In Iberia, EDPR installed 70 MW (including 66 MW attributable to EDPR through the Eólicas de Portugal consortium). The interest in the Eólicas de Portugal consortium totalled 455 MW by year end. Spain’s installed capacity of 2.3 GW remains unchanged vs. last year as significant changes were made in the remuneration framework for the renewable sector, including the removal of specific remunerations previously received and the standardization of returns on profitability.
EDPR added 8 MW to its installed capacity in France and completed the extension of the Chimay wind farm, adding 14 MW in Belgium.
2013 marked EDPR’s first full year operating in Italy and 30 additional MW were installed, which originated from the existing pipeline.
In North America, EDPR reached a total installed capacity of 3,667 MW with the completion of its first project in Canada. The South Branch project located in Ontario has an installed capacity of 30 MW. With the successful execution of its first wind project in Canada, EDPR adds to its already diversified portfolio a market with a low risk profile and an attractive wind resource.
EDPR’s wind installed capacity in Brazil totalled 84 MW and is fully covered under the incentive programs for renewable energy development. Although no new capacity was added during the year, EDPR secured 116 MW of
long term PPAs during the December auction, securing future growth.
NEARLY 100% ISO14001 AND OHSAS 18001 CERTIFIED CAPACITY IN EUROPE
EDPR’s capacity follows the highest standards to preserve the environment along with the health and safety of the employees. This commitment is recognized with the environmental certification ISO 14001 and Health & Safety certification OHSAS 18001. These certifications cover almost a 100% of our operations in Europe.
In North America, EDPR is currently pursuing ISO 14001 and OHSAS 18001 certifications for all of its wind farms.
8.489 7.987
7.483 6.676
5.576
20132012201120102009
MW INSTALLED (EBITDA + ENEOP MW)
848
1.647
2.194
2.707
3.387
290
958
2.193
3.664 3.958
2009 2010 2011 2012 2013
MW CERTIFIED ISO 14001 AND OHSAS 18001
OHSAS 18001 ISO 14001
2013 MANAGEMENT REPORT : EDP RENOVÁVEIS
NEV
ER
EN
DIN
G E
NER
GY
35
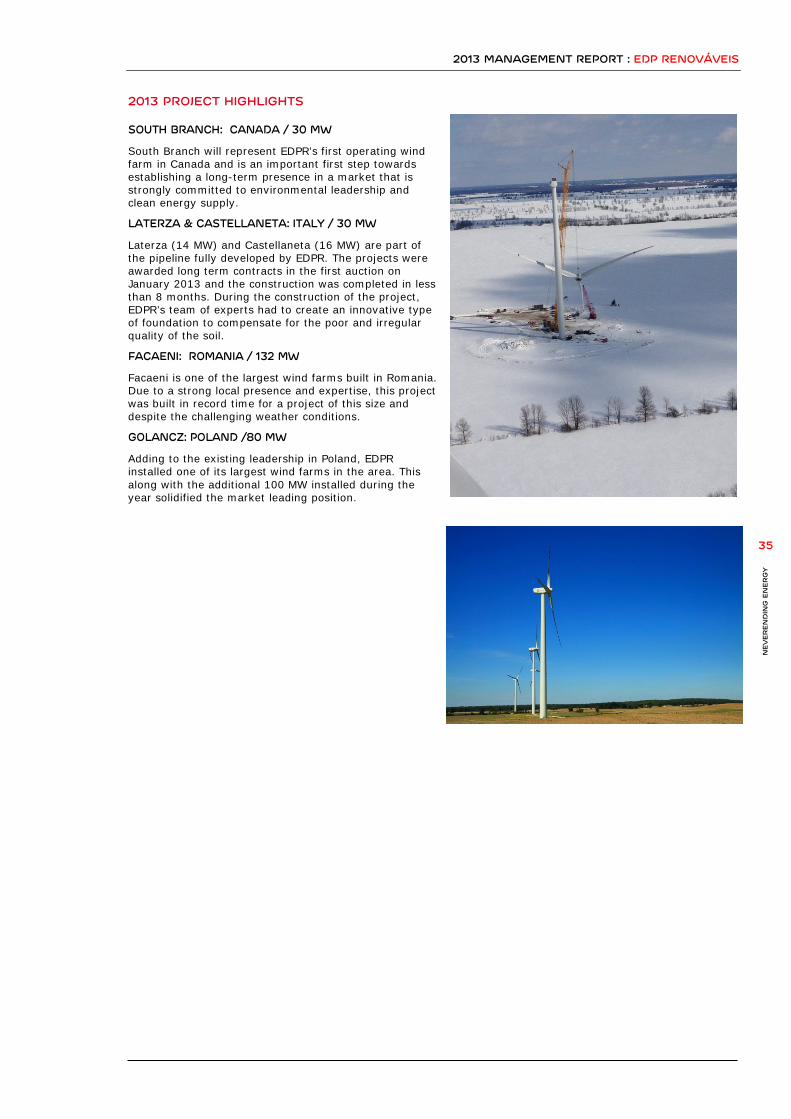
2013 PROJECT HIGHLIGHTS SOUTH BRANCH: CANADA / 30 MW
South Branch will represent EDPR’s first operating wind farm in Canada and is an important first step towards establishing a long-term presence in a market that is strongly committed to environmental leadership and clean energy supply.
LATERZA & CASTELLANETA: ITALY / 30 MW
Laterza (14 MW) and Castellaneta (16 MW) are part of the pipeline fully developed by EDPR. The projects were awarded long term contracts in the first auction on January 2013 and the construction was completed in less than 8 months. During the construction of the project, EDPR’s team of experts had to create an innovative type of foundation to compensate for the poor and irregular quality of the soil.
FACAENI: ROMANIA / 132 MW
Facaeni is one of the largest wind farms built in Romania. Due to a strong local presence and expertise, this project was built in record time for a project of this size and despite the challenging weather conditions.
GOLANCZ: POLAND /80 MW
Adding to the existing leadership in Poland, EDPR installed one of its largest wind farms in the area. This along with the additional 100 MW installed during the year solidified the market leading position.
2013 MANAGEMENT REPORT : EDP RENOVÁVEIS
NEV
ER
EN
DIN
G E
NER
GY
36
3.1.2. GENERATION NEARLY 2X INCREASE OVER THE LAST 5 YEARS
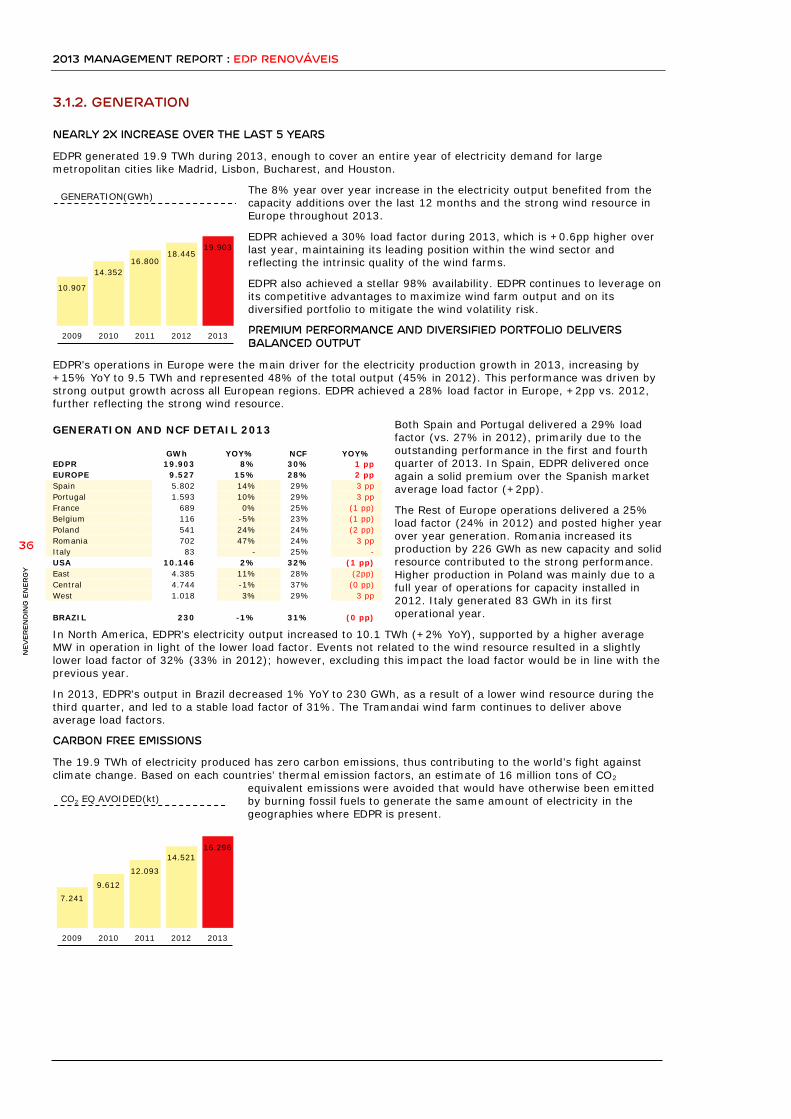
EDPR generated 19.9 TWh during 2013, enough to cover an entire year of electricity demand for large metropolitan cities like Madrid, Lisbon, Bucharest, and Houston.
The 8% year over year increase in the electricity output benefited from the capacity additions over the last 12 months and the strong wind resource in Europe throughout 2013.
EDPR achieved a 30% load factor during 2013, which is +0.6pp higher over last year, maintaining its leading position within the wind sector and reflecting the intrinsic quality of the wind farms.
EDPR also achieved a stellar 98% availability. EDPR continues to leverage on its competitive advantages to maximize wind farm output and on its diversified portfolio to mitigate the wind volatility risk.
PREMIUM PERFORMANCE AND DIVERSIFIED PORTFOLIO DELIVERS BALANCED OUTPUT
EDPR’s operations in Europe were the main driver for the electricity production growth in 2013, increasing by +15% YoY to 9.5 TWh and represented 48% of the total output (45% in 2012). This performance was driven by strong output growth across all European regions. EDPR achieved a 28% load factor in Europe, +2pp vs. 2012, further reflecting the strong wind resource.
Both Spain and Portugal delivered a 29% load factor (vs. 27% in 2012), primarily due to the outstanding performance in the first and fourth quarter of 2013. In Spain, EDPR delivered once again a solid premium over the Spanish market average load factor (+2pp).
The Rest of Europe operations delivered a 25% load factor (24% in 2012) and posted higher year over year generation. Romania increased its production by 226 GWh as new capacity and solid resource contributed to the strong performance. Higher production in Poland was mainly due to a full year of operations for capacity installed in 2012. Italy generated 83 GWh in its first operational year.
In North America, EDPR’s electricity output increased to 10.1 TWh (+2% YoY), supported by a higher average MW in operation in light of the lower load factor. Events not related to the wind resource resulted in a slightly lower load factor of 32% (33% in 2012); however, excluding this impact the load factor would be in line with the previous year.
In 2013, EDPR's output in Brazil decreased 1% YoY to 230 GWh, as a result of a lower wind resource during the third quarter, and led to a stable load factor of 31%. The Tramandai wind farm continues to deliver above average load factors.
CARBON FREE EMISSIONS
The 19.9 TWh of electricity produced has zero carbon emissions, thus contributing to the world’s fight against climate change. Based on each countries’ thermal emission factors, an estimate of 16 million tons of CO2
equivalent emissions were avoided that would have otherwise been emitted by burning fossil fuels to generate the same amount of electricity in the geographies where EDPR is present.
GENERATION AND NCF DETAIL 2013
GWh
YOY%
NCF
YOY%
EDPR
19.903
8%
30%
1 pp EUROPE
9.527
15%
28%
2 pp
Spain 5.802
14% 29%
3 pp Portugal 1.593
10% 29%
3 pp
France 689
0% 25%
(1 pp) Belgium 116
-5% 23%
(1 pp)
Poland 541
24% 24%
(2 pp) Romania 702
47% 24%
3 pp
Italy 83
- 25%
- USA
10.146
2%
32%
(1 pp)
East 4.385
11% 28%
(2pp) Central 4.744
-1% 37%
(0 pp)
West 1.018
3% 29%
3 pp
BRAZIL
230
-1%
31%
(0 pp)
19.903 18.445
16.800 14.352
10.907
20132012201120102009
GENERATION(GWh)
16.296 14.521
12.093
9.612 7.241
20132012201120102009
CO2 EQ AVOIDED(kt)
2013 MANAGEMENT REPORT : EDP RENOVÁVEIS
NEV
ER
EN
DIN
G E
NER
GY
37
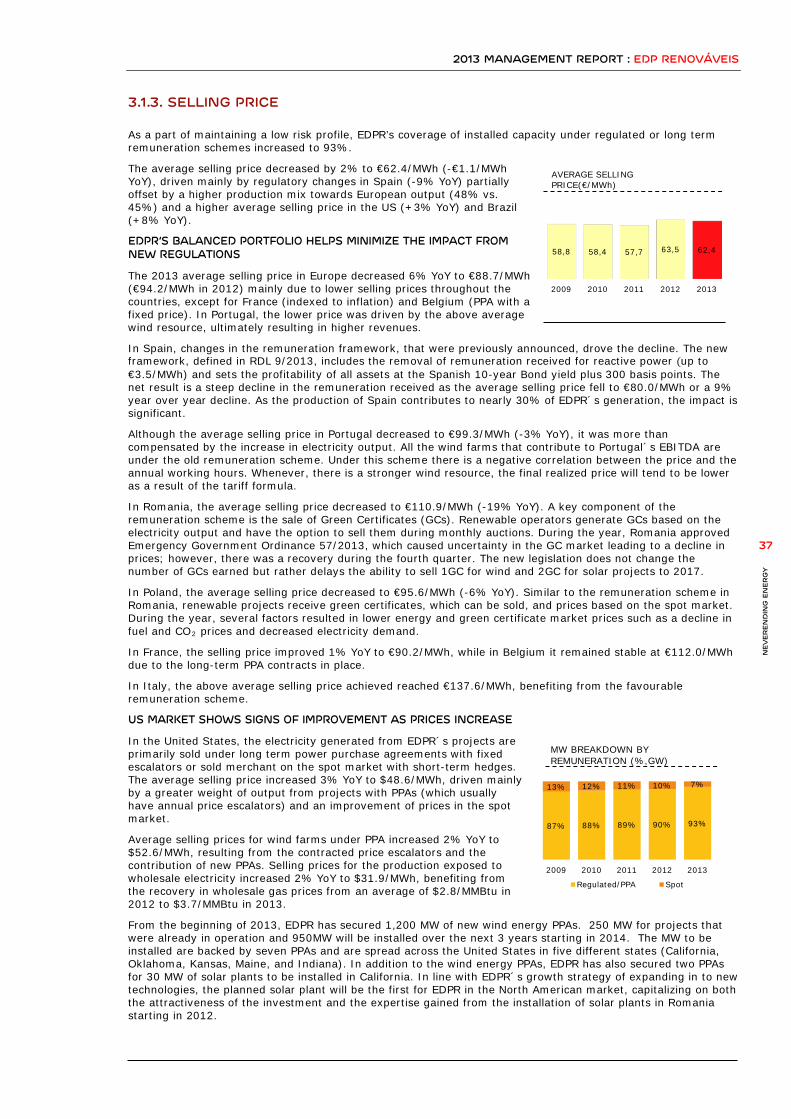
3.1.3. SELLING PRICE As a part of maintaining a low risk profile, EDPR’s coverage of installed capacity under regulated or long term remuneration schemes increased to 93%.
The average selling price decreased by 2% to €62.4/MWh (-€1.1/MWh YoY), driven mainly by regulatory changes in Spain (-9% YoY) partially offset by a higher production mix towards European output (48% vs. 45%) and a higher average selling price in the US (+3% YoY) and Brazil (+8% YoY).
EDPR’S BALANCED PORTFOLIO HELPS MINIMIZE THE IMPACT FROM NEW REGULATIONS
The 2013 average selling price in Europe decreased 6% YoY to €88.7/MWh (€94.2/MWh in 2012) mainly due to lower selling prices throughout the countries, except for France (indexed to inflation) and Belgium (PPA with a fixed price). In Portugal, the lower price was driven by the above average wind resource, ultimately resulting in higher revenues.
In Spain, changes in the remuneration framework, that were previously announced, drove the decline. The new framework, defined in RDL 9/2013, includes the removal of remuneration received for reactive power (up to €3.5/MWh) and sets the profitability of all assets at the Spanish 10-year Bond yield plus 300 basis points. The net result is a steep decline in the remuneration received as the average selling price fell to €80.0/MWh or a 9% year over year decline. As the production of Spain contributes to nearly 30% of EDPR´s generation, the impact is significant.
Although the average selling price in Portugal decreased to €99.3/MWh (-3% YoY), it was more than compensated by the increase in electricity output. All the wind farms that contribute to Portugal´s EBITDA are under the old remuneration scheme. Under this scheme there is a negative correlation between the price and the annual working hours. Whenever, there is a stronger wind resource, the final realized price will tend to be lower as a result of the tariff formula.
In Romania, the average selling price decreased to €110.9/MWh (-19% YoY). A key component of the remuneration scheme is the sale of Green Certificates (GCs). Renewable operators generate GCs based on the electricity output and have the option to sell them during monthly auctions. During the year, Romania approved Emergency Government Ordinance 57/2013, which caused uncertainty in the GC market leading to a decline in prices; however, there was a recovery during the fourth quarter. The new legislation does not change the number of GCs earned but rather delays the ability to sell 1GC for wind and 2GC for solar projects to 2017.
In Poland, the average selling price decreased to €95.6/MWh (-6% YoY). Similar to the remuneration scheme in Romania, renewable projects receive green certificates, which can be sold, and prices based on the spot market. During the year, several factors resulted in lower energy and green certificate market prices such as a decline in fuel and CO2 prices and decreased electricity demand.
In France, the selling price improved 1% YoY to €90.2/MWh, while in Belgium it remained stable at €112.0/MWh due to the long-term PPA contracts in place.
In Italy, the above average selling price achieved reached €137.6/MWh, benefiting from the favourable remuneration scheme.
US MARKET SHOWS SIGNS OF IMPROVEMENT AS PRICES INCREASE
In the United States, the electricity generated from EDPR´s projects are primarily sold under long term power purchase agreements with fixed escalators or sold merchant on the spot market with short-term hedges. The average selling price increased 3% YoY to $48.6/MWh, driven mainly by a greater weight of output from projects with PPAs (which usually have annual price escalators) and an improvement of prices in the spot market.
Average selling prices for wind farms under PPA increased 2% YoY to $52.6/MWh, resulting from the contracted price escalators and the contribution of new PPAs. Selling prices for the production exposed to wholesale electricity increased 2% YoY to $31.9/MWh, benefiting from the recovery in wholesale gas prices from an average of $2.8/MMBtu in 2012 to $3.7/MMBtu in 2013.
From the beginning of 2013, EDPR has secured 1,200 MW of new wind energy PPAs. 250 MW for projects that were already in operation and 950MW will be installed over the next 3 years starting in 2014. The MW to be installed are backed by seven PPAs and are spread across the United States in five different states (California, Oklahoma, Kansas, Maine, and Indiana). In addition to the wind energy PPAs, EDPR has also secured two PPAs for 30 MW of solar plants to be installed in California. In line with EDPR´s growth strategy of expanding in to new technologies, the planned solar plant will be the first for EDPR in the North American market, capitalizing on both the attractiveness of the investment and the expertise gained from the installation of solar plants in Romania starting in 2012.
62,4 63,5 57,7 58,4 58,8
20132012201120102009
AVERAGE SELLING PRICE(€/MWh)
87% 88% 89% 90% 93%
13% 12% 11% 10% 7%
2009 2010 2011 2012 2013
MW BREAKDOWN BY REMUNERATION (%,GW)
Regulated/PPA Spot

2013 MANAGEMENT REPORT : EDP RENOVÁVEIS
NEV
ER
EN
DIN
G E
NER
GY
38
Risk management is critical when the price received from generating electricity is subject to the uncertainty in the wholesale market. In order to improve certainty and decrease exposure to volatile spot prices, EDPR entered into power futures contracts, partially hedging US merchant exposure. This allowed EDPR to secure a fixed price for a stated volume and provide price stability and effectively reduce the monthly cash flow volatility due to the variation in market-driven electricity prices.
BRAZIL PRICES INCREASE IN LINE WITH ESCALATORS
In 2013, the average selling price in Brazil increased 8% to R$309.2/MWh, reflecting the updated PPA price in accordance with the adjustment for inflation.
REMUNERATION SCHEMES
Spain: -9% YoY 2,310 MW/ €80.0/MWh New regime: In July 2013 the Government changed the remuneration framework for existing facilities. According to the current secondary legislation draft, wind farms built in 2004 or earlier are not eligible to receive any incentive while newer farms will receive a flat premium per installed MW until the end of their regulatory life.
Portugal: -3% YoY 619 MW / €99.3/MWh Feed in tariff “Old Regime” – Tariff is calculated according to a formula that takes into account the load factor, installed capacity, among other parameters. Feed in tariff “New regime” – Price was defined with a different formula but similar parameters.
France: +1% YoY 322 MW / €90.2/MWh Feed-in tariff, stable for 15 years. First 10 years: receive approximately €82/MWh; inflation type indexation and with an “x” factor only until the start of operation.
Romania: -12% YoY 521 MW / €121.1/MWh Market price plus GC. Wind generators receive 2 GC for each MWh produced until 2017 (but one GC will be deferred from trading until March 2017). Solar receives 6 GC per MWh for 15 years (but 2 GC will be deferred from trading until March 2017).
Poland: -6% YoY 370 MW/ €95.6/MWh Market price plus GC. Option to choose a regulated electricity price (PLN201.4/MWh for 2013). DisCos have a substitution fee for non compliance with GC obligation, which in 2013 was PLN297.4/MWh. Option to negotiate long-term PPAs.
Belgium: 0% YoY 71 MW / €112.0/MWh Market price plus green certificate (GC) system. Separate GC prices with cap and floor for Wallonia (€65/MWh-100/MWh) and Flanders (€80/MWh-125/MWh). Option to negotiate long-term PPAs.
Italy: n.a.% YoY 70 MW / €137.6/MWh Market price plus green certificates (old regime). Long term PPA system set in a competitive tender (new regime).
United States: +3% YoY 3,667 MW / $48.6/MWh Electricity price – market price or long-term PPA - plus renewable energy certificates (RECs). In addition, a number of tax/governmental incentive schemes may apply, such as Production Tax Credits (PTCs), Cash Grants (CGs) and MACRs.
Brazil: +8% YoY 84 MW / R$309.2/MWh Feed-in-tariff – PROINFA. Long-term PPA system set in a competitive tender.
Country: %YoY Price Installed MW / 2013 Price Remuneration scheme
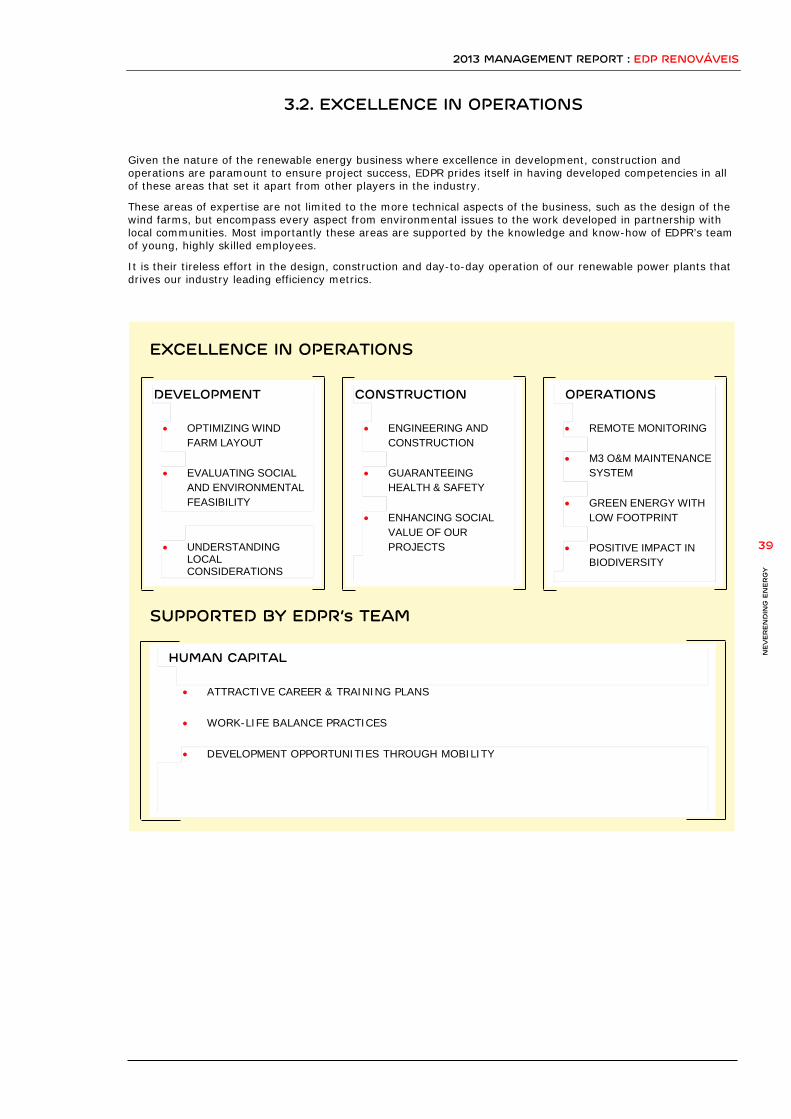
2013 MANAGEMENT REPORT : EDP RENOVÁVEIS
NEV
ER
EN
DIN
G E
NER
GY
39
3.2. EXCELLENCE IN OPERATIONS
Given the nature of the renewable energy business where excellence in development, construction and operations are paramount to ensure project success, EDPR prides itself in having developed competencies in all of these areas that set it apart from other players in the industry.
These areas of expertise are not limited to the more technical aspects of the business, such as the design of the wind farms, but encompass every aspect from environmental issues to the work developed in partnership with local communities. Most importantly these areas are supported by the knowledge and know-how of EDPR’s team of young, highly skilled employees.
It is their tireless effort in the design, construction and day-to-day operation of our renewable power plants that drives our industry leading efficiency metrics.
DEVELOPMENT
• OPTIMIZING WIND FARM LAYOUT
• EVALUATING SOCIAL AND ENVIRONMENTAL FEASIBILITY
• UNDERSTANDING LOCAL CONSIDERATIONS
CONSTRUCTION
• ENGINEERING AND CONSTRUCTION
• GUARANTEEING HEALTH & SAFETY
• ENHANCING SOCIAL VALUE OF OUR PROJECTS
OPERATIONS
• REMOTE MONITORING
• M3 O&M MAINTENANCE SYSTEM
• GREEN ENERGY WITH LOW FOOTPRINT
• POSITIVE IMPACT IN BIODIVERSITY
HUMAN CAPITAL
• ATTRACTIVE CAREER & TRAINING PLANS • WORK-LIFE BALANCE PRACTICES • DEVELOPMENT OPPORTUNITIES THROUGH MOBILITY
EXCELLENCE IN OPERATIONS
SUPPORTED BY EDPR’s TEAM

2013 MANAGEMENT REPORT : EDP RENOVÁVEIS
NEV
ER
EN
DIN
G E
NER
GY
40
3.2.1 DEVELOPMENT Industry leading load factors
16.3 GW of pipeline under development
Environmental and social criteria in project selection
The development stage of the project is by far the most critical. The choice of location, wind farm layout or wind turbine generator will influence the top-line return of the project for the next 25 years of operations. Once the wind farm is up and running, certain adjustments can be made to maximize output and reduce costs, however the fundamental drivers of return were decided years before, during development.
Finding the prime locations to build our wind farms and defining the optimal placing of the turbines is critical for a project’s success. Placing the turbine in a sub-optimal location could significantly reduce a wind turbine’s net capacity factor. For this reason, EDPR has implemented a thorough process that ensures the quality of the new additions to the global portfolio and tries to anticipate during the early stages of the development if a project will meet the highest standards defined by the company.
However, not only technical factors are taken into consideration during this initial process. Social and environmental aspects of potential sites are evaluated
before initiating the permitting process, following our environmental and biodiversity policy commitments, in order to ensure that our development portfolio only considers projects that can meet our highest environmental standards.
WIND FARM LAYOUT DESIGN EDPR uses a two stage process to determine the optimal layout for a wind farm to maximize the profitability of the project. This process is carried out by one of the most experienced teams in the industry, including experts with more than 10 years of experience.
One of the first steps of developing a project is to use complex mathematical models to produce a series of layout options. Information on wind speeds, wind direction, foundation costs and zone restrictions are among the many variables considered in the model. Once these options are developed it’s also important to consider the potential losses in energy output due to the “wake effect”.
This effect relates to the loss of energy and increased turbulence caused by rotating blades on downstream wind turbines. It is important to anticipate the potential impact and adjust the layout accordingly because once a wind farm is built no further changes can be made without a sizeable impact. The ultimate goal is to design a layout that will capture the maximum amount of the wind resource, minimize construction costs and avoid unsustainable areas.
Since a wind farm can become a part of the local community, their input is also critical to achieve our goals. Early engagement provides a valuable understanding of the social considerations of the sites and also ensures a good and smooth development. During this process, potential conditions that might be attached to the consent of the wind farm are discussed. These conditions can influence the layout, construction techniques, scheduling, post-consent monitoring, and studies. Public consultations are a standard practice to understand social considerations and are well attended by the locals and often receive coverage in the local media.
WIND TURBINE GENERATOR CHOICE As well as optimizing the layout of the wind farm, great effort is taken into choosing the best fit wind turbine generator for each site. When developing a new project our technical and procurement teams work closely to choose the model that will provide the best all-round profitability for the project. This is a delicate balance between the technical specifications of each model and the price offered by the manufacturer. The model selected is based on maximizing return, which based on the economics, could come at the expense of maximizing production.
EDPR manages more than 70 wind turbine models from 9 different suppliers in its global portfolio. The experience gained in working with a diversified portfolio of models helps ensure low turbine supply risk, high productivity and competitive pricing among turbine manufacturers.
26% 27%
25%
27%
29%
28%
25%
23%
25% 25%
2009 2010 2011 2012 2013
EDPR vs. Spanish Market Average
EDPR in SpainSpanish Market Average
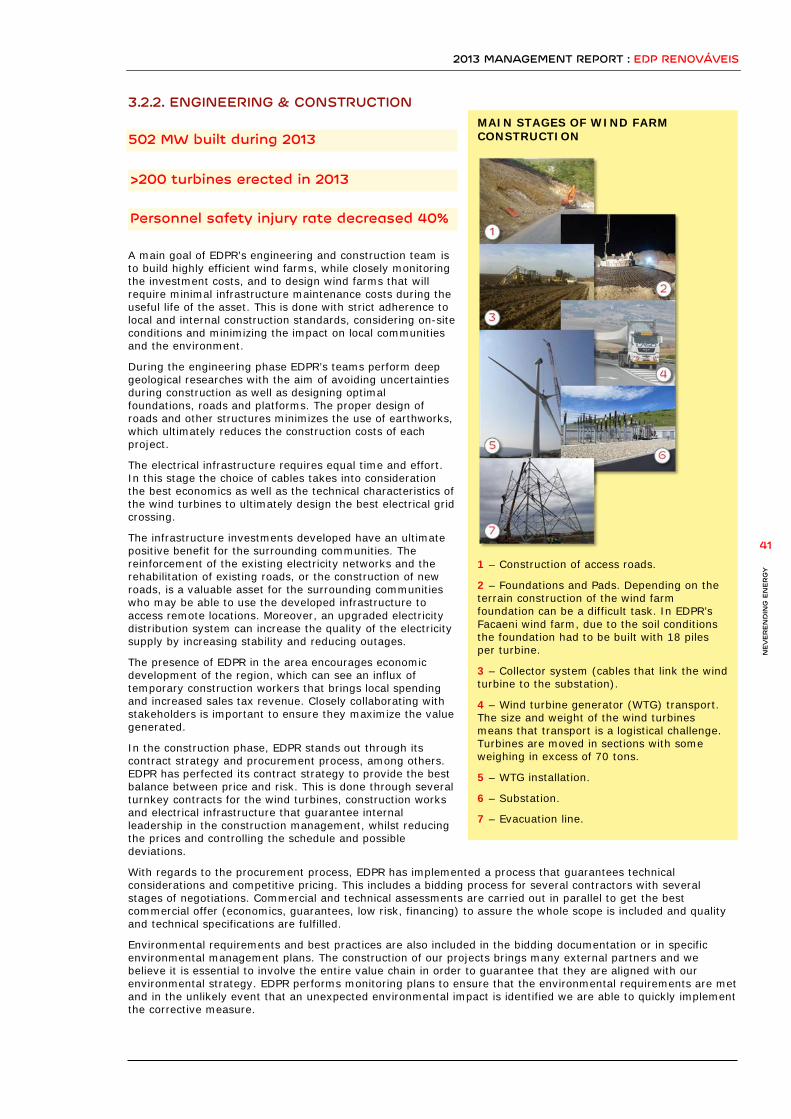
2013 MANAGEMENT REPORT : EDP RENOVÁVEIS
NEV
ER
EN
DIN
G E
NER
GY
41
3.2.2. ENGINEERING & CONSTRUCTION 502 MW built during 2013
>200 turbines erected in 2013
Personnel safety injury rate decreased 40% A main goal of EDPR’s engineering and construction team is to build highly efficient wind farms, while closely monitoring the investment costs, and to design wind farms that will require minimal infrastructure maintenance costs during the useful life of the asset. This is done with strict adherence to local and internal construction standards, considering on-site conditions and minimizing the impact on local communities and the environment.
During the engineering phase EDPR’s teams perform deep geological researches with the aim of avoiding uncertainties during construction as well as designing optimal foundations, roads and platforms. The proper design of roads and other structures minimizes the use of earthworks, which ultimately reduces the construction costs of each project.
The electrical infrastructure requires equal time and effort. In this stage the choice of cables takes into consideration the best economics as well as the technical characteristics of the wind turbines to ultimately design the best electrical grid crossing.
The infrastructure investments developed have an ultimate positive benefit for the surrounding communities. The reinforcement of the existing electricity networks and the rehabilitation of existing roads, or the construction of new roads, is a valuable asset for the surrounding communities who may be able to use the developed infrastructure to access remote locations. Moreover, an upgraded electricity distribution system can increase the quality of the electricity supply by increasing stability and reducing outages.
The presence of EDPR in the area encourages economic development of the region, which can see an influx of temporary construction workers that brings local spending and increased sales tax revenue. Closely collaborating with stakeholders is important to ensure they maximize the value generated.
In the construction phase, EDPR stands out through its contract strategy and procurement process, among others. EDPR has perfected its contract strategy to provide the best balance between price and risk. This is done through several turnkey contracts for the wind turbines, construction works and electrical infrastructure that guarantee internal leadership in the construction management, whilst reducing the prices and controlling the schedule and possible deviations.
With regards to the procurement process, EDPR has implemented a process that guarantees technical considerations and competitive pricing. This includes a bidding process for several contractors with several stages of negotiations. Commercial and technical assessments are carried out in parallel to get the best commercial offer (economics, guarantees, low risk, financing) to assure the whole scope is included and quality and technical specifications are fulfilled.
Environmental requirements and best practices are also included in the bidding documentation or in specific environmental management plans. The construction of our projects brings many external partners and we believe it is essential to involve the entire value chain in order to guarantee that they are aligned with our environmental strategy. EDPR performs monitoring plans to ensure that the environmental requirements are met and in the unlikely event that an unexpected environmental impact is identified we are able to quickly implement the corrective measure.
MAIN STAGES OF WIND FARM CONSTRUCTION
1 – Construction of access roads.
2 – Foundations and Pads. Depending on the terrain construction of the wind farm foundation can be a difficult task. In EDPR’s Facaeni wind farm, due to the soil conditions the foundation had to be built with 18 piles per turbine.
3 – Collector system (cables that link the wind turbine to the substation).
4 – Wind turbine generator (WTG) transport. The size and weight of the wind turbines means that transport is a logistical challenge. Turbines are moved in sections with some weighing in excess of 70 tons.
5 – WTG installation.
6 – Substation.
7 – Evacuation line.

2013 MANAGEMENT REPORT : EDP RENOVÁVEIS
NEV
ER
EN
DIN
G E
NER
GY
42
A SAFE ENVIRONMENT FOR OUR EMPLOYEES AND CONTRACTORS
Guaranteeing a healthy and safe work environment for our employees and contractors is fundamental in all aspects of the business. EDPR’s Health and Safety policy, available on our website, reflects the company’s commitment to the prevention of occupational risks associated with our activities.
To support our strategy on health and safety, we have implemented proper management systems. These systems are adapted to each country, with specific standards and procedures based on the regulation and best practices.
The Management System is being certified OHSAS 18001:2007. At the end of 2013, the certification covered 3,387 MW, representing 42% of EDPR’s installed capacity. The certification was additionally extended to Belgium and Romania.
During 2013, EDPR registered a substantial improvement in its health & safety ratios. The number of accidents registered for employees and contractor personnel reduced by 50%, an improvement towards our zero accidents goal stated in our Health & Safety policy.
3.2.3. OPERATIONS >5000 turbines remotely operated
97.7% availability
CO2 free electricity with a small water and waste footprint
As the operator of a global fleet of 8.5 GW, EDPR places great attention on effectively managing its assets. Ensuring that operations and maintenance costs are kept to a minimum through the useful life of the wind farms, and maximizing their return is cornerstone of this process.
In addition to its leading O&M strategy and remote operations infrastructure, EDPR continues to seek gains year after year in other areas such as improved warehouse logistics, better power forecasting and leaner operations. Minor improvements in any of these areas multiply into significant cost savings for the company and its shareholders.
IMPROVING POWER FORECASTING
During the day-to-day operation of a wind farm, forecasting plays a critical role as it allows EDPR to accurately predict the future energy generation. If wind farms are able to accurately forecast there energy production they can minimize imbalance costs and help improve the energy system as a whole. Energy imbalances happen when actual production or usage of energy is lower/higher that the scheduled amount. If a wind farm produces less energy that it forecasted it will have to pay the energy system authority for this deviation. To avoid such costs it is imperative that wind farm energy forecasts are as accurate as possible.
As with layout optimization, forecasting of energy production falls on EDPR’s energy assessment team. In this case state-of-the art physical and statistical modelling is used to predict the wind resource for all our wind farms on an hourly basis. The availability of on-site wind data and advances in meteorological modelling has significantly helped improve the forecasting ability over the last years. However certain challenges remain such as accounting for thermal winds, complex terrain, very high winds and the impact from icing.
To deal with some of these problems EDPR has implemented a successful program to identify and correct periods of curtailment or unavailability. Our teams periodically analyse the millions of data points collected to identify problems and implement corrections. This program has resulted in a 10% improvement in the forecasting of production from some critical wind farms throughout 2013.
ASSET OPERATIONS EDPR’s top line revenues are the result of the product of two key factors, energy generated and selling price. As a result, selling the energy generated at attractive prices whilst reducing volatility is as important as maximizing production.
EDPR’s energy management team uses long-term power purchasing agreements signed with local off takers to stabilize the energy price received for as long as 20 years. Additionally, depending on the specificities of each contract, exposure to other market uncertainties is also reduced. 93% of EDPR’s capacity is covered either by the
11
22 21 24
2,59
4,21 4,42 4,45
2013201220112010
Health & Safety (employees + contractors)
Industrial accidentsInjury Rate
2013 MANAGEMENT REPORT : EDP RENOVÁVEIS
NEV
ER
EN
DIN
G E
NER
GY
43
regulatory stability of country specific frameworks or long-term PPAs and the remaining 7% is exposed to the changes in energy spot markets. To further reduce its exposure to spot markets, following our low risk strategy, EDPR uses short-term hedging instruments to sell energy at fixed prices.
During 2013 EDPR signed 1,200 MW of long-term PPA in the US and contracted short-term hedges in at least 4 geographies.
M3 MAINTENANCE SYSTEM During the first years of a wind farm’s life, operations and maintenance of the wind turbine generators is usually guaranteed by the turbine manufacturer. Once this period has finished, EDPR must decide on the optimal maintenance system that will reduce costs, whilst maintaining high levels of availability. To deal with this problem EDPR has implemented a successful O&M program called M3 (Modular Maintenance Model). Depending on the country, turbine type, historical performance and other technical aspects, our O&M teams will decide on the optimal balance between external contractors and in-house maintenance. Usually, EDPR keeps control of high value-added activities such as maintenance planning, logistics and remote operations while outsourcing, under direct supervision, people intensive tasks.
This strategy has resulted in high costs savings for the company. When compared with other post-warranty wind farms under full scope O&M contracts, the costs savings achieve 15% and reaches 20% when compared with wind farms under their initial warranty.
EDPR’S LEAN PROGRAM Launched in 2011, EDPR’s Lean program focuses on optimizing process across the company’s business using the lean-six sigma methodology. The objective is to leverage front-line personnel ideas and experience to improve the company’s revenues and costs, improve safety and reduce environmental impact.
Within this strategy EDPR has implemented two programs, “Daily Lean” and “Lean improvement”. The first applies continuous improvement to the day-to-day activities at our wind farms, with the objective of reducing repetitive and non-value added tasks. Improving the tracking of repaired components and warehouse layout are two examples of the results of this program.
The second program “Lean Improvement”, developed together between our performance engineers and our field personnel, identifies and solves issues that are common to a fleet of turbines or part of a fleet. This program implemented changes that help reduce the impact of lightning damage and reduce gearbox overheating among many others.
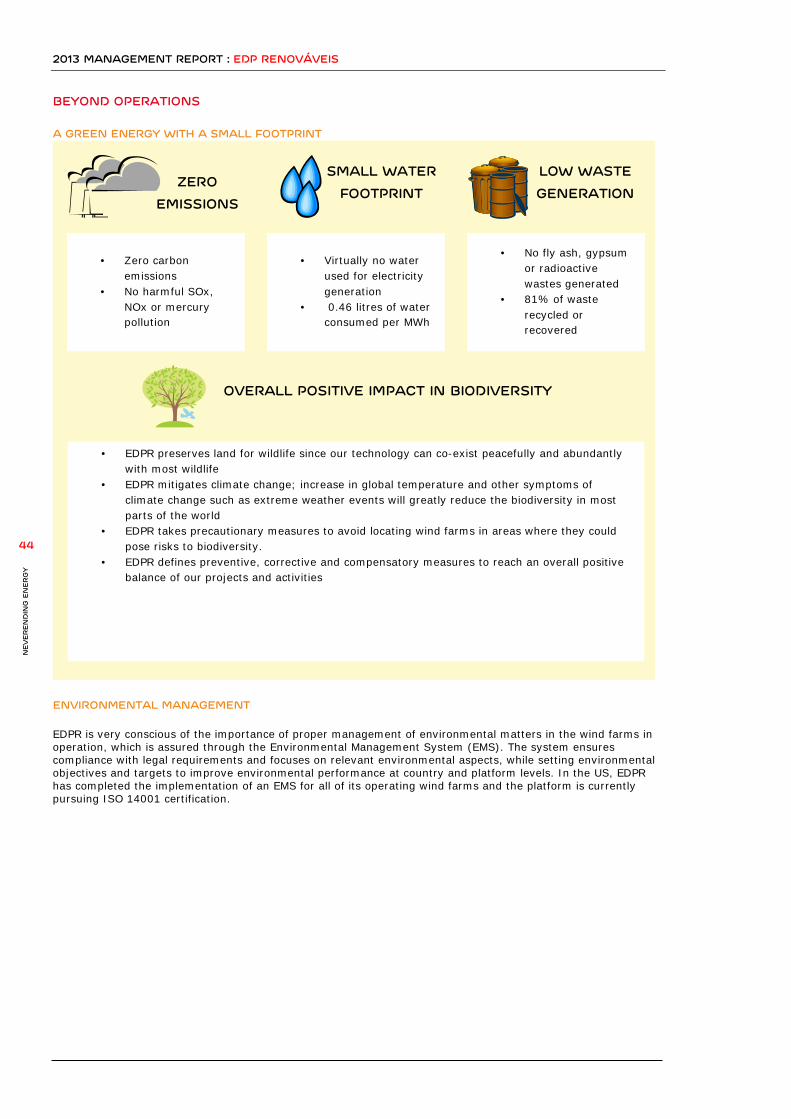
2013 MANAGEMENT REPORT : EDP RENOVÁVEIS
NEV
ER
EN
DIN
G E
NER
GY
44
BEYOND OPERATIONS A GREEN ENERGY WITH A SMALL FOOTPRINT
ENVIRONMENTAL MANAGEMENT EDPR is very conscious of the importance of proper management of environmental matters in the wind farms in operation, which is assured through the Environmental Management System (EMS). The system ensures compliance with legal requirements and focuses on relevant environmental aspects, while setting environmental objectives and targets to improve environmental performance at country and platform levels. In the US, EDPR has completed the implementation of an EMS for all of its operating wind farms and the platform is currently pursuing ISO 14001 certification.
• Zero carbon emissions
• No harmful SOx, NOx or mercury pollution
• Virtually no water used for electricity generation
• 0.46 litres of water consumed per MWh
• No fly ash, gypsum or radioactive wastes generated
• 81% of waste recycled or recovered
• EDPR preserves land for wildlife since our technology can co-exist peacefully and abundantly with most wildlife
• EDPR mitigates climate change; increase in global temperature and other symptoms of climate change such as extreme weather events will greatly reduce the biodiversity in most parts of the world
• EDPR takes precautionary measures to avoid locating wind farms in areas where they could pose risks to biodiversity.
• EDPR defines preventive, corrective and compensatory measures to reach an overall positive balance of our projects and activities
ZERO EMISSIONS
SMALL WATER
FOOTPRINT
LOW WASTE
GENERATION
OVERALL POSITIVE IMPACT IN BIODIVERSITY

2013 MANAGEMENT REPORT : EDP RENOVÁVEIS
NEV
ER
EN
DIN
G E
NER
GY
45
3.2.4. HUMAN CAPITAL To attract, develop and retain talent is a main goal of EDPR’s Human Resources strategy. At EDPR, our people are very important and we, as a responsible employer, want to retain them by offering quality employment that can be balanced with personal life.
Despite a difficult macroeconomic environment, our employee base increased by three percent over last year to reach 890. New employees have the opportunity to join a company with a strong work culture that emphasizes team work within a diverse environment represented by 24 nationalities.
We strive to offer our workforce with opportunities to develop professionally and to assume new roles to reach the company’s goals. Our employees are distributed globally as 24% of our employees work at EDPR Holding, 44% within the European Platform, 29% within the North American Platform and 2% in Brazil. All are encouraged to take advantage of the functional and geographic mobility opportunities so they can assume more responsibilities.
ATTRACT AND COMMIT HIRING As part of the employee recruiting strategy, EDPR is committed to hiring the brightest people and seeks potential employees attending top universities and business schools. We have carried out different initiatives to enhance employer branding by participating in different Employer forums and hosting visits from top-tier universities. EDPR offers an internship program aimed at giving young professionals work experience and potentially identifying future employees with growth potential who can contribute to the future development of the business.
EDPR hires talented individuals who are passionate about the industry and share our vision and purpose. When hiring, the company takes into account not only the specific job skills for a certain position but also the behavioural skills, which are at the base of the organisational culture. As a company devoted to sustainability, EDPR aims to combine career goals with company values.
• Team Oriented Environment: EDPR promotes an environment based on team building. • Career Development: EDPR recognizes the importance of career development, helps employees acquire
knowledge to master the business, and rewards employees for their innovation, hard work and performance.
• Diversity: EDPR has a diverse team, with employees from a wide range of backgrounds and cultures. • Sustainability: EDPR aims to encourage environmental, economic and social stewardship by its
employees.
At EDPR, we hire top talent ensuring a non-discriminatory selection processes. This is confirmed in the Code of Ethics which contains specific clauses of non-discrimination and equal opportunities in line with the company’s culture of diversity.
In 2013, EDPR hired 91 employees, 32% of which are women. EDPR additionally offered 87 long term internships and 18 summer internships.
INTEGRATION EDPR has a strong company culture, and wants new hires to be able to understand this culture and quickly adopt it in their day-to-day activities. To encourage this, new hires are involved in a number of workshops and team building activities aimed at improving integration and gaining a better understanding of the company.
Our Welcome Day, a three day event for new hires, allows new employees to obtain basic knowledge of the company, our business, and depending on the employee’s profile, a visit to one of the wind farms or the remote control dispatch centre. During 2013, EDPR introduced a new integration tool called the Induction Plan. New hires spend a few days at the corporate headquarters and are guided by colleagues from different areas to learn key aspects of their job and gain a better understanding of their work and how it contributes to the mission of EDPR.
2013 MANAGEMENT REPORT : EDP RENOVÁVEIS
NEV
ER
EN
DIN
G E
NER
GY
46
BENEFITS& WORK LIFE BALANCE BENEFITS EDPR is committed to offer a competitive compensation and benefits package to recognize the work and talent of our employees. The compensation policy addresses the needs of local markets and provides flexibility to adapt to the specifics of each region. In addition to a fixed base compensation, there is a variable component that depends on a performance evaluation measured against the company’s performance, area and individual KPIs.
Our performance based compensation is an important tool to promote a greater focus from our employees on not only the company’s objectives but personal and team objectives as well. In order to be competitive in the marketplace and recruit the best talent, EDPR reviews and benchmarks itself against local markets in order to offer the most attractive benefits packages. For example, in 2013, EDPR extended the coverage of its life and accident insurances to 100% of the employees.
WORK LIFE BALANCE At EDPR, we understand the importance of maintaining a balance between work and personal commitments. This understanding has led to an increase of employees’ satisfaction, while boosting productivity, and morale.
EDPR has work-life balance programs and aims to constantly improve and provide the most suitable benefits to employees. Often specific benefits are only applicable to certain countries in which EDPR is present. As an example of normalizing key benefits across the countries, EDPR employees in the United States can now enjoy extended maternity leave, as it is a common practice in Europe.
Since 2011, EDPR’s practices have been recognized with the Family Responsible Employer Certification (EFR- Empresa Familiarmente Responsable) by the MásFamilia Foundation, in Spain. This certification reflects EDPR’s commitment to promote a healthy work-life balance for its employees. EDPR stood out for its effectiveness in terms of scheduling flexibility, family support, equal opportunities and its ambitious policy of continuous improvement.
EDPR does not limit itself to only providing benefits to the community through the construction of new wind farms and solar plants. Employees are also encouraged to actively participate in their communities and to be responsive and aware of emerging needs through many volunteering initiatives sponsored by EDPR’s Volunteering Program. Employees can choose from several campaigns to donate financially or participate directly in volunteering opportunities held during working hours or weekends. For example, during the Christmas holidays, a campaign was started in partnership with a NGO to raise fund for a social initiative in South America.
DEVELOPMENT & TRAINING 1.4 M€ invested in training
33 hours of training per employee
1,541 € spent in training per employee POTENTIAL APPRAISAL Assessing the potential of our talented pool of employees is a fundamental tool in people management. The purpose of the annual Potential Appraisal is to prepare employees to achieve his/her top potential development based on a set of strategic skills. All of EDPR’s employees, regardless of their professional category, are evaluated yearly to determine their development potential by providing the most suitable training. EDPR creates tailored development plan to address specific needs. The potential assessment process is independent from performance appraisal and is based on a 360 degree evaluation model which considers feedback from oneself, peers, subordinates and the manager.
TRAINING PLAN Each year a customized Training Plan is created based on the results of the potential performance assessment. The plan provides a framework for managing training within the company, in close alignment with the business strategy. When defining our strategy for the future, we strive to align current and future demands of the organization with our employees’ capabilities while fulfilling their professional development expectations and supporting their continuous improvement. EDPR is committed to offer employees an attractive career plan, as well as advanced education and training opportunities.
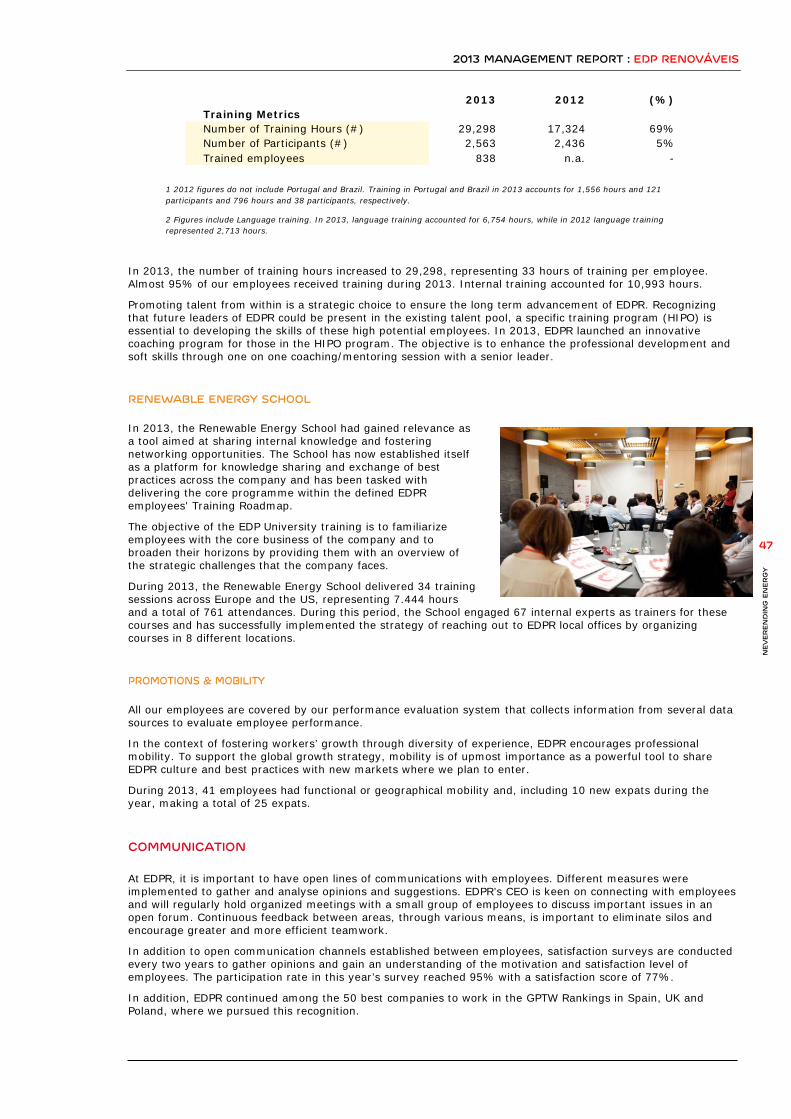
2013 MANAGEMENT REPORT : EDP RENOVÁVEIS
NEV
ER
EN
DIN
G E
NER
GY
47
2013 2012 (%) Training Metrics Number of Training Hours (#) 29,298 17,324 69% Number of Participants (#) 2,563 2,436 5% Trained employees 838 n.a. -
1 2012 figures do not include Portugal and Brazil. Training in Portugal and Brazil in 2013 accounts for 1,556 hours and 121 participants and 796 hours and 38 participants, respectively.
2 Figures include Language training. In 2013, language training accounted for 6,754 hours, while in 2012 language training represented 2,713 hours.
In 2013, the number of training hours increased to 29,298, representing 33 hours of training per employee. Almost 95% of our employees received training during 2013. Internal training accounted for 10,993 hours.
Promoting talent from within is a strategic choice to ensure the long term advancement of EDPR. Recognizing that future leaders of EDPR could be present in the existing talent pool, a specific training program (HIPO) is essential to developing the skills of these high potential employees. In 2013, EDPR launched an innovative coaching program for those in the HIPO program. The objective is to enhance the professional development and soft skills through one on one coaching/mentoring session with a senior leader.
RENEWABLE ENERGY SCHOOL In 2013, the Renewable Energy School had gained relevance as a tool aimed at sharing internal knowledge and fostering networking opportunities. The School has now established itself as a platform for knowledge sharing and exchange of best practices across the company and has been tasked with delivering the core programme within the defined EDPR employees' Training Roadmap.
The objective of the EDP University training is to familiarize employees with the core business of the company and to broaden their horizons by providing them with an overview of the strategic challenges that the company faces.
During 2013, the Renewable Energy School delivered 34 training sessions across Europe and the US, representing 7.444 hours and a total of 761 attendances. During this period, the School engaged 67 internal experts as trainers for these courses and has successfully implemented the strategy of reaching out to EDPR local offices by organizing courses in 8 different locations.
PROMOTIONS & MOBILITY All our employees are covered by our performance evaluation system that collects information from several data sources to evaluate employee performance.
In the context of fostering workers’ growth through diversity of experience, EDPR encourages professional mobility. To support the global growth strategy, mobility is of upmost importance as a powerful tool to share EDPR culture and best practices with new markets where we plan to enter.
During 2013, 41 employees had functional or geographical mobility and, including 10 new expats during the year, making a total of 25 expats.
COMMUNICATION At EDPR, it is important to have open lines of communications with employees. Different measures were implemented to gather and analyse opinions and suggestions. EDPR’s CEO is keen on connecting with employees and will regularly hold organized meetings with a small group of employees to discuss important issues in an open forum. Continuous feedback between areas, through various means, is important to eliminate silos and encourage greater and more efficient teamwork.
In addition to open communication channels established between employees, satisfaction surveys are conducted every two years to gather opinions and gain an understanding of the motivation and satisfaction level of employees. The participation rate in this year’s survey reached 95% with a satisfaction score of 77%.
In addition, EDPR continued among the 50 best companies to work in the GPTW Rankings in Spain, UK and Poland, where we pursued this recognition.

2013 MANAGEMENT REPORT : EDP RENOVÁVEIS
NEV
ER
EN
DIN
G E
NER
GY
48
EDPR’s ability to attract, develop, and retain talent is a testament to its commitment to excelling in all areas. It’s no wonder that EDPR continues to be among the 50 best companies to work for as determined by the Great Place to Work rankings. A motivated workforce aligned with the company’s strategy is one of the key drivers behind our ability to deliver on results during 2013.
MEETING WITH THE CEO Based on the feedback of our employees, we have organized during 2013 meetings sessions between our employees and the CEO.
During these meetings, employees are given the opportunity to share their point of view of the business from their positions and learn about the strategy of the company and how this relates to their day-to-day tasks. This is a great opportunity for employees to better understand their impact on the business.
In Spain, 53% of our employees already had the chance to meet the CEO. This initiative has already started in other EDPR geographies. The feedback received from our employees is very positive.
2013 MANAGEMENT REPORT : EDP RENOVÁVEIS
49
NEV
ER
EN
DIN
G E
NER
GY

2013 MANAGEMENT REPORT : EDP RENOVÁVEIS
NEV
ER
EN
DIN
G E
NER
GY
50

2013 MANAGEMENT REPORT : EDP RENOVÁVEIS
51
NEV
ER
EN
DIN
G E
NER
GY
Index
FINANCIAL PERFORMANCE 52 Income Statement 53
Balance-Sheet 54 Cash-Flow Statement 55
Financial Debt 56 Europe 57
United States 58 Brazil 59
04

2013 MANAGEMENT REPORT : EDP RENOVÁVEIS
NEV
ER
EN
DIN
G E
NER
GY
52
4. FINANCIAL PERFORMANCE
REVENUES INCREASED 6% TO 1.4 BILLION EUROS
In 2013, EDPR registered another year of record performance, with Revenues increasing to 1,356 million euros, mainly driven by the 8% increase in electricity generation. EDPR’s average selling price decreased 2% as the result of the lower average selling price in Europe; however, the decrease was partially offset by the higher
average selling price in the US and Brazil along with a higher production mix towards Europe.
EBITDA OF 947 MILLION EUROS
EBITDA improved 1% to 947 million euros, representing a 70% EBITDA margin. EBITDA grew despite the negative cumulative impact of 71 million euros related to all 2013 Spanish regulatory changes, including a 17 million euros adjustment on sales, related to the framework (RDL 9/2013) that was announced in July 2013 and pending approval.
NET PROFIT INCREASED 7% TO 135 MILLION EUROS
The positive year over year growth in Net Profit highlights EDPR’s ability to transform strong operational metrics into quality bottom-line metrics.
ROBUST CASH-FLOW
Operating Cash-Flow increased 5% to 700 million euros, which more than covered the Capex expenditure of the year.
In 2013, EDPR concluded the sale of a minority equity stake and shareholders’ loans in wind farms in Portugal to CTG, and executed a sale of a minority equity stake in the US with Fiera Axium, for a combined total of 402 million euros. In October 2013, EDPR structured an additional asset rotation transaction with Axpo Group for a portfolio of wind farms in France. The financial close occurred during the first quarter of 2014.
Capital expenditures (Capex) totalled 627 million euros reflecting the capacity additions and the capacity under construction. Moreover a cash grant for 120 million dollars was collected in the US. As a result of the robust cash flow, execution of the asset rotation strategy, and close monitoring of expenditures, Net Debt decreased by 23 million euros.
STRONG BALANCE SHEET
Execution of the asset rotation strategy primarily helped increase EDPR’s total equity by 340 million euros to reach 6.1 billion euros.
Total liabilities decreased 531 million euros to 7.0 billion euros. This decrease was mainly driven by lower financial debt and a decrease in accounts payables.
Total assets of 13.1 billion euros are 190 million euros lower versus last year, mainly due to the depreciation of the US Dollar.
FINANCIAL HIGHLIGHTS
€m 2013
2012
∆%/€
INCOME STATEMENT
Revenues 1,356
1,285
+6%
EBITDA 947
938
+1%
Net Profit 1 135
126
+7%
CASH-FLOW
Operating Cash-flow 700
666
+5%
Capex 627
612
+2%
BALANCE SHEET
Assets 13,112
13,302
(190)
Equity 6,089
5,749
+341
Liabilities 7,022
7,553
(531)
LIABILITIES
Net Debt 3,283
3,305
(23)
Institutional Partnerships 836
942
(106)
1 Attributable to EDPR equity holders
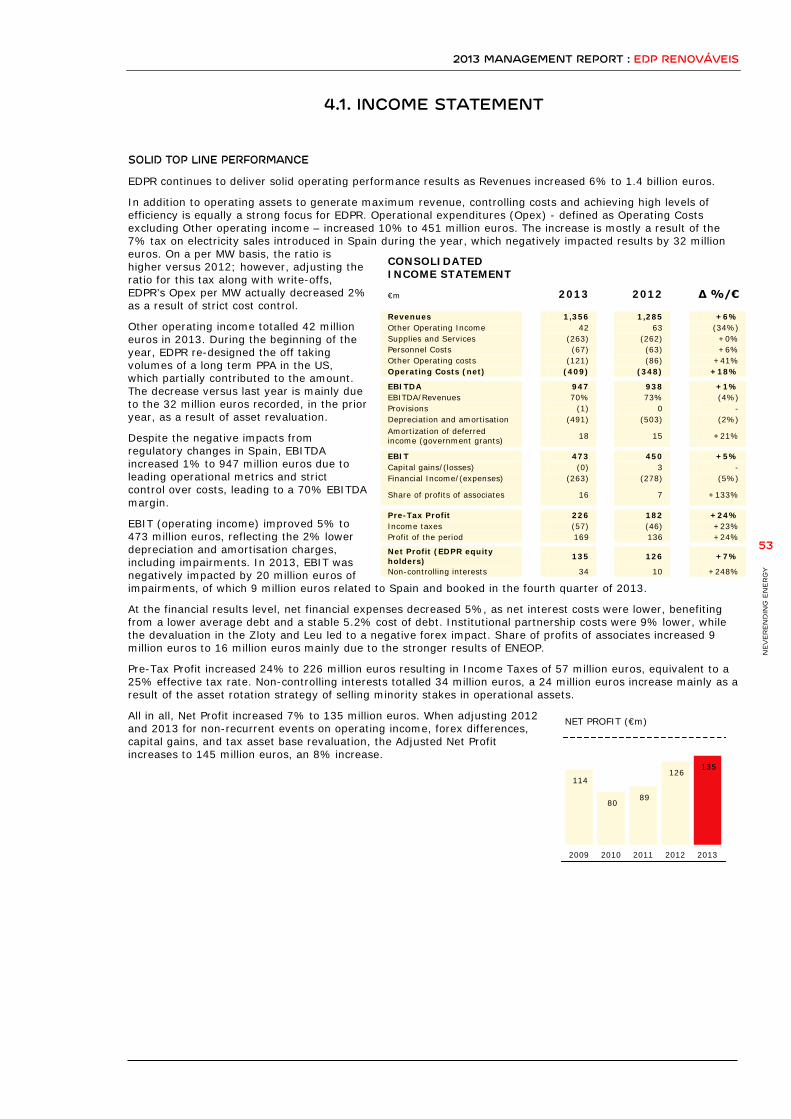
2013 MANAGEMENT REPORT : EDP RENOVÁVEIS
53
NEV
ER
EN
DIN
G E
NER
GY
114
80 89
126 135
2009 2010 2011 2012 2013
NET PROFIT (€m)
4.1. INCOME STATEMENT
SOLID TOP LINE PERFORMANCE
EDPR continues to deliver solid operating performance results as Revenues increased 6% to 1.4 billion euros.
In addition to operating assets to generate maximum revenue, controlling costs and achieving high levels of efficiency is equally a strong focus for EDPR. Operational expenditures (Opex) - defined as Operating Costs excluding Other operating income – increased 10% to 451 million euros. The increase is mostly a result of the 7% tax on electricity sales introduced in Spain during the year, which negatively impacted results by 32 million euros. On a per MW basis, the ratio is higher versus 2012; however, adjusting the ratio for this tax along with write-offs, EDPR’s Opex per MW actually decreased 2% as a result of strict cost control.
Other operating income totalled 42 million euros in 2013. During the beginning of the year, EDPR re-designed the off taking volumes of a long term PPA in the US, which partially contributed to the amount. The decrease versus last year is mainly due to the 32 million euros recorded, in the prior year, as a result of asset revaluation.
Despite the negative impacts from regulatory changes in Spain, EBITDA increased 1% to 947 million euros due to leading operational metrics and strict control over costs, leading to a 70% EBITDA margin.
EBIT (operating income) improved 5% to 473 million euros, reflecting the 2% lower depreciation and amortisation charges, including impairments. In 2013, EBIT was negatively impacted by 20 million euros of impairments, of which 9 million euros related to Spain and booked in the fourth quarter of 2013.
At the financial results level, net financial expenses decreased 5%, as net interest costs were lower, benefiting from a lower average debt and a stable 5.2% cost of debt. Institutional partnership costs were 9% lower, while the devaluation in the Zloty and Leu led to a negative forex impact. Share of profits of associates increased 9 million euros to 16 million euros mainly due to the stronger results of ENEOP.
Pre-Tax Profit increased 24% to 226 million euros resulting in Income Taxes of 57 million euros, equivalent to a 25% effective tax rate. Non-controlling interests totalled 34 million euros, a 24 million euros increase mainly as a result of the asset rotation strategy of selling minority stakes in operational assets.
All in all, Net Profit increased 7% to 135 million euros. When adjusting 2012 and 2013 for non-recurrent events on operating income, forex differences, capital gains, and tax asset base revaluation, the Adjusted Net Profit increases to 145 million euros, an 8% increase.
CONSOLIDATED INCOME STATEMENT
€m 2013
2012
∆ %/€ Revenues 1,356 1,285 +6% Other Operating Income 42 63 (34%) Supplies and Services (263) (262) +0% Personnel Costs (67) (63) +6% Other Operating costs (121) (86) +41% Operating Costs (net) (409) (348) +18% EBITDA 947 938 +1% EBITDA/Revenues 70% 73% (4%) Provisions (1) 0 - Depreciation and amortisation (491) (503) (2%) Amortization of deferred income (government grants) 18 15 +21%
EBIT 473 450 +5% Capital gains/(losses) (0) 3 - Financial Income/(expenses) (263) (278) (5%)
Share of profits of associates 16 7 +133%
Pre-Tax Profit 226 182 +24% Income taxes (57) (46) +23% Profit of the period 169 136 +24% Net Profit (EDPR equity holders) 135 126 +7%
Non-controlling interests 34 10 +248%
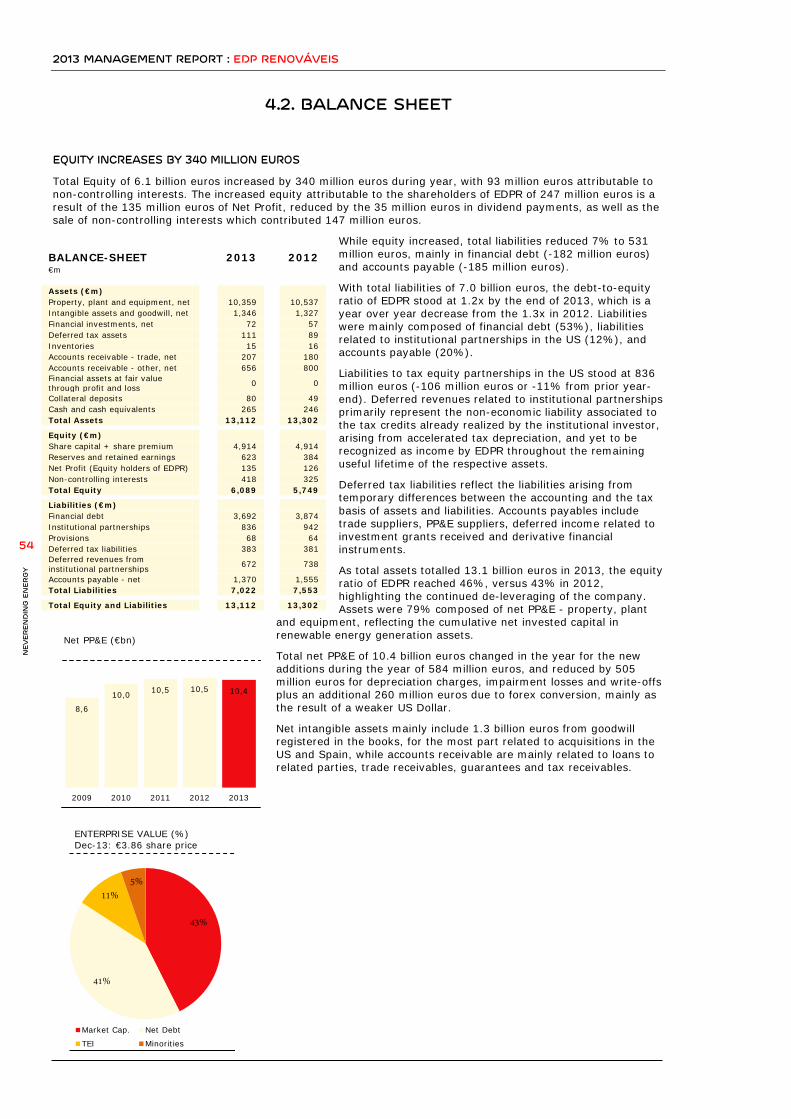
2013 MANAGEMENT REPORT : EDP RENOVÁVEIS
NEV
ER
EN
DIN
G E
NER
GY
54
8,6
10,0 10,5 10,5 10,4
2009 2010 2011 2012 2013
Net PP&E (€bn)
43%
41%
11% 5%
ENTERPRISE VALUE (%) Dec-13: €3.86 share price
Market Cap. Net Debt
TEI Minorities
4.2. BALANCE SHEET
EQUITY INCREASES BY 340 MILLION EUROS
Total Equity of 6.1 billion euros increased by 340 million euros during year, with 93 million euros attributable to non-controlling interests. The increased equity attributable to the shareholders of EDPR of 247 million euros is a result of the 135 million euros of Net Profit, reduced by the 35 million euros in dividend payments, as well as the sale of non-controlling interests which contributed 147 million euros.
While equity increased, total liabilities reduced 7% to 531 million euros, mainly in financial debt (-182 million euros) and accounts payable (-185 million euros).
With total liabilities of 7.0 billion euros, the debt-to-equity ratio of EDPR stood at 1.2x by the end of 2013, which is a year over year decrease from the 1.3x in 2012. Liabilities were mainly composed of financial debt (53%), liabilities related to institutional partnerships in the US (12%), and accounts payable (20%).
Liabilities to tax equity partnerships in the US stood at 836 million euros (-106 million euros or -11% from prior year-end). Deferred revenues related to institutional partnerships primarily represent the non-economic liability associated to the tax credits already realized by the institutional investor, arising from accelerated tax depreciation, and yet to be recognized as income by EDPR throughout the remaining useful lifetime of the respective assets.
Deferred tax liabilities reflect the liabilities arising from temporary differences between the accounting and the tax basis of assets and liabilities. Accounts payables include trade suppliers, PP&E suppliers, deferred income related to investment grants received and derivative financial instruments.
As total assets totalled 13.1 billion euros in 2013, the equity ratio of EDPR reached 46%, versus 43% in 2012, highlighting the continued de-leveraging of the company. Assets were 79% composed of net PP&E - property, plant
and equipment, reflecting the cumulative net invested capital in renewable energy generation assets.
Total net PP&E of 10.4 billion euros changed in the year for the new additions during the year of 584 million euros, and reduced by 505 million euros for depreciation charges, impairment losses and write-offs plus an additional 260 million euros due to forex conversion, mainly as the result of a weaker US Dollar.
Net intangible assets mainly include 1.3 billion euros from goodwill registered in the books, for the most part related to acquisitions in the US and Spain, while accounts receivable are mainly related to loans to related parties, trade receivables, guarantees and tax receivables.
BALANCE-SHEET 2013
2012 €m Assets (€m) Property, plant and equipment, net 10,359 10,537 Intangible assets and goodwill, net 1,346 1,327 Financial investments, net 72 57 Deferred tax assets 111 89 Inventories 15 16 Accounts receivable - trade, net 207 180 Accounts receivable - other, net 656 800 Financial assets at fair value through profit and loss 0 0
Collateral deposits 80 49 Cash and cash equivalents 265 246 Total Assets 13,112 13,302 Equity (€m) Share capital + share premium 4,914 4,914 Reserves and retained earnings 623 384 Net Profit (Equity holders of EDPR) 135 126 Non-controlling interests 418 325 Total Equity 6,089 5,749 Liabilities (€m) Financial debt 3,692 3,874 Institutional partnerships 836 942 Provisions 68 64 Deferred tax liabilities 383 381 Deferred revenues from institutional partnerships 672 738
Accounts payable - net 1,370 1,555 Total Liabilities 7,022 7,553 Total Equity and Liabilities 13,112 13,302

2013 MANAGEMENT REPORT : EDP RENOVÁVEIS
NEV
ER
EN
DIN
G E
NER
GY
55
62%
34%
4%
CAPEX BREAKDOWN BY PLATFORM (%)
Europe North AmericaBrazil & Other
392
567 643 666 700
2009 2010 2011 2012 2013
OPERATING CASH-FLOW (€m)
4.3. CASH-FLOW STATEMENT
IMPROVED RECURRENT CASH FLOW
EDPR generated Operating Cash-Flow of 700 million euros, a 5% increase from the prior year. EDPR continues to benefit from the strong cash-flow generation capabilities of its assets in operation.
The key items that explain 2013 cash-flow evolution are the following:
• Funds from operations (FFO), resulting from EBITDA after net interest expenses, income from associates and current taxes, increased to 671 million euros;
• Operating Cash-Flow, this is FFO before net interest costs, adjusted by non-cash items (namely write-offs and income from US institutional partnerships) and net of changes in working capital, amounted to 700 million euros.
• Capex related to the on-going construction and development works totalled 627 million euros. In Europe Capex reached 387 million euros, almost entirely dedicated to projects in Poland and Romania, while 212 million euros were in North America. A large part of the Capex in the US occurred during the fourth quarter in order to qualify projects for the PTC program. Other net investing activities amounted to 136 million euros, mostly reflecting the settlements to equipment suppliers related to Capex from previous periods and net of the 120 million US Dollars cash grant collected from the US Treasury related with the Marble River wind farm added in 2012.
• As part of the asset rotation program, EDPR concluded the sale of non-controlling interests and shareholders’ loans amounting to 402 million euros.
• Total dividends and capital distributions paid amounted to 76 million euros, which includes the 35 million euros paid to EDPR shareholders.
• Forex & Others had a negative effect, increasing Net Debt by 20 million euros.
NET DEBT DECREASES BY 23 MILLION EUROS
All in all, Net Debt decreased versus last year and stood at 3,283 million euros by year end. In line with the self-funded business model and focus on operational excellence, EDPR will continue to benefit from the solid free cash-flow generation capabilities of its assets.
CASH-FLOW 2013
2012
∆ %/€ €m EBITDA 947 938 +1% Current income tax (93) (85) +9% Net interest costs (200) (205) (3%) Share of profit of associates 16 7 +121% FFO (Funds From Operations) 671 655 +2% Net interest costs 200 205 (3%) Income from associated companies (16) (7) +121% Non-cash items adjustments (112) (120) (7%) Changes in working capital (42) (66) (36%) Operating Cash-Flow 700 666 +5% Capex (627) (612) +2% Financial (investments) divestments (47) (22) +110% Changes in working capital related to PP&E suppliers (180) 2 -
Cash grant 91 5 - Net Operating Cash-Flow (63) 39 - Sale of non-controlling interests and shareholders' loans 402 176 +129%
Proceeds (payments) related to institutional partnerships (36) (15) +135%
Net interest costs (post capitalisation) (184) (189) (3%) Dividends and capital distributions (76) (5) - Forex & others (20) 27 - Decrease / (Increase) in Net Debt 23 33 (30%)
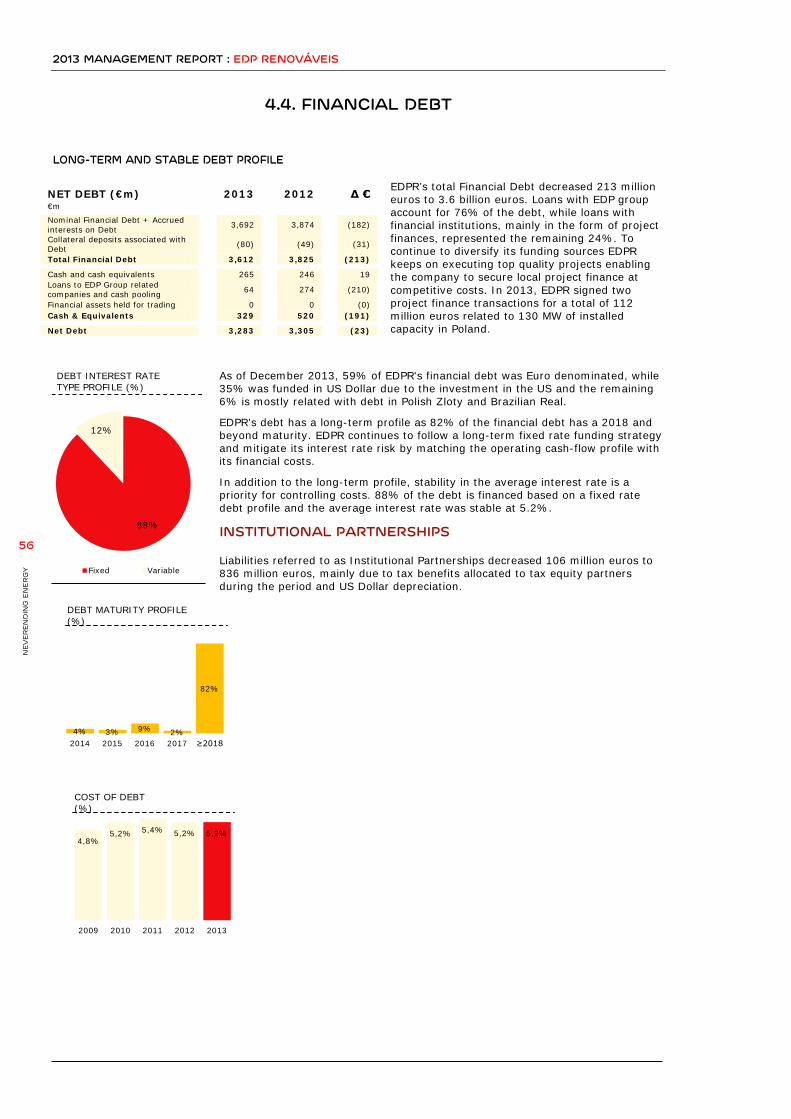
2013 MANAGEMENT REPORT : EDP RENOVÁVEIS
NEV
ER
EN
DIN
G E
NER
GY
56
4,8% 5,2% 5,4% 5,2% 5,2%
2009 2010 2011 2012 2013
COST OF DEBT (%)
88%
12%
DEBT INTEREST RATE TYPE PROFILE (%)
Fixed Variable
4.4. FINANCIAL DEBT
LONG-TERM AND STABLE DEBT PROFILE
EDPR’s total Financial Debt decreased 213 million euros to 3.6 billion euros. Loans with EDP group account for 76% of the debt, while loans with financial institutions, mainly in the form of project finances, represented the remaining 24%. To continue to diversify its funding sources EDPR keeps on executing top quality projects enabling the company to secure local project finance at competitive costs. In 2013, EDPR signed two project finance transactions for a total of 112 million euros related to 130 MW of installed capacity in Poland.
As of December 2013, 59% of EDPR's financial debt was Euro denominated, while 35% was funded in US Dollar due to the investment in the US and the remaining 6% is mostly related with debt in Polish Zloty and Brazilian Real.
EDPR’s debt has a long-term profile as 82% of the financial debt has a 2018 and beyond maturity. EDPR continues to follow a long-term fixed rate funding strategy and mitigate its interest rate risk by matching the operating cash-flow profile with its financial costs.
In addition to the long-term profile, stability in the average interest rate is a priority for controlling costs. 88% of the debt is financed based on a fixed rate debt profile and the average interest rate was stable at 5.2%.
INSTITUTIONAL PARTNERSHIPS Liabilities referred to as Institutional Partnerships decreased 106 million euros to 836 million euros, mainly due to tax benefits allocated to tax equity partners during the period and US Dollar depreciation.
4% 3% 9% 2%
82%
2014 2015 2016 2017 ≥2018
DEBT MATURITY PROFILE (%)
NET DEBT (€m) 2013
2012
∆ € €m Nominal Financial Debt + Accrued interests on Debt 3,692 3,874 (182)
Collateral deposits associated with Debt (80) (49) (31)
Total Financial Debt 3,612 3,825 (213) Cash and cash equivalents 265 246 19 Loans to EDP Group related companies and cash pooling 64 274 (210)
Financial assets held for trading 0 0 (0) Cash & Equivalents 329 520 (191) Net Debt 3,283 3,305 (23)

2013 MANAGEMENT REPORT : EDP RENOVÁVEIS
NEV
ER
EN
DIN
G E
NER
GY
57
88,7 94,2 88,0 84,2 87,2
20132012201120102009
AVERAGE SELLING PRICE IN EUROPE (€/MWh)
844 778 635 562
436
20132012201120102009
REVENUES IN EUROPE (€m)
4.5. EUROPE
REVENUES In Europe, EDPR delivered a 9% year-on-year growth in revenues, to 844 million euros. Increasing growth in Rest of Europe led to a higher contribution to Revenues, reaching 26% in 2013 versus 24% in the prior year. Consequently, the contribution from Spain and Portugal reduced to 55% and 19%, respectively.
The performance was driven by the higher electricity output which more than offset the effect of a lower average selling price. In detail, the increase in revenues was the result of higher revenues in Rest of Europe (+34 million euros), Spain (+18 million euros) and Portugal (+11 million euros). The stronger wind resource drove revenues higher by 123 million euros whereas the lower average selling price partially offset this by 57 million euros.
AVERAGE SELLING PRICE The average selling price in Europe decreased 6% to €89/MWh. In Spain the average selling price was impacted by changes in the remuneration framework for renewable assets and in Rest of Europe mainly by the lower realised price in Romania due to lower green certificate prices following some uncertainty created by the approval of Emergency Government Ordinance 57/2013.
OPERATING COSTS AND INCOME Net Operating Costs amounted to 236 million euros due to the 30% growth in operating costs and lower other operating income. The increase is mostly explained by the 7% tax on electricity sales introduced in Spain during the year, which negatively impacted results by 32 million euros. Adjusted opex, excluding the 7% tax in Spain and write-offs, decreased 3% in MWh basis. Other operating income decreased by 34 million euros mainly due to the one-off 32 million euros recorded, in the prior year, related to asset revaluation.
EBITDA in Europe decreased 4% to 609 million euros, leading to an EBITDA margin of 72%, while EBIT reached 359 million euros.
EUROPE INCOME STATEMENT 2013 2012 ∆ %
€m
Revenues 844 778 +9% Other operating income 12 47 (74%) Supplies and services (142) (125) +13% Personnel costs (26) (25) +4% Other operating costs (80) (41) +96% Operating Costs (net) (236) (144) +64%
EBITDA 609 633 (4%) EBITDA/Revenues 72% 81% (9 pp)
Provisions (0) 0 - Depreciation and amortisation (251) (260) (3%) Amortisation of government grants 1 1 (2%) EBIT 359 374 (4%)
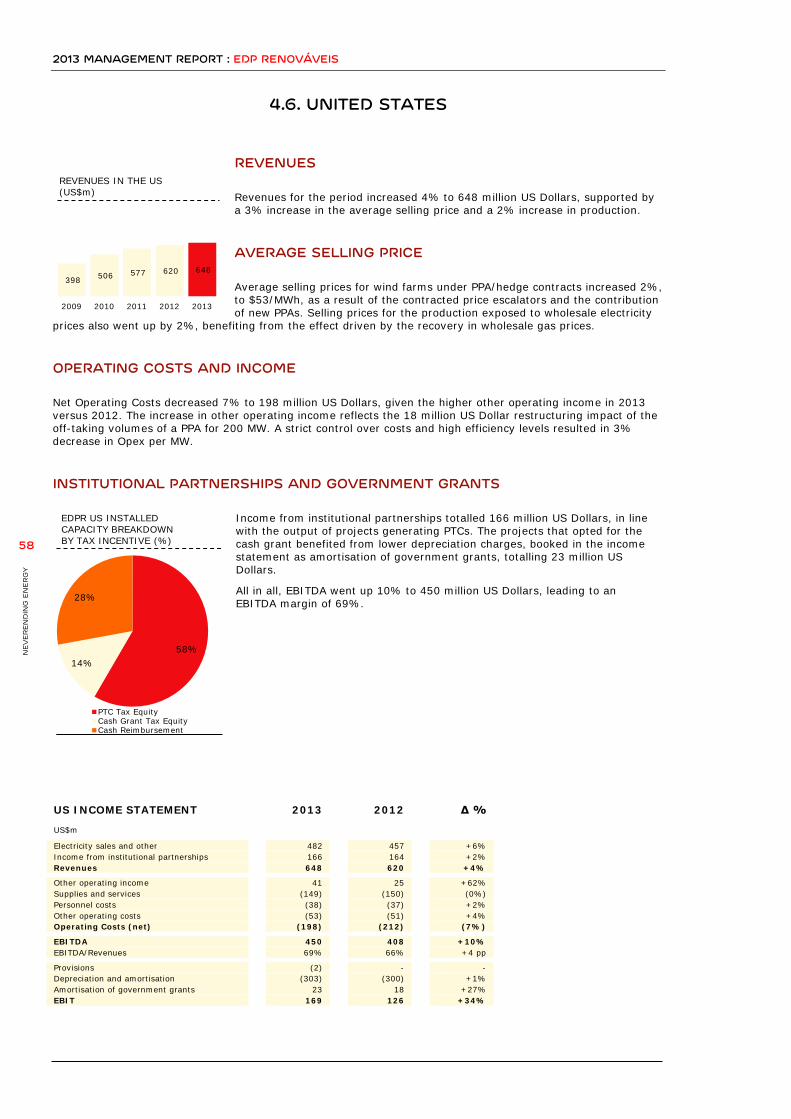
2013 MANAGEMENT REPORT : EDP RENOVÁVEIS
NEV
ER
EN
DIN
G E
NER
GY
58
58% 14%
28%
EDPR US INSTALLED CAPACITY BREAKDOWN BY TAX INCENTIVE (%)
PTC Tax EquityCash Grant Tax EquityCash Reimbursement
648 620 577 506 398
20132012201120102009
REVENUES IN THE US (US$m)
4.6. UNITED STATES
REVENUES Revenues for the period increased 4% to 648 million US Dollars, supported by a 3% increase in the average selling price and a 2% increase in production.
AVERAGE SELLING PRICE Average selling prices for wind farms under PPA/hedge contracts increased 2%, to $53/MWh, as a result of the contracted price escalators and the contribution of new PPAs. Selling prices for the production exposed to wholesale electricity
prices also went up by 2%, benefiting from the effect driven by the recovery in wholesale gas prices.
OPERATING COSTS AND INCOME Net Operating Costs decreased 7% to 198 million US Dollars, given the higher other operating income in 2013 versus 2012. The increase in other operating income reflects the 18 million US Dollar restructuring impact of the off-taking volumes of a PPA for 200 MW. A strict control over costs and high efficiency levels resulted in 3% decrease in Opex per MW.
INSTITUTIONAL PARTNERSHIPS AND GOVERNMENT GRANTS
Income from institutional partnerships totalled 166 million US Dollars, in line with the output of projects generating PTCs. The projects that opted for the cash grant benefited from lower depreciation charges, booked in the income statement as amortisation of government grants, totalling 23 million US Dollars.
All in all, EBITDA went up 10% to 450 million US Dollars, leading to an EBITDA margin of 69%.
US INCOME STATEMENT 2013 2012 ∆ %
US$m
Electricity sales and other 482 457 +6% Income from institutional partnerships 166 164 +2% Revenues 648 620 +4% Other operating income 41 25 +62% Supplies and services (149) (150) (0%) Personnel costs (38) (37) +2% Other operating costs (53) (51) +4% Operating Costs (net) (198) (212) (7%) EBITDA 450 408 +10% EBITDA/Revenues 69% 66% +4 pp Provisions (2) - - Depreciation and amortisation (303) (300) +1% Amortisation of government grants 23 18 +27% EBIT 169 126 +34%
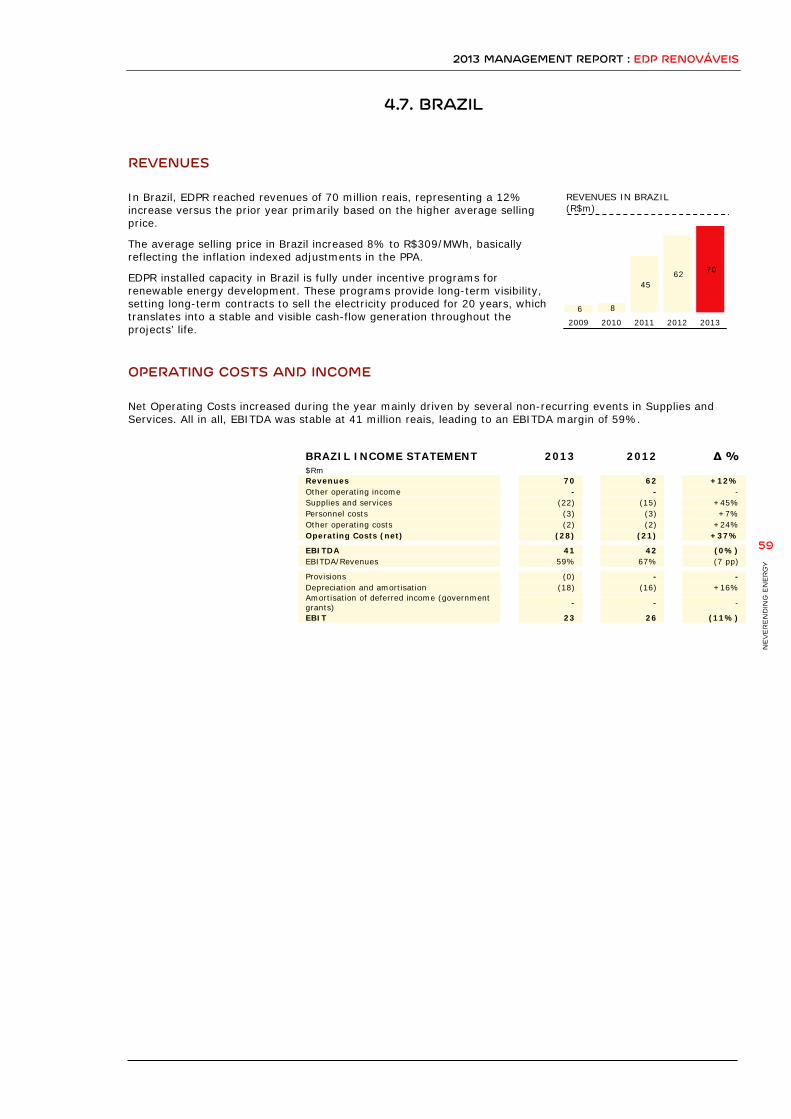
2013 MANAGEMENT REPORT : EDP RENOVÁVEIS
NEV
ER
EN
DIN
G E
NER
GY
59
70 62 45
8 6
20132012201120102009
REVENUES IN BRAZIL (R$m)
4.7. BRAZIL
REVENUES In Brazil, EDPR reached revenues of 70 million reais, representing a 12% increase versus the prior year primarily based on the higher average selling price.
The average selling price in Brazil increased 8% to R$309/MWh, basically reflecting the inflation indexed adjustments in the PPA.
EDPR installed capacity in Brazil is fully under incentive programs for renewable energy development. These programs provide long-term visibility, setting long-term contracts to sell the electricity produced for 20 years, which translates into a stable and visible cash-flow generation throughout the projects’ life.
OPERATING COSTS AND INCOME Net Operating Costs increased during the year mainly driven by several non-recurring events in Supplies and Services. All in all, EBITDA was stable at 41 million reais, leading to an EBITDA margin of 59%.
BRAZIL INCOME STATEMENT 2013 2012 ∆ % $Rm Revenues 70 62 +12% Other operating income - - - Supplies and services (22) (15) +45% Personnel costs (3) (3) +7% Other operating costs (2) (2) +24% Operating Costs (net) (28) (21) +37% EBITDA 41 42 (0%) EBITDA/Revenues 59% 67% (7 pp) Provisions (0) - - Depreciation and amortisation (18) (16) +16% Amortisation of deferred income (government grants) - - -
EBIT 23 26 (11%)
2013 MANAGEMENT REPORT : EDP RENOVÁVEIS
NEV
ER
EN
DIN
G E
NER
GY
60
2013 MANAGEMENT REPORT : EDP RENOVÁVEIS
NEV
ER
EN
DIN
G E
NER
GY
61
Index
GRI REPORT 62 Economic Performance 62
Environmental Performance 64 Social Performance 70
05
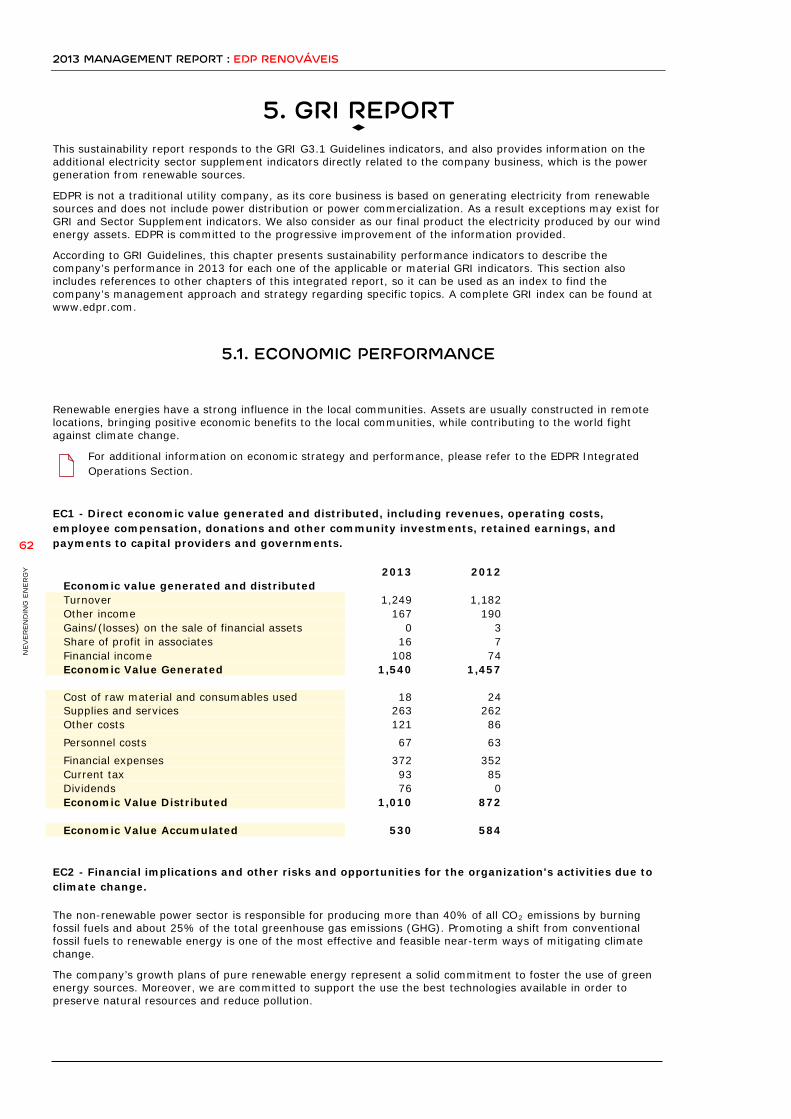
2013 MANAGEMENT REPORT : EDP RENOVÁVEIS
NEV
ER
EN
DIN
G E
NER
GY
62
5. GRI REPORT This sustainability report responds to the GRI G3.1 Guidelines indicators, and also provides information on the additional electricity sector supplement indicators directly related to the company business, which is the power generation from renewable sources.
EDPR is not a traditional utility company, as its core business is based on generating electricity from renewable sources and does not include power distribution or power commercialization. As a result exceptions may exist for GRI and Sector Supplement indicators. We also consider as our final product the electricity produced by our wind energy assets. EDPR is committed to the progressive improvement of the information provided.
According to GRI Guidelines, this chapter presents sustainability performance indicators to describe the company’s performance in 2013 for each one of the applicable or material GRI indicators. This section also includes references to other chapters of this integrated report, so it can be used as an index to find the company’s management approach and strategy regarding specific topics. A complete GRI index can be found at www.edpr.com.
5.1. ECONOMIC PERFORMANCE
Renewable energies have a strong influence in the local communities. Assets are usually constructed in remote locations, bringing positive economic benefits to the local communities, while contributing to the world fight against climate change.
For additional information on economic strategy and performance, please refer to the EDPR Integrated Operations Section.
EC1 - Direct economic value generated and distributed, including revenues, operating costs, employee compensation, donations and other community investments, retained earnings, and payments to capital providers and governments.
2013 2012 Economic value generated and distributed Turnover 1,249 1,182 Other income 167 190 Gains/(losses) on the sale of financial assets 0 3 Share of profit in associates 16 7 Financial income 108 74 Economic Value Generated 1,540 1,457
Cost of raw material and consumables used 18 24 Supplies and services 263 262 Other costs 121 86 Personnel costs 67 63 Financial expenses 372 352 Current tax 93 85 Dividends 76 0 Economic Value Distributed 1,010 872
Economic Value Accumulated 530 584
EC2 - Financial implications and other risks and opportunities for the organization's activities due to climate change.
The non-renewable power sector is responsible for producing more than 40% of all CO2 emissions by burning fossil fuels and about 25% of the total greenhouse gas emissions (GHG). Promoting a shift from conventional fossil fuels to renewable energy is one of the most effective and feasible near-term ways of mitigating climate change.
The company’s growth plans of pure renewable energy represent a solid commitment to foster the use of green energy sources. Moreover, we are committed to support the use the best technologies available in order to preserve natural resources and reduce pollution.
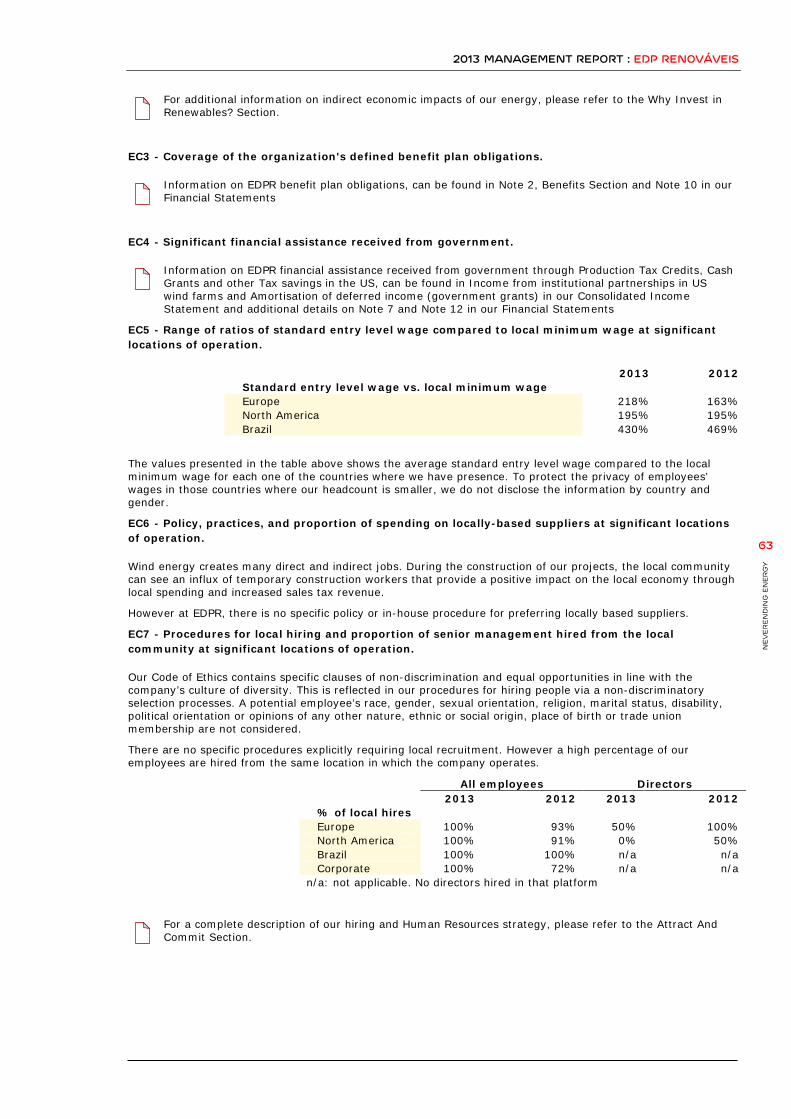
2013 MANAGEMENT REPORT : EDP RENOVÁVEIS
NEV
ER
EN
DIN
G E
NER
GY
63
For additional information on indirect economic impacts of our energy, please refer to the Why Invest in Renewables? Section.
EC3 - Coverage of the organization's defined benefit plan obligations.
Information on EDPR benefit plan obligations, can be found in Note 2, Benefits Section and Note 10 in our Financial Statements
EC4 - Significant financial assistance received from government.
Information on EDPR financial assistance received from government through Production Tax Credits, Cash Grants and other Tax savings in the US, can be found in Income from institutional partnerships in US wind farms and Amortisation of deferred income (government grants) in our Consolidated Income Statement and additional details on Note 7 and Note 12 in our Financial Statements
EC5 - Range of ratios of standard entry level wage compared to local minimum wage at significant locations of operation.
2013 2012 Standard entry level wage vs. local minimum wage Europe 218% 163% North America 195% 195% Brazil 430% 469%
The values presented in the table above shows the average standard entry level wage compared to the local minimum wage for each one of the countries where we have presence. To protect the privacy of employees’ wages in those countries where our headcount is smaller, we do not disclose the information by country and gender.
EC6 - Policy, practices, and proportion of spending on locally-based suppliers at significant locations of operation.
Wind energy creates many direct and indirect jobs. During the construction of our projects, the local community can see an influx of temporary construction workers that provide a positive impact on the local economy through local spending and increased sales tax revenue.
However at EDPR, there is no specific policy or in-house procedure for preferring locally based suppliers.
EC7 - Procedures for local hiring and proportion of senior management hired from the local community at significant locations of operation.
Our Code of Ethics contains specific clauses of non-discrimination and equal opportunities in line with the company’s culture of diversity. This is reflected in our procedures for hiring people via a non-discriminatory selection processes. A potential employee’s race, gender, sexual orientation, religion, marital status, disability, political orientation or opinions of any other nature, ethnic or social origin, place of birth or trade union membership are not considered.
There are no specific procedures explicitly requiring local recruitment. However a high percentage of our employees are hired from the same location in which the company operates.
All employees Directors 2013 2012 2013 2012
% of local hires Europe 100% 93% 50% 100% North America 100% 91% 0% 50% Brazil 100% 100% n/a n/a Corporate 100% 72% n/a n/a
n/a: not applicable. No directors hired in that platform
For a complete description of our hiring and Human Resources strategy, please refer to the Attract And Commit Section.
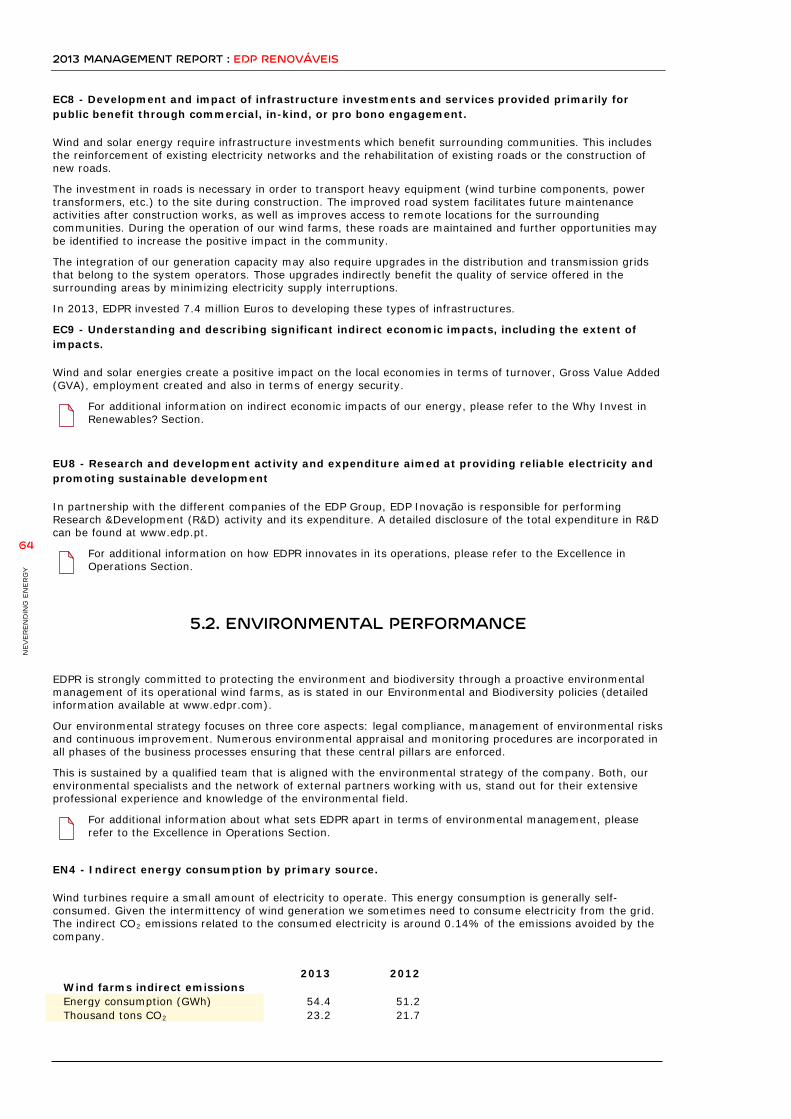
2013 MANAGEMENT REPORT : EDP RENOVÁVEIS
NEV
ER
EN
DIN
G E
NER
GY
64
EC8 - Development and impact of infrastructure investments and services provided primarily for public benefit through commercial, in-kind, or pro bono engagement.
Wind and solar energy require infrastructure investments which benefit surrounding communities. This includes the reinforcement of existing electricity networks and the rehabilitation of existing roads or the construction of new roads.
The investment in roads is necessary in order to transport heavy equipment (wind turbine components, power transformers, etc.) to the site during construction. The improved road system facilitates future maintenance activities after construction works, as well as improves access to remote locations for the surrounding communities. During the operation of our wind farms, these roads are maintained and further opportunities may be identified to increase the positive impact in the community.
The integration of our generation capacity may also require upgrades in the distribution and transmission grids that belong to the system operators. Those upgrades indirectly benefit the quality of service offered in the surrounding areas by minimizing electricity supply interruptions.
In 2013, EDPR invested 7.4 million Euros to developing these types of infrastructures.
EC9 - Understanding and describing significant indirect economic impacts, including the extent of impacts.
Wind and solar energies create a positive impact on the local economies in terms of turnover, Gross Value Added (GVA), employment created and also in terms of energy security.
For additional information on indirect economic impacts of our energy, please refer to the Why Invest in Renewables? Section.
EU8 - Research and development activity and expenditure aimed at providing reliable electricity and promoting sustainable development
In partnership with the different companies of the EDP Group, EDP Inovação is responsible for performing Research &Development (R&D) activity and its expenditure. A detailed disclosure of the total expenditure in R&D can be found at www.edp.pt.
For additional information on how EDPR innovates in its operations, please refer to the Excellence in Operations Section.
5.2. ENVIRONMENTAL PERFORMANCE
EDPR is strongly committed to protecting the environment and biodiversity through a proactive environmental management of its operational wind farms, as is stated in our Environmental and Biodiversity policies (detailed information available at www.edpr.com).
Our environmental strategy focuses on three core aspects: legal compliance, management of environmental risks and continuous improvement. Numerous environmental appraisal and monitoring procedures are incorporated in all phases of the business processes ensuring that these central pillars are enforced.
This is sustained by a qualified team that is aligned with the environmental strategy of the company. Both, our environmental specialists and the network of external partners working with us, stand out for their extensive professional experience and knowledge of the environmental field.
For additional information about what sets EDPR apart in terms of environmental management, please refer to the Excellence in Operations Section.
EN4 - Indirect energy consumption by primary source.
Wind turbines require a small amount of electricity to operate. This energy consumption is generally self-consumed. Given the intermittency of wind generation we sometimes need to consume electricity from the grid. The indirect CO2 emissions related to the consumed electricity is around 0.14% of the emissions avoided by the company.
2013 2012 Wind farms indirect emissions Energy consumption (GWh) 54.4 51.2 Thousand tons CO2 23.2 21.7

2013 MANAGEMENT REPORT : EDP RENOVÁVEIS
NEV
ER
EN
DIN
G E
NER
GY
65
EN7 - Initiatives to reduce indirect energy consumption and reductions achieved.
Our activity is based on clean energy generation, and we produce about 350,500 times the electricity we consume. However, we are conscious about promoting a culture of rational use of resources and we promote many internal campaigns to promote sustainable behaviours as is explained in the following pages.
For additional information about our initiatives to promote sustainable behaviours, please refer to the EN18 Indicator.
EN8 - Total water withdrawal by source.
Generation from wind energy does not consume water in its operational processes. The water is consumed only for human use. The consumption of water per GWh generated accounts for 0.46 litres/GWh. Even so, the company actively seeks to adopt more eco-efficient practices. An example of this is that in 2013 seven substations installed rain water collection and treatment systems to cover their own water supply needs.
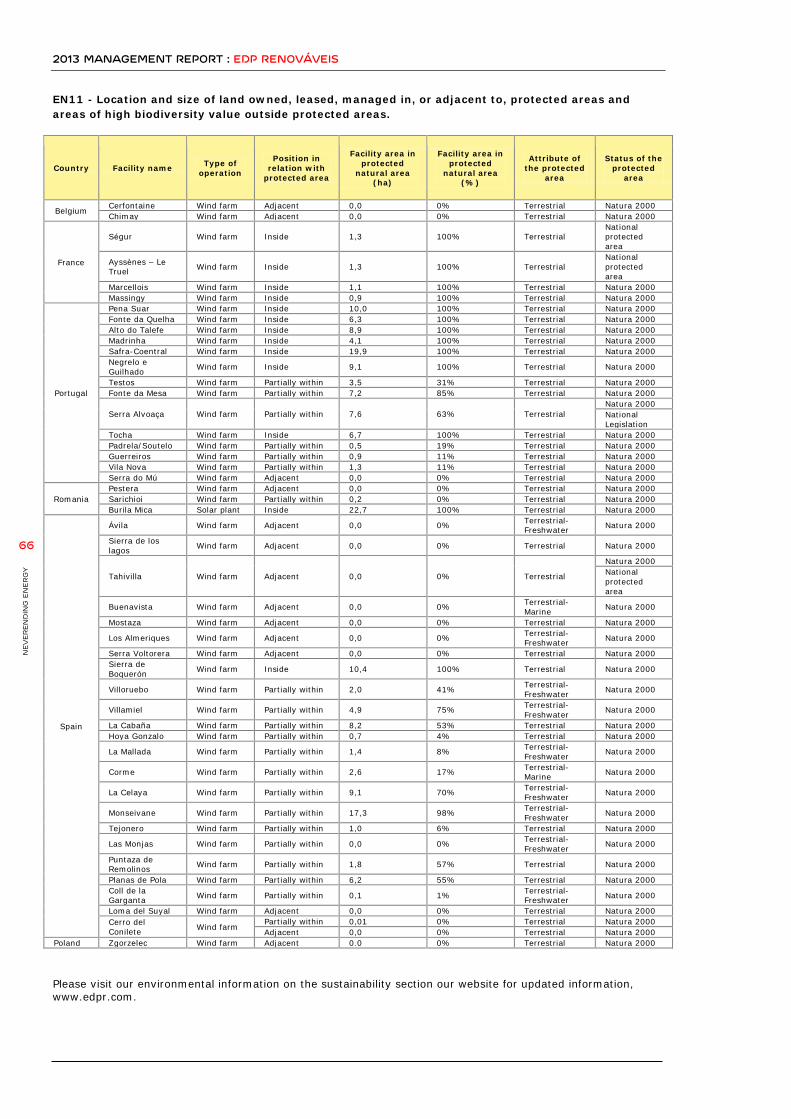
2013 MANAGEMENT REPORT : EDP RENOVÁVEIS
NEV
ER
EN
DIN
G E
NER
GY
66
EN11 - Location and size of land owned, leased, managed in, or adjacent to, protected areas and areas of high biodiversity value outside protected areas.
Country Facility name Type of operation
Position in relation with
protected area
Facility area in protected
natural area (ha)
Facility area in protected
natural area (%)
Attribute of the protected
area
Status of the protected
area
Belgium Cerfontaine Wind farm Adjacent 0,0 0% Terrestrial Natura 2000 Chimay Wind farm Adjacent 0,0 0% Terrestrial Natura 2000
France
Ségur Wind farm Inside 1,3 100% Terrestrial National protected area
Ayssènes – Le Truel Wind farm Inside 1,3 100% Terrestrial
National protected area
Marcellois Wind farm Inside 1,1 100% Terrestrial Natura 2000 Massingy Wind farm Inside 0,9 100% Terrestrial Natura 2000
Portugal
Pena Suar Wind farm Inside 10,0 100% Terrestrial Natura 2000 Fonte da Quelha Wind farm Inside 6,3 100% Terrestrial Natura 2000 Alto do Talefe Wind farm Inside 8,9 100% Terrestrial Natura 2000 Madrinha Wind farm Inside 4,1 100% Terrestrial Natura 2000 Safra-Coentral Wind farm Inside 19,9 100% Terrestrial Natura 2000 Negrelo e Guilhado Wind farm Inside 9,1 100% Terrestrial Natura 2000
Testos Wind farm Partially within 3,5 31% Terrestrial Natura 2000 Fonte da Mesa Wind farm Partially within 7,2 85% Terrestrial Natura 2000
Serra Alvoaça Wind farm Partially within 7,6 63% Terrestrial Natura 2000 National Legislation
Tocha Wind farm Inside 6,7 100% Terrestrial Natura 2000 Padrela/Soutelo Wind farm Partially within 0,5 19% Terrestrial Natura 2000 Guerreiros Wind farm Partially within 0,9 11% Terrestrial Natura 2000 Vila Nova Wind farm Partially within 1,3 11% Terrestrial Natura 2000 Serra do Mú Wind farm Adjacent 0,0 0% Terrestrial Natura 2000
Romania Pestera Wind farm Adjacent 0,0 0% Terrestrial Natura 2000 Sarichioi Wind farm Partially within 0,2 0% Terrestrial Natura 2000 Burila Mica Solar plant Inside 22,7 100% Terrestrial Natura 2000
Spain
Ávila Wind farm Adjacent 0,0 0% Terrestrial-Freshwater Natura 2000
Sierra de los lagos Wind farm Adjacent 0,0 0% Terrestrial Natura 2000
Tahivilla Wind farm Adjacent 0,0 0% Terrestrial
Natura 2000 National protected area
Buenavista Wind farm Adjacent 0,0 0% Terrestrial- Marine Natura 2000
Mostaza Wind farm Adjacent 0,0 0% Terrestrial Natura 2000
Los Almeriques Wind farm Adjacent 0,0 0% Terrestrial-Freshwater Natura 2000
Serra Voltorera Wind farm Adjacent 0,0 0% Terrestrial Natura 2000 Sierra de Boquerón Wind farm Inside 10,4 100% Terrestrial Natura 2000
Villoruebo Wind farm Partially within 2,0 41% Terrestrial-Freshwater Natura 2000
Villamiel Wind farm Partially within 4,9 75% Terrestrial-Freshwater Natura 2000
La Cabaña Wind farm Partially within 8,2 53% Terrestrial Natura 2000 Hoya Gonzalo Wind farm Partially within 0,7 4% Terrestrial Natura 2000
La Mallada Wind farm Partially within 1,4 8% Terrestrial-Freshwater Natura 2000
Corme Wind farm Partially within 2,6 17% Terrestrial-Marine Natura 2000
La Celaya Wind farm Partially within 9,1 70% Terrestrial-Freshwater Natura 2000
Monseivane Wind farm Partially within 17,3 98% Terrestrial-Freshwater Natura 2000
Tejonero Wind farm Partially within 1,0 6% Terrestrial Natura 2000
Las Monjas Wind farm Partially within 0,0 0% Terrestrial-Freshwater Natura 2000
Puntaza de Remolinos Wind farm Partially within 1,8 57% Terrestrial Natura 2000
Planas de Pola Wind farm Partially within 6,2 55% Terrestrial Natura 2000 Coll de la Garganta Wind farm Partially within 0,1 1% Terrestrial-
Freshwater Natura 2000
Loma del Suyal Wind farm Adjacent 0,0 0% Terrestrial Natura 2000 Cerro del Conilete Wind farm
Partially within 0,01 0% Terrestrial Natura 2000 Adjacent 0,0 0% Terrestrial Natura 2000
Poland Zgorzelec Wind farm Adjacent 0.0 0% Terrestrial Natura 2000
Please visit our environmental information on the sustainability section our website for updated information, www.edpr.com.
2013 MANAGEMENT REPORT : EDP RENOVÁVEIS
NEV
ER
EN
DIN
G E
NER
GY
67
EN12 - Description of significant impacts of activities, products, and services on biodiversity in protected areas and areas of high biodiversity value outside protected areas.
Potential environmental impacts are analysed in detail in the environmental impact studies of the projects. Additionally feasible alternatives are assessed and preventive, corrective and compensation measures are determined.
The company has defined general procedures in its Environmental Management System to prevent, correct or compensate impacts in the environment. In addition, efforts are intensified with specific monitoring procedures in the small number of sites located inside or close to protected areas.
For additional information, visit our environmental information on the sustainability section our website, www.edpr.com.
EU13 - Biodiversity of offset habitats compared to the biodiversity of the affected areas.
In the small number of sites located inside or close to protected areas, we intensify our efforts with specific monitoring procedures, as defined in our Environmental Management System.
For additional information, visit our environmental information on the sustainability section our website, www.edpr.com.
EN13 - Habitats protected or restored.
After the construction period, it is our duty to return the site to its initial state. Therefore, we perform morphological restoration and reseeding works. In 2013, 57 ha of affected land were restored.
EDPR has been collaborating for the past years with the Natural Heritage Foundation of Castilla y León (Spain). As part of the activities financed we highlight the environmental restoration of an area heavily impacted by a public motorway in the Burgos province of Spain. The restoration project created a wetland system that provides shelter and food for migratory birds crossing the Iberian Peninsula. Long fly routes without intermediate rest areas is one of the main causes of stress for migratory birds crossing the central dry regions of Spain.
The restored area also provides a habitat for numerous amphibians and reptile species and has benefited surrounding populations by recovering the landscape, designing flood control systems, implementing noise insulation from the motorway, among other benefits.
The collaboration of EDPR with the Natural Heritage Foundation of Castilla y León has also included other projects, such as:
• The restoration of various natural ponds in Carcedo de Burgos. • Construction of a visitor’s centre in Aliseda de Tormes. • Adaptation of the pathways at the “Lagunas glaciares de Neila” natural park and signposts showing
regulations for public use. • Monitoring of the Dupont’s Lark in the area of Medinaceli. • Monitoring, preservation and improvement of the habitats of the Black Stork, the Cinereous Vulture, the
Spanish Imperial Eagle and other birds of prey in the province of Ávila.
EN14 - Strategies, current actions, and future plans for managing impacts on biodiversity.
The increase in global temperature and other symptoms of climate change such as extreme weather events will greatly reduce the biodiversity in most parts of the world. Acting now to mitigate climate change can avoid the projected climatic range loss for biodiversity. EDPR is committed to promote biodiversity conservation and has an active role in reducing loss in biodiversity.
The management of the impact on biodiversity is part of our own environmental policy. We take precautionary measures to avoid locating wind farms in areas where they could pose risks to biodiversity. Through preventive, corrective and compensatory measures we seek an overall positive balance of our projects and activities.
In 2013, we focused our efforts to standardize our environmental impact assessment studies, by adopting best practices, reinforced mitigation and compensation measures and adopted more efficient post-construction monitoring practices.
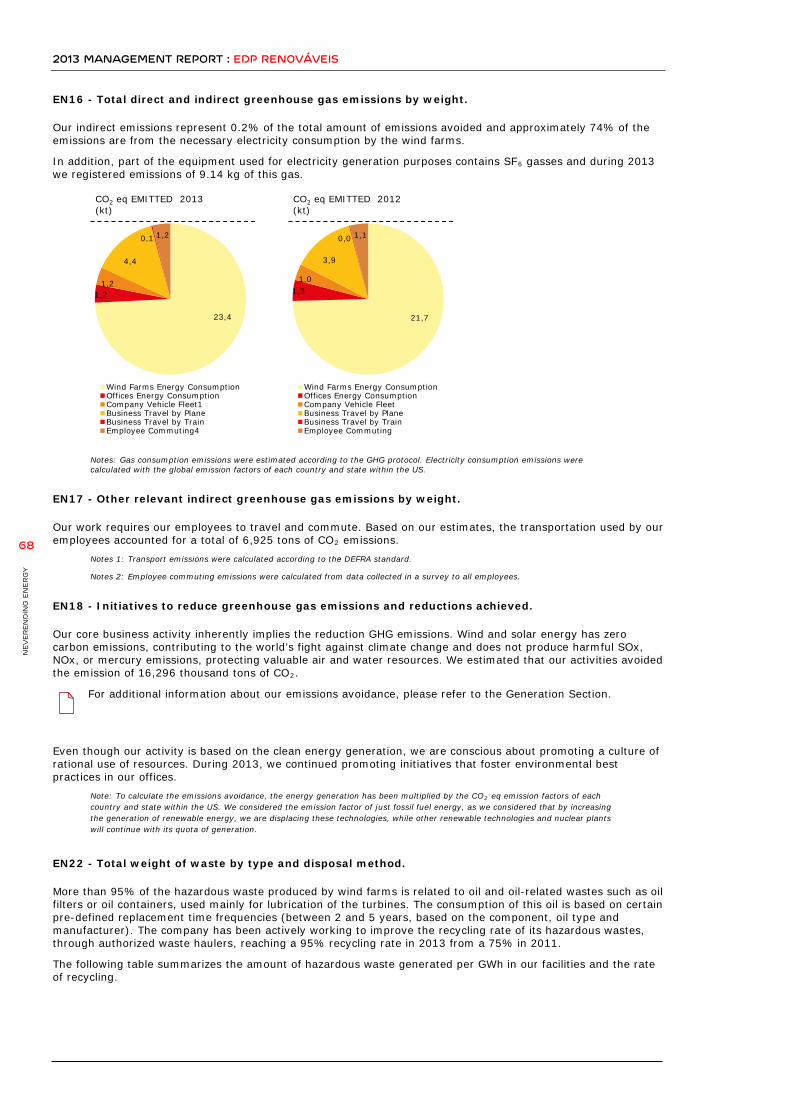
2013 MANAGEMENT REPORT : EDP RENOVÁVEIS
NEV
ER
EN
DIN
G E
NER
GY
68
EN16 - Total direct and indirect greenhouse gas emissions by weight.
Our indirect emissions represent 0.2% of the total amount of emissions avoided and approximately 74% of the emissions are from the necessary electricity consumption by the wind farms.
In addition, part of the equipment used for electricity generation purposes contains SF6 gasses and during 2013 we registered emissions of 9.14 kg of this gas.
Notes: Gas consumption emissions were estimated according to the GHG protocol. Electricity consumption emissions were calculated with the global emission factors of each country and state within the US.
EN17 - Other relevant indirect greenhouse gas emissions by weight.
Our work requires our employees to travel and commute. Based on our estimates, the transportation used by our employees accounted for a total of 6,925 tons of CO2 emissions.
Notes 1: Transport emissions were calculated according to the DEFRA standard.
Notes 2: Employee commuting emissions were calculated from data collected in a survey to all employees.
EN18 - Initiatives to reduce greenhouse gas emissions and reductions achieved.
Our core business activity inherently implies the reduction GHG emissions. Wind and solar energy has zero carbon emissions, contributing to the world’s fight against climate change and does not produce harmful SOx, NOx, or mercury emissions, protecting valuable air and water resources. We estimated that our activities avoided the emission of 16,296 thousand tons of CO2.
For additional information about our emissions avoidance, please refer to the Generation Section.
Even though our activity is based on the clean energy generation, we are conscious about promoting a culture of rational use of resources. During 2013, we continued promoting initiatives that foster environmental best practices in our offices.
Note: To calculate the emissions avoidance, the energy generation has been multiplied by the CO2 eq emission factors of each country and state within the US. We considered the emission factor of just fossil fuel energy, as we considered that by increasing the generation of renewable energy, we are displacing these technologies, while other renewable technologies and nuclear plants will continue with its quota of generation.
EN22 - Total weight of waste by type and disposal method.
More than 95% of the hazardous waste produced by wind farms is related to oil and oil-related wastes such as oil filters or oil containers, used mainly for lubrication of the turbines. The consumption of this oil is based on certain pre-defined replacement time frequencies (between 2 and 5 years, based on the component, oil type and manufacturer). The company has been actively working to improve the recycling rate of its hazardous wastes, through authorized waste haulers, reaching a 95% recycling rate in 2013 from a 75% in 2011.
The following table summarizes the amount of hazardous waste generated per GWh in our facilities and the rate of recycling.
23,4
1,2 1,2
4,4
0,1 1,2
CO2 eq EMITTED 2013 (kt)
Wind Farms Energy ConsumptionOffices Energy ConsumptionCompany Vehicle Fleet1Business Travel by PlaneBusiness Travel by TrainEmployee Commuting4
21,7
1,3 1,0
3,9
0,0 1,1
CO2 eq EMITTED 2012 (kt)
Wind Farms Energy ConsumptionOffices Energy ConsumptionCompany Vehicle FleetBusiness Travel by PlaneBusiness Travel by TrainEmployee Commuting
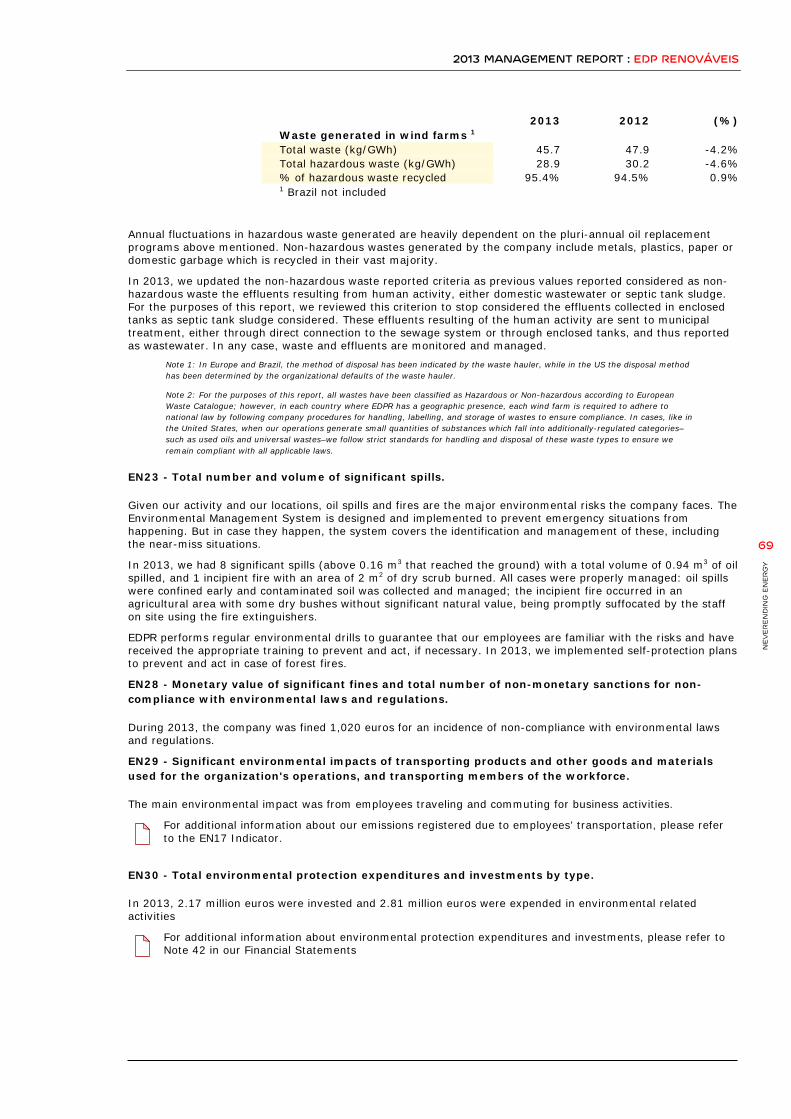
2013 MANAGEMENT REPORT : EDP RENOVÁVEIS
NEV
ER
EN
DIN
G E
NER
GY
69
2013 2012 (%) Waste generated in wind farms 1 Total waste (kg/GWh) 45.7 47.9 -4.2% Total hazardous waste (kg/GWh) 28.9 30.2 -4.6% % of hazardous waste recycled 95.4% 94.5% 0.9% 1 Brazil not included
Annual fluctuations in hazardous waste generated are heavily dependent on the pluri-annual oil replacement programs above mentioned. Non-hazardous wastes generated by the company include metals, plastics, paper or domestic garbage which is recycled in their vast majority.
In 2013, we updated the non-hazardous waste reported criteria as previous values reported considered as non-hazardous waste the effluents resulting from human activity, either domestic wastewater or septic tank sludge. For the purposes of this report, we reviewed this criterion to stop considered the effluents collected in enclosed tanks as septic tank sludge considered. These effluents resulting of the human activity are sent to municipal treatment, either through direct connection to the sewage system or through enclosed tanks, and thus reported as wastewater. In any case, waste and effluents are monitored and managed.
Note 1: In Europe and Brazil, the method of disposal has been indicated by the waste hauler, while in the US the disposal method has been determined by the organizational defaults of the waste hauler.
Note 2: For the purposes of this report, all wastes have been classified as Hazardous or Non-hazardous according to European Waste Catalogue; however, in each country where EDPR has a geographic presence, each wind farm is required to adhere to national law by following company procedures for handling, labelling, and storage of wastes to ensure compliance. In cases, like in the United States, when our operations generate small quantities of substances which fall into additionally-regulated categories–such as used oils and universal wastes–we follow strict standards for handling and disposal of these waste types to ensure we remain compliant with all applicable laws.
EN23 - Total number and volume of significant spills.
Given our activity and our locations, oil spills and fires are the major environmental risks the company faces. The Environmental Management System is designed and implemented to prevent emergency situations from happening. But in case they happen, the system covers the identification and management of these, including the near-miss situations.
In 2013, we had 8 significant spills (above 0.16 m3 that reached the ground) with a total volume of 0.94 m3 of oil spilled, and 1 incipient fire with an area of 2 m2 of dry scrub burned. All cases were properly managed: oil spills were confined early and contaminated soil was collected and managed; the incipient fire occurred in an agricultural area with some dry bushes without significant natural value, being promptly suffocated by the staff on site using the fire extinguishers.
EDPR performs regular environmental drills to guarantee that our employees are familiar with the risks and have received the appropriate training to prevent and act, if necessary. In 2013, we implemented self-protection plans to prevent and act in case of forest fires.
EN28 - Monetary value of significant fines and total number of non-monetary sanctions for non-compliance with environmental laws and regulations.
During 2013, the company was fined 1,020 euros for an incidence of non-compliance with environmental laws and regulations.
EN29 - Significant environmental impacts of transporting products and other goods and materials used for the organization's operations, and transporting members of the workforce.
The main environmental impact was from employees traveling and commuting for business activities.
For additional information about our emissions registered due to employees’ transportation, please refer to the EN17 Indicator.
EN30 - Total environmental protection expenditures and investments by type.
In 2013, 2.17 million euros were invested and 2.81 million euros were expended in environmental related activities
For additional information about environmental protection expenditures and investments, please refer to Note 42 in our Financial Statements
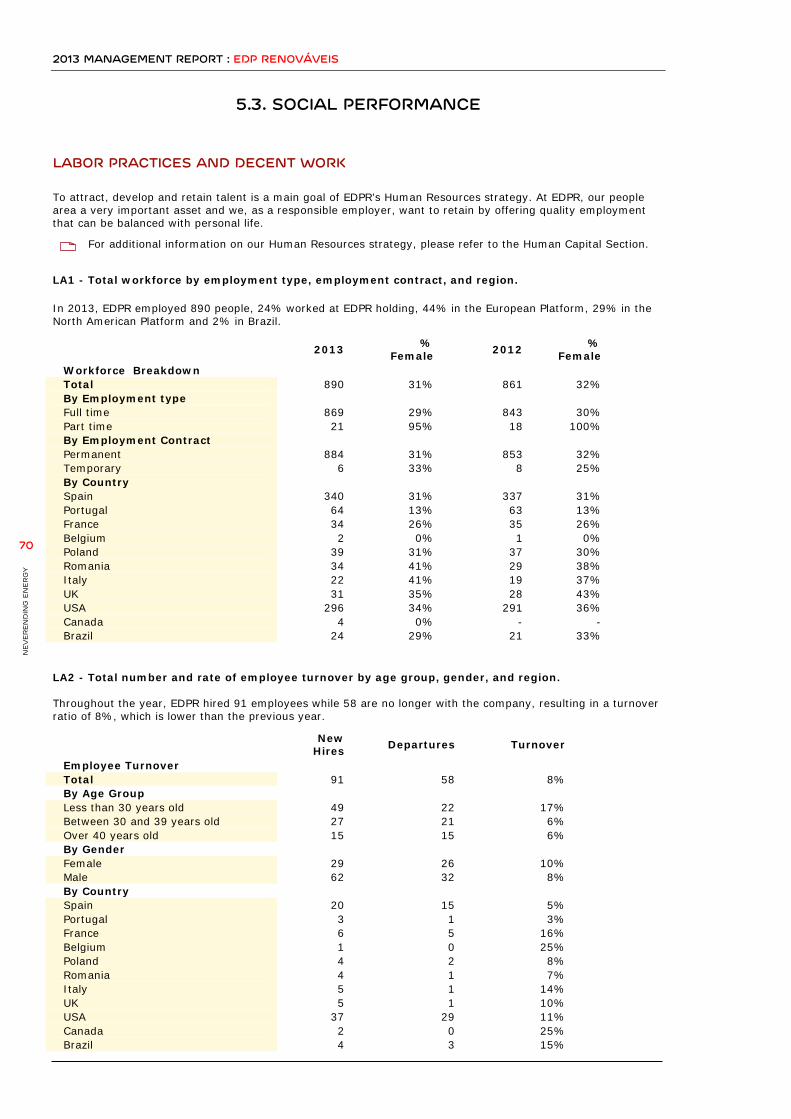
2013 MANAGEMENT REPORT : EDP RENOVÁVEIS
NEV
ER
EN
DIN
G E
NER
GY
70
5.3. SOCIAL PERFORMANCE
LABOR PRACTICES AND DECENT WORK To attract, develop and retain talent is a main goal of EDPR’s Human Resources strategy. At EDPR, our people area a very important asset and we, as a responsible employer, want to retain by offering quality employment that can be balanced with personal life.
For additional information on our Human Resources strategy, please refer to the Human Capital Section.
LA1 - Total workforce by employment type, employment contract, and region.
In 2013, EDPR employed 890 people, 24% worked at EDPR holding, 44% in the European Platform, 29% in the North American Platform and 2% in Brazil.
2013 %
Female 2012 %
Female Workforce Breakdown Total 890 31% 861 32% By Employment type Full time 869 29% 843 30% Part time 21 95% 18 100% By Employment Contract Permanent 884 31% 853 32% Temporary 6 33% 8 25% By Country Spain 340 31% 337 31% Portugal 64 13% 63 13% France 34 26% 35 26% Belgium 2 0% 1 0% Poland 39 31% 37 30% Romania 34 41% 29 38% Italy 22 41% 19 37% UK 31 35% 28 43% USA 296 34% 291 36% Canada 4 0% - - Brazil 24 29% 21 33%
LA2 - Total number and rate of employee turnover by age group, gender, and region. Throughout the year, EDPR hired 91 employees while 58 are no longer with the company, resulting in a turnover ratio of 8%, which is lower than the previous year.
New
Hires Departures Turnover
Employee Turnover Total 91 58 8% By Age Group Less than 30 years old 49 22 17% Between 30 and 39 years old 27 21 6% Over 40 years old 15 15 6% By Gender Female 29 26 10% Male 62 32 8% By Country Spain 20 15 5% Portugal 3 1 3% France 6 5 16% Belgium 1 0 25% Poland 4 2 8% Romania 4 1 7% Italy 5 1 14% UK 5 1 10% USA 37 29 11% Canada 2 0 25% Brazil 4 3 15%
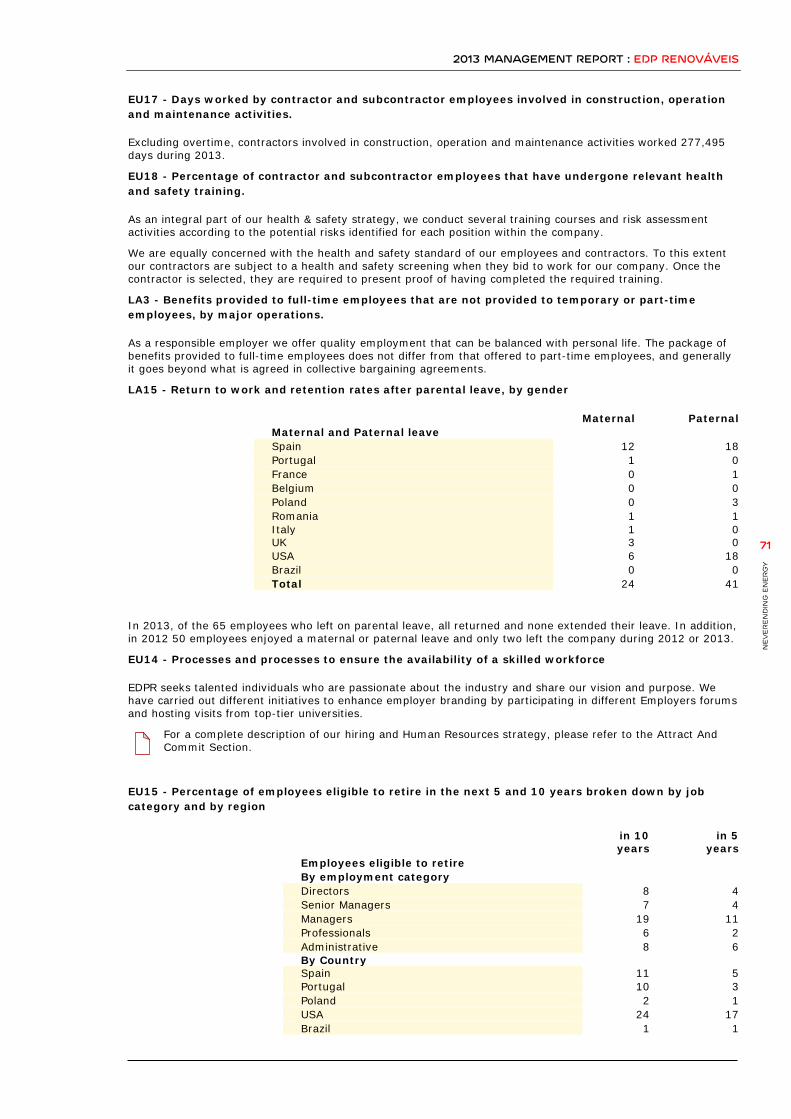
2013 MANAGEMENT REPORT : EDP RENOVÁVEIS
NEV
ER
EN
DIN
G E
NER
GY
71
EU17 - Days worked by contractor and subcontractor employees involved in construction, operation and maintenance activities.
Excluding overtime, contractors involved in construction, operation and maintenance activities worked 277,495 days during 2013.
EU18 - Percentage of contractor and subcontractor employees that have undergone relevant health and safety training.
As an integral part of our health & safety strategy, we conduct several training courses and risk assessment activities according to the potential risks identified for each position within the company.
We are equally concerned with the health and safety standard of our employees and contractors. To this extent our contractors are subject to a health and safety screening when they bid to work for our company. Once the contractor is selected, they are required to present proof of having completed the required training.
LA3 - Benefits provided to full-time employees that are not provided to temporary or part-time employees, by major operations.
As a responsible employer we offer quality employment that can be balanced with personal life. The package of benefits provided to full-time employees does not differ from that offered to part-time employees, and generally it goes beyond what is agreed in collective bargaining agreements.
LA15 - Return to work and retention rates after parental leave, by gender
Maternal Paternal Maternal and Paternal leave Spain 12 18 Portugal 1 0 France 0 1 Belgium 0 0 Poland 0 3 Romania 1 1 Italy 1 0 UK 3 0 USA 6 18 Brazil 0 0 Total 24 41
In 2013, of the 65 employees who left on parental leave, all returned and none extended their leave. In addition, in 2012 50 employees enjoyed a maternal or paternal leave and only two left the company during 2012 or 2013.
EU14 - Processes and processes to ensure the availability of a skilled workforce
EDPR seeks talented individuals who are passionate about the industry and share our vision and purpose. We have carried out different initiatives to enhance employer branding by participating in different Employers forums and hosting visits from top-tier universities.
For a complete description of our hiring and Human Resources strategy, please refer to the Attract And Commit Section.
EU15 - Percentage of employees eligible to retire in the next 5 and 10 years broken down by job category and by region
in 10 years
in 5 years
Employees eligible to retire By employment category Directors 8 4 Senior Managers 7 4 Managers 19 11 Professionals 6 2 Administrative 8 6 By Country Spain 11 5 Portugal 10 3 Poland 2 1 USA 24 17 Brazil 1 1
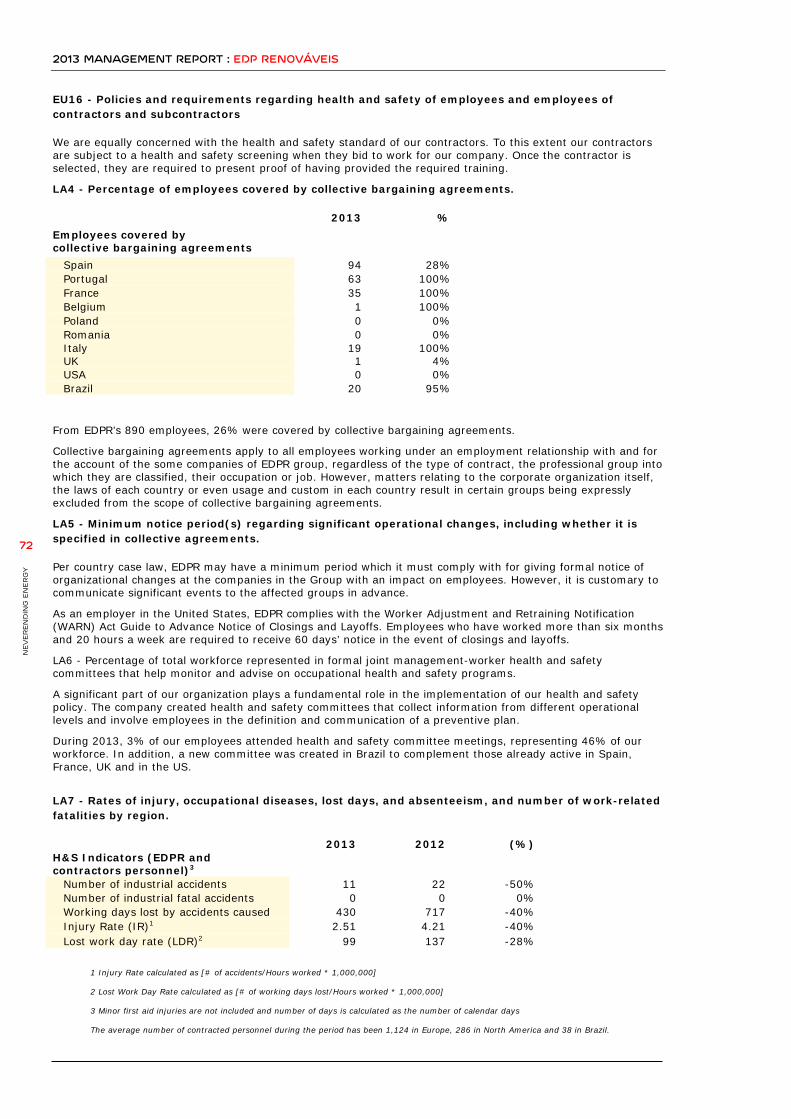
2013 MANAGEMENT REPORT : EDP RENOVÁVEIS
NEV
ER
EN
DIN
G E
NER
GY
72
EU16 - Policies and requirements regarding health and safety of employees and employees of contractors and subcontractors
We are equally concerned with the health and safety standard of our contractors. To this extent our contractors are subject to a health and safety screening when they bid to work for our company. Once the contractor is selected, they are required to present proof of having provided the required training.
LA4 - Percentage of employees covered by collective bargaining agreements.
2013 % Employees covered by collective bargaining agreements
Spain 94 28% Portugal 63 100% France 35 100% Belgium 1 100% Poland 0 0% Romania 0 0% Italy 19 100% UK 1 4% USA 0 0% Brazil 20 95%
From EDPR’s 890 employees, 26% were covered by collective bargaining agreements.
Collective bargaining agreements apply to all employees working under an employment relationship with and for the account of the some companies of EDPR group, regardless of the type of contract, the professional group into which they are classified, their occupation or job. However, matters relating to the corporate organization itself, the laws of each country or even usage and custom in each country result in certain groups being expressly excluded from the scope of collective bargaining agreements.
LA5 - Minimum notice period(s) regarding significant operational changes, including whether it is specified in collective agreements.
Per country case law, EDPR may have a minimum period which it must comply with for giving formal notice of organizational changes at the companies in the Group with an impact on employees. However, it is customary to communicate significant events to the affected groups in advance.
As an employer in the United States, EDPR complies with the Worker Adjustment and Retraining Notification (WARN) Act Guide to Advance Notice of Closings and Layoffs. Employees who have worked more than six months and 20 hours a week are required to receive 60 days’ notice in the event of closings and layoffs.
LA6 - Percentage of total workforce represented in formal joint management-worker health and safety committees that help monitor and advise on occupational health and safety programs.
A significant part of our organization plays a fundamental role in the implementation of our health and safety policy. The company created health and safety committees that collect information from different operational levels and involve employees in the definition and communication of a preventive plan.
During 2013, 3% of our employees attended health and safety committee meetings, representing 46% of our workforce. In addition, a new committee was created in Brazil to complement those already active in Spain, France, UK and in the US.
LA7 - Rates of injury, occupational diseases, lost days, and absenteeism, and number of work-related fatalities by region.
2013 2012 (%) H&S Indicators (EDPR and contractors personnel)3
Number of industrial accidents 11 22 -50% Number of industrial fatal accidents 0 0 0% Working days lost by accidents caused 430 717 -40% Injury Rate (IR)1 2.51 4.21 -40% Lost work day rate (LDR)2 99 137 -28%
1 Injury Rate calculated as [# of accidents/Hours worked * 1,000,000]
2 Lost Work Day Rate calculated as [# of working days lost/Hours worked * 1,000,000]
3 Minor first aid injuries are not included and number of days is calculated as the number of calendar days
The average number of contracted personnel during the period has been 1,124 in Europe, 286 in North America and 38 in Brazil.
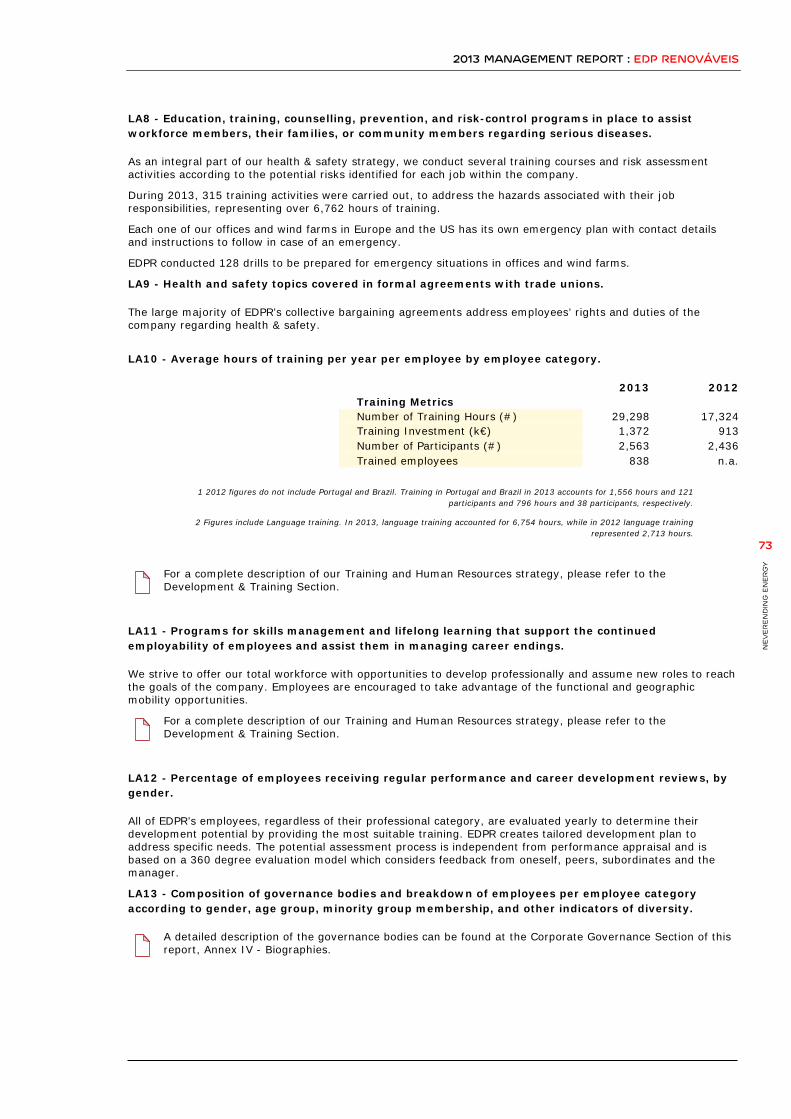
2013 MANAGEMENT REPORT : EDP RENOVÁVEIS
NEV
ER
EN
DIN
G E
NER
GY
73
LA8 - Education, training, counselling, prevention, and risk-control programs in place to assist workforce members, their families, or community members regarding serious diseases.
As an integral part of our health & safety strategy, we conduct several training courses and risk assessment activities according to the potential risks identified for each job within the company.
During 2013, 315 training activities were carried out, to address the hazards associated with their job responsibilities, representing over 6,762 hours of training.
Each one of our offices and wind farms in Europe and the US has its own emergency plan with contact details and instructions to follow in case of an emergency.
EDPR conducted 128 drills to be prepared for emergency situations in offices and wind farms.
LA9 - Health and safety topics covered in formal agreements with trade unions.
The large majority of EDPR’s collective bargaining agreements address employees’ rights and duties of the company regarding health & safety.
LA10 - Average hours of training per year per employee by employee category.
2013 2012 Training Metrics Number of Training Hours (#) 29,298 17,324 Training Investment (k€) 1,372 913 Number of Participants (#) 2,563 2,436 Trained employees 838 n.a.
1 2012 figures do not include Portugal and Brazil. Training in Portugal and Brazil in 2013 accounts for 1,556 hours and 121 participants and 796 hours and 38 participants, respectively.
2 Figures include Language training. In 2013, language training accounted for 6,754 hours, while in 2012 language training represented 2,713 hours.
For a complete description of our Training and Human Resources strategy, please refer to the Development & Training Section.
LA11 - Programs for skills management and lifelong learning that support the continued employability of employees and assist them in managing career endings.
We strive to offer our total workforce with opportunities to develop professionally and assume new roles to reach the goals of the company. Employees are encouraged to take advantage of the functional and geographic mobility opportunities.
For a complete description of our Training and Human Resources strategy, please refer to the Development & Training Section.
LA12 - Percentage of employees receiving regular performance and career development reviews, by gender.
All of EDPR’s employees, regardless of their professional category, are evaluated yearly to determine their development potential by providing the most suitable training. EDPR creates tailored development plan to address specific needs. The potential assessment process is independent from performance appraisal and is based on a 360 degree evaluation model which considers feedback from oneself, peers, subordinates and the manager.
LA13 - Composition of governance bodies and breakdown of employees per employee category according to gender, age group, minority group membership, and other indicators of diversity.
A detailed description of the governance bodies can be found at the Corporate Governance Section of this report, Annex IV - Biographies.
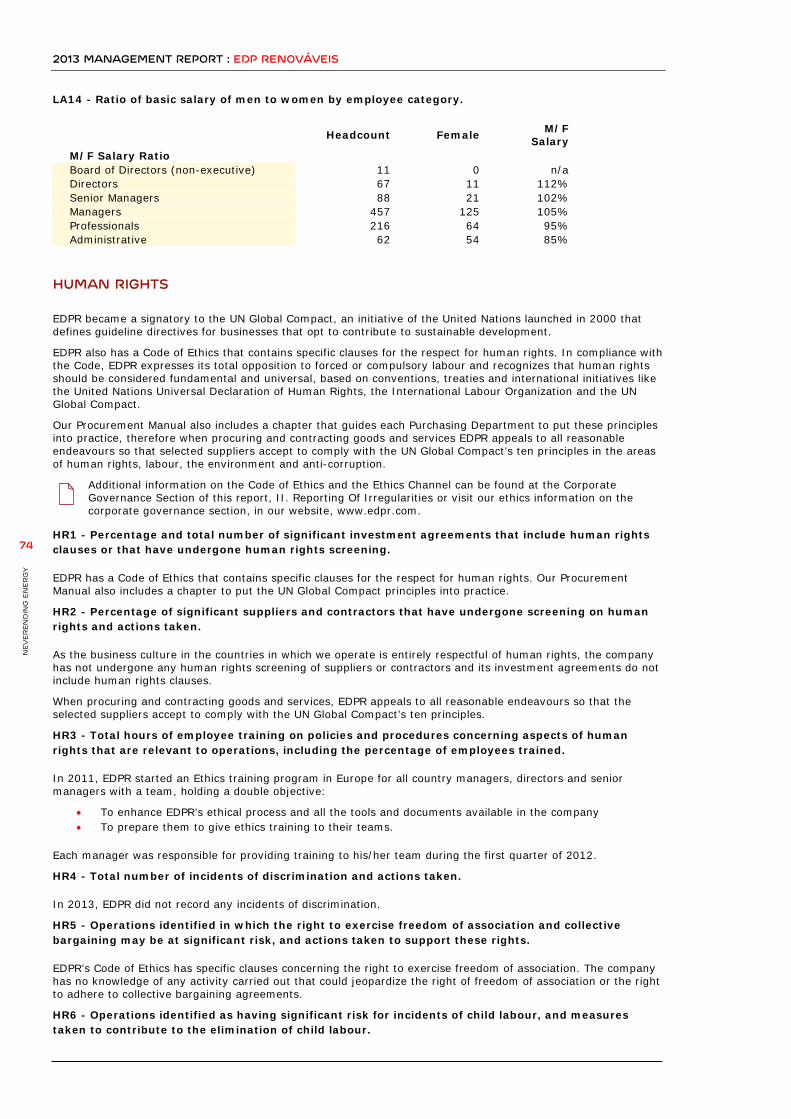
2013 MANAGEMENT REPORT : EDP RENOVÁVEIS
NEV
ER
EN
DIN
G E
NER
GY
74
LA14 - Ratio of basic salary of men to women by employee category.
Headcount Female M/F
Salary M/F Salary Ratio Board of Directors (non-executive) 11 0 n/a Directors 67 11 112% Senior Managers 88 21 102% Managers 457 125 105% Professionals 216 64 95% Administrative 62 54 85%
HUMAN RIGHTS EDPR became a signatory to the UN Global Compact, an initiative of the United Nations launched in 2000 that defines guideline directives for businesses that opt to contribute to sustainable development.
EDPR also has a Code of Ethics that contains specific clauses for the respect for human rights. In compliance with the Code, EDPR expresses its total opposition to forced or compulsory labour and recognizes that human rights should be considered fundamental and universal, based on conventions, treaties and international initiatives like the United Nations Universal Declaration of Human Rights, the International Labour Organization and the UN Global Compact.
Our Procurement Manual also includes a chapter that guides each Purchasing Department to put these principles into practice, therefore when procuring and contracting goods and services EDPR appeals to all reasonable endeavours so that selected suppliers accept to comply with the UN Global Compact’s ten principles in the areas of human rights, labour, the environment and anti-corruption.
Additional information on the Code of Ethics and the Ethics Channel can be found at the Corporate Governance Section of this report, II. Reporting Of Irregularities or visit our ethics information on the corporate governance section, in our website, www.edpr.com.
HR1 - Percentage and total number of significant investment agreements that include human rights clauses or that have undergone human rights screening.
EDPR has a Code of Ethics that contains specific clauses for the respect for human rights. Our Procurement Manual also includes a chapter to put the UN Global Compact principles into practice.
HR2 - Percentage of significant suppliers and contractors that have undergone screening on human rights and actions taken.
As the business culture in the countries in which we operate is entirely respectful of human rights, the company has not undergone any human rights screening of suppliers or contractors and its investment agreements do not include human rights clauses.
When procuring and contracting goods and services, EDPR appeals to all reasonable endeavours so that the selected suppliers accept to comply with the UN Global Compact’s ten principles.
HR3 - Total hours of employee training on policies and procedures concerning aspects of human rights that are relevant to operations, including the percentage of employees trained.
In 2011, EDPR started an Ethics training program in Europe for all country managers, directors and senior managers with a team, holding a double objective:
• To enhance EDPR’s ethical process and all the tools and documents available in the company • To prepare them to give ethics training to their teams.
Each manager was responsible for providing training to his/her team during the first quarter of 2012.
HR4 - Total number of incidents of discrimination and actions taken.
In 2013, EDPR did not record any incidents of discrimination.
HR5 - Operations identified in which the right to exercise freedom of association and collective bargaining may be at significant risk, and actions taken to support these rights.
EDPR’s Code of Ethics has specific clauses concerning the right to exercise freedom of association. The company has no knowledge of any activity carried out that could jeopardize the right of freedom of association or the right to adhere to collective bargaining agreements.
HR6 - Operations identified as having significant risk for incidents of child labour, and measures taken to contribute to the elimination of child labour.

2013 MANAGEMENT REPORT : EDP RENOVÁVEIS
NEV
ER
EN
DIN
G E
NER
GY
75
EDPR’s Code of Ethics has specific clauses against child or forced labour. The company did not identify any operation that could have a significant risk for incidents of child labour, forced and compulsory labour or indigenous rights.
HR7 - Operations identified as having significant risk for incidents of forced or compulsory labour, and measures to contribute to the elimination of forced or compulsory labour.
EDPR’s Code of Ethics has specific clauses against child or forced labour. The company did not identify any operation that could have a significant risk for incidents of forced and compulsory labour or indigenous rights.
HR9 - Total number of incidents of violations involving rights of indigenous people and actions taken.
EDPR did not identify any operation that could have a significant risk for incidents with indigenous rights.
HR10 - Percentage and total number of operations that have been subject to human rights reviews and/or impact assessments.
EDPR has more than 200 renewable plants in operation and is present in 11 countries, all of which are within the scope of the Code of Ethics premises and regulation.
HR11 - Number of grievances related to human rights filed, addressed, and resolved through formal grievance mechanisms.
Additional information on the Whistleblowing Channel and the Ethics Channel can be found at the Corporate Governance Section of this report, II. Reporting Of Irregularities or visit our ethics information on the corporate governance section, in our website, www.edpr.com.
SOCIETY Wind and solar energies create a positive impact on the local economies in terms of turnover, Gross Value Added (GVA), employment created and also in terms of energy security.
Land leases and taxes are a large contribution to the yearly budget for the municipalities where it is present. In 2013, EDPR contributed with 65.6 million Euros in taxes and payments to the administrations and we devoted 1.4 million Euros in social projects to support education and community related activities.
SUPPORTING EDUCATION EDPR has developed its own original and comprehensive education support strategy, with different programs related to the renewable energy that have been implemented in areas where we are developing or we have operational projects.
During 2013, EDPR has continued with the third edition of its Green Education program, providing education grants to 90 students from Spain, Romania, Poland and Portugal based on their academic merits and financial situation. This program creates strong ties with the communities. In June 2013, Tarifa city council awarded EDPR a recognition and gratitude in this regards.
EDPR also promoted the education of students on the fundamentals of renewable energy. The Kid Wind initiative in the US, committed more than 60 thousand US dollars in scholarships to schools brings the science behind renewable energy into their classroom curricula.
Our education strategy is completed with our EDP University Challenge contest, where EDPR wants to promote excellence among university students and establish a collaboration framework between the company and the academic world. In this eighth edition 84 teams, with 245 students and 60 professors, coming from 41 different universities participated. The company devoted 68 thousand euros to this program, which can be followed through its own web site www.edpr-universitychallenge.es.
PARTICIPATING IN THE COMMUNITY Becoming part of a community implies to host our stakeholders in our facilities, organizing visits and events, and participate and support our neighbouring communities’ special occasions. During 2013, EDPR hosted visits from schools, such as the visit form MN’s elementary school visited the Pioneer Prairie & Prairie Star Wind Farms, were different activities were prepared by EDPR volunteers, so we transmitted how the wind farm was managed and operated. This educational visit represented the first in a series of forthcoming educationally based partnerships with local schools in the US.
In addition, EDPR hosted a “Global Wind Day” as part of a worldwide initiative, in order to promote awareness for wind energy. Wind farms Pioneer Prairie and Prairie Star in North America and Rabosera in Europe held educational and recreational activities attended by students, general public, legislators and journalists.
EDPR also participated in a wide range of sponsorship and volunteering activities with the communities. As such, in 2013 we sponsored local fairs (Expofacic fair in Portugal), cultural events (Wiatrakalia music festival in Poland), sporting events (French National Track Cycling championships), and charitable events (Save the Children dinner in Romania). Some of these contributions also include social volunteering from our employees, like it was the volunteering at local food banks in Houston and Madrid.
2013 MANAGEMENT REPORT : EDP RENOVÁVEIS
NEV
ER
EN
DIN
G E
NER
GY
76
BROADENING KNOWLEDGE In between our two social strategies, the support to education and our involvement in the community, we have a range of activities aiming to share our knowledge. This refers to our participation and/or sponsorship of several conferences and workshops. We have contributed by sharing our knowledge in order to improve biodiversity protection, the adoption of socially responsible practices and the promotion of renewable energy.
FUNDACIÓN EDP EDPR has joined Fundación EDP together with EDP and its subsidiary companies in Spain. Fundación EDP was created in November 2013 as an evolution of the former Fundación HC.
The Mission of Fundación EDP is to reinforce the commitment of EDP Group as regards to education, culture, social and environment in its geographical areas of activity.
Fundación EDP has planned for 2014 to directly develop activities in Spain for 2.7 million Euros, being EDPR an important contributor to these activities.
SO1 - Nature, scope, and effectiveness of any programs and practices that assess and manage the impacts of operations on communities, including entering, operating, and exiting.
Wind farm energy is a long lasting economic development driver for the municipalities where it is present. EDPR has different programs in place to assess and manage the impact on communities, and to maximize the shared value of our projects.
For example, grievance mechanisms during operation are also available to ensure that suggestions or complaints are properly recorded and addressed. This allows us not only to solve the complaints but to introduce improvements in our processes. A good example is the way we handle the complaints related to possible interferences with TV signal in France. We have set a procedure involving the town halls to facilitate and speed up the collection of these complaints as soon as they arise, a proper analysis and communication with the plaintiff and a fast satisfactory resolution.
For additional the contributions to the society and stakeholder management, please refer to the Excellence in Operations Section and the introduction to the SOCIETY section of GRI Report.
SO2 -Percentage and total number of business units analysed for risks related to corruption.
EDPR’s Code of Ethics applies to all employees and business units. The code is published on the company's intranet and is included in the welcome pack given to all new hires, as it needs to be signed by all of them when entering the company. In the Code of Ethics, active and passive corruption is forbidden, either through acts and omissions or through the creation of situations of benefit or illicit influence.
Additional information on the Code of Ethics and the Ethics Channel can be found at the Corporate Governance Section of this report, II. Reporting Of Irregularities or visit our ethics information on the corporate governance section, in our website, www.edpr.com.
SO3 -Percentage of employees trained in organization's anti-corruption policies and procedures.
Additional information on the Code of Ethics and the Ethics Channel can be found at the Corporate Governance Section of this report, II. Reporting Of Irregularities or visit our ethics information on the corporate governance section, in our website, www.edpr.com.
SO4 -Actions taken in response to incidents of corruption.
EDPR has no knowledge of any corruption-related incidents recorded during 203.
Moreover, the company has internal procedures to monitor compliance with the Code of Ethics and defines actions to be taken in case of incidents.
Additional information on the Code of Ethics and the Ethics Channel can be found at the Corporate Governance Section of this report, II. Reporting Of Irregularities or visit our ethics information on the corporate governance section, in our website, www.edpr.com.
SO5 -Public policy positions and participation in public policy development and lobbying.
The renewable industry has been subject to public debate all over the world. EDPR is committed to contributing to public policy dialogue with key public institutions and local communities, generating effective initiatives and policy solutions that promote the development of renewable energy.
We are aware that only through legal and regulatory certainty, will we be able to provide a sustainable business in the long term, consistently adding value for all our stakeholders and providing a contribution in the challenge to provide clean and sustainable energy.

2013 MANAGEMENT REPORT : EDP RENOVÁVEIS
NEV
ER
EN
DIN
G E
NER
GY
77
Please visit our stakeholders’ information on the sustainability section our website, www.edpr.com, for additional information on our public policy.
SO6 -Total value of financial and in-kind contributions to political parties, politicians, and related institutions by country.
EDPR made no contributions to political parties in 2013.
SO7 -Total number of legal actions for anti-competitive behaviour, anti-trust, and monopoly practices and their outcomes.
EDPR has no knowledge of any legal actions for anti-competitive behaviour, anti-trust or monopoly practices recorded during 2013.
SO8 -Monetary value of significant fines and total number of non-monetary sanctions for non-compliance with laws and regulations.
During 2013, the company received a total penalty of 261,666 euros mainly tax- related.
PRODUCT RESPONSIBILITY Our core business and health & safety initiatives are focused on the electricity generation and not in its final consumption.
EU25 - Number of injuries and fatalities to the public involving company assets, including legal judgments, settlements and pending legal cases of diseases.
During 2013, EDPR did not identify injuries or fatalities to the public involving company assets.
2013 MANAGEMENT REPORT : EDP RENOVÁVEIS
NEV
ER
EN
DIN
G E
NER
GY
78
Index
ANNEX 79 SUBSEQUENT EVENTS 79
GRI PRINCIPLES 80
06

2013 MANAGEMENT REPORT : EDP RENOVÁVEIS
NEV
ER
EN
DIN
G E
NER
GY
79
8. ANNEX
8.1. SUBSEQUENT EVENTS This Annual Report concerns the events and performance of 2013, however, the following subsequent events are relevant.
EDPRENOVÁVEIS EXECUTES PROJECT FINANCE FOR ITS FIRST PROJECT IN CANADA
On 16 January 2014, EDP Renováveis, S.A. (“EDPR”) executed a project finance structure agreement for its first wind farm in Canada. The South Branch project located in Ontario has an installed capacity of 30 MW remunerated based on a previously secured 20 year Feed-in Tariff awarded by the Ontario Power Authority.
The long-term contracted debt facility amounts to 49 million Canadian Dollars and the funding is expected to occur during the first quarter of 2014. EDPR’s financing strategy is to contract long-term debt in local currency at competitive prices in order to mitigate the refinancing risk and to reduce the foreign exchange risk by having a natural hedge between revenues and costs.
With the successful execution of its first wind project in Canada, EDPR adds to its portfolio a market with a low risk profile and attractive wind resource and extends its geographical diversification to 11 markets around the world (US, Spain, Portugal, France, Belgium, Poland, Romania, UK, Italy, Brazil and Canada).
EDPR REACHES AGREEMENT WITH AXPO
EDPR reached an agreement in October 2013 with Axpo Group, to sell a 49% non-controlling equity stake and outstanding shareholders loans in a wind farm portfolio of 100 MW located in France. These wind farms currently benefit from a feed-in tariff remuneration scheme. The settlement of the asset rotation transaction signed with Axpo Group occurred during the first quarter of 2014.
EDPR secures PPA for new 200 MW wind farm in the united states
In the US EDPR signed a 20-year Power Purchase Agreement (“PPA”) with Kansas City Power & Light Company to sell the renewable energy produced from its 200 MW Waverly wind farm project to be installed in the state of Kansas and expected to start selling electricity under the PPA in 2016.
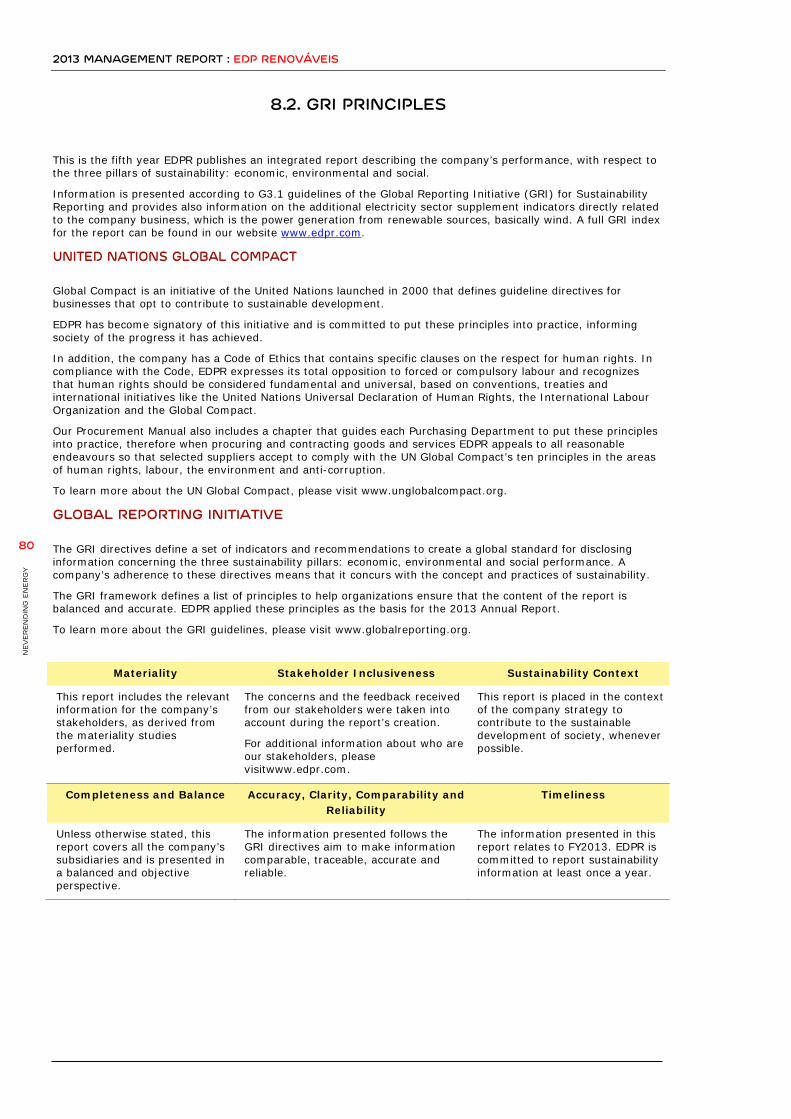
2013 MANAGEMENT REPORT : EDP RENOVÁVEIS
NEV
ER
EN
DIN
G E
NER
GY
80
8.2. GRI PRINCIPLES
This is the fifth year EDPR publishes an integrated report describing the company’s performance, with respect to the three pillars of sustainability: economic, environmental and social.
Information is presented according to G3.1 guidelines of the Global Reporting Initiative (GRI) for Sustainability Reporting and provides also information on the additional electricity sector supplement indicators directly related to the company business, which is the power generation from renewable sources, basically wind. A full GRI index for the report can be found in our website www.edpr.com.
UNITED NATIONS GLOBAL COMPACT Global Compact is an initiative of the United Nations launched in 2000 that defines guideline directives for businesses that opt to contribute to sustainable development.
EDPR has become signatory of this initiative and is committed to put these principles into practice, informing society of the progress it has achieved.
In addition, the company has a Code of Ethics that contains specific clauses on the respect for human rights. In compliance with the Code, EDPR expresses its total opposition to forced or compulsory labour and recognizes that human rights should be considered fundamental and universal, based on conventions, treaties and international initiatives like the United Nations Universal Declaration of Human Rights, the International Labour Organization and the Global Compact.
Our Procurement Manual also includes a chapter that guides each Purchasing Department to put these principles into practice, therefore when procuring and contracting goods and services EDPR appeals to all reasonable endeavours so that selected suppliers accept to comply with the UN Global Compact’s ten principles in the areas of human rights, labour, the environment and anti-corruption.
To learn more about the UN Global Compact, please visit www.unglobalcompact.org.
GLOBAL REPORTING INITIATIVE The GRI directives define a set of indicators and recommendations to create a global standard for disclosing information concerning the three sustainability pillars: economic, environmental and social performance. A company’s adherence to these directives means that it concurs with the concept and practices of sustainability.
The GRI framework defines a list of principles to help organizations ensure that the content of the report is balanced and accurate. EDPR applied these principles as the basis for the 2013 Annual Report.
To learn more about the GRI guidelines, please visit www.globalreporting.org.
Materiality Stakeholder Inclusiveness Sustainability Context
This report includes the relevant information for the company’s stakeholders, as derived from the materiality studies performed.
The concerns and the feedback received from our stakeholders were taken into account during the report’s creation.
For additional information about who are our stakeholders, please visitwww.edpr.com.
This report is placed in the context of the company strategy to contribute to the sustainable development of society, whenever possible.
Completeness and Balance Accuracy, Clarity, Comparability and Reliability
Timeliness
Unless otherwise stated, this report covers all the company’s subsidiaries and is presented in a balanced and objective perspective.
The information presented follows the GRI directives aim to make information comparable, traceable, accurate and reliable.
The information presented in this report relates to FY2013. EDPR is committed to report sustainability information at least once a year.

2013 MANAGEMENT REPORT : EDP RENOVÁVEIS
NEV
ER
EN
DIN
G E
NER
GY
81
PRINCIPLE OF MATERIALITY The macro-economic context, where the challenges of sustainability are increasing, summing up with the diversity of EDPR’s stakeholders, results in a large and complex list of important issues, which must be prioritised according to its relevance and significance.
An issue is considered material when it influences the decision, the action and the performance of an organization and its stakeholders. EDPR’s material issues were identified and the results achieved supported the preparation of this Annual Report, as reflected in the company’s management strategy and, in particular, in its agenda for sustainability.


Members of the Board of Directors of the Company EDP Renováveis, S.A.
DECLARE
To the extent of our knowledge, the information referred to in sub‐paragraph a) of paragraph 1 of Article 245 of Decree‐Law no. 357‐A/2007 of October 31 and other documents relating to the submission of accounts required by current regulations have been prepared in accordance with applicable accounting standards, reflecting a true and fair view of the assets, liabilities, financial position and results of EDP Renováveis, S.A. and the companies included in its scope of consolidation and the management report fairly presents the evolution of business performance and position of EDP Renováveis, S.A. and the companies included in its scope of consolidation, containing a description of the principal risks and uncertainties that they face.
Lisbon, February 26, 2013.
António Luís Guerra Nunes Mexia João Manuel Manso Neto
Nuno Maria Pestana de Almeida Alves João Manuel Veríssimo Marques da Cruz
Rui Manuel Rodrigues Lopes Teixeira João Paulo Nogueira da Sousa Costeira
Gabriel Alonso Imaz Manuel Menéndez Menéndez
José Fernando Maia de Araújo e Silva João Manuel de Mello Franco
João José Belard da Fonseca Lopes Raimundo Jorge Manuel Azevedo Henriques dos Santos
Rafael Caldeira de Castel‐Branco Valverde Gilles August
Related Documents