2013 LOCAL CAPACITY TECHNICAL ANALYSIS ADDENDUM TO THE FINAL REPORT AND STUDY RESULTS Absence of San Onofre Nuclear Generating Station (SONGS) August 20, 2012

Welcome message from author
This document is posted to help you gain knowledge. Please leave a comment to let me know what you think about it! Share it to your friends and learn new things together.
Transcript

2013LOCAL CAPACITY TECHNICAL
ANALYSIS
ADDENDUM TO THE FINAL REPORT AND STUDY RESULTS
Absence of San Onofre Nuclear Generating Station (SONGS)
August 20, 2012

1
Local Capacity Technical Study Overview and Results
I. Executive Summary
This Addendum to the 2013 Local Capacity Technical Analysis, dated April 30,
2012 includes the results and recommendations of the 2013 Local Capacity Technical
(LCT) Study in the absence of the San Onofre Nuclear Generating Station (SONGS).
The results and recommendations affect the LA Basin and San Diego-Imperial Valley
local areas.
This Addendum does not change the 2013 LCR allocations already provided to
Load Serving Entities (LSEs) based on the 2013 Local Capacity Technical (LCT) Study
report dated April 30, 2012. Instead, the ISO issues these results and
recommendations to provide Load Serving Entities (LSEs) with advance notice of LCR
needs in the absence of SONGS in order to facilitate a more informed 2013 Resource
Adequacy (RA) procurement. It is also the intention of the ISO to mitigate any reliability
conditions that will remain, even if the LSEs procured all the available resources in
these local areas. These results, in the absence of SONGS, will also provide a basis to
allocate the costs of any ISO procurement needed to mitigate reliability conditions
notwithstanding the resource adequacy procurement of LSEs.1
Please note that these studies assume that both SONGS units 2 and 3 are
completely unavailable for operation in 2013. At the time this study was completed,
SONGS was on an extended forced outage and the expected date that it would return
to service was undetermined.
This study includes the most updated data available on July 15, 2012, namely
the 2012 Net Qualifying Capacity (NQC) list and the California Energy Commission
(CEC) adopted load forecast that was published in June 2012.
1 For information regarding the conditions under which the CAISO may engage in procurement of local capacity and the allocation of the costs of such procurement, please see Sections 41 and 43 of the current CAISO Tariff, at: http://www.caiso.com/238a/238acd24167f0.html.
2
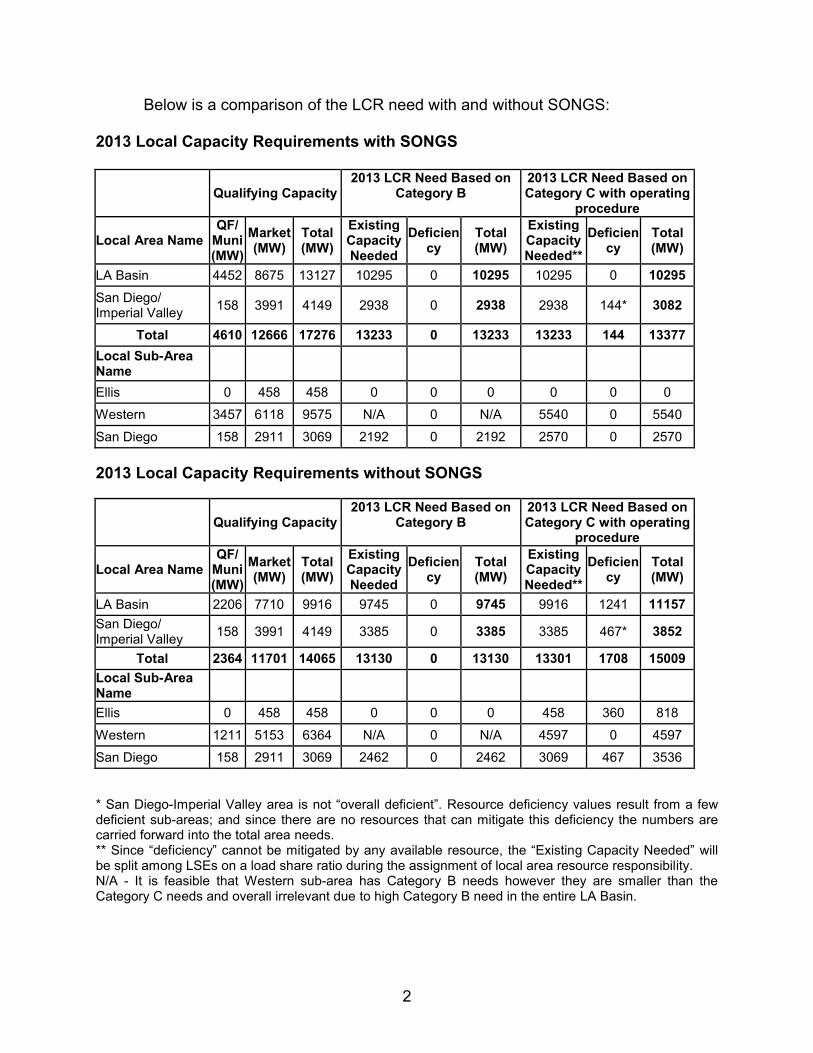
Below is a comparison of the LCR need with and without SONGS:
2013 Local Capacity Requirements with SONGS
Qualifying Capacity2013 LCR Need Based on
Category B2013 LCR Need Based on Category C with operating
procedure
Local Area NameQF/
Muni(MW)
Market(MW)
Total(MW)
Existing Capacity Needed
Deficiency
Total(MW)
Existing Capacity Needed**
Deficiency
Total(MW)
LA Basin 4452 8675 13127 10295 0 10295 10295 0 10295
San Diego/Imperial Valley
158 3991 4149 2938 0 2938 2938 144* 3082
Total 4610 12666 17276 13233 0 13233 13233 144 13377
Local Sub-Area Name
Ellis 0 458 458 0 0 0 0 0 0
Western 3457 6118 9575 N/A 0 N/A 5540 0 5540
San Diego 158 2911 3069 2192 0 2192 2570 0 2570
2013 Local Capacity Requirements without SONGS
Qualifying Capacity2013 LCR Need Based on
Category B2013 LCR Need Based on Category C with operating
procedure
Local Area NameQF/
Muni(MW)
Market(MW)
Total(MW)
Existing Capacity Needed
Deficiency
Total(MW)
Existing Capacity Needed**
Deficiency
Total(MW)
LA Basin 2206 7710 9916 9745 0 9745 9916 1241 11157
San Diego/Imperial Valley
158 3991 4149 3385 0 3385 3385 467* 3852
Total 2364 11701 14065 13130 0 13130 13301 1708 15009
Local Sub-Area Name
Ellis 0 458 458 0 0 0 458 360 818
Western 1211 5153 6364 N/A 0 N/A 4597 0 4597
San Diego 158 2911 3069 2462 0 2462 3069 467 3536
* San Diego-Imperial Valley area is not “overall deficient”. Resource deficiency values result from a few deficient sub-areas; and since there are no resources that can mitigate this deficiency the numbers are carried forward into the total area needs.** Since “deficiency” cannot be mitigated by any available resource, the “Existing Capacity Needed” will be split among LSEs on a load share ratio during the assignment of local area resource responsibility.N/A - It is feasible that Western sub-area has Category B needs however they are smaller than the Category C needs and overall irrelevant due to high Category B need in the entire LA Basin.

3
Compared to the final 2013 Local Capacity Technical (LCT) report, the total
available capacity in the LA Basin has decreased by 3,211 MW, representing the
capacity from SONGS, El Segundo # 3 retirement and El Segundo Repower (because
of the in-service date delay from June1 to August 2013). The Ellis sub-area
requirements have increased significantly by 818 MW, while the Western sub-area LCR
needs have decreased by about 943 MW. Overall the LA Basin LCR needs are now
driven by a new overlapping Category C contingency in the San Diego’s electric system,
due to voltage support needs that arise in the area. Without SONGS in operation, the
LA Basin reflects a net increase of 862 MW in LCR need. The need for existing
resources has decreased, however, by 379 MW due to the retirement or shut-down of
other units. Basically, all existing available resources are needed for LCR in this area
and additional deficiencies exist. For further details please see pages 5-19 below.
The total available capacity remains unchanged in the San Diego-Imperial Valley
LCR area. The San Diego sub-area requirements have increased significantly, by 966
MW, and the San Diego-Imperial Valley area requirements have increased also by 447
MW, due to voltage support needs in the absence of SONGS. Overall for the San
Diego-Imperial Valley LCR area, the additional resources needed for LCR has
increased by 447 MW; however, there is a shift of sub-area needs and all available
existing resources in the San Diego sub-area are now required for LCR. For further
details, please see pages 19-27 below.
Even though resource procurement is the responsibilities of the LSEs in the area,
the ISO is proposing mitigation for all new deficiencies created due to the absence of
SONGS as a contingency plan for summer 2013. This mitigation is described in chapter
II below.

4
II. Mitigation Plan for LA Basin and San Diego-Imperial Valley LCR areas and
sub-areas due to the absence of SONGS
Ellis sub-area:
The following transmission upgrade plan has been identified which mitigates the
identified reliability concerns in this sub-area:
Barre-Ellis 230k V lines reconfiguration from 2 to 4 circuits.
In addition to the mitigation measures needed for the adjacent LCR areas
described below, reconfiguring the Barre-Ellis 230 kV lines from 2 to 4 circuits prior to
next summer will mitigate the identified reliability concern in this sub-area, which is the
loss of the Imperial Valley-North Gila 500 kV line followed by the loss of the Barre – Ellis
#1 or #2 230 kV lines. Re-configuring the Barre-Ellis lines from 2 to 4 circuits will
mitigate this issue by allowing three of the new Barre–Ellis circuits to remain in
operation under this contingency.
LA Basin area and San Diego sub-area – common mitigation plan:
The following upgrade plan has been identified which mitigates the identified reliability
concerns in this common area:
Install shunt capacitors (1 x 80 MVAR each) at Johanna and Santiago, (2 x 80
MVAR) at Viejo Substation (or 1 x 80 MVAR at Talega as an alternate location for the
second 1 x 80 MVAR at Viejo) and convert Huntington Beach units 3 and 4 to
synchronous condensers.
Together these projects will mitigate the post-transient voltage stability concerns
in the San Diego sub-area and low voltage concern in the LA Basin LCR area2. A
mixture of dynamic (i.e., synchronous condensers) and static (shunt capacitors) reactive
support is required in order to satisfy fast voltage recovery need at the SONGS 230 kV
2 The NERC NUC-001 Standards require that the post-contingency voltage at San Onofre 230 kV switchyard be recovered to a minimum of 218 kV after a major contingency in less than 80 seconds.

5
bus without causing further operational concerns (i.e., capacitor “hunting” issue and
slow response time if only static reactive support is installed).
Huntington Beach units 3 and 4, as generating units, will no longer be available
due to lack of air emission credits, however due to their proximity to San Onofre
switchyard they are best suited for dynamic voltage support which they can still provide
without air emission credits or water permits by being converted to synchronous
condensers.
As an added benefit, the shunt capacitors eliminate the need for a new SPS in
the Johanna-Santiago area that is required to protect against voltage instability for the
loss of 230 kV double circuit tower line (DCTL) of Ellis-Johanna and Ellis-Santiago when
generating resources in the San Diego area are at medium to low output level. As a
second benefit, this alternative will reduce the single contingency resource need to
3,069 MW in the San Diego-Imperial Valley LCR area. This amount of LCR need is
equivalent to the need based on meeting Category C contingency requirement for the
San Diego sub-area, effectively reducing the procurement target in the SDG&E service
area by 316 MW.
The reduction in SDG&E service area need will consequently increase the LA
Basin single contingency need to the point where a new small 83 MW deficiency exists.
Mitigation for this new single contingency deficiency is twofold:
1. Some units at Imperial Valley (not required for local RA without SONGS
and these mitigation measures) may be under un RA contract therefore satisfying this
need, and
2. The ISO has received Demand Response (DR) program information from
the Participating Transmission Owners (PTOs). It is possible that about 48 MW in
Orange County and another 252 MW in the South of Lugo area could be used if
available within 30 minutes of a transmission line loss or overload. If possible, the ISO
will rely on them for the first part of summer 2013 until El Segundo Repower or Sentinel
become commercially operational in August 2013 in order to mitigate this single
contingency need that causes South of Lugo loading concerns. However, even if
available within 30 minutes, these DR programs and the new generating resources are
insufficient in mitigating the double contingency need as addressed above, however.

6
III. Local Capacity Requirement Study Results
1. LA Basin Area
Area Definition
The transmission tie lines into the LA Basin Area are:
1) San Onofre - San Luis Rey #1, #2, & #3 230 kV Lines2) San Onofre - Talega #1 & #2 230 kV Lines3) Lugo - Mira Loma #2 & #3 500 kV Lines4) Lugo – Rancho Vista #1 500 kV line5) Sylmar - Eagle Rock 230 kV Line6) Sylmar - Gould 230 kV Line7) Vincent - Mesa Cal 230 kV Line8) Vincent - Rio Hondo #1 & #2 230 kV Lines9) Eagle Rock - Pardee 230 kV Line10)Devers - Palo Verde 500 kV Line11)Mirage - Coachelv 230 kV Line12)Mirage - Ramon 230 kV Line13)Mirage - Julian Hinds 230 kV Line
These sub-stations form the boundary surrounding the LA Basin area:
1) San Onofre is in San Luis Rey is out2) San Onofre is in Talega is out3) Mira Loma is in Lugo is out4) Rancho Vista is in Lugo is out5) Eagle Rock is in Sylmar is out 6) Gould is in Sylmar is out7) Mesa Cal is in Vincent is out8) Rio Hondo is in Vincent is out9) Eagle Rock is in Pardee is out10)Devers is in Palo Verde is out11)Mirage is in Coachelv is out12)Mirage is in Ramon is out13)Mirage is in Julian Hinds is out
This study includes the new CEC forecast posted June 2012. Total 2013 busload within
the defined area is 19,300 MW with 133 MW of losses and 27 MW of pumps resulting in
total load + losses + pumps of 19,460 MW. However, the electrically “defined area” is
not aligned with the geographic substations included in the CEC demand forecast, and
the load modeled in the base cases represents a 1-in-10 level or 20,460 MW (based on

7
the adopted CEC forecast).
Total units and qualifying capacity available in the LA Basin area:
MKT/SCHEDRESOURCE ID
BUS #
BUS NAME kV NQCUNIT
IDLCR SUB-AREA
NAMENQC
CommentsCAISO Tag
ALAMIT_7_UNIT 1 24001 ALAMT1 G 18 174.56 1 Western MarketALAMIT_7_UNIT 2 24002 ALAMT2 G 18 175.00 2 Western Market
ALAMIT_7_UNIT 3 24003 ALAMT3 G 18 332.18 3 Western MarketALAMIT_7_UNIT 4 24004 ALAMT4 G 18 335.67 4 Western MarketALAMIT_7_UNIT 5 24005 ALAMT5 G 20 497.97 5 Western MarketALAMIT_7_UNIT 6 24161 ALAMT6 G 20 495.00 6 Western Market
ANAHM_2_CANYN1 25211 CanyonGT 13.8 49.40 1 Western MUNIANAHM_2_CANYN2 25212 CanyonGT 13.8 48.00 2 Western MUNI
ANAHM_2_CANYN3 25213 CanyonGT 13.8 48.00 3 Western MUNIANAHM_2_CANYN4 25214 CanyonGT 13.8 49.40 4 Western MUNI
ANAHM_7_CT 25203 ANAHEIMG 13.8 40.64 1 Western Aug NQC MUNIARCOGN_2_UNITS 24011 ARCO 1G 13.8 54.28 1 Western Aug NQC QF/SelfgenARCOGN_2_UNITS 24012 ARCO 2G 13.8 54.28 2 Western Aug NQC QF/SelfgenARCOGN_2_UNITS 24013 ARCO 3G 13.8 54.28 3 Western Aug NQC QF/Selfgen
ARCOGN_2_UNITS 24014 ARCO 4G 13.8 54.28 4 Western Aug NQC QF/SelfgenARCOGN_2_UNITS 24163 ARCO 5G 13.8 27.14 5 Western Aug NQC QF/SelfgenARCOGN_2_UNITS 24164 ARCO 6G 13.8 27.15 6 Western Aug NQC QF/Selfgen
BARRE_2_QF 24016 BARRE 230 0.00 Western Not modeled QF/SelfgenBARRE_6_PEAKER 29309 BARPKGEN 13.8 45.38 1 Western MarketBRDWAY_7_UNIT 3 29007 BRODWYSC 13.8 65.00 1 Western MUNI
BUCKWD_7_WINTCV 25634 BUCKWIND 115 0.15 W5 None Aug NQC WindCABZON_1_WINDA1 29290 CABAZON 33 11.29 1 None Aug NQC Wind
CENTER_2_QF 24203 CENTER S 66 18.10 WesternNot modeled
Aug NQCQF/Selfgen
CENTER_2_RHONDO 24203 CENTER S 66 1.91 Western Not modeled QF/SelfgenCENTER_6_PEAKER 29308 CTRPKGEN 13.8 44.57 1 Western Market
CENTRY_6_PL1X4 25302 CLTNCTRY 13.8 36.00 1 None Aug NQC MUNICHEVMN_2_UNITS 24022 CHEVGEN1 13.8 0.00 1 Western, El Nido Aug NQC QF/SelfgenCHEVMN_2_UNITS 24023 CHEVGEN2 13.8 0.00 2 Western, El Nido Aug NQC QF/Selfgen
CHINO_2_QF 24024 CHINO 66 7.83 WesternNot modeled
Aug NQCQF/Selfgen
CHINO_2_SOLAR 24024 CHINO 66 0.00 Western Not modeled MarketCHINO_6_CIMGEN 24026 CIMGEN 13.8 25.29 1 Western Aug NQC QF/SelfgenCHINO_6_SMPPAP 24140 SIMPSON 13.8 27.15 1 Western Aug NQC QF/Selfgen
CHINO_7_MILIKN 24024 CHINO 66 1.37 WesternNot modeled
Aug NQCMarket
COLTON_6_AGUAM1 25303 CLTNAGUA 13.8 43.00 1 None MUNICORONS_6_CLRWTR 24210 MIRALOMA 66 14.00 None Not modeled MUNICORONS_6_CLRWTR 24210 MIRALOMA 66 14.00 None Not modeled MUNI
DEVERS_1_QF 24815 GARNET 115 1.51 QF None Aug NQC QF/Selfgen
DEVERS_1_QF 25632 TERAWND 115 2.94 QF None Aug NQC QF/Selfgen
DEVERS_1_QF 25633 CAPWIND 115 0.56 QF None Aug NQC QF/Selfgen
DEVERS_1_QF 25634 BUCKWIND 115 1.73 QF None Aug NQC QF/Selfgen
DEVERS_1_QF 25635 ALTWIND 115 1.35 Q1 None Aug NQC QF/Selfgen
DEVERS_1_QF 25635 ALTWIND 115 2.50 Q2 None Aug NQC QF/Selfgen
DEVERS_1_QF 25636 RENWIND 115 0.59 Q1 None Aug NQC QF/Selfgen

8
DEVERS_1_QF 25636 RENWIND 115 2.28 Q2 None Aug NQC QF/Selfgen
DEVERS_1_QF 25636 RENWIND 115 0.27 W1 None Aug NQC QF/Selfgen
DEVERS_1_QF 25637 TRANWIND 115 6.68 QF None Aug NQC QF/Selfgen
DEVERS_1_QF 25639 SEAWIND 115 2.01 QF None Aug NQC QF/Selfgen
DEVERS_1_QF 25640 PANAERO 115 1.79 QF None Aug NQC QF/Selfgen
DEVERS_1_QF 25645 VENWIND 115 1.53 EU None Aug NQC QF/Selfgen
DEVERS_1_QF 25645 VENWIND 115 3.58 Q1 None Aug NQC QF/Selfgen
DEVERS_1_QF 25645 VENWIND 115 2.41 Q2 None Aug NQC QF/Selfgen
DEVERS_1_QF 25646 SANWIND 115 0.80 Q1 None Aug NQC QF/Selfgen
DEVERS_1_QF 25646 SANWIND 115 2.68 Q2 None Aug NQC QF/Selfgen
DMDVLY_1_UNITS 25425 ESRP P2 6.9 1.39 NoneNot modeled
Aug NQCQF/Selfgen
DREWS_6_PL1X4 25301 CLTNDREW 13.8 36.00 1 None Aug NQC MUNIDVLCYN_1_UNITS 25603 DVLCYN3G 13.8 67.15 3 None Aug NQC MUNIDVLCYN_1_UNITS 25604 DVLCYN4G 13.8 67.15 4 None Aug NQC MUNIDVLCYN_1_UNITS 25648 DVLCYN1G 13.8 50.35 1 None Aug NQC MUNIDVLCYN_1_UNITS 25649 DVLCYN2G 13.8 50.35 2 None Aug NQC MUNI
ELLIS_2_QF 24197 ELLIS 66 0.00 Western, EllisNot modeled
Aug NQCQF/Selfgen
ELSEGN_7_UNIT 3 24047 ELSEG3 G 18 0.00 3 Western, El Nido Retired MarketELSEGN_7_UNIT 4 24048 ELSEG4 G 18 335.00 4 Western, El Nido Market
ETIWND_2_FONTNA 24055 ETIWANDA 66 0.81 NoneNot modeled
Aug NQCQF/Selfgen
ETIWND_2_QF 24055 ETIWANDA 66 14.86 NoneNot modeled
Aug NQCQF/Selfgen
ETIWND_2_SOLAR 24055 ETIWANDA 66 0.00 NoneNot modeled
Aug NQCMarket
ETIWND_6_GRPLND 29305 ETWPKGEN 13.8 42.53 1 None Market
ETIWND_6_MWDETI 25422 ETI MWDG 13.8 10.37 1 None Aug NQC Market
ETIWND_7_MIDVLY 24055 ETIWANDA 66 1.54 NoneNot modeled
Aug NQCQF/Selfgen
ETIWND_7_UNIT 3 24052 MTNVIST3 18 320.00 3 None MarketETIWND_7_UNIT 4 24053 MTNVIST4 18 320.00 4 None MarketGARNET_1_UNITS 24815 GARNET 115 0.71 G1 None Aug NQC QF/Selfgen
GARNET_1_UNITS 24815 GARNET 115 0.25 G2 None Aug NQC QF/SelfgenGARNET_1_UNITS 24815 GARNET 115 0.51 G3 None Aug NQC QF/SelfgenGARNET_1_UNITS 24815 GARNET 115 0.25 PC None Aug NQC QF/SelfgenGARNET_1_WIND 24815 GARNET 115 0.66 W2 None Aug NQC WindGARNET_1_WIND 24815 GARNET 115 0.66 W3 None Aug NQC Wind
GLNARM_7_UNIT 1 29005 PASADNA1 13.8 22.30 1 Western MUNI
GLNARM_7_UNIT 2 29006 PASADNA2 13.8 22.30 1 Western MUNIGLNARM_7_UNIT 3 29005 PASADNA1 13.8 44.83 Western Not modeled MUNIGLNARM_7_UNIT 4 29006 PASADNA2 13.8 42.42 Western Not modeled MUNIHARBGN_7_UNITS 24062 HARBOR G 13.8 76.28 1 Western MarketHARBGN_7_UNITS 24062 HARBOR G 13.8 11.86 HP Western MarketHARBGN_7_UNITS 25510 HARBORG4 4.16 11.86 LP Western Market
HINSON_6_CARBGN 24020 CARBOGEN 13.8 21.46 1 Western Aug NQC Market
HINSON_6_LBECH1 24078 LBEACH1G 13.8 65.00 1 Western MarketHINSON_6_LBECH2 24170 LBEACH2G 13.8 65.00 2 Western MarketHINSON_6_LBECH3 24171 LBEACH3G 13.8 65.00 3 Western MarketHINSON_6_LBECH4 24172 LBEACH4G 13.8 65.00 4 Western Market
HINSON_6_SERRGN 24139 SERRFGEN 13.8 28.38 1 Western Aug NQC QF/SelfgenHNTGBH_7_UNIT 1 24066 HUNT1 G 13.8 225.75 1 Western, Ellis Market

9
HNTGBH_7_UNIT 2 24067 HUNT2 G 13.8 225.80 2 Western, Ellis MarketINDIGO_1_UNIT 1 29190 WINTECX2 13.8 42.00 1 None MarketINDIGO_1_UNIT 2 29191 WINTECX1 13.8 42.00 1 None MarketINDIGO_1_UNIT 3 29180 WINTEC8 13.8 42.00 1 None Market
INLDEM_5_UNIT 1 29041 IEEC-G1 19.5 335.00 1 Valley Aug NQC MarketINLDEM_5_UNIT 2 29042 IEEC-G2 19.5 335.00 1 Valley Aug NQC Market
JOHANN_6_QFA1 24072 JOHANNA 230 0.00 Western, EllisNot modeled
Aug NQCQF/Selfgen
LACIEN_2_VENICE 24337 VENICE 13.8 4.45 1 Western, El Nido Aug NQC MUNI
LAFRES_6_QF 24073 LA FRESA 66 2.55 Western, El NidoNot modeled
Aug NQCQF/Selfgen
LAGBEL_6_QF 24075 LAGUBELL 66 10.60 WesternNot modeled
Aug NQCQF/Selfgen
LGHTHP_6_ICEGEN 24070 ICEGEN 13.8 46.55 1 Western Aug NQC QF/Selfgen
LGHTHP_6_QF 24083 LITEHIPE 66 1.10 WesternNot modeled
Aug NQCQF/Selfgen
MESAS_2_QF 24209 MESA CAL 66 1.06 WesternNot modeled
Aug NQCQF/Selfgen
MIRLOM_2_CORONA 2.35 NoneNot modeled
Aug NQCQF/Selfgen
MIRLOM_2_TEMESC 2.49 NoneNot modeled
Aug NQCQF/Selfgen
MIRLOM_6_DELGEN 24030 DELGEN 13.8 29.78 1 None Aug NQC QF/SelfgenMIRLOM_6_PEAKER 29307 MRLPKGEN 13.8 43.18 1 None Market
MIRLOM_7_MWDLKM 24210 MIRALOMA 66 4.60 NoneNot modeled
Aug NQCMUNI
MOJAVE_1_SIPHON 25657 MJVSPHN1 13.8 6.00 1 None Aug NQC MarketMOJAVE_1_SIPHON 25657 MJVSPHN1 13.8 6.00 2 None Aug NQC Market
MOJAVE_1_SIPHON 25657 MJVSPHN1 13.8 6.00 3 None Aug NQC MarketMTWIND_1_UNIT 1 29060 MOUNTWND 115 7.08 S1 None Aug NQC WindMTWIND_1_UNIT 2 29060 MOUNTWND 115 2.76 S2 None Aug NQC WindMTWIND_1_UNIT 3 29060 MOUNTWND 115 2.88 S3 None Aug NQC Wind
OLINDA_2_COYCRK 24211 OLINDA 66 3.13 Western Not modeled QF/SelfgenOLINDA_2_QF 24211 OLINDA 66 0.78 1 Western Aug NQC QF/Selfgen
OLINDA_7_LNDFIL 24201 BARRE 66 4.50 WesternNot modeled
Aug NQCQF/Selfgen
PADUA_2_ONTARO 24111 PADUA 66 0.91 NoneNot modeled
Aug NQCQF/Selfgen
PADUA_6_MWDSDM 24111 PADUA 66 7.70 NoneNot modeled
Aug NQCMUNI
PADUA_6_QF 24111 PADUA 66 0.74 NoneNot modeled
Aug NQCQF/Selfgen
PADUA_7_SDIMAS 24111 PADUA 66 1.05 NoneNot modeled
Aug NQCQF/Selfgen
PWEST_1_UNIT 0.15 WesternNot modeled
Aug NQCMarket
REDOND_7_UNIT 5 24121 REDON5 G 18 178.87 5 Western MarketREDOND_7_UNIT 6 24122 REDON6 G 18 175.00 6 Western MarketREDOND_7_UNIT 7 24123 REDON7 G 20 505.96 7 Western MarketREDOND_7_UNIT 8 24124 REDON8 G 20 495.90 8 Western Market
RHONDO_2_QF 24213 RIOHONDO 66 2.54 WesternNot modeled
Aug NQCQF/Selfgen
RHONDO_6_PUENTE 24213 RIOHONDO 66 0.00 WesternNot modeled
Aug NQCMarket
RVSIDE_2_RERCU3 24299 RERC2G3 13.8 48.50 1 None MUNI
RVSIDE_2_RERCU4 24300 RERC2G4 13.8 48.50 1 None MUNI

10
RVSIDE_6_RERCU1 24242 RERC1G 13.8 48.35 1 None MUNIRVSIDE_6_RERCU2 24243 RERC2G 13.8 48.50 1 None MUNIRVSIDE_6_SPRING 24244 SPRINGEN 13.8 36.00 1 None Market
SANTGO_6_COYOTE 24133 SANTIAGO 66 6.08 1 Western, Ellis Aug NQC Market
SBERDO_2_PSP3 24921 MNTV-CT1 18 129.71 1 None MarketSBERDO_2_PSP3 24922 MNTV-CT2 18 129.71 1 None MarketSBERDO_2_PSP3 24923 MNTV-ST1 18 225.08 1 None MarketSBERDO_2_PSP4 24924 MNTV-CT3 18 129.71 1 None Market
SBERDO_2_PSP4 24925 MNTV-CT4 18 129.71 1 None MarketSBERDO_2_PSP4 24926 MNTV-ST2 18 225.08 1 None Market
SBERDO_2_QF 24214 SANBRDNO 66 0.14 NoneNot modeled
Aug NQCQF/Selfgen
SBERDO_2_SNTANA 24214 SANBRDNO 66 0.27 NoneNot modeled
Aug NQCQF/Selfgen
SBERDO_6_MILLCK 24214 SANBRDNO 66 1.28 NoneNot modeled
Aug NQCQF/Selfgen
SONGS_7_UNIT 2 24129 S.ONOFR2 22 0.00 2 Western Not available NuclearSONGS_7_UNIT 3 24130 S.ONOFR3 22 0.00 3 Western Not available Nuclear
TIFFNY_1_DILLON 5.63 WesternNot modeled
Aug NQCWind
VALLEY_5_PERRIS 24160 VALLEYSC 115 7.94 ValleyNot modeled
Aug NQCQF/Selfgen
VALLEY_5_REDMTN 24160 VALLEYSC 115 2.00 ValleyNot modeled
Aug NQCQF/Selfgen
VALLEY_7_BADLND 24160 VALLEYSC 115 0.54 ValleyNot modeled
Aug NQCMarket
VALLEY_7_UNITA1 24160 VALLEYSC 115 1.34 ValleyNot modeled
Aug NQCMarket
VERNON_6_GONZL1 5.75 Western Not modeled MUNI
VERNON_6_GONZL2 5.75 Western Not modeled MUNIVERNON_6_MALBRG 24239 MALBRG1G 13.8 42.37 C1 Western MUNIVERNON_6_MALBRG 24240 MALBRG2G 13.8 42.37 C2 Western MUNI
VERNON_6_MALBRG 24241 MALBRG3G 13.8 49.26 S3 Western MUNI
VILLPK_2_VALLYV 24216 VILLA PK 66 4.10 WesternNot modeled
Aug NQCQF/Selfgen
VILLPK_6_MWDYOR 24216 VILLA PK 66 0.00 WesternNot modeled
Aug NQCMUNI
VISTA_6_QF 24902 VSTA 66 0.17 1 None Aug NQC QF/Selfgen
WALNUT_6_HILLGEN 24063 HILLGEN 13.8 47.07 1 Western Aug NQC QF/Selfgen
WALNUT_7_WCOVCT 24157 WALNUT 66 3.43 WesternNot modeled
Aug NQCMarket
WALNUT_7_WCOVST 24157 WALNUT 66 2.98 WesternNot modeled
Aug NQCMarket
WHTWTR_1_WINDA1 29061 WHITEWTR 33 8.26 1 None Aug NQC Wind
ARCOGN_2_UNITS 24018 BRIGEN 13.8 0.00 1 WesternNo NQC -hist. data
Market
HINSON_6_QF 24064 HINSON 66 0.00 1 WesternNo NQC -hist. data
QF/Selfgen
INLAND_6_UNIT 24071 INLAND 13.8 30.30 1 NoneNo NQC -hist. data
QF/Selfgen
MOBGEN_6_UNIT 1 24094 MOBGEN 13.8 20.20 1 Western, El NidoNo NQC -hist. data
QF/Selfgen
NA 24324 SANIGEN 13.8 6.80 D1 NoneNo NQC -hist. data
QF/Selfgen
NA 24325 ORCOGEN 13.8 0.00 1 Western, EllisNo NQC -hist. data
QF/Selfgen

11
NA 24327 THUMSGEN 13.8 40.00 1 WesternNo NQC -hist. data
QF/Selfgen
NA 24328 CARBGEN2 13.8 15.2 1 WesternNo NQC –hist. data
Market
NA 24329 MOBGEN2 13.8 20.2 1 Western, El NidoNo NQC –hist. data
QF/Selfgen
NA 24330 OUTFALL1 13.8 0.00 1 Western, El NidoNo NQC -hist. data
QF/Selfgen
NA 24331 OUTFALL2 13.8 0.00 1 Western, El NidoNo NQC -hist. data
QF/Selfgen
NA 24332 PALOGEN 13.8 3.60 D1 Western, El NidoNo NQC -hist. data
QF/Selfgen
NA 24341 COYGEN 13.8 0.00 1 Western, EllisNo NQC -hist. data
QF/Selfgen
NA 24342 FEDGEN 13.8 0.00 1 WesternNo NQC -hist. data
QF/Selfgen
NA 24839 BLAST 115 45.00 1 NoneNo NQC –hist. data
QF/Selfgen
NA 29021 WINTEC6 115 45.00 1 NoneNo NQC –hist. data
Wind
NA 29023 WINTEC4 12 16.50 1 NoneNo NQC –hist. data
Wind
NA 29060 SEAWEST 115 44.40 S1 NoneNo NQC –hist. data
Wind
NA 29060 SEAWEST 115 22.20 S2 NoneNo NQC –hist. data
Wind
NA 29060 SEAWEST 115 22.40 S3 NoneNo NQC –hist. data
Wind
NA 29260 ALTAMSA4 115 40.00 1 NoneNo NQC –hist. data
Wind
NA 29338 CLEARGEN 13.8 0.00 1 NoneNo NQC -hist. data
QF/Selfgen
NA 29339 DELGEN 13.8 0.00 1 NoneNo NQC -hist. data
QF/Selfgen
NA 29951 REFUSE 13.8 9.90 D1 WesternNo NQC -
PmaxQF/Selfgen
NA 29953 SIGGEN 13.8 24.90 D1 WesternNo NQC -
PmaxQF/Selfgen
HNTGBH_7_UNIT 3 24167 HUNT3 G 13.8 0.00 3 Western, Ellis Retired MarketHNTGBH_7_UNIT 4 24168 HUNT4 G 13.8 0.00 4 Western, Ellis Retired Market
New unit 29201 EME WCG1 13.8 100 1 WesternNo NQC -
PmaxMarket
New unit 29202 EME WCG2 13.8 100 1 WesternNo NQC -
PmaxMarket
New unit 29203 EME WCG3 13.8 100 1 WesternNo NQC -
PmaxMarket
New unit 29204 EME WCG4 13.8 100 1 WesternNo NQC -
PmaxMarket
New unit 29205 EME WCG5 13.8 100 1 WesternNo NQC -
PmaxMarket
Major new projects modeled:
1. Walnut Creek Energy Center
2. Huntington Beach #3 and #4 retirement
3. Del Amo – Ellis 230 kV line loops into Barre 230 kV substation

12
4. Recalibrate arming level for Santiago SPS
5. El Segundo #3 retirement
El Segundo Repowering (630 MW) and Sentinel (850 MW) have not been relied upon
since the publicly announced commercial operating date is August 2013 (based on CEC
web site http://www.energy.ca.gov/sitingcases/all_projects.html).
Critical Contingency Analysis Summary
LA Basin Overall:
The most critical contingency for the LA Basin is the loss of Imperial Valley-Miguel 500
kV line followed Imperial Valley-Suncrest 500 kV line or vice versa, which would result
in voltage below the minimum allowable (218 kV) at the San Onofre 230 kV switchyard
as specified in the Appendix E of the Transmission Control Agreement (TCA)3 as
required by the NERC NUC-001 Standards. This limiting contingency establishes an
LCR of 11,157 MW in 2013 (includes 810 MW of QF, 230 MW of Wind and 1166 MW of
Muni generation as well as 1241 MW of deficiency) as the minimum generation capacity
necessary for reliable load serving capability within this area.
The most critical single contingency for the LA Basin is the loss of Alamitos Unit #5
followed by Palo Verde-Devers 500 kV line, which would cause the South of Lugo flow
to exceed its 6400 MW path rating limit. This limiting contingency establishes an LCR of
9,745 MW for 2013 (includes 810 MW of QF, 230 MW of Wind and 1166 MW of Muni
generation as well as 83 MW of deficiency).
Effectiveness factors:
The following table has units that have at least 5% effectiveness to the above-
mentioned South of Lugo constraint within the LA Basin area:
Gen Bus Gen Name Gen ID MW Eff Fctr (%)
24052 MTNVIST3 3 76
3 TCA: http://www.caiso.com/Documents/TransmissionControlAgreement-Updatedas-Dec3_2010.pdf

13
24053 MTNVIST4 4 76
24071 INLAND 1 75
25422 ETI MWDG 1 75
29305 ETWPKGEN 1 75
29041 IEEC-G1 1 74
29042 IEEC-G2 2 74
24242 RERC1G 1 74
24243 RERC2G 1 74
24244 SPRINGEN 1 74
25301 CLTNDREW 1 74
25302 CLTNCTRY 1 74
25303 CLTNAGUA 1 74
24299 RERC2G3 1 74
24300 RERC2G4 1 74
24921 MNTV-CT1 1 72
24922 MNTV-CT2 1 72
24923 MNTV-ST1 1 72
24924 MNTV-CT3 1 72
24925 MNTV-CT4 1 72
24926 MNTV-ST2 1 72
29307 MRLPKGEN 1 72
29338 CLEARGEN 1 71
29339 DELGEN 1 71
24026 CIMGEN D1 71
24140 SIMPSON D1 71
24030 DELGEN 1 71
24815 GARNET QF 71
24815 GARNET W3 71
29190 WINTECX2 1 70
29191 WINTECX1 1 70
29180 WINTEC8 1 70
29023 WINTEC4 1 70
29021 WINTEC6 1 70
24839 BLAST 1 70
25648 DVLCYN1G 1 70
25649 DVLCYN2G 2 70
25603 DVLCYN3G 3 70
25604 DVLCYN4G 4 70
25632 TERAWND QF 70
25634 BUCKWND QF 70
25635 ALTWIND Q1 70
25635 ALTWIND Q2 70
25637 TRANWND QF 70

14
25645 VENWIND EU 70
25645 VENWIND Q2 70
25645 VENWIND Q1 70
25646 SANWIND Q2 70
29060 MOUNTWND S1 70
29060 MOUNTWND S3 70
29060 MOUNTWND S2 70
29061 WHITEWTR 1 70
29290 CABAZON 1 70
25639 SEAWIND QF 69
25640 PANAERO QF 69
29260 ALTAMSA4 1 69
25633 CAPWIND QF 66
25657 MJVSPHN1 1 66
25658 MJVSPHN2 2 66
25659 MJVSPHN3 3 66
25203 ANAHEIMG 1 62
25211 CanyonGT 1 1 60
25212 CanyonGT 2 2 60
25213 CanyonGT 3 3 60
25214 CanyonGT 4 4 60
29309 BARPKGEN 1 58
24066 HUNT1 G 1 58
24067 HUNT2 G 2 58
24133 SANTIAGO 1 58
24325 ORCOGEN 1 58
24341 COYGEN 1 57
24005 ALAMT5 G 5 53
24161 ALAMT6 G 6 53
24063 HILLGEN D1 53
29201 EME WCG1 1 53
29203 EME WCG3 1 53
29204 EME WCG4 1 53
29205 EME WCG5 1 53
29202 EME WCG2 1 53
24001 ALAMT1 G 1 50
24002 ALAMT2 G 2 50
24003 ALAMT3 G 3 50
24004 ALAMT4 G 4 50
29953 SIGGEN D1 48
24018 BRIGEN 1 46
24011 ARCO 1G 1 44
24012 ARCO 2G 2 44

15
24013 ARCO 3G 3 44
24014 ARCO 4G 4 44
24163 ARCO 5G 5 44
24164 ARCO 6G 6 44
24020 CARBGEN1 1 44
24064 HINSON 1 44
24070 ICEGEN D1 44
24170 LBEACH12 2 44
24171 LBEACH34 3 44
24094 MOBGEN1 1 44
24062 HARBOR G 1 44
25510 HARBORG4 LP 44
24062 HARBOR G HP 44
24139 SERRFGEN D1 44
24170 LBEACH12 1 44
24171 LBEACH34 4 44
24327 THUMSGEN 1 44
24328 CARBGEN2 1 44
24022 CHEVGEN1 1 41
24023 CHEVGEN2 2 41
24330 OUTFALL1 1 41
24331 OUTFALL2 1 41
24332 PALOGEN D1 41
24333 REDON1 G R1 41
24334 REDON2 G R2 41
24335 REDON3 G R3 41
24336 REDON4 G R4 41
24337 VENICE 1 41
24047 ELSEG3 G 3 41
24048 ELSEG4 G 4 41
24121 REDON5 G 5 41
24122 REDON6 G 6 41
24123 REDON7 G 7 41
24124 REDON8 G 8 41
24329 MOBGEN2 1 41
29209 BLY1ST1 1 40
29207 BLY1CT1 1 40
29208 BLY1CT2 1 40
24342 FEDGEN 1 39
29951 REFUSE D1 37
24241 MALBRG3G S3 37
24240 MALBRG2G C2 37
24239 MALBRG1G C1 37

16
29005 PASADNA1 1 29
29006 PASADNA2 1 29
29007 BRODWYSC 1 29
29308 CTRPKGEN 1 19
Valley Sub-Area:
The most critical contingency for the Valley sub-area is the loss of Palo Verde – Devers
500 kV line and Valley – Serrano 500 kV line or vice versa, which would result in
voltage collapse. This limiting contingency establishes a LCR of 670 MW (includes 10
MW of QF generation) in 2013 as the generation capacity necessary for reliable load
serving capability within this sub-area.
Effectiveness factors:
The generators inside the sub-area have the same effectiveness factors.
Western Sub-Area:
The most critical contingency for the Western sub-area is the loss of Serrano-Villa Park
#2 230 kV line followed by the loss of the Serrano-Lewis 230 kV line or vice versa,
which would result in thermal overload of the remaining Serrano-Villa Park 230 kV line.
This limiting contingency establishes a LCR of 4,597 MW (includes 623 MW of QF, 6
MW of Wind and 582 MW of Muni generation) in 2013 as the generation capacity
necessary for reliable load serving capability within this sub-area.
Effectiveness factors:
The following table has units that have at least 5% effectiveness to the above-
mentioned constraint:
Gen Bus Gen Name Gen IDMW Eff Fctr (%)
29309 BARPKGEN 1 29
25203 ANAHEIMG 1 28
25211 CanyonGT 1 1 27
25212 CanyonGT 2 2 27
25213 CanyonGT 3 3 27
25214 CanyonGT 4 4 27
24066 HUNT1 G 1 25

17
24067 HUNT2 G 2 25
24325 ORCOGEN 1 24
24005 ALAMT5 G 5 23
24161 ALAMT6 G 6 23
24001 ALAMT1 G 1 22
24002 ALAMT2 G 2 22
24003 ALAMT3 G 3 22
24004 ALAMT4 G 4 22
24133 SANTIAGO 1 18
24341 COYGEN 1 18
24011 ARCO 1G 1 17
24012 ARCO 2G 2 17
24013 ARCO 3G 3 17
24014 ARCO 4G 4 17
24018 BRIGEN 1 17
24020 CARBGEN1 1 17
24064 HINSON 1 17
24070 ICEGEN D1 17
24170 LBEACH12 2 17
24171 LBEACH34 3 17
24062 HARBOR G 1 17
25510 HARBORG4 LP 17
24062 HARBOR G HP 17
24139 SERRFGEN D1 17
24170 LBEACH12 1 17
24171 LBEACH34 4 17
24173 LBEACH5G R5 17
24174 LBEACH6G R6 17
24327 THUMSGEN 1 17
24328 CARBGEN2 1 17
24079 LBEACH7G R7 17
24080 LBEACH8G R8 17
24081 LBEACH9G R9 17
24163 ARCO 5G 5 17
24164 ARCO 6G 6 17
24094 MOBGEN1 1 16
29308 CTRPKGEN 1 16
24329 MOBGEN2 1 16
24330 OUTFALL1 1 16
24331 OUTFALL2 1 16
24332 PALOGEN D1 16
24022 CHEVGEN1 1 15
24023 CHEVGEN2 2 15

18
24048 ELSEG4 G 4 15
24333 REDON1 G R1 15
24334 REDON2 G R2 15
24335 REDON3 G R3 15
24336 REDON4 G R4 15
24337 VENICE 1 15
29953 SIGGEN D1 15
24047 ELSEG3 G 3 15
24121 REDON5 G 5 15
24122 REDON6 G 6 15
24123 REDON7 G 7 15
24124 REDON8 G 8 15
29951 REFUSE D1 14
24342 FEDGEN 1 14
24241 MALBRG3G S3 14
24240 MALBRG2G C2 14
24239 MALBRG1G C1 14
29005 PASADNA1 1 11
29006 PASADNA2 1 11
29007 BRODWYSC 1 11
24063 HILLGEN D1 7
29201 EME WCG1 1 7
29203 EME WCG3 1 7
29204 EME WCG4 1 7
29205 EME WCG5 1 7
29202 EME WCG2 1 7
There are numerous other combinations of contingencies in the area that could
overload a significant number of 230 kV lines in this sub-area but have less LCR need.
As such, anyone of them (combination of contingencies) could become binding for any
given set of procured resources. As a result, effectiveness factors may not be the best
indicator towards informed procurement.
Ellis sub-area
The most critical contingency for Ellis sub-area is the loss of the Imperial Valley-North
Gila 500 kV line followed by the loss of the Barre – Ellis #1 or #2 230 kV lines, which
overload the remaining line. This limiting contingency establishes an LCR of 818 MW in
2013 (which includes 6 MW of QF generation as well as 360 MW of deficiency) as the

19
minimum capacity necessary for reliable load serving capability within this sub-area.
Effectiveness factors:
The generators inside the sub-area have the same effectiveness factors.
El Nido sub-area
The most critical contingency for the El Nido sub-area is the loss of the La Fresa –
Hinson 230 kV line followed by the loss of the La Fresa – Redondo #1 and #2 230 kV
lines, which would cause voltage collapse. This limiting contingency establishes an LCR
of 386 MW in 2013 (which includes 47 MW of QF and 4 MW of MUNI generation) as the
minimum capacity necessary for reliable load serving capability within this sub-area.
Effectiveness factors:
The generators inside the sub-area have the same effectiveness factors.
Changes to study results compared to SONGS being operational:
The load forecast is essentially the same. The total available capacity has decreased by
3,211 MW (2246 MW SONGS + 335 MW El Segundo # 3 + 630 MW El Segundo
Repower). The Ellis sub-area LCR needs have increased significantly, by 818 MW, due
to the additional flow through this sub-area required to serve San Diego load in absence
of SONGS. The Western sub-area LCR needs have decreased by about 943 MW
mainly due to the fact that there are other units in this sub-area with higher
effectiveness factors than SONGS that are now required and that have not been
previously accounted for, due to unit dispatch methodology (see final 2013 LCR manual
for order in which units are turned on). The LA Basin single contingency need has
decreased by a total of 550 MW, mainly due to the difference between P max of
SONGS and Alamitos #5 (new worst-case resource outage) and due to higher LCR
needs in the San Diego-Imperial Valley area and has partly (increased) due to the
smaller effectiveness factors relative to South of Lugo path for units required to replace
SONGS. The LA Basin has a new multiple contingency requirement due to voltage
support issues that arise in the area, without SONGS, for outages in San Diego’s
system. For mitigation of new deficiencies please see chapter II.

20
LA Basin Overall Requirements:
2013 QF/Wind(MW)
Muni (MW)
Nuclear (MW)
Market (MW)
Max. Qualifying Capacity (MW)
Available generation 1040 1166 0 7710 9916
2013 Existing Generation Capacity Needed (MW)
Deficiency (MW)
Total MW LCR Need
Category B (Single)4 9,745 0 9,745Category C (Multiple)5 9,916 1,241 11,157
2. San Diego-Imperial Valley Area
Area Definition
The transmission tie lines forming a boundary around the Greater San Diego-Imperial
Valley area include:
1) Imperial Valley – North Gila 500 kV Line2) Otay Mesa – Tijuana 230 kV Line3) San Onofre - San Luis Rey #1 230 kV Line4) San Onofre - San Luis Rey #2 230 kV Line5) San Onofre - San Luis Rey #3 230 kV Line6) San Onofre – Talega #1 230 kV Line 7) San Onofre – Talega #2 230 kV Line8) Imperial Valley – El Centro 230 kV Line 9) Imperial Valley – Dixieland 230 kV Line 10) Imperial Valley – La Rosita 230 kV Line
The substations that delineate the Greater San Diego-Imperial Valley area are:
1) Imperial Valley is in North Gila is out2) Otay Mesa is in Tijuana is out3) San Onofre is out San Luis Rey is in4) San Onofre is out San Luis Rey is in5) San Onofre is out San Luis Rey is in
4 A single contingency means that the system will be able the survive the loss of a single element, however the operators will not have any means (other than load drop) in order to bring the system within a safe operating zone and get prepared for the next contingency as required by NERC transmission operations standards.5 Multiple contingencies means that the system will be able the survive the loss of a single element, and the operators will have enough generation (other operating procedures) in order to bring the system within a safe operating zone and get prepared for the next contingency as required by NERC transmission operations standards.

21
6) San Onofre is out Talega is in 7) San Onofre is out Talega is in8) Imperial Valley is in El Centro is out 9) Imperial Valley is in Dixieland is out10) Imperial Valley is in La Rosita is out
Study includes the new CEC adopted forecast that was posted in June 2012. The total
2013 busload within the defined area: 4990 MW with 134 MW of losses resulting in total
load + losses of 5124 MW.
Total units and qualifying capacity available in this area:
MKT/SCHEDRESOURCE ID
BUS #
BUS NAME kV NQCUNIT
IDLCR SUB-AREA
NAMENQC
CommentsCAISO Tag
BORDER_6_UNITA1 22149 CALPK_BD 13.8 48.98 1 San Diego MarketCBRLLO_6_PLSTP1 22092 CABRILLO 69 2.23 1 San Diego Aug NQC QF/SelfgenCCRITA_7_RPPCHF 22124 CHCARITA 138 3.69 1 San Diego Aug NQC QF/SelfgenCHILLS_1_SYCENG 22120 CARLTNHS 138 0.26 1 San Diego Aug NQC QF/SelfgenCHILLS_7_UNITA1 22120 CARLTNHS 138 1.31 2 San Diego Aug NQC QF/Selfgen
CPSTNO_7_PRMADS 22112 CAPSTRNO 138 4.73 1 San Diego Aug NQC QF/Selfgen
CRSTWD_6_KUMYAY 22915 KUMEYAAY 34.5 6.70 1 San Diego Aug NQC Wind
DIVSON_6_NSQF 22172 DIVISION 69 34.41 1 San Diego Aug NQC QF/SelfgenEGATE_7_NOCITY 22204 EASTGATE 69 0.21 1 San Diego Aug NQC QF/Selfgen
ELCAJN_6_LM6K 23320 EC GEN2 13.8 48.10 1San Diego, El
CajonMarket
ELCAJN_6_UNITA1 22150 CALPK_EC 13.8 45.42 1San Diego, El
CajonMarket
ELCAJN_7_GT1 22212 ELCAJNGT 12.5 16.00 1San Diego, El
CajonMarket
ENCINA_7_EA1 22233 ENCINA 1 14.4 106.00 1 San Diego MarketENCINA_7_EA2 22234 ENCINA 2 14.4 104.00 1 San Diego MarketENCINA_7_EA3 22236 ENCINA 3 14.4 110.00 1 San Diego MarketENCINA_7_EA4 22240 ENCINA 4 22 300.00 1 San Diego Market
ENCINA_7_EA5 22244 ENCINA 5 24 330.00 1 San Diego MarketENCINA_7_GT1 22248 ENCINAGT 12.5 14.50 1 San Diego Market
ESCNDO_6_PL1X2 22257 ESGEN 13.8 35.50 1 San Diego MarketESCNDO_6_UNITB1 22153 CALPK_ES 13.8 48.04 1 San Diego Market
ESCO_6_GLMQF 22332 GOALLINE 69 39.92 1 San Diego, Esco Aug NQC QF/Selfgen
KEARNY_7_KY1 22377 KEARNGT1 12.5 16.00 1San Diego,
MissionMarket
KEARNY_7_KY2 22373 KEARN2AB 12.5 15.02 1San Diego,
MissionMarket
KEARNY_7_KY2 22373 KEARN2AB 12.5 15.02 2San Diego,
MissionMarket
KEARNY_7_KY2 22374 KEARN2CD 12.5 15.02 1San Diego,
MissionMarket
KEARNY_7_KY2 22374 KEARN2CD 12.5 13.95 2San Diego,
MissionMarket
KEARNY_7_KY3 22375 KEARN3AB 12.5 14.98 1San Diego,
MissionMarket
KEARNY_7_KY3 22375 KEARN3AB 12.5 16.05 2 San Diego, Market

22
Mission
KEARNY_7_KY3 22376 KEARN3CD 12.5 14.98 1San Diego,
MissionMarket
KEARNY_7_KY3 22376 KEARN3CD 12.5 14.98 2San Diego,
MissionMarket
LAKHDG_6_UNIT 1 22625 LKHODG1 13.8 20.00 1San Diego, Bernardo
Market
LARKSP_6_UNIT 1 22074 LRKSPBD1 13.8 46.00 1 San Diego MarketLARKSP_6_UNIT 2 22075 LRKSPBD2 13.8 46.00 1 San Diego Market
LAROA1_2_UNITA1 20187 LRP-U1 16 165 1 None MarketLAROA2_2_UNITA1 22996 INTBST 18 157 1 None MarketLAROA2_2_UNITA1 22997 INTBCT 16 165 1 None Market
MRGT_6_MEF2 22487 MFE_MR2 13.8 47.90 1San Diego,
Mission, MiramarMarket
MRGT_6_MMAREF 22486 MFE_MR1 13.8 48.00 1San Diego,
Mission, MiramarMarket
MRGT_7_UNITS 22488 MIRAMRGT 12.5 18.55 1San Diego,
Mission, MiramarMarket
MRGT_7_UNITS 22488 MIRAMRGT 12.5 17.45 2San Diego,
Mission, MiramarMarket
MSHGTS_6_MMARLF 22448 MESAHGTS 69 3.19 1San Diego,
MissionAug NQC QF/Selfgen
MSSION_2_QF 22496 MISSION 69 0.74 1 San Diego Aug NQC QF/Selfgen
NIMTG_6_NIQF 22576 NOISLMTR 69 35.59 1 San Diego Aug NQC QF/SelfgenOGROVE_6_PL1X2 22628 PA99MWQ1 13.8 49.95 1 San Diego, Pala MarketOGROVE_6_PL1X2 22629 PA99MWQ2 13.8 49.95 2 San Diego, Pala Market
OTAY_6_PL1X2 22617 OYGEN 13.8 35.50 1 San Diego MarketOTAY_6_UNITB1 22604 OTAY 69 2.80 1 San Diego Aug NQC QF/SelfgenOTAY_7_UNITC1 22604 OTAY 69 2.65 3 San Diego Aug NQC QF/Selfgen
OTMESA_2_PL1X3 22605 OTAYMGT1 18 185.06 1 San Diego MarketOTMESA_2_PL1X3 22606 OTAYMGT2 18 185.06 1 San Diego MarketOTMESA_2_PL1X3 22607 OTAYMST1 16 233.48 1 San Diego MarketPALOMR_2_PL1X3 22262 PEN_CT1 18 162.39 1 San Diego MarketPALOMR_2_PL1X3 22263 PEN_CT2 18 162.39 1 San Diego MarketPALOMR_2_PL1X3 22265 PEN_ST 18 240.83 1 San Diego Market
PTLOMA_6_NTCCGN 22660 POINTLMA 69 1.65 2 San Diego Aug NQC QF/SelfgenPTLOMA_6_NTCQF 22660 POINTLMA 69 16.70 1 San Diego Aug NQC QF/Selfgen
SAMPSN_6_KELCO1 22704 SAMPSON 12.5 0.72 1 San Diego Aug NQC QF/Selfgen
SMRCOS_6_UNIT 1 22724 SANMRCOS 69 0.47 1 San Diego Aug NQC QF/SelfgenTERMEX_2_PL1X3 22981 IV GEN1 18 281 1 None MarketTERMEX_2_PL1X3 22982 IV GEN2 18 156 1 None MarketTERMEX_2_PL1X3 22983 IVGEN3 18 156 1 None Market
NA 22444 MESA RIM 69 0.00 1 San DiegoNo NQC -hist. data
QF/Selfgen
NA 22592 OLD TOWN 69 0.00 1 San DiegoNo NQC -hist. data
QF/Selfgen
NA 22602 OMWD 69 0.00 1 San DiegoNo NQC -hist. data
QF/Selfgen
NA 22708 SANLUSRY 69 0.00 1 San DiegoNo NQC -hist. data
QF/Selfgen
NA 22916 PFC-AVC 0.6 0.00 1 San DiegoNo NQC -hist. data
QF/Selfgen
LAKHDG_6_UNIT 2 22626 LKHODG2 13.8 20.00 2San Diego, Bernardo
No NQC -Pmax
Market

23
Major new projects modeled:
1. Sunrise Power Link Project (Southern Route)
2. Eastgate – Rose Canyon 69kV (TL6927) reconductor
3. New Imperial Valley-Dixieland 230 kV line
4. East County 500 kV substation (ECO)
5. Lake Hodges unit # 2
Critical Contingency Analysis Summary
El Cajon Sub-area:
The most critical contingency for the El Cajon sub-area is the loss of the El Cajon-
Jamacha 69 kV line (TL624) followed by the loss of Miguel-Granite-Los Coches 69 kV
line (TL632), which would thermally overload the El Cajon – Los Coches 69 kV line
(TL631). This limiting contingency establishes a LCR of 83 MW (including 0 MW of QF
generation) in 2013 as the minimum generation capacity necessary for reliable load
serving capability within this sub-area.
The most critical single contingency for this sub-area is the loss of Miguel-Granite-Los
Coches 69 kV line (TL632) with El Cajon Energy Center already out of service, which
would thermally overload the El Cajon – Los Coches 69 kV line (TL631). This limiting
contingency establishes a LCR of 53 MW (including 0 MW of QF generation) in 2013.
Effectiveness factors:
All units within this sub-area (El Cajon Peaker, El Cajon GT and El Cajon Energy
Center) have the same effectiveness factor.
Rose Canyon Sub-area
This sub-area has been eliminated due to TL6927, Eastgate-Rose Canyon 69 kV
reconductor which is already in-service.
Mission Sub-area

24
The most critical contingency for the Mission sub-area is the loss of Mission - Kearny 69
kV line (TL663) followed by the loss of Mission – Mesa Heights 69kV line (TL676),
which would thermally overload the Mission - Clairmont 69kV line (TL670). This limiting
contingency establishes a local capacity need of 126 MW (including 3 MW of QF
generation) in 2013 as the minimum generation capacity necessary for reliable load
serving capability within this sub-area.
Effectiveness factors:
Miramar Energy Facility units and Miramar GTs (Cabrillo Power II) are 8% effective,
Miramar Landfill unit and all Kearny peakers are 32% effective.
Bernardo Sub-area:
The most critical contingency for the Bernardo sub-area is the loss of Artesian -
Sycamore 69 kV line followed by the loss of Poway-Rancho Carmel 69 kV line, which
would thermally overload the Felicita Tap-Bernardo 69 kV line (TL689). This limiting
contingency establishes a LCR of 110 MW (including 0 MW of QF generation and 70
MW of deficiency) in 2013 as the minimum generation capacity necessary for reliable
load serving capability within this sub-area.
Effectiveness factors:
All units within this sub-area (Lake Hodges) are needed so there is no effectiveness
factor required.
Esco Sub-area
The most critical contingency for the Esco sub-area is the loss of Poway-Pomerado 69
kV line (TL6913) followed by the loss of Esco - Escondido 69kV line (TL6908) which
would thermally overload the Bernardo – Rancho Carmel 69 kV line (TL633). This
limiting contingency establishes a LCR of 114 MW (including 40 MW of QF generation
and 74 MW of deficiency) in 2013 as the minimum generation capacity necessary for
reliable load serving capability within this sub-area.

25
Effectiveness factors:
Only unit within this sub-area (Goal line) is needed so no effectiveness factor is
required.
Pala Sub-area
The most critical contingency for the Pala sub-area is the loss of Pendleton – San Luis
Rey 69 kV line (TL6912) followed by the loss of Lilac - Pala 69kV line (TL6932) which
would thermally overload the Melrose – Morro Hill Tap 69 kV line. This limiting
contingency establishes a LCR of 43 MW (including 0 MW of QF generation) in 2013 as
the minimum generation capacity necessary for reliable load serving capability within
this sub-area.
Effectiveness factors:
All units within this sub-area (Orange Grove) have the same effectiveness factor.
Miramar Sub-area
The most critical contingency for the Miramar sub-area is the loss of Otay Mesa –
Miguel Tap – Silvergate 230kV line (TL23042) followed by the loss of Sycamore
230/138 kV Bank #60, which would thermally overload the Sycamore - Scripps 69 kV
line (TL6916). This limiting contingency establishes a LCR of 97 MW (including 0 MW of
QF generation) in 2013 as the minimum generation capacity necessary for reliable load
serving capability within this sub-area.
The most critical single contingency for this sub-area is the loss of Otay Mesa – Miguel
Tap – Silvergate 230kV line (TL23042) with Miramar Energy Facility #1 or #2 out of
service, which would thermally overload the Sycamore - Scripps 69 kV line (TL6916).
This limiting contingency establishes a LCR of 86 MW (including 0 MW of QF
generation) in 2013.
Effectiveness factors:
All units within this sub-area (Miramar Energy Facility and Miramar GTs) have the same

26
effectiveness factor.
San Diego Sub-area:
The most limiting contingency for San Diego sub-area is the loss of Imperial Valley-
Suncrest 500 kV line followed by the loss of ECO-Miguel 500 kV line. The limiting
constraint is the post-transient voltage instability. This contingency establishes an LCR
of 3,536 MW in 2013 (includes 151 MW of QF generation and 7 MW of Wind as well as
467 MW of deficiency) as the minimum generation capacity necessary for reliable load
serving capability within this sub-area.
The most limiting single contingency in the San Diego sub-area is a (G-1/N-1)
contingency described by the outage of ECO-Miguel 500 kV line with Otay Mesa
Combined-Cycle Power Plant (603 MW) already out of service. The limiting constraint is
post-transient voltage instability. This contingency establishes an LCR of 2,462 MW in
2013 (includes 151 MW of QF generation and 7 MW of Wind).
Effectiveness factors:
All units within this area have the same effectiveness factor. Units outside of this area
are not effective.
San Diego Sub-area Requirements:
2013 QF(MW)
Wind (MW)
Market (MW)
Max. Qualifying Capacity (MW)
Available generation 151 7 2911 3069
2013 Existing Generation Capacity Needed (MW)
Deficiency (MW)
Total MW LCR Need
Category B (Single)6 2,462 0 2,462Category C (Multiple)7 3,069 467 3,536
6 A single contingency means that the system will be able the survive the loss of a single element, however the operators will not have any means (other than load drop) in order to bring the system within a safe operating zone and get prepared for the next contingency as required by NERC transmission operations standards.7 Multiple contingencies means that the system will be able the survive the loss of a single element, and the operators will have enough generation (other operating procedures) in order to bring the system within a safe operating zone and get prepared for the next contingency as required by NERC

27
San Diego-Imperial Valley Area Overall:
The most limiting contingency in the San Diego-Imperial Valley area is described by the
outage of 500 kV Southwest Power Link (SWPL) between Imperial Valley and North
Gila Substations over-lapping with an outage of the Otay Mesa Combined-Cycle Power
plant (603 MW) while maintaining post-transient voltage stability. This limiting
contingency establishes a local capacity need of 3,385 MW in 2013 (includes 151 MW
of QF generation and 7 MW of Wind) as the minimum capacity necessary for reliable
load serving capability within this area.
It is worth mentioning that Imperial Valley – Dixieland 230kV line was modeled between
IID and ISO. There were no additional upgrades modeled between CFE and ISO control
areas at Imperial Valley 230 kV bus in 2013 base case. The ISO acknowledges that the
LCR needs for the San Diego-Imperial Valley area will decrease as additional
transmission is constructed between the IID/CFE systems and Imperial Valley and more
power is flowing in real-time from these control areas into the ISO control area.
Effectiveness factors:
All units within this area have the same effectiveness factor. Units outside of this area
are not effective.
Changes to study results compared to SONGS being operational:
The load forecast went up by 10 MW. The total available capacity is the same. The San
Diego sub-area requirements have increased significantly, by 966 MW, due to the
voltage support issues that arise in the area without SONGS for outages in San Diego’s
system. The San Diego-Imperial Valley area requirements have increased also, by 447
MW, due to the same voltage support issues. For mitigation of new deficiencies and
potential reduction in the San Diego-Imperial Valley area LCR, in the absence of
SONGS, please see chapter II.
transmission operations standards.

28
San Diego-Imperial Valley Area Overall Requirements:
2013 QF(MW)
Wind (MW)
Market (MW)
Max. Qualifying Capacity (MW)
Available generation 151 7 3991 4149
2013 Existing Generation Capacity Needed (MW)
Deficiency (MW)
Total MW LCR Need
Category B (Single)8 3,385 0 3,385Category C (Multiple)9 3,385 46710 3,852
8 A single contingency means that the system will be able the survive the loss of a single element, however the operators will not have any means (other than load drop) in order to bring the system within a safe operating zone and get prepared for the next contingency as required by NERC transmission operations standards.9 Multiple contingencies means that the system will be able the survive the loss of a single element, and the operators will have enough generation (other operating procedures) in order to bring the system within a safe operating zone and get prepared for the next contingency as required by NERC transmission operations standards.10 San Diego-Imperial Valley area is not “overall deficient”. Resource deficiency values result from a few deficient sub-areas; and since there are no resources that can mitigate this deficiency the numbers are carried forward into the total area needs.
Related Documents