The Hudson River Eel Project Citizen Science Juvenile American Eel Surveys: 2008‐2013 Chris Bowser ([email protected] ; 845‐264‐5041), Sarah Mount, Zoraida Maloney and Laurel Walker; NYSDEC Hudson River Estuary Program and National Estuarine Research Reserve with NYS Water Resource Institute at Cornell Project Website: http://www.dec.ny.gov/lands/49580.html Overview The New York State Department of Environmental Conservation (NYSDEC) Hudson River Estuary Program and National Estuarine Research Reserve support a citizen science juvenile eel monitoring program to observe the number of juvenile eels in tributaries of the Hudson River. Along with DEC staff, trained volunteers including college interns, high school students, teachers, watershed group members, and local residents check specialized nets daily for eels. The project provides crucial baseline data on young eel populations in the Hudson River, and gets students and community members into their local streams. This report summarizes data collected by students and volunteers at several sites along the Hudson River estuary. Table 1: Total eels caught and eels caught per day as a catch per unit effort (CPUE) combined for all sampling sites in that year. In this study, eels are separated into two age classes: YOY glass eels and older elvers. “Glass eels” are defined as eels that are just entering the Hudson River system in the spring of the sampling year (which includes recently pigmented eels in late spring), and “older elvers” are fully pigmented eels that have been in the Hudson River system for at least a year. Year Total YOY Glass Eels CPUE YOY Glass Eels Total Older Elvers CPUE Older Elvers Total Eels Caught CPUE Total Eels Caught 2008 2388 19.8 181 1.86 2569 21 2009 7740 35.8 430 1.85 8170 38.1 2010 10564 23.3 1408 3.3 11972 26.6 2011 6964 17 1303 3.28 8267 20.4 2012 84995 143.9 1325 2.15 86320 146 2013 102323 198.6 1647 3.3 103970 201 TOTAL (2008‐2013) 214974 73 6294 2.6 221268 75.5 Left to right: A fyke net; student with glass eels and elvers about to be released; students reset the fyke net. 1

Welcome message from author
This document is posted to help you gain knowledge. Please leave a comment to let me know what you think about it! Share it to your friends and learn new things together.
Transcript

The Hudson River Eel Project Citizen Science Juvenile American Eel Surveys: 2008‐2013 Chris Bowser ([email protected] ; 845‐264‐5041), Sarah Mount, Zoraida Maloney and Laurel Walker; NYSDEC Hudson River Estuary Program and National Estuarine Research Reserve with NYS Water Resource Institute at Cornell Project Website: http://www.dec.ny.gov/lands/49580.html
Overview The New York State Department of Environmental Conservation (NYSDEC) Hudson River Estuary Program and National Estuarine Research Reserve support a citizen science juvenile eel monitoring program to observe the number of juvenile eels in tributaries of the Hudson River. Along with DEC staff, trained volunteers including college interns, high school students, teachers, watershed group members, and local residents check specialized nets daily for eels. The project provides crucial baseline data on young eel populations in the Hudson River, and gets students and community members into their local streams. This report summarizes data collected by students and volunteers at several sites along the Hudson River estuary. Table 1: Total eels caught and eels caught per day as a catch per unit effort (CPUE) combined for all sampling sites in that year. In this study, eels are separated into two age classes: YOY glass eels and older elvers. “Glass eels” are defined as eels that are just entering the Hudson River system in the spring of the sampling year (which includes recently pigmented eels in late spring), and “older elvers” are fully pigmented eels that have been in the Hudson River system for at least a year.
Year Total YOY Glass Eels
CPUE YOY Glass Eels
Total Older Elvers
CPUE Older Elvers
Total Eels Caught
CPUE Total Eels Caught
2008 2388 19.8 181 1.86 2569 21 2009 7740 35.8 430 1.85 8170 38.1 2010 10564 23.3 1408 3.3 11972 26.6 2011 6964 17 1303 3.28 8267 20.4 2012 84995 143.9 1325 2.15 86320 146 2013 102323 198.6 1647 3.3 103970 201 TOTAL (2008‐2013)
214974 73 6294 2.6 221268 75.5
Left to right: A fyke net; student with glass eels and elvers about to be released; students reset the fyke net.
1

2
Table of Contents Overview ................................................................................................................................................... 1 Methods .................................................................................................................................................... 3 2008 Results .............................................................................................................................................. 5 2009 Results .............................................................................................................................................. 6 2010 Results .............................................................................................................................................. 7 2011 Results .............................................................................................................................................. 8 2012 Results .............................................................................................................................................. 9 2013 Results ............................................................................................................................................ 10 Fish Population Surveys ......................................................................................................................... 11 Eel Ladder Restoration ........................................................................................................................... 12 Eel Project Expands to New York City .................................................................................................. 13 Eel Project Partners by Site .................................................................................................................... 14

Methods Sampling protocols follow those outlined by the Atlantic States Marine Fisheries Commission (ASMFC)1 and on previous Hudson River research following ASMFC protocols2.
Sampling Sites Sampled streams are all tributaries to the Hudson River estuary in New York. Net placement is close to the mouth of the stream, and as close to the head of tide as possible, depending on the stream’s profile and accessibility. Once a site is established, the same site is used in subsequent years. Table 2: Sample streams with their location (New York State county), the number of sampling years, and Hudson River Mile (RM) measured from the southern tip of Manhattan (RM 0), except the Bronx River which is a tributary to the East River, and Richmond Creek which is a part of New York Harbor. The Saw Kill site has been active each spring since before this citizen‐science project2. RM Stream County Years of Sampling
132 Hannacroix Creek Greene 2010‐2013 98 Saw Kill Dutchess 2003‐2013 84 Black Creek Ulster 2010‐2013 82 Crum Elbow Creek Dutchess 2009‐2013 76 Fall Kill Dutchess 2008‐2013 61 Quassaick Creek Orange 2012‐2013 53 Indian Brook Putnam 2009‐2013 38 Furnace Brook Westchester 2008‐2013 37 Minisceongo Creek Rockland 2010‐2013 ER Bronx River Bronx 2013 NY
Harbor Richmond Creek Richmond 2012‐2013
Sampling Gear Fyke nets are checked daily over approximately a six week period from late March to the end of May (sampling period varies slightly site to site) at all sampling sites. Nets are secured in the streambed using rebar or metal posts, and chimney blocks are used to weigh down the trap end of the net against the current. The mouth of the net faces the mainstem Hudson River in order to catch eels as they swim upstream into the tributaries. The wings of the fyke net are measured to be 13.5 ft apart, and the mouth of the net is 4 ft, these measurements are standard across sites2. Fyke nets all have a chain line on the bottom and a float line on top. Rocks are placed on the chain line as extra weight to minimize space underneath the net that eels can swim under. The height of the wings of the net is 4‐5 ft, with a float line that allows the net to move with changing tide levels. Between the mouth of the net and the funnel trap there is a ¼ inch size exclusion mesh, so no larger animals can enter the trap.
1 Atlantic States Marine Fisheries Commission. 2000. Standard procedures for American eel young of the year survey. http://www.asmfc.org/ 2 Schmidt, R.E., R. Petersson, T.R. Lake. 2006. Hudson River tributaries in the lives of fishes with emphasis on the American eel. American Fisheries Society Symposium, 51:317‐330.
3

4
The rest of the fyke net is made with 1 mm mesh, which is small enough that glass eels cannot swim through, but still allows water to flow. Volunteers scrub the net as needed to ensure adequate water flow. Nets are removed from the stream during high flow conditions to ensure volunteer safety. All eels caught in the fyke net are counted, weighed and released upstream. Eels are weighed in a group of approximately twenty (the number weighed will depend on how many eels are caught). The number of eels weighed and the total weight is recorded, and an average individual weight is calculated. Dry weights are taken by patting the eels dry with paper towels before weighing. At all of the sites possible, eels caught are released above the first barrier to upstream migration, usually a small dam or waterfall. Eels caught are recorded in two groups: “glass eels” and “elvers”. We use these terms to describe the difference between young of the year (YOY) eels (glass eels) and eels that have been residents of the Hudson River system for at least a year (elvers). Citizen scientists are trained by DEC staff in distinguishing between the two life stages, and we include a guide at each site with color photos and tips for identifying the different stages of juvenile eels. The fyke net’s exclusion mesh prevents eels larger than about 5 inches from entering the trap. Water temperature, air temperature, and tide period is collected at each site every day. Some sites collect additional water quality data. At many sites, volunteers also look for river herring as a part of the NYSDEC Volunteer River Herring Monitoring Project3. Volunteer Recruitment and Training Presentations are done at schools, colleges, watershed group meetings, and other groups such as scouts troops and afterschool clubs to recruit volunteers. Some presentations are done for large assemblies of students (100‐200 people at a time), and some are done for smaller groups. These presentations generally include an overview of the project, information on the recent decline of eel populations, our sampling protocols, and data from past years. In addition to these general presentations, we provide in situ training by several DEC staff after the fyke nets are deployed to ensure proper data collection and maintenance of sampling gear. Volunteers never sample alone, there must be at least two people present to sample. At the end of the season, volunteers are asked to fill out evaluations and describe their experiences while participating in the eel project.
3 NYSDEC Volunteer River Herring Monitoring website: http://www.dec.ny.gov/animals/41545.html
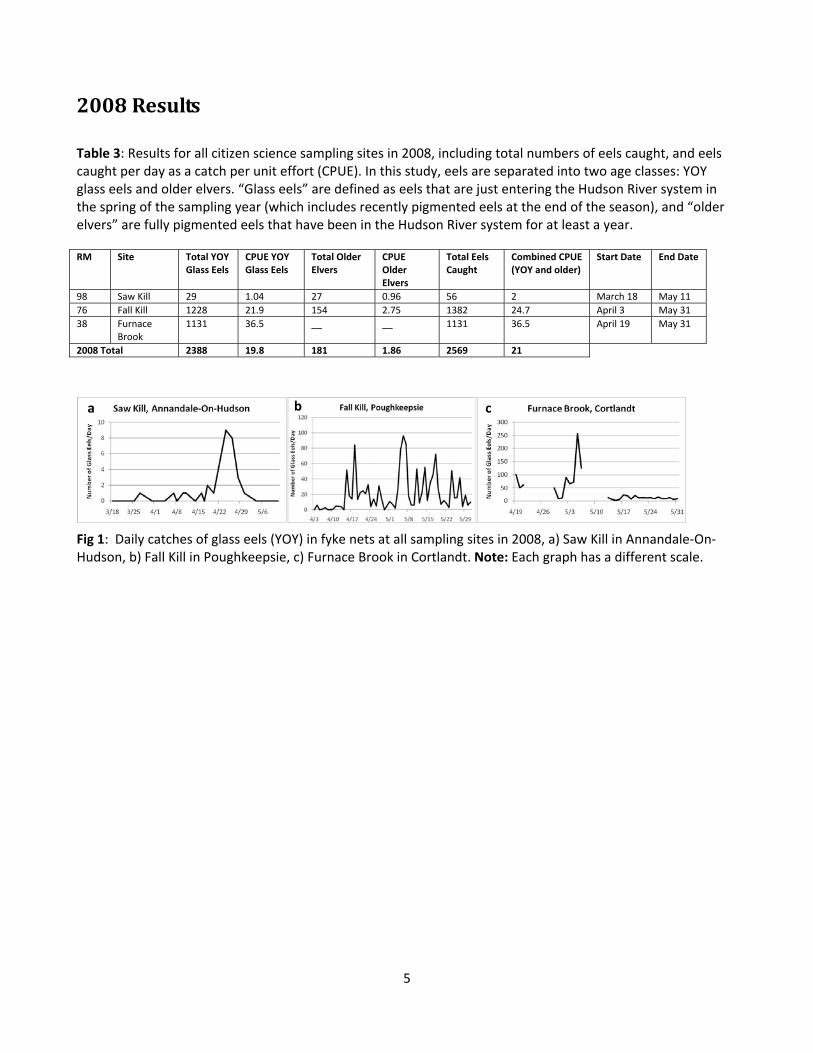
2008 Results Table 3: Results for all citizen science sampling sites in 2008, including total numbers of eels caught, and eels caught per day as a catch per unit effort (CPUE). In this study, eels are separated into two age classes: YOY glass eels and older elvers. “Glass eels” are defined as eels that are just entering the Hudson River system in the spring of the sampling year (which includes recently pigmented eels at the end of the season), and “older elvers” are fully pigmented eels that have been in the Hudson River system for at least a year. RM Site Total YOY
Glass Eels CPUE YOY Glass Eels
Total Older Elvers
CPUE Older Elvers
Total Eels Caught
Combined CPUE (YOY and older)
Start Date End Date
98 Saw Kill 29 1.04 27 0.96 56 2 March 18 May 1176 Fall Kill 1228 21.9 154 2.75 1382 24.7 April 3 May 3138 Furnace
Brook 1131 36.5 __ __ 1131 36.5 April 19 May 31
2008 Total 2388 19.8 181 1.86 2569 21
b a c
Fig 1: Daily catches of glass eels (YOY) in fyke nets at all sampling sites in 2008, a) Saw Kill in Annandale‐On‐Hudson, b) Fall Kill in Poughkeepsie, c) Furnace Brook in Cortlandt. Note: Each graph has a different scale.
5
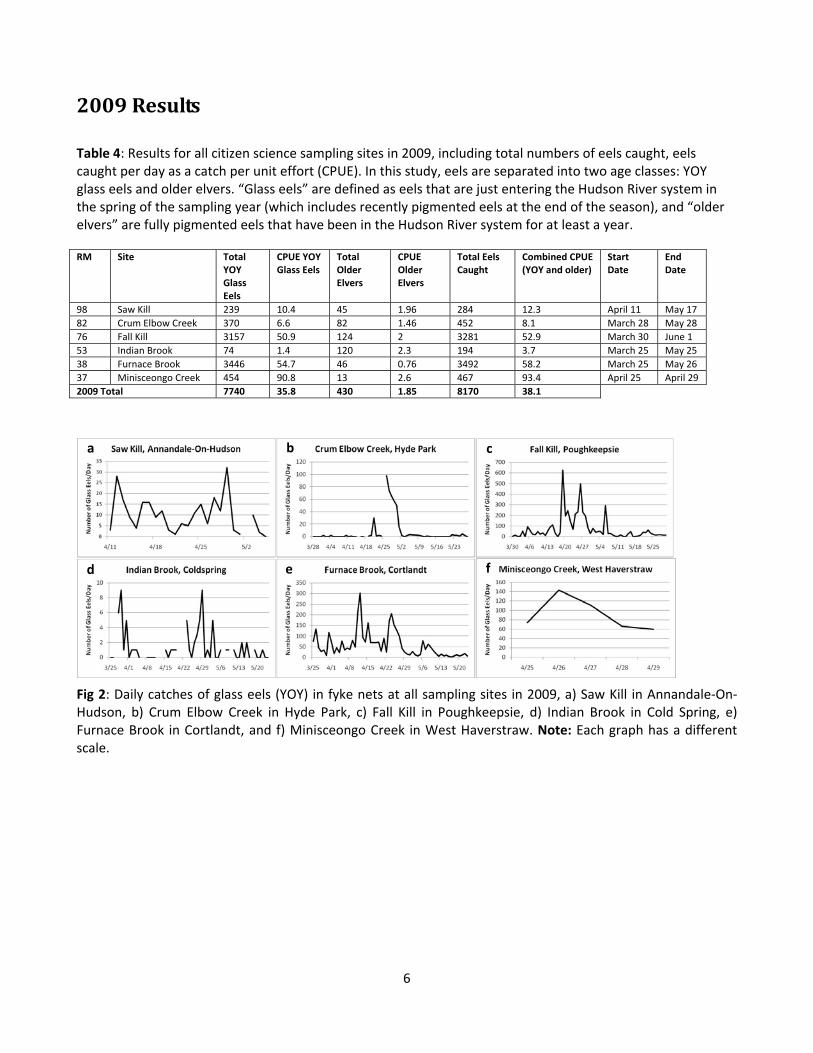
2009 Results Table 4: Results for all citizen science sampling sites in 2009, including total numbers of eels caught, eels caught per day as a catch per unit effort (CPUE). In this study, eels are separated into two age classes: YOY glass eels and older elvers. “Glass eels” are defined as eels that are just entering the Hudson River system in the spring of the sampling year (which includes recently pigmented eels at the end of the season), and “older elvers” are fully pigmented eels that have been in the Hudson River system for at least a year. RM Site Total
YOY Glass Eels
CPUE YOY Glass Eels
Total Older Elvers
CPUE Older Elvers
Total Eels Caught
Combined CPUE (YOY and older)
Start Date
End Date
98 Saw Kill 239 10.4 45 1.96 284 12.3 April 11 May 1782 Crum Elbow Creek 370 6.6 82 1.46 452 8.1 March 28 May 2876 Fall Kill 3157 50.9 124 2 3281 52.9 March 30 June 153 Indian Brook 74 1.4 120 2.3 194 3.7 March 25 May 2538 Furnace Brook 3446 54.7 46 0.76 3492 58.2 March 25 May 2637 Minisceongo Creek 454 90.8 13 2.6 467 93.4 April 25 April 292009 Total 7740 35.8 430 1.85 8170 38.1
b a c
f e d
Fig 2: Daily catches of glass eels (YOY) in fyke nets at all sampling sites in 2009, a) Saw Kill in Annandale‐On‐Hudson, b) Crum Elbow Creek in Hyde Park, c) Fall Kill in Poughkeepsie, d) Indian Brook in Cold Spring, e) Furnace Brook in Cortlandt, and f) Minisceongo Creek in West Haverstraw. Note: Each graph has a different scale.
6
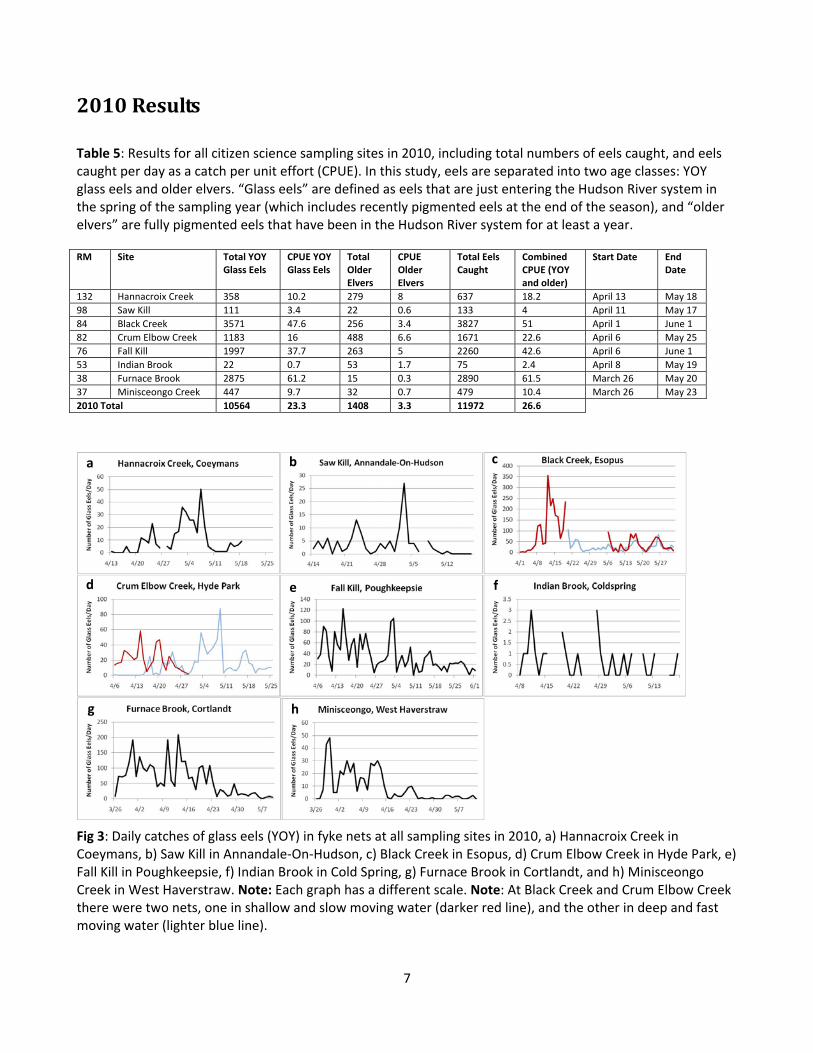
2010 Results Table 5: Results for all citizen science sampling sites in 2010, including total numbers of eels caught, and eels caught per day as a catch per unit effort (CPUE). In this study, eels are separated into two age classes: YOY glass eels and older elvers. “Glass eels” are defined as eels that are just entering the Hudson River system in the spring of the sampling year (which includes recently pigmented eels at the end of the season), and “older elvers” are fully pigmented eels that have been in the Hudson River system for at least a year. RM Site Total YOY
Glass Eels CPUE YOY Glass Eels
Total Older Elvers
CPUE Older Elvers
Total Eels Caught
Combined CPUE (YOY and older)
Start Date End Date
132 Hannacroix Creek 358 10.2 279 8 637 18.2 April 13 May 1898 Saw Kill 111 3.4 22 0.6 133 4 April 11 May 1784 Black Creek 3571 47.6 256 3.4 3827 51 April 1 June 182 Crum Elbow Creek 1183 16 488 6.6 1671 22.6 April 6 May 2576 Fall Kill 1997 37.7 263 5 2260 42.6 April 6 June 153 Indian Brook 22 0.7 53 1.7 75 2.4 April 8 May 1938 Furnace Brook 2875 61.2 15 0.3 2890 61.5 March 26 May 2037 Minisceongo Creek 447 9.7 32 0.7 479 10.4 March 26 May 232010 Total 10564 23.3 1408 3.3 11972 26.6
c b a
d fe
g h
Fig 3: Daily catches of glass eels (YOY) in fyke nets at all sampling sites in 2010, a) Hannacroix Creek in Coeymans, b) Saw Kill in Annandale‐On‐Hudson, c) Black Creek in Esopus, d) Crum Elbow Creek in Hyde Park, e) Fall Kill in Poughkeepsie, f) Indian Brook in Cold Spring, g) Furnace Brook in Cortlandt, and h) Minisceongo Creek in West Haverstraw. Note: Each graph has a different scale. Note: At Black Creek and Crum Elbow Creek there were two nets, one in shallow and slow moving water (darker red line), and the other in deep and fast moving water (lighter blue line).
7

2011 Results Table 6: Results for all citizen science sampling sites in 2011, including total numbers of eels caught, and eels caught per day as a catch per unit effort (CPUE). In this study, eels are separated into two age classes: YOY glass eels and older elvers. “Glass eels” are defined as eels that are just entering the Hudson River system in the spring of the sampling year (which includes recently pigmented eels at the end of the season), and “older elvers” are fully pigmented eels that have been in the Hudson River system for at least a year. RM Site Total
YOY Glass Eels
CPUE YOY Glass Eels
Total Older Elvers
CPUE Older Elvers
Total Eels Caught
Combined CPUE (YOY and older)
Start Date
End Date
132 Hannacroix Creek 262 10.9 124 5.2 386 16 May 2 June 298 Saw Kill 116 2.5 9 0.2 125 2.66 March 27 June 584 Black Creek 1002 14.7 163 2.4 1165 17.1 March 27 June 282 Crum Elbow Creek 1843 25.25 648 8.9 2491 34.1 March 28 June 1776 Fall Kill 625 10 218 3.5 843 13.6 March 25 June 153 Indian Brook 38 4.2 39 4.3 77 8.6 March 31 April 2238 Furnace Brook 2466 58.7 10 0.24 2476 60 March 26 May 2837 Minisceongo Creek 612 9.7 92 1.5 704 11.2 March 27 June 12011 Total 6964 17 1303 3.28 8267 20.4
c b a
e f Poughkeepsied
g
Fig 4: Daily catches of glass eels (YOY) in fyke nets at all sampling sites in 2011, a) Hannacroix Creek in Coeymans, b) Saw Kill in Annandale‐On‐Hudson, c) Black Creek in Esopus, d) Crum Elbow Creek in Hyde Park, e) Fall Kill in Poughkeepsie, f) Furnace Brook in Cortlandt, and g) Minisceongo Creek in West Haverstraw. Note: Each graph has a different scale.
8

2012 Results Table 7: Results for all citizen science sampling sites in 2012, including total numbers of eels caught, and eels caught per day as a catch per unit effort (CPUE). In this study, eels are separated into two age classes: YOY glass eels and older elvers. “Glass eels” are defined as eels that are just entering the Hudson River system in the spring of the sampling year (which includes recently pigmented eels at the end of the season), and “older elvers” are fully pigmented eels that have been in the Hudson River system for at least a year. RM Site Total
YOY Glass Eels
CPUE YOY Glass Eels
Total Older Elvers
CPUE Older Elvers
Total Eels Caught
Combined CPUE (YOY and older)
Start Date
End Date
132 Hannacroix Creek 2945 60 37 0.76 2982 60.85 March 24 May 1498 Saw Kill 139 3.2 15 0.34 154 3.5 March 18 April 3084 Black Creek 12408 203.4 101 1.66 12509 205 March 13 May 1482 Crum Elbow Creek 22460 295.5 732 9.63 23192 305.2 March 13 May 3076 Fall Kill 6751 105.5 198 3.1 6949 108.6 March 7 May 1161 Quassaick Creek 23446 468.9 123 2.46 23569 471.4 March 20 May 1153 Indian Brook 73 2.8 67 2.6 140 5.4 March 9 May 1438 Furnace Brook 3796 58.4 23 0.35 3819 58.75 March 4 May 1937 Minisceongo Creek 940 18.4 22 0.43 962 18.86 March 6 May 4NY Har Richmond Creek 12037 222.9 7 0.13 12044 223 March 6 April 302012 Total 84995 143.9 1325 2.15 86320 146
9
ca b
e f d
g
Fig 5: Daily catches of glass eels (YOY) in fyke nets at all sampling sCoeymans, b) Saw Kill in Annandale‐On‐Hudson, c) Black Creek in Esopus,Fall Kill in Poughkeepsie, f) Quassaick Creek in Newburgh, g) Furnace Broin West Haverstraw, i) Richmond Creek in Staten Island. Note:
ites in 2012, a) Hannacroix Creek in d) Crum Elbow Creek in Hyde Park, e) ok in Cortlandt, h) Minisceongo Creek
Each graph has a different scale.
ih
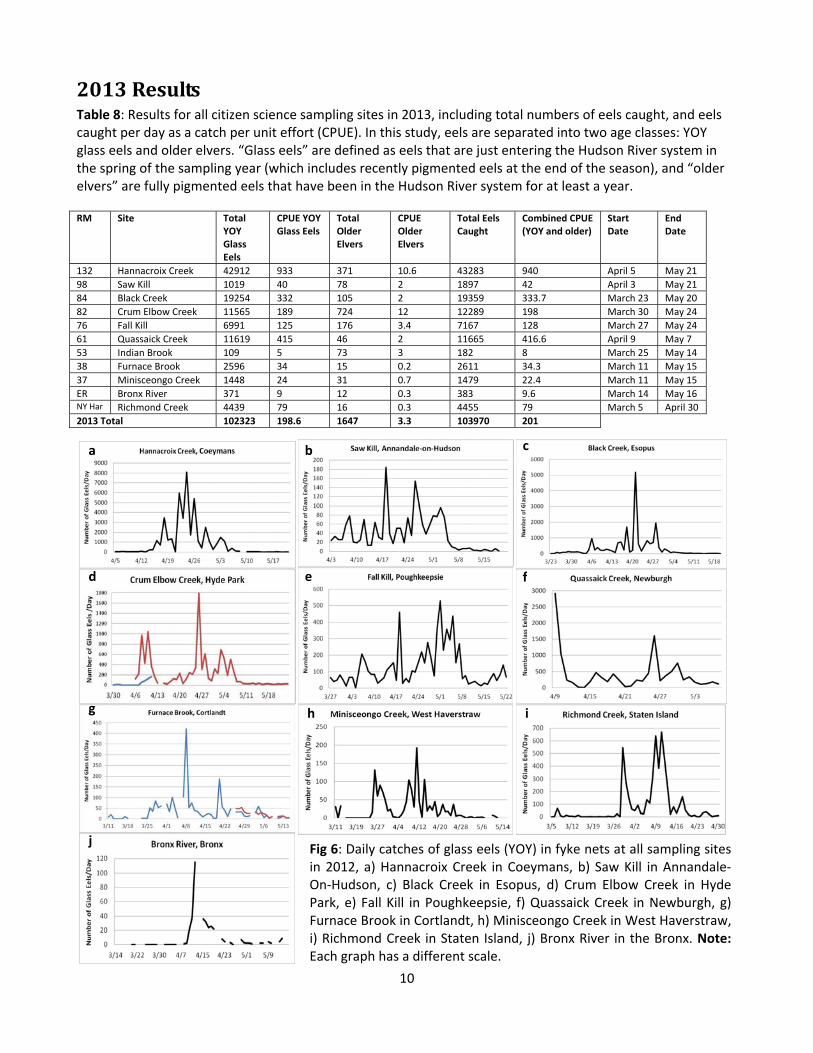
2013 Results Table 8: Results for all citizen science sampling sites in 2013, including total numbers of eels caught, and eels caught per day as a catch per unit effort (CPUE). In this study, eels are separated into two age classes: YOY glass eels and older elvers. “Glass eels” are defined as eels that are just entering the Hudson River system in the spring of the sampling year (which includes recently pigmented eels at the end of the season), and “older elvers” are fully pigmented eels that have been in the Hudson River system for at least a year. RM Site Total
YOY Glass Eels
CPUE YOY Glass Eels
Total Older Elvers
CPUE Older Elvers
Total Eels Caught
Combined CPUE (YOY and older)
Start Date
End Date
132 Hannacroix Creek 42912 933 371 10.6 43283 940 April 5 May 2198 Saw Kill 1019 40 78 2 1897 42 April 3 May 2184 Black Creek 19254 332 105 2 19359 333.7 March 23 May 2082 Crum Elbow Creek 11565 189 724 12 12289 198 March 30 May 2476 Fall Kill 6991 125 176 3.4 7167 128 March 27 May 2461 Quassaick Creek 11619 415 46 2 11665 416.6 April 9 May 753 Indian Brook 109 5 73 3 182 8 March 25 May 1438 Furnace Brook 2596 34 15 0.2 2611 34.3 March 11 May 1537 Minisceongo Creek 1448 24 31 0.7 1479 22.4 March 11 May 15ER Bronx River 371 9 12 0.3 383 9.6 March 14 May 16NY Har Richmond Creek 4439 79 16 0.3 4455 79 March 5 April 302013 Total 102323 198.6 1647 3.3 103970 201
10
Fig 6: Daily catches of glass eels (YOY) in fyke nets at all sampling sites in 2012, a) Hannacroix Creek in Coeymans, b) Saw Kill in Annandale‐On‐Hudson, c) Black Creek in Esopus, d) Crum Elbow Creek in Hyde Park, e) Fall Kill in Poughkeepsie, f) Quassaick Creek in Newburgh, g) Furnace Brook in Cortlandt, h) Minisceongo Creek in West Haverstraw, i) Richmond Creek in Staten Island, j) Bronx River in the Bronx. Note: Each graph has a different scale.
c
b c a b
d e f
g h i
j

Fish Population Surveys Dams have been identified as one of the key factors contributing to the decline in eel populations4. To quantitatively assess the impact of dams on eel populations, we performed electroshocking surveys above and below barriers to migration. Backpack electroshocking is a commonly used fisheries technique in which an electrical current is put in the water that stuns fish for a few seconds. Netters are ready to catch the stunned fish and put them in a recovery bucket. The fish are identified, any eels are measured, and all fish are released back into the stream. Data from 22 sites on 11 streams show that eels are significantly impacted by the presence of barriers, both natural (waterfalls) and man‐made (dams).
Fig 6: Average number of eels caught above and below barriers from 22 sites on 11 tributaries to the Hudson River. Standard error bars are shown. Electroshocking surveys can help us identify potential future eel ladder sites, and confirm the conclusions of previous studies5 that show the impact of barriers on eel migration upstream.
Electrofishing at Crum Elbow Creek in Hyde Park, Dutchess County
4 Haro, A., W. Richkus, K. Whalen, A. Hoar, W. Busch, S. Lary, T. Brush, D. Dixon. 2000. Population decline of the American eel: implications for research and management. Fisheries, 25(9):7-16. 5 Machut, L.S., K.E. Limburg, R.E. Schmidt, D. Dittman. 2007. Anthropogenic impacts on American eel demographics in Hudson River tributaries, New York. Transactions of the American Fisheries Society, 136(6):1699-1713.
11

Eel Ladder Restoration In 2011, a newly designed low‐cost eel ladder (approximately $400 in materials) was installed at Furnace Brook in Westchester County to help eels access habitat upstream of an approximately 6 meter high dam. In 2012, the same design was installed at Crum Elbow Creek and Saw Kill in Dutchess County. Electroshocking surveys show that the number of eels upstream of the dam is an order of magnitude lower than the number of eels directly downstream of the dam. The ladder is made of a PVC tube (8 inch diameter) with one end in the stream and the other end landing in a bucket. Eels climb up netting in the tube to land in the bucket and are counted by volunteers before being transported upstream. There are two siphons that bring water from upstream of the dam to the ladder to ensure flow down the PVC tube, and to provide eels with the scent of upstream waters. From the end of May to the end of October, volunteers and scientists checked the bucket twice a week for eels. All eels caught were separated into size classes: stage one (<3 inches), stage two (3‐6 inches), stage three (6‐12 inches), and stage four (>12 inches). The majority of eels that used all ladders were 3‐6 inches long. Eels were not anesthetized and measured, but the size class of each eel was estimated to get a general understanding of what sizes used the ladder. All eels were then released above one or more barriers to their migration upstream. Table 8: Eels caught in an eel ladder at Furnace Brook in 2011, separated by size class. All eels caught were then released upstream of the dam. Stage 1
<3 inches Stage 2 3‐6 inches
Stage 3 6‐12 inches
Stage 4 >12 inches
Total
Eels Caught May‐October, 2011
323 967 168 13 1461
Table 9: Eels caught in eel ladders at three sites in 2012, separated by size class. All eels caught were then released upstream of the dam (at Crum Elbow they were released upstream of several dams). Stage 1
<3 inches Stage 2 3‐6 inches
Stage 3 6‐12 inches
Stage 4 >12 inches
Total
Furnace Brook 61 207 41 0 308Crum Elbow 3 73 3 1 80Saw Kill 1 37 1 0 39
Low‐cost eel ladder at Furnace Brook, Westchester County
12
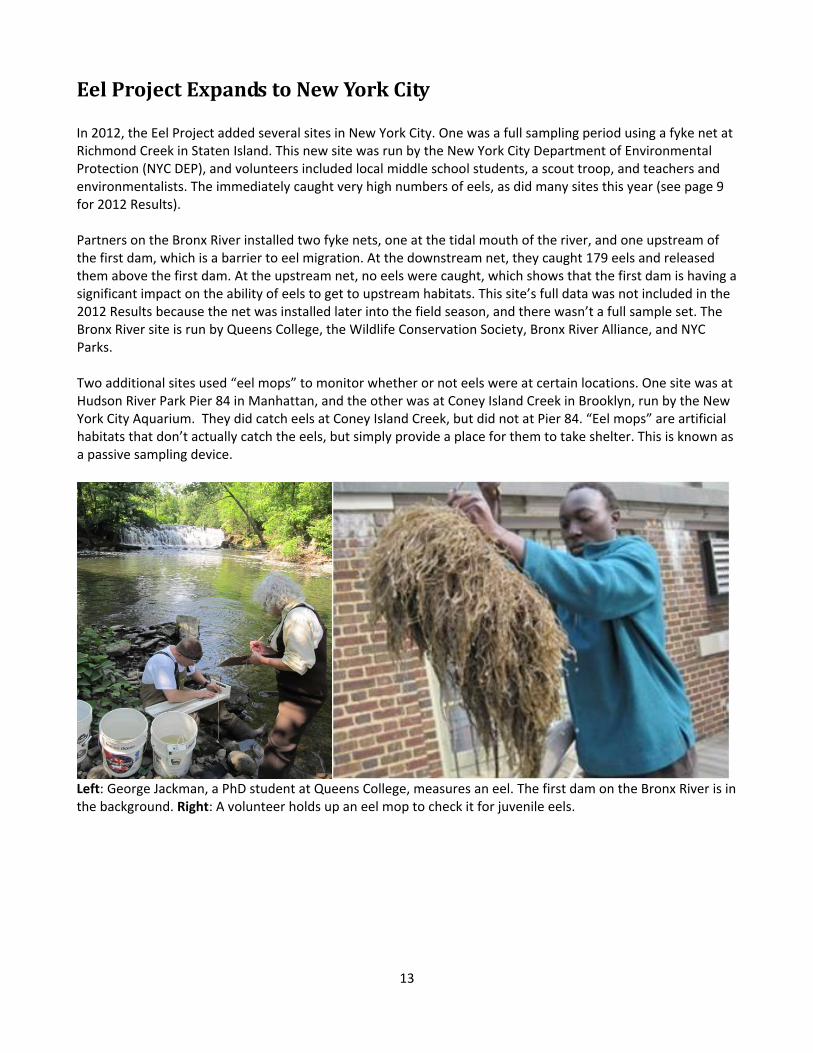
Eel Project Expands to New York City In 2012, the Eel Project added several sites in New York City. One was a full sampling period using a fyke net at Richmond Creek in Staten Island. This new site was run by the New York City Department of Environmental Protection (NYC DEP), and volunteers included local middle school students, a scout troop, and teachers and environmentalists. The immediately caught very high numbers of eels, as did many sites this year (see page 9 for 2012 Results). Partners on the Bronx River installed two fyke nets, one at the tidal mouth of the river, and one upstream of the first dam, which is a barrier to eel migration. At the downstream net, they caught 179 eels and released them above the first dam. At the upstream net, no eels were caught, which shows that the first dam is having a significant impact on the ability of eels to get to upstream habitats. This site’s full data was not included in the 2012 Results because the net was installed later into the field season, and there wasn’t a full sample set. The Bronx River site is run by Queens College, the Wildlife Conservation Society, Bronx River Alliance, and NYC Parks. Two additional sites used “eel mops” to monitor whether or not eels were at certain locations. One site was at Hudson River Park Pier 84 in Manhattan, and the other was at Coney Island Creek in Brooklyn, run by the New York City Aquarium. They did catch eels at Coney Island Creek, but did not at Pier 84. “Eel mops” are artificial habitats that don’t actually catch the eels, but simply provide a place for them to take shelter. This is known as a passive sampling device.
Left: George Jackman, a PhD student at Queens College, measures an eel. The first dam on the Bronx River is in the background. Right: A volunteer holds up an eel mop to check it for juvenile eels.
13
Eel Project Partners by Site
Quassaick Creek, Newburgh Hannacroix Creek, Coeymans Warex Terminal Corp New Baltimore Conservancy Mt. St. Mary’s College Cornell Cooperative Extension of Greene County San Miguel Academy Coxsackie Elementary School Newburgh Rowing Club Coxsackie‐Athens High School Quassaick Creek Watershed Alliance Storm King High School Saw Kill, Annandale‐on‐Hudson Bard College Furnace Brook, Cortlandt
Black Creek, Esopus Ossining High School Scenic Hudson Putnam/Northern Westchester BOCES Kingston High School Local homeschoolers Boy Scouts of America New Paltz High School Minisceongo Creek, West Haverstraw SUNY New Paltz Strawtown Arts Studio GenOn Bowline Plant Crum Elbow Creek, Hyde Park
Richmond Creek, Staten Island Hyde Park Landing New York City Department of Environmental Protection
Marist College Vassar College
St. Clare’s School Dutchess Community College NY Harbor School Boy Scouts of America Fall Kill, Poughkeepsie
Poughkeepsie High School Arlington High School Mid‐Hudson Children’s Museum
14
Related Documents