ENERGY COMMISSION, GHANA 2013 ENERGY (SUPPLY AND DEMAND) OUTLOOK FOR GHANA Final April, 2013

Welcome message from author
This document is posted to help you gain knowledge. Please leave a comment to let me know what you think about it! Share it to your friends and learn new things together.
Transcript

ENERGY COMMISSION, GHANA
2013 ENERGY
(SUPPLY AND DEMAND)
OUTLOOK FOR GHANA
Final
April, 2013
i
Executive Summary
Energy Commission presents supply and demand forecasts for electricity, crude oil, petroleum
products, natural gas and charcoal for the year 2013.
Electricity:
In 2012, the total grid electricity generated1 in the country was 12,164 Gigawatt-hours (GWh)
2.
For 2013, the total electricity requirement of the country would be in the range of 13,667-15,794
GWh. The low-side represents relatively low supply due to comparatively high cost of energy as
a result of lower than expected flow of gas for power generation. The high-side covers VALCO
operating at two-to-three potlines. Between 13,459-16,121 GWh could be supplied by the public
utilities through the national grid depending upon adequate fuel supply for power generation.
The low-side represents relatively high cost of fuel or inadequate gas supply.
In 2012, Ghana’s peak load on the transmission grid was 1,729 Megawatts (MW) and the total
peak on the overall grid system was 1,871 MW.
For 2013, Ghana’s peak load and the total system peak on the grid transmission system would be
about 1,800 MW and 1,900 MW respectively. For VALCO to be operating between 3-4 potlines,
Ghana’s peak load and the total system peak would increase to 1,980 MW and 2,500 MW
respectively.
Except for the limitations placed on VALCO operations, there should be no significant shortfall
in electricity supply to meet demand provided there is adequate supply of fuel for power
generation. In summary, installed capacity would not be the challenge but fuel supply is the
constraint.
Shortfall in fuel supply would compel the utilities to continue to ration power by resorting to
load-shedding. Large consumers however meet their electricity supply shortfall by private and
back-up generation at the point of use, or cut down or suspend operations during load-shedding
hours.
1 i.e. electricity generated by the state utilities and the Independent Power Producers and pumped into the grid.
2 Million units of electricity.

ii
Higher than expected average annual precipitation is expected this year – 2013, according to the
Ghana Meteorological Agency (GMA). Higher inflows into the hydropower reservoir would
improve the overall power generation to offset inadequate or delayed gas supply.
Natural gas
In 2012, total natural gas required to run all the dual-fuelled thermal plants in optimum mode
was about 180 million standard cubic feet per day (mmscfd). However, only an average of 65
mmscfd was available, in consonance with our forecast for that year. WAGP gas flow was
truncated in August 2012, due to an accident on the undersea-pipeline in the Togolese waters that
very month3.
For 2013, the average annual volume of natural gas expected from the West Africa Gas Pipeline
(WAGP) is likely to reduce further to about 35-40 mmscfd (35,000-40,000 MMBtu)4, due to
technical and demand challenges being encountered in Nigeria. However, domestic gas from the
Jubilee field is likely to ramp the annual average up to 45-50 mmscfd by end of the year5.
2013 is also expected to see commencement of development of other fields neighbouring Jubilee,
namely Sankofa, TEN, Sankofa East which are expected to bring along more associated gas by
2017-2018 depending upon the timely and rate of the development of the fields. These new fields
are projected to yield an average ranging from 100-500 mmscfd by 2020.
However, considering the number of thermal power plants currently installed and expected to be
in operation by 2015, those under construction and those planned or issued with licences by the
Energy Commission, estimated total gas requirement is expected to exceed 800 mmscfd by 2017.
Thus the only cost effective gas supply option is to import LNG to meet the shortfall, but such an
arrangement must start this year-2013 to avert the future anticipated shortfall.
3 WAGP gas supply was interrupted at the end of August, 2012 following pirate activities in the Togolese waters
that month. Since then, gas has not flowed to Ghana at the time of producing this document. 4 For WAGP gas from Nigeria, assume 1 mscf=1000 MMBtu
5 Jubilee gas is expected to be available at the end of the year. Assuming at least two month supply from say
November to December at the average rate of 70-80 mmscfd will yield an annual average range of 6-10 mmscfd.

iii
In 2012, the WAPCo6 tariff for transporting natural gas via the West African Gas Pipeline
(WAGP) was $4.175 per MMBtu ($4.25 per mscf) and the average WAGP gas price was $2.587
per MMBtu ($2.63 per mscf). Total delivered gas price7 was $8.188 per MMBtu ($8.34 per
mscf).
For 2013, the new WAPCo tariff for transporting natural gas is expected between $4.20-4.30 per
MMBtu ($4.28-4.38 per mscf); less than one percent rise over last year. The average WAGP gas
price would be within $2.58-2.60 per MMBtu ($2.60-2.65 per mscf). The total delivered gas
price would be $8.50-9.00 per MMBtu ($8.66-9.17 per mscf); 3-4% increment over the previous
year.
Petroleum
For 2013, the average purchase price of Brent crude would be between $108 and $110 per barrel
and $98-102 per barrel for other brands of light crudes. Average light crude oil price for power
generation would range from $100-102 per barrel.
Ghana bought Brent crude at an average price of $113 per barrel in 2012. Thus average price is
expected to be lower in 2013 by 3-4%.
For 2013, we estimate that the total crude oil and imported products required would increase to
3.0-3.5 million tonnes from 2.9 million tonnes in 2012, in order to meet optimal refinery
operations and imported products for local consumption.
Crude oil required for refinery operations would vary from 1.6-1.9 million tonnes (12-13 million
barrels) during the year, depending upon the availability of the Tema Oil Refinery and its
auxiliary units. The remaining 1.4-1.6 million tonnes of products would have to be imported.
For LPG, the total national requirement could likely be in the range of 250,000-300,000 tonnes
for the year due to the growing demand, particularly as transport fuel. However, limited nation-
wide storage capacity and the inadequate revenues generated from its sales due to cross-
subsidization could continue to constrain supply to 220,000-250,000 tonnes range in 2013.
6 West African Gas Pipeline Company Ltd.
7 i.e. including duties, taxes, etc

iv
The breakdown of the total petroleum products required would be as follows:
Product
National supply
requirement Exports included
Tonnes
Total Gasoline8* 850,000 - 970,000 1,000,000
Total Diesel 1,600,000 - 1,700,000 1,850,000
Kerosene/ATK 200,000 - 230,000 300,000
LPG 250,000 - 300,000 350,000
Total 3,000,000 - 3,200,000 3,500,000
Crude oil production from the Jubilee field increased from an annual average of about 73,000
barrels per day in 2011 to an annual average of 81,000 barrels per day in 2012, though still short
of the target of 120,000 barrels per day projected by the field operators for last year. Production
however ramped up to 100,000 barrels per day during the last quarter of 2012.
With technical challenges almost resolved, according to Tullow Oil, the operator,9,, production is
likely to range between 100,000-120,000 barrels per day in 2013.
Charcoal
Average prices of charcoal in the country rose from GH¢9 per mini bag and GH¢15 per maxi
bag in 2011 to GH¢11 per mini bag and GH¢18 per maxi bag in 2012.
The high-price regions for 2012 were Western and Central.
The low-price regions were Ashanti, Brong-Ahafo and Northern. , the latter also saw a drop in
average mini-bag charcoal price.
8 NB: *Total gasoline includes Premix; **Total diesel includes supplies to the mining companies and bunkering
9 According to the operator, Tullow Oil plc, Tullow January 2012 Update.

v
Averages prices however dropped in Greater Accra for maxi bag and in Northern Region for
mini bag.
Average charcoal price for minibag more than doubled in Upper East and West Regions. Eastern
and Western Regions also experienced significant charcoal price increment.
We estimate that average charcoal price in 2013 could range between 20-25% over 2012 average
price nationwide due to general increase in LPG price, an alternative but cleaner cooking fuel.
Increases could go up between 30-35% on the average in the southern sector due to LPG supply
shortages and further expected rise in transportation and labour costs.
Recommendations
To ameliorate the overall power supply shortage prevailing in the country, emanating out of
inadequate fuel supply for power generation, investments in alternative gas supply in the light of
increasing crude oil prices should highly be encouraged. It is therefore commendable for the
Ministry of Energy to charge the Energy Commission to coordinate all potential liquefied natural
gas (LNG) investment initiatives taking place in the country.
In the light of the above, we reiterate the following recommendations made in 2012:
i. The power generation utilities supported by the Government should look for
alternative sources of natural gas for the country’s power plants, besides supplies
from the West African Gas Pipeline to enhance gas supply security.
ii. In this respect, Government should proactively create incentives to encourage
investment in LNG regas facility built in the shortest possible time. An investment
workshop for stakeholders where the government entities including Ghana Investment
Promotion Centre and the Ministries of Energy and Finance can table the economic
and investment incentives that the government could offer would be very essential.
iii. The Government should do whatever it could to support the entities concerned
including the Ghana National Gas Company Ltd to expedite development of the
natural gas processing plant to process gas expected from the offshore Jubilee oil
fields. Since the thermal plants are now the marginal generators, natural gas, which
is largely less expensive than LCO will help supplement oil-based generation and
consequently reduce average generation cost.

vi
iv. Government ensures as a matter of urgency, that the required commercial
frameworks for the developments of the TEN and the Sankofa fields are finalized by
close of this year – 2013 to enable commercial production in these fields to
commence by 2017.
v. Government provides significant attractive fiscal incentives to investors like tax holidays
to make the non-associate gas fields economically viable to develop.
vi. On the other hand, Renewable Energy technologies can provide at least 5% of the
country’s electricity requirements at present. Thus, with the passage of the
Renewable Energy Act, 2011 (Act 832), the Energy Commission with the mandate to
promote renewable energy in the country and with the support of the sector ministry
would team up with the finance and the environment ministries, other stakeholders
such as the Environmental Protection Agency, Ghana Investment Promotion Centre,
the international, regional and local financial institutions to organise investment fora
on assessing carbon finance facilities for grid–connected Renewable energy based
power supply in the country.
vii. As part of the strategic oil stock of the country, BOST10
should initiate steps to
include storage of crude oil as soon as possible. Storing crude oil is cheaper, stable
and more durable compared to storage of products.
viii. The sector Ministry, National Petroleum Authority, BOST, Energy Commission and
the Ghana Investment Promotion Centre assemble other key stakeholders to identify
the key barriers impeding investment in new oil refinery in the country and to institute
the needed incentives, to encourage construction of new oil refineries to serve both
the local and export markets.
ix. National Petroleum Authority should encourage the Oil Marketing Companies to set
up more LPG distribution centres to increase access and consumption.
10
Bulk Oil Storage and Transport company

vii
Foreword
THE ENERGY COMMISSION has the mandate to prepare, review and update periodically
indicative national plans to ensure that all reasonable demands for energy are met in a
sustainable manner. In addition, the Energy Commission is mandated to secure and maintain a
comprehensive data base for national decision making for the efficient development and
utilisation of energy resources available to the nation. Energy Commission’s jurisdiction include
promoting and ensuring uniform rules of practice for the production, transmission, wholesale
supply, distribution and sale of electricity and natural gas.
In fulfilment of its mandates, the Energy Commission in 2006, published the Strategic National
Energy Plan for Ghana (SNEP) covering the period 2006-2020. The Commission has been
preparing annual energy demand and supply forecasts to provide some guide to the energy sector
operators and potential investors as well as the wider business community wishing to operate in
the country. The purpose of the 2013 Annual Energy Outlook therefore is intended to give
government, industry and business, indications of the levels/quantities of electricity, liquid and
gaseous fuels that would be required to be provided by the energy producers.
This document covers demand and supply of electricity, crude oil and petroleum products,
natural gas as well as charcoal. Even though, no forecast for electricity prices is included, higher
thermal generation mix and increasing fuel price would lead to higher generation cost. The rate
of cost increase would be lower if more natural gas which is less expensive than oil is made
available to replace oil in the generation mix. High cost of crude oil would also lead to higher
petroleum product prices. Inadequate supply of LPG leads to higher charcoal consumption and
consequently more wood for charcoal production. Average price of charcoal is also increasing.
In the document, ‘Demand’ is used when referring to gross fuel or energy required by a demand
sector, e.g. Residential, Commercial, or Industry. ‘Supply Requirement’ is Supply or
Generation/Production + transmission/transport losses. For further elaboration, please refer to
Annex 1 of the document for a schematic overview of Ghana’s Energy Demand and Supply
System.

viii
This report was prepared by the Strategic Planning and Policy Division of the Energy
Commission. General questions about the report should be referred to Mr. Michael Opam,
([email protected], [email protected]) Director, Planning and Policy
Directorate. Specific questions about the content may be directed to Dr. Joseph Essandoh-Yeddu
([email protected], [email protected]), Head of Strategic Planning and Policy
Division.
Your comments are most welcome.
A. K. Ofosu Ahenkorah (PhD)
Executive Secretary

ix
2013Energy Demand and Supply Outlook for Ghana, March, 2013
TABLE OF CONTENTS
Executive Summary i
Foreword vii
List of Tables xi
List of Figures xii
1.0 Power Subsector 1
1.1 Overview of grid power supply in 2012 1
1.2 2012 forecasts and actuals 2
1.3 Forecast for 2013 4
Fuel supply challenge and likely impact on generation 5 1.4 The potential drivers for electricity consumption 7
Aluminium production 7 Gold production 9 Other Industries 10 National Electrification Scheme 12 Natural or organic economic growth 12 Petroleum Up-stream and Mid-stream activities 12 Energy Efficiency and Conservation measures 13
2.0 Petroleum Subsector: Oil 15
2.1 Overview of petroleum supply in 2012 15
Saltpond field 15 Jubilee field 15 Domestic consumption and stocks in 2012 16
2.2 2012 forecast and actuals 20
Household fuel use 22 2.3 Forecast for 2013 23
Local petroleum product requirements 28 Priority Issues 30
2.4 Recommendations 31
3.0 Petroleum Subsector: Natural Gas 32
3.1 Overview of natural gas supply in 2012 32
3.2 2012 forecast and actuals 32
3.3 Forecast for 2013 and beyond 33
3.4 Alternative natural gas supply sources 35
3.4.1 Supply from the Jubilee field 35
3.4.2 Supply from LNG re-gas facility 37
Deployment of LNG regas facility 37
x
2013Energy Demand and Supply Outlook for Ghana, March, 2013
Cost implications of LNG supply option 38 3.4.3 Supply from other domestic fields 39
3.5 Recommendation 41
4.0 Woodfuel Subsector: Charcoal demand and prices 42
5.0 The Regulatory environment 45
5.1 The Electricity supply industry 45
5.1.1 Licensing and Permitting 45
5.1.2 Codes of Practice and Regulations 46
5.1.3 Establishment of Wholesale Electricity Market 47
5.2 The Natural Gas supply industry 47
5.2.1 Licensing and Permitting 48
5.2.2 Codes of Practice and Regulations 48
Annex1 – Schematic Overview of Ghana Energy Demand and Supply System 49
Annex 2 – Existing 100-200 mmscfd LNG plants worldwide 50

xi
2013Energy Demand and Supply Outlook for Ghana, March, 2013
List of Tables
Table 1 Installed Generation Capacity as of December 2012 1
Table 2 Transmission losses since 2008 2
Table 3. Average Natural Gas Supply from WAGP in 2012 2
Table 4 Grid Electricity and associated fuels: Forecasts and Actuals for 2012 3
Table 5 Grid Electricity Generation Capacity available for 2013 5
Table 6 Grid Electricity Generation Capacity available for 2013 with less gas supply 6
Table 7 Grid Electricity supply, share and growth to the Demand Sectors since 2000 11
Table 8 Industrial Sector Grid Electricity supply and shares since 2000 11
Table 9 Summary of estimates for additional electricity requirement in 2013 13
Table 10 Summary of Power Sector forecast for 2013 14
Table 11 Average crude oil prices in Ghana, United States (Gulf Coast) and Europe
(the North Sea).
17
Table 12 Petroleum product consumption for 2012 17
Table 13 National petroleum stocks as at 19 December, 2011and 17 December, 2012 19
Table 14 Yearly average crude oil prices for 2012: Forecast and Actuals 20
Table 15 Comparing petroleum products consumption in Ghana in 2011 and 2012 20
Table 16 Energy for Household Cooking in 2000 and 2010 22
Table 17 Ghana’s Oil Imports, costs and GDP growth compared 23
Table 18 Forecast for average crude oil prices for 2013 27
Table 19 Petroleum product forecast for 2013 28
Table 20 Operating performance of Tema Oil Refinery with and without the RFCC 29
Table 21 International Price Scale: Ratio of prices of refined product against crude oil 30
Table 22 WAGP Delivered Gas Price Components 33
Table 23 Average delivery gas prices in Ghana (WAGP), United States (Henry Hub),
and Europe (the North Sea)
34
Table 24 Estimated LNG cost range based on cargo shipments from Western Africa
to United States and Europe
39
Table 25 Natural gas forecast for Ghana in mmscfd, 2013-2020 41

xii
2013Energy Demand and Supply Outlook for Ghana, March, 2013
Table 26 Average price per mini and maxi bags of charcoal in the regions for 2011 and 2012 43
Table 27 Average price per kilogramme of bag of charcoal in the regions for 2011
and 2012
44
List of Figures
Figure 1 Trend of Saltpond field oil production since 2006 15
Figure 2 Jubilee field daily oil production in 2012 16
Figure 3 Total oil products supplied from 2000 and 2012 18
Figure 4 LPG consumption in tonnes for 2000 and 2010 21
Figure 5 LPG consumption shares for 2000 and 2010 21
Figure 6 Household incomes in 2000 and 2010 for urban and rural areas 22
Figure 7 Total WAGP gas supply for Ghana in 2012 32
Figure 8 Projected Nigerian natural gas supply plan. Courtesy of CERA, 2010 35
Figure 9 Jubilee field daily gas production for 2012 36
Figure 10 Fuel consumption trend as against GDP growth: 2000 - 2012 42
Figure A Energy supply continuum 49

1
1.0 Power Subsector
1.1 Overview of grid power supply in 2012
Installed generation capacity available for grid supply as at the end of 2012 was 2,296
Megawatt (MW) (see Table 1).
Table 1. Installed Electricity Generation Capacity as of December 2012.
GENERATION PLANT FUEL TYPE INSTALLED CAPACITY
MW
Hydro Power Plants
Akosombo Hydro 1,020
Kpong Hydro 160
Sub-Total 1,180
Thermal Power Plants11
Takoradi Power Company (TAPCO) LCO/NG/diesel 330
Takoradi International Company (TICO) LCO/NG/diesel 220
Sunon–Asogli Power (SAPP) NG 200
Tema Thermal Plant1 (TT1P) LCO/NG/diesel 110
Mines Reserve Plant (MRP) Diesel/NG 80
Tema Thermal Plant2 (TT2P) NG 50
CENIT Energy Ltd (CEL) LCO/NG 126
Sub – Total 1115.5
Total 2,296
NG is Natural gas
The total electricity made available for gross transmission in 2012 was 12,164 GWh as
against 11,200 GWh in 2011. The 2012 generation comprised 8,071 GWh (67%) hydropower
and 3,639 GWh (33%) of thermal power. Even though, hydropower generation share
decreased by about 0.5 percentage points over 2011, energy produced increased by about 510
GWh due to significant water inflows into the Akosombo reservoir in 201212
.
The Ghana load at peak on the transmission grid was 1,729 MW and the grid system
(maximum) peak was 1,871 MW.
Total power transmission losses in 2012 was 4.3% of gross transmission, 0.4 percentage
point improvement over 2011 (see Table 2).
11
TAPCO is Takoradi Power Company, a combined cycle (CC) thermal plant; TICO is Takoradi International
Power Company, a single cycle (SC) thermal plant 12
GRIDCo submissions to the Energy Commission, March, 2013

2
Table 2. Transmission losses since 2008.
Year 2008 2009 2010 2011 2012
Transmission losses as % of gross transmission 3.7 3.8 3.7 4.7 4.3
1.2 2012 forecasts and actuals
For 2012, we projected that the total electricity required would be between 12,394-14,673
GWh, and that 11,000-12,000 GWh would come from the existing grid. We also projected
that oil required for thermal power generation would range from a minimum of 600,000
tonnes to a maximum of 700,000 tonnes (about 3-5 million barrels) during the year,
depending upon the availability of the thermal plants and the volatility of the oil price.
Total WAGP gas flow in 2012 was 15,491,670 MMBtu (15,492 mmscf) which was about
half the 2011 supply; 30,524,557.83 MMBtu (30,525 mmscf). Average WAGP gas flow per
day for the period of flow was also lower; 65 mmscfd compared to about 95 mmscfd in 2011.
(see Tables 3 and 4).
Table 3 Average Natural Gas Supply from WAGP in 2012.
Month MMBtu per day mmscfd
January 73,657 74
February 42,589 43
March 61,321 61
April 57,225 57
May 56,914 57
June 48,917 49
July 82,176 82
August 91,684 83
Mean 64,537 65
Assumed 1000 MMBtu = 1mmscf

3
WAGP gas supply was interrupted at the end of August, 2012 following a rapture of the
pipeline in Togolese waters that month. Since then, gas has not flowed to Ghana at the time
of producing this document13
.
Table 4. Grid Electricity and associated fuels: Forecasts and Actuals for 2012.
2011 2012
Forecast Actual
Total Electricity Requirement
(GWh) 12,394-14,673
Grid Electricity
(GWh) 11,200 11,000-12,000 12,164
Percentage hydro
(%) 67.5 66-68 67
System Peak/Maximum Demand*
(MW)*)
1,520-1,665 1,700-1,800 1,729-1871
Mean WAGP gas flow range
(mmscf per day) 94-96 65-75 65
Oil required/consumed
1000 Tonnes
(Million barrels)
260
( 2 )
400-700
(3-5)
704
(5)
WAGP Gas transportation tariff **
US$ per mscf ($ per MMBtu)
4.04-4.17
(3.963-4.065)
4.15-4.27
(4.08-4.19)
4.25
(4.175)
Average price for WAGP Gas***
US$ per mscf ($ per MMBtu)
2.499
(2.454)
2.57-2.60
(2.53-2.55)
2.63
(2.587)
Total delivered gas price **
(other charges included)
US$ per mscf ($ per MMBtu)
6.68-8.14
(6.56-7.99)
8.15-8.9.16
(8-9)
8.34
(8.188)
Average price for light crude oil
purchased for power production
US$ per bbl ($ per MMBtu gas equiv.)
111
(18.90)
120-125
(20.62-21.48)
115
(19.72)
Average price for Brent crude
US$ per bbl ($ per MMBtu gas equiv.)
111
120-130
113
(Global 112)
*Actuals data obtained from GridCo. Low-side is Ghana/local and high-side is total system peak
** Actual data in $/MMBtu courtesy of WAPCo. Low-side for Foundation customers and high-side
for Standard customers. Other charges include delivery fee, ELPS transport fees, insurance, etc.
*** Prices indexed to LCO and negotiated between the buyer and supplier and reviewed every six
months. Actual data in $/MMBtu courtesy of WAPCo. Low-side for Foundation customers and high-
side for Standard customers.
13
Enquiries from WAPCo, January 2013.

4
Global Brent crude price averaged $112 per barrel in 2012. Average price however at which
Ghana purchased the crude hovered around $113 per barrel but fell between $95-102 per
barrel during the summer. In cognisance with the oil price uncertainties during the year, the
Volta River Authority (VRA), the nation’s largest power producer hedged 500,000 barrels of
its crude oil purchases (about one-tenth of its expected procurement for the year) at a price
slightly below $115 per barrel14
.
1.3 Forecast for 2013
Ghana’s real Gross Domestic Product (GDP) growth in 2012 was estimated to drop to
between 7.9-8.5% from a high of 14.4% in 201115
. The dip in the GDP growth was attributed
to slow growth in manufacturing and the utilities subsectors in 2012. Economic experts
project further decrease but modestly high GDP growth of 7.1% for 2013 still largely on
account of improved Jubilee field commercial oil production expected in 201316
.
At such high GDP growth rate, we projected under SNEP (2006-2020)17
that the total
electricity generation18
required for the country in 2013 would be as follows:
19,500-20,210 GWh with VALCO operating at not more than two potlines; and
20,210-24,770 GWh for VALCO to be operating at 4-5 potlines.
The corresponding maximum peak (including suppressed demand) would have been between
1,987-2,556 MW which translates into about 2,500-3,100 MW19
dependable capacity
required.
However, this is not attainable considering the limited installed grid power generation
capacity in the country and also lack of significant potential electricity import (see Table 5).
The technically dependable capacity and the optimum grid power generation available in
2013 is estimated at 2,267 MW and 16,121 GWh respectively (see Table 5). The
corresponding maximum peak (including suppressed demand) would be between 1,800-
2,000 MW. The relatively wide range is due to the high uncertainties in the availability of
adequate gas supply.
14
CAPE3 monthly newsletter on oil and gas in Ghana, June, 2012. www.cape3org.com Bank of Ghana,
Statistical Buletin, December 2012. 15
Ghana Statistical Service (GSS) projected 7.1% whilst other economic think-tanks including CEPA (Centre
for Economic and Policy Analysis) and Ernest & Young projected 8.5% 16
Ernst & Young, 2012Report on Ghana’s economic growth, July11, 2012; Business Monitor International,
Ghana: Business Forecast Report, 4th
Quarter 2012. 17
Strategic National Energy Plan (2006-2020), Energy Commission, available at www.energycom.gov.gh 18
Total electricity generation=grid/public generation + private back-up generation 19
Low-side value if VALCO is shut down; high-side if VALCO is fully in operation.

5
Table 5. Grid Power Generation Capacity available for 2013.
GENERATION PLANT CAPACITY (MW) Plant
Availability
Factor
Expected Energy
(GWh)
Installed Dependable
Hydro Power Plants
Akosombo 1,020 960 0.90 7,568.64
Kpong 160 140 0.90 1,103.76
Bui 130 100 0.90 788.4
Sub-Total 1,310 1,200 9,460.80
Thermal Power Plants20
TAPCO (CC) 330 300 0.70 1,839.6
TICO (SC) 220 200 0.80 1,401.6
Sunon – Asogli (gas) 200 180 0.68 1,072.224
Tema Thermal Plant – TT1PP 110 100 0.85 744.6
Tema Thermal Plant – TT2PP 50 45 0.85 335.07
Takoradi 3 (T3) 132 120 0.50 525.6
Mines Reserve Plant (MRP) 0 35 0.75 229.95
CENIT Energy Ltd 126 120 0.70 735.84
Sub-Total 1,168 1,065 6,654.53
Solar Power Plants
VRA Solar grid-inter-tied 2 2 0.3 5.26
Sub – Total 2 2 5.26
Total 2,480 2,267 ≈16,121
Fuel supply challenge and likely impact on generation
The required supply of natural gas expected from Nigeria through WAGP gas supply this
year, 2013 would worsen due to its interruption at the end of August, 2012 following pirate
activities in the Togolese waters that month. Average supply before the interruption in
August, 2012 was about 65 mmscfd. The pipeline has since been repaired but Ghana is not
likely to see any flows greater than daily average of 40 mmscfd in 2013. Eventual supplies to
the country for the rest of the year would be very erratic. Political and economic
developments in Nigeria are also fuelling a conspiracy theory that gas may hardly flow in
2013, since there seems to be no logic for the said country to let go gas to neighbouring
20
TAPCO is Takoradi Power Company, a combined cycle (CC) thermal plant; TICO is Takoradi International
Power Company, a single cycle (SC) thermal plant

6
countries when there are thermal power plants in that country built but inoperative due to
lack of gas supply to the plants. The Nigerian Commercial Group has so far reneged on their
promise to the extent that supplies since 2011 are yet to reach their contract volumes.
The Sunon-Asogli-plant which is wholly natural gas fuelled has been out of operation since
August 2012 to date.
This has the potential to reduce the projected dependable capacity and available generation
further to about 2,167 MW and 13,459 GWh, unless more efforts are made to augment the
loss in the required gas supply with adequate oil supply (see Table 6).
Table 6. Grid Power Generation Capacity available for 2013 with less gas supply
GENERATION PLANT CAPACITY (MW) Plant
Availability
Factor
Expected Energy
(GWh)
Installed Dependable
Hydro Power Plants
Akosombo 1,020 960 0.94 7568.64
Kpong 160 140 0.90 1103.76
Bui 130 100 0.90 788.4
Sub-Total 1,310 1,200 9,460.80
Thermal Power Plants21
TAPCO (CC) 330 300 0.50 1314.2
TICO (SC) 220 100 0.68 595.68
Sunon – Asogli (gas) 200 180 0.30 473.04
Tema Thermal Plant – TT1PP 110 100 0.50 438
Tema Thermal Plant – TT2PP 50 45 0.30 118.26
Takoradi 3 (T3) 132 120 0.50 525.6
CENIT Energy Ltd 126 120 0.50 525.6
Sub-Total 1,168 1,065 3,990.38
Solar Power Plants
VRA Solar grid-inter-tied 2 2 0.3 5.26
Sub – Total 2 2 5.26
Total 2,480 2,167 ≈13,459
21
TAPCO is Takoradi Power Company, a combined cycle (CC) thermal plant; TICO is Takoradi International
Power Company, a single cycle (SC) thermal plant

7
We however expect Ghana’s own gas from the Jubilee field operations to be available during
the last quarter of 2013.
With these developments, we estimate that the likely average annual gas supply for 2013
would be between 45-50 mmscfd (about 45,000-50,000 MMBtu per day).
We however do not expect the total delivered gas price to fall outside $8-9 per MMBtu. We
expect the average global Brent crude oil price to decline slightly in 2013, falling to $108-
110 per barrel, from $111 per barrel in 2012. The total quantity of oil required in 2013 to
fire the thermal plants would however be about double that of 2012 (see Table 10).
On other hand, we expect the trend of average annual precipitations for 2013 to be higher
than 2012 as this year coincides with the maximum sunspot cycle (solar maximum) of the
sun which is usually associated with higher convection currents and consequently higher
rainfalls. Indications from the Ghana Meteorological Agency22
also corroborate this fact and
that the mean annual rainfall is expected to be higher this year than in 2012. Higher inflows
into the hydropower reservoir would improve the overall power generation in the light of
lower than expected gas supply this year.
1.4 The potential drivers for electricity consumption
Under contemporary circumstances, we project that the potential drivers for electricity
consumption would be the same as in 2012 and are as follow:
Aluminium production should VALCO continue and expand operation;
Industry besides VALCO, largely mining and influenced by gold production;
Other or general Industrial share also growing;
On-going national electrification scheme;
Natural or organic economic expansion; and
Petroleum up-stream and mid-stream activities.
Aluminium production
The Volta Aluminium Company, VALCO is the country’s single largest non-utility customer
when in full operation. The smelter has an installed capacity of 200,000 tonnes of primary
aluminium production at a maximum power demand of 320 Megawatt with five potlines,
22
2013 Meteo forecast, Ghana Meteorological Agency
8
consuming about 2,900 GWh per year. The fifth potline however, has not been fully
available and hence the plant had operated a maximum of four and a half potlines with
maximum production of 180,000 tonnes per annum.
Primary aluminium production in general is energy-intensive. Electricity intensity of
production at VALCO averaged 17 Megawatt-hour per tonne of aluminium in the early
1990s but has improved to the present average of 16.2 Megawatt-hour per tonne. Aluminium
smelting worldwide is very sensitive to electricity pricing and both are highly correlated. At
larger production volumes, high electricity tariffs become cost competitive.
Aluminium has become the world’s second most used metal after iron and is today the single
most important non-ferrous metal. Global demand was about 39 million tonnes in 2010 and
this is projected to exceed 100 million tonnes by 2020 with an estimated annual growth rate
ranging between 6.5-10%23
Global aluminium production in 2011 was almost 44 million
tonnes and demand was projected to reach 49 million tonnes by end of 2012, i.e. last year,
driven largely by surging demand in Asia.
Average world market price of the metal dropped from the range of $2,600-$2,800 per tonne
in 2011 to $2,060-2,127 per tonne in 2012.
The global average price is expected to weaken further this year, i.e. 2013 as a result of
continuous drop in demand in Europe caused by the prevailing economic depression in the
region. Experts project a drop to less than $2,000 per tonne (i.e. $1,800-2,000 per tonne)
from the high range in 2011. Even at this price range and for production of 120,000-160,000
tonnes of aluminium per annum, i.e. operating three-to-four potlines, VALCO would be in
business at a tariff of 4.5-6.5 cents per kWh24
. The downside is that there has not been
enough electricity generation capacity to support VALCO’s operations at that production
level since 2000.
Whenever there had been nationwide supply shortage, VALCO had been forced to curtail
operations. In 2003-2004, the nation experienced nationwide load shedding and VALCO
which then accounted for 26-40% of the total electricity consumption and about 50% of
electricity consumed by industry, was called upon to either shut down or reduce production
significantly. Consequently, VALCO had been almost out of the electricity consumption
share since 2004 except in 2006 when it was made to come on line. Since then it had not
operated beyond two potlines as a result of inadequate power.
For VALCO to operate between two-three potlines, we estimate electricity requirement of
600 GWh for one more potline and 1,200-1,300 GWh for two more potlines in 2013.
23
International Aluminium Institute, https://stats.world-aluminium.org/iai/stats; Alcoa group, www.alcoa.com/
extracted in March, 2011. 24
Aluminium smelter economics is as such that the high the production levels, the easier to operate on higher
tariffs. Refer to SNEP 2006-2020, Annex I of IV, Energy Commission, www.energycom.gov.gh/documents

9
Gold production
Gold surpassed cocoa as the country’s number one foreign exchange earner in the 1990s, and
had accounted for 43-47% of merchandised export earnings since 200625
. Gold which was
around $400 per ounce in 2004 rose to an average of $1,572 per ounce in 2011 and hitting a
record average of $1,668 in 2012 as the precious metal provides safe haven as well as
alternative to the United States dollar (which is said to be losing in value) for investors who
are worried by the general global economic uncertainty particularly of the United States and
also of the Eurozone 26
.
Ghana’s annual gold production increased from 77 tonnes in 2007 to 79.5 tonnes in 2008.
We predicted that it could exceed 80 tonnes in 2010 due to favourable global price and it did,
in fact reaching over 84 tonnes (2.97 million ounces) in 201027
.
Production has climbed to a record 119 tonnes (almost 4.2 million ounces) in 2012, from
about 89 tonnes (almost 3.14 million fine ounces) in 2011 which is unprecedented in modern
Ghana’s gold mining history. Total revenue in 2011 from the commodity was about $5
billion about 30% more over 2010 earnings28
.
Gold production is expected to continue to soar and could hit 127 tonnes (4.5 million ounces)
by the end of 2013 due to upward surge in prices. Also, new mining operations are expected
to add between 300,000-500,00029
ounces in 2013.
Despite the projected surge in production, the global average price is expected to fall below
the 2012’s average price of $1,668 this year, i.e. 2013 as a result of expected improvement in
the U.S economy but also some European economies off-loading some of their gold reserves
unto the world market.
Gold is a rare but precious metal. Global gold output has averaged between 2,500–3,000
tonnes every year since the beginning of the decade. Ghana, ranks as the world’s 10th
– 12th
producer and the second highest on the continent after South Africa.
Four main factors influence gold production technology, particularly, as whether to opt for
surface or underground mining. They are the (i) richness or concentration of the ore; (ii)
production costs, (iii) world market price of gold and (iv) energy price. For most surface
mines in Ghana, the concentration of gold is between 2–3 grammes per tonne of ore,
reducing to 1–2 grammes per tonne for workable tailings. For underground mining,
concentration could go as high as 8–12 grammes per tonne of ore on the average in Obuasi
underground but drops to a range of 3–5 grammes per tonne of ore for other areas of the
25
Bank of Ghana Statistical Bulletin, December, 2012. 26
Bloomberg L.P., 2013. 27
2010 Energy Outlook, Energy Commission. 28
Bank of Ghana Statistical bulletin October 2012; http://goldprice.org 29
Newmont’s second gold mine at Akyem is expected to start commercial production in 2013 with as much as
450,000 ounces annually. BullionStreet, 2013

10
country. In general for any given mining area, the ore is richer as one goes deeper
underground.
Electricity consumption for underground operations is about three times that for surface
mining operations. Electricity intensity of surface gold mining in the country is 8-9 GWh per
tonne of gold whilst underground mining requires between 28-29 GWh per tonne of gold 30
.
Electricity supply for surface mining is mainly for pumping and grinding of the ore. For
underground mining, besides pumping and grinding, electricity is required for operating the
transport-elevators, drilling, air-conditioning and ventilation.
The general observation is that the ambient temperature increases by 10 degrees Celsius for
every kilometre below the surface of the earth.
Most operations thus shift from underground to surface mining, when cost of electricity per
production of ounce of gold exceeds about 10 percent of the prevailing world market price of
gold. The benchmark is for energy cost per production not to exceed 20%. Surface mining is
a less expensive technology but has more serious environmental consequences for
surrounding communities and the nation as a whole.
Fortunately, at the prevailing global market price of gold, exceeding $1,400 per ounce, the
20% energy cost benchmark is not exceeded even for diesel oil prices averaging $140 per
barrel and electricity tariff below 20 US cents per kWh. We thus project deep or underground
mining operations to increase or potentially double this year, particularly at Obuasi, Tarkwa
and Prestea mines, the latter which had been moribund for the past years.
For the additional or marginal production of about (300,000-450,000 ounces) 8-10 tonnes
new gold expected in 2013, we forecast a range 232-450 GWh where the low-side represent
half production from surface mining and half of production from deep or underground
mining whilst the high-side representing half production from surface mining about full
production from deep or underground mining.
Other Industries31
The share of electricity supplied to the industrial sector (VALCO inclusive) has shown wide
variability since 2000 and indeed it was the sector most severely affected during the load
shedding in 2003-2004 and 2007 (see Table 7)32
.
The shares of electricity supplied to the industrial (VALCO inclusive) and the Non-
residential comprising Commercial & Service sectors for the past three years had shown
increasing trends whilst share of supply to the Residential Sector had seemingly decreased.
30
SNEP 2006-2020, Volume 1, Energy Commission, 2006. page 34. (point 160) 31
Industry other than VALCO and Gold Mining. 32
The country underwent a nationwide load shedding from 2002-2004 due to low inflows into the Volta
reservoir which culminated into reduced generation (about one-third to half capacity less) from the nation’s
hydropower.

11
Table 7 shows final electricity reaching the demand sectors.
Table 7. Grid Electricity supply, share and growth to the Demand Sectors since 2000.
YEAR
DEMAND SECTORS
Industry Non Residential Residential Total
1000 GWh
%
Share % Gr
1000 GWh
%
share % Gr
1000 GWh
%
share % Gr
1000 GWh
% Gr
2000 4.31 68.0 0 0.55 8.7 0 1.49 23.5 0 6.34 0
2001 4.33 66.4 0.5 0.58 8.7 5.5 1.61 24.7 8.1 6.53 3.0
2002 3.90 63.2 -9.9 0.60 9.8 3.4 1.67 27.1 3.7 6.17 -5.5
2003 2.21 48.6 -43.3 0.62 13.6 3.3 1,73 38.0 3.6 4.55 -26.3
2004 2.03 448 -8.1 0.66 14.6 6.5 1.78 39.3 2.9 4.53 -0.4
2005 2.54 49.2 25.1 0.70 13.6 6.1 1.92 37.2 7.5 5.16 13.9
2006 3.59 55.1 41.3 0.79 12.1 12.9 2.13 32.7 10.9 6.51 26.2
2007 2.70 48.3 -25.0 0. 80 14.3 1.3 2.10 37.6 -1.4 5.59 -14.1
2008 2.97 48.2 10.0 0.93 15.1 16.3 2.27 36.9 8.1 6.16 10.2
2009 2.94 47.2 -1.0 0.88 14.1 -5.4 2.41 38.7 6.2 6,23 1.1
2010 3.16 46.1 7.5 0.97 14.1 10.2 2.74 39.9 13.7 6.86 10.1
2011 3.90 48.9 23.4 1.31 16.4 36.1 2.76 34.6 0.7 7.98 16.3
2012 4.20 51.9 7.7 1.30 16.0 -0.8 2.60 32.1 -5.8 8.10 1.5
Mean Growth33
2.2 7.3 4.5 2.8
Note: Gr is growth rate
As VALCO’s power consumption share continued to drop over the years, the Mining
subsector of Industry which is dominated by gold mining and the Other industries34
have
taken over with the latter maintaining the largest share (see Table 8).
Table 8. Industrial Sector Grid Electricity supply and shares since 2000.
YEAR
INDUSTRY SECTOR
VALCO MINES OTHER INDUSTRIES
(i.e. less VALCO less MINES)
1000 GWh
%
Share of
Industry
% Share
of Total
Electricity
1000 GWh
%
Share of
Industry
% Share
of Total
Electricity
1000 GWh
%
Share of
Industry
% Share of
Total
Electricity
2000 2.50 58.0 39.4 0.63 14.6 9.9 1.17 27.1 18.5
2001 2.56 59.1 39.2 0.57 13.2 8.7 1.20 27.7 18.4
2002 2.06 52.8 33.4 0.56 14.4 9.1 1.28 32.8 20.7
2003 0.25 11.3 5.5 0.57 25.8 12.5 1.38 62.4 30.3
2004 0.01 0.5 0.2 0.60 29.6 13.2 1.42 70.0 31.3
2005 0.26 10.2 5.0 0.75 29.5 14.5 1.53 60.2 29.7
2006 1.20 33.4 18.4 0.87 24.2 13.4 1.52 42.3 23.3
2007 0.21 7.8 3.8 1.00 37.0 17.9 1.48 54.8 26.5
2008 0.17 5.7 2.8 1.14 38.4 18.5 1.65 55.6 26.8
2009 0.01 0.8 0.2 1.25 42.5 20.1 1.66 56.5 26.6
2010 0.01 0.3 0.1 1.24 39.2 18.1 1.91 60.4 27.8
2011 0.60 15.4 7.5 1.30 33.3 16.3 2.00 51.3 25.1
2012 0.60 14.3 7.4 1.40 33.3 17.3 2.20 52.4 27.2
33
Average growth based on geometric mean which is more appropriate than the arithmetic mean for describing
proportional growth 34
i.e. excluding the mines, besides VALCO.

12
We estimate a net electricity requirement of 320-350 GWh for 2013 based on the 2000-2012
growth and that of 2011-2012 growth of the Other Industries.
National Electrification Scheme
The Ministry of Energy in 1989 instituted the National Electrification Scheme (NES) as
Government’s principal policy to extend electricity to all parts of the country over a 30-year
period from 1990-2020.
643 communities were connected to the national grid in 2012, bringing to the total of
communities connected nationally to about 5,500 and a national average coverage of about
72% as of December 2012, just as in 2011 due to population growth catching up with the rate
of electrification35
. All regional and district capitals have been connected to the national grid.
According to the Ministry of Energy, over 3,000 communities earmarked for electrification
since 2011 would continue. Also, funding arrangement had been secured for about 2,000
communities earmarked for electrification in 2013 and beyond.
However, as it had been since 2011, it is not likely that all earmarked communities would be
connected to the grid in 2013. We have therefore maintained the national average residential
electricity consumption rate from 2000-2010 as the minimum growth rate and the
consumption growth rate between 2009-2011 as maximum as used in the 2012 Energy
Outlook, we thus estimate a net electricity requirement of 172-375 GWh for 2013, as a result
of the National Electrification Scheme.
Natural or organic economic growth
Allowing for natural demand growth due the expansion of the economy, using national
electricity growth from 2000-2012 as maximum and growth between 2011-2012 as
minimum, we estimate additional 122-978 GWh to be required.
Petroleum Up-stream and Mid-stream activities
The petroleum upstream covers offshore FPSO36
vessel operations which involves the
production of oil and gas from the Jubilee field. The midstream operations cover the gas
evacuation through an undersea pipeline to the processing plant which would receive the
associated natural gas from the Jubilee field in the Tano (Western) Basin and process it into
lean gas, LPG and other condensates.
The oil production upstream requires between 15-40MW a day for its operations. This is
expected to increase to 50-60MW when oil production reaches 120,000 barrels a day.
Electricity consumption on the drilling ship is between 300-400 GWh per annum but the fuel
supply is natural gas directly from the oil operations offshore. Construction of the gas
processing plant is expected to ramp up in early 2013 to ensure completion by end of third
35
Ministry of Energy, Power Sector, National Electrification Scheme, 2011, www.energymin.gov.gh 36
Floating, Production, Storage and Off-loading vessel.

13
quarter of the year. This would require between 100-200 GWh annually for its major
welding and utility operations until completion.
Energy Efficiency and Conservation measures
In order to ameliorate the challenging electricity demand and supply imbalance facing the
country, the Energy Commission has already put in place conservation measures and
programmes that have resulted in significant reduction of the electricity system load over the
years.
In 2009, automatic capacitor banks were installed in six public institutions, leading to a total
estimated savings of 1,851kVA by this intervention. The second phase involving 26 selected
public institutions across the country could not be implementation in 2012 for technical
reasons but would be implemented and completed in 2013 with expected savings estimated at
1875kVA or about 15 GWh.
In the last quarter of 2011, the Energy Commission commenced the Refrigerator Energy
Efficiency project which would run up to 2014. The project intends to introduce very
efficient refrigerators into the economy with the potential of reducing electricity consumption
in refrigerators by 50% in the medium term. It is targeting over two million inefficient
refrigerators in use in the country each consuming on the average 1,200kWh per year as
against 250kWh per year for very efficient ones. In the short term, the project is targeting
about 15,000 refrigerators by mid 2014 with estimated savings of about 8 GWh.
Table 9 presents the summary of the additional electricity requirement to top up the 2012
production in order the meet that of 2013.
Table 9. Summary of estimates for additional electricity requirement for 2013.
Demand Drivers Minimum Maximum
VALCO One more Potline Two more Potlines
600 GWh 1,200 – 1300 GWh
Gold mining Surface mining Deep mining
200-232 GWh 400-450 GWh
Other Industries 320 350
National
Electrification
172 GWh 375 GWh
Natural GDP
growth
National Average 2000-2012
electricity growth
2010-2012 electricity
growth
121 GWh 978 GWh
Gas processing
construction
100 GWh 200 GWh
Demand-side
management
-10 -23
Total 1,503-1,535 3,480-3,630

14
Summary of forecast for the power sector for 2013 is as follows (see Table 10):
Table 10. Summary of Power Sector forecast for 2013
Total electricity requirement
(VALCO at 3-4 potlines in brackets)
GWh
13,667-15,794
(16,100-19,500)
Likely grid electricity supply
GWh 13,459-16,121
Percentage Hydropower
% 58-68
37
Shortfall in capacity for reserve margin
MW 350-450
System Peak/Maximum Demand
(VALCO at 3-4 potlines in brackets)
MW
1,800-1,900
(1,987-2,500)
Expected Mean Annual WAGP gas flow rate
MMBtu per day (mmscf per day)
45,000-50,000
(45-50)
WAGP Gas transportation tariff **
$ per MMBtu ($ per mscf)
4.17-4.30
(4.19-4.32)
Average price for WAGP Gas (cif) **
$ per MMBtu ($ per mscf)
2.58-2.59
(2.60-2.62)
Total delivery price of gas
$ per MMBtu ($ per mscf)
8.50-9.00
(8.66-9.17)
Optimum crude oil (LCO) requirement
Million barrels (kilotonnes) 8-9 (1,158-1,250)
Average price for light crude oil dedicated for
power production
$ per bbl ($ per MMBtu)
100-102
(~17-18)
Average price for Brent crude $ per bbl ($ per MMBtu)
108-110
(~18-19)
**Low-side is for foundation customers and high-side for standard customers.
37
Depending upon availability of less expensive fuel which is natural gas.

15
2.0 Petroleum Subsector: Oil
2.1 Overview of petroleum supply in 2012
Saltpond field
Total oil production from the Saltpond field in 2012 was about 105,000 barrels with daily
and monthly productions averaging about 290 and 8,800 barrels respectively. The trend from
the previous years might be an indication that either the field has matured or drying up” (see
Figure 1).
Jubilee field
Total oil production from the Jubilee field in 2012 on the other hand was 27.4 million barrels
compared with 23.8 million barrels in 2011, an increase of 15% over the previous year.
-
5,000
10,000
15,000
20,000
25,000
30,000
Jan
-06
Ap
r-0
6Ju
l-0
6O
ct-0
6Ja
n-0
7A
pr-
07
Jul-
07
Oct
-07
Jan
-08
Ap
r-0
8Ju
l-0
8O
ct-0
8Ja
n-0
9A
pr-
09
Jul-
09
Oct
-09
Jan
-10
Ap
r-1
0Ju
l-1
0O
ct-1
0Ja
n-1
1A
pr-
11
Jul-
11
Oct
-11
Jan
-12
Ap
r-1
2Ju
l-1
2O
ct-1
2
MONTHLY PRODUCTION
Figure 1. Trend of Saltpond field oil production since 2006
16
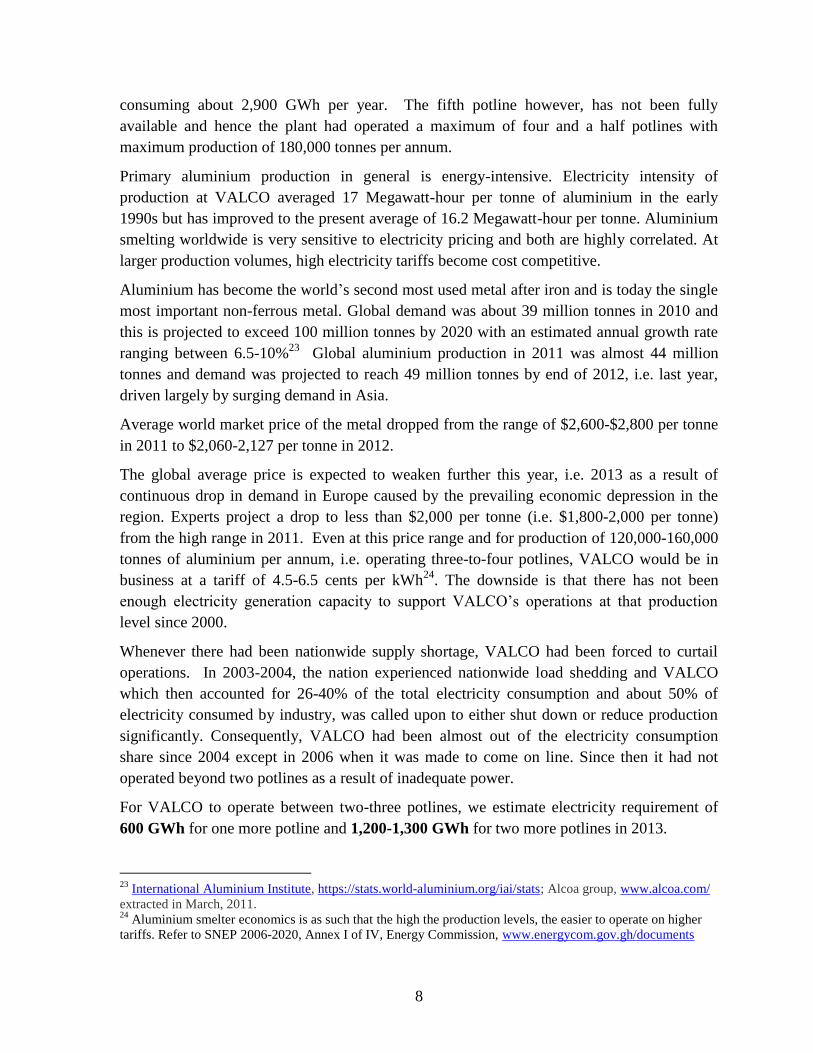
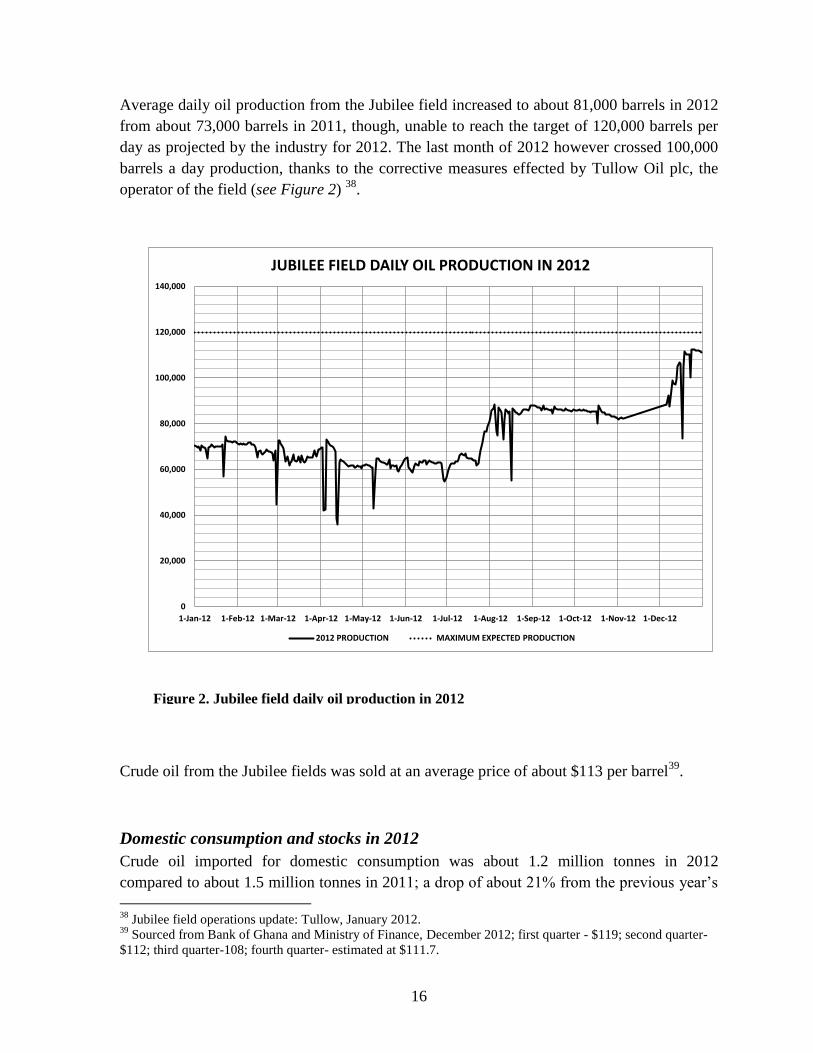
Average daily oil production from the Jubilee field increased to about 81,000 barrels in 2012
from about 73,000 barrels in 2011, though, unable to reach the target of 120,000 barrels per
day as projected by the industry for 2012. The last month of 2012 however crossed 100,000
barrels a day production, thanks to the corrective measures effected by Tullow Oil plc, the
operator of the field (see Figure 2) 38
.
Crude oil from the Jubilee fields was sold at an average price of about $113 per barrel39
.
Domestic consumption and stocks in 2012
Crude oil imported for domestic consumption was about 1.2 million tonnes in 2012
compared to about 1.5 million tonnes in 2011; a drop of about 21% from the previous year’s
38
Jubilee field operations update: Tullow, January 2012. 39
Sourced from Bank of Ghana and Ministry of Finance, December 2012; first quarter - $119; second quarter-
$112; third quarter-108; fourth quarter- estimated at $111.7.
0
20,000
40,000
60,000
80,000
100,000
120,000
140,000
1-Jan-12 1-Feb-12 1-Mar-12 1-Apr-12 1-May-12 1-Jun-12 1-Jul-12 1-Aug-12 1-Sep-12 1-Oct-12 1-Nov-12 1-Dec-12
JUBILEE FIELD DAILY OIL PRODUCTION IN 2012
2012 PRODUCTION MAXIMUM EXPECTED PRODUCTION
Figure 2. Jubilee field daily oil production in 2012

17
and also a drop of about 27% from 2010. Electricity production accounted for 58.2% of the
crude oil consumption whilst primary refinery operations accounted for the remaining 41.8%.
Monthly average prices of crude oil sourced by Ghana in 2012 was within $124-126 per
barrel between February and April but dropped to below $110 per barrel between May and
July of the year; it was about $96 per barrel in June.
Table 11 compares the Ghanaian sourced oil prices and those of West Texas Intermediate
(WTI) representing the United States and the London Brent representing Europe.
Table 11. Average crude oil prices in Ghana, United States (Gulf Coast), and Europe (the
North Sea).
Year
Ghana WTI
Gulf Coast/
United States
Brent Crude
North Sea/
United Kingdom
U.S dollars per barrel
2010 80 79.4 70
2011 111 94.9 111
2012 113 93.3 112 Source: Bank of Ghana, LondonGasPrice.com, tradingnrg.com
Total products consumed in 2012 amounted to about 3.2 million tonnes, about 14% over
2011 (see Table 12). 40
Table 12. Petroleum product consumption for 2012
PETROLEUM
PRODUCT
2010 2011 2012
CHANGE
b/n 2010
& 2011
b/n 2011
& 2012
1000 tonnes Percentage
LPG 178.4 214.4 268.5 20.2 25.2
Gasoline 737.8 807 992.7 9.4 23.0
Premix 32.4 45.5 58.9 40.4 29.5
Kerosene 49.3 62.4 45.6 26.6 -26.9
ATK 108.4 135.3 141.3 24.8 4.4
Gas oil/diesel 1,271.90 1,511.5 1,665 18.8 10.2
RFO 30.9 37.5 33.5 21.4 -10.7
Total 2,409.10 2,813.70 3,205.50 16.8 13.9
Source: National Petroleum Authority, 2012.
40
Stocks from the previous year but held by the oil marketing companies might have added up to the supply in
the year to make up the total consumption.

18
The three highest movers in 2012 were premix gasoline, LPG and gasoline; whilst 2011 had
premix gasoline, kerosene and ATK as the highest movers.
Petroleum products imported in 2012 were about 2.5 million tonnes, an increase of about
17.5% over imports in 2011. Growth in gasoline and diesel oil imports dropped from 25%
and 38% respectively in 2011 to about 14% and 9% respectively in 2012. The highest
imported product dual purpose kerosene (DPK) which went up from 17,500 tonnes in 2011
to about 115,000 tonnes in 2012 most probably due to the growth of the domestic aviation
industry.
Total oil products supplied (comprising local production and imports) to the economy
continued to show an upward trend; it was about 2.4 million tonnes in 2012 compared to 2.3
million in 2011 but continued to lag behind consumption (see Figure 3). Products exported
were largely marine gas oil (MGO) sold to foreign vessels, aviation fuel sold to international
airlines and heavy gasoline and designer-gasoline formulations. Total product exports
dropped from 746,400 tonnes in 2011 to 533,900 tonnes in 201241
.
41
such as “V-power” marketed by one of the major oil marketers.
Figure 3.Total oil products supplied from 2000 - 2012
0.00
500.00
1,000.00
1,500.00
2,000.00
2,500.00
3,000.00
3,500.00
2000 2001 2002 2003 2004 2005 2006 2007 2008 2009 2010 2011 2012
Total Supply Import Export Consumption
YEARS
TOTAL SUPPLY, EXPORT, IMPORT AND CONSUMPTION FROM 2000 TO 2012

19
Total national petroleum stocks or inventories in December, 2012 averaged 120,000 tonnes
per week compared to 224,880 tonnes the previous year (see Table 13).
Table 13. National petroleum stocks as at 19 December, 2011 and 17 December, 2012.
OIL AND
PRODUCTS
STOCKS* Estimated weeks to last according
to NPA
2011 2012 2011 2012
Tonnes
Crude oil 0 0 0 0
Gasoline 104,414 33,898 5.8 1.5
Premix 740 745 8.5 0.6 (~4 days)
Kerosene 2,902 1,048 2.6 1.3
ATK 8,785 10,640 3.0 3.8
Gas oil 104,539 60,164 3.5 1.8
LPG 3,500 4,700 0.7 (4-5 days) 0.8 (5-6 days)
Total 224,880 111,195 *Nearest whole number; NA – Data Not available
NPA-National Petroleum Authority; EC-Energy Commission
Data adapted from NPA source.
Fuel supply security and erratic fuel prices have advised countries to set up strategic stocks
both for crude oil and refined products. Most developed countries, for instance, the OECD42
members have agreed on a minimum of six months of strategic stocks.
Ghana decided on a similar measure in the 1990s and is supposed to maintain three weeks of
strategic stocks of refined products on the average but from the above (see Table 13) the
situation seems to becoming more challenging. Among the long term strategy recommended
under the SNEP 2006-2020 was to expand the strategic stock to include crude oil but the
country still keeps zero strategic stocks of crude.
Most gasoline formulas when bought from open market are cracked petroleum products,
meaning coming from the cracker units of refinery instead of straight-runs. Cracked gasoline
and products have relatively short lifespan, usually not more than three months compared to
straight-run products. This also means such cracked products must be used within three
months of their storage to avoid gum formation. Straight-run gasoline and products last
longer but more expensive. Crude oil storage however has the comparative advantage of
longer lifespan than the products.
42
OECD is Organisation for Economic Cooperation and Development.

20
2.2 2012 forecast and actuals
Table 14 presents the forecast and the actuals for 2012.
Table 14. Yearly average crude oil prices for 2012: Forecast and Actuals
Ghana WTI
Gulf Coast/
United States
Brent Crude
North Sea/
United Kingdom
Forecast 120-130 100-106 120-130
Actual 113 93.3 112 Source: Bank of Ghana, www.LondonGasPrice.com, www.tradingnrg.com
Ghana’s total crude oil import in 2012 was 1.21 million tonnes and as usual came largely
from Nigeria (an OPEC country).
Crude oil for refinery operation continued to dwindle since 2010. Just about 506,000 tonnes
were refined at Tema Oil Refinery (TOR) in 2012 compared to the local refinery capacity of
about two (2) million tonnes per annum. In 2011, about the one (1) million tonnes of oil was
refined at TOR. In addition, the 2012 crude for refinery operations was far lower than
expected in the light of our forecast of 1.6-1.9 million tonnes (12-14 million barrels) as
required for 2012.
Except for diesel, our forecasts for 2012 were within actual products supplied to the economy
(see Table 15).
Despite improvement in our oil product forecast for 2012, shortages of LPG were apparent
during the year, though somehow better than in 2011. Demand for LPG would continue to
43
In this analysis, products supplied to the economy were assumed to be consumed.
Table 15. Comparing major petroleum products consumption in Ghana in 2011 and 201243
PRODUCTS
2011 CONSUMPTION 2012 CONSUMPTION
1000 Tonnes Net /shortfall 1000 Tonnes Net /shortfall
Forecast Actual 1000 Tonnes Forecast Actual 1000 Tonnes
Gasoline 800-850 852.2 2.2 850 - 870 992.7 122-143
Diesel 1,600-1,700 1,511.5 (88.5-188.5) 1,600 - 1,700 1,361.3 239-339
Kerosene
/ATK 250-300 197.7 (52.3-102.3) 200 - 230 214 14-16
LPG 220-250 214.5 (5.5-35.5) 250 - 300 268.5 18.5-31.5
Total 2,820-3,050 2,775.9 (146.3-236.3) 2,900 3,100 2,836.5 63,5-263.5
NB: Total diesel consumption includes sales to the mining companies and bunkering.
Total gasoline consumption includes premix and other premium formulations.
Petroleum supply shortfall in brackets- red

21
grow considering the seemingly large number of vehicles switch from gasoline to LPG (see
Figures 4 and 5).
Significant increases in retail prices of LPG might have once again helped in retarding its
vehicular consumption.
-
10,000
20,000
30,000
40,000
50,000
60,000
70,000
80,000
90,000
100,000
Household Transport Commercial and Services
2000
2010
Figure 4. LPG consumption in tonnes for 2000 and 2010
LPG Consumption Share LPG Consumption Share
Figure 5. LPG consumption shares for 2000 and 2010
22
Household fuel use
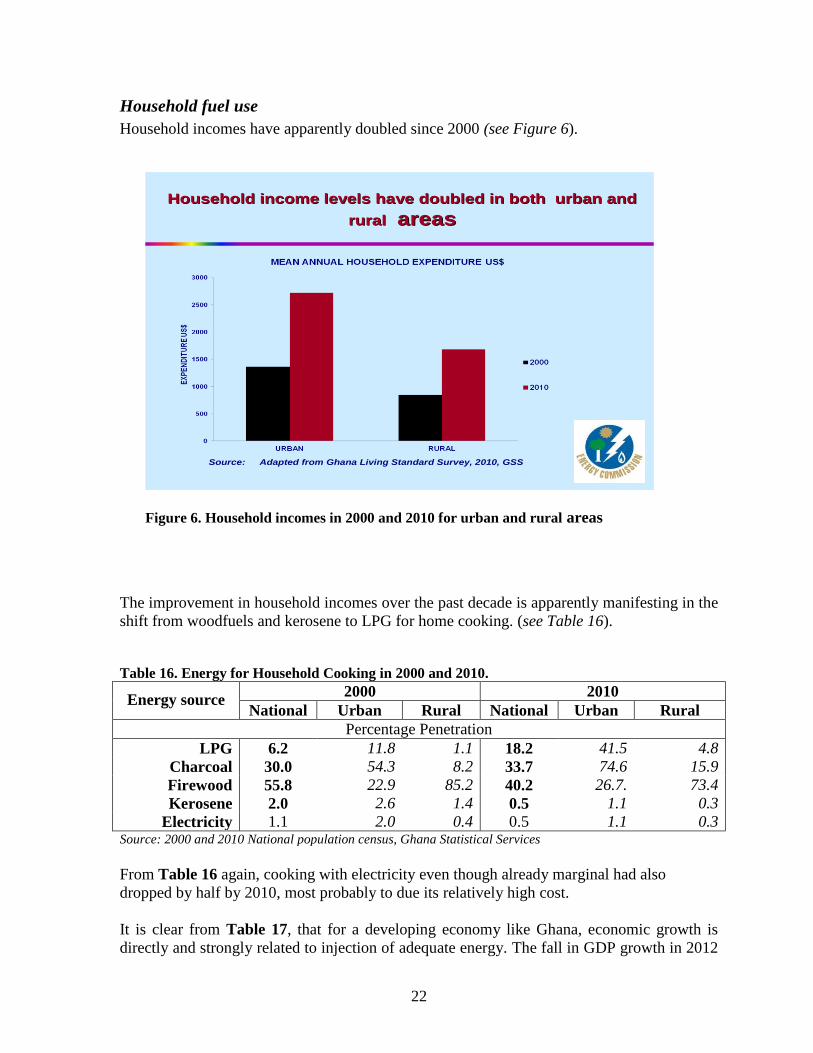
Household incomes have apparently doubled since 2000 (see Figure 6).
The improvement in household incomes over the past decade is apparently manifesting in the
shift from woodfuels and kerosene to LPG for home cooking. (see Table 16).
Table 16. Energy for Household Cooking in 2000 and 2010.
Energy source 2000 2010
National Urban Rural National Urban Rural
Percentage Penetration
LPG 6.2 11.8 1.1 18.2 41.5 4.8
Charcoal 30.0 54.3 8.2 33.7 74.6 15.9
Firewood 55.8 22.9 85.2 40.2 26.7. 73.4
Kerosene 2.0 2.6 1.4 0.5 1.1 0.3
Electricity 1.1 2.0 0.4 0.5 1.1 0.3 Source: 2000 and 2010 National population census, Ghana Statistical Services
From Table 16 again, cooking with electricity even though already marginal had also
dropped by half by 2010, most probably to due its relatively high cost.
It is clear from Table 17, that for a developing economy like Ghana, economic growth is
directly and strongly related to injection of adequate energy. The fall in GDP growth in 2012
Household income levels have doubled in both urban and Household income levels have doubled in both urban and
rural rural areas areas
Source: Adapted from Ghana Living Standard Survey, 2010, GSS
Figure 6. Household incomes in 2000 and 2010 for urban and rural areas

23
had been attributed to the fall in oil production and subsequently revenues from it compared
to 2011.
Table 17. Ghana’s Oil Imports, costs and GDP growth compared
Year
Crude oil
imported
(million
tonnes)
Products
imported
(1000 tonnes)
Petroleum
imported in
US$1000 (cif)
Average
Crude
oil price
Real GDP at
2006 constant
prices
Million
GH Cedis
Real GDP
growth
Rate
2006 1.71 906 1,686 66 18,705 6.4%
2007 2.05 1,200 2,145 73 19,913 5.7%
2008 1.98 1,096 2,413 98 21,592 7.3%
2009 0.98 1,890 1,472 62 22,598 6.3%
2010 1.66 1,450 2,134 80 25,129 8%
2011 1.53 2,075 3,159 111 29, 100* 14.4%
(Non-oil:8%)
2012 1.21 2,478 >3,200* 113 31,500* *7.9-8.1%
* Estimated
Data source: Ghana in figures, GSS-2008, Bank of Ghana, December 2012, Ghana Statistical Services, 2013
Inadequate natural gas for power generation would demand increase in oil supply as the most
viable option. Oil is however about two-three times more expensive than gas. Thus without
adequate revenues to augment the oil supply for public/grid electricity generation, private
generation largely via gensets would rise with corresponding increase in diesel requirement.
With the projected in drop in gold prices and the insufficient and relatively high cost of
power in 2013, GDP growth for 2013 is likely to slow down further compared to 2011.
2.3 Forecast for 2013
The year 2012 was faced with the aftermath of the Fukushima (Japan) energy crisis. The
Arab Spring which started two years ago has apparently died except for the Syrian crisis
which is still on-going and in the forefront. Following closely is the Iranian nuclear crisis.
Military experts speculation that there could be a war between Israel and Iran in 2012 even
tough did not materialise, the threat is not entirely gone. Impact of geopolitics is still relevant
in 2013, so also are the rising oil production costs, such as rising labour and material costs,
and the shift to increasingly challenging operating areas, such as the deep- and ultra- deep-
waters as in the Jubilee fields, which have emerged recently as factors in the increasing
record oil price levels since 2011.
The main driver for oil forecast in 2013 therefore is still going to be a mix of geopolitics and
petroleum demand supply fundamentals, including the speculation factor due to trade in
oil futures. The challenge is in determining the right balance.
24
Geopolitical issues moved to the top of the energy agenda with the start of the political unrest
across the Middle East and North Africa in 2011. Similar geo-energy events in 1971 led to
nationalization of many international oil companies and the events associated with the
Iranian revolution in 1979 led to dramatic increases in oil prices. Thus supply security,
geopolitical sensitivity, price volatility would occupy the energy agenda for this year too and
would serve as fuel for oil and commodity price speculation.
The Syrian crisis somehow is overshadowing the Iranian crisis, but in terms of influence on
the petroleum industry, the county is nowhere near Iran. Iran produces between 4-6% of the
global oil and gas supplies. She has about 10% of the world’s proven oil reserves and 15-
16% of the global gas reserves44
. The country geographically controls the Strait of Hormuz,
the sole maritime link between the oil-rich Persian Gulf region and the rest of the world45
.
Tankers carrying an average of 17 million barrels of oil a day from Iraq, Kuwait, Qatar,
Saudi Arabia and UAE besides Iran itself, representing about 20% of the global daily supply
pass through this vital artery. Any conflict between Israel and Iran could compel the latter to
attempt to block the strait and some analysts believe that any sustained blockage could
trigger a 30-50% increase in the price of oil and could also trigger a full-scale global
recession or depression. The standoff conflict over the Iran’s nuclear crisis would try to
maintain the high prices of crudes by close of 2013. IMF projects that oil prices may increase
by 30% if supplies from Iran are disrupted.
The South China Sea is a semi-enclosed portion of the Western Pacific bounded by China to
the north, Vietnam to the west, the Philippines to the east and the island of Borneo (shared by
Brunei, Indonesia and Malaysia) to the south. Long an important fishing ground as well as
commercial shipping routes has been transformed into a cockpit of international friction with
the discovery of large oil and gas deposits. Some islands in this energy-rich area are claimed
by each of the surrounding countries, including China which claims them all, and has
demonstrated a willingness to use military force to assert dominance in the region.
Even though, South China Sea seems remote from Ghana, the global crude oil demand
currently would continue to be driven by Asia’s demand which has been responsible for 70%
of the world energy growth in the past 10-15 years and in which China was responsible for
40% of it. Opposing sides have been flexing their muscles through war of words and war
games comprising series of conspicuous military exercises have been conducted in seemingly
readiness against each other, particularly with the smaller countries forming alliances and
receiving backing from the United States against China. Should the conflict intensify, it can
affect the global demand for crude oil.
44
Syria on the other hand has just about 0.2% of the global oil and gas reserves; contributes just 0.3% of the
global oil supplies. 45
We would encourage readers to check for Strait of Hormuz and the South China Sea from any available
global map to save space.

25
Troubled waters of Africa: Political instability in the horn of Africa, particularly in Somalia
generated high rate of piracy in the Gulf of Eden during the last decade which seriously
hampered maritime trade including oil cargoes through the Gulf. Piracy levels have greatly
reduced thanks to the multi-national naval intervention that was launched in the gulf. The
International Maritime Authority46
has however reported that pirate activities have apparently
shifted to West African waters since the beginning of this decade and have exceeded events
in the Gulf of Eden. One may recall that the WAGP gas supply was interrupted at the end of
August, 2012 following pirate activities in the Togolese waters that month which was said to
have caused destruction to a section of the pipeline underneath the Togolese waters. Should
the maritime environment be allowed to deteriorate, it would impact to some extent on
shipment fees and insurance premium on oil cargoes and consequently global demand and
price since the West coast accounts for about 3% of global oil production and shipment.
Shipments to Ghana being part of the West coast is likely to be significantly impacted.
Irrespective however of the geopolitical events, demand and supply fundamentals still serve
as the major drivers for crude oil price volatility. We elaborate the oil and gas fundamentals
as follows:
i. Global demand growth: Global oil consumption increased from about 88 million
barrels per day in 2011 to an average of 89.6 million barrels per day in 2012 despite
its relatively high cost and the escalating tensions in the Middle East47
.. The world
economy is expected to expand by 3.6% in 2013 from 3.3% in 2012, a mere 0.3
percentage point increase over the previous year, which is largely due to economic
contraction in the Eurozone48
.
Consumption in 2013 is therefore expected to be at an average of 90.5 million barrels
per day, down from 90.6-90.7 million barrels per day previously forecasted by other
major experts49
.
Higher oil forecast is made for Japan due to the Fukushima nuclear power accident
which knocked out about 2% from her entire power capacity of 279 GW. Japan's
nuclear disaster has also influenced demand for energy in the Far East. The obvious
alternative to nuclear in Japan in the short to medium term is thermal plants for power
and fuel oil for heating. This means the country would have to buy more LNG
(liquefied natural gas), oil and coal to make up the nuclear energy loss. These could
push up the price of oil and natural gas consequently.
ii. U.S. economy: Despite the economic downturn, the United States is still the largest
and the most important economy in the world and was still responsible for about 20%
of the global economy in 2012 as in 2011. The economy was projected to grow by
46
International Maritime Authority, 2012 Annual Report, published, 2013. 47
89.9 million by IEA 2011 Market report, February 2012. 48
IMF January Update, 2012. 49
IEA Oil Market report, 2013; U.S EIA 2013 Short term Energy Outlook, March 2013.

26
1.8% in 2012 but expanded 2.2%. IMF has revised downwards its projection for U.S
GDP growth from 2% to 1.7% for 2013, even though the US administration is
maintaining its forecast of 2.4% for the country for this year. Experts forecast an
average crude oil price range of $107-109 per barrel for Brent and $92-97 per barrel
for West Texas Intermediate (WTI)50.
iii. Euro-zone economic quakes: The Euro-zone economy which is a key player in
consuming crude oil is as large as that of the United States and for that matter equally
important comprising about 21% of the global economy. However, it is still
threatened by economic and political events in southern Europe, namely Greece,
Spain, Italy, Portugal and Cyprus. Europe is also directly and more affected by the
geopolitical events in the Middle East and North Africa, since it gets most of its
supplies from the affected regions than the United States. In line with the weak
economic outlook, European oil demand is expected to decline further in 2013.
Experts estimate an average Brent crude price in Europe to range from $107 -109 per barrel
for most part of 2013, depending upon OECD51
member countries’ interventions using their
strategic reserve stocks.
Meeting the global demand: The market would need between 800,000-900,000
barrels a day extra to meet the global demand in 2013. Meeting this excess demand
would come from production in OPEC and Non-OPEC countries as well as existing
inventories and strategic stocks just as in the previous years. Significant growth in
supply is expected to occur in Iraq, Caucuses region of Russia, China and West
Africa. Libya and South Sudan are also expected to contribute significantly to the
global supply, with the apparent return of peace to their countries after last year’s
political crisis. Production in North America would continue to increase with growing
production from onshore shale formations and the Canadian tar oil sands.
Global oil production share is expected to be 41% coming from OPEC, 11% coming
from Russia, 13% from the United States and the remaining 35% coming from the
remaining Non-OPEC countries52
.
iv. Total supply from OPEC countries was projected to decline in 2012 due to the
prevailing crisis in the region, but rather increased from about 25 million barrels a
day to 30 million barrels a day in the year53
. In fact, its production quota rose to about
31 million barrels per day in January 2012, the highest since 2008 ostensibly to take
advantage of the prevailing high oil prices.
OPEC is responsible for about 40% of the world crude oil supply. Its members serve
as the “swing” producers in the world market, since they largely possess surplus or
50
BMI, January 2013; US EIA February, 2013 51
Organisation for Economic Cooperation and Development usually referred to as rich countries’ club. 52
BMI Global Oil & Gas news, January, 2013. 53
The quota was set in 2008 by OPEC. www.opec.org.

27
“spare” oil production capacity estimated at 2.82 million barrels a day by close of
2011. OPEC maintains a production quota of 24.845 million barrels a day54
.
Increasing prices however means more revenue for producing countries and for that
matter plays into the interest of some of the member countries. Therefore at a meeting
in December 2012, the cartel decided to keep production capped at a three-year high
of 30 million barrels per day.
Iraqi exports would compensate for any potential drop in supply from Iran and
Venezuela.
v. Price speculation due to activities of traders in oil futures cannot be ignored,
unscientific, though. Current fundamentals could place the global oil price range to
between US$80-90 per barrel but speculation is estimated to account for 20-26% of
the current world market oil price range 55
.
Experts speculate that the prevailing uphill prices are not sustainable and could send the
fragile global economy into recession as occurred in 2008.
Therefore, in order to curb the increasing prices, we expect interventions from OECD
countries56
and perhaps from major OPEC members like Saudi Arabia which has adequate
spare production capacity and the reserves to do so. Commercial oil inventories or stocks
held by OECD stood at 2.61-2.64 billion barrels equivalent to about 57 days of their supply.
On the other hand, high prices give field operators an opportunity to produce more oil from
enhance oil recovery (EOR), unconventional sources as well as from deeper and offshore
depths.
Forecast for Ghana: Since Ghana’s supplies largely come from Nigeria (an OPEC country)
and Equatorial Guinea (a non-OPEC country) all in West Africa, we forecast that average
Brent crude oil price that Ghana buys would be $108-110 per barrel 57
and $98-102 per barrel
for other light crudes (see Table 18).
Table 18. Forecast for average crude oil prices for 2013
Fuel brand Ghana
United States
(WTI and NYMEX) Europe
US dollars per barrel
Brent crude 108-110 106-107 107-109
Other light crudes/ U.S refiner 98-102 92-97 97-100
54
The quota was set in 2008 by OPEC. www.opec.org. 55
Personal communication with Prof. Krishan Malik, President, Institute of Petroleum Development, Austin
Texas and of Department of Petroleum and Geosystems Engineering, The University of Texas at Austin, April,
2011. 56
Organisation for Economic Cooperation and Development; nicknamed a club of largely upper middle income
and developed countries. 57
With characteristics almost or similar to Brent crude.

28
As in 2012, we do not expect Ghana to source her crude oil from the Jubilee field, a high
premium oil58
. Rather, it sounds more prudent to use part of Ghana’s proceeds from the sales
to mitigate the impact of consequential high product prices at home.
For the Jubilee field operations, with technical challenges almost resolved and new wells
drilled, production would be maintained at about 100,000 barrels per day reaching between
110,000-120,000 barrels per day by the close of the year59
.
Local petroleum product requirements
Quantities of imported crude oil refined at TOR and products imported to meet shortfall
totalled reduced from about 3.2 million tonnes in 2011 to around 2.9 million tonnes in 2012,
a drop of about 9%.
With the expected drop in crude oil prices, we estimate that the total crude oil and imported
products required for 2013 would increase to 3.0-3.5 million tonnes in order to meet optimal
refinery operations and products for local consumption as well as for exports (see Table 19).
Crude oil required for refinery operations would vary from 1.6-1.9 million tonnes (11-13
million barrels) during the year, depending upon the availability of the Tema Oil Refinery
and its auxiliary units. The remaining 1.4-1.6 million tonnes balance would be imported
products.
Table 19 presents estimated the total products required for 2013.
Table 19. Petroleum product forecast for 2013.
PRODUCT
National supply
requirement
Exports
included
Tonnes
Total Gasoline 850,000 - 970,000 1,000,000
Total Diesel 1,600,000 - 1,700,000 1,850,000
Kerosene/ATK 200,000 - 230,000 300,000
LPG 250,000 - 300,000 350,000
Total 3,000,000 3,200,000 3,500,000 NB: Total gasoline includes Premix;
Total diesel includes supplies to the mining companies and bunkering
Capacity utilisation at Tema Oil Refinery (TOR) in 2012 was just around 25%, about one
third of what was used in 2011. However, based on international standards, 95% capacity
utilization is required for refineries to achieve economic viability. TOR is supposed to refine
all the crude oil needs of the country, except for consignments meant for power generation. It
58
With API equal or greater than 37. 59
Tullow Operational Update, December, 2012.

29
comprises a Crude Distillation Unit (CDU) of production capacity 45,000 barrels per day
(bpd) and a 14,000 bpd Residual Fluid Catalytic Cracker (RFCC) unit to process RFO, a by-
product of crude oil processed by the CDU, into diesel, gasoline and LPG.
The country’s annual petroleum requirement has however far exceeded the capacity of TOR
by about 50%, assuming TOR is operating at over 90% capacity utilisation.
LPG supply: Half of the total LPG requirement could be met if TOR is operating at over
90% capacity on the average during the year (see Table 20). This would also reduce the LPG
import requirement to half of the national demand.
However, limited local production means about two-thirds or more of the LPG national
requirement would be imported. Cross-subsidization of the ex-depot price of LPG means
gasoline and diesel are made to carry most of the tax and levy burden60
. The shift from
gasoline to LPG by vehicle users also suggests that the necessary revenues expected are not
generated from the gasoline sales to augment or beef up LPG imports61
.
Table 20. Operating performance of Tema Oil Refinery with and without the RFCC
62
Without RFCC With RFCC
Tonne per year Weight % Tonne per year Weight %
Technical operational
capacity in tonnes 1,995,000 100 1,995,000 100
Products
LPG 26,136 1.3 114,944 5.8
Gasoline 300,273 15.1 580,615 29.1
Naphtha 38,595 1.9 0 1.9
ATK/kerosene 270,629 13.6 270,629 13.6
Diesel 716,206 35.9 798,034 40.0
Fuel Oil 582,994 29.2 71,575 3.6
Consumption/Losses 60,379 3.0 119,930 6.0
Adapted from Tema Oil Refinery data
Total national LPG storage capacity is also a challenge. In summary, storage limitations and
insufficient revenue generation could constrain the supply to less than 300,000 tonnes in
2013. Otherwise, total LPG requirement of the country could exceed 300,000 tonnes up to
350,000 tonnes due to the increasing requirement by the transport sector as fuel, considering
60 Gasoline carries most of the levies and taxes, whilst LPG is taxed for only excise duty and debt recovery
levy. 61
LPG price for vehicular fuel is slightly higher than for domestic cylinders but still far lower in energy terms
when compared to gasoline. 62
RFCC is Residual Fuel Catalytic Cracker.

30
that demand growth for LPG as fuel for transport in southern sector had ranged from 11-26%
per year since 200663
.
Additional LPG supplies for the country is expected from processing the wet associated gas
from the Jubilee field, when the gas processing facility becomes operational by end of this
year. For instance, processing 160 mmscfd of the wet gas would yield about 1,000 tonnes of
LPG a day, which would be enough to meet the country’s short term; 1-2 years demand64
.
Priority Issues
We reiterate some of the issues raised in the earlier Outlooks since they were hardly
implemented.
i. Include Crude oil in strategic stocks
We are of the opinion that existing strategic stock based on products storage alone is
more expensive to stockpile and in addition limits the country’s ability to take advantage
of any falling oil prices to the fullest. Besides, products have limited shelf life.
After 1983, developed countries’ petroleum strategic storage has been shifting towards
crude oil. As at the end of 2008, the United States petroleum stocks totaled 1.7 billion
barrels, 59% crude oil and 41% products.65
ii. Expand refinery capacity as soon as possible
Crude oil in stock would still have to be refined into usable end products. With the
commercial oil production, Ghana stands to gain immensely if immediate steps are taken
to expand the refinery capacity of the country. It costs less to import crude oil for refining
locally than importing the finished products as shown in Table 21.
Table 21. International Price Scale: Ratio of prices of refined product against crude oil
Products F.O.B C.I.F*
Crude oil 1.0 -
Gasoline 1.3 1.5 – 1.6
Diesel 1.25 1.3 – 1.4
Kerosene/ATK 1.35 1.4 – 1.5
Fuel oil 0.6 – 0.7 0.8 – 0.9
LPG 1.4 1.5 – 1.7
* Depending upon distance for delivery
63
Energy Commission (2011), Liquefied Petroleum Consumption survey, 2003-2007. Energy Survey in
Households, Industries, Commercial and Services. 64
Assuming short term is 1-2 years; 2014-2015 and medium term; 2014-1017. 65
EIA, 2009

31
Ghana announced her intention to expand the Tema Oil Refinery (TOR) as well as build a
new refinery in the late 1990s but no construction has since started.
Export opportunities in the West Africa sub-region abounds and an expanded refining
capacity would therefore position the country to take advantage of the inadequate refinery
capacity in West Africa. Total consumption in non-refinery countries66
in West Africa has
exceeded 80,000 barrels per day (about 4 million tonnes per annum). Besides, Nigeria has
total refinery capacity of about 600,000 BPD (about 20 million tonnes) but production has
been below 50% capacity due largely to operational difficulties. Ghana could quickly expand
TOR whilst it makes plans to construct a new refinery to meet local demand as well as
targeting the economies within the sub-region, particularly those without refineries and at
least, capturing 50% of the market by 2020. Since, building a new refinery of about100,000
barrels per day capacity takes between 3–5 years, such a facility in Ghana could be
operational by 2017 if construction starts by 2014.
With the limited refining capacity within the West African sub-region for the short-to-
medium term, it is prudent that the right and attractive investment climate is created to
encourage investment in new refineries in the country.
It must however be noted that the profitability of refinery operations is very sensitive to the
capacity utilisation; 90% capacity utilisation has been accepted as benchmark for economic
operations of most refineries. It will therefore economically wise to locate such say a 100,000
barrel per day refinery plant in the Export Processing Zone (EPZ) with export market as part
of its target.
iii. LPG Supply
Increasing refinery capacity and revamping of TOR would increase the production of LPG at
TOR. Limited storage capacity however would continue to constrain local distribution and
access.
2.4 Recommendations
We reiterate the recommendations made in 2012 that67
i. BOST68
initiate steps to include storage of crude oil as part of the strategic stock
of the country as soon as possible. Storing crude oil is quicker, far cheaper, stable
and more durable compared to storing products.
ii. National Petroleum Authority encourages the OMCs to set up more LPG
distribution centres to increase access and consumption.
66
Benin, Burkina Faso, The Gambia, Guinea Bissau, Equatorial Guinea, Liberia, Niger, Mali, Mauritania, Togo 67
SNEP, 2006-2020, Energy Commission, www.energycom.gov.gh/documents 68
Bulk Oil Storage and Transport company
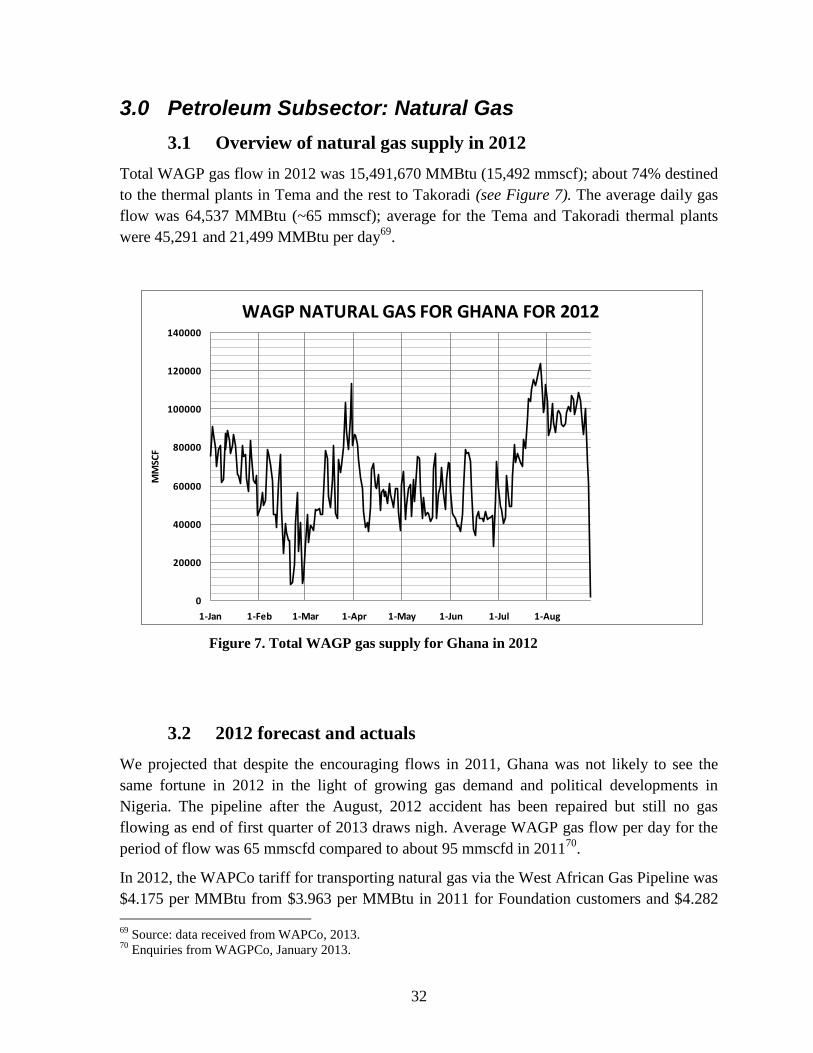
32
3.0 Petroleum Subsector: Natural Gas
3.1 Overview of natural gas supply in 2012
Total WAGP gas flow in 2012 was 15,491,670 MMBtu (15,492 mmscf); about 74% destined
to the thermal plants in Tema and the rest to Takoradi (see Figure 7). The average daily gas
flow was 64,537 MMBtu (~65 mmscf); average for the Tema and Takoradi thermal plants
were 45,291 and 21,499 MMBtu per day69
.
3.2 2012 forecast and actuals
We projected that despite the encouraging flows in 2011, Ghana was not likely to see the
same fortune in 2012 in the light of growing gas demand and political developments in
Nigeria. The pipeline after the August, 2012 accident has been repaired but still no gas
flowing as end of first quarter of 2013 draws nigh. Average WAGP gas flow per day for the
period of flow was 65 mmscfd compared to about 95 mmscfd in 201170
.
In 2012, the WAPCo tariff for transporting natural gas via the West African Gas Pipeline was
$4.175 per MMBtu from $3.963 per MMBtu in 2011 for Foundation customers and $4.282
69
Source: data received from WAPCo, 2013. 70
Enquiries from WAGPCo, January 2013.
Figure 7. Total WAGP gas supply for Ghana in 2012
WAGP NATURAL GAS FOR GHANA FOR 2012
0
20000
40000
60000
80000
100000
120000
140000
1-Jan 1-Feb 1-Mar 1-Apr 1-May 1-Jun 1-Jul 1-Aug
MM
SCF

33
per MMBtu from $4.065 per MMBtu in 2011 for Standard customers. The 2012 WAGP Gas
transportation tariff was within our forecast of $4.08-4.19 per MMBtu.
Average WAGP gas price in 2012 was $2.587 per MMBtu compared to $2.454 per MMBtu
in 2011. The total delivery price in 2012 was $8.188 per MMBtu 71
(see Table 22 for details).
Table 22. WAGP Delivered Gas Price Components
Details
Customer Price
Foundation Standard
$/MMbtu
Gas Purchase 2.5870 N/A
ELPS Transport 1.2271 N/A
WAGP Transport 4.1752 4.2818
WAGP Credit Support Charge 0.1139 N/A
WAGPA Charge 0.0600 0.0600
Delivery or shipper fee 0.1000 N/A
Pipeline Protection Zone charge 0.0250 0.0250
Fuel Gas - Commodity 2.5870 N/A
Fuel Gas - ELPS Transport 1.2271 N/A
Shipper Fee 0.1000 N/A
Delivered Gas Price ($/MMbtu)72
8.1882 N/A
Source: Adapted from WAPCo, 2013
Both the gas and the total delivery prices fell within our projected ranges of $2.53-2.55 for
the gas and $8-9 per MMBtu for total delivery respectively.
3.3 Forecast for 2013 and beyond
For 2013, the WAGP transport fee is likely to be adjusted to $4.20-4.30 per MMBtu owing to
the repairs due to the August, 2012 pirate attack. ELPS transport charge may also increase by
20-40% over 2012 fee due to major rehabilitation works to stabilise the ELPS system in
Lagos and upward adjustment of insurance premium due to the accident. Nevertheless, we
still expect the total gas delivery price to stay within $8-9 per MMBtu due to the expected
fall in crude oil prices which the gas price is indexed to.
Comparatively, average spot (Henry Hub) price in the United States has been projected to
increase to $3.52 per MMBtu whilst average delivery price in Europe is expected to stay
within $8.80-8.90 per MMBtu during the year (see Table 23) 73
.
71
Source: WAPCo, 2013. Communications with the statistical personnel. 72
Delivered gas price is not an absolute sum of the listed charges. It is usually the total less the repetitive
charges. It also does not include the Credit Support Charge component.

34
Table 23. Average delivery gas prices in Ghana (WAGP), United States (Henry Hub), and
Europe (the North Sea).
Year
WAGP/
Ghana
Henry Hub/
United States
Northsea
Europe/
U.S dollars per MMBtu
LNG import prices in italic brackets
2011 6.56 3.59 8.70 (11.97)
2012 8.19 2.75 8.90 (11.79
2013 8.50-9.00 3.52 (6) 8.80 (10.80) Source: Bank of Ghana, LondonGasPrice.com, tradingnrg.com
Securing adequate supply of gas is fundamental to improving availability as well as
providing relatively affordable electricity price. Restoring the high supply levels Ghana had
in 2011 up to August 2012, again would depend upon demand and political developments in
Nigeria due to supply constraints in Nigeria itself (see Figure 8).
Existing and on-going power projects in Nigeria if all goes well as planned could expand the
country’s installed capacity to about 13,000 MW by 2016 and 15,000 MW by 202074
. The
country achieved a generating capacity of 4,350 MW by end of 2012, a feat attributed to
more gas being made available last year. According to NERC75
, the country is on course to
achieve a generation capacity of 7,000 MW by close of 2013. Should this ambition be
aggressively pursued, there would be a greater strain on the existing supply situation. Nigeria
is struggling to achieve its domestic supply and export plans. Supply requirement totals about
5 billion cubic feet per day (bcfd) for domestic consumption, LNG contractual shipments and
WAGP commitments. The country needs to develop new fields and bring them on line to
meet the projected demand but experts in the industry do not expect even up to half supply to
be realised until 2016-2017 (see Figure 8).
The current policy of the Nigeria government somehow seems to be meeting local gas
demand first before considering exports to neighbouring countries.
73
Spot prices usually do not include transportation cost. 74
Energy Commission of Nigeria, website news update, 1st Quarter, 2013.
75 Nigeria Electricity Regulatory Commission, Nigeria Power Report, first quarter 2013.
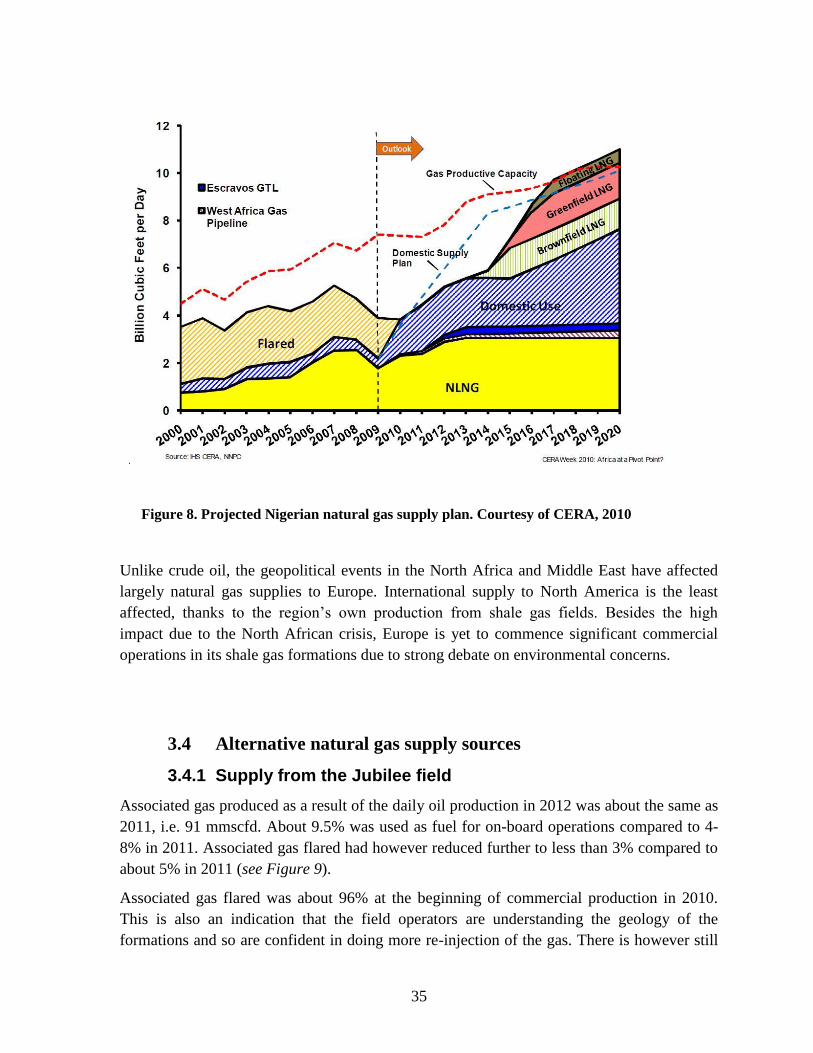
35
Unlike crude oil, the geopolitical events in the North Africa and Middle East have affected
largely natural gas supplies to Europe. International supply to North America is the least
affected, thanks to the region’s own production from shale gas fields. Besides the high
impact due to the North African crisis, Europe is yet to commence significant commercial
operations in its shale gas formations due to strong debate on environmental concerns.
3.4 Alternative natural gas supply sources
3.4.1 Supply from the Jubilee field
Associated gas produced as a result of the daily oil production in 2012 was about the same as
2011, i.e. 91 mmscfd. About 9.5% was used as fuel for on-board operations compared to 4-
8% in 2011. Associated gas flared had however reduced further to less than 3% compared to
about 5% in 2011 (see Figure 9).
Associated gas flared was about 96% at the beginning of commercial production in 2010.
This is also an indication that the field operators are understanding the geology of the
formations and so are confident in doing more re-injection of the gas. There is however still
Figure 8. Projected Nigerian natural gas supply plan. Courtesy of CERA, 2010

36
some uncertainties as to how long the geological formation would allow re-injection beyond
8-24 months of operation.
Pipeline infrastructure to transport the associated gas being produced from the Jubilee fields,
from the FPSO76
, onshore for processing is almost complete; the marine-portion is 100%
complete and the onshore section left is over 82% complete. Reliable indications from the
field suggest that the gas processing plant could be operational by last quarter of 2013,
depending upon timely and adequate financing and provided scheduled implementation
activities are followed through. Expected net average gas supply would range between 60-
100 mmscfd.
Nevertheless, there is still a fact that the associated gas from the Jubilee field even at 120
mmscfd alone would not be adequate to meet the current gas requirements for medium-to-
long term. For this reason, alternative supply options would have to be looked at.
76
Floating Production, Storage and Offloading (FPSO) Kwame Nkrumah MV 21
Figure 9. Jubilee field daily gas production in 2012
0
20
40
60
80
100
120
140
160
1-Jan 1-Feb 1-Mar 1-Apr 1-May 1-Jun 1-Jul 1-Aug 1-Sep 1-Oct 1-Nov 1-Dec
MM
SC
F
ASSOCIATED GAS PRODUCED, GAS USED AS FUEL, GAS INJECTED, AND GAS FLARED FOR 2012
Associated Gas Produced
Gas Used for Fuel
Gas Injected
Gas Flared

37
3.4.2 Supply from LNG re-gas facility
There are however opportunities for LNG supply through the following sources:
Floating Re-gasification plants using grounded LNG vessels which have retired from
services.
Temporary or stop-gap through “Energy Bridge Re-gasification Vessels” (EBRVs)
Permanent LNG re-gasification plants.
For N-Gas of Nigeria to limit gas supply to WAGP at contract volume of 128 mmscfd
instead of the full capacity of 440 mmscfd as originally agreed in the supply contract is of
concern but not hopeless77
. The supply balance of 312 mmscfd reinforces the opportunity for
the development of a viable LNG terminal. Furthermore, the un-utilised space in the pipeline
can be used as gas storage through a technique known as “line packing” to serve as back-up
for the potentially alternative gas supply sources but to only to offset very short interruptions
in supply.
Under the WAGP sales agreement, Open access to the pipeline, i.e. allowing third parties to
access the pipeline if convenient was supposed to commence last year.
About 43 LNG regas plants of 100-200 mmscfd capacity existed globally as at 2010. Eleven
new ones have either been approved or under construction and 22 new projects were
announced (Annex 2). Of course larger capacity LNG regas plants are also available.
With significant commercial shale gas discovered in North America demand pressure on
global supplies is expected to reduce and natural gas global market average spot price is
expected to stay within US$5.5-6.5 per MMBtu for the next five years78
.
Deployment of LNG regas facility
Permanent LNG discharge/re-gasification terminal
Development of permanent LNG re-gasification plant of 100-200 mmscfd capacity however
require at least three-four years even if a project is approved and money is available today.
Nevertheless, for a permanent LNG regas facility, supplies to Ivory Coast could be included
as a medium-to-long term potential market to supplement dwindling indigenous supply in
that country. One should also not be surprised, if such a project end up supplying gas to
neighbouring Togo and Benin also in the long term, provided the WAGP facility allows
reverse directional flow.
77
Energy Commission source 78
International Energy Agency (IEA), medium to long term forecast.

38
Energy Bridge Regasification Vessels
The energy bridge re-gasification is the one that can be delivered in the shortest possible
time; i.e. within a year. Energy Bridge Regasification Vessels, or EBRVs™, are purpose-
built LNG tankers that incorporate on-board equipment for the vapourisation of LNG and
delivery of high pressure natural gas. These vessels load in the same manner as standard
LNG tankers at traditional liquefaction terminals, and also retain the flexibility to discharge
the gas in two distinct ways. These are:
Through the EBRV’s connection with subsea buoy in the hull of the ship; and
through a high pressure gas manifold located in front of the vessel’s LNG loading
arms.
The maximum rate of discharge of the natural gas from an EBRV into the deepwater port is
determined by a combination of the availability of capacity on downstream pipelines and the
regasification capabilities of the facilities located on-board each EBRV.
Floating Re-gasification plants
Average lifetime of most LNG vessels is 25 years. This means LNG vessels built more than
25 years ago have become less competitive for transport services. Such an LNG ship is
retired and reconfigured as floating LNG re-gasification facility. Typical LNG ship has
capacity of 120,000-125,000 liquid cubic metres (lm3). The larger the containment the
greater the application for floating storage and regasification applications79
. Some 59 ships
built worldwide before 1983 with containment between 122,000-133,000 liquid cubic metres
are due for retirement.
Construction of floating regas terminals has rapidly increased since 2005 when the first one
was built in Louisiana, USA. Four units were commissioned between February 2007 and
August 2008.
Floating Regas facility would take between one and half-to-two years to build if a project is
approved and money is readily available today, otherwise up to three years to allow for
initial paper works.
Cost implications of LNG supply option
LNG supply option however would be relatively expensive compared to local or the WAGP
gas. Potential LNG supplies are likely to come from cargos from Nigeria and Angola
destined for United States and or the European markets. LNG cargoes from Nigeria to the
United States would potentially offer the least cost due to the prevailing low gas prices in the
79
Zeus Liquefied Natural Gas Report, January 28, 2009

39
latter. Nigeria accounted for 3% of United States’ LNG supply in the past but with the
existing gluts in the latter, shippers are looking for alternative markets, of course, the bulk
would go to the growing Asian market.
Ownership and financing arrangement would also impact significantly on the cost of the
delivered gas. Ownership can be Joint Venture - shared cost between a Ghanaian and foreign
partners; Public or State Private Partnership (PPP); or facility wholly owned by a foreigner
investor.
PPP through state participation by providing sovereign guarantee is likely to reduce cost
further due to potential decrease in risk cost.
Table 24 presents a qualitative analysis of likely cost range for the country if such is built
within the next two years.
Table 24. Estimated LNG cost range based on cargo shipments from Western Africa to United
States and Europe.
LNG Cargo Destination
Ownership/Financing Arrangement in
US dollars per MMBtu*
PPP
Joint
Venture/
Shared Cost
Operator
wholly
owned
Add
Construction
of off-
loading/regas
berth
From Nigeria en-route to USA 6-7 8-9 9-10
1.0-2.0 From Nigeria en-route to Europe 7-8 9-10 11-12
From Angola en-route to USA 7-8 9-10 10-11
From Angola en-route to Europe 8-9 11-12 13-14 *Assuming operating life time of 5-10 years and minimum delivery volume of 200 mmscfd
3.4.3 Supply from other domestic fields
Besides the gas from the Jubilee field, more associated gas is expected from other
neighbouring fields in the medium to long term, the most prominent being TEN (Tweneboa-
Enyenra-Ntomme) field when oil production starts around 201780
, but this would depend on
rate of development of the field which is scheduled to start in 2013. TEN is expected to yield
an average of 90 mmscfd for over 20 year operational lifetime.
The Sankofa field, another neighbouring field presents the most significant proven non-
associated gas discovery in recent times. Estimated yield is about twice the projected average
yield from Jubilee; about 185 mmscfd. Deepwater ‘non-associated’ however means it would
cost more to develop the field. Wellhead price is estimated to be $6-9 per MMBtu compared
80
Estimated as the commencement year.

40
to wellhead cost of the Jubilee associated gas which is virtually given to Ghana for free81
. In
all cases, generation from gas supply options including the LNG would be less expensive
than any oil-fired option.
The initial natural gas demand at Takoradi Thermal Power Plant if the WAGP pipeline were
to be operational in 2006 was 36 mmscfd. With the number of thermal power plants currently
installed and expected to be in operation by 2015, the current demand is between 260-290
mmscfd which is over the breakeven point for a typical 200-250 mmscfd LNG re-
gasification facility. Demand is expected to jump up significantly when gas from the other
fields discussed are developed and production starts between 2017 and 2018. Gas demand is
projected to exceed 800-mmscfd by 2017 (see Table 25)82
.
Meanwhile, total production from all these local fields is expected to range from a minimum
of about 80 mmscfd in 2013 and ramp up to a maximum of about 400 mmscfd by 2018 if
developments of the fields are carried out as planned. Total gas supply is not likely to exceed
500 mmscfd by 2020.
Thus based on the projected electricity demand and estimated gas required by existing power
plants plus those under construction and those planned or issued with licences by the Energy
Commission, the country is likely to experience gas supply shortfalls right from this year
2013 to 2020. The situation becomes more challenging when industrial demand is included.
Thus the only cost effective gas supply option to quench the shortfall is by LNG import.
In summary, LNG imports would augment domestic gas to make up adequate supplies to
meet both power and industry requirement such as for the anticipated production of fertilizers
(urea), alcohol (methanol) and other petrochemicals.
In making our forecast for the natural gas up to 2020, we made the following assumptions:
that industrial use of gas is not likely to be realised until 2015-2016, starting with 5
mmscfd by 2015 to about 50 mmscfd by 2020.
that a typical urea-fertilizer plant with minimum capacity of 800,000 tonnes per year
would require about 50 mmscfd but would not be available until 2017, if construction
is even to starts this year-2013.
that a typical methanol plant with minimum capacity of 800,000 tonnes per year
would require about 70 mmscfd but would not be available until 2017, if construction
is even to commence this year-2013.
81
Adapted from the World Bank commissioned report: Natural Gas Pricing Policy for Ghana, Final Report,
May 2012, consultant- R. Garcia Consultores S.A 82
See 2010 Energy Outlook, Energy Commission, 2010.

41
Table 25. Natural gas forecast for Ghana in mmscfd, 2013-2020
Year 2013 2014 2015 2016 2017 2018 2019 2020
Min Power only
262 313 313 370 840 840 870 870
Max
Power only 289 345 380 446 1,128 1,128 1,140 1,140
Min
Non-power incl.
262 313 318 380 980 990 1,030 1,040
Max
Non-power
incl. 289 345 388 456 1,268 1,278 1,300 1,310
Available annual average supply
WAGP 0-40 0-100 0-120 0-120 0-120 0-120 0-120 0-120
Local
fields 5-10 60-100 80-100 80-100 200-300 300-400 300-400 400-500
Source: Energy Commission, 2013
What is urgent at present is for the Government to ensure that the required commercial
framework for the development of Sankofa and other new fields are finalized by close of this
year–2013 to enable commercial production to commence by 2017. The development of the
Sankofa field would require significant fiscal incentives like tax holidays to investors to make it
economically viable since unlike oil which could easily be stored and ferried out of the country
borders to external market, non-associated gas requires long-term supply commitment before they are
developed.
3.5 Recommendation
We thus make following recommendations:
i. Government proactively creates incentives to encourage investment in LNG
regas facility to be built in Ghana at the shortest possible time.
ii. Government ensures as a matter of urgency, that the required commercial
frameworks for the developments of the TEN and the Sankofa fields are
finalized by close of this year – 2013 to enable commercial production in
these fields to commence by 2017.
iii. Government provides significant attractive fiscal incentives to investors to make
the non-associate gas fields economically viable to develop.
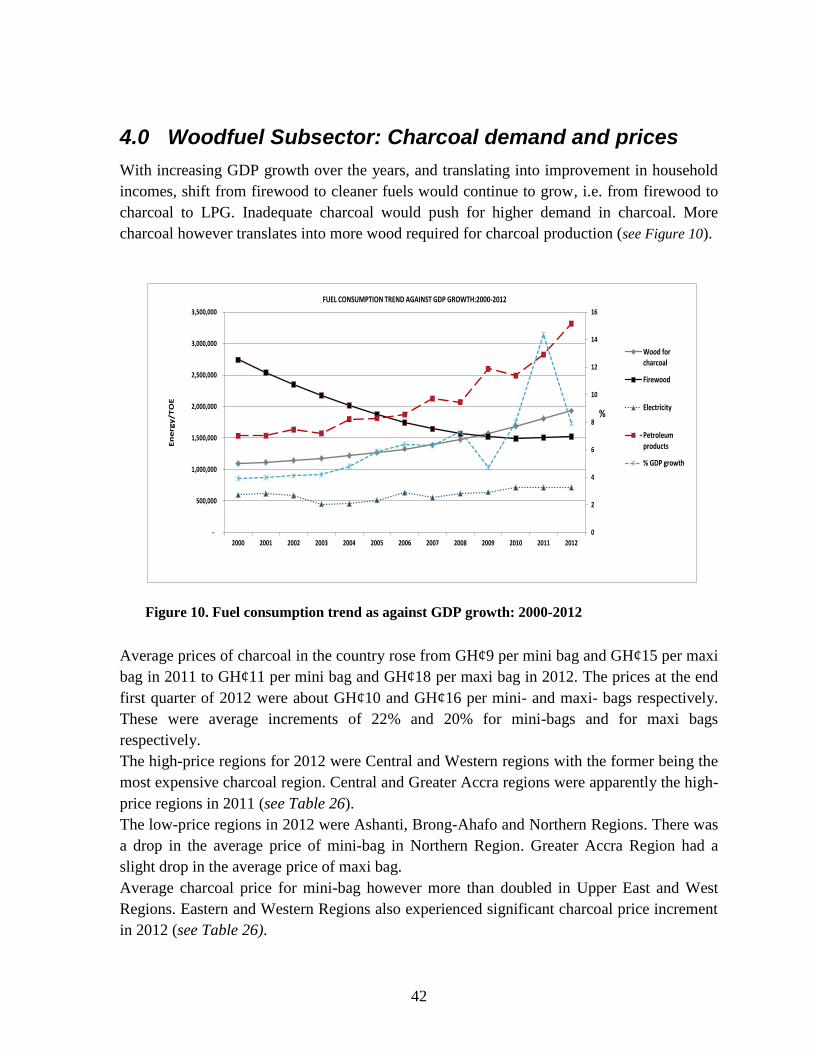
42
4.0 Woodfuel Subsector: Charcoal demand and prices
With increasing GDP growth over the years, and translating into improvement in household
incomes, shift from firewood to cleaner fuels would continue to grow, i.e. from firewood to
charcoal to LPG. Inadequate charcoal would push for higher demand in charcoal. More
charcoal however translates into more wood required for charcoal production (see Figure 10).
Average prices of charcoal in the country rose from GH¢9 per mini bag and GH¢15 per maxi
bag in 2011 to GH¢11 per mini bag and GH¢18 per maxi bag in 2012. The prices at the end
first quarter of 2012 were about GH¢10 and GH¢16 per mini- and maxi- bags respectively.
These were average increments of 22% and 20% for mini-bags and for maxi bags
respectively.
The high-price regions for 2012 were Central and Western regions with the former being the
most expensive charcoal region. Central and Greater Accra regions were apparently the high-
price regions in 2011 (see Table 26).
The low-price regions in 2012 were Ashanti, Brong-Ahafo and Northern Regions. There was
a drop in the average price of mini-bag in Northern Region. Greater Accra Region had a
slight drop in the average price of maxi bag.
Average charcoal price for mini-bag however more than doubled in Upper East and West
Regions. Eastern and Western Regions also experienced significant charcoal price increment
in 2012 (see Table 26).
0
2
4
6
8
10
12
14
16
-
500,000
1,000,000
1,500,000
2,000,000
2,500,000
3,000,000
3,500,000
2000 2001 2002 2003 2004 2005 2006 2007 2008 2009 2010 2011 2012
Wood for charcoal
Firewood
Electricity
Petroleum products
% GDP growth
FUEL CONSUMPTION TREND AGAINST GDP GROWTH:2000-2012
En
erg
y/T
OE
%
Figure 10. Fuel consumption trend as against GDP growth: 2000-2012
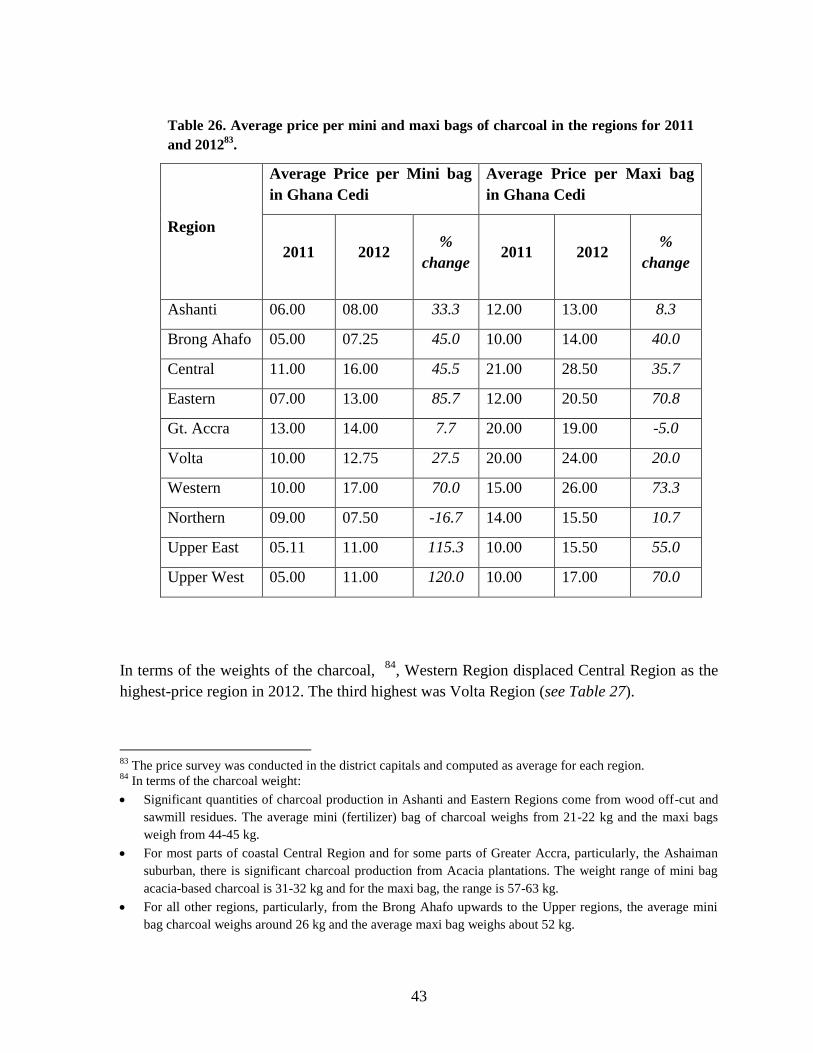
43
Table 26. Average price per mini and maxi bags of charcoal in the regions for 2011
and 201283
.
Region
Average Price per Mini bag
in Ghana Cedi
Average Price per Maxi bag
in Ghana Cedi
2011 2012 %
change 2011 2012
%
change
Ashanti 06.00 08.00 33.3 12.00 13.00 8.3
Brong Ahafo 05.00 07.25 45.0 10.00 14.00 40.0
Central 11.00 16.00 45.5 21.00 28.50 35.7
Eastern 07.00 13.00 85.7 12.00 20.50 70.8
Gt. Accra 13.00 14.00 7.7 20.00 19.00 -5.0
Volta 10.00 12.75 27.5 20.00 24.00 20.0
Western 10.00 17.00 70.0 15.00 26.00 73.3
Northern 09.00 07.50 -16.7 14.00 15.50 10.7
Upper East 05.11 11.00 115.3 10.00 15.50 55.0
Upper West 05.00 11.00 120.0 10.00 17.00 70.0
In terms of the weights of the charcoal, 84
, Western Region displaced Central Region as the
highest-price region in 2012. The third highest was Volta Region (see Table 27).
83
The price survey was conducted in the district capitals and computed as average for each region. 84
In terms of the charcoal weight:
Significant quantities of charcoal production in Ashanti and Eastern Regions come from wood off-cut and
sawmill residues. The average mini (fertilizer) bag of charcoal weighs from 21-22 kg and the maxi bags
weigh from 44-45 kg.
For most parts of coastal Central Region and for some parts of Greater Accra, particularly, the Ashaiman
suburban, there is significant charcoal production from Acacia plantations. The weight range of mini bag
acacia-based charcoal is 31-32 kg and for the maxi bag, the range is 57-63 kg.
For all other regions, particularly, from the Brong Ahafo upwards to the Upper regions, the average mini
bag charcoal weighs around 26 kg and the average maxi bag weighs about 52 kg.
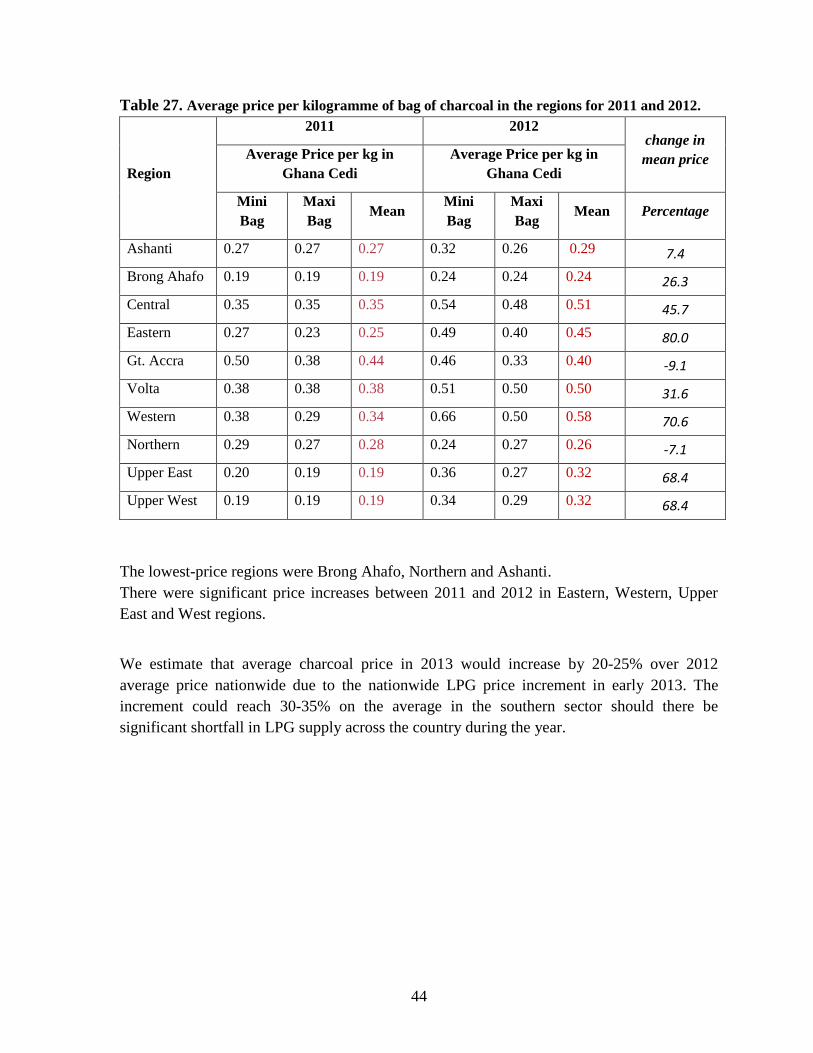
44
Table 27. Average price per kilogramme of bag of charcoal in the regions for 2011 and 2012.
Region
2011 2012 change in
mean price Average Price per kg in
Ghana Cedi
Average Price per kg in
Ghana Cedi
Mini
Bag
Maxi
Bag Mean
Mini
Bag
Maxi
Bag Mean Percentage
Ashanti 0.27 0.27 0.27 0.32 0.26 0.29 7.4
Brong Ahafo 0.19 0.19 0.19 0.24 0.24 0.24 26.3
Central 0.35 0.35 0.35 0.54 0.48 0.51 45.7
Eastern 0.27 0.23 0.25 0.49 0.40 0.45 80.0
Gt. Accra 0.50 0.38 0.44 0.46 0.33 0.40 -9.1
Volta 0.38 0.38 0.38 0.51 0.50 0.50 31.6
Western 0.38 0.29 0.34 0.66 0.50 0.58 70.6
Northern 0.29 0.27 0.28 0.24 0.27 0.26 -7.1
Upper East 0.20 0.19 0.19 0.36 0.27 0.32 68.4
Upper West 0.19 0.19 0.19 0.34 0.29 0.32 68.4
The lowest-price regions were Brong Ahafo, Northern and Ashanti.
There were significant price increases between 2011 and 2012 in Eastern, Western, Upper
East and West regions.
We estimate that average charcoal price in 2013 would increase by 20-25% over 2012
average price nationwide due to the nationwide LPG price increment in early 2013. The
increment could reach 30-35% on the average in the southern sector should there be
significant shortfall in LPG supply across the country during the year.

45
5.0 The Regulatory environment
5.1 The Electricity supply industry
5.1.1 Licensing and Permitting
The Energy Commission in 2006 established a licensing framework for licensing electricity
service providers. The Licensing Manual for service providers in the Electricity Supply
Industry was published in 2006, setting the requirements and guidelines for entities desiring
to acquire licenses to operate in the electricity supply industry.
Under the Licensing framework, provisional and full licences have been issued to entities
engaged in the various segments of electricity supply. Besides adding generating capacity to
existing capacity and enhancing service delivery to customers, the licensing regime enhances
the Commission’s authority to hold the licensees to terms and conditions stipulated in the
licence.
Licenses and permits issued by the Commission so far are as follows:
i. Three new Wholesale Electricity Supply Licences were issued to Independent Power
Producers (IPP) to construct and operate thermal plants. Out of this, 200 MW from
the Sunon Asogli Plant and 126MW from Tema Osonor Power Plant (now Cenit
Energy Limited) has been realized since last quarter of 2010. Cenpower Generation
Company is preparing to begin construction and when completed will add 300 MW
to Ghana’s generation capacity.
ii. Volta River Authority (VRA), a Government owned utility, has been issued a
Construction Permit to construct a 220 MW Kpone Thermal Power Project in Tema.
iii. Two VRA thermal plants namely TAPCO (T1) and Tema Thermal 1 Power Plant
(TT1PP) were issued permanent wholesale supply licences.
iv. The TICO thermal generation plant in Takoradi, which is jointly owned by VRA and
TAQA global, was issued permanent wholesale supply licence.
v. One (1) private distribution utility, Enclave Power Company was issued licence to
distribute and sell electricity without discrimination to customers in the Tema Free
Zone Enclave.
vi. Operations of the Electricity Company of Ghana (ECG), a Government owned utility,
was also regularized by issuing them with permanent operational distribution and sale
licence.
vii. A Distribution and Sales Licence was issued to the Northern Electricity Distribution
Company.
viii. Ten (10) Provisional Wholesale Electricity Supply licences have been issued to
potential Independent Power Producers. This are expected to bring on line 3,090 MW
of power when plants are constructed

46
ix. Two (2) applications for Provisional Wholesale Electricity Supply licences are being
processed for Independent Power Producer with an expected capacity of 500 MW.
x. Thirty-one (31) Bulk Customers of electricity have been issued permits to enable
them operate in the deregulated Wholesale Electricity Market.
In May 2012, the licensing Manual was reviewed to make it simpler and more precise in
guiding prospective licence applicant through the licensing process. Also, new licences
including Electricity Import, Export and Brokerage licence have been introduced.
5.1.2 Codes of Practice and Regulations
The Commission developed and launched the National Electricity Grid Code in 2010 to
govern the operation of the National Interconnected Transmission System (NITS). The Grid
Code specifies in detail the technical operational rules, codes and procedures as well as
obligations and liabilities of all players in the market. Complementary to the National
Electricity Grid Code, The Energy Commission is has completed the drafting of the
Electricity Distribution Code, that sets in detail, the minimum acceptable technical standards
for the development of the electricity distribution networks, provides guidelines and technical
requirements for interconnection and evacuation of embedded generation and other relevant
issues related to the safe and reliable management and operation of the Electricity
Distribution Network. The draft is currently undergoing stakeholder review and should be
launched by the end of the year.
The Commission is developing a Toll Free Short Code service which would allow the
general public to report on outages, and poor voltage levels by sending text (SMS) messages.
This initiative would provide the Commission with information from both the customers
(who experience the outages) and the utilities (who are responsible for maintaining power
supply). This would enable the Commission to cross-check the information provided by the
utilities with the reports provided by customers, and thereby obtain a much clearer and
validated picture of the outage level within the distribution network.
The Commission has developed the Electrical Wiring Regulation 2011, L. I. 2008 to regulate
electrical wiring in the country. This is to ensure the safety of persons, property and livestock
from the use of electrical energy.
Pursuant to the above, a certification guideline was developed in August 2012. Further, a
curriculum for the certification examination was also developed in conjunction with the
Technical/Vocational Education Directorate of the Ghana Education Service. All
stakeholders have also been met to discuss the implementation of the provisions of the
Regulations.

47
In 2013, the Commission is expected to collaborate with the agencies involved in the
certification process and coordinate activities towards the certification of the first batch of
Electrical Wiring Practitioners under the developed certification scheme. The Commission
would also carry out public sensitization activities to create awareness in the general public
on the provisions of the Regulations.
5.1.3 Establishment of Wholesale Electricity Market
The Electricity Regulation 2008 provides for the establishment of a competitive wholesale
electricity market to facilitate wholesale electricity trading and the provision of ancillary
services in the NITS. The operator of this Wholesale Electricity Market(WEM) in Ghana (the
ETU) shall ensure the procurement and dispatch of electricity from any facility of a
wholesale supplier to a bulk customer and distribution utility in a fair, transparent and non-
discriminatory manner.
The Wholesale Electricity Market would allow for choice and competition in the wholesale
supply of electricity and subsequently create an enabling environment to attract Independent
Power Producers (IPPs) as well as enhancing Ghana’s strive towards increasing its installed
capacity from the current 2000MW to 5000MW by 2016.
Further incentive for private sector investment in the Wholesale Supply of electricity is
Ghana’s interconnection with some neighbouring West African countries, thereby opening
up the market for electricity in those countries to IPP’s in Ghana.
Such a market, in principle, requires to be guided by rules and regulations (backed by
legislation) that should essentially reflect government’s broad policy objectives regarding the
structure and administrative management and operation of the market.
5.2 The Natural Gas supply industry
Electricity supply is heavily dependent on the availability of fuel to power the thermal plants.
So far, natural gas supply from Nigeria through the West African Gas Pipeline (WAGP) has
proven unreliable. The development of the gas from the Jubilee field is expected to boost the
installation and operation of more gas fired plants to increase Ghana’s generation capacity.
The Energy Commission is also leading the coordination of efforts to procure Liquefied
Natural Gas (LNG) through a Floating Regasification Storage Unit (FRSU) to ensure
adequate supply of gas in the short to medium term as the country awaits the delivery of
pipeline gas from the Jubilee Field.

48
5.2.1 Licensing and Permitting
A Licensing Manual for Natural Gas Supply Industry was developed by the Energy
Commission in 2008 to serve as a guide for prospective natural gas service providers with
regard to licensing requirements as well as assisting in ensuring compliance with codes and
standards governing quality, health and safety in the industry as stipulated in the Energy
Commission Act, 1997 (Act 541). The manual is currently under review to facilitate the
accelerated development of the natural gas industry.
i. In January 2010 a Construction Permit was issued to BOST to enable them install an
interconnection header in the yard of WAPCo’s Regulating and Metering Station
(RMS).
ii. In 2010, applications for Construction and Siting Permits were received from the
Volta River Authority (VRA) and Sunon Asogli Power (Gh) Limited in respect of the
individual pipeline connection to its Thermal Power Plant and interconnection header
arrangement to the WAPCo Regulating and Metering Station in Tema. Permits were
not issued to VRA and Sunon Asogli Power (GH) Limited as expected because they
did not provide sufficient evidence that their pipelines have been inspected and
certified as safe.
Provisional wholesale Supply Licence has been to Ghana National Gas Company
(GNGC) . Also, a Construction Permit has been issued to GNCC for the construction
of pipelines from Atuabo – Aboadze. Siting Clearance has been issued for the gas
processing plant, pipelines from Atuabo to link the West African Gas Pipeline at
Aboadze, and pipelines from Essiama to Prestea, An application for a Construction
Permit for the construction of a gas processing plant at Atuabo is being processed.
iii. A Provisional Gas Transmission Utility Licence has been issued to BOST to operate
the Natural Gas Transmission Interconnected System(NGTIS)
5.2.2 Codes of Practice and Regulations
Since the natural gas industry is new in Ghana and like any other energy infrastructure, it is
important that before any construction of a facility takes place, the developer must be made
to satisfy some basic requirements and comply with established regulations.
It is in this respect that the Energy Commission has since developed the Natural Gas
Pipeline Safety Regulation with adopted Ghana Standards, which is about to be placed
before parliament for enactment.
The Commission is also in the process of developing an Occupational Health and Safety
Regulation with adopted Ghana Standards. A Transmission Access Code to establish
conditions for Natural Gas Service Providers to have fair, transparent and safe access to the
Natural Gas Transmission Network in Ghana, is also currently being developed in
accordance with Sections 24, 27 and 28 of the Energy Commission Act, 1997 (Act 541).

49
Annex1 – Schematic Overview of Ghana Energy Demand and
Supply System
The integrated energy supply feeds the energy-demand economic sectors comprising
Residential, Commercial & Services, Agricultural & Fisheries, Transport and Industries. The
Energy Supply Sector of Ghana is thus: Biomass, Petroleum and Power (Electricity),
whilst the Energy Demand sectors of the economy are the Residential, Commercial &
Services, Agricultural & Fisheries, Transport and Industries (Figure A).
Figure Annex A1. Energy supply continuum
ENERGY SUPPLY
SECTOR
ENERGY DEMAND SECTORS OF THE ECONOMY
Economic Sectors Sub-sector classification
Woodfuels / Biomass Residential Urban, Rural
Commercial and Services Schools, hotels, restaurants, hospitals
Stores/shops Petroleum (oil and gas).
Agricultural and Fisheries Irrigation, Land Preparation and
Harvest, Spraying and Logging, Post
Harvest Processing, Livestock,
Fisheries.
Transport Road, Rail, Maritime/Water, Air
Power
Industries Manufacturing, Mining, Utilities,
Construction, etc
Figure A2. Energy supply continuum
Firewood & charcoal
Petroleum products
Electricity / Power
Solar, heat & others
Residential
Commercial & Services
Agricultural & Fisheries
Transport
Industrial
Energy Supply Energy-Economic sectors
Energy transportation
/transmission /
distribution
Biomass/wood
Hydro /
Crude Oil
Solar & others
Primary fuels
Energy
conversion
Secondary
fuels/Energy

50
Annex 2 – Existing 100-200 mmscfd LNG plants worldwide
Continent Country
Capacity
Number
Installed
Status
Mmscfd Existing Announced/
Proposed
Approved/ under
construct
Asia China 200 0 0 1 0
India 200 0 0 1 0
100 1 1 0 0
Indonesia 200 0 0 1 0
Japan 100 3 3 0 1
200 2 1 2 0
New Zealand 200 0 0 1 0
Philippines 200 0 0 2 0
Sri Lanka 100 0 0 1 0
South Korea 200 1 1 0 0
Taiwan 200 1 1 0 0
Europe Belgium 100 3 3 1
Cyprus 100 0 0 1 0
France 100 2 2 1 0
Greece 200 1 1 0 0
Italy 200 1 0 2 0
Lithuania 200 1 0 1 0
Poland 200 0 0 1 0
Spain 100 5 5 1 1
200 7 7 0 0
Netherlands 100 1 0 1 1
200 1 0 0 1
U.K 100 1 1 1 0
200 5 5 2 2
North
America
Dominican
Rep
200 0 0 0 1
El Salvador 100 0 0 0 1
Puerto Rico 100 1 1 1 0
United States 200 3 3 0 0
South
America
Brazil 200 1 1 0
Chile 200 0 0 0 2
100 2 2 0 0
Africa South Africa 200 0 0 1 0
Global Total 43 43 22 11
Related Documents