©2013 Elizabeth Arden, Inc. ANNUAL REPORT 2013

Welcome message from author
This document is posted to help you gain knowledge. Please leave a comment to let me know what you think about it! Share it to your friends and learn new things together.
Transcript

©20
13El
izab
eth
Ard
en,I
nc.
A N N U A L R E P O R T 2 0 1 3

©20
13El
izab
eth
Ard
en,I
nc.
©20
13El
izab
eth
Ard
en,I
nc.

Fiscal 2013 was a transitional year for our Companyand although we did not meet our budgeted goals,we accomplished a great deal. In addition to imple-menting the next phase of the Elizabeth Arden brandrepositioning, we successfully launched several newfragrance brands, and continued to execute againstour priority of expanding sales of our fragrancesglobally, opening offices in the high growth marketsof Russia, Brazil and Germany and restructuring ourbusiness in China to accomodate accelerated growth.
Looking ahead, our priorities remain to accelerate theglobal growth of the Elizabeth Arden brand, increasesales of our fragrance portfolio, particularly interna-tionally, and continue to drive improved operationalefficiencies. Many of the current initiatives that weare undertaking to expand our business, while notexpected to be accretive to our earnings in fiscal 2014,are important to drive future revenue and profitgrowth. Over the past four fiscal years, we postedconsistent improvement quarter over quarter in ourkey financial metrics – gross margin, EBITDA marginand trailing twelve-month return on invested capital,achieving growth in 14 out of 16 quarters. We arecommitted to returning to systematic improvementin these metrics during fiscal 2014.
Elizabeth ArdenBrand Repositioning
We made significant progress with the ElizabethArden brand repositioning in fiscal 2013. This
comprehensive brand repositioning is a multi-yearproject designed to honor the heritage of thebrand while modernizing the brand and increasingits relevance among a broader consumer base.The brand has tremendous brand awareness aroundthe world, and despite not being sold in many ofthe world’s largest beauty markets (Japan, France,Germany), ranks 16th globally among prestige beautybrands* with $1 billion in retail sales. We believe thereis significant opportunity to expand our market shareand increase sales of the Elizabeth Arden brand inthe $57 billion*, highly-fragmented, global prestigebeauty market.
1
D e a r F e l l o wS h a r e h o l d e r s :
*Based on Euromonitor 2012 retail sales.

During fiscal years 2012 and 2013, we streamlined theElizabeth Arden brand product assortment, improvedproduct formulations, redesigned and upgraded thepackaging and counters, created new advertising andmarketing vehicles, and enhanced beauty advisor sup-port and education. During this period, every elementof the brand was affected. These activities were de-signed to improve the department store buying expe-rience and to make the SKU line-up more productivefor us and our retailers, as well as to more effectivelyarticulate our brand messaging.
Fiscal 2013 marked the launch of the repositionedElizabeth Arden brand to retailers around the world.Our strategy was to roll out the new product assort-ment on a phased basis. To that end, we started witha limited number of high potential “flagship” retaildoors in select markets where the consumer wouldfind key aspects of the repositioned Elizabeth Ardenbrand, including the new product assortment and,in most cases, fully renovated counters. Since thereset date through the end of fiscal 2013, retail salesat these flagship Elizabeth Arden counters increasedan average of 20% in North America year over year,and retail sales at our international flagship doorsincreased 17%, in the aggregate. These increases weredriven by the retail sales performance of the re-posi-tioned Elizabeth Arden skin care and color products.
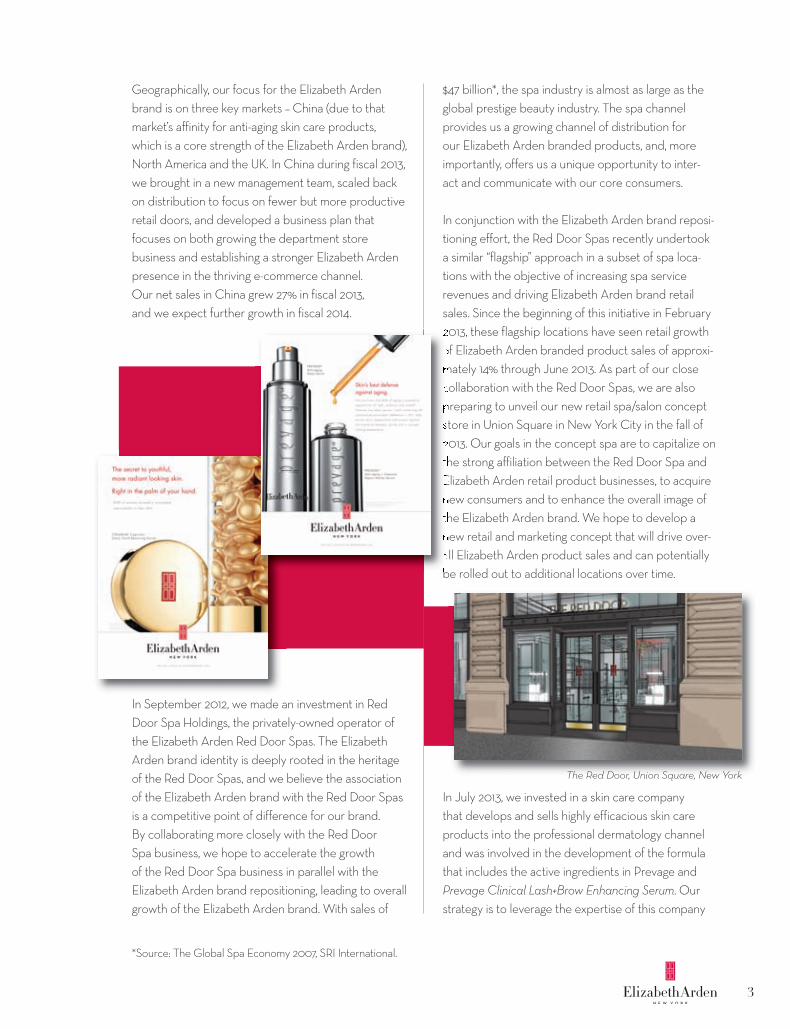
Our fiscal 2014 focus is to ramp up our efforts topull consumers to the repositioned Elizabeth Ardenbrand across more counters. This fiscal year, we arealso launching a new Elizabeth Arden fragrance,UNTOLD. This new fragrance was introduced toretailers in North America in the summer of 2013 andis already exceeding our expectations. In addition,our core skin care franchises, Prevage, Ceramide,Visible Difference and Eight Hour Cream, continueto be driven by exciting innovation. In addition tothe launch of our entry level skin care regimen,Visible Difference, in fiscal 2013 we also success-fully launched highly innovative Prevage products,including Prevage Anti-aging+Intensive Repair DailySerum and Prevage Clinical Lash+Brow EnhancingSerum, which drove a 13% increase in net sales ofthe Prevage franchise in fiscal 2013. During fiscal2014, we will be introducing several additionalPrevage and Ceramide skin care products, aswell as several new color cosmetic products.
2Montreal
Geographically, our focus for the Elizabeth Ardenbrand is on three key markets – China (due to thatmarket’s affinity for anti-aging skin care products,which is a core strength of the Elizabeth Arden brand),North America and the UK. In China during fiscal 2013,we brought in a new management team, scaled backon distribution to focus on fewer but more productiveretail doors, and developed a business plan thatfocuses on both growing the department storebusiness and establishing a stronger Elizabeth Ardenpresence in the thriving e-commerce channel.Our net sales in China grew 27% in fiscal 2013,and we expect further growth in fiscal 2014.
In September 2012, we made an investment in RedDoor Spa Holdings, the privately-owned operator ofthe Elizabeth Arden Red Door Spas. The ElizabethArden brand identity is deeply rooted in the heritageof the Red Door Spas, and we believe the associationof the Elizabeth Arden brand with the Red Door Spasis a competitive point of difference for our brand.By collaborating more closely with the Red DoorSpa business, we hope to accelerate the growthof the Red Door Spa business in parallel with theElizabeth Arden brand repositioning, leading to overallgrowth of the Elizabeth Arden brand. With sales of
$47 billion*, the spa industry is almost as large as theglobal prestige beauty industry. The spa channelprovides us a growing channel of distribution forour Elizabeth Arden branded products, and, moreimportantly, offers us a unique opportunity to inter-act and communicate with our core consumers.
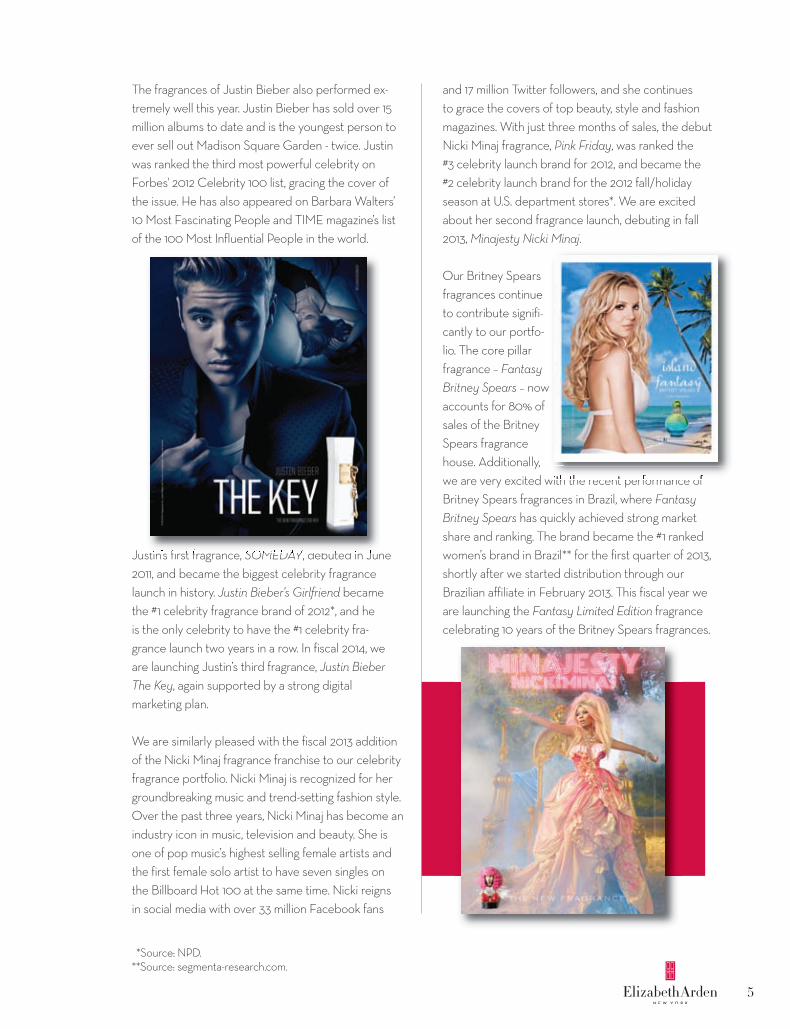
In conjunction with the Elizabeth Arden brand reposi-tioning effort, the Red Door Spas recently undertooka similar “flagship” approach in a subset of spa loca-tions with the objective of increasing spa servicerevenues and driving Elizabeth Arden brand retailsales. Since the beginning of this initiative in February2013, these flagship locations have seen retail growthof Elizabeth Arden branded product sales of approxi-mately 14% through June 2013. As part of our closecollaboration with the Red Door Spas, we are alsopreparing to unveil our new retail spa/salon conceptstore in Union Square in New York City in the fall of2013. Our goals in the concept spa are to capitalize onthe strong affiliation between the Red Door Spa andElizabeth Arden retail product businesses, to acquirenew consumers and to enhance the overall image ofthe Elizabeth Arden brand. We hope to develop anew retail and marketing concept that will drive over-all Elizabeth Arden product sales and can potentiallybe rolled out to additional locations over time.
In July 2013, we invested in a skin care companythat develops and sells highly efficacious skin careproducts into the professional dermatology channeland was involved in the development of the formulathat includes the active ingredients in Prevage andPrevage Clinical Lash+Brow Enhancing Serum. Ourstrategy is to leverage the expertise of this company
3*Euromonitor Data 2010 and Company data.
*Source: The Global Spa Economy 2007, SRI International.
The Red Door, Union Square, New York

in the professional dermatology channel to developa product pipeline that is backed by proven, clinicalresults to drive sales at both the Red Door Spa andElizabeth Arden counters.
We believe that we have a unique opportunity todevelop consumer brand loyalty by being able tointeract with the Elizabeth Arden consumer in amulti-channel approach: through the Red Door Spas,the traditional Elizabeth Arden retail counter business,a content-rich digital replenishment platform, and theprofessional dermatology channel. We are focusedon leveraging these unique associations to driveElizabeth Arden product sales.
Fragrance Expansion
We believe that there is considerable opportunity toexpand our sales of fragrances globally. While NorthAmerica currently represents the largest market forsales of our fragrances, there is significant growthpotential in international markets, including Brazil,Germany and Russia. Of the $43 billion of retail salesin the global fragrance market, 85% is representedby markets outside of North America*. In fiscal 2013,we continued to increase our focus on large growingmarkets, opening offices in Brazil, Germany and Russiaand dedicating additional attention and resourcesto the markets in the Middle East. For fiscal 2013,net sales of fragrances grew 14% (at constant rates)in international markets.
Brazil, in particular, represents a strong opportunity forsales of certain of our fragrance brands. Brazil is one
of the largest fragrance markets in the world, and ourfragrance portfolio, especially celebrity fragrancessuch as Taylor Swift, Britney Spears, and Justin Bieberfragrances, resonates well with those consumers.We have been very pleased with the performanceof our fragrance portfolio in that market since westarted distribution in the second half of fiscal 2013.
Fragrance Brand Performance
Overall, fiscal 2013 was a successful year for ourfragrance business. Our global net sales of fragrancesincreased by 16% (at constant rates), well in excess ofindustry growth rates, and our core brand franchisescontinued to grow.
The Taylor Swift fragrance franchise increased 73%for fiscal 2013, driven by the launch of her secondfragrance, Wonderstruck Enchanted by Taylor Swift,as well as growth in sales to U.S. mass retailers of bothWonderstruck and Wonderstruck Enchanted. In latesummer of 2013, we launched the third fragrance forTaylor Swift, Taylor by Taylor Swift, which is supportedby a strong digital marketing plan. The Taylor Swiftfragrances have also been supported by our sponsor-ship of her current Red Tour global concert series.
4
*Based on Euromonitor 2012 retail sales.
The fragrances of Justin Bieber also performed ex-tremely well this year. Justin Bieber has sold over 15million albums to date and is the youngest person toever sell out Madison Square Garden - twice. Justinwas ranked the third most powerful celebrity onForbes' 2012 Celebrity 100 list, gracing the cover ofthe issue. He has also appeared on Barbara Walters’10 Most Fascinating People and TIME magazine’s listof the 100 Most Influential People in the world.
Justin’s first fragrance, SOMEDAY, debuted in June2011, and became the biggest celebrity fragrancelaunch in history. Justin Bieber’s Girlfriend becamethe #1 celebrity fragrance brand of 2012*, and heis the only celebrity to have the #1 celebrity fra-grance launch two years in a row. In fiscal 2014, weare launching Justin’s third fragrance, Justin BieberThe Key, again supported by a strong digitalmarketing plan.
We are similarly pleased with the fiscal 2013 additionof the Nicki Minaj fragrance franchise to our celebrityfragrance portfolio. Nicki Minaj is recognized for hergroundbreaking music and trend-setting fashion style.Over the past three years, Nicki Minaj has become anindustry icon in music, television and beauty. She isone of pop music’s highest selling female artists andthe first female solo artist to have seven singles onthe Billboard Hot 100 at the same time. Nicki reignsin social media with over 33 million Facebook fans
and 17 million Twitter followers, and she continuesto grace the covers of top beauty, style and fashionmagazines. With just three months of sales, the debutNicki Minaj fragrance, Pink Friday, was ranked the#3 celebrity launch brand for 2012, and became the#2 celebrity launch brand for the 2012 fall/holidayseason at U.S. department stores*. We are excitedabout her second fragrance launch, debuting in fall2013, Minajesty Nicki Minaj.
Our Britney Spearsfragrances continueto contribute signifi-cantly to our portfo-lio. The core pillarfragrance – FantasyBritney Spears – nowaccounts for 80% ofsales of the BritneySpears fragrancehouse. Additionally,we are very excited with the recent performance ofBritney Spears fragrances in Brazil, where FantasyBritney Spears has quickly achieved strong marketshare and ranking. The brand became the #1 rankedwomen’s brand in Brazil** for the first quarter of 2013,shortly after we started distribution through ourBrazilian affiliate in February 2013. This fiscal year weare launching the Fantasy Limited Edition fragrancecelebrating 10 years of the Britney Spears fragrances.
5
**Source: segmenta-research.com.*Source: NPD.

The success of our focus on pillar fragrances withinour designer fragrance brands is evident by theperformance of the Juicy Couture fragrances.Sales of Juicy Couture fragrances grew 16% in fiscal2013, driven by continued strategic focus on theViva la Juicy pillar fragrance, which grew 26%and now accounts for 61% of total Juicy Couturefragrance sales.
Our John Varvatos fragrances continued their consis-tent pattern of steady performance, delivering 19%growth in net sales for fiscal 2013 on the strengthof the classic fragrances, John Varvatos and JohnVarvatos Artisan, and growth in international markets.In fiscal 2014, we look forwardto the global launches of JohnVarvatos Deluxe and JohnVarvatos Artisan Acqua.
Finally, we arepleased to reportthat, once again,the Curve fragrancebrand, together withElizabeth Taylor’sWhite Diamonds,
ranked as the #1 selling men’s fragrance and the #1selling women’s fragrance, respectively, in NorthAmerica at mass retailers*.
E-Commerce
In fiscal 2013, our e-commerce team launched the fullElizabeth Arden new product assortment and newbrand look and feel on www.elizabetharden.com,including U.S. and 15 international content websites.
We also launched new mobile commerce functionality,upgraded brand content and leveraged social mediato drive strong new e-commerce customer acquisi-tion growth. We expect to expand our e-commercecapabilities and increase e-commerce sales globallyin fiscal 2014, with an active focus on China and otherkey markets. Our e-commerce strategy recognizes theneed to bring brand, content, and shopping togetherto deliver effective global commercial growth.
6
*Based on IRI and Company data.
Doing Well by Doing Good
As a member of the global community, ElizabethArden recognizes its obligation not only to enhancethe lives of our customers but also to improve thecommunities where we live and work. Our socialresponsibility efforts generally focus on two specificareas where we have already made a significantimpact; namely, programs that expand educationalopportunities in public education for young people,as well as causes that seek to benefit women.
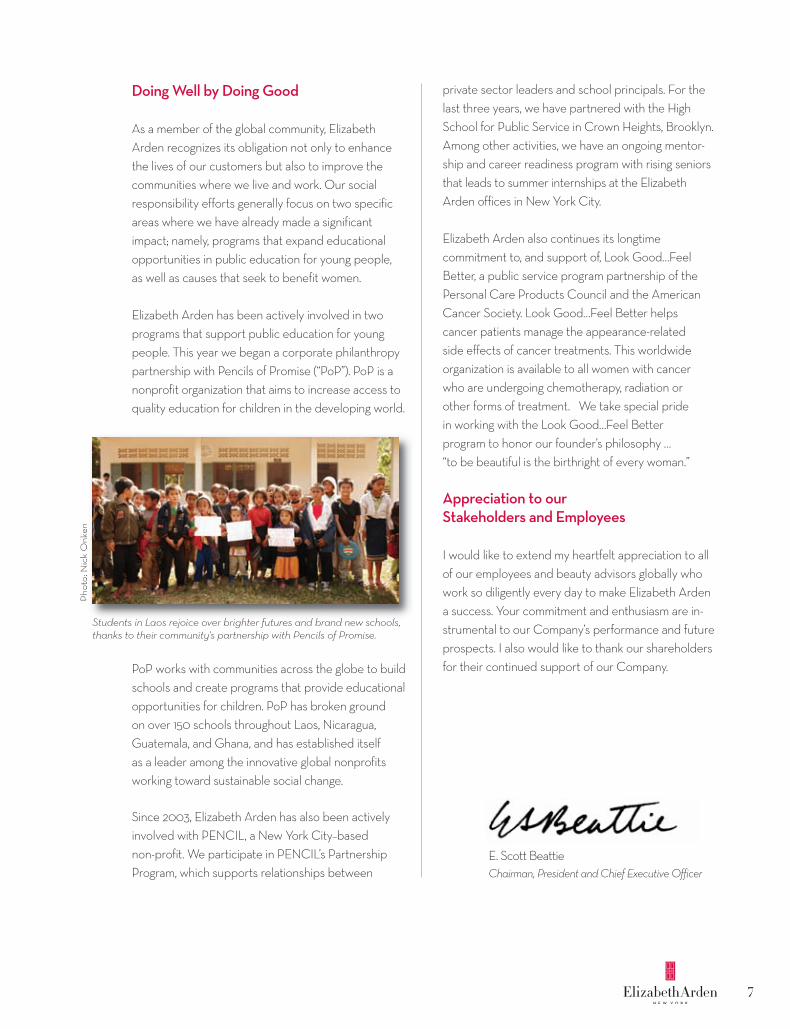
Elizabeth Arden has been actively involved in twoprograms that support public education for youngpeople. This year we began a corporate philanthropypartnership with Pencils of Promise (“PoP”). PoP is anonprofit organization that aims to increase access toquality education for children in the developing world.
PoP works with communities across the globe to buildschools and create programs that provide educationalopportunities for children. PoP has broken groundon over 150 schools throughout Laos, Nicaragua,Guatemala, and Ghana, and has established itselfas a leader among the innovative global nonprofitsworking toward sustainable social change.
Since 2003, Elizabeth Arden has also been activelyinvolved with PENCIL, a New York City–basednon-profit. We participate in PENCIL’s PartnershipProgram, which supports relationships between
private sector leaders and school principals. For thelast three years, we have partnered with the HighSchool for Public Service in Crown Heights, Brooklyn.Among other activities, we have an ongoing mentor-ship and career readiness program with rising seniorsthat leads to summer internships at the ElizabethArden offices in New York City.
Elizabeth Arden also continues its longtimecommitment to, and support of, Look Good…FeelBetter, a public service program partnership of thePersonal Care Products Council and the AmericanCancer Society. Look Good…Feel Better helpscancer patients manage the appearance-relatedside effects of cancer treatments. This worldwideorganization is available to all women with cancerwho are undergoing chemotherapy, radiation orother forms of treatment. We take special pridein working with the Look Good…Feel Betterprogram to honor our founder’s philosophy …“to be beautiful is the birthright of every woman.”
Appreciation to ourStakeholders and Employees
I would like to extend my heartfelt appreciation to allof our employees and beauty advisors globally whowork so diligently every day to make Elizabeth Ardena success. Your commitment and enthusiasm are in-strumental to our Company’s performance and futureprospects. I also would like to thank our shareholdersfor their continued support of our Company.
E. Scott BeattieChairman, President andChief ExecutiveOfficer
7
Pho
to:N
ick
Onk
en
Students in Laos rejoice over brighter futures and brand new schools,thanks to their community's partnership with Pencils of Promise.
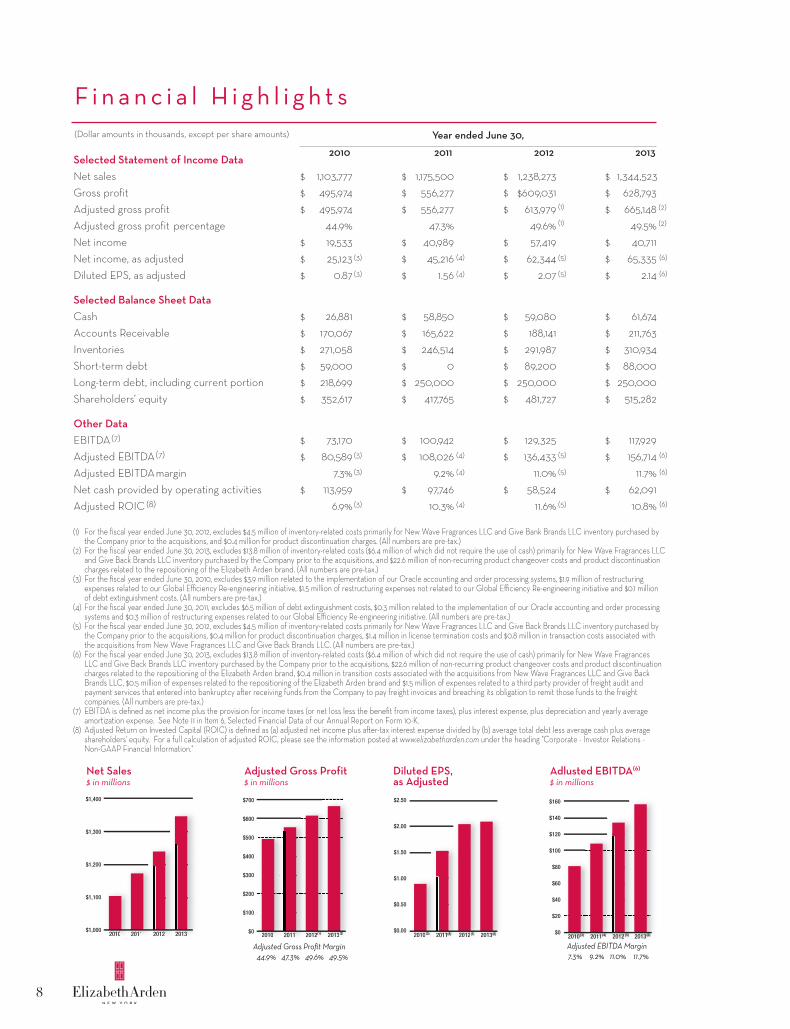
Selected Statement of Income DataNet sales 1,103,777 1,175,500 1,238,273 1,344,523Gross profit 495,974 556,277 $609,031 628,793Adjusted gross profit 495,974 556,277 613,979 665,148Adjusted gross profit percentage 44.9% 47.3% 49.6% 49.5%Net income 19,533 40,989 57,419 40,711Net income, as adjusted 25,123 45,216 62,344 65,335Diluted EPS, as adjusted 0.87 1.56 2.07 2.14
Selected Balance Sheet DataCash 26,881 58,850 59,080 61,674Accounts Receivable 170,067 165,622 188,141 211,763Inventories 271,058 246,514 291,987 310,934Short-term debt 59,000 0 89,200 88,000Long-term debt, including current portion 218,699 250,000 250,000 250,000Shareholders’ equity 352,617 417,765 481,727 515,282
Other DataEBITDA(7) 73,170 100,942 129,325 117,929Adjusted EBITDA(7) 80,589 108,026 136,433 156,714Adjusted EBITDAmargin 7.3% 9.2% 11.0% 11.7%Net cash provided by operating activities 113,959 97,746 58,524 62,091Adjusted ROIC (8) 6.9% 10.3% 11.6% 10.8%
8
F i n a n c i a l H i g h l i g h t s
$$$
$$$
$$$$$$
$$
$
$$$
$$$
$$$$$$
$$
$
$$$
$$$
$$$$$$
$$
$
$$$
$$$
$$$$$$
$$
$
(Dollar amounts in thousands, except per share amounts)
20112010 2012 2013
Year ended June 30,
(4)(3)
(3)
(3)
(3)
(3)
(4)
(4)
(4)
(4) (5)
(5)
(5)
(5)
(5)
(6)
(2)(1)
(1) (2)
(6)
(6)
(6)
(6)
$1,400
$1,300
$1,200
$1,100
$1,0002010 2011 2012 201320132012 22010 2011 22
$700
$600
$500
$400
$300
$200
$100
$02011 2012 2013(1) (2)2010 20122 (1)22010 2013(2)2
$2.50
$2.00
$1.50
$1.00
$0.50
$0.002010 2011 2012(5)(4)(3) 2013(6)20122 (5)2010 2(3) 2013(6)2
$160
$140
$120
$100
$80
$60
$40
$20
$02010 2011 2012(3) (4) (5) 2013(6)
Diluted EPS,as Adjusted
Net Sales$ in millions
Adjusted Gross Profit$ in millions
Adjusted EBITDAMargin7.3% 9.2% 11.0% 11.7%
Adjusted Gross Profit Margin44.9% 47.3% 49.6% 49.5%
Adlusted EBITDA(6)
$ in millions
(1) For the fiscal year ended June 30, 2012, excludes $4.5 million of inventory-related costs primarily for New Wave Fragrances LLC and Give Bank Brands LLC inventory purchased bythe Company prior to the acquisitions, and $0.4 million for product discontinuation charges. (All numbers are pre-tax.)
(2) For the fiscal year ended June 30, 2013, excludes $13.8 million of inventory-related costs ($6.4 million of which did not require the use of cash) primarily for New Wave Fragrances LLCand Give Back Brands LLC inventory purchased by the Company prior to the acquisitions, and $22.6 million of non-recurring product changeover costs and product discontinuationcharges related to the repositioning of the Elizabeth Arden brand. (All numbers are pre-tax.)
(3) For the fiscal year ended June 30, 2010, excludes $3.9 million related to the implementation of our Oracle accounting and order processing systems, $1.9 million of restructuringexpenses related to our Global Efficiency Re-engineering initiative, $1.5 million of restructuring expenses not related to our Global Efficiency Re-engineering initiative and $0.1 millionof debt extinguishment costs. (All numbers are pre-tax.)
(4) For the fiscal year ended June 30, 2011, excludes $6.5 million of debt extinguishment costs, $0.3 million related to the implementation of our Oracle accounting and order processingsystems and $0.3 million of restructuring expenses related to our Global Efficiency Re-engineering initiative. (All numbers are pre-tax.)
(5) For the fiscal year ended June 30, 2012, excludes $4.5 million of inventory-related costs primarily for New Wave Fragrances LLC and Give Back Brands LLC inventory purchased bythe Company prior to the acquisitions, $0.4 million for product discontinuation charges, $1.4 million in license termination costs and $0.8 million in transaction costs associated withthe acquisitions from New Wave Fragrances LLC and Give Back Brands LLC. (All numbers are pre-tax.)
(6) For the fiscal year ended June 30, 2013, excludes $13.8 million of inventory-related costs ($6.4 million of which did not require the use of cash) primarily for New Wave FragrancesLLC and Give Back Brands LLC inventory purchased by the Company prior to the acquisitions, $22.6 million of non-recurring product changeover costs and product discontinuationcharges related to the repositioning of the Elizabeth Arden brand, $0.4 million in transition costs associated with the acquisitions from New Wave Fragrances LLC and Give BackBrands LLC, $0.5 million of expenses related to the repositioning of the Elizabeth Arden brand and $1.5 million of expenses related to a third party provider of freight audit andpayment services that entered into bankruptcy aQer receiving funds from the Company to pay freight invoices and breaching its obligation to remit those funds to the freightcompanies. (All numbers are pre-tax.)
(7) EBITDA is defined as net income plus the provision for income taxes (or net loss less the benefit from income taxes), plus interest expense, plus depreciation and yearly averageamortization expense. See Note 11 in Item 6, Selected Financial Data of our Annual Report on Form 10-K.
(8) Adjusted Return on Invested Capital (ROIC) is defined as (a) adjusted net income plus aQer-tax interest expense divided by (b) average total debt less average cash plus averageshareholders' equity. For a full calculation of adjusted ROIC, please see the information posted at www.elizabetharden.com under the heading "Corporate - Investor Relations -Non-GAAP Financial Information."

UNITED STATESSECURITIES AND EXCHANGE COMMISSION
Washington, D.C. 20549
FORM 10-KÈ ANNUAL REPORT PURSUANT TO SECTION 13 OR 15(d) OF THE
SECURITIES EXCHANGE ACT OF 1934For the fiscal year ended June 30, 2013
OR‘ TRANSITION REPORT PURSUANT TO SECTION 13 OR 15(d) OF THE
SECURITIES EXCHANGE ACT OF 1934For the transition period from to
Commission file number 1-6370
Elizabeth Arden, Inc.(Exact name of registrant as specified in its charter)
Florida 59-0914138(State or other jurisdiction of
incorporation or organization)(I.R.S. Employer
Identification No.)
2400 SW 145th Avenue,Miramar, Florida 33027
(Address of principal executive offices) (Zip Code)(954) 364-6900
(Registrant’s telephone number, including area code)Securities registered pursuant to Section 12(b) of the Act:
Title of Security Name of Exchange on Which RegisteredElizabeth Arden Common Stock, $.01 par value per share Nasdaq Global Select Market
Indicate by check mark if the registrant is a well-known seasoned issuer, as defined in Rule 405 of the SecuritiesAct. Yes ‘ No È
Indicate by check mark if the registrant is not required to file reports pursuant to Section 13 or Section 15(d) ofthe Act. Yes ‘ No È
Indicate by check mark whether the registrant (1) has filed all reports required to be filed by Section 13 or 15(d)of the Securities Exchange Act of 1934 during the preceding 12 months (or for such shorter period that the registrantwas required to file such reports), and (2) has been subject to such filing requirements for the past 90days. Yes È No ‘
Indicate by check mark whether the registrant has submitted electronically and posted on its corporate Web site,if any, every Interactive Data File required to be submitted and posted pursuant to Rule 405 of Regulation S-T(§232.405 of this chapter) during the preceding 12 months (or for such shorter period that the registrant was requiredto submit and post such files). Yes È No ‘
Indicate by check mark if disclosure of delinquent filers pursuant to Item 405 of Regulation S-K (§229.405 ofthis chapter) is not contained herein, and will not be contained, to the best of registrant’s knowledge, in definitiveproxy or information statements incorporated by reference in Part III of this Form 10-K or any amendment to thisForm 10-K È
Indicate by check mark whether the registrant is a large accelerated filer, an accelerated filer, a non-acceleratedfiler, or a smaller reporting company. See definitions of “large accelerated filer,” “accelerated filer,” “non-acceleratedfiler” and “smaller reporting company” in Rule 12b-2 of the Exchange Act. (Check one):Large accelerated filer È Accelerated filer ‘ Non-accelerated filer ‘ Smaller reporting company ‘
Indicate by check mark whether the registrant is a shell company (as defined in rule 12b-2 of theAct). Yes ‘ No È
The aggregate market value of voting Common Stock held by non-affiliates of the registrant was approximately$990 million based on the closing price of the Common Stock on the NASDAQ Global Select Market of $45.01 pershare on December 31, 2012, the last business day of the registrant’s most recently completed second fiscal quarter,based on the number of shares outstanding on that date less the number of shares held by the registrant’s directors,executive officers and holders of at least 10% of the outstanding shares of Common Stock.
As of August 7, 2013, the registrant had 29,652,628 shares of Common Stock outstanding.
Documents Incorporated by ReferencePortions of the Registrant’s definitive proxy statement relating to its 2013 Annual Meeting of Shareholders, to be
filed no later than 120 days after the end of the Registrant’s fiscal year ended June 30, 2013, are hereby incorporatedby reference in Part III of this Annual Report on Form 10-K.
9

ELIZABETH ARDEN, INC.
TABLE OF CONTENTS
Page
Part I
Item 1. Business . . . . . . . . . . . . . . . . . . . . . . . . . . . . . . . . . . . . . . . . . . . . . . . . . . . . . . . . . . 11
Item 1A. Risk Factors . . . . . . . . . . . . . . . . . . . . . . . . . . . . . . . . . . . . . . . . . . . . . . . . . . . . . . . 22
Item 1B. Unresolved Staff Comments . . . . . . . . . . . . . . . . . . . . . . . . . . . . . . . . . . . . . . . . . . 31
Item 2. Properties . . . . . . . . . . . . . . . . . . . . . . . . . . . . . . . . . . . . . . . . . . . . . . . . . . . . . . . . . 31
Item 3. Legal Proceedings . . . . . . . . . . . . . . . . . . . . . . . . . . . . . . . . . . . . . . . . . . . . . . . . . . 32
Item 4. Mine Safety Disclosures . . . . . . . . . . . . . . . . . . . . . . . . . . . . . . . . . . . . . . . . . . . . . . 32
Part II
Item 5. Market For Registrant’s Common Equity, Related Stockholder Matters andIssuer Purchases of Equity Securities . . . . . . . . . . . . . . . . . . . . . . . . . . . . . . . . . 33
Item 6. Selected Financial Data . . . . . . . . . . . . . . . . . . . . . . . . . . . . . . . . . . . . . . . . . . . . . . 36
Item 7. Management’s Discussion and Analysis of Financial Condition and Results ofOperations . . . . . . . . . . . . . . . . . . . . . . . . . . . . . . . . . . . . . . . . . . . . . . . . . . . . . . 39
Item 7A. Quantitative and Qualitative Disclosures About Market Risk . . . . . . . . . . . . . . . . 62
Item 8. Financial Statements and Supplementary Data . . . . . . . . . . . . . . . . . . . . . . . . . . . 64
Item 9. Changes in and Disagreements with Accountants on Accounting and FinancialDisclosure . . . . . . . . . . . . . . . . . . . . . . . . . . . . . . . . . . . . . . . . . . . . . . . . . . . . . . . 107
Item 9A. Controls and Procedures . . . . . . . . . . . . . . . . . . . . . . . . . . . . . . . . . . . . . . . . . . . . . 107
Item 9B. Other Information . . . . . . . . . . . . . . . . . . . . . . . . . . . . . . . . . . . . . . . . . . . . . . . . . . 107
Part III
Item 10. Directors, Executive Officers and Corporate Governance . . . . . . . . . . . . . . . . . . . . 107
Item 11. Executive Compensation . . . . . . . . . . . . . . . . . . . . . . . . . . . . . . . . . . . . . . . . . . . . . 107
Item 12. Security Ownership of Certain Beneficial Owners and Management and RelatedStockholder Matters . . . . . . . . . . . . . . . . . . . . . . . . . . . . . . . . . . . . . . . . . . . . . . . 107
Item 13. Certain Relationships and Related Transactions, and Director Independence . . . . 108
Item 14. Principal Accounting Fees and Services . . . . . . . . . . . . . . . . . . . . . . . . . . . . . . . . . 108
Part IV
Item 15. Exhibits, Financial Statement Schedules . . . . . . . . . . . . . . . . . . . . . . . . . . . . . . . . 108
Signatures . . . . . . . . . . . . . . . . . . . . . . . . . . . . . . . . . . . . . . . . . . . . . . . . . . . . . . . . . . . . . . . . . . . 112
10

PART I
ITEM 1. BUSINESS
General
Elizabeth Arden, Inc. is a global prestige beauty products company with an extensive portfolioof prestige fragrance, skin care and cosmetics brands. Our extensive product portfolio includes thefollowing:
Elizabeth Arden Brand The Elizabeth Arden skin care brands: VisibleDifference, Ceramide, Prevage, and Eight HourCream, Elizabeth Arden branded lipstick, foundationand other color cosmetics products, and the ElizabethArden fragrances: Red Door, Elizabeth Arden 5thAvenue, Elizabeth Arden Green Tea and UNTOLD
Celebrity Fragrances The fragrance brands of Britney Spears, ElizabethTaylor, Mariah Carey, Taylor Swift, Justin Bieber,Nicki Minaj and Usher
Lifestyle Fragrances Curve, Giorgio Beverly Hills, PS Fine Cologne andWhite Shoulders
Designer Fragrances Juicy Couture, Alfred Sung, BCBGMAXAZRIA, EdHardy, Geoffrey Beene, Halston, John Varvatos,Lucky, Rocawear and True Religion
In addition to our owned and licensed fragrance brands, we distribute approximately 250additional prestige fragrance brands, primarily in the United States, through distribution agreementsand other purchasing arrangements.
We sell our prestige beauty products to retailers and other outlets in the United States andinternationally, including;
• U.S. department stores and specialty stores such as Macy’s, Dillard’s, Ulta, Belk, Sephora,Saks, Bloomingdales and Nordstrom;
• U.S. mass retailers such as Wal-Mart, Target, Kohl’s, Walgreens, CVS, and Marmaxx; and
• International retailers such as Boots, Debenhams, Superdrug Stores, The Perfume Shop,Hudson’s Bay, Shoppers Drug Mart, Loblaws, Myer, Douglas and various travel retailoutlets such as Nuance, Heinemann and World Duty Free.
In the United States, we sell our Elizabeth Arden skin care and cosmetics products primarily indepartment stores and our fragrances in department stores and mass retailers. We also sell ourElizabeth Arden fragrances, skin care and cosmetics products and other fragrance lines inapproximately 120 countries worldwide through perfumeries, boutiques, department stores andtravel retail outlets, such as duty free shops and airport boutiques, as well as through our ElizabethArden branded retail outlet stores and our website.
At June 30, 2013, our operations were organized into the following two operating segments,which also comprise our reportable segments:
• North America — Our North America segment sells our portfolio of owned, licensed anddistributed brands, including the Elizabeth Arden products, to department stores, massretailers and distributors in the United States, Canada and Puerto Rico, and also includesthe Company’s direct to consumer business, which is composed of our Elizabeth Ardenbranded retail outlet stores and our global e-commerce business. This segment also sells theElizabeth Arden products through the Red Door beauty salons and spas, which are ownedand operated by a third party licensee in which we have a minority investment.
11
• International — Our International segment sells our portfolio of owned and licensedbrands, including our Elizabeth Arden products, to perfumeries, boutiques, departmentstores, travel retail outlets and distributors in approximately 120 countries outside of NorthAmerica.
Financial information relating to our reportable segments is included in Note 18 to the Notes toConsolidated Financial Statements.
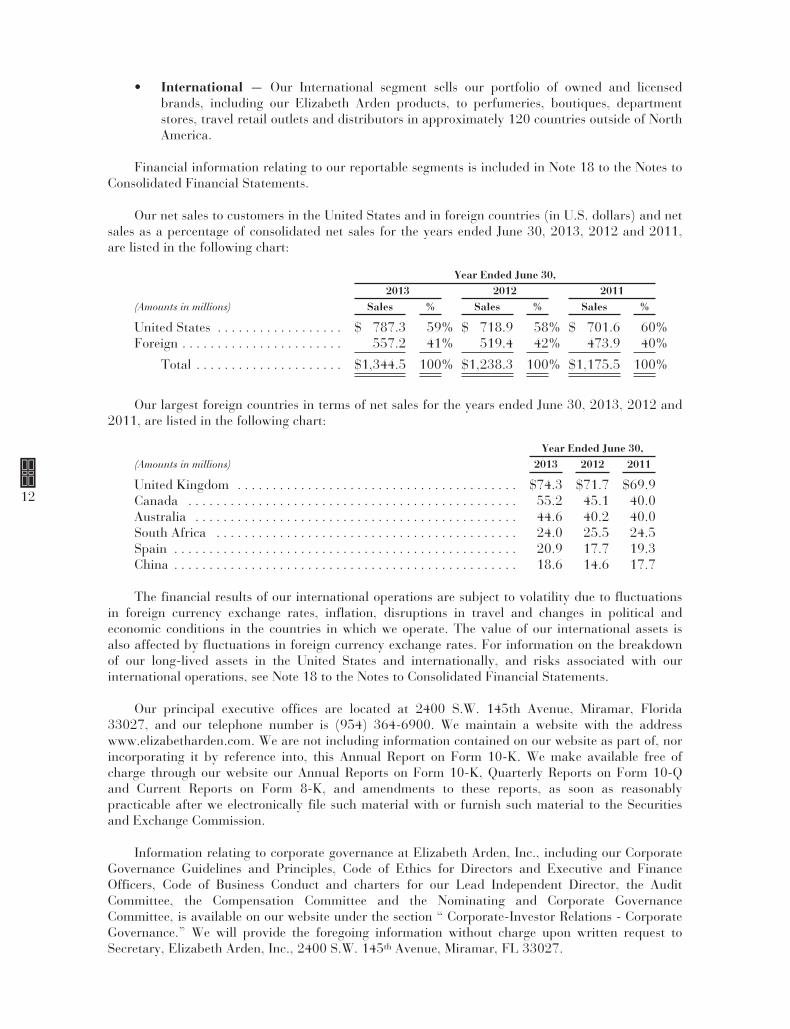
Our net sales to customers in the United States and in foreign countries (in U.S. dollars) and netsales as a percentage of consolidated net sales for the years ended June 30, 2013, 2012 and 2011,are listed in the following chart:
Year Ended June 30,2013 2012 2011
(Amounts in millions) Sales % Sales % Sales %
United States . . . . . . . . . . . . . . . . . . $ 787.3 59% $ 718.9 58% $ 701.6 60%Foreign . . . . . . . . . . . . . . . . . . . . . . . 557.2 41% 519.4 42% 473.9 40%
Total . . . . . . . . . . . . . . . . . . . . . $1,344.5 100% $1,238.3 100% $1,175.5 100%
Our largest foreign countries in terms of net sales for the years ended June 30, 2013, 2012 and2011, are listed in the following chart:
Year Ended June 30,(Amounts in millions) 2013 2012 2011
United Kingdom . . . . . . . . . . . . . . . . . . . . . . . . . . . . . . . . . . . . . . . . $74.3 $71.7 $69.9Canada . . . . . . . . . . . . . . . . . . . . . . . . . . . . . . . . . . . . . . . . . . . . . . . 55.2 45.1 40.0Australia . . . . . . . . . . . . . . . . . . . . . . . . . . . . . . . . . . . . . . . . . . . . . . 44.6 40.2 40.0South Africa . . . . . . . . . . . . . . . . . . . . . . . . . . . . . . . . . . . . . . . . . . . 24.0 25.5 24.5Spain . . . . . . . . . . . . . . . . . . . . . . . . . . . . . . . . . . . . . . . . . . . . . . . . . 20.9 17.7 19.3China . . . . . . . . . . . . . . . . . . . . . . . . . . . . . . . . . . . . . . . . . . . . . . . . . 18.6 14.6 17.7
The financial results of our international operations are subject to volatility due to fluctuationsin foreign currency exchange rates, inflation, disruptions in travel and changes in political andeconomic conditions in the countries in which we operate. The value of our international assets isalso affected by fluctuations in foreign currency exchange rates. For information on the breakdownof our long-lived assets in the United States and internationally, and risks associated with ourinternational operations, see Note 18 to the Notes to Consolidated Financial Statements.
Our principal executive offices are located at 2400 S.W. 145th Avenue, Miramar, Florida33027, and our telephone number is (954) 364-6900. We maintain a website with the addresswww.elizabetharden.com. We are not including information contained on our website as part of, norincorporating it by reference into, this Annual Report on Form 10-K. We make available free ofcharge through our website our Annual Reports on Form 10-K, Quarterly Reports on Form 10-Qand Current Reports on Form 8-K, and amendments to these reports, as soon as reasonablypracticable after we electronically file such material with or furnish such material to the Securitiesand Exchange Commission.
Information relating to corporate governance at Elizabeth Arden, Inc., including our CorporateGovernance Guidelines and Principles, Code of Ethics for Directors and Executive and FinanceOfficers, Code of Business Conduct and charters for our Lead Independent Director, the AuditCommittee, the Compensation Committee and the Nominating and Corporate GovernanceCommittee, is available on our website under the section “ Corporate-Investor Relations - CorporateGovernance.” We will provide the foregoing information without charge upon written request toSecretary, Elizabeth Arden, Inc., 2400 S.W. 145th Avenue, Miramar, FL 33027.
12
Business Strategy
Our business strategy is currently focused on two important initiatives: the global repositioningof the Elizabeth Arden brand and expanding the market penetration of our prestige fragranceportfolio in international markets, especially in the large European fragrance market, as well asgrowing markets such as Brazil and Russia. We also intend to continue to increase net sales,operating margins and earnings by continuing to expand the prestige fragrance category at massretail customers in North America and continuing to improve working capital efficiency and returnon invested capital. We believe that our focus on organic growth opportunities for our existingbrands, new licensing opportunities and acquisitions, and new product innovation will assist us inachieving these goals.
We are in the process of a comprehensive brand repositioning for the Elizabeth Arden brand,which is designed to honor the heritage of the brand while modernizing the brand’s presentation andincreasing its relevance among target consumers. The brand repositioning includes a revised productassortment, improved product formulations, package redesign, counter redesign, new advertisingand marketing vehicles, and enhanced beauty advisor support. The initial roll-out was limited to anumber of flagship retail doors. During fiscal 2013, we introduced our new product assortment toour prestige retail customers and replaced most of such flagship retail counters with new counters.We also extended elements of the new advertising, marketing and beauty advisor programs beyondour global flagship retail doors to the next tier of approximately 200 retail doors globally. To date,we have incurred pre-tax costs and expenses of $23.1 million in connection with the brandrepositioning. In fiscal 2014, we expect to incur $11 million to $16 million in additional costs inconnection with the continued roll-out of the Elizabeth Arden brand repositioning and to exitunprofitable retail doors in certain markets. The specific facts and circumstances of the continuedroll-out of the repositioning will impact the timing and amount of any such costs and expenses aswell as capital expenditures.
During fiscal 2013, we also continued to implement our key initiative to expand our marketshare for fragrances in Western Europe and increased our focus on expanding market share inEastern European markets. We believe the European fragrance market offers opportunities for us toexpand the sales of our fragrance portfolio. We also believe many of our fragrance brands, includingour Elizabeth Arden fragrances and the Juicy Couture, Britney Spears, John Varvatos, Justin Bieberand Nicki Minaj fragrance brands, resonate well with retailers and consumers in those markets. Infiscal 2014, we will continue to work towards developing strong partnerships with leading retailers,travel retail customers and distributor markets to further expand our market share in the Europeanfragrance market as well as in the large fragrance markets of Brazil and Russia. In fiscal 2013, weopened an affiliate office in Brazil and began selling certain of our fragrance products in thatmarket.
We continue to focus on (i) expanding gross margins through increased focus on product mix,improved pricing and reduced sales dilution, (ii) improving our sales and operations planningprocesses and our supply chain and logistics efficiency and, (iii) leveraging our overhead structureby increasing sales of our International segment.
In fiscal 2013, our gross margins were 240 basis points below our fiscal 2012 gross margins,including the negative impact of 270 basis points for costs associated with the Elizabeth Ardenbrand repositioning and the 2012 acquisitions of the licenses for Justin Bieber, Nicki Minaj, EdHardy, BCBGMAXAZRIA and True Religion fragrance brands. This 270 basis point gross marginimpact in the year ended June 30, 2013 represented an increase of 230 basis points over the 40 basispoint impact of these costs in the year ended June 30, 2012. As we complete the integration of the2012 fragrance brand acquisitions and implement the key drivers of success from the repositioningfor the Elizabeth Arden brand across a larger segment of the business, we expect to begin to seesystematic improvement in our gross margin during the second half of fiscal 2014.
13

Recent License Agreements and Acquisitions
In the fourth quarter of fiscal 2012, we acquired (i) the global licenses and certain assets,including inventory, related to the Ed Hardy, True Religion and BCBGMAXAZRIA fragrance brandsfrom New Wave Fragrances, LLC, and (ii) the global licenses and certain assets related to the JustinBieber and Nicki Minaj fragrance brands, including existing inventory of the Justin Bieberfragrances, from Give Back Brands LLC. Prior to the acquisition from New Wave Fragrances, wehad been acting as a distributor of the Ed Hardy and True Religion fragrances to certain mid-tierand mass retailers in North America. Originally introduced in 2008 and inspired by the tattoo art ofDon Ed Hardy, the Ed Hardy fragrance portfolio includes the Ed Hardy Love & Luck, Ed HardyHearts & Daggers and Ed Hardy Born Wild men’s and women’s fragrances, as well as the Ed HardySkull and Roses men’s and women’s fragrances that we launched in the fall of 2012. The TrueReligion fragrance launched in U.S. department stores in October 2008 and includes the brandsDrifter and Hippie Chic, and we followed the 2011 launch of BCBGMAXAZRIA’s women’s fragrancewith the launch of BCBGMAXAZRIA Bon Chic in U.S. department stores in the fall of 2012.
In addition to expanding the international distribution of Someday, the first fragrance frominternationally acclaimed recording artist Justin Bieber, we globally launched the second fragrancein this brand franchise, Justin Bieber’s Girlfriend, commencing in U.S. department stores in thesummer of 2012. We also globally launched the first fragrance from Nicki Minaj, Pink Friday NickiMinaj commencing in U.S. department stores in the fall of 2012.
During fiscal 2012, we amended our long-term license agreement with Liz Claiborne, Inc. andcertain of its affiliates to acquire all of the U.S. and international trademarks for the Curve fragrancebrands, as well as trademarks for certain other smaller fragrance brands. The amendmentestablished a lower effective royalty rate for the remaining licensed fragrance brands, including JuicyCouture and Lucky Brand fragrances, reduced the future minimum guaranteed royalties for theterm of the license, and required a pre-payment of royalties for the remainder of calendar 2011.
For further information on the acquisitions, please see Note 11 to the Notes to ConsolidatedFinancial Statements.
Products
Our net sales of products and net sales of products as a percentage of consolidated net sales forthe years ended June 30, 2013, 2012 and 2011, are listed in the following chart:
Year Ended June 30,2013 2012 2011
(Amounts in millions) Sales % Sales % Sales %
Fragrance . . . . . . . . . . . . . . . . . . . . . . . . . . . . $1,052.9 78% $ 941.9 76% $ 900.3 76%Skin Care . . . . . . . . . . . . . . . . . . . . . . . . . . . . 226.0 17% 226.4 18% 207.1 18%Cosmetics . . . . . . . . . . . . . . . . . . . . . . . . . . . . 65.6 5% 70.0 6% 68.1 6%
Total . . . . . . . . . . . . . . . . . . . . . . . . . . . . $1,344.5 100% $1,238.3 100% $1,175.5 100%
Fragrance. We offer a wide variety of fragrance products for both men and women, includingperfume, colognes, eau de toilettes, eau de parfums, body sprays and gift sets. Our fragrances areclassified into the Elizabeth Arden branded fragrances, celebrity branded fragrances, designerbranded fragrances, and lifestyle fragrances. Each fragrance is sold in a variety of sizes andpackaging assortments. In addition, we sell bath and body products that are based on the particularfragrance to complement the fragrance lines, such as soaps, deodorants, body lotions, gels, creams,body and hair mists, and dusting powders. We sell fragrance products worldwide, primarily todepartment stores, mass retailers, perfumeries, boutiques, distributors and travel retail outlets. Wetailor the size and packaging of the fragrance to suit the particular target customer.
14
Skin Care. Our skin care lines are sold under the Elizabeth Arden name and include productssuch as moisturizers, creams, lotions and cleansers. Our core Elizabeth Arden branded productsinclude the Visible Difference, Ceramide, Prevage, and Eight Hour Cream lines. In connection withour Elizabeth Arden brand repositioning, we have introduced a complete line of essential skin careproducts under the Visible Difference brand, which serves as our entry price point line for theElizabeth Arden skin care products. Our Ceramide skin care line targets women who are 40 andover. Prevage is our premium cosmeceutical skin care line. Our Eight Hour Cream franchise has astrong international following. We sell skin care products worldwide, primarily in department andspecialty stores, perfumeries and travel retail outlets.
Cosmetics. We offer a variety of cosmetics under the Elizabeth Arden name, includingfoundations, lipsticks, mascaras, eye shadows and powders. We offer these products in a wide arrayof shades and colors. The largest component of our cosmetics business is foundations, which wemarket in conjunction with our skin care products. As part of the Elizabeth Arden brandrepositioning, our entire line of cosmetics has been repackaged to emphasize the modernization andluxury of the brand. We sell our cosmetics internationally and in the United States, primarily indepartment and specialty stores, perfumeries and travel retail outlets.
Trademarks, Licenses, Patents and Other Intellectual Properties
We own or have rights to use the trademarks and other intellectual properties necessary for themanufacturing, marketing, distribution and sale of numerous fragrance, cosmetic and skin carebrands, including Elizabeth Arden’s Red Door, Elizabeth Arden 5th Avenue, Elizabeth Arden VisibleDifference, and Prevage among others. These trademarks are registered or have pending applicationsin the United States and in certain of the countries in which we sell these product lines. We considerthe protection of our trademarks to be important to our business.
We are the exclusive worldwide trademark licensee for a number of fragrance brands including:
• the Britney Spears fragrances curious Britney Spears, Fantasy Britney Spears, midnightfantasy Britney Spears, Britney Spears believe, radiance Britney Spears and cosmicradiance Britney Spears;
• the Elizabeth Taylor fragrances White Diamond, Elizabeth Taylor’s Passion and VioletEyes Elizabeth Taylor;
• the Mariah Carey fragrances M by Mariah Carey, Forever Mariah Carey, Lollipop Bling,Lollipop Splash and Mariah Carey Dreams;
• the Juicy Couture fragrances Juicy Couture, Viva la Juicy, Couture Couture, and Peace,Love & Juicy Couture;
• the Lucky fragrances;
• the Usher fragrances He, She, UR for Men, UR for Women and Usher VIP;
• the Giorgio fragrances Giorgio Beverly Hills and Giorgio Red;
• the Taylor Swift fragrances Wonderstruck, Wonderstruck Enchanted and Taylor by TaylorSwift;
• the Justin Bieber fragrances Someday, Justin Bieber’s Girlfriend and Justin Bieber The Key;
• the Nicki Minaj fragrance Pink Friday Nicki Minaj;
• the Ed Hardy fragrances Ed Hardy, Ed Hardy Hearts & Daggers, Ed Hardy Love & Luckand Ed Hardy Skull & Roses;
• the John Varvatos fragrances John Varvatos, John Varvatos Vintage, John Varvatos Artisanand John Varvatos Star USA; and
• the designer fragrance brands of Alfred Sung, BCBGMAXAZRIA, Geoffrey Beene and TrueReligion.
15

The Elizabeth Taylor license agreement terminates in October 2022 and is renewable by us, atour sole option, for unlimited 20-year periods. The Britney Spears license terminates in December2014 and is renewable at our option for another five-year term if certain sales targets are achieved.The license agreement with Liz Claiborne Inc. and its affiliates relating to the Liz Claiborne andJuicy Couture fragrances terminates in December 2017 and is renewable by us for two additionalfive-year terms, provided specified conditions, including certain sales targets, are met. Our otherlicense agreements have terms with expirations ranging from 2013 to 2031, and, typically, haverenewal terms dependent on sales targets being achieved. Many of our license agreements are subjectto our obligation to make required minimum royalty payments, minimum advertising andpromotional expenditures and/or, in some cases, meet minimum sales requirements.
We also have the right under various exclusive distributor and license agreements and otherarrangements to distribute other fragrances in various territories and to use the trademarks of thirdparties in connection with the sale of these products.
Certain of our skin care and cosmetic products, including the Prevage skin care line,incorporate patented or patent-pending formulations. In addition, several of our packaging methods,packages, components and products are covered by design patents, patent applications andcopyrights. Substantially all of our trademarks and patents are held by us or by one of our wholly-owned United States subsidiaries.
Sales and Distribution
We sell our prestige beauty products to retailers in the United States, including departmentstores such as Macy’s, Dillard’s, Saks, Belk, Bloomingdales and Nordstrom; specialty stores such asUlta and Sephora; and mass retailers such as Wal-Mart, Target, Kohl’s, Walgreens, CVS andMarmaxx; and to international retailers such as Boots, Debenhams, Superdrug Stores, The PerfumeShop, Hudson’s Bay, Shoppers Drug Mart, Loblaws, Myer and Douglas, and various travel retailoutlets such as Nuance, Heinemann and World Duty Free. We also sell products to independentfragrance, cosmetic, gift and other stores. We currently sell our skin care and cosmetics products inNorth America primarily in department and specialty stores. We also sell our fragrances, skin careand cosmetic products in approximately 120 other countries worldwide primarily throughdepartment stores, perfumeries, pharmacies, specialty retailers, and other retail shops and “dutyfree” and travel retail locations. In certain countries, we maintain a dedicated sales force that solicitsorders and provides customer service. In other countries and jurisdictions, we sell our productsthrough local distributors or sales representatives under contractual arrangements. We manage ouroperations outside of North America from our offices in Geneva, Switzerland.
We also sell our Elizabeth Arden products in a number of outlet stores throughout the UnitedStates in which we also sell several of our other products. Our owned products are also marketedand sold through our e-commerce site at www.elizabetharden.com. In addition, our Elizabeth Ardenproducts are sold in Red Door beauty salons, which are owned and operated by Elizabeth ArdenSalon Holdings, LLC, an entity in which we have a minority interest and whose subsidiaries operatethe Elizabeth Arden Red Door Spas and the Mario Tricoci Hair Salons. In addition to the sales priceof our products sold to the operator of these salons, we receive a royalty based on the net sales fromeach of the salons for the use of the “Elizabeth Arden” and “Red Door” trademarks.
In fiscal 2013, we invested a total of $7.6 million, including transaction costs, for a minorityinvestment in Elizabeth Arden Salon Holdings, LLC. The investment was made with the intent ofaccelerating the growth of the spa business in parallel with the growth of the Elizabeth Arden brandand the Elizabeth Arden brand repositioning. We also entered into a lease for additional space at ourNew York offices and plan to open and operate, along with Elizabeth Arden Salon Holdings, a newElizabeth Arden Red Door Spa with the intention of testing a new retail salon concept for theElizabeth Arden Red Door Spas.
16

Our sales personnel are organized by geographic market and by customer account. In addition, inNorth America, we have sales personnel who routinely visit prestige retailers to assist in themerchandising, layout and stocking of selling areas. For many of our mass retailers in the UnitedStates and Canada, we sell basic products in customized packaging designed to deter theft and permitthe products to be sold in open displays. Our fulfillment capabilities enable us to reliably process,assemble and ship small orders, as well as large orders, on a timely basis. In the United States andCanada, we use this ability to assist our customers in their retail distribution by shipping in multipleformats including “cross dock shipping” where we pack by store and ship to the customer’sdistribution center, bulk shipment directly to distribution centers and direct-to-store shipment.
As is customary in the beauty industry, sales to customers are generally made pursuant topurchase orders, and we do not have long-term or exclusive contracts with any of our retailcustomers. We believe that our continuing relationships with our customers are based upon ourability to provide a wide selection and reliable source of prestige beauty products, our expertise inmarketing and new product introduction, and our ability to provide value-added services, includingour category management services, to U.S. mass retailers.
Our ten largest customers accounted for approximately 38% of net sales for the year endedJune 30, 2013. The only customer that accounted for more than 10% of our net sales during that periodwas Wal-Mart (including Sam’s Club), which accounted for approximately 11% of our consolidated netsales and approximately 18% of our North America segment net sales. The loss of, or a significantadverse change in our relationship with, any of our largest customers could have a material adverseeffect on our business, prospects, results of operations, financial condition or cash flows.
The industry practice for businesses that market beauty products has been to grant certainretailers (primarily North American prestige department stores and specialty beauty stores), subjectto our authorization and approval, the right to either return merchandise or to receive a markdownallowance for certain products. We establish estimated return reserves and markdown allowances atthe time of sale based upon our level of sales, historical and projected experience with productreturns and markdowns in each of our business segments and with respect to each of our producttypes, current economic trends and changes in customer demand and customer mix. Our returnreserves and markdown allowances are reviewed and updated as needed during the year, andadditions to these reserves and allowances may be required. Additions to these reserves andallowances may have a negative impact on our financial results.
Marketing
Our marketing approach is focused on generating strong demand across our key brands. Weemphasize competitive positioning for each brand and ensure that our brand positioning is carriedthrough all consumer touch points. We employ traditional consumer reach vehicles, such astelevision and magazine print advertising, and are increasingly leveraging new media, such as socialnetworking and mobile and digital applications, so that we are able to engage with our consumersthrough their preferred technologies. As part of the Elizabeth Arden brand repositioning, ourcommunications have been designed to reflect a consistent, equity-building, modern point of view todrive new relevance among women.
We have developed global growth strategies for our key brands that we believe are designed todeliver sales, margin, and market share improvements. Our Elizabeth Arden brand repositioningefforts are focused on modernizing the brand, focusing on skin care and the growth of the globalskin care market, including incorporating technologies into our skin care products, and leveragingour unique Red Door Spa heritage to generate both organic and innovation-driven growth. Webelieve that our repackaged and reformulated Elizabeth Arden brand products, including our newline of Visible Difference skin care essentials, will help us to achieve organic growth of the brand. Wealso understand that innovation is critical in the beauty category, and we intend to focus ourinnovation resources on what we view as the most significant opportunities for growth, while alsoemphasizing profitability.
17

The structure of our marketing function is intended to meet the changing needs of the globalbeauty marketplace. We maintain a global marketing group in New York, which is accountable forglobal strategic planning and the development needs of most of our brands. We also maintainregional marketing teams responsible for translating and customizing global marketing strategies tothe needs of the many local markets around the world in which we sell our products. We believe thisorganizational structure supports our growth strategies and is consistent with best practices in theindustry. We also work with the Red Door Spa organization to co-leverage its unique associationwith the Elizabeth Arden brand.
Our marketing programs are also integrated with significant cooperative advertising programsthat we plan and execute with our retailers, often linked with new product innovation andpromotions. In our department store and perfumery accounts, we periodically promote our brandswith “gift with purchase” and “purchase with purchase” programs. At in-store counters, salesrepresentatives offer personal demonstrations to market individual products. We also engage inextensive sampling programs.
During fiscal 2013, we introduced several new Elizabeth Arden products including the newVisible Difference entry-level skin care regimen, Prevage Anti-aging + Intensive Repair Daily Serum,Prevage Clinical Lash + Brow Enhancing Serum, several new Ceramide skin care products, and anew Red Door fragrance, Red Door Aura. We also debuted new products for several of our fragrancebrands, including Pink Friday Nicki Minaj, Wonderstruck Enchanted, our second fragrance forTaylor Swift, Justin Beiber’s Girlfriend and Ed Hardy’s Skull & Roses. In fiscal 2014, we plan tolaunch several new products across the Elizabeth Arden skin care, color and fragrance categoriesincluding Prevage Anti-aging Intensive Eye Serum and Prevage Anti-aging Treatment BoostingCleanser, a Ceramide Boosting 5-Minute Facial and a new Ceramide line, Flawless Future, BeautifulColor Lipstick, Flawless Finish Liquid Mineral Foundation and a new fragrance, UNTOLD. We alsoplan to launch several fragrances including Justin Bieber The Key, Taylor by Taylor Swift, oursecond fragrance for Nicki Minaj, BCBGMAXAZRIA Bon Genre and a new Britney Spears Fantasyfragrance.
Seasonality
Our operations have historically been seasonal, with higher sales generally occurring in the firsthalf of our fiscal year as a result of increased demand by retailers in anticipation of and during theholiday season. For the year ended June 30, 2013, approximately 60% of our net sales were madeduring the first half of our fiscal year. Due to product innovations and new product launches, thesize and timing of certain orders from our customers, and additions or losses of brand distributionrights, sales, results of operations, working capital requirements and cash flows can varysignificantly between quarters of the same and different years. As a result, we expect to experiencevariability in net sales, operating margin, net income, working capital requirements and cash flowson a quarterly basis. Increased sales of skin care and cosmetic products relative to fragrances mayreduce the seasonality of our business.
We experience seasonality in our working capital, with peak inventory levels normally from Julyto October and peak receivable balances normally from September to December. Our workingcapital borrowings are also seasonal and are normally highest in the months of September, Octoberand November. During the months of December, January and February of each year, cash isnormally generated as customer payments on holiday season orders are received.
Manufacturing, Supply Chain and Logistics
We use third-party suppliers and contract manufacturers in the United States and Europe toobtain substantially all of our raw materials, components and packaging products and tomanufacture substantially all of our finished products for our owned and licensed brands. We alsouse third parties in the United States to manufacture our fragrance, skin and cosmetic products.
18
Cosmetic Essence LLC (CEI), an unrelated third party, has been our leading manufacturer in theUnited States through plants located in New Jersey and Roanoke, Virginia. Additionally, thirdparties in Europe also manufacture certain of our fragrance and cosmetic products, and we also havea small manufacturing facility in South Africa primarily to manufacture local requirements of ourfragrance products.
We primarily use a “turnkey” manufacturing model with the majority of our contractmanufacturers in the United States and Europe, including CEI. Under the “turnkey” manufacturingmodel, our contract manufacturers assume administrative responsibility for planning andpurchasing raw materials and components, while we continue to direct strategic sourcing and pricingwith important raw materials and components vendors. Any supply chain disruptions may adverselyaffect our business, prospects, results of operations, financial condition or cash flows.
As is customary in our industry, historically we have not had long-term or exclusive agreementswith contract manufacturers of our owned and licensed brands, with fragrance oil or blendmanufacturers or with suppliers of our distributed brands and have generally made purchasesthrough purchase orders. We do, however, enter into supply agreements for finished goods with themost significant “turnkey” manufacturers of our owned and licensed brands. We believe that wehave good relationships with manufacturers of our owned and licensed brands and that there arealternative sources should one or more of these manufacturers become unavailable. We receive ourdistributed brands in finished goods form directly from fragrance manufacturers, as well as fromother sources. Sales of fragrance brands that we distribute on a non-exclusive basis accounted forapproximately 9% of our net sales for fiscal 2013. The loss of, or a significant adverse change in ourrelationship with, any of our key manufacturers for our owned and licensed brands, such as CEI, orsuppliers of our distributed fragrance brands, could have a material adverse effect on our business,prospects, results of operations, financial condition or cash flows.
Our fulfillment operations for the United States and certain other areas of the world areconducted out of a leased distribution facility in Roanoke, Virginia. The 400,000 square-footRoanoke facility accommodates our distribution activities and houses a large portion of ourinventory. We also lease 274,000 square feet in a warehouse facility in Salem, Virginia, primarilydedicated to third-party assembly of our promotional gift sets. Our fulfillment operations for Europeare conducted under a logistics services agreement by CEPL, an unrelated third party, at CEPL’sfacility in Beville, France. We recently renewed the CEPL agreement which now extends to June2016. While we insure our inventory and the Roanoke facility, the loss of any of these facilities orthe inventory stored in those facilities, would require us to find replacement facilities or inventoryand could have a material adverse effect on our business, prospects, results of operations, financialcondition or cash flows.
Government Regulation
We and our products are subject to regulation by the Food and Drug Administration, theFederal Trade Commission and state regulatory authorities in the United States, as well as byvarious other federal, local and international regulatory authorities in the countries in which ourproducts are produced or sold. Such regulations principally relate to the ingredients, manufacturing,labeling, packaging and marketing of our products. We believe that we are in substantial compliancewith such regulations, as well as with applicable federal, state, local and international rules andregulations governing the discharge of materials hazardous to the environment. Changes in suchregulations, or in the manner in which such regulations are interpreted, applied, or enforced, couldhave a material adverse effect on our business, prospects, results of operations, financial condition orcash flows.
19

Management Information Systems
Our primary information technology systems discussed below provide a complete portfolio ofbusiness systems, business intelligence systems, and information technology infrastructure servicesto support our global operations:
• Logistics and supply chain systems, including purchasing, materials management,manufacturing, inventory management, order management, customer service, pricing,demand planning, warehouse management and shipping;
• Financial and administrative systems, including general ledger, payables, receivables,personnel, payroll, tax, treasury and asset management;
• Electronic data interchange systems to enable electronic exchange of order, status, invoice,and financial information with our customers, financial service providers and our partnerswithin the extended supply chain;
• Business intelligence and business analysis systems to enable management’s informationalneeds as they conduct business operations and perform business decision making; and
• Information technology infrastructure services to enable seamless integration of our globalbusiness operations through Wide Area Networks (WAN), personal computingtechnologies, electronic mail, and service agreements providing outsourced computingoperations.
These management information systems and infrastructure provide on-line business processsupport for our global business operations. Further, many of these capabilities have been extendedinto the operations of certain of our U.S. customers and third party service providers to enhancethese arrangements, with examples such as vendor managed inventory, third party distribution,third party manufacturing, inventory replenishment, customer billing, retail sales analysis, productavailability, pricing information and transportation management.
We are commencing the last phase of implementation of our Oracle global enterprise system,which includes an upgrade to certain of our information systems relating to our global supply chainand logistics functions. This project is planned to be completed in spring 2015 and is expected tocreate efficiencies in our global logistics and supply chain operations.
We outsource substantially all of our data center operations to IBM, a leading globalinformation services and technology provider. Substantially all of our data center operations arelocated in a facility in Raleigh, North Carolina. IBM also provides us with certain backup capabilitiesto enhance the reliability of our management information systems, which are designed to continue tooperate if our primary computer systems should fail. We use service level agreements and operatingmetrics to help us monitor and assess the performance of our outsourced data center operations. Wealso have business interruption insurance to cover a portion of lost income or additional expensesassociated with disruptions to our business, including our management information systems,resulting from certain casualties. Our business, results of operations, financial condition or cash flowmay, however, be adversely affected if our outsourced data center operations facilities are damagedor otherwise fail and/or our backup capabilities do not or cannot perform as intended.
Competition
The beauty industry is highly competitive and can change rapidly due to consumer preferencesand industry trends. Competition in the beauty industry is based on brand strength, pricing andassortment of products, in store presence and visibility, innovation, perceived value, productavailability, order fulfillment, service to the customer, promotional activities, advertising, specialevents, new product introductions, e-commerce and mobile commerce initiatives, and otheractivities.
20

We believe that we compete primarily on the basis of brand recognition, quality, productefficacy, price, and our emphasis on providing value-added customer services, including categorymanagement services, to certain retailers. There are products that are better-known and morepopular than the products manufactured or supplied by us. Many of our competitors aresubstantially larger and more diversified, and have substantially greater financial and marketingresources than we do, as well as greater name recognition and the ability to develop and marketproducts similar to, and competitive with, those manufactured by us.
Employees
As of August 12, 2013, we had approximately 2,440 full-time employees and approximately550 part-time employees in the United States and 19 foreign countries. None of our employees arecovered by a collective bargaining agreement. We believe that our relationship with our employees issatisfactory.
Executive Officers of the Company
The following sets forth the names and ages of each of our executive officers as of August 12,2013 and the positions they hold:
Name Age Position with the Company
E. Scott Beattie . . . . . . . . . . . . 54 Chairman, President and Chief Executive OfficerStephen J. Smith . . . . . . . . . . 53 Executive Vice President and Chief Financial OfficerJoel B. Ronkin . . . . . . . . . . . . 45 Executive Vice President, General Manager — North AmericaPierre Pirard . . . . . . . . . . . . . . 45 Executive Vice President — Product Innovation and Global
Supply ChainKathy Widmer . . . . . . . . . . . . 51 Executive Vice President and Chief Marketing OfficerOscar E. Marina . . . . . . . . . . . 54 Executive Vice President, General Counsel and SecretaryL. Hoy Heise . . . . . . . . . . . . . 67 Executive Vice President and Chief Information OfficerDirk Trappmann . . . . . . . . . . 52 Executive Vice President, General Manager — International
Each of our executive officers holds office for such term as may be determined by our board ofdirectors. Set forth below is a brief description of the business experience of each of our executiveofficers.
E. Scott Beattie has served as Chairman of our Board of Directors since April 2000, as ourChief Executive Officer since March 1998, and as one of our directors since January 1995.Mr. Beattie also has served as our President since August 2006, a position he also held from April1997 to March 2003. In addition, Mr. Beattie served as our Chief Operating Officer from April 1997to March 1998, and as Vice Chairman of the Board of Directors from November 1995 to April 1997.Mr. Beattie is also Chairman of the board of directors of the Personal Care Products Council, theU.S. trade association for the global cosmetic and personal care products industry, a member of theadvisory board of the Ivey Business School, and a member of the board of directors and the auditand finance committee of the board of directors of PENCIL, a not-for-profit organization thatbenefits New York City public schools.
Stephen J. Smith has served as our Executive Vice President and Chief Financial Officer sinceMay 2001. Previously, Mr. Smith was with PricewaterhouseCoopers LLP, an internationalprofessional services firm, as partner from October 1993 until May 2001, and as manager from July1987 until October 1993.
Joel B. Ronkin has served as our Executive Vice President, General Manager— North Americasince July 2010, as our Executive Vice President, General Manager — North America Fragrancesfrom July 2006 to July 2010, as our Executive Vice President and Chief Administrative Officer fromApril 2004 to June 2006, as our Senior Vice President and Chief Administrative Officer
21

from February 2001 through March 2004, and as our Vice President, Associate General Counsel andAssistant Secretary from March 1999 through January 2001. From June 1997 through March 1999,Mr. Ronkin served as the Vice President, Secretary and General Counsel of National Auto FinanceCompany, Inc., an automobile finance company. From May 1992 to June 1997, Mr. Ronkin was anattorney with the law firm of Steel Hector & Davis L.L.P. in Miami, Florida.
Pierre Pirard has served as our Executive Vice President, Product Innovation and GlobalSupply Chain since February 2010. From November 2007 until February 2010, he served as ourSenior Vice President, Global Supply Chain. Prior to joining us, Mr. Pirard spent 15 years atJohnson & Johnson where he held numerous positions, including serving as Regional Director,External Manufacturing North America — Consumer Sector, from 2005 until 2007; as RegionalDirector — Supply Chain Planning North America — Consumer Sector from 2001 to 2005; and invarious positions in the finance, project management, supply and logistics groups for Johnson &Johnson Canada from 1992 to 2000.
Kathy Widmer has served as our Executive Vice President and Chief Marketing Officer sinceNovember 2009. Prior to joining us, Ms. Widmer was with Johnson & Johnson for 21 years whereshe held numerous positions, including, most recently, serving as Vice President, Marketing, McNeilConsumer Healthcare from May 2008 until November 2009. Prior to May 2008, Ms. Widmer servedas Franchise Director and Product Director for various Johnson and Johnson consumer products,including Tylenol, Motrin, Reach Oral Care, and Pepcid from August 1996 until April 2008.Ms. Widmer serves on the board of directors of Texas Roadhouse, Inc., a Kentucky-based steakrestaurant chain.
Oscar E. Marina has served as our Executive Vice President, General Counsel and Secretarysince April 2004, as our Senior Vice President, General Counsel and Secretary from March 2000 toMarch 2004, and as our Vice President, General Counsel and Secretary from March 1996 to March2000. From October 1988 to March 1996, Mr. Marina was an attorney with the law firm of SteelHector & Davis L.L.P. in Miami, Florida, becoming a partner of the firm in January 1995.
L. Hoy Heise has served as our Executive Vice President and Chief Information Officer sinceNovember 2007, as our Executive Vice President, Chief Information Officer and OperationsPlanning from March 2006 to November 2007, and as our Senior Vice President and ChiefInformation Officer from May 2004 to February 2006. From February 2003 to April 2004,Mr. Heise was the founder and principal of his own technology consulting firm. From June 1999until May 2001, Mr. Heise was Senior Vice President of Gartner, an information technology researchfirm. Prior to that time, Mr. Heise worked in various management and consulting capacities forRenaissance Worldwide, a global provider of business process improvement and informationtechnology consulting services.
Dirk Trappmann has served as our Executive Vice President, General Manager- Internationalsince October 2010. Prior to joining us, Mr. Trappmann was with La Prairie Group, where he heldthe position of President and Chief Executive Officer for over five years. Before his position at LaPrairie Group, Mr. Trappmann spent thirteen years with Beiersdorf AG in numerous managementpositions, including Managing Director Thailand/Indochina and International MarketingDirector. Mr. Trappmann currently serves on the board of directors of Cosmetics Europe, theEuropean cosmetic trade association. On August 8, 2013, the Company announced thatMr. Trappmann is leaving the Company.
ITEM 1A. RISK FACTORS
The risk factors in this section describe the major risks to our business, prospects, results ofoperations, financial condition and cash flows, and should be considered carefully. In addition, thesefactors constitute our cautionary statements under the Private Securities Litigation Reform Act of1995 and could cause our actual results to differ materially from those projected in any forward-
22
looking statements (as defined in such act) made in this Annual Report on Form 10-K. Investorsshould not place undue reliance on any such forward-looking statements. Any statements that arenot historical facts and that express, or involve discussions as to, expectations, beliefs, plans,objectives, assumptions or future events or performance (often, but not always, through the use ofwords or phrases such as “will likely result,” “are expected to,” “will continue,” “is anticipated,”“estimated,” “intends,” “plans,” “believes” and “projects”) may be forward-looking and mayinvolve estimates and uncertainties which could cause actual results to differ materially from thoseexpressed in the forward-looking statements.
Further, any forward-looking statement speaks only as of the date on which such statement ismade, and we undertake no obligation to update any forward-looking statement to reflect events orcircumstances after the date on which such statement is made or to reflect the occurrence ofanticipated or unanticipated events or circumstances. New factors emerge from time to time, and itis not possible for us to predict all of such factors. Further, we cannot assess the impact of each suchfactor on our results of operations or the extent to which any factor, or combination of factors, maycause actual results to differ materially from those contained in any forward-looking statements.
We may be adversely affected by factors affecting our customers’ businesses.
Factors that adversely impact our customers’ businesses may also have an adverse effect on ourbusiness, prospects, results of operations, financial condition or cash flows. These factors mayinclude:
• any reduction in consumer traffic and demand as a result of economic downturns likedomestic and international recessions;
• any credit risks associated with the financial condition of our customers;
• the effect of consolidation or weakness in the retail industry, including the closure ofcustomer doors and the uncertainty resulting therefrom; and
• inventory reduction initiatives and other factors affecting customer buying patterns,including any reduction in retail space commitment to fragrances and cosmetics andretailer practices used to control inventory shrinkage.
Fluctuations in foreign exchange rates could adversely affect our results of operations andcash flows.
We sell our products in approximately 120 countries around the world. During each of the yearsended June 30, 2013 and 2012, we derived approximately 41% and 42%, respectively of our netsales from our international operations. We conduct our international operations in a variety ofdifferent countries and derive our sales in various currencies including the Euro, British pound,Swiss franc, Canadian dollar and Australian dollar, as well as the U.S. dollar. Most of our skin careand cosmetic products are produced in third-party manufacturing facilities located in the U.S. Ouroperations may be subject to volatility because of currency changes, inflation and changes inpolitical and economic conditions in the countries in which we operate. With respect to internationaloperations, our sales, cost of goods sold and expenses are typically denominated in a combination oflocal currency and the U.S. dollar. Our results of operations are reported in U.S. dollars.Fluctuations in currency rates can affect our reported sales, margins, operating costs and theanticipated settlement of our foreign denominated receivables and payables. A weakening of theforeign currencies in which we generate sales relative to the currencies in which our costs aredenominated, which is primarily the U.S. dollar, could adversely affect our business, prospects,results of operations, financial condition or cash flows. Our competitors may or may not be subjectto the same fluctuations in currency rates, and our competitive position could be affected by thesechanges.
23

We do not have contracts with customers or with suppliers of our distributed brands, so ifwe cannot maintain and develop relationships with such customers and suppliers ourbusiness, prospects, results of operations, financial condition or cash flows may bematerially adversely affected.
We do not have long-term or exclusive contracts with any of our customers and generally do nothave long-term or exclusive contracts with our suppliers of distributed brands. Our ten largestcustomers accounted for approximately 38% of our net sales in the year ended June 30, 2013. Ouronly customer who accounted for more than 10% of our net sales in the year ended June 30, 2013was Wal-Mart (including Sam’s Club), who accounted for approximately 11% of our consolidatednet sales and approximately 18% of our North America segment net sales. In addition, our suppliersof distributed brands, which represented approximately 9% of our net sales for fiscal 2013,generally can, at any time, elect to supply products to our customers directly or through anotherdistributor. Our suppliers of distributed brands may also choose to reduce or eliminate the volume oftheir products distributed by us. The loss of any of our key suppliers or customers, or a change inour relationship with any one of them, could have a material adverse effect on our business,prospects, results of operations, financial condition or cash flows.
We depend on various licenses for a significant portion of our sales, and the loss of one ormore licenses or agreements could have a material adverse effect on us.
Our rights to market and sell certain of our prestige fragrance brands are derived from licensesfrom unaffiliated third parties and our business is dependent upon the continuation and renewal ofsuch licenses on terms favorable to us. Each license is for a specific term and may have optionalrenewal terms. In addition, such licenses may be subject to us making required minimum royaltypayments, minimum advertising and promotional expenditures and meeting minimum salesrequirements. Just as the loss of a license or other significant agreement may have a material adverseeffect on us, a renewal on less favorable terms could have a material adverse effect on our business,prospects, results of operations, financial condition or cash flows.
We rely on third-party manufacturers and component suppliers for substantially all of ourowned and licensed products.
We do not own or operate any significant manufacturing facilities. We use third-partymanufacturers and component suppliers to manufacture substantially all of our owned and licensedproducts. Over the past few years, we have reduced the number of third-party manufacturers andcomponent and materials suppliers that we use, and have implemented a “turnkey” manufacturingprocess for substantially all of our products in which we now rely on our third-party manufacturersfor certain supply chain functions that we previously handled ourselves, such as component andmaterials planning, purchasing and warehousing. Our business, prospects, results of operations,financial condition or cash flows could be materially adversely affected if we experience any supplychain disruptions caused by this “turnkey” manufacturing process or other supply chain projects, orif our manufacturers or component suppliers were to experience problems with product quality,credit or liquidity issues, or disruptions or delays in the manufacturing process or delivery of thefinished products or the raw materials or components used to make such products.
The loss of or disruption in our distribution facilities may have a material adverse effect onour business.
We currently have one distribution facility and one promotional set assembly facility in theUnited States and use a third-party fulfillment center in France primarily for European distribution.These facilities house a large portion of our inventory. Although we insure our inventory, any loss,damage or disruption of these facilities, or loss or damage of the inventory stored in them, couldadversely affect our business, prospects, results of operations, financial condition or cash flows.
24
Our business is subject to regulation in the United States and internationally.
The manufacturing, distribution, formulation, packaging and advertising of our products andthose we distribute for others are subject to numerous federal, state and foreign governmentalregulations. The number of laws and regulations that are being enacted or proposed by state, federaland international governments and governmental authorities are increasing. Compliance with theseregulations is difficult and expensive and may require reformulation, repackaging, relabeling ordiscontinuation of certain of our products. If we fail to adhere, or are alleged to have failed toadhere, to any applicable federal, state or foreign laws or regulations, or if such laws or regulationsnegatively affect sales of our products, our business, prospects, results of operation, financialcondition or cash flows may be adversely affected. In addition, our future results could be adverselyaffected by changes in applicable federal, state and foreign laws and regulations, or theinterpretation or enforcement thereof, including those relating to products or ingredients, productliability, trade rules and customs regulations, intellectual property, consumer laws, privacy laws,anti-corruption laws, as well as accounting standards and taxation requirements (including tax-ratechanges, new tax laws and revised tax law interpretations).
Adverse U.S. or international economic conditions could negatively impact our business,prospects, results of operations, financial condition or cash flows.
We believe that consumer spending on beauty products is influenced by general economicconditions and the availability of discretionary income. Adverse U.S. or international economicconditions, such as the current economic environment in Europe, or periods of inflation or highenergy prices can contribute to higher unemployment levels, decreased consumer spending, reducedcredit availability and declining consumer confidence and demand, each of which poses risks to ourbusiness. A decrease in consumer spending and/or in retailer and consumer confidence and demandfor our products could significantly negatively impact our net sales and profitability, including ouroperating margins and return on invested capital. Such economic conditions could cause some of ourcustomers or suppliers to experience cash flow and/or credit problems and impair their financialcondition, which could disrupt our business and adversely affect product orders, payment patternsand default rates and increase our bad debt expense. Adverse economic conditions could alsoadversely affect our access to the capital necessary for our business and our ability to remain incompliance with the financial covenant in our revolving credit facility that applies only in the eventthat we do not have the requisite average borrowing base capacity as set forth in our credit facility.If the recent adverse U.S. and international economic conditions persist or deteriorate further, ourbusiness, prospects, results of operations, financial condition or cash flows could be negativelyimpacted.
We may be adversely affected by domestic and international events that impact consumerconfidence and demand.
Sudden disruptions in business conditions due to events such as terrorist attacks, diseases ornatural disasters may have a short-term, or sometimes long-term, adverse impact on consumerconfidence and spending. In addition, any reductions in travel or increases in restrictions ontravelers’ ability to transport our products on airplanes due to general economic downturns,diseases, increased security levels, acts of war or terrorism could result in a material decline in thenet sales and profitability of our travel retail business.
The beauty industry is highly competitive and if we cannot effectively compete our businessand results of operations will suffer.
The beauty industry is highly competitive and can change rapidly due to consumer preferencesand industry trends. Competition in the beauty industry is based on brand strength, pricing andassortment of products, in-store presence and visibility, innovation, perceived value, productavailability and order fulfillment, service to the consumer, promotional activities, advertising,
25
special events, new product introductions, e-commerce and mobile commerce initiatives and otheractivities. The trend toward consolidation in the retail trade has resulted in us becoming increasinglydependent on key retailers, including large-format retailers, who have increased their bargainingstrength. This trend has also resulted in an increased risk related to the concentration of ourcustomers. We compete primarily with global prestige beauty companies and multinationalconsumer product companies, some of whom have greater resources than we have and brands withgreater name recognition and consumer loyalty than our brands. Our success depends on ourproducts’ appeal to a broad range of consumers whose preferences cannot be predicted withcertainty and are subject to change, and on our ability to anticipate and respond in a timely andcost-effective manner to market trends through product innovations, product line extensions andmarketing and promotional activities. As product life cycles shorten, we must continually work todevelop, produce, and market new products and maintain and enhance the recognition of ourbrands. Net revenues and margins on beauty products tend to decline as they advance in their lifecycles, so our net revenues and margins could suffer if we do not successfully and continuouslydevelop new products. This issue is further compounded by the rapidly increasing use andproliferation of social and digital media by consumers, and the speed with which information andopinions are shared. Constant product innovation also can place a strain on our financial andpersonnel resources. We may incur expenses in connection with product innovation anddevelopment, marketing and advertising that are not subsequently supported by a sufficient level ofsales, which could negatively affect our results of operations. These competitive factors, as well asnew product risks, could have an adverse effect on our business, prospects, results of operations,financial condition or cash flows.
Our business strategy depends upon our ability to increase sales of the Elizabeth Ardenbrand and our prestige fragrance portfolio, as well as our ability to acquire or licenseadditional brands or secure additional distribution arrangements and obtain the requiredfinancing for these agreements and arrangements.
Our business strategy contemplates the continued growth of our portfolio of owned, licensedand distributed brands. In addition, efforts to increase sales of the Elizabeth Arden brand and ourprestige fragrance portfolio, such as our global repositioning of the Elizabeth Arden brand, mayrequire investments that may result in material short-term expenditures without any currentrevenue, and we may not ultimately achieve our net sales or earnings estimates associated with suchefforts. Our future expansion through acquisitions, new product licenses or new product distributionarrangements, if any, will depend upon our ability to identify suitable brands to acquire, license ordistribute and our ability to obtain the required financing for these acquisitions, licenses ordistribution arrangements, and thus depends on the capital resources and working capital availableto us. We may not be able to identify, negotiate, finance or consummate such acquisitions, licensesor arrangements, or the associated working capital requirements, on terms acceptable to us, or at all,which could hinder our ability to increase revenues and build our business.
The success of our business depends, in part, on the demand for celebrity and designerfragrance products.
We have license agreements to manufacture, market and distribute a number of celebrity anddesigner fragrance products, including those of Elizabeth Taylor, Britney Spears, Mariah Carey,Taylor Swift, Justin Bieber, Nicki Minaj, Juicy Couture, John Varvatos, Ed Hardy,BCBGMAXAZRIA and True Religion. In fiscal 2013, we derived approximately 47% of our net salesfrom celebrity and designer fragrance brands. The demand for these products is, to some extent,dependent on the appeal to consumers of the particular celebrity or designer and the celebrity’s ordesigner’s reputation. To the extent that the celebrity/designer fragrance category or a particularcelebrity or designer ceases to be appealing to consumers or a celebrity’s or designer’s reputation isadversely affected, sales of the related products and the value of the brands can decrease materially.In addition, under certain circumstances, lower net sales may shorten the duration of the applicablelicense agreement.
26

We may not be able to successfully and cost-effectively integrate acquired businesses or newbrands.
Acquisitions entail numerous integration risks and impose costs on us that could materially andadversely affect our business, prospects, results of operations, financial condition or cash flows,including:
• difficulties in assimilating acquired operations, products or brands, including disruptions toour operations or the unavailability of key employees from acquired businesses;
• diversion of management’s attention from the day-to-day management of our corebusiness;
• adverse effects on existing business relationships with suppliers and customers;
• incurrence or assumption of additional debt and liabilities, as well as the potential forincreased claims and litigation; and
• incurrence of significant amortization expenses related to intangible assets and thepotential impairment of acquired assets.
Our business could be adversely affected if we are unable to successfully protect ourintellectual property rights.
The market for our products depends to a significant extent upon the value associated with thetrademarks and patents that we own or license. We own, or have licenses or other rights to use, thematerial available trademarks and patents used in connection with the ingredients, packaging,marketing and distribution of our major owned and licensed products both in the U.S. and in certainother countries where such products are principally sold.
Although most of our brand names are registered in the U.S. and in certain foreign countries inwhich we operate, we may not be successful in asserting trademark protection. In addition, the lawsof certain foreign countries may not protect our intellectual property rights to the same extent as thelaws of the U.S. The costs required to protect our trademarks and patents may be substantial. Wealso cannot assure that the owners of the trademarks that we license can or will successfullymaintain their intellectual property rights.
If other parties infringe on our intellectual property rights or the intellectual property rightsthat we license, the value of our brands in the marketplace may be diluted. In addition, anyinfringement of our intellectual property rights would also likely result in a commitment of our timeand resources to protect these rights through litigation or otherwise. We may infringe on others’intellectual property rights, which may result in a reduction in sales or profitability and acommitment of our time and resources to defend through litigation or otherwise. One or moreadverse judgments with respect to these intellectual property rights could negatively impact ourability to compete and could materially adversely affect our business, prospects, results ofoperations, financial condition or cash flows.
If our intangible assets, such as trademarks, patents and goodwill, become impaired, wemay be required to record a significant non-cash charge to earnings which would negativelyimpact our results of operations.
Exclusive brand licenses, trademarks and intangibles comprise a material portion of our totalconsolidated assets. Completed acquisitions, like the recent acquisitions of the licenses for the EdHardy, True Religion, BCBGMAXAZRIA, Justin Bieber and Nicki Minaj fragrance brands, typicallyresult in an increase in other intangibles on our balance sheet. Under accounting principles generallyaccepted in the United States, we review our intangible assets, including our trademarks, patents,licenses and goodwill, for impairment annually, or more frequently if events or changes incircumstances indicate the carrying value of our intangible assets may not be fully recoverable. The
27

carrying value of our intangible assets may not be recoverable due to factors such as a decline in ourstock price and market capitalization, reduced estimates of future cash flows, including thoseassociated with the specific brands to which intangibles relate, or slower growth rates in ourindustry. Estimates of future cash flows are based on a long-term financial outlook of our operationsand the specific brands to which the intangible assets relate. However, actual performance in thenear-term or long-term could be materially different from these forecasts, which could impact futureestimates and the recorded value of the intangibles. For example, a significant sustained decline inour stock price and market capitalization may result in impairment of certain of our intangibleassets, including goodwill, and a significant charge to earnings in our financial statements during theperiod in which an impairment is determined to exist. Any such impairment charge could materiallyreduce our results of operations.
We are subject to risks related to our international operations.
We operate on a global basis, with sales in approximately 120 countries. Approximately 41% ofour fiscal 2013 net sales were generated outside of the United States. Our international operationscould be adversely affected by:
• import and export license requirements;
• trade restrictions;
• changes in tariffs and taxes;
• restrictions on repatriating foreign profits back to the United States;
• changes in, or our unfamiliarity with, foreign laws and regulations, including those relatedto product registration, ingredients and labeling, including changes in the interpretation orenforcement of such laws and regulations;
• difficulties in staffing and managing international operations; and
• changes in social, political, legal, economic and other conditions.
Unanticipated changes in our tax provisions, the adoption of new tax legislation or exposureto additional tax liabilities could affect our profitability and cash flows.
We are subject to income and other taxes in the United States and numerous foreignjurisdictions. Our effective tax rate in the future could be adversely affected by changes to ouroperating structure, changes in the mix of earnings in countries with differing statutory tax rates,changes in the valuation of deferred tax assets and liabilities, changes in tax laws and the discoveryof new information in the course of our tax return preparation process. In particular, the carryingvalue of deferred tax assets, which are predominantly in the United States, is dependent on ourability to generate future taxable income in the United States. From time to time, tax proposals areintroduced or considered by the United States Congress or the legislative bodies in foreignjurisdictions that could also affect our tax rate, the carrying value of our deferred tax assets, or ourother tax liabilities. Our tax liabilities are also affected by the amounts we charge for inventory,services, licenses, funding and other items in intercompany transactions. We are subject to ongoingtax audits in various jurisdictions, and tax authorities may disagree with our intercompany charges,cross-jurisdictional transfer pricing or other matters and assess additional taxes. We regularly assessthe likely outcomes of these audits in order to determine the appropriateness of our tax provision. Inconnection with an examination of our U.S. federal tax returns for the years ended June 30, 2008and June 30, 2009, the Internal Revenue Service (the IRS) proposed adjustments that wouldincrease our U.S. taxable income by $29.1 million in the aggregate for both of those years. Wedisagree with the proposed adjustments and intend to vigorously contest them and pursue allavailable remedies. However, there can be no assurance that we will prevail in the IRS appealsprocess or accurately predict the outcomes of other tax audits, and the amounts ultimately paidupon resolution of audits could be materially different from the amounts previously included in our
28

income tax expense. As a result, the ultimate resolution of these tax audits, changes in tax laws ortax rates, and the ability to utilize our deferred tax assets could materially affect our tax provision,net income and cash flows in future periods.
Our quarterly results of operations fluctuate due to seasonality and other factors, and wemay not have sufficient liquidity to meet our seasonal working capital requirements.
We generate a significant portion of our net income in the first half of our fiscal year as a resultof higher sales in anticipation of the holiday season. Similarly, our working capital needs are greaterduring the first half of the fiscal year. We may experience variability in net sales and net income ona quarterly basis as a result of a variety of factors, including new product innovations and launches,the size and timing of customer orders and additions or losses of brand distribution rights. If wewere to experience a significant shortfall in sales or internally generated funds, we may not havesufficient liquidity to fund our business.
Our level of debt and debt service obligations, and the restrictive covenants in our revolvingcredit facility and our indenture for our 7 3/8% senior notes, may reduce our operating andfinancial flexibility and could adversely affect our business and growth prospects.
At June 30, 2013, we had total debt of approximately $338 million which includes $250 millionin aggregate principal amount outstanding of our 7 3/8% senior notes and $88 million outstandingunder our revolving bank credit facility, both of which have requirements that may limit ouroperating and financial flexibility. Our indebtedness could adversely impact our business, prospects,results of operations, financial condition or cash flows by increasing our vulnerability to generaladverse economic and industry conditions and restricting our ability to consummate acquisitions orfund working capital, capital expenditures and other general corporate requirements.
Specifically, our revolving credit facility, second lien facility and our indenture for our 7 3/8%senior notes limit or otherwise affect our ability to, among other things:
• incur additional debt;
• pay dividends or make other restricted payments;
• create or permit certain liens, other than customary and ordinary liens;
• sell assets other than in the ordinary course of our business;
• invest in other entities or businesses; and
• consolidate or merge with or into other companies or sell all or substantially all of ourassets.
These restrictions could limit our ability to finance our future operations or capital needs, makeacquisitions or pursue available business opportunities. Our revolving credit facility also requires usto maintain specified amounts of borrowing capacity or maintain a debt service coverage ratio. Ourability to meet these conditions and our ability to service our debt obligations will depend upon ourfuture operating performance, which can be affected by general economic, financial, competitive,legislative, regulatory, business and other factors beyond our control. If our actual results deviatesignificantly from our projections, we may not be able to service our debt or remain in compliancewith the conditions contained in our revolving credit facility, and we would not be allowed to borrowunder the revolving credit facility. If we were not able to borrow under our revolving credit facility,we would be required to develop an alternative source of liquidity. We cannot assure you that wecould obtain replacement financing on favorable terms or at all.
A default under our revolving credit facility or second lien facility could also result in a defaultunder our indenture for our 7 3/8% senior notes. Upon the occurrence of an event of default underour indenture, all amounts outstanding under our other indebtedness may be declared to be
29

immediately due and payable. If we were unable to repay amounts due on our revolving creditfacility or second lien facility, the lenders would have the right to proceed against the collateralgranted to them to secure that debt.
Our success depends, in part, on the quality, efficacy and safety of our products.
Our success depends, in part, on the quality, efficacy and safety of our products. If our productsare found to be defective or unsafe, or if they otherwise fail to meet customer or consumerstandards, our relationships with customers or consumers could suffer, the appeal of one or more ofour brands could be diminished, and we could lose sales and/or become subject to liability claims,any of which could have a material adverse effect on our business, prospects, results of operations,financial condition or cash flows.
Our success depends upon the retention and availability of key personnel and the successionof senior management.
Our success largely depends on the performance of our management team and other keypersonnel. Our future operations could be harmed if we are unable to attract and retain talented,highly qualified senior executives and other key personnel. In addition, if we are unable to effectivelyprovide for the succession of senior management, including our chief executive officer, our business,prospects, results of operations, financial condition or cash flows may be materially adverselyaffected.
The market price of our common stock may fluctuate as a result of a variety of factors.
The market price of our common stock could fluctuate significantly in response to variousfactors, many of which are beyond our control, including:
• volatility in the financial markets;
• actual or anticipated variations in our quarterly or annual financial results;
• announcements or significant developments with respect to beauty products or the beautyindustry in general;
• general economic and political conditions;
• governmental policies and regulations; and
• financial analyst and rating agency actions.
Our global information systems are subject to outages, hacking and other risks and thefailure to adequately maintain the security of our electronic and confidential informationcould materially adversely affect our financial condition and results of operations.
We have information systems that support our business processes, including supply chain,marketing, sales, order processing, distribution, finance and intracompany communicationsthroughout the world. We are commencing an upgrade to certain of our information systems relatingto our supply chain and logistics functions, which will require a substantial investment anddedication of management resources. In addition, all of our global information systems aresusceptible to outages due to fire, floods, tornadoes, hurricanes, power loss, telecommunicationsfailures, security breaches and similar events. Despite the implementation of network securitymeasures, our systems may also be vulnerable to computer viruses, “hacking” and similardisruptions from unauthorized tampering. Our business, prospects, results of operations, financialcondition or cash flows may be adversely affected by the occurrence of these or other events thatcould disrupt or damage our information systems, any failure to properly maintain or upgrade ourinformation systems, and/or any failure to implement our supply chain and logistics informationsystem upgrade on a timely and cost-effective basis.
30

In addition, as part of our normal business activities, we collect and store certain confidentialinformation, including personal information with respect to customers and employees. In addition,the success of our e-commerce operations depends on the secure transmission of confidential andpersonal data over public networks, including the use of cashless payments. Any failure on the partof us or our vendors to properly maintain the security of our confidential data and our employees’and customers’ personal information could result in business disruption, damage to our reputation,financial obligations to third parties, fines, penalties, regulatory proceedings and private litigationwith potentially large costs and other competitive disadvantages, and could accordingly have amaterial adverse impact on our business, financial condition and results of operations.
We outsource certain functions, making us dependent on the entities and facilitiesperforming those functions.
We are continually looking for opportunities to secure essential business services in a more cost-effective manner, without impacting the quality of the service rendered. In some cases, this requiresthe outsourcing of functions or parts of functions that can be performed more effectively by externalservice providers. These include certain information systems functions such as informationtechnology operations, certain human resource functions such as payroll processing and employeebenefit plan administration, and our European logistics management. We believe that we conductappropriate due diligence before entering into agreements with the outsourcing entity, and we useservice level agreements and operating metrics to monitor and assess performance. We believe thefailure of one or more entities to properly provide the expected services without disruption, providethem on a timely basis or to provide them at the prices we expect may have a material adverse effecton our results of operations or financial condition. In addition, substantially all of our data centeroperations are located in a facility in Raleigh, North Carolina, and any loss of or damage to thefacility could have a material adverse effect on our business, results of operations, prospects,financial condition or cash flows.
Our success depends, in part, on our ability to successfully manage our inventories.
The competitive nature of the beauty industry and rapidly changing consumer preferencesrequire constant product innovation and have led to the shortening of product life cycles. As a result,we monitor our inventories based on forecasted demand, the estimated market value and shelf life ofour inventory and our historic experience. If we misjudge consumer preferences or demands orfuture sales do not reach forecasted levels, however, we could have excess inventory that we mayneed to hold for a long period of time, write down, sell at prices lower than expected or discard. Ifwe are not successful in managing our inventory, our business, results of operations, financialcondition, or cash flows could be adversely affected.
ITEM 1B. UNRESOLVED STAFF COMMENTS
None.
ITEM 2. PROPERTIES
United States. Our corporate headquarters are located in Miramar, Florida, where we leaseapproximately 32,000 square feet of general office space under a lease that expires in June 2016.Our U.S. fulfillment operations are conducted in our Roanoke, Virginia distribution facility thatconsists of approximately 400,000 square feet and is leased through September 2023. We also lease(i) a 76,000-square foot warehouse in Roanoke to coordinate returns processing that is leasedthrough December 2015, and (ii) a 274,000-square foot warehouse in Salem, Virginia primarilydedicated to third party assembly that is leased through March 2016. From time to time, we alsolease additional temporary warehouse facilities to handle inventory overflow. We leaseapproximately 50,000 square feet of general office space for our supply chain, information systemsand finance operations in Stamford, Connecticut under a lease that expires October 2021. We lease
31

approximately 63,000 square feet of general office space primarily for our marketing operations inNew York City under leases that expire in December 2015 and October 2017, and we entered intoan additional lease at that location for approximately 10,000 square feet that will be used for a newElizabeth Arden Red Door Spa and Elizabeth Arden retail store. We also lease small offices inBentonville, Arkansas and Minneapolis, Minnesota, and have retail outlet stores that are located inFlorida, New York, Texas, Georgia, Virginia, Nevada and Arizona for which we lease approximately1,000 to 2,000 square feet, depending on the location.
International. Our international operations are headquartered in offices in Geneva,Switzerland that are leased through 2017. We also lease offices in Australia, Brazil, Canada, China,Denmark, France, Germany, Italy, Russia New Zealand, Puerto Rico, Singapore, South Africa,South Korea, Spain, Taiwan, and the United Kingdom. We own a small manufacturing anddistribution facility in South Africa primarily to manufacture and distribute local requirements ofour fragrance products.
We believe that additional office, warehouse and retail space suitable for our needs isreasonably available in the markets in which we operate.
ITEM 3. LEGAL PROCEEDINGS
We are a party to a number of legal actions, proceedings, claims and disputes, arising in theordinary course of business, including those with current and former customers over amounts owed.While any action, proceeding or claim contains an element of uncertainty and it is possible that ourcash flows and results of operations in a particular quarter or year could be materially affected bythe impact of such actions, proceedings, claims and disputes, based on current facts andcircumstances our management believes that the outcome of such actions, proceedings, claims anddisputes will not have a material adverse effect on our business, prospects, results of operations,financial condition or cash flows.
The IRS began an examination of the Company’s U.S. federal tax returns for the years endedJune 30, 2008 (Fiscal 2008) and June 30, 2009 (Fiscal 2009) during fiscal year 2011 and, in May2013 issued an IRS Letter 950, known as a 30-day Letter for Fiscal 2008 and Fiscal 2009 relatingto transfer pricing matters. In the 30-day Letter, the IRS proposed adjustments that would increasethe Company’s U.S. taxable income for Fiscal 2008 and Fiscal 2009 by approximately $29.1million, which could be material to the Company’s consolidated statements of operations in theperiod in which resolved unless resolved favorably by the Company. The Company disagrees withthe proposed adjustments, has filed a protest commencing the appeals process and intends tovigorously contest them and pursue its available remedies. While any IRS examination contains anelement of uncertainty, based on current facts and circumstances, the Company believes the ultimateoutcome at IRS appeals or any judicial process, if necessary, will not have a material adverse effecton the Company’s financial condition, business or prospects. In addition, if the examination is notresolved favorably, the Company has $105 million of U.S. federal operating loss carryforwards as ofJune 30, 2013, of which $60 million would be available to offset any cash flow impact.
ITEM 4. MINE SAFETY DISCLOSURES
Not applicable.
32

PART II
ITEM 5. MARKET FOR REGISTRANT’S COMMON EQUITY, RELATED STOCKHOLDERMATTERS AND ISSUER PURCHASES OF EQUITY SECURITIES
Market Information. Our common stock, $.01 par value per share, has been traded on theNASDAQ Global Select Market under the symbol “RDEN” since January 25, 2001. The followingtable sets forth the high and low sales prices for our common stock, as reported by NASDAQ foreach of our fiscal quarters from July 1, 2011 through June 30, 2013.
Quarter Ended High Low
6/30/13 . . . . . . . . . . . . . . . . . . . . . . . . . . . . . . . . . . . . . . . . . . . . . . . . . . . $49.47 $38.653/31/13 . . . . . . . . . . . . . . . . . . . . . . . . . . . . . . . . . . . . . . . . . . . . . . . . . . . $49.57 $35.1012/31/12 . . . . . . . . . . . . . . . . . . . . . . . . . . . . . . . . . . . . . . . . . . . . . . . . . . $49.75 $42.809/30/12 . . . . . . . . . . . . . . . . . . . . . . . . . . . . . . . . . . . . . . . . . . . . . . . . . . . $47.82 $36.336/30/12 . . . . . . . . . . . . . . . . . . . . . . . . . . . . . . . . . . . . . . . . . . . . . . . . . . . $40.19 $32.733/31/12 . . . . . . . . . . . . . . . . . . . . . . . . . . . . . . . . . . . . . . . . . . . . . . . . . . . $39.96 $30.9612/31/11 . . . . . . . . . . . . . . . . . . . . . . . . . . . . . . . . . . . . . . . . . . . . . . . . . . $37.94 $28.039/30/11 . . . . . . . . . . . . . . . . . . . . . . . . . . . . . . . . . . . . . . . . . . . . . . . . . . . $34.62 $25.86
Holders. As of August 8, 2013, there were 344 record holders of our common stock. Thenumber of record holders does not include beneficial owners of common stock whose shares are heldin the names of banks, brokers, nominees or other fiduciaries.
Dividends. We have not declared any cash dividends on our common stock since we became abeauty products company in 1995, and we currently have no plans to declare dividends on ourcommon stock in the foreseeable future. Any future determination by our board of directors to paydividends on our common stock will be made only after considering our financial condition, resultsof operations, capital requirements and other relevant factors. Additionally, our revolving creditfacility, our second lien facility and the indenture relating to our 7 3/8% senior notes due 2021restrict our ability to pay cash dividends based upon our ability to satisfy certain financialcovenants, including having a certain amount of borrowing capacity and satisfying a fixed chargecoverage ratio after the payment of the dividends. See Notes 8 and 9 to the Notes to ConsolidatedFinancial Statements.
Performance Graph. The following performance graph data and table compare the cumulativetotal shareholder returns, including the reinvestment of dividends, on our common stock with theRussell 2000 Index and a market-weighted index of publicly traded peer companies for the fivefiscal years from July 1, 2008 through June 30, 2013.
We have elected to modify our peer group to include two new beauty products companies(L’Oréal Paris and Shiseido Company Limited) and remove International Flavors and Fragrances,Inc. and Physicians Formula Holdings, Inc. Physicians Formula Holdings is no longer publiclytraded, and we believe that L’Oréal Paris is more comparable to our business than InternationalFlavors and Fragrances in terms of channels of distribution and products sold. We believe that ournewly-selected peer group is a good representation of beauty companies with similar marketcapitalizations, channels of distribution and/or products as our company. The publicly tradedcompanies in our new peer group are The Estee Lauder Companies Inc., Inter Parfums, Inc., L’OréalParis, Revlon, Inc., and Shiseido Company Limited. The publicly traded companies in our old peergroup were The Estee Lauder Companies Inc., International Flavors and Fragrances, Inc., InterParfums, Inc., Physicians Formula Holdings, Inc., and Revlon, Inc. The graph and table assume that$100 was invested on June 30, 2008 in each of the Russell 2000 Index, each of the new and old peergroups, and our common stock, and that all dividends were reinvested.
33

6/08 6/09 6/10 6/11 6/12 6/13
COMPARISON OF 5 YEAR CUMULATIVE TOTAL RETURNAmong Elizabeth Arden, Inc., the Russell 2000 Index,
New Peer Group, and Old Peer Group
Elizabeth Arden, Inc. Russell 2000 New Peer Group
$0
$50
$100
$150
$200
$300
$250
$350
Old Peer Group
Fiscal Year EndedJune 30,
2009 2010 2011 2012 2013
Elizabeth Arden, Inc. . . . . . . . . . . . . . . . . . . . . . . . . . . . 57.51 95.65 191.24 255.67 296.71Russell 2000 . . . . . . . . . . . . . . . . . . . . . . . . . . . . . . . . . 74.99 91.10 125.18 122.58 152.25New Peer Group . . . . . . . . . . . . . . . . . . . . . . . . . . . . . . 70.32 91.26 127.27 117.38 168.79Old Peer Group . . . . . . . . . . . . . . . . . . . . . . . . . . . . . . . 75.23 120.19 212.29 207.27 269.54
34

Issuer Purchases of Equity Securities. This table provides information with respect to ourpurchases of shares of our common stock, $.01 par value per share, during the three months endedJune 30, 2013.
Issuer Purchases of Equity Securities
(a) (b) (c) (d)
Period
Total Numberof Shares
Purchased
AveragePrice PaidPer Share
Total Numberof Shares
Purchased asPart of
PubliclyAnnounced
Plans orPrograms(1)
ApproximateDollar Valuethat May Yet
Be PurchasedUnder thePlans or
Programs(2)
April 1, 2013 through April 30, 2013 . . . . . . 1,123 $38.93 1,123 $40,443,610May 1, 2013 through May 31, 2013 . . . . . . . 8,889 $38.93 8,889 $40,097,568June 1, 2013 through June 30, 2013 . . . . . . . — $ N/A — $40,097,568
Totals . . . . . . . . . . . . . . . . . . . . . . . . . . . . . . . 10,012 $38.93 10,012 $40,097,568
(1) On November 2, 2010, our board of directors authorized the repurchase of an additional $40million of our common stock under the terms of an existing $80 million common stockrepurchase program and extended the term of the stock repurchase program fromNovember 30, 2010 to November 30, 2012. On August 7, 2012, our board of directorsapproved an extension of the stock repurchase program through November 30, 2014. Allshares purchased during the quarter ended June 30, 2013 were purchased on the open market.
(2) Amounts reflect the remaining dollar value of shares that may be purchased under the stockrepurchase program described above.
[Remainder of page intentionally left blank.]
35
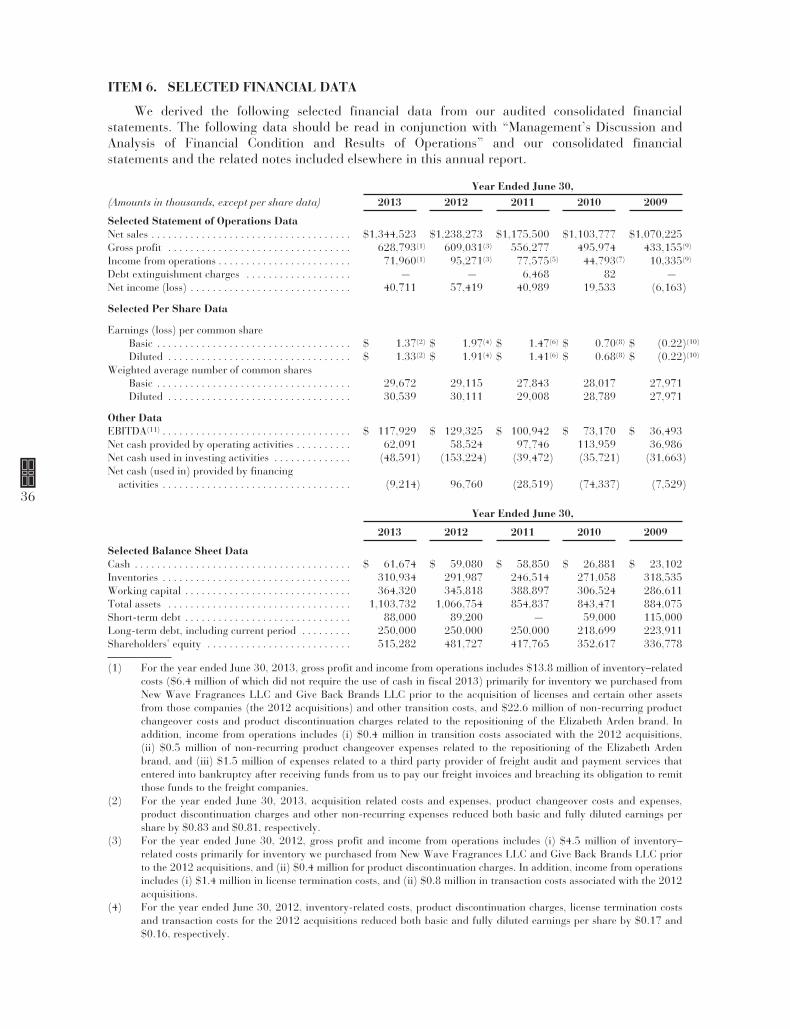
ITEM 6. SELECTED FINANCIAL DATA
We derived the following selected financial data from our audited consolidated financialstatements. The following data should be read in conjunction with “Management’s Discussion andAnalysis of Financial Condition and Results of Operations” and our consolidated financialstatements and the related notes included elsewhere in this annual report.
Year Ended June 30,(Amounts in thousands, except per share data) 2013 2012 2011 2010 2009
Selected Statement of Operations DataNet sales . . . . . . . . . . . . . . . . . . . . . . . . . . . . . . . . . . . . $1,344,523 $1,238,273 $1,175,500 $1,103,777 $1,070,225Gross profit . . . . . . . . . . . . . . . . . . . . . . . . . . . . . . . . . 628,793(1) 609,031(3) 556,277 495,974 433,155(9)
Income from operations . . . . . . . . . . . . . . . . . . . . . . . . 71,960(1) 95,271(3) 77,575(5) 44,793(7) 10,335(9)
Debt extinguishment charges . . . . . . . . . . . . . . . . . . . — — 6,468 82 —Net income (loss) . . . . . . . . . . . . . . . . . . . . . . . . . . . . . 40,711 57,419 40,989 19,533 (6,163)
Selected Per Share Data
Earnings (loss) per common shareBasic . . . . . . . . . . . . . . . . . . . . . . . . . . . . . . . . . . . $ 1.37(2) $ 1.97(4) $ 1.47(6) $ 0.70(8) $ (0.22)(10)
Diluted . . . . . . . . . . . . . . . . . . . . . . . . . . . . . . . . . $ 1.33(2) $ 1.91(4) $ 1.41(6) $ 0.68(8) $ (0.22)(10)
Weighted average number of common sharesBasic . . . . . . . . . . . . . . . . . . . . . . . . . . . . . . . . . . . 29,672 29,115 27,843 28,017 27,971Diluted . . . . . . . . . . . . . . . . . . . . . . . . . . . . . . . . . 30,539 30,111 29,008 28,789 27,971
Other DataEBITDA(11) . . . . . . . . . . . . . . . . . . . . . . . . . . . . . . . . . . $ 117,929 $ 129,325 $ 100,942 $ 73,170 $ 36,493Net cash provided by operating activities . . . . . . . . . . 62,091 58,524 97,746 113,959 36,986Net cash used in investing activities . . . . . . . . . . . . . . (48,591) (153,224) (39,472) (35,721) (31,663)Net cash (used in) provided by financing
activities . . . . . . . . . . . . . . . . . . . . . . . . . . . . . . . . . . (9,214) 96,760 (28,519) (74,337) (7,529)
Year Ended June 30,
2013 2012 2011 2010 2009
Selected Balance Sheet DataCash . . . . . . . . . . . . . . . . . . . . . . . . . . . . . . . . . . . . . . . $ 61,674 $ 59,080 $ 58,850 $ 26,881 $ 23,102Inventories . . . . . . . . . . . . . . . . . . . . . . . . . . . . . . . . . . 310,934 291,987 246,514 271,058 318,535Working capital . . . . . . . . . . . . . . . . . . . . . . . . . . . . . . 364,320 345,818 388,897 306,524 286,611Total assets . . . . . . . . . . . . . . . . . . . . . . . . . . . . . . . . . 1,103,732 1,066,754 854,837 843,471 884,075Short-term debt . . . . . . . . . . . . . . . . . . . . . . . . . . . . . . 88,000 89,200 — 59,000 115,000Long-term debt, including current period . . . . . . . . . 250,000 250,000 250,000 218,699 223,911Shareholders’ equity . . . . . . . . . . . . . . . . . . . . . . . . . . 515,282 481,727 417,765 352,617 336,778
(1) For the year ended June 30, 2013, gross profit and income from operations includes $13.8 million of inventory–relatedcosts ($6.4 million of which did not require the use of cash in fiscal 2013) primarily for inventory we purchased fromNew Wave Fragrances LLC and Give Back Brands LLC prior to the acquisition of licenses and certain other assetsfrom those companies (the 2012 acquisitions) and other transition costs, and $22.6 million of non-recurring productchangeover costs and product discontinuation charges related to the repositioning of the Elizabeth Arden brand. Inaddition, income from operations includes (i) $0.4 million in transition costs associated with the 2012 acquisitions,(ii) $0.5 million of non-recurring product changeover expenses related to the repositioning of the Elizabeth Ardenbrand, and (iii) $1.5 million of expenses related to a third party provider of freight audit and payment services thatentered into bankruptcy after receiving funds from us to pay our freight invoices and breaching its obligation to remitthose funds to the freight companies.
(2) For the year ended June 30, 2013, acquisition related costs and expenses, product changeover costs and expenses,product discontinuation charges and other non-recurring expenses reduced both basic and fully diluted earnings pershare by $0.83 and $0.81, respectively.
(3) For the year ended June 30, 2012, gross profit and income from operations includes (i) $4.5 million of inventory–related costs primarily for inventory we purchased from New Wave Fragrances LLC and Give Back Brands LLC priorto the 2012 acquisitions, and (ii) $0.4 million for product discontinuation charges. In addition, income from operationsincludes (i) $1.4 million in license termination costs, and (ii) $0.8 million in transaction costs associated with the 2012acquisitions.
(4) For the year ended June 30, 2012, inventory-related costs, product discontinuation charges, license termination costsand transaction costs for the 2012 acquisitions reduced both basic and fully diluted earnings per share by $0.17 and$0.16, respectively.
36

(5) For the year ended June 30, 2011, income from operations includes (i) $0.3 million of restructuring expenses related toour Global Efficiency Re-engineering initiative (the Initiative), and (ii) $0.3 million of expenses related toimplementation of our Oracle accounting and order processing systems.
(6) For the year ended June 30, 2011, debt extinguishment charges, restructuring expenses related to the Initiative andOracle accounting and order processing systems implementation costs reduced both basic and fully diluted earningsper share by $0.15.
(7) For the year ended June 30, 2010, income from operations includes (i) $3.9 million of expenses related toimplementation of our Oracle accounting and order processing systems, (ii) $1.9 million of restructuring expensesrelated to the Initiative, and (iii) $1.5 million of restructuring expenses that are not related to the Initiative.
(8) For the year ended June 30, 2010, Oracle accounting and order processing systems implementation costs, restructuringexpenses and debt extinguishment charges reduced basic and fully diluted earnings per share by $0.20 and $0.19,respectively.
(9) For the year ended June 30, 2009, gross profit and income from operations includes costs related to the globallicensing agreement with Liz Claiborne of $18.9 million (which did not require the use of cash in fiscal 2009) for theLiz Claiborne inventory we purchased at a higher cost prior to the effective date of the license agreement and $4.4million ($1.0 million in gross profit) of Liz Claiborne transition expenses. In addition, income from operations includes(i) $3.4 million of expenses related to implementation of our Oracle accounting and order processing systems, (ii) $3.5million of restructuring expenses related to the Initiative, and (iii) $1.1 million of restructuring expenses that are notrelated to the Initiative.
(10) For the year ended June 30, 2009, Liz Claiborne related expenses, Oracle accounting and order processing systemsimplementation costs and restructuring expenses reduced basic and fully diluted earnings per share by $0.70 and$0.69, respectively.
(11) EBITDA is defined as net income plus the provision for income taxes (or net loss less the benefit from income taxes),plus interest expense, plus depreciation and amortization expense. EBITDA should not be considered as an alternativeto operating income (loss) or net income (loss) (as determined in accordance with generally accepted accountingprinciples) as a measure of our operating performance or to net cash provided by operating, investing and financingactivities (as determined in accordance with generally accepted accounting principles) or as a measure of our ability tomeet cash needs. We believe that EBITDA is a measure commonly reported and widely used by investors and otherinterested parties as a measure of a company’s operating performance and debt servicing ability because it assists incomparing performance on a consistent basis without regard to capital structure (particularly when acquisitions areinvolved), depreciation and amortization, or non-operating factors such as historical cost. Accordingly, as a result ofour capital structure, we believe EBITDA is a relevant measure. This information has been disclosed here to permit amore complete comparative analysis of our operating performance and debt servicing ability relative to othercompanies. EBITDA may not, however, be comparable in all instances to other similar types of measures.
In addition, EBITDA has limitations as an analytical tool, including the fact that:
• it does not reflect our cash expenditures, future requirements for capital expenditures orcontractual commitments;
• it does not reflect the significant interest expense or the cash requirements necessary toservice interest or principal payments on our debt;
• it does not reflect any cash income taxes that we may be required to pay; and
• although depreciation and amortization are non-cash charges, the assets being depreciatedand amortized will often have to be replaced in the future and these measures do not reflectany cash requirements for such replacements.
The following is a reconciliation of net income (loss) as determined in accordance with generallyaccepted accounting principles, to EBITDA:
Year Ended June 30,(Amounts in thousands) 2013 2012 2011 2010 2009
Net income (loss) . . . . . . . . . . . . . . . . . . . $ 40,711 $ 57,419 $ 40,989 $19,533 $ (6,163)Provision for (benefit from) income
taxes . . . . . . . . . . . . . . . . . . . . . . . 6,940 16,093 8,637 3,293 (8,316)Interest expense . . . . . . . . . . . . . . . . 24,309 21,759 21,481 21,885 24,814Depreciation related to cost of goods
sold . . . . . . . . . . . . . . . . . . . . . . . . 6,386 5,257 5,089 5,040 4,416Depreciation and amortization . . . . 39,583 28,797 24,746 23,419 21,742
EBITDA . . . . . . . . . . . . . . . . . . . . . . . . . . $117,929(a) $129,325(b) $100,942(c) $73,170(d) $36,493(e)
37
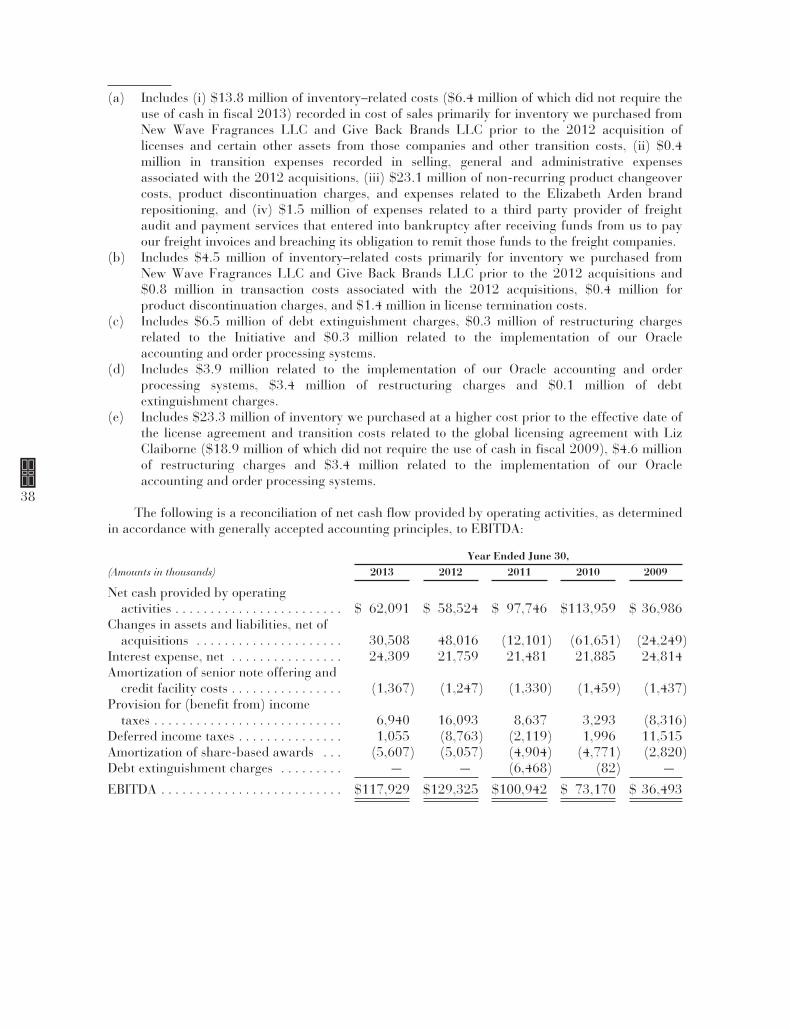
(a) Includes (i) $13.8 million of inventory–related costs ($6.4 million of which did not require theuse of cash in fiscal 2013) recorded in cost of sales primarily for inventory we purchased fromNew Wave Fragrances LLC and Give Back Brands LLC prior to the 2012 acquisition oflicenses and certain other assets from those companies and other transition costs, (ii) $0.4million in transition expenses recorded in selling, general and administrative expensesassociated with the 2012 acquisitions, (iii) $23.1 million of non-recurring product changeovercosts, product discontinuation charges, and expenses related to the Elizabeth Arden brandrepositioning, and (iv) $1.5 million of expenses related to a third party provider of freightaudit and payment services that entered into bankruptcy after receiving funds from us to payour freight invoices and breaching its obligation to remit those funds to the freight companies.
(b) Includes $4.5 million of inventory–related costs primarily for inventory we purchased fromNew Wave Fragrances LLC and Give Back Brands LLC prior to the 2012 acquisitions and$0.8 million in transaction costs associated with the 2012 acquisitions, $0.4 million forproduct discontinuation charges, and $1.4 million in license termination costs.
(c) Includes $6.5 million of debt extinguishment charges, $0.3 million of restructuring chargesrelated to the Initiative and $0.3 million related to the implementation of our Oracleaccounting and order processing systems.
(d) Includes $3.9 million related to the implementation of our Oracle accounting and orderprocessing systems, $3.4 million of restructuring charges and $0.1 million of debtextinguishment charges.
(e) Includes $23.3 million of inventory we purchased at a higher cost prior to the effective date ofthe license agreement and transition costs related to the global licensing agreement with LizClaiborne ($18.9 million of which did not require the use of cash in fiscal 2009), $4.6 millionof restructuring charges and $3.4 million related to the implementation of our Oracleaccounting and order processing systems.
The following is a reconciliation of net cash flow provided by operating activities, as determinedin accordance with generally accepted accounting principles, to EBITDA:
Year Ended June 30,(Amounts in thousands) 2013 2012 2011 2010 2009
Net cash provided by operatingactivities . . . . . . . . . . . . . . . . . . . . . . . . $ 62,091 $ 58,524 $ 97,746 $113,959 $ 36,986
Changes in assets and liabilities, net ofacquisitions . . . . . . . . . . . . . . . . . . . . . 30,508 48,016 (12,101) (61,651) (24,249)
Interest expense, net . . . . . . . . . . . . . . . . 24,309 21,759 21,481 21,885 24,814Amortization of senior note offering and
credit facility costs . . . . . . . . . . . . . . . . (1,367) (1,247) (1,330) (1,459) (1,437)Provision for (benefit from) income
taxes . . . . . . . . . . . . . . . . . . . . . . . . . . . 6,940 16,093 8,637 3,293 (8,316)Deferred income taxes . . . . . . . . . . . . . . . 1,055 (8,763) (2,119) 1,996 11,515Amortization of share-based awards . . . (5,607) (5,057) (4,904) (4,771) (2,820)Debt extinguishment charges . . . . . . . . . — — (6,468) (82) —
EBITDA . . . . . . . . . . . . . . . . . . . . . . . . . . $117,929 $129,325 $100,942 $ 73,170 $ 36,493
38
ITEM 7. MANAGEMENT’S DISCUSSION AND ANALYSIS OF FINANCIAL CONDITION ANDRESULTS OF OPERATIONS
The following discussion and analysis should be read in conjunction with the consolidatedfinancial statements and the accompanying notes which appear elsewhere in this document.
Overview
We are a global prestige beauty products company with an extensive portfolio of prestigefragrance, skin care and cosmetics brands. Our extensive product portfolio includes the following:
Elizabeth ArdenBrand
The Elizabeth Arden skin care brands: VisibleDifference, Ceramide, Prevage, and Eight Hour Cream,Elizabeth Arden branded lipstick, foundation and othercolor cosmetics products, and the Elizabeth Ardenfragrances: Red Door, Elizabeth Arden 5th Avenue,Elizabeth Arden Green Tea and UNTOLD
Celebrity Fragrances The fragrance brands of Britney Spears, ElizabethTaylor, Mariah Carey, Taylor Swift, Justin Bieber, NickiMinaj and Usher
Lifestyle Fragrances Curve, Giorgio Beverly Hills, PS Fine Cologne and WhiteShoulders
Designer Fragrances Juicy Couture, Alfred Sung, BCBGMAXAZRIA, EdHardy, Geoffrey Beene, Halston, John Varvatos, Lucky,Rocawear and True Religion
In addition to our owned and licensed fragrance brands, we distribute approximately 250additional prestige fragrance brands, primarily in the United States, through distribution agreementsand other purchasing arrangements. In August 2011, we amended our long-term license agreementwith Liz Claiborne, Inc. and certain of its affiliates and acquired all of the U.S. and internationaltrademarks for the Curve fragrance brands as well as trademarks for certain other smaller fragrancebrands. The amendment established a lower effective royalty rate for the remaining licensedfragrance brands, including Juicy Couture and Lucky Brand fragrances, reduced the futureminimum guaranteed royalties for the term of the license, and required a pre-payment of royaltiesfor the remainder of calendar 2011. We paid Liz Claiborne, Inc. and its affiliates $58.4 million incash in connection with this transaction. We capitalized $43.9 million of the $58.4 million cash paidas exclusive brand trademarks and the balance was recorded as a prepaid asset associated with thesettlement of royalties for the remainder of calendar year 2011 and the buy-down of future royaltiesfor 2012 and beyond.
In May 2012, we acquired the global licenses and certain related assets, including inventory, forthe Ed Hardy, True Religion and BCBGMAXAZRIA fragrance brands from New Wave Fragrances,LLC. Prior to the acquisition, we had been acting as a distributor of the Ed Hardy and TrueReligion fragrances to certain mid-tier and mass retailers in the North America. The total cost of theacquisition was $60.1 million, including amounts paid for inventory of $19.8 million, of which$58.1 million was paid in cash and $2 million was retained by us and was scheduled to be paid inthe third quarter of fiscal 2013, subject to the settlement of certain post-closing adjustments. Thefull $2 million of the purchase price that we retained was offset by post-closing adjustments and wasnot paid to New Wave Fragrances, LLC. This transaction was accounted for as a businesscombination. See Note 11 to the Notes to Consolidated Financial Statements for further informationon the acquisition and allocation of the purchase price.
In June 2012, we also acquired the global licenses and certain assets related to the Justin Bieberand Nicki Minaj fragrance brands, including inventory of the Justin Bieber fragrances, from Give
39
Back Brands LLC. In connection with the acquisition, we paid Give Back Brands LLC $26.5 million,including $3.6 million for inventory. In addition, we have issued to Give Back Brands LLC asubordinated note in the principal amount of $28 million, payable upon the achievement of specifiednet sales targets for the acquired brands over the three-year period from July 1, 2012 throughJune 30, 2015. Based on results for the six months ended December 31, 2012, conditions forpayment of the first $5 million installment were satisfied, and such installment was paid during thethird quarter of fiscal 2013. In addition, based on the results for fiscal 2013, conditions for paymentof the second $5 million installment have been satisfied and such installment is payable during thefirst quarter of fiscal 2014. This transaction was accounted for as a business combination. See Note11 to the Notes to Consolidated Financial Statements for further information on the acquisition andallocation of the purchase price.
For ease of reference in this Form 10-K, the acquisitions from New Wave Fragrances LLC andGive Back Brands LLC are referred to herein on a collective basis as the 2012 acquisitions.
In fiscal 2013, we invested a total of $7.6 million, including transaction costs, for a minorityinvestment in Elizabeth Arden Salon Holdings, LLC, an unrelated entity whose subsidiaries operatethe Elizabeth Arden Red Door Spas and the Mario Tricoci Hair Salons. The investment was madewith the intent of accelerating the growth of the spa business in parallel with the growth of theElizabeth Arden brand and the Elizabeth Arden brand repositioning. The investment, which is in theform of a collateralized convertible note bearing interest at 2%, has been accounted for using thecost method and at June 30, 2013, is included in other assets on our consolidated balance sheet. Weexpect to invest an additional $2.1 million in fiscal 2014.
Our business strategy is currently focused on two important initiatives: the global repositioningof the Elizabeth Arden brand and expanding the market penetration of our prestige fragranceportfolio in international markets, especially in the large European fragrance market, as well asgrowing markets such as Brazil and Russia. We also intend to continue to increase net sales,operating margins and earnings by continuing to expand the prestige fragrance category at massretail customers in North America and continuing to improve working capital efficiency and returnon invested capital. We believe that our focus on organic growth opportunities for our existingbrands, new licensing opportunities and acquisitions, and new product innovation will assist us inachieving these goals.
We are in the process of a comprehensive brand repositioning for the Elizabeth Arden brand,which is designed to honor the heritage of the brand while modernizing the brand’s presentation andincreasing its relevance among target consumers. The brand repositioning includes a revised productassortment, improved product formulations, package redesign, counter redesign, new advertisingand marketing vehicles, and enhanced beauty advisor support. The initial roll-out was limited to anumber of flagship retail doors. During fiscal 2013, we introduced our new product assortment toour prestige retail customers and replaced most of such flagship retail counters with new counters.We also extended elements of the new advertising, marketing and beauty advisor programs beyondour global flagship retail doors to the next tier of approximately 200 retail doors globally. To date,we have incurred pre-tax costs and expenses of $23.1 million in connection with the brandrepositioning. In fiscal 2014, we expect to incur $11 million to $16 million in additional costs andexpenses in connection with the continued roll-out of the Elizabeth Arden brand repositioning and toexit unprofitable retail doors in certain markets. The specific facts and circumstances of thecontinued roll- out of the repositioning will impact the timing and amount of any such costs andexpenses as well as capital expenditures.
In fiscal 2013, we recorded pre-tax costs and expenses of $23.1 million in connection with thebrand repositioning, including $13.1 million for non-recurring product changeover costs andexpenses and $10.0 million for product discontinuation charges. The non-recurring productchangeover costs and expenses related to the shipping of new product assortment to retailers toreplace the older products. The product discontinuation charges resulted from our strategic decision,
40
based on our current evaluation of market demand and the status of the Elizabeth Arden brandrepositioning, not to incur the additional costs associated with using existing raw materials and othercomponents related to our older Elizabeth Arden skin care and color cosmetic products tomanufacture additional finished goods inventory of such products. This strategic decision was madein order to accelerate the execution of the Elizabeth Arden brand repositioning, which should enablesystematic improvement in our gross margins in future periods.
In fiscal 2014, we expect to incur approximately $5 million in restructuring related costs. Theseone-time restructuring costs include amounts for sales positions as well as other staff positions acrossvarious business units that are being eliminated to drive expense savings and additional operatingefficiencies. We are also implementing the last phase of an Oracle global enterprise system, whichincludes an upgrade to certain of our information systems relating to our global supply chain andlogistics functions. This is intended to further increase business efficiencies throughout our Companyto improve our cash flow, operating margins and profitability.
During fiscal 2013, we introduced several new Elizabeth Arden products including the newVisible Difference entry-level skin care regimen, Prevage Anti-aging + Intensive Repair Daily Serum,Prevage Clinical Lash + Brow Enhancing Serum, several new Ceramide skin care products, and anew Red Door fragrance, Red Door Aura. We also launched new products for several of ourfragrance brands, including Pink Friday Nicki Minaj, Wonderstruck Enchanted, our secondfragrance for Taylor Swift, Justin Beiber’s Girlfriend and Ed Hardy’s Skull & Roses.
In fiscal 2014, we plan to launch several new products across the Elizabeth Arden skin care,color and fragrance categories including Prevage Anti-aging Intensive Eye Serum and Prevage Anti-aging Treatment Booster Cleanser, a Ceramide Boosting 5- Minute Facial and a new Ceramide line,Flawless Future, Beautiful Color Lipstick, Flawless Finish Liquid Mineral Foundation and a newfragrance, UNTOLD. We also plan to launch several fragrances including Justin Bieber The Key,Taylor by Taylor Swift, our second fragrance for Nicki Minaj, BCBGMAXAZRIA Bon Genre and anew Britney Spears Fantasy fragrance.
In fiscal 2013, our gross margins were 240 basis points below our fiscal 2012 gross margins,including the negative impact of 270 basis points for costs associated with the Elizabeth Ardenbrand repositioning and the 2012 acquisitions of the licenses for Justin Bieber, Nicki Minaj, EdHardy, BCBGMAXAZRIA and True Religion fragrance brands. This 270 basis point gross marginimpact in the year ended June 30, 2013 represented an increase of 230 basis points over the 40 basispoint impact of these costs in the year ended June 30, 2012. As we complete the integration of the2012 acquisitions and implement the key drivers of our success from the repositioning for theElizabeth Arden brand across a larger segment of the business, we expect to begin to see systematicimprovement in our gross margin during the second half of fiscal 2014. We continue to focus on(i) expanding gross margins through increased focus on product mix, improved pricing and reducedsales dilution, (ii) improving our sales and operations planning processes and our supply chain andlogistics efficiency and, (iii) leveraging our overhead structure by increasing sales of ourInternational segment.
We manage our business by evaluating net sales, gross margins, EBITDA (as defined in Note 11under Item 6 “Selected Financial Data”), EBITDA margin, segment profit and working capitalutilization (including monitoring our levels of inventory, accounts receivable, operating cash flowand return on invested capital). We encounter a variety of challenges that may affect our businessand should be considered as described in Item 1A “Risk Factors” and in the section “Management’sDiscussion and Analysis of Financial Condition and Results of Operations — Forward-LookingInformation and Factors That May Affect Future Results.”
Critical Accounting Policies and Estimates
The preparation of our consolidated financial statements in conformity with U.S. generallyaccepted accounting principles requires us to make estimates and assumptions that affect the
41
amounts of assets, liabilities, revenues and expenses reported in those consolidated financialstatements. We base our estimates on historical experience and other factors that we believe aremost likely to occur. Changes in facts and circumstances may result in revised estimates, which arerecorded in the period in which they become known. Actual results could differ from those estimates.If these changes result in a material impact to the consolidated financial statements, their impact isdisclosed in “Management’s Discussion and Analysis of Financial Condition and Results ofOperations” and/or in the “Notes to the Consolidated Financial Statements.” The disclosures belowalso note situations in which it is reasonably likely that future financial results could be affected bychanges in these estimates and assumptions. The term “reasonably likely” refers to an occurrencethat is more than remote but less than probable in the judgment of management.
Our most critical accounting policies and estimates are described in detail below. See Note 1 tothe Notes to Consolidated Financial Statements — “General Information and Summary ofSignificant Accounting Policies,” for a discussion of these and other accounting policies.
Accounting for Acquisitions and Intangible Assets. Under the accounting for businesscombinations, consideration paid in an acquisition is allocated to the underlying assets andliabilities, based on their respective estimated fair values. The excess of the consideration paid at theacquisition date over the fair values of the identifiable assets acquired or liabilities assumed isrecorded as goodwill.
The judgments made in determining the estimated fair value and expected useful lives assignedto each class of assets and liabilities acquired can significantly affect net income. For example,different classes of assets will have useful lives that differ, and the useful life of property, plant, andequipment acquired will differ substantially from the useful life of brand licenses and trademarks.Consequently, to the extent a longer-lived asset is ascribed greater value under the purchase methodthan a shorter-lived asset, net income in a given period may be higher.
Determining the fair value of certain assets and liabilities acquired is judgmental in nature andoften involves the use of significant estimates and assumptions. One area that requires morejudgment is determining the fair value and useful lives of intangible assets. Because the fair valueand the estimated useful life of an intangible asset is a subjective estimate, it is reasonably likely thatcircumstances may cause the estimate to change. For example, if we discontinue or experience adecline in the profitability of one or more of our brands, the value of the intangible assets associatedwith those brands or their useful lives may decline, or, certain intangible assets such as the ElizabethArden brand trademarks, may no longer be classified as an indefinite-lived asset, which could resultin additional charges to net income.
During the quarter ended June 30, 2012, we adopted the updated guidance to Topic 350,Intangibles-Goodwill and Other, issued by Financial Accounting Standards Board (“FASB”) inSeptember 2011, which simplifies how an entity assesses goodwill for impairment and allows anentity to first assess qualitative factors to determine whether it is necessary to perform the two-stepquantitative goodwill impairment assessment. An entity is no longer required to calculate the fairvalue of a reporting unit unless the entity determines, based on a qualitative assessment, that it ismore likely than not that its fair value is less than its carrying amount. Should a goodwillimpairment assessment be necessary, there is a two step process for assessing impairment ofgoodwill. The first step used to identify potential impairment compares the fair value of a reportingunit with its carrying amount, including goodwill. The second step, if necessary, measures theamount of the impairment by comparing the estimated fair value of the goodwill and intangibleassets to their respective carrying values. If an impairment is identified, the carrying value of theasset is adjusted to estimated fair value. See Note 1 to the Notes to Consolidated FinancialStatements.
In July 2012, the FASB issued another update to Codification Topic 350, Intangibles-Goodwilland Other: Testing Indefinite-Lived Intangible Assets for Impairment. This update simplifies the
42

guidance for testing impairment of indefinite-lived intangible assets other than goodwill. Examplesof intangible assets subject to the guidance include indefinite-lived trademarks, licenses, anddistribution rights. The amendments allow a company the option to first assess qualitative factors todetermine whether it is necessary to perform the quantitative impairment test. A company electingto perform a qualitative assessment is no longer required to calculate the fair value of an indefinite-lived intangible asset unless the company determines, based on such qualitative assessment, that it is“more likely than not” that the asset is impaired. The changes to Codification Topic 350 will beeffective for us beginning July 1, 2013, with early adoption permitted. We did not adopt the updatedguidance in Topic 350 for our annual impairment test of indefinite-lived intangible assets other thangoodwill performed during the quarter ended June 30, 2013. Adoption of the updated guidance isnot expected to have a material impact on our consolidated financial statements or disclosures.
Our intangible assets consist of exclusive brand licenses, trademarks, patents and otherintellectual property, customer relationships and lists, non-compete agreements and goodwill. Thevalue of these assets is exposed to future adverse changes if we experience declines in operatingresults or experience significant negative industry or economic trends. We have determined that theElizabeth Arden trademarks have indefinite useful lives as cash flows from the use of the trademarksare expected to be generated indefinitely. Goodwill and intangible assets with indefinite lives such asour Elizabeth Arden trademarks, are not amortized, but rather assessed for impairment at leastannually. We typically perform our annual impairment assessment during the fourth quarter of ourfiscal year or more frequently if events or changes in circumstances indicate the carrying value ofgoodwill may not fully be recoverable.
During the quarter ended June 30, 2013, we completed our annual impairment assessment ofthe Elizabeth Arden trademarks, with the assistance of a third party valuation firm. In assessing thefair value of these trademarks, we considered the income approach. Under the income approach, thefair value is based on the present value of estimated future cash flows. The analysis and assessmentsof these assets and goodwill indicated that no impairment adjustment was required as the estimatedfair value exceeded the recorded carrying value. A hypothetical 10% decrease to the fair value of ourElizabeth Arden trademarks or a hypothetical 1% increase in the discount rate used to estimate fairvalue would not result in an impairment of our Elizabeth Arden trademarks. During the quarterended June 30, 2013, we also completed our annual impairment assessment of goodwill using thequalitative assessment under the updated guidance to Topic 350. The analysis indicated that noimpairment adjustment was required. A hypothetical 10% decrease in the fair value of our NorthAmerica reporting unit would not result in an impairment of our goodwill.
Due to the ongoing uncertainty in capital market conditions, we will continue to monitor andevaluate the expected future cash flows of our reporting units and the long-term trends of ourmarket capitalization for the purposes of assessing the carrying value of our goodwill and indefinite-lived Elizabeth Arden trademarks, other trademarks and intangible assets. If market and economicconditions deteriorate, this could increase the likelihood of future material non-cash impairmentcharges to our results of operations related to our goodwill, indefinite-lived Elizabeth Ardentrademarks, or other trademarks and intangible assets.
Depreciation and Amortization. Depreciation and amortization is provided over the estimateduseful lives of the assets using the straight line method. Periodically, we review the lives assigned toour long-lived assets and adjust the lives, as circumstances dictate. Because estimated useful life is asubjective estimate, it is reasonably likely that circumstances may cause the estimate to change. Forexample, if we experience significant declines in net sales in certain channels of distribution, it couldaffect the estimated useful life of certain of our long-lived assets, such as counters or trade fixtures,which could result in additional charges to net income.
Long-Lived Assets. We review for the impairment of long-lived assets to be held and usedwhenever events or changes in circumstances indicate that the carrying amount of such assets maynot be fully recoverable. Measurement of an impairment loss is based on the fair value of the assetcompared to its carrying value. An impairment loss is recognized to the extent the carrying amount
43

of the asset exceeds its estimated fair value. Because the fair value is a subjective estimate, it isreasonably likely that circumstances may cause the estimate to change. The same circumstances thatcould affect the estimated useful life of a long-lived asset, as discussed above, could cause us tochange our estimate of the fair value of that asset, which could result in additional charges to netincome. We did not record any adjustments to our long-lived assets in fiscal 2013, 2012 or 2011.Long-lived assets to be disposed of are reported at the lower of carrying amount or fair value lesscosts to sell.
Revenue Recognition. Sales are recognized when title and risk of loss transfers to the customer,the sales price is fixed or determinable and collectability of the resulting receivable is probable. Salesare recorded net of estimated returns, markdowns and other allowances. The provision for salesreturns and markdowns represents management’s estimate of future returns and markdowns basedon historical experience and considering current external factors and market conditions.
Allowances for Sales Returns and Markdowns. As is customary in the prestige beauty business,we grant certain of our customers (primarily North American department stores and specialtybeauty stores), subject to our authorization and approval, the right to either return product forcredit against amounts previously billed or to receive a markdown allowance. Upon sale to suchcustomers, we record a provision for product returns and markdowns estimated based on our level ofsales, historical and projected experience with product returns and markdowns in each of ourbusiness segments and with respect to each of our product types, current economic trends andchanges in customer demand and customer mix. We make detailed estimates at the segment,product and customer level, which are then aggregated to arrive at a consolidated provision forproduct returns and markdowns and are reviewed periodically as facts and circumstances warrant.Such provisions and markdown allowances are recorded as a reduction of net sales. Because there isconsiderable judgment used in evaluating the allowance for returns and markdowns, it is reasonablylikely that actual experience will differ from our estimates. If, for example, customer demand for ourproducts is lower than estimated or a proportionately greater amount of sales is made to departmentstores and/or specialty beauty stores, additional provisions for returns or markdowns may berequired resulting in a charge to income in the period in which the determination was made.Similarly, if customer demand for our products is higher than estimated, a reduction of ourprovision for returns or markdowns may be required resulting in an increase to income in the periodin which the determination was made. As a percentage of gross sales, our returns and markdownswere 8.6%, 7.3% and 8.3% for the fiscal years ending June 30, 2013, 2012 and 2011, respectively.A hypothetical 5% change in the value of our allowance for sales returns and markdowns as ofJune 30, 2013 would result in a $1.2 million change to net income.
Allowances for Doubtful Accounts Receivable. We maintain allowances for doubtful accountsto cover uncollectible accounts receivable, and we evaluate our accounts receivable to determine ifthey will ultimately be collected. This evaluation includes significant judgments and estimates,including an analysis of receivables aging and a customer-by-customer review for large accounts. Itis reasonably likely that actual experience will differ from our estimates, which may result in anincrease or decrease in the allowance for doubtful accounts. If, for example, the financial conditionof our customers deteriorates resulting in an impairment of their ability to pay, additionalallowances may be required, resulting in a charge to income in the period in which thedetermination was made. A hypothetical 5% change in the value of our allowance for doubtfulaccounts receivable as of June 30, 2013 would result in a $0.1 million change to net income.
Provisions for Inventory Obsolescence. We record a provision for estimated obsolescence andshrinkage of inventory. Our estimates consider the cost of inventory, forecasted demand, theestimated market value, the shelf life of the inventory and our historical experience. Because of thesubjective nature of this estimate, it is reasonably likely that circumstances may cause the estimateto change. If, for example, demand for our products declines, or if we decide to discontinue certainproducts, we may need to increase our provision for inventory obsolescence which would result inadditional charges to net income. A hypothetical 5% change in the value of our provision forinventory obsolescence as of June 30, 2013 would result in a $1.4 million change to net income.
44

Hedge Contracts. We have designated each qualifying foreign currency contract we haveentered into as a cash flow hedge. Unrealized gains or losses, net of taxes, associated with thesecontracts are included in accumulated other comprehensive income on the balance sheet. Gains andlosses will only be recognized in earnings in the period in which the forecasted transaction affectsearnings or the transactions are no longer probable of occurring. Changes to fair value of anycontracts deemed to be ineffective would be recognized in earnings immediately.
Share-Based Compensation. All share-based payments to employees, including the grants ofemployee stock options, are recognized in the consolidated financial statements based on their fairvalues, but only to the extent that vesting is considered probable. Compensation cost for awards thatvest will not be reversed if the awards expire without being exercised. The fair value of stock optionsis determined using the Black-Scholes option-pricing model. The fair value of restricted stock andrestricted stock unit awards is based on the closing price of our common stock on the date of grant.Compensation costs for awards are amortized using the straight-line method. Option pricing modelinput assumptions such as expected term, expected volatility and risk-free interest rate impact thefair value estimate. Further, the forfeiture rate impacts the amount of aggregate compensation.These assumptions are subjective and generally require significant analysis and judgment to develop.When estimating fair value, some of the assumptions are based on or determined from external dataand other assumptions may be derived from our historical experience with share-basedarrangements. The appropriate weight to place on historical experience is a matter of judgment,based on relevant facts and circumstances.
We rely on our historical experience and post-vested termination activity to provide data forestimating our expected term for use in determining the fair value of our stock options. We currentlyestimate our stock volatility by considering our historical stock volatility experience and other keyfactors. The risk-free interest rate is the implied yield currently available on U.S. Treasury zero-coupon issues with a remaining term equal to the expected term used as the input to the Black-Scholes model. We estimate forfeitures using our historical experience. Our estimates of forfeitureswill be adjusted over the requisite service period based on the extent to which actual forfeituresdiffer, or are expected to differ, from their estimates. Because of the significant amount of judgmentused in these calculations, it is reasonably likely that circumstances may cause the estimate tochange. If, for example, actual forfeitures are lower than our estimate, additional charges to netincome may be required.
Income Taxes and Valuation Reserves. A valuation allowance may be required to reducedeferred tax assets to the amount that is more likely than not to be realized. We consider projectedfuture taxable income and ongoing tax planning strategies in assessing a potential valuationallowance. In the event we determine that we may not be able to realize all or part of our deferredtax asset in the future, or that new estimates indicate that a previously recorded valuation allowanceis no longer required, an adjustment to the deferred tax asset would likely be charged or credited tonet income in the period in which such determination was made.
We recognize in our consolidated financial statements the impact of a tax position if it is morelikely than not that such position will be sustained on audit based on its technical merits. While webelieve that our assessments of whether our tax positions are more likely than not to be sustained arereasonable, each assessment is subjective and requires the use of significant judgments. As a result,one or more of such assessments may prove ultimately to be incorrect, which could result in achange to net income. See Note 12 to the Notes to Consolidated Financial Statements.
Foreign Currency Contracts
We operate in several foreign countries, which expose us to market risk associated with foreigncurrency exchange rate fluctuations. Our risk management policy is to enter into cash flow hedges toreduce a portion of the exposure of our foreign subsidiaries’ revenues to fluctuations in currencyrates using foreign currency forward contracts. We also enter into cash flow hedges for a portion of
45
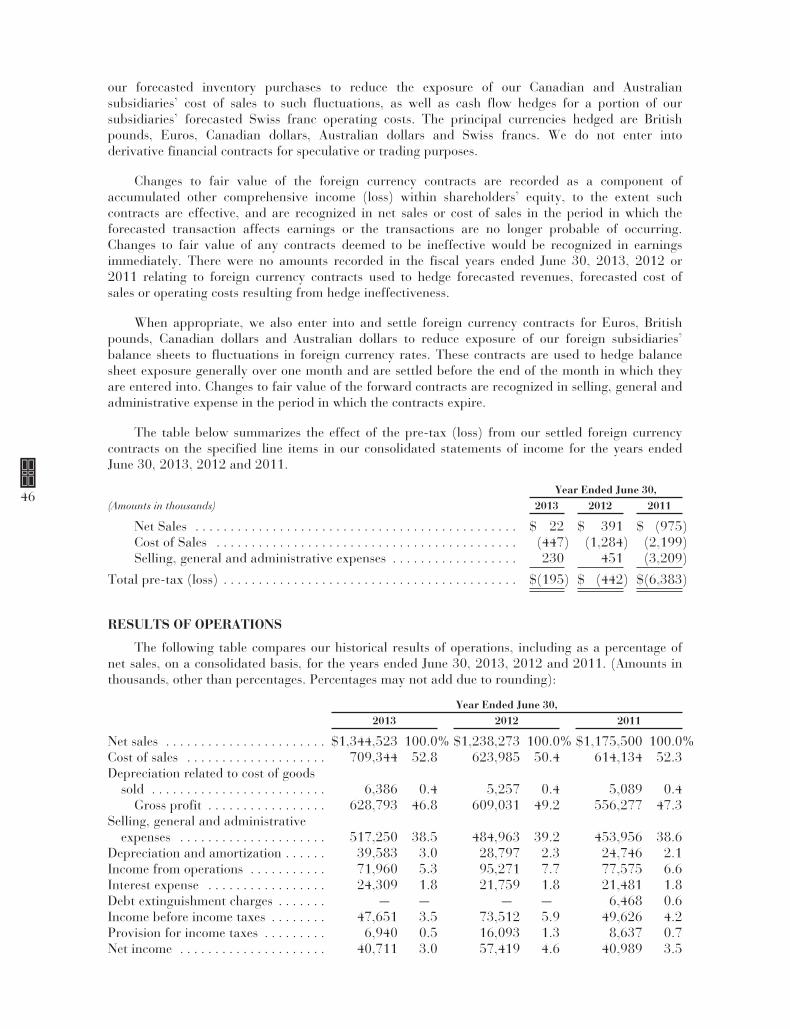
our forecasted inventory purchases to reduce the exposure of our Canadian and Australiansubsidiaries’ cost of sales to such fluctuations, as well as cash flow hedges for a portion of oursubsidiaries’ forecasted Swiss franc operating costs. The principal currencies hedged are Britishpounds, Euros, Canadian dollars, Australian dollars and Swiss francs. We do not enter intoderivative financial contracts for speculative or trading purposes.
Changes to fair value of the foreign currency contracts are recorded as a component ofaccumulated other comprehensive income (loss) within shareholders’ equity, to the extent suchcontracts are effective, and are recognized in net sales or cost of sales in the period in which theforecasted transaction affects earnings or the transactions are no longer probable of occurring.Changes to fair value of any contracts deemed to be ineffective would be recognized in earningsimmediately. There were no amounts recorded in the fiscal years ended June 30, 2013, 2012 or2011 relating to foreign currency contracts used to hedge forecasted revenues, forecasted cost ofsales or operating costs resulting from hedge ineffectiveness.
When appropriate, we also enter into and settle foreign currency contracts for Euros, Britishpounds, Canadian dollars and Australian dollars to reduce exposure of our foreign subsidiaries’balance sheets to fluctuations in foreign currency rates. These contracts are used to hedge balancesheet exposure generally over one month and are settled before the end of the month in which theyare entered into. Changes to fair value of the forward contracts are recognized in selling, general andadministrative expense in the period in which the contracts expire.
The table below summarizes the effect of the pre-tax (loss) from our settled foreign currencycontracts on the specified line items in our consolidated statements of income for the years endedJune 30, 2013, 2012 and 2011.
Year Ended June 30,(Amounts in thousands) 2013 2012 2011
Net Sales . . . . . . . . . . . . . . . . . . . . . . . . . . . . . . . . . . . . . . . . . . . . . . $ 22 $ 391 $ (975)Cost of Sales . . . . . . . . . . . . . . . . . . . . . . . . . . . . . . . . . . . . . . . . . . . (447) (1,284) (2,199)Selling, general and administrative expenses . . . . . . . . . . . . . . . . . . 230 451 (3,209)
Total pre-tax (loss) . . . . . . . . . . . . . . . . . . . . . . . . . . . . . . . . . . . . . . . . . . $(195) $ (442) $(6,383)
RESULTS OF OPERATIONS
The following table compares our historical results of operations, including as a percentage ofnet sales, on a consolidated basis, for the years ended June 30, 2013, 2012 and 2011. (Amounts inthousands, other than percentages. Percentages may not add due to rounding):
Year Ended June 30,2013 2012 2011
Net sales . . . . . . . . . . . . . . . . . . . . . . . $1,344,523 100.0% $1,238,273 100.0% $1,175,500 100.0%Cost of sales . . . . . . . . . . . . . . . . . . . . 709,344 52.8 623,985 50.4 614,134 52.3Depreciation related to cost of goods
sold . . . . . . . . . . . . . . . . . . . . . . . . . 6,386 0.4 5,257 0.4 5,089 0.4Gross profit . . . . . . . . . . . . . . . . . 628,793 46.8 609,031 49.2 556,277 47.3
Selling, general and administrativeexpenses . . . . . . . . . . . . . . . . . . . . . 517,250 38.5 484,963 39.2 453,956 38.6
Depreciation and amortization . . . . . . 39,583 3.0 28,797 2.3 24,746 2.1Income from operations . . . . . . . . . . . 71,960 5.3 95,271 7.7 77,575 6.6Interest expense . . . . . . . . . . . . . . . . . 24,309 1.8 21,759 1.8 21,481 1.8Debt extinguishment charges . . . . . . . — — — — 6,468 0.6Income before income taxes . . . . . . . . 47,651 3.5 73,512 5.9 49,626 4.2Provision for income taxes . . . . . . . . . 6,940 0.5 16,093 1.3 8,637 0.7Net income . . . . . . . . . . . . . . . . . . . . . 40,711 3.0 57,419 4.6 40,989 3.5
46

Year Ended June 30,2013 2012 2011
Other data:EBITDA and EBITDA margin(1) . . . . . . . . . . . . . . $117,929 8.8% $129,325 10.4% $100,942 8.6%
(1) For a definition of EBITDA and a reconciliation of net income to EBITDA, see Note 11 underItem 6 “Selected Financial Data.” EBITDA margin represents EBITDA divided by net sales.
At June 30, 2013, our operations were organized into the following two operating segments,which also comprise our reportable segments:
• North America — Our North America segment sells our portfolio of owned, licensed anddistributed brands, including the Elizabeth Arden products, to department stores, massretailers and distributors in the United States, Canada and Puerto Rico, and also includesour direct to consumer business, which is composed of our Elizabeth Arden branded retailoutlet stores and our global e-commerce business. This segment also sells the ElizabethArden products through the Red Door beauty salons and spas, which are owned andoperated by a third party licensee in which we have a minority investment.
• International — Our International segment sells our portfolio of owned and licensedbrands, including our Elizabeth Arden products, to perfumeries, boutiques, departmentstores, travel retail outlets and distributors in approximately 120 countries outside of NorthAmerica.
Segment profit excludes depreciation and amortization, interest expense, debt extinguishmentcharges, consolidation and elimination adjustments and unallocated corporate expenses, which areshown in the table reconciling segment profit to consolidated income before income taxes. Includedin unallocated corporate expenses are (i) restructuring charges that are related to an announcedplan, (ii) restructuring costs for corporate operations, (iii) costs related to our Global Efficiency Re-engineering Initiative (which we refer to as the “Initiative”), which was substantially completed infiscal 2011, and (iv) acquisition-related costs including transition costs. These expenses are recordedin unallocated corporate expenses as these items are centrally directed and controlled and are notincluded in internal measures of segment operating performance. We do not have any intersegmentsales.
The following table is a comparative summary of our net sales and segment profit by operatingsegment for the years ended June 30, 2013, 2012 and 2011, and reflects the basis of presentationdescribed in Note 1 — “General Information & Summary of Significant Accounting Policies” andNote 18 — “Segment Data and Related Information” to the Notes to Consolidated FinancialStatements for all periods presented.
(Amounts in thousands)
Year Ended June 30,2013 2012 2011
Segment Net Sales:North America . . . . . . . . . . . . . . . . . . . . . . . . . . . . . . . $ 857,531 $ 778,407 $ 756,731International . . . . . . . . . . . . . . . . . . . . . . . . . . . . . . . . . 486,992 459,866 418,769
Total . . . . . . . . . . . . . . . . . . . . . . . . . . . . . . . . . . . . . . . . . . . $1,344,523 $1,238,273 $1,175,500
Segment Profit:North America . . . . . . . . . . . . . . . . . . . . . . . . . . . . . . . $ 128,198 $ 128,692 $ 104,013International . . . . . . . . . . . . . . . . . . . . . . . . . . . . . . . . . 6,425 13,316 6,420Less:
Depreciation and Amortization . . . . . . . . . . . . . . . 45,969 34,054 29,835Interest expense, net . . . . . . . . . . . . . . . . . . . . . . . 24,309 21,759 21,481Consolidation and Elimination Adjustments . . . . 912 5,575 1,854Unallocated Corporate Expenses . . . . . . . . . . . . . 15,782(1) 7,108(2) 7,637(3)
Income Before Income Taxes . . . . . . . . . . . . . . . . . . . . . . . . $ 47,651 $ 73,512 $ 49,626
47

(1) Amounts for the year ended June 30, 2013, include (i) $13.8 million of inventory–related costs($6.4 million of which did not require the use of cash in fiscal 2013) recorded in cost of salesprimarily for inventory we purchased from New Wave Fragrances LLC and Give Back BrandsLLC prior to the acquisition of licenses and other assets from those companies, and othertransition costs, (ii) $0.4 million in transition expenses associated with such acquisitions, and(iii) $1.5 million of expenses related to a third party provider of freight audit and paymentservices that entered into bankruptcy after receiving funds from us to pay our freight invoicesand breaching its obligation to remit those funds to the freight companies.
(2) Amounts shown for the year ended June 30, 2012 include (i) $4.5 million of inventory–relatedcosts primarily for inventory we purchased from New Wave Fragrances LLC and Give BackBrands LLC prior to the acquisitions from those companies, (ii) $0.8 million in transactioncosts associated with such acquisitions, (iii) $0.4 million for product discontinuation charges,and (iv) $1.4 million of license termination costs.
(3) Amounts shown for the year ended June 30, 2011 include (i) $6.5 million of debtextinguishment charges, (ii) $0.5 million of restructuring expenses for corporate operations, notrelated to the Initiative, (iii) $0.3 million of restructuring expenses related to the Initiative, and(iv) $0.3 million of expenses related to the implementation of an Oracle accounting and orderprocessing system.
The following is additional net sales information relating to the following product categories:the Elizabeth Arden Brand (skin care, cosmetics and fragrances) and Celebrity, Lifestyle, Designerand Other Fragrances.
(Amounts in thousands)
Year Ended June 30,2013 2012 2011
Net Sales:Elizabeth Arden Brand . . . . . . . . . . . . . . . . . . . . . . . . . $ 478,020 $ 484,645 $ 454,922Celebrity, Lifestyle, Designer and Other
Fragrances . . . . . . . . . . . . . . . . . . . . . . . . . . . . . . . . 866,503 753,628 720,578
Total . . . . . . . . . . . . . . . . . . . . . . . . . . . . . . . . . . . . . . . . . . . $1,344,523 $1,238,273 $1,175,500
Year Ended June 30, 2013 Compared to Year Ended June 30, 2012
Net Sales. Net sales increased by 8.6% or $106.3 million for the year ended June 30, 2013,compared to the year ended June 30, 2012. Excluding the unfavorable impact of foreign currency,net sales increased by 9.5%, or $118.0 million. Pricing changes had an immaterial effect on netsales. The following is a discussion of net sales by segments and product categories.
Segment Net Sales:
North America
Net sales increased by 10.2% or $79.1 million. The impact of foreign currency translationwas not material. Net sales of licensed and non-Elizabeth Arden branded, owned productsincreased by $99.9 million. The increase includes higher net sales of (i) $54.1 million of thebrands acquired in the 2012 acquisitions, (ii) $44.5 million due to the launches of Pink FridayNicki Minaj, Justin Bieber’s Girlfriend and Ed Hardy Skull & Roses fragrances, and (iii) $40.4million from higher sales of the Juicy Couture and Taylor Swift fragrances. Partially offsettingthese increases were lower sales of various other owned and licensed brands, including $16.3million of lower sales of Britney Spears, Mariah Carey and Curve fragrances. Net sales forElizabeth Arden branded products decreased by $2.6 million, due to lower sales of skin careproducts and fragrances. Net sales of distributed brands were $18.2 million lower than the prioryear period.
48
International
Net sales increased by 5.9% or $27.1 million. Excluding the unfavorable impact of foreigncurrency, net sales increased by 8.4%, or $38.4 million. Net sales of licensed and non-ElizabethArden branded, owned products increased an aggregate of $31.7 million primarily due tohigher sales of the brands acquired in the 2012 acquisitions (including the launches of JustinBieber’s Girlfriend and Pink Friday Nicki Minaj) and Taylor Swift and John Varvatosfragrances, partially offset by lower sales of $9.2 million of Juicy Couture, Giorgio and MariahCarey fragrances. Net sales for Elizabeth Arden branded products decreased by $4.0 milliondue to lower sales of color cosmetic products. Our international results were led by higher netsales of $14.1 million in distributor markets and $7.0 million in Europe.
Product Category Net Sales:
Elizabeth Arden Brand
Net sales decreased by 1.4% or $6.6 million, primarily due to lower sales for color cosmeticproducts and fragrances. Excluding the unfavorable impact of foreign currency, net salesincreased by $0.3 million. Net sales for color cosmetic products decreased by 6.3%, or $4.4million and net sales of fragrances decreased 1.0%, or $1.8 million as lower net sales ofElizabeth Arden 5th Avenue fragrances and Elizabeth Arden Pretty were partially offset byhigher sales of Red Door fragrances.
Celebrity, Lifestyle, Designer and Other Fragrances
Net sales increased by 15.0% or $112.9 million. Excluding the unfavorable impact offoreign currency, net sales increased by 15.6% or $117.6 million. The increase includes highernet sales of (i) $69.4 million of brands acquired as part of the 2012 acquisitions, (ii) $62.5million due to the launches of Justin Bieber’s Girlfriend, Pink Friday Nicki Minaj and Ed HardySkull & Roses fragrances, and (iii) $42.5 million from increased sales of Taylor Swift and JuicyCouture fragrances. Partially offsetting these increases were lower sales of various other ownedand licensed brands, including $17.9 million of lower sales of Britney Spears, Mariah Carey andCurve fragrances as well as $18.7 million of lower sales of distributed brands.
Gross Margin. For the years ended June 30, 2013 and 2012, gross margins were 46.8% and49.2%, respectively. Gross margin in the current year period was negatively impacted by $36.4million, or 270 basis points, of inventory-related costs ($6.4 million of which did not require the useof cash in fiscal 2013) associated with the 2012 acquisitions and product changeover costs andproduct discontinuation charges associated with the Elizabeth Arden brand repositioning. Of the$36.4 million, $22.6 million relates to the brand repositioning, including $12.6 million for non-recurring product changeover costs and $10.0 million for product discontinuation charges. The non-recurring product changeover costs and expenses related to the shipping of new product assortmentto retailers to replace the older products. The product discontinuation charges resulted from ourstrategic decision, based on our current evaluation of market demand and the status of the ElizabethArden brand repositioning, not to incur the additional costs associated with using existing rawmaterials and other components related to our older Elizabeth Arden skin care and color cosmeticproducts to manufacture additional finished goods inventory of such products. This strategicdecision was made in order to accelerate the execution of the Elizabeth Arden brand repositioning,which should enable systematic improvement in our gross margins in future periods. Gross marginin the prior year period included $4.9 million, or 40 basis points of inventory related costs primarilyfor inventory purchased by us from New Wave Fragrances LLC and Give Back Brands LLC prior tothe 2012 acquisitions. Gross margin was also negatively impacted in the current year period byhigher sales discounts and allowances and higher freight costs.
SG&A. Selling, general and administrative expenses increased 6.7%, or $32.3 million, for theyear ended June 30, 2013, compared to the year ended June 30, 2012. The increase was due to
49

higher marketing and sales expenses of $54.5 million, partially offset by lower general andadministrative expenses of $22.2 million. The increase in marketing and sales expenses wasprimarily due to higher advertising, media and sales promotion expenses due to higher spend insupport of the recently acquired brands and 2013 fiscal year fragrance launches, higher marketingexpenses related to the Elizabeth Arden brand repositioning, and higher royalty expenses due toincreased sales of licensed brands. The decrease in general and administrative expenses wasprincipally due to lower incentive compensation related costs of $15.8 million and the impact offoreign currency translation of our affiliates’ balance sheets as the current year included losses of$1.5 million compared to losses of $4.2 million in the prior year period. The year ended June 30,2013 also included $0.4 million of transition costs for the 2012 acquisitions, $0.5 million of productchangeover expenses related to the Elizabeth Arden brand repositioning and $1.5 million inexpenses related to a third party provider of freight audit and payment services that entered intobankruptcy after receiving funds from us to pay our freight invoices and breaching its obligation toremit those funds to the freight companies. For the year ended June 30, 2012, general andadministrative expenses also included a total of $2.2 million of license termination costs andtransaction costs for the 2012 acquisitions.
Segment Profit
North America
Segment profit decreased slightly by 0.4% or $0.5 million. The decrease in segment profitwas due to higher selling, general and administrative expenses as further discussed above.
International
Segment profit decreased by 51.7% or $6.9 million. The decrease in segment profit wasdue to higher selling, general and administrative expenses partially as further discussed above.
Depreciation and Amortization Expense. Depreciation and amortization expense increasedby 37.5% or $10.8 million, for the year ended June 30, 2013, compared to the year ended June 30,2012, primarily due to higher amortization expense related to the 2012 acquisitions and higherdepreciation expense for in-store counters and displays primarily related to the Elizabeth Ardenbrand repositioning.
Interest Expense. Interest expense, net of interest income, increased 11.7%, or $2.6 million,for the year ended June 30, 2013, compared to the year ended June 30, 2012. The increase was dueto higher average borrowings under our revolving bank credit facility during the current year perioddue to the 2012 acquisitions and interest under our second lien credit agreement which we initiallyborrowed against on July 2, 2012.
Provision for Income Taxes. The pre-tax (loss) income from our domestic and internationaloperations consisted of the following for the years ended June 30, 2013 and 2012:
Year Ended
(Amounts in thousands)June 30,
2013June 30,
2012
Domestic pre-tax (loss) income . . . . . . . . . . . . . $(17,164) $16,964Foreign pre-tax income . . . . . . . . . . . . . . . . . . . 64,815 56,548
Total income before income taxes . . . . . . . . . . . $ 47,651 $73,512
Effective tax rate . . . . . . . . . . . . . . . . . . . . . . . . 14.6% 21.9%
The effective tax rate in the current year period was lower as compared to the prior year perioddue to the domestic operating loss in the current year compared to operating income in the prioryear as well as shifts in the ratio of earnings contributions between foreign jurisdictions. The current
50
year period included out-of-period adjustments to correct an error related to deferred taxes thatincreased income tax expense by $0.9 million. The impact of the out-of-period adjustment in thecurrent year, as well as other discrete tax adjustments in both the current year and prior year werenot material to the effective tax rate. See Note 12 to the Notes to Consolidated Financial Statements.
A substantial portion of our consolidated taxable income is typically generated in Switzerland,where our international operations are headquartered and managed, and is taxed at a significantlylower effective tax rate than our domestic taxable income. As a result, any material shift in therelative proportion of our consolidated taxable income that is generated between the United Statesand Switzerland could have a material effect on our consolidated effective tax rate.
Net Income. Net income for the year ended June 30, 2013, was $40.7 million compared to$57.4 million for the year ended June 30, 2012. The decrease in the net income was primarily due tohigher selling, general and administrative expenses and higher depreciation and amortizationexpense, partially offset by higher gross profit and the lower effective tax rate in the current yearperiod.
EBITDA. EBITDA (net income plus the provision for income taxes (or net loss less the benefitfrom income taxes), plus interest expense, plus depreciation and amortization expense) of $117.9million for the year ended June 30, 2013 and includes $38.8 million of costs comprised of (i) $13.8million of inventory–related costs ($6.4 million of which did not require the use of cash in fiscal2013) recorded in cost of sales primarily for inventory we purchased from New Wave FragrancesLLC and Give Back Brands LLC prior to the 2012 acquisition of licenses and certain other assetsfrom those companies and other transition costs, (ii) $0.4 million in transition expenses recorded inselling, general and administrative expenses associated with such acquisitions, (iii) $23.1 million ofnon-recurring product changeover costs, product discontinuation charges and expenses related to theElizabeth Arden brand repositioning, and (iv) $1.5 million in expenses related to a third partyprovider of freight audit and payment services that entered into bankruptcy after receiving fundsfrom us to pay our freight invoices and breaching its obligation to remit those funds to the freightcompanies. EBITDA for the year ended June 30, 2012 was $129.3 million and included $7.1 millionof costs comprised of (i) $4.5 million of inventory–related costs primarily for inventory wepurchased from New Wave Fragrances LLC and Give Back Brands LLC prior to the assetacquisitions from those companies, (ii) $0.8 million in transaction costs associated with suchacquisitions, (iii) $0.4 million for product discontinuation charges, and (iv) $1.4 million of licensetermination costs. The decrease in EBITDA in the current year of approximately $11.4 millioncompared to the prior year was primarily the result of higher selling, general and administrativeexpenses as discussed above. For a discussion of EBITDA and a reconciliation of net income toEBITDA for the years ended June 30, 2013 and 2012, see Note 11 under Item 6, “Selected FinancialData.”
Year Ended June 30, 2012 Compared to Year Ended June 30, 2011
Net Sales. Net sales increased by 5.3% or $62.8 million for the year ended June 30, 2012,compared to the year ended June 30, 2011. The impact of foreign currency translation was notmaterial. Pricing changes had an immaterial effect on net sales. The following is a discussion of netsales by segments and product categories.
Segment Net Sales:
North America
Net sales increased by 2.9% or $21.7 million. The impact of foreign currency translationwas not material. Net sales of Elizabeth Arden branded products were flat. Net sales of licensedand other owned fragrance brands decreased by $5.3 million due to lower sales of JuicyCouture, Mariah Carey, Usher and Britney Spears fragrances. Partially offsetting these
51
decreases were higher sales from the launch of the Taylor Swift fragrance Wonderstruck as wellas higher sales of Curve and the John Varvatos fragrance Star USA. Net sales of distributedbrands sold under licenses acquired in the 2012 acquisitions and net sales of other distributedbrands increased by $16.7 million and $10.2 million, respectively, as compared to the prioryear. Higher sales to department store customers led our North America results.
International
Net sales increased by 9.8% or $41.1 million. The impact of foreign currency translationwas not material. Net sales of Elizabeth Arden branded products increased by $29.8 million dueto higher sales in all product categories, primarily led by higher sales of skin care products. Netsales of licensed and other owned fragrance brands increased by $10.4 million primarily due tohigher sales of Viva La Juicy and John Varvatos fragrances, and the launch of the Taylor Swiftfragrance Wonderstruck in select markets primarily in Australia and New Zealand. Ourinternational results were led by higher sales of $21.3 million in Europe and $12.0 million intravel retail and distributor markets.
Product Category Net Sales:
Elizabeth Arden Brand
Net sales increased by 6.5% or $29.7 million, primarily due to higher sales for skin careproducts and fragrances. The impact of foreign currency was not material. Net sales for skincare products increased by 9.3%, or $19.3 million, led by higher sales of Ceramides, VisibleDifference and Eight Hour. Net sales of fragrances increased 4.7%, or $8.5 million, led byhigher sales of Green Tea and Red Door fragrances.
Celebrity, Lifestyle, Designer and Other Fragrances
Net sales increased by 4.6% or $33.1 million. The impact of foreign currency was notmaterial. Net sales increased by $55.7 million primarily due to the launches of the Taylor Swiftfragrance Wonderstruck and the John Varvatos fragrance Star USA, as well as higher sales ofViva La Juicy and Curve fragrances. Partially offsetting these increases were $40.4 million oflower sales of Mariah Carey, Britney Spears and Usher fragrances, as well as lower sales of otherJuicy Couture fragrances due in part to the prior year launch of Peace, Love & Juicy Couture.Net sales of distributed brands sold under licenses acquired in the 2012 acquisitions and netsales of other distributed brands increased by $17.0 million and $10.7 million, respectively, ascompared to the prior year.
Gross Margin. For the years ended June 30, 2012 and June 30, 2011, gross margins were49.2% and 47.3%, respectively. Gross margin in the current year period benefited from a higherproportion of sales of Elizabeth Arden products, primarily skin care products which have highergross margins, as well as improved operating efficiencies, including lower freight and distributioncosts. Partially offsetting these benefits were $4.9 million, or 40 basis points, of inventory–relatedcosts primarily for inventory we purchased from New Wave Fragrances LLC and Give Back BrandsLLC prior to the 2012 acquisitions.
SG&A. Selling, general and administrative expenses increased 6.8%, or $31.0 million, for theyear ended June 30, 2012, compared to the year ended June 30, 2011. The increase was due tohigher marketing and sales expenses of $24.4 million and higher general and administrativeexpenses of $6.6 million. The increase in marketing and sales expenses was primarily due to higheradvertising, sales promotion, and direct selling and development expenses of $24.3 million. Theincrease in general and administrative expenses was principally due to (i) higher payroll relatedcosts, net of lower incentive compensation, of $2.2 million, and (ii) the unfavorable impact offoreign currency translation of certain of our affiliates’ balance sheets as the current year included
52

losses of $4.2 million compared to losses of $0.9 million in the prior year. For the year endedJune 30, 2012, general and administrative expenses also included a total of $2.2 million of licensetermination costs and transaction costs for the 2012 acquisitions. For the year ended June 30, 2011,total one-time costs relating to restructuring and our Global Efficiency Re-engineering Initiativetotaled $1.4 million.
Segment Profit
North America
Segment profit increased 23.7% or $24.7 million. The increase in segment profit was dueto higher net sales and gross profit, partially offset by higher selling, general and administrativeexpenses as further described above.
International
Segment profit increased 107.4% or $6.9 million. The increase in segment profit was dueto higher net sales and gross profit, partially offset by higher selling, general and administrativeexpenses as further described above.
Depreciation and Amortization Expense. Depreciation and amortization expense increasedby 16.3% or $4.1 million, for the year ended June 30, 2012, compared to the year ended June 30,2011, primarily due to higher amortization expense related to the amended licensing agreement withLiz Claiborne, Inc. and the 2012 acquisitions, as well as higher depreciation for leaseholdimprovements and IT equipment.
Interest Expense. Interest expense, net of interest income, increased 1.3%, or $0.3 million, forthe year ended June 30, 2012, compared to the year ended June 30, 2011. The increase wasprimarily due to higher long-term debt in the current year as a result of the higher aggregateprincipal amount of our 7 3/8% senior notes issued in January 2011, as compared to the 7 3/4%senior subordinated notes that were outstanding during the first half of the prior year.
Debt Extinguishment Charges. For the year ended June 30, 2011, we recorded $6.5 millionin debt extinguishment charges related to the purchase and redemption of our previouslyoutstanding 7 3/4% senior subordinated notes and the amendment of our revolving bank creditfacility.
Provision for Income Taxes. The pre-tax income from our domestic and internationaloperations consisted of the following for the years ended June 30, 2012 and 2011:
Year Ended
(Amounts in thousands)June 30,
2012June 30,
2011
Domestic pre-tax income . . . . . . . . . . . . . . . . . . . . . . . . . . . . $16,964 $ 5,887Foreign pre-tax income . . . . . . . . . . . . . . . . . . . . . . . . . . . . . . 56,548 43,739
Total income before income taxes . . . . . . . . . . . . . . . . . . . . . $73,512 $49,626
Effective tax rate . . . . . . . . . . . . . . . . . . . . . . . . . . . . . . . . . . . 21.9% 17.4%
The increase in the effective tax rate in the current year period as compared to the prior yearperiod was mainly due to (i) higher earnings contributions from our domestic operations in thecurrent year as compared to the prior year, and (ii) a shift in the ratio of earnings contributionsbetween foreign jurisdictions that have different tax rates. Our domestic operations are tax-effectedat a higher rate than our foreign operations. The impact of discrete tax adjustments in the currentyear were not material to the effective tax rate. The prior year effective tax rate included a net taxbenefit of $1.4 million, of which (i) $0.9 million related to the closure of foreign tax audits and was
53

recorded in the fourth quarter, (ii) $0.3 million related to the reversal of valuation allowancesassociated with net operating losses previously recorded by certain international subsidiaries thatbecame realizable, and (iii) $0.2 million related to tax benefits due to changes in estimates forcertain entities. Also included in the prior year effective tax rates was a tax benefit of $0.6 millionrelated to research and development and foreign tax credits. See Note 12 to the Notes toConsolidated Financial Statements.
A substantial portion of our consolidated taxable income is typically generated in Switzerland,where our international operations are headquartered and managed, and is taxed at a significantlylower effective tax rate than our domestic taxable income. As a result, any material shift in therelative proportion of our consolidated taxable income that is generated between the United Statesand Switzerland could have a material effect on our consolidated effective tax rate.
Net Income. Net income for the year ended June 30, 2012, was $57.4 million compared to$41.0 million for the year ended June 30, 2011. The increase in net income was primarily the resultof higher net income from operations, partially offset by a higher effective tax rate in the currentyear period.
EBITDA. EBITDA (net income plus the provision for income taxes (or net loss less the benefitfrom income taxes), plus interest expense, plus depreciation and amortization expense) of $129.3million for the year ended June 30, 2012, includes $7.1 million of costs comprised of (i) $4.5 millionof inventory–related costs primarily for inventory we purchased from New Wave Fragrances LLCand Give Back Brands LLC prior to the 2012 acquisitions from those companies, (ii) $0.8 million intransaction costs associated with such acquisitions, (iii) $0.4 million for product discontinuationcharges, and (iv) $1.4 million of license termination costs. EBITDA for the year ended June 30,2011, was $100.9 million and included $6.5 million in debt extinguishment charges andrestructuring and Initiative-related one-time costs of $0.6 million. The increase in EBITDA for theyear ended June 30, 2012 of approximately $28.4 million compared to the prior year was primarilythe result of higher income from operations as discussed above. For a discussion of EBITDA and areconciliation of net income to EBITDA for the years ended June 30, 2012 and June 30, 2011, seeNote 11 under Item 6, “Selected Financial Data.”
Seasonality
Our operations have historically been seasonal, with higher sales generally occurring in the firsthalf of our fiscal year as a result of increased demand by retailers in anticipation of and during theholiday season. For the year ended June 30, 2013, approximately 60% of our net sales were madeduring the first half of our fiscal year. Due to product innovation and new product launches, the sizeand timing of certain orders from our customers, and additions or losses of brand distribution rights,sales, results of operations, working capital requirements and cash flows can vary significantlybetween quarters of the same and different years. As a result, we expect to experience variability innet sales, operating margin, net income, working capital requirements and cash flows on a quarterlybasis. Increased sales of skin care and cosmetic products relative to fragrances may reduce theseasonality of our business.
We experience seasonality in our working capital, with peak inventory levels normally from Julyto October and peak receivable balances normally from September to December. Our workingcapital borrowings are also seasonal and are normally highest in the months of September, Octoberand November. During the months of December, January and February of each year, cash isnormally generated as customer payments on holiday season orders are received.
54

Liquidity and Capital Resources
Year Ended June 30,(Amounts in thousands) 2013 2012 2011
Net cash provided by operating activities . . . . . . . . . . . . . . . . . . . $ 62,091 $ 58,524 $ 97,746Net cash used in investing activities . . . . . . . . . . . . . . . . . . . . . . . (48,591) (153,224) (39,472)Net cash (used in) provided by financing activities . . . . . . . . . . . (9,214) 96,760 (28,519)Net increase in cash and cash equivalents . . . . . . . . . . . . . . . . . . 2,594 230 31,969
Operating Activities
Cash provided by our operating activities is driven by net income adjusted for non-cashexpenses and debt extinguishment charges, and changes in working capital. The following chartillustrates our net cash provided by operating activities during the years ended June 30, 2013, 2012and 2011:
Year Ended June 30,(Amounts in thousands) 2013 2012 2011
Net income . . . . . . . . . . . . . . . . . . . . . . . . . . . . . . . . . . . . . . . . . . . . $ 40,711 $ 57,419 $40,989Net adjustments to reconcile net income to net cash provided by
operating activities . . . . . . . . . . . . . . . . . . . . . . . . . . . . . . . . . . . . 51,888 49,121 44,656Net change in assets and liabilities, net of acquisitions (“working
capital changes”) . . . . . . . . . . . . . . . . . . . . . . . . . . . . . . . . . . . . . (30,508) (48,016) 12,101
Net cash provided by operations . . . . . . . . . . . . . . . . . . . . . . . . $ 62,091 $ 58,524 $97,746
For the year ended June 30, 2013, net cash provided by operating activities was $62.1 million,as compared to $58.5 million for the year ended June 30, 2012. Net income decreased by $16.7million and net adjustments to reconcile net income to cash used in operating activities increased by$2.8 million, as compared to the prior year. Working capital changes utilized cash of $30.5 millionin the current year as compared to $48.0 million in the prior year. The decrease in cash utilized byworking capital changes primarily related to a decrease in prepaid and other assets as the prior yearwas impacted by royalty prepayments and other payments to licensors and suppliers in connectionwith the 2012 acquisitions and the amended license agreement with Liz Claiborne, as well as alarger aggregate increase in accounts payable and other accrued liabilities primarily due to thetiming of payments.
For the year ended June 30, 2012, net cash provided by operating activities was $58.5 million,as compared to $97.7 million for the year ended June 30, 2011. Net income increased by $16.4million and net adjustments to reconcile net income to cash used in operating activities increased by$4.5 million, as compared to the prior year. Working capital changes utilized cash of $48.0 millionin the current year period as compared to providing cash of $12.1 million in the prior year. Theincrease in cash utilized by working capital changes primarily related to (i) a larger increase inaccounts receivable due to the increase in and timing of sales in the fourth quarter, (ii) higherinventory purchases in the current year primarily due to the brand repositioning for ElizabethArden, (iii) royalty prepayments and other payments to licensors and suppliers in connection withthe 2012 acquisitions and the amended license agreement with Liz Claiborne, and (iv) higher cashpayments and lower accruals in the current year as compared to prior year incentive compensationpayments and accruals. These increases were partially offset by higher accounts payable, primarilydue to the timing of payments to vendors and inventory purchases.
55

Investing Activities
The following chart illustrates our net cash used in investing activities during the years endedJune 30, 2013, 2012 and 2011:
Year Ended June 30,(Amounts in thousands) 2013 2012 2011
Additions to property and equipment . . . . . . . . . . . . . . . . . . . . . . $(40,523) $ (24,088) $(25,608)Acquisition of businesses, intangible and other assets . . . . . . . . . (8,068) (129,136) (13,864)
Net cash used in investing activities . . . . . . . . . . . . . . . . . . . $(48,591) $(153,224) $(39,472)
For the year ended June 30, 2013, net cash used in investing activities of $48.6 million wascomposed of (i) $40.5 million of capital expenditures, (ii) $7.6 million associated with a minorityinvestment in Elizabeth Arden Salon Holdings, LLC, an unrelated entity whose subsidiaries operatethe Red Door beauty salons and spas, and (iii) $0.5 million for the acquisition of a license for acosmetic formula.
For the year ended June 30, 2012, net cash used in investing activities of $153.2 million wascomposed of $24.1 million of capital expenditures and $129.1 million related to the acquisition ofbusinesses, intangibles and other assets. The cash used for acquisition of businesses, intangibles andother assets was primarily composed of (i) $43.9 million for the acquisition of trademarks for theCurve fragrance brands and certain other smaller fragrance brands from the amendment of the licenseagreement with Liz Claiborne, (ii) $58.1 million for the acquisition of intangible assets, inventory andother assets from New Wave LLC and (iii) $26.5 for the acquisition of intangible assets, inventory andother assets from Give Back Brands LLC. During the year ended June 30, 2012, we also paid anaggregate of $0.6 million for the license agreements for a cosmetic formula and patent.
For the year ended June 30, 2011, net cash used in investing activities of $39.5 million wascomposed of (i) $25.6 million of capital expenditures primarily for in-store counters and displays,leasehold improvements and computer hardware and software, and (ii) $13.9 million of paymentsrelated to the acquisition of the Prevage trademarks and related patents and the global licenseagreement with John Varvatos Apparel Corp. for the manufacture, distribution and marketing ofJohn Varvatos fragrances.
We currently expect to incur approximately $50 million in capital expenditures in the yearending June 30, 2014, primarily for (i) in-store counters and displays related to the Elizabeth Ardenbrand repositioning, (ii) computer hardware and software, including amounts related to the lastphase of our Oracle global enterprise system, which includes an upgrade to certain of ourinformation systems for our global supply chain and logistics functions, (iii) tools and dies for newfragrance launches, and (iv) leasehold improvements, including amounts for the new ElizabethArden Spa and Elizabeth Arden retail store in New York City.
Financing Activities
The following chart illustrates our net cash (used in) provided by financing activities during theyears ended June 30, 2013, 2012 and 2011:
Year Ended June 30,(Amounts in thousands) 2013 2012 2011
(Payments on) proceeds from short-term debt . . . . . . . . . . . . . . . $ (1,200) $89,200 $ (59,000)Proceeds from long-term debt . . . . . . . . . . . . . . . . . . . . . . . . . . . . — — 243,996Repurchase of senior subordinated notes . . . . . . . . . . . . . . . . . . . . — — (223,332)Repurchase of common stock . . . . . . . . . . . . . . . . . . . . . . . . . . . . . (12,905) — (13,758)Proceeds from the exercise of stock options . . . . . . . . . . . . . . . . . . 7,589 5,570 20,432Payments of contingent consideration related to acquisition . . . . . (4,960) — —All other financing activities . . . . . . . . . . . . . . . . . . . . . . . . . . . . . . 2,262 1,990 3,143
Net cash (used in) provided by financing activities . . . . . . . . $ (9,214) $96,760 $ (28,519)
56
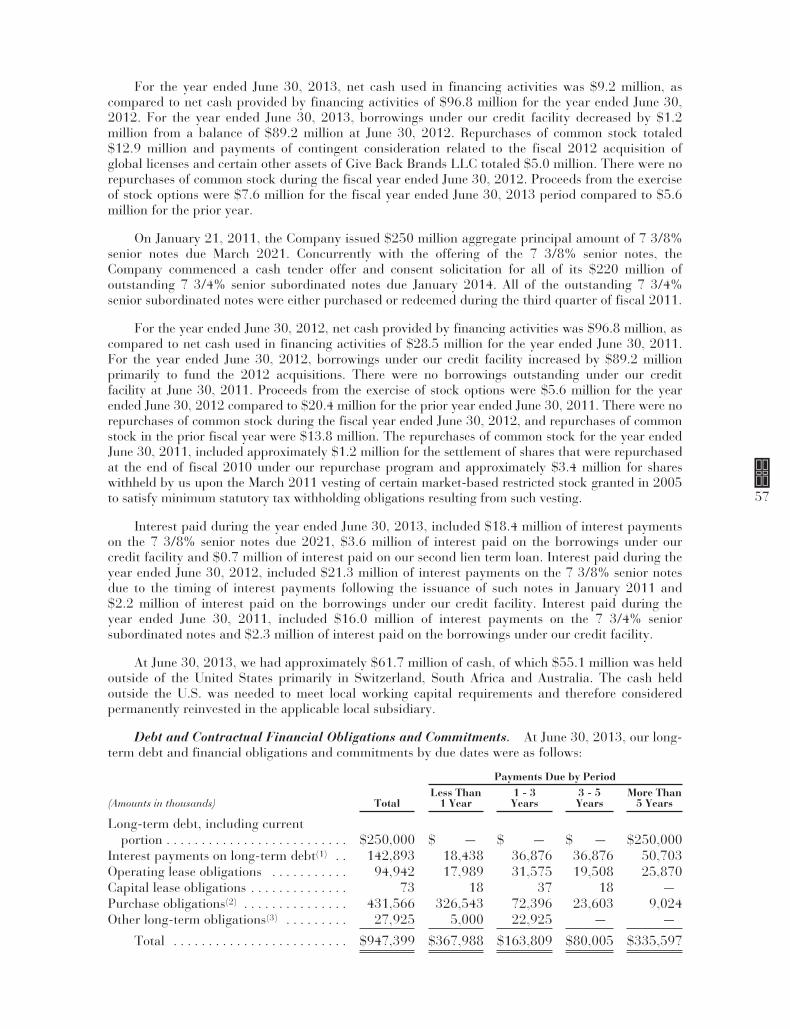
For the year ended June 30, 2013, net cash used in financing activities was $9.2 million, ascompared to net cash provided by financing activities of $96.8 million for the year ended June 30,2012. For the year ended June 30, 2013, borrowings under our credit facility decreased by $1.2million from a balance of $89.2 million at June 30, 2012. Repurchases of common stock totaled$12.9 million and payments of contingent consideration related to the fiscal 2012 acquisition ofglobal licenses and certain other assets of Give Back Brands LLC totaled $5.0 million. There were norepurchases of common stock during the fiscal year ended June 30, 2012. Proceeds from the exerciseof stock options were $7.6 million for the fiscal year ended June 30, 2013 period compared to $5.6million for the prior year.
On January 21, 2011, the Company issued $250 million aggregate principal amount of 7 3/8%senior notes due March 2021. Concurrently with the offering of the 7 3/8% senior notes, theCompany commenced a cash tender offer and consent solicitation for all of its $220 million ofoutstanding 7 3/4% senior subordinated notes due January 2014. All of the outstanding 7 3/4%senior subordinated notes were either purchased or redeemed during the third quarter of fiscal 2011.
For the year ended June 30, 2012, net cash provided by financing activities was $96.8 million, ascompared to net cash used in financing activities of $28.5 million for the year ended June 30, 2011.For the year ended June 30, 2012, borrowings under our credit facility increased by $89.2 millionprimarily to fund the 2012 acquisitions. There were no borrowings outstanding under our creditfacility at June 30, 2011. Proceeds from the exercise of stock options were $5.6 million for the yearended June 30, 2012 compared to $20.4 million for the prior year ended June 30, 2011. There were norepurchases of common stock during the fiscal year ended June 30, 2012, and repurchases of commonstock in the prior fiscal year were $13.8 million. The repurchases of common stock for the year endedJune 30, 2011, included approximately $1.2 million for the settlement of shares that were repurchasedat the end of fiscal 2010 under our repurchase program and approximately $3.4 million for shareswithheld by us upon the March 2011 vesting of certain market-based restricted stock granted in 2005to satisfy minimum statutory tax withholding obligations resulting from such vesting.
Interest paid during the year ended June 30, 2013, included $18.4 million of interest paymentson the 7 3/8% senior notes due 2021, $3.6 million of interest paid on the borrowings under ourcredit facility and $0.7 million of interest paid on our second lien term loan. Interest paid during theyear ended June 30, 2012, included $21.3 million of interest payments on the 7 3/8% senior notesdue to the timing of interest payments following the issuance of such notes in January 2011 and$2.2 million of interest paid on the borrowings under our credit facility. Interest paid during theyear ended June 30, 2011, included $16.0 million of interest payments on the 7 3/4% seniorsubordinated notes and $2.3 million of interest paid on the borrowings under our credit facility.
At June 30, 2013, we had approximately $61.7 million of cash, of which $55.1 million was heldoutside of the United States primarily in Switzerland, South Africa and Australia. The cash heldoutside the U.S. was needed to meet local working capital requirements and therefore consideredpermanently reinvested in the applicable local subsidiary.
Debt and Contractual Financial Obligations and Commitments. At June 30, 2013, our long-term debt and financial obligations and commitments by due dates were as follows:
Payments Due by Period
(Amounts in thousands) TotalLess Than
1 Year1 - 3Years
3 - 5Years
More Than5 Years
Long-term debt, including currentportion . . . . . . . . . . . . . . . . . . . . . . . . . . $250,000 $ — $ — $ — $250,000
Interest payments on long-term debt(1) . . 142,893 18,438 36,876 36,876 50,703Operating lease obligations . . . . . . . . . . . 94,942 17,989 31,575 19,508 25,870Capital lease obligations . . . . . . . . . . . . . . 73 18 37 18 —Purchase obligations(2) . . . . . . . . . . . . . . . 431,566 326,543 72,396 23,603 9,024Other long-term obligations(3) . . . . . . . . . 27,925 5,000 22,925 — —
Total . . . . . . . . . . . . . . . . . . . . . . . . . $947,399 $367,988 $163,809 $80,005 $335,597
57

(1) Consists of interest at the rate of 7 3/8% per annum on the $250 million aggregate principalamount of 7 3/8% senior notes. See Note 9 to the Notes to Consolidated Financial Statements.
(2) Consists of obligations incurred in the ordinary course of business related to purchasecommitments for finished goods, raw materials, components, advertising, promotional items,minimum royalty guarantees, insurance, services pursuant to legally binding obligations,including fixed or minimum obligations, and estimates of such obligations subject to variableprice provisions.
(3) Includes: (i) the contingent consideration which may become payable to Give Back Brands LLCif certain sales targets are met, but (ii) excludes $10.0 million of unrecognized tax benefits that,if not realized, would result in cash payments. We cannot currently estimate when, or if, any ofthe gross unrecognized tax benefits, will be due. See Notes 11 and 12 to the Notes toConsolidated Financial Statements.
Future Liquidity and Capital Needs. Our principal future uses of funds are for workingcapital requirements, including brand and product development and marketing expenses, newproduct launches, additional brand acquisitions or product licensing and distribution arrangements,capital expenditures and debt service. In addition, we may use funds to repurchase material amountsof our common stock and senior notes through open market purchases, privately negotiatedtransactions or otherwise, depending upon prevailing market conditions, our liquidity requirements,contractual restrictions and other factors. We have historically financed our working capital needsprimarily through internally generated funds, our credit facility and external financing. We collectcash from our customers based on our sales to them and their respective payment terms.
We have a $300 million revolving bank credit facility with a syndicate of banks, for whichJPMorgan Chase Bank is the administrative agent, which generally provides for borrowings on arevolving basis, with a sub-limit of $25 million for letters of credit. See Note 8 to the Notes toConsolidated Financial Statements. Under the terms of the credit facility, we may, at any time,increase the size of the credit facility up to $375 million without entering into a formal amendmentrequiring the consent of all of the banks, subject to our satisfaction of certain conditions. The creditfacility was amended in June 2012 to allow for the contingent consideration that may becomepayable with respect to the acquisition of certain assets of Give Back Brands LLC and to allow forthe second lien facility further discussed below. The credit facility expires in January 2016.
The credit facility is guaranteed by all of our U.S. subsidiaries and is collateralized by a firstpriority lien on all of our U.S. accounts receivable and inventory. Borrowings under the new creditfacility are limited to 85% of eligible accounts receivable and 85% of the appraised net liquidationvalue of our inventory, as determined pursuant to the terms of the credit facility; provided, however,that from August 15 to October 31 of each year, our borrowing base may be temporarily increasedby up to $25 million.
The credit facility has only one financial maintenance covenant, which is a debt servicecoverage ratio that must be maintained at not less than 1.1 to 1 if average borrowing base capacitydeclines to less than $25 million ($35 million from September 1 through January 31). Our averageborrowing base capacity for each of the quarters during fiscal 2013 did not fall below the applicablethresholds noted above. Accordingly, the debt service coverage ratio did not apply during the yearended June 30, 2013. We were in compliance with all applicable covenants under the credit facilityfor the quarter and year ended June 30, 2013.
Under the terms of the credit facility, we may pay dividends or repurchase common stock if wemaintain borrowing base capacity of at least $25 million from February 1 to August 31, and at least$35 million from September 1 to January 31, after making the applicable payment. The creditfacility restricts us from incurring additional non-trade indebtedness (other than refinancings andcertain small amounts of indebtedness).
58

Borrowings under the credit portion of the credit facility bear interest at a floating rate based onan “Applicable Margin” which is determined by reference to a debt service coverage ratio. At ouroption, the Applicable Margin may be applied to either the London InterBank Offered Rate (LIBOR)or the base rate (which is comparable to prime rates). The Applicable Margin ranges from 1.75% to2.50% for LIBOR loans and from 0.25% to 1.0% for base rate loans, except that the ApplicableMargin on the first $25 million of borrowings from August 15 to October 31 of each year, while thetemporary increase in our borrowing base is in effect, is 1.0% higher. We are required to pay anunused commitment fee ranging from 0.375% to 0.50% based on the quarterly average unusedportion of the credit facility. The interest rates payable by us on our 7 3/8% senior notes and onborrowings under our revolving credit facility and second lien facility are not impacted by creditrating agency actions.
At June 30, 2013, the Applicable Margin was 1.75% for LIBOR loans and 0.25% for prime rateloans. The commitment fee on the unused portion of the credit facility at June 30, 2013 was 0.50%.For the years ended June 30, 2013 and 2012, the weighted average annual interest rate onborrowings under our credit facility was 2.1% and 2.2%, respectively.
In connection with the 2012 acquisitions of fragrance licenses and certain other assets fromNew Wave Fragrances LLC and Give Back Brands LLC, on June 12, 2012, the Company enteredinto a second lien facility agreement with JPMorgan Chase Bank, N.A. providing us the ability toborrow up to $30 million on or prior to July 2, 2012. On July 2, 2012, we borrowed $30 millionunder this facility agreement and used the proceeds to repay amounts under our credit facility. Thesecond lien facility is collateralized by a second priority lien on all of our U.S. accounts receivableand inventories and the interest on borrowings charged under the second lien facility was either(i) LIBOR plus an applicable margin of 3.75% or (ii) the base rate specified in the second lienfacility (which is comparable to prime rates) plus a margin of 2.75%. We had the option to prepayall or a portion of the second lien facility anytime after February 1, 2013, provided the borrowingbase capacity under the credit facility was in excess of $35 million after giving effect to theapplicable prepayment each day for the 30 day period ending on the date of the prepayment. Thesecond lien facility matures on July 2, 2014.
On February 11, 2013, we prepaid all of the amounts outstanding under the second lien facilityand amended the second lien facility to allow for borrowings of up to $30 million on a revolvingbasis until its maturity. The amendment also reduced the interest on borrowings on the second lienfacility to (i) LIBOR plus an applicable margin of 3.25% or (ii) the base rate specified in the secondlien facility (which is comparable to prime rates) plus a margin of 1.75%. The unused commitmentfee applicable to the second lien facility ranges from 0.25% to 0.375%. To the extent we borrowamounts under the second lien facility, we have the option to prepay all or a portion of suchborrowings, provided the borrowing base capacity under the credit facility is in excess of $35 millionafter giving effect to the applicable prepayment each day for the 30 day period ending on the date ofthe prepayment. At June 30, 2013, we had no outstanding borrowings under the second lien facility.
At June 30, 2013, we had $88.0 million in borrowings and $2.6 million in letters of creditoutstanding under the credit facility. At June 30, 2013, based on eligible accounts receivable andinventory available as collateral, an additional $81.4 million in the aggregate could be borrowedunder our credit facility and our second lien facility. The borrowing base capacity under the creditfacility typically declines in the second half of our fiscal year as our higher accounts receivablebalances resulting from holiday season sales are likely to decline due to cash collections.
Based upon our internal projections, we believe that existing cash and cash equivalents,internally generated funds and borrowings under our credit facility and the second lien facility willbe sufficient to cover debt service, working capital requirements and capital expenditures for thenext twelve months, other than additional working capital requirements that may result from furtherexpansion of our operations through acquisitions of additional brands or licensing or distributionarrangements. A deterioration in the economic and retail environment, however, could cause us to
59
fail to satisfy the financial maintenance covenant under our credit facility that applies only in theevent we do not have the requisite average borrowing base capacity as set forth under the creditfacility. In such an event, we would not be allowed to borrow under the credit facility and may nothave access to the capital necessary for our business. In addition, a default under our credit facilityor the second lien facility that causes acceleration of the debt under either facility could trigger adefault under our outstanding 7 3/8% senior notes. In the event we are not able to borrow undereither borrowing facility, we would be required to develop an alternative source of liquidity. There isno assurance that we could obtain replacement financing or what the terms of such financing, ifavailable, would be.
We have discussions from time to time with manufacturers and owners of prestige fragrancebrands regarding our possible acquisition of additional exclusive licensing and/or distribution rights.We currently have no material agreements or commitments with respect to any such acquisition,although we periodically execute routine agreements to maintain the confidentiality of informationobtained during the course of discussions with such manufacturers and brand owners. There is noassurance that we will be able to negotiate successfully for any such future acquisitions or that wewill be able to obtain acquisition financing or additional working capital financing on satisfactoryterms for further expansion of our operations.
Repurchases of Common Stock. On November 2, 2010, our board of directors authorized therepurchase of an additional $40 million of our common stock under the terms of an existing $80million common stock repurchase program and extended the term of the stock repurchase programfrom November 30, 2010 to November 30, 2012. On August 7, 2012, our board of directorsapproved an extension of the stock repurchase program through November 30, 2014.
For the fiscal year ended June 30, 2013, we purchased 332,894 shares of common stock on theopen market under the stock repurchase program at an average price of $38.77 per share and at acost of $12.9 million, including sales commissions. As of June 30, 2013, we had repurchased4,362,095 shares of common stock on the open market under the stock repurchase program since itsinception in November 2005, at an average price of $18.32 per share and at a cost of approximately$79.9 million, including sales commissions, leaving approximately $40.1 million available foradditional repurchases under the program. The acquisition of these shares was accounted for underthe treasury method. See Note 13 to Notes to Consolidated Financial Statements.
Forward-Looking Information and Factors That May Affect Future Results
The Securities and Exchange Commission encourages companies to disclose forward-lookinginformation so that investors can better understand a company’s future prospects and makeinformed investment decisions. This Annual Report on Form 10-K and other written and oralstatements that we make from time to time contain such forward-looking statements that set outanticipated results based on management’s plans and assumptions regarding future events orperformance. We have tried, wherever possible, to identify such statements by using words such as“anticipate,” “estimate,” “expect,” “project,” “intend,” “plan,” “believe,” “will” and similarexpressions in connection with any discussion of future operating or financial performance. Inparticular, these include statements relating to future actions, prospective products, future operatingor financial performance or results of current and anticipated products, sales efforts, expenses and/or cost savings, interest rates, foreign exchange rates, the outcome of contingencies, such as legalproceedings, and financial results. A list of factors that could cause our actual results of operationsand financial condition to differ materially from our forward-looking statements is set forth below,and most of these factors are discussed in greater detail under Item 1A - “Risk Factors” of thisAnnual Report on Form 10-K:
• factors affecting our relationships with our customers or our customers’ businesses,including the absence of contracts with customers, our customers’ financial condition, andchanges in the retail, fragrance and cosmetic industries, such as the consolidation of
60

retailers and the associated closing of retail doors as well as retailer inventory controlpractices, including, but not limited to, levels of inventory carried at point of sale andpractices used to control inventory shrinkage;
• risks of international operations, including foreign currency fluctuations, hedging activities,economic and political consequences of terrorist attacks, disruptions in travel, unfavorablechanges in U.S. or international laws or regulations, diseases and pandemics, and politicalinstability in certain regions of the world;
• our reliance on license agreements with third parties for the rights to sell many of ourprestige fragrance brands;
• our reliance on third-party manufacturers for substantially all of our owned and licensedproducts and our absence of contracts with suppliers of distributed brands and componentsfor manufacturing of owned and licensed brands;
• delays in shipments, inventory shortages and higher supply chain costs due to the loss of ordisruption in our distribution facilities or at key third party manufacturing or fulfillmentfacilities that manufacture or provide logistic services for our products;
• our ability to respond in a timely manner to changing consumer preferences andpurchasing patterns and other international and domestic conditions and events thatimpact retailer and/or consumer confidence and demand, such as domestic or internationalrecessions or economic uncertainty;
• our ability to protect our intellectual property rights;
• the success, or changes in the timing or scope, of our new product launches, advertisingand merchandising programs;
• our ability to successfully manage our inventories;
• the quality, safety and efficacy of our products;
• the impact of competitive products and pricing;
• our ability to (i) implement our growth strategy and acquire or license additional brands orsecure additional distribution arrangements, (ii) successfully and cost-effectively integrateacquired businesses or new brands, and (iii) finance our growth strategy and our workingcapital requirements;
• our level of indebtedness, our ability to realize sufficient cash flows from operations tomeet our debt service obligations and working capital requirements, and restrictivecovenants in our revolving credit facility, second lien facility and the indenture for our73⁄8% senior notes;
• changes in product mix to less profitable products;
• the retention and availability of key personnel;
• changes in the legal, regulatory and political environment that impact, or will impact, ourbusiness, including changes to customs or trade regulations, laws or regulations relating toingredients or other chemicals or raw materials contained in products or packaging, oraccounting standards or critical accounting estimates;
• the success of our Elizabeth Arden brand repositioning efforts;
• the impact of tax audits, including the ultimate outcome of the pending Internal RevenueService examination of our U.S. federal tax returns for the fiscal years ended June 30, 2008and June 30, 2009, changes in tax laws or tax rates, and our ability to utilize our deferredtax assets;
• our ability to effectively implement, manage and maintain our global information systemsand maintain the security of our confidential data and our employees’ and customers’
61
personal information, including our ability to successfully and cost-effectively implementthe last phase of our Oracle global enterprise system;
• our reliance on certain third parties for certain outsourced business services, includinginformation technology operations, logistics management and employee benefit planadministration;
• the potential for significant impairment charges relating to our trademarks, goodwill orother intangible assets that could result from a number of factors, including downwardpressure on our stock price; and
• other unanticipated risks and uncertainties.
We caution that the factors described herein and other factors could cause our actual results ofoperations and financial condition to differ materially from those expressed in any forward-lookingstatements we make and that investors should not place undue reliance on any such forward-lookingstatements. Further, any forward-looking statement speaks only as of the date on which suchstatement is made, and we undertake no obligation to update any forward-looking statement toreflect events or circumstances after the date on which such statement is made or to reflect theoccurrence of anticipated or unanticipated events or circumstances. New factors emerge from time totime, and it is not possible for us to predict all of such factors. Further, we cannot assess the impactof each such factor on our results of operations or the extent to which any factor, or combination offactors, may cause actual results to differ materially from those contained in any forward-lookingstatements.
ITEM 7A. QUANTITATIVE AND QUALITATIVE DISCLOSURES ABOUT MARKET RISK
Interest Rate Risk
As of June 30, 2013, we had $88.0 million in borrowings and $2.6 million in letters of creditoutstanding under our revolving credit facility and no outstanding balances under our second lienfacility. Borrowings under our revolving credit facility are seasonal, with peak borrowings typicallyin the months of September, October and November. Borrowings under the credit facility and secondlien term facility are subject to variable rates and, accordingly, our earnings and cash flow will beaffected by changes in interest rates. Based upon our average borrowings under our revolving creditfacility and second lien facility during the year ended June 30, 2013, and assuming there had been atwo percentage point (200 basis points) change in the average interest rate for these borrowings, it isestimated that our interest expense for the year ended June 30, 2013 would have increased ordecreased by approximately $2.7 million. See Note 8 to the Notes to Consolidated FinancialStatements.
Foreign Currency Risk
We sell our products in approximately 120 countries around the world. During the fiscal yearended June 30, 2013, we derived approximately 41% of our net sales from our internationaloperations. We conduct our international operations in a variety of different countries and derive oursales in various currencies including the Euro, British pound, Swiss franc, Canadian dollar andAustralian dollar, as well as the U.S. dollar. Most of our skin care and cosmetic products areproduced in third-party manufacturing facilities located in the U.S. Our operations may be subjectto volatility because of currency changes, inflation and changes in political and economic conditionsin the countries in which we operate. With respect to international operations, our sales, cost ofgoods sold and expenses are typically denominated in a combination of local currency and the U.S.dollar. Our results of operations are reported in U.S. dollars. Fluctuations in currency rates canaffect our reported sales, margins, operating costs and the anticipated settlement of our foreigndenominated receivables and payables. A weakening of the foreign currencies in which we generatesales relative to the currencies in which our costs are denominated, which is primarily the U.S.dollar, may adversely affect our ability to meet our obligations and could adversely affect our
62

business, prospects, results of operations, financial condition or cash flows. Our competitors may ormay not be subject to the same fluctuations in currency rates, and our competitive position could beaffected by these changes.
As of June 30, 2013, our subsidiaries outside the United States held 40% of our total assets.The cumulative effect of translating balance sheet accounts from the functional currency of oursubsidiaries into the U.S. dollar at current exchange rates is included in accumulated othercomprehensive (loss) income in our consolidated balance sheets.
As of June 30, 2013, we had notional amounts of 5.0 million British pounds and 7.5 millionEuros under open foreign currency contracts that expire between July 31, 2013 and May 31, 2014to reduce the exposure of our foreign subsidiary revenues to fluctuations in currency rates. As ofJune 30, 2013, we had notional amounts of 9.9 million Swiss francs under foreign currencycontracts that expire between July 31, 2013 and May 31, 2014 used to hedge forecasted operatingcosts.
We have designated each qualifying foreign currency contract as a cash flow hedge. The gainsand losses of these contracts will only be recognized in earnings in the period in which the forecastedtransaction affects earnings or the transactions are no longer probable of occurring. The realizedloss, net of taxes, recognized during the year ended June 30, 2013 from settled contracts wasapproximately $0.3 million. At June 30, 2013, the unrealized gain, net of taxes, associated withthese open contracts of approximately $0.6 million is included in accumulated other comprehensive(loss) income in our consolidated balance sheet. See Note 16 to the Notes to Consolidated FinancialStatements.
When appropriate, we also enter into and settle foreign currency contracts for Euros, Britishpounds, Canadian dollars and Australian dollars to reduce the exposure of our foreign subsidiaries’balance sheets to fluctuations in foreign currency rates. As of June 30, 2013, there were no suchforeign currency contracts outstanding. The realized gain, net of taxes, recognized during the yearended June 30, 2013, was $0.2 million.
We do not utilize foreign exchange contracts for trading or speculative purposes. There can beno assurance that our hedging operations or other exchange rate practices, if any, will eliminate orsubstantially reduce risks associated with fluctuating exchange rates.
63
ITEM 8. FINANCIAL STATEMENTS AND SUPPLEMENTARY DATA
INDEX TO FINANCIAL STATEMENTS
Page
Report of Management . . . . . . . . . . . . . . . . . . . . . . . . . . . . . . . . . . . . . . . . . . . . . . . . . . . . . . . . . 65
Report of Independent Registered Public Accounting Firm . . . . . . . . . . . . . . . . . . . . . . . . . . . . . 66
Consolidated Balance Sheets as of June 30, 2013 and June 30, 2012 . . . . . . . . . . . . . . . . . . . . . 67
Consolidated Statements of Income for the Years Ended June 30, 2013, 2012 and 2011 . . . . . 68
Consolidated Statements of Comprehensive Income for the Years Ended June 30, 2013, 2012and 2011 . . . . . . . . . . . . . . . . . . . . . . . . . . . . . . . . . . . . . . . . . . . . . . . . . . . . . . . . . . . . . . . . . . 69
Consolidated Statements of Shareholders’ Equity for the Years Ended June 30, 2013, 2012and 2011 . . . . . . . . . . . . . . . . . . . . . . . . . . . . . . . . . . . . . . . . . . . . . . . . . . . . . . . . . . . . . . . . . . 70
Consolidated Statements of Cash Flows for the Years Ended June 30, 2013, 2012 and2011 . . . . . . . . . . . . . . . . . . . . . . . . . . . . . . . . . . . . . . . . . . . . . . . . . . . . . . . . . . . . . . . . . . . . . . 73
Notes to Consolidated Financial Statements . . . . . . . . . . . . . . . . . . . . . . . . . . . . . . . . . . . . . . . . . 74
64

Report of ManagementElizabeth Arden, Inc. and Subsidiaries
Report on Consolidated Financial Statements
We prepared and are responsible for the consolidated financial statements that appear in theAnnual Report on Form 10-K for the year ended June 30, 2013 of Elizabeth Arden, Inc. (the“Company”). These consolidated financial statements are in conformity with accounting principlesgenerally accepted in the United States of America, and therefore, include amounts based oninformed judgments and estimates. We also accept responsibility for the preparation of the otherfinancial information that is included in the Company’s Annual Report on Form 10-K.
Report on Internal Control Over Financial Reporting
The management of the Company is responsible for establishing and maintaining adequateinternal control over financial reporting as defined in Rules 13a-15(f) and 15d-15(f) under theSecurities Exchange Act of 1934. The Company’s internal control over financial reporting isdesigned to provide reasonable assurance regarding the reliability of financial reporting and thepreparation of financial statements for external purposes in accordance with generally acceptedaccounting principles in the United States of America. The Company’s internal control over financialreporting includes those policies and procedures that: (i) pertain to the maintenance of records that,in reasonable detail, accurately and fairly reflect the transactions and dispositions of the assets of theCompany; (ii) provide reasonable assurance that transactions are recorded as necessary to permitpreparation of financial statements in accordance with generally accepted accounting principles, andthat receipts and expenditures of the Company are being made only in accordance withauthorizations of management and directors of the Company; and (iii) provide reasonable assuranceregarding prevention or timely detection of unauthorized acquisition, use or disposition of theCompany’s assets that could have a material effect on the consolidated financial statements.
Because of its inherent limitations, internal control over financial reporting may not prevent ordetect misstatements. Also, projections of any evaluation of effectiveness to future periods aresubject to the risk that controls may become inadequate because of changes in conditions, or that thedegree of compliance with the policies or procedures may deteriorate. Management of the Companyassessed the effectiveness of the Company’s internal control over financial reporting as of June 30,2013. In making this assessment, management used the criteria set forth by the Committee ofSponsoring Organizations of the Treadway Commission (COSO) in Internal Control-IntegratedFramework. Based on our assessment using those criteria, management concluded that the Companymaintained effective internal control over financial reporting as of June 30, 2013.
The Company’s independent registered public accounting firm, PricewaterhouseCoopers LLP,has audited the effectiveness of the Company’s internal control over financial reporting for the yearended June 30, 2013, and has expressed an unqualified opinion in their report, which is includedherein.
/s/ E. Scott Beattie /s/ Stephen J. SmithE. Scott BeattieChairman, President and Chief ExecutiveOfficer
Stephen J. SmithExecutive Vice President and Chief FinancialOfficer
August 12, 2013
65
Report of Independent Registered Public Accounting Firm
To the Board of Directors and Shareholders ofElizabeth Arden, Inc.:
In our opinion, the consolidated financial statements listed in the accompanying index present fairly,in all material respects, the financial position of Elizabeth Arden, Inc. and its subsidiaries atJune 30, 2013 and June 30, 2012, and the results of their operations and their cash flows for each ofthe three years in the period ended June 30, 2013 in conformity with accounting principles generallyaccepted in the United States of America. Also in our opinion, the Company maintained, in allmaterial respects, effective internal control over financial reporting as of June 30, 2013, based oncriteria established in Internal Control — Integrated Framework issued by the Committee ofSponsoring Organizations of the Treadway Commission (COSO). The Company’s management isresponsible for these financial statements, for maintaining effective internal control over financialreporting and for its assessment of the effectiveness of internal control over financial reporting,included in the accompanying Report of Management appearing under Item 8. Our responsibility isto express opinions on these financial statements and on the Company’s internal control overfinancial reporting based on our integrated audits. We conducted our audits in accordance with thestandards of the Public Company Accounting Oversight Board (United States). Those standardsrequire that we plan and perform the audits to obtain reasonable assurance about whether thefinancial statements are free of material misstatement and whether effective internal control overfinancial reporting was maintained in all material respects. Our audits of the financial statementsincluded examining, on a test basis, evidence supporting the amounts and disclosures in the financialstatements, assessing the accounting principles used and significant estimates made by management,and evaluating the overall financial statement presentation. Our audit of internal control overfinancial reporting included obtaining an understanding of internal control over financial reporting,assessing the risk that a material weakness exists, and testing and evaluating the design andoperating effectiveness of internal control based on the assessed risk. Our audits also includedperforming such other procedures as we considered necessary in the circumstances. We believe thatour audits provide a reasonable basis for our opinions.
A company’s internal control over financial reporting is a process designed to provide reasonableassurance regarding the reliability of financial reporting and the preparation of financial statementsfor external purposes in accordance with generally accepted accounting principles. A company’sinternal control over financial reporting includes those policies and procedures that (i) pertain to themaintenance of records that, in reasonable detail, accurately and fairly reflect the transactions anddispositions of the assets of the company; (ii) provide reasonable assurance that transactions arerecorded as necessary to permit preparation of financial statements in accordance with generallyaccepted accounting principles, and that receipts and expenditures of the company are being madeonly in accordance with authorizations of management and directors of the company; and(iii) provide reasonable assurance regarding prevention or timely detection of unauthorizedacquisition, use, or disposition of the company’s assets that could have a material effect on thefinancial statements.
Because of its inherent limitations, internal control over financial reporting may not prevent ordetect misstatements. Also, projections of any evaluation of effectiveness to future periods aresubject to the risk that controls may become inadequate because of changes in conditions, or that thedegree of compliance with the policies or procedures may deteriorate.
/s/ PricewaterhouseCoopers LLPNew York, New YorkAugust 12, 2013
66
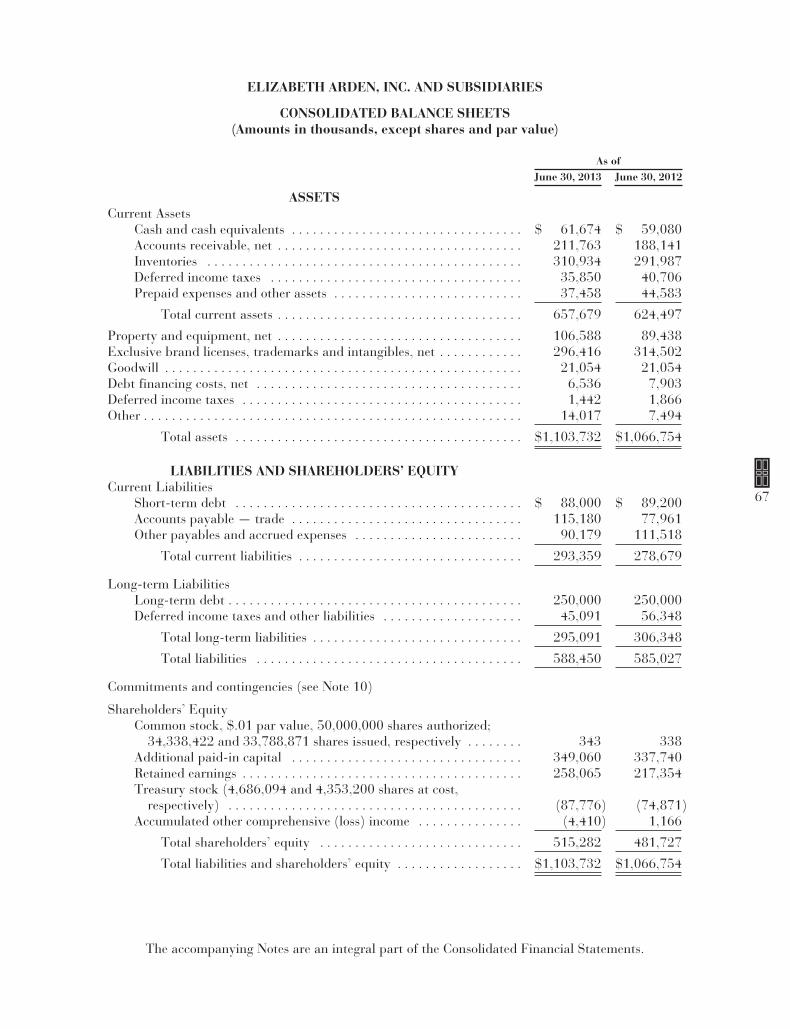
ELIZABETH ARDEN, INC. AND SUBSIDIARIES
CONSOLIDATED BALANCE SHEETS(Amounts in thousands, except shares and par value)
As ofJune 30, 2013 June 30, 2012
ASSETSCurrent Assets
Cash and cash equivalents . . . . . . . . . . . . . . . . . . . . . . . . . . . . . . . . . $ 61,674 $ 59,080Accounts receivable, net . . . . . . . . . . . . . . . . . . . . . . . . . . . . . . . . . . . 211,763 188,141Inventories . . . . . . . . . . . . . . . . . . . . . . . . . . . . . . . . . . . . . . . . . . . . . 310,934 291,987Deferred income taxes . . . . . . . . . . . . . . . . . . . . . . . . . . . . . . . . . . . . 35,850 40,706Prepaid expenses and other assets . . . . . . . . . . . . . . . . . . . . . . . . . . . 37,458 44,583
Total current assets . . . . . . . . . . . . . . . . . . . . . . . . . . . . . . . . . . . 657,679 624,497
Property and equipment, net . . . . . . . . . . . . . . . . . . . . . . . . . . . . . . . . . . . 106,588 89,438Exclusive brand licenses, trademarks and intangibles, net . . . . . . . . . . . . 296,416 314,502Goodwill . . . . . . . . . . . . . . . . . . . . . . . . . . . . . . . . . . . . . . . . . . . . . . . . . . . 21,054 21,054Debt financing costs, net . . . . . . . . . . . . . . . . . . . . . . . . . . . . . . . . . . . . . . 6,536 7,903Deferred income taxes . . . . . . . . . . . . . . . . . . . . . . . . . . . . . . . . . . . . . . . . 1,442 1,866Other . . . . . . . . . . . . . . . . . . . . . . . . . . . . . . . . . . . . . . . . . . . . . . . . . . . . . . 14,017 7,494
Total assets . . . . . . . . . . . . . . . . . . . . . . . . . . . . . . . . . . . . . . . . . $1,103,732 $1,066,754
LIABILITIES AND SHAREHOLDERS’ EQUITYCurrent Liabilities
Short-term debt . . . . . . . . . . . . . . . . . . . . . . . . . . . . . . . . . . . . . . . . . $ 88,000 $ 89,200Accounts payable — trade . . . . . . . . . . . . . . . . . . . . . . . . . . . . . . . . . 115,180 77,961Other payables and accrued expenses . . . . . . . . . . . . . . . . . . . . . . . . 90,179 111,518
Total current liabilities . . . . . . . . . . . . . . . . . . . . . . . . . . . . . . . . 293,359 278,679
Long-term LiabilitiesLong-term debt . . . . . . . . . . . . . . . . . . . . . . . . . . . . . . . . . . . . . . . . . . 250,000 250,000Deferred income taxes and other liabilities . . . . . . . . . . . . . . . . . . . . 45,091 56,348
Total long-term liabilities . . . . . . . . . . . . . . . . . . . . . . . . . . . . . . 295,091 306,348
Total liabilities . . . . . . . . . . . . . . . . . . . . . . . . . . . . . . . . . . . . . . 588,450 585,027
Commitments and contingencies (see Note 10)
Shareholders’ EquityCommon stock, $.01 par value, 50,000,000 shares authorized;
34,338,422 and 33,788,871 shares issued, respectively . . . . . . . . 343 338Additional paid-in capital . . . . . . . . . . . . . . . . . . . . . . . . . . . . . . . . . 349,060 337,740Retained earnings . . . . . . . . . . . . . . . . . . . . . . . . . . . . . . . . . . . . . . . . 258,065 217,354Treasury stock (4,686,094 and 4,353,200 shares at cost,
respectively) . . . . . . . . . . . . . . . . . . . . . . . . . . . . . . . . . . . . . . . . . . (87,776) (74,871)Accumulated other comprehensive (loss) income . . . . . . . . . . . . . . . (4,410) 1,166
Total shareholders’ equity . . . . . . . . . . . . . . . . . . . . . . . . . . . . . 515,282 481,727
Total liabilities and shareholders’ equity . . . . . . . . . . . . . . . . . . $1,103,732 $1,066,754
The accompanying Notes are an integral part of the Consolidated Financial Statements.
67

ELIZABETH ARDEN, INC. AND SUBSIDIARIES
CONSOLIDATED STATEMENTS OF INCOME(Amounts in thousands, except per share data)
Year Ended June 30,2013 2012 2011
Net sales . . . . . . . . . . . . . . . . . . . . . . . . . . . . . . . . . . . . . . . . $1,344,523 $1,238,273 $1,175,500Cost of goods sold:
Cost of sales . . . . . . . . . . . . . . . . . . . . . . . . . . . . . . . . . 709,344 623,985 614,134Depreciation related to cost of goods sold . . . . . . . . . . 6,386 5,257 5,089
Total cost of goods sold . . . . . . . . . . . . . . . . . . . . . . 715,730 629,242 619,223
Gross profit . . . . . . . . . . . . . . . . . . . . . . . . . . . . . . . . . . . . . 628,793 609,031 556,277
Operating expensesSelling, general and administrative . . . . . . . . . . . . . . . 517,250 484,963 453,956Depreciation and amortization . . . . . . . . . . . . . . . . . . . 39,583 28,797 24,746
Total operating expenses . . . . . . . . . . . . . . . . . . . . . 556,833 513,760 478,702
Income from operations . . . . . . . . . . . . . . . . . . . . . . . . . . . . 71,960 95,271 77,575Other expense
Interest expense . . . . . . . . . . . . . . . . . . . . . . . . . . . . . . 24,309 21,759 21,481Debt extinguishment charges . . . . . . . . . . . . . . . . . . . . — — 6,468
Other expense, net . . . . . . . . . . . . . . . . . . . . . . . . . . 24,309 21,759 27,949
Income before income taxes . . . . . . . . . . . . . . . . . . . . . . . . . 47,651 73,512 49,626Provision for income taxes . . . . . . . . . . . . . . . . . . . . . . . . . . 6,940 16,093 8,637
Net income . . . . . . . . . . . . . . . . . . . . . . . . . . . . . . . . . . . . . . $ 40,711 $ 57,419 $ 40,989
Net income per common share:Basic . . . . . . . . . . . . . . . . . . . . . . . . . . . . . . . . . . . . . . . $ 1.37 $ 1.97 $ 1.47
Diluted . . . . . . . . . . . . . . . . . . . . . . . . . . . . . . . . . . . . . $ 1.33 $ 1.91 $ 1.41
Weighted average number of common shares:Basic . . . . . . . . . . . . . . . . . . . . . . . . . . . . . . . . . . . . . . . 29,672 29,115 27,843
Diluted . . . . . . . . . . . . . . . . . . . . . . . . . . . . . . . . . . . . . 30,539 30,111 29,008
The accompanying Notes are an integral part of the Consolidated Financial Statements.
68
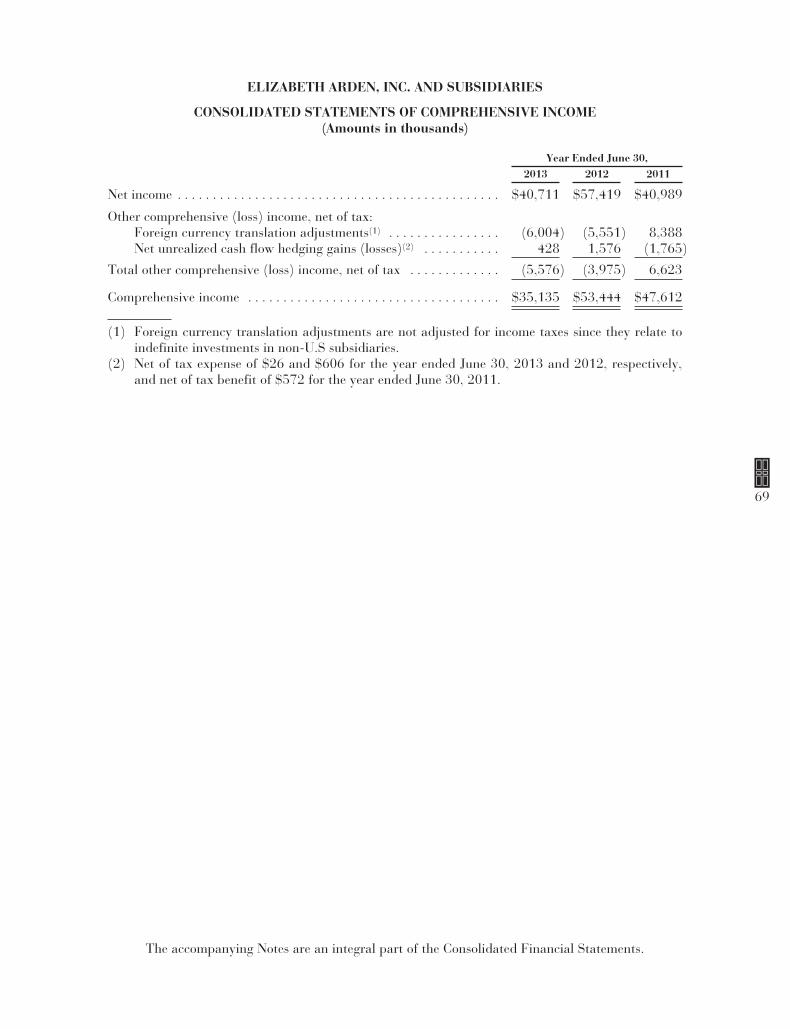
ELIZABETH ARDEN, INC. AND SUBSIDIARIES
CONSOLIDATED STATEMENTS OF COMPREHENSIVE INCOME(Amounts in thousands)
Year Ended June 30,2013 2012 2011
Net income . . . . . . . . . . . . . . . . . . . . . . . . . . . . . . . . . . . . . . . . . . . . . . $40,711 $57,419 $40,989
Other comprehensive (loss) income, net of tax:Foreign currency translation adjustments(1) . . . . . . . . . . . . . . . . (6,004) (5,551) 8,388Net unrealized cash flow hedging gains (losses)(2) . . . . . . . . . . . 428 1,576 (1,765)
Total other comprehensive (loss) income, net of tax . . . . . . . . . . . . . (5,576) (3,975) 6,623
Comprehensive income . . . . . . . . . . . . . . . . . . . . . . . . . . . . . . . . . . . . $35,135 $53,444 $47,612
(1) Foreign currency translation adjustments are not adjusted for income taxes since they relate toindefinite investments in non-U.S subsidiaries.
(2) Net of tax expense of $26 and $606 for the year ended June 30, 2013 and 2012, respectively,and net of tax benefit of $572 for the year ended June 30, 2011.
The accompanying Notes are an integral part of the Consolidated Financial Statements.
69

ELIZABETH ARDEN, INC. AND SUBSIDIARIES
CONSOLIDATED STATEMENTS OF SHAREHOLDERS’ EQUITY(Amounts in thousands)
Common Stock AdditionalPaid-inCapital
RetainedEarnings
Treasury StockAccumulated
OtherComprehensive
Income
TotalShareholders’
EquityShares Amount Shares Amount
Balance as of July 1, 2010 . . . . . 31,897 $319 $297,137 $118,946 (3,633) $(62,303) $(1,482) $352,617Issuance of common stock upon
exercise of options . . . . . . . . . . 1,354 13 20,419 — — — — 20,432Issuance of common stock for
employee stock purchaseplan . . . . . . . . . . . . . . . . . . . . . 107 1 1,753 — — — — 1,754
Restricted stock, forfeitures andtax withholdings . . . . . . . . . . . 95 1 — — — — — 1
Amortization of share-basedawards . . . . . . . . . . . . . . . . . . . — — 4,904 — — — — 4,904
Repurchase of common stock . . . — — – — (720) (12,568) — (12,568)Excess tax benefit from share-
based awards . . . . . . . . . . . . . . — — 3,008 — — — — 3,008Other . . . . . . . . . . . . . . . . . . . . . . — — 5 — — — — 5Net Income . . . . . . . . . . . . . . . . . . — — — 40,989 — — — 40,989Foreign currency translation
adjustments . . . . . . . . . . . . . . . — — — — — — 8,388 8,388Net unrealized cash flow hedging
loss . . . . . . . . . . . . . . . . . . . . . . — — — — — — (1,765) (1,765)
Balance as of June 30, 2011 . . . . 33,453 $334 $327,226 $159,935 (4,353) $(74,871) $ 5,141 $417,765
The accompanying Notes are an integral part of the Consolidated Financial Statements
70
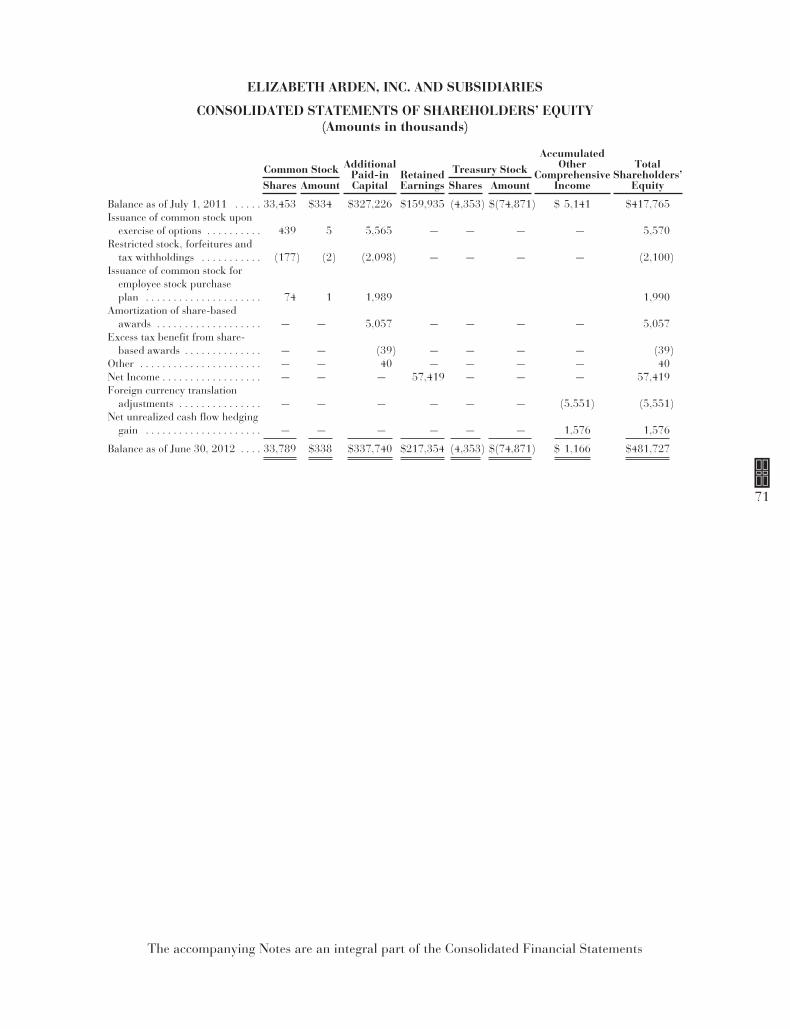
ELIZABETH ARDEN, INC. AND SUBSIDIARIES
CONSOLIDATED STATEMENTS OF SHAREHOLDERS’ EQUITY(Amounts in thousands)
Common Stock AdditionalPaid-inCapital
RetainedEarnings
Treasury StockAccumulated
OtherComprehensive
Income
TotalShareholders’
EquityShares Amount Shares Amount
Balance as of July 1, 2011 . . . . . 33,453 $334 $327,226 $159,935 (4,353) $(74,871) $ 5,141 $417,765Issuance of common stock upon
exercise of options . . . . . . . . . . 439 5 5,565 — — — — 5,570Restricted stock, forfeitures and
tax withholdings . . . . . . . . . . . (177) (2) (2,098) — — — — (2,100)Issuance of common stock for
employee stock purchaseplan . . . . . . . . . . . . . . . . . . . . . 74 1 1,989 1,990
Amortization of share-basedawards . . . . . . . . . . . . . . . . . . . — — 5,057 — — — — 5,057
Excess tax benefit from share-based awards . . . . . . . . . . . . . . — — (39) — — — — (39)
Other . . . . . . . . . . . . . . . . . . . . . . — — 40 — — — — 40Net Income . . . . . . . . . . . . . . . . . . — — — 57,419 — — — 57,419Foreign currency translation
adjustments . . . . . . . . . . . . . . . — — — — — — (5,551) (5,551)Net unrealized cash flow hedging
gain . . . . . . . . . . . . . . . . . . . . . — — — — — — 1,576 1,576
Balance as of June 30, 2012 . . . . 33,789 $338 $337,740 $217,354 (4,353) $(74,871) $ 1,166 $481,727
The accompanying Notes are an integral part of the Consolidated Financial Statements
71
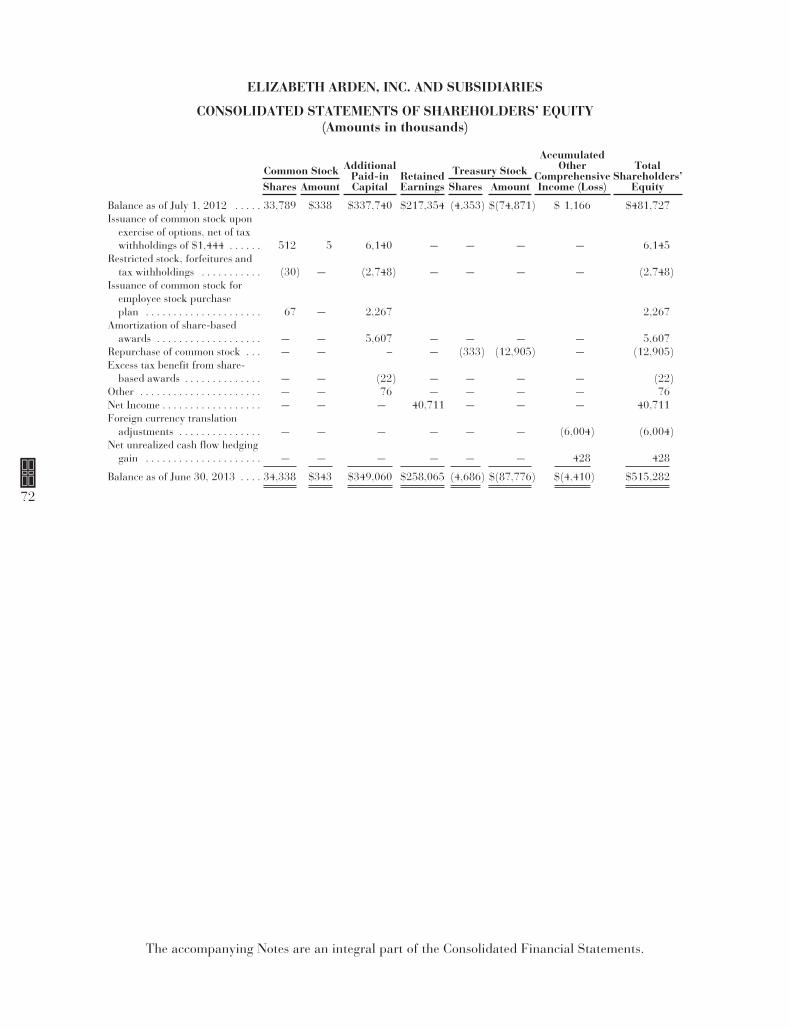
ELIZABETH ARDEN, INC. AND SUBSIDIARIES
CONSOLIDATED STATEMENTS OF SHAREHOLDERS’ EQUITY(Amounts in thousands)
Common Stock AdditionalPaid-inCapital
RetainedEarnings
Treasury StockAccumulated
OtherComprehensiveIncome (Loss)
TotalShareholders’
EquityShares Amount Shares Amount
Balance as of July 1, 2012 . . . . . 33,789 $338 $337,740 $217,354 (4,353) $(74,871) $ 1,166 $481,727Issuance of common stock upon
exercise of options, net of taxwithholdings of $1,444 . . . . . . 512 5 6,140 — — — — 6,145
Restricted stock, forfeitures andtax withholdings . . . . . . . . . . . (30) — (2,748) — — — — (2,748)
Issuance of common stock foremployee stock purchaseplan . . . . . . . . . . . . . . . . . . . . . 67 — 2,267 2,267
Amortization of share-basedawards . . . . . . . . . . . . . . . . . . . — — 5,607 — — — — 5,607
Repurchase of common stock . . . — — – — (333) (12,905) — (12,905)Excess tax benefit from share-
based awards . . . . . . . . . . . . . . — — (22) — — — — (22)Other . . . . . . . . . . . . . . . . . . . . . . — — 76 — — — — 76Net Income . . . . . . . . . . . . . . . . . . — — — 40,711 — — — 40,711Foreign currency translation
adjustments . . . . . . . . . . . . . . . — — — — — — (6,004) (6,004)Net unrealized cash flow hedging
gain . . . . . . . . . . . . . . . . . . . . . — — — — — — 428 428
Balance as of June 30, 2013 . . . . 34,338 $343 $349,060 $258,065 (4,686) $(87,776) $(4,410) $515,282
The accompanying Notes are an integral part of the Consolidated Financial Statements.
72
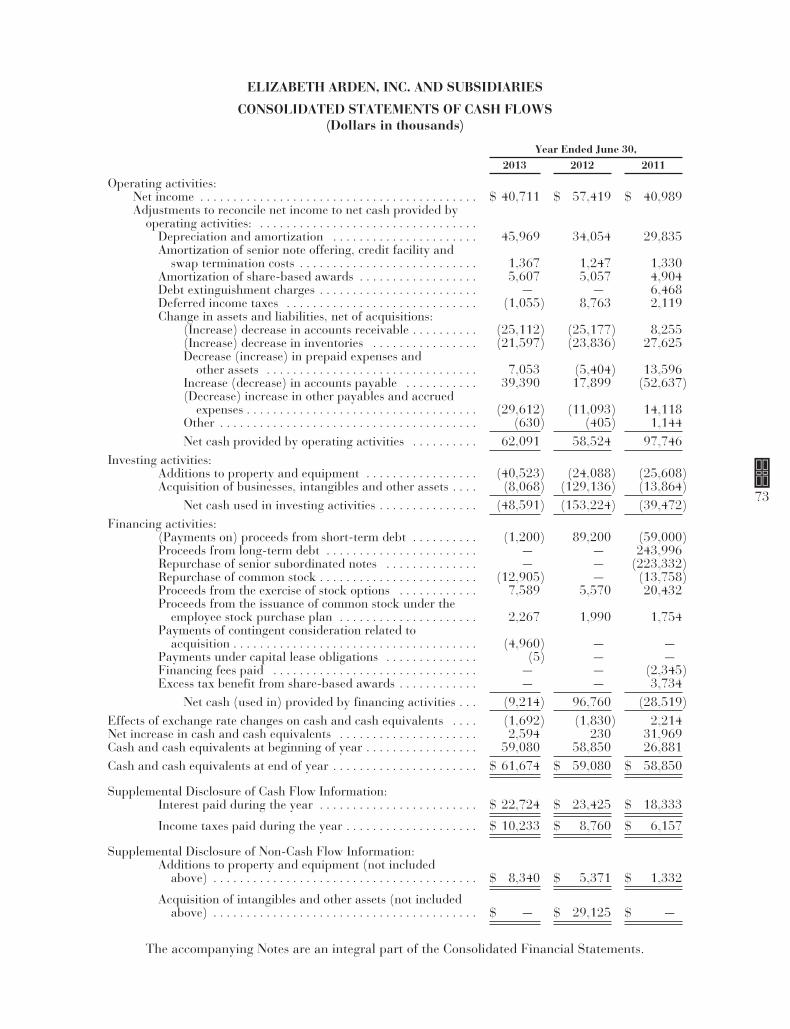
ELIZABETH ARDEN, INC. AND SUBSIDIARIES
CONSOLIDATED STATEMENTS OF CASH FLOWS(Dollars in thousands)
Year Ended June 30,2013 2012 2011
Operating activities:Net income . . . . . . . . . . . . . . . . . . . . . . . . . . . . . . . . . . . . . . . . . . $ 40,711 $ 57,419 $ 40,989Adjustments to reconcile net income to net cash provided by
operating activities: . . . . . . . . . . . . . . . . . . . . . . . . . . . . . . . . .Depreciation and amortization . . . . . . . . . . . . . . . . . . . . . . 45,969 34,054 29,835Amortization of senior note offering, credit facility and
swap termination costs . . . . . . . . . . . . . . . . . . . . . . . . . . . 1,367 1,247 1,330Amortization of share-based awards . . . . . . . . . . . . . . . . . . 5,607 5,057 4,904Debt extinguishment charges . . . . . . . . . . . . . . . . . . . . . . . . — — 6,468Deferred income taxes . . . . . . . . . . . . . . . . . . . . . . . . . . . . . (1,055) 8,763 2,119Change in assets and liabilities, net of acquisitions:
(Increase) decrease in accounts receivable . . . . . . . . . . (25,112) (25,177) 8,255(Increase) decrease in inventories . . . . . . . . . . . . . . . . (21,597) (23,836) 27,625Decrease (increase) in prepaid expenses and
other assets . . . . . . . . . . . . . . . . . . . . . . . . . . . . . . . . 7,053 (5,404) 13,596Increase (decrease) in accounts payable . . . . . . . . . . . 39,390 17,899 (52,637)(Decrease) increase in other payables and accrued
expenses . . . . . . . . . . . . . . . . . . . . . . . . . . . . . . . . . . . (29,612) (11,093) 14,118Other . . . . . . . . . . . . . . . . . . . . . . . . . . . . . . . . . . . . . . . (630) (405) 1,144Net cash provided by operating activities . . . . . . . . . . 62,091 58,524 97,746
Investing activities:Additions to property and equipment . . . . . . . . . . . . . . . . . (40,523) (24,088) (25,608)Acquisition of businesses, intangibles and other assets . . . . (8,068) (129,136) (13,864)
Net cash used in investing activities . . . . . . . . . . . . . . . (48,591) (153,224) (39,472)Financing activities:
(Payments on) proceeds from short-term debt . . . . . . . . . . (1,200) 89,200 (59,000)Proceeds from long-term debt . . . . . . . . . . . . . . . . . . . . . . . — — 243,996Repurchase of senior subordinated notes . . . . . . . . . . . . . . — — (223,332)Repurchase of common stock . . . . . . . . . . . . . . . . . . . . . . . . (12,905) — (13,758)Proceeds from the exercise of stock options . . . . . . . . . . . . 7,589 5,570 20,432Proceeds from the issuance of common stock under the
employee stock purchase plan . . . . . . . . . . . . . . . . . . . . . 2,267 1,990 1,754Payments of contingent consideration related to
acquisition . . . . . . . . . . . . . . . . . . . . . . . . . . . . . . . . . . . . . (4,960) — —Payments under capital lease obligations . . . . . . . . . . . . . . (5) — —Financing fees paid . . . . . . . . . . . . . . . . . . . . . . . . . . . . . . . — — (2,345)Excess tax benefit from share-based awards . . . . . . . . . . . . — — 3,734
Net cash (used in) provided by financing activities . . . (9,214) 96,760 (28,519)Effects of exchange rate changes on cash and cash equivalents . . . . (1,692) (1,830) 2,214Net increase in cash and cash equivalents . . . . . . . . . . . . . . . . . . . . . 2,594 230 31,969Cash and cash equivalents at beginning of year . . . . . . . . . . . . . . . . . 59,080 58,850 26,881Cash and cash equivalents at end of year . . . . . . . . . . . . . . . . . . . . . . $ 61,674 $ 59,080 $ 58,850
Supplemental Disclosure of Cash Flow Information:Interest paid during the year . . . . . . . . . . . . . . . . . . . . . . . . $ 22,724 $ 23,425 $ 18,333
Income taxes paid during the year . . . . . . . . . . . . . . . . . . . . $ 10,233 $ 8,760 $ 6,157
Supplemental Disclosure of Non-Cash Flow Information:Additions to property and equipment (not included
above) . . . . . . . . . . . . . . . . . . . . . . . . . . . . . . . . . . . . . . . . $ 8,340 $ 5,371 $ 1,332
Acquisition of intangibles and other assets (not includedabove) . . . . . . . . . . . . . . . . . . . . . . . . . . . . . . . . . . . . . . . . $ — $ 29,125 $ —
The accompanying Notes are an integral part of the Consolidated Financial Statements.
73
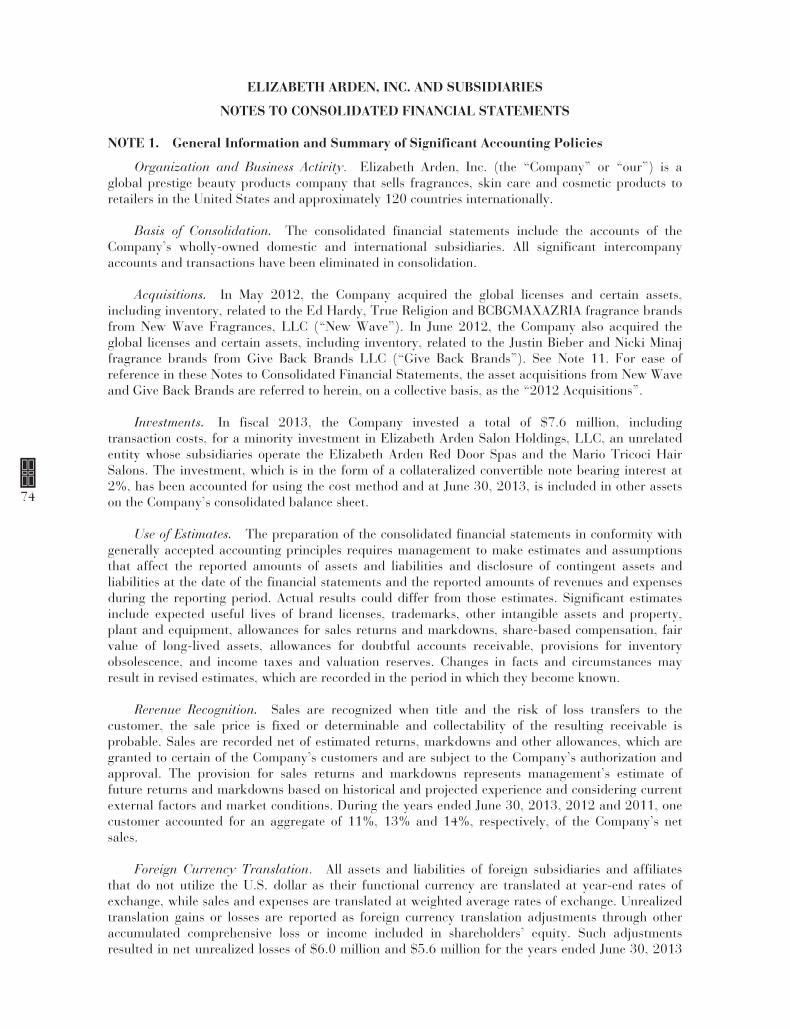
ELIZABETH ARDEN, INC. AND SUBSIDIARIES
NOTES TO CONSOLIDATED FINANCIAL STATEMENTS
NOTE 1. General Information and Summary of Significant Accounting Policies
Organization and Business Activity. Elizabeth Arden, Inc. (the “Company” or “our”) is aglobal prestige beauty products company that sells fragrances, skin care and cosmetic products toretailers in the United States and approximately 120 countries internationally.
Basis of Consolidation. The consolidated financial statements include the accounts of theCompany’s wholly-owned domestic and international subsidiaries. All significant intercompanyaccounts and transactions have been eliminated in consolidation.
Acquisitions. In May 2012, the Company acquired the global licenses and certain assets,including inventory, related to the Ed Hardy, True Religion and BCBGMAXAZRIA fragrance brandsfrom New Wave Fragrances, LLC (“New Wave”). In June 2012, the Company also acquired theglobal licenses and certain assets, including inventory, related to the Justin Bieber and Nicki Minajfragrance brands from Give Back Brands LLC (“Give Back Brands”). See Note 11. For ease ofreference in these Notes to Consolidated Financial Statements, the asset acquisitions from New Waveand Give Back Brands are referred to herein, on a collective basis, as the “2012 Acquisitions”.
Investments. In fiscal 2013, the Company invested a total of $7.6 million, includingtransaction costs, for a minority investment in Elizabeth Arden Salon Holdings, LLC, an unrelatedentity whose subsidiaries operate the Elizabeth Arden Red Door Spas and the Mario Tricoci HairSalons. The investment, which is in the form of a collateralized convertible note bearing interest at2%, has been accounted for using the cost method and at June 30, 2013, is included in other assetson the Company’s consolidated balance sheet.
Use of Estimates. The preparation of the consolidated financial statements in conformity withgenerally accepted accounting principles requires management to make estimates and assumptionsthat affect the reported amounts of assets and liabilities and disclosure of contingent assets andliabilities at the date of the financial statements and the reported amounts of revenues and expensesduring the reporting period. Actual results could differ from those estimates. Significant estimatesinclude expected useful lives of brand licenses, trademarks, other intangible assets and property,plant and equipment, allowances for sales returns and markdowns, share-based compensation, fairvalue of long-lived assets, allowances for doubtful accounts receivable, provisions for inventoryobsolescence, and income taxes and valuation reserves. Changes in facts and circumstances mayresult in revised estimates, which are recorded in the period in which they become known.
Revenue Recognition. Sales are recognized when title and the risk of loss transfers to thecustomer, the sale price is fixed or determinable and collectability of the resulting receivable isprobable. Sales are recorded net of estimated returns, markdowns and other allowances, which aregranted to certain of the Company’s customers and are subject to the Company’s authorization andapproval. The provision for sales returns and markdowns represents management’s estimate offuture returns and markdowns based on historical and projected experience and considering currentexternal factors and market conditions. During the years ended June 30, 2013, 2012 and 2011, onecustomer accounted for an aggregate of 11%, 13% and 14%, respectively, of the Company’s netsales.
Foreign Currency Translation. All assets and liabilities of foreign subsidiaries and affiliatesthat do not utilize the U.S. dollar as their functional currency are translated at year-end rates ofexchange, while sales and expenses are translated at weighted average rates of exchange. Unrealizedtranslation gains or losses are reported as foreign currency translation adjustments through otheraccumulated comprehensive loss or income included in shareholders’ equity. Such adjustmentsresulted in net unrealized losses of $6.0 million and $5.6 million for the years ended June 30, 2013
74

ELIZABETH ARDEN, INC. AND SUBSIDIARIES
NOTES TO CONSOLIDATED FINANCIAL STATEMENTS—(CONTINUED)
and 2012, respectively, and net unrealized gains of $8.4 million for the year ended June 30, 2011.Gains or losses resulting from foreign currency transactions are recorded in the foreign subsidiaries’statements of operations. Such net losses totaled $1.5 million, $4.2 million and $0.9 million, in theyears ended June 30, 2013, 2012 and 2011, respectively.
Cash and Cash Equivalents. Cash and cash equivalents include cash and interest-bearingdeposits at banks with an original maturity date of three months or less.
Allowances for Doubtful Accounts Receivable. The Company maintains allowances fordoubtful accounts to cover uncollectible accounts receivable and evaluates its accounts receivable todetermine if they will ultimately be collected. This evaluation includes significant judgments andestimates, including an analysis of receivables aging and a customer-by-customer review for largeaccounts. If, for example, the financial condition of the Company’s customers deteriorates resultingin an impairment of their ability to pay, additional allowances may be required, resulting in acharge to income in the period in which the determination was made.
Inventories. Inventories are stated at the lower of cost or market. Cost is determined using theweighted average method. See Note 5.
Property and Equipment, and Depreciation. Property and equipment are stated at cost.Expenditures for major improvements and additions are recorded to the asset accounts, whilereplacements, maintenance and repairs, which do not improve or extend the lives of the respectiveassets, are charged to expense. Depreciation is provided over the estimated useful lives of the assetsusing the straight-line method. When fixed assets are sold or otherwise disposed of, the accounts arerelieved of the original cost of the assets and the related accumulated depreciation and any resultingprofit or loss is credited or charged to income. See Note 6.
Exclusive Brand Licenses, Trademarks, and Intangibles. The Company’s definite livedintangible assets are being amortized using the straight-line method over their estimated usefullives. Intangible assets that have indefinite useful lives are not being amortized. See Note 7.
Indefinite-Lived and Long-Lived Assets. Goodwill and intangible assets with indefinite livesare not amortized, but rather assessed for impairment at least annually. An annual impairmentassessment is performed during the Company’s fourth fiscal quarter or more frequently if events orchanges in circumstances indicate the carrying value of goodwill and indefinite-lived intangibleassets may not fully be recoverable. The Company adopted the updated guidance to Topic 350,Intangibles- Goodwill and Other, issued by the Financial Accounting Standards Board (“FASB”) inSeptember 2011, for its annual goodwill impairment assessment that was performed during fiscalyear 2012. The updated guidance simplifies how an entity assesses goodwill for impairment andallows an entity to first assess qualitative factors to determine whether it is necessary to perform thetwo-step quantitative impairment assessment. An entity is no longer required to calculate the fairvalue of a reporting unit unless the entity determines, based on a qualitative assessment, that it ismore likely than not that its fair value is less than its carrying amount. Should a goodwillimpairment assessment be necessary, there is a two step process for assessing impairment ofgoodwill. The first step, used to identify potential impairment, compares the fair value of a reportingunit with its carrying amount, including goodwill. The second step, if necessary, measures theamount of the impairment by comparing the estimated fair value of the goodwill and intangibleassets to their respective carrying values. If an impairment is identified, the carrying value of theasset is adjusted to estimated fair value.
Long-lived assets are reviewed for impairment upon the occurrence of specific triggering events.The impairment assessment is based on a comparison of the carrying value of such assets against the
75

ELIZABETH ARDEN, INC. AND SUBSIDIARIES
NOTES TO CONSOLIDATED FINANCIAL STATEMENTS—(CONTINUED)
undiscounted future cash flows expected to be generated by such assets. If an impairment isidentified, the carrying value of the asset is adjusted to estimated fair value. There were notriggering events identified, and therefore no such adjustments were recorded for the years endedJune 30, 2013, 2012 or 2011. See Note 7.
Leases. The Company leases distribution equipment, office and computer equipment, andvehicles. The Company also has operating leases for office and retail space. The Company reviewsall of its leases to determine whether they qualify as operating or capital leases. Leaseholdimprovements are capitalized and amortized over the lesser of the useful life of the asset or currentlease term. The Company accounts for free rent periods and scheduled rent increases on a straight-line basis over the lease term. Landlord allowances and incentives are recorded as deferred rent andare amortized as a reduction to rent expense over the lease term.
Debt Issuance Costs. Debt issuance costs and transaction fees, which are associated with theissuance of senior notes, the revolving credit facility and second lien facility (see Note 8), are beingamortized and charged to interest expense over the term of the related notes or the term of theapplicable credit facility. In any period in which the senior notes are redeemed, the unamortizeddebt issuance costs and transaction fees relating to the notes being redeemed are expensed. Inaddition, termination costs related to interest rate swaps are amortized to interest expense over theremaining life of the related notes. See Note 9.
Cost of Sales. Included in cost of sales are the cost of products sold, the cost of gift withpurchase items provided to customers, royalty costs related to patented technology or formulations,warehousing, distribution and supply chain costs. The major components of warehousing,distribution and supply chain costs include salary and related benefit costs for employees in thewarehousing, distribution and supply chain functions and facility related costs in these areas.
Selling, General and Administrative Costs. Included in selling, general and administrativeexpenses are advertising, creative development and promotion costs not paid directly to theCompany’s customers, royalty costs related to trademarks, salary and related benefit costs of theCompany’s employees in the finance, human resources, information technology, legal, sales andmarketing functions, facility related costs of the Company’s administrative functions, and costs paidto consultants and third party providers for related services.
Advertising and Promotional Costs. Advertising and promotional costs paid directly tocustomers for goods and services provided (primarily co-op advertising and certain direct sellingcosts) are expensed as incurred and are recorded as a reduction of sales. Advertising andpromotional costs not paid directly to the Company’s customers are expensed as incurred andrecorded as a component of cost of goods sold (in the case of free goods given to customers) orselling, general and administrative expenses. Advertising and promotional costs include promotions,direct selling, co-op advertising and media placement. Advertising and promotional costs for theyears ended June 30, 2013, 2012 and 2011 were as follows:
Year Ended June 30,(Amounts in millions) 2013 2012 2011
Advertising and promotional costs . . . . . . . . . . . . . . . . . . . . . . . . . . . . . . $414.1 $353.1 $332.8
Income Taxes. The provision for income taxes is the tax payable or refundable for the periodplus or minus the change during the period in deferred tax assets and liabilities and certain otheradjustments. The Company provides for deferred taxes under the liability method. Under suchmethod, deferred taxes are adjusted for tax rate changes as they occur. Deferred income tax assetsand liabilities are computed annually for differences between the financial statement and tax basesof assets and liabilities that will result in taxable or deductible amounts in the future based on
76

ELIZABETH ARDEN, INC. AND SUBSIDIARIES
NOTES TO CONSOLIDATED FINANCIAL STATEMENTS—(CONTINUED)
enacted tax laws and rates applicable to the periods in which the differences are expected to affecttaxable income. A valuation allowance is provided for deferred tax assets if it is more likely than notthat these items will either expire before the Company is able to realize their benefit, or, that futuredeductibility is uncertain. The Company has not provided for taxes on undistributed earnings offoreign subsidiaries, as these earnings are deemed to be permanently reinvested. If in the futurethese earnings are repatriated to the United States, or if the Company determines such earnings willbe remitted in the foreseeable future, additional tax provisions may be required.
The Company recognizes in its consolidated financial statements the impact of a tax position ifit is more likely than not that such position will be sustained on audit based on its technical merits.While the Company believes that its assessments of whether its tax positions are more likely than notto be sustained are reasonable, each assessment is subjective and requires the use of significantjudgments. As a result, one or more of such assessments may prove ultimately to be incorrect, whichcould result in a change to net income.
Hedge Contracts. The Company has designated each foreign currency contract entered into asof June 30, 2013, as a cash flow hedge. Unrealized gains or losses, net of taxes, associated with thesecontracts are included in accumulated other comprehensive income on the consolidated balancesheet. Gains and losses will only be recognized in earnings in the period in which the forecastedtransaction affects earnings or the transactions are no longer probable of occurring. Changes to fairvalue of any contracts deemed to be ineffective would be recognized in earnings immediately.
Other Payables and Accrued Expenses. A summary of the Company’s other payables andaccrued expenses as of June 30, 2013 and 2012, is as follows:
(Amounts in thousands)June 30,
2013June 30,
2012
Accrued employee-related benefits . . . . . . . . . . . . . . . . . . . . . . . . . . . . . . . . . . . $12,605 $ 28,288Accrued advertising, promotion and royalties . . . . . . . . . . . . . . . . . . . . . . . . . . 26,668 27,774Accrued value added taxes . . . . . . . . . . . . . . . . . . . . . . . . . . . . . . . . . . . . . . . . . 6,395 5,017Accrued interest . . . . . . . . . . . . . . . . . . . . . . . . . . . . . . . . . . . . . . . . . . . . . . . . . 6,200 5,819Other accruals . . . . . . . . . . . . . . . . . . . . . . . . . . . . . . . . . . . . . . . . . . . . . . . . . . . 38,311 44,620
Total other payables and accrued expenses . . . . . . . . . . . . . . . . . . . . . . . . . . . . $90,179 $111,518
Accumulated Other Comprehensive (Loss) Income. Accumulated other comprehensive (loss)income includes, in addition to net income or net loss, unrealized gains and losses excluded from theconsolidated statements of operations and recorded directly into a separate section of shareholders’equity on the consolidated balance sheet. These unrealized gains and losses are referred to as othercomprehensive income (loss) items. The Company’s accumulated other comprehensive (loss) incomeshown on the consolidated balance sheets at June 30, 2013 and June 30, 2012, consists of foreigncurrency translation adjustments, which are not adjusted for income taxes since they relate toindefinite investments in non-U.S. subsidiaries, and the unrealized gains (losses), net of taxes,related to the Company’s foreign currency contracts, respectively.
The components of accumulated other comprehensive (loss) income as of June 30, 2013, 2012and 2011, were as follows:
Year Ended June 30,(Amounts in thousands) 2013 2012 2011
Cumulative foreign currency translation adjustments . . . . . . . . . . . . . . $(5,007) $ 997 $ 6,548Unrealized hedging gain (loss), net of taxes . . . . . . . . . . . . . . . . . . . . . . 597 169 (1,407)
Accumulated other comprehensive (loss) income . . . . . . . . . . . . . . . . . . $(4,410) $1,166 $ 5,141
77

ELIZABETH ARDEN, INC. AND SUBSIDIARIES
NOTES TO CONSOLIDATED FINANCIAL STATEMENTS—(CONTINUED)
Fair Value of Financial Instruments. The Company’s financial instruments include accountsreceivable, accounts payable, currency forward contracts, short-term debt and long-term debt. OnJanuary 1, 2012, the Company adopted the new FASB and the International Accounting StandardsBoard (“IASB”) guidance on fair value measurement and disclosure requirements. This updatesupersedes most of the guidance in Topic 820, Fair Value Measurements and Disclosures and manyof the changes are clarifications of existing guidance or wording changes to align with InternationalFinancial Reporting Standards. The changes to Topic 820 did not have a material impact on theCompany’s consolidated financial statements or disclosures. The fair value of the Company’s seniornotes and all other financial instruments was not materially different than their carrying value as ofJune 30, 2013, and June 30, 2012. See Note 15.
Share-Based Compensation. All share-based payments to employees, including the grants ofemployee stock options, are recognized in the consolidated financial statements based on their fairvalues, but only to the extent that vesting is considered probable. Compensation cost for awards thatvest will not be reversed if the awards expire without being exercised. The fair value of stock optionsis determined using the Black-Scholes option-pricing model and the fair value of restricted stock andrestricted stock unit awards is based on the closing price of the Company’s common stock, $.01 parvalue (“Common Stock”) on the date of grant. Compensation costs for awards are amortized usingthe straight-line method. Option pricing model input assumptions such as expected term, expectedvolatility and risk-free interest rate impact the fair value estimate. Further, the forfeiture rateimpacts the amount of aggregate compensation. These assumptions are subjective and generallyrequire significant analysis and judgment to develop. When estimating fair value, some of theassumptions are based on or determined from external data and other assumptions may be derivedfrom the Company’s historical experience with share-based arrangements. The appropriate weight toplace on historical experience is a matter of judgment, based on relevant facts and circumstances.
The Company relies on its historical experience and post-vested termination activity to providedata for estimating expected term for use in determining the fair value of its stock options. TheCompany currently estimates its stock volatility by considering historical stock volatility experienceand other key factors. The risk-free interest rate is the implied yield currently available on U.S.Treasury zero-coupon issues with a remaining term equal to the expected term used as the input tothe Black-Scholes model. The Company estimates forfeitures using its historical experience, whichwill be adjusted over the requisite service period based on the extent to which actual forfeituresdiffer, or are expected to differ, from such estimates. Because of the significant amount of judgmentused in these calculations, it is reasonably likely that circumstances may cause the estimate tochange. If, for example, actual forfeitures are lower than the Company’s estimate, additional chargesto net income may be required.
Out-Of Period Adjustments. During the year ended June 30, 2013, the Company recorded out-of-period adjustments to correct an error related to deferred taxes. Income tax expense increased andnet income decreased by $0.9 million. The company did not adjust the prior periods as it concludedthat such adjustments were not material to the current or prior period consolidated financialstatements.
Reclassifications. To conform to the presentation for the fiscal year ended June 30, 2013,certain reclassifications were made to the prior year’s consolidated financial statements andaccompanying footnotes.
NOTE 2. Net Income Per Share
Basic net income per share is computed by dividing the net income by the weighted averageshares of the Company’s outstanding Common Stock. The calculation of net income per diluted
78
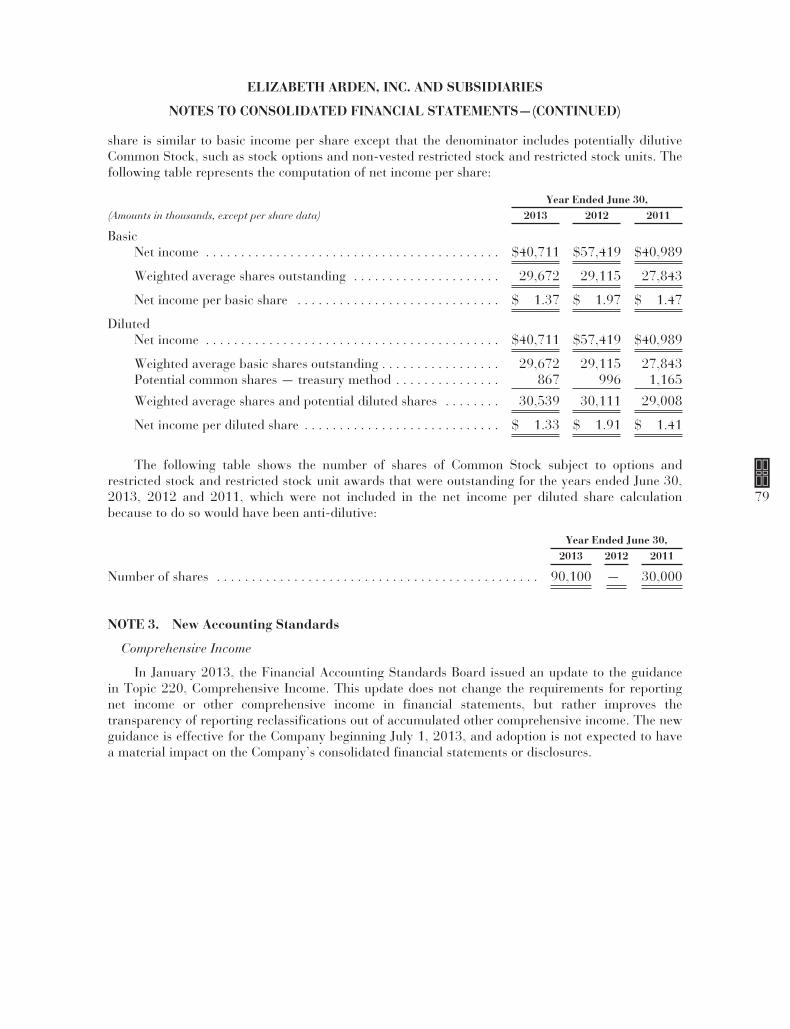
ELIZABETH ARDEN, INC. AND SUBSIDIARIES
NOTES TO CONSOLIDATED FINANCIAL STATEMENTS—(CONTINUED)
share is similar to basic income per share except that the denominator includes potentially dilutiveCommon Stock, such as stock options and non-vested restricted stock and restricted stock units. Thefollowing table represents the computation of net income per share:
Year Ended June 30,(Amounts in thousands, except per share data) 2013 2012 2011
BasicNet income . . . . . . . . . . . . . . . . . . . . . . . . . . . . . . . . . . . . . . . . . . $40,711 $57,419 $40,989
Weighted average shares outstanding . . . . . . . . . . . . . . . . . . . . . 29,672 29,115 27,843
Net income per basic share . . . . . . . . . . . . . . . . . . . . . . . . . . . . . $ 1.37 $ 1.97 $ 1.47
DilutedNet income . . . . . . . . . . . . . . . . . . . . . . . . . . . . . . . . . . . . . . . . . . $40,711 $57,419 $40,989
Weighted average basic shares outstanding . . . . . . . . . . . . . . . . . 29,672 29,115 27,843Potential common shares — treasury method . . . . . . . . . . . . . . . 867 996 1,165
Weighted average shares and potential diluted shares . . . . . . . . 30,539 30,111 29,008
Net income per diluted share . . . . . . . . . . . . . . . . . . . . . . . . . . . . $ 1.33 $ 1.91 $ 1.41
The following table shows the number of shares of Common Stock subject to options andrestricted stock and restricted stock unit awards that were outstanding for the years ended June 30,2013, 2012 and 2011, which were not included in the net income per diluted share calculationbecause to do so would have been anti-dilutive:
Year Ended June 30,2013 2012 2011
Number of shares . . . . . . . . . . . . . . . . . . . . . . . . . . . . . . . . . . . . . . . . . . . . . . 90,100 — 30,000
NOTE 3. New Accounting Standards
Comprehensive Income
In January 2013, the Financial Accounting Standards Board issued an update to the guidancein Topic 220, Comprehensive Income. This update does not change the requirements for reportingnet income or other comprehensive income in financial statements, but rather improves thetransparency of reporting reclassifications out of accumulated other comprehensive income. The newguidance is effective for the Company beginning July 1, 2013, and adoption is not expected to havea material impact on the Company’s consolidated financial statements or disclosures.
79

ELIZABETH ARDEN, INC. AND SUBSIDIARIES
NOTES TO CONSOLIDATED FINANCIAL STATEMENTS—(CONTINUED)
NOTE 4. Accounts Receivable, Net
The following table details the provisions and allowances established for potential losses fromuncollectible accounts receivable and estimated sales returns in the ordinary course of business:
Year Ended June 30,(Amounts in thousands) 2013 2012 2011
Allowance for Bad Debt:Beginning balance . . . . . . . . . . . . . . . . . . . . . . . . . . . . . . . . . . $ 5,883 $ 6,961 $ 6,127Provision . . . . . . . . . . . . . . . . . . . . . . . . . . . . . . . . . . . . . . . . . 462 418 2,303Write-offs, net of recoveries . . . . . . . . . . . . . . . . . . . . . . . . . . . (2,864) (1,496) (1,469)
Ending balance . . . . . . . . . . . . . . . . . . . . . . . . . . . . . . . . . . . . $ 3,481 $ 5,883 $ 6,961
Allowance for Sales Returns:Beginning balance . . . . . . . . . . . . . . . . . . . . . . . . . . . . . . . . . . $ 16,548 $ 16,101 $ 19,568Provision(1) . . . . . . . . . . . . . . . . . . . . . . . . . . . . . . . . . . . . . . . . 72,939 57,121 57,398Actual returns(1) . . . . . . . . . . . . . . . . . . . . . . . . . . . . . . . . . . . . (69,954) (56,674) (60,865)
Ending balance . . . . . . . . . . . . . . . . . . . . . . . . . . . . . . . . . . . . $ 19,533 $ 16,548 $ 16,101
(1) The increase in fiscal 2013 compared to fiscal 2012 was primarily due to the Elizabeth Ardenbrand repositioning and higher sales, primarily to North America department stores andspecialty beauty store customers that have return rights, as a result of the brands acquiredunder the 2012 Acquisitions.
NOTE 5. Inventories
The components of inventory were as follows:
June 30,(Amounts in thousands) 2013 2012
Raw and packaging materials . . . . . . . . . . . . . . . . . . . . . . . . . . . . . . . . . . . . . . $ 66,295 $ 55,362Work in progress . . . . . . . . . . . . . . . . . . . . . . . . . . . . . . . . . . . . . . . . . . . . . . . . 26,902 19,650Finished goods . . . . . . . . . . . . . . . . . . . . . . . . . . . . . . . . . . . . . . . . . . . . . . . . . 217,737 216,975
Totals . . . . . . . . . . . . . . . . . . . . . . . . . . . . . . . . . . . . . . . . . . . . . . . . . . . . . . . . $310,934 $291,987
80
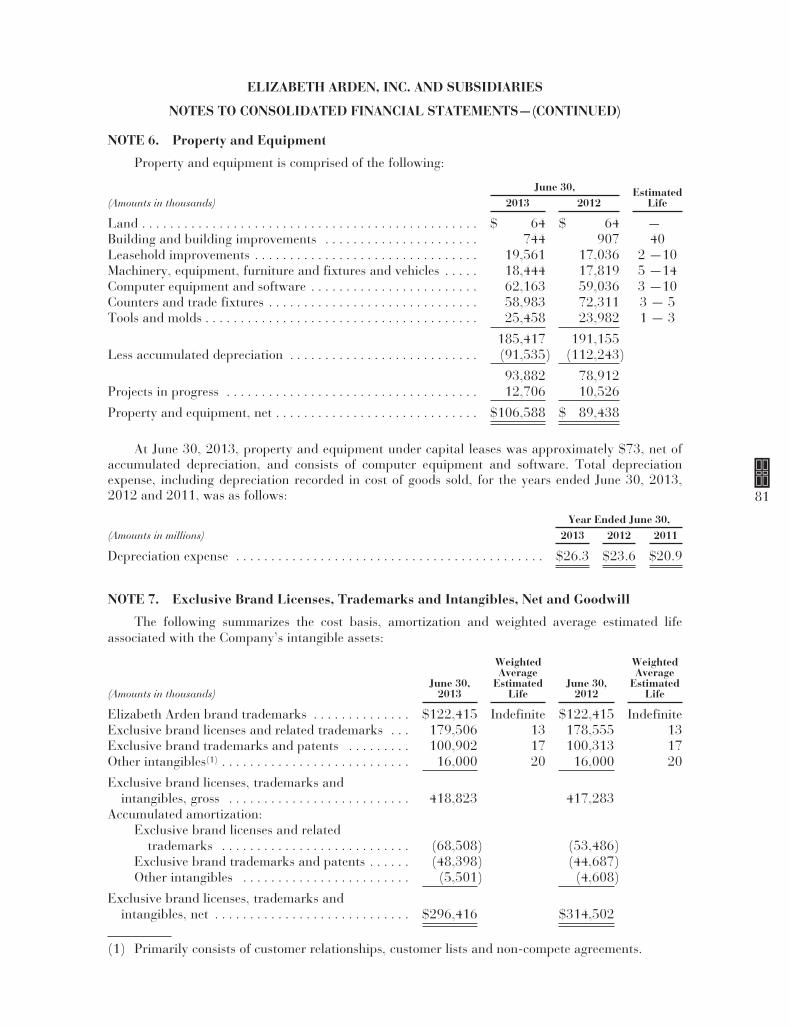
ELIZABETH ARDEN, INC. AND SUBSIDIARIES
NOTES TO CONSOLIDATED FINANCIAL STATEMENTS—(CONTINUED)
NOTE 6. Property and Equipment
Property and equipment is comprised of the following:
June 30, EstimatedLife(Amounts in thousands) 2013 2012
Land . . . . . . . . . . . . . . . . . . . . . . . . . . . . . . . . . . . . . . . . . . . . . . . . $ 64 $ 64 —Building and building improvements . . . . . . . . . . . . . . . . . . . . . . 744 907 40Leasehold improvements . . . . . . . . . . . . . . . . . . . . . . . . . . . . . . . . 19,561 17,036 2 —10Machinery, equipment, furniture and fixtures and vehicles . . . . . 18,444 17,819 5 —14Computer equipment and software . . . . . . . . . . . . . . . . . . . . . . . . 62,163 59,036 3 —10Counters and trade fixtures . . . . . . . . . . . . . . . . . . . . . . . . . . . . . . 58,983 72,311 3 — 5Tools and molds . . . . . . . . . . . . . . . . . . . . . . . . . . . . . . . . . . . . . . . 25,458 23,982 1 — 3
185,417 191,155Less accumulated depreciation . . . . . . . . . . . . . . . . . . . . . . . . . . . (91,535) (112,243)
93,882 78,912Projects in progress . . . . . . . . . . . . . . . . . . . . . . . . . . . . . . . . . . . . 12,706 10,526
Property and equipment, net . . . . . . . . . . . . . . . . . . . . . . . . . . . . . $106,588 $ 89,438
At June 30, 2013, property and equipment under capital leases was approximately $73, net ofaccumulated depreciation, and consists of computer equipment and software. Total depreciationexpense, including depreciation recorded in cost of goods sold, for the years ended June 30, 2013,2012 and 2011, was as follows:
Year Ended June 30,(Amounts in millions) 2013 2012 2011
Depreciation expense . . . . . . . . . . . . . . . . . . . . . . . . . . . . . . . . . . . . . . . . . . . . $26.3 $23.6 $20.9
NOTE 7. Exclusive Brand Licenses, Trademarks and Intangibles, Net and Goodwill
The following summarizes the cost basis, amortization and weighted average estimated lifeassociated with the Company’s intangible assets:
(Amounts in thousands)June 30,
2013
WeightedAverage
EstimatedLife
June 30,2012
WeightedAverage
EstimatedLife
Elizabeth Arden brand trademarks . . . . . . . . . . . . . . $122,415 Indefinite $122,415 IndefiniteExclusive brand licenses and related trademarks . . . 179,506 13 178,555 13Exclusive brand trademarks and patents . . . . . . . . . 100,902 17 100,313 17Other intangibles(1) . . . . . . . . . . . . . . . . . . . . . . . . . . . 16,000 20 16,000 20
Exclusive brand licenses, trademarks andintangibles, gross . . . . . . . . . . . . . . . . . . . . . . . . . . 418,823 417,283
Accumulated amortization:Exclusive brand licenses and related
trademarks . . . . . . . . . . . . . . . . . . . . . . . . . . . (68,508) (53,486)Exclusive brand trademarks and patents . . . . . . (48,398) (44,687)Other intangibles . . . . . . . . . . . . . . . . . . . . . . . . (5,501) (4,608)
Exclusive brand licenses, trademarks andintangibles, net . . . . . . . . . . . . . . . . . . . . . . . . . . . . $296,416 $314,502
(1) Primarily consists of customer relationships, customer lists and non-compete agreements.
81

ELIZABETH ARDEN, INC. AND SUBSIDIARIES
NOTES TO CONSOLIDATED FINANCIAL STATEMENTS—(CONTINUED)
At June 30, 2013, the Company had goodwill of $21.1 million recorded on its consolidatedbalance sheet. The entire amount of the goodwill in all periods presented relates to the NorthAmerica segment. The amount of goodwill recorded on the consolidated balance sheet at June 30,2013 did not change from the prior year end balance as the Company did not record any additionsor impairments during fiscal 2013.
Goodwill and intangible assets with indefinite lives, such as the Company’s Elizabeth Ardentrademarks, are not amortized, but rather assessed for impairment at least annually. An annualimpairment assessment is performed during the fourth quarter of the Company’s fiscal year or morefrequently if events or changes in circumstances indicate the carrying value of goodwill and indefinite-lived intangibles may not fully be recoverable. During fiscal year 2012, the Company adopted theupdated guidance to Topic 350, Intangibles- Goodwill and Other, issued by the Financial AccountingStandards Board (“FASB”) in September 2011, for its annual impairment assessment of goodwill.During the quarter ended June 30, 2013, the Company completed the Company’s annual impairmentassessment of goodwill using the qualitative assessment under Topic 350 and the analysis indicatedthat no impairment adjustment was required. Similarly, no such adjustments for impairment ofgoodwill were recorded for the fiscal years ended June 30, 2012 or 2011.
In July 2012, the FASB issued another update to Codification Topic 350, Intangibles- Goodwilland Other: Testing Indefinite-Lived Intangible Assets for Impairment. This update simplifies theguidance for testing impairment of indefinite-lived intangible assets other than goodwill. Examplesof intangible assets subject to the guidance include indefinite-lived trademarks, licenses, anddistribution rights. The amendments allow a company the option to first assess qualitative factors todetermine whether it is necessary to perform the quantitative impairment test. A company electingto perform a qualitative assessment is no longer required to calculate the fair value of an indefinite-lived intangible asset unless the company determines, based on such qualitative assessment, that it is“more likely than not” that the asset is impaired. The changes to Codification Topic 350 will beeffective for the Company beginning July 1, 2013, with early adoption permitted. The Company didnot adopt the updated guidance in Topic 350 for its annual impairment test performed forindefinite-lived intangible assets other than goodwill during the quarter ended June 30, 2013,although adoption of the updated guidance is not expected to have a material impact on theCompany’s consolidated financial statements or disclosures.
The Company has determined that the Elizabeth Arden trademarks have indefinite useful lives,as cash flows from the use of the trademarks are expected to be generated indefinitely. During thequarter ended June 30, 2013, the Company completed its annual impairment assessment of theElizabeth Arden trademarks, with the assistance of a third party valuation firm. In assessing the fairvalue of these assets, the Company considered the income approach for the Elizabeth Ardentrademarks. Under the income approach, the fair value is based on the present value of estimatedfuture cash flows. The analysis indicated that no impairment adjustment was required as theestimated fair value exceeded the recorded carrying value. Similarly, no such adjustments forimpairment of intangible assets were recorded for the fiscal years ended June 30, 2012 or 2011.
Due to the ongoing uncertainty in capital market conditions, the Company will continue tomonitor and evaluate the expected future cash flows of its reporting units and the long term trendsof its market capitalization for the purposes of assessing the carrying value of its goodwill andindefinite-lived Elizabeth Arden trademarks, other trademarks and intangible assets.
82
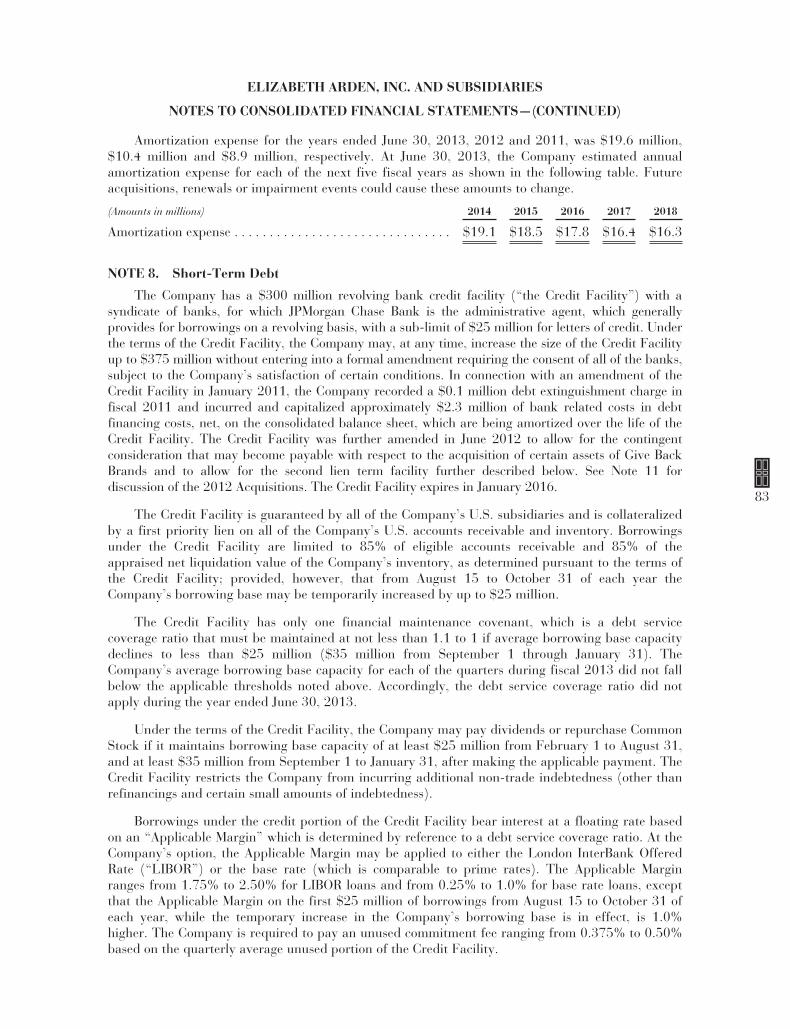
ELIZABETH ARDEN, INC. AND SUBSIDIARIES
NOTES TO CONSOLIDATED FINANCIAL STATEMENTS—(CONTINUED)
Amortization expense for the years ended June 30, 2013, 2012 and 2011, was $19.6 million,$10.4 million and $8.9 million, respectively. At June 30, 2013, the Company estimated annualamortization expense for each of the next five fiscal years as shown in the following table. Futureacquisitions, renewals or impairment events could cause these amounts to change.
(Amounts in millions) 2014 2015 2016 2017 2018
Amortization expense . . . . . . . . . . . . . . . . . . . . . . . . . . . . . . . $19.1 $18.5 $17.8 $16.4 $16.3
NOTE 8. Short-Term Debt
The Company has a $300 million revolving bank credit facility (“the Credit Facility”) with asyndicate of banks, for which JPMorgan Chase Bank is the administrative agent, which generallyprovides for borrowings on a revolving basis, with a sub-limit of $25 million for letters of credit. Underthe terms of the Credit Facility, the Company may, at any time, increase the size of the Credit Facilityup to $375 million without entering into a formal amendment requiring the consent of all of the banks,subject to the Company’s satisfaction of certain conditions. In connection with an amendment of theCredit Facility in January 2011, the Company recorded a $0.1 million debt extinguishment charge infiscal 2011 and incurred and capitalized approximately $2.3 million of bank related costs in debtfinancing costs, net, on the consolidated balance sheet, which are being amortized over the life of theCredit Facility. The Credit Facility was further amended in June 2012 to allow for the contingentconsideration that may become payable with respect to the acquisition of certain assets of Give BackBrands and to allow for the second lien term facility further described below. See Note 11 fordiscussion of the 2012 Acquisitions. The Credit Facility expires in January 2016.
The Credit Facility is guaranteed by all of the Company’s U.S. subsidiaries and is collateralizedby a first priority lien on all of the Company’s U.S. accounts receivable and inventory. Borrowingsunder the Credit Facility are limited to 85% of eligible accounts receivable and 85% of theappraised net liquidation value of the Company’s inventory, as determined pursuant to the terms ofthe Credit Facility; provided, however, that from August 15 to October 31 of each year theCompany’s borrowing base may be temporarily increased by up to $25 million.
The Credit Facility has only one financial maintenance covenant, which is a debt servicecoverage ratio that must be maintained at not less than 1.1 to 1 if average borrowing base capacitydeclines to less than $25 million ($35 million from September 1 through January 31). TheCompany’s average borrowing base capacity for each of the quarters during fiscal 2013 did not fallbelow the applicable thresholds noted above. Accordingly, the debt service coverage ratio did notapply during the year ended June 30, 2013.
Under the terms of the Credit Facility, the Company may pay dividends or repurchase CommonStock if it maintains borrowing base capacity of at least $25 million from February 1 to August 31,and at least $35 million from September 1 to January 31, after making the applicable payment. TheCredit Facility restricts the Company from incurring additional non-trade indebtedness (other thanrefinancings and certain small amounts of indebtedness).
Borrowings under the credit portion of the Credit Facility bear interest at a floating rate basedon an “Applicable Margin” which is determined by reference to a debt service coverage ratio. At theCompany’s option, the Applicable Margin may be applied to either the London InterBank OfferedRate (“LIBOR”) or the base rate (which is comparable to prime rates). The Applicable Marginranges from 1.75% to 2.50% for LIBOR loans and from 0.25% to 1.0% for base rate loans, exceptthat the Applicable Margin on the first $25 million of borrowings from August 15 to October 31 ofeach year, while the temporary increase in the Company’s borrowing base is in effect, is 1.0%higher. The Company is required to pay an unused commitment fee ranging from 0.375% to 0.50%based on the quarterly average unused portion of the Credit Facility.
83

ELIZABETH ARDEN, INC. AND SUBSIDIARIES
NOTES TO CONSOLIDATED FINANCIAL STATEMENTS—(CONTINUED)
At June 30, 2013, the Applicable Margin was 1.75% for LIBOR loans and 0.25% for prime rateloans. For the fiscal years ended June 30, 2013 and 2012, the weighted average annual interest rateon borrowings under the Credit Facility was 2.1% and 2.2%, respectively.
In connection with the 2012 acquisitions of fragrance licenses and certain other assets fromNew Wave Fragrances LLC and Give Back Brands LLC, on June 12, 2012, the Company enteredinto a second lien credit agreement with JPMorgan Chase Bank, N.A. providing the Company theability to borrow up to $30 million on or prior to July 2, 2012 (the “Second Lien Facility”). OnJuly 2, 2012, the Company borrowed $30 million under the Second Lien Facility and used theproceeds to repay amounts under the Credit Facility. The Second Lien Facility is collateralized by asecond priority lien on all of the Company’s U.S. accounts receivable and inventories and the intereston borrowings charged under the Second Lien Facility was either (i) LIBOR plus an applicablemargin of 3.75% or (ii) the base rate specified in the Second Lien Facility (which is comparable toprime rates) plus a margin of 2.75%. The Company had the option to prepay all or a portion of theSecond Lien Facility anytime after February 1, 2013, provided the borrowing availability under theCredit Facility was in excess of $35 million after giving effect to the applicable prepayment each dayfor the 30 day period ending on the date of the prepayment. The Second Lien Facility matures onJuly 2, 2014.
On February 11, 2013, the Company prepaid all of the amounts outstanding under the SecondLien Facility and amended the Second Lien Facility to allow for borrowings of up to $30 million ona revolving basis until its maturity. The amendment also reduced the interest on borrowings on theSecond Lien Facility to (i) LIBOR plus an applicable margin of 3.25% or (ii) the base rate specifiedin the Second Lien Facility (which is comparable to prime rates) plus a margin of 1.75%. Theunused commitment fee applicable to the Second Lien Facility ranges from 0.25% to 0.375%. Tothe extent the Company borrows amounts under the Second Lien Facility, the Company has theoption to prepay all or a portion of such borrowings, provided the borrowing base capacity under theCredit Facility is in excess of $35 million after giving effect to the applicable prepayment each dayfor the 30 day period ending on the date of the prepayment.
At June 30, 2013, the Company had $88.0 million in borrowings and $2.6 million in letters ofcredit outstanding under the Credit Facility, compared with $89.2 million in borrowings and $4.4million in letters of credit outstanding under the Credit Facility at June 30, 2012. At June 30, 2013,the Company had no outstanding borrowings under the Second Lien Facility. At June 30, 2013,based on eligible accounts receivable and inventory available as collateral, an additional $81.4million in the aggregate could be borrowed under the Credit Facility and the Second Lien Facility.In periods when there are outstanding borrowings, the Company classifies the Credit Facility andSecond Lien Facility as short term debt on its balance sheet because it expects to reduce outstandingborrowings over the next twelve months.
NOTE 9. Long-Term Debt
The Company’s long-term debt consisted of the following:
(Amounts in thousands)June 30,
2013June 30,
2012
73⁄8% Senior Notes due March 2021 . . . . . . . . . . . . . . . . . . . . . . . . . . . . . . . . $250,000 $250,000
On January 21, 2011, the Company issued $250 million aggregate principal amount of 73⁄8%Senior Notes due March 2021 (the “73⁄8% Senior Notes”). Interest on the 73⁄8% Senior Notesaccrues at a rate of 7.375% per annum and is payable semi-annually on March 15 andSeptember 15 of every year. The 73⁄8% Senior Notes rank pari passu in right of payment to
84
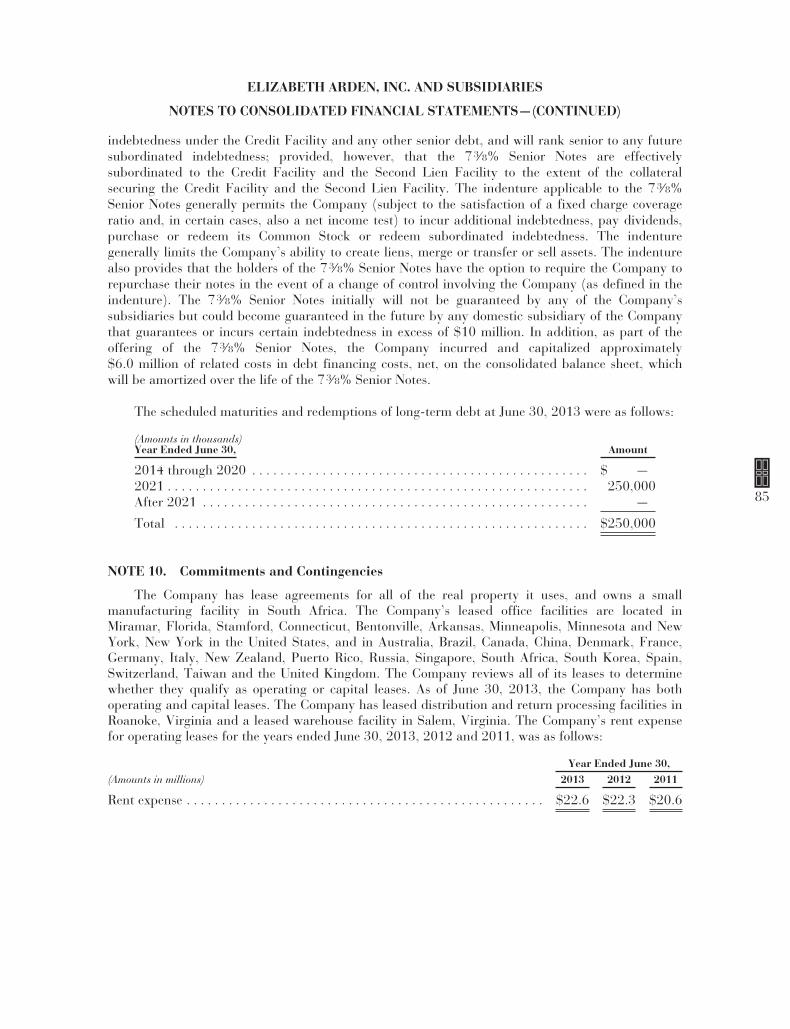
ELIZABETH ARDEN, INC. AND SUBSIDIARIES
NOTES TO CONSOLIDATED FINANCIAL STATEMENTS—(CONTINUED)
indebtedness under the Credit Facility and any other senior debt, and will rank senior to any futuresubordinated indebtedness; provided, however, that the 73⁄8% Senior Notes are effectivelysubordinated to the Credit Facility and the Second Lien Facility to the extent of the collateralsecuring the Credit Facility and the Second Lien Facility. The indenture applicable to the 73⁄8%Senior Notes generally permits the Company (subject to the satisfaction of a fixed charge coverageratio and, in certain cases, also a net income test) to incur additional indebtedness, pay dividends,purchase or redeem its Common Stock or redeem subordinated indebtedness. The indenturegenerally limits the Company’s ability to create liens, merge or transfer or sell assets. The indenturealso provides that the holders of the 73⁄8% Senior Notes have the option to require the Company torepurchase their notes in the event of a change of control involving the Company (as defined in theindenture). The 73⁄8% Senior Notes initially will not be guaranteed by any of the Company’ssubsidiaries but could become guaranteed in the future by any domestic subsidiary of the Companythat guarantees or incurs certain indebtedness in excess of $10 million. In addition, as part of theoffering of the 73⁄8% Senior Notes, the Company incurred and capitalized approximately$6.0 million of related costs in debt financing costs, net, on the consolidated balance sheet, whichwill be amortized over the life of the 73⁄8% Senior Notes.
The scheduled maturities and redemptions of long-term debt at June 30, 2013 were as follows:
(Amounts in thousands)Year Ended June 30, Amount
2014 through 2020 . . . . . . . . . . . . . . . . . . . . . . . . . . . . . . . . . . . . . . . . . . . . . . . . $ —2021 . . . . . . . . . . . . . . . . . . . . . . . . . . . . . . . . . . . . . . . . . . . . . . . . . . . . . . . . . . . . 250,000After 2021 . . . . . . . . . . . . . . . . . . . . . . . . . . . . . . . . . . . . . . . . . . . . . . . . . . . . . . . —
Total . . . . . . . . . . . . . . . . . . . . . . . . . . . . . . . . . . . . . . . . . . . . . . . . . . . . . . . . . . . $250,000
NOTE 10. Commitments and Contingencies
The Company has lease agreements for all of the real property it uses, and owns a smallmanufacturing facility in South Africa. The Company’s leased office facilities are located inMiramar, Florida, Stamford, Connecticut, Bentonville, Arkansas, Minneapolis, Minnesota and NewYork, New York in the United States, and in Australia, Brazil, Canada, China, Denmark, France,Germany, Italy, New Zealand, Puerto Rico, Russia, Singapore, South Africa, South Korea, Spain,Switzerland, Taiwan and the United Kingdom. The Company reviews all of its leases to determinewhether they qualify as operating or capital leases. As of June 30, 2013, the Company has bothoperating and capital leases. The Company has leased distribution and return processing facilities inRoanoke, Virginia and a leased warehouse facility in Salem, Virginia. The Company’s rent expensefor operating leases for the years ended June 30, 2013, 2012 and 2011, was as follows:
Year Ended June 30,(Amounts in millions) 2013 2012 2011
Rent expense . . . . . . . . . . . . . . . . . . . . . . . . . . . . . . . . . . . . . . . . . . . . . . . . . . . $22.6 $22.3 $20.6
85

ELIZABETH ARDEN, INC. AND SUBSIDIARIES
NOTES TO CONSOLIDATED FINANCIAL STATEMENTS—(CONTINUED)
The Company’s aggregate minimum lease payments under its operating and capital leases andother long-term liabilities (other than long-term debt) at June 30, 2013, were as follows:
(Amounts in thousands)Operating
LeasesCapitalLeases
OtherLong-term
Obligations(1) Total
2014 . . . . . . . . . . . . . . . . . . . . . . . . . . . . . . . . . . . . . . . . $17,989 $ 18 $ 5,000 $ 23,0072015 . . . . . . . . . . . . . . . . . . . . . . . . . . . . . . . . . . . . . . . . 17,141 18 12,463 29,6222016 . . . . . . . . . . . . . . . . . . . . . . . . . . . . . . . . . . . . . . . . 14,434 18 10,462 24,9142017 . . . . . . . . . . . . . . . . . . . . . . . . . . . . . . . . . . . . . . . . 11,188 19 — 11,2072018 . . . . . . . . . . . . . . . . . . . . . . . . . . . . . . . . . . . . . . . . 8,320 — — 8,320and thereafter . . . . . . . . . . . . . . . . . . . . . . . . . . . . . . . . . 25,870 — — 25,870
Total . . . . . . . . . . . . . . . . . . . . . . . . . . . . . . . . . . . . . . . . $94,942 $ 73 $27,925 $122,940
(1) Includes: (i) the contingent consideration which may become payable to Give Back Brands ifcertain sales targets are met (see Note 11), but (ii) excludes $10.0 million of unrecognized taxbenefits that, if not realized, would result in cash payments. The Company cannot currentlyestimate when, or if, any of the gross unrecognized tax benefits, will be due.
In connection with the acquisition of global licenses and certain assets from Give Back BrandsLLC in June 2012, the Company agreed to pay Give Back Brands LLC up to an additional $28million subject to the achievement of specified sales targets for the acquired brands over a three-yearperiod from July 1, 2012 through June 30, 2015. As part of the accounting for the acquisition, theCompany established a liability for the potential payment of $28 million based upon the probabilityof achieving the specified sales targets. See Note 11.
During fiscal 2013, the Company invested $7.6 million, including transaction costs, for aminority investment in Elizabeth Arden Salon Holdings, LLC, an unrelated party whose subsidiariesoperate the Elizabeth Arden Red Door Spas and the Mario Tricoci Hair Salons (“Salon Holdings”).The investment, which is in the form of a collateralized convertible note bearing interest at 2%, hasbeen accounted for using the cost method and at June 30, 2013, is included in other assets on theconsolidated balance sheet. The Company expects to invest an additional $2.1 million in fiscal2014. The Company entered into a co-investment agreement with another minority investor of SalonHoldings under which the minority investor has the ability to put its interest in Salon Holdings tothe Company under certain circumstances, at a specified price based on the performance of SalonHoldings over the previous 12 month period. Should the minority investor put its interest in SalonHoldings to the Company, it can elect to receive payment in cash, Common Stock or a combinationof both. As of June 30, 2013, if the minority investor had put its interest in Salon Holdings to theCompany, based on the performance of Salon Holdings over the previous 12 month period, theimpact would not have been material to the Company’s liquidity.
The Company is a party to a number of legal actions, proceedings, audits, tax audits, claimsand disputes, arising in the ordinary course of business, including those with current and formercustomers over amounts owed. While any action, proceeding, audit or claim contains an element ofuncertainty and may materially affect the Company’s cash flows and results of operations in aparticular quarter or year, based on current facts and circumstances, the Company’s managementbelieves that the outcome of such actions, proceedings, audits, claims and disputes will not have amaterial adverse effect on the Company’s business, prospects, results of operations, financialcondition or cash flows.
86
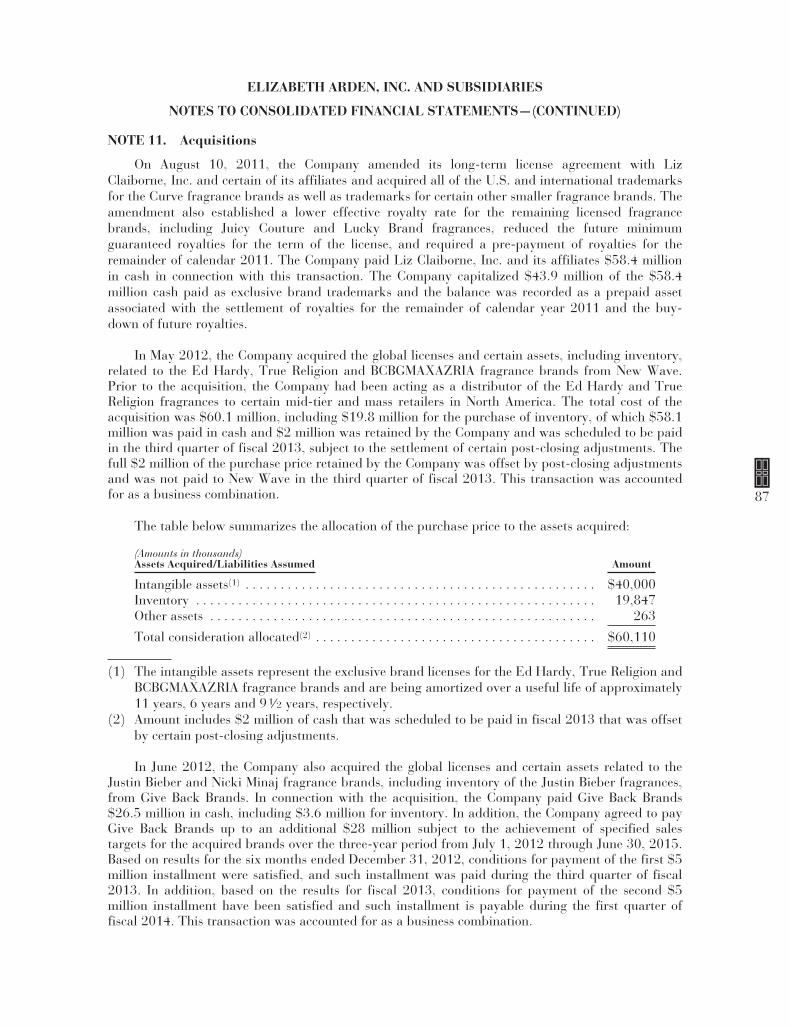
ELIZABETH ARDEN, INC. AND SUBSIDIARIES
NOTES TO CONSOLIDATED FINANCIAL STATEMENTS—(CONTINUED)
NOTE 11. Acquisitions
On August 10, 2011, the Company amended its long-term license agreement with LizClaiborne, Inc. and certain of its affiliates and acquired all of the U.S. and international trademarksfor the Curve fragrance brands as well as trademarks for certain other smaller fragrance brands. Theamendment also established a lower effective royalty rate for the remaining licensed fragrancebrands, including Juicy Couture and Lucky Brand fragrances, reduced the future minimumguaranteed royalties for the term of the license, and required a pre-payment of royalties for theremainder of calendar 2011. The Company paid Liz Claiborne, Inc. and its affiliates $58.4 millionin cash in connection with this transaction. The Company capitalized $43.9 million of the $58.4million cash paid as exclusive brand trademarks and the balance was recorded as a prepaid assetassociated with the settlement of royalties for the remainder of calendar year 2011 and the buy-down of future royalties.
In May 2012, the Company acquired the global licenses and certain assets, including inventory,related to the Ed Hardy, True Religion and BCBGMAXAZRIA fragrance brands from New Wave.Prior to the acquisition, the Company had been acting as a distributor of the Ed Hardy and TrueReligion fragrances to certain mid-tier and mass retailers in North America. The total cost of theacquisition was $60.1 million, including $19.8 million for the purchase of inventory, of which $58.1million was paid in cash and $2 million was retained by the Company and was scheduled to be paidin the third quarter of fiscal 2013, subject to the settlement of certain post-closing adjustments. Thefull $2 million of the purchase price retained by the Company was offset by post-closing adjustmentsand was not paid to New Wave in the third quarter of fiscal 2013. This transaction was accountedfor as a business combination.
The table below summarizes the allocation of the purchase price to the assets acquired:
(Amounts in thousands)Assets Acquired/Liabilities Assumed Amount
Intangible assets(1) . . . . . . . . . . . . . . . . . . . . . . . . . . . . . . . . . . . . . . . . . . . . . . . . . . $40,000Inventory . . . . . . . . . . . . . . . . . . . . . . . . . . . . . . . . . . . . . . . . . . . . . . . . . . . . . . . . . 19,847Other assets . . . . . . . . . . . . . . . . . . . . . . . . . . . . . . . . . . . . . . . . . . . . . . . . . . . . . . . 263
Total consideration allocated(2) . . . . . . . . . . . . . . . . . . . . . . . . . . . . . . . . . . . . . . . . $60,110
(1) The intangible assets represent the exclusive brand licenses for the Ed Hardy, True Religion andBCBGMAXAZRIA fragrance brands and are being amortized over a useful life of approximately11 years, 6 years and 91⁄2 years, respectively.
(2) Amount includes $2 million of cash that was scheduled to be paid in fiscal 2013 that was offsetby certain post-closing adjustments.
In June 2012, the Company also acquired the global licenses and certain assets related to theJustin Bieber and Nicki Minaj fragrance brands, including inventory of the Justin Bieber fragrances,from Give Back Brands. In connection with the acquisition, the Company paid Give Back Brands$26.5 million in cash, including $3.6 million for inventory. In addition, the Company agreed to payGive Back Brands up to an additional $28 million subject to the achievement of specified salestargets for the acquired brands over the three-year period from July 1, 2012 through June 30, 2015.Based on results for the six months ended December 31, 2012, conditions for payment of the first $5million installment were satisfied, and such installment was paid during the third quarter of fiscal2013. In addition, based on the results for fiscal 2013, conditions for payment of the second $5million installment have been satisfied and such installment is payable during the first quarter offiscal 2014. This transaction was accounted for as a business combination.
87
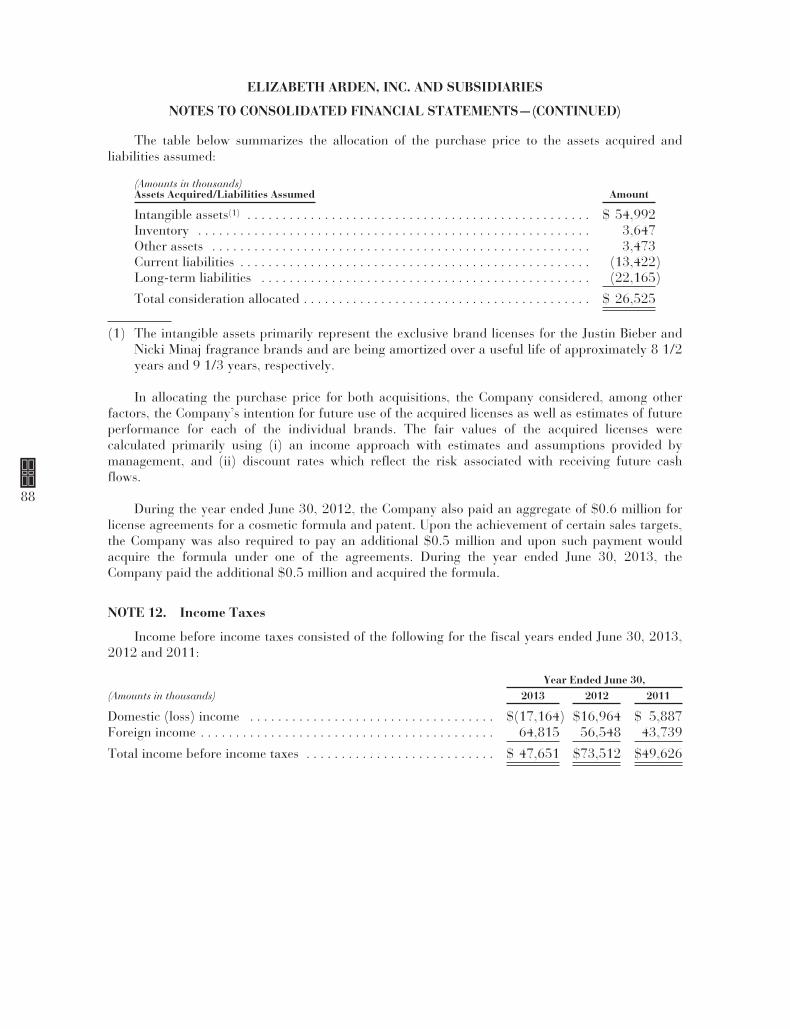
ELIZABETH ARDEN, INC. AND SUBSIDIARIES
NOTES TO CONSOLIDATED FINANCIAL STATEMENTS—(CONTINUED)
The table below summarizes the allocation of the purchase price to the assets acquired andliabilities assumed:
(Amounts in thousands)Assets Acquired/Liabilities Assumed Amount
Intangible assets(1) . . . . . . . . . . . . . . . . . . . . . . . . . . . . . . . . . . . . . . . . . . . . . . . . . $ 54,992Inventory . . . . . . . . . . . . . . . . . . . . . . . . . . . . . . . . . . . . . . . . . . . . . . . . . . . . . . . . 3,647Other assets . . . . . . . . . . . . . . . . . . . . . . . . . . . . . . . . . . . . . . . . . . . . . . . . . . . . . . 3,473Current liabilities . . . . . . . . . . . . . . . . . . . . . . . . . . . . . . . . . . . . . . . . . . . . . . . . . . (13,422)Long-term liabilities . . . . . . . . . . . . . . . . . . . . . . . . . . . . . . . . . . . . . . . . . . . . . . . (22,165)
Total consideration allocated . . . . . . . . . . . . . . . . . . . . . . . . . . . . . . . . . . . . . . . . . $ 26,525
(1) The intangible assets primarily represent the exclusive brand licenses for the Justin Bieber andNicki Minaj fragrance brands and are being amortized over a useful life of approximately 8 1/2years and 9 1/3 years, respectively.
In allocating the purchase price for both acquisitions, the Company considered, among otherfactors, the Company’s intention for future use of the acquired licenses as well as estimates of futureperformance for each of the individual brands. The fair values of the acquired licenses werecalculated primarily using (i) an income approach with estimates and assumptions provided bymanagement, and (ii) discount rates which reflect the risk associated with receiving future cashflows.
During the year ended June 30, 2012, the Company also paid an aggregate of $0.6 million forlicense agreements for a cosmetic formula and patent. Upon the achievement of certain sales targets,the Company was also required to pay an additional $0.5 million and upon such payment wouldacquire the formula under one of the agreements. During the year ended June 30, 2013, theCompany paid the additional $0.5 million and acquired the formula.
NOTE 12. Income Taxes
Income before income taxes consisted of the following for the fiscal years ended June 30, 2013,2012 and 2011:
Year Ended June 30,(Amounts in thousands) 2013 2012 2011
Domestic (loss) income . . . . . . . . . . . . . . . . . . . . . . . . . . . . . . . . . . . $(17,164) $16,964 $ 5,887Foreign income . . . . . . . . . . . . . . . . . . . . . . . . . . . . . . . . . . . . . . . . . . 64,815 56,548 43,739
Total income before income taxes . . . . . . . . . . . . . . . . . . . . . . . . . . . $ 47,651 $73,512 $49,626
88

ELIZABETH ARDEN, INC. AND SUBSIDIARIES
NOTES TO CONSOLIDATED FINANCIAL STATEMENTS—(CONTINUED)
The components of the provision for income taxes for the fiscal years ended June 30, 2013,2012 and 2011, are as follows:
Year Ended June 30,(Amounts in thousands) 2013 2012 2011
Current income taxesFederal . . . . . . . . . . . . . . . . . . . . . . . . . . . . . . . . . . . . . . . . . . . . . . $ — $ — $ (493)State . . . . . . . . . . . . . . . . . . . . . . . . . . . . . . . . . . . . . . . . . . . . . . . . 116 148 557Foreign . . . . . . . . . . . . . . . . . . . . . . . . . . . . . . . . . . . . . . . . . . . . . . 7,879 7,182 6,454
Total current provision . . . . . . . . . . . . . . . . . . . . . . . . . . . . . $ 7,995 $ 7,330 $ 6,518
Deferred income taxesFederal . . . . . . . . . . . . . . . . . . . . . . . . . . . . . . . . . . . . . . . . . . . . . . $ (980) $ 7,591 $ 2,200State . . . . . . . . . . . . . . . . . . . . . . . . . . . . . . . . . . . . . . . . . . . . . . . . (471) 815 1,025Foreign . . . . . . . . . . . . . . . . . . . . . . . . . . . . . . . . . . . . . . . . . . . . . . 396 357 (1,106)
Total deferred provision . . . . . . . . . . . . . . . . . . . . . . . . . . . . $(1,055) $ 8,763 $ 2,119
Total . . . . . . . . . . . . . . . . . . . . . . . . . . . . . . . . . . . . . . . . . . . . . . . . . . . $ 6,940 $16,093 $ 8,637
The total income tax provision differs from the amount obtained by applying the statutoryfederal income tax rate to income before income taxes as follows:
Year Ended June 30,2013 2012 2011
(Amounts in thousands, except percentages) Amount Rate Amount Rate Amount Rate
Income tax provision at statutory rates . . . . $16,678 35.0% $25,729 35.0% $17,369 35.0%State taxes, net of federal benefits . . . . . . . . (559) (1.2) 526 0.7 714 1.5Tax on foreign earnings at different rates
from statutory rates . . . . . . . . . . . . . . . . . (8,792) (18.4) (9,590) (13.0) (8,664) (17.5)Research and development and foreign tax
credits . . . . . . . . . . . . . . . . . . . . . . . . . . . . (1,050) (2.2) (579) (0.8) (1,291) (2.6)Change in U.S. and foreign valuation
allowance . . . . . . . . . . . . . . . . . . . . . . . . . 31 0.1 10 — (292) (0.6)Other . . . . . . . . . . . . . . . . . . . . . . . . . . . . . . . 632 1.3 (3) — 801 1.6
Total . . . . . . . . . . . . . . . . . . . . . . . . . . . $ 6,940 14.6% $16,093 21.9% $ 8,637 17.4%
The total income tax provision for the year ended June 30, 2013 in the above table includesout-of-period adjustments of $0.9 million, included in Other, to correct an error related to deferredtaxes. Income tax expense increased and net income decreased by $0.9 million. The Company didnot adjust the prior periods as it concluded that such adjustments were not material to the current orprior period consolidated financial statements.
On January 2, 2013, the American Taxpayer Relief Act of 2012 was signed into law by thePresident of the United States. Under the provisions of the American Taxpayer Relief Act of 2012,the research and development tax credit that had expired December 31, 2011, was reinstatedretroactively to January 1, 2012, and is now scheduled to expire on December 31, 2013. The impactof the extension of such tax credit resulted in a net tax benefit of approximately $0.5 million for thefiscal year ending June 30, 2013, of which $0.2 million was recorded as a discrete item.
89
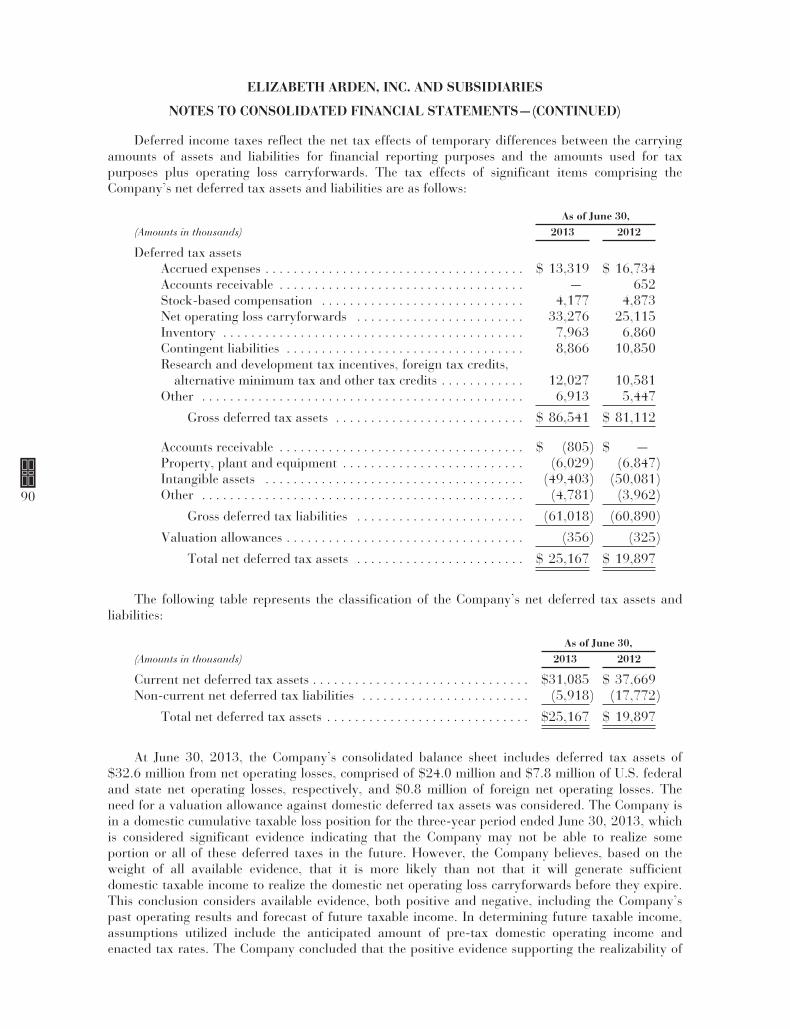
ELIZABETH ARDEN, INC. AND SUBSIDIARIES
NOTES TO CONSOLIDATED FINANCIAL STATEMENTS—(CONTINUED)
Deferred income taxes reflect the net tax effects of temporary differences between the carryingamounts of assets and liabilities for financial reporting purposes and the amounts used for taxpurposes plus operating loss carryforwards. The tax effects of significant items comprising theCompany’s net deferred tax assets and liabilities are as follows:
As of June 30,(Amounts in thousands) 2013 2012
Deferred tax assetsAccrued expenses . . . . . . . . . . . . . . . . . . . . . . . . . . . . . . . . . . . . . $ 13,319 $ 16,734Accounts receivable . . . . . . . . . . . . . . . . . . . . . . . . . . . . . . . . . . . — 652Stock-based compensation . . . . . . . . . . . . . . . . . . . . . . . . . . . . . 4,177 4,873Net operating loss carryforwards . . . . . . . . . . . . . . . . . . . . . . . . 33,276 25,115Inventory . . . . . . . . . . . . . . . . . . . . . . . . . . . . . . . . . . . . . . . . . . . 7,963 6,860Contingent liabilities . . . . . . . . . . . . . . . . . . . . . . . . . . . . . . . . . . 8,866 10,850Research and development tax incentives, foreign tax credits,
alternative minimum tax and other tax credits . . . . . . . . . . . . 12,027 10,581Other . . . . . . . . . . . . . . . . . . . . . . . . . . . . . . . . . . . . . . . . . . . . . . 6,913 5,447
Gross deferred tax assets . . . . . . . . . . . . . . . . . . . . . . . . . . . $ 86,541 $ 81,112
Accounts receivable . . . . . . . . . . . . . . . . . . . . . . . . . . . . . . . . . . . $ (805) $ —Property, plant and equipment . . . . . . . . . . . . . . . . . . . . . . . . . . (6,029) (6,847)Intangible assets . . . . . . . . . . . . . . . . . . . . . . . . . . . . . . . . . . . . . (49,403) (50,081)Other . . . . . . . . . . . . . . . . . . . . . . . . . . . . . . . . . . . . . . . . . . . . . . (4,781) (3,962)
Gross deferred tax liabilities . . . . . . . . . . . . . . . . . . . . . . . . (61,018) (60,890)
Valuation allowances . . . . . . . . . . . . . . . . . . . . . . . . . . . . . . . . . . (356) (325)
Total net deferred tax assets . . . . . . . . . . . . . . . . . . . . . . . . $ 25,167 $ 19,897
The following table represents the classification of the Company’s net deferred tax assets andliabilities:
As of June 30,(Amounts in thousands) 2013 2012
Current net deferred tax assets . . . . . . . . . . . . . . . . . . . . . . . . . . . . . . . $31,085 $ 37,669Non-current net deferred tax liabilities . . . . . . . . . . . . . . . . . . . . . . . . (5,918) (17,772)
Total net deferred tax assets . . . . . . . . . . . . . . . . . . . . . . . . . . . . . $25,167 $ 19,897
At June 30, 2013, the Company’s consolidated balance sheet includes deferred tax assets of$32.6 million from net operating losses, comprised of $24.0 million and $7.8 million of U.S. federaland state net operating losses, respectively, and $0.8 million of foreign net operating losses. Theneed for a valuation allowance against domestic deferred tax assets was considered. The Company isin a domestic cumulative taxable loss position for the three-year period ended June 30, 2013, whichis considered significant evidence indicating that the Company may not be able to realize someportion or all of these deferred taxes in the future. However, the Company believes, based on theweight of all available evidence, that it is more likely than not that it will generate sufficientdomestic taxable income to realize the domestic net operating loss carryforwards before they expire.This conclusion considers available evidence, both positive and negative, including the Company’spast operating results and forecast of future taxable income. In determining future taxable income,assumptions utilized include the anticipated amount of pre-tax domestic operating income andenacted tax rates. The Company concluded that the positive evidence supporting the realizability of
90
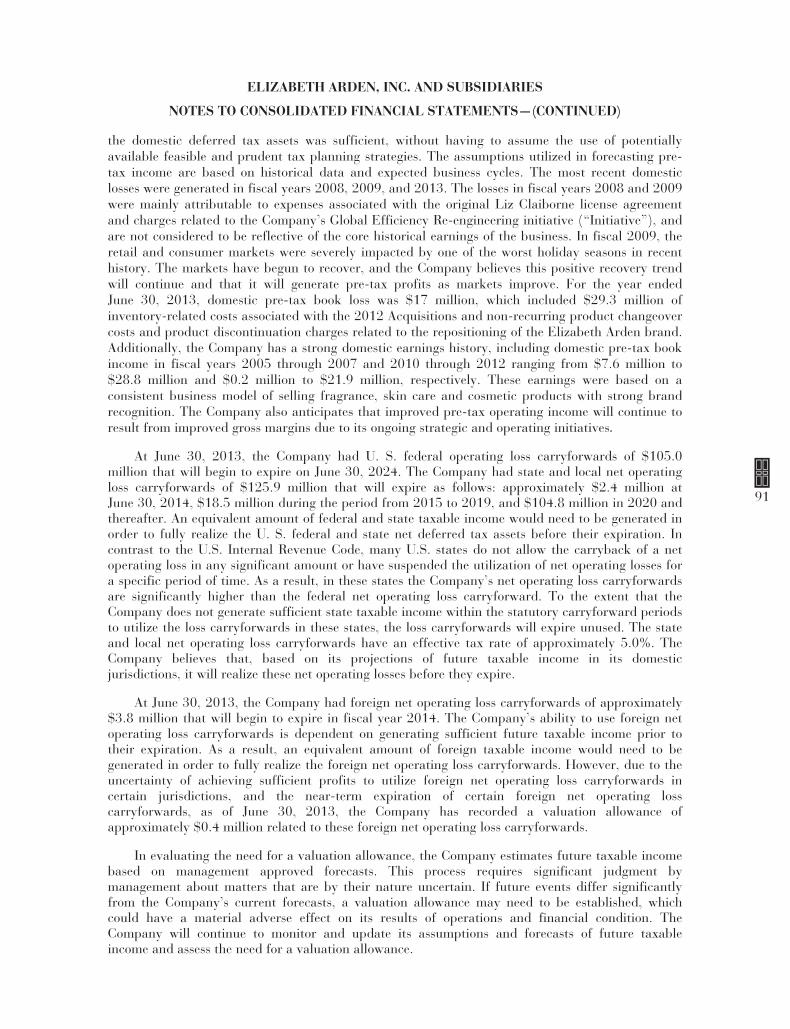
ELIZABETH ARDEN, INC. AND SUBSIDIARIES
NOTES TO CONSOLIDATED FINANCIAL STATEMENTS—(CONTINUED)
the domestic deferred tax assets was sufficient, without having to assume the use of potentiallyavailable feasible and prudent tax planning strategies. The assumptions utilized in forecasting pre-tax income are based on historical data and expected business cycles. The most recent domesticlosses were generated in fiscal years 2008, 2009, and 2013. The losses in fiscal years 2008 and 2009were mainly attributable to expenses associated with the original Liz Claiborne license agreementand charges related to the Company’s Global Efficiency Re-engineering initiative (“Initiative”), andare not considered to be reflective of the core historical earnings of the business. In fiscal 2009, theretail and consumer markets were severely impacted by one of the worst holiday seasons in recenthistory. The markets have begun to recover, and the Company believes this positive recovery trendwill continue and that it will generate pre-tax profits as markets improve. For the year endedJune 30, 2013, domestic pre-tax book loss was $17 million, which included $29.3 million ofinventory-related costs associated with the 2012 Acquisitions and non-recurring product changeovercosts and product discontinuation charges related to the repositioning of the Elizabeth Arden brand.Additionally, the Company has a strong domestic earnings history, including domestic pre-tax bookincome in fiscal years 2005 through 2007 and 2010 through 2012 ranging from $7.6 million to$28.8 million and $0.2 million to $21.9 million, respectively. These earnings were based on aconsistent business model of selling fragrance, skin care and cosmetic products with strong brandrecognition. The Company also anticipates that improved pre-tax operating income will continue toresult from improved gross margins due to its ongoing strategic and operating initiatives.
At June 30, 2013, the Company had U. S. federal operating loss carryforwards of $105.0million that will begin to expire on June 30, 2024. The Company had state and local net operatingloss carryforwards of $125.9 million that will expire as follows: approximately $2.4 million atJune 30, 2014, $18.5 million during the period from 2015 to 2019, and $104.8 million in 2020 andthereafter. An equivalent amount of federal and state taxable income would need to be generated inorder to fully realize the U. S. federal and state net deferred tax assets before their expiration. Incontrast to the U.S. Internal Revenue Code, many U.S. states do not allow the carryback of a netoperating loss in any significant amount or have suspended the utilization of net operating losses fora specific period of time. As a result, in these states the Company’s net operating loss carryforwardsare significantly higher than the federal net operating loss carryforward. To the extent that theCompany does not generate sufficient state taxable income within the statutory carryforward periodsto utilize the loss carryforwards in these states, the loss carryforwards will expire unused. The stateand local net operating loss carryforwards have an effective tax rate of approximately 5.0%. TheCompany believes that, based on its projections of future taxable income in its domesticjurisdictions, it will realize these net operating losses before they expire.
At June 30, 2013, the Company had foreign net operating loss carryforwards of approximately$3.8 million that will begin to expire in fiscal year 2014. The Company’s ability to use foreign netoperating loss carryforwards is dependent on generating sufficient future taxable income prior totheir expiration. As a result, an equivalent amount of foreign taxable income would need to begenerated in order to fully realize the foreign net operating loss carryforwards. However, due to theuncertainty of achieving sufficient profits to utilize foreign net operating loss carryforwards incertain jurisdictions, and the near-term expiration of certain foreign net operating losscarryforwards, as of June 30, 2013, the Company has recorded a valuation allowance ofapproximately $0.4 million related to these foreign net operating loss carryforwards.
In evaluating the need for a valuation allowance, the Company estimates future taxable incomebased on management approved forecasts. This process requires significant judgment bymanagement about matters that are by their nature uncertain. If future events differ significantlyfrom the Company’s current forecasts, a valuation allowance may need to be established, whichcould have a material adverse effect on its results of operations and financial condition. TheCompany will continue to monitor and update its assumptions and forecasts of future taxableincome and assess the need for a valuation allowance.
91
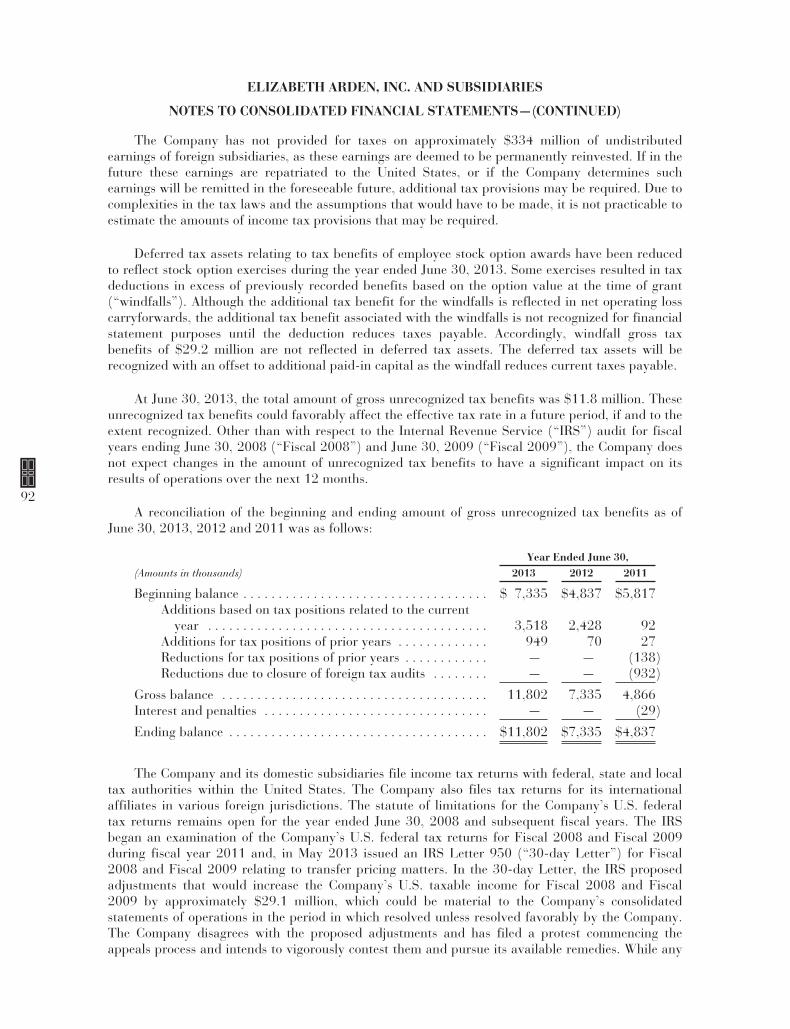
ELIZABETH ARDEN, INC. AND SUBSIDIARIES
NOTES TO CONSOLIDATED FINANCIAL STATEMENTS—(CONTINUED)
The Company has not provided for taxes on approximately $334 million of undistributedearnings of foreign subsidiaries, as these earnings are deemed to be permanently reinvested. If in thefuture these earnings are repatriated to the United States, or if the Company determines suchearnings will be remitted in the foreseeable future, additional tax provisions may be required. Due tocomplexities in the tax laws and the assumptions that would have to be made, it is not practicable toestimate the amounts of income tax provisions that may be required.
Deferred tax assets relating to tax benefits of employee stock option awards have been reducedto reflect stock option exercises during the year ended June 30, 2013. Some exercises resulted in taxdeductions in excess of previously recorded benefits based on the option value at the time of grant(“windfalls”). Although the additional tax benefit for the windfalls is reflected in net operating losscarryforwards, the additional tax benefit associated with the windfalls is not recognized for financialstatement purposes until the deduction reduces taxes payable. Accordingly, windfall gross taxbenefits of $29.2 million are not reflected in deferred tax assets. The deferred tax assets will berecognized with an offset to additional paid-in capital as the windfall reduces current taxes payable.
At June 30, 2013, the total amount of gross unrecognized tax benefits was $11.8 million. Theseunrecognized tax benefits could favorably affect the effective tax rate in a future period, if and to theextent recognized. Other than with respect to the Internal Revenue Service (“IRS”) audit for fiscalyears ending June 30, 2008 (“Fiscal 2008”) and June 30, 2009 (“Fiscal 2009”), the Company doesnot expect changes in the amount of unrecognized tax benefits to have a significant impact on itsresults of operations over the next 12 months.
A reconciliation of the beginning and ending amount of gross unrecognized tax benefits as ofJune 30, 2013, 2012 and 2011 was as follows:
Year Ended June 30,(Amounts in thousands) 2013 2012 2011
Beginning balance . . . . . . . . . . . . . . . . . . . . . . . . . . . . . . . . . . . $ 7,335 $4,837 $5,817Additions based on tax positions related to the current
year . . . . . . . . . . . . . . . . . . . . . . . . . . . . . . . . . . . . . . . . 3,518 2,428 92Additions for tax positions of prior years . . . . . . . . . . . . . 949 70 27Reductions for tax positions of prior years . . . . . . . . . . . . — — (138)Reductions due to closure of foreign tax audits . . . . . . . . — — (932)
Gross balance . . . . . . . . . . . . . . . . . . . . . . . . . . . . . . . . . . . . . . 11,802 7,335 4,866Interest and penalties . . . . . . . . . . . . . . . . . . . . . . . . . . . . . . . . — — (29)
Ending balance . . . . . . . . . . . . . . . . . . . . . . . . . . . . . . . . . . . . . $11,802 $7,335 $4,837
The Company and its domestic subsidiaries file income tax returns with federal, state and localtax authorities within the United States. The Company also files tax returns for its internationalaffiliates in various foreign jurisdictions. The statute of limitations for the Company’s U.S. federaltax returns remains open for the year ended June 30, 2008 and subsequent fiscal years. The IRSbegan an examination of the Company’s U.S. federal tax returns for Fiscal 2008 and Fiscal 2009during fiscal year 2011 and, in May 2013 issued an IRS Letter 950 (“30-day Letter”) for Fiscal2008 and Fiscal 2009 relating to transfer pricing matters. In the 30-day Letter, the IRS proposedadjustments that would increase the Company’s U.S. taxable income for Fiscal 2008 and Fiscal2009 by approximately $29.1 million, which could be material to the Company’s consolidatedstatements of operations in the period in which resolved unless resolved favorably by the Company.The Company disagrees with the proposed adjustments and has filed a protest commencing theappeals process and intends to vigorously contest them and pursue its available remedies. While any
92

ELIZABETH ARDEN, INC. AND SUBSIDIARIES
NOTES TO CONSOLIDATED FINANCIAL STATEMENTS—(CONTINUED)
IRS examination contains an element of uncertainty, based on current facts and circumstances, theCompany believes the ultimate outcome at IRS appeals or any judicial process, if necessary, will nothave a material adverse effect on the Company’s financial condition, business or prospects. Inaddition, if the examination is not resolved favorably, the Company has $105 million of U.S. federaloperating loss carryforwards as of June 30, 2013, of which $60 million would be available to offsetany cash flow impact. It is reasonably possible that over the next twelve-month period the Companymay experience an increase or decrease in its unrecognized tax benefits, but it is not possible todetermine either the magnitude or range of any increase or decrease at this time. The year endedJune 30, 2004 and subsequent fiscal years remain subject to examination for various state taxjurisdictions. In addition, the Company has subsidiaries in various foreign jurisdictions that havestatutes of limitations generally ranging from one to five years. The year ended June 30, 2008 andsubsequent fiscal years remain subject to examination for various foreign jurisdictions.
The Company recognizes interest accrued related to unrecognized tax benefits in interestexpense and related penalties in the provision for income taxes in the consolidated statement ofoperations, which is consistent with the recognition of these items in prior reporting periods.
NOTE 13. Repurchases of Common Stock
On November 2, 2010, the Company’s board of directors authorized the repurchase of anadditional $40 million of Common Stock under the terms of an existing $80 million common stockrepurchase program and extended the term of the stock repurchase program from November 30,2010 to November 30, 2012. On August 7, 2012, the Company’s board of directors approved anextension of the stock repurchase program through November 30, 2014.
For the fiscal year ended June 30, 2013, the Company purchased 332,894 shares of CommonStock on the open market under the stock repurchase program at an average price of $38.77 pershare and at a cost of $12.9 million, including sales commissions. As of June 30, 2013, the Companyhad repurchased 4,362,095 shares of Common Stock on the open market under the stockrepurchase program since its inception in November 2005, at an average price of $18.32 per shareand at a cost of approximately $79.9 million, including sales commissions, leaving approximately$40.1 million available for additional repurchases under the program. The acquisition of theseshares was accounted for under the treasury method.
In connection with the vesting of 343,800 shares of outstanding market-based restricted stockgranted in 2005, in March 2011 the Company withheld 121,908 shares of Common Stock at a fairmarket value of $28.08 per share, representing a cost of approximately $3.4 million, to satisfyminimum statutory tax withholding obligations resulting from such vesting. The acquisition of theseshares by the Company was accounted for under the treasury method.
NOTE 14. Stock Plans
At June 30, 2013, the Company had three active stock incentive plans, one for the benefit ofnon-employee directors of the Company’s Board of Directors (the “Board”), the 2004 Non-employeeDirector Stock Option Plan (the “2004 Director Plan”), and two for the benefit of eligible employeesand independent contractors (the 2004 Stock Incentive Plan and the 2010 Stock Award andIncentive Plan). In addition, as of June 30, 2013, stock options granted under the Company’s 1995Stock Option Plan and 2000 Stock Incentive Plan were still outstanding and restricted stock grantedunder the 2000 Stock Incentive Plan was still outstanding. The 1995 Stock Option Plan and the2000 Stock Incentive Plan have expired by their terms and no further awards will be granted underthe 1995 Stock Option Plan or the 2000 Stock Incentive Plan. The 2004 Director Plan replaced the
93

ELIZABETH ARDEN, INC. AND SUBSIDIARIES
NOTES TO CONSOLIDATED FINANCIAL STATEMENTS—(CONTINUED)
1995 Non-Employee Director Plan, and no further grants of stock options will occur under the 1995Non-Employee Director Plan. All six plans were adopted by the Board and approved by theCompany’s shareholders.
The 2004 Stock Incentive Plan (the “2004 Incentive Plan”) authorizes the Company to grantawards with respect to a total of 2,700,000 shares of Common Stock. The stock options awardedunder the 2004 Incentive Plan are exercisable at any time or in any installments as determined bythe compensation committee of the Board at the time of grant and may be either incentive or non-qualified stock options under the Internal Revenue Code, as determined by the compensationcommittee. The exercise price for stock option grants cannot be lower than the closing price of theCommon Stock on the date of grant. At June 30, 2013, 8,203 shares of Common Stock remainedavailable for grant under the 2004 Incentive Plan.
The 2004 Director Plan authorizes the Company to grant non-qualified stock options for up to350,000 shares of Common Stock to non-employee directors of the Company. Each year on the dateof the annual meeting of the shareholders and provided that a sufficient number of shares remainavailable under the 2004 Director Plan, there will automatically be granted to each eligible directoran option to purchase shares of Common Stock in such amount as the Board determines based on acompetitive review of comparable companies. Each option granted under the 2004 Director Plan onan annual shareholders meeting date will become exercisable three years from the date of grant ifsuch person has continued to serve as a director until that date, unless exercisability of the option isaccelerated due to death, disability or retirement in good standing at or after age 70. No option maybe exercisable after the expiration of ten years from the date of grant. The exercise price will equalthe closing price of the Common Stock on the date of grant. At June 30, 2013, 86,000 shares ofCommon Stock remained available for grant under the 2004 Director Plan.
The 2010 Stock Award and Incentive Plan (the “2010 Plan”) authorizes the Company to grantawards with respect to a total of 1,100,000 shares of Common Stock of which a maximum of550,000 shares may be awarded as full value awards. A full value award is any award other than astock option or stock appreciation right, which is settled by the issuance of shares. The stock optionsawarded under the 2010 Plan are exercisable at any time or in any installments as determined bythe compensation committee of the Board at the time of grant and may be either incentive or non-qualified stock options under the Internal Revenue Code, as determined by the compensationcommittee. The exercise price for stock option grants cannot be lower than the closing price of theCommon Stock on the date of grant. At June 30, 2013, 866,201 shares of Common Stock remainedavailable for grant under the 2010 Plan, of which 438,534 shares can be issued as full value shares.
For the years ended June 30, 2013, 2012 and 2011, total share-based compensation expensecharged against income for all stock plans was as follows:
Year Ended June 30,(Amounts in millions) 2013 2012 2011
Stock options . . . . . . . . . . . . . . . . . . . . . . . . . . . . . . . . . . . . . . . . . . . . . . . . . . . . . $1.7 $1.5 $1.8Employee stock purchase plan . . . . . . . . . . . . . . . . . . . . . . . . . . . . . . . . . . . . . . . . 0.8 0.8 0.6Restricted stock/restricted stock units . . . . . . . . . . . . . . . . . . . . . . . . . . . . . . . . . . 3.1 2.8 2.5
Total share-based compensation expense . . . . . . . . . . . . . . . . . . . . . . . . . . . . . . . $5.6 $5.1 $4.9
Tax benefit related to compensation cost . . . . . . . . . . . . . . . . . . . . . . . . . . . . . . . . $0.9 $1.1 $0.9
As of June 30, 2013, there were approximately $5.9 million of unrecognized compensation costsrelated to non-vested share-based arrangements granted under the Company’s share-basedcompensation plans. These costs are expected to be recognized over a weighted-average period ofapproximately three years.
94

ELIZABETH ARDEN, INC. AND SUBSIDIARIES
NOTES TO CONSOLIDATED FINANCIAL STATEMENTS—(CONTINUED)
Stock Options
On August 5, 2013, the compensation committee of the Board approved the grant to certainemployees of stock options to purchase shares of Common Stock. The stock options are due to vestin equal thirds over a three-year period on dates that are two business days after the Company’sfinancial results for each of the fiscal years ending June 30, 2014, 2015 and 2016, are publiclyannounced, but only if the person receiving the grant is still employed by the Company at the timeof vesting. The stock option grants are expected to be effective on August 12, 2013, the secondbusiness day after the Company’s financial results for the fiscal year ending June 30, 2013 arescheduled to be publicly announced (the “2013 Equity Grant Date”), and will have a total aggregatecompensation amount of approximately $1.4 million. The closing price of the common stock on theeffective date of grant will be used to establish (i) the exercise price, and (ii) the total number ofstock options to be granted based on the Black-Scholes option model. The options expire ten yearsfrom the date of grant.
Year Ended June 30, 2013. On August 13, 2012, the Board granted to employees stockoptions for 72,700 shares of Common Stock. The stock options are due to vest in equal thirds over athree-year period on dates that are two business days after the Company’s financial results for eachof the fiscal years ending June 30, 2013, 2014 and 2015, are publicly announced, but only if theperson receiving the grant is still employed by the Company at the time of vesting. The exerciseprice of those stock options is $45.95 per share, which was the closing price of the Common Stockon the effective date of grant. The weighted-average grant date fair value of options granted was$20.42 per share based on the Black-Scholes option pricing model. The options expire ten yearsfrom the date of grant.
On November 7, 2012, the date of the Company’s 2012 annual shareholders meeting, theCompany granted stock options for an aggregate of 17,400 shares of Common Stock to six non-employee directors under the Company’s 2004 Director Plan. All of the stock options granted onNovember 7, 2012, are exercisable three years from the date of grant if such persons continue toserve as a director until that date. The exercise price of those stock options is $46.61 per share,which was the closing price of the Common Stock on the date of grant. The weighted-average grantdate fair value of options granted was $20.66 per share based on the Black-Scholes option pricingmodel. The options expire ten years from the date of grant.
Year Ended June 30, 2012. On August 15, 2011, the Board granted to employees stockoptions for 95,500 shares of Common Stock. The stock options are due to vest in equal thirds over athree-year period on dates that are two business days after the Company’s financial results for eachof the fiscal years ending June 30, 2012, 2013 and 2014, are publicly announced, but only if theperson receiving the grant is still employed by the Company at the time of vesting. The exerciseprice of those stock options is $31.78 per share, which was the closing price of the Common Stockon the effective date of grant. The weighted-average grant date fair value of options granted was$14.51 per share based on the Black-Scholes option pricing model. The options expire ten yearsfrom the date of grant.
On November 9, 2011, the date of the Company’s 2011 annual shareholders meeting, theCompany granted stock options for an aggregate of 24,000 shares of Common Stock to six non-employee directors under the Company’s 2004 Director Plan. All of the stock options granted onNovember 9, 2011, are exercisable three years from the date of grant if such persons continue toserve as a director until that date. The exercise price of those stock options is $33.19 per share,which was the closing price of the Common Stock on the date of grant. The weighted-average grantdate fair value of options granted was $14.93 per share based on the Black-Scholes option pricingmodel. The options expire ten years from the date of grant.
95
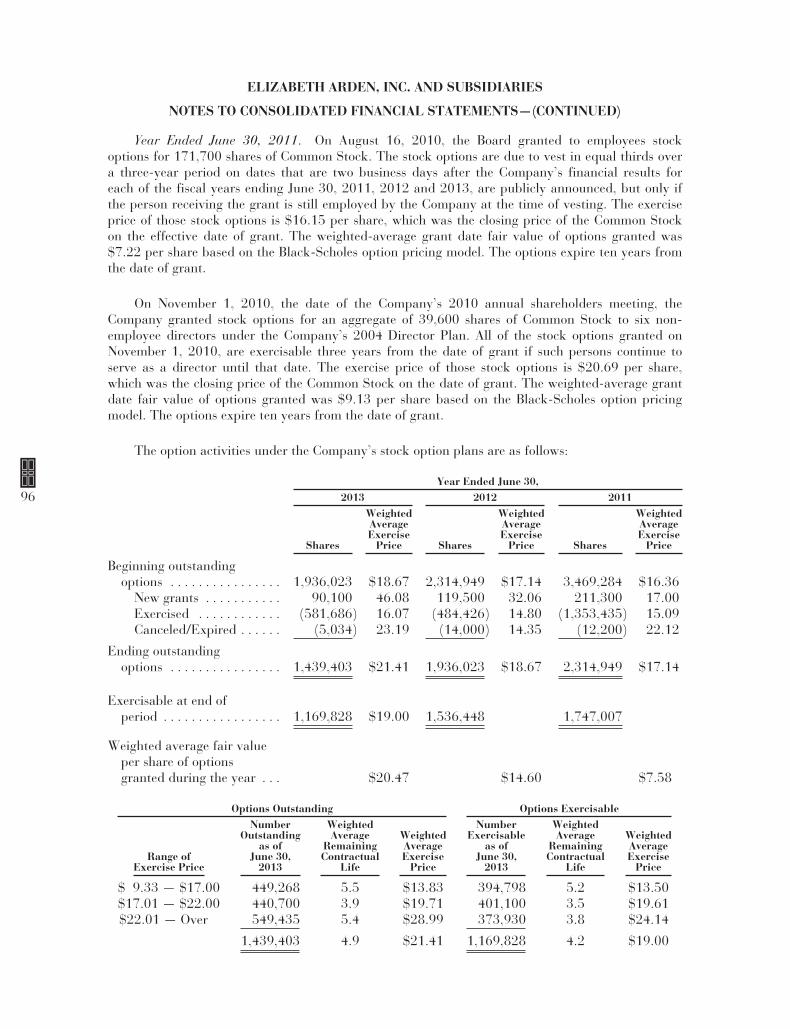
ELIZABETH ARDEN, INC. AND SUBSIDIARIES
NOTES TO CONSOLIDATED FINANCIAL STATEMENTS—(CONTINUED)
Year Ended June 30, 2011. On August 16, 2010, the Board granted to employees stockoptions for 171,700 shares of Common Stock. The stock options are due to vest in equal thirds overa three-year period on dates that are two business days after the Company’s financial results foreach of the fiscal years ending June 30, 2011, 2012 and 2013, are publicly announced, but only ifthe person receiving the grant is still employed by the Company at the time of vesting. The exerciseprice of those stock options is $16.15 per share, which was the closing price of the Common Stockon the effective date of grant. The weighted-average grant date fair value of options granted was$7.22 per share based on the Black-Scholes option pricing model. The options expire ten years fromthe date of grant.
On November 1, 2010, the date of the Company’s 2010 annual shareholders meeting, theCompany granted stock options for an aggregate of 39,600 shares of Common Stock to six non-employee directors under the Company’s 2004 Director Plan. All of the stock options granted onNovember 1, 2010, are exercisable three years from the date of grant if such persons continue toserve as a director until that date. The exercise price of those stock options is $20.69 per share,which was the closing price of the Common Stock on the date of grant. The weighted-average grantdate fair value of options granted was $9.13 per share based on the Black-Scholes option pricingmodel. The options expire ten years from the date of grant.
The option activities under the Company’s stock option plans are as follows:
Year Ended June 30,2013 2012 2011
Shares
WeightedAverageExercise
Price Shares
WeightedAverageExercise
Price Shares
WeightedAverageExercise
Price
Beginning outstandingoptions . . . . . . . . . . . . . . . . 1,936,023 $18.67 2,314,949 $17.14 3,469,284 $16.36
New grants . . . . . . . . . . . 90,100 46.08 119,500 32.06 211,300 17.00Exercised . . . . . . . . . . . . (581,686) 16.07 (484,426) 14.80 (1,353,435) 15.09Canceled/Expired . . . . . . (5,034) 23.19 (14,000) 14.35 (12,200) 22.12
Ending outstandingoptions . . . . . . . . . . . . . . . . 1,439,403 $21.41 1,936,023 $18.67 2,314,949 $17.14
Exercisable at end ofperiod . . . . . . . . . . . . . . . . . 1,169,828 $19.00 1,536,448 1,747,007
Weighted average fair valueper share of optionsgranted during the year . . . $20.47 $14.60 $7.58
Options Outstanding Options Exercisable
Range ofExercise Price
NumberOutstanding
as ofJune 30,
2013
WeightedAverage
RemainingContractual
Life
WeightedAverageExercise
Price
NumberExercisable
as ofJune 30,
2013
WeightedAverage
RemainingContractual
Life
WeightedAverageExercise
Price
$ 9.33 — $17.00 449,268 5.5 $13.83 394,798 5.2 $13.50$17.01 — $22.00 440,700 3.9 $19.71 401,100 3.5 $19.61$22.01 — Over 549,435 5.4 $28.99 373,930 3.8 $24.14
1,439,403 4.9 $21.41 1,169,828 4.2 $19.00
96

ELIZABETH ARDEN, INC. AND SUBSIDIARIES
NOTES TO CONSOLIDATED FINANCIAL STATEMENTS—(CONTINUED)
The intrinsic value of a stock option is the amount by which the current market value of theunderlying stock exceeds the exercise price of the option. The intrinsic value of stock options is asfollows:
Year Ended June 30,(Amounts in millions) 2013 2012 2011
Stock options outstanding and exercisable at end of period . . . . . . $30.5 $31.3 $19.1Stock options exercised during fiscal year (based on average price
during the period) . . . . . . . . . . . . . . . . . . . . . . . . . . . . . . . . . . . . . $17.5 $ 9.9 $12.0
The weighted-average grant-date fair value of options granted during the years ended June 30,2013, 2012 and 2011, was estimated on the grant date using the Black-Scholes option-pricingmodel with the following assumptions:
Year Ended June 30,2013 2012 2011
Expected dividend yield . . . . . . . . . . . . . . . . 0.00% 0.00% 0.00%Expected price volatility . . . . . . . . . . . . . . . 58.0% 58.0% 56.0%Risk-free interest rate . . . . . . . . . . . . . . . . . . 0.70 — 0.80% 1.29 — 1.91% 1.68 — 2.22%Expected life of options in years . . . . . . . . . 4 4 4
Employee Stock Purchase Plan. Through November 30, 2011, the Company had an EmployeeStock Purchase Plan (the “2002 ESPP”) under which employees in certain countries were permittedto deposit after tax funds from their wages for purposes of purchasing Common Stock at a 15%discount from the lowest of the closing price of the Common Stock at either the start of thecontribution period or the end of the contribution period. The 2002 ESPP terminated onNovember 30, 2011 at the conclusion of the last offering under the 2002 ESPP.
On August 9, 2011, the Board approved the Company’s 2011 Employee Stock Purchase Plan(the “2011 ESPP”) because the shares of Common Stock available under the 2002 ESPP were soonto be exhausted. The 2011 ESPP authorizes the issuance of up to 1,000,000 shares of CommonStock under terms and conditions that are, in all material respects, the same as those in the 2002ESPP. The 2011 ESPP was approved by the Company’s shareholders at the Company’s 2011annual shareholders meeting in November 2011, and became effective on December 1, 2011. OnMay 30, 2013 and November 30, 2012 purchases of Common Stock occurred under this plan for30,240 shares and 36,483 shares, respectively. The next purchase under the 2011 ESPP will beconsummated on November 29, 2013. At June 30, 2013, 898,053 shares of Common Stockremained available for purchase under the 2011 ESPP.
Restricted Stock/Restricted Stock Units
On August 5, 2013, the compensation committee of the Board approved the grant to certainemployees of service-based restricted stock units. The service-based restricted stock units will vest inequal thirds over a three-year period on a date that is two business days after the Company’sfinancial results for each of the years ending June 30, 2014, 2015 and 2016 are publicly announced,but only if the person receiving the grant is still employed by the Company at the time of vesting.These restricted stock unit grants will have a total aggregate compensation amount of approximately$3.2 million. Also, on August 5, 2013, the compensation committee of the Board approved theadditional grant to certain employees of a special retention award of service-based restricted stockunits. This special award of service-based restricted stock units will vest in equal thirds over a three-year period on a date that is two business days after the Company’s financial results for each of theyears ending June 30, 2016, 2017 and 2018 are publicly announced, but only if the person receiving
97
ELIZABETH ARDEN, INC. AND SUBSIDIARIES
NOTES TO CONSOLIDATED FINANCIAL STATEMENTS—(CONTINUED)
the grant is still employed by the Company at the time of vesting. These special restricted stock unitgrants will have a total aggregate compensation amount of approximately $3.5 million. All of thesegrants of restricted stock units are expected to be effective on the 2013 Equity Grant Date and thenumber of restricted stock units granted will be based on the closing price of the Company’scommon stock on the effective date of grant. All of these restricted stock unit grants are recorded asadditional paid-in capital in shareholders’ equity as amortization occurs over the applicable vestingperiod.
On August 5, 2013, the compensation committee of the Board also approved the grant ofperformance-based restricted stock units to the chief executive officer having a compensation valueof approximately $1.0 million, effective on the 2013 Equity Grant Date. The vesting of theseperformance-based restricted stock units is subject to both performance and service criteria. Theactual number of performance-based restricted stock units eligible for vesting will be determinedbased on the Company’s achievement of specified earnings per share and revenue targets for thefiscal year ending June 30, 2014. The number of performance-based restricted stock units that aredetermined to be eligible to vest based on the Company’s achievement of such performance criteriawill then vest in three equal installments on the date that is two business days after the Company’sfinancial results for each of the years ending June 30, 2014, June 30, 2015 and June 30, 2016 arepublicly announced, subject to the continued employment of the chief executive through theapplicable vesting date. The closing price of the common stock on the 2013 Equity Grant Date willbe used to establish the specific number of performance-based restricted stock units that will begranted to the chief executive officer.
Year Ended June 30, 2013. On August 13, 2012, the Board granted to employees 72,700service-based restricted stock units. The service-based restricted stock units vest in equal thirds overa three-year period on the date that is two business days after the Company’s financial results foreach of the years ending June 30, 2013, 2014 and 2015 are publicly announced, but only if theperson receiving the grant is still employed by the Company at the time of vesting. The fair value ofthe service-based restricted stock units granted was $45.95 per share, equal to the closing price ofthe Company’s common stock on the date of grant. The service-based restricted stock units arerecorded as additional paid-in capital in shareholders’ equity as amortization occurs over the three-year vesting period.
On August 13, 2012, the Board also granted 19,000 performance-based restricted stock units tothe chief executive officer. The vesting of these performance-based restricted stock units is subject toboth performance and service criteria. The actual number of performance-based restricted stockunits eligible for vesting will be determined based on the Company’s achievement of specifiedearnings per share and revenue targets for the fiscal year ending June 30, 2013. The number ofperformance-based restricted stock units that are determined to be eligible to vest based on theCompany’s achievement of such performance criteria will then vest in three equal installments onthe date that is two business days after the Company’s financial results for each of the years endingJune 30, 2013, June 30, 2014 and June 30, 2015 are publicly announced, subject to the continuedemployment of the chief executive through the applicable vesting date. Based on the earnings pershare and revenue amounts for the fiscal year ended June 30, 2013, 6,111 shares were determinedto be eligible for vesting. The fair value of the performance-based restricted stock units granted was$45.95 per share, equal to the closing price of the Company’s common stock on the date of grant.The performance-based restricted stock units are recorded as additional paid-in capital inshareholders’ equity as amortization occurs over the three-year vesting period.
Year Ended June 30, 2012. On August 15, 2011, the Board granted to employees 98,300service-based restricted stock units. The service-based restricted stock units vest in equal thirds overa three-year period on the date that is two business days after the Company’s financial results for
98
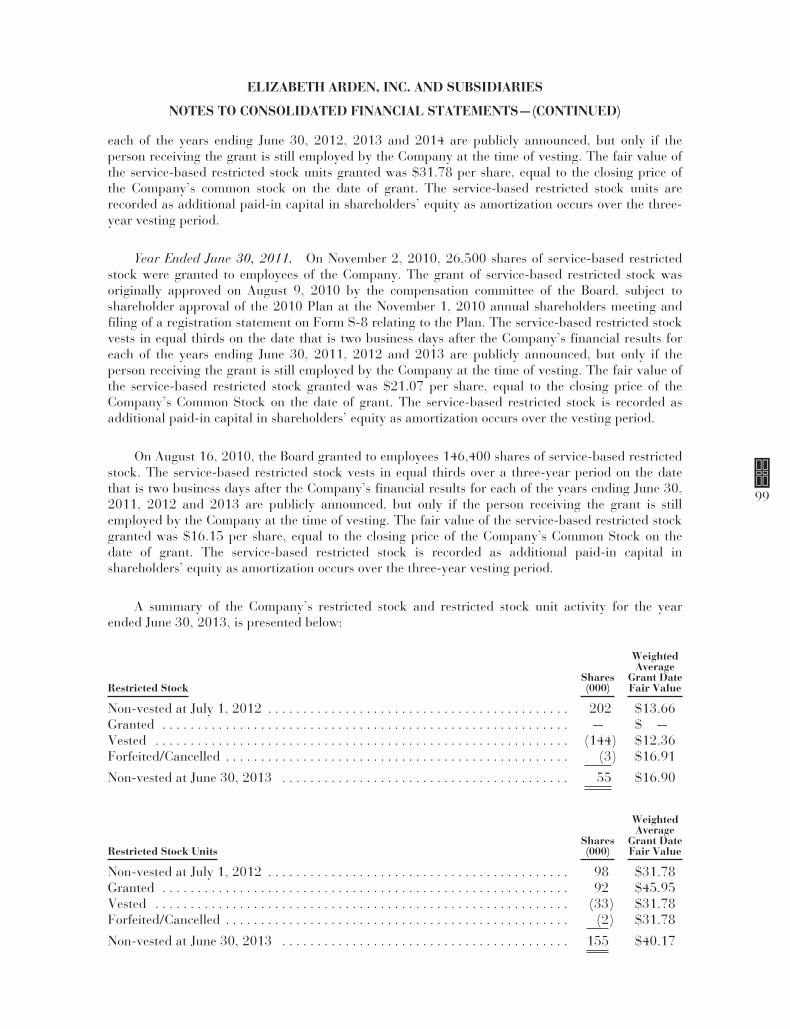
ELIZABETH ARDEN, INC. AND SUBSIDIARIES
NOTES TO CONSOLIDATED FINANCIAL STATEMENTS—(CONTINUED)
each of the years ending June 30, 2012, 2013 and 2014 are publicly announced, but only if theperson receiving the grant is still employed by the Company at the time of vesting. The fair value ofthe service-based restricted stock units granted was $31.78 per share, equal to the closing price ofthe Company’s common stock on the date of grant. The service-based restricted stock units arerecorded as additional paid-in capital in shareholders’ equity as amortization occurs over the three-year vesting period.
Year Ended June 30, 2011. On November 2, 2010, 26,500 shares of service-based restrictedstock were granted to employees of the Company. The grant of service-based restricted stock wasoriginally approved on August 9, 2010 by the compensation committee of the Board, subject toshareholder approval of the 2010 Plan at the November 1, 2010 annual shareholders meeting andfiling of a registration statement on Form S-8 relating to the Plan. The service-based restricted stockvests in equal thirds on the date that is two business days after the Company’s financial results foreach of the years ending June 30, 2011, 2012 and 2013 are publicly announced, but only if theperson receiving the grant is still employed by the Company at the time of vesting. The fair value ofthe service-based restricted stock granted was $21.07 per share, equal to the closing price of theCompany’s Common Stock on the date of grant. The service-based restricted stock is recorded asadditional paid-in capital in shareholders’ equity as amortization occurs over the vesting period.
On August 16, 2010, the Board granted to employees 146,400 shares of service-based restrictedstock. The service-based restricted stock vests in equal thirds over a three-year period on the datethat is two business days after the Company’s financial results for each of the years ending June 30,2011, 2012 and 2013 are publicly announced, but only if the person receiving the grant is stillemployed by the Company at the time of vesting. The fair value of the service-based restricted stockgranted was $16.15 per share, equal to the closing price of the Company’s Common Stock on thedate of grant. The service-based restricted stock is recorded as additional paid-in capital inshareholders’ equity as amortization occurs over the three-year vesting period.
A summary of the Company’s restricted stock and restricted stock unit activity for the yearended June 30, 2013, is presented below:
Restricted StockShares(000)
WeightedAverage
Grant DateFair Value
Non-vested at July 1, 2012 . . . . . . . . . . . . . . . . . . . . . . . . . . . . . . . . . . . . . . . . . . . 202 $13.66Granted . . . . . . . . . . . . . . . . . . . . . . . . . . . . . . . . . . . . . . . . . . . . . . . . . . . . . . . . . . — $ —Vested . . . . . . . . . . . . . . . . . . . . . . . . . . . . . . . . . . . . . . . . . . . . . . . . . . . . . . . . . . . (144) $12.36Forfeited/Cancelled . . . . . . . . . . . . . . . . . . . . . . . . . . . . . . . . . . . . . . . . . . . . . . . . . (3) $16.91
Non-vested at June 30, 2013 . . . . . . . . . . . . . . . . . . . . . . . . . . . . . . . . . . . . . . . . . 55 $16.90
Restricted Stock UnitsShares(000)
WeightedAverage
Grant DateFair Value
Non-vested at July 1, 2012 . . . . . . . . . . . . . . . . . . . . . . . . . . . . . . . . . . . . . . . . . . . 98 $31.78Granted . . . . . . . . . . . . . . . . . . . . . . . . . . . . . . . . . . . . . . . . . . . . . . . . . . . . . . . . . . 92 $45.95Vested . . . . . . . . . . . . . . . . . . . . . . . . . . . . . . . . . . . . . . . . . . . . . . . . . . . . . . . . . . . (33) $31.78Forfeited/Cancelled . . . . . . . . . . . . . . . . . . . . . . . . . . . . . . . . . . . . . . . . . . . . . . . . . (2) $31.78
Non-vested at June 30, 2013 . . . . . . . . . . . . . . . . . . . . . . . . . . . . . . . . . . . . . . . . . 155 $40.17
99

ELIZABETH ARDEN, INC. AND SUBSIDIARIES
NOTES TO CONSOLIDATED FINANCIAL STATEMENTS—(CONTINUED)
NOTE 15. Fair Value Measurements
Accounting standards define fair value as the price that would be received to sell an asset orpaid to transfer a liability in the principal or most advantageous market for the asset or liability inan orderly transaction between market participants at the measurement date. The accountingstandards also have established a fair value hierarchy, which prioritizes the inputs to valuationtechniques used in measuring fair value into three broad levels as follows:
Level 1 — Quoted prices in active markets for identical assets or liabilities
Level 2 — Inputs, other than the quoted prices in active markets, that are observable eitherdirectly or indirectly
Level 3 — Unobservable inputs based on the Company’s own assumptions
At June 30, 2013 and 2012, the estimated fair value of the Company’s 7 3/8% Senior Noteswas as follows:
(Amounts in thousands)June 30,
2013June 30,
2012
7 3/8% Senior Notes due March 2021 (Level 2) . . . . . . . . . . . . . . . . . . . . . . . $271,250 $271,875
The Company determined the estimated fair value amounts by using available marketinformation and commonly accepted valuation methodologies. However, considerable judgment isrequired in interpreting market data to develop estimates of fair value, primarily due to the illiquidnature of the capital markets in which the 7 3/8% Senior Notes are traded. The use of differentassumptions and/or estimation methodologies may have a material effect on the estimated fairvalue.
The Company’s derivative assets and liabilities are currently composed of foreign currencycontracts. Fair values are based on market prices or determined using valuation models that use astheir basis readily observable market data that is actively quoted and can be validated throughexternal sources, including independent pricing services, brokers and market transactions.
The following table presents the fair value hierarchy for the Company’s financial assets andliabilities that were measured at fair value on a recurring basis as of June 30, 2013 and 2012:
June 30, 2013 June 30, 2012(Amounts in thousands) Asset Liability Asset Liability
Level 2 . . . . . . . . . . . . . . . . . . . . . . . . . . . . . . . . . . . . . . . . . . . . . . . 658 — 586 382
Total . . . . . . . . . . . . . . . . . . . . . . . . . . . . . . . . . . . . . . . . . . . . . . . . . $658 $— $586 $382
See Note 16 for a discussion of the Company’s foreign currency contracts.
Accounting standards require non-financial assets and liabilities to be recognized at fair valuesubsequent to initial recognition when they are deemed to be other-than-temporarily impaired. As ofJune 30, 2013, the Company did not have any non-financial assets and liabilities measured at fairvalue.
NOTE 16. Derivative Financial Instruments
The Company operates in several foreign countries, which exposes it to market risk associatedwith foreign currency exchange rate fluctuations. The Company’s risk management policy is to enter
100

ELIZABETH ARDEN, INC. AND SUBSIDIARIES
NOTES TO CONSOLIDATED FINANCIAL STATEMENTS—(CONTINUED)
into cash flow hedges to reduce a portion of the exposure of the Company’s foreign subsidiaries’revenues to fluctuations in currency rates using foreign currency forward contracts. The Companyalso enters into cash flow hedges for a portion of its forecasted inventory purchases to reduce theexposure of its Canadian and Australian subsidiaries’ cost of sales to such fluctuations, as well ascash flow hedges for a portion of its subsidiaries’ forecasted Swiss franc operating costs. Theprincipal currencies hedged are British pounds, Euros, Canadian dollars, Australian dollars andSwiss francs. The Company does not enter into derivative financial contracts for speculative ortrading purposes. The Company’s derivative financial instruments are recorded in the consolidatedbalance sheets at fair value determined using pricing models based on market prices or determinedusing valuation models that use as their basis readily observable market data that is actively quotedand can be validated through external sources, including independent pricing services, brokers andmarket transactions. Cash flows from derivative financial instruments are classified as cash flowsfrom operating activities in the consolidated statements of cash flows.
Foreign currency contracts used to hedge forecasted revenues are designated as cash flowhedges. These contracts are used to hedge forecasted revenues generally over approximately 12 to 24months. Changes to fair value of the foreign currency contracts are recorded as a component ofaccumulated other comprehensive income within shareholders’ equity to the extent such contractsare effective, and are recognized in net sales in the period in which the forecasted transaction affectsearnings or the transactions are no longer probable of occurring. Changes to fair value of anycontracts deemed to be ineffective would be recognized in earnings immediately. There were noamounts recorded in fiscal 2013, 2012, or 2011 relating to foreign currency contracts used to hedgeforecasted revenues resulting from hedge ineffectiveness. As of June 30, 2013, the Company hadnotional amounts of 5.0 million British pounds and 7.5 million Euros under foreign currencycontracts used to hedge forecasted revenues that expire between July 31, 2013 and May 31, 2014.
Foreign currency contracts used to hedge forecasted cost of sales or operating costs aredesignated as cash flow hedges. These contracts are used to hedge the forecasted cost of sales of theCompany’s Canadian and Australian subsidiaries or operating costs of the Company’s Swisssubsidiaries generally over approximately 12 to 24 months. Changes to fair value of the foreigncurrency contracts are recorded as a component of accumulated other comprehensive income withinshareholders’ equity, to the extent such contracts are effective, and are recognized in cost of sales orselling, general and administrative expenses in the period in which the forecasted transaction affectsearnings or the transactions are no longer probable of occurring. Changes to fair value of anycontracts deemed to be ineffective would be recognized in earnings immediately. There were noamounts recorded in fiscal 2013, 2012 or 2011 relating to foreign currency contracts used to hedgeforecasted cost of sales or operating costs resulting from hedge ineffectiveness. As of June 30, 2013,the Company had notional amounts under foreign currency contracts of 9.9 million Swiss francs tohedge forecasted operating costs that expire between July 31, 2013 and May 31, 2014.
When appropriate, the Company also enters into and settles foreign currency contracts forEuros, British pounds, Canadian dollars and Australian dollars to reduce exposure of the Company’sforeign subsidiaries’ balance sheets to fluctuations in foreign currency rates. These contracts areused to hedge balance sheet exposure generally over one month and are settled before the end of themonth in which they are entered into. Changes to fair value of the forward contracts are recognizedin selling, general and administrative expense in the period in which the contracts expire. For theyear ended June 30, 2013, the Company recorded a credit of $0.3 million in selling, general andadministrative expenses related to these contracts. For the years ended June 30, 2012 and 2011, theCompany recorded a credit of $0.4 million and a charge of $3.2 million, respectively, in selling,general and administrative expenses related to these contracts. As of June 30, 2013, there were nosuch foreign currency contracts outstanding. There were no amounts recorded in fiscal 2013, 2012and 2011 relating to foreign currency contracts to hedge subsidiary balance sheets resulting fromhedge ineffectiveness.
101

ELIZABETH ARDEN, INC. AND SUBSIDIARIES
NOTES TO CONSOLIDATED FINANCIAL STATEMENTS—(CONTINUED)
The following tables illustrate the fair value of outstanding foreign currency contracts and thegains (losses) associated with the settlement of these contracts:
(Amounts in thousands)
Fair Value ofDerivative Instruments
Designated asEffective Hedges
Balance Sheet LocationJune 30,
2013June 30,
2012
Other assets . . . . . . . . . . . . . . . . . . . . . . . . . . . . . . . . . . . . . . . . . . . . . . . . . . . . . $658 $586
Other payables . . . . . . . . . . . . . . . . . . . . . . . . . . . . . . . . . . . . . . . . . . . . . . . . . . . $ — $382
(Loss) Gain Reclassified from Accumulated Other Comprehensive Income into Income, Net ofTax (Effective Portion)
Year Ended June 30,(Amounts in thousands) 2013 2012 2011
Currency Contracts — Sales(1) . . . . . . . . . . . . . . . . . . . . . . . . . . . . . . . . . . . . $ 20 $ 355 $ (894)Currency Contracts — Cost of Sales(2) . . . . . . . . . . . . . . . . . . . . . . . . . . . . . . (310) (908) (1,544)Currency Contracts — Selling, General and Administrative Expenses(3) . . . (20) 17 —
Total(4) . . . . . . . . . . . . . . . . . . . . . . . . . . . . . . . . . . . . . . . . . . . . . . . . . . . . . . $(310) $(536) $(2,438)
(1) Recorded in net sales on the consolidated statements of income.(2) Recorded in cost of sales on the consolidated statements of income.(3) Recorded in selling, general and administrative expenses on the consolidated statements of
income.(4) Net of tax benefit of $137, $339 and $736 for the years ended June 30, 2013, 2012 and 2011,
respectively.
Net Gain (Loss) Recognized in Other Comprehensive Income on Derivatives, Net of Tax (EffectivePortion)
Year Ended June 30,(Amounts in thousands) 2013 2012 2011
Currency Contracts — Sales . . . . . . . . . . . . . . . . . . . . . . . . . . . . . . . . . . . . . . $241 $ (62) $413Currency Contracts — Cost of Sales . . . . . . . . . . . . . . . . . . . . . . . . . . . . . . . . 215 2,336 260Currency Contracts — Selling, General and Administrative Expenses and
Administrative Expenses . . . . . . . . . . . . . . . . . . . . . . . . . . . . . . . . . . . . . . . 282 (162) —
Total(1) . . . . . . . . . . . . . . . . . . . . . . . . . . . . . . . . . . . . . . . . . . . . . . . . . . . . . . . $738 $2,112 $673
(1) Net of tax expense of $163, $945 and $164 for the years ended June 30, 2013, 2012 and 2011,respectively.
102

ELIZABETH ARDEN, INC. AND SUBSIDIARIES
NOTES TO CONSOLIDATED FINANCIAL STATEMENTS—(CONTINUED)
NOTE 17. Quarterly Data (Unaudited)
Condensed consolidated quarterly and interim information is as follows: (Amounts inthousands, except per share data)
Fiscal Quarter EndedJune 30,
2013March 31,
2013December 31,
2012September 30,
2012
Net sales . . . . . . . . . . . . . . . . . . . . . . . . . . . . . . . $267,579 $264,484 $467,919 $344,541Gross profit(1) . . . . . . . . . . . . . . . . . . . . . . . . . . . 118,743 126,185 236,466 147,399(Loss) income from operations(1) . . . . . . . . . . . . (5,078) 4,334 63,841 8,863Net (loss) income(2) . . . . . . . . . . . . . . . . . . . . . . (5,009) (1,273) 44,809 2,184(Loss) income per common share:
Basic(1) . . . . . . . . . . . . . . . . . . . . . . . . . . . . $ (0.17) $ (0.04) $ 1.51 $ 0.07Diluted(1) . . . . . . . . . . . . . . . . . . . . . . . . . . . $ (0.17) $ (0.04) $ 1.47 $ 0.07
(1) For the year ended June 30, 2013, gross profit includes $13.8 million of inventory–related costs($6.4 million of which did not require the use of cash in fiscal 2013) primarily for inventorypurchased by the Company from New Wave Fragrances, LLC and Give Back Brands, LLC priorto the acquisition of licenses and certain other assets from those companies and other transitioncosts, and $22.6 million of non-recurring product changeover costs and product discontinuationcharges related to the repositioning of the Elizabeth Arden brand. In addition, income fromoperations includes (i) $0.4 million in transition costs associated with the 2012 Acquisitions,(ii) $0.5 million of non-recurring product changeover expenses related to the repositioning ofthe Elizabeth Arden brand, and (iii) $1.5 million of expenses related to a third party provider offreight audit and payment services that entered into bankruptcy after receiving funds from theCompany to pay Company freight invoices and breaching its obligation to remit those funds tothe freight companies. For the year ended June 30, 2013, acquisition related costs andexpenses, product changeover costs and expenses, product discontinuation charges and othernon-recurring expenses reduced both basic and fully diluted earnings per share by $0.83 and$0.81, respectively. The breakout of acquisition related costs and expenses, product changeovercosts and expenses, product discontinuation charges and other non-recurring expenses by fiscalquarter is as follows:
Fiscal Quarter Ended
(Amounts in millions)June 30,
2013March 31,
2013December 31,
2012September 30,
2012
Inventory–related costs — 2012 Acquisitions . . . . . $ — $0.6 $1.9 $11.3Product changeover costs and expenses, and
product discontinuation charges related toElizabeth Arden brand repositioning . . . . . . . . . . 12.9 2.8 3.9 3.5
Transition costs — 2012 Acquisitions . . . . . . . . . . . — 0.1 — 0.3Other non-recurring expenses . . . . . . . . . . . . . . . . . 1.5 — — —
Total . . . . . . . . . . . . . . . . . . . . . . . . . . . . . . . . . . . . . $14.4 $3.5 $5.8 $15.1
(2) For the quarter ended June 30, 2013, net income includes an out-of-period adjustments of $0.9million to correct an error related to deferred taxes. Income tax expense increased and netincome decreased by $0.9 million. The Company did not adjust the prior periods as itconcluded that such adjustments were not material to the current or prior period consolidatedfinancial statements.
103
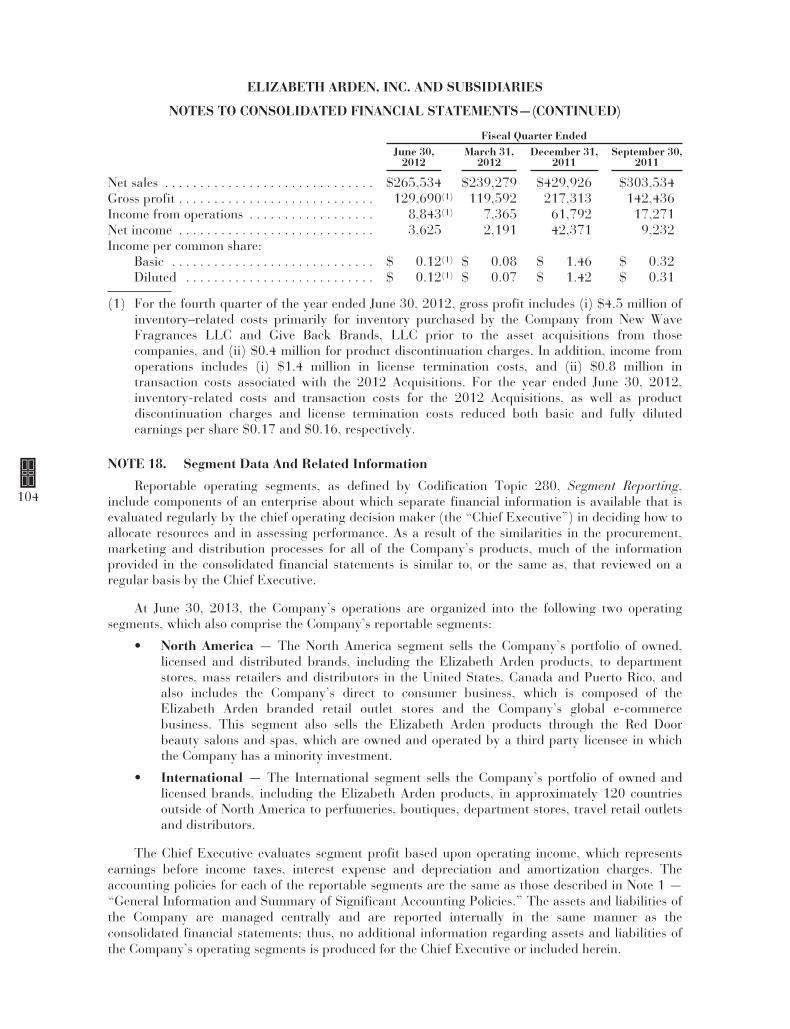
ELIZABETH ARDEN, INC. AND SUBSIDIARIES
NOTES TO CONSOLIDATED FINANCIAL STATEMENTS—(CONTINUED)
Fiscal Quarter EndedJune 30,
2012March 31,
2012December 31,
2011September 30,
2011
Net sales . . . . . . . . . . . . . . . . . . . . . . . . . . . . . . $265,534 $239,279 $429,926 $303,534Gross profit . . . . . . . . . . . . . . . . . . . . . . . . . . . . 129,690(1) 119,592 217,313 142,436Income from operations . . . . . . . . . . . . . . . . . . 8,843(1) 7,365 61,792 17,271Net income . . . . . . . . . . . . . . . . . . . . . . . . . . . . 3,625 2,191 42,371 9,232Income per common share:
Basic . . . . . . . . . . . . . . . . . . . . . . . . . . . . . $ 0.12(1) $ 0.08 $ 1.46 $ 0.32Diluted . . . . . . . . . . . . . . . . . . . . . . . . . . . $ 0.12(1) $ 0.07 $ 1.42 $ 0.31
(1) For the fourth quarter of the year ended June 30, 2012, gross profit includes (i) $4.5 million ofinventory–related costs primarily for inventory purchased by the Company from New WaveFragrances LLC and Give Back Brands, LLC prior to the asset acquisitions from thosecompanies, and (ii) $0.4 million for product discontinuation charges. In addition, income fromoperations includes (i) $1.4 million in license termination costs, and (ii) $0.8 million intransaction costs associated with the 2012 Acquisitions. For the year ended June 30, 2012,inventory-related costs and transaction costs for the 2012 Acquisitions, as well as productdiscontinuation charges and license termination costs reduced both basic and fully dilutedearnings per share $0.17 and $0.16, respectively.
NOTE 18. Segment Data And Related Information
Reportable operating segments, as defined by Codification Topic 280, Segment Reporting,include components of an enterprise about which separate financial information is available that isevaluated regularly by the chief operating decision maker (the “Chief Executive”) in deciding how toallocate resources and in assessing performance. As a result of the similarities in the procurement,marketing and distribution processes for all of the Company’s products, much of the informationprovided in the consolidated financial statements is similar to, or the same as, that reviewed on aregular basis by the Chief Executive.
At June 30, 2013, the Company’s operations are organized into the following two operatingsegments, which also comprise the Company’s reportable segments:
• North America — The North America segment sells the Company’s portfolio of owned,licensed and distributed brands, including the Elizabeth Arden products, to departmentstores, mass retailers and distributors in the United States, Canada and Puerto Rico, andalso includes the Company’s direct to consumer business, which is composed of theElizabeth Arden branded retail outlet stores and the Company’s global e-commercebusiness. This segment also sells the Elizabeth Arden products through the Red Doorbeauty salons and spas, which are owned and operated by a third party licensee in whichthe Company has a minority investment.
• International — The International segment sells the Company’s portfolio of owned andlicensed brands, including the Elizabeth Arden products, in approximately 120 countriesoutside of North America to perfumeries, boutiques, department stores, travel retail outletsand distributors.
The Chief Executive evaluates segment profit based upon operating income, which representsearnings before income taxes, interest expense and depreciation and amortization charges. Theaccounting policies for each of the reportable segments are the same as those described in Note 1 —“General Information and Summary of Significant Accounting Policies.” The assets and liabilities ofthe Company are managed centrally and are reported internally in the same manner as theconsolidated financial statements; thus, no additional information regarding assets and liabilities ofthe Company’s operating segments is produced for the Chief Executive or included herein.
104

ELIZABETH ARDEN, INC. AND SUBSIDIARIES
NOTES TO CONSOLIDATED FINANCIAL STATEMENTS—(CONTINUED)
Segment profit excludes depreciation and amortization, interest expense, debt extinguishmentcharges, consolidation and elimination adjustments and unallocated corporate expenses, which areshown in the table reconciling segment profit to consolidated income before income taxes. Includedin unallocated corporate expenses are (i) restructuring charges that are related to an announcedplan, (ii) restructuring costs for corporate operations, (iii) costs related to the Global Efficiency Re-Engineering initiative (the “Initiative”), which was substantially completed in fiscal 2011, and(iv) acquisition-related costs including transition costs. These expenses are recorded in unallocatedcorporate expenses as these items are centrally directed and controlled and are not included ininternal measures of segment operating performance. The Company does not have any intersegmentsales.
The following table is a comparative summary of the Company’s net sales and segment profitby operating segment for the fiscal years ending June 30, 2013, 2012 and 2011.
(Amounts in thousands) Year Ended June 30,2013 2012 2011
Segment Net Sales:North America . . . . . . . . . . . . . . . . . . . . . . . . . . . . . . . $ 857,531 $ 778,407 $ 756,731International . . . . . . . . . . . . . . . . . . . . . . . . . . . . . . . . . 486,992 459,866 418,769
Total . . . . . . . . . . . . . . . . . . . . . . . . . . . . . . . . . . . . . . . . . . . $1,344,523 $1,238,273 $1,175,500
Segment Profit:North America . . . . . . . . . . . . . . . . . . . . . . . . . . . . . . . $ 128,198 $ 128,692 $ 104,013International . . . . . . . . . . . . . . . . . . . . . . . . . . . . . . . . . 6,425 13,316 6,420
Total . . . . . . . . . . . . . . . . . . . . . . . . . . . . . . . . . . . . . . . . . . . $ 134,623 $ 142,008 $ 110,433
Reconciliation:Segment Profit . . . . . . . . . . . . . . . . . . . . . . . . . . . . . . . $ 134,623 $ 142,008 $ 110,433Less:
Depreciation and Amortization . . . . . . . . . . . . . . . 45,969 34,054 29,835Interest Expense . . . . . . . . . . . . . . . . . . . . . . . . . . 24,309 21,759 21,481Consolidation and Elimination Adjustments . . . . 912 5,575 1,854Unallocated Corporate Expenses . . . . . . . . . . . . . 15,782(1) 7,108(2) 7,637(3)
Income Before Income Taxes . . . . . . . . . . . . . . . . . . . . . . . . $ 47,651 $ 73,512 $ 49,626
(1) Amounts for the year ended June 30, 2013, include (i) $13.8 million of inventory–related costs($6.4 million of which did not require the use of cash in fiscal 2013) recorded in cost of salesprimarily for inventory purchased by the Company from New Wave Fragrances LLC and GiveBack Brands LLC prior to the acquisition of licenses and other assets from those companies,and other transition costs, (ii) $0.4 million in transition expenses associated with suchacquisitions, and (iii) $1.5 million of expenses related to a third party provider of freight auditand payment services that entered into bankruptcy after receiving funds from the Company topay Company freight invoices and breaching its obligation to remit those funds to the freightcompanies.
(2) Amounts shown for the year ended June 30, 2012 include (i) $4.5 million of inventory–relatedcosts primarily for New Wave and Give Back Brands inventory purchased by the Companyprior to the acquisitions, (ii) $0.8 million in transaction costs associated with such acquisitions,(iii) $0.4 million for product discontinuation charges, and (iv) $1.4 million of licensetermination costs.
105
ELIZABETH ARDEN, INC. AND SUBSIDIARIES
NOTES TO CONSOLIDATED FINANCIAL STATEMENTS—(CONTINUED)
(3) Amounts shown for the year ended June 30, 2011 include (i) $6.5 million of debtextinguishment charges, (ii) $0.5 million of restructuring expenses for corporate operations, notrelated to the Initiative, (iii) $0.3 million of restructuring expenses related to the Initiative, and(iv) $0.3 million of expenses related to the implementation of an Oracle accounting and orderprocessing system.
During the year ended June 30, 2013, the Company sold its products in approximately 120countries outside the United States through its international affiliates and subsidiaries withoperations headquartered in Geneva, Switzerland, and through third party distributors. TheCompany’s international operations are subject to certain risks, including political instability incertain regions of the world and diseases or other factors affecting customer purchasing patterns,economic and political consequences of terrorist attacks or the threat of such attacks andfluctuations in foreign exchange rates that could adversely affect its results of operations. SeeItem 1A - “Risk Factors.” The value of international assets is affected by fluctuations in foreigncurrency exchange rates. For a discussion of foreign currency translation, see Note 16.
The Company’s consolidated net sales by principal geographic areas and principal classes ofproducts are summarized as follows:
Year Ended June 30,(Amounts in thousands) 2013 2012 2011
Net sales:United States . . . . . . . . . . . . . . . . . . . . . . . . . $ 787,305 $ 718,880 $ 701,642United Kingdom . . . . . . . . . . . . . . . . . . . . . . 74,250 71,749 69,922Foreign (other than United Kingdom) . . . . . 482,968 447,644 403,936
Total . . . . . . . . . . . . . . . . . . . . . . . . . . . . $1,344,523 $1,238,273 $1,175,500
Classes of similar products (net sales):Fragrance . . . . . . . . . . . . . . . . . . . . . . . . . . . . $1,052,906 $ 941,869 $ 900,289Skin care . . . . . . . . . . . . . . . . . . . . . . . . . . . . 226,027 226,408 207,125Cosmetics . . . . . . . . . . . . . . . . . . . . . . . . . . . . 65,590 69,996 68,086
Total . . . . . . . . . . . . . . . . . . . . . . . . . . . . $1,344,523 $1,238,273 $1,175,500
Information concerning consolidated long-lived assets for the U.S. and foreign operations is asfollows:
June 30,(Amounts in thousands) 2013 2012
Long-lived assetsUnited States(1) . . . . . . . . . . . . . . . . . . . . . . . . . . . . . . . . . . . . . . $375,388 $385,551Foreign(2) . . . . . . . . . . . . . . . . . . . . . . . . . . . . . . . . . . . . . . . . . . 48,670 39,443
Total . . . . . . . . . . . . . . . . . . . . . . . . . . . . . . . . . . . . . . . . . . $424,058 $424,994
(1) Primarily exclusive brand licenses, trademarks and intangibles, net, and property andequipment, net.
(2) Primarily property and equipment, net.
106

ITEM 9. CHANGES IN AND DISAGREEMENTS WITH ACCOUNTANTS ON ACCOUNTINGAND FINANCIAL DISCLOSURE
None.
ITEM 9A. CONTROLS AND PROCEDURES
Our Chairman, President and Chief Executive Officer, and our Executive Vice President andChief Financial Officer, who are the principal executive officer and principal financial officer,respectively, have evaluated the effectiveness and operation of our disclosure controls andprocedures (as defined in Rules 13a-15(e) and 15d-15(e) of the Securities Exchange Act of 1934, asamended), as of the end of the period covered by this annual report (the “Evaluation Date”). Basedupon such evaluation, they have concluded that, as of the Evaluation Date, our disclosure controlsand procedures are functioning effectively.
There have been no changes in our internal control over financial reporting during our mostrecent fiscal quarter that have materially affected, or are likely to materially affect, our internalcontrol over financial reporting.
Management’s report on our internal control over financial reporting (as such term is defined inRules 13a-15(f) and 15d-15(f) under the Exchange Act), is included in our Financial Statements inItem 8 under the heading Report of Management — Report on Internal Control Over FinancialReporting and is hereby incorporated by reference. The related report of our independent registeredpublic accounting firm is also included in our Financial Statements in Item 8 under the headingReport of Independent Registered Public Accounting Firm.
ITEM 9B. OTHER INFORMATION
None.
PART III
ITEM 10. DIRECTORS, EXECUTIVE OFFICERS AND CORPORATE GOVERNANCE
We have adopted a Supplemental Code of Ethics for the Directors and Executive and FinanceOfficers that applies to our directors, our chief executive officer, our chief financial officer, and ourother executive officers and finance officers. The full text of this Code of Ethics, as approved by ourboard of directors, is published on our website, at www.elizabetharden.com, under the section“Corporate — Investor Relations — Corporate Governance — Code of Ethics.” We intend to disclosefuture amendments to and waivers of the provisions of this Code of Ethics on our website.
The other information required by this item will be contained in the Company’s ProxyStatement relating to the 2013 Annual Meeting of Shareholders to be filed within 120 days after theend of our fiscal year ended June 30, 2013 (the proxy statement) and is incorporated herein by thisreference or is included in Part I under “Executive Officers of the Company.”
ITEM 11. EXECUTIVE COMPENSATION
The information required by this item will be contained in the proxy statement and isincorporated herein by this reference.
ITEM 12. SECURITY OWNERSHIP OF CERTAIN BENEFICIAL OWNERS ANDMANAGEMENT AND RELATED STOCKHOLDER MATTERS
The information required by this item will be contained in the proxy statement and isincorporated herein by this reference.
107

ITEM 13. CERTAIN RELATIONSHIPS AND RELATED TRANSACTIONS, AND DIRECTORINDEPENDENCE
The information required by this item will be contained in the proxy statement and isincorporated herein by this reference
ITEM 14. PRINCIPAL ACCOUNTING FEES AND SERVICES
The information required by this item will be contained in the proxy statement and isincorporated herein by this reference.
PART IV
ITEM 15 EXHIBITS, FINANCIAL STATEMENT SCHEDULES
(a) 1. Financial Statements —
The consolidated financial statements, Report of Management and Report of IndependentRegistered Public Accounting Firm are listed in the “Index to Financial Statements andSchedules” on page 64 and included on pages 65 through 73.
2. Financial Statement Schedules —
All schedules for which provision is made in the applicable accounting regulations of theSecurities and Exchange Commission (the “Commission”) are either not required under therelated instructions, are not applicable (and therefore have been omitted), or the requireddisclosures are contained in the financial statements included herein.
3. Exhibits (including those incorporated by reference).
ExhibitNumber Description
3.1 Amended and Restated Articles of Incorporation of the Company dated November 17,2005 (incorporated herein by reference to Exhibit 3.1 filed as part of the Company’sForm 10-Q for the quarter ended December 31, 2005 (Commission File No. 1-6370)).
3.2 Amended and Restated By-laws of the Company (incorporated herein by reference toExhibit 3.1 filed as part of the Company’s Form 8-K dated October 27, 2009(Commission File No. 1-6370)).
4.1 Indenture, dated as of January 21, 2011, respecting Elizabeth Arden, Inc.’s 73⁄8% SeniorNotes due 2021, among Elizabeth Arden, Inc. and U.S. Bank National Association, astrustee (incorporated herein by reference to Exhibit 4.1 to the Company’s Form 8-Kdated January 21, 2011 (Commission File No. 1-6370)).
10.1 Third Amended and Restated Credit Agreement, dated as of January 21, 2011, amongElizabeth Arden, Inc., as borrower, JP Morgan Chase Bank, N.A., as administrativeagent, Bank of America, N.A., as collateral agent and syndication agent, Wells FargoCapital Finance, LLC, HSBC Bank USA, N.A. and U.S. Bank National Association, asco-documentation agents, JPMorgan Chase Bank, N.A., and Bank of America, N.A. asjoint lead arrangers, and the other lenders party thereto (incorporated herein byreference to Exhibit 10.1 filed as part of the Company’s Form 8-K dated January 21,2011 (Commission File No. 1-6370)).
10.2 Amended and Restated Security Agreement dated as of January 29, 2001, made by theCompany and certain of its subsidiaries in favor of Fleet National Bank (n/k/a Bank ofAmerica, N.A.), as administrative agent (incorporated herein by reference to Exhibit 4.5filed as part of the Company’s Form 8-K dated January 23, 2001 (Commission File No.1-6370)).
108

ExhibitNumber Description
10.3 First Amendment to Third Amended and Restated Credit Agreement dated as of June12, 2012, among Elizabeth Arden, Inc., as Borrower, JPMorgan Chase Bank, N.A., asthe administrative agent, Bank of America, N.A., as the collateral agent, and the otherbanks party thereto (incorporated by reference to Exhibit 10.3 filed as part of theCompany’s Form 10-K for the year ended June 30, 2012 (Commission File No. 1-6370)).
10.4 Credit Agreement (Second Lien) dated as of June 12, 2012, between Elizabeth Arden,Inc. and JPMorgan Chase Bank, N.A. (incorporated by reference to Exhibit 10.4 filedas part of the Company’s Form 10-K for the year ended June 30, 2012 (CommissionFile No. 1-6370)).
10.5 First Amendment to Credit Agreement (Second Lien) dated as of February 11, 2013,between Elizabeth Arden, Inc. and JPMorgan Chase Bank N.A. (incorporated byreference to Exhibit 10.5 filed as part of the Company’s Form 10-Q for the quarterended March 31, 2013 (Commission File No. 1-6370)).
10.6 Amended and Restated Deed of Lease dated as of January 17, 2003, between theCompany and Liberty Property Limited Partnership (incorporated herein by referencedto Exhibit 10.5 filed as a part of the Company’s Form 10-Q for the quarter ended April26, 2003 (Commission File No. 1-6370)).
10.7+ Amendment to the Amended and Restated Deed of Lease dated as of June 30, 2012,between the Company and Liberty Property Limited Partnership (incorporated byreference to Exhibit 10.6 filed as part of the Company’s Form 10-K for the year endedJune 30, 2012 (Commission File No. 1-6370)).
10.8+ 2004 Stock Incentive Plan, as amended and restated (incorporated herein by referenceto Exhibit 10.12 filed as part of the Company’s Form 10-Q for the quarter endedDecember 31, 2007 (Commission File No. 1-6370)).
10.9+ 2004 Non-Employee Director Stock Option Plan, as amended (incorporated herein byreference to Exhibit 10.2 filed as part of the Company’s Form 10-Q for the quarterended September 30, 2006 (Commission File No. 1-6370)).
10.10+ 2000 Stock Incentive Plan, as amended (incorporated herein by reference to Exhibit10.14 filed as part of the Company’s Form 10-Q for the quarter ended December 31,2007 (Commission File No. 1-6370)).
10.11+ 1995 Stock Option Plan, as amended (incorporated herein by reference to Exhibit 10.4filed as part of the Company’s Form 10-Q for the quarter ended September 30, 2006(Commission File No. 1-6370)).
10.12+ 2011 Employee Stock Purchase Plan (incorporated herein by reference to Exhibit 4.3filed as part of the Company’s Form S-8, Registration No. 333-177839, datedNovember 9, 2011 (Commission File No. 1-6370)).
10.13+ Non-Employee Director Stock Option Plan, as amended (incorporated herein byreference to Exhibit 10.6 filed as part of the Company’s Form 10-Q for the quarterended September 30, 2006 (Commission File No. 1-6370)).
10.14+ Form of Nonqualified Stock Option Agreement for stock option awards under theCompany’s Non-Employee Director Stock Option Plan (incorporated herein byreference to Exhibit 10.8 filed as a part of the Company’s Form 10-Q for the quarterended March 31, 2005 (Commission File No. 1-6370)).
10.15+ Form of Incentive Stock Option Agreement for stock option awards under theCompany’s 1995 Stock Option Plan (incorporated herein by reference to Exhibit 10.9filed as a part of the Company’s Form 10-Q for the quarter ended March 31, 2005(Commission File No. 1-6370)).
109

ExhibitNumber Description
10.16+ Form of Nonqualified Stock Option Agreement for stock option awards under theCompany’s 1995 Stock Option Plan (incorporated herein by reference to Exhibit 10.10filed as a part of the Company’s Form 10-Q for the quarter ended March 31, 2005(Commission File No. 1-6370)).
10.17+ Form of Stock Option Agreement for stock option awards under the Company’s 2000Stock Incentive Plan (incorporated herein by reference to Exhibit 10.11 filed as a partof the Company’s Form 10-Q for the quarter ended March 31, 2005 (Commission FileNo. 1-6370)).
10.18+ Form of Stock Option Agreement for stock option awards under the Company’s 2004Non-Employee Director Stock Option Plan (incorporated herein by reference to Exhibit10.14 filed as a part of the Company’s Form 10-Q for the quarter ended March 31,2005 (Commission File No. 1-6370)).
10.19+ Form of Stock Option Agreement for stock option awards under the Company’s 2004Stock Incentive Plan (incorporated herein by reference to Exhibit 10.19 filed as a partof the Company’s Form 10-K for the year ended June 30, 2005 (Commission File No.1-6370)).
10.20+ Form of Restricted Stock Agreement for the restricted stock awards under theCompany’s 2004 Stock Incentive Plan (incorporated herein by reference to Exhibit10.20 filed as a part of the Company’s Form 10-K for the year ended June 30, 2005(Commission File No. 1-6370)).
10.21+ Elizabeth Arden, Inc. Severance Policy, as amended and restated on May 4, 2010(incorporated herein by reference to Exhibit 10.31 filed as part of the Company’s Form10-Q for the quarter ended March 31, 2010 (Commission File No. 1-6370)).
10.22+ Form of Restricted Stock Agreement for service-based restricted stock awards (three-year vesting period) under the Company’s 2000 Stock Incentive Plan (incorporatedherein by reference to Exhibit 10.32 filed as part of the Company’s Form 10-K for theyear ended June 30, 2007 (Commission File No. 1-6370)).
10.23+ Form of Indemnification Agreement for Directors and Officers of Elizabeth Arden, Inc.(incorporated by reference to Exhibit 10.1 filed as part of the Company’s Form 8-Kdated August 11, 2009 (Commission File No. 1-6370)).
10.24+ Elizabeth Arden Inc. 2010 Stock Award and Incentive Plan (incorporated by referenceto Exhibit 4.3 filed as part of the Company’s Form S-8, Registration No. 333-170287,filed on November 2, 2010 (Commission File No. 1-6370)).
10.25+ Form of Restricted Stock Agreement for service-based stock awards under theCompany’s 2010 Stock Award and Incentive Plan (incorporated herein by reference toExhibit 10.35 filed as part of the Company’s Form 10-Q for the quarter endedSeptember 30, 2010 (Commission File No. 1-6370)).
10.26+ Form of Restricted Stock Unit Agreement for restricted stock unit awards under theCompany’s 2010 Stock Award and Incentive Plan (incorporated herein by reference toExhibit 10.22 filed as part of the Company’s Form 10-Q for the quarter endedSeptember 30, 2011 (Commission File No. 1-6370)).
10.27+ Form of Restricted Stock Unit Agreement for restricted stock unit awards under theCompany’s 2004 Stock Incentive Plan (incorporated herein by reference to Exhibit10.26 filed as part of the Company’s Form 10-Q for the quarter ended September 30,2012 (Commission File No. 1-6370)).
10.28+ Letter Agreement between Elizabeth Arden, Inc. and Kathleen Widmer, dated March19, 2013, regarding 2013 retention payment (incorporated herein by reference toExhibit 10.28 filed as part of the Company’s Form 10-Q for the quarter ended March31, 2013 (Commission File No. 1-6370)).
110

ExhibitNumber Description
12.1* Ratio of earnings to fixed charges.
21.1* Subsidiaries of the Registrant.
23.1* Consent of PricewaterhouseCoopers LLP.
24.1* Power of Attorney (included as part of signature page).
31.1* Section 302 Certification of Chief Executive Officer.
31.2* Section 302 Certification of Chief Financial Officer.
32* Section 906 Certifications of the Chief Executive Officer and the Chief FinancialOfficer.
101.INS** XBRL Instance Document
101.SCH** XBRL Taxonomy Extension Schema Document
101.CAL** XBRL Taxonomy Extension Calculation Linkbase Document
101.DEF** XBRL Taxonomy Extension Definition Linkbase Document
101.LAB** XBRL Taxonomy Extension Label Linkbase Document
101.PRE** XBRL Taxonomy Extension Presentation Linkbase Document
+ Management contract or compensatory plan or arrangement.* Filed herewith.** Filed herewith as Exhibit 101 are the following documents formatted in XBRL (Extensible
Business Reporting Language): (i) audited consolidated balance sheets as of June 30, 2013 andJune 30, 2012, (ii) audited consolidated statements of income for the fiscal years endedJune 30, 2013, 2012 and 2011, respectively, (iii) audited consolidated statements ofcomprehensive income for the fiscal years ended June 30, 2013, 2012 and 2011, respectively,(iv) audited consolidated statements of cash flows for the fiscal years ended June 30, 2013,2012 and 2011, respectively and (v) the notes to the audited condensed consolidated financialstatements. Pursuant to Rule 406T of Regulation S-T, these interactive data files are deemednot filed or part of a registration statement or prospectus for purposes of Sections 11 or 12 ofthe Securities Act of 1933 or Section 18 of the Securities Exchange Act of 1934 and otherwiseare not subject to liability.
The exhibits to this annual report are listed in the Exhibit Index located on pages 108 - 111.Elizabeth Arden, Inc. will furnish any or all of these exhibits upon the payment of $.10 per page($5.00 minimum). Any request for exhibits should be addressed to Investor Relations, ElizabethArden, Inc., 200 Park Avenue South, New York, NY 10003; should specify which exhibits aredesired; should state that the person making such request was a shareholder on September 11, 2013and should be accompanied by a remittance payable to Elizabeth Arden, Inc. in the minimumamount of $5.00. Elizabeth Arden, Inc. will bill for any additional charge.
111
SIGNATURES
Pursuant to the requirements of Section 13 or 15(d) of the Securities Exchange Act of 1934, theregistrant has duly caused this report to be signed on its behalf by the undersigned, thereunto dulyauthorized, as of the 12th day of August 2013.
ELIZABETH ARDEN, INC.
By: /s/ E. Scott BeattieE. Scott BeattieChairman, President, ChiefExecutive Officer and Director(Principal Executive Officer)
We, the undersigned directors and officers of Elizabeth Arden, Inc., hereby severally constituteE. Scott Beattie and Stephen J. Smith, and each of them singly, our true and lawful attorneys withfull power to them and each of them to sign for us, in our names in the capacities indicated below,any and all amendments to this Annual Report on Form 10-K filed with the Securities and ExchangeCommission.
Pursuant to the requirements of the Securities Exchange Act of 1934, this report has beensigned by the following persons on behalf of the registrant and in the capacities and on the datesindicated.
Signature Title Date
/s/ E. Scott Beattie
Chairman, President and ChiefExecutive Officer and Director(Principal Executive Officer)
August 12, 2013
E. Scott Beattie
/s/ Stephen J. Smith
Executive Vice President and ChiefFinancial Officer (Principal Financialand Accounting Officer)
August 12, 2013
Stephen J. Smith
/s/ Fred Berens Director August 12, 2013Fred Berens
/s/ Maura J. Clark Director August 12, 2013Maura J. Clark
/s/ Richard C. W. Mauran Director August 12, 2013Richard C.W. Mauran
/s/ William M. Tatham Director August 12, 2013William M. Tatham
/s/ J. W. Nevil Thomas Director August 12, 2013J.W. Nevil Thomas
/s/ A. Salman Amin Director August 12, 2013A. Salman Amin
112

EXHIBIT INDEX
ExhibitNumber Description
12.1 Ratio of earnings to fixed charges.
21.1 Subsidiaries of the Registrant.
23.1 Consent of PricewaterhouseCoopers LLP.
24.1 Power of Attorney (included as part of signature page).
31.1 Section 302 Certification of Chief Executive Officer.
31.2 Section 302 Certification of Chief Financial Officer.
32 Section 906 Certifications of the Chief Executive Officer and the Chief FinancialOfficer.
101.INS XBRL Instance Document
101.SCH XBRL Taxonomy Extension Schema Document
101.CAL XBRL Taxonomy Extension Calculation Linkbase Document
101.DEF XBRL Taxonomy Extension Definition Linkbase Document
101.LAB XBRL Taxonomy Extension Label Linkbase Document
101.PRE XBRL Taxonomy Extension Presentation Linkbase Document
113

CORPORATE AND INVESTOR INFORMATION
DIRECTORS
E. Scott BeattieChairman, President andChief Executive OfficerElizabeth Arden, Inc.
Fred Berens, Lead Independent DirectorMember, Audit and Compensation CommitteesManaging Director - InvestmentsWells Fargo Advisors LLC
A. Salman AminChairperson, Compensation CommitteeChief Operating Officer, North American MarketsSC Johnson & Sons, Inc.
Maura J. ClarkChairperson, Audit CommitteeMember, Nominating and CorporateGovernance CommitteePresident, Direct Energy BusinessDirect Energy Services, LLC
Richard C.W. MauranChairperson, Nominating and CorporateGovernance CommitteePrivate Investor
William M. TathamMember, Audit and Compensation CommitteesChief Executive OfficerNexJ Systems, Inc.
J. W. Nevil ThomasMember, Audit and Nominating and CorporateGovernance CommitteesPresident and Chief Executive OfficerNevcorp, Inc.
ANNUAL MEETINGOur annual meeting of shareholders will be held at10:00 a.m. local time on November 6, 2013 at ourFlorida offices located at 2400 SW 145 Avenue,Miramar, Florida 33027.
CORPORATE OFFICES2400 SW 145 AvenueMiramar, Florida 33027954-364-6900
200 Park Avenue SouthNew York, New York 10003212-261-1000
200 First Stamford PlaceStamford, Connecticut 06902203-462-5700
28, chemin de Joinville1216 Cointrin-Geneva41-22-791-8711
COMMON STOCK INFORMATIONOur common stock is traded on the Nasdaq GlobalSelect Market under the symbol “RDEN.”
INVESTOR RELATIONSFor investor information, including filings with theSecurities and Exchange Commission and otherfinancial literature, please visit our website atwww.elizabetharden.com or write to us at:Elizabeth Arden, Inc.Investor Relations200 Park Avenue SouthNew York, New York 10003
TRANSFER AGENT AND REGISTRARAmerican Stock Transfer & Trust Company6201 15th AvenueBrooklyn, New York 11219800-937-5449
INDEPENDENT REGISTERED PUBLICACCOUNTING FIRMPricewaterhouseCoopers LLP300 Madison AvenueNew York, New York 10017
114


©20
13El
izab
eth
Ard
en,I
nc.
©20
13El
izab
eth
Ard
en,I
nc.

©20
13El
izab
eth
Ard
en,I
nc.
A N N U A L R E P O R T 2 0 1 3
Related Documents