HALTON DISTRICT SCHOOL BOARD AND HALTON CATHOLIC DISTRICT SCHOOL BOARD EDUCATION DEVELOPMENT CHARGE BACKGROUND STUDY OFFICE CONSOLIDATION INCORPORATING THE BACKGROUND STUDY (APRIL 30, 2013) AS AMENDED JUNE 3, 2013

Welcome message from author
This document is posted to help you gain knowledge. Please leave a comment to let me know what you think about it! Share it to your friends and learn new things together.
Transcript
HALTON DISTRICT SCHOOL BOARD
AND HALTON CATHOLIC
DISTRICT SCHOOL BOARD
EDUCATION DEVELOPMENT CHARGE BACKGROUND STUDY
OFFICE CONSOLIDATION
INCORPORATING THE BACKGROUND STUDY (APRIL 30,
2013) AS AMENDED
JUNE 3, 2013
Watson & Associates Economists Ltd. HDSB HCDSB FINAL EDC STUDY
CONTENTS Page
EXECUTIVE SUMMARY (i) 1. INTRODUCTION 1.1 Background 1-1 1.2 Existing By-laws 1-2 1.3 Area in Which By-law May Apply 1-3 1.4 EDC Review Areas 1-3 2. THE EDC BY-LAW 2.1 Imposition of an EDC 2-1 2.2 The Background Study 2-1 2.3 Public Meetings 2-2 2.4 Exemptions, Expiration, Collection 2-4 2.5 Appeals and Amendments 2-5 3. THE PROCESS AND METHODOLOGY OF CALCULATING AN EDUCATION DEVELOPMENT CHARGE 3.1 Eligibility 3-1 3.2 Demographic Projections 3-6 3.3 Site Needs 3-8 3.4 Growth-related Net Education Land Costs 3-10 3.5 Determination of the Charge 3-11 3.6 Policy Statements 3-12 4. DEMOGRAPHIC PROJECTIONS 4.1 The Residential and Non-residential Growth Forecast 4-1 4.2 Enrolment Projections 4-4 4.3 Summary of Projected Enrolment 4-16 5. EDUCATION DEVELOPMENT CHARGE CALCULATION 5.1 The Projections 5-1 5.2 Net Education Land Costs 5-6 5.3 Reconciliation of the EDC Reserve Fund 5-10 5.4 The Education Development Charge 5-11 APPENDICES A EDUCATION DEVELOPMENT CHARGE MINISTRY OF EDUCATION FORMS
SUBMISSION A-1 B EDUCATION DEVELOPMENT CHARGE PROPOSED DRAFT BY-LAWS B-1 C EDUCATION DEVELOPMENT CHARGE POLICIES ON ALTERNATIVE ACCOMMODATION ARRANGEMENTS AND OPERATING BUDGET SURPLUS C-1

Watson & Associates Economists Ltd. HDSB HCDSB FINAL EDC STUDY
FOREWORD AND ACKNOWLEDGEMENTS This report incorporates changes made to the original background study and an addendum has been issued which highlights the revisions and contains all pages that have changed from the original study. Section 257.61(1) of the Education Act states that, “Before passing an education development charge by-law, the board shall complete an education development charge background study.” Section 257.61(2) of the Act as well as section 9 of Ontario Regulation 20/98, as amended, provide the information that must be contained in the background study. This report contains background studies for the Halton District School Board and the Halton Catholic District School Board. The consultant would like to acknowledge and thank the staff at the HDSB and HCDSB for their work, time and effort over the past several months. Staff from both Boards provided invaluable input and assistance throughout the EDC process. The consultant would also like to thank Mr. Brad Teichman of the firm McCarthy Tetrault, legal counsel for both School Boards and Mr. Chris Vardon of Cushman & Wakefield, the appraisal firm responsible for the site valuations. The consultant also appreciates the time and advice from the planning staff at the Region of Halton.
Watson & Associates Economists Ltd. HDSB HCDSB FINAL EDC STUDY
EXECUTIVE SUMMARY
(i)
Watson & Associates Economists Ltd. HDSB HCDSB FINAL EDC STUDY
EXECUTIVE SUMMARY The Halton District School Board (HDSB) and the Halton Catholic District School Board (HCDSB) have Education Development Charge by-laws in force in the Region of Halton which will expire in June of 2014. Education Development Charges (EDCs) are a revenue source, for school boards that qualify, to purchase and develop land for new schools. EDCs are meant as a funding mechanism for Boards that are experiencing a growth-related accommodation need in their jurisdiction. In order to renew their by-laws each Board must follow certain processes and guidelines as required by Provincial legislation. This Background Study fulfills certain requirements while providing the background necessary to understand and determine the Education Development Charge. The general authority for school boards to impose EDCs is provided by Division E of Part IX for the Education Act. Ontario Regulation 20/98, as amended, provides the requirements necessary to determine an EDC. In addition the Ministry has published a set of EDC Guidelines to assist boards with the EDC process. Before an EDC by-law can be passed, school boards must ensure that they:
• Demonstrate that their elementary or secondary enrolment on a jurisdiction wide basis is greater than the elementary or secondary OTG approved capacity or that their EDC reserve fund is in a deficit position.
• Prepare a background study meeting the requirements of the legislation. • Hold required legislated public meetings. • Receive written Ministry approval.
Both the HDSB and HCDSB are able to renew their existing by-laws on the basis of:
1. Reserve Fund Qualification – both Boards have a deficit in the EDC reserve fund and outstanding financial obligations; and
2. Capacity Trigger – both Boards have an average projected enrolment exceeding the approved OTG capacity. HDSB and HCDSB exceed capacity on the elementary panel only.
The School Boards intend to hold individual public meetings for both the EDC policy review as well as the new proposed EDC by-law. HCDSB will hold their public meeting on Tuesday, May 21st, 2013 and HDSB will hold their public meeting on Wednesday, May 22nd. Both of the Boards will hold these public meetings at their respective Board offices in Burlington. For each Board, the policy review meeting will commence at 7PM followed by the public meeting for the new proposed EDC by-law at 730PM. The HCDSB plans to consider passage of the new EDC by-law on June18th, 2013 and the HDSB plans to consider passage of its by-law on June 19th, 2013 at their respective Board offices.
(ii)
Watson & Associates Economists Ltd. HDSB HCDSB FINAL EDC STUDY
The EDC analysis in this Background Study has been completed for both the HDSB and the HCDSB. The Boards’ jurisdictions are made up of the Region of Halton, including the city of Burlington, and the towns of Oakville, Halton Hills and Milton. This EDC study contemplates jurisdiction wide by-laws which includes all of the Region of Halton for each respective Board. Demographic projections form an important component of the EDC analysis. The residential dwelling unit forecast is used both to project pupils from new development as well as determining the final quantum of the residential charge. The residential forecasts used in this analysis are consistent with the most recent and available Regional forecasts that were available at the time of study preparation. The total number of net new units projected in The Region of Halton for the 15 years in the EDC analysis total 82,659. The number of growth-related pupils is based on the aforementioned residential forecast and pupil yields have been derived from Statistics Canada custom tabulated data and historical board enrolment information. Pupil yields are mathematical representations of the number of school aged children that will be generated by particular dwellings. The total growth-related pupils must be offset by any available pupil places that are not required by existing pupils of the Boards. These calculations were done for both Boards on a review area basis to determine the total net growth-related pupil places. The analysis projects a total of 13,419 elementary net growth-related pupils and 4,177 secondary net growth-related pupils for the HDSB. For the HCDSB, a total of 5,485 elementary net growth-related pupils were projected while the secondary panel projected a total of 1,942 net growth-related pupil places. Once the net growth-related pupil place requirements have been determined, it is necessary for boards to decide the number of new schools that will be built to accommodate that need. The EDC legislation provides a table which relates pupil place requirements to school site sizes. The table as well as a description and methodology are provided in the Background Study. The Study also provides information on the approximate timing, size and location of the proposed new schools/sites. The EDC analysis for The Region of Halton predicts that the HDSB will require approximately 18 new elementary sites (5 Oakville, 11 Milton, 2 Halton Hills) and 3 new secondary sites (1 Oakville, 2 Milton) in the 15 year EDC time frame. The HCDSB’s EDC analysis projects a need for 10 new elementary sites (3 Oakville, 5 Milton, 2 Halton Hills) and 2 new secondary sites (1 Oakville, 1 Milton).
(iii)
Watson & Associates Economists Ltd. HDSB HCDSB FINAL EDC STUDY
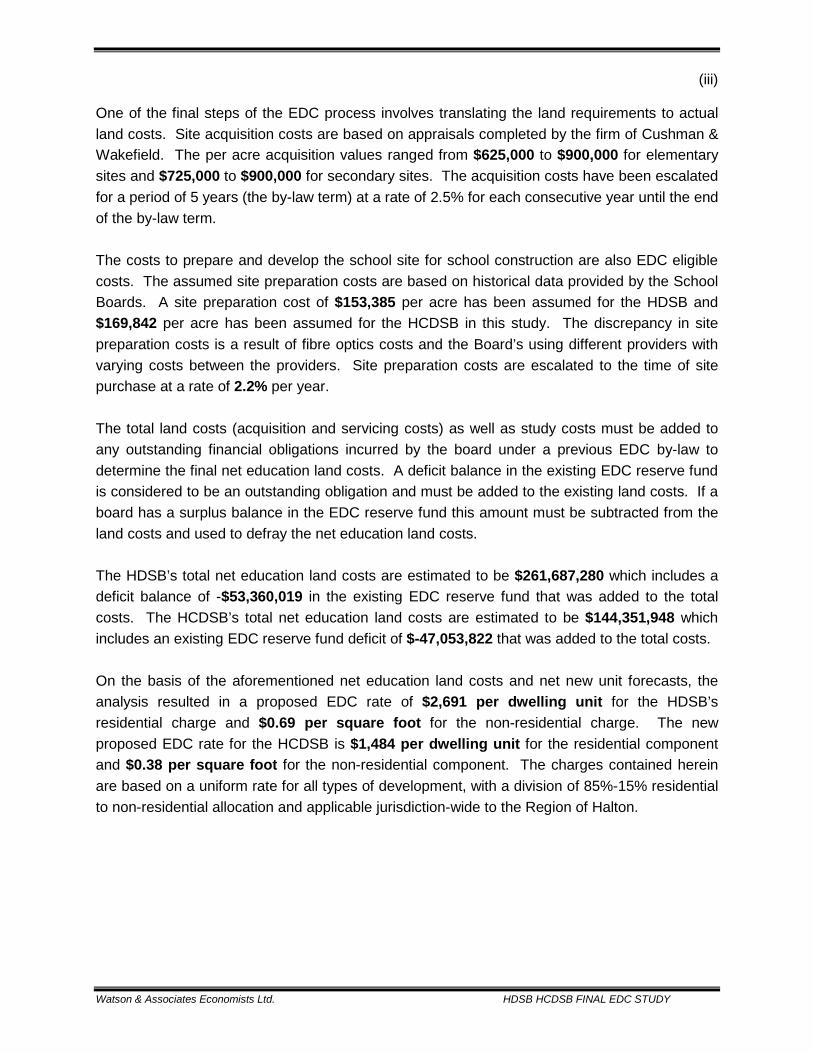
One of the final steps of the EDC process involves translating the land requirements to actual land costs. Site acquisition costs are based on appraisals completed by the firm of Cushman & Wakefield. The per acre acquisition values ranged from $625,000 to $900,000 for elementary sites and $725,000 to $900,000 for secondary sites. The acquisition costs have been escalated for a period of 5 years (the by-law term) at a rate of 2.5% for each consecutive year until the end of the by-law term. The costs to prepare and develop the school site for school construction are also EDC eligible costs. The assumed site preparation costs are based on historical data provided by the School Boards. A site preparation cost of $153,385 per acre has been assumed for the HDSB and $169,842 per acre has been assumed for the HCDSB in this study. The discrepancy in site preparation costs is a result of fibre optics costs and the Board’s using different providers with varying costs between the providers. Site preparation costs are escalated to the time of site purchase at a rate of 2.2% per year. The total land costs (acquisition and servicing costs) as well as study costs must be added to any outstanding financial obligations incurred by the board under a previous EDC by-law to determine the final net education land costs. A deficit balance in the existing EDC reserve fund is considered to be an outstanding obligation and must be added to the existing land costs. If a board has a surplus balance in the EDC reserve fund this amount must be subtracted from the land costs and used to defray the net education land costs. The HDSB’s total net education land costs are estimated to be $261,687,280 which includes a deficit balance of -$53,360,019 in the existing EDC reserve fund that was added to the total costs. The HCDSB’s total net education land costs are estimated to be $144,351,948 which includes an existing EDC reserve fund deficit of $-47,053,822 that was added to the total costs. On the basis of the aforementioned net education land costs and net new unit forecasts, the analysis resulted in a proposed EDC rate of $2,691 per dwelling unit for the HDSB’s residential charge and $0.69 per square foot for the non-residential charge. The new proposed EDC rate for the HCDSB is $1,484 per dwelling unit for the residential component and $0.38 per square foot for the non-residential component. The charges contained herein are based on a uniform rate for all types of development, with a division of 85%-15% residential to non-residential allocation and applicable jurisdiction-wide to the Region of Halton.

Watson & Associates Economists Ltd. HDSB HCDSB FINAL EDC STUDY
1. INTRODUCTION
1-1
Watson & Associates Economists Ltd. HDSB HCDSB FINAL EDC STUDY
1. INTRODUCTION 1.1 Background Education Development Charges (EDCs) are a revenue source, for school boards that qualify, to purchase and develop land for new schools. EDCs are meant as a funding mechanism for boards that are experiencing a growth-related accommodation need in their jurisdiction. In order to qualify for Education Development Charges, it is necessary for school boards to meet certain “triggers”. School boards no longer have the ability to implement property taxes to fund education costs and now rely on a system of per pupil grants established by the Ministry of Education. The grants are set out to cover expenses such as teacher salaries, text books, heating of schools, renewing schools, building schools etc. Education Development Charges are meant to fund the acquisition and development of growth-related school sites outside this grant envelope. Education Development Charges are based on a formulaic approach which looks at three main areas – enrolment projections to determine need, the number of school sites necessary to meet need and the costs related to the purchase and development of those school sites. The EDC may be levied by a school board on both residential and non-residential developments, subject to certain exemptions which are outlined in the legislation. Division E of Part IX of the Education Act is the legislation responsible for governing the EDC. Ontario Regulation 20/98, as amended, provides guidelines and requirements on the qualification process for a school board as well as the specifics on calculating the charge. The charges are collected at building permit issuance on behalf of the school board by the local area municipality in the by-law’s area. As mentioned earlier, not all school boards are eligible to implement EDCs due to qualification triggers that must be met. To qualify there are two triggers that can be met - the Board’s total projected enrolment for the five year period following expected by-law passage must exceed the Board’s Ministry rated On-The-Ground capacity on either the elementary or secondary panel. The other qualification trigger deals with unmet financial obligations with regard to the purchase and development of growth-related school sites. If the school board has an existing EDC by-law in place and they can demonstrate that there are existing outstanding financial obligations, the school board will automatically qualify for a subsequent by-law. The Education Act, specifically Section 257.54, gives school boards the ability to “pass by-laws for the imposition of education development charges” if there is residential land in the jurisdiction of a board that would increase education land costs.
1-2
Watson & Associates Economists Ltd. HDSB HCDSB FINAL EDC STUDY
School Boards are responsible for providing school sites and can do so through such limited revenue sources such as, selling surplus school sites, revenue from leasing sites, entering into joint use agreements with other school boards or public/private partnerships and the imposition of Education Development Charges - thus making EDCs an important revenue source.
1.2 Existing By-laws This EDC Background Study has been prepared on behalf of the Halton District School Board and the Halton Catholic District School Board in consideration of renewing their EDC by-laws in The Region of Halton. Each Board’s current in-force by-laws came into effect in June of 2009 and are based on 85% recovery of costs from residential development and 15% from non-residential development.
CURRENT IN-FORCE EDC BY-LAWS FOR THE HDSB AND THE HCDSB
SCHOOL BOARD
INFORCE DATE
% RESIDENTIAL/NON-RESIDENTIAL
AREA OF BY-LAW CHARGE
($/Dwelling Unit)
HDSB June, 2009 85%(Res) -15%(Non-res) Region of Halton $2,506
HCDSB June, 2009 85%(Res) -15%(Non-res) Region of Halton $1,159
EDC Policy Review It should be noted that all school boards with an existing EDC by-law in place must conduct a review of the policies contained in their existing by-laws before passing a new by-law. This process includes a policy review report as well as a public meeting to review the policies in a public forum. Section 257.60 sub-section (1) of the Education Act states that:
“Before passing an education development charge by-law, the board shall conduct a review of the education development charge policies of the board.”
Sub-section (2) goes on to state that:
“In conducting a review under subsection (1), the board shall ensure that adequate information is made available to the public, and for this purpose shall hold at least one public meeting, notice of which shall be given in at least one newspaper having general circulation in the area of jurisdiction of the board.”
1-3
Watson & Associates Economists Ltd. HDSB HCDSB FINAL EDC STUDY
1.3 Area in Which By-law May Apply The legislation states that an education development charge by-law may apply to the entire area of the jurisdiction of a board or only part of it. In addition, an education development charge by-law of the board shall not apply with respect to land in more than one “region” if the regulations divide the area of the jurisdiction of the board into prescribed regions. Finally, “education development charges collected under an education development charge by-law that applies to land in a region shall not, except with the prior written approval of the Minister, be used in relation to land that is outside that region” and “money from an EDC reserve fund established under section 16(1) of O.Reg 20/98 may be used only for growth-related net education land costs attributed to or resulting from development in the area to which the EDC by-law applies.” EDC background studies should clearly outline the areas that will be covered by EDC by-laws. Four maps have been included on the following pages outlining The Region of Halton, the area to which the EDC by-laws will apply and the respective review areas for each Board and panel respectively.
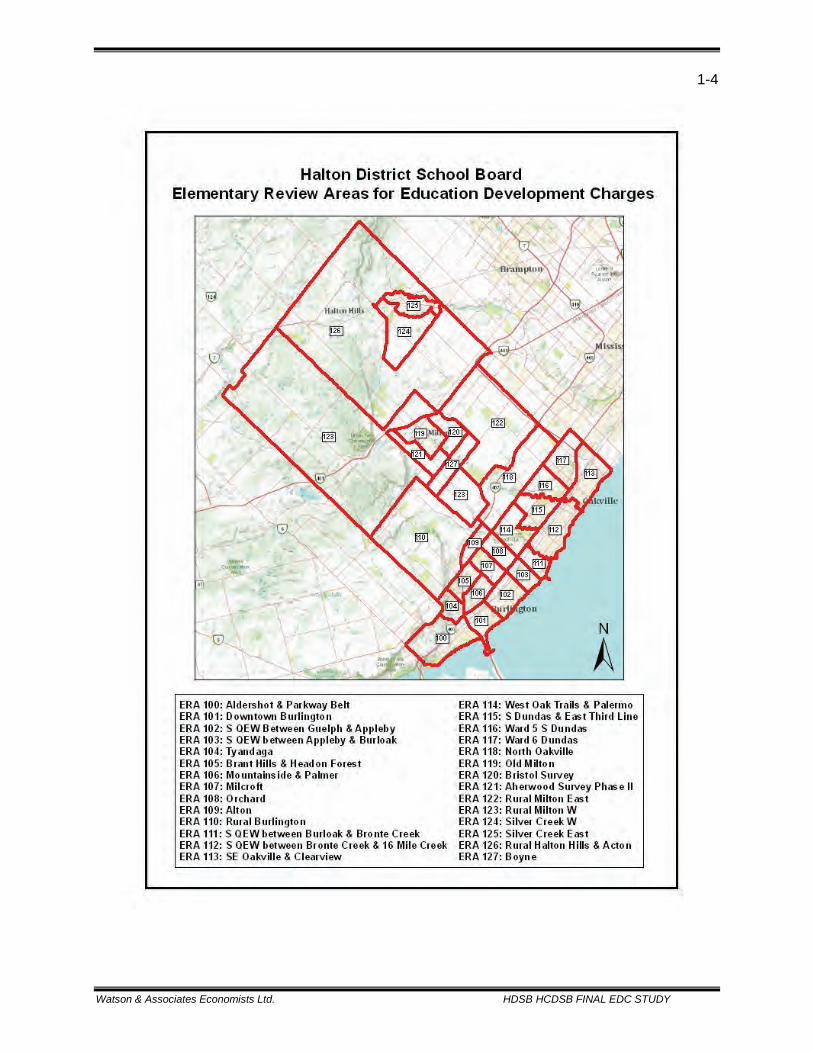
1.4 EDC Review Areas The EDC methodology allows school boards to examine growth-related needs on a jurisdiction wide basis – that is treat the whole EDC area as one review area - or to examine them on a sub area basis or review areas. Review areas are artificial constructs intended to divide the board’s jurisdiction into sub-areas in order to more accurately determine the location of new school sites. Board review areas are likely to reflect attendance boundaries for families of schools, natural dividers such as rivers, creeks etc. or man-made barriers such as major thoroughfares. The Ministry of Education’s EDC Guidelines recommend that review areas are consistent with Board review areas used for capital planning purposes and that they also maintain consistency with review areas of subsequent EDC by-laws.
1-4
Watson & Associates Economists Ltd. HDSB HCDSB FINAL EDC STUDY
1-5
Watson & Associates Economists Ltd. HDSB HCDSB FINAL EDC STUDY
1-6
Watson & Associates Economists Ltd. HDSB HCDSB FINAL EDC STUDY
1-7
Watson & Associates Economists Ltd. HDSB HCDSB FINAL EDC STUDY
1-8
Watson & Associates Economists Ltd. HDSB HCDSB FINAL EDC STUDY
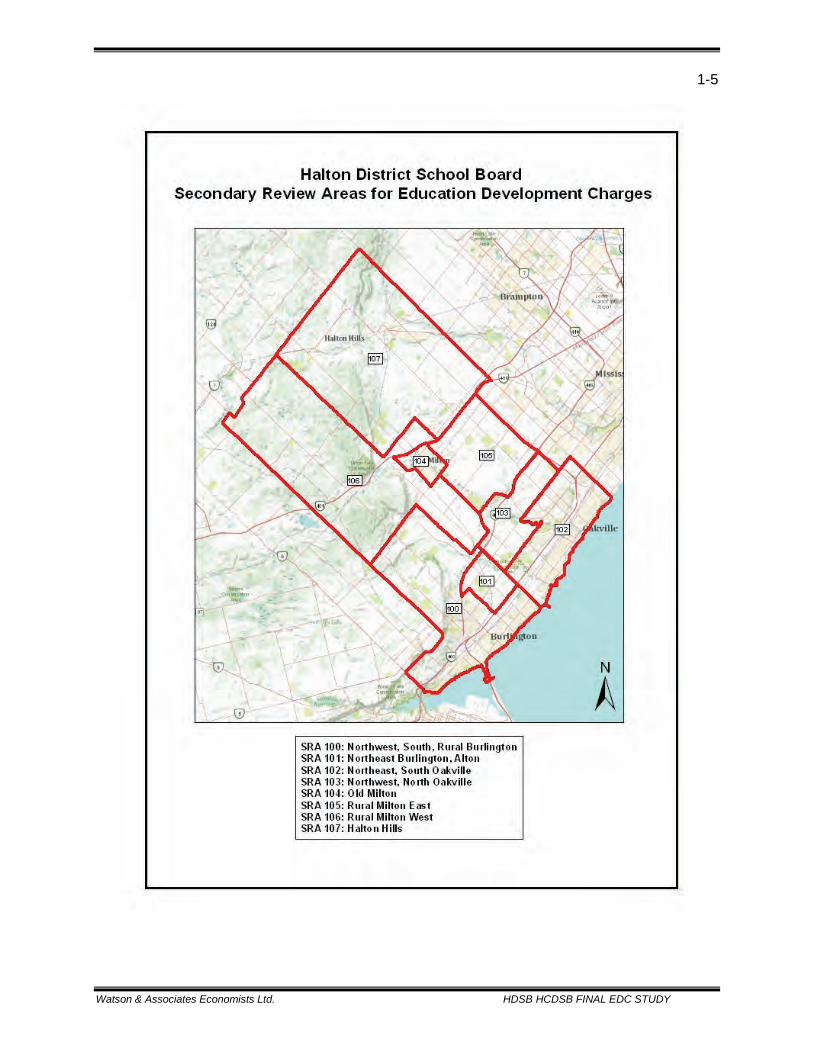
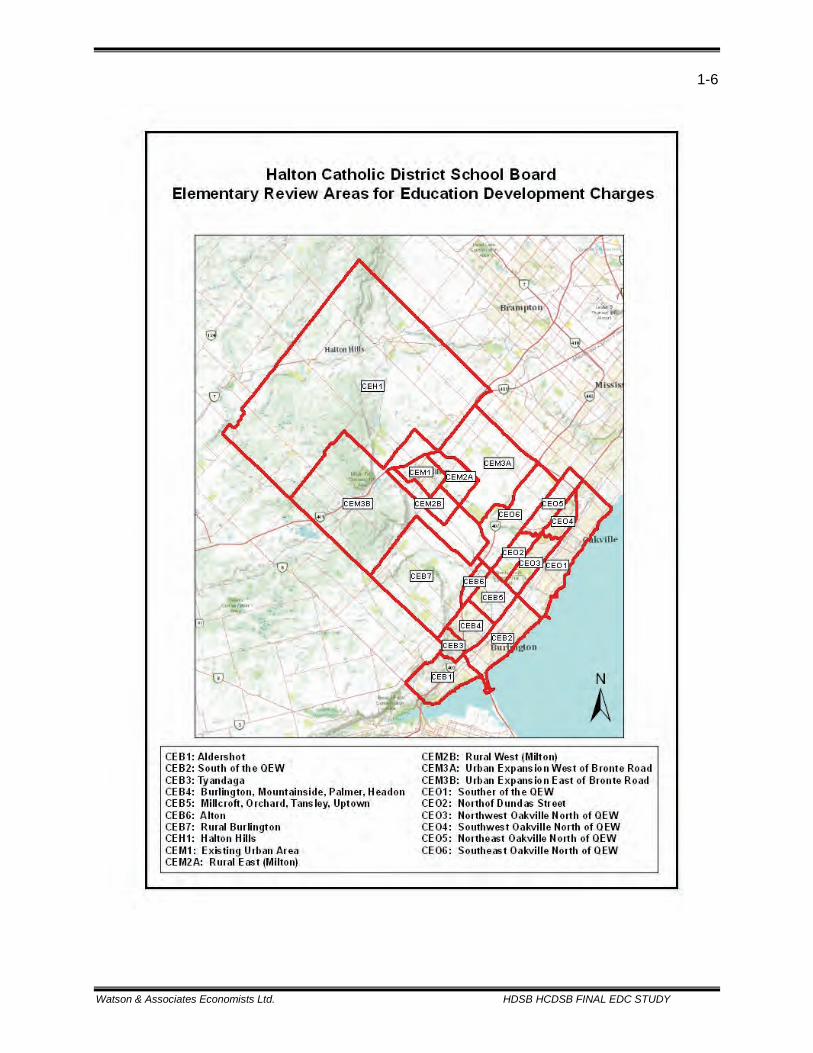
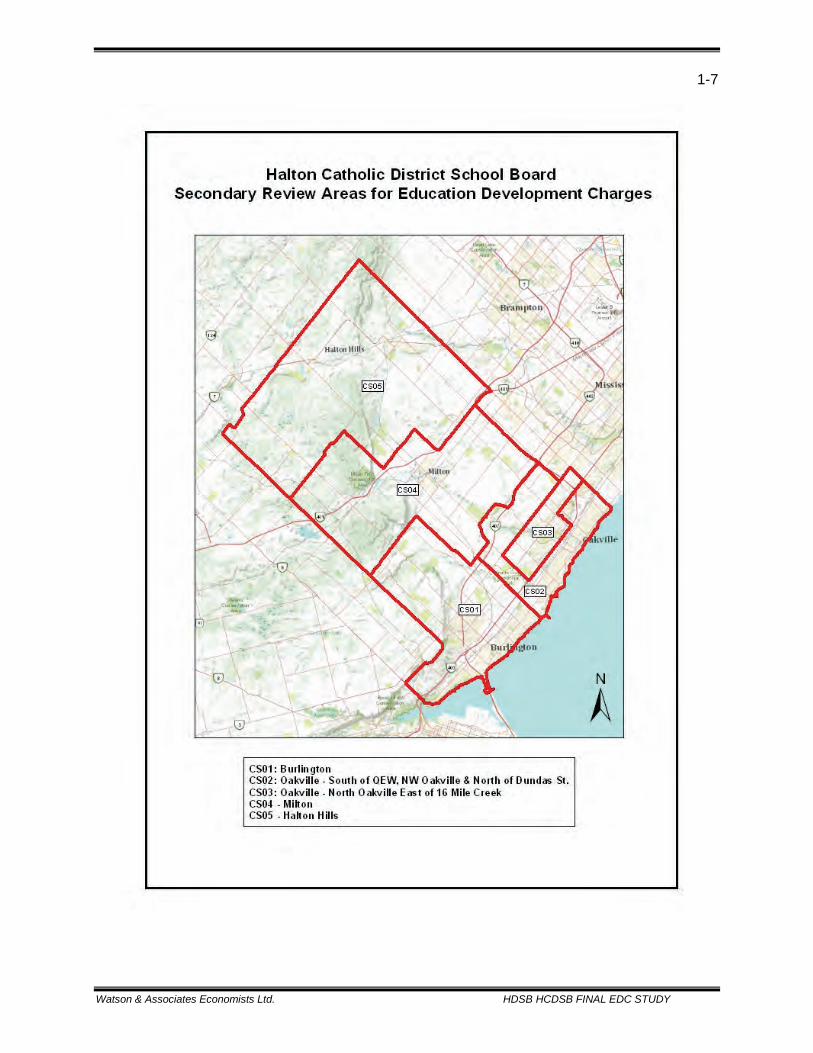
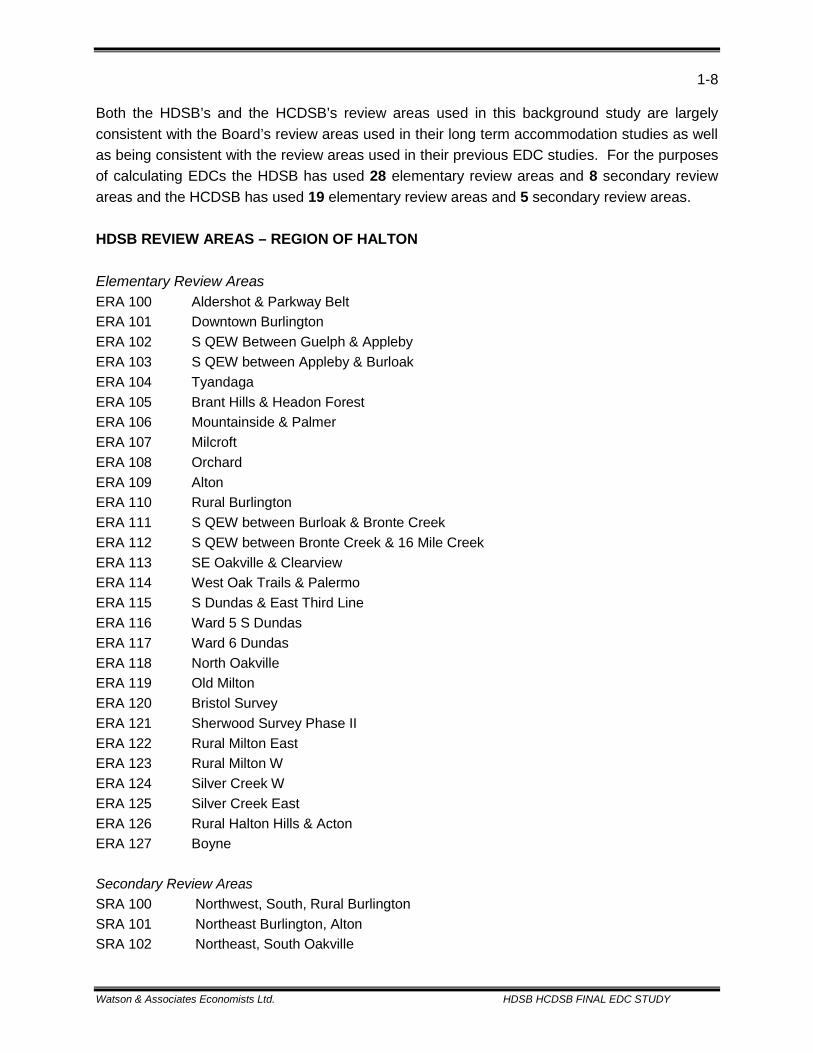
Both the HDSB’s and the HCDSB’s review areas used in this background study are largely consistent with the Board’s review areas used in their long term accommodation studies as well as being consistent with the review areas used in their previous EDC studies. For the purposes of calculating EDCs the HDSB has used 28 elementary review areas and 8 secondary review areas and the HCDSB has used 19 elementary review areas and 5 secondary review areas. HDSB REVIEW AREAS – REGION OF HALTON Elementary Review Areas ERA 100 Aldershot & Parkway Belt ERA 101 Downtown Burlington ERA 102 S QEW Between Guelph & Appleby ERA 103 S QEW between Appleby & Burloak ERA 104 Tyandaga ERA 105 Brant Hills & Headon Forest ERA 106 Mountainside & Palmer ERA 107 Milcroft ERA 108 Orchard ERA 109 Alton ERA 110 Rural Burlington ERA 111 S QEW between Burloak & Bronte Creek ERA 112 S QEW between Bronte Creek & 16 Mile Creek ERA 113 SE Oakville & Clearview ERA 114 West Oak Trails & Palermo ERA 115 S Dundas & East Third Line ERA 116 Ward 5 S Dundas ERA 117 Ward 6 Dundas ERA 118 North Oakville ERA 119 Old Milton ERA 120 Bristol Survey ERA 121 Sherwood Survey Phase II ERA 122 Rural Milton East ERA 123 Rural Milton W ERA 124 Silver Creek W ERA 125 Silver Creek East ERA 126 Rural Halton Hills & Acton ERA 127 Boyne Secondary Review Areas SRA 100 Northwest, South, Rural Burlington SRA 101 Northeast Burlington, Alton SRA 102 Northeast, South Oakville
1-9
Watson & Associates Economists Ltd. HDSB HCDSB FINAL EDC STUDY
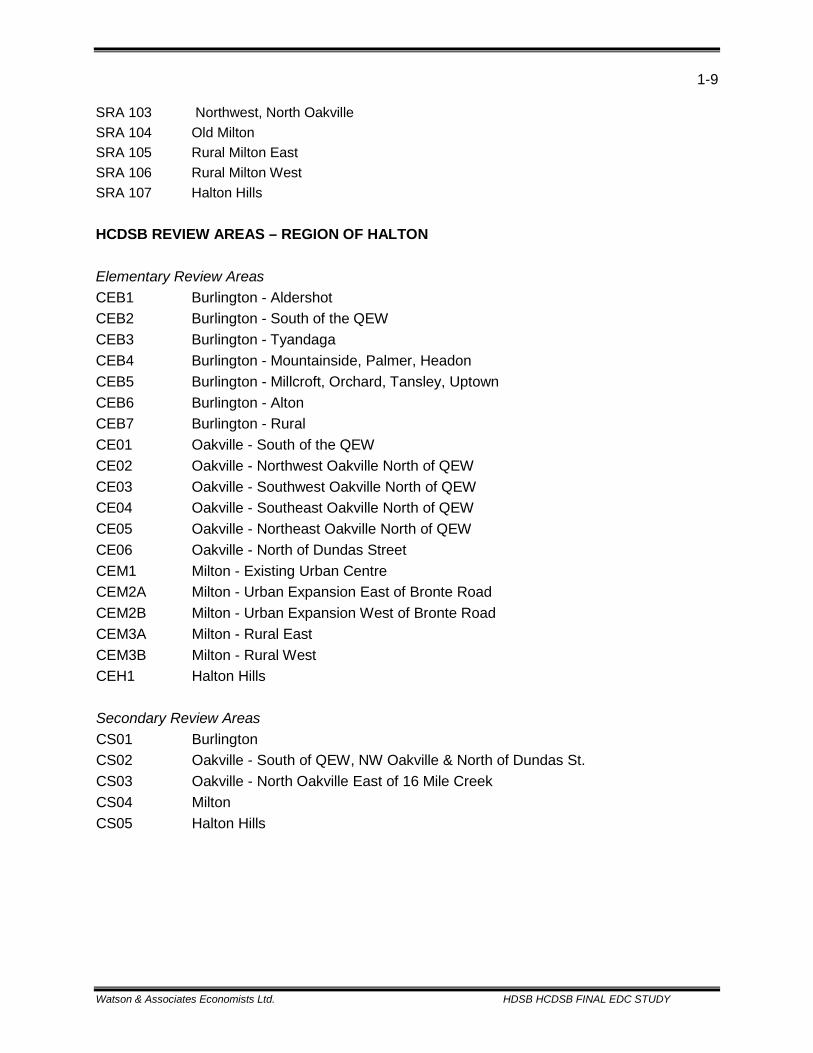
SRA 103 Northwest, North Oakville SRA 104 Old Milton SRA 105 Rural Milton East SRA 106 Rural Milton West SRA 107 Halton Hills HCDSB REVIEW AREAS – REGION OF HALTON Elementary Review Areas CEB1 Burlington - Aldershot CEB2 Burlington - South of the QEW CEB3 Burlington - Tyandaga CEB4 Burlington - Mountainside, Palmer, Headon CEB5 Burlington - Millcroft, Orchard, Tansley, Uptown CEB6 Burlington - Alton CEB7 Burlington - Rural CE01 Oakville - South of the QEW CE02 Oakville - Northwest Oakville North of QEW CE03 Oakville - Southwest Oakville North of QEW CE04 Oakville - Southeast Oakville North of QEW CE05 Oakville - Northeast Oakville North of QEW CE06 Oakville - North of Dundas Street CEM1 Milton - Existing Urban Centre CEM2A Milton - Urban Expansion East of Bronte Road CEM2B Milton - Urban Expansion West of Bronte Road CEM3A Milton - Rural East CEM3B Milton - Rural West CEH1 Halton Hills Secondary Review Areas CS01 Burlington CS02 Oakville - South of QEW, NW Oakville & North of Dundas St. CS03 Oakville - North Oakville East of 16 Mile Creek CS04 Milton CS05 Halton Hills

1-10
Watson & Associates Economists Ltd. HDSB HCDSB FINAL EDC STUDY
The EDC calculation on a review area basis assumes that the total OTG capacity of all existing permanent accommodation within review area is considered to be the total available capacity for instructional purposes and required to meet the needs of the existing community. Determining board needs on a review area basis is premised on:
• Available space is determined by subtracting the year 15 existing community enrolment number from the current OTG capacity figure. For the purposes of this analysis, the OTG capacity was adjusted to account for changes to classroom loading figures to incorporate loading for full day kindergarten.
• Pupils that are generated from new development must fill any available surplus OTG capacity first.
• Pupils generated from new development above and beyond those that fill any available surplus space within the review area, are net growth-related pupil place requirements and can potentially be funded through education development charges.
The review area approach to calculating EDCs has been undertaken by both Boards as it is consistent with the way in which future capital construction needs will be assessed over the long term.
Watson & Associates Economists Ltd. HDSB HCDSB FINAL EDC STUDY
2. THE EDC BY-LAW
2-1
Watson & Associates Economists Ltd. HDSB HCDSB FINAL EDC STUDY
2. THE EDC BY-LAW 2.1 Imposition of an EDC The passage of an Education Development Charge by-law gives school boards the authority to impose and collect EDCs for the purpose of acquiring and developing growth-related school sites. Each by-law has a maximum term of 5 years and must be passed within one year of EDC background study completion. Before a school board can proceed with an EDC by-law it must receive confirmation in writing from the Ministry of Education acknowledging receipt of the background study and approving estimates of enrolment projections and future site needs contained in the background study. Section 10 of Ontario Regulation 20/98, sets out the conditions that must be satisfied in order for a board to pass an education development charge by-law:
• The Minister has approved the Board’s estimates of the total number of elementary and secondary pupils over each of the fifteen years of the forecast period.
• The Minister has approved the Board’s estimates of the number of elementary and secondary school sites used by the Board to determine the net education land costs.
• The Board has prepared a background study and given a copy of the education development charge background study relating to the by-law to the Minister and each Board having jurisdiction within the area to which the by-law would apply.
• The Board has demonstrated that the average elementary or secondary enrolment within its jurisdiction exceeds the board’s elementary or secondary capacity; or the Board’s current EDC financial obligations exceed revenues reported in the EDC reserve fund.
• Hold at least one public meeting. 2.2 The Background Study An Education Development Charge background study must be completed by a school board that wishes to pass an EDC by-law. The intention of the background study is to provide information on the process and methodology of calculating an EDC, as well as the background and assumptions that make up the estimates of the enrolment projections and site needs. Section 257.61 of the legislation requires that “before passing an education development charge by-law, the board shall complete an education development charge background study.” O.Reg 20/98, section 9 (1) sets out the following information that must be included in an EDC background study:
2-2
Watson & Associates Economists Ltd. HDSB HCDSB FINAL EDC STUDY
• Estimates of the number of new dwelling units for each year of the fifteen year forecast period in the area in which the charge is to be imposed.
• The number of projected new pupil places as a result of new growth and the number of new school sites needed to provide accommodation for those students.
• The number of existing pupil places by school and the number of available spaces to accommodate the projected number of new pupil places.
• For every existing elementary and secondary pupil place in the board’s jurisdiction that the board does not intend to use to accommodate pupils from new growth, an explanation as to why the board does not intend to do so.
• For each elementary and secondary school site, estimates of the net education land cost, the location of the site, the area of the site (including the area that exceeds the maximum set out in section 2 of O.Reg 20/98, and an explanation of whether the costs of the excess land are education land costs and if so, why).
• The number of pupil places the board estimates will be provided by the school to be built on the site and the number of those pupil places that the board estimates will be used to accommodate new pupil places.
• A statement of the board’s policy concerning possible arrangements with municipalities, school boards or other persons or bodies in the public or private sector, including arrangements of a long-term or co-operative nature, which would provide accommodation for the new pupils without imposing EDCs, or with a reduction in such charges.
• A statement from the board stating that it has reviewed its operating budget for savings that could be applied to reduce growth-related net education land costs, and the amount of any savings which it proposes to apply, if any.
School Boards are required to provide the Ministry with a copy of the final background study at least 40 days prior to the anticipated by-law passage date. In addition, the background study must be made available to the public at least two weeks prior to the legislated public meeting.
2.3 Public Meetings
Before a school board can pass an EDC by-law, the legislation requires that the Board hold at least one public meeting. The purpose of the meeting is to advise any interested stakeholders and the public at large of the Board’s intentions and address the new proposed EDC by-law. The public meeting also gives the community and stakeholders the opportunity to voice any issues or concerns they have with regard to the proposed by-law. The Board is required to provide at least 20 days notice of the meeting and must make the background study as well as the new proposed by-law available to the public at least two weeks in advance of said meeting. O.Reg 20/98 states that notice of a public meeting can be given in two ways:
2-3
Watson & Associates Economists Ltd. HDSB HCDSB FINAL EDC STUDY
• To every owner of land in the area to which the proposed by-law would apply by personal service, fax or mail.
• By publication in a newspaper that is, in the Secretary of the Board’s opinion, of sufficiently general circulation in the area to which the proposed by-law would apply to give the public reasonable notice of the meeting.
If a school board already has an existing in-force EDC by-law in place, the board must hold an additional meeting to review the existing policies of the current EDC by-law. This part of the process is necessary in order to fulfil the necessary requirements of the policy review process. It should be noted that this policy review meeting can be addressed by the board during its EDC public meeting. The School Boards intend to hold individual public meetings for both the EDC policy review as well as the new proposed EDC by-law. HCDSB will hold their public meeting on Tuesday, May 21st, 2013 and HDSB will hold their public meeting on Wednesday, May 22nd. Both of the Boards will hold these public meetings at their respective Board offices in Burlington. Stakeholder Participation In addition to the legislated public meetings, the Ministry encourages school boards to include relevant stakeholders in the EDC process and discussions. Local developers or development associations, as well as Municipalities should be contacted in advance of the public meetings to ensure they are aware of the proposed EDC and to make light of any potential issues etc. It is essential that stakeholders are part of the process and that the discussions remain transparent at all times to help ensure a smooth passage of the EDC by-law. The HDSB and HCDSB have worked together closely on the preparation of the EDC background study and by-laws to ensure consistency in the included data and assumptions used in the calculation of the charges. Growth forecasts used for the EDC analysis are consistent with the most recent and available Regional forecasts. The School Boards held a joint information session in March, 2013 in advance of their legislated public meetings (May, 2013), to discuss the proposed EDCs with community partners, stakeholders and municipal officials.
2-4
Watson & Associates Economists Ltd. HDSB HCDSB FINAL EDC STUDY
2.4 Exemptions, Expiration, Collection Exemptions The EDC by-law is subject to certain statutory exemptions for both residential and non-residential collection. The exemptions for residential development deal with residential intensification and replacement of units. If a new unit is added to an existing dwelling unit, for example, a single detached unit is converted to a duplex; the additional unit is exempt from EDCs. Section 3 of O.Reg 20/98 sets out the classes of residential buildings and the maximum number of dwelling units that can be added under the exemption. The legislation also allows for exemptions dealing with the replacement of residential units when the unit has been destroyed by fire, demolition or otherwise or has been rendered uninhabitable, subject to certain conditions prescribed under section 4 of O.Reg 20/98. Non-residential statutory exemptions deal similarly with additions/enlargements of space and replacement of existing non-residential space which has been destroyed. A non-residential development that includes the enlargement of existing industrial space, up to 50% of the gross floor area of the existing development, is exempt from EDCs as per section 257.55 of Division E of the Education Act. Replacement of non-residential building space is exempt from EDCs if the existing space was destroyed by fire, demolition or otherwise or has been rendered uninhabitable, subject to certain conditions in section 5 of O.Reg 20/98. In addition to the exemptions mentioned, the legislation allows for a limited non-residential exemption for certain institutional developments. S. 257.54 (5) of the Education Act stipulates that; “No land, except land owned by and used for the purposes of a board or municipality, is exempt from an EDC under a by-law passed under subsection (1) by reason only that it is exempt from taxation under section 3 of the Assessment Act. School boards may also decide to impose their own non-statutory exemptions to certain developments, both residentially and non-residentially. These types of exemptions may be for developments like senior’s housing, social housing or recreational developments. Non-statutory exemptions are entirely at the discretion of the board and any EDC revenues lost as a result cannot be recovered. Expiration A school board can specify any date as the expiration date of the EDC by-law as long as the term of the by-law does not exceed 5 years. The exception to this rule is that the EDC by-law of one school board automatically expires on the same date as an existing by-law of a coterminous
2-5
Watson & Associates Economists Ltd. HDSB HCDSB FINAL EDC STUDY
school board if they are in force in any part of the same area. Section 17 of O.Reg 20/98 prescribes the conditions dealing with this special rule of expiry of by-laws. Collection The EDC is collected by local municipalities on behalf of the school boards at the time a building permit is issued. The funds are deposited into an EDC reserve fund. The Municipality, under the legislation, cannot issue a building permit if the education development charge has not been paid. In addition to collecting the charge and transferring the monies to the school boards, municipalities are also required to provide the boards with detailed reports respecting all EDC transactions (Section 20 of O.Reg 20/98). At a minimum each report should cover the total EDCs that have been collected, the number of building permits issued (or GFA for non-residential), any exemptions granted and any permits that were issued without an EDC being paid. The municipalities do not receive any remuneration for collecting EDCs on behalf of the school boards. However, municipalities are allowed to retain any interest earned on the monthly EDC balances. 2.5 Appeals and Amendments Appeals The Education Development Charge by-law can be appealed by any individual or organization in accordance with the provisions in the Education Act. Sections 257.64 to 257.69 of the Act outline the legislation dealing with the appeal of the EDC by-law. The by-law is subject to appeal for a maximum of 40 days after the by-law has been passed. The school boards must provide a written notice that an EDC by-law has been passed (within 20 days of passage) and this notice must include information on how to file an appeal. An appeal of the EDC by-law goes to the Ontario Municipal Board (OMB) to be decided. All appeals must be filed in writing with the secretary of the school board within the allotted time allowed. The reasons for the appeal must be included in the notice. It is the responsibility of the secretary of the board to forward a copy of the Notice of Appeal to the OMB within 30 days after the last day of the appeal period. In addition to the Notice, the secretary must provide:
• A copy of the by-law certified by the secretary. • A copy of the background study. • An affidavit or declaration certifying that notice of the passing of the by-law was provided
in accordance with the Education Act. • The original or true copy of all written submissions and material relevant to the by-law.
2-6
Watson & Associates Economists Ltd. HDSB HCDSB FINAL EDC STUDY
After hearing an appeal the OMB may decide to:
• Dismiss the appeal in whole or in part. • Order the board to repeal or amend the by-law. • Repeal or amend the by-law itself.
If the by-law is repealed, the EDCs that have already been paid must be refunded. If the by-law is amended and the amended charge is lower than the original charge, the difference must be refunded. All refunds are due within 30 days of the by-law being repealed or amended. While the OMB does have the power to repeal or amend the by-law, they are not able to increase the quantum of the charge, remove or reduce the scope of discretionary exemptions or change the expiration date of the by-law. Amendments The EDC legislation gives school boards the authority to amend their by-laws. Section 257.70 (1) of the Act states; “Subject to subsection (2), a board may pass a by-law amending an education development charge by-law.” There are certain limitations to an EDC amendment, specifically laid out in S257.70 (2) of the Act, “A board may not amend an education development charge by-law so as to any one of the following more than once in the one year period immediately following the coming into force of the by-law or in any succeeding one year period:
• Increase the amount of an EDC. • Remove or reduce the scope of an exemption. • Extend the term of the by-law.
There are a variety of reasons why school boards may feel the need to amend their by-law. School boards may be paying more for school sites than what was estimated in the EDC and may need to increase their land cost assumptions or they may need to change a discretionary exemption. The board does not need Ministry approval to pass an amending by-law, however boards are required to provide proper notice proposing an amendment and of the amendment itself. Boards are also required to ensure that the original EDC background study is available, as well as any additional information that would explain the reason for the amendment. A public meeting is not required to pass an amending by-law, but it is recommended.
Watson & Associates Economists Ltd. HDSB HCDSB FINAL EDC STUDY
3. THE PROCESS AND METHODOLOGY OF CALCULATING
AN EDUCATION DEVELOPMENT CHARGE
3-1
Watson & Associates Economists Ltd. HDSB HCDSB FINAL EDC STUDY
3. THE PROCESS AND METHODOLOGY OF CALCULATING AN EDUCATION DEVELOPMENT CHARGE
The following chapter will outline the procedures and methodologies utilized to calculate the EDC. As mentioned earlier in this report, the EDC calculation is formulaic and technical in nature and encompasses three main components – demographic projections, determination of need (new school sites) and the associated costs.
3.1 Eligibility School Boards must first qualify by meeting certain criteria in order to be eligible to impose EDCs. The first criteria deals with the board’s average projected enrolment compared to its OTG capacity. The second set of criteria, available only to school boards who have an existing in-force by-law, deals with outstanding EDC financial obligations. Capacity Trigger If a school board’s average elementary or secondary enrolment on a jurisdiction wide basis over the five years following proposed by-law passage is greater than the board’s elementary or secondary OTG capacity than it is eligible to impose an EDC. Qualification on either panel allows the Board to impose EDCs throughout its jurisdiction for both elementary and secondary new school sites. Form A of the EDC submission sets out the Board’s projected average daily enrolment over the proposed 5-year term of the EDC by-law (2013 – 2018), as compared to the Board’s OTG capacity on both the elementary and secondary panels. For the purposes of this study, elementary ADE enrolment has been converted to allow for the planned Ministry initiative of full day instruction for JK and SK and as such JK and SK pupils are counted as full time. The Board’s OTG capacity for the EDC is typically based on the Ministry approved permanent capacity according to the School Facilities Inventory System on the proposed date the new by-law is to come into force. However, to account for the aforementioned full day Kindergarten program that has been or is in the process of being implemented at the Board’s schools, capacities were adjusted to reflect the new loading for full day kindergarten classrooms. Additional adjustments may be made to the capacity figure used in the study, in consultation with Ministry staff and for circumstances such as:
• OTG capacity of schools that are transferred from one panel to the other within 12 months of by-law passage may be attributed to the panel the school will be used for after the transfer is complete. Boards’ must have a passed resolution for this to take effect.
3-2
Watson & Associates Economists Ltd. HDSB HCDSB FINAL EDC STUDY
• The capacity of all schools or additions under construction and that are planned for opening within 12 months of the by-law coming into force are to be included in the capacity determination.
• Purpose built space that cannot be reasonably used to accommodate pupils from new growth may be excluded from the permanent capacity determination.
• The capacity of a leased school must be included if the school has a “New Pupil Place” capacity attributed to it. The “New Pupil Place” capacity is the capacity used in the determination of Ministry grants.
• Any schools that have been closed (in accordance with board’s school closure policy) may be excluded from the permanent capacity. In addition, if a school is scheduled to close during the tenure of the by-law (with Board passed resolution) then the capacity may also be excluded.
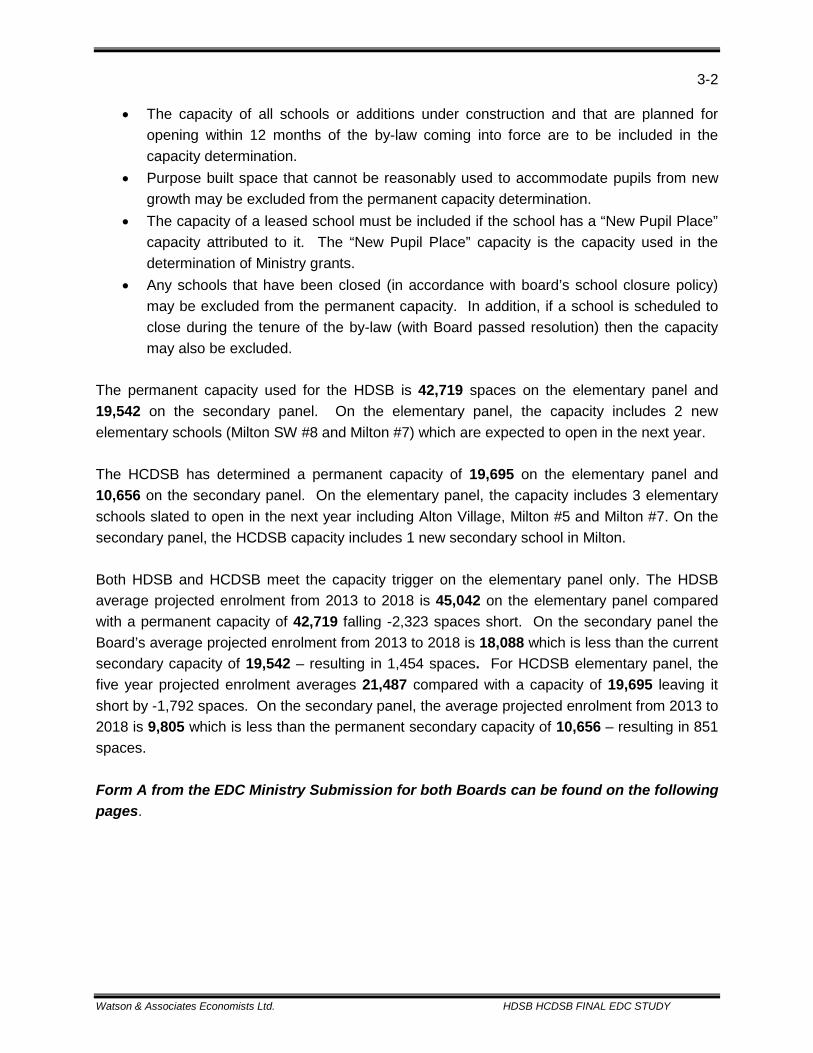
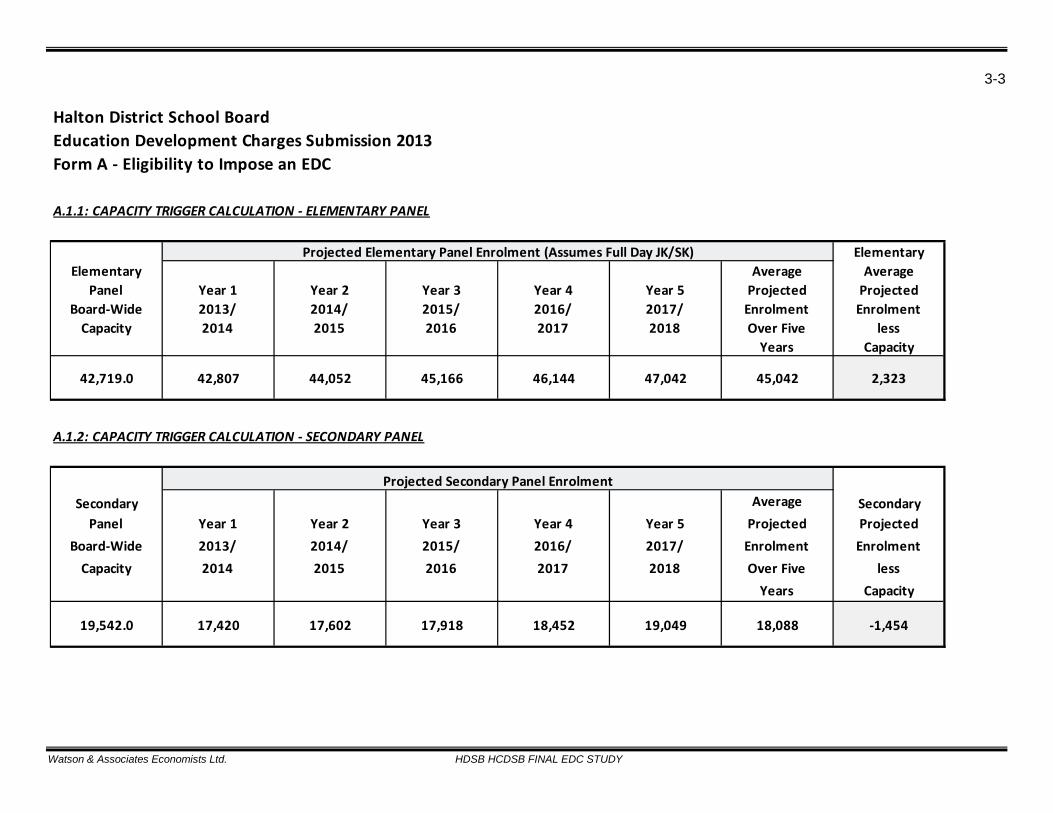
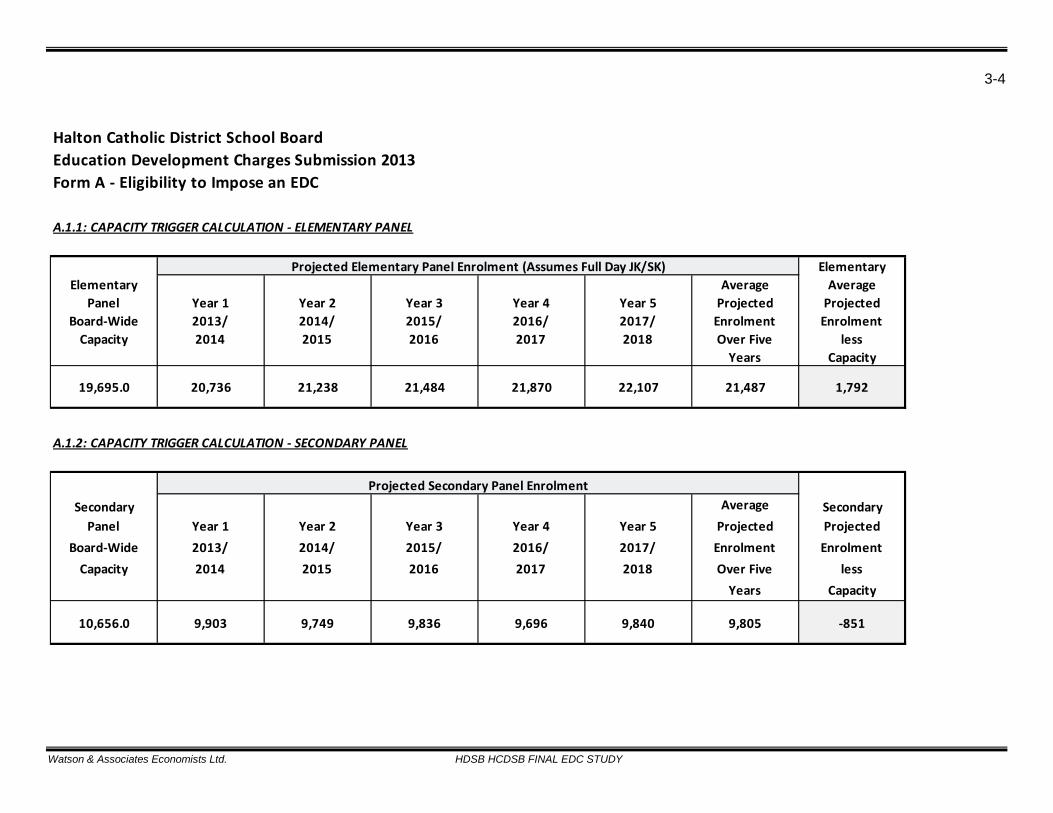
The permanent capacity used for the HDSB is 42,719 spaces on the elementary panel and 19,542 on the secondary panel. On the elementary panel, the capacity includes 2 new elementary schools (Milton SW #8 and Milton #7) which are expected to open in the next year. The HCDSB has determined a permanent capacity of 19,695 on the elementary panel and 10,656 on the secondary panel. On the elementary panel, the capacity includes 3 elementary schools slated to open in the next year including Alton Village, Milton #5 and Milton #7. On the secondary panel, the HCDSB capacity includes 1 new secondary school in Milton. Both HDSB and HCDSB meet the capacity trigger on the elementary panel only. The HDSB average projected enrolment from 2013 to 2018 is 45,042 on the elementary panel compared with a permanent capacity of 42,719 falling -2,323 spaces short. On the secondary panel the Board’s average projected enrolment from 2013 to 2018 is 18,088 which is less than the current secondary capacity of 19,542 – resulting in 1,454 spaces. For HCDSB elementary panel, the five year projected enrolment averages 21,487 compared with a capacity of 19,695 leaving it short by -1,792 spaces. On the secondary panel, the average projected enrolment from 2013 to 2018 is 9,805 which is less than the permanent secondary capacity of 10,656 – resulting in 851 spaces. Form A from the EDC Ministry Submission for both Boards can be found on the following pages.
3-3
Watson & Associates Economists Ltd. HDSB HCDSB FINAL EDC STUDY
Halton District School BoardEducation Development Charges Submission 2013Form A - Eligibility to Impose an EDC
A.1.1: CAPACITY TRIGGER CALCULATION - ELEMENTARY PANEL
ElementaryElementary Average Average
Panel Year 1 Year 2 Year 3 Year 4 Year 5 Projected ProjectedBoard-Wide 2013/ 2014/ 2015/ 2016/ 2017/ Enrolment Enrolment
Capacity 2014 2015 2016 2017 2018 Over Five lessYears Capacity
42,719.0 42,807 44,052 45,166 46,144 47,042 45,042 2,323
A.1.2: CAPACITY TRIGGER CALCULATION - SECONDARY PANEL
Secondary Average SecondaryPanel Year 1 Year 2 Year 3 Year 4 Year 5 Projected Projected
Board-Wide 2013/ 2014/ 2015/ 2016/ 2017/ Enrolment EnrolmentCapacity 2014 2015 2016 2017 2018 Over Five less
Years Capacity
19,542.0 17,420 17,602 17,918 18,452 19,049 18,088 -1,454
Projected Elementary Panel Enrolment (Assumes Full Day JK/SK)
Projected Secondary Panel Enrolment
3-4
Watson & Associates Economists Ltd. HDSB HCDSB FINAL EDC STUDY
Halton Catholic District School BoardEducation Development Charges Submission 2013Form A - Eligibility to Impose an EDC
A.1.1: CAPACITY TRIGGER CALCULATION - ELEMENTARY PANEL
ElementaryElementary Average Average
Panel Year 1 Year 2 Year 3 Year 4 Year 5 Projected ProjectedBoard-Wide 2013/ 2014/ 2015/ 2016/ 2017/ Enrolment Enrolment
Capacity 2014 2015 2016 2017 2018 Over Five lessYears Capacity
19,695.0 20,736 21,238 21,484 21,870 22,107 21,487 1,792
A.1.2: CAPACITY TRIGGER CALCULATION - SECONDARY PANEL
Secondary Average SecondaryPanel Year 1 Year 2 Year 3 Year 4 Year 5 Projected Projected
Board-Wide 2013/ 2014/ 2015/ 2016/ 2017/ Enrolment EnrolmentCapacity 2014 2015 2016 2017 2018 Over Five less
Years Capacity
10,656.0 9,903 9,749 9,836 9,696 9,840 9,805 -851
Projected Elementary Panel Enrolment (Assumes Full Day JK/SK)
Projected Secondary Panel Enrolment
3-5
Watson & Associates Economists Ltd. HDSB HCDSB FINAL EDC STUDY
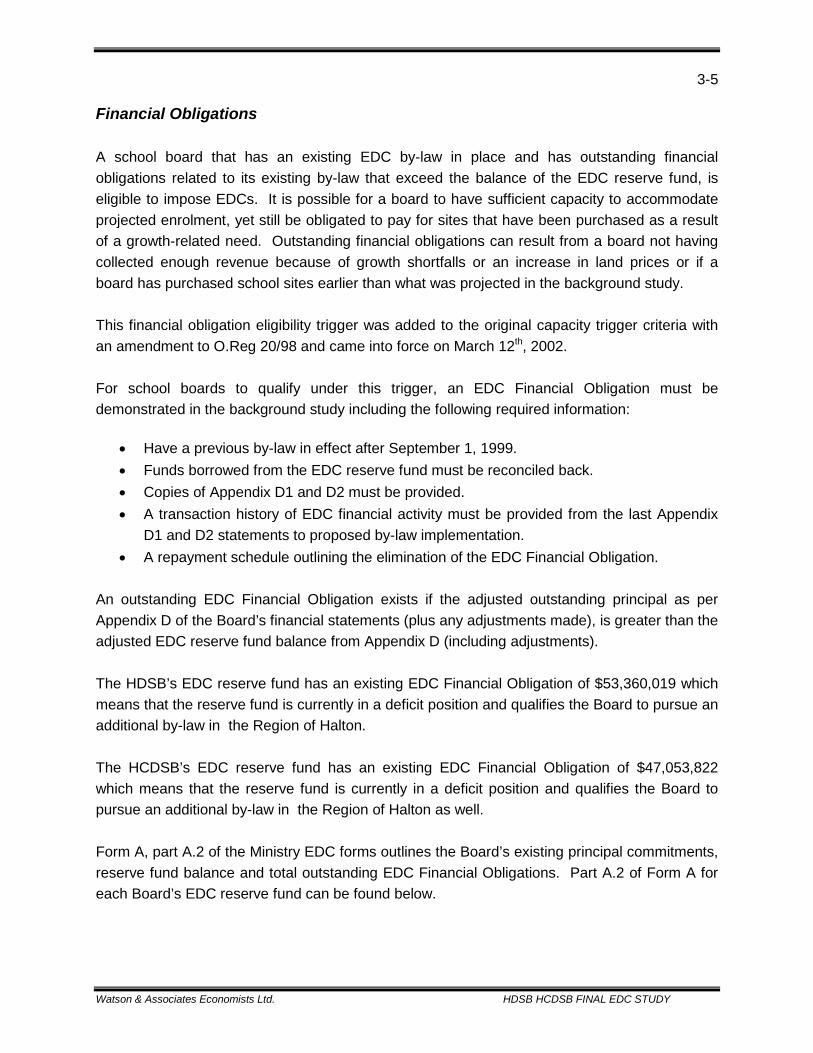
Financial Obligations A school board that has an existing EDC by-law in place and has outstanding financial obligations related to its existing by-law that exceed the balance of the EDC reserve fund, is eligible to impose EDCs. It is possible for a board to have sufficient capacity to accommodate projected enrolment, yet still be obligated to pay for sites that have been purchased as a result of a growth-related need. Outstanding financial obligations can result from a board not having collected enough revenue because of growth shortfalls or an increase in land prices or if a board has purchased school sites earlier than what was projected in the background study. This financial obligation eligibility trigger was added to the original capacity trigger criteria with an amendment to O.Reg 20/98 and came into force on March 12th, 2002. For school boards to qualify under this trigger, an EDC Financial Obligation must be demonstrated in the background study including the following required information:
• Have a previous by-law in effect after September 1, 1999. • Funds borrowed from the EDC reserve fund must be reconciled back. • Copies of Appendix D1 and D2 must be provided. • A transaction history of EDC financial activity must be provided from the last Appendix
D1 and D2 statements to proposed by-law implementation. • A repayment schedule outlining the elimination of the EDC Financial Obligation.
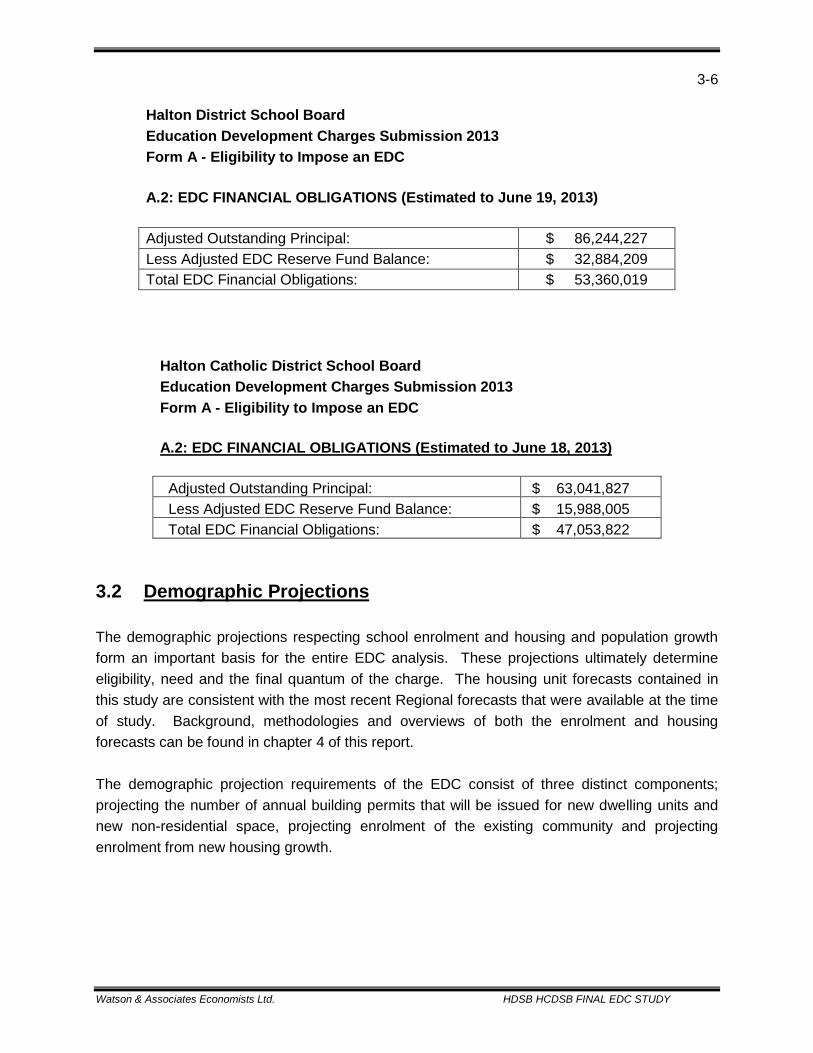
An outstanding EDC Financial Obligation exists if the adjusted outstanding principal as per Appendix D of the Board’s financial statements (plus any adjustments made), is greater than the adjusted EDC reserve fund balance from Appendix D (including adjustments). The HDSB’s EDC reserve fund has an existing EDC Financial Obligation of $53,360,019 which means that the reserve fund is currently in a deficit position and qualifies the Board to pursue an additional by-law in the Region of Halton. The HCDSB’s EDC reserve fund has an existing EDC Financial Obligation of $47,053,822 which means that the reserve fund is currently in a deficit position and qualifies the Board to pursue an additional by-law in the Region of Halton as well. Form A, part A.2 of the Ministry EDC forms outlines the Board’s existing principal commitments, reserve fund balance and total outstanding EDC Financial Obligations. Part A.2 of Form A for each Board’s EDC reserve fund can be found below.
3-6
Watson & Associates Economists Ltd. HDSB HCDSB FINAL EDC STUDY
Halton District School Board Education Development Charges Submission 2013 Form A - Eligibility to Impose an EDC A.2: EDC FINANCIAL OBLIGATIONS (Estimated to June 19, 2013)
Adjusted Outstanding Principal: $ 86,244,227 Less Adjusted EDC Reserve Fund Balance: $ 32,884,209 Total EDC Financial Obligations: $ 53,360,019
Halton Catholic District School Board Education Development Charges Submission 2013 Form A - Eligibility to Impose an EDC
A.2: EDC FINANCIAL OBLIGATIONS (Estimated to June 18, 2013)
Adjusted Outstanding Principal: $ 63,041,827 Less Adjusted EDC Reserve Fund Balance: $ 15,988,005 Total EDC Financial Obligations: $ 47,053,822
3.2 Demographic Projections The demographic projections respecting school enrolment and housing and population growth form an important basis for the entire EDC analysis. These projections ultimately determine eligibility, need and the final quantum of the charge. The housing unit forecasts contained in this study are consistent with the most recent Regional forecasts that were available at the time of study. Background, methodologies and overviews of both the enrolment and housing forecasts can be found in chapter 4 of this report. The demographic projection requirements of the EDC consist of three distinct components; projecting the number of annual building permits that will be issued for new dwelling units and new non-residential space, projecting enrolment of the existing community and projecting enrolment from new housing growth.
3-7
Watson & Associates Economists Ltd. HDSB HCDSB FINAL EDC STUDY
New Dwelling Units/Non-residential Space The number of new dwelling units in the area of the EDC by-law must be estimated for each of the next fifteen years. The forecast is set out by three types of development, low density (single and semi detached homes), medium density (townhouses) and high density (apartments), and is broken down by the School Board review areas that were outlined earlier in this report. The forecast is set out by varying types of development for two reasons. The first is that different types of development produce school aged children in different ways. Lower density developments typically produce greater numbers of school aged children than do apartments. Defining various types of developments allows for greater accuracy when projecting the number of new pupils arising from new developments. The second reason is to be able to calculate a differentiated charge should the Boards choose to do so. Each board has the ability to charge a uniform EDC rate across all types of development – meaning that the EDC is one rate for a single family home or an apartment – or can choose to charge separate rates depending on the type of development. There are certain situations, as defined by the legislation, where certain developments are exempt from EDCs, such as housing intensification. Forecast of net new dwelling units should ensure that these exempt units are factored into any forecast and excluded. In addition to a housing forecast, projections of new non-residential space must also be provided in the EDC study to allow for the calculation of the non-residential component of the charge. A forecast of new non-residential space estimated to be built in the by-law area must be provided for each of the fifteen years following by-law inception. The non-residential forecast can be estimated in two ways; by gross floor area of non-residential space or by the estimated declared value of future non-residential construction. As with the residential component, there are certain statutory exemptions which must be factored into the non-residential forecast to ensure that exempt space is excluded. These exemptions are discussed earlier in the report. Existing Community Projections and Projections of New Pupils The enrolment projections required in order to calculate EDCs must be made up of two distinct projections, one for the existing community and one for pupils from new housing growth. This is done because ultimately the number of total growth-related pupils must be offset by any available pupil places that are not required by pupils of the existing community in year 15 of the forecast. The existing community projection must estimate by school, the number of students for fifteen years based on the number of existing students today and assuming no additional new housing growth. The Board’s total OTG capacity of the review area (as of by-law inception)
3-8
Watson & Associates Economists Ltd. HDSB HCDSB FINAL EDC STUDY
less the projected number of existing community pupils in the review area in year 15, is the Board’s total available space. The determination of pupils from new development is based on the aforementioned housing forecast and the use of pupil yield factors. Pupil yields are mathematical representations of the number of school-aged children that will be generated by a particular dwelling over the planning forecast and that will attend a particular school board. Pupil yields used in this analysis are based on Statistics Canada data and Board historical enrolment information. Multiplying the pupil yield factors by the appropriate type of developments in the net new dwelling forecast determines the projected pupils from new development. To determine the total net growth-related pupil place requirements, the available pupil places (total available space referenced above) must be subtracted from the total pupils projected from new development. Enrolment projections and the determination of net growth-related pupil places can be done on a jurisdiction wide basis or on a review area basis. The EDC analysis in this study is based on a review area approach.
3.3 Site Needs The final “planning” or “forecasting” step in the EDC process is determining the Board’s site needs, specifically the number, location and size of sites for new growth-related schools. The calculation of net growth-related pupil place requirements ultimately determines the number of necessary sites and their size. The regulation governing the EDC provides a table of maximum sizes depending on the number of pupil places that will be constructed. These tables can be found on the following page. While the tables ultimately determine the amount/size of land that will be necessary for new school sites, the legislation also recognizes that there may be situations in which the necessary site for a new school may exceed the size specified in the table. For example a board may need a larger site to accommodate certain municipal requirements or Ministry initiatives. Should a site exceed the legislative requirements, justification must be included in the EDC background study.

3-9
Watson & Associates Economists Ltd. HDSB HCDSB FINAL EDC STUDY
Form G of the Ministry EDC Forms submission provides specific details on each site the Board is proposing to acquire to construct new schools. On a site by site basis, Form G provides information on the general location of the site (by review area or greater detail, if available), the proposed size of the new school, the approximate timing of site purchase as well as the percentage of the site that is considered EDC eligible. The Ministry also recommends that proposed site purchases for new schools are consistent with the Board’s long term accommodation plans.
Elementary Schools
Number of Pupils Maximum Area (acres)
1 to 400 4
401 to 500 5
501 to 600 6
601 to 700 7
701 or more 8
Secondary Schools
Number of Pupils Maximum Area (acres)
1 to 1000 12
1001 to 1100 13
1101 to 1200 14
1201 to 1300 15
1301 to 1400 16
1401 to 1500 17
1501 or more 18
3-10
Watson & Associates Economists Ltd. HDSB HCDSB FINAL EDC STUDY
3.4 Growth-related Net Education Land Costs The planning or forecasting component of the EDC analysis is critical to determining the overall EDC eligible needs of the Boards. To finalize the calculation process of the EDC, these accommodation needs must be translated into financial requirements. The analysis in the previous section determined the total growth-related pupil needs as well as the amount of land (in acres) that will be required to accommodate those pupils. EDC eligible expenses are determined by attaching costs to acquire and service the land needed. Land acquisition costs have been determined by qualified appraisers and the methodologies used as well as relevant data can be found in chapter 5 of this report. Servicing costs are based on historical costs provided by the School Boards with respect to sites that have been recently developed. Once costs for each site have been finalized, the next step is to determine the percentage of each site that is EDC eligible. This is based on the percentage of net growth-related students that make up the total capacity of the proposed new school. For example, if the new proposed school had a capacity of 450 and 400 of the spaces were accounted for by new growth-related pupils then the site would be 88.88% eligible for EDCs (400/450=88.88%). In addition to site acquisition and servicing costs there are other EDC eligible expenses that can be included in the analysis. Examples of other EDC eligible costs are:
• Interest and borrowing costs related to site acquisition. • Land escalation costs. • Costs related to the preparation and distribution of EDC background studies. • Costs related to studies of land being considered for acquisition (environmental
assessments). • Costs to service/prepare land for construction (grading, service lines etc.)
Outstanding Financial Obligations In addition to the costs that have been outlined above, any outstanding financial obligations from previous by-laws are also eligible education land costs. A negative balance in the Board’s EDC reserve fund, established for the area to which the proposed by-law will apply, is considered as an outstanding financial obligation and can be added to the total net education land costs. It should be noted that if the board has a positive balance in the EDC reserve fund, these funds must be used to defray any EDC eligible expenditures. The total eligible costs are referred to as the total growth-related net education land costs.
3-11
Watson & Associates Economists Ltd. HDSB HCDSB FINAL EDC STUDY
3.5 Determination of the Charge Once the total growth-related net education land costs have been determined there are certain prescribed steps that must be followed to determine the actual quantum of the EDC. As discussed in chapter 2, the legislation allows school boards to determine the type of EDC it will impose. Boards can impose EDCs on residential or non-residential developments and can also charge a uniform rate for all types of developments or can differentiate the rate based on dwelling unit types. Apportionment of Land Costs The legislation allows school boards to allocate up to 40% of their education land costs to non-residential development. If a school board had a non-residential component to their EDCs then the land costs would be multiplied by whatever percentage the board deemed to be apportioned to non-residential. For example, if the total land costs were estimated to be $1 million and the non-residential allocation was 10% then the non-residential growth-related net education land costs would total $100,000. The remaining balance would make up the residential growth-related net education land costs. To determine the residential charge (assuming a uniform charge) the total residential growth-related net education land costs are divided over the projected number of net new dwelling units assumed in the EDC forecast over the next fifteen years. The result is the amount of the uniform residential EDC per dwelling unit. If charges are to be imposed on non-residential development there are two ways in which they can be calculated. If the board chooses to use a non-residential forecast of gross floor area, then the total non-residential growth-related net education land costs are divided by the estimated gross floor area of proposed non-residential developments. The board can also choose to use a non-residential forecast of estimated declared values where the non-residential land costs are divided by the projected declared values and multiplied by 100 to get a non-residential charge. Once the residential charge is determined it can be charged uniformly across all types of development or different rates can be charged depending on the types of units being built. If the EDC is applied in a uniform manner then the total residential land costs are simply divided over the estimated net new dwelling units as described earlier. If the board chooses to impose a differentiated EDC then the charges are apportioned on the basis of different unit types producing different amounts of pupils. Boards may choose to define developments as they wish (i.e. low density, high density, condos, apartments, single family etc.) but are encouraged to stay as consistent as possible with categories used by the Municipalities impacted by the by-law.
3-12
Watson & Associates Economists Ltd. HDSB HCDSB FINAL EDC STUDY
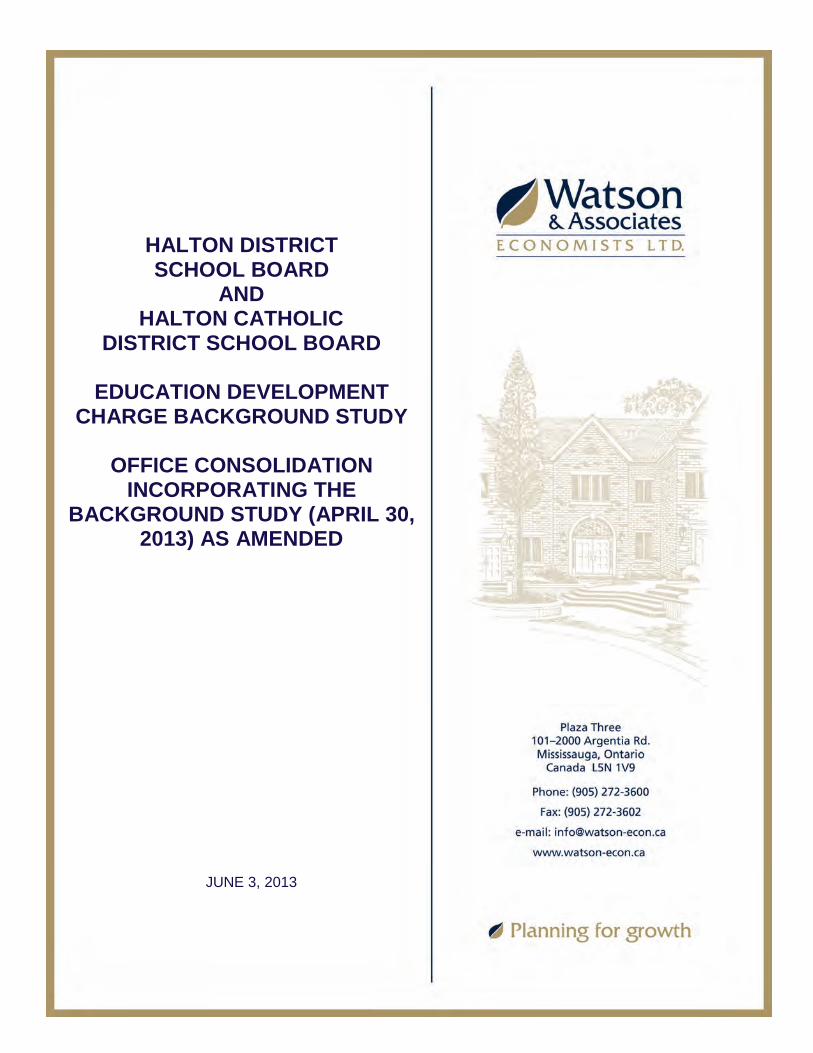
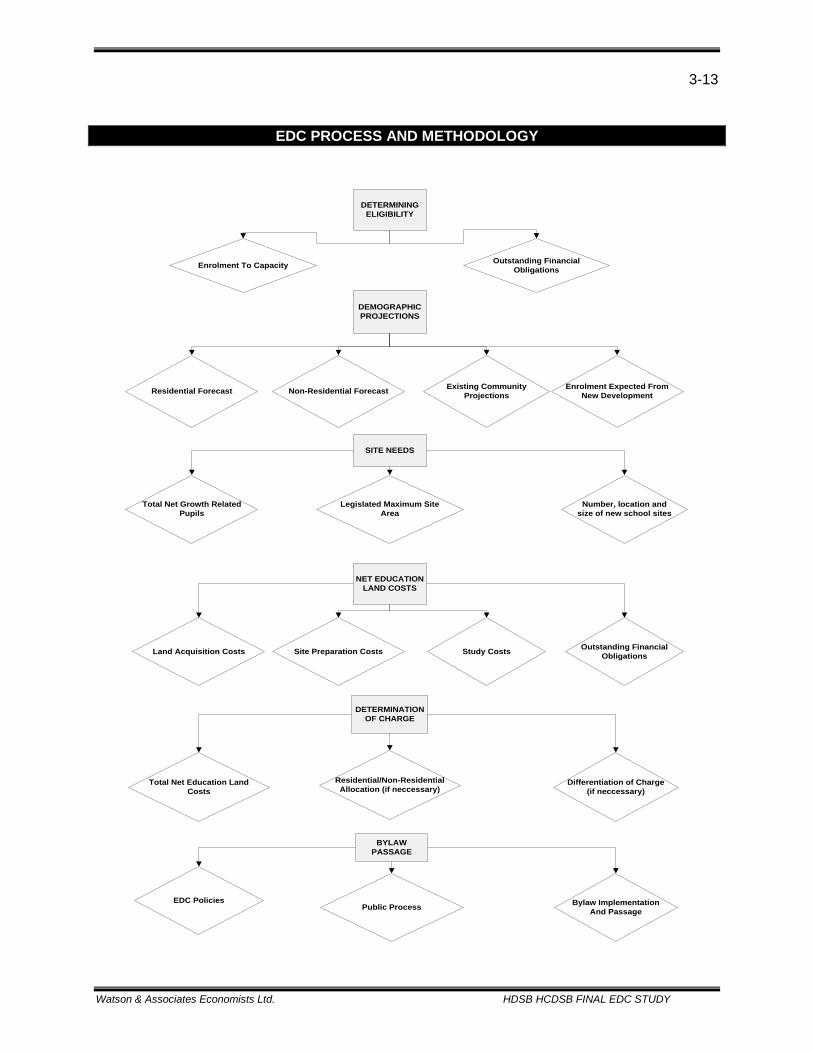
A distribution factor is determined by the distribution of growth-related pupils amongst the various unit types defined by the board. For example, if 100 students were from low density developments, 50 from medium density and 10 from high, the distribution factors would be 62.5% for low (100/160), 31.25% for medium and 6.25% for high. These distribution factors are then multiplied by the total residential land costs to determine the apportioned residential land costs by development type. Each separate amount is then divided by the number of net new units for the particular development type to arrive at the differentiated residential EDC per unit by development type. 3.6 Policy Statements In addition to the demographic forecasting and financial components of the EDC analysis, there is also an important policy component. EDC policies are largely determined by the School Boards and help shape the type of by-law that will be imposed. Examples of some important EDC policies are the apportionment of land costs across residential and non-residential development or an area specific versus a jurisdiction wide by-law. There are two specific policies that the legislation requires the boards to produce policy statements for and that must be included in the EDC background study. The first policy that a statement must be provided for is the alternative accommodation arrangement policy. The statement must include information on the board’s policy with regard to how it deals with alternative accommodation arrangements to provide pupil accommodation and how it could reduce or eliminate the need for EDCs. If the board has had a previous by-law then information respecting how alternative accommodation arrangements were implemented (or not implemented) must also be provided. The second policy statement deals with the policy on operating budget surpluses. The EDC must include a board policy that states if savings are achieved in the operating budget they must be used to defray any eligible EDC expenditures. The statement included in the background study must state that the board has reviewed its current operating budget for potential savings that could be applied to the EDC. The statement must also include the amount of potential savings that would be applied to the EDC, if any. Both of the statements can be found with the Board policies in Appendix C of this document. A flow chart detailing the EDC process can be found on the following page. In addition, the Ministry EDC Forms, which detail the calculations required to determine the EDC can be found in Appendix A at the end of this report.
3-13
Watson & Associates Economists Ltd. HDSB HCDSB FINAL EDC STUDY
EDC PROCESS AND METHODOLOGY
DETERMINING ELIGIBILITY
Enrolment To Capacity Outstanding Financial Obligations
DEMOGRAPHIC PROJECTIONS
SITE NEEDS
Total Net Growth Related Pupils
Legislated Maximum Site Area
Number, location and size of new school sites
NET EDUCATION LAND COSTS
Land Acquisition Costs Outstanding Financial ObligationsSite Preparation Costs Study Costs
DETERMINATION OF CHARGE
Residential Forecast Enrolment Expected From New DevelopmentNon-Residential Forecast Existing Community
Projections
Total Net Education Land Costs
Residential/Non-Residential Allocation (if neccessary)
Differentiation of Charge (if neccessary)
BYLAW PASSAGE
EDC PoliciesPublic Process Bylaw Implementation
And Passage
Watson & Associates Economists Ltd. HDSB HCDSB FINAL EDC STUDY
4. DEMOGRAPHIC PROJECTIONS
4-1
Watson & Associates Economists Ltd. HDSB HCDSB FINAL EDC STUDY
4. DEMOGRAPHIC PROJECTIONS As mentioned earlier in the report, the demographic projections form the backbone of the EDC analysis, in that they are used to determine eligibility, need and ultimately the quantum of the charge itself. The demographic projections for an EDC consist of both forecasts of new housing development as well as projections of school enrolment. Projections of both new housing and enrolment must be provided on an annual basis for a 15 year period following by-law imposition. The following chapter provides the methodology and background to the demographic projections as well as the results of those projections. 4.1 The Residential and Non-residential Growth Forecast Residential The residential growth forecast for the EDC is critical to the analysis because of the direct link between new homes and new pupils for the school boards. In addition to determining a board’s needs, the number of net new projected units in the forecast is what the total net education land costs get divided by to determine the final quantum of the residential charge. The dwelling unit forecast contained in this study provides a projection of the number of units on an annual basis for the next 15 years by low (single/semis), medium (townhouses) and high (apartments) density allocations. O.Reg 20/98, S.7(2) states that the board must, “estimate the number of new dwelling units in the area in which charges are to be imposed for each of the 15 years immediately following the day the by-law comes into force.” Housing development and occupancy patterns have changed significantly over the last decade. Housing developments are offering more choice in terms of density, like singles, townhomes apartments as well as developments that cater to specific lifestyles or age groups (retirement residences). The new Places To Grow initiative by the Provincial government mandates that future developments will have more units on less land, increasing the likelihood of more urban type developments and infilling projects in the future. The combination of new initiatives, societal shifts in housing and the recent downturn in the economy have posed a set of unique challenges for municipalities in the area to develop long term population and housing projections. The development projections contained in this study are based on the Region’s Best Planning Estimates (BPE), available at the time the study was being prepared. This ensures consistency with local and upper tier governments and other agencies. The forecast information may be supplanted with other relevant data garnered from historical building permit issuance, small area development plans and prior conversations/meetings with local planning departments.
4-2
Watson & Associates Economists Ltd. HDSB HCDSB FINAL EDC STUDY
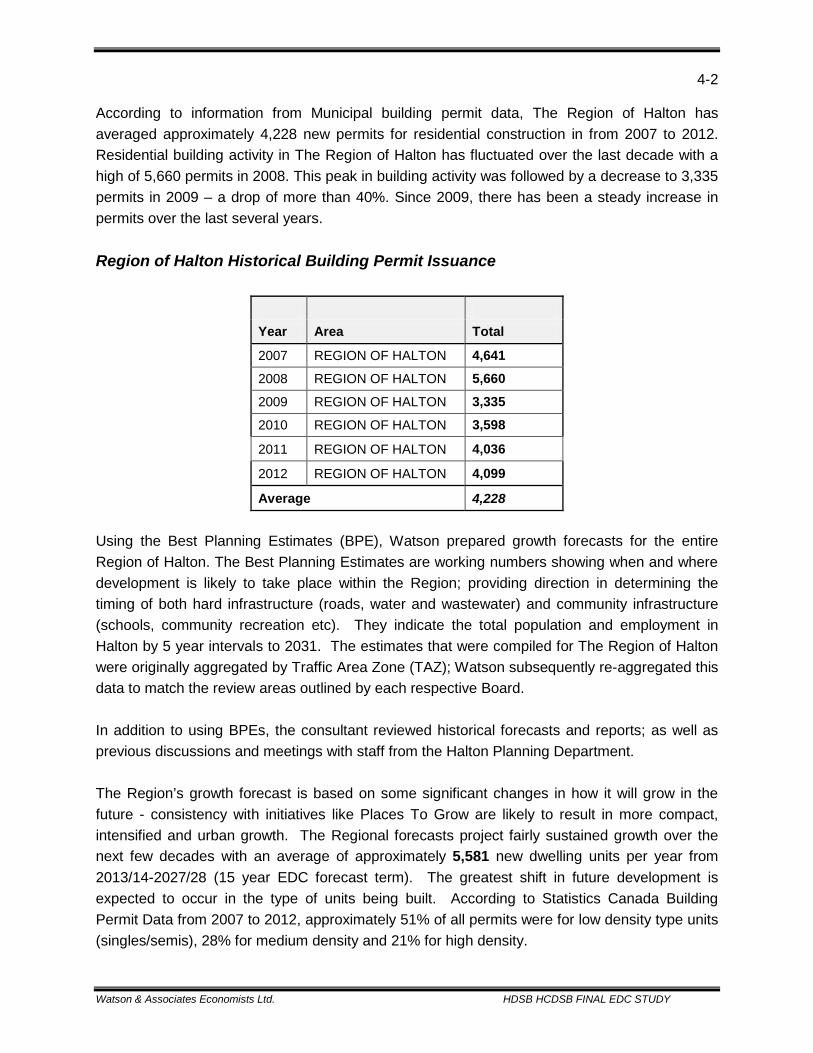
According to information from Municipal building permit data, The Region of Halton has averaged approximately 4,228 new permits for residential construction in from 2007 to 2012. Residential building activity in The Region of Halton has fluctuated over the last decade with a high of 5,660 permits in 2008. This peak in building activity was followed by a decrease to 3,335 permits in 2009 – a drop of more than 40%. Since 2009, there has been a steady increase in permits over the last several years. Region of Halton Historical Building Permit Issuance
Year Area Total
2007 REGION OF HALTON 4,641
2008 REGION OF HALTON 5,660
2009 REGION OF HALTON 3,335
2010 REGION OF HALTON 3,598
2011 REGION OF HALTON 4,036
2012 REGION OF HALTON 4,099
Average 4,228 Using the Best Planning Estimates (BPE), Watson prepared growth forecasts for the entire Region of Halton. The Best Planning Estimates are working numbers showing when and where development is likely to take place within the Region; providing direction in determining the timing of both hard infrastructure (roads, water and wastewater) and community infrastructure (schools, community recreation etc). They indicate the total population and employment in Halton by 5 year intervals to 2031. The estimates that were compiled for The Region of Halton were originally aggregated by Traffic Area Zone (TAZ); Watson subsequently re-aggregated this data to match the review areas outlined by each respective Board. In addition to using BPEs, the consultant reviewed historical forecasts and reports; as well as previous discussions and meetings with staff from the Halton Planning Department. The Region’s growth forecast is based on some significant changes in how it will grow in the future - consistency with initiatives like Places To Grow are likely to result in more compact, intensified and urban growth. The Regional forecasts project fairly sustained growth over the next few decades with an average of approximately 5,581 new dwelling units per year from 2013/14-2027/28 (15 year EDC forecast term). The greatest shift in future development is expected to occur in the type of units being built. According to Statistics Canada Building Permit Data from 2007 to 2012, approximately 51% of all permits were for low density type units (singles/semis), 28% for medium density and 21% for high density.

4-3
Watson & Associates Economists Ltd. HDSB HCDSB FINAL EDC STUDY
REGION OF HALTON
2013/14-2027/28
# Of Units % By Density
Low (Single/Semi) 37, 725 45%
Medium (Townhouses) 17, 980 21%
High (Apartments) 28, 014 34%
Total 83, 718 100%
As noted earlier the final growth forecast for the Halton EDC by-law for both the HDSB and the HCDSB is based on the aforementioned data and totals 83,718 new units that are forecast to be built over the next 15 years. Of these new units, 45% are estimated to be low density, 21% medium density and 34% high density. While the forecast averages 5,581 units for the 15 year EDC term, it is expected that the first 5 years of the forecast will average 5,585 units per year, between years 5 and 10 the forecast is expected to average 5,715 and between years 10 and 15 the forecast is expected to average 5,444. In order to account for intensification of units, which are exempt from EDCs, an adjustment to the projections was made to derive the “net” new units housing forecast. This adjustment is intended to estimate the number of units in the forecast that will be created by intensification – transforming an existing single family home into duplex/apartment type units. The overall forecast was reduced by approximately 1.3% to estimate the number of exempt units and resulted in a projection of 82,659 net new units. Non-residential The non-residential growth forecast provides a basis for calculating a non-residential EDC, should boards elect to impose such a charge. O.Reg 20/98, s.7(10) states that, “If charges are to be imposed on non-residential development, the Board shall determine the charges and the charges shall be expressed as either: a rate applied to the gross floor area (GFA) of a new development or a rate applied to the declared value of development.” The non-residential forecasts contained in this report are projections of GFA and have been derived from the same sources as the residential forecasts. The non-residential forecast for the Region of Halton totals 75,403,985 square feet of GFA over the next 15 years. As with the residential forecast, assumptions must be made respecting certain exemptions of GFA. Industrial additions (up to 50% of existing floor area) and certain institutional properties (municipal and school board properties) are exempt under the legislation. Utilizing historical Statistics Canada data on non-residential construction by type, 18,501,226 square feet were exempted from this forecast and the total “net” new non-residential forecast totals 56,902,759 square feet of GFA.
4-4
Watson & Associates Economists Ltd. HDSB HCDSB FINAL EDC STUDY
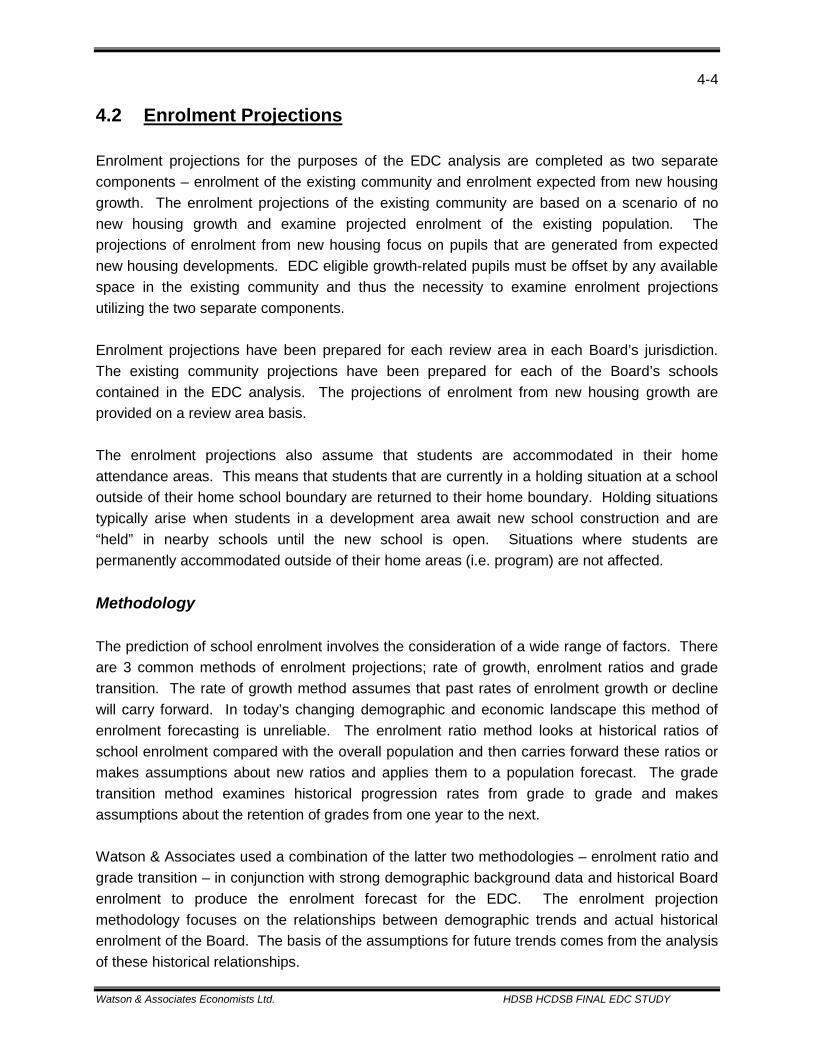
4.2 Enrolment Projections Enrolment projections for the purposes of the EDC analysis are completed as two separate components – enrolment of the existing community and enrolment expected from new housing growth. The enrolment projections of the existing community are based on a scenario of no new housing growth and examine projected enrolment of the existing population. The projections of enrolment from new housing focus on pupils that are generated from expected new housing developments. EDC eligible growth-related pupils must be offset by any available space in the existing community and thus the necessity to examine enrolment projections utilizing the two separate components. Enrolment projections have been prepared for each review area in each Board’s jurisdiction. The existing community projections have been prepared for each of the Board’s schools contained in the EDC analysis. The projections of enrolment from new housing growth are provided on a review area basis. The enrolment projections also assume that students are accommodated in their home attendance areas. This means that students that are currently in a holding situation at a school outside of their home school boundary are returned to their home boundary. Holding situations typically arise when students in a development area await new school construction and are “held” in nearby schools until the new school is open. Situations where students are permanently accommodated outside of their home areas (i.e. program) are not affected. Methodology The prediction of school enrolment involves the consideration of a wide range of factors. There are 3 common methods of enrolment projections; rate of growth, enrolment ratios and grade transition. The rate of growth method assumes that past rates of enrolment growth or decline will carry forward. In today’s changing demographic and economic landscape this method of enrolment forecasting is unreliable. The enrolment ratio method looks at historical ratios of school enrolment compared with the overall population and then carries forward these ratios or makes assumptions about new ratios and applies them to a population forecast. The grade transition method examines historical progression rates from grade to grade and makes assumptions about the retention of grades from one year to the next. Watson & Associates used a combination of the latter two methodologies – enrolment ratio and grade transition – in conjunction with strong demographic background data and historical Board enrolment to produce the enrolment forecast for the EDC. The enrolment projection methodology focuses on the relationships between demographic trends and actual historical enrolment of the Board. The basis of the assumptions for future trends comes from the analysis of these historical relationships.
4-5
Watson & Associates Economists Ltd. HDSB HCDSB FINAL EDC STUDY
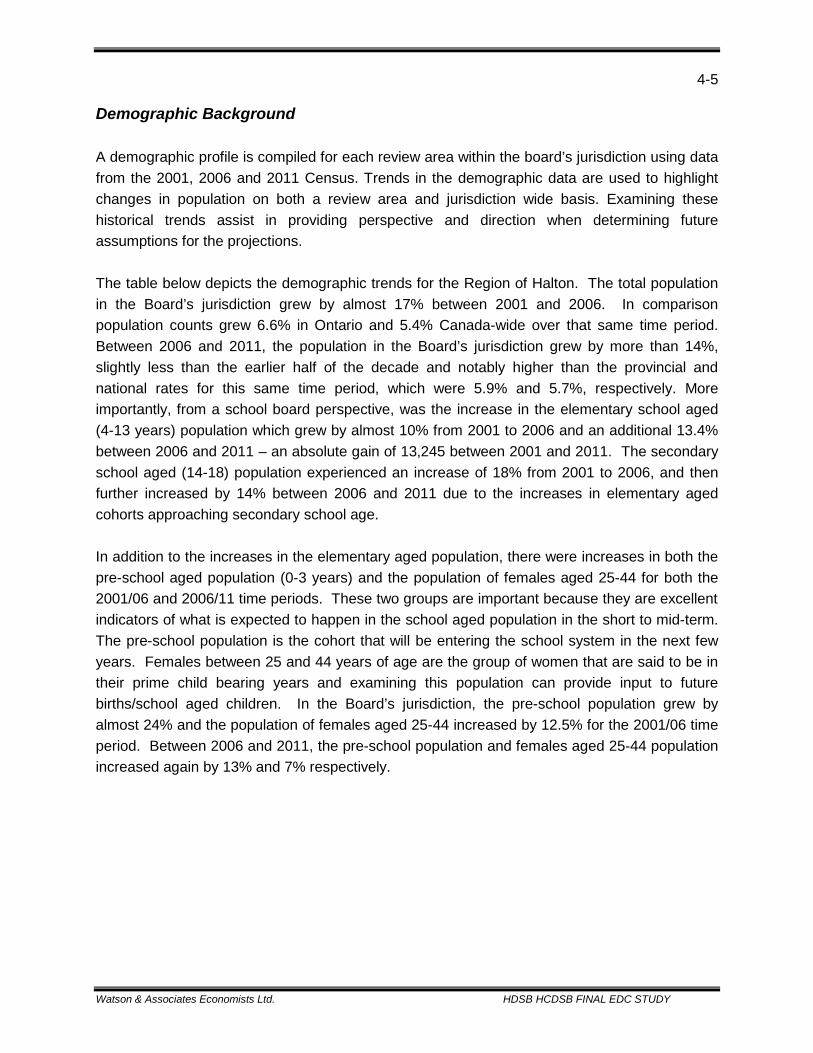
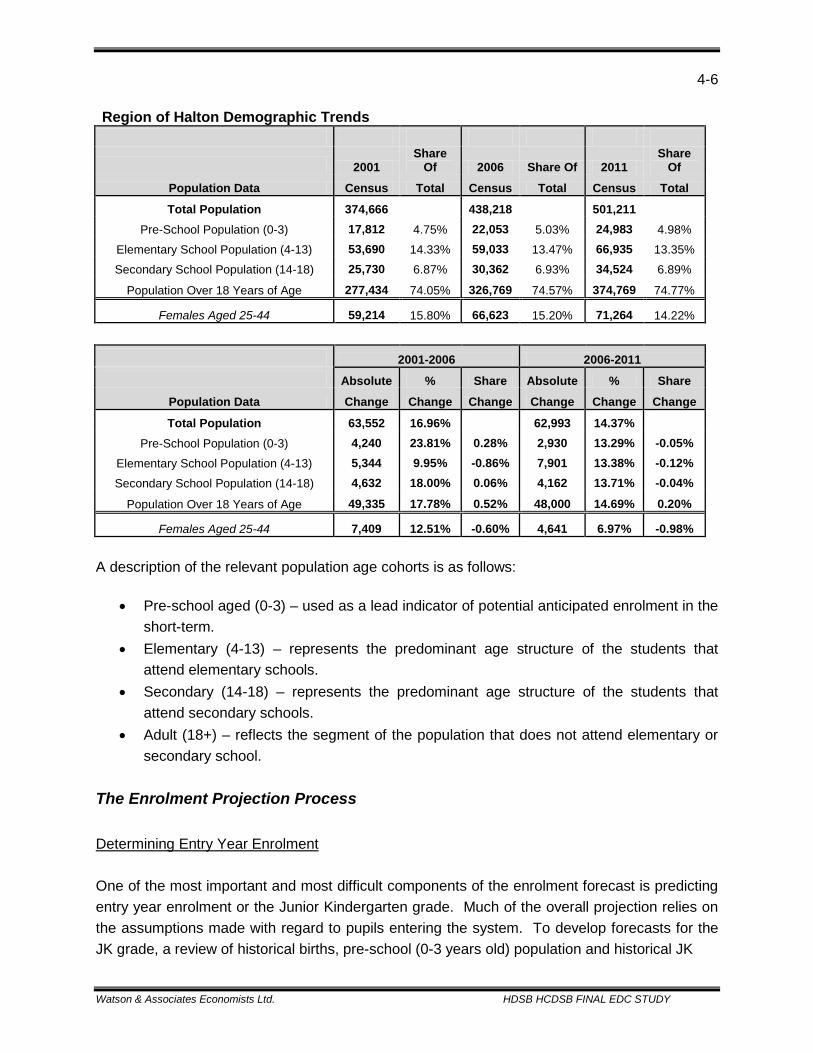
Demographic Background A demographic profile is compiled for each review area within the board’s jurisdiction using data from the 2001, 2006 and 2011 Census. Trends in the demographic data are used to highlight changes in population on both a review area and jurisdiction wide basis. Examining these historical trends assist in providing perspective and direction when determining future assumptions for the projections. The table below depicts the demographic trends for the Region of Halton. The total population in the Board’s jurisdiction grew by almost 17% between 2001 and 2006. In comparison population counts grew 6.6% in Ontario and 5.4% Canada-wide over that same time period. Between 2006 and 2011, the population in the Board’s jurisdiction grew by more than 14%, slightly less than the earlier half of the decade and notably higher than the provincial and national rates for this same time period, which were 5.9% and 5.7%, respectively. More importantly, from a school board perspective, was the increase in the elementary school aged (4-13 years) population which grew by almost 10% from 2001 to 2006 and an additional 13.4% between 2006 and 2011 – an absolute gain of 13,245 between 2001 and 2011. The secondary school aged (14-18) population experienced an increase of 18% from 2001 to 2006, and then further increased by 14% between 2006 and 2011 due to the increases in elementary aged cohorts approaching secondary school age. In addition to the increases in the elementary aged population, there were increases in both the pre-school aged population (0-3 years) and the population of females aged 25-44 for both the 2001/06 and 2006/11 time periods. These two groups are important because they are excellent indicators of what is expected to happen in the school aged population in the short to mid-term. The pre-school population is the cohort that will be entering the school system in the next few years. Females between 25 and 44 years of age are the group of women that are said to be in their prime child bearing years and examining this population can provide input to future births/school aged children. In the Board’s jurisdiction, the pre-school population grew by almost 24% and the population of females aged 25-44 increased by 12.5% for the 2001/06 time period. Between 2006 and 2011, the pre-school population and females aged 25-44 population increased again by 13% and 7% respectively.
4-6
Watson & Associates Economists Ltd. HDSB HCDSB FINAL EDC STUDY
Region of Halton Demographic Trends
2001 Share
Of 2006 Share Of 2011 Share
Of
Population Data Census Total Census Total Census Total
Total Population 374,666 438,218 501,211 Pre-School Population (0-3) 17,812 4.75% 22,053 5.03% 24,983 4.98%
Elementary School Population (4-13) 53,690 14.33% 59,033 13.47% 66,935 13.35%
Secondary School Population (14-18) 25,730 6.87% 30,362 6.93% 34,524 6.89%
Population Over 18 Years of Age 277,434 74.05% 326,769 74.57% 374,769 74.77%
Females Aged 25-44 59,214 15.80% 66,623 15.20% 71,264 14.22%
2001-2006 2006-2011 Absolute % Share Absolute % Share
Population Data Change Change Change Change Change Change
Total Population 63,552 16.96% 62,993 14.37% Pre-School Population (0-3) 4,240 23.81% 0.28% 2,930 13.29% -0.05%
Elementary School Population (4-13) 5,344 9.95% -0.86% 7,901 13.38% -0.12% Secondary School Population (14-18) 4,632 18.00% 0.06% 4,162 13.71% -0.04%
Population Over 18 Years of Age 49,335 17.78% 0.52% 48,000 14.69% 0.20%
Females Aged 25-44 7,409 12.51% -0.60% 4,641 6.97% -0.98% A description of the relevant population age cohorts is as follows:
• Pre-school aged (0-3) – used as a lead indicator of potential anticipated enrolment in the short-term.
• Elementary (4-13) – represents the predominant age structure of the students that attend elementary schools.
• Secondary (14-18) – represents the predominant age structure of the students that attend secondary schools.
• Adult (18+) – reflects the segment of the population that does not attend elementary or secondary school.
The Enrolment Projection Process Determining Entry Year Enrolment One of the most important and most difficult components of the enrolment forecast is predicting entry year enrolment or the Junior Kindergarten grade. Much of the overall projection relies on the assumptions made with regard to pupils entering the system. To develop forecasts for the JK grade, a review of historical births, pre-school (0-3 years old) population and historical JK
4-7
Watson & Associates Economists Ltd. HDSB HCDSB FINAL EDC STUDY
enrolment is undertaken. The participation rates of the Board’s JK grade enrolment of the 4 year old population are examined from one census period to the next to determine future participation ratios. In addition, a population forecast of the pre-school and school aged population (0-18 years) by single year of age is prepared for the study area. This forecast is based on the population trends of the 2001, 2006, and 2011 census periods as well as other relevant demographic trends of the area. Recent fertility and death rates are applied to the 2011 Census population and the population is aged to provide future births and future school aged population. The challenge in this population forecast is to exclude growth/development in this phase of the forecast. The total enrolment forecast is divided into two separate components – existing enrolment and enrolment from future housing. To account for this, trends are examined for 2001, 2006 and 2011 census populations to estimate levels of growth and migration that occurred between the census periods. Assumptions arising from this examination are used to ‘strip’ growth/migration from the projected population forecast to ensure that growth is not double counted. Comparing historical JK enrolment to actual population provides ratios that are used to determine future JK enrolment from the projected 4 year old population in the review area. This determines the projected JK pupils for the review area for the forecast period. These overall JK students then need to be allocated to their respective schools in the review area. This allocation is based on historical shares combined with any Board information on recent openings/closures or program changes that may affect future share. Table 4.1 depicts an example of JK/Elementary participation rates between 2001 and 2011.

4-8
Watson & Associates Economists Ltd. HDSB HCDSB FINAL EDC STUDY
Table 4.1: An Example Of Junior Kindergarten/Elementary Participation Rates – 2001-2011
SINGLE YEAR OF AGE 2001 2006 2011 0 3,185 3,712 3,799 1 3,457 3,883 3,925 2 3,602 3,965 4,078 3 3,664 3,862 4,267 4 3,813 4,110 4,259 5 4,011 3,953 4,474 6 4,157 4,119 4,350 7 4,259 4,079 4,653 8 4,347 4,244 4,520 9 4,253 4,324 4,560 10 4,354 4,506 4,522 11 4,439 4,564 4,760 12 4,184 4,736 4,605 13 4,060 4,762 4,840
JK HEADCOUNT ENROLMENT 1,489 1,484 1,730 ELEMENTARY HEADCOUNT ENROLMENT 17,950 19,203 19,887
JK PARTICIPATION 39% 36% 41% ELEMENTARY PARTICIPATION 43% 44% 46%
At this stage of the projections, each school in a review area will have a projected number of JK’s for the forecast period. The next step then involves using the grade transition method to advance each grade from one year to the next. For every school in the system, retention rates from grade to grade are calculated and applied to grade enrolments as they are advanced through each projection year. Each school and community can be unique when it comes to grade retention. For example, the ratio of kindergarten students to junior kindergarten students is often higher in the more rural areas and an indication that more students routinely enter the senior kindergarten grade than would be expected, given the junior kindergarten count from the previous year. Programs, such as French Immersion etc. can also have a significant impact on grade to grade retention. Table 4.2 provides an example of retention rate calculations based on historical enrolment.
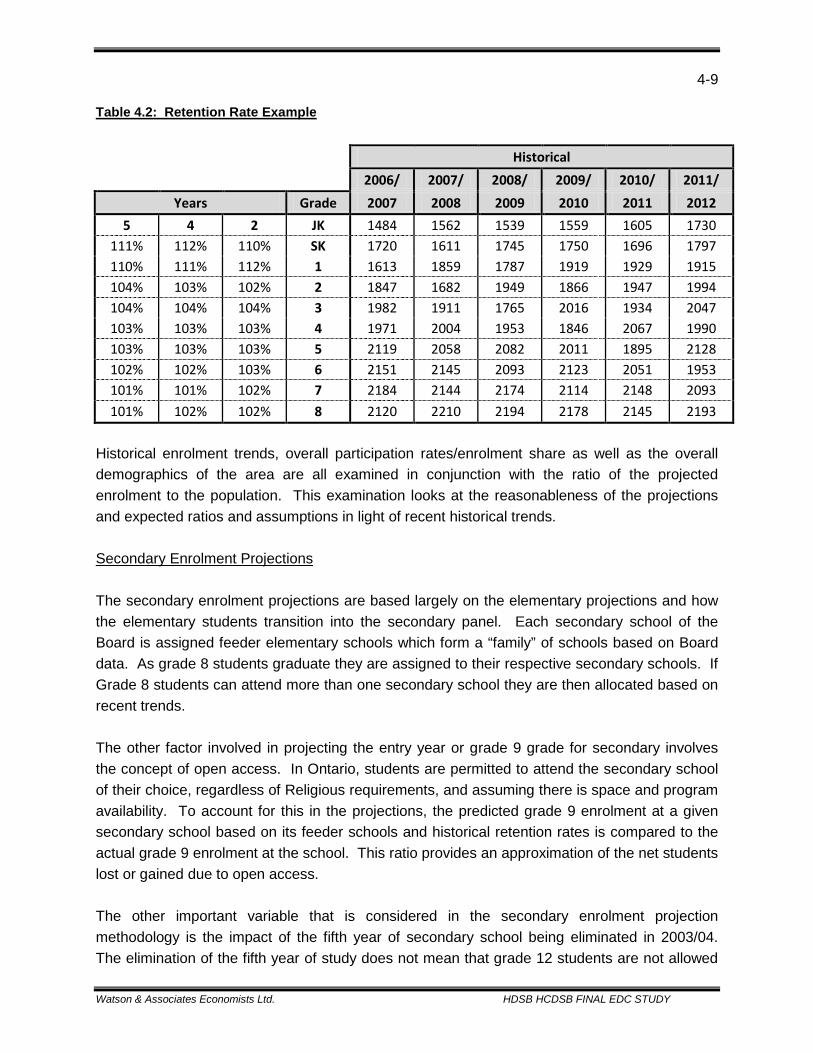
4-9
Watson & Associates Economists Ltd. HDSB HCDSB FINAL EDC STUDY
Table 4.2: Retention Rate Example
Historical
2006/ 2007/ 2008/ 2009/ 2010/ 2011/ Years Grade 2007 2008 2009 2010 2011 2012
5 4 2 JK 1484 1562 1539 1559 1605 1730 111% 112% 110% SK 1720 1611 1745 1750 1696 1797 110% 111% 112% 1 1613 1859 1787 1919 1929 1915 104% 103% 102% 2 1847 1682 1949 1866 1947 1994 104% 104% 104% 3 1982 1911 1765 2016 1934 2047 103% 103% 103% 4 1971 2004 1953 1846 2067 1990 103% 103% 103% 5 2119 2058 2082 2011 1895 2128 102% 102% 103% 6 2151 2145 2093 2123 2051 1953 101% 101% 102% 7 2184 2144 2174 2114 2148 2093 101% 102% 102% 8 2120 2210 2194 2178 2145 2193
Historical enrolment trends, overall participation rates/enrolment share as well as the overall demographics of the area are all examined in conjunction with the ratio of the projected enrolment to the population. This examination looks at the reasonableness of the projections and expected ratios and assumptions in light of recent historical trends. Secondary Enrolment Projections The secondary enrolment projections are based largely on the elementary projections and how the elementary students transition into the secondary panel. Each secondary school of the Board is assigned feeder elementary schools which form a “family” of schools based on Board data. As grade 8 students graduate they are assigned to their respective secondary schools. If Grade 8 students can attend more than one secondary school they are then allocated based on recent trends. The other factor involved in projecting the entry year or grade 9 grade for secondary involves the concept of open access. In Ontario, students are permitted to attend the secondary school of their choice, regardless of Religious requirements, and assuming there is space and program availability. To account for this in the projections, the predicted grade 9 enrolment at a given secondary school based on its feeder schools and historical retention rates is compared to the actual grade 9 enrolment at the school. This ratio provides an approximation of the net students lost or gained due to open access. The other important variable that is considered in the secondary enrolment projection methodology is the impact of the fifth year of secondary school being eliminated in 2003/04. The elimination of the fifth year of study does not mean that grade 12 students are not allowed
4-10
Watson & Associates Economists Ltd. HDSB HCDSB FINAL EDC STUDY
to come back for a fifth year of study. There are still instances where grade 12 students may come back to finish the four year program in five years or to upgrade or retake certain courses. The percentage of students that are coming back for a fifth year varies though-out the Province and even from school to school within a Board. The projections in this analysis typically utilize a 3 year average of grade 12 retention rates (putting greater emphasis on the last year or two) as well as input from the School Boards on their experiences and expected future trends. The remainder of the secondary projection follows the same methodology used in the elementary projections. Grades are advanced by applying historical grade transition rates for each school in the system. Assumptions are derived using historical ratios of enrolment to population and are used to ensure that projected secondary enrolment relates back to the projected secondary populations. Examining Historical Enrolment Trends Historical enrolment provides trends that are used to help form assumptions for projected enrolment and provides an important basis to determine relationships with demographic data. The historical data can provide detail on things like how the change in enrolments compare with the changes in the school aged populations of the same area, how different sized grade cohorts are moving through the system and how enrolment has changed in light of new housing activity. An important indicator when examining historical enrolment is the ratio of senior elementary enrolment compared to junior elementary enrolment. This ratio provides a quick “snapshot” of the current enrolment structure and can provide a short term outlook of expected enrolment. The comparison is made between the senior elementary grades (6-8) and the junior elementary grades (JK-1). Assuming full day JK and SK, an equal number of pupils entering JK-1 to those moving through the senior elementary grades would result in a ratio of 1. If the ratio is higher than 1 it indicates that more pupils are leaving the elementary system or school than are entering, and could be an indicator of future enrolment decline, at least in the short term and absent of mitigating factors. A ratio lower than 1 indicates possible enrolment growth (at least in the short term) and is typically found in growing areas where housing attracts young couples or young families with children. The ratio of senior to junior elementary enrolment for the HDSB’s total jurisdiction based on 2011/12 enrolment is 0.96; in 2006/07 however the GSR was 1.14. The decrease in grade structure ratio between 2006/07 and 2011/12 is indicative of the population growth occurring in the area at that time, causing more students to enter the elementary system than leave. The current GSR (0.96) is projected to be the lowest rate over the next 15 years, indicative of a peak population growth rates that will start to decline as the GSR increases. Table 4.3 outlines historical enrolment and historical grade ratios for HDSB.
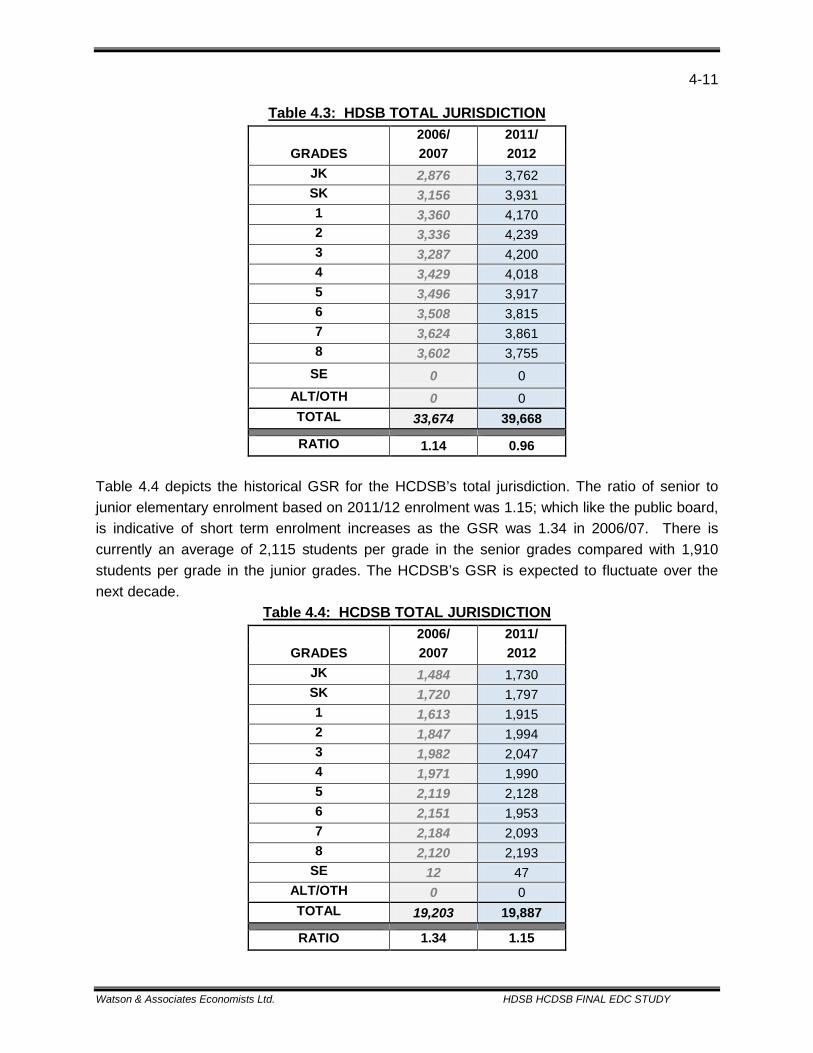
4-11
Watson & Associates Economists Ltd. HDSB HCDSB FINAL EDC STUDY
Table 4.3: HDSB TOTAL JURISDICTION
2006/ 2011/
GRADES 2007 2012 JK 2,876 3,762 SK 3,156 3,931 1 3,360 4,170 2 3,336 4,239 3 3,287 4,200 4 3,429 4,018 5 3,496 3,917 6 3,508 3,815 7 3,624 3,861 8 3,602 3,755
SE 0 0 ALT/OTH 0 0 TOTAL 33,674 39,668
RATIO 1.14 0.96 Table 4.4 depicts the historical GSR for the HCDSB’s total jurisdiction. The ratio of senior to junior elementary enrolment based on 2011/12 enrolment was 1.15; which like the public board, is indicative of short term enrolment increases as the GSR was 1.34 in 2006/07. There is currently an average of 2,115 students per grade in the senior grades compared with 1,910 students per grade in the junior grades. The HCDSB’s GSR is expected to fluctuate over the next decade.
Table 4.4: HCDSB TOTAL JURISDICTION
2006/ 2011/
GRADES 2007 2012 JK 1,484 1,730 SK 1,720 1,797 1 1,613 1,915 2 1,847 1,994 3 1,982 2,047 4 1,971 1,990 5 2,119 2,128 6 2,151 1,953 7 2,184 2,093 8 2,120 2,193
SE 12 47 ALT/OTH 0 0 TOTAL 19,203 19,887
RATIO 1.34 1.15
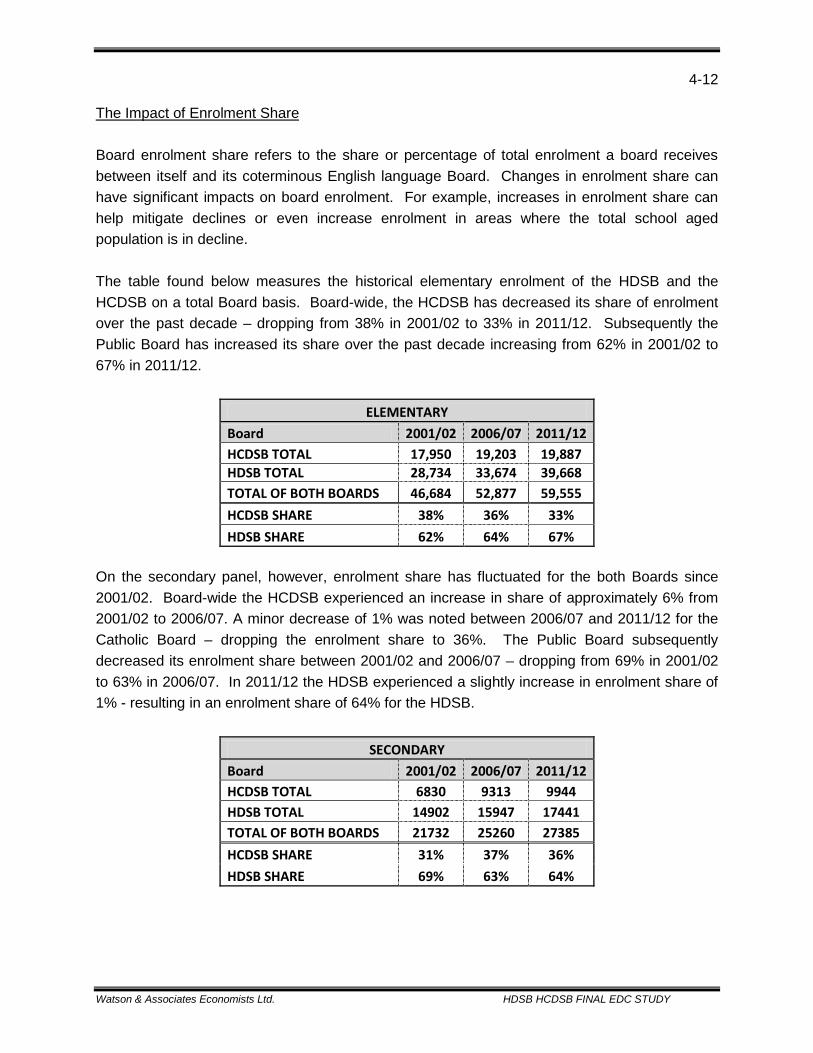
4-12
Watson & Associates Economists Ltd. HDSB HCDSB FINAL EDC STUDY
The Impact of Enrolment Share Board enrolment share refers to the share or percentage of total enrolment a board receives between itself and its coterminous English language Board. Changes in enrolment share can have significant impacts on board enrolment. For example, increases in enrolment share can help mitigate declines or even increase enrolment in areas where the total school aged population is in decline. The table found below measures the historical elementary enrolment of the HDSB and the HCDSB on a total Board basis. Board-wide, the HCDSB has decreased its share of enrolment over the past decade – dropping from 38% in 2001/02 to 33% in 2011/12. Subsequently the Public Board has increased its share over the past decade increasing from 62% in 2001/02 to 67% in 2011/12.
ELEMENTARY Board 2001/02 2006/07 2011/12 HCDSB TOTAL 17,950 19,203 19,887 HDSB TOTAL 28,734 33,674 39,668 TOTAL OF BOTH BOARDS 46,684 52,877 59,555 HCDSB SHARE 38% 36% 33% HDSB SHARE 62% 64% 67%
On the secondary panel, however, enrolment share has fluctuated for the both Boards since 2001/02. Board-wide the HCDSB experienced an increase in share of approximately 6% from 2001/02 to 2006/07. A minor decrease of 1% was noted between 2006/07 and 2011/12 for the Catholic Board – dropping the enrolment share to 36%. The Public Board subsequently decreased its enrolment share between 2001/02 and 2006/07 – dropping from 69% in 2001/02 to 63% in 2006/07. In 2011/12 the HDSB experienced a slightly increase in enrolment share of 1% - resulting in an enrolment share of 64% for the HDSB.
SECONDARY Board 2001/02 2006/07 2011/12 HCDSB TOTAL 6830 9313 9944 HDSB TOTAL 14902 15947 17441 TOTAL OF BOTH BOARDS 21732 25260 27385 HCDSB SHARE 31% 37% 36% HDSB SHARE 69% 63% 64%
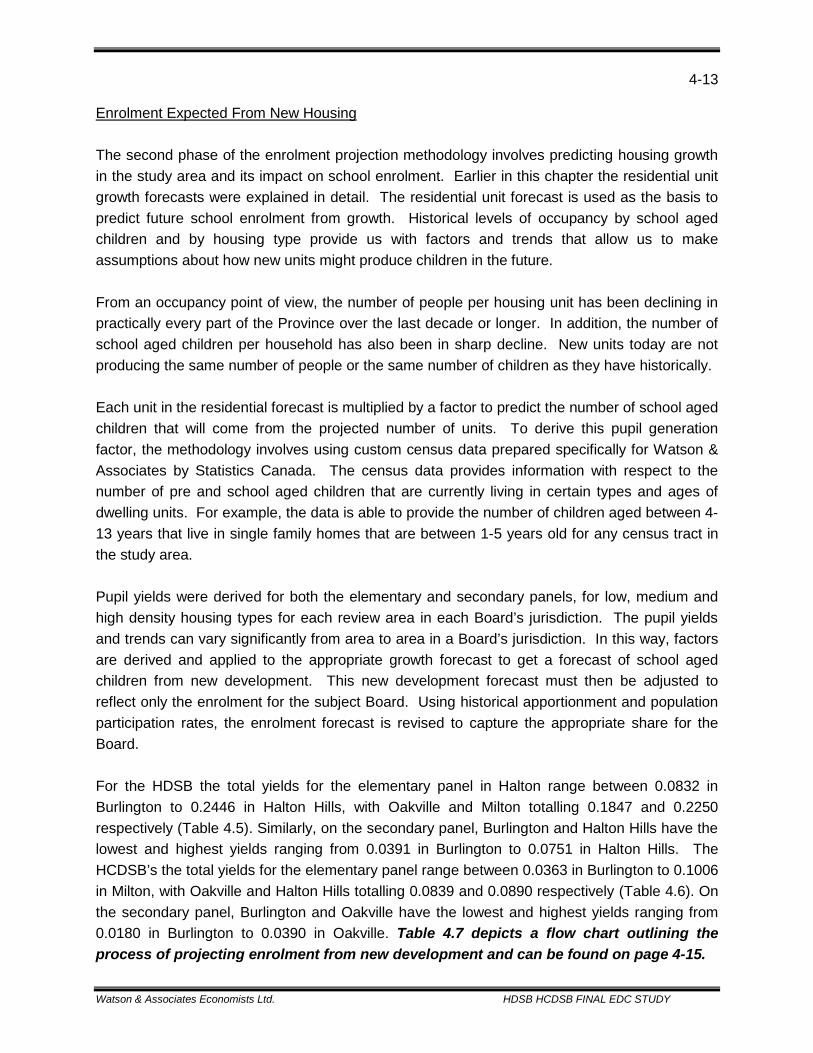
4-13
Watson & Associates Economists Ltd. HDSB HCDSB FINAL EDC STUDY
Enrolment Expected From New Housing The second phase of the enrolment projection methodology involves predicting housing growth in the study area and its impact on school enrolment. Earlier in this chapter the residential unit growth forecasts were explained in detail. The residential unit forecast is used as the basis to predict future school enrolment from growth. Historical levels of occupancy by school aged children and by housing type provide us with factors and trends that allow us to make assumptions about how new units might produce children in the future. From an occupancy point of view, the number of people per housing unit has been declining in practically every part of the Province over the last decade or longer. In addition, the number of school aged children per household has also been in sharp decline. New units today are not producing the same number of people or the same number of children as they have historically. Each unit in the residential forecast is multiplied by a factor to predict the number of school aged children that will come from the projected number of units. To derive this pupil generation factor, the methodology involves using custom census data prepared specifically for Watson & Associates by Statistics Canada. The census data provides information with respect to the number of pre and school aged children that are currently living in certain types and ages of dwelling units. For example, the data is able to provide the number of children aged between 4-13 years that live in single family homes that are between 1-5 years old for any census tract in the study area. Pupil yields were derived for both the elementary and secondary panels, for low, medium and high density housing types for each review area in each Board’s jurisdiction. The pupil yields and trends can vary significantly from area to area in a Board’s jurisdiction. In this way, factors are derived and applied to the appropriate growth forecast to get a forecast of school aged children from new development. This new development forecast must then be adjusted to reflect only the enrolment for the subject Board. Using historical apportionment and population participation rates, the enrolment forecast is revised to capture the appropriate share for the Board. For the HDSB the total yields for the elementary panel in Halton range between 0.0832 in Burlington to 0.2446 in Halton Hills, with Oakville and Milton totalling 0.1847 and 0.2250 respectively (Table 4.5). Similarly, on the secondary panel, Burlington and Halton Hills have the lowest and highest yields ranging from 0.0391 in Burlington to 0.0751 in Halton Hills. The HCDSB’s the total yields for the elementary panel range between 0.0363 in Burlington to 0.1006 in Milton, with Oakville and Halton Hills totalling 0.0839 and 0.0890 respectively (Table 4.6). On the secondary panel, Burlington and Oakville have the lowest and highest yields ranging from 0.0180 in Burlington to 0.0390 in Oakville. Table 4.7 depicts a flow chart outlining the process of projecting enrolment from new development and can be found on page 4-15.
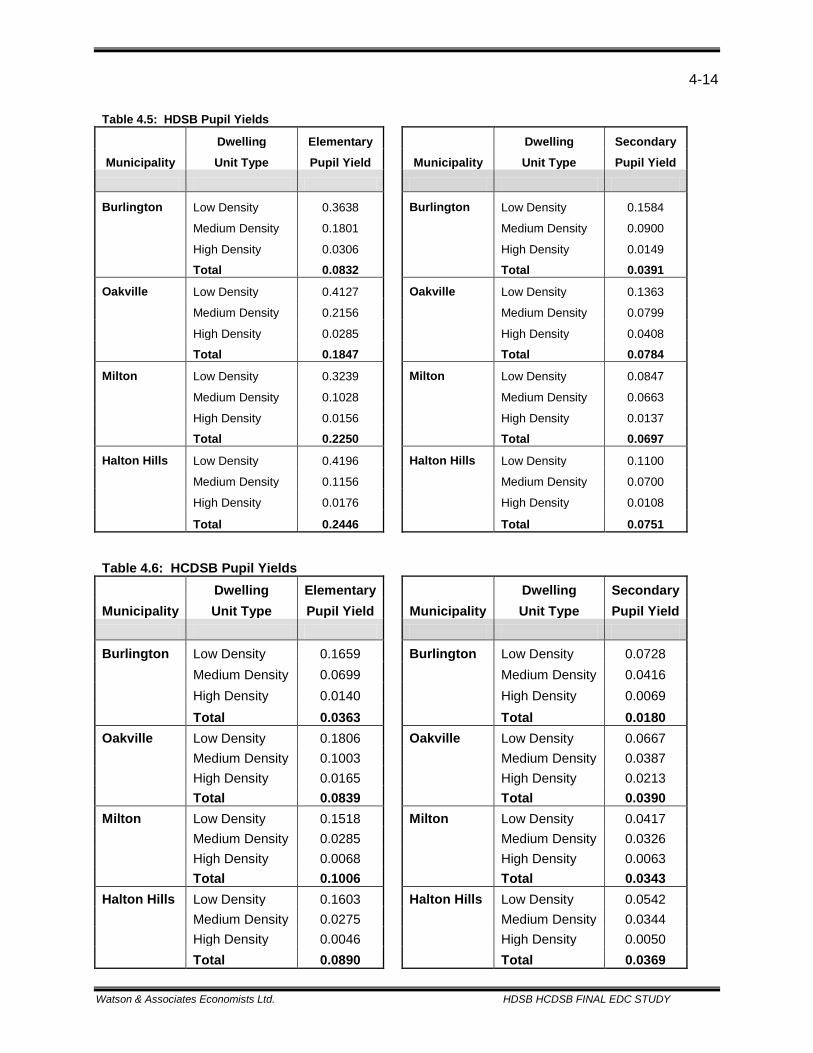
4-14
Watson & Associates Economists Ltd. HDSB HCDSB FINAL EDC STUDY
Table 4.5: HDSB Pupil Yields Dwelling Elementary
Dwelling Secondary
Municipality Unit Type Pupil Yield
Municipality Unit Type Pupil Yield
Burlington Low Density 0.3638
Burlington Low Density 0.1584
Medium Density 0.1801
Medium Density 0.0900
High Density 0.0306
High Density 0.0149
Total 0.0832
Total 0.0391
Oakville Low Density 0.4127
Oakville Low Density 0.1363
Medium Density 0.2156
Medium Density 0.0799
High Density 0.0285
High Density 0.0408
Total 0.1847
Total 0.0784
Milton Low Density 0.3239
Milton Low Density 0.0847
Medium Density 0.1028
Medium Density 0.0663
High Density 0.0156
High Density 0.0137
Total 0.2250
Total 0.0697
Halton Hills Low Density 0.4196
Halton Hills Low Density 0.1100
Medium Density 0.1156
Medium Density 0.0700
High Density 0.0176
High Density 0.0108
Total 0.2446
Total 0.0751
Table 4.6: HCDSB Pupil Yields Dwelling Elementary
Dwelling Secondary Municipality Unit Type Pupil Yield
Municipality Unit Type Pupil Yield
Burlington Low Density 0.1659
Burlington Low Density 0.0728
Medium Density 0.0699
Medium Density 0.0416 High Density 0.0140
High Density 0.0069
Total 0.0363
Total 0.0180 Oakville Low Density 0.1806
Oakville Low Density 0.0667
Medium Density 0.1003
Medium Density 0.0387 High Density 0.0165
High Density 0.0213
Total 0.0839
Total 0.0390 Milton Low Density 0.1518
Milton Low Density 0.0417
Medium Density 0.0285
Medium Density 0.0326 High Density 0.0068
High Density 0.0063
Total 0.1006
Total 0.0343 Halton Hills Low Density 0.1603
Halton Hills Low Density 0.0542
Medium Density 0.0275
Medium Density 0.0344 High Density 0.0046
High Density 0.0050
Total 0.0890
Total 0.0369

4-15
Watson & Associates Economists Ltd. HDSB HCDSB FINAL EDC STUDY
Table 4.7: Enrolment Expected From New Development
Council Approved Growth Forecast
School Age Population Generation
Factors
MULTIPLIED BY
Projected School Age Population
(elementary and secondary)
Adjusted For Board Share With
Coterminous Board
Adjusted For Population
Participation (i.e those not attending
Public Schools)
Adjusted for Average Daily
Enrolment (Secondary Only)
Board Specific Enrolment Expected From New
Development
Enrolment Expected From New Development
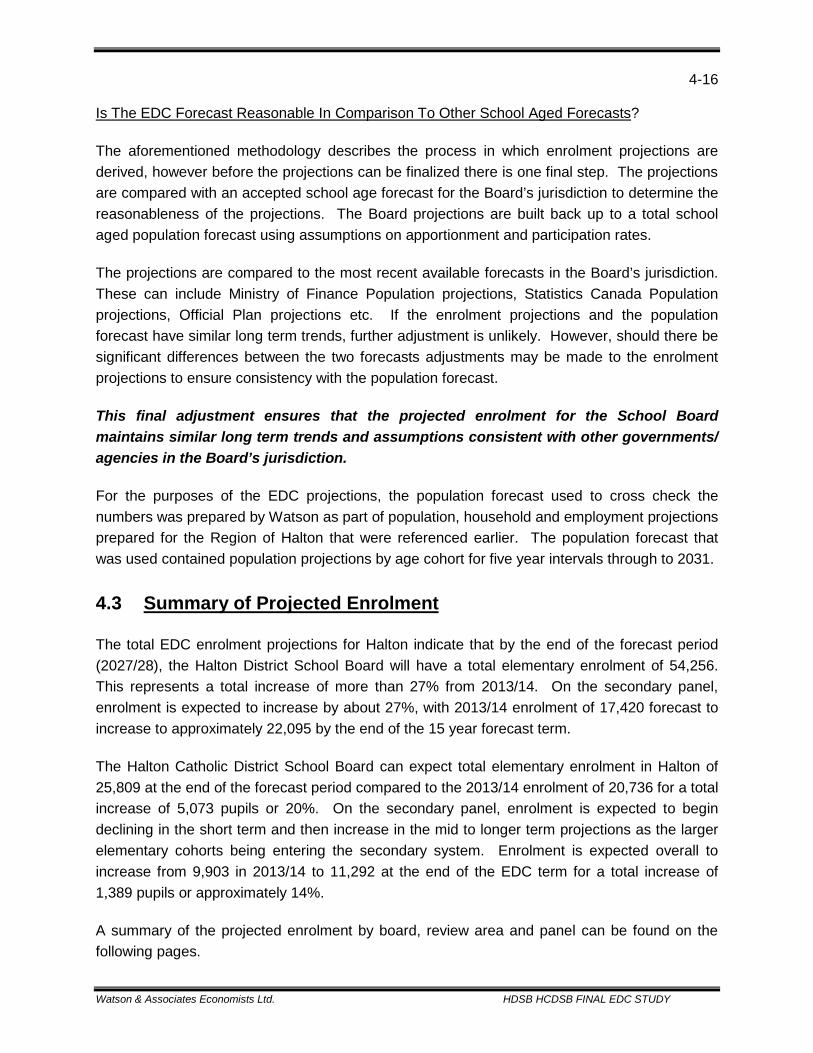
4-16
Watson & Associates Economists Ltd. HDSB HCDSB FINAL EDC STUDY
Is The EDC Forecast Reasonable In Comparison To Other School Aged Forecasts? The aforementioned methodology describes the process in which enrolment projections are derived, however before the projections can be finalized there is one final step. The projections are compared with an accepted school age forecast for the Board’s jurisdiction to determine the reasonableness of the projections. The Board projections are built back up to a total school aged population forecast using assumptions on apportionment and participation rates. The projections are compared to the most recent available forecasts in the Board’s jurisdiction. These can include Ministry of Finance Population projections, Statistics Canada Population projections, Official Plan projections etc. If the enrolment projections and the population forecast have similar long term trends, further adjustment is unlikely. However, should there be significant differences between the two forecasts adjustments may be made to the enrolment projections to ensure consistency with the population forecast. This final adjustment ensures that the projected enrolment for the School Board maintains similar long term trends and assumptions consistent with other governments/ agencies in the Board’s jurisdiction. For the purposes of the EDC projections, the population forecast used to cross check the numbers was prepared by Watson as part of population, household and employment projections prepared for the Region of Halton that were referenced earlier. The population forecast that was used contained population projections by age cohort for five year intervals through to 2031. 4.3 Summary of Projected Enrolment The total EDC enrolment projections for Halton indicate that by the end of the forecast period (2027/28), the Halton District School Board will have a total elementary enrolment of 54,256. This represents a total increase of more than 27% from 2013/14. On the secondary panel, enrolment is expected to increase by about 27%, with 2013/14 enrolment of 17,420 forecast to increase to approximately 22,095 by the end of the 15 year forecast term. The Halton Catholic District School Board can expect total elementary enrolment in Halton of 25,809 at the end of the forecast period compared to the 2013/14 enrolment of 20,736 for a total increase of 5,073 pupils or 20%. On the secondary panel, enrolment is expected to begin declining in the short term and then increase in the mid to longer term projections as the larger elementary cohorts being entering the secondary system. Enrolment is expected overall to increase from 9,903 in 2013/14 to 11,292 at the end of the EDC term for a total increase of 1,389 pupils or approximately 14%. A summary of the projected enrolment by board, review area and panel can be found on the following pages.
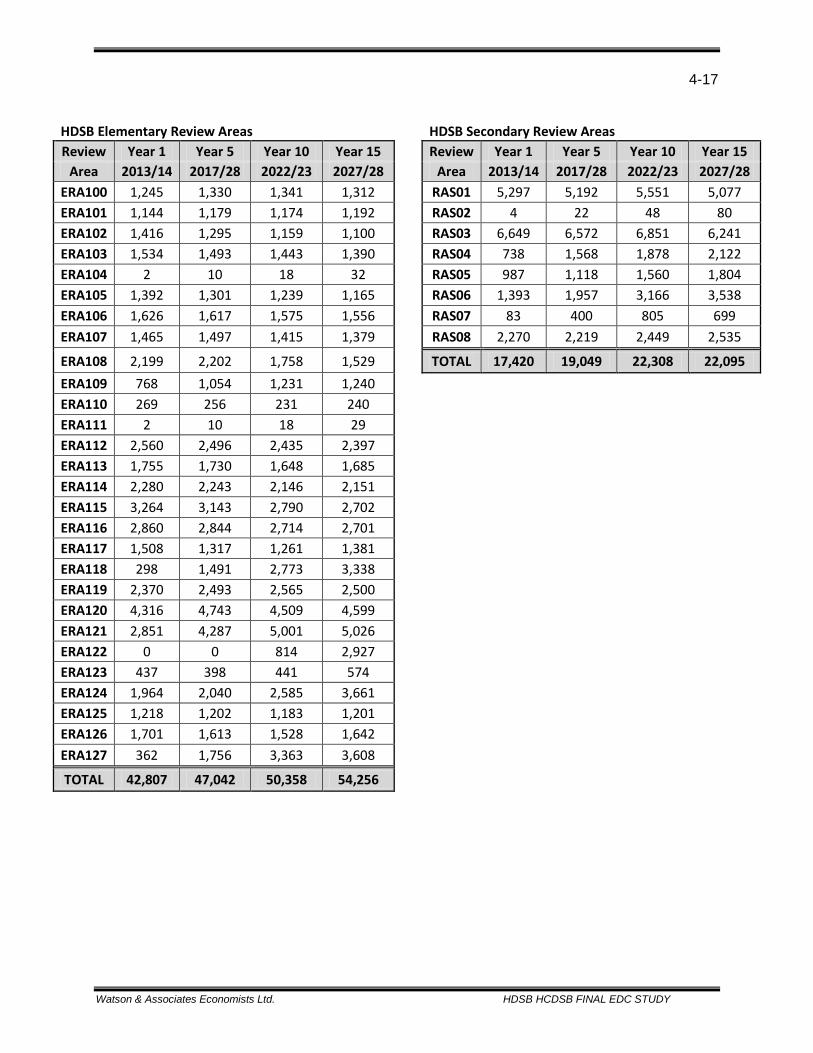
4-17
Watson & Associates Economists Ltd. HDSB HCDSB FINAL EDC STUDY
HDSB Elementary Review Areas
HDSB Secondary Review Areas
Review Year 1 Year 5 Year 10 Year 15 Review Year 1 Year 5 Year 10 Year 15 Area 2013/14 2017/28 2022/23 2027/28 Area 2013/14 2017/28 2022/23 2027/28
ERA100 1,245 1,330 1,341 1,312 RAS01 5,297 5,192 5,551 5,077 ERA101 1,144 1,179 1,174 1,192 RAS02 4 22 48 80 ERA102 1,416 1,295 1,159 1,100 RAS03 6,649 6,572 6,851 6,241 ERA103 1,534 1,493 1,443 1,390 RAS04 738 1,568 1,878 2,122 ERA104 2 10 18 32 RAS05 987 1,118 1,560 1,804 ERA105 1,392 1,301 1,239 1,165 RAS06 1,393 1,957 3,166 3,538 ERA106 1,626 1,617 1,575 1,556 RAS07 83 400 805 699 ERA107 1,465 1,497 1,415 1,379 RAS08 2,270 2,219 2,449 2,535
ERA108 2,199 2,202 1,758 1,529 TOTAL 17,420 19,049 22,308 22,095 ERA109 768 1,054 1,231 1,240 ERA110 269 256 231 240 ERA111 2 10 18 29 ERA112 2,560 2,496 2,435 2,397 ERA113 1,755 1,730 1,648 1,685 ERA114 2,280 2,243 2,146 2,151 ERA115 3,264 3,143 2,790 2,702 ERA116 2,860 2,844 2,714 2,701 ERA117 1,508 1,317 1,261 1,381 ERA118 298 1,491 2,773 3,338 ERA119 2,370 2,493 2,565 2,500 ERA120 4,316 4,743 4,509 4,599 ERA121 2,851 4,287 5,001 5,026 ERA122 0 0 814 2,927 ERA123 437 398 441 574 ERA124 1,964 2,040 2,585 3,661 ERA125 1,218 1,202 1,183 1,201 ERA126 1,701 1,613 1,528 1,642 ERA127 362 1,756 3,363 3,608 TOTAL 42,807 47,042 50,358 54,256

4-18
Watson & Associates Economists Ltd. HDSB HCDSB FINAL EDC STUDY
HCDSB Elementary Review Areas HCDSB Secondary Review Areas Review Year 1 Year 5 Year 10 Year 15 Review Year 1 Year 5 Year 10 Year 15
Area 2013/14 2017/28 2022/23 2027/28 Area 2013/14 2017/28 2022/23 2027/28 CEB1 438 441 409 418 RAS01 3,081 2,691 2,512 2,338 CEB2 1,383 1,303 1,288 1,273 RAS02 994 1,148 1,354 1,682 CEB3 1 6 8 13 RAS03 2,445 2,282 1,996 1,880 CEB4 1,632 1,498 1,403 1,397 RAS04 1,789 2,241 3,595 3,882 CEB5 1,378 1,211 1,117 1,113 RAS05 1,594 1,478 1,408 1,509
CEB6 565 625 618 635 TOTAL 9,903 9,840 10,866 11,292 CEB7 0 2 3 3 CE01 1,870 1,772 1,777 1,812 CE02 2,275 2,356 2,400 2,477 CE03 890 802 682 649 CE04 653 590 556 568 CE05 1,812 1,603 1,535 1,566 CE06 138 688 1,279 1,542 CEM1 1,393 1,526 1,554 1,596
CEM2A 2,576 3,276 3,802 3,943 CEM2B 1,014 1,824 2,098 1,993 CEM3A - 0 400 1,391 CEM3B 1 3 48 160 CEH1 2,716 2,582 2,782 3,261
TOTAL 20,736 22,107 23,762 25,809
Watson & Associates Economists Ltd. HDSB HCDSB FINAL EDC STUDY
5. EDUCATION DEVELOPMENT CHARGE CALCULATION
5-1
Watson & Associates Economists Ltd. HDSB HCDSB FINAL EDC STUDY
5. EDUCATION DEVELOPMENT CHARGE CALCULATION Once eligibility has been determined, the charge is calculated using the aforementioned forecasts and methodologies. The calculation is dependent on the growth/enrolment forecasts to project need, the valuation of land and services to assign a cost to that need and the residential and non-residential forecast to provide a quotient to determine the final quantum of the charge. O.Reg 20/98, S.7 provides the basis under which the EDC is determined. The following section will explain and highlight the specific calculation components of the EDC.
5.1 The Projections The residential dwelling unit forecasts as well as the non-residential GFA forecasts that were used in the EDC analysis are explained in detail in chapter 4 and outlined below. Residential Unit Forecast
REGION OF HALTON 2013/14-2027/28
TOTAL PROJECTED UNITS 83,719
TOTAL NET NEW UNITS 82,659 Non-residential GFA Forecasts
REGION OF HALTON 2013/14-2027/28
TOTAL PROJECTED GFA (Sq.ft.) 75,403,985
TOTAL NET GFA (Sq.ft.) 56,902,759 Net Growth-related Pupil Places The projected school board enrolments as well as the residential forecasts determine the net growth-related pupil places which in turn determine the number of EDC eligible sites. Form E of the EDC Ministry Submission for each board and each panel is set out below. These forms highlight, by review area, the net number of units, the board pupil yields and the growth-related pupils. The HDSB’s projections forecast a total of 13,419 elementary net growth-related pupils and 4,177 secondary pupils. The HCDSB enrolment projections predict 5,485 net growth-related pupils on the elementary panel and 1,942 on the secondary panel.
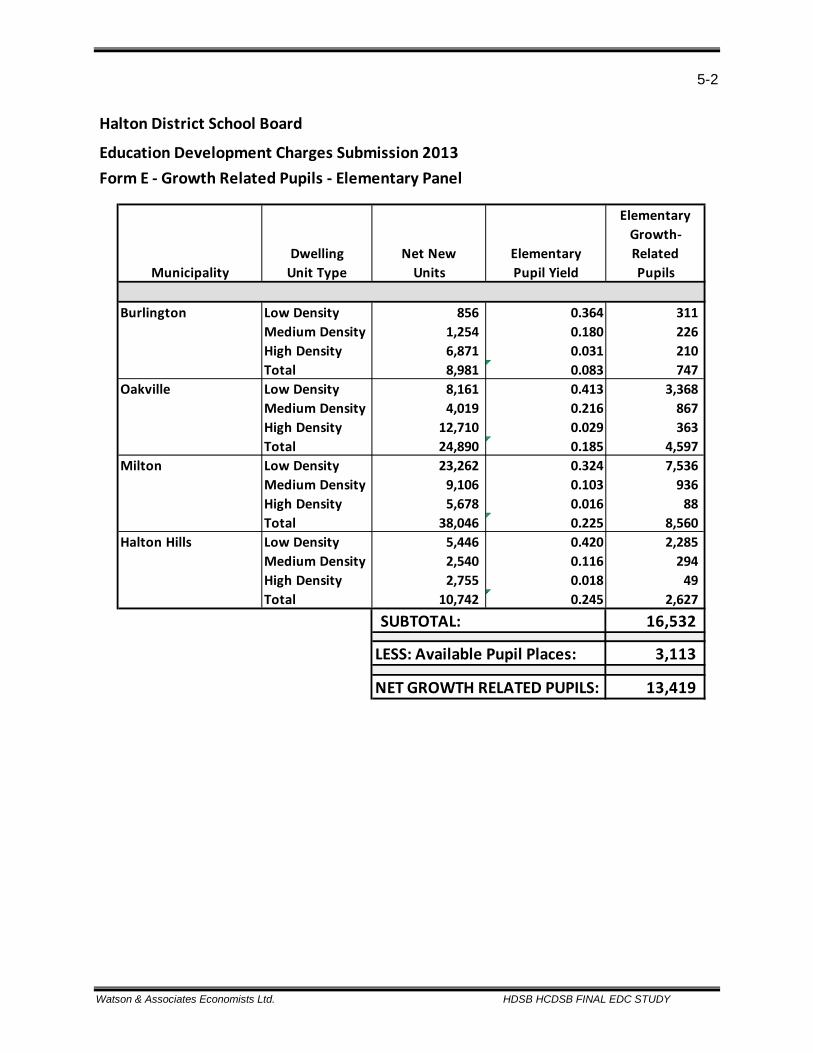
5-2
Watson & Associates Economists Ltd. HDSB HCDSB FINAL EDC STUDY
Halton District School Board
Education Development Charges Submission 2013Form E - Growth Related Pupils - Elementary Panel
ElementaryGrowth-
Dwelling Net New Elementary RelatedUnit Type Units Pupil Yield Pupils
Burlington Low Density 856 0.364 311 Medium Density 1,254 0.180 226 High Density 6,871 0.031 210 Total 8,981 0.083 747
Oakville Low Density 8,161 0.413 3,368 Medium Density 4,019 0.216 867 High Density 12,710 0.029 363 Total 24,890 0.185 4,597
Milton Low Density 23,262 0.324 7,536 Medium Density 9,106 0.103 936 High Density 5,678 0.016 88 Total 38,046 0.225 8,560
Halton Hills Low Density 5,446 0.420 2,285 Medium Density 2,540 0.116 294 High Density 2,755 0.018 49 Total 10,742 0.245 2,627
SUBTOTAL: 16,532
LESS: Available Pupil Places: 3,113
NET GROWTH RELATED PUPILS: 13,419
Municipality
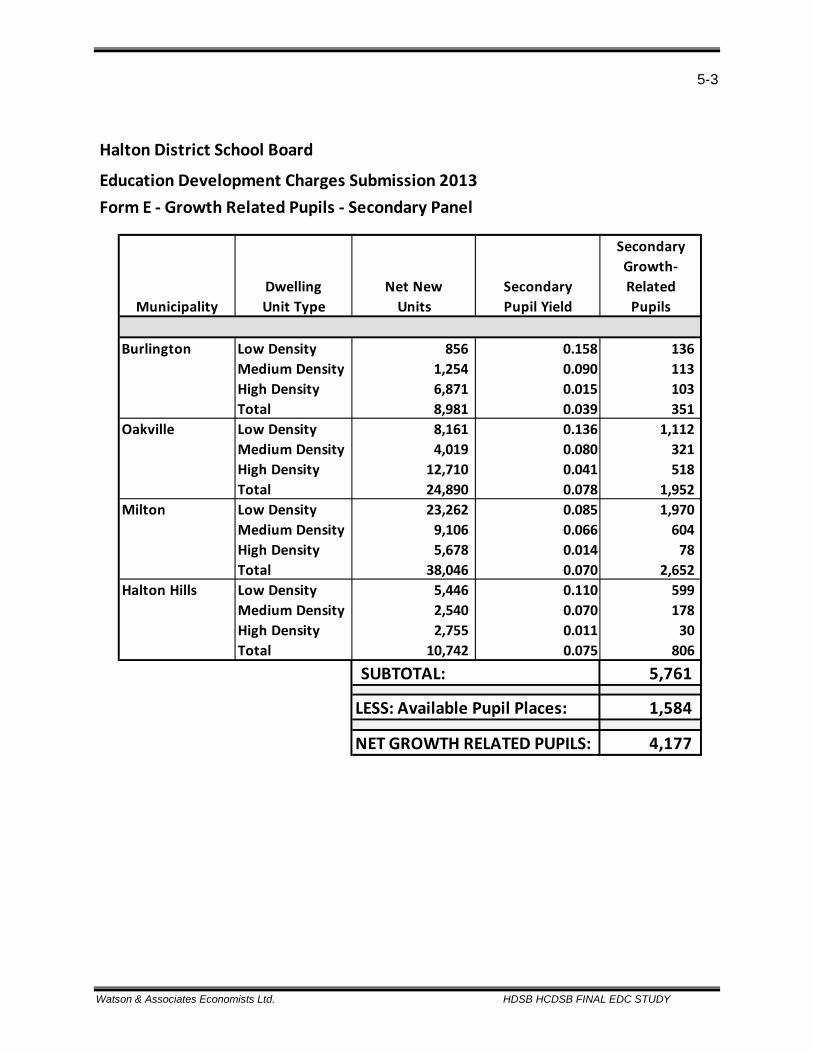
5-3
Watson & Associates Economists Ltd. HDSB HCDSB FINAL EDC STUDY
Halton District School Board
Education Development Charges Submission 2013Form E - Growth Related Pupils - Secondary Panel
SecondaryGrowth-
Dwelling Net New Secondary RelatedUnit Type Units Pupil Yield Pupils
DE
Burlington Low Density 856 0.158 136 Medium Density 1,254 0.090 113 High Density 6,871 0.015 103 Total 8,981 0.039 351
Oakville Low Density 8,161 0.136 1,112 Medium Density 4,019 0.080 321 High Density 12,710 0.041 518 Total 24,890 0.078 1,952
Milton Low Density 23,262 0.085 1,970 Medium Density 9,106 0.066 604 High Density 5,678 0.014 78 Total 38,046 0.070 2,652
Halton Hills Low Density 5,446 0.110 599 Medium Density 2,540 0.070 178 High Density 2,755 0.011 30 Total 10,742 0.075 806
SUBTOTAL: 5,761
LESS: Available Pupil Places: 1,584
NET GROWTH RELATED PUPILS: 4,177
Municipality
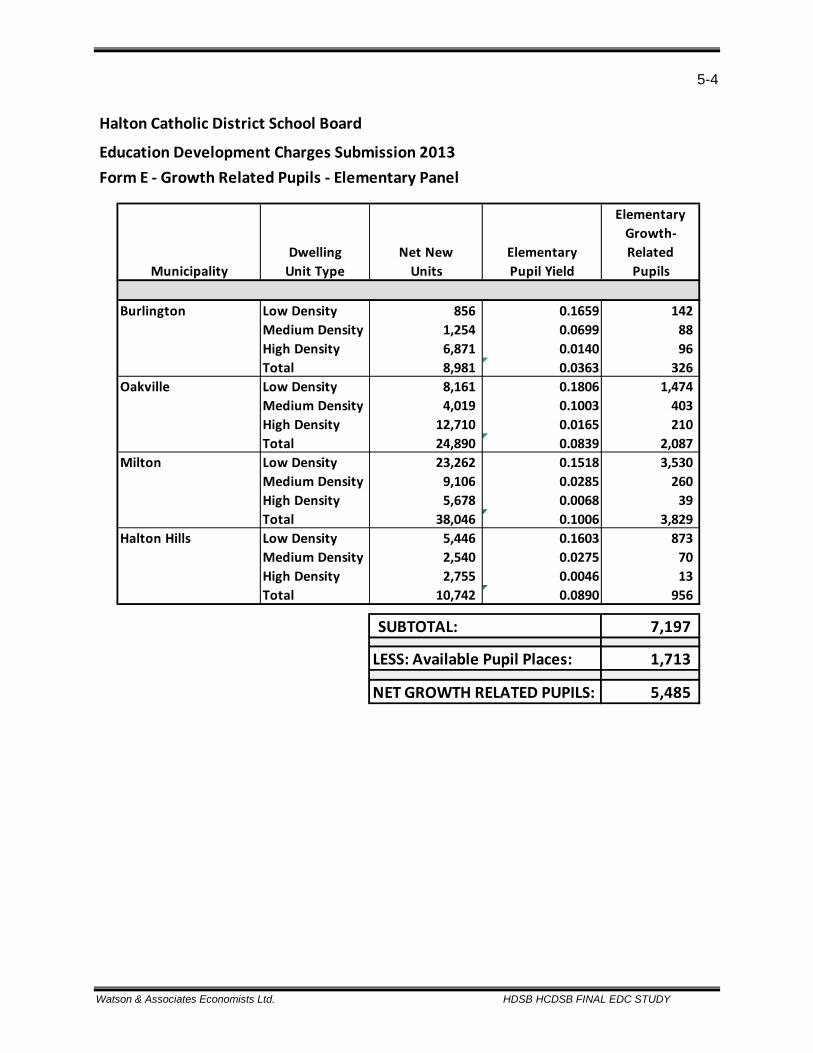
5-4
Watson & Associates Economists Ltd. HDSB HCDSB FINAL EDC STUDY
Halton Catholic District School Board
Education Development Charges Submission 2013Form E - Growth Related Pupils - Elementary Panel
ElementaryGrowth-
Dwelling Net New Elementary RelatedUnit Type Units Pupil Yield Pupils
Burlington Low Density 856 0.1659 142 Medium Density 1,254 0.0699 88 High Density 6,871 0.0140 96 Total 8,981 0.0363 326
Oakville Low Density 8,161 0.1806 1,474 Medium Density 4,019 0.1003 403 High Density 12,710 0.0165 210 Total 24,890 0.0839 2,087
Milton Low Density 23,262 0.1518 3,530 Medium Density 9,106 0.0285 260 High Density 5,678 0.0068 39 Total 38,046 0.1006 3,829
Halton Hills Low Density 5,446 0.1603 873 Medium Density 2,540 0.0275 70 High Density 2,755 0.0046 13 Total 10,742 0.0890 956
SUBTOTAL: 7,197
LESS: Available Pupil Places: 1,713
NET GROWTH RELATED PUPILS: 5,485
Municipality
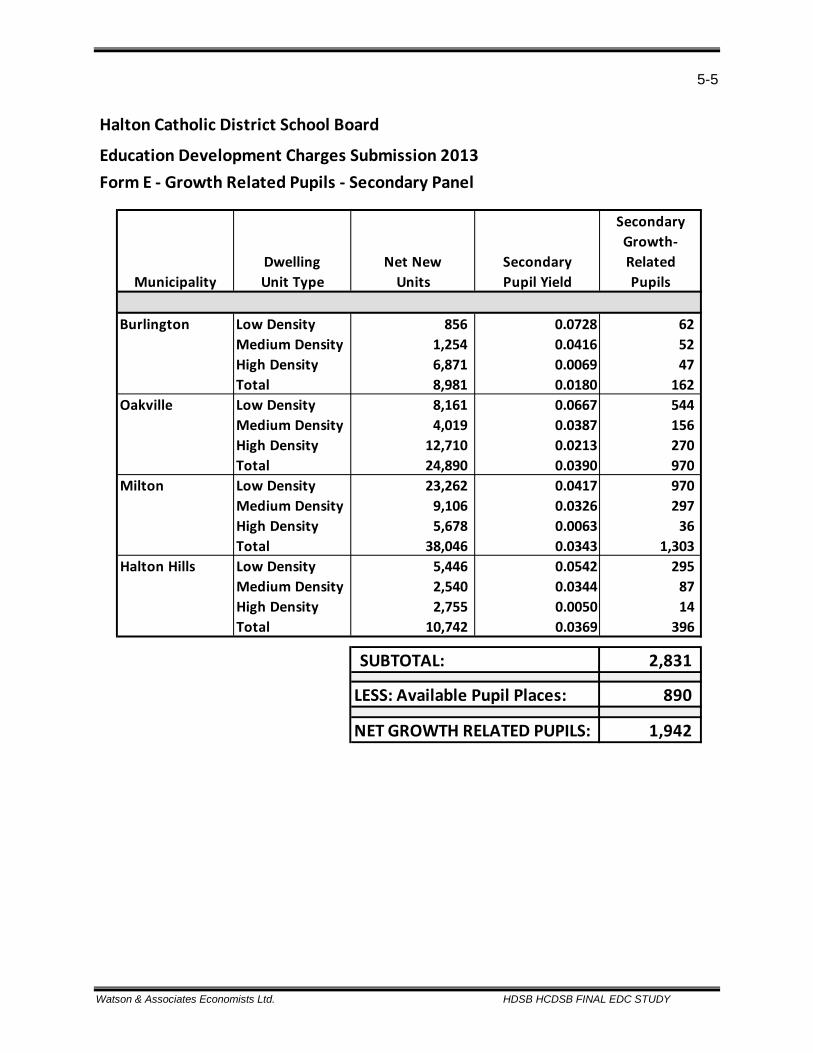
5-5
Watson & Associates Economists Ltd. HDSB HCDSB FINAL EDC STUDY
Halton Catholic District School Board
Education Development Charges Submission 2013Form E - Growth Related Pupils - Secondary Panel
SecondaryGrowth-
Dwelling Net New Secondary RelatedUnit Type Units Pupil Yield Pupils
DE
Burlington Low Density 856 0.0728 62 Medium Density 1,254 0.0416 52 High Density 6,871 0.0069 47 Total 8,981 0.0180 162
Oakville Low Density 8,161 0.0667 544 Medium Density 4,019 0.0387 156 High Density 12,710 0.0213 270 Total 24,890 0.0390 970
Milton Low Density 23,262 0.0417 970 Medium Density 9,106 0.0326 297 High Density 5,678 0.0063 36 Total 38,046 0.0343 1,303
Halton Hills Low Density 5,446 0.0542 295 Medium Density 2,540 0.0344 87 High Density 2,755 0.0050 14 Total 10,742 0.0369 396
SUBTOTAL: 2,831
LESS: Available Pupil Places: 890
NET GROWTH RELATED PUPILS: 1,942
Municipality
5-6
Watson & Associates Economists Ltd. HDSB HCDSB FINAL EDC STUDY
5.2 Net Education Land Costs The enrolment projections, the Board’s long term accommodation plans and the EDC analysis ultimately determine the number of EDC eligible sites which are needed for new growth-related schools. Form F of the Ministry Submission outlines by review area the 15 year enrolment projections as well as the net growth-related pupil places. Form G of the Ministry Submission outlines the number of new sites that will be needed as well as the number of EDC eligible acres of land that are required for those sites. O.Reg 20/98, S.7, specifically paragraphs 4-7, deals with the steps involved in moving from the site component of the calculation to the financial or costing component of the calculation. A cost must be attached to the value of the land that needs to be purchased as well as the costs to provide services and prepare the land for construction. In addition, the balance of the existing EDC reserve funds must be calculated and incorporated into the analysis. Finally, the total eligible revenues, expenditures and existing deficits or surpluses are cashflowed over a 15 year period to determine the final charge. Section 257.53 (2) specifically describes what education land costs are:
1. Costs to acquire land or an interest in land, including a leasehold interest, to be used by the board to provide pupil accommodation.
2. Costs to provide services to the land or otherwise prepare the site so that a building or buildings may built on the land to provide pupil accommodation.
3. Costs to prepare and distribute education development charge background studies. 4. Interest on money borrowed to pay for costs described in paragraphs 1 and 2. 5. Costs to undertake studies in connection with an acquisition referred to in paragraph 1.
N.B – Only the capital component of costs to lease land or to acquire a leasehold interest is an education land cost.
Site Valuation Paragraph 4 of Section 7 of O.Reg 20/98 states that, “The board shall estimate the net education land cost for the elementary school sites and secondary school sites required to provide pupil places for the new elementary school pupils and secondary school pupils.” To determine the costs of land acquisition, both the HDSB and the HCDSB retained the appraisal firm of Cushman & Wakefield. The appraisers were responsible for providing a land value per acre for each EDC eligible site identified in the analysis. In addition the appraisers were asked to provide an annual land escalation factor (for 5 years) to apply to the current land values. Specific details and background to the appraisals can be found in the firm’s appraisal reports which were provided to each School Board. The reports are titled “Hypothetical Analysis
5-7
Watson & Associates Economists Ltd. HDSB HCDSB FINAL EDC STUDY
of Future School Sites To Serve As Input To The Education Development Charges By-law (2013).” The following approach to land valuation was undertaken by the appraisers:
The acreage rates for each site/district have been based on an examination of historic acquisition costs, pending acquisition agreements and options, and available sales data. The information regarding the sites has been provided by the Boards and has been relied upon as being accurate. In addition, the values assume that the sites are zoned and serviced for residential development, notwithstanding the fact the many of the sites are still in the preliminary stages of planning – these “hypothetical” values are intended to capture the cost of land at the time the Board will be purchasing the sites to be used as schools. In undertaking the appraisals, the two most common approaches to the valuation of development land were utilized and are summarized as follows: a) the Direct Comparison Approach which involves comparing or contrasting
the recent sale, listing or optioned prices of comparable properties to the subject and adjusting for any significant differences between them; and,
b) the Land Residual Approach (or Development Approach) which estimates land value based on determining selling prices of serviced lots and considers infrastructure costs and appropriate returns, rendering a ‘residual’ land value component.
The strengths underlying the Land Residual Approach are that it more accurately reflects the specific development parameters of a site, while its weaknesses relate to the preliminary nature of planning and engineering information available. The strengths underlying the Direct Comparison Approach are that it more accurately reflects market attitudes to development land, while its weaknesses relate to the specifics of the subject properties, particularly those that are draft plan approved. For all the subject properties, except where noted, both approaches have been utilized. The effective date of the appraisals is April 1, 2013.
The tables on the following page set out the estimated EDC eligible sites that the Boards will require in the 15 year analysis term, their locations and their appraised land value.
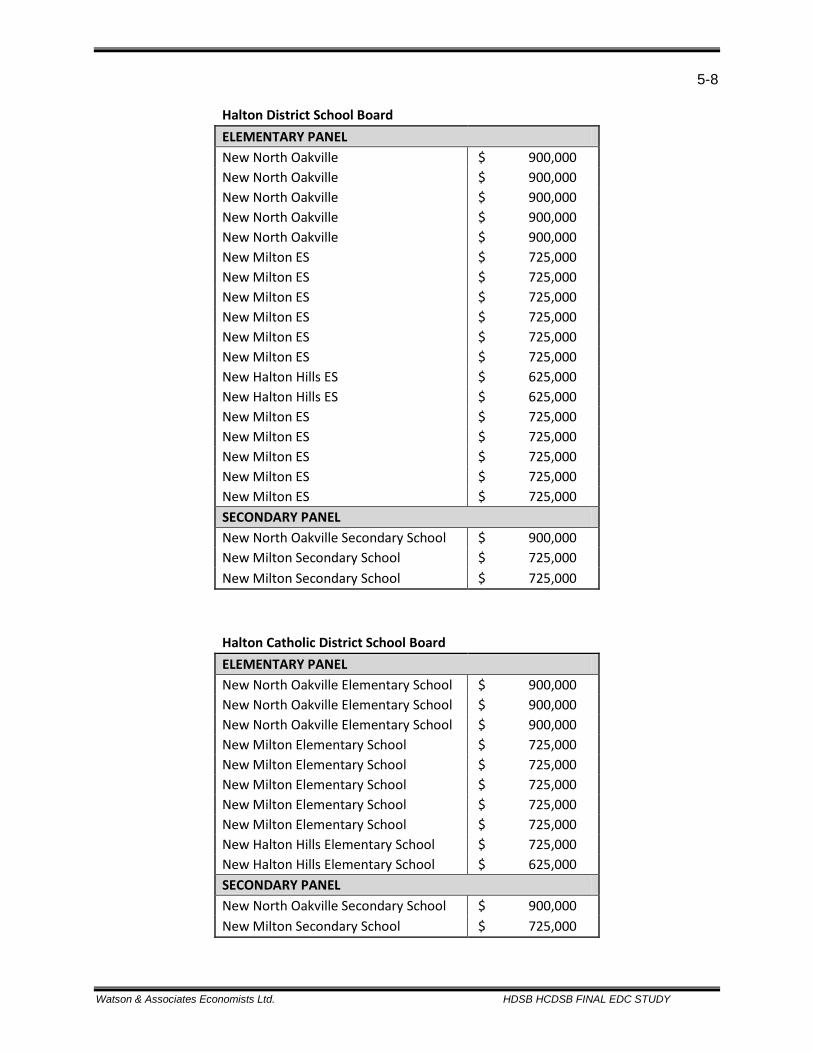
5-8
Watson & Associates Economists Ltd. HDSB HCDSB FINAL EDC STUDY
Halton District School Board ELEMENTARY PANEL New North Oakville $ 900,000 New North Oakville $ 900,000 New North Oakville $ 900,000 New North Oakville $ 900,000 New North Oakville $ 900,000 New Milton ES $ 725,000 New Milton ES $ 725,000 New Milton ES $ 725,000 New Milton ES $ 725,000 New Milton ES $ 725,000 New Milton ES $ 725,000 New Halton Hills ES $ 625,000 New Halton Hills ES $ 625,000 New Milton ES $ 725,000 New Milton ES $ 725,000 New Milton ES $ 725,000 New Milton ES $ 725,000 New Milton ES $ 725,000 SECONDARY PANEL New North Oakville Secondary School $ 900,000 New Milton Secondary School $ 725,000 New Milton Secondary School $ 725,000
Halton Catholic District School Board ELEMENTARY PANEL New North Oakville Elementary School $ 900,000 New North Oakville Elementary School $ 900,000 New North Oakville Elementary School $ 900,000 New Milton Elementary School $ 725,000 New Milton Elementary School $ 725,000 New Milton Elementary School $ 725,000 New Milton Elementary School $ 725,000 New Milton Elementary School $ 725,000 New Halton Hills Elementary School $ 725,000 New Halton Hills Elementary School $ 625,000 SECONDARY PANEL New North Oakville Secondary School $ 900,000 New Milton Secondary School $ 725,000
5-9
Watson & Associates Economists Ltd. HDSB HCDSB FINAL EDC STUDY
Land Escalation over the Forecast Period As previously mentioned, the appraiser’s report estimates an annual land escalation rate to be applied to the acreage values in order to sustain the likely site acquisition costs over the next 5 years. In arriving at an escalation factor the appraisers considered the recent historical general economic conditions at both the micro- and macro-economic levels. The purchase of school sites by the Boards takes place on a very local level, with Boards entering into negotiations with developers on a site-specific basis. Notwithstanding the individual nature of these transactions, it is important to recognize the perception that the health and stability of the economy as a whole has been downgraded, with impacts felt in virtually all sectors including residential land sales. Having regard for all of the above, the appraisers concluded escalation factors of 2.5% per annum for the first year through to the final year are reasonable for the purposes of projecting the land values over the five year by-law period. Land Development and Servicing Costs The Education Act includes the, “costs to provide services to the land or otherwise prepare the site so that a building or buildings may be built on the land to provide pupil accommodation” as an EDC eligible education cost. These costs typically include services to the lot line of the property, rough grading and compaction of the site and that the site is cleared of debris. Costs related to studies of land being considered for acquisition such as environmental assessments or soil studies are also considered to be EDC eligible. Discussions with stakeholders and the Ministry of Education in past EDC by-law processes has resulted in a list that includes some of the primary development and servicing costs that are considered to be EDC eligible:
• Agent/commission fees to acquire sites. • Municipal requirements to maintain sites prior to construction. • Appraisal studies, legal fees. • Expropriation Costs. • Site option agreements. • Land transfer taxes.
Based on recent historical site preparation costs that were provided by the School Boards a figure of $153,385 per acre for HDSB $169, 842 per acre for HCDSB was used in the study. The discrepancy in site preparation costs is a result of fibre optics costs and each Board using different providers with varying costs between the providers. Using historical economic data and construction cost indices, an escalation factor of 2.2% per annum was applied to the
5-10
Watson & Associates Economists Ltd. HDSB HCDSB FINAL EDC STUDY
assumed per acre site preparation costs. Site preparation costs are escalated to the time of site purchase. Total Land Costs The total net education land costs including the site acquisition costs, the escalation of land over the term of the by-law (five years), the site development/servicing costs, as well as associated financing costs and study costs are projected to be over $261 million for the HDSB. The HCDSB is projected to incur total education land costs of more than $144 million over the 15 year term of the proposed by-law. 5.3 Reconciliation of the EDC Reserve Fund Before the final growth-related net education land costs can be determined they must be adjusted by any deficit or surplus in the existing EDC reserve fund. Any outstanding education development charge financial obligations that have been incurred by the board under a previous by law are added to the total land costs. If there is a positive balance in the EDC reserve fund this amount is subtracted from the total land costs and used to defray EDC eligible expenditures. Section 7, paragraphs 5-7 of O.Reg 20/98 describe the process of deriving the final net education land costs.
“The board shall estimate the balance of the education development charge reserve fund, if any, relating to the area in which the charges are to be imposed. The estimate shall be an estimate of the balance immediately before the day the board intends to have the by-law come into force.” “The board shall adjust the net education land costs with respect to any balance estimated under paragraph 5. If the balance is positive, the balance shall be subtracted from the cost. If the balance is negative, the balance shall be converted to a positive number and added to the cost.” “The net education land cost as adjusted, if necessary, under paragraph 6, is the growth related net education land cost.”
The reserve fund analysis can be found on the following pages for each board. The analysis summarizes the EDC collections (both actual and estimated) as well as the EDC costs that have been expended (both actual and estimated) and the estimated EDC reserve fund balance. As noted, the EDC reserve fund includes certain estimates respecting revenues and expenditures. The first part of the EDC reserve fund reconciliation involves adjusting the estimated opening balance of the previous by-law to reflect actual costs - EDC collections are
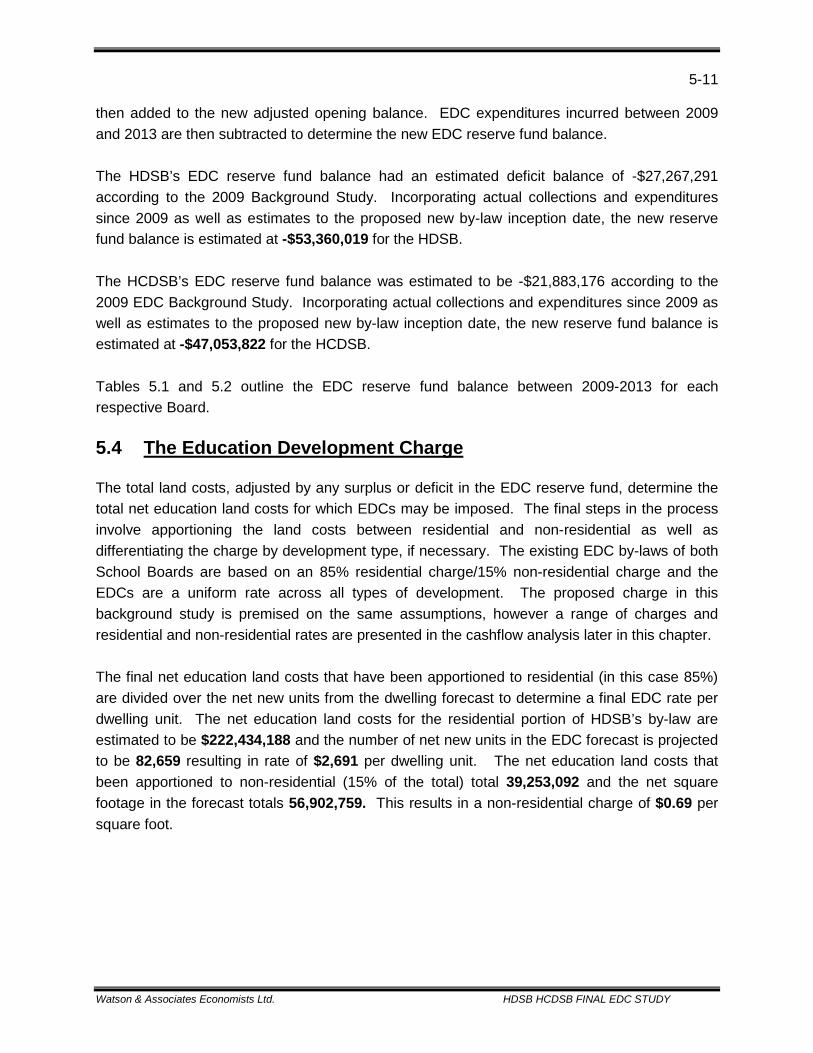
5-11
Watson & Associates Economists Ltd. HDSB HCDSB FINAL EDC STUDY
then added to the new adjusted opening balance. EDC expenditures incurred between 2009 and 2013 are then subtracted to determine the new EDC reserve fund balance. The HDSB’s EDC reserve fund balance had an estimated deficit balance of -$27,267,291 according to the 2009 Background Study. Incorporating actual collections and expenditures since 2009 as well as estimates to the proposed new by-law inception date, the new reserve fund balance is estimated at -$53,360,019 for the HDSB. The HCDSB’s EDC reserve fund balance was estimated to be -$21,883,176 according to the 2009 EDC Background Study. Incorporating actual collections and expenditures since 2009 as well as estimates to the proposed new by-law inception date, the new reserve fund balance is estimated at -$47,053,822 for the HCDSB. Tables 5.1 and 5.2 outline the EDC reserve fund balance between 2009-2013 for each respective Board. 5.4 The Education Development Charge The total land costs, adjusted by any surplus or deficit in the EDC reserve fund, determine the total net education land costs for which EDCs may be imposed. The final steps in the process involve apportioning the land costs between residential and non-residential as well as differentiating the charge by development type, if necessary. The existing EDC by-laws of both School Boards are based on an 85% residential charge/15% non-residential charge and the EDCs are a uniform rate across all types of development. The proposed charge in this background study is premised on the same assumptions, however a range of charges and residential and non-residential rates are presented in the cashflow analysis later in this chapter. The final net education land costs that have been apportioned to residential (in this case 85%) are divided over the net new units from the dwelling forecast to determine a final EDC rate per dwelling unit. The net education land costs for the residential portion of HDSB’s by-law are estimated to be $222,434,188 and the number of net new units in the EDC forecast is projected to be 82,659 resulting in rate of $2,691 per dwelling unit. The net education land costs that been apportioned to non-residential (15% of the total) total 39,253,092 and the net square footage in the forecast totals 56,902,759. This results in a non-residential charge of $0.69 per square foot.
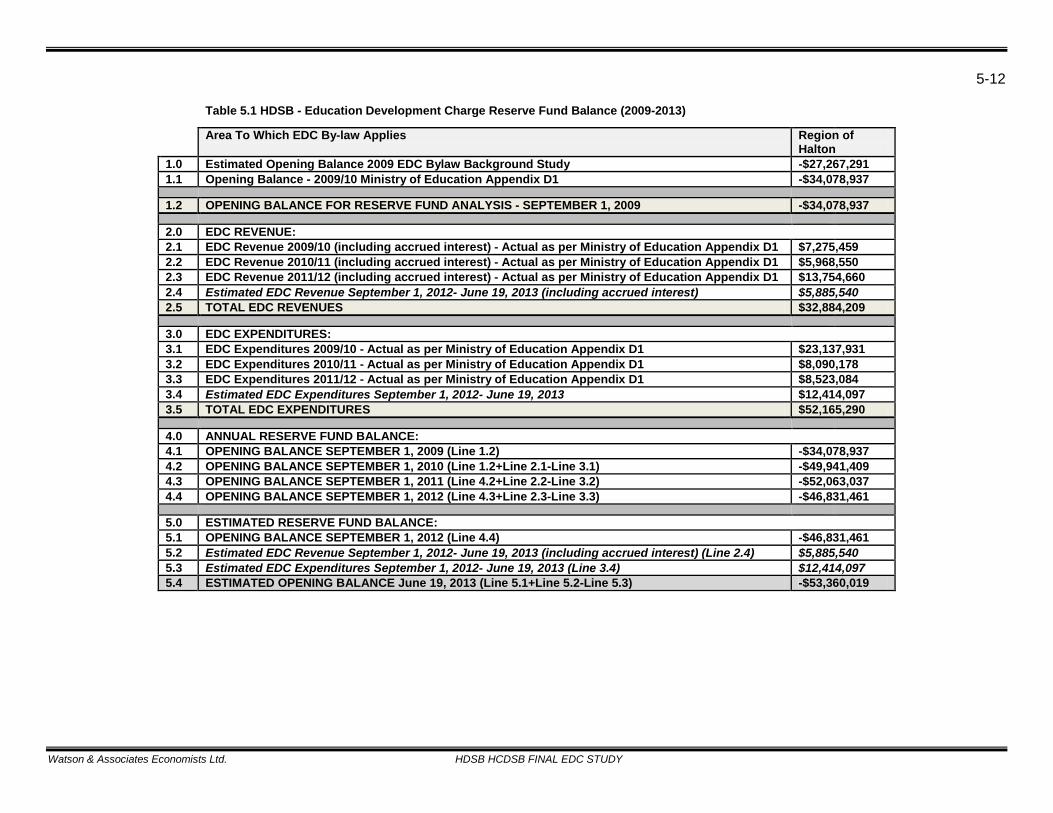
5-12
Watson & Associates Economists Ltd. HDSB HCDSB FINAL EDC STUDY
Table 5.1 HDSB - Education Development Charge Reserve Fund Balance (2009-2013) Area To Which EDC By-law Applies Region of
Halton 1.0 Estimated Opening Balance 2009 EDC Bylaw Background Study -$27,267,291 1.1 Opening Balance - 2009/10 Ministry of Education Appendix D1 -$34,078,937 1.2 OPENING BALANCE FOR RESERVE FUND ANALYSIS - SEPTEMBER 1, 2009 -$34,078,937 2.0 EDC REVENUE: 2.1 EDC Revenue 2009/10 (including accrued interest) - Actual as per Ministry of Education Appendix D1 $7,275,459 2.2 EDC Revenue 2010/11 (including accrued interest) - Actual as per Ministry of Education Appendix D1 $5,968,550 2.3 EDC Revenue 2011/12 (including accrued interest) - Actual as per Ministry of Education Appendix D1 $13,754,660 2.4 Estimated EDC Revenue September 1, 2012- June 19, 2013 (including accrued interest) $5,885,540 2.5 TOTAL EDC REVENUES $32,884,209 3.0 EDC EXPENDITURES: 3.1 EDC Expenditures 2009/10 - Actual as per Ministry of Education Appendix D1 $23,137,931 3.2 EDC Expenditures 2010/11 - Actual as per Ministry of Education Appendix D1 $8,090,178 3.3 EDC Expenditures 2011/12 - Actual as per Ministry of Education Appendix D1 $8,523,084 3.4 Estimated EDC Expenditures September 1, 2012- June 19, 2013 $12,414,097 3.5 TOTAL EDC EXPENDITURES $52,165,290 4.0 ANNUAL RESERVE FUND BALANCE: 4.1 OPENING BALANCE SEPTEMBER 1, 2009 (Line 1.2) -$34,078,937 4.2 OPENING BALANCE SEPTEMBER 1, 2010 (Line 1.2+Line 2.1-Line 3.1) -$49,941,409 4.3 OPENING BALANCE SEPTEMBER 1, 2011 (Line 4.2+Line 2.2-Line 3.2) -$52,063,037 4.4 OPENING BALANCE SEPTEMBER 1, 2012 (Line 4.3+Line 2.3-Line 3.3) -$46,831,461 5.0 ESTIMATED RESERVE FUND BALANCE: 5.1 OPENING BALANCE SEPTEMBER 1, 2012 (Line 4.4) -$46,831,461 5.2 Estimated EDC Revenue September 1, 2012- June 19, 2013 (including accrued interest) (Line 2.4) $5,885,540 5.3 Estimated EDC Expenditures September 1, 2012- June 19, 2013 (Line 3.4) $12,414,097 5.4 ESTIMATED OPENING BALANCE June 19, 2013 (Line 5.1+Line 5.2-Line 5.3) -$53,360,019
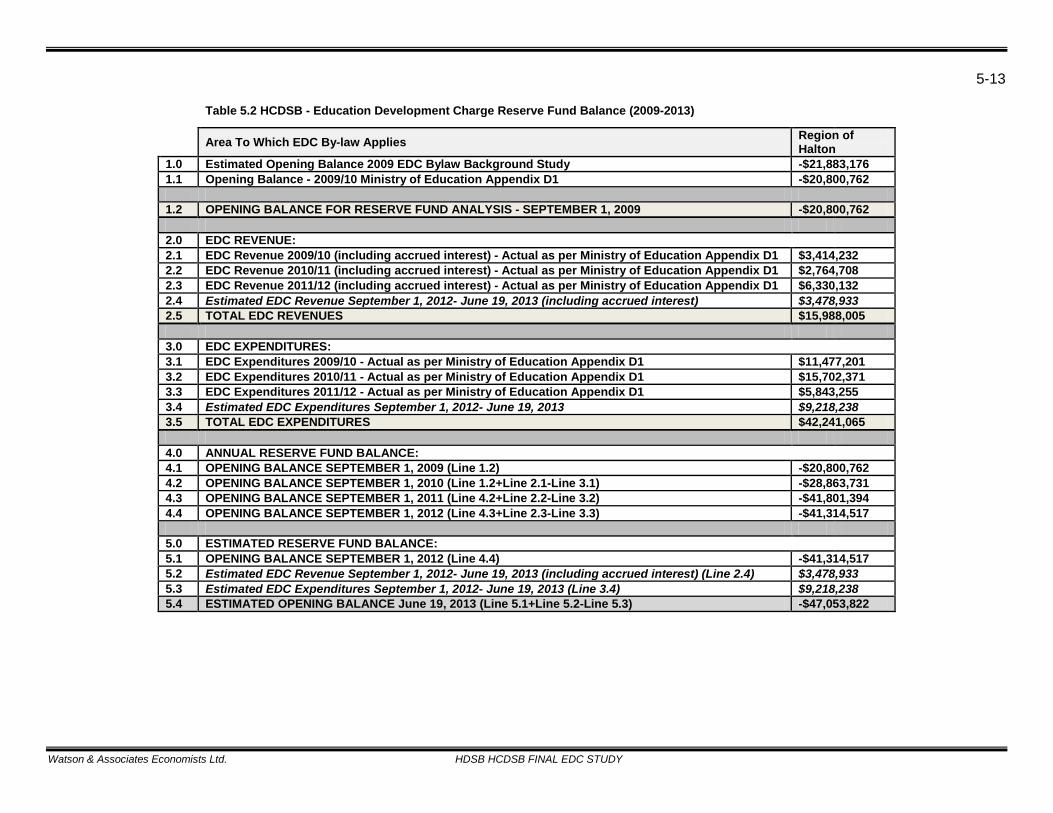
5-13
Watson & Associates Economists Ltd. HDSB HCDSB FINAL EDC STUDY
Table 5.2 HCDSB - Education Development Charge Reserve Fund Balance (2009-2013)
Area To Which EDC By-law Applies Region of Halton
1.0 Estimated Opening Balance 2009 EDC Bylaw Background Study -$21,883,176 1.1 Opening Balance - 2009/10 Ministry of Education Appendix D1 -$20,800,762 1.2 OPENING BALANCE FOR RESERVE FUND ANALYSIS - SEPTEMBER 1, 2009 -$20,800,762 2.0 EDC REVENUE: 2.1 EDC Revenue 2009/10 (including accrued interest) - Actual as per Ministry of Education Appendix D1 $3,414,232 2.2 EDC Revenue 2010/11 (including accrued interest) - Actual as per Ministry of Education Appendix D1 $2,764,708 2.3 EDC Revenue 2011/12 (including accrued interest) - Actual as per Ministry of Education Appendix D1 $6,330,132 2.4 Estimated EDC Revenue September 1, 2012- June 19, 2013 (including accrued interest) $3,478,933 2.5 TOTAL EDC REVENUES $15,988,005 3.0 EDC EXPENDITURES: 3.1 EDC Expenditures 2009/10 - Actual as per Ministry of Education Appendix D1 $11,477,201 3.2 EDC Expenditures 2010/11 - Actual as per Ministry of Education Appendix D1 $15,702,371 3.3 EDC Expenditures 2011/12 - Actual as per Ministry of Education Appendix D1 $5,843,255 3.4 Estimated EDC Expenditures September 1, 2012- June 19, 2013 $9,218,238 3.5 TOTAL EDC EXPENDITURES $42,241,065 4.0 ANNUAL RESERVE FUND BALANCE: 4.1 OPENING BALANCE SEPTEMBER 1, 2009 (Line 1.2) -$20,800,762 4.2 OPENING BALANCE SEPTEMBER 1, 2010 (Line 1.2+Line 2.1-Line 3.1) -$28,863,731 4.3 OPENING BALANCE SEPTEMBER 1, 2011 (Line 4.2+Line 2.2-Line 3.2) -$41,801,394 4.4 OPENING BALANCE SEPTEMBER 1, 2012 (Line 4.3+Line 2.3-Line 3.3) -$41,314,517 5.0 ESTIMATED RESERVE FUND BALANCE: 5.1 OPENING BALANCE SEPTEMBER 1, 2012 (Line 4.4) -$41,314,517 5.2 Estimated EDC Revenue September 1, 2012- June 19, 2013 (including accrued interest) (Line 2.4) $3,478,933 5.3 Estimated EDC Expenditures September 1, 2012- June 19, 2013 (Line 3.4) $9,218,238 5.4 ESTIMATED OPENING BALANCE June 19, 2013 (Line 5.1+Line 5.2-Line 5.3) -$47,053,822
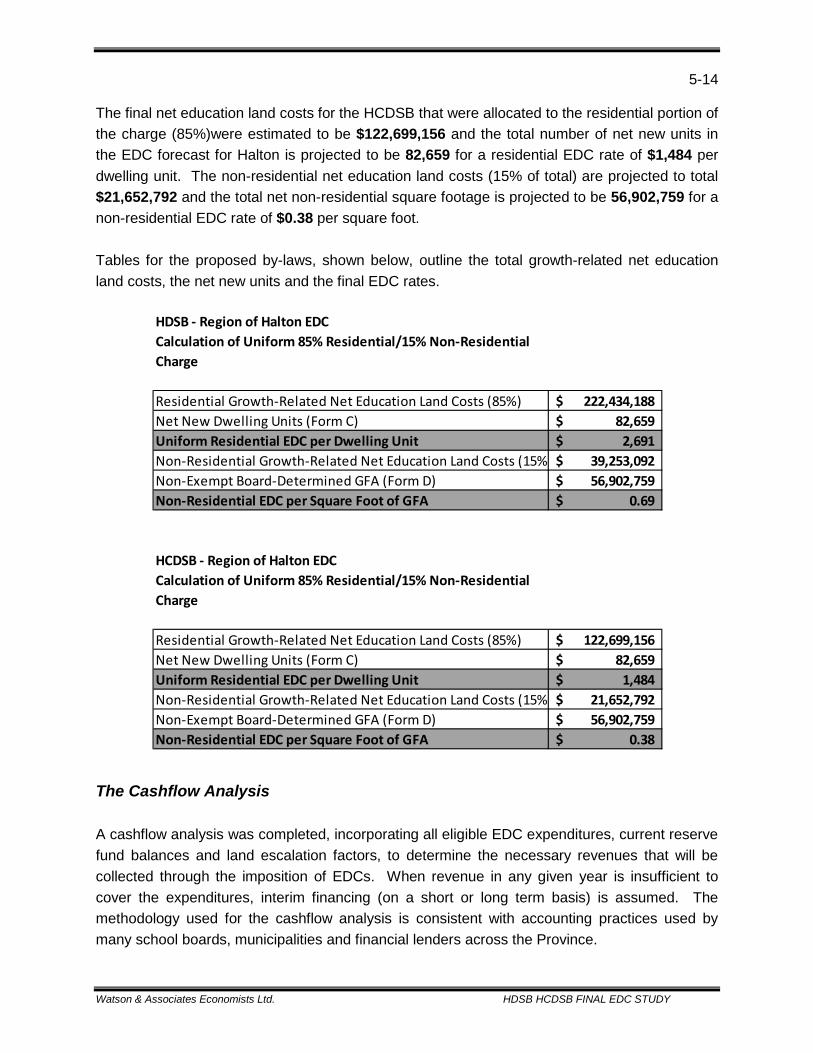
5-14
Watson & Associates Economists Ltd. HDSB HCDSB FINAL EDC STUDY
The final net education land costs for the HCDSB that were allocated to the residential portion of the charge (85%)were estimated to be $122,699,156 and the total number of net new units in the EDC forecast for Halton is projected to be 82,659 for a residential EDC rate of $1,484 per dwelling unit. The non-residential net education land costs (15% of total) are projected to total $21,652,792 and the total net non-residential square footage is projected to be 56,902,759 for a non-residential EDC rate of $0.38 per square foot. Tables for the proposed by-laws, shown below, outline the total growth-related net education land costs, the net new units and the final EDC rates.
The Cashflow Analysis A cashflow analysis was completed, incorporating all eligible EDC expenditures, current reserve fund balances and land escalation factors, to determine the necessary revenues that will be collected through the imposition of EDCs. When revenue in any given year is insufficient to cover the expenditures, interim financing (on a short or long term basis) is assumed. The methodology used for the cashflow analysis is consistent with accounting practices used by many school boards, municipalities and financial lenders across the Province.
HDSB - Region of Halton EDCCalculation of Uniform 85% Residential/15% Non-Residential Charge
Residential Growth-Related Net Education Land Costs (85%) 222,434,188$ Net New Dwelling Units (Form C) 82,659$ Uniform Residential EDC per Dwelling Unit 2,691$ Non-Residential Growth-Related Net Education Land Costs (15%) 39,253,092$ Non-Exempt Board-Determined GFA (Form D) 56,902,759$ Non-Residential EDC per Square Foot of GFA 0.69$
HCDSB - Region of Halton EDCCalculation of Uniform 85% Residential/15% Non-Residential Charge
Residential Growth-Related Net Education Land Costs (85%) 122,699,156$ Net New Dwelling Units (Form C) 82,659$ Uniform Residential EDC per Dwelling Unit 1,484$ Non-Residential Growth-Related Net Education Land Costs (15%) 21,652,792$ Non-Exempt Board-Determined GFA (Form D) 56,902,759$ Non-Residential EDC per Square Foot of GFA 0.38$
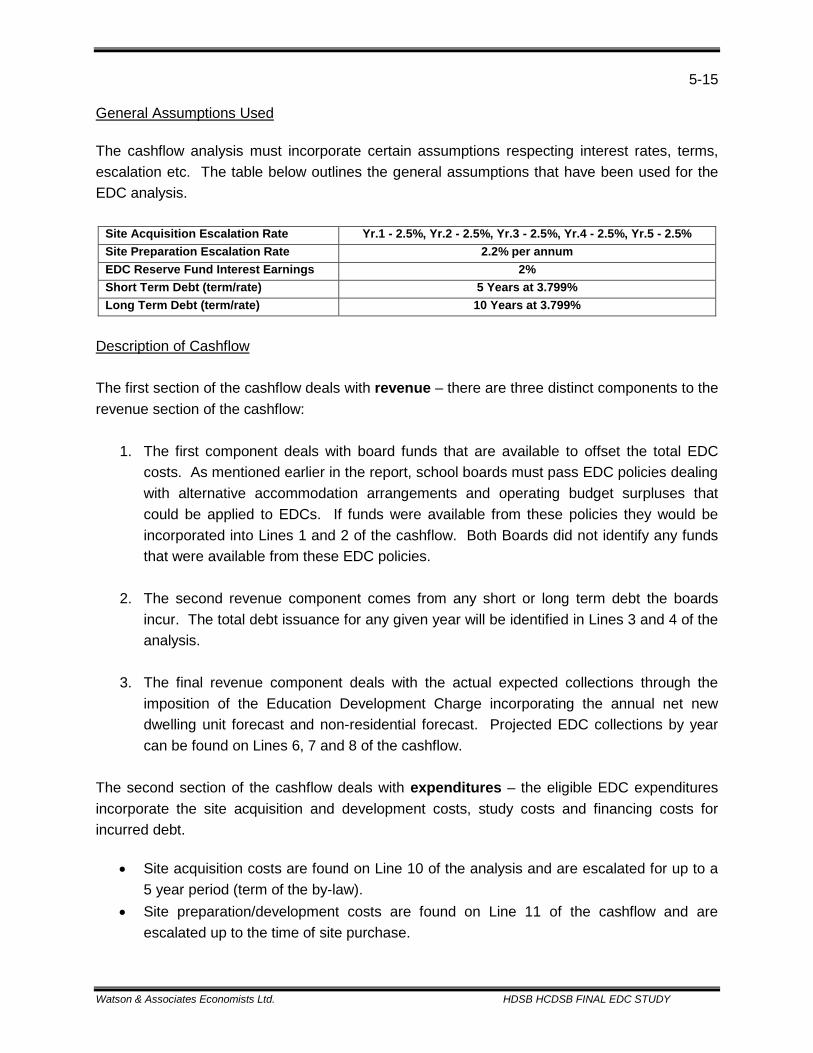
5-15
Watson & Associates Economists Ltd. HDSB HCDSB FINAL EDC STUDY
General Assumptions Used The cashflow analysis must incorporate certain assumptions respecting interest rates, terms, escalation etc. The table below outlines the general assumptions that have been used for the EDC analysis.
Site Acquisition Escalation Rate Yr.1 - 2.5%, Yr.2 - 2.5%, Yr.3 - 2.5%, Yr.4 - 2.5%, Yr.5 - 2.5% Site Preparation Escalation Rate 2.2% per annum EDC Reserve Fund Interest Earnings 2% Short Term Debt (term/rate) 5 Years at 3.799% Long Term Debt (term/rate) 10 Years at 3.799%
Description of Cashflow The first section of the cashflow deals with revenue – there are three distinct components to the revenue section of the cashflow:
1. The first component deals with board funds that are available to offset the total EDC costs. As mentioned earlier in the report, school boards must pass EDC policies dealing with alternative accommodation arrangements and operating budget surpluses that could be applied to EDCs. If funds were available from these policies they would be incorporated into Lines 1 and 2 of the cashflow. Both Boards did not identify any funds that were available from these EDC policies.
2. The second revenue component comes from any short or long term debt the boards incur. The total debt issuance for any given year will be identified in Lines 3 and 4 of the analysis.
3. The final revenue component deals with the actual expected collections through the
imposition of the Education Development Charge incorporating the annual net new dwelling unit forecast and non-residential forecast. Projected EDC collections by year can be found on Lines 6, 7 and 8 of the cashflow.
The second section of the cashflow deals with expenditures – the eligible EDC expenditures incorporate the site acquisition and development costs, study costs and financing costs for incurred debt.
• Site acquisition costs are found on Line 10 of the analysis and are escalated for up to a 5 year period (term of the by-law).
• Site preparation/development costs are found on Line 11 of the cashflow and are escalated up to the time of site purchase.
5-16
Watson & Associates Economists Ltd. HDSB HCDSB FINAL EDC STUDY
• Study costs (Line 12) are based on historical board data and are included for each expected subsequent by-law renewal (every 5 years).
• Long and short term financing costs (debt carrying costs) are found on Lines 13 and 14 of the cashflow analysis.
The final section of the cashflow provides the projected opening and closing balances of the EDC reserve fund incorporating any existing deficit or surplus as well as annual interest earnings on any balance in the account. Total borrowing, debt payments and outstanding debt can be found in the bottom right portion of the cashflow analysis. The cashflow analysis also provides a range of possible EDC charges based on different residential and non-residential allocations. All EDCs calculated in this study are based on 85% residential and 15% non-residential collection. The top right portion of the cashflow analysis highlights the possible residential and non-residential EDC rates with a range of 0-40% for non-residential allocations. Cashflows for each School Board are included in Tables 5.3 and 5.4 on the following pages.
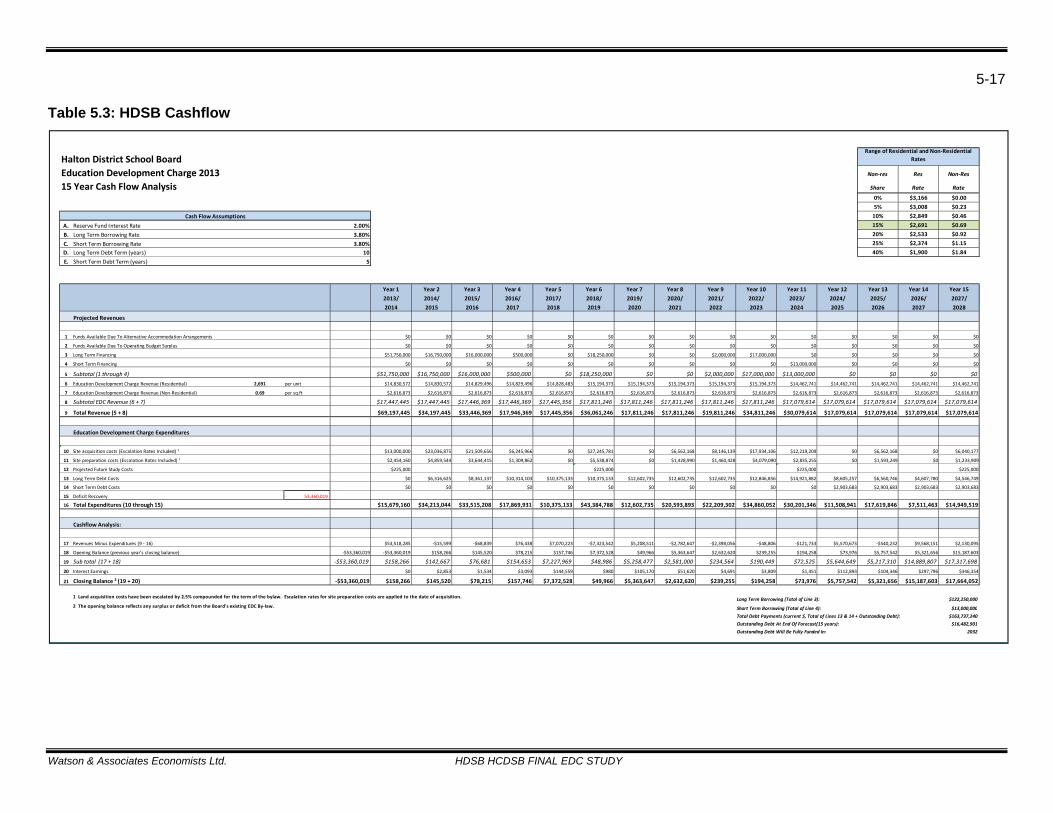
5-17
Watson & Associates Economists Ltd. HDSB HCDSB FINAL EDC STUDY
Table 5.3: HDSB Cashflow
Halton District School BoardRange of Residential and Non‐Residential
Rates
Education Development Charge 2013 Non‐res Res Non‐Res
15 Year Cash Flow Analysis Share Rate Rate
0% $3,166 $0.005% $3,008 $0.23
Cash Flow Assumptions 10% $2,849 $0.46
A. Reserve Fund Interest Rate 2.00% 15% $2,691 $0.69
B. Long Term Borrowing Rate 3.80% 20% $2,533 $0.92
C. Short Term Borrowing Rate 3.80% 25% $2,374 $1.15D. Long Term Debt Term (years) 10 40% $1,900 $1.84E. Short Term Debt Term (years) 5
Year 1 Year 2 Year 3 Year 4 Year 5 Year 6 Year 7 Year 8 Year 9 Year 10 Year 11 Year 12 Year 13 Year 14 Year 152013/ 2014/ 2015/ 2016/ 2017/ 2018/ 2019/ 2020/ 2021/ 2022/ 2023/ 2024/ 2025/ 2026/ 2027/2014 2015 2016 2017 2018 2019 2020 2021 2022 2023 2024 2025 2026 2027 2028
Projected Revenues
1 Funds Available Due To Alternative Accommodation Arrangements $0 $0 $0 $0 $0 $0 $0 $0 $0 $0 $0 $0 $0 $0 $0
2 Funds Available Due To Operating Budget Surplus $0 $0 $0 $0 $0 $0 $0 $0 $0 $0 $0 $0 $0 $0 $0
3 Long Term Financing $51,750,000 $16,750,000 $16,000,000 $500,000 $0 $18,250,000 $0 $0 $2,000,000 $17,000,000 $0 $0 $0 $0 $0
4 Short Term Financing $0 $0 $0 $0 $0 $0 $0 $0 $0 $0 $13,000,000 $0 $0 $0 $0
5 Subtotal (1 through 4) $51,750,000 $16,750,000 $16,000,000 $500,000 $0 $18,250,000 $0 $0 $2,000,000 $17,000,000 $13,000,000 $0 $0 $0 $06 Education Development Charge Revenue (Residential) 0.85 2,691 per unit $14,830,572 $14,830,572 $14,829,496 $14,829,496 $14,828,483 $15,194,373 $15,194,373 $15,194,373 $15,194,373 $15,194,373 $14,462,741 $14,462,741 $14,462,741 $14,462,741 $14,462,741
7 Education Development Charge Revenue (Non‐Residential) 0.150 0.69 per sq.ft $2,616,873 $2,616,873 $2,616,873 $2,616,873 $2,616,873 $2,616,873 $2,616,873 $2,616,873 $2,616,873 $2,616,873 $2,616,873 $2,616,873 $2,616,873 $2,616,873 $2,616,873
8 Subtotal EDC Revenue (6 + 7) $17,447,445 $17,447,445 $17,446,369 $17,446,369 $17,445,356 $17,811,246 $17,811,246 $17,811,246 $17,811,246 $17,811,246 $17,079,614 $17,079,614 $17,079,614 $17,079,614 $17,079,614
9 Total Revenue (5 + 8) 3,166 17,664,052 $69,197,445 $34,197,445 $33,446,369 $17,946,369 $17,445,356 $36,061,246 $17,811,246 $17,811,246 $19,811,246 $34,811,246 $30,079,614 $17,079,614 $17,079,614 $17,079,614 $17,079,614
0 16,482,901
Education Development Charge Expenditures
10 Site acquisition costs (Escalation Rates Included) ¹ $13,000,000 $23,036,875 $21,509,656 $6,245,966 $0 $27,245,781 $0 $6,562,168 $8,146,139 $17,934,106 $12,219,209 $0 $6,562,168 $0 $6,040,177
11 Site preparation costs (Escalation Rates Included) ¹ $2,454,160 $4,859,544 $3,644,415 $1,309,862 $0 $5,538,874 $0 $1,428,990 $1,460,428 $4,079,090 $2,835,255 $0 $1,593,249 $0 $1,233,909
12 Projected Future Study Costs $225,000 $225,000 $225,000 $225,000
13 Long Term Debt Costs $0 $6,316,625 $8,361,137 $10,314,103 $10,375,133 $10,375,133 $12,602,735 $12,602,735 $12,602,735 $12,846,856 $14,921,882 $8,605,257 $6,560,746 $4,607,780 $4,546,749
14 Short Term Debt Costs $0 $0 $0 $0 $0 $0 $0 $0 $0 $0 $0 $2,903,683 $2,903,683 $2,903,683 $2,903,683
15 Deficit Recovery 53,360,019‐
16 Total Expenditures (10 through 15) $15,679,160 $34,213,044 $33,515,208 $17,869,931 $10,375,133 $43,384,788 $12,602,735 $20,593,893 $22,209,302 $34,860,052 $30,201,346 $11,508,941 $17,619,846 $7,511,463 $14,949,519
Cashflow Analysis:
17 Revenues Minus Expenditures (9 ‐ 16) $53,518,285 ‐$15,599 ‐$68,839 $76,438 $7,070,223 ‐$7,323,542 $5,208,511 ‐$2,782,647 ‐$2,398,056 ‐$48,806 ‐$121,733 $5,570,673 ‐$540,232 $9,568,151 $2,130,095
18 Opening Balance (previous year's closing balance) ‐$53,360,019 ‐$53,360,019 $158,266 $145,520 $78,215 $157,746 $7,372,528 $49,966 $5,363,647 $2,632,620 $239,255 $194,258 $73,976 $5,757,542 $5,321,656 $15,187,603
19 Sub total (17 + 18) ‐$53,360,019 $158,266 $142,667 $76,681 $154,653 $7,227,969 $48,986 $5,258,477 $2,581,000 $234,564 $190,449 $72,525 $5,644,649 $5,217,310 $14,889,807 $17,317,69820 Interest Earnings $0 $2,853 $1,534 $3,093 $144,559 $980 $105,170 $51,620 $4,691 $3,809 $1,451 $112,893 $104,346 $297,796 $346,354
21 Closing Balance ² (19 + 20) ‐$53,360,019 $158,266 $145,520 $78,215 $157,746 $7,372,528 $49,966 $5,363,647 $2,632,620 $239,255 $194,258 $73,976 $5,757,542 $5,321,656 $15,187,603 $17,664,052
1 Land acquisition costs have been escalated by 2.5% compounded for the term of the bylaw. Escalation rates for site preparation costs are applied to the date of acquisition. Long Term Borrowing (Total of Line 3): $122,250,0002 The opening balance reflects any surplus or deficit from the Board's existing EDC By‐law. Short Term Borrowing (Total of Line 4): $13,000,000
Total Debt Payments (current $, Total of Lines 13 & 14 + Outstanding Debt): $163,737,240Outstanding Debt At End Of Forecast(15 years): $16,482,901Outstanding Debt Will Be Fully Funded In: 2032
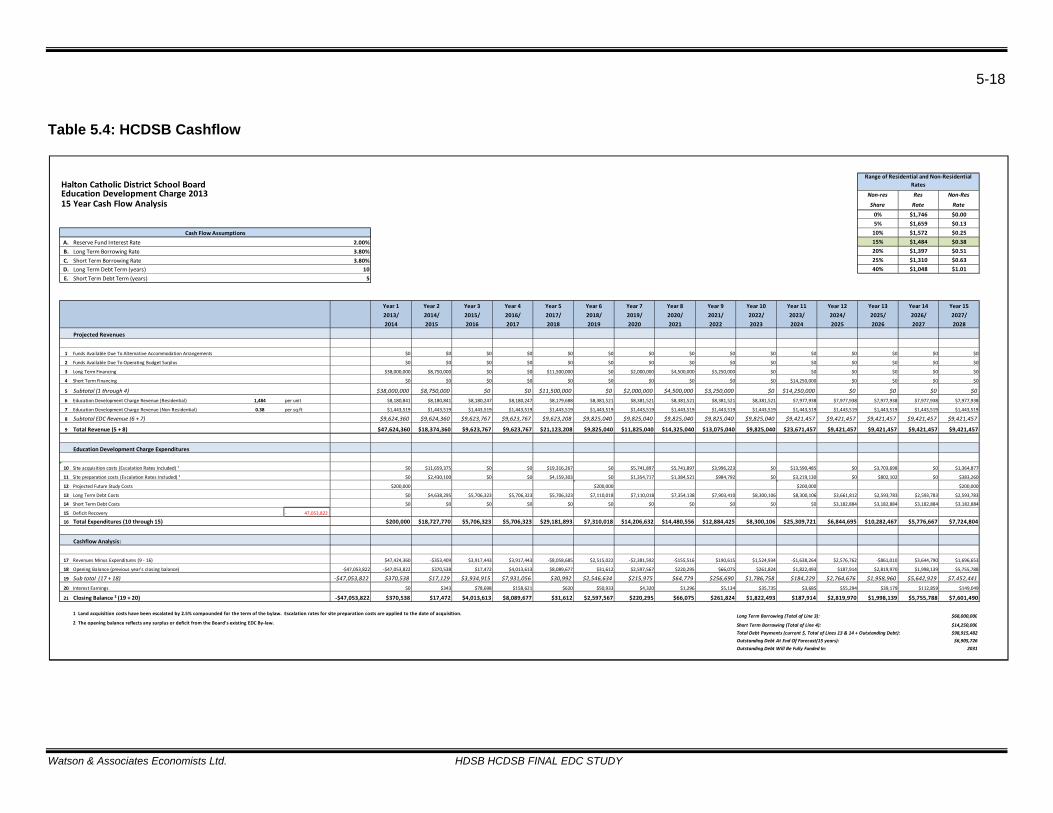
5-18
Watson & Associates Economists Ltd. HDSB HCDSB FINAL EDC STUDY
Table 5.4: HCDSB Cashflow
Halton Catholic District School BoardRange of Residential and Non‐Residential
Rates
Education Development Charge 2013 Non‐res Res Non‐Res
15 Year Cash Flow Analysis Share Rate Rate
0% $1,746 $0.005% $1,659 $0.13
Cash Flow Assumptions 10% $1,572 $0.25
A. Reserve Fund Interest Rate 2.00% 15% $1,484 $0.38
B. Long Term Borrowing Rate 3.80% 20% $1,397 $0.51
C. Short Term Borrowing Rate 3.80% 25% $1,310 $0.63D. Long Term Debt Term (years) 10 40% $1,048 $1.01E. Short Term Debt Term (years) 5
Year 1 Year 2 Year 3 Year 4 Year 5 Year 6 Year 7 Year 8 Year 9 Year 10 Year 11 Year 12 Year 13 Year 14 Year 152013/ 2014/ 2015/ 2016/ 2017/ 2018/ 2019/ 2020/ 2021/ 2022/ 2023/ 2024/ 2025/ 2026/ 2027/2014 2015 2016 2017 2018 2019 2020 2021 2022 2023 2024 2025 2026 2027 2028
Projected Revenues
1 Funds Available Due To Alternative Accommodation Arrangements $0 $0 $0 $0 $0 $0 $0 $0 $0 $0 $0 $0 $0 $0 $0
2 Funds Available Due To Operating Budget Surplus $0 $0 $0 $0 $0 $0 $0 $0 $0 $0 $0 $0 $0 $0 $0
3 Long Term Financing $38,000,000 $8,750,000 $0 $0 $11,500,000 $0 $2,000,000 $4,500,000 $3,250,000 $0 $0 $0 $0 $0 $0
4 Short Term Financing $0 $0 $0 $0 $0 $0 $0 $0 $0 $0 $14,250,000 $0 $0 $0 $0
5 Subtotal (1 through 4) $38,000,000 $8,750,000 $0 $0 $11,500,000 $0 $2,000,000 $4,500,000 $3,250,000 $0 $14,250,000 $0 $0 $0 $06 Education Development Charge Revenue (Residential) 0.85 1,484 per unit $8,180,841 $8,180,841 $8,180,247 $8,180,247 $8,179,688 $8,381,521 $8,381,521 $8,381,521 $8,381,521 $8,381,521 $7,977,938 $7,977,938 $7,977,938 $7,977,938 $7,977,938
7 Education Development Charge Revenue (Non‐Residential) 0.150 0.38 per sq.ft $1,443,519 $1,443,519 $1,443,519 $1,443,519 $1,443,519 $1,443,519 $1,443,519 $1,443,519 $1,443,519 $1,443,519 $1,443,519 $1,443,519 $1,443,519 $1,443,519 $1,443,519
8 Subtotal EDC Revenue (6 + 7) $9,624,360 $9,624,360 $9,623,767 $9,623,767 $9,623,208 $9,825,040 $9,825,040 $9,825,040 $9,825,040 $9,825,040 $9,421,457 $9,421,457 $9,421,457 $9,421,457 $9,421,457
9 Total Revenue (5 + 8) 1,746 7,601,490 $47,624,360 $18,374,360 $9,623,767 $9,623,767 $21,123,208 $9,825,040 $11,825,040 $14,325,040 $13,075,040 $9,825,040 $23,671,457 $9,421,457 $9,421,457 $9,421,457 $9,421,457
0 6,905,726
Education Development Charge Expenditures
10 Site acquisition costs (Escalation Rates Included) ¹ $0 $11,659,375 $0 $0 $19,316,267 $0 $5,741,897 $5,741,897 $3,996,223 $0 $13,590,485 $0 $3,703,698 $0 $1,364,877
11 Site preparation costs (Escalation Rates Included) ¹ $0 $2,430,100 $0 $0 $4,159,303 $0 $1,354,717 $1,384,521 $984,792 $0 $3,219,130 $0 $802,102 $0 $383,260
12 Projected Future Study Costs $200,000 $200,000 $200,000 $200,000
13 Long Term Debt Costs $0 $4,638,295 $5,706,323 $5,706,323 $5,706,323 $7,110,018 $7,110,018 $7,354,138 $7,903,410 $8,300,106 $8,300,106 $3,661,812 $2,593,783 $2,593,783 $2,593,783
14 Short Term Debt Costs $0 $0 $0 $0 $0 $0 $0 $0 $0 $0 $0 $3,182,884 $3,182,884 $3,182,884 $3,182,884
15 Deficit Recovery 47,053,822‐
16 Total Expenditures (10 through 15) $200,000 $18,727,770 $5,706,323 $5,706,323 $29,181,893 $7,310,018 $14,206,632 $14,480,556 $12,884,425 $8,300,106 $25,309,721 $6,844,695 $10,282,467 $5,776,667 $7,724,804
Cashflow Analysis:
17 Revenues Minus Expenditures (9 ‐ 16) $47,424,360 ‐$353,409 $3,917,443 $3,917,443 ‐$8,058,685 $2,515,022 ‐$2,381,592 ‐$155,516 $190,615 $1,524,934 ‐$1,638,264 $2,576,762 ‐$861,010 $3,644,790 $1,696,653
18 Opening Balance (previous year's closing balance) ‐$47,053,822 ‐$47,053,822 $370,538 $17,472 $4,013,613 $8,089,677 $31,612 $2,597,567 $220,295 $66,075 $261,824 $1,822,493 $187,914 $2,819,970 $1,998,139 $5,755,788
19 Sub total (17 + 18) ‐$47,053,822 $370,538 $17,129 $3,934,915 $7,931,056 $30,992 $2,546,634 $215,975 $64,779 $256,690 $1,786,758 $184,229 $2,764,676 $1,958,960 $5,642,929 $7,452,44120 Interest Earnings $0 $343 $78,698 $158,621 $620 $50,933 $4,320 $1,296 $5,134 $35,735 $3,685 $55,294 $39,179 $112,859 $149,049
21 Closing Balance ² (19 + 20) ‐$47,053,822 $370,538 $17,472 $4,013,613 $8,089,677 $31,612 $2,597,567 $220,295 $66,075 $261,824 $1,822,493 $187,914 $2,819,970 $1,998,139 $5,755,788 $7,601,490
1 Land acquisition costs have been escalated by 2.5% compounded for the term of the bylaw. Escalation rates for site preparation costs are applied to the date of acquisition. Long Term Borrowing (Total of Line 3): $68,000,0002 The opening balance reflects any surplus or deficit from the Board's existing EDC By‐law. Short Term Borrowing (Total of Line 4): $14,250,000
Total Debt Payments (current $, Total of Lines 13 & 14 + Outstanding Debt): $98,915,482Outstanding Debt At End Of Forecast(15 years): $6,905,726Outstanding Debt Will Be Fully Funded In: 2031
Watson & Associates Economists Ltd. HDSB HCDSB FINAL EDC STUDY
APPENDIX A EDUCATION DEVELOPMENT CHARGE
MINISTRY OF EDUCATION FORMS SUBMISSION
A-1
Watson & Associates Economists Ltd. HDSB HCDSB FINAL EDC STUDY
APPENDIX A - EDUCATION DEVELOPMENT CHARGE MINISTRY OF EDUCATION FORMS SUBMISSION
The Ministry of Education has prepared a set of standard forms that are required to form part of the EDC Background Study. The forms are used by the Ministry to review the EDC analysis and are standardized so that information is presented in a consistent manner for all school boards. The forms for each School Board’s EDC analysis are found in this appendix. In addition, a description of each form and its purpose can be found below. FORM A1 AND A2 This form is used to determine whether a school board is eligible to impose EDCs. The A1 section of the form includes the Board’s approved OTG capacity for each panel as well as the projected 5 year enrolment. If the average 5 year projected enrolment is greater than the Board’s OTG capacity (on either panel), the School Board is eligible to impose EDCs. The A2 section of the form deals with any outstanding EDC financial obligations. The form highlights any outstanding principal less the existing reserve fund balance. A positive financial obligation results in a board being eligible to impose future EDCs. FORM B Form B outlines the dwelling unit forecast that was used in the EDC analysis. The forecast is provided by EDC review area and by year for low, medium and high density types of development. FORM C This form provides the net new dwelling units that are requirement of the EDC analysis. Due to certain statutory exemptions (intensification) that were discussed earlier in this report, a certain percentage of units are removed from the forecast to determine the “net new units.” FORM D This form provides the non-residential forecast of gross floor area in square feet over the next 15 years. In addition to providing the total projected square footage, this form also includes an estimate as to the amount of square footage that is exempt from the forecast. Similar to the residential forecast, because of certain statutory exemptions, an assumption must be made regarding square footage that is excluded from the final EDC forecast.
A-2
Watson & Associates Economists Ltd. HDSB HCDSB FINAL EDC STUDY
FORM E Form E provides the total number of growth-related pupils by EDC review area. The form includes the net number of units, associated pupil yields and the number of pupils by density type for both the elementary and secondary panels. The bottom of the form provides the total number of growth-related pupils less any existing available space to determine the total “net” growth-related pupils. FORM F These forms provide the total “net” growth-related pupil places on a review area basis. Each form provides a projection of the existing community enrolment by school for each of the 15 years in the EDC forecast as well as their current OTG capacities. In addition, the total projected enrolment expected from new development is provided for the total review area. The total requirements from new development less any available existing space are the net growth-related pupil places for that review area. FORM G Form G highlights the EDC eligible sites that the board is proposing to purchase. Each site listing includes information on location, status, proposed school size and site size. The form also provides information on what percentage of each site is EDC eligible based on eligible pupil places as a percentage of the total proposed capacity of the school. In addition to providing site and eligibility information, Form G is noteworthy because it includes the translation from site requirements to site costs. On a site by site basis the form highlights the expected per acre acquisition costs, site development costs as well as associated escalation and financing costs. FORM H1 or H2 These forms outline the EDC calculation – Form H1 is used for a uniform EDC rate and Form H2 is used if the board is proposing a differentiated EDC rate. This EDC analysis assumes a uniform rate and includes Form H1. This form includes all relevant information needed to calculate the final EDC. The total education land costs (derived from Form G) are added to any existing EDC financial obligations (Form A2) and study costs to determine the growth-related net education land costs for which EDCs may be collected. These costs must then be allocated to the proposed residential and non-residential splits. The amount determined to be borne by residential development (between 60% and 100%) is divided by the total net new units to determine a residential charge by unit. The portion of costs allocated to non-residential development is divided by the net non-residential GFA forecast to derive a non-residential EDC charge per square foot.
Watson & Associates Economists Ltd. HDSB HCDSB FINAL EDC STUDY
HALTON DISTRICT SCHOOL BOARD EDUCATION DEVELOPMENT CHARGE FORMS SUBMISSION
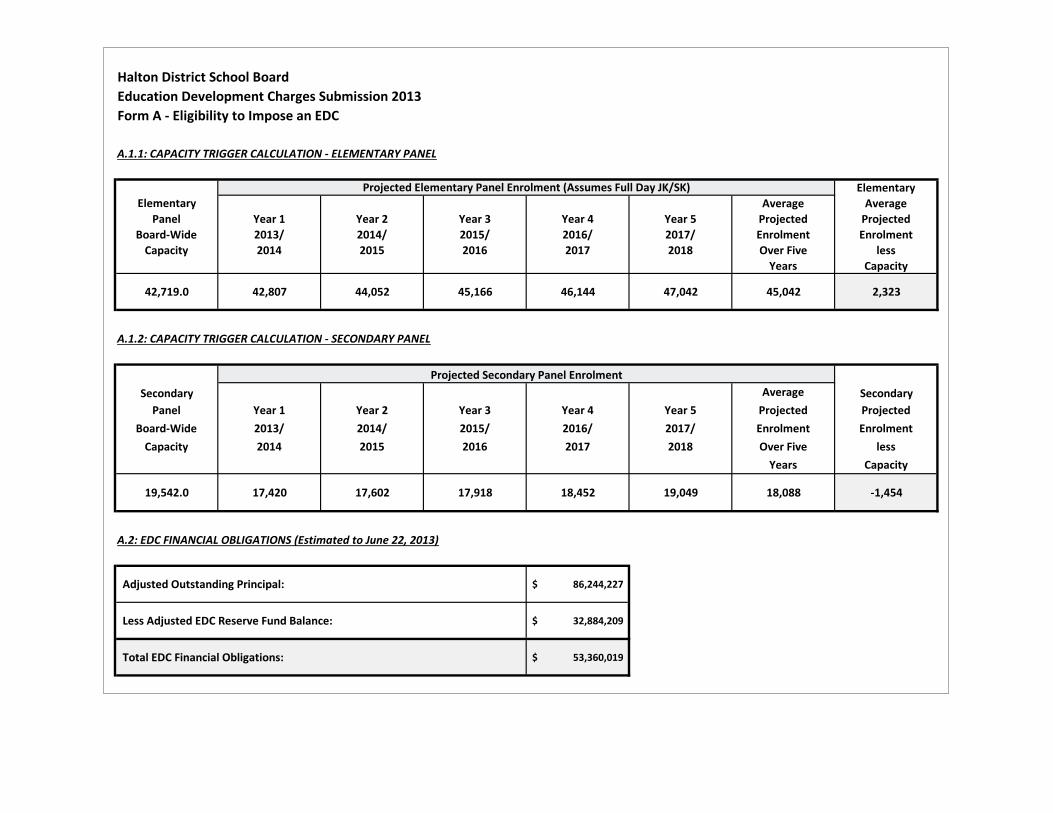
Halton District School Board
Education Development Charges Submission 2013
Form A - Eligibility to Impose an EDC
A.1.1: CAPACITY TRIGGER CALCULATION - ELEMENTARY PANEL
Elementary
Elementary Average Average
Panel Year 1 Year 2 Year 3 Year 4 Year 5 Projected Projected
Board-Wide 2013/ 2014/ 2015/ 2016/ 2017/ Enrolment Enrolment
Capacity 2014 2015 2016 2017 2018 Over Five less
Years Capacity
42,719.0 42,807 44,052 45,166 46,144 47,042 45,042 2,323
A.1.2: CAPACITY TRIGGER CALCULATION - SECONDARY PANEL
Secondary Average Secondary
Panel Year 1 Year 2 Year 3 Year 4 Year 5 Projected Projected
Board-Wide 2013/ 2014/ 2015/ 2016/ 2017/ Enrolment Enrolment
Capacity 2014 2015 2016 2017 2018 Over Five less
Years Capacity
19,542.0 17,420 17,602 17,918 18,452 19,049 18,088 -1,454
A.2: EDC FINANCIAL OBLIGATIONS (Estimated to June 22, 2013)
Adjusted Outstanding Principal: 86,244,227$
Less Adjusted EDC Reserve Fund Balance: 32,884,209$
Total EDC Financial Obligations: 53,360,019$
Projected Elementary Panel Enrolment (Assumes Full Day JK/SK)
Projected Secondary Panel Enrolment
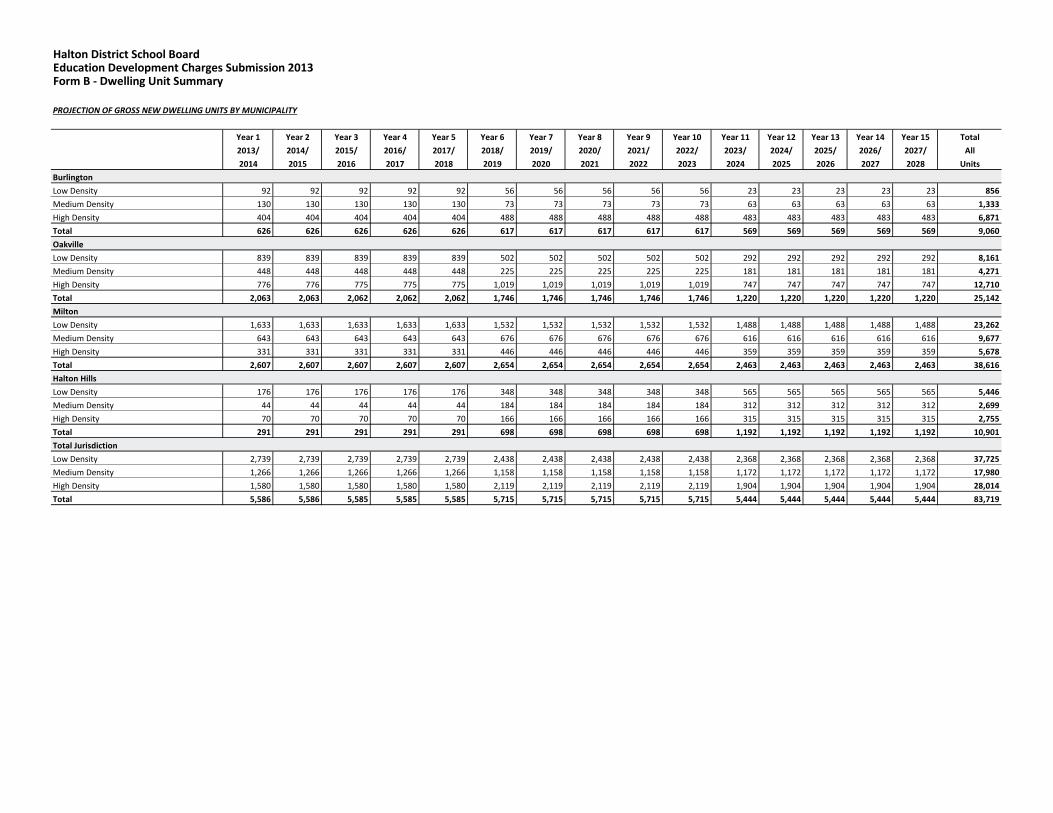
Halton District School BoardEducation Development Charges Submission 2013Form B - Dwelling Unit Summary
PROJECTION OF GROSS NEW DWELLING UNITS BY MUNICIPALITY
Year 1 Year 2 Year 3 Year 4 Year 5 Year 6 Year 7 Year 8 Year 9 Year 10 Year 11 Year 12 Year 13 Year 14 Year 15 Total
2013/ 2014/ 2015/ 2016/ 2017/ 2018/ 2019/ 2020/ 2021/ 2022/ 2023/ 2024/ 2025/ 2026/ 2027/ All
2014 2015 2016 2017 2018 2019 2020 2021 2022 2023 2024 2025 2026 2027 2028 Units
Burlington
Low Density 92 92 92 92 92 56 56 56 56 56 23 23 23 23 23 856
Medium Density 130 130 130 130 130 73 73 73 73 73 63 63 63 63 63 1,333
High Density 404 404 404 404 404 488 488 488 488 488 483 483 483 483 483 6,871
Total 626 626 626 626 626 617 617 617 617 617 569 569 569 569 569 9,060
Oakville
Low Density 839 839 839 839 839 502 502 502 502 502 292 292 292 292 292 8,161
Medium Density 448 448 448 448 448 225 225 225 225 225 181 181 181 181 181 4,271
High Density 776 776 775 775 775 1,019 1,019 1,019 1,019 1,019 747 747 747 747 747 12,710
Total 2,063 2,063 2,062 2,062 2,062 1,746 1,746 1,746 1,746 1,746 1,220 1,220 1,220 1,220 1,220 25,142
Milton
Low Density 1,633 1,633 1,633 1,633 1,633 1,532 1,532 1,532 1,532 1,532 1,488 1,488 1,488 1,488 1,488 23,262
Medium Density 643 643 643 643 643 676 676 676 676 676 616 616 616 616 616 9,677
High Density 331 331 331 331 331 446 446 446 446 446 359 359 359 359 359 5,678
Total 2,607 2,607 2,607 2,607 2,607 2,654 2,654 2,654 2,654 2,654 2,463 2,463 2,463 2,463 2,463 38,616
Halton Hills
Low Density 176 176 176 176 176 348 348 348 348 348 565 565 565 565 565 5,446
Medium Density 44 44 44 44 44 184 184 184 184 184 312 312 312 312 312 2,699
High Density 70 70 70 70 70 166 166 166 166 166 315 315 315 315 315 2,755
Total 291 291 291 291 291 698 698 698 698 698 1,192 1,192 1,192 1,192 1,192 10,901
Total Jurisdiction
Low Density 2,739 2,739 2,739 2,739 2,739 2,438 2,438 2,438 2,438 2,438 2,368 2,368 2,368 2,368 2,368 37,725
Medium Density 1,266 1,266 1,266 1,266 1,266 1,158 1,158 1,158 1,158 1,158 1,172 1,172 1,172 1,172 1,172 17,980
High Density 1,580 1,580 1,580 1,580 1,580 2,119 2,119 2,119 2,119 2,119 1,904 1,904 1,904 1,904 1,904 28,014
Total 5,586 5,586 5,585 5,585 5,585 5,715 5,715 5,715 5,715 5,715 5,444 5,444 5,444 5,444 5,444 83,719
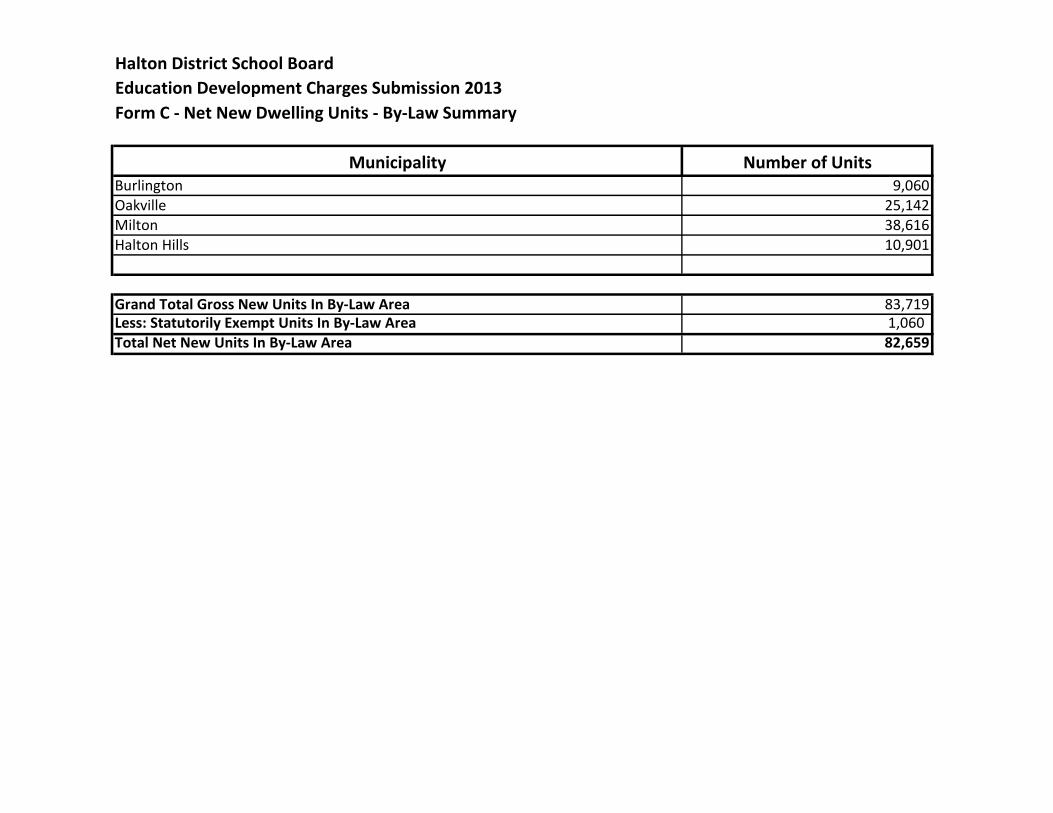
Halton District School Board
Education Development Charges Submission 2013
Form C - Net New Dwelling Units - By-Law Summary
Number of UnitsBurlington 9,060Oakville 25,142Milton 38,616Halton Hills 10,901
Grand Total Gross New Units In By-Law Area 83,719Less: Statutorily Exempt Units In By-Law Area 1,060 Total Net New Units In By-Law Area 82,659
Municipality

Halton District School Board
Education Development Charges Submission 2013
Form D - Non-Residential Development
D1 - Non-Residential Charge Based On Gross Floor Area (sq. ft.)
Total Estimated Non-Residential Board-Determined Gross Floor Area
to be Constructed Over 15 Years From Date of By-Law Passage: 75,403,985
Less: Board-Determined Gross Floor Area From Exempt Development: 18,501,226
Net Estimated Board-Determined Gross Floor Area: 56,902,759
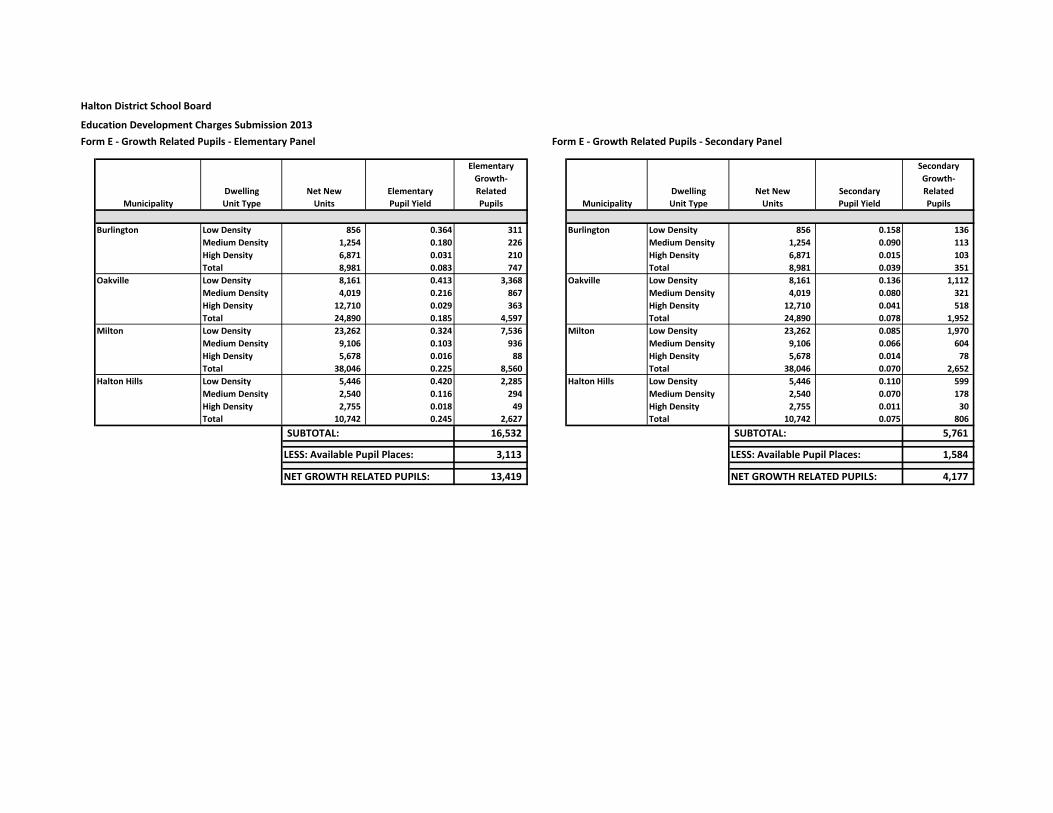
Halton District School Board
Education Development Charges Submission 2013
Form E - Growth Related Pupils - Elementary Panel Form E - Growth Related Pupils - Secondary Panel
Elementary Secondary
Growth- Growth-
Dwelling Net New Elementary Related Dwelling Net New Secondary Related
Unit Type Units Pupil Yield Pupils Unit Type Units Pupil Yield Pupils
CODE
Burlington Low Density 856 0.364 311 1 Burlington Low Density 856 0.158 136
Medium Density 1,254 0.180 226 1 Medium Density 1,254 0.090 113
High Density 6,871 0.031 210 1 High Density 6,871 0.015 103
Total 8,981 0.083 747 0 Total 8,981 0.039 351
Oakville Low Density 8,161 0.413 3,368 2 Oakville Low Density 8,161 0.136 1,112
Medium Density 4,019 0.216 867 2 Medium Density 4,019 0.080 321
High Density 12,710 0.029 363 2 High Density 12,710 0.041 518
Total 24,890 0.185 4,597 0 Total 24,890 0.078 1,952
Milton Low Density 23,262 0.324 7,536 3 Milton Low Density 23,262 0.085 1,970
Medium Density 9,106 0.103 936 3 Medium Density 9,106 0.066 604
High Density 5,678 0.016 88 3 High Density 5,678 0.014 78
Total 38,046 0.225 8,560 0 Total 38,046 0.070 2,652
Halton Hills Low Density 5,446 0.420 2,285 4 Halton Hills Low Density 5,446 0.110 599
Medium Density 2,540 0.116 294 4 Medium Density 2,540 0.070 178
High Density 2,755 0.018 49 4 High Density 2,755 0.011 30
Total 10,742 0.245 2,627 Total 10,742 0.075 806
SUBTOTAL: 16,532 SUBTOTAL: 5,761
LESS: Available Pupil Places: 3,113 LESS: Available Pupil Places: 1,584
NET GROWTH RELATED PUPILS: 13,419 NET GROWTH RELATED PUPILS: 4,177
Municipality Municipality
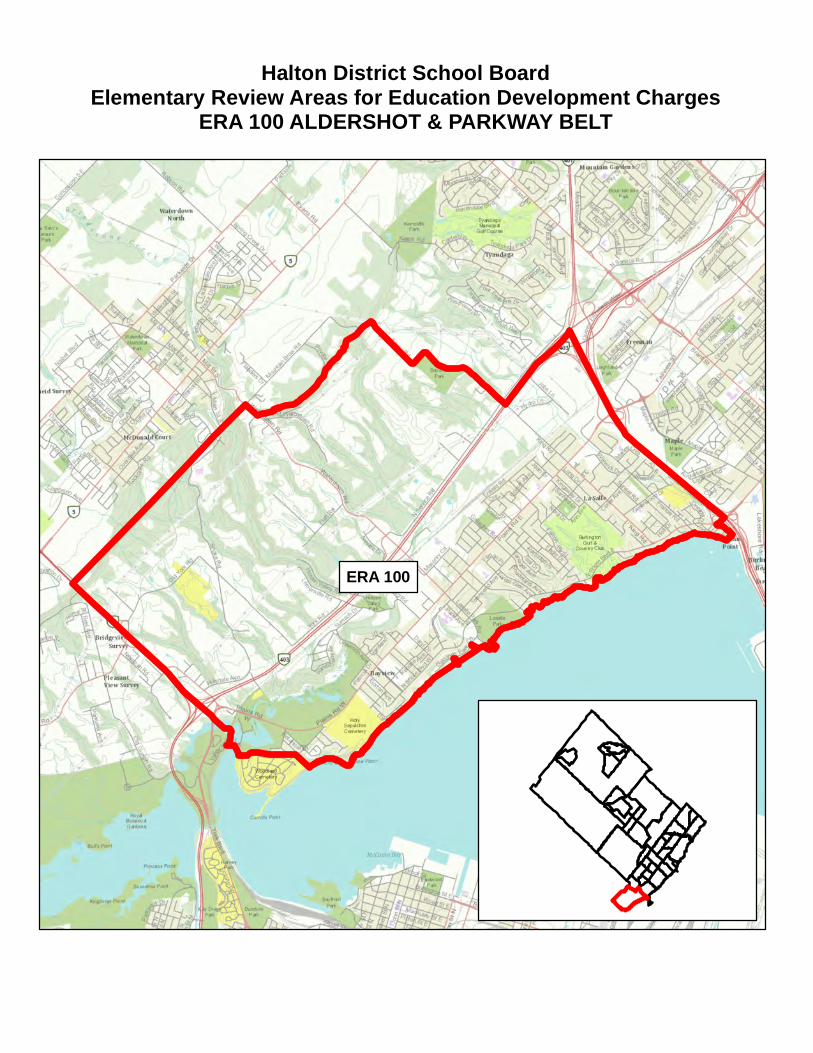
Halton District School BoardElementary Review Areas for Education Development Charges
ERA 100 ALDERSHOT & PARKWAY BELT
ERA 100

Halton District School Board
Education Development Charges Submission 2013
Form F - Growth Related Pupil Place Requirements
Panel: Elementary Panel
Review Area: ERA100 Aldershot & Parkway Belt
REQUIREMENTS OF EXISTING COMMUNITY
Current Number Current Year 1 Year 2 Year 3 Year 4 Year 5 Year 6 Year 7 Year 8 Year 9 Year 10 Year 11 Year 12 Year 13 Year 14 Year 15
OTG of Temp 2012/ 2013/ 2014/ 2015/ 2016/ 2017/ 2018/ 2019/ 2020/ 2021/ 2022/ 2023/ 2024/ 2025/ 2026/ 2027/
Capacity Facilities 2013 2014 2015 2016 2017 2018 2019 2020 2021 2022 2023 2024 2025 2026 2027 2028
Aldershot Elem. School 322 0 244 237 249 275 254 233 240 261 284 295 285 259 254 251 247 242
Glenview Public School 366 0 322 340 329 323 320 311 312 304 299 288 283 278 274 270 266 263
King's Road Public School 337 0 243 243 242 230 234 236 235 225 220 212 208 205 201 198 196 194
Maplehurst Public School 519 0 395 406 423 432 447 458 461 459 445 428 420 413 406 400 394 390
TOTAL: 1,544.0 0 1,204 1,227 1,243 1,260 1,255 1,238 1,249 1,249 1,249 1,223 1,195 1,155 1,135 1,119 1,103 1,089
AVAILABLE PUPIL PLACES: 455
REQUIREMENTS OF NEW DEVELOPMENT (CUMULATIVE)
Year 1 Year 2 Year 3 Year 4 Year 5 Year 6 Year 7 Year 8 Year 9 Year 10 Year 11 Year 12 Year 13 Year 14 Year 15
2013/ 2014/ 2015/ 2016/ 2017/ 2018/ 2019/ 2020/ 2021/ 2022/ 2023/ 2024/ 2025/ 2026/ 2027/
2014 2015 2016 2017 2018 2019 2020 2021 2022 2023 2024 2025 2026 2027 2028
18 37 55 73 92 103 113 124 135 145 161 176 192 207 222
CALCULATION OF GROWTH-RELATED PUPIL PLACE REQUIREMENTS
1 Requirements of New Development (Pupil Places) 222
2 Available Pupil Places in Existing Facilities 455
3 Net Growth-Related Pupil Place Requirements (1-2) 0
NOTES
15 Year Projections (Assumes Full Day JK/SK)
Existing Schools and Projects
15 Year Projections (Assumes Full Day JK/SK)

Halton District School BoardElementary Review Areas for Education Development Charges
ERA 101 DOWNTOWN BURLINGTON
ERA 101

Halton District School Board
Education Development Charges Submission 2013
Form F - Growth Related Pupil Place Requirements
Panel: Elementary Panel
Review Area: ERA101 Downtown Burlington
REQUIREMENTS OF EXISTING COMMUNITY
Current Number Current Year 1 Year 2 Year 3 Year 4 Year 5 Year 6 Year 7 Year 8 Year 9 Year 10 Year 11 Year 12 Year 13 Year 14 Year 15
OTG of Temp 2012/ 2013/ 2014/ 2015/ 2016/ 2017/ 2018/ 2019/ 2020/ 2021/ 2022/ 2023/ 2024/ 2025/ 2026/ 2027/
Capacity Facilities 2013 2014 2015 2016 2017 2018 2019 2020 2021 2022 2023 2024 2025 2026 2027 2028
Burlington Central Elem. School 265 0 241 200 199 196 204 225 203 191 204 199 185 194 205 208 207 206
Central Public School 435 0 355 337 324 302 292 292 296 302 300 302 300 297 293 290 287 284
Lakeshore Public School 328 0 198 198 198 199 199 200 204 207 207 208 207 205 202 200 198 196
Tom Thomson Public School 274 8 399 406 423 430 437 446 444 432 444 448 446 441 436 431 426 421
TOTAL: 1,302.0 8 1,193 1,140 1,144 1,127 1,132 1,162 1,148 1,132 1,155 1,157 1,138 1,136 1,136 1,128 1,117 1,107
AVAILABLE PUPIL PLACES: 195
REQUIREMENTS OF NEW DEVELOPMENT (CUMULATIVE)
Year 1 Year 2 Year 3 Year 4 Year 5 Year 6 Year 7 Year 8 Year 9 Year 10 Year 11 Year 12 Year 13 Year 14 Year 15
2013/ 2014/ 2015/ 2016/ 2017/ 2018/ 2019/ 2020/ 2021/ 2022/ 2023/ 2024/ 2025/ 2026/ 2027/
2014 2015 2016 2017 2018 2019 2020 2021 2022 2023 2024 2025 2026 2027 2028
3 7 10 13 17 21 25 29 32 36 46 56 66 75 85
CALCULATION OF GROWTH-RELATED PUPIL PLACE REQUIREMENTS
1 Requirements of New Development (Pupil Places) 85
2 Available Pupil Places in Existing Facilities 195
3 Net Growth-Related Pupil Place Requirements (1-2) 0
NOTES
15 Year Projections (Assumes Full Day JK/SK)
Existing Schools and Projects
15 Year Projections (Assumes Full Day JK/SK)
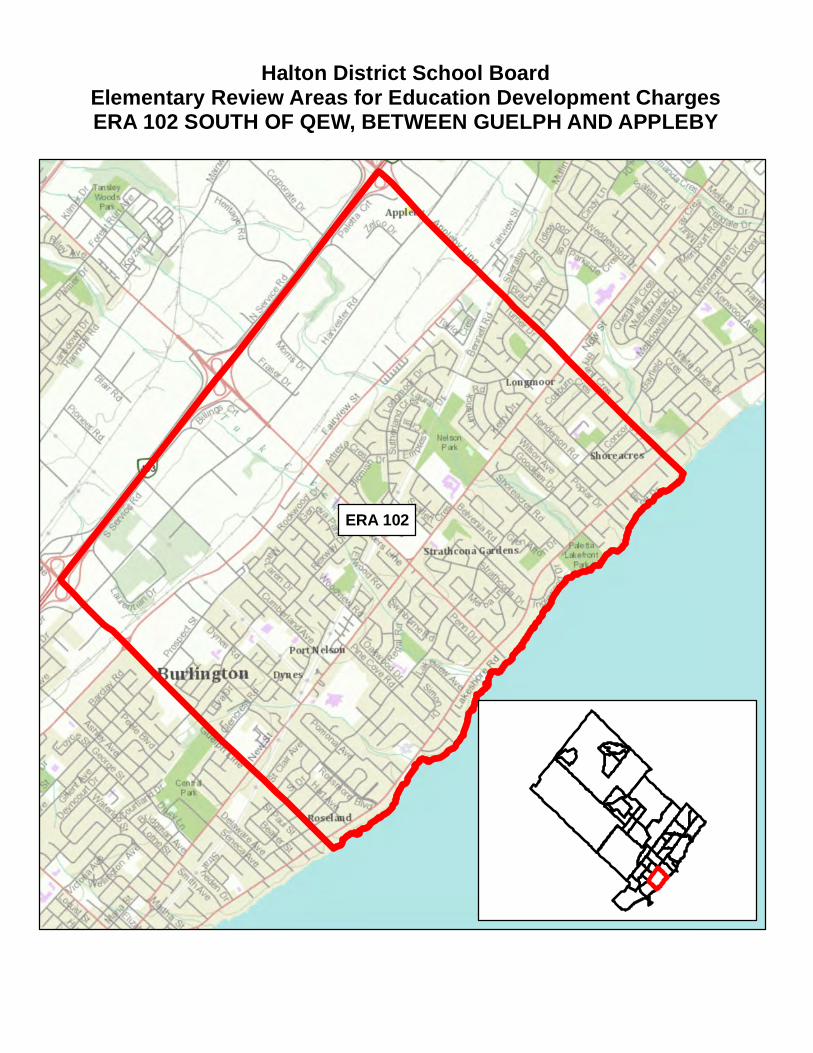
Halton District School BoardElementary Review Areas for Education Development ChargesERA 102 SOUTH OF QEW, BETWEEN GUELPH AND APPLEBY
ERA 102

Halton District School Board
Education Development Charges Submission 2013
Form F - Growth Related Pupil Place Requirements
Panel: Elementary Panel
Review Area: ERA102 S of QEW, between Guelph & Appleby
REQUIREMENTS OF EXISTING COMMUNITY
Current Number Current Year 1 Year 2 Year 3 Year 4 Year 5 Year 6 Year 7 Year 8 Year 9 Year 10 Year 11 Year 12 Year 13 Year 14 Year 15
OTG of Temp 2012/ 2013/ 2014/ 2015/ 2016/ 2017/ 2018/ 2019/ 2020/ 2021/ 2022/ 2023/ 2024/ 2025/ 2026/ 2027/
Capacity Facilities 2013 2014 2015 2016 2017 2018 2019 2020 2021 2022 2023 2024 2025 2026 2027 2028
John T. Tuck Public School 541 2 629 637 639 637 622 592 587 582 584 564 540 512 496 492 488 484
Pauline Johnson Public School 236 1 259 270 262 249 248 247 240 231 222 212 205 204 201 199 197 196
Ryerson Public School 527 0 228 244 233 230 213 215 203 202 189 181 176 175 173 171 169 168
Tecumseh Public School 442 0 259 261 251 242 235 219 218 217 212 201 199 196 193 191 190 188
TOTAL: 1,746.0 3 1,375 1,411 1,385 1,358 1,317 1,273 1,248 1,232 1,207 1,158 1,121 1,086 1,063 1,053 1,044 1,036
AVAILABLE PUPIL PLACES: 710
REQUIREMENTS OF NEW DEVELOPMENT (CUMULATIVE)
Year 1 Year 2 Year 3 Year 4 Year 5 Year 6 Year 7 Year 8 Year 9 Year 10 Year 11 Year 12 Year 13 Year 14 Year 15
2013/ 2014/ 2015/ 2016/ 2017/ 2018/ 2019/ 2020/ 2021/ 2022/ 2023/ 2024/ 2025/ 2026/ 2027/
2014 2015 2016 2017 2018 2019 2020 2021 2022 2023 2024 2025 2026 2027 2028
5 9 14 18 23 26 29 31 34 37 43 48 53 59 64
CALCULATION OF GROWTH-RELATED PUPIL PLACE REQUIREMENTS
1 Requirements of New Development (Pupil Places) 64
2 Available Pupil Places in Existing Facilities 710
3 Net Growth-Related Pupil Place Requirements (1-2) 0
NOTES
15 Year Projections (Assumes Full Day JK/SK)
Existing Schools and Projects
15 Year Projections (Assumes Full Day JK/SK)
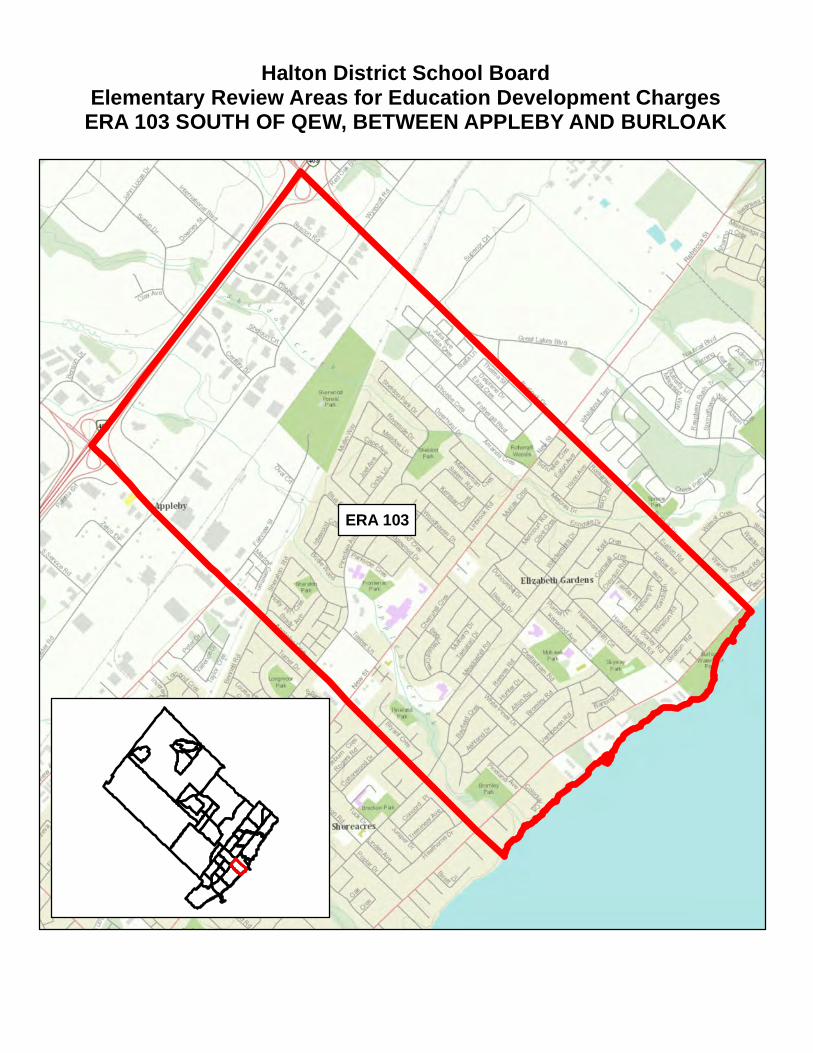
Halton District School BoardElementary Review Areas for Education Development Charges
ERA 103 SOUTH OF QEW, BETWEEN APPLEBY AND BURLOAK
ERA 103

Halton District School Board
Education Development Charges Submission 2013
Form F - Growth Related Pupil Place Requirements
Panel: Elementary Panel
Review Area: ERA103 S of QEW, between Appleby & Burloak
REQUIREMENTS OF EXISTING COMMUNITY
Current Number Current Year 1 Year 2 Year 3 Year 4 Year 5 Year 6 Year 7 Year 8 Year 9 Year 10 Year 11 Year 12 Year 13 Year 14 Year 15
OTG of Temp 2012/ 2013/ 2014/ 2015/ 2016/ 2017/ 2018/ 2019/ 2020/ 2021/ 2022/ 2023/ 2024/ 2025/ 2026/ 2027/
Capacity Facilities 2013 2014 2015 2016 2017 2018 2019 2020 2021 2022 2023 2024 2025 2026 2027 2028
Frontenac Public School 777 0 483 437 409 396 381 362 343 339 346 340 335 331 327 324 321 318
Mohawk Gardens Public School 504 0 399 395 388 380 372 371 381 376 372 368 363 359 355 351 347 345
Pineland Public School 688 1 666 701 703 724 751 754 734 747 748 732 729 722 713 705 697 689
LESS HOLDING FOR LAKESHORE WOODS (ERA111) 30- 30- 30- 30- 30- 30- 30- 30- 30- 30- 30- 30- 30- 30- 30- 30-
TOTAL: 1,969.0 1 1,518 1,503 1,470 1,470 1,474 1,456 1,428 1,432 1,436 1,409 1,397 1,382 1,365 1,350 1,335 1,323
AVAILABLE PUPIL PLACES: 646
REQUIREMENTS OF NEW DEVELOPMENT (CUMULATIVE)
Year 1 Year 2 Year 3 Year 4 Year 5 Year 6 Year 7 Year 8 Year 9 Year 10 Year 11 Year 12 Year 13 Year 14 Year 15
2013/ 2014/ 2015/ 2016/ 2017/ 2018/ 2019/ 2020/ 2021/ 2022/ 2023/ 2024/ 2025/ 2026/ 2027/
2014 2015 2016 2017 2018 2019 2020 2021 2022 2023 2024 2025 2026 2027 2028
1 3 4 6 7 9 11 12 14 16 20 24 29 33 37
CALCULATION OF GROWTH-RELATED PUPIL PLACE REQUIREMENTS
1 Requirements of New Development (Pupil Places) 37
2 Available Pupil Places in Existing Facilities 646
3 Net Growth-Related Pupil Place Requirements (1-2) 0
NOTES
15 Year Projections (Assumes Full Day JK/SK)
Existing Schools and Projects
15 Year Projections (Assumes Full Day JK/SK)
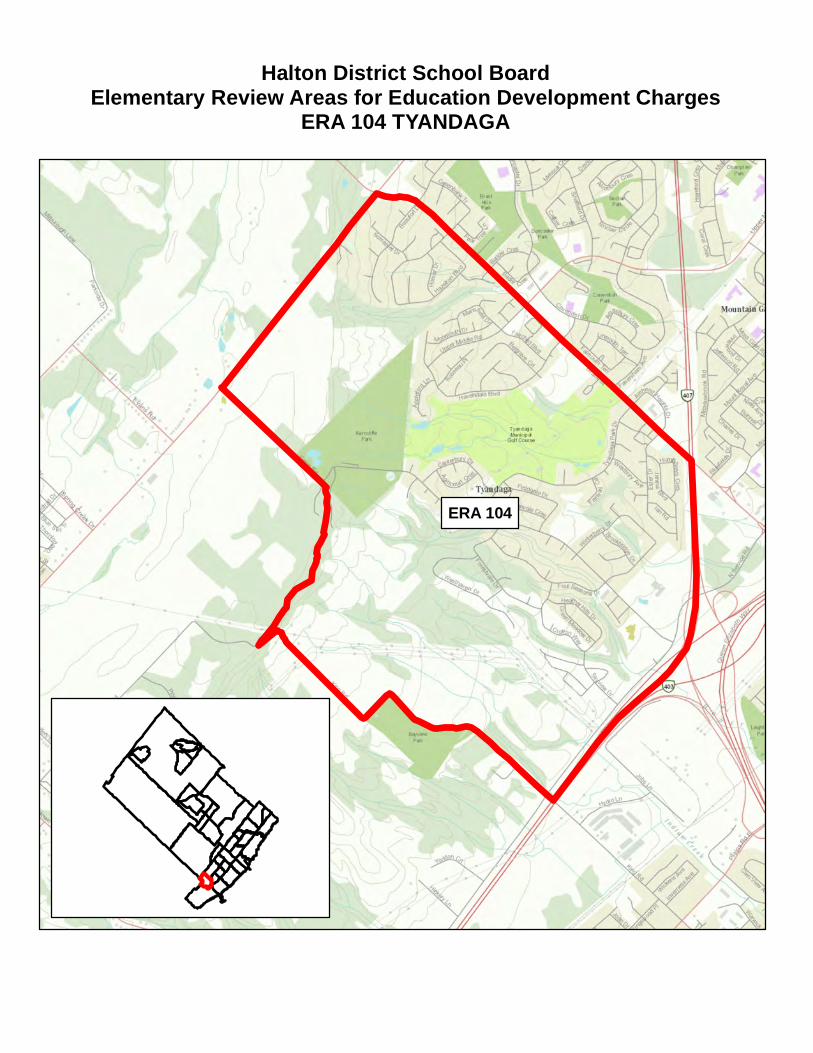
Halton District School BoardElementary Review Areas for Education Development Charges
ERA 104 TYANDAGA
ERA 104
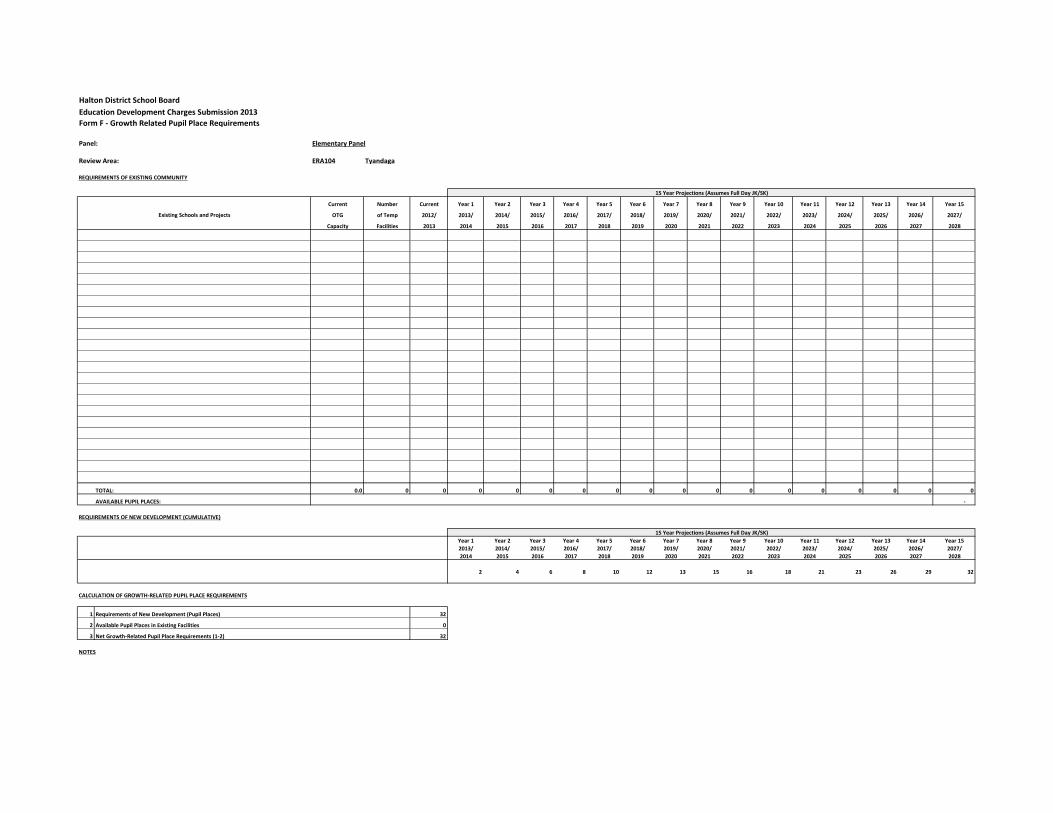
Halton District School Board
Education Development Charges Submission 2013
Form F - Growth Related Pupil Place Requirements
Panel: Elementary Panel
Review Area: ERA104 Tyandaga
REQUIREMENTS OF EXISTING COMMUNITY
Current Number Current Year 1 Year 2 Year 3 Year 4 Year 5 Year 6 Year 7 Year 8 Year 9 Year 10 Year 11 Year 12 Year 13 Year 14 Year 15
OTG of Temp 2012/ 2013/ 2014/ 2015/ 2016/ 2017/ 2018/ 2019/ 2020/ 2021/ 2022/ 2023/ 2024/ 2025/ 2026/ 2027/
Capacity Facilities 2013 2014 2015 2016 2017 2018 2019 2020 2021 2022 2023 2024 2025 2026 2027 2028
TOTAL: 0.0 0 0 0 0 0 0 0 0 0 0 0 0 0 0 0 0 0
AVAILABLE PUPIL PLACES: -
REQUIREMENTS OF NEW DEVELOPMENT (CUMULATIVE)
Year 1 Year 2 Year 3 Year 4 Year 5 Year 6 Year 7 Year 8 Year 9 Year 10 Year 11 Year 12 Year 13 Year 14 Year 15
2013/ 2014/ 2015/ 2016/ 2017/ 2018/ 2019/ 2020/ 2021/ 2022/ 2023/ 2024/ 2025/ 2026/ 2027/
2014 2015 2016 2017 2018 2019 2020 2021 2022 2023 2024 2025 2026 2027 2028
2 4 6 8 10 12 13 15 16 18 21 23 26 29 32
CALCULATION OF GROWTH-RELATED PUPIL PLACE REQUIREMENTS
1 Requirements of New Development (Pupil Places) 32
2 Available Pupil Places in Existing Facilities 0
3 Net Growth-Related Pupil Place Requirements (1-2) 32
NOTES
Existing Schools and Projects
15 Year Projections (Assumes Full Day JK/SK)
15 Year Projections (Assumes Full Day JK/SK)
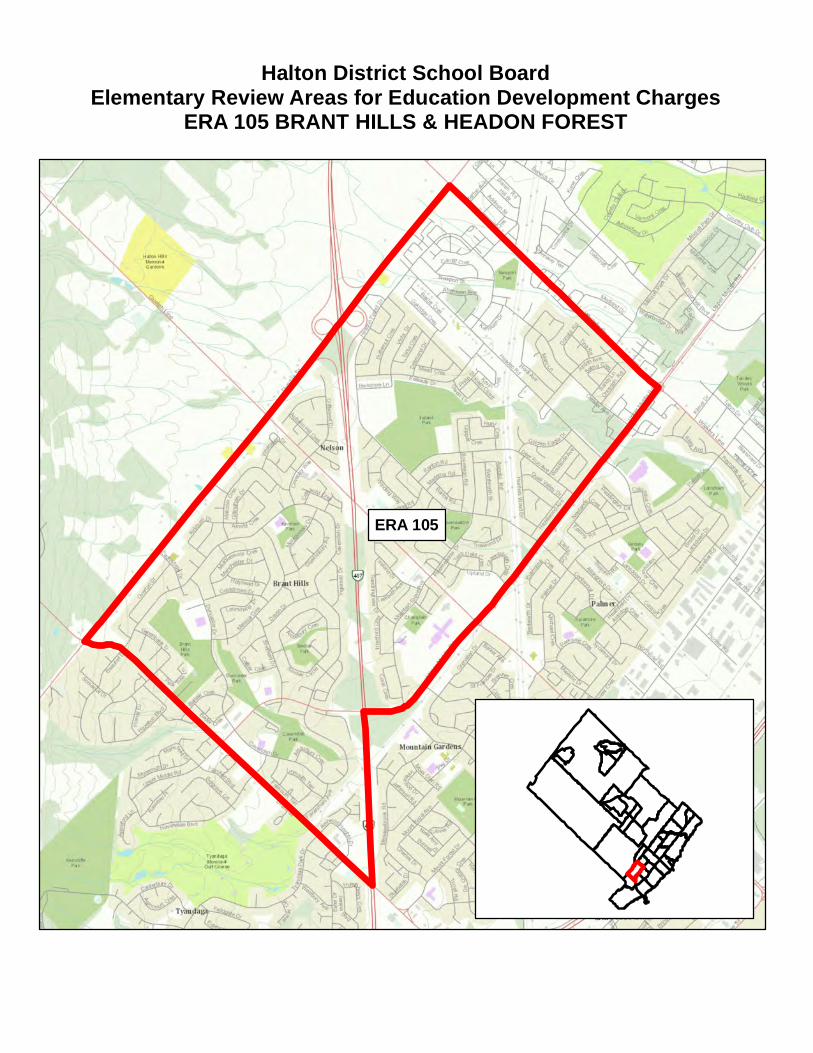
Halton District School BoardElementary Review Areas for Education Development Charges
ERA 105 BRANT HILLS & HEADON FOREST
ERA 105
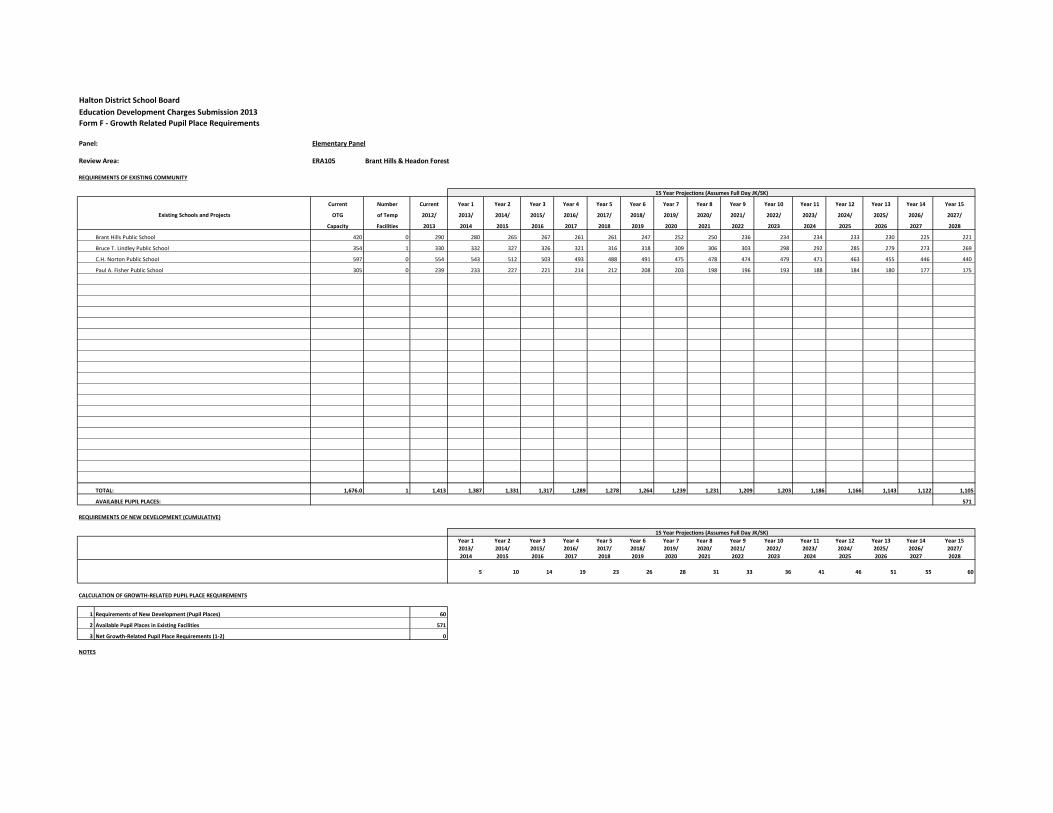
Halton District School Board
Education Development Charges Submission 2013
Form F - Growth Related Pupil Place Requirements
Panel: Elementary Panel
Review Area: ERA105 Brant Hills & Headon Forest
REQUIREMENTS OF EXISTING COMMUNITY
Current Number Current Year 1 Year 2 Year 3 Year 4 Year 5 Year 6 Year 7 Year 8 Year 9 Year 10 Year 11 Year 12 Year 13 Year 14 Year 15
OTG of Temp 2012/ 2013/ 2014/ 2015/ 2016/ 2017/ 2018/ 2019/ 2020/ 2021/ 2022/ 2023/ 2024/ 2025/ 2026/ 2027/
Capacity Facilities 2013 2014 2015 2016 2017 2018 2019 2020 2021 2022 2023 2024 2025 2026 2027 2028
Brant Hills Public School 420 0 290 280 265 267 261 261 247 252 250 236 234 234 233 230 225 221
Bruce T. Lindley Public School 354 1 330 332 327 326 321 316 318 309 306 303 298 292 285 279 273 269
C.H. Norton Public School 597 0 554 543 512 503 493 488 491 475 478 474 479 471 463 455 446 440
Paul A. Fisher Public School 305 0 239 233 227 221 214 212 208 203 198 196 193 188 184 180 177 175
TOTAL: 1,676.0 1 1,413 1,387 1,331 1,317 1,289 1,278 1,264 1,239 1,231 1,209 1,203 1,186 1,166 1,143 1,122 1,105
AVAILABLE PUPIL PLACES: 571
REQUIREMENTS OF NEW DEVELOPMENT (CUMULATIVE)
Year 1 Year 2 Year 3 Year 4 Year 5 Year 6 Year 7 Year 8 Year 9 Year 10 Year 11 Year 12 Year 13 Year 14 Year 15
2013/ 2014/ 2015/ 2016/ 2017/ 2018/ 2019/ 2020/ 2021/ 2022/ 2023/ 2024/ 2025/ 2026/ 2027/
2014 2015 2016 2017 2018 2019 2020 2021 2022 2023 2024 2025 2026 2027 2028
5 10 14 19 23 26 28 31 33 36 41 46 51 55 60
CALCULATION OF GROWTH-RELATED PUPIL PLACE REQUIREMENTS
1 Requirements of New Development (Pupil Places) 60
2 Available Pupil Places in Existing Facilities 571
3 Net Growth-Related Pupil Place Requirements (1-2) 0
NOTES
15 Year Projections (Assumes Full Day JK/SK)
Existing Schools and Projects
15 Year Projections (Assumes Full Day JK/SK)

Halton District School BoardElementary Review Areas for Education Development Charges
ERA 106 MOUNTAINSIDE & PALMER
ERA 106

Halton District School Board
Education Development Charges Submission 2013
Form F - Growth Related Pupil Place Requirements
Panel: Elementary Panel
Review Area: ERA106 Mountainside & Palmer
REQUIREMENTS OF EXISTING COMMUNITY
Current Number Current Year 1 Year 2 Year 3 Year 4 Year 5 Year 6 Year 7 Year 8 Year 9 Year 10 Year 11 Year 12 Year 13 Year 14 Year 15
OTG of Temp 2012/ 2013/ 2014/ 2015/ 2016/ 2017/ 2018/ 2019/ 2020/ 2021/ 2022/ 2023/ 2024/ 2025/ 2026/ 2027/
Capacity Facilities 2013 2014 2015 2016 2017 2018 2019 2020 2021 2022 2023 2024 2025 2026 2027 2028
Clarksdale Public School 550 0 411 424 418 429 409 407 401 381 386 384 387 384 381 377 373 370
Dr. Charles Best Public School 332 0 300 292 296 298 293 289 282 278 277 279 277 274 271 269 266 263
Rolling Meadows Public School 584 0 503 489 488 491 501 521 515 545 551 525 522 519 523 519 515 511
Sir Ernest Macmillan Public School 415 6 413 419 412 378 374 387 388 386 393 374 366 363 367 366 364 363
TOTAL: 1,881.0 6 1,627 1,623 1,615 1,596 1,577 1,604 1,586 1,589 1,606 1,562 1,551 1,541 1,542 1,530 1,518 1,507
AVAILABLE PUPIL PLACES: 374
REQUIREMENTS OF NEW DEVELOPMENT (CUMULATIVE)
Year 1 Year 2 Year 3 Year 4 Year 5 Year 6 Year 7 Year 8 Year 9 Year 10 Year 11 Year 12 Year 13 Year 14 Year 15
2013/ 2014/ 2015/ 2016/ 2017/ 2018/ 2019/ 2020/ 2021/ 2022/ 2023/ 2024/ 2025/ 2026/ 2027/
2014 2015 2016 2017 2018 2019 2020 2021 2022 2023 2024 2025 2026 2027 2028
3 6 8 11 14 16 18 20 22 25 30 35 40 45 50
CALCULATION OF GROWTH-RELATED PUPIL PLACE REQUIREMENTS
1 Requirements of New Development (Pupil Places) 50
2 Available Pupil Places in Existing Facilities 374
3 Net Growth-Related Pupil Place Requirements (1-2) 0
NOTES
15 Year Projection of Average Daily Enrolments
Existing Schools and Projects
15 Year Projection of Average Daily Enrolments
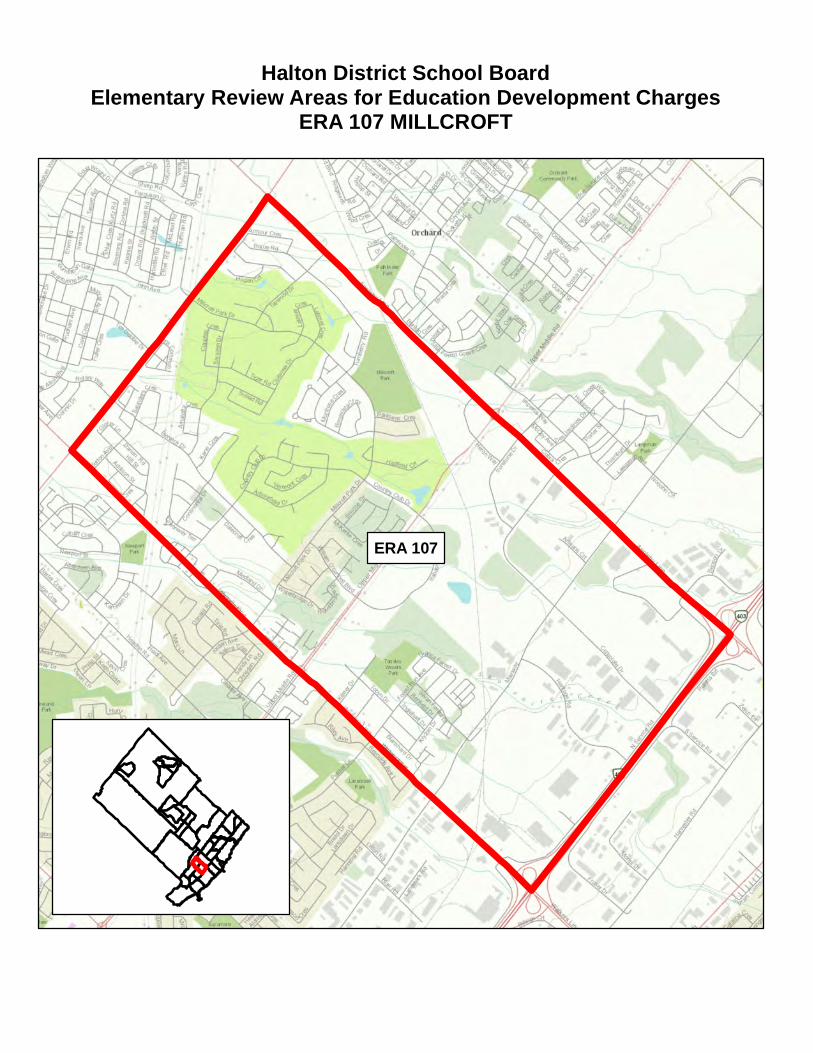
Halton District School BoardElementary Review Areas for Education Development Charges
ERA 107 MILLCROFT
ERA 107
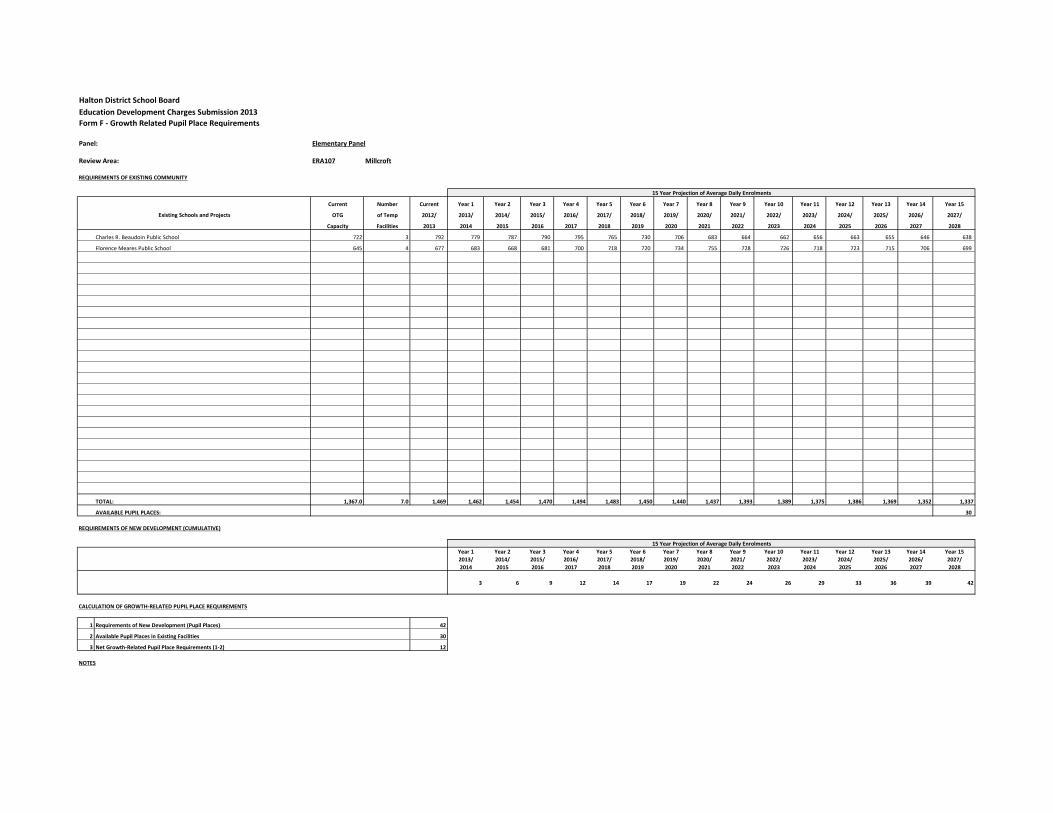
Halton District School Board
Education Development Charges Submission 2013
Form F - Growth Related Pupil Place Requirements
Panel: Elementary Panel
Review Area: ERA107 Millcroft
REQUIREMENTS OF EXISTING COMMUNITY
Current Number Current Year 1 Year 2 Year 3 Year 4 Year 5 Year 6 Year 7 Year 8 Year 9 Year 10 Year 11 Year 12 Year 13 Year 14 Year 15
OTG of Temp 2012/ 2013/ 2014/ 2015/ 2016/ 2017/ 2018/ 2019/ 2020/ 2021/ 2022/ 2023/ 2024/ 2025/ 2026/ 2027/
Capacity Facilities 2013 2014 2015 2016 2017 2018 2019 2020 2021 2022 2023 2024 2025 2026 2027 2028
Charles R. Beaudoin Public School 722 3 792 779 787 790 795 765 730 706 683 664 662 656 663 655 646 638
Florence Meares Public School 645 4 677 683 668 681 700 718 720 734 755 728 726 718 723 715 706 699
TOTAL: 1,367.0 7.0 1,469 1,462 1,454 1,470 1,494 1,483 1,450 1,440 1,437 1,393 1,389 1,375 1,386 1,369 1,352 1,337
AVAILABLE PUPIL PLACES: 30
REQUIREMENTS OF NEW DEVELOPMENT (CUMULATIVE)
Year 1 Year 2 Year 3 Year 4 Year 5 Year 6 Year 7 Year 8 Year 9 Year 10 Year 11 Year 12 Year 13 Year 14 Year 15
2013/ 2014/ 2015/ 2016/ 2017/ 2018/ 2019/ 2020/ 2021/ 2022/ 2023/ 2024/ 2025/ 2026/ 2027/
2014 2015 2016 2017 2018 2019 2020 2021 2022 2023 2024 2025 2026 2027 2028
3 6 9 12 14 17 19 22 24 26 29 33 36 39 42
CALCULATION OF GROWTH-RELATED PUPIL PLACE REQUIREMENTS
1 Requirements of New Development (Pupil Places) 42
2 Available Pupil Places in Existing Facilities 30
3 Net Growth-Related Pupil Place Requirements (1-2) 12
NOTES
15 Year Projection of Average Daily Enrolments
Existing Schools and Projects
15 Year Projection of Average Daily Enrolments
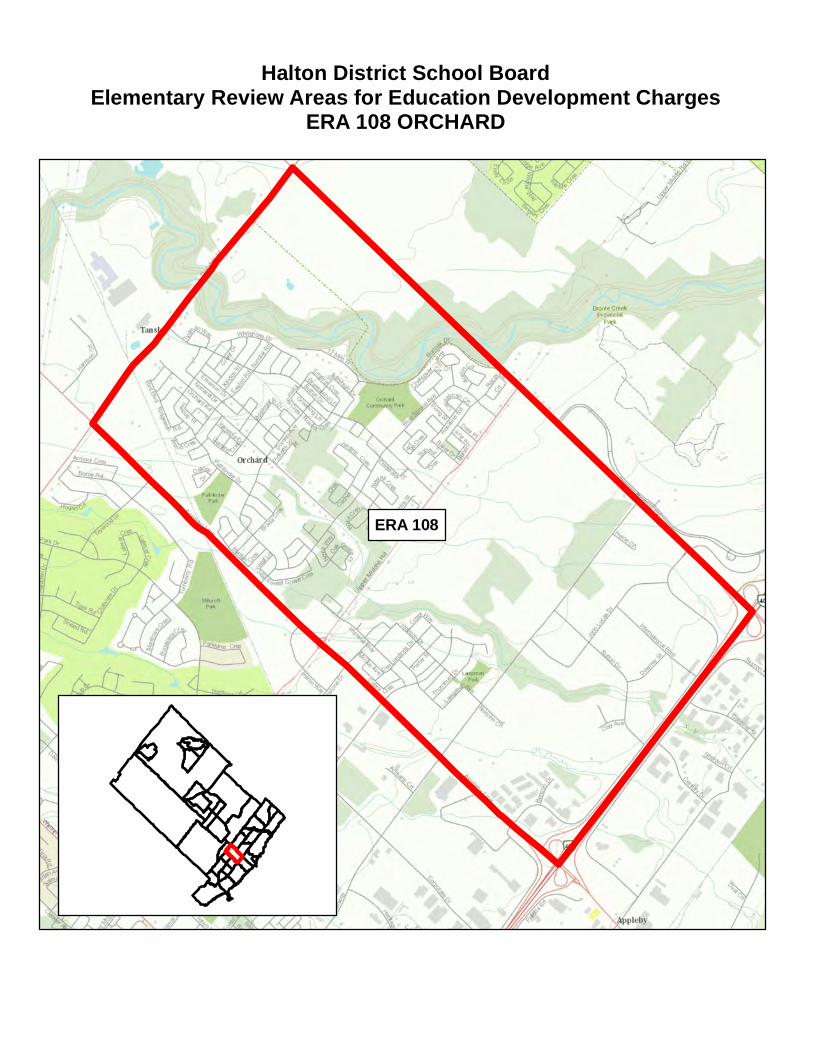
Halton District School BoardElementary Review Areas for Education Development Charges
ERA 108 ORCHARD
ERA 108
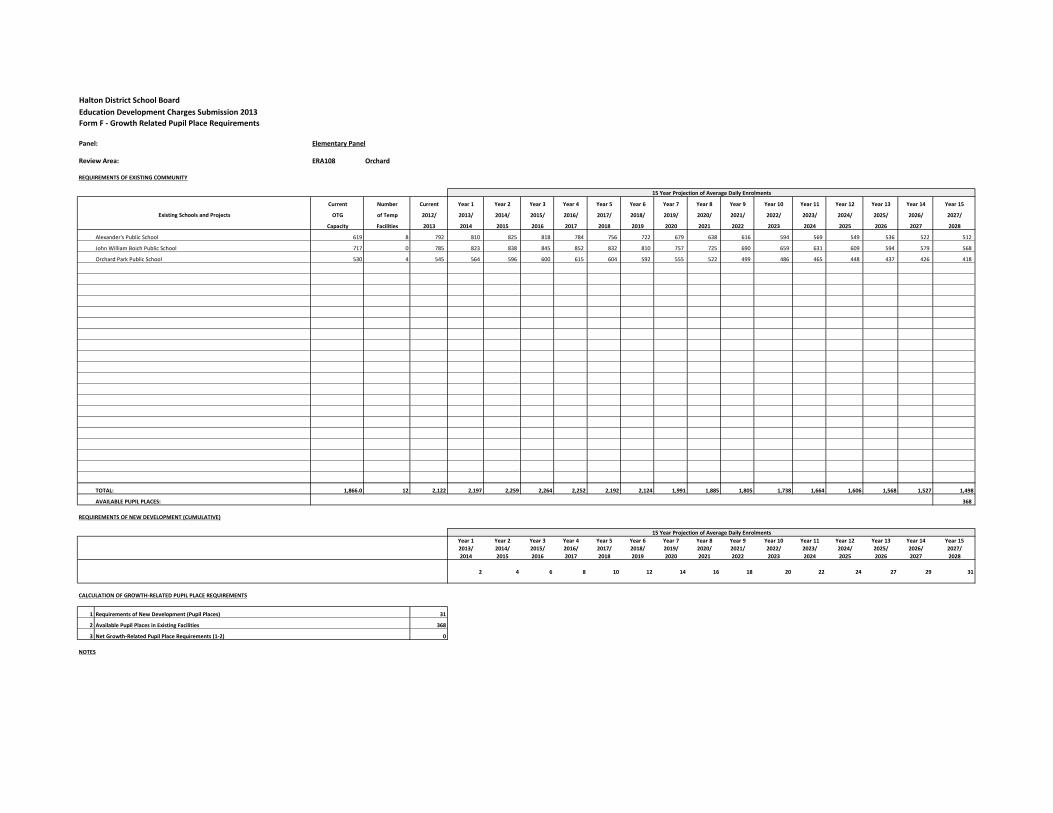
Halton District School Board
Education Development Charges Submission 2013
Form F - Growth Related Pupil Place Requirements
Panel: Elementary Panel
Review Area: ERA108 Orchard
REQUIREMENTS OF EXISTING COMMUNITY
Current Number Current Year 1 Year 2 Year 3 Year 4 Year 5 Year 6 Year 7 Year 8 Year 9 Year 10 Year 11 Year 12 Year 13 Year 14 Year 15
OTG of Temp 2012/ 2013/ 2014/ 2015/ 2016/ 2017/ 2018/ 2019/ 2020/ 2021/ 2022/ 2023/ 2024/ 2025/ 2026/ 2027/
Capacity Facilities 2013 2014 2015 2016 2017 2018 2019 2020 2021 2022 2023 2024 2025 2026 2027 2028
Alexander's Public School 619 8 792 810 825 818 784 756 722 679 638 616 594 569 549 536 522 512
John William Boich Public School 717 0 785 823 838 845 852 832 810 757 725 690 659 631 609 594 579 568
Orchard Park Public School 530 4 545 564 596 600 615 604 592 555 522 499 486 465 448 437 426 418
TOTAL: 1,866.0 12 2,122 2,197 2,259 2,264 2,252 2,192 2,124 1,991 1,885 1,805 1,738 1,664 1,606 1,568 1,527 1,498
AVAILABLE PUPIL PLACES: 368
REQUIREMENTS OF NEW DEVELOPMENT (CUMULATIVE)
Year 1 Year 2 Year 3 Year 4 Year 5 Year 6 Year 7 Year 8 Year 9 Year 10 Year 11 Year 12 Year 13 Year 14 Year 15
2013/ 2014/ 2015/ 2016/ 2017/ 2018/ 2019/ 2020/ 2021/ 2022/ 2023/ 2024/ 2025/ 2026/ 2027/
2014 2015 2016 2017 2018 2019 2020 2021 2022 2023 2024 2025 2026 2027 2028
2 4 6 8 10 12 14 16 18 20 22 24 27 29 31
CALCULATION OF GROWTH-RELATED PUPIL PLACE REQUIREMENTS
1 Requirements of New Development (Pupil Places) 31
2 Available Pupil Places in Existing Facilities 368
3 Net Growth-Related Pupil Place Requirements (1-2) 0
NOTES
15 Year Projection of Average Daily Enrolments
Existing Schools and Projects
15 Year Projection of Average Daily Enrolments
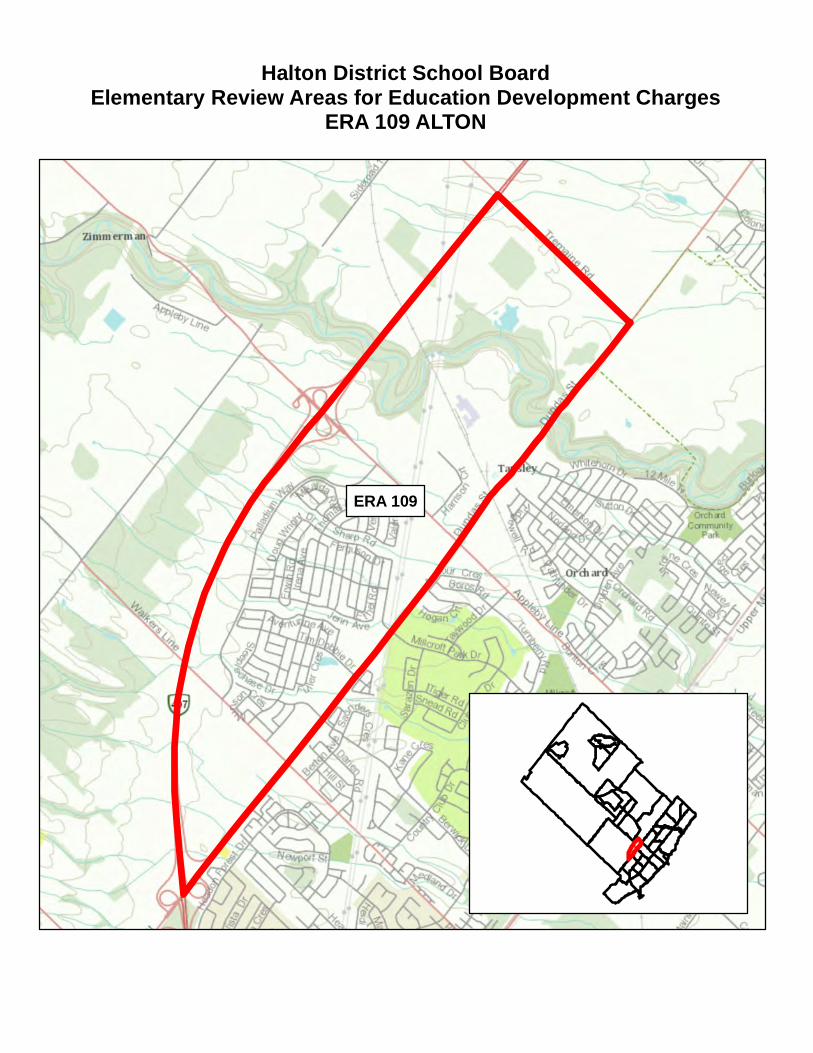
Halton District School BoardElementary Review Areas for Education Development Charges
ERA 109 ALTON
ERA 109
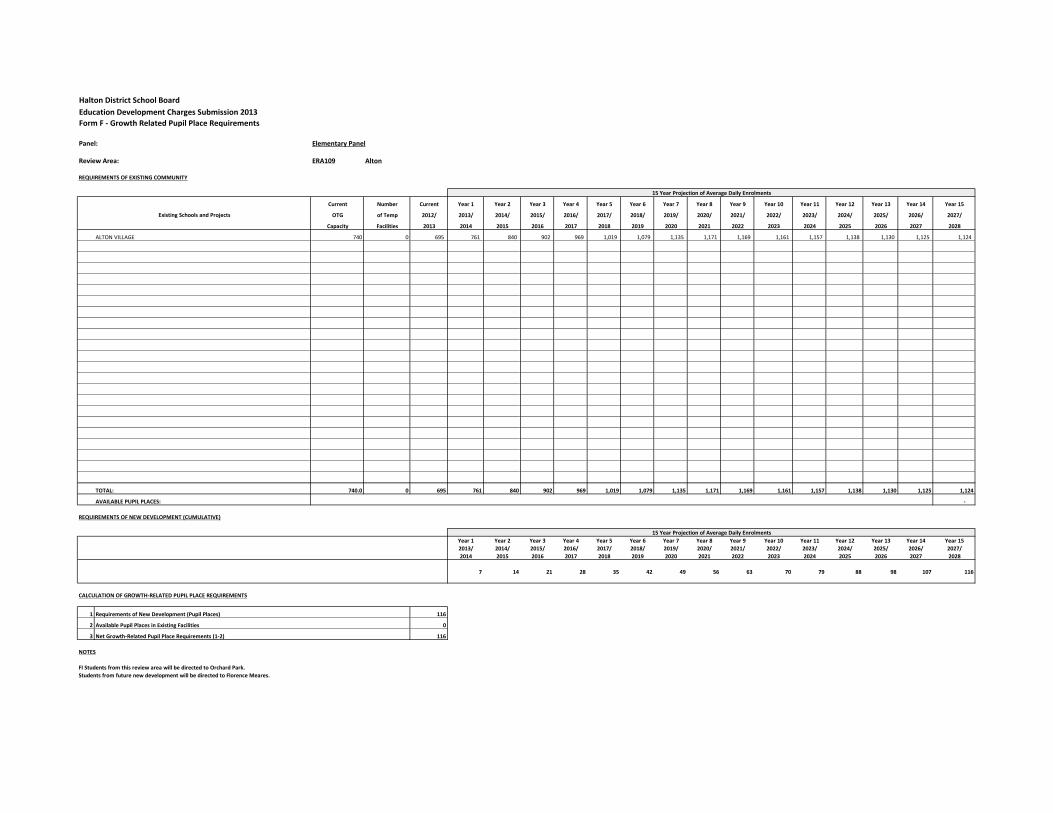
Halton District School Board
Education Development Charges Submission 2013
Form F - Growth Related Pupil Place Requirements
Panel: Elementary Panel
Review Area: ERA109 Alton
REQUIREMENTS OF EXISTING COMMUNITY
Current Number Current Year 1 Year 2 Year 3 Year 4 Year 5 Year 6 Year 7 Year 8 Year 9 Year 10 Year 11 Year 12 Year 13 Year 14 Year 15
OTG of Temp 2012/ 2013/ 2014/ 2015/ 2016/ 2017/ 2018/ 2019/ 2020/ 2021/ 2022/ 2023/ 2024/ 2025/ 2026/ 2027/
Capacity Facilities 2013 2014 2015 2016 2017 2018 2019 2020 2021 2022 2023 2024 2025 2026 2027 2028
ALTON VILLAGE 740 0 695 761 840 902 969 1,019 1,079 1,135 1,171 1,169 1,161 1,157 1,138 1,130 1,125 1,124
TOTAL: 740.0 0 695 761 840 902 969 1,019 1,079 1,135 1,171 1,169 1,161 1,157 1,138 1,130 1,125 1,124
AVAILABLE PUPIL PLACES: -
REQUIREMENTS OF NEW DEVELOPMENT (CUMULATIVE)
Year 1 Year 2 Year 3 Year 4 Year 5 Year 6 Year 7 Year 8 Year 9 Year 10 Year 11 Year 12 Year 13 Year 14 Year 15
2013/ 2014/ 2015/ 2016/ 2017/ 2018/ 2019/ 2020/ 2021/ 2022/ 2023/ 2024/ 2025/ 2026/ 2027/
2014 2015 2016 2017 2018 2019 2020 2021 2022 2023 2024 2025 2026 2027 2028
7 14 21 28 35 42 49 56 63 70 79 88 98 107 116
CALCULATION OF GROWTH-RELATED PUPIL PLACE REQUIREMENTS
1 Requirements of New Development (Pupil Places) 116
2 Available Pupil Places in Existing Facilities 0
3 Net Growth-Related Pupil Place Requirements (1-2) 116
NOTES
FI Students from this review area will be directed to Orchard Park.
Students from future new development will be directed to Florence Meares.
Existing Schools and Projects
15 Year Projection of Average Daily Enrolments
15 Year Projection of Average Daily Enrolments
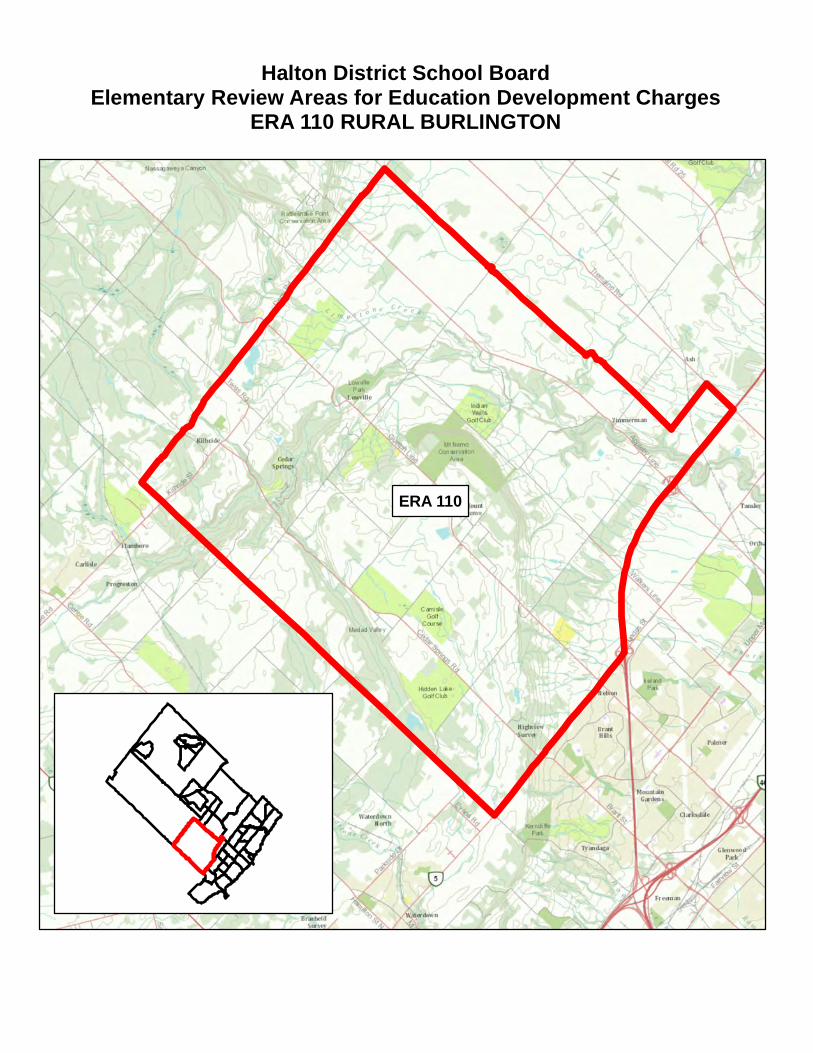
Halton District School BoardElementary Review Areas for Education Development Charges
ERA 110 RURAL BURLINGTON
ERA 110

Halton District School Board
Education Development Charges Submission 2013
Form F - Growth Related Pupil Place Requirements
Panel: Elementary Panel
Review Area: ERA110 Rural Burlington
REQUIREMENTS OF EXISTING COMMUNITY
Current Number Current Year 1 Year 2 Year 3 Year 4 Year 5 Year 6 Year 7 Year 8 Year 9 Year 10 Year 11 Year 12 Year 13 Year 14 Year 15
OTG of Temp 2012/ 2013/ 2014/ 2015/ 2016/ 2017/ 2018/ 2019/ 2020/ 2021/ 2022/ 2023/ 2024/ 2025/ 2026/ 2027/
Capacity Facilities 2013 2014 2015 2016 2017 2018 2019 2020 2021 2022 2023 2024 2025 2026 2027 2028
Kilbride Public School 363 1 268 268 269 259 257 251 239 237 238 232 225 231 227 228 230 232
TOTAL: 363.0 1 268 268 269 259 257 251 239 237 238 232 225 231 227 228 230 232
AVAILABLE PUPIL PLACES: 131
REQUIREMENTS OF NEW DEVELOPMENT (CUMULATIVE)
Year 1 Year 2 Year 3 Year 4 Year 5 Year 6 Year 7 Year 8 Year 9 Year 10 Year 11 Year 12 Year 13 Year 14 Year 15
2013/ 2014/ 2015/ 2016/ 2017/ 2018/ 2019/ 2020/ 2021/ 2022/ 2023/ 2024/ 2025/ 2026/ 2027/
2014 2015 2016 2017 2018 2019 2020 2021 2022 2023 2024 2025 2026 2027 2028
1 2 3 4 5 5 6 6 6 7 7 7 8 8 8
CALCULATION OF GROWTH-RELATED PUPIL PLACE REQUIREMENTS
1 Requirements of New Development (Pupil Places) 8
2 Available Pupil Places in Existing Facilities 131
3 Net Growth-Related Pupil Place Requirements (1-2) 0
NOTES
12,884 12,980 13,010 13,024 13,017 12,955 12,814 12,676 12,616 12,316 12,118 11,914 11,763 11,619 11,473 11,357
50 101 151 200 250 287 325 362 398 435 498 561 624 686 747
12,884 13,031 13,111 13,175 13,217 13,205 13,102 13,001 12,978 12,714 12,554 12,412 12,324 12,243 12,158 12,105
15 Year Projection of Average Daily Enrolments
15 Year Projection of Average Daily Enrolments
Existing Schools and Projects

Halton District School BoardElementary Review Areas for Education Development ChargesERA 111 S OF QEW, BETWEEN BURLOAK & 12 MILE CREEK
ERA 111
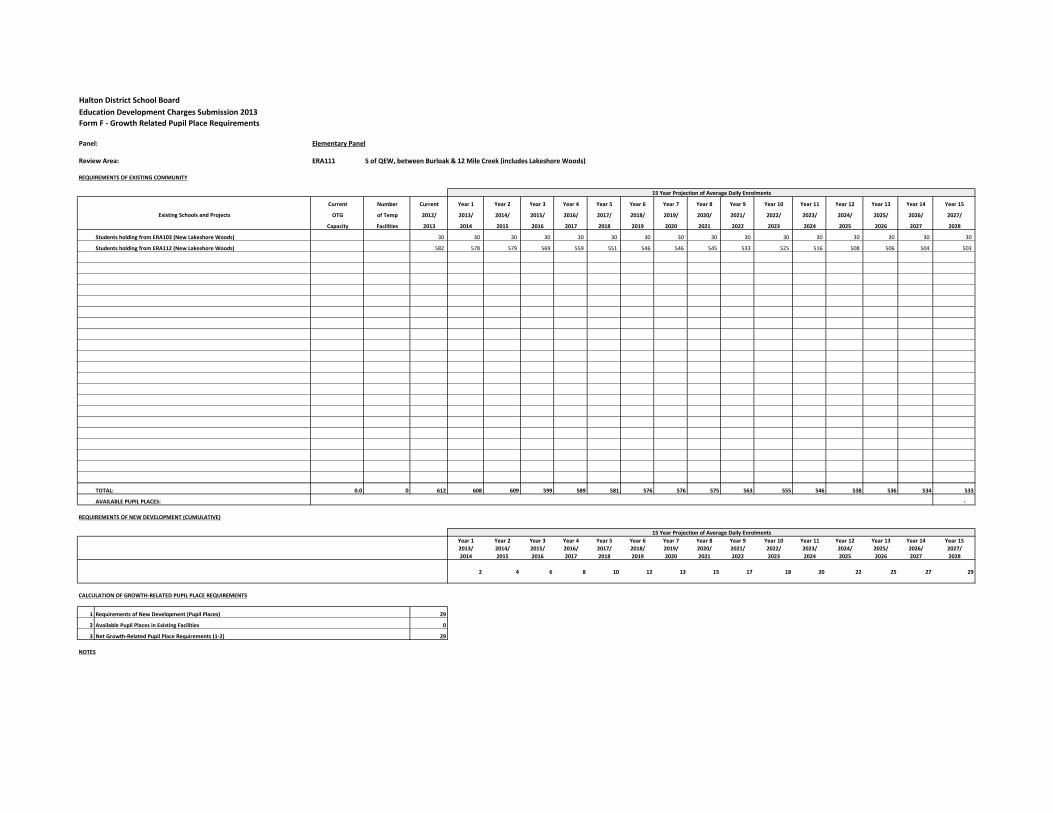
Halton District School Board
Education Development Charges Submission 2013
Form F - Growth Related Pupil Place Requirements
Panel: Elementary Panel
Review Area: ERA111 S of QEW, between Burloak & 12 Mile Creek (includes Lakeshore Woods)
REQUIREMENTS OF EXISTING COMMUNITY
Current Number Current Year 1 Year 2 Year 3 Year 4 Year 5 Year 6 Year 7 Year 8 Year 9 Year 10 Year 11 Year 12 Year 13 Year 14 Year 15
OTG of Temp 2012/ 2013/ 2014/ 2015/ 2016/ 2017/ 2018/ 2019/ 2020/ 2021/ 2022/ 2023/ 2024/ 2025/ 2026/ 2027/
Capacity Facilities 2013 2014 2015 2016 2017 2018 2019 2020 2021 2022 2023 2024 2025 2026 2027 2028
Students holding from ERA103 (New Lakeshore Woods) 30 30 30 30 30 30 30 30 30 30 30 30 30 30 30 30
Students holding from ERA112 (New Lakeshore Woods) 582 578 579 569 559 551 546 546 545 533 525 516 508 506 504 503
TOTAL: 0.0 0 612 608 609 599 589 581 576 576 575 563 555 546 538 536 534 533
AVAILABLE PUPIL PLACES: -
REQUIREMENTS OF NEW DEVELOPMENT (CUMULATIVE)
Year 1 Year 2 Year 3 Year 4 Year 5 Year 6 Year 7 Year 8 Year 9 Year 10 Year 11 Year 12 Year 13 Year 14 Year 15
2013/ 2014/ 2015/ 2016/ 2017/ 2018/ 2019/ 2020/ 2021/ 2022/ 2023/ 2024/ 2025/ 2026/ 2027/
2014 2015 2016 2017 2018 2019 2020 2021 2022 2023 2024 2025 2026 2027 2028
2 4 6 8 10 12 13 15 17 18 20 22 25 27 29
CALCULATION OF GROWTH-RELATED PUPIL PLACE REQUIREMENTS
1 Requirements of New Development (Pupil Places) 29
2 Available Pupil Places in Existing Facilities 0
3 Net Growth-Related Pupil Place Requirements (1-2) 29
NOTES
15 Year Projection of Average Daily Enrolments
Existing Schools and Projects
15 Year Projection of Average Daily Enrolments
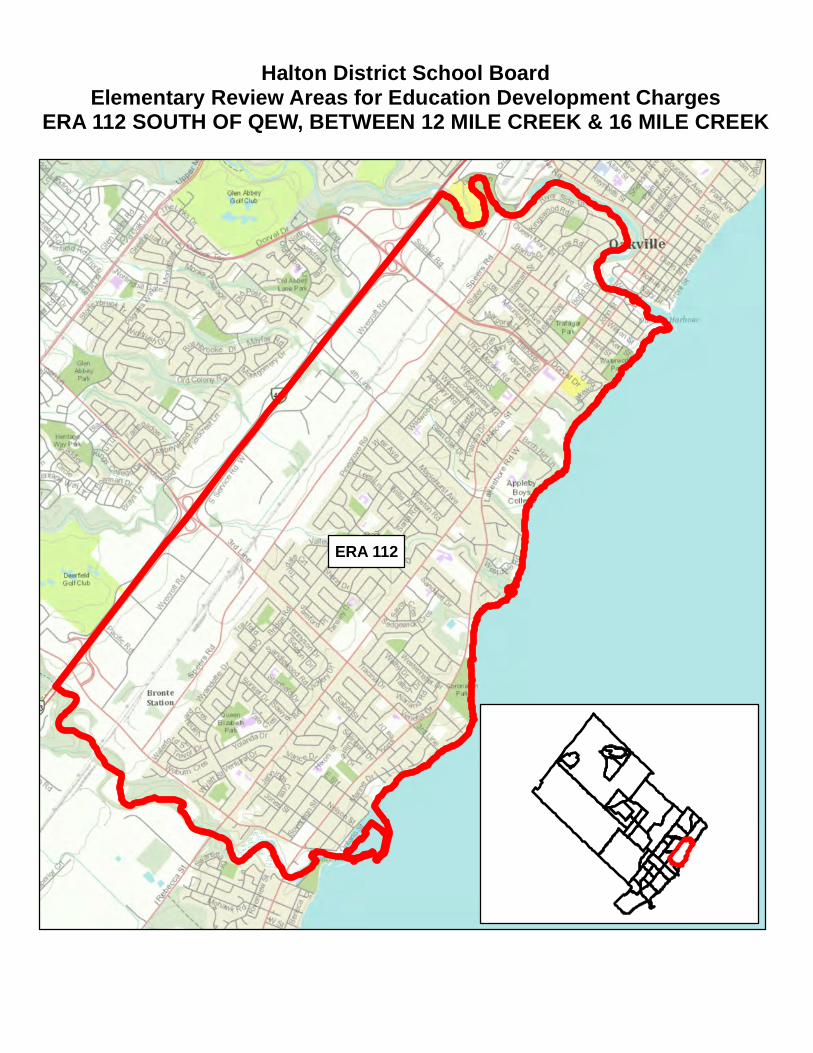
Halton District School BoardElementary Review Areas for Education Development Charges
ERA 112 SOUTH OF QEW, BETWEEN 12 MILE CREEK & 16 MILE CREEK
ERA 112

Halton District School Board
Education Development Charges Submission 2013
Form F - Growth Related Pupil Place Requirements
Panel: Elementary Panel
Review Area: ERA112 S of QEW, between 12 Mile Creek & 16 Mile Creek
REQUIREMENTS OF EXISTING COMMUNITY
Current Number Current Year 1 Year 2 Year 3 Year 4 Year 5 Year 6 Year 7 Year 8 Year 9 Year 10 Year 11 Year 12 Year 13 Year 14 Year 15
OTG of Temp 2012/ 2013/ 2014/ 2015/ 2016/ 2017/ 2018/ 2019/ 2020/ 2021/ 2022/ 2023/ 2024/ 2025/ 2026/ 2027/
Capacity Facilities 2013 2014 2015 2016 2017 2018 2019 2020 2021 2022 2023 2024 2025 2026 2027 2028
Brookdale Public School 363 0 316 306 302 292 285 275 269 272 266 258 247 242 237 236 234 234
Eastview Public School 562 0 477 461 472 452 449 455 428 429 442 426 417 401 386 384 382 381
Gladys Speers Public School 392 1 396 398 397 389 380 372 384 373 363 353 344 342 340 339 337 336
Oakwood Public School 360 0 171 171 156 160 153 147 132 128 124 121 120 120 119 118 118 117
Pine Grove Public School 555 10 741 767 796 810 827 821 812 826 816 820 821 820 819 821 820 820
W.H. Morden Public School 429 3 464 443 430 406 368 359 381 378 390 370 363 349 336 334 332 330
LESS HOLDING FOR LAKESHORE WOODS (ERA111) 582- 578- 579- 569- 559- 551- 546- 546- 545- 533- 525- 516- 508- 506- 504- 503-
TOTAL: 2,661.0 14 1,983 1,968 1,974 1,939 1,905 1,877 1,861 1,860 1,857 1,815 1,788 1,757 1,729 1,725 1,719 1,715
AVAILABLE PUPIL PLACES: 946
REQUIREMENTS OF NEW DEVELOPMENT (CUMULATIVE)
Year 1 Year 2 Year 3 Year 4 Year 5 Year 6 Year 7 Year 8 Year 9 Year 10 Year 11 Year 12 Year 13 Year 14 Year 15
2013/ 2014/ 2015/ 2016/ 2017/ 2018/ 2019/ 2020/ 2021/ 2022/ 2023/ 2024/ 2025/ 2026/ 2027/
2014 2015 2016 2017 2018 2019 2020 2021 2022 2023 2024 2025 2026 2027 2028
14 27 41 54 68 79 90 101 112 122 133 145 156 167 178
CALCULATION OF GROWTH-RELATED PUPIL PLACE REQUIREMENTS
1 Requirements of New Development (Pupil Places) 178
2 Available Pupil Places in Existing Facilities 946
3 Net Growth-Related Pupil Place Requirements (1-2) 0
NOTES
15 Year Projection of Average Daily Enrolments
Existing Schools and Projects
15 Year Projection of Average Daily Enrolments
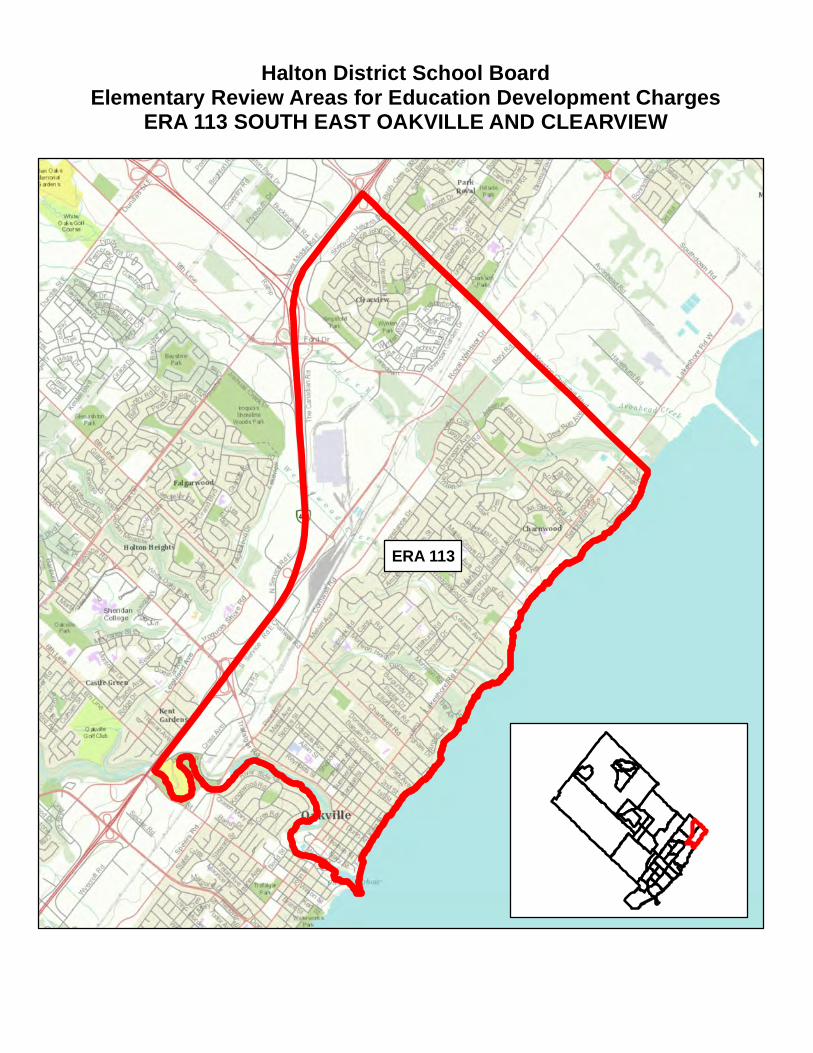
Halton District School BoardElementary Review Areas for Education Development Charges
ERA 113 SOUTH EAST OAKVILLE AND CLEARVIEW
ERA 113

Halton District School Board
Education Development Charges Submission 2013
Form F - Growth Related Pupil Place Requirements
Panel: Elementary Panel
Review Area: ERA113 SE Oakville and Clearview
REQUIREMENTS OF EXISTING COMMUNITY
Current Number Current Year 1 Year 2 Year 3 Year 4 Year 5 Year 6 Year 7 Year 8 Year 9 Year 10 Year 11 Year 12 Year 13 Year 14 Year 15
OTG of Temp 2012/ 2013/ 2014/ 2015/ 2016/ 2017/ 2018/ 2019/ 2020/ 2021/ 2022/ 2023/ 2024/ 2025/ 2026/ 2027/
Capacity Facilities 2013 2014 2015 2016 2017 2018 2019 2020 2021 2022 2023 2024 2025 2026 2027 2028
E.J. James Public School 377 3 465 465 475 486 488 492 484 499 487 485 486 485 486 486 486 486
James W Hill Public School 501 0 509 516 500 509 518 515 505 507 500 465 459 449 454 450 446 443
Maple Grove Public School 584 0 555 513 487 445 423 397 382 388 388 363 341 331 338 335 332 330
New Central Public School 259 0 244 234 218 203 202 199 190 179 170 166 168 167 165 163 162 161
TOTAL: 1,721.0 3 1,773 1,729 1,680 1,644 1,631 1,604 1,562 1,575 1,545 1,479 1,454 1,432 1,443 1,434 1,426 1,419
AVAILABLE PUPIL PLACES: 302
REQUIREMENTS OF NEW DEVELOPMENT (CUMULATIVE)
Year 1 Year 2 Year 3 Year 4 Year 5 Year 6 Year 7 Year 8 Year 9 Year 10 Year 11 Year 12 Year 13 Year 14 Year 15
2013/ 2014/ 2015/ 2016/ 2017/ 2018/ 2019/ 2020/ 2021/ 2022/ 2023/ 2024/ 2025/ 2026/ 2027/
2014 2015 2016 2017 2018 2019 2020 2021 2022 2023 2024 2025 2026 2027 2028
26 52 77 102 126 140 154 168 181 195 209 224 238 252 266
CALCULATION OF GROWTH-RELATED PUPIL PLACE REQUIREMENTS
1 Requirements of New Development (Pupil Places) 266
2 Available Pupil Places in Existing Facilities 302
3 Net Growth-Related Pupil Place Requirements (1-2) 0
NOTES
15 Year Projection of Average Daily Enrolments
Existing Schools and Projects
15 Year Projection of Average Daily Enrolments

Halton District School BoardElementary Review Areas for Education Development Charges
ERA 114 WEST OAK TRAILS & PALERMO
ERA 114

Halton District School Board
Education Development Charges Submission 2013
Form F - Growth Related Pupil Place Requirements
Panel: Elementary Panel
Review Area: ERA114 West Oak Trails & Palermo
REQUIREMENTS OF EXISTING COMMUNITY
Current Number Current Year 1 Year 2 Year 3 Year 4 Year 5 Year 6 Year 7 Year 8 Year 9 Year 10 Year 11 Year 12 Year 13 Year 14 Year 15
OTG of Temp 2012/ 2013/ 2014/ 2015/ 2016/ 2017/ 2018/ 2019/ 2020/ 2021/ 2022/ 2023/ 2024/ 2025/ 2026/ 2027/
Capacity Facilities 2013 2014 2015 2016 2017 2018 2019 2020 2021 2022 2023 2024 2025 2026 2027 2028
Captain R. Wilson Public School 671 2 671 647 626 597 580 557 539 523 513 504 493 487 483 481 479 478
Emily Carr Public School 763 5 764 748 733 717 689 673 645 631 615 602 597 590 586 583 581 579
Palermo Public School 718 9 791 858 901 906 914 879 894 892 888 875 867 855 847 842 839 836
TOTAL: 2,152.0 16 2,226 2,253 2,260 2,219 2,183 2,109 2,079 2,046 2,016 1,981 1,958 1,931 1,916 1,906 1,898 1,893
AVAILABLE PUPIL PLACES: 259
REQUIREMENTS OF NEW DEVELOPMENT (CUMULATIVE)
Year 1 Year 2 Year 3 Year 4 Year 5 Year 6 Year 7 Year 8 Year 9 Year 10 Year 11 Year 12 Year 13 Year 14 Year 15
2013/ 2014/ 2015/ 2016/ 2017/ 2018/ 2019/ 2020/ 2021/ 2022/ 2023/ 2024/ 2025/ 2026/ 2027/
2014 2015 2016 2017 2018 2019 2020 2021 2022 2023 2024 2025 2026 2027 2028
28 55 82 108 134 145 156 167 178 189 203 217 231 245 258
CALCULATION OF GROWTH-RELATED PUPIL PLACE REQUIREMENTS
1 Requirements of New Development (Pupil Places) 258
2 Available Pupil Places in Existing Facilities 259
3 Net Growth-Related Pupil Place Requirements (1-2) 0
NOTES
15 Year Projection of Average Daily Enrolments
15 Year Projection of Average Daily Enrolments
Existing Schools and Projects
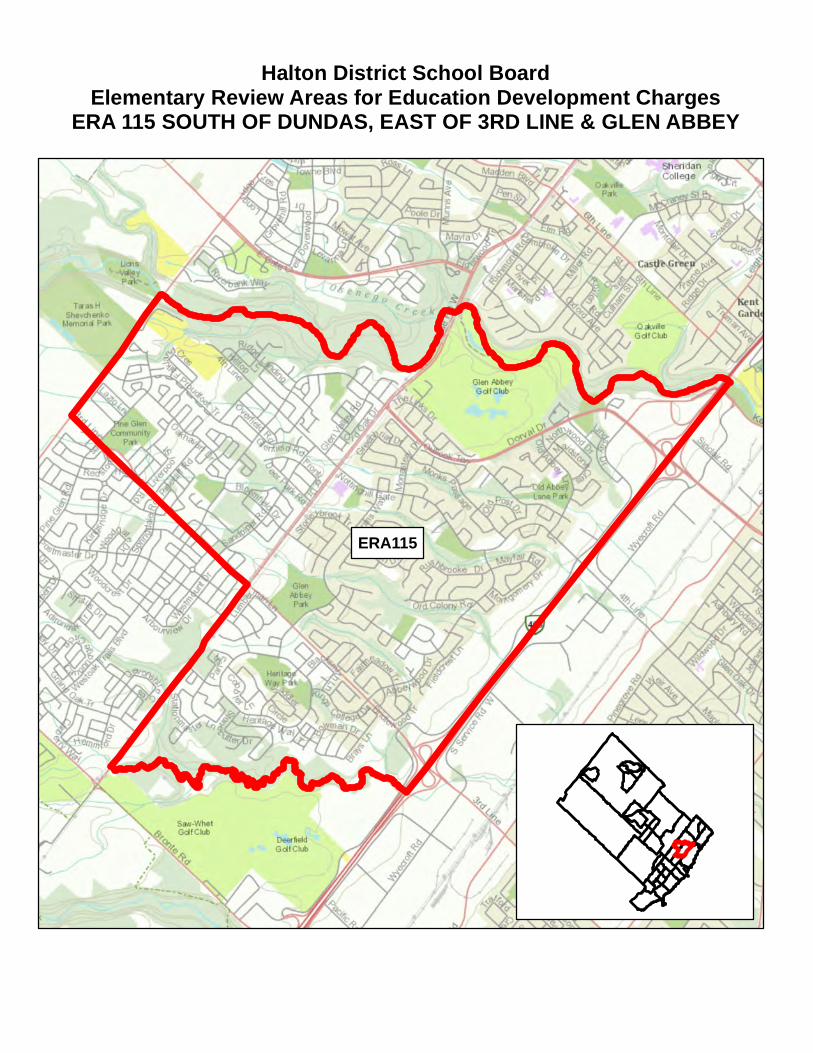
Halton District School BoardElementary Review Areas for Education Development Charges
ERA 115 SOUTH OF DUNDAS, EAST OF 3RD LINE & GLEN ABBEY
ERA115

Halton District School Board
Education Development Charges Submission 2013
Form F - Growth Related Pupil Place Requirements
Panel: Elementary Panel
Review Area: ERA115 S of Dundas, E of 3rd Line & Glen Abbey
REQUIREMENTS OF EXISTING COMMUNITY
Current Number Current Year 1 Year 2 Year 3 Year 4 Year 5 Year 6 Year 7 Year 8 Year 9 Year 10 Year 11 Year 12 Year 13 Year 14 Year 15
OTG of Temp 2012/ 2013/ 2014/ 2015/ 2016/ 2017/ 2018/ 2019/ 2020/ 2021/ 2022/ 2023/ 2024/ 2025/ 2026/ 2027/
Capacity Facilities 2013 2014 2015 2016 2017 2018 2019 2020 2021 2022 2023 2024 2025 2026 2027 2028
Abbey Lane Public School 441 0 384 368 352 339 311 300 299 289 287 270 263 255 249 249 246 244
Forest Trail Public School 736 17 879 868 860 875 878 893 889 892 891 893 893 892 892 893 893 893
Heritage Glen Public School 642 0 607 624 634 638 651 657 653 637 619 606 586 568 555 556 548 542
Pilgrim Wood Public School 685 2 552 581 578 603 622 631 599 544 485 480 483 468 456 458 452 446
West Oak Public School 720 9 852 816 789 732 677 625 590 563 549 530 510 495 483 484 478 474
TOTAL: 3,224.0 28 3,274 3,257 3,213 3,187 3,138 3,107 3,031 2,924 2,830 2,779 2,735 2,678 2,636 2,640 2,617 2,598
AVAILABLE PUPIL PLACES: 626
REQUIREMENTS OF NEW DEVELOPMENT (CUMULATIVE)
Year 1 Year 2 Year 3 Year 4 Year 5 Year 6 Year 7 Year 8 Year 9 Year 10 Year 11 Year 12 Year 13 Year 14 Year 15
2013/ 2014/ 2015/ 2016/ 2017/ 2018/ 2019/ 2020/ 2021/ 2022/ 2023/ 2024/ 2025/ 2026/ 2027/
2014 2015 2016 2017 2018 2019 2020 2021 2022 2023 2024 2025 2026 2027 2028
7 15 22 29 36 40 44 48 52 55 65 75 85 94 104
CALCULATION OF GROWTH-RELATED PUPIL PLACE REQUIREMENTS
1 Requirements of New Development (Pupil Places) 104
2 Available Pupil Places in Existing Facilities 626
3 Net Growth-Related Pupil Place Requirements (1-2) 0
NOTES
15 Year Projection of Average Daily Enrolments
Existing Schools and Projects
15 Year Projection of Average Daily Enrolments
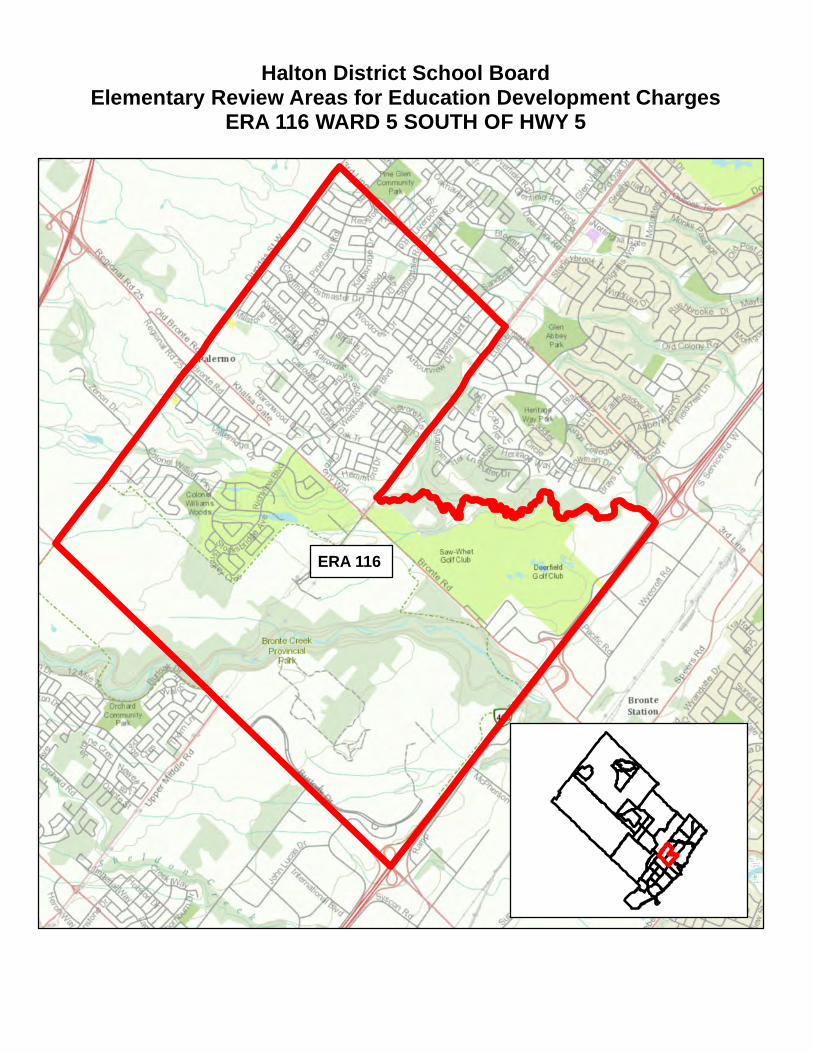
Halton District School BoardElementary Review Areas for Education Development Charges
ERA 116 WARD 5 SOUTH OF HWY 5
ERA 116
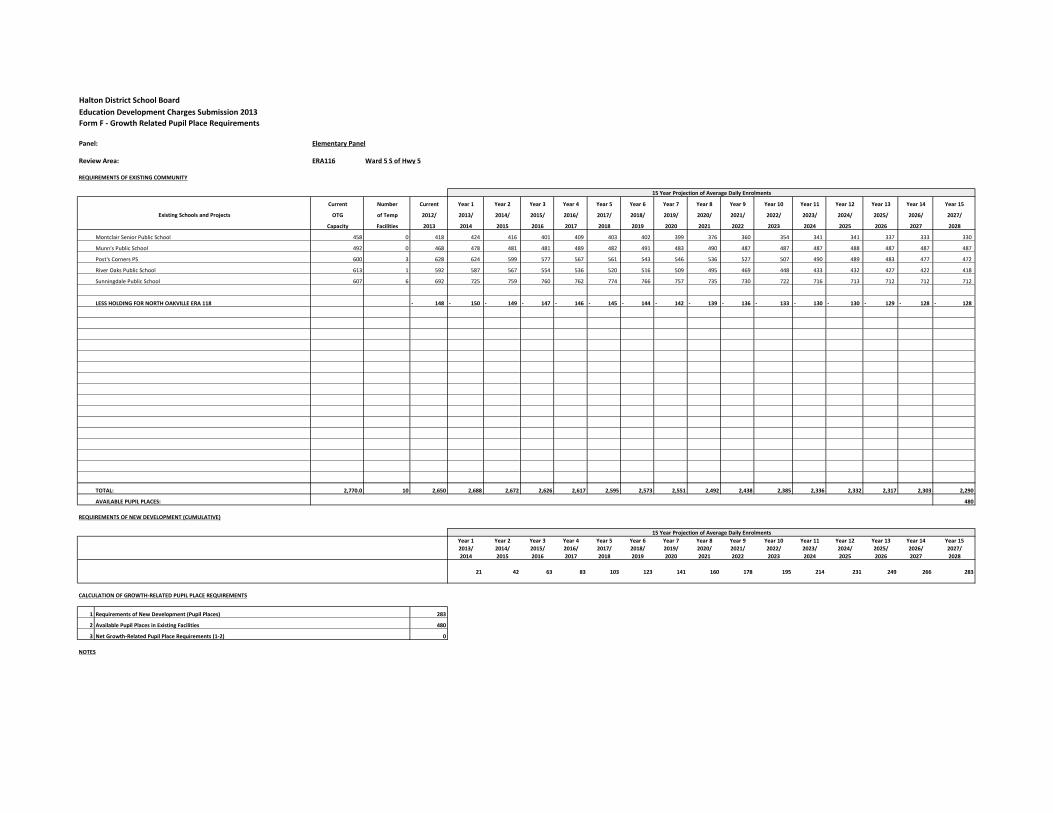
Halton District School Board
Education Development Charges Submission 2013
Form F - Growth Related Pupil Place Requirements
Panel: Elementary Panel
Review Area: ERA116 Ward 5 S of Hwy 5
REQUIREMENTS OF EXISTING COMMUNITY
Current Number Current Year 1 Year 2 Year 3 Year 4 Year 5 Year 6 Year 7 Year 8 Year 9 Year 10 Year 11 Year 12 Year 13 Year 14 Year 15
OTG of Temp 2012/ 2013/ 2014/ 2015/ 2016/ 2017/ 2018/ 2019/ 2020/ 2021/ 2022/ 2023/ 2024/ 2025/ 2026/ 2027/
Capacity Facilities 2013 2014 2015 2016 2017 2018 2019 2020 2021 2022 2023 2024 2025 2026 2027 2028
Montclair Senior Public School 458 0 418 424 416 401 409 403 402 399 376 360 354 341 341 337 333 330
Munn's Public School 492 0 468 478 481 481 489 482 491 483 490 487 487 487 488 487 487 487
Post's Corners PS 600 3 628 624 599 577 567 561 543 546 536 527 507 490 489 483 477 472
River Oaks Public School 613 1 592 587 567 554 536 520 516 509 495 469 448 433 432 427 422 418
Sunningdale Public School 607 6 692 725 759 760 762 774 766 757 735 730 722 716 713 712 712 712
LESS HOLDING FOR NORTH OAKVILLE ERA 118 148- 150- 149- 147- 146- 145- 144- 142- 139- 136- 133- 130- 130- 129- 128- 128-
TOTAL: 2,770.0 10 2,650 2,688 2,672 2,626 2,617 2,595 2,573 2,551 2,492 2,438 2,385 2,336 2,332 2,317 2,303 2,290
AVAILABLE PUPIL PLACES: 480
REQUIREMENTS OF NEW DEVELOPMENT (CUMULATIVE)
Year 1 Year 2 Year 3 Year 4 Year 5 Year 6 Year 7 Year 8 Year 9 Year 10 Year 11 Year 12 Year 13 Year 14 Year 15
2013/ 2014/ 2015/ 2016/ 2017/ 2018/ 2019/ 2020/ 2021/ 2022/ 2023/ 2024/ 2025/ 2026/ 2027/
2014 2015 2016 2017 2018 2019 2020 2021 2022 2023 2024 2025 2026 2027 2028
21 42 63 83 103 123 141 160 178 195 214 231 249 266 283
CALCULATION OF GROWTH-RELATED PUPIL PLACE REQUIREMENTS
1 Requirements of New Development (Pupil Places) 283
2 Available Pupil Places in Existing Facilities 480
3 Net Growth-Related Pupil Place Requirements (1-2) 0
NOTES
15 Year Projection of Average Daily Enrolments
Existing Schools and Projects
15 Year Projection of Average Daily Enrolments
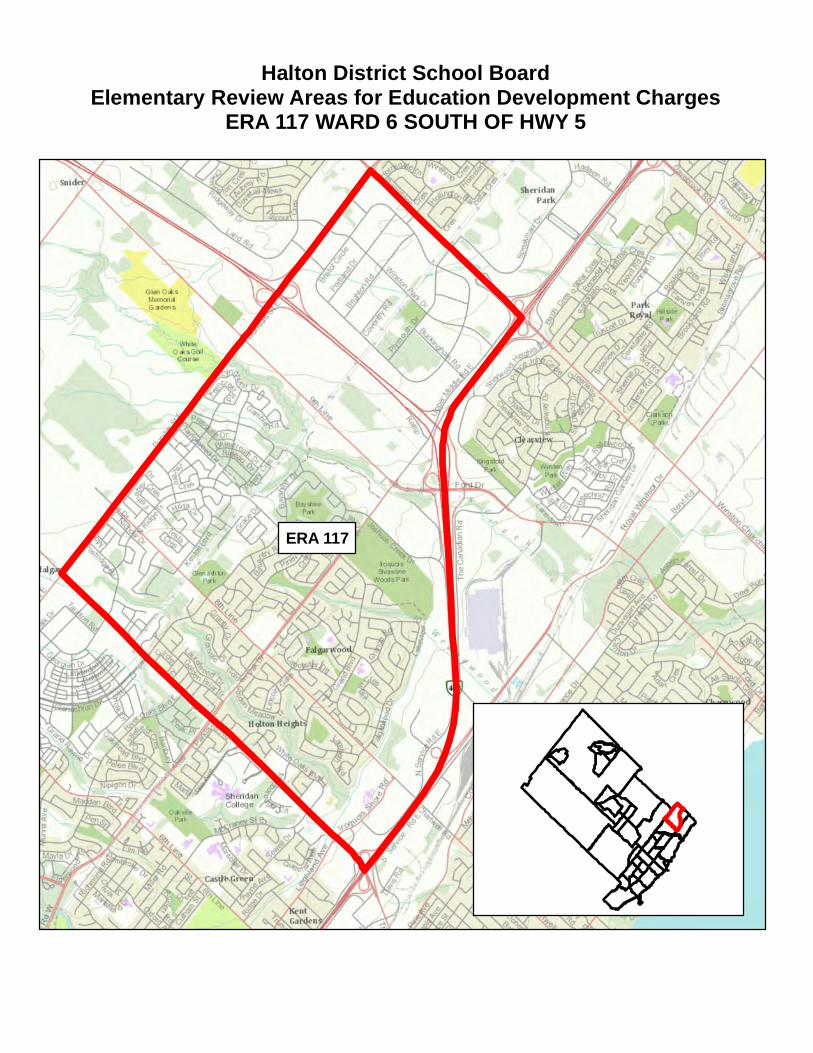
Halton District School BoardElementary Review Areas for Education Development Charges
ERA 117 WARD 6 SOUTH OF HWY 5
ERA 117

Halton District School Board
Education Development Charges Submission 2013
Form F - Growth Related Pupil Place Requirements
Panel: Elementary Panel
Review Area: ERA117 Ward 6 S of Hwy 5
REQUIREMENTS OF EXISTING COMMUNITY
Current Number Current Year 1 Year 2 Year 3 Year 4 Year 5 Year 6 Year 7 Year 8 Year 9 Year 10 Year 11 Year 12 Year 13 Year 14 Year 15
OTG of Temp 2012/ 2013/ 2014/ 2015/ 2016/ 2017/ 2018/ 2019/ 2020/ 2021/ 2022/ 2023/ 2024/ 2025/ 2026/ 2027/
Capacity Facilities 2013 2014 2015 2016 2017 2018 2019 2020 2021 2022 2023 2024 2025 2026 2027 2028
Falgarwood Public School 536 0 428 408 393 366 336 316 311 331 312 311 300 294 297 309 320 323
Joshua Creek Public School 835 3 884 886 876 842 801 771 741 723 704 690 694 694 700 720 739 743
Sheridan Public School 262 0 203 200 185 174 173 161 158 158 159 161 167 172 173 173 173 173
TOTAL: 1,633.0 3 1,515 1,494 1,454 1,382 1,310 1,248 1,211 1,212 1,175 1,162 1,161 1,161 1,170 1,202 1,232 1,239
AVAILABLE PUPIL PLACES: 394
REQUIREMENTS OF NEW DEVELOPMENT (CUMULATIVE)
Year 1 Year 2 Year 3 Year 4 Year 5 Year 6 Year 7 Year 8 Year 9 Year 10 Year 11 Year 12 Year 13 Year 14 Year 15
2013/ 2014/ 2015/ 2016/ 2017/ 2018/ 2019/ 2020/ 2021/ 2022/ 2023/ 2024/ 2025/ 2026/ 2027/
2014 2015 2016 2017 2018 2019 2020 2021 2022 2023 2024 2025 2026 2027 2028
14 28 42 55 69 75 82 88 94 101 109 118 126 135 143
CALCULATION OF GROWTH-RELATED PUPIL PLACE REQUIREMENTS
1 Requirements of New Development (Pupil Places) 143
2 Available Pupil Places in Existing Facilities 394
3 Net Growth-Related Pupil Place Requirements (1-2) 0
NOTES
Existing Schools and Projects
15 Year Projection of Average Daily Enrolments
15 Year Projection of Average Daily Enrolments
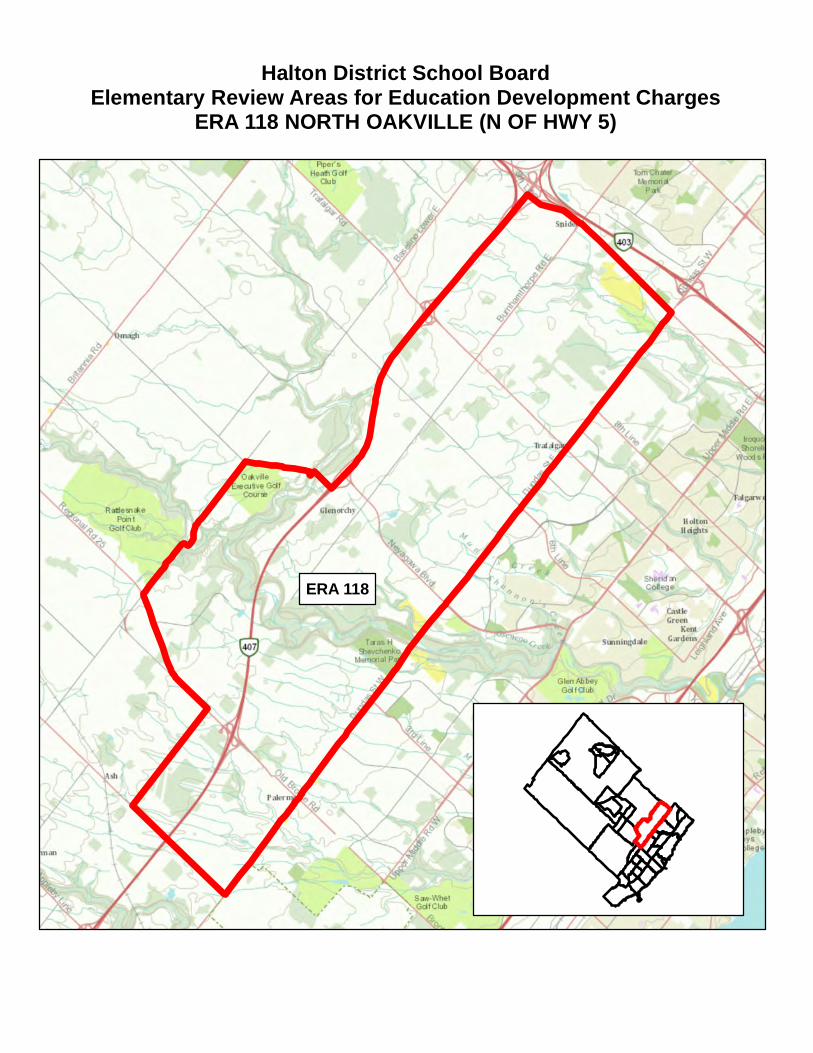
Halton District School BoardElementary Review Areas for Education Development Charges
ERA 118 NORTH OAKVILLE (N OF HWY 5)
ERA 118

Halton District School Board
Education Development Charges Submission 2013
Form F - Growth Related Pupil Place Requirements
Panel: Elementary Panel
Review Area: ERA118 North Oakville (N of Hwy 5)
REQUIREMENTS OF EXISTING COMMUNITY
Current Number Current Year 1 Year 2 Year 3 Year 4 Year 5 Year 6 Year 7 Year 8 Year 9 Year 10 Year 11 Year 12 Year 13 Year 14 Year 15
OTG of Temp 2012/ 2013/ 2014/ 2015/ 2016/ 2017/ 2018/ 2019/ 2020/ 2021/ 2022/ 2023/ 2024/ 2025/ 2026/ 2027/
Capacity Facilities 2013 2014 2015 2016 2017 2018 2019 2020 2021 2022 2023 2024 2025 2026 2027 2028
HOLDING FROM ERA116 148 150 149 147 146 145 144 142 139 136 133 130 130 129 128 128
TOTAL: 0.0 0 148 150 149 147 146 145 144 142 139 136 133 130 130 129 128 128
AVAILABLE PUPIL PLACES: 0
REQUIREMENTS OF NEW DEVELOPMENT (CUMULATIVE)
Year 1 Year 2 Year 3 Year 4 Year 5 Year 6 Year 7 Year 8 Year 9 Year 10 Year 11 Year 12 Year 13 Year 14 Year 15
2013/ 2014/ 2015/ 2016/ 2017/ 2018/ 2019/ 2020/ 2021/ 2022/ 2023/ 2024/ 2025/ 2026/ 2027/
2014 2015 2016 2017 2018 2019 2020 2021 2022 2023 2024 2025 2026 2027 2028
298 596 895 1193 1491 1748 2004 2260 2517 2773 2886 2999 3112 3225 3338
CALCULATION OF GROWTH-RELATED PUPIL PLACE REQUIREMENTS
1 Requirements of New Development (Pupil Places) 3338
2 Available Pupil Places in Existing Facilities 0
3 Net Growth-Related Pupil Place Requirements (1-2) 3338
NOTES
15 Year Projection of Average Daily Enrolments
Existing Schools and Projects
15 Year Projection of Average Daily Enrolments

Halton District School BoardElementary Review Areas for Education Development Charges
ERA 119 OLD MILTON
ERA 119

Halton District School Board
Education Development Charges Submission 2013
Form F - Growth Related Pupil Place Requirements
Panel: Elementary Panel
Review Area: ERA119 Old Milton
REQUIREMENTS OF EXISTING COMMUNITY
Current Number Current Year 1 Year 2 Year 3 Year 4 Year 5 Year 6 Year 7 Year 8 Year 9 Year 10 Year 11 Year 12 Year 13 Year 14 Year 15
OTG of Temp 2012/ 2013/ 2014/ 2015/ 2016/ 2017/ 2018/ 2019/ 2020/ 2021/ 2022/ 2023/ 2024/ 2025/ 2026/ 2027/
Capacity Facilities 2013 2014 2015 2016 2017 2018 2019 2020 2021 2022 2023 2024 2025 2026 2027 2028
E.W. Foster Public School 328 12 574 585 553 529 514 490 479 503 507 499 487 474 462 451 442 435
J.M. Denyes Public School 343 0 228 210 205 193 191 198 199 197 197 193 188 183 179 176 173 171
Martin Street Public School 282 1 277 282 284 299 305 316 309 322 324 319 311 303 295 288 282 278
Robert Baldwin Public School 426 2 402 404 412 413 405 414 422 422 423 415 405 394 385 376 370 365
Sam Sherratt Public School 415 0 384 368 368 385 391 384 367 342 322 316 329 334 330 324 317 310
W.I. Dick Middle School 412 0 485 490 503 534 531 540 480 454 446 491 512 509 499 486 473 460
TOTAL: 2,206.0 15 2,350 2,339 2,324 2,354 2,337 2,342 2,256 2,240 2,219 2,232 2,232 2,198 2,150 2,101 2,057 2,020
AVAILABLE PUPIL PLACES: 186
REQUIREMENTS OF NEW DEVELOPMENT (CUMULATIVE)
Year 1 Year 2 Year 3 Year 4 Year 5 Year 6 Year 7 Year 8 Year 9 Year 10 Year 11 Year 12 Year 13 Year 14 Year 15
2013/ 2014/ 2015/ 2016/ 2017/ 2018/ 2019/ 2020/ 2021/ 2022/ 2023/ 2024/ 2025/ 2026/ 2027/
2014 2015 2016 2017 2018 2019 2020 2021 2022 2023 2024 2025 2026 2027 2028
31 62 92 122 151 188 225 261 297 332 362 392 421 451 480
CALCULATION OF GROWTH-RELATED PUPIL PLACE REQUIREMENTS
1 Requirements of New Development (Pupil Places) 480
2 Available Pupil Places in Existing Facilities 186
3 Net Growth-Related Pupil Place Requirements (1-2) 294
NOTES
15 Year Projection of Average Daily Enrolments
Existing Schools and Projects
15 Year Projection of Average Daily Enrolments
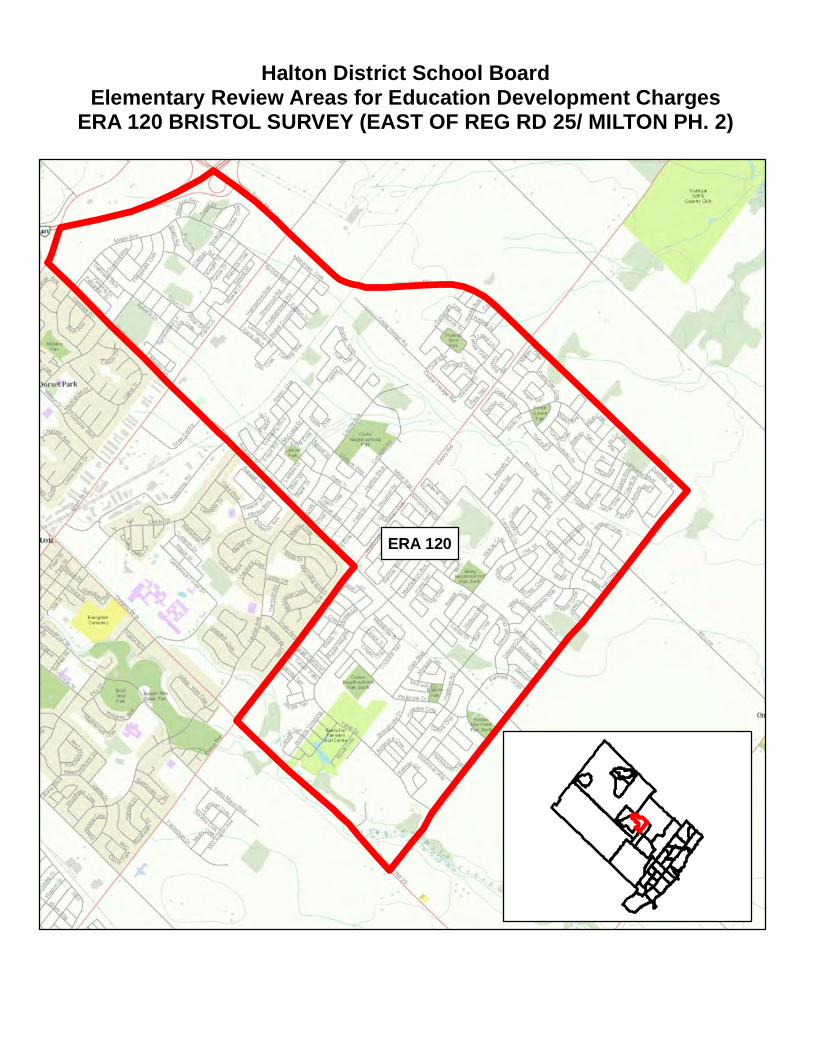
Halton District School BoardElementary Review Areas for Education Development Charges
ERA 120 BRISTOL SURVEY (EAST OF REG RD 25/ MILTON PH. 2)
ERA 120

Halton District School Board
Education Development Charges Submission 2013
Form F - Growth Related Pupil Place Requirements
Panel: Elementary Panel
Review Area: ERA120 Bristol Survey (E of Reg Rd 25/Milton Ph. 2)
REQUIREMENTS OF EXISTING COMMUNITY
Current Number Current Year 1 Year 2 Year 3 Year 4 Year 5 Year 6 Year 7 Year 8 Year 9 Year 10 Year 11 Year 12 Year 13 Year 14 Year 15
OTG of Temp 2012/ 2013/ 2014/ 2015/ 2016/ 2017/ 2018/ 2019/ 2020/ 2021/ 2022/ 2023/ 2024/ 2025/ 2026/ 2027/
Capacity Facilities 2013 2014 2015 2016 2017 2018 2019 2020 2021 2022 2023 2024 2025 2026 2027 2028
Bruce Trail Public School 792 11 951 1,004 1,044 1,069 1,076 1,080 1,092 1,093 1,100 1,087 1,067 1,056 1,052 1,055 1,058 1,063
Chris Hadfield Public School 593 13 807 825 811 811 808 797 775 761 744 730 708 701 698 700 702 705
Hawthorne Village Public School 769 12 1,273 1,281 1,262 1,253 1,234 1,196 1,175 1,126 1,099 1,065 1,026 1,016 1,013 1,016 1,019 1,023
Tiger Jeet Singh Public School 818 10 1,079 1,145 1,209 1,272 1,322 1,370 1,371 1,362 1,337 1,310 1,301 1,285 1,280 1,283 1,287 1,292
New Milton #7 741 0 - - - - - - - - - - - - - - - -
TOTAL: 3,713.0 46 4,110 4,255 4,326 4,405 4,440 4,443 4,413 4,343 4,280 4,192 4,103 4,057 4,043 4,055 4,067 4,083
AVAILABLE PUPIL PLACES: -
REQUIREMENTS OF NEW DEVELOPMENT (CUMULATIVE)
Year 1 Year 2 Year 3 Year 4 Year 5 Year 6 Year 7 Year 8 Year 9 Year 10 Year 11 Year 12 Year 13 Year 14 Year 15
2013/ 2014/ 2015/ 2016/ 2017/ 2018/ 2019/ 2020/ 2021/ 2022/ 2023/ 2024/ 2025/ 2026/ 2027/
2014 2015 2016 2017 2018 2019 2020 2021 2022 2023 2024 2025 2026 2027 2028
62 123 183 242 300 322 343 365 385 406 429 451 473 495 516
CALCULATION OF GROWTH-RELATED PUPIL PLACE REQUIREMENTS
1 Requirements of New Development (Pupil Places) 516
2 Available Pupil Places in Existing Facilities -
3 Net Growth-Related Pupil Place Requirements (1-2) 516
NOTES
15 Year Projection of Average Daily Enrolments
Existing Schools and Projects
15 Year Projection of Average Daily Enrolments
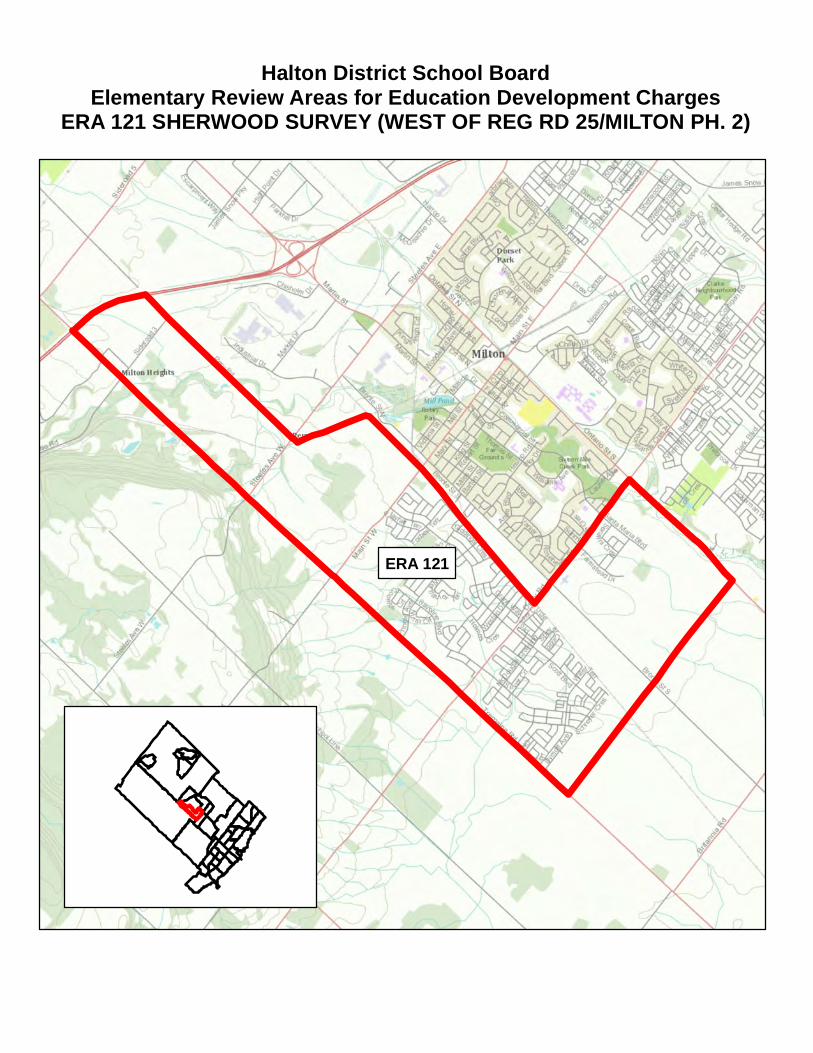
Halton District School BoardElementary Review Areas for Education Development Charges
ERA 121 SHERWOOD SURVEY (WEST OF REG RD 25/MILTON PH. 2)
ERA 121
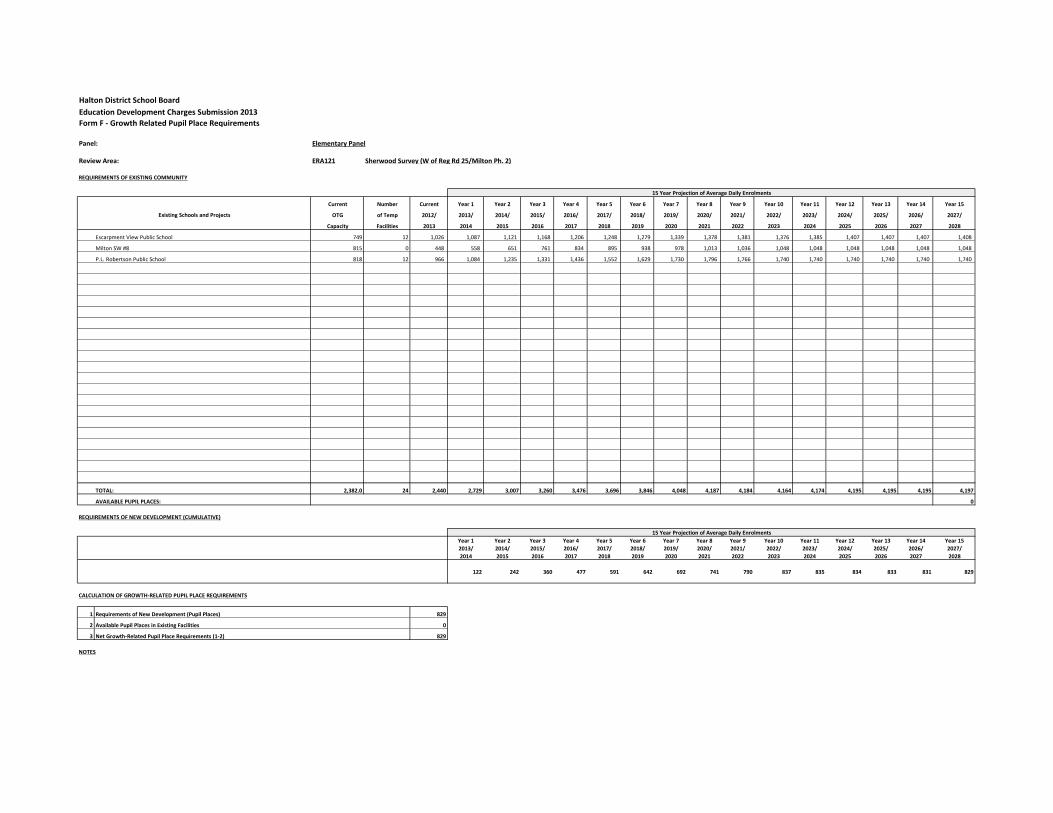
Halton District School Board
Education Development Charges Submission 2013
Form F - Growth Related Pupil Place Requirements
Panel: Elementary Panel
Review Area: ERA121 Sherwood Survey (W of Reg Rd 25/Milton Ph. 2)
REQUIREMENTS OF EXISTING COMMUNITY
Current Number Current Year 1 Year 2 Year 3 Year 4 Year 5 Year 6 Year 7 Year 8 Year 9 Year 10 Year 11 Year 12 Year 13 Year 14 Year 15
OTG of Temp 2012/ 2013/ 2014/ 2015/ 2016/ 2017/ 2018/ 2019/ 2020/ 2021/ 2022/ 2023/ 2024/ 2025/ 2026/ 2027/
Capacity Facilities 2013 2014 2015 2016 2017 2018 2019 2020 2021 2022 2023 2024 2025 2026 2027 2028
Escarpment View Public School 749 12 1,026 1,087 1,121 1,168 1,206 1,248 1,279 1,339 1,378 1,381 1,376 1,385 1,407 1,407 1,407 1,408
Milton SW #8 815 0 448 558 651 761 834 895 938 978 1,013 1,036 1,048 1,048 1,048 1,048 1,048 1,048
P.L. Robertson Public School 818 12 966 1,084 1,235 1,331 1,436 1,552 1,629 1,730 1,796 1,766 1,740 1,740 1,740 1,740 1,740 1,740
TOTAL: 2,382.0 24 2,440 2,729 3,007 3,260 3,476 3,696 3,846 4,048 4,187 4,184 4,164 4,174 4,195 4,195 4,195 4,197
AVAILABLE PUPIL PLACES: 0
REQUIREMENTS OF NEW DEVELOPMENT (CUMULATIVE)
Year 1 Year 2 Year 3 Year 4 Year 5 Year 6 Year 7 Year 8 Year 9 Year 10 Year 11 Year 12 Year 13 Year 14 Year 15
2013/ 2014/ 2015/ 2016/ 2017/ 2018/ 2019/ 2020/ 2021/ 2022/ 2023/ 2024/ 2025/ 2026/ 2027/
2014 2015 2016 2017 2018 2019 2020 2021 2022 2023 2024 2025 2026 2027 2028
122 242 360 477 591 642 692 741 790 837 835 834 833 831 829
CALCULATION OF GROWTH-RELATED PUPIL PLACE REQUIREMENTS
1 Requirements of New Development (Pupil Places) 829
2 Available Pupil Places in Existing Facilities 0
3 Net Growth-Related Pupil Place Requirements (1-2) 829
NOTES
15 Year Projection of Average Daily Enrolments
Existing Schools and Projects
15 Year Projection of Average Daily Enrolments
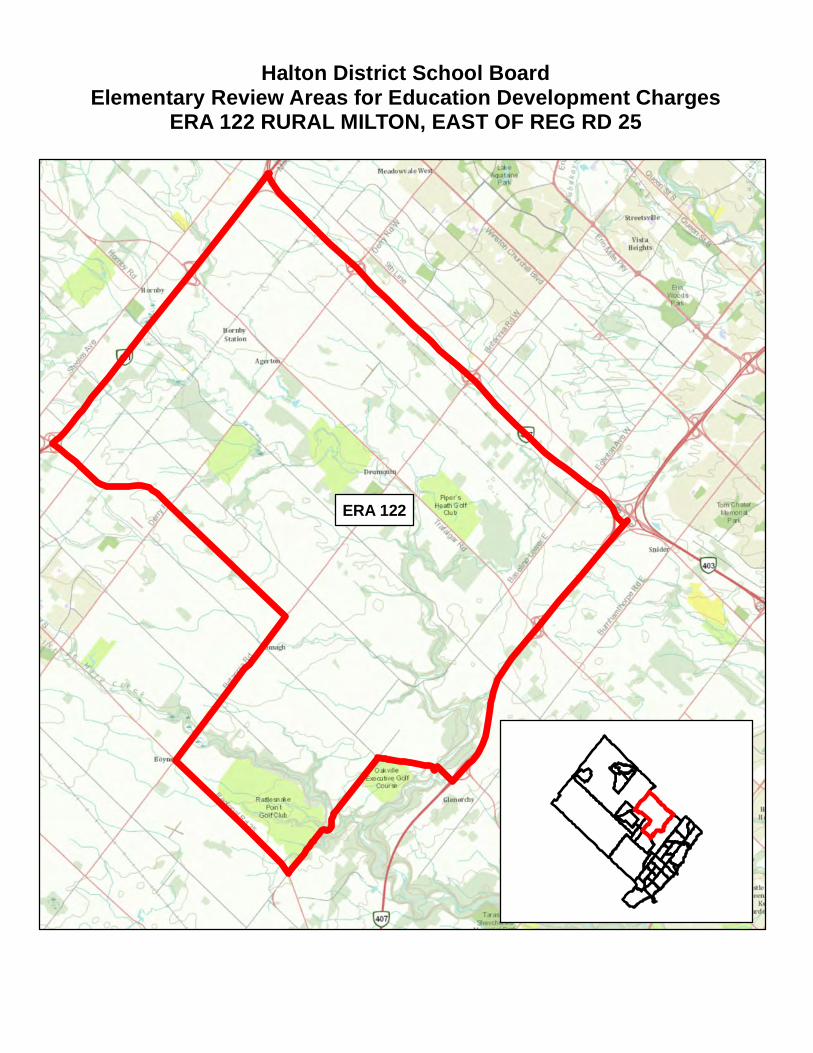
Halton District School BoardElementary Review Areas for Education Development Charges
ERA 122 RURAL MILTON, EAST OF REG RD 25
ERA 122
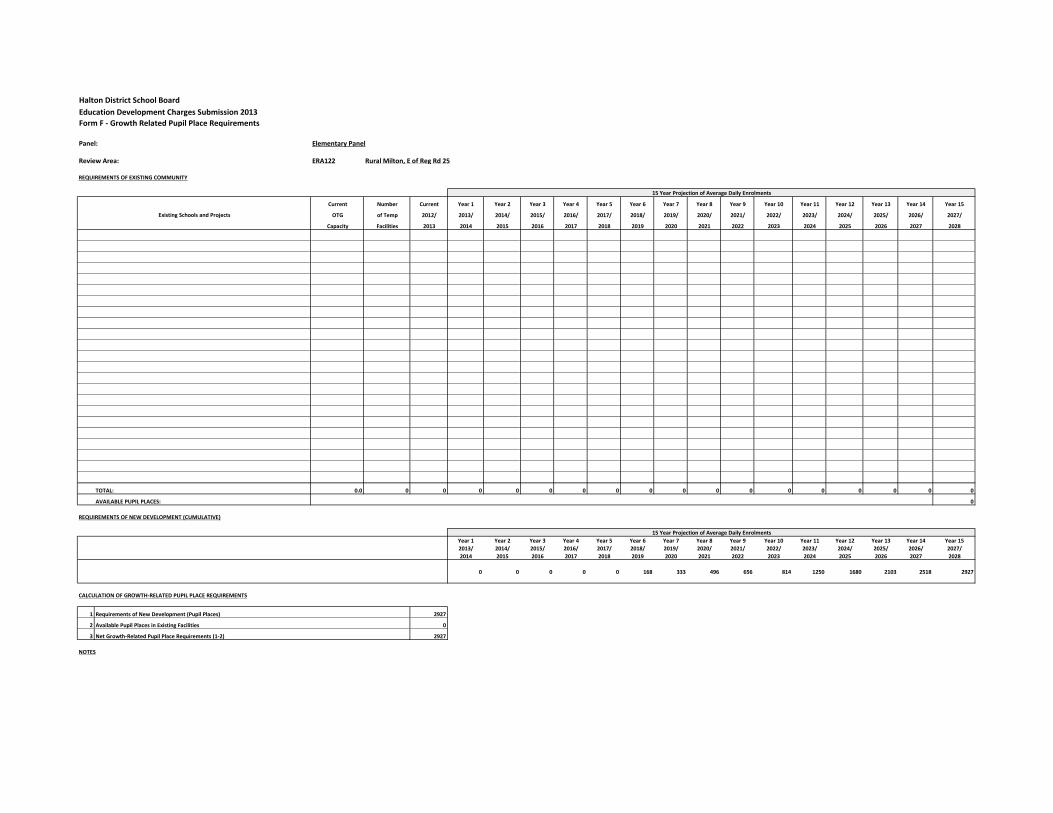
Halton District School Board
Education Development Charges Submission 2013
Form F - Growth Related Pupil Place Requirements
Panel: Elementary Panel
Review Area: ERA122 Rural Milton, E of Reg Rd 25
REQUIREMENTS OF EXISTING COMMUNITY
Current Number Current Year 1 Year 2 Year 3 Year 4 Year 5 Year 6 Year 7 Year 8 Year 9 Year 10 Year 11 Year 12 Year 13 Year 14 Year 15
OTG of Temp 2012/ 2013/ 2014/ 2015/ 2016/ 2017/ 2018/ 2019/ 2020/ 2021/ 2022/ 2023/ 2024/ 2025/ 2026/ 2027/
Capacity Facilities 2013 2014 2015 2016 2017 2018 2019 2020 2021 2022 2023 2024 2025 2026 2027 2028
TOTAL: 0.0 0 0 0 0 0 0 0 0 0 0 0 0 0 0 0 0 0
AVAILABLE PUPIL PLACES: 0
REQUIREMENTS OF NEW DEVELOPMENT (CUMULATIVE)
Year 1 Year 2 Year 3 Year 4 Year 5 Year 6 Year 7 Year 8 Year 9 Year 10 Year 11 Year 12 Year 13 Year 14 Year 15
2013/ 2014/ 2015/ 2016/ 2017/ 2018/ 2019/ 2020/ 2021/ 2022/ 2023/ 2024/ 2025/ 2026/ 2027/
2014 2015 2016 2017 2018 2019 2020 2021 2022 2023 2024 2025 2026 2027 2028
0 0 0 0 0 168 333 496 656 814 1250 1680 2103 2518 2927
CALCULATION OF GROWTH-RELATED PUPIL PLACE REQUIREMENTS
1 Requirements of New Development (Pupil Places) 2927
2 Available Pupil Places in Existing Facilities 0
3 Net Growth-Related Pupil Place Requirements (1-2) 2927
NOTES
15 Year Projection of Average Daily Enrolments
15 Year Projection of Average Daily Enrolments
Existing Schools and Projects
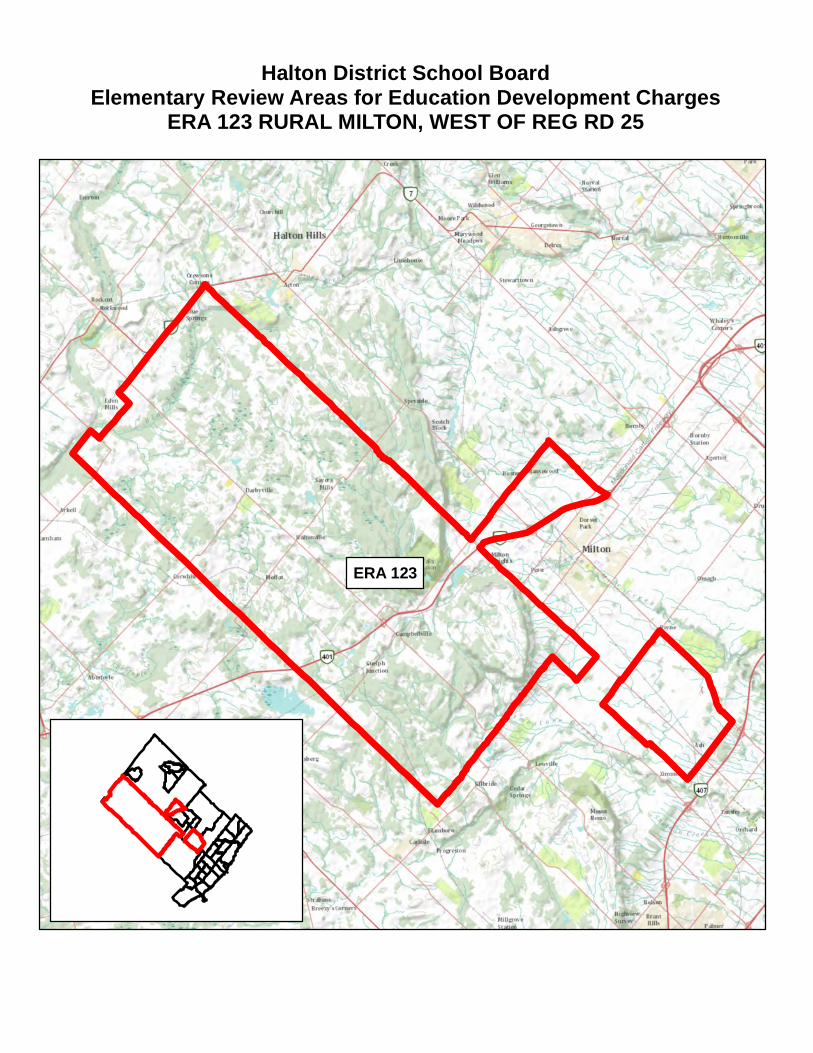
Halton District School BoardElementary Review Areas for Education Development Charges
ERA 123 RURAL MILTON, WEST OF REG RD 25
ERA 123
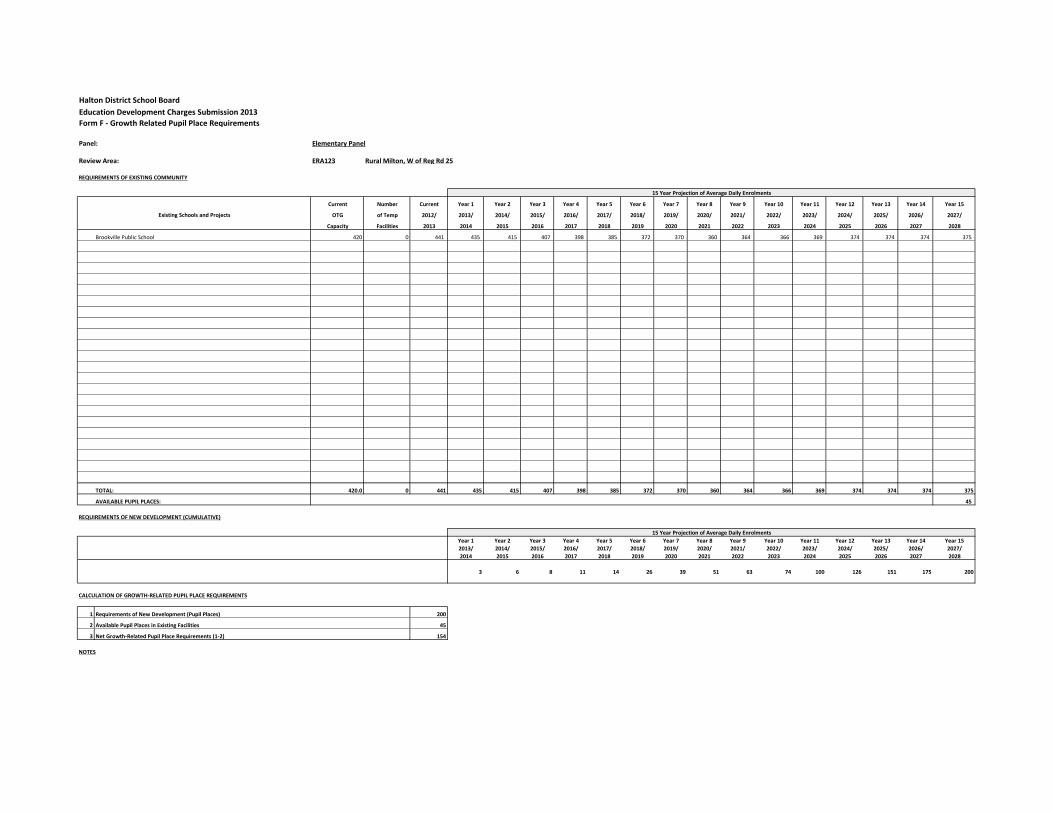
Halton District School Board
Education Development Charges Submission 2013
Form F - Growth Related Pupil Place Requirements
Panel: Elementary Panel
Review Area: ERA123 Rural Milton, W of Reg Rd 25
REQUIREMENTS OF EXISTING COMMUNITY
Current Number Current Year 1 Year 2 Year 3 Year 4 Year 5 Year 6 Year 7 Year 8 Year 9 Year 10 Year 11 Year 12 Year 13 Year 14 Year 15
OTG of Temp 2012/ 2013/ 2014/ 2015/ 2016/ 2017/ 2018/ 2019/ 2020/ 2021/ 2022/ 2023/ 2024/ 2025/ 2026/ 2027/
Capacity Facilities 2013 2014 2015 2016 2017 2018 2019 2020 2021 2022 2023 2024 2025 2026 2027 2028
Brookville Public School 420 0 441 435 415 407 398 385 372 370 360 364 366 369 374 374 374 375
TOTAL: 420.0 0 441 435 415 407 398 385 372 370 360 364 366 369 374 374 374 375
AVAILABLE PUPIL PLACES: 45
REQUIREMENTS OF NEW DEVELOPMENT (CUMULATIVE)
Year 1 Year 2 Year 3 Year 4 Year 5 Year 6 Year 7 Year 8 Year 9 Year 10 Year 11 Year 12 Year 13 Year 14 Year 15
2013/ 2014/ 2015/ 2016/ 2017/ 2018/ 2019/ 2020/ 2021/ 2022/ 2023/ 2024/ 2025/ 2026/ 2027/
2014 2015 2016 2017 2018 2019 2020 2021 2022 2023 2024 2025 2026 2027 2028
3 6 8 11 14 26 39 51 63 74 100 126 151 175 200
CALCULATION OF GROWTH-RELATED PUPIL PLACE REQUIREMENTS
1 Requirements of New Development (Pupil Places) 200
2 Available Pupil Places in Existing Facilities 45
3 Net Growth-Related Pupil Place Requirements (1-2) 154
NOTES
15 Year Projection of Average Daily Enrolments
Existing Schools and Projects
15 Year Projection of Average Daily Enrolments
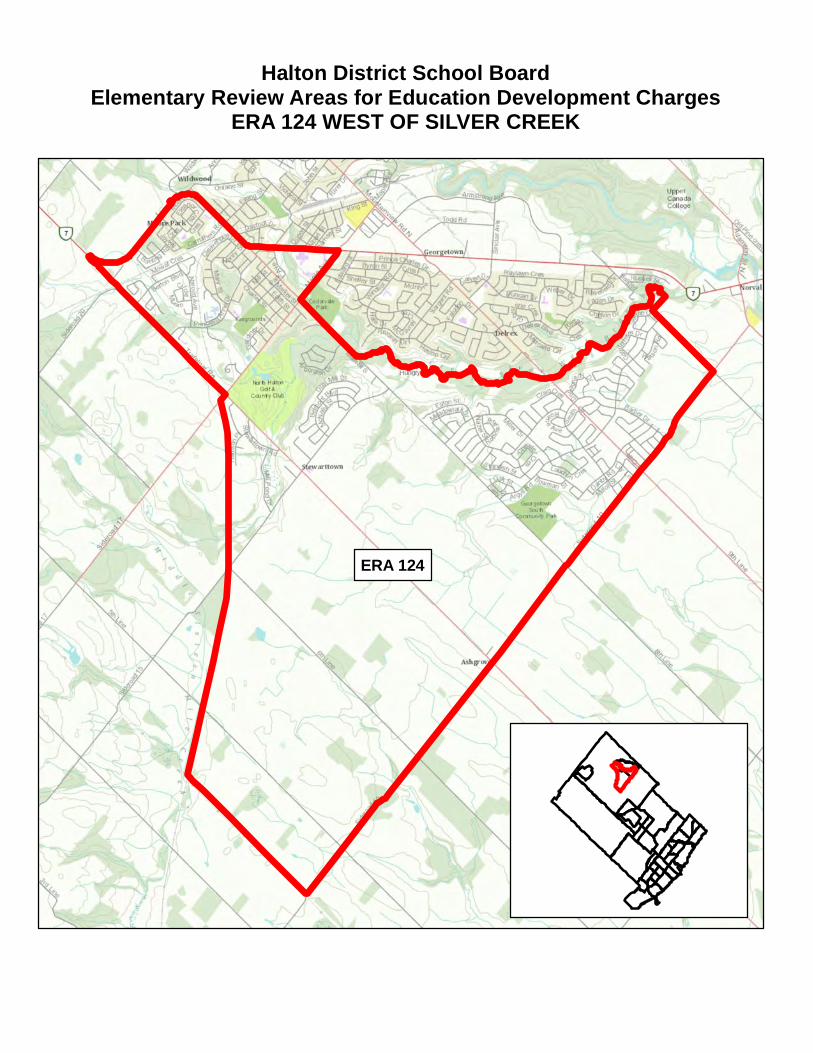
Halton District School BoardElementary Review Areas for Education Development Charges
ERA 124 WEST OF SILVER CREEK
ERA 124

Halton District School Board
Education Development Charges Submission 2013
Form F - Growth Related Pupil Place Requirements
Panel: Elementary Panel
Review Area: ERA124 W of Silver Creek (incl South Georgetown)
REQUIREMENTS OF EXISTING COMMUNITY
Current Number Current Year 1 Year 2 Year 3 Year 4 Year 5 Year 6 Year 7 Year 8 Year 9 Year 10 Year 11 Year 12 Year 13 Year 14 Year 15
OTG of Temp 2012/ 2013/ 2014/ 2015/ 2016/ 2017/ 2018/ 2019/ 2020/ 2021/ 2022/ 2023/ 2024/ 2025/ 2026/ 2027/
Capacity Facilities 2013 2014 2015 2016 2017 2018 2019 2020 2021 2022 2023 2024 2025 2026 2027 2028
Gardiner Public School 625 0 557 573 567 583 596 622 644 655 645 634 618 611 619 626 631 634
Joseph Gibbons Public School 213 0 133 129 119 116 109 111 113 105 103 105 106 107 108 108 108 108
Park Public School 283 2 239 224 205 195 180 168 165 161 159 161 164 165 166 166 166 167
Silver Creek Public School 645 2 619 605 577 537 511 486 460 455 431 420 413 409 414 418 421 422
Stewarttown Middle School 331 1 398 367 355 346 355 329 317 285 281 269 239 222 216 218 220 220
TOTAL: 2,097.0 5 1,946 1,897 1,822 1,776 1,750 1,716 1,700 1,661 1,618 1,589 1,540 1,514 1,522 1,537 1,547 1,552
AVAILABLE PUPIL PLACES: 545
REQUIREMENTS OF NEW DEVELOPMENT (CUMULATIVE)
Year 1 Year 2 Year 3 Year 4 Year 5 Year 6 Year 7 Year 8 Year 9 Year 10 Year 11 Year 12 Year 13 Year 14 Year 15
2013/ 2014/ 2015/ 2016/ 2017/ 2018/ 2019/ 2020/ 2021/ 2022/ 2023/ 2024/ 2025/ 2026/ 2027/
2014 2015 2016 2017 2018 2019 2020 2021 2022 2023 2024 2025 2026 2027 2028
67 133 197 261 324 473 619 763 905 1045 1265 1481 1694 1903 2109
CALCULATION OF GROWTH-RELATED PUPIL PLACE REQUIREMENTS
1 Requirements of New Development (Pupil Places) 2109
2 Available Pupil Places in Existing Facilities 545
3 Net Growth-Related Pupil Place Requirements (1-2) 1564
NOTES
38,781 38,916 38,968 38,937 38,803 38,438 38,225 37,910 37,230 36,692 36,197 35,942 35,771 35,571 35,400
745 1485 2218 2946 3668 4468 5260 6045 6822 7591 8580 9556 10519 11469 12405
39,526 40,401 41,186 41,883 42,471 42,906 43,485 43,955 44,052 44,283 44,777 45,498 46,290 47,040 47,805
15 Year Projection of Average Daily Enrolments
Existing Schools and Projects
15 Year Projection of Average Daily Enrolments

Halton District School BoardElementary Review Areas for Education Development Charges
ERA 125 EAST OF SILVER CREEK
ERA 125

Halton District School Board
Education Development Charges Submission 2013
Form F - Growth Related Pupil Place Requirements
Panel: Elementary Panel
Review Area: ERA125 E of Silver Creek
REQUIREMENTS OF EXISTING COMMUNITY
Current Number Current Year 1 Year 2 Year 3 Year 4 Year 5 Year 6 Year 7 Year 8 Year 9 Year 10 Year 11 Year 12 Year 13 Year 14 Year 15
OTG of Temp 2012/ 2013/ 2014/ 2015/ 2016/ 2017/ 2018/ 2019/ 2020/ 2021/ 2022/ 2023/ 2024/ 2025/ 2026/ 2027/
Capacity Facilities 2013 2014 2015 2016 2017 2018 2019 2020 2021 2022 2023 2024 2025 2026 2027 2028
Centennial Public School 492 0 446 467 463 451 444 442 440 423 423 423 423 423 423 423 423 423
George Kennedy Public School 584 0 518 492 482 463 440 438 439 434 433 432 427 421 414 408 402 397
Harrison Public School 343 0 252 249 250 258 265 269 257 255 255 253 250 246 242 239 236 234
TOTAL: 1,419.0 0 1,216 1,207 1,195 1,173 1,149 1,149 1,136 1,112 1,111 1,108 1,100 1,090 1,080 1,070 1,061 1,053
AVAILABLE PUPIL PLACES: 366
REQUIREMENTS OF NEW DEVELOPMENT (CUMULATIVE)
Year 1 Year 2 Year 3 Year 4 Year 5 Year 6 Year 7 Year 8 Year 9 Year 10 Year 11 Year 12 Year 13 Year 14 Year 15
2013/ 2014/ 2015/ 2016/ 2017/ 2018/ 2019/ 2020/ 2021/ 2022/ 2023/ 2024/ 2025/ 2026/ 2027/
2014 2015 2016 2017 2018 2019 2020 2021 2022 2023 2024 2025 2026 2027 2028
11 22 32 42 53 59 65 71 77 83 97 110 122 135 148
CALCULATION OF GROWTH-RELATED PUPIL PLACE REQUIREMENTS
1 Requirements of New Development (Pupil Places) 148
2 Available Pupil Places in Existing Facilities 366
3 Net Growth-Related Pupil Place Requirements (1-2) 0
NOTES
Existing Schools and Projects
15 Year Projection of Average Daily Enrolments
15 Year Projection of Average Daily Enrolments
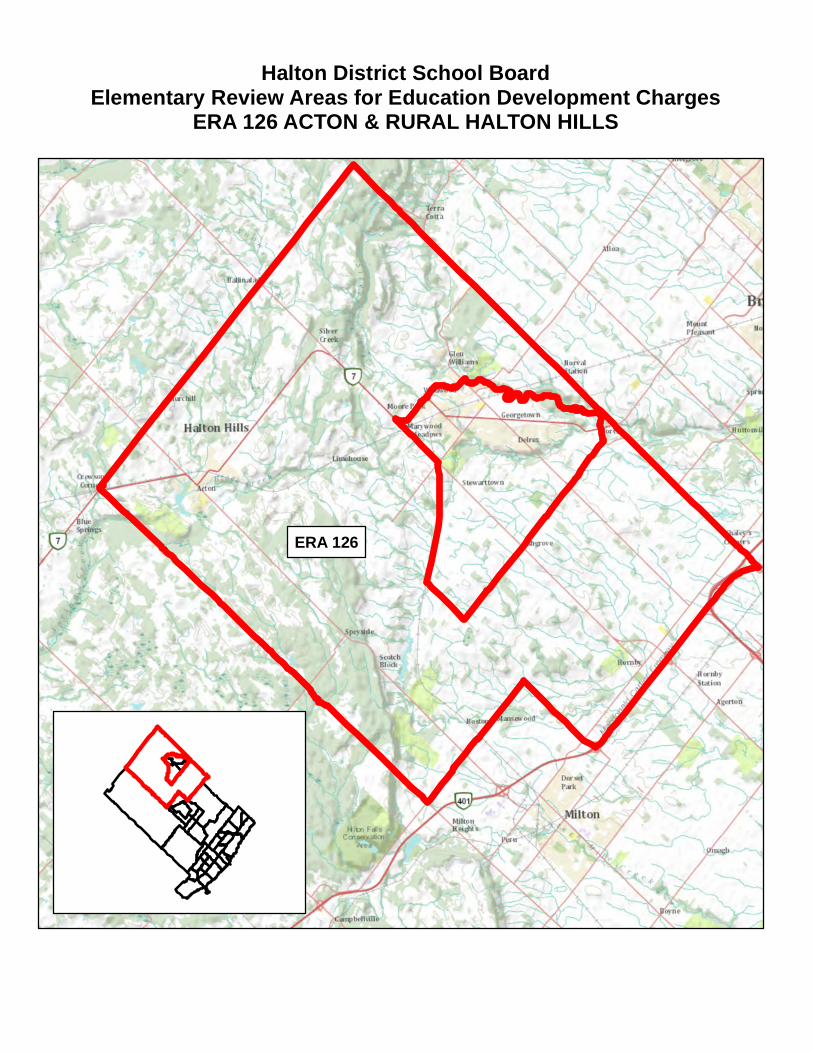
Halton District School BoardElementary Review Areas for Education Development Charges
ERA 126 ACTON & RURAL HALTON HILLS
ERA 126

Halton District School Board
Education Development Charges Submission 2013
Form F - Growth Related Pupil Place Requirements
Panel: Elementary Panel
Review Area: ERA126 Acton & Rural Halton Hills
REQUIREMENTS OF EXISTING COMMUNITY
Current Number Current Year 1 Year 2 Year 3 Year 4 Year 5 Year 6 Year 7 Year 8 Year 9 Year 10 Year 11 Year 12 Year 13 Year 14 Year 15
OTG of Temp 2012/ 2013/ 2014/ 2015/ 2016/ 2017/ 2018/ 2019/ 2020/ 2021/ 2022/ 2023/ 2024/ 2025/ 2026/ 2027/
Capacity Facilities 2013 2014 2015 2016 2017 2018 2019 2020 2021 2022 2023 2024 2025 2026 2027 2028
Glen Williams Public School 239 2 241 248 258 262 257 251 259 250 240 230 229 226 224 222 220 218
Limehouse Public School 187 0 152 154 152 147 137 138 131 123 117 113 112 111 110 109 107 107
McKenzie-Smith Bennett School 734 2 673 667 681 678 670 656 656 673 670 642 600 571 547 543 539 536
Pineview Public School 307 0 261 241 227 213 184 172 161 156 150 145 143 142 141 139 138 137
Robert Little Public School 400 0 377 383 383 383 376 359 345 316 302 290 288 285 282 279 277 274
TOTAL: 1,867.0 4 1,704 1,693 1,701 1,682 1,624 1,576 1,553 1,519 1,479 1,420 1,372 1,336 1,304 1,292 1,281 1,272
AVAILABLE PUPIL PLACES: 595
REQUIREMENTS OF NEW DEVELOPMENT (CUMULATIVE)
Year 1 Year 2 Year 3 Year 4 Year 5 Year 6 Year 7 Year 8 Year 9 Year 10 Year 11 Year 12 Year 13 Year 14 Year 15
2013/ 2014/ 2015/ 2016/ 2017/ 2018/ 2019/ 2020/ 2021/ 2022/ 2023/ 2024/ 2025/ 2026/ 2027/
2014 2015 2016 2017 2018 2019 2020 2021 2022 2023 2024 2025 2026 2027 2028
8 15 23 30 37 61 86 109 133 156 200 244 287 329 371
CALCULATION OF GROWTH-RELATED PUPIL PLACE REQUIREMENTS
1 Requirements of New Development (Pupil Places) 371
2 Available Pupil Places in Existing Facilities 595
3 Net Growth-Related Pupil Place Requirements (1-2) 0
NOTES
15 Year Projection of Average Daily Enrolments
Existing Schools and Projects
15 Year Projection of Average Daily Enrolments
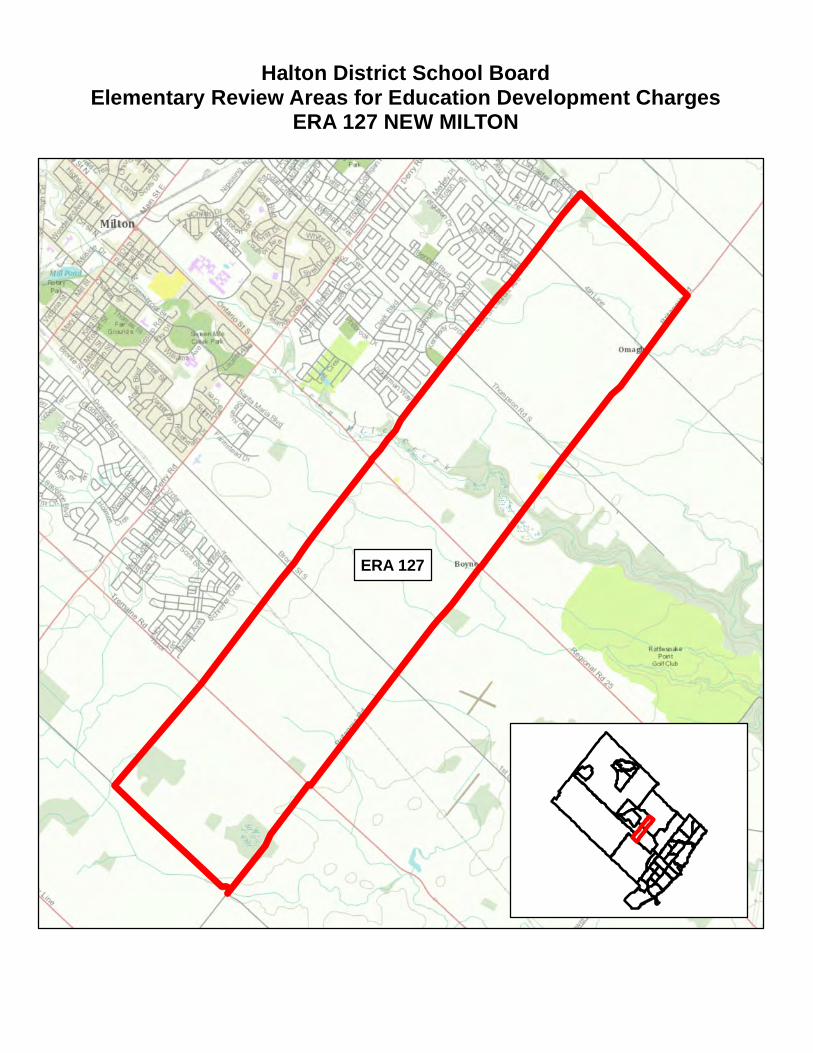
Halton District School BoardElementary Review Areas for Education Development Charges
ERA 127 NEW MILTON
ERA 127
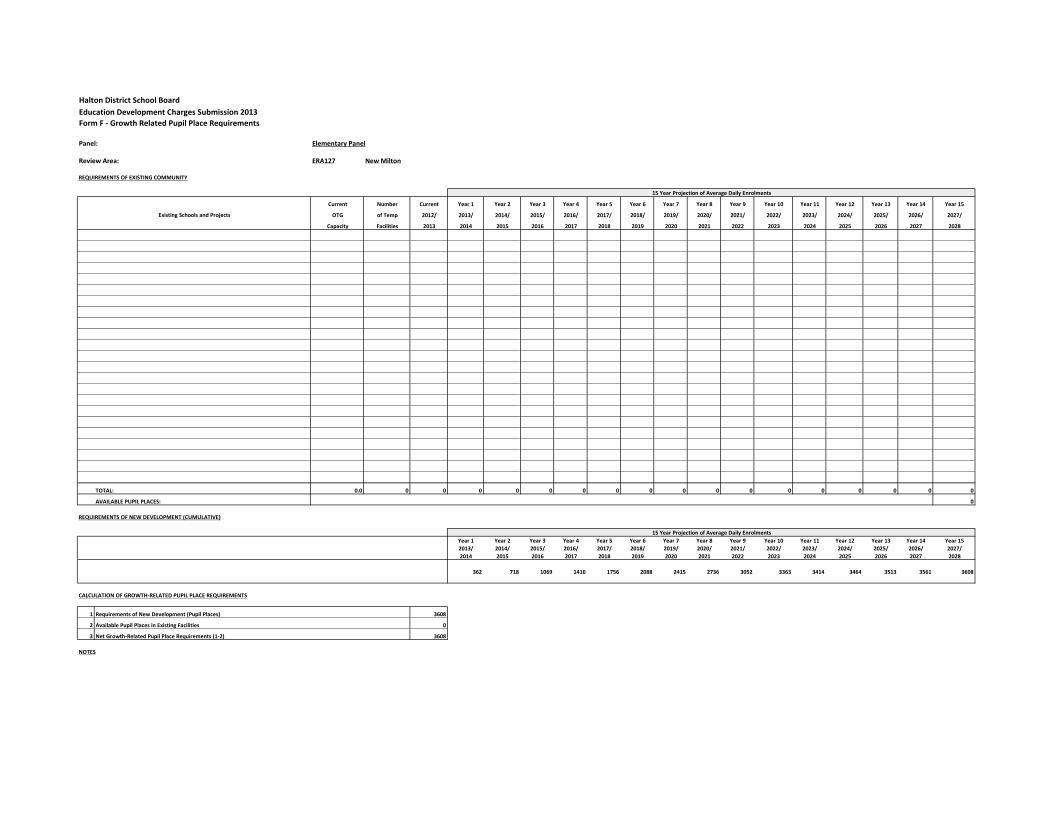
Halton District School Board
Education Development Charges Submission 2013
Form F - Growth Related Pupil Place Requirements
Panel: Elementary Panel
Review Area: ERA127 New Milton
REQUIREMENTS OF EXISTING COMMUNITY
Current Number Current Year 1 Year 2 Year 3 Year 4 Year 5 Year 6 Year 7 Year 8 Year 9 Year 10 Year 11 Year 12 Year 13 Year 14 Year 15
OTG of Temp 2012/ 2013/ 2014/ 2015/ 2016/ 2017/ 2018/ 2019/ 2020/ 2021/ 2022/ 2023/ 2024/ 2025/ 2026/ 2027/
Capacity Facilities 2013 2014 2015 2016 2017 2018 2019 2020 2021 2022 2023 2024 2025 2026 2027 2028
TOTAL: 0.0 0 0 0 0 0 0 0 0 0 0 0 0 0 0 0 0 0
AVAILABLE PUPIL PLACES: 0
REQUIREMENTS OF NEW DEVELOPMENT (CUMULATIVE)
Year 1 Year 2 Year 3 Year 4 Year 5 Year 6 Year 7 Year 8 Year 9 Year 10 Year 11 Year 12 Year 13 Year 14 Year 15
2013/ 2014/ 2015/ 2016/ 2017/ 2018/ 2019/ 2020/ 2021/ 2022/ 2023/ 2024/ 2025/ 2026/ 2027/
2014 2015 2016 2017 2018 2019 2020 2021 2022 2023 2024 2025 2026 2027 2028
362 718 1069 1416 1756 2088 2415 2736 3052 3363 3414 3464 3513 3561 3608
CALCULATION OF GROWTH-RELATED PUPIL PLACE REQUIREMENTS
1 Requirements of New Development (Pupil Places) 3608
2 Available Pupil Places in Existing Facilities 0
3 Net Growth-Related Pupil Place Requirements (1-2) 3608
NOTES
15 Year Projection of Average Daily Enrolments
Existing Schools and Projects
15 Year Projection of Average Daily Enrolments
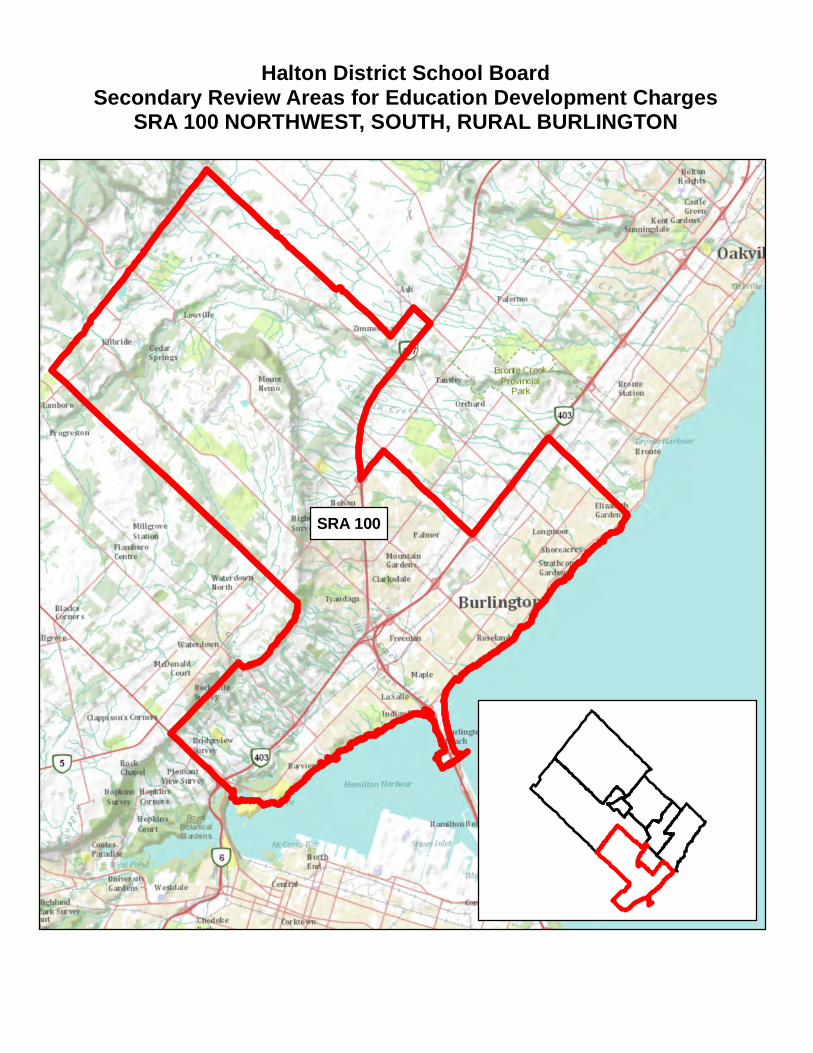
Halton District School BoardSecondary Review Areas for Education Development Charges
SRA 100 NORTHWEST, SOUTH, RURAL BURLINGTON
SRA 100
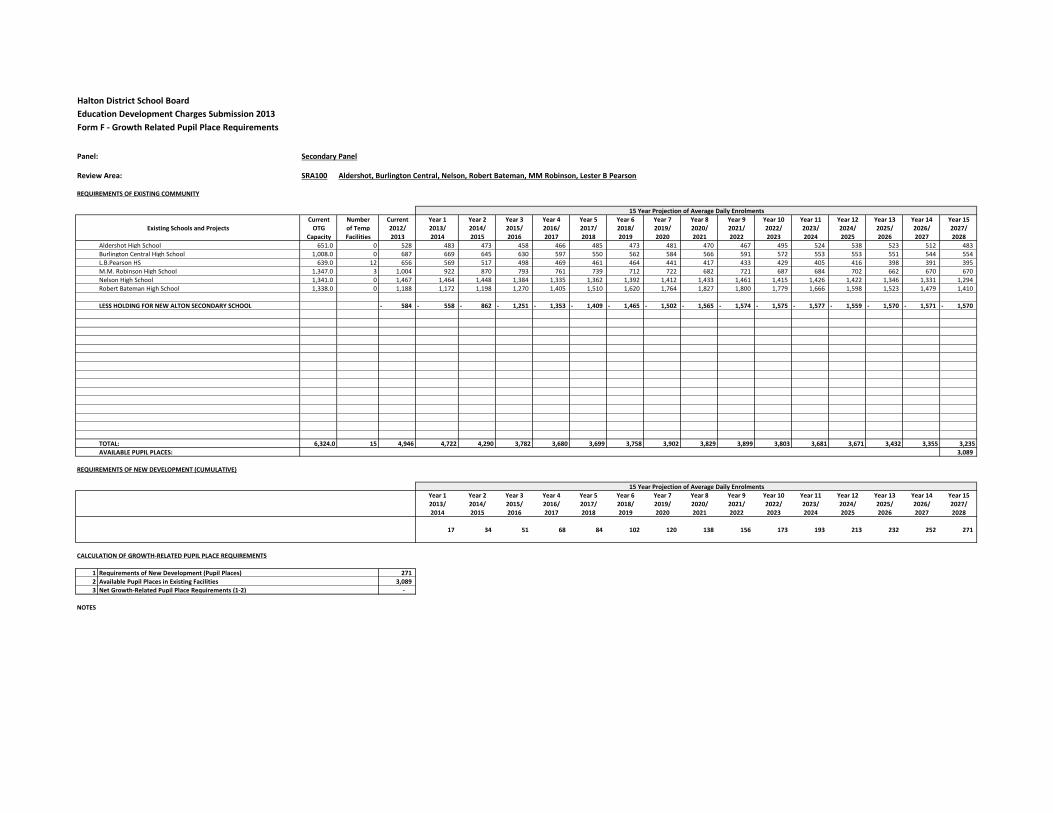
Halton District School Board
Education Development Charges Submission 2013
Form F - Growth Related Pupil Place Requirements
Panel: Secondary Panel
Review Area: SRA100 Aldershot, Burlington Central, Nelson, Robert Bateman, MM Robinson, Lester B Pearson
REQUIREMENTS OF EXISTING COMMUNITY
Current Number Current Year 1 Year 2 Year 3 Year 4 Year 5 Year 6 Year 7 Year 8 Year 9 Year 10 Year 11 Year 12 Year 13 Year 14 Year 15
OTG of Temp 2012/ 2013/ 2014/ 2015/ 2016/ 2017/ 2018/ 2019/ 2020/ 2021/ 2022/ 2023/ 2024/ 2025/ 2026/ 2027/
Capacity Facilities 2013 2014 2015 2016 2017 2018 2019 2020 2021 2022 2023 2024 2025 2026 2027 2028
Aldershot High School 651.0 0 528 483 473 458 466 485 473 481 470 467 495 524 538 523 512 483
Burlington Central High School 1,008.0 0 687 669 645 630 597 550 562 584 566 591 572 553 553 551 544 554
L.B.Pearson HS 639.0 12 656 569 517 498 469 461 464 441 417 433 429 405 416 398 391 395
M.M. Robinson High School 1,347.0 3 1,004 922 870 793 761 739 712 722 682 721 687 684 702 662 670 670
Nelson High School 1,341.0 0 1,467 1,464 1,448 1,384 1,335 1,362 1,392 1,412 1,433 1,461 1,415 1,426 1,422 1,346 1,331 1,294
Robert Bateman High School 1,338.0 0 1,188 1,172 1,198 1,270 1,405 1,510 1,620 1,764 1,827 1,800 1,779 1,666 1,598 1,523 1,479 1,410
LESS HOLDING FOR NEW ALTON SECONDARY SCHOOL 584- 558- 862- 1,251- 1,353- 1,409- 1,465- 1,502- 1,565- 1,574- 1,575- 1,577- 1,559- 1,570- 1,571- 1,570-
TOTAL: 6,324.0 15 4,946 4,722 4,290 3,782 3,680 3,699 3,758 3,902 3,829 3,899 3,803 3,681 3,671 3,432 3,355 3,235
AVAILABLE PUPIL PLACES: 3,089
REQUIREMENTS OF NEW DEVELOPMENT (CUMULATIVE)
Year 1 Year 2 Year 3 Year 4 Year 5 Year 6 Year 7 Year 8 Year 9 Year 10 Year 11 Year 12 Year 13 Year 14 Year 15
2013/ 2014/ 2015/ 2016/ 2017/ 2018/ 2019/ 2020/ 2021/ 2022/ 2023/ 2024/ 2025/ 2026/ 2027/
2014 2015 2016 2017 2018 2019 2020 2021 2022 2023 2024 2025 2026 2027 2028
17 34 51 68 84 102 120 138 156 173 193 213 232 252 271
CALCULATION OF GROWTH-RELATED PUPIL PLACE REQUIREMENTS
1 Requirements of New Development (Pupil Places) 271
2 Available Pupil Places in Existing Facilities 3,089
3 Net Growth-Related Pupil Place Requirements (1-2) -
NOTES
15 Year Projection of Average Daily Enrolments
Existing Schools and Projects
15 Year Projection of Average Daily Enrolments
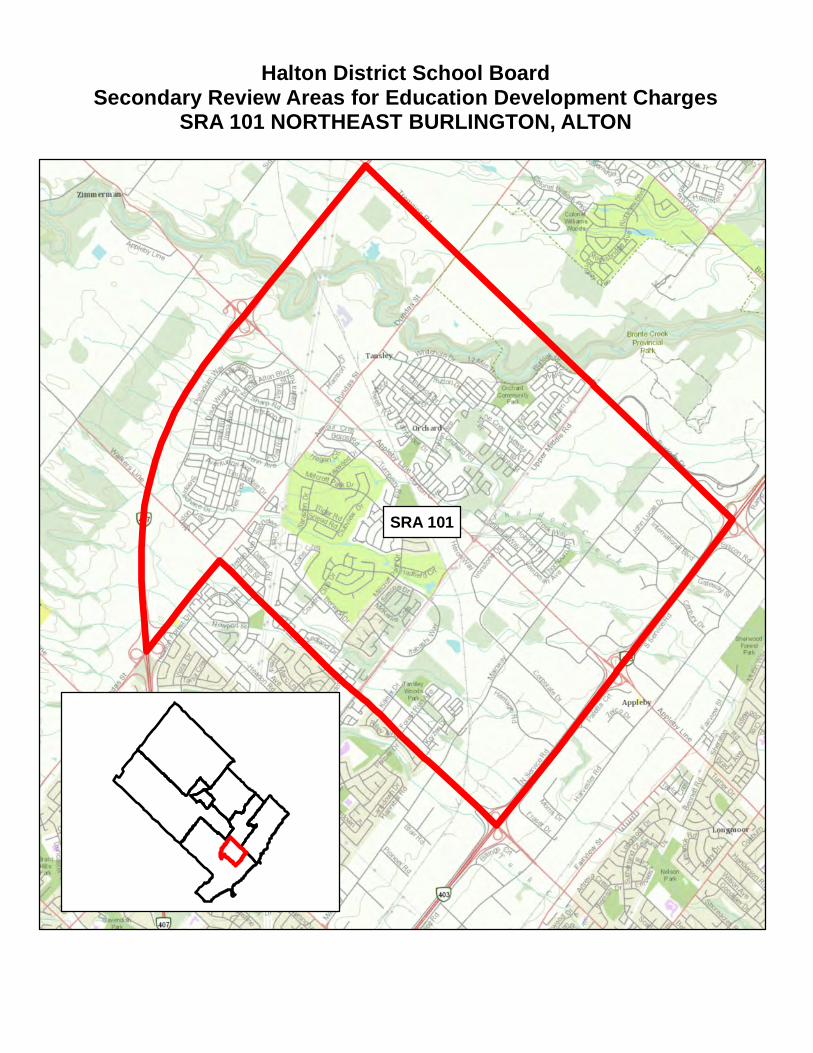
Halton District School BoardSecondary Review Areas for Education Development Charges
SRA 101 NORTHEAST BURLINGTON, ALTON
SRA 101

Halton District School Board
Education Development Charges Submission 2013
Form F - Growth Related Pupil Place Requirements
Panel: Secondary Panel
Review Area: SRA101 Proposed NE Burlington SS
REQUIREMENTS OF EXISTING COMMUNITY
Current Number Current Year 1 Year 2 Year 3 Year 4 Year 5 Year 6 Year 7 Year 8 Year 9 Year 10 Year 11 Year 12 Year 13 Year 14 Year 15
OTG of Temp 2012/ 2013/ 2014/ 2015/ 2016/ 2017/ 2018/ 2019/ 2020/ 2021/ 2022/ 2023/ 2024/ 2025/ 2026/ 2027/
Capacity Facilities 2013 2014 2015 2016 2017 2018 2019 2020 2021 2022 2023 2024 2025 2026 2027 2028
Alton HS 1,200.0 0 584 558 862 1,251 1,353 1,409 1,465 1,502 1,565 1,574 1,575 1,577 1,559 1,570 1,571 1,570
TOTAL: 1,200.0 0 584 558 862 1,251 1,353 1,409 1,465 1,502 1,565 1,574 1,575 1,577 1,559 1,570 1,571 1,570
AVAILABLE PUPIL PLACES: -
REQUIREMENTS OF NEW DEVELOPMENT (CUMULATIVE)
Year 1 Year 2 Year 3 Year 4 Year 5 Year 6 Year 7 Year 8 Year 9 Year 10 Year 11 Year 12 Year 13 Year 14 Year 15
2013/ 2014/ 2015/ 2016/ 2017/ 2018/ 2019/ 2020/ 2021/ 2022/ 2023/ 2024/ 2025/ 2026/ 2027/
2014 2015 2016 2017 2018 2019 2020 2021 2022 2023 2024 2025 2026 2027 2028
4 9 13 18 22 27 33 38 43 48 54 61 67 74 80
CALCULATION OF GROWTH-RELATED PUPIL PLACE REQUIREMENTS
1 Requirements of New Development (Pupil Places) 80
2 Available Pupil Places in Existing Facilities -
3 Net Growth-Related Pupil Place Requirements (1-2) 80
NOTES
15 Year Projection of Average Daily Enrolments
15 Year Projection of Average Daily Enrolments
Existing Schools and Projects
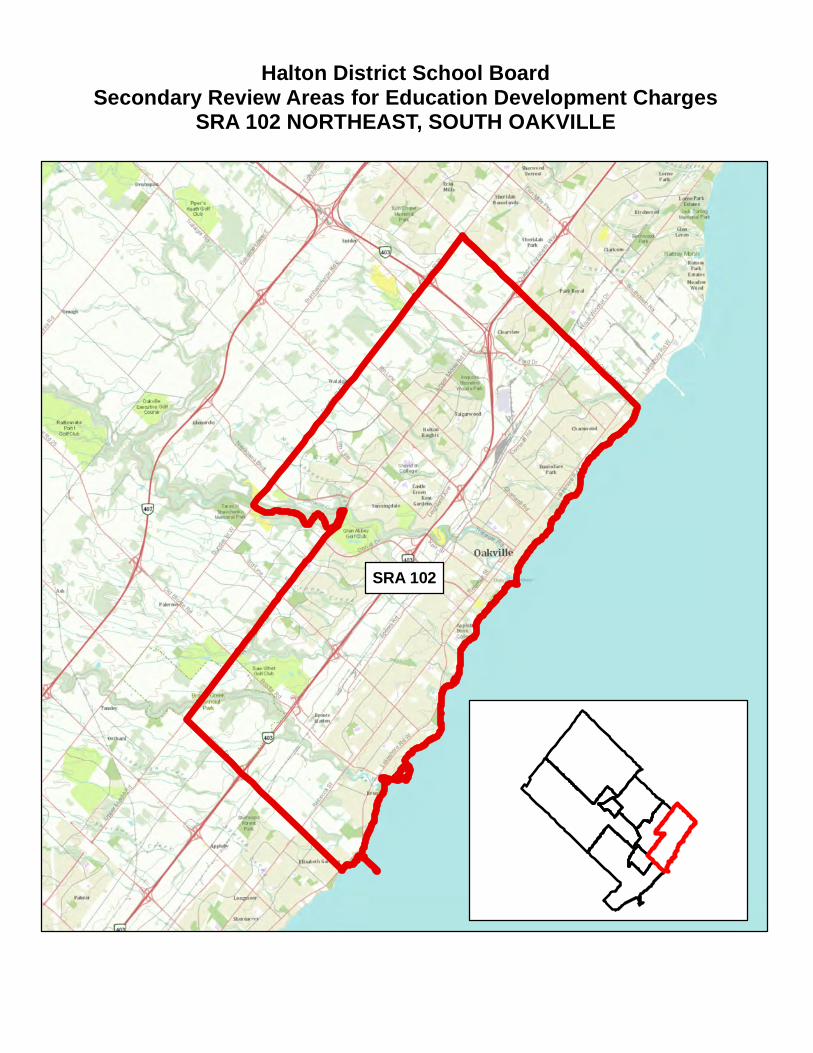
Halton District School BoardSecondary Review Areas for Education Development Charges
SRA 102 NORTHEAST, SOUTH OAKVILLE
SRA 102
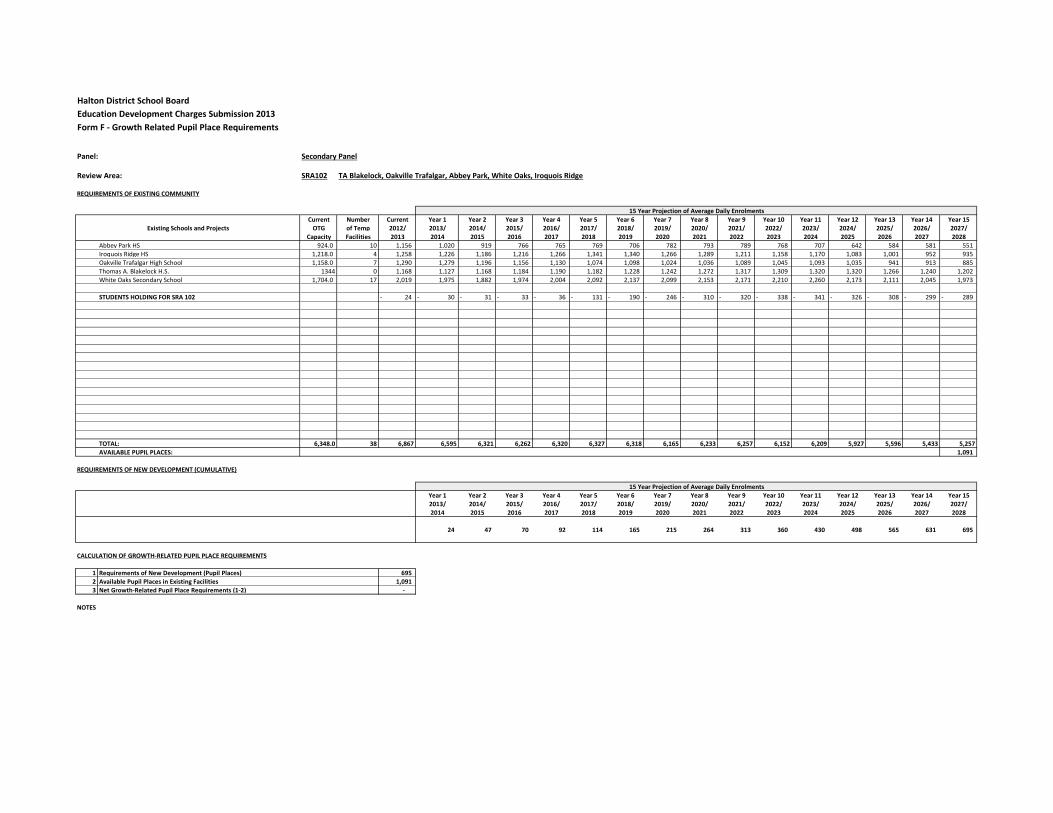
Halton District School Board
Education Development Charges Submission 2013
Form F - Growth Related Pupil Place Requirements
Panel: Secondary Panel
Review Area: SRA102 TA Blakelock, Oakville Trafalgar, Abbey Park, White Oaks, Iroquois Ridge
REQUIREMENTS OF EXISTING COMMUNITY
Current Number Current Year 1 Year 2 Year 3 Year 4 Year 5 Year 6 Year 7 Year 8 Year 9 Year 10 Year 11 Year 12 Year 13 Year 14 Year 15
OTG of Temp 2012/ 2013/ 2014/ 2015/ 2016/ 2017/ 2018/ 2019/ 2020/ 2021/ 2022/ 2023/ 2024/ 2025/ 2026/ 2027/
Capacity Facilities 2013 2014 2015 2016 2017 2018 2019 2020 2021 2022 2023 2024 2025 2026 2027 2028
Abbey Park HS 924.0 10 1,156 1,020 919 766 765 769 706 782 793 789 768 707 642 584 581 551
Iroquois Ridge HS 1,218.0 4 1,258 1,226 1,186 1,216 1,266 1,341 1,340 1,266 1,289 1,211 1,158 1,170 1,083 1,001 952 935
Oakville Trafalgar High School 1,158.0 7 1,290 1,279 1,196 1,156 1,130 1,074 1,098 1,024 1,036 1,089 1,045 1,093 1,035 941 913 885
Thomas A. Blakelock H.S. 1344 0 1,168 1,127 1,168 1,184 1,190 1,182 1,228 1,242 1,272 1,317 1,309 1,320 1,320 1,266 1,240 1,202
White Oaks Secondary School 1,704.0 17 2,019 1,975 1,882 1,974 2,004 2,092 2,137 2,099 2,153 2,171 2,210 2,260 2,173 2,111 2,045 1,973
STUDENTS HOLDING FOR SRA 102 24- 30- 31- 33- 36- 131- 190- 246- 310- 320- 338- 341- 326- 308- 299- 289-
TOTAL: 6,348.0 38 6,867 6,595 6,321 6,262 6,320 6,327 6,318 6,165 6,233 6,257 6,152 6,209 5,927 5,596 5,433 5,257
AVAILABLE PUPIL PLACES: 1,091
REQUIREMENTS OF NEW DEVELOPMENT (CUMULATIVE)
Year 1 Year 2 Year 3 Year 4 Year 5 Year 6 Year 7 Year 8 Year 9 Year 10 Year 11 Year 12 Year 13 Year 14 Year 15
2013/ 2014/ 2015/ 2016/ 2017/ 2018/ 2019/ 2020/ 2021/ 2022/ 2023/ 2024/ 2025/ 2026/ 2027/
2014 2015 2016 2017 2018 2019 2020 2021 2022 2023 2024 2025 2026 2027 2028
24 47 70 92 114 165 215 264 313 360 430 498 565 631 695
CALCULATION OF GROWTH-RELATED PUPIL PLACE REQUIREMENTS
1 Requirements of New Development (Pupil Places) 695
2 Available Pupil Places in Existing Facilities 1,091
3 Net Growth-Related Pupil Place Requirements (1-2) -
NOTES
15 Year Projection of Average Daily Enrolments
Existing Schools and Projects
15 Year Projection of Average Daily Enrolments
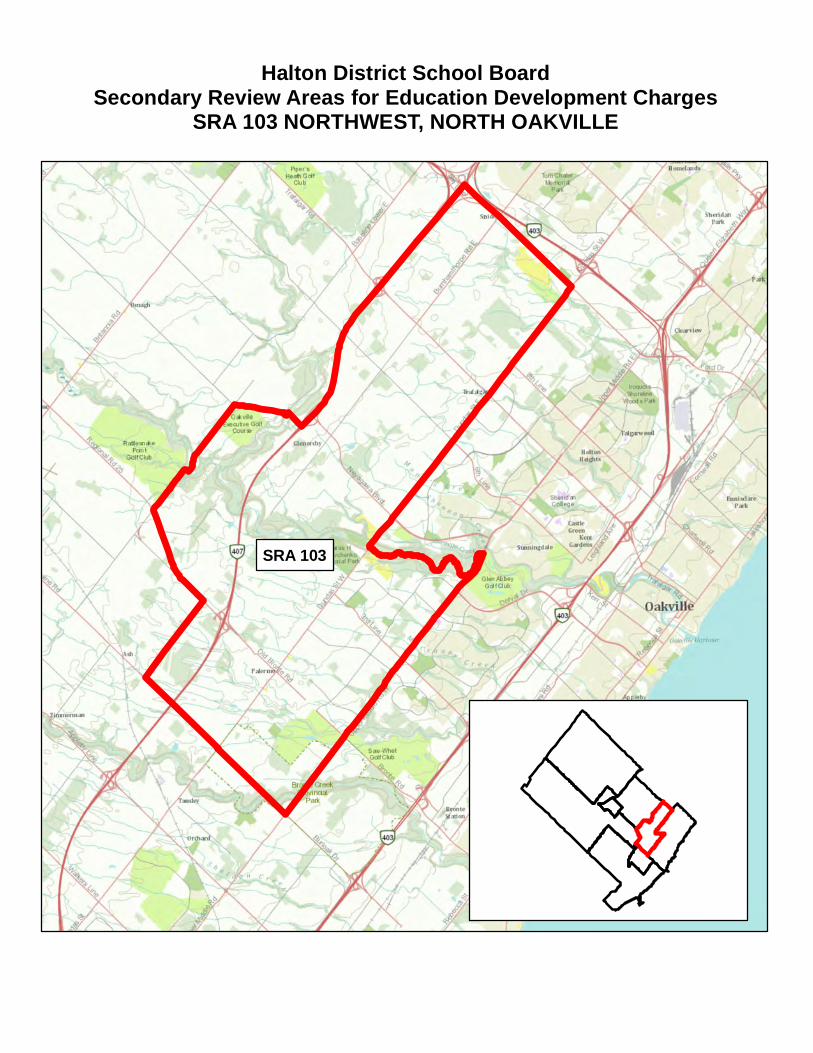
Halton District School BoardSecondary Review Areas for Education Development Charges
SRA 103 NORTHWEST, NORTH OAKVILLE
SRA 103

Halton District School Board
Education Development Charges Submission 2013
Form F - Growth Related Pupil Place Requirements
Panel: Secondary Panel
Review Area: SRA103 Garth Webb & N. Oakville SS
REQUIREMENTS OF EXISTING COMMUNITY
Current Number Current Year 1 Year 2 Year 3 Year 4 Year 5 Year 6 Year 7 Year 8 Year 9 Year 10 Year 11 Year 12 Year 13 Year 14 Year 15
OTG of Temp 2012/ 2013/ 2014/ 2015/ 2016/ 2017/ 2018/ 2019/ 2020/ 2021/ 2022/ 2023/ 2024/ 2025/ 2026/ 2027/
Capacity Facilities 2013 2014 2015 2016 2017 2018 2019 2020 2021 2022 2023 2024 2025 2026 2027 2028
GARTH WEBB 1,182.0 0 393 657 936 1,088 1,139 1,177 1,205 1,182 1,137 1,068 1,033 1,000 978 930 897 865
STUDENTS HOLDING IN SRA 102 24 30 31 33 36 131 190 246 310 320 338 341 326 308 299 289
TOTAL: 1,182.0 0 417 687 967 1,121 1,175 1,309 1,395 1,428 1,448 1,388 1,371 1,342 1,304 1,238 1,196 1,155
AVAILABLE PUPIL PLACES: 27
REQUIREMENTS OF NEW DEVELOPMENT (CUMULATIVE)
Year 1 Year 2 Year 3 Year 4 Year 5 Year 6 Year 7 Year 8 Year 9 Year 10 Year 11 Year 12 Year 13 Year 14 Year 15
2013/ 2014/ 2015/ 2016/ 2017/ 2018/ 2019/ 2020/ 2021/ 2022/ 2023/ 2024/ 2025/ 2026/ 2027/
2014 2015 2016 2017 2018 2019 2020 2021 2022 2023 2024 2025 2026 2027 2028
81 160 239 315 390 485 578 668 758 845 931 1,015 1,097 1,178 1,256
CALCULATION OF GROWTH-RELATED PUPIL PLACE REQUIREMENTS
1 Requirements of New Development (Pupil Places) 1,256
2 Available Pupil Places in Existing Facilities 27
3 Net Growth-Related Pupil Place Requirements (1-2) 1,229
NOTES
15 Year Projection of Average Daily Enrolments
Existing Schools and Projects
15 Year Projection of Average Daily Enrolments

Halton District School BoardSecondary Review Areas for Education Development Charges
SRA 104 OLD MILTON
SRA 104

Halton District School Board
Education Development Charges Submission 2013
Form F - Growth Related Pupil Place Requirements
Panel: Secondary Panel
Review Area: SRA104 Milton District
REQUIREMENTS OF EXISTING COMMUNITY
Current Number Current Year 1 Year 2 Year 3 Year 4 Year 5 Year 6 Year 7 Year 8 Year 9 Year 10 Year 11 Year 12 Year 13 Year 14 Year 15
OTG of Temp 2012/ 2013/ 2014/ 2015/ 2016/ 2017/ 2018/ 2019/ 2020/ 2021/ 2022/ 2023/ 2024/ 2025/ 2026/ 2027/
Capacity Facilities 2013 2014 2015 2016 2017 2018 2019 2020 2021 2022 2023 2024 2025 2026 2027 2028
Milton District High School 966.0 5 1,076 977 910 911 1,040 1,068 1,171 1,167 1,199 1,338 1,416 1,539 1,609 1,604 1,584 1,590
TOTAL: 966.0 5 1,076 977 910 911 1,040 1,068 1,171 1,167 1,199 1,338 1,416 1,539 1,609 1,604 1,584 1,590
AVAILABLE PUPIL PLACES: -
REQUIREMENTS OF NEW DEVELOPMENT (CUMULATIVE)
Year 1 Year 2 Year 3 Year 4 Year 5 Year 6 Year 7 Year 8 Year 9 Year 10 Year 11 Year 12 Year 13 Year 14 Year 15
2013/ 2014/ 2015/ 2016/ 2017/ 2018/ 2019/ 2020/ 2021/ 2022/ 2023/ 2024/ 2025/ 2026/ 2027/
2014 2015 2016 2017 2018 2019 2020 2021 2022 2023 2024 2025 2026 2027 2028
10 20 30 40 50 69 89 107 126 144 161 178 194 210 214
CALCULATION OF GROWTH-RELATED PUPIL PLACE REQUIREMENTS
1 Requirements of New Development (Pupil Places) 214
2 Available Pupil Places in Existing Facilities -
3 Net Growth-Related Pupil Place Requirements (1-2) 214
NOTES
15 Year Projection of Average Daily Enrolments
Existing Schools and Projects
15 Year Projection of Average Daily Enrolments
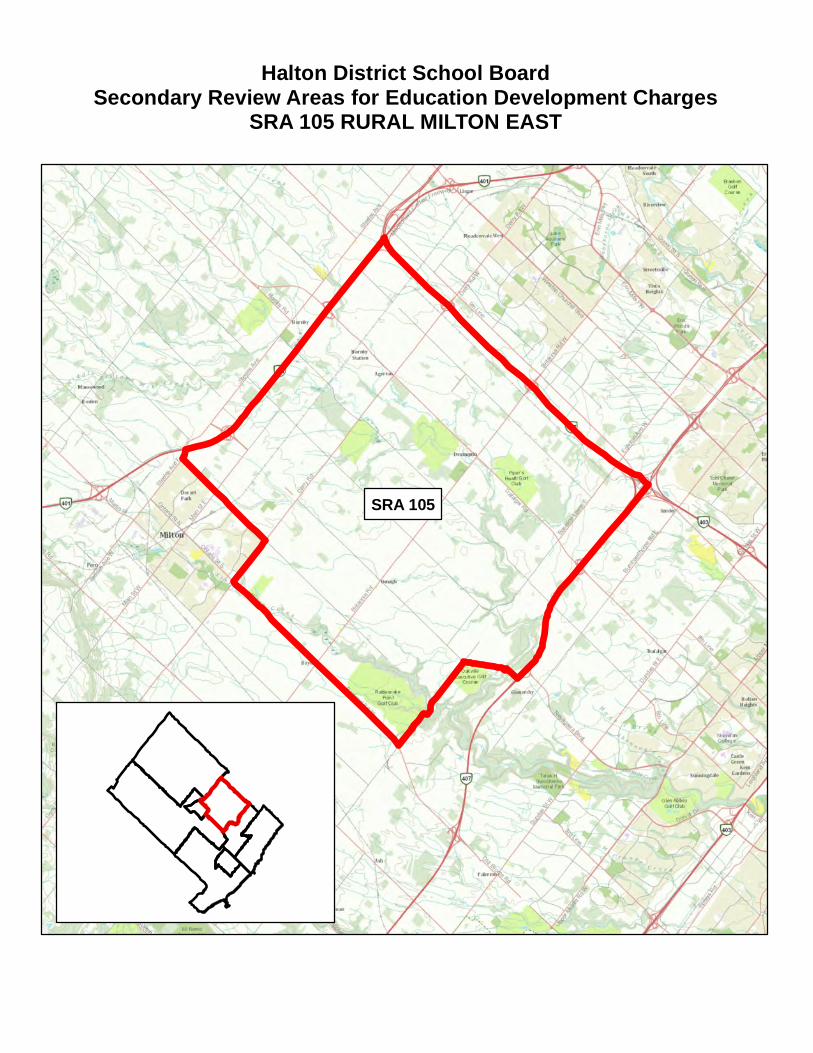
Halton District School BoardSecondary Review Areas for Education Development Charges
SRA 105 RURAL MILTON EAST
SRA 105

Halton District School Board
Education Development Charges Submission 2013
Form F - Growth Related Pupil Place Requirements
Panel: Secondary Panel
Review Area: SRA105 Proposed Milton Expansion Lands SS
REQUIREMENTS OF EXISTING COMMUNITY
Current Number Current Year 1 Year 2 Year 3 Year 4 Year 5 Year 6 Year 7 Year 8 Year 9 Year 10 Year 11 Year 12 Year 13 Year 14 Year 15
OTG of Temp 2012/ 2013/ 2014/ 2015/ 2016/ 2017/ 2018/ 2019/ 2020/ 2021/ 2022/ 2023/ 2024/ 2025/ 2026/ 2027/
Capacity Facilities 2013 2014 2015 2016 2017 2018 2019 2020 2021 2022 2023 2024 2025 2026 2027 2028
CRAIG KIELBURGER SS 1,203.0 4 1,254 1,323 1,431 1,495 1,528 1,619 1,715 1,865 1,956 2,017 2,040 2,016 1,975 1,914 1,847 1,800
TOTAL: 1,203.0 4 1,254 1,323 1,431 1,495 1,528 1,619 1,715 1,865 1,956 2,017 2,040 2,016 1,975 1,914 1,847 1,800
AVAILABLE PUPIL PLACES: -
REQUIREMENTS OF NEW DEVELOPMENT (CUMULATIVE)
Year 1 Year 2 Year 3 Year 4 Year 5 Year 6 Year 7 Year 8 Year 9 Year 10 Year 11 Year 12 Year 13 Year 14 Year 15
2013/ 2014/ 2015/ 2016/ 2017/ 2018/ 2019/ 2020/ 2021/ 2022/ 2023/ 2024/ 2025/ 2026/ 2027/
2014 2015 2016 2017 2018 2019 2020 2021 2022 2023 2024 2025 2026 2027 2028
70 139 206 273 338 501 661 818 973 1,125 1,276 1,425 1,570 1,713 1,739
CALCULATION OF GROWTH-RELATED PUPIL PLACE REQUIREMENTS
1 Requirements of New Development (Pupil Places) 1,739
2 Available Pupil Places in Existing Facilities -
3 Net Growth-Related Pupil Place Requirements (1-2) 1,739
NOTES
15 Year Projection of Average Daily Enrolments
15 Year Projection of Average Daily Enrolments
Existing Schools and Projects

Halton District School BoardSecondary Review Areas for Education Development Charges
SRA 106 RURAL MILTON WEST
SRA 106
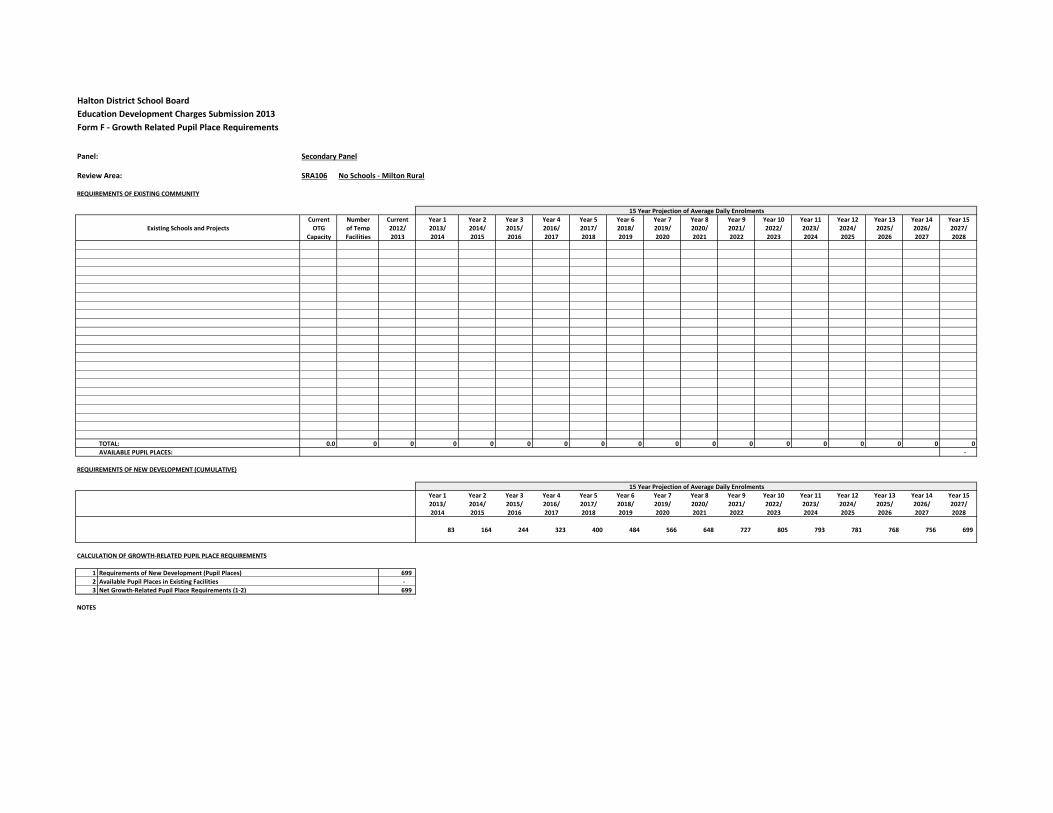
Halton District School Board
Education Development Charges Submission 2013
Form F - Growth Related Pupil Place Requirements
Panel: Secondary Panel
Review Area: SRA106 No Schools - Milton Rural
REQUIREMENTS OF EXISTING COMMUNITY
Current Number Current Year 1 Year 2 Year 3 Year 4 Year 5 Year 6 Year 7 Year 8 Year 9 Year 10 Year 11 Year 12 Year 13 Year 14 Year 15
OTG of Temp 2012/ 2013/ 2014/ 2015/ 2016/ 2017/ 2018/ 2019/ 2020/ 2021/ 2022/ 2023/ 2024/ 2025/ 2026/ 2027/
Capacity Facilities 2013 2014 2015 2016 2017 2018 2019 2020 2021 2022 2023 2024 2025 2026 2027 2028
TOTAL: 0.0 0 0 0 0 0 0 0 0 0 0 0 0 0 0 0 0 0
AVAILABLE PUPIL PLACES: -
REQUIREMENTS OF NEW DEVELOPMENT (CUMULATIVE)
Year 1 Year 2 Year 3 Year 4 Year 5 Year 6 Year 7 Year 8 Year 9 Year 10 Year 11 Year 12 Year 13 Year 14 Year 15
2013/ 2014/ 2015/ 2016/ 2017/ 2018/ 2019/ 2020/ 2021/ 2022/ 2023/ 2024/ 2025/ 2026/ 2027/
2014 2015 2016 2017 2018 2019 2020 2021 2022 2023 2024 2025 2026 2027 2028
83 164 244 323 400 484 566 648 727 805 793 781 768 756 699
CALCULATION OF GROWTH-RELATED PUPIL PLACE REQUIREMENTS
1 Requirements of New Development (Pupil Places) 699
2 Available Pupil Places in Existing Facilities -
3 Net Growth-Related Pupil Place Requirements (1-2) 699
NOTES
15 Year Projection of Average Daily Enrolments
Existing Schools and Projects
15 Year Projection of Average Daily Enrolments
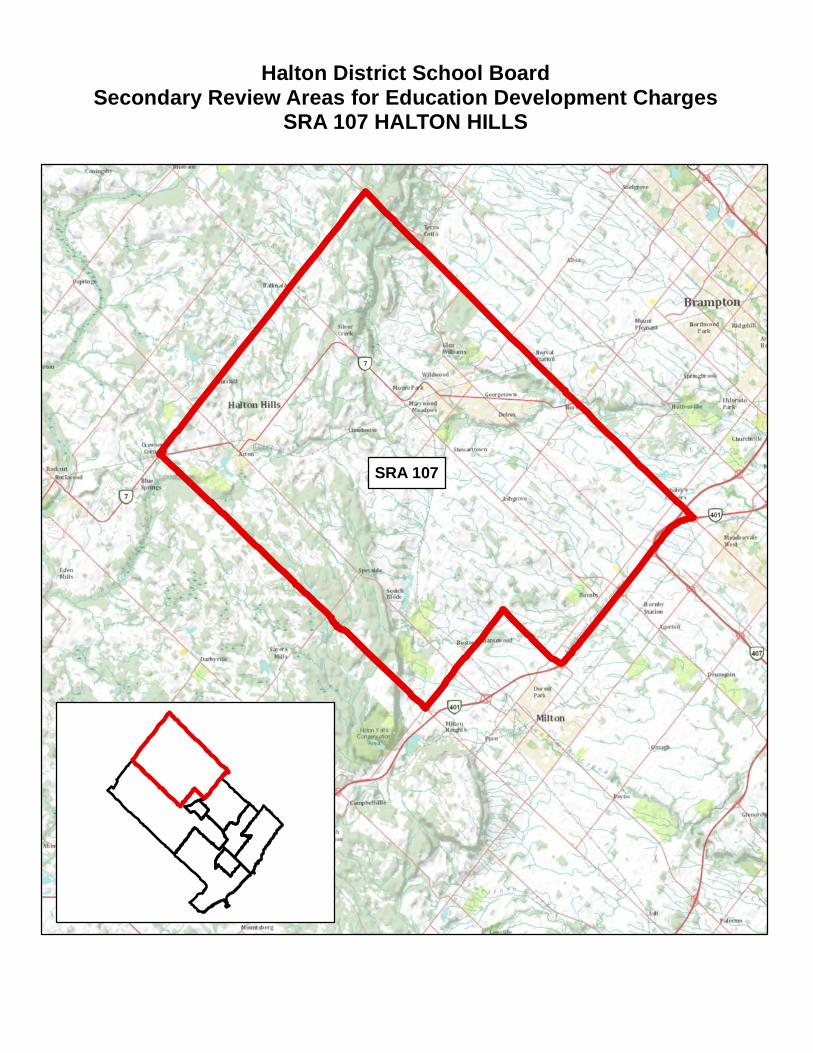
Halton District School BoardSecondary Review Areas for Education Development Charges
SRA 107 HALTON HILLS
SRA 107

Halton District School Board
Education Development Charges Submission 2013
Form F - Growth Related Pupil Place Requirements
Panel: Secondary Panel
Review Area: SRA107 Action District, Georgetown District
REQUIREMENTS OF EXISTING COMMUNITY
Current Number Current Year 1 Year 2 Year 3 Year 4 Year 5 Year 6 Year 7 Year 8 Year 9 Year 10 Year 11 Year 12 Year 13 Year 14 Year 15
OTG of Temp 2012/ 2013/ 2014/ 2015/ 2016/ 2017/ 2018/ 2019/ 2020/ 2021/ 2022/ 2023/ 2024/ 2025/ 2026/ 2027/
Capacity Facilities 2013 2014 2015 2016 2017 2018 2019 2020 2021 2022 2023 2024 2025 2026 2027 2028
Acton District High School 636.0 0 522 506 495 478 482 484 480 483 482 476 493 500 498 469 432 409
Georgetown District H.S. 1,683.0 0 1,791 1,740 1,703 1,691 1,647 1,614 1,566 1,572 1,541 1,536 1,555 1,521 1,457 1,410 1,354 1,319
TOTAL: 2,319.0 0 2,313 2,245 2,198 2,169 2,129 2,098 2,047 2,055 2,023 2,012 2,048 2,021 1,956 1,879 1,786 1,728
AVAILABLE PUPIL PLACES: 591
REQUIREMENTS OF NEW DEVELOPMENT (CUMULATIVE)
Year 1 Year 2 Year 3 Year 4 Year 5 Year 6 Year 7 Year 8 Year 9 Year 10 Year 11 Year 12 Year 13 Year 14 Year 15
2013/ 2014/ 2015/ 2016/ 2017/ 2018/ 2019/ 2020/ 2021/ 2022/ 2023/ 2024/ 2025/ 2026/ 2027/
2014 2015 2016 2017 2018 2019 2020 2021 2022 2023 2024 2025 2026 2027 2028
25 50 74 98 121 179 236 292 347 401 496 589 680 770 806
CALCULATION OF GROWTH-RELATED PUPIL PLACE REQUIREMENTS
1 Requirements of New Development (Pupil Places) 806
2 Available Pupil Places in Existing Facilities 591
3 Net Growth-Related Pupil Place Requirements (1-2) 216
NOTES
15 Year Projection of Average Daily Enrolments
Existing Schools and Projects
15 Year Projection of Average Daily Enrolments
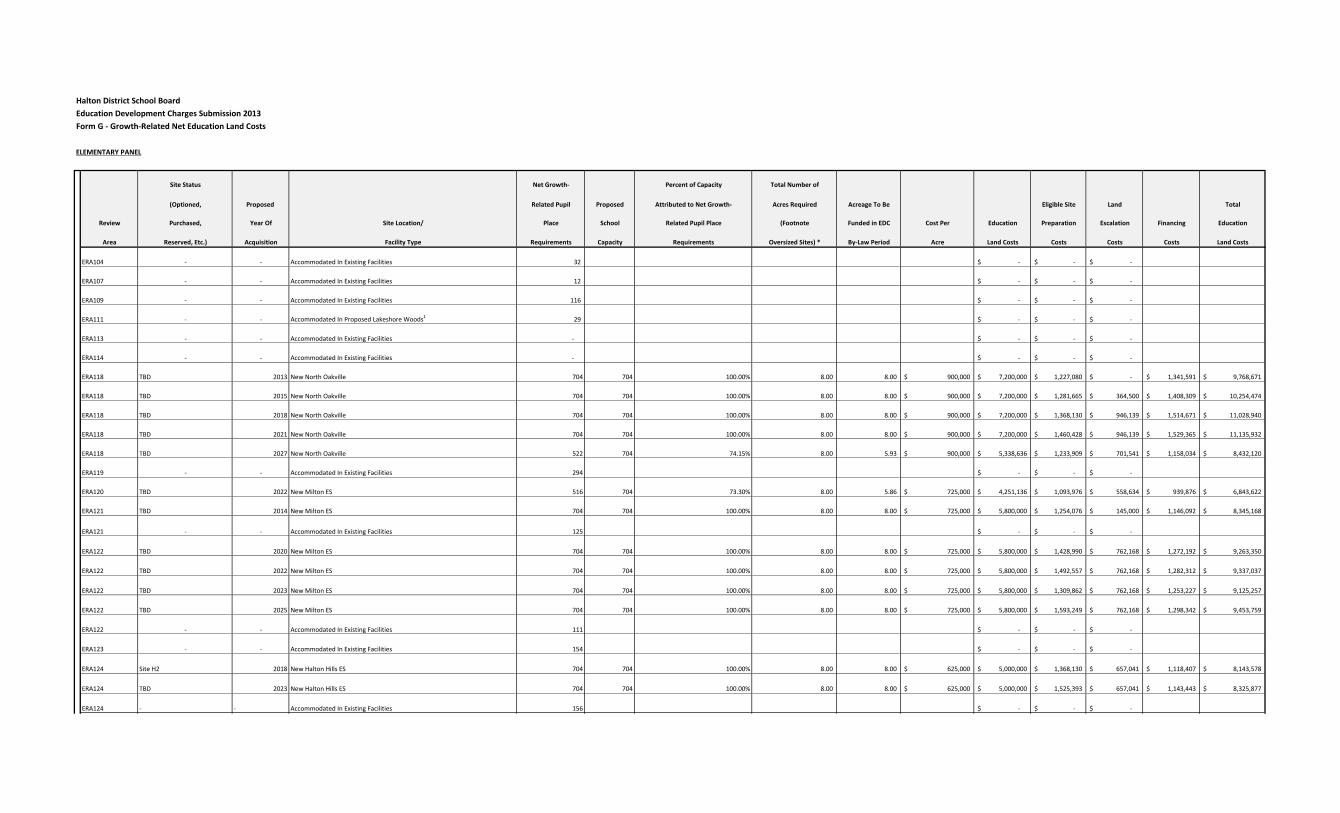
Halton District School Board
Education Development Charges Submission 2013
Form G - Growth-Related Net Education Land Costs
ELEMENTARY PANEL
Site Status Net Growth- Percent of Capacity Total Number of
(Optioned, Proposed Related Pupil Proposed Attributed to Net Growth- Acres Required Acreage To Be Eligible Site Land Total
Review Purchased, Year Of Site Location/ Place School Related Pupil Place (Footnote Funded in EDC Cost Per Education Preparation Escalation Financing Education
Area Reserved, Etc.) Acquisition Facility Type Requirements Capacity Requirements Oversized Sites) * By-Law Period Acre Land Costs Costs Costs Costs Land Costs
ERA104 - - Accommodated In Existing Facilities 32 -$ -$ -$
ERA107 - - Accommodated In Existing Facilities 12 -$ -$ -$
ERA109 - - Accommodated In Existing Facilities 116 -$ -$ -$
ERA111 - - Accommodated In Proposed Lakeshore Woods1
29 -$ -$ -$
ERA113 - - Accommodated In Existing Facilities - -$ -$ -$
ERA114 - - Accommodated In Existing Facilities - -$ -$ -$
ERA118 TBD 2013 New North Oakville 704 704 100.00% 8.00 8.00 900,000$ 7,200,000$ 1,227,080$ -$ 1,341,591$ 9,768,671$
ERA118 TBD 2015 New North Oakville 704 704 100.00% 8.00 8.00 900,000$ 7,200,000$ 1,281,665$ 364,500$ 1,408,309$ 10,254,474$
ERA118 TBD 2018 New North Oakville 704 704 100.00% 8.00 8.00 900,000$ 7,200,000$ 1,368,130$ 946,139$ 1,514,671$ 11,028,940$
ERA118 TBD 2021 New North Oakville 704 704 100.00% 8.00 8.00 900,000$ 7,200,000$ 1,460,428$ 946,139$ 1,529,365$ 11,135,932$
ERA118 TBD 2027 New North Oakville 522 704 74.15% 8.00 5.93 900,000$ 5,338,636$ 1,233,909$ 701,541$ 1,158,034$ 8,432,120$
ERA119 - - Accommodated In Existing Facilities 294 -$ -$ -$
ERA120 TBD 2022 New Milton ES 516 704 73.30% 8.00 5.86 725,000$ 4,251,136$ 1,093,976$ 558,634$ 939,876$ 6,843,622$
ERA121 TBD 2014 New Milton ES 704 704 100.00% 8.00 8.00 725,000$ 5,800,000$ 1,254,076$ 145,000$ 1,146,092$ 8,345,168$
ERA121 - - Accommodated In Existing Facilities 125 -$ -$ -$
ERA122 TBD 2020 New Milton ES 704 704 100.00% 8.00 8.00 725,000$ 5,800,000$ 1,428,990$ 762,168$ 1,272,192$ 9,263,350$
ERA122 TBD 2022 New Milton ES 704 704 100.00% 8.00 8.00 725,000$ 5,800,000$ 1,492,557$ 762,168$ 1,282,312$ 9,337,037$
ERA122 TBD 2023 New Milton ES 704 704 100.00% 8.00 8.00 725,000$ 5,800,000$ 1,309,862$ 762,168$ 1,253,227$ 9,125,257$
ERA122 TBD 2025 New Milton ES 704 704 100.00% 8.00 8.00 725,000$ 5,800,000$ 1,593,249$ 762,168$ 1,298,342$ 9,453,759$
ERA122 - - Accommodated In Existing Facilities 111 -$ -$ -$
ERA123 - - Accommodated In Existing Facilities 154 -$ -$ -$
ERA124 Site H2 2018 New Halton Hills ES 704 704 100.00% 8.00 8.00 625,000$ 5,000,000$ 1,368,130$ 657,041$ 1,118,407$ 8,143,578$
ERA124 TBD 2023 New Halton Hills ES 704 704 100.00% 8.00 8.00 625,000$ 5,000,000$ 1,525,393$ 657,041$ 1,143,443$ 8,325,877$
ERA124 - - Accommodated In Existing Facilities 156 -$ -$ -$

Halton District School Board
Education Development Charges Submission 2013
Form G - Growth-Related Net Education Land Costs
ELEMENTARY PANEL
Site Status Net Growth- Percent of Capacity Total Number of
(Optioned, Proposed Related Pupil Proposed Attributed to Net Growth- Acres Required Acreage To Be Eligible Site Land Total
Review Purchased, Year Of Site Location/ Place School Related Pupil Place (Footnote Funded in EDC Cost Per Education Preparation Escalation Financing Education
Area Reserved, Etc.) Acquisition Facility Type Requirements Capacity Requirements Oversized Sites) * By-Law Period Acre Land Costs Costs Costs Costs Land Costs
ERA127 TBD 2013 New Milton ES 704 704 100.00% 8.00 8.00 725,000$ 5,800,000$ 1,227,080$ -$ 1,118,711$ 8,145,791$
ERA127 TBD 2014 New Milton ES 704 704 100.00% 8.00 8.00 725,000$ 5,800,000$ 1,254,076$ 145,000$ 1,146,092$ 8,345,168$
ERA127 TBD 2016 New Milton ES 704 704 100.00% 8.00 8.00 725,000$ 5,800,000$ 1,309,862$ 445,966$ 1,202,887$ 8,758,715$
ERA127 TBD 2018 New Milton ES 704 704 100.00% 8.00 8.00 725,000$ 5,800,000$ 1,368,130$ 762,168$ 1,262,503$ 9,192,801$
ERA127 TBD 2022 New Milton ES 704 704 100.00% 8.00 8.00 725,000$ 5,800,000$ 1,492,557$ 762,168$ 1,282,312$ 9,337,037$
ERA127 - - Accommodated In Existing Facilities 88
Total: 13,419 12,672 144.00 139.80 106,389,773$ 24,289,150$ 10,140,008$ 22,418,365$ 163,237,296$
1 Lakeshore Woods has been identified as an EDC eligible site in the Board's previous EDC bylaw.
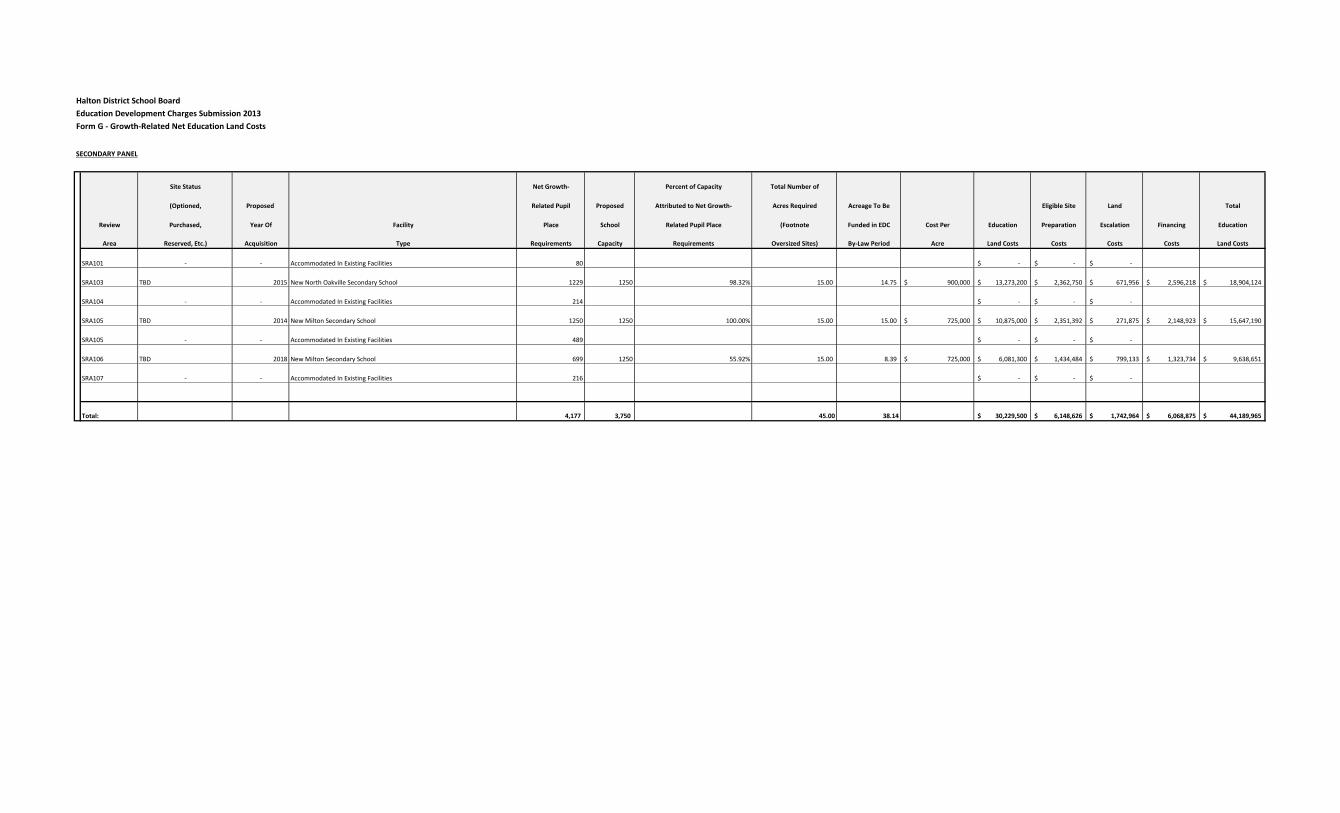
Halton District School Board
Education Development Charges Submission 2013
Form G - Growth-Related Net Education Land Costs
SECONDARY PANEL
Site Status Net Growth- Percent of Capacity Total Number of
(Optioned, Proposed Related Pupil Proposed Attributed to Net Growth- Acres Required Acreage To Be Eligible Site Land Total
Review Purchased, Year Of Facility Place School Related Pupil Place (Footnote Funded in EDC Cost Per Education Preparation Escalation Financing Education
Area Reserved, Etc.) Acquisition Type Requirements Capacity Requirements Oversized Sites) By-Law Period Acre Land Costs Costs Costs Costs Land Costs
SRA101 - - Accommodated In Existing Facilities 80 -$ -$ -$
SRA103 TBD 2015 New North Oakville Secondary School 1229 1250 98.32% 15.00 14.75 900,000$ 13,273,200$ 2,362,750$ 671,956$ 2,596,218$ 18,904,124$
SRA104 - - Accommodated In Existing Facilities 214 -$ -$ -$
SRA105 TBD 2014 New Milton Secondary School 1250 1250 100.00% 15.00 15.00 725,000$ 10,875,000$ 2,351,392$ 271,875$ 2,148,923$ 15,647,190$
SRA105 - - Accommodated In Existing Facilities 489 -$ -$ -$
SRA106 TBD 2018 New Milton Secondary School 699 1250 55.92% 15.00 8.39 725,000$ 6,081,300$ 1,434,484$ 799,133$ 1,323,734$ 9,638,651$
SRA107 - - Accommodated In Existing Facilities 216 -$ -$ -$
Total: 4,177 3,750 45.00 38.14 30,229,500$ 6,148,626$ 1,742,964$ 6,068,875$ 44,189,965$
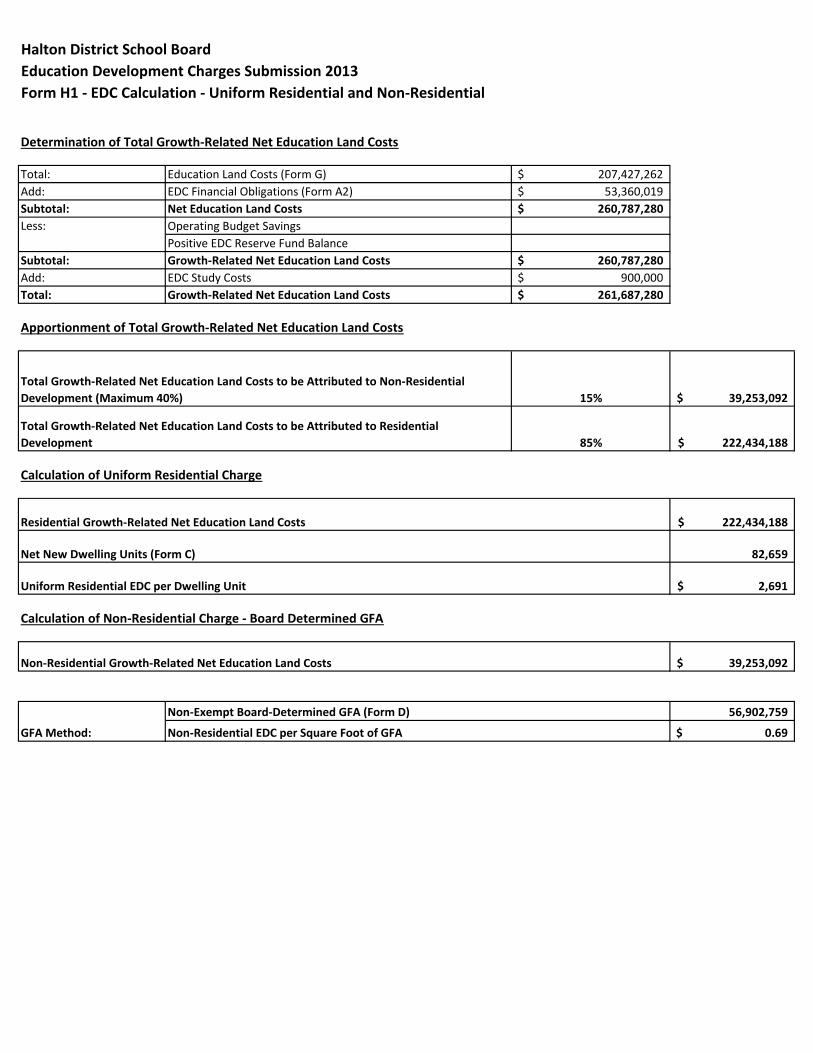
Halton District School Board
Education Development Charges Submission 2013
Form H1 - EDC Calculation - Uniform Residential and Non-Residential
Determination of Total Growth-Related Net Education Land Costs
Total: Education Land Costs (Form G) 207,427,262$
Add: EDC Financial Obligations (Form A2) 53,360,019$
Subtotal: Net Education Land Costs 260,787,280$
Operating Budget Savings
Positive EDC Reserve Fund Balance
Subtotal: Growth-Related Net Education Land Costs 260,787,280$
Add: EDC Study Costs 900,000$
Total: Growth-Related Net Education Land Costs 261,687,280$
Apportionment of Total Growth-Related Net Education Land Costs
Calculation of Uniform Residential Charge
Calculation of Non-Residential Charge - Board Determined GFA
56,902,759
0.69$ GFA Method:
Non-Exempt Board-Determined GFA (Form D)
Non-Residential EDC per Square Foot of GFA
Non-Residential Growth-Related Net Education Land Costs 39,253,092$
2,691$
Residential Growth-Related Net Education Land Costs
Net New Dwelling Units (Form C)
Uniform Residential EDC per Dwelling Unit
222,434,188$
82,659
39,253,092$
222,434,188$
Less:
Total Growth-Related Net Education Land Costs to be Attributed to Non-Residential
Development (Maximum 40%)
Total Growth-Related Net Education Land Costs to be Attributed to Residential
Development
15%
85%
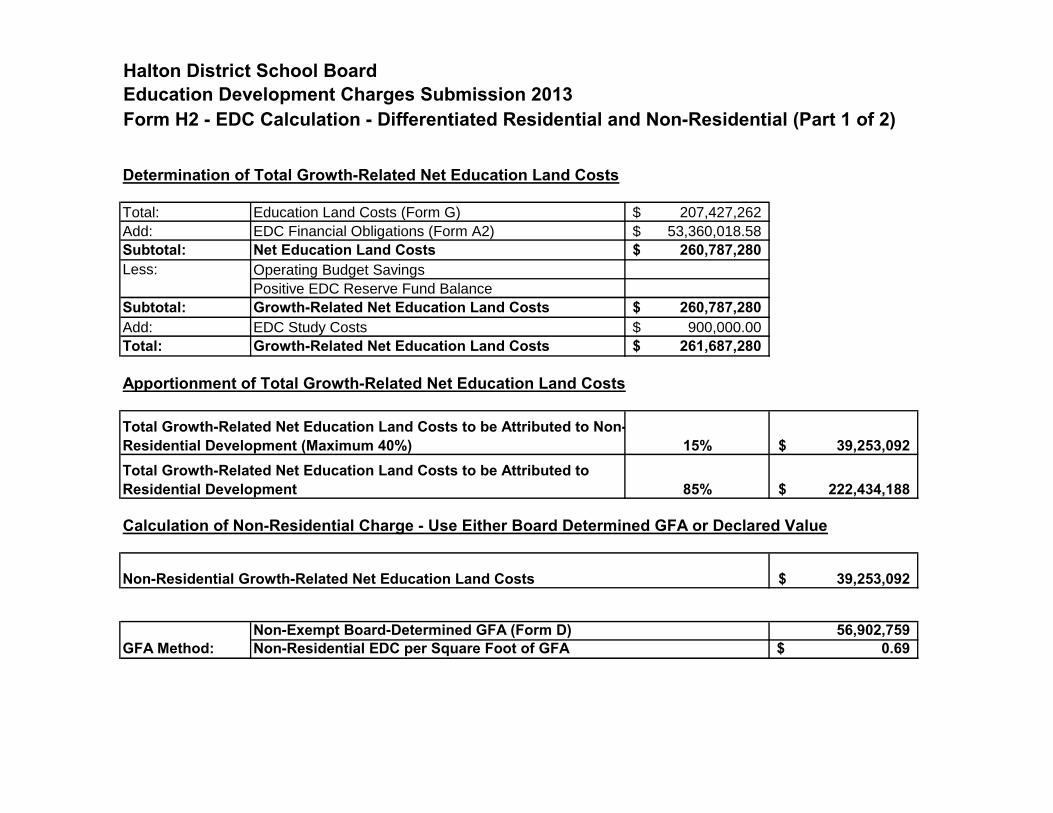
Halton District School BoardEducation Development Charges Submission 2013Form H2 - EDC Calculation - Differentiated Residential and Non-Residential (Part 1 of 2)
Determination of Total Growth-Related Net Education Land Costs
Total: Education Land Costs (Form G) 207,427,262$
Add: EDC Financial Obligations (Form A2) 53,360,018.58$
Subtotal: Net Education Land Costs 260,787,280$ Operating Budget Savings
Positive EDC Reserve Fund Balance
Subtotal: Growth-Related Net Education Land Costs 260,787,280$ Add: EDC Study Costs 900,000.00$
Total: Growth-Related Net Education Land Costs 261,687,280$
Apportionment of Total Growth-Related Net Education Land Costs
Calculation of Non-Residential Charge - Use Either Board Determined GFA or Declared Value
56,902,759 0.69$
39,253,092$
GFA Method:Non-Exempt Board-Determined GFA (Form D)Non-Residential EDC per Square Foot of GFA
Non-Residential Growth-Related Net Education Land Costs
Total Growth-Related Net Education Land Costs to be Attributed to Residential Development 85% 222,434,188$
Less:
Total Growth-Related Net Education Land Costs to be Attributed to Non-Residential Development (Maximum 40%) 15% 39,253,092$
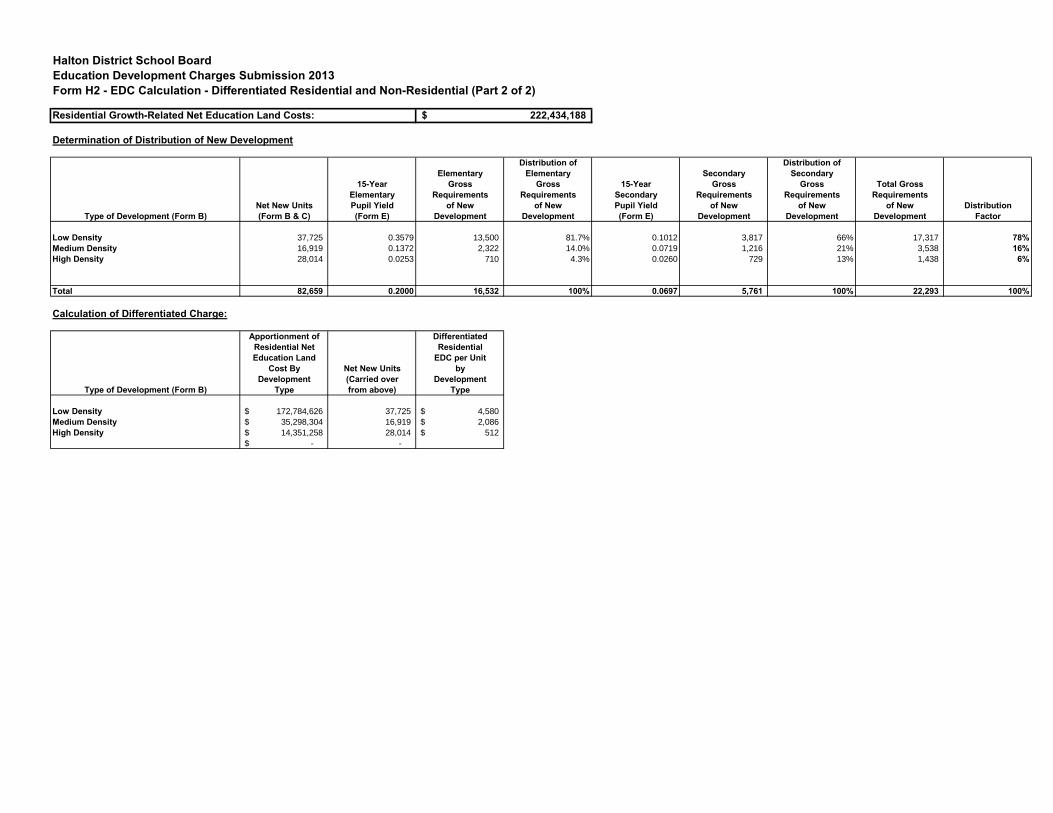
Halton District School BoardEducation Development Charges Submission 2013Form H2 - EDC Calculation - Differentiated Residential and Non-Residential (Part 2 of 2)
Residential Growth-Related Net Education Land Costs:
Determination of Distribution of New Development
Distribution of Distribution ofElementary Elementary Secondary Secondary
15-Year Gross Gross 15-Year Gross Gross Total GrossElementary Requirements Requirements Secondary Requirements Requirements Requirements
Net New Units Pupil Yield of New of New Pupil Yield of New of New of New DistributionType of Development (Form B) (Form B & C) (Form E) Development Development (Form E) Development Development Development Factor
Low Density 37,725 0.3579 13,500 81.7% 0.1012 3,817 66% 17,317 78%Medium Density 16,919 0.1372 2,322 14.0% 0.0719 1,216 21% 3,538 16%High Density 28,014 0.0253 710 4.3% 0.0260 729 13% 1,438 6%
Total 82,659 0.2000 16,532 100% 0.0697 5,761 100% 22,293 100%
Calculation of Differentiated Charge:
Apportionment of DifferentiatedResidential Net ResidentialEducation Land EDC per Unit
Cost By Net New Units byDevelopment (Carried over Development
Type of Development (Form B) Type from above) Type
Low Density 172,784,626$ 37,725 4,580$
Medium Density 35,298,304$ 16,919 2,086$
High Density 14,351,258$ 28,014 512$
-$ -
222,434,188$

Watson & Associates Economists Ltd. HDSB HCDSB FINAL EDC STUDY
HALTON CATHOLIC DISTRICT SCHOOL BOARD EDUCATION DEVELOPMENT CHARGE FORMS SUBMISSION

Halton Catholic District School BoardEducation Development Charges Submission 2013Form A - Eligibility to Impose an EDC
A.1.1: CAPACITY TRIGGER CALCULATION - ELEMENTARY PANEL
ElementaryElementary Average Average
Panel Year 1 Year 2 Year 3 Year 4 Year 5 Projected ProjectedBoard-Wide 2013/ 2014/ 2015/ 2016/ 2017/ Enrolment Enrolment
Capacity 2014 2015 2016 2017 2018 Over Five lessYears Capacity
19,695.0 20,736 21,238 21,484 21,870 22,107 21,487 1,792
A.1.2: CAPACITY TRIGGER CALCULATION - SECONDARY PANEL
Secondary Average SecondaryPanel Year 1 Year 2 Year 3 Year 4 Year 5 Projected Projected
Board-Wide 2013/ 2014/ 2015/ 2016/ 2017/ Enrolment EnrolmentCapacity 2014 2015 2016 2017 2018 Over Five less
Years Capacity
10,656.0 9,903 9,749 9,836 9,696 9,840 9,805 -851
A.2: EDC FINANCIAL OBLIGATIONS (Estimated to June 18, 2013)
Adjusted Outstanding Principal: 63,041,827$
Less Adjusted EDC Reserve Fund Balance: 15,988,005$
Total EDC Financial Obligations: 47,053,822$
Projected Elementary Panel Enrolment (Assumes Full Day JK/SK)
Projected Secondary Panel Enrolment
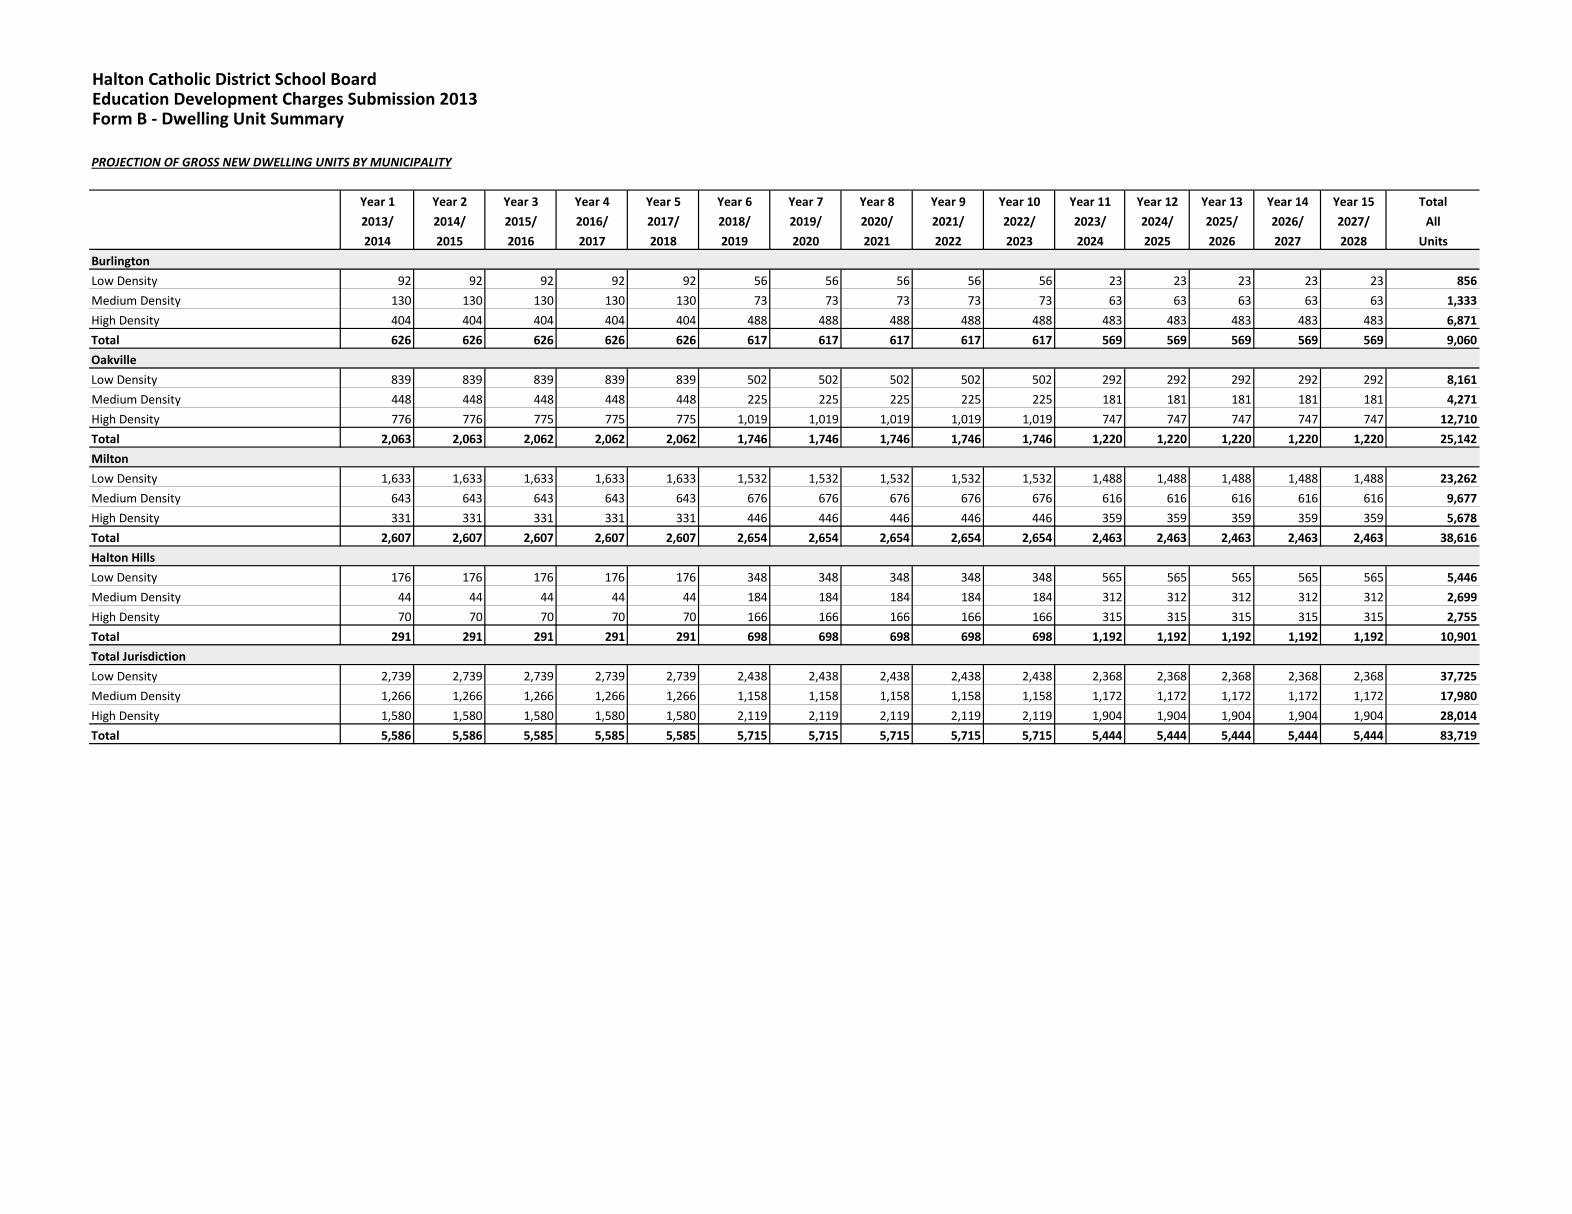
Halton Catholic District School BoardEducation Development Charges Submission 2013Form B - Dwelling Unit Summary
PROJECTION OF GROSS NEW DWELLING UNITS BY MUNICIPALITY
Year 1 Year 2 Year 3 Year 4 Year 5 Year 6 Year 7 Year 8 Year 9 Year 10 Year 11 Year 12 Year 13 Year 14 Year 15 Total2013/ 2014/ 2015/ 2016/ 2017/ 2018/ 2019/ 2020/ 2021/ 2022/ 2023/ 2024/ 2025/ 2026/ 2027/ All2014 2015 2016 2017 2018 2019 2020 2021 2022 2023 2024 2025 2026 2027 2028 Units
BurlingtonLow Density 92 92 92 92 92 56 56 56 56 56 23 23 23 23 23 856Medium Density 130 130 130 130 130 73 73 73 73 73 63 63 63 63 63 1,333High Density 404 404 404 404 404 488 488 488 488 488 483 483 483 483 483 6,871Total 626 626 626 626 626 617 617 617 617 617 569 569 569 569 569 9,060OakvilleLow Density 839 839 839 839 839 502 502 502 502 502 292 292 292 292 292 8,161Medium Density 448 448 448 448 448 225 225 225 225 225 181 181 181 181 181 4,271High Density 776 776 775 775 775 1,019 1,019 1,019 1,019 1,019 747 747 747 747 747 12,710Total 2,063 2,063 2,062 2,062 2,062 1,746 1,746 1,746 1,746 1,746 1,220 1,220 1,220 1,220 1,220 25,142MiltonLow Density 1,633 1,633 1,633 1,633 1,633 1,532 1,532 1,532 1,532 1,532 1,488 1,488 1,488 1,488 1,488 23,262Medium Density 643 643 643 643 643 676 676 676 676 676 616 616 616 616 616 9,677High Density 331 331 331 331 331 446 446 446 446 446 359 359 359 359 359 5,678Total 2,607 2,607 2,607 2,607 2,607 2,654 2,654 2,654 2,654 2,654 2,463 2,463 2,463 2,463 2,463 38,616Halton HillsLow Density 176 176 176 176 176 348 348 348 348 348 565 565 565 565 565 5,446Medium Density 44 44 44 44 44 184 184 184 184 184 312 312 312 312 312 2,699High Density 70 70 70 70 70 166 166 166 166 166 315 315 315 315 315 2,755Total 291 291 291 291 291 698 698 698 698 698 1,192 1,192 1,192 1,192 1,192 10,901Total JurisdictionLow Density 2,739 2,739 2,739 2,739 2,739 2,438 2,438 2,438 2,438 2,438 2,368 2,368 2,368 2,368 2,368 37,725Medium Density 1,266 1,266 1,266 1,266 1,266 1,158 1,158 1,158 1,158 1,158 1,172 1,172 1,172 1,172 1,172 17,980High Density 1,580 1,580 1,580 1,580 1,580 2,119 2,119 2,119 2,119 2,119 1,904 1,904 1,904 1,904 1,904 28,014Total 5,586 5,586 5,585 5,585 5,585 5,715 5,715 5,715 5,715 5,715 5,444 5,444 5,444 5,444 5,444 83,719
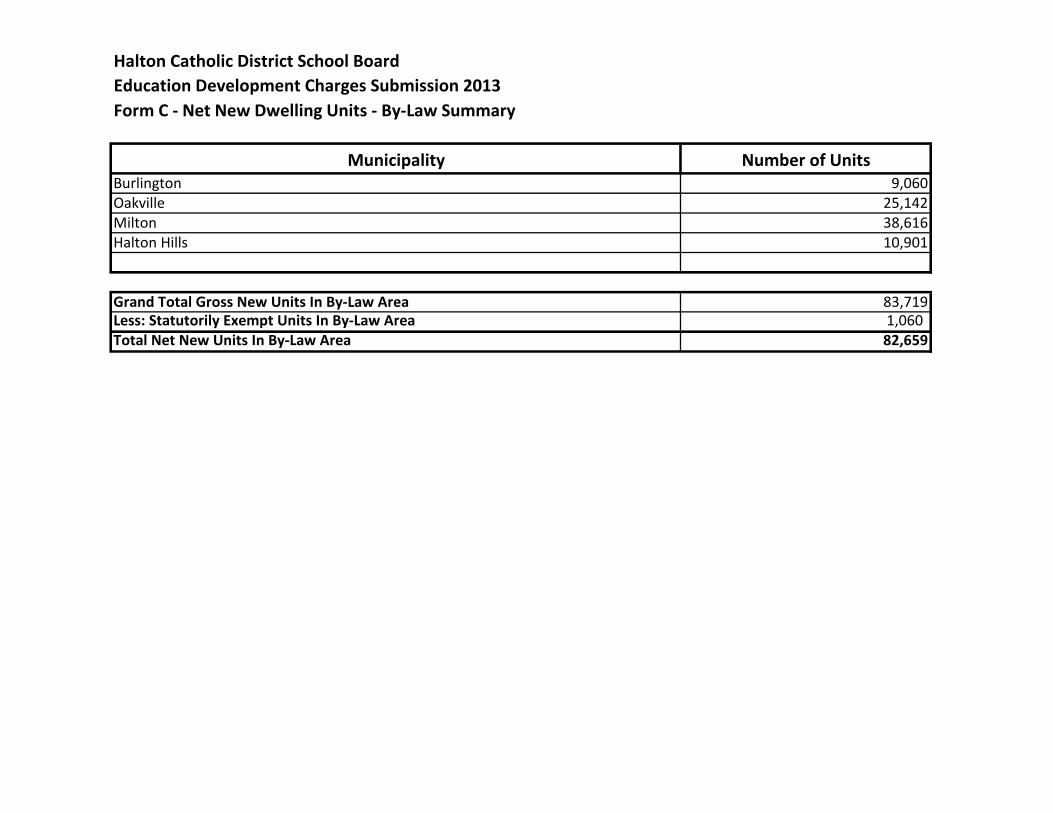
Halton Catholic District School BoardEducation Development Charges Submission 2013Form C - Net New Dwelling Units - By-Law Summary
Number of UnitsBurlington 9,060Oakville 25,142Milton 38,616Halton Hills 10,901
Grand Total Gross New Units In By-Law Area 83,719Less: Statutorily Exempt Units In By-Law Area 1,060 Total Net New Units In By-Law Area 82,659
Municipality
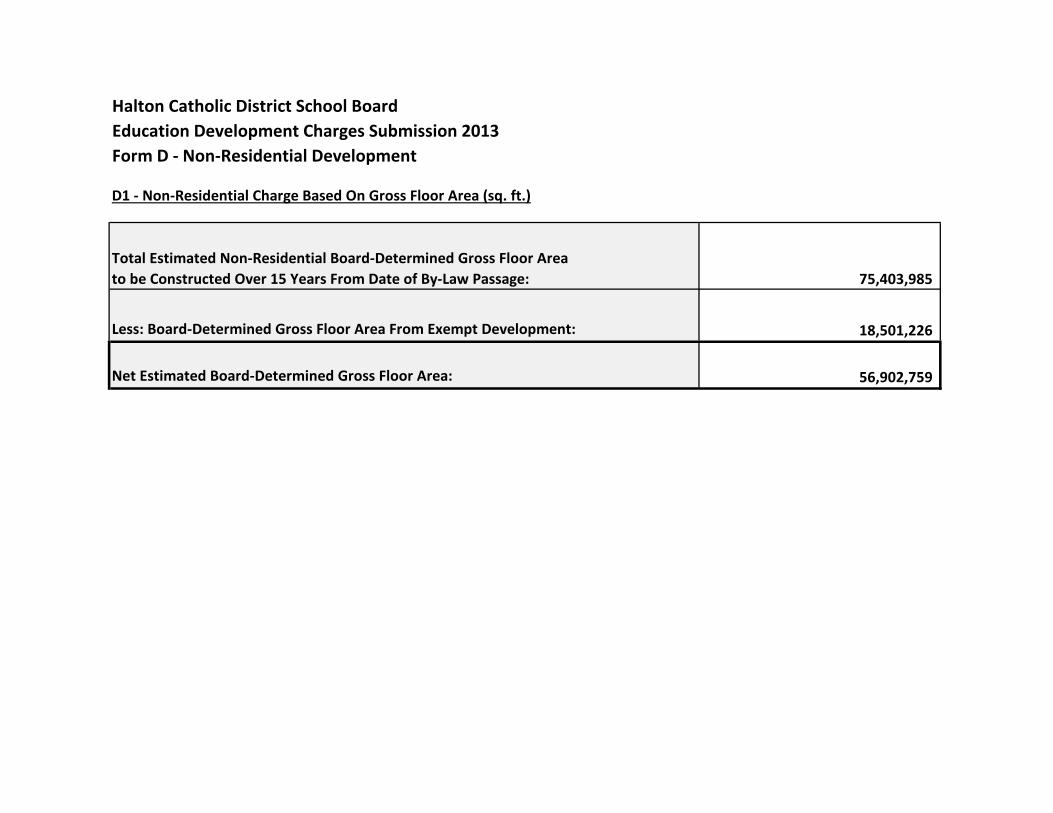
Halton Catholic District School BoardEducation Development Charges Submission 2013Form D - Non-Residential Development
D1 - Non-Residential Charge Based On Gross Floor Area (sq. ft.)
Total Estimated Non-Residential Board-Determined Gross Floor Area to be Constructed Over 15 Years From Date of By-Law Passage: 75,403,985
Less: Board-Determined Gross Floor Area From Exempt Development: 18,501,226
Net Estimated Board-Determined Gross Floor Area: 56,902,759
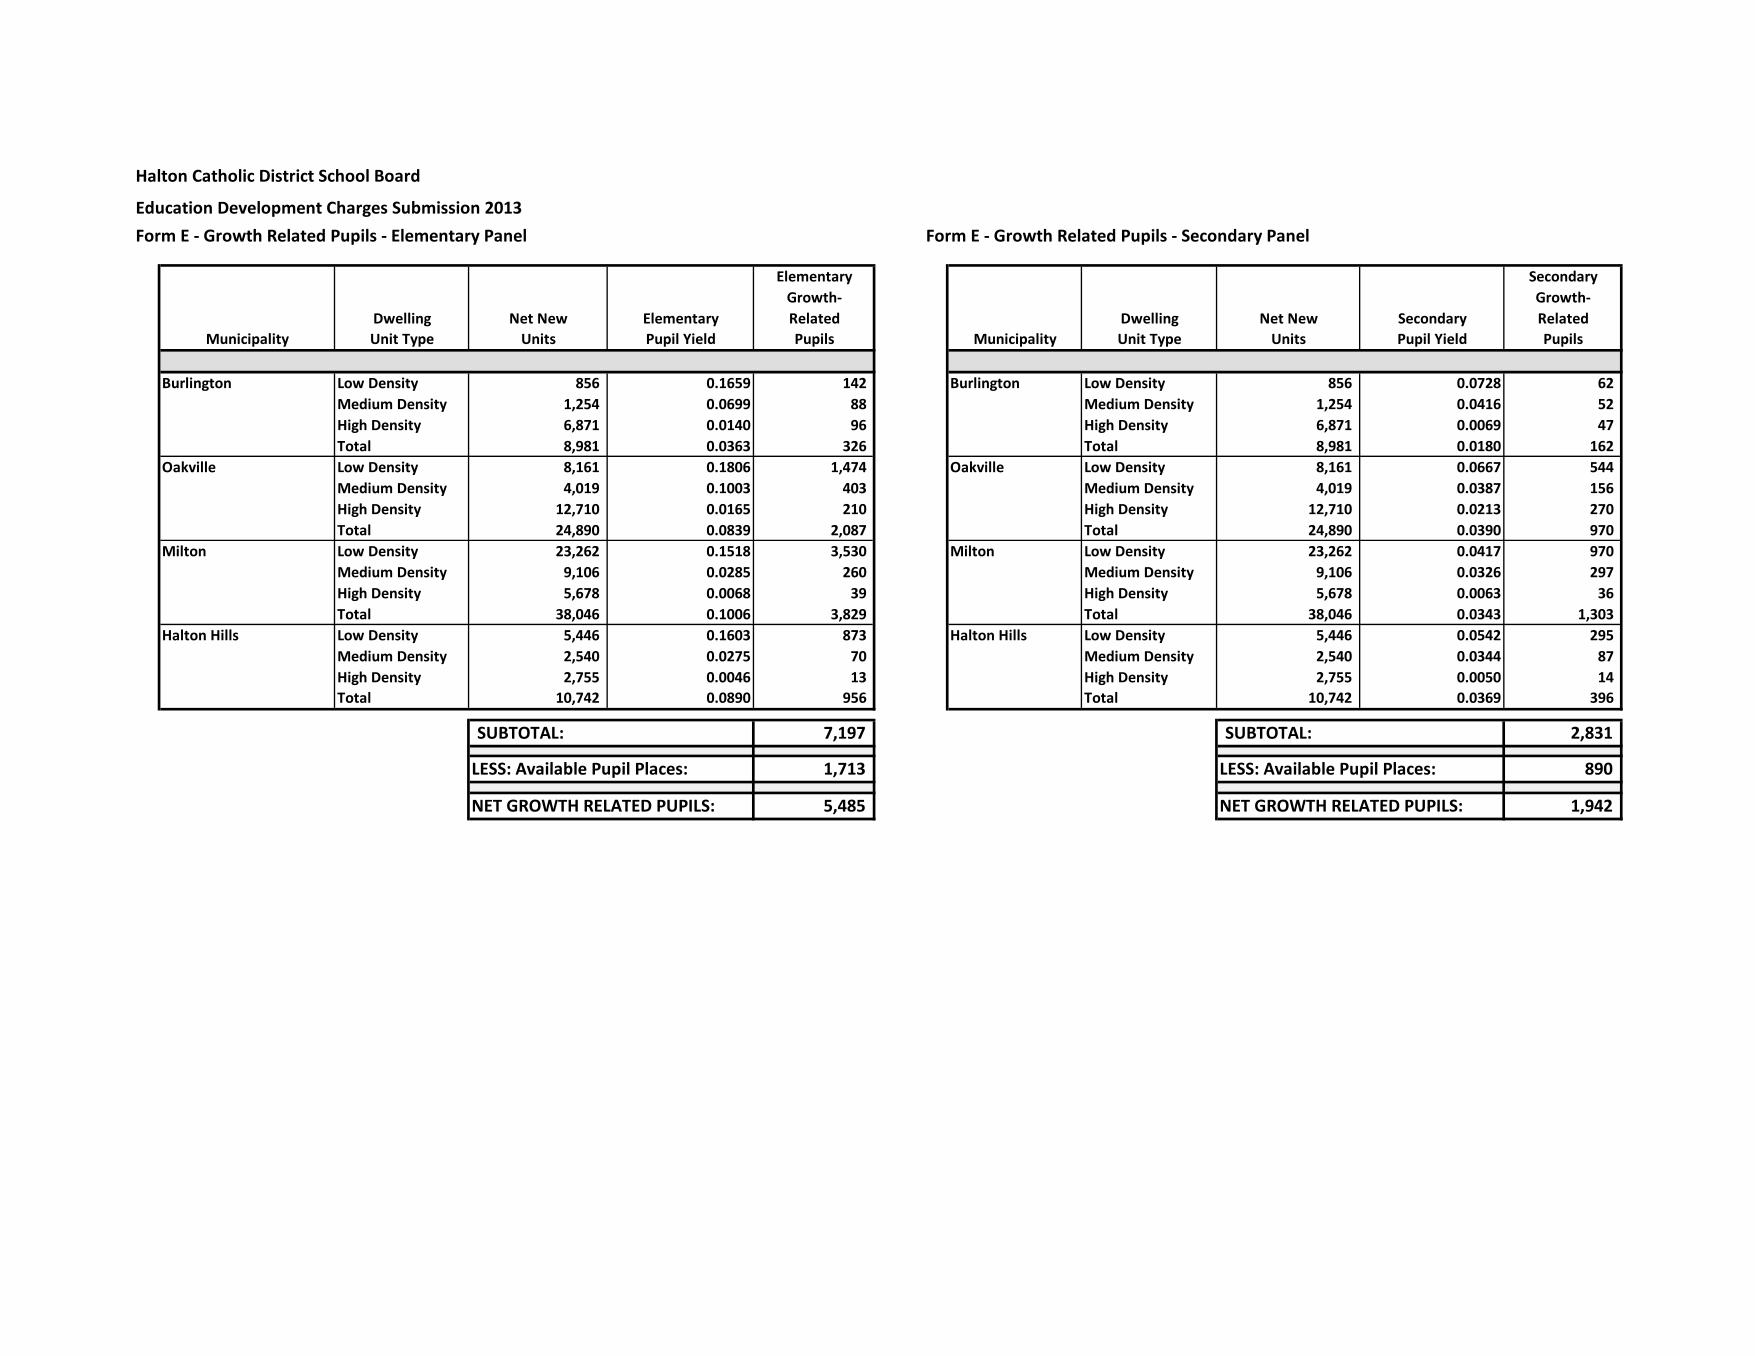
Halton Catholic District School Board
Education Development Charges Submission 2013Form E - Growth Related Pupils - Elementary Panel Form E - Growth Related Pupils - Secondary Panel
Elementary SecondaryGrowth- Growth-
Dwelling Net New Elementary Related Dwelling Net New Secondary RelatedUnit Type Units Pupil Yield Pupils Unit Type Units Pupil Yield Pupils
CODE
Burlington Low Density 856 0.1659 142 1 Burlington Low Density 856 0.0728 62 Medium Density 1,254 0.0699 88 1 Medium Density 1,254 0.0416 52 High Density 6,871 0.0140 96 1 High Density 6,871 0.0069 47 Total 8,981 0.0363 326 0 Total 8,981 0.0180 162
Oakville Low Density 8,161 0.1806 1,474 2 Oakville Low Density 8,161 0.0667 544 Medium Density 4,019 0.1003 403 2 Medium Density 4,019 0.0387 156 High Density 12,710 0.0165 210 2 High Density 12,710 0.0213 270 Total 24,890 0.0839 2,087 0 Total 24,890 0.0390 970
Milton Low Density 23,262 0.1518 3,530 3 Milton Low Density 23,262 0.0417 970 Medium Density 9,106 0.0285 260 3 Medium Density 9,106 0.0326 297 High Density 5,678 0.0068 39 3 High Density 5,678 0.0063 36 Total 38,046 0.1006 3,829 0 Total 38,046 0.0343 1,303
Halton Hills Low Density 5,446 0.1603 873 4 Halton Hills Low Density 5,446 0.0542 295 Medium Density 2,540 0.0275 70 4 Medium Density 2,540 0.0344 87 High Density 2,755 0.0046 13 4 High Density 2,755 0.0050 14 Total 10,742 0.0890 956 Total 10,742 0.0369 396
SUBTOTAL: 7,197 SUBTOTAL: 2,831
LESS: Available Pupil Places: 1,713 LESS: Available Pupil Places: 890
NET GROWTH RELATED PUPILS: 5,485 NET GROWTH RELATED PUPILS: 1,942
Municipality Municipality
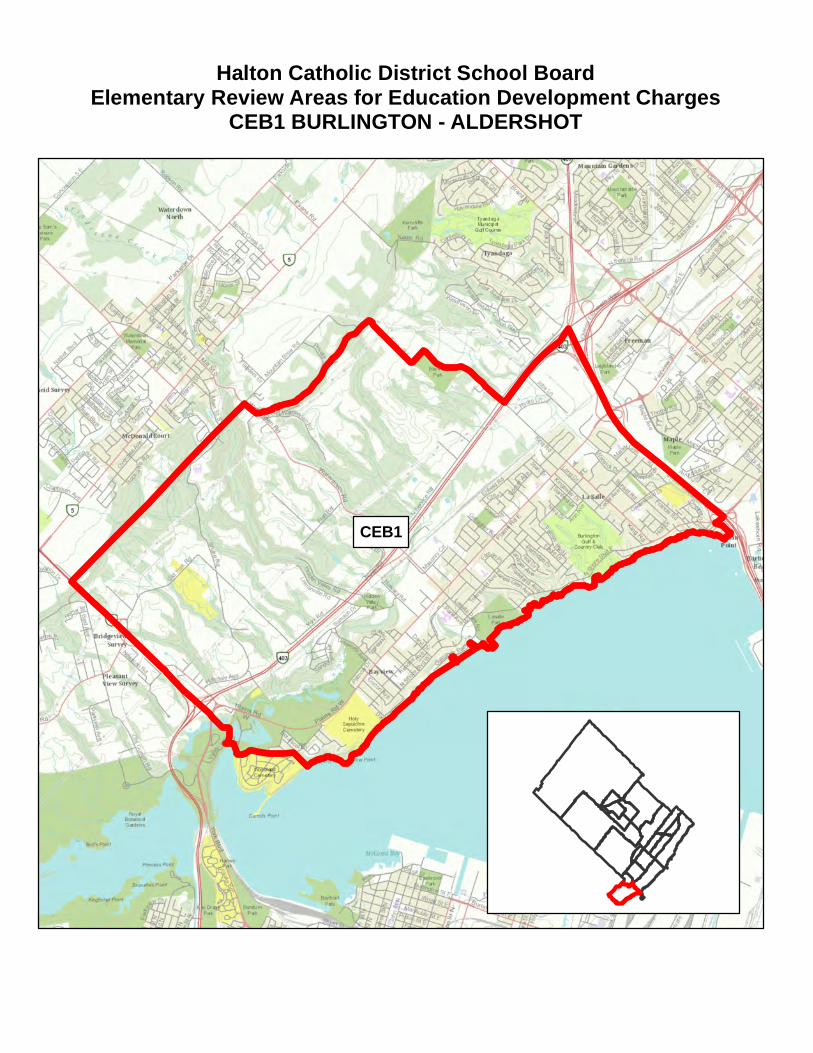
Halton Catholic District School BoardElementary Review Areas for Education Development Charges
CEB1 BURLINGTON - ALDERSHOT
CEB1

Halton Catholic District School BoardEducation Development Charges Submission 2013Form F - Growth Related Pupil Place Requirements
Panel: Elementary Panel
Review Area: CEB1 Burlington - Aldershot
REQUIREMENTS OF EXISTING COMMUNITY
Current Number Current Year 1 Year 2 Year 3 Year 4 Year 5 Year 6 Year 7 Year 8 Year 9 Year 10 Year 11 Year 12 Year 13 Year 14 Year 15
OTG of Temp 2012/ 2013/ 2014/ 2015/ 2016/ 2017/ 2018/ 2019/ 2020/ 2021/ 2022/ 2023/ 2024/ 2025/ 2026/ 2027/
Capacity Facilities 2013 2014 2015 2016 2017 2018 2019 2020 2021 2022 2023 2024 2025 2026 2027 2028
Holy Rosary (B) 455 0 429 430 429 415 415 401 392 383 373 350 345 334 330 326 323 321
TOTAL: 455.0 0 429 430 429 415 415 401 392 383 373 350 345 334 330 326 323 321
AVAILABLE PUPIL PLACES: 134
REQUIREMENTS OF NEW DEVELOPMENT (CUMULATIVE)
Year 1 Year 2 Year 3 Year 4 Year 5 Year 6 Year 7 Year 8 Year 9 Year 10 Year 11 Year 12 Year 13 Year 14 Year 152013/ 2014/ 2015/ 2016/ 2017/ 2018/ 2019/ 2020/ 2021/ 2022/ 2023/ 2024/ 2025/ 2026/ 2027/2014 2015 2016 2017 2018 2019 2020 2021 2022 2023 2024 2025 2026 2027 2028
8 16 24 33 41 45 50 55 60 64 71 77 84 91 97
CALCULATION OF GROWTH-RELATED PUPIL PLACE REQUIREMENTS
1 Requirements of New Development (Pupil Places) 97
2 Available Pupil Places in Existing Facilities 134
3 Net Growth-Related Pupil Place Requirements (1-2) 0
NOTES
15 Year Projections (Assumes Full Day JK/SK)
Existing Schools and Projects
15 Year Projections (Assumes Full Day JK/SK)
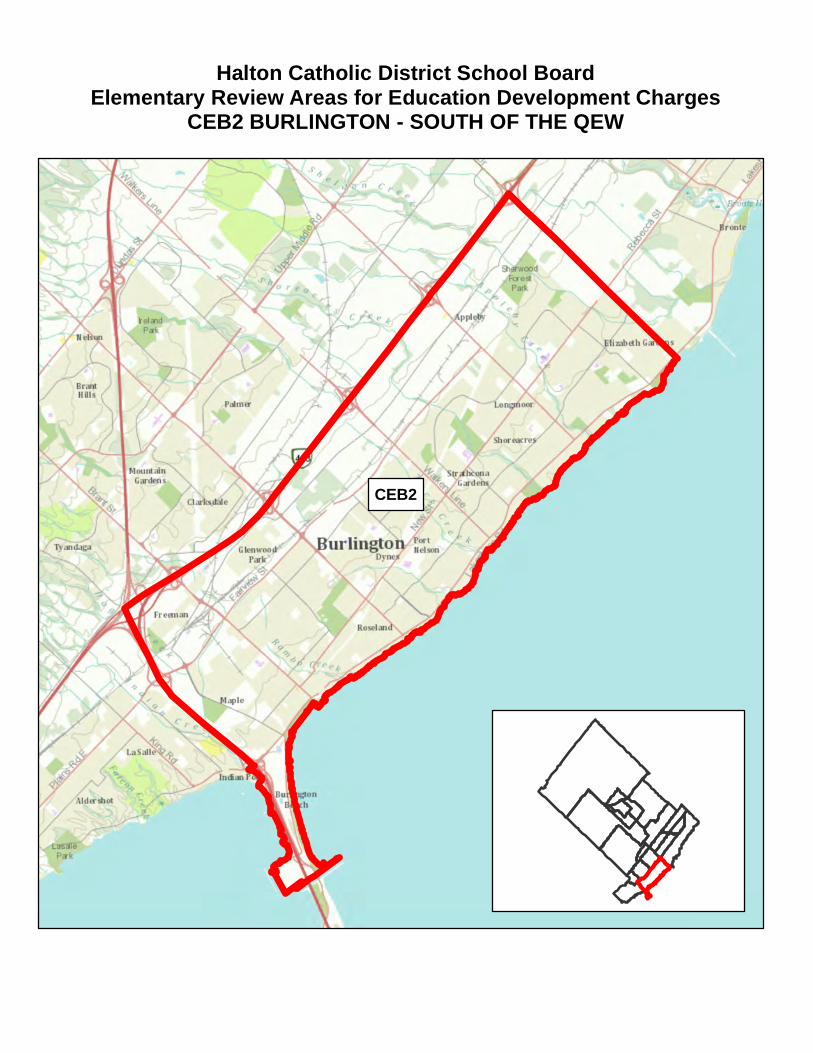
Halton Catholic District School BoardElementary Review Areas for Education Development Charges
CEB2 BURLINGTON - SOUTH OF THE QEW
CEB2

Halton Catholic District School BoardEducation Development Charges Submission 2013Form F - Growth Related Pupil Place Requirements
Panel: Elementary Panel
Review Area: CEB2 Burlington - South of the QEW
REQUIREMENTS OF EXISTING COMMUNITY
Current Number Current Year 1 Year 2 Year 3 Year 4 Year 5 Year 6 Year 7 Year 8 Year 9 Year 10 Year 11 Year 12 Year 13 Year 14 Year 15
OTG of Temp 2012/ 2013/ 2014/ 2015/ 2016/ 2017/ 2018/ 2019/ 2020/ 2021/ 2022/ 2023/ 2024/ 2025/ 2026/ 2027/
Capacity Facilities 2013 2014 2015 2016 2017 2018 2019 2020 2021 2022 2023 2024 2025 2026 2027 2028
Ascension 383 0 315 295 283 262 253 242 235 228 221 227 228 225 223 222 221 221
St. John (B) 383 0 316 316 320 320 329 340 346 353 362 357 355 351 348 347 345 345
St. Patrick 337 0 233 242 252 255 259 268 279 271 273 268 266 263 261 260 259 258
St. Paul 337 0 277 267 257 246 245 236 236 233 239 230 223 220 219 218 217 217
St. Raphael 314 0 266 259 248 227 217 201 196 181 180 187 182 180 179 178 177 177
TOTAL: 1,754.0 0 1,407 1,380 1,359 1,310 1,302 1,288 1,291 1,266 1,274 1,269 1,255 1,239 1,230 1,225 1,220 1,217
AVAILABLE PUPIL PLACES: 537
REQUIREMENTS OF NEW DEVELOPMENT (CUMULATIVE)
Year 1 Year 2 Year 3 Year 4 Year 5 Year 6 Year 7 Year 8 Year 9 Year 10 Year 11 Year 12 Year 13 Year 14 Year 152013/ 2014/ 2015/ 2016/ 2017/ 2018/ 2019/ 2020/ 2021/ 2022/ 2023/ 2024/ 2025/ 2026/ 2027/2014 2015 2016 2017 2018 2019 2020 2021 2022 2023 2024 2025 2026 2027 2028
3 6 9 12 15 19 23 26 30 34 34 39 45 50 56
CALCULATION OF GROWTH-RELATED PUPIL PLACE REQUIREMENTS
1 Requirements of New Development (Pupil Places) 56
2 Available Pupil Places in Existing Facilities 537
3 Net Growth-Related Pupil Place Requirements (1-2) 0
NOTES
15 Year Projections (Assumes Full Day JK/SK)
Existing Schools and Projects
15 Year Projections (Assumes Full Day JK/SK)
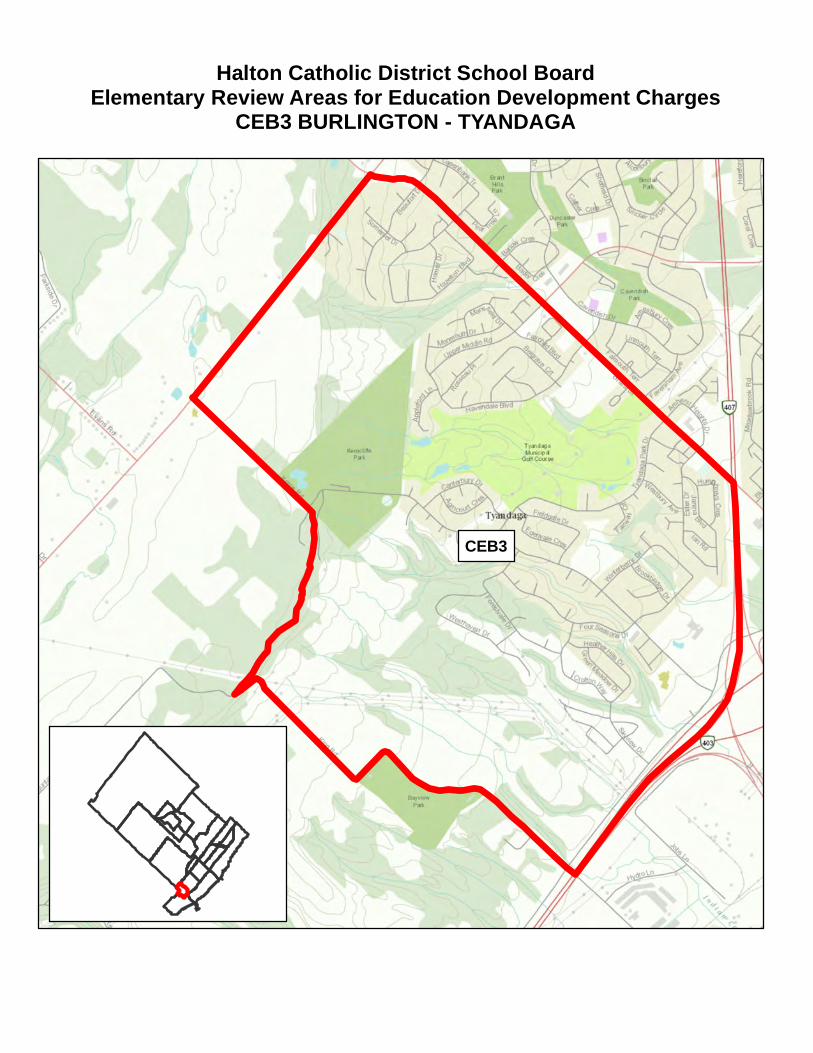
Halton Catholic District School BoardElementary Review Areas for Education Development Charges
CEB3 BURLINGTON - TYANDAGA
CEB3

Halton Catholic District School BoardEducation Development Charges Submission 2013Form F - Growth Related Pupil Place Requirements
Panel: Elementary Panel
Review Area: CEB3 Burlington - Tyendaga
REQUIREMENTS OF EXISTING COMMUNITY
Current Number Current Year 1 Year 2 Year 3 Year 4 Year 5 Year 6 Year 7 Year 8 Year 9 Year 10 Year 11 Year 12 Year 13 Year 14 Year 15
OTG of Temp 2012/ 2013/ 2014/ 2015/ 2016/ 2017/ 2018/ 2019/ 2020/ 2021/ 2022/ 2023/ 2024/ 2025/ 2026/ 2027/
Capacity Facilities 2013 2014 2015 2016 2017 2018 2019 2020 2021 2022 2023 2024 2025 2026 2027 2028
TOTAL: 0.0 0 0 0 0 0 0 0 0 0 0 0 0 0 0 0 0 0
AVAILABLE PUPIL PLACES: -
REQUIREMENTS OF NEW DEVELOPMENT (CUMULATIVE)
Year 1 Year 2 Year 3 Year 4 Year 5 Year 6 Year 7 Year 8 Year 9 Year 10 Year 11 Year 12 Year 13 Year 14 Year 152013/ 2014/ 2015/ 2016/ 2017/ 2018/ 2019/ 2020/ 2021/ 2022/ 2023/ 2024/ 2025/ 2026/ 2027/2014 2015 2016 2017 2018 2019 2020 2021 2022 2023 2024 2025 2026 2027 2028
1 2 3 5 6 6 7 7 8 8 9 10 11 12 13
CALCULATION OF GROWTH-RELATED PUPIL PLACE REQUIREMENTS
1 Requirements of New Development (Pupil Places) 13
2 Available Pupil Places in Existing Facilities 0
3 Net Growth-Related Pupil Place Requirements (1-2) 13
NOTES
15 Year Projections (Assumes Full Day JK/SK)
Existing Schools and Projects
15 Year Projections (Assumes Full Day JK/SK)
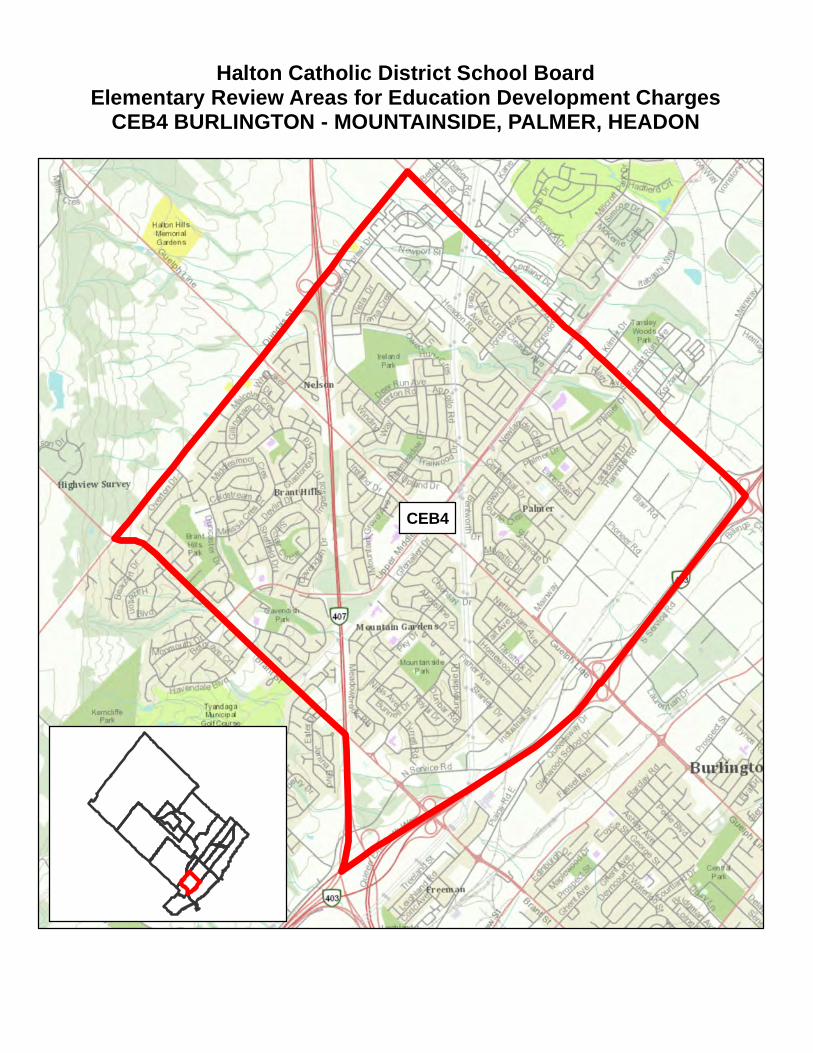
Halton Catholic District School BoardElementary Review Areas for Education Development Charges
CEB4 BURLINGTON - MOUNTAINSIDE, PALMER, HEADON
CEB4

Halton Catholic District School BoardEducation Development Charges Submission 2013Form F - Growth Related Pupil Place Requirements
Panel: Elementary Panel
Review Area: CEB4 Burlington - Mountainside, Palmer, Headon
REQUIREMENTS OF EXISTING COMMUNITY
Current Number Current Year 1 Year 2 Year 3 Year 4 Year 5 Year 6 Year 7 Year 8 Year 9 Year 10 Year 11 Year 12 Year 13 Year 14 Year 15
OTG of Temp 2012/ 2013/ 2014/ 2015/ 2016/ 2017/ 2018/ 2019/ 2020/ 2021/ 2022/ 2023/ 2024/ 2025/ 2026/ 2027/
Capacity Facilities 2013 2014 2015 2016 2017 2018 2019 2020 2021 2022 2023 2024 2025 2026 2027 2028
Canadian Martyrs 409 0 343 315 312 299 298 291 283 277 270 269 261 260 259 258 257 256
St. Gabriel 524 0 501 493 501 483 457 440 440 428 419 426 413 412 411 409 407 405
St. Mark 478 0 335 316 316 306 305 301 299 292 294 289 286 285 284 282 281 280
St. Timothy 504 0 523 503 480 459 459 443 432 423 413 411 410 409 407 405 403 402
TOTAL: 1,915.0 0 1,702 1,627 1,609 1,548 1,519 1,475 1,454 1,421 1,395 1,396 1,370 1,365 1,361 1,355 1,348 1,343
AVAILABLE PUPIL PLACES: 572
REQUIREMENTS OF NEW DEVELOPMENT (CUMULATIVE)
Year 1 Year 2 Year 3 Year 4 Year 5 Year 6 Year 7 Year 8 Year 9 Year 10 Year 11 Year 12 Year 13 Year 14 Year 152013/ 2014/ 2015/ 2016/ 2017/ 2018/ 2019/ 2020/ 2021/ 2022/ 2023/ 2024/ 2025/ 2026/ 2027/2014 2015 2016 2017 2018 2019 2020 2021 2022 2023 2024 2025 2026 2027 2028
5 10 14 19 23 25 27 29 31 32 37 42 46 50 54
CALCULATION OF GROWTH-RELATED PUPIL PLACE REQUIREMENTS
1 Requirements of New Development (Pupil Places) 54
2 Available Pupil Places in Existing Facilities 572
3 Net Growth-Related Pupil Place Requirements (1-2) 0
NOTES
15 Year Projections (Assumes Full Day JK/SK)
Existing Schools and Projects
15 Year Projections (Assumes Full Day JK/SK)
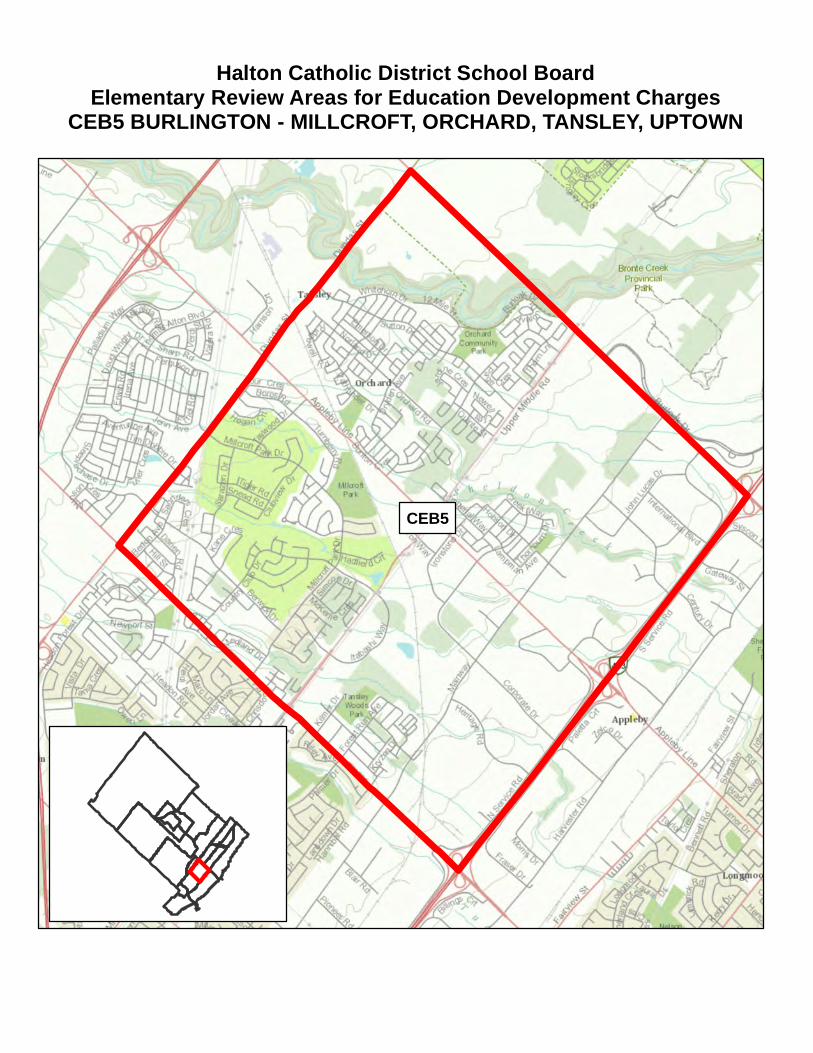
Halton Catholic District School BoardElementary Review Areas for Education Development Charges
CEB5 BURLINGTON - MILLCROFT, ORCHARD, TANSLEY, UPTOWN
CEB5

Halton Catholic District School BoardEducation Development Charges Submission 2013Form F - Growth Related Pupil Place Requirements
Panel: Elementary Panel
Review Area: CEB5 Burlington - Millcroft, Orchard, Tansley, Uptown
REQUIREMENTS OF EXISTING COMMUNITY
Current Number Current Year 1 Year 2 Year 3 Year 4 Year 5 Year 6 Year 7 Year 8 Year 9 Year 10 Year 11 Year 12 Year 13 Year 14 Year 15
OTG of Temp 2012/ 2013/ 2014/ 2015/ 2016/ 2017/ 2018/ 2019/ 2020/ 2021/ 2022/ 2023/ 2024/ 2025/ 2026/ 2027/
Capacity Facilities 2013 2014 2015 2016 2017 2018 2019 2020 2021 2022 2023 2024 2025 2026 2027 2028
Sacred Heart of Jesus 547 0 489 459 424 391 367 345 316 298 301 296 295 292 290 289 289 289
St. Christopher 478 7 596 595 586 561 559 513 488 478 460 447 455 451 453 452 453 452
St. Elizabeth Seton 455 13 317 320 336 331 323 336 330 336 324 340 339 336 333 333 332 332
TOTAL: 1,480.0 20 1,402 1,374 1,345 1,283 1,248 1,194 1,134 1,113 1,085 1,083 1,089 1,078 1,076 1,074 1,073 1,074
AVAILABLE PUPIL PLACES: 406
REQUIREMENTS OF NEW DEVELOPMENT (CUMULATIVE)
Year 1 Year 2 Year 3 Year 4 Year 5 Year 6 Year 7 Year 8 Year 9 Year 10 Year 11 Year 12 Year 13 Year 14 Year 152013/ 2014/ 2015/ 2016/ 2017/ 2018/ 2019/ 2020/ 2021/ 2022/ 2023/ 2024/ 2025/ 2026/ 2027/2014 2015 2016 2017 2018 2019 2020 2021 2022 2023 2024 2025 2026 2027 2028
4 7 10 14 17 19 22 24 26 29 31 33 36 38 40
CALCULATION OF GROWTH-RELATED PUPIL PLACE REQUIREMENTS
1 Requirements of New Development (Pupil Places) 40
2 Available Pupil Places in Existing Facilities 406
3 Net Growth-Related Pupil Place Requirements (1-2) 0
NOTES
Existing Schools and Projects
15 Year Projections (Assumes Full Day JK/SK)
15 Year Projections (Assumes Full Day JK/SK)
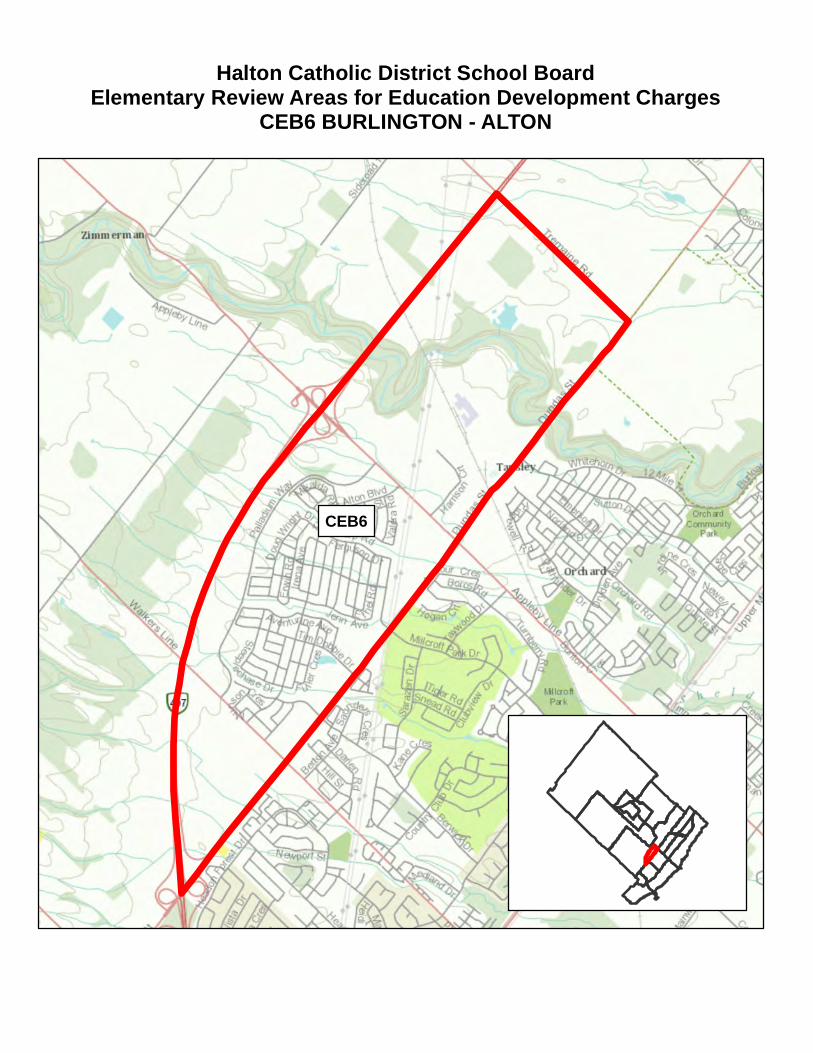
Halton Catholic District School BoardElementary Review Areas for Education Development Charges
CEB6 BURLINGTON - ALTON
CEB6

Halton Catholic District School BoardEducation Development Charges Submission 2013Form F - Growth Related Pupil Place Requirements
Panel: Elementary Panel
Review Area: CEB6 Burlington - Alton
REQUIREMENTS OF EXISTING COMMUNITY
Current Number Current Year 1 Year 2 Year 3 Year 4 Year 5 Year 6 Year 7 Year 8 Year 9 Year 10 Year 11 Year 12 Year 13 Year 14 Year 15
OTG of Temp 2012/ 2013/ 2014/ 2015/ 2016/ 2017/ 2018/ 2019/ 2020/ 2021/ 2022/ 2023/ 2024/ 2025/ 2026/ 2027/
Capacity Facilities 2013 2014 2015 2016 2017 2018 2019 2020 2021 2022 2023 2024 2025 2026 2027 2028
New Alton Village 622 0 538 561 564 580 600 605 609 598 593 582 580 579 578 576 574 573
TOTAL: 622.0 0 538 561 564 580 600 605 609 598 593 582 580 579 578 576 574 573
AVAILABLE PUPIL PLACES: 49
REQUIREMENTS OF NEW DEVELOPMENT (CUMULATIVE)
Year 1 Year 2 Year 3 Year 4 Year 5 Year 6 Year 7 Year 8 Year 9 Year 10 Year 11 Year 12 Year 13 Year 14 Year 152013/ 2014/ 2015/ 2016/ 2017/ 2018/ 2019/ 2020/ 2021/ 2022/ 2023/ 2024/ 2025/ 2026/ 2027/2014 2015 2016 2017 2018 2019 2020 2021 2022 2023 2024 2025 2026 2027 2028
4 8 12 16 20 23 27 31 35 38 43 48 53 58 63
CALCULATION OF GROWTH-RELATED PUPIL PLACE REQUIREMENTS
1 Requirements of New Development (Pupil Places) 63
2 Available Pupil Places in Existing Facilities 49
3 Net Growth-Related Pupil Place Requirements (1-2) 13
NOTES
15 Year Projections (Assumes Full Day JK/SK)
Existing Schools and Projects
15 Year Projections (Assumes Full Day JK/SK)
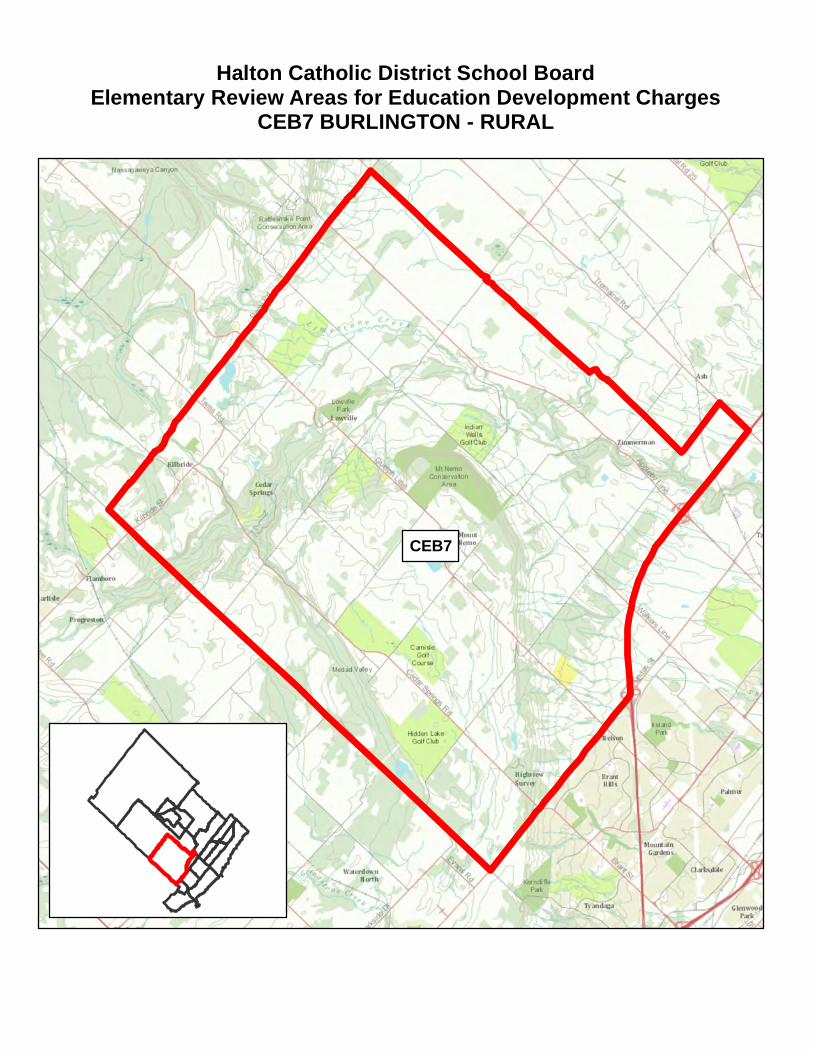
Halton Catholic District School BoardElementary Review Areas for Education Development Charges
CEB7 BURLINGTON - RURAL
CEB7

Halton Catholic District School BoardEducation Development Charges Submission 2013Form F - Growth Related Pupil Place Requirements
Panel: Elementary Panel
Review Area: CEB7 Burlington - Rural
REQUIREMENTS OF EXISTING COMMUNITY
Current Number Current Year 1 Year 2 Year 3 Year 4 Year 5 Year 6 Year 7 Year 8 Year 9 Year 10 Year 11 Year 12 Year 13 Year 14 Year 15
OTG of Temp 2012/ 2013/ 2014/ 2015/ 2016/ 2017/ 2018/ 2019/ 2020/ 2021/ 2022/ 2023/ 2024/ 2025/ 2026/ 2027/
Capacity Facilities 2013 2014 2015 2016 2017 2018 2019 2020 2021 2022 2023 2024 2025 2026 2027 2028
TOTAL: 0.0 0 0 0 0 0 0 0 0 0 0 0 0 0 0 0 0 0
AVAILABLE PUPIL PLACES: -
REQUIREMENTS OF NEW DEVELOPMENT (CUMULATIVE)
Year 1 Year 2 Year 3 Year 4 Year 5 Year 6 Year 7 Year 8 Year 9 Year 10 Year 11 Year 12 Year 13 Year 14 Year 152013/ 2014/ 2015/ 2016/ 2017/ 2018/ 2019/ 2020/ 2021/ 2022/ 2023/ 2024/ 2025/ 2026/ 2027/2014 2015 2016 2017 2018 2019 2020 2021 2022 2023 2024 2025 2026 2027 2028
0 1 1 2 2 2 2 2 3 3 3 3 3 3 3
CALCULATION OF GROWTH-RELATED PUPIL PLACE REQUIREMENTS
1 Requirements of New Development (Pupil Places) 3
2 Available Pupil Places in Existing Facilities 0
3 Net Growth-Related Pupil Place Requirements (1-2) 3
NOTES
15 Year Projection of Average Daily Enrolments
Existing Schools and Projects
15 Year Projection of Average Daily Enrolments
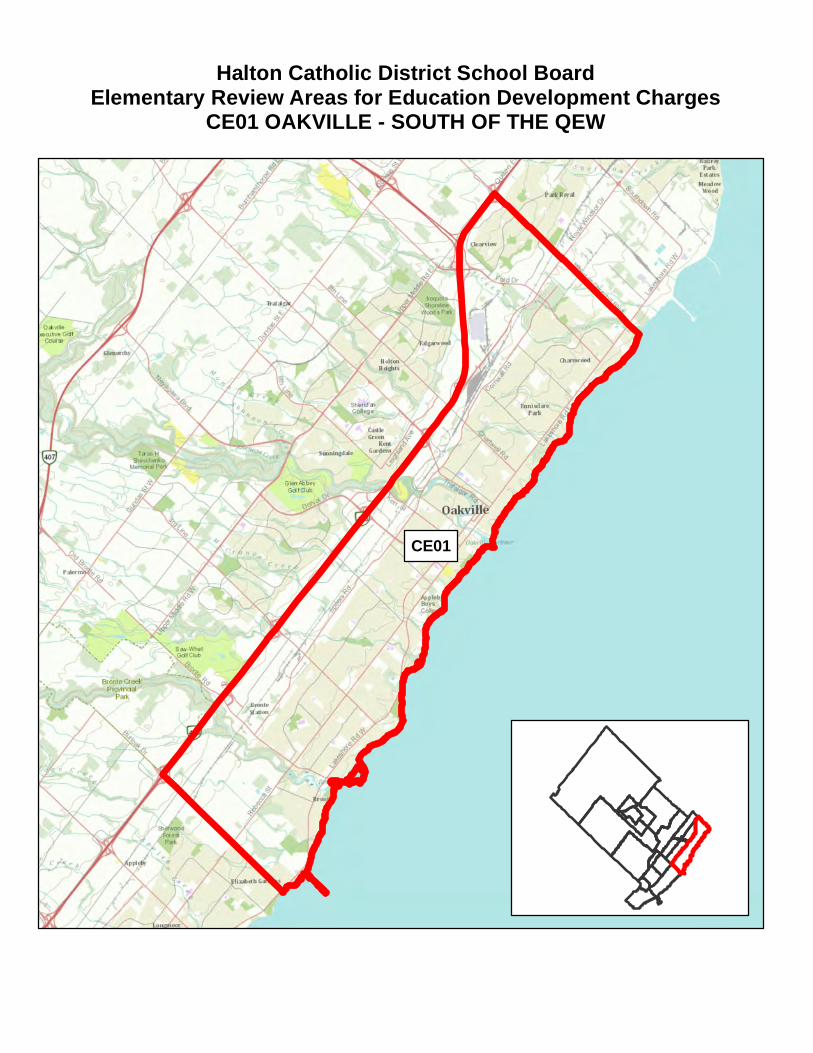
Halton Catholic District School BoardElementary Review Areas for Education Development Charges
CE01 OAKVILLE - SOUTH OF THE QEW
CE01
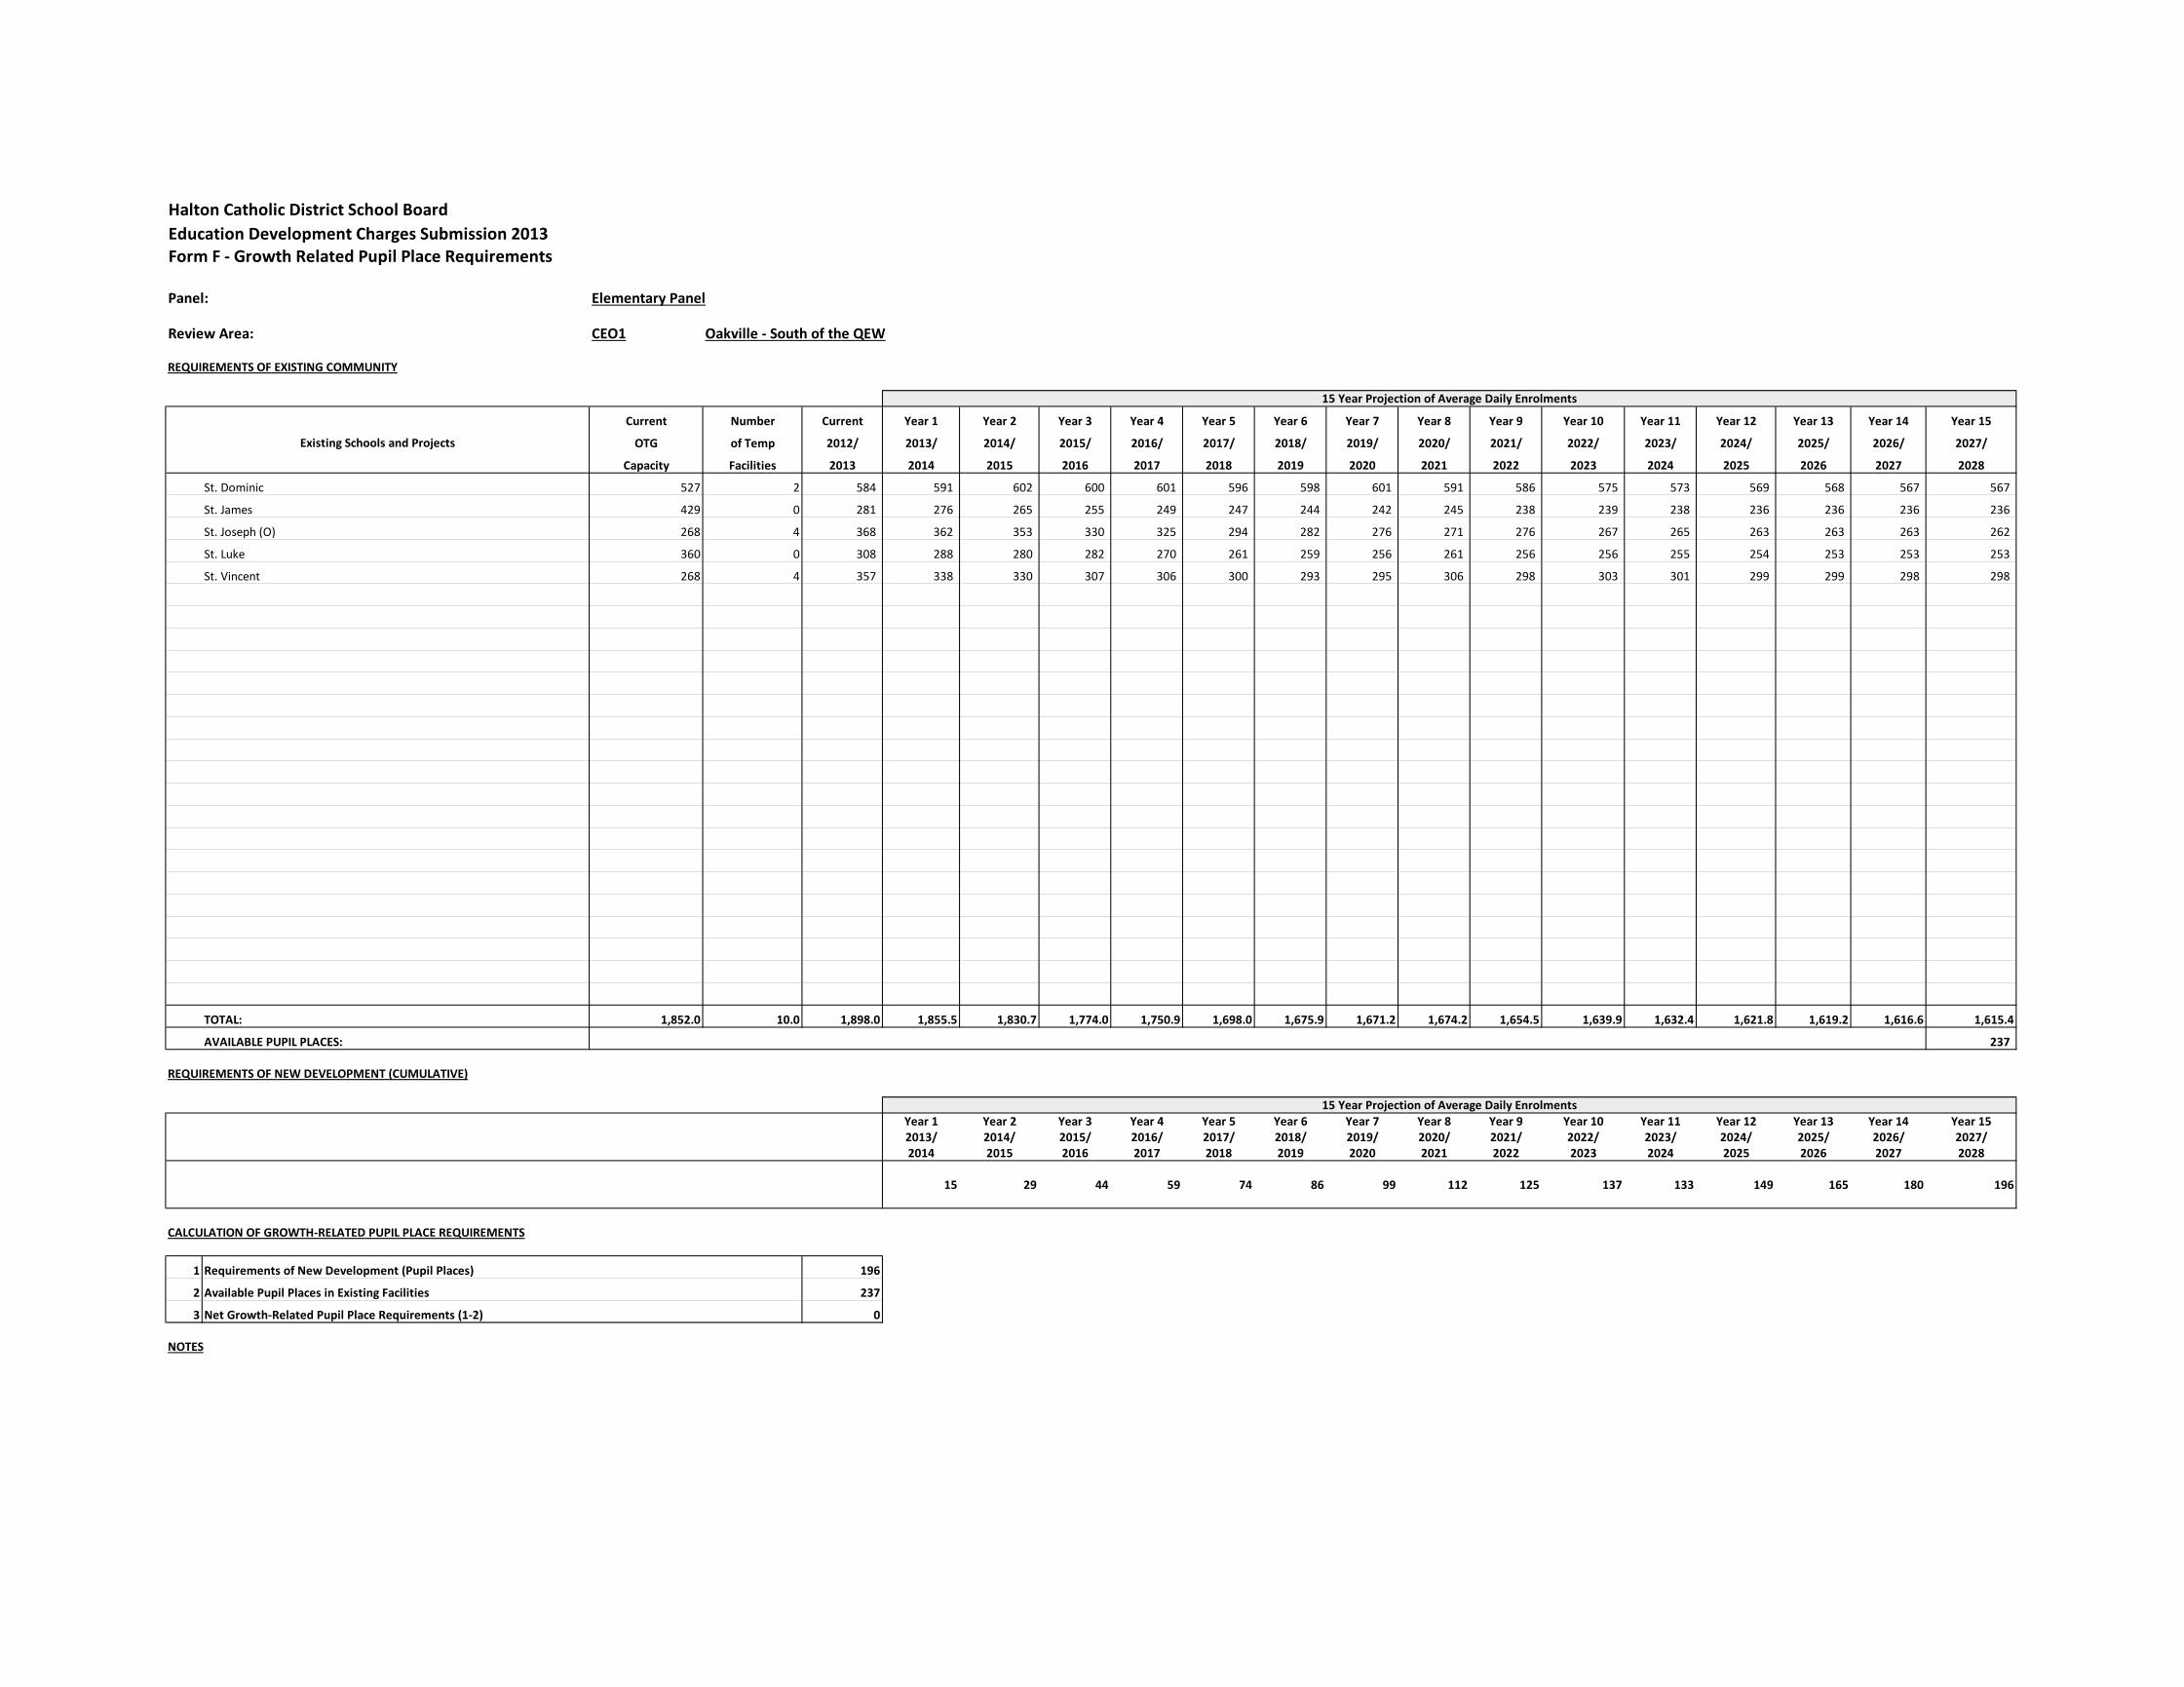
Halton Catholic District School BoardEducation Development Charges Submission 2013Form F - Growth Related Pupil Place Requirements
Panel: Elementary Panel
Review Area: CEO1 Oakville - South of the QEW
REQUIREMENTS OF EXISTING COMMUNITY
Current Number Current Year 1 Year 2 Year 3 Year 4 Year 5 Year 6 Year 7 Year 8 Year 9 Year 10 Year 11 Year 12 Year 13 Year 14 Year 15
OTG of Temp 2012/ 2013/ 2014/ 2015/ 2016/ 2017/ 2018/ 2019/ 2020/ 2021/ 2022/ 2023/ 2024/ 2025/ 2026/ 2027/
Capacity Facilities 2013 2014 2015 2016 2017 2018 2019 2020 2021 2022 2023 2024 2025 2026 2027 2028
St. Dominic 527 2 584 591 602 600 601 596 598 601 591 586 575 573 569 568 567 567
St. James 429 0 281 276 265 255 249 247 244 242 245 238 239 238 236 236 236 236
St. Joseph (O) 268 4 368 362 353 330 325 294 282 276 271 276 267 265 263 263 263 262
St. Luke 360 0 308 288 280 282 270 261 259 256 261 256 256 255 254 253 253 253
St. Vincent 268 4 357 338 330 307 306 300 293 295 306 298 303 301 299 299 298 298
TOTAL: 1,852.0 10.0 1,898.0 1,855.5 1,830.7 1,774.0 1,750.9 1,698.0 1,675.9 1,671.2 1,674.2 1,654.5 1,639.9 1,632.4 1,621.8 1,619.2 1,616.6 1,615.4
AVAILABLE PUPIL PLACES: 237
REQUIREMENTS OF NEW DEVELOPMENT (CUMULATIVE)
Year 1 Year 2 Year 3 Year 4 Year 5 Year 6 Year 7 Year 8 Year 9 Year 10 Year 11 Year 12 Year 13 Year 14 Year 152013/ 2014/ 2015/ 2016/ 2017/ 2018/ 2019/ 2020/ 2021/ 2022/ 2023/ 2024/ 2025/ 2026/ 2027/2014 2015 2016 2017 2018 2019 2020 2021 2022 2023 2024 2025 2026 2027 2028
15 29 44 59 74 86 99 112 125 137 133 149 165 180 196
CALCULATION OF GROWTH-RELATED PUPIL PLACE REQUIREMENTS
1 Requirements of New Development (Pupil Places) 196
2 Available Pupil Places in Existing Facilities 237
3 Net Growth-Related Pupil Place Requirements (1-2) 0
NOTES
15 Year Projection of Average Daily Enrolments
Existing Schools and Projects
15 Year Projection of Average Daily Enrolments
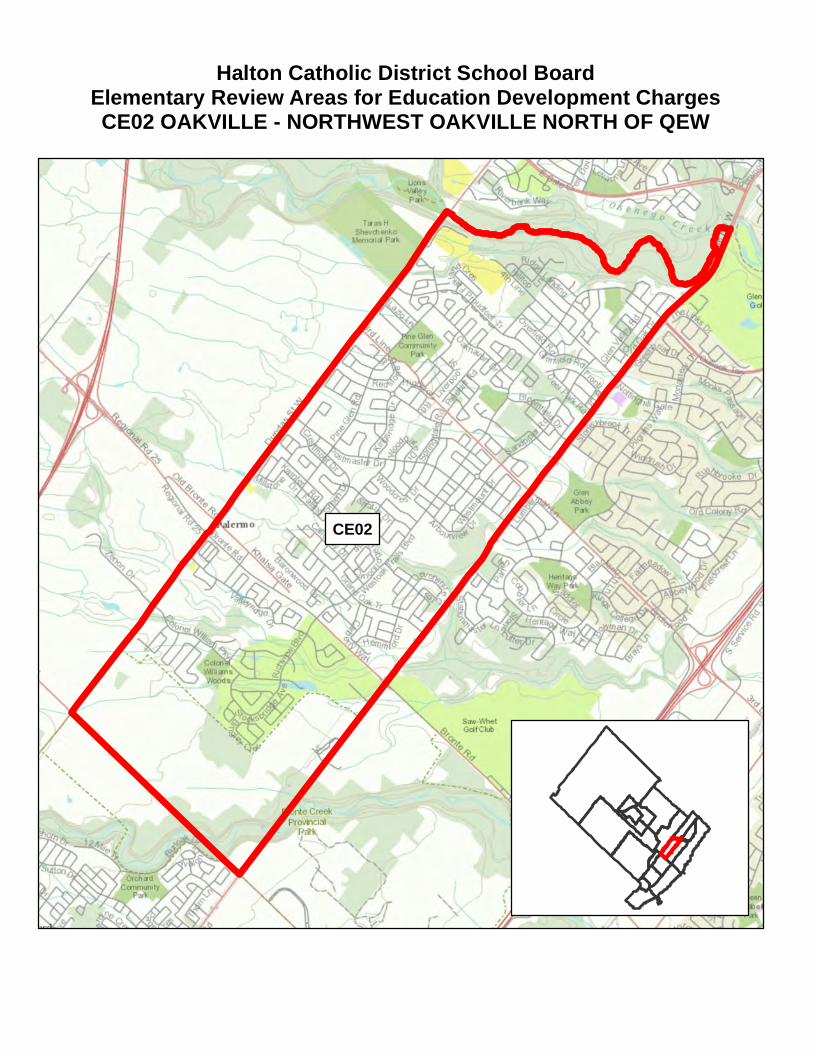
Halton Catholic District School BoardElementary Review Areas for Education Development ChargesCE02 OAKVILLE - NORTHWEST OAKVILLE NORTH OF QEW
CE02

Halton Catholic District School BoardEducation Development Charges Submission 2013Form F - Growth Related Pupil Place Requirements
Panel: Elementary Panel
Review Area: CEO2 Oakville - Northwest Oakville North of QEW
REQUIREMENTS OF EXISTING COMMUNITY
Current Number Current Year 1 Year 2 Year 3 Year 4 Year 5 Year 6 Year 7 Year 8 Year 9 Year 10 Year 11 Year 12 Year 13 Year 14 Year 15
OTG of Temp 2012/ 2013/ 2014/ 2015/ 2016/ 2017/ 2018/ 2019/ 2020/ 2021/ 2022/ 2023/ 2024/ 2025/ 2026/ 2027/
Capacity Facilities 2013 2014 2015 2016 2017 2018 2019 2020 2021 2022 2023 2024 2025 2026 2027 2028
Mother Teresa 547 0 596 555 535 516 490 459 446 432 426 420 421 421 423 425 428 431
Pope John Paul II 570 5 712 713 719 707 702 680 670 662 650 636 637 638 640 644 647 652
St. Joan of Arc 547 1 585 588 582 580 572 563 564 559 555 546 550 551 553 556 559 563
St. Mary 599 0 345 404 454 503 548 584 614 650 676 701 698 698 700 704 708 713
TOTAL: 2,263.0 6 2,238 2,260 2,290 2,305 2,311 2,286 2,294 2,302 2,306 2,303 2,306 2,308 2,316 2,329 2,343 2,359
AVAILABLE PUPIL PLACES: -
REQUIREMENTS OF NEW DEVELOPMENT (CUMULATIVE)
Year 1 Year 2 Year 3 Year 4 Year 5 Year 6 Year 7 Year 8 Year 9 Year 10 Year 11 Year 12 Year 13 Year 14 Year 152013/ 2014/ 2015/ 2016/ 2017/ 2018/ 2019/ 2020/ 2021/ 2022/ 2023/ 2024/ 2025/ 2026/ 2027/2014 2015 2016 2017 2018 2019 2020 2021 2022 2023 2024 2025 2026 2027 2028
15 29 43 57 70 75 81 85 90 94 100 105 110 114 119
CALCULATION OF GROWTH-RELATED PUPIL PLACE REQUIREMENTS
1 Requirements of New Development (Pupil Places) 119
2 Available Pupil Places in Existing Facilities 0
3 Net Growth-Related Pupil Place Requirements (1-2) 119
NOTES
15 Year Projection of Average Daily Enrolments
Existing Schools and Projects
15 Year Projection of Average Daily Enrolments
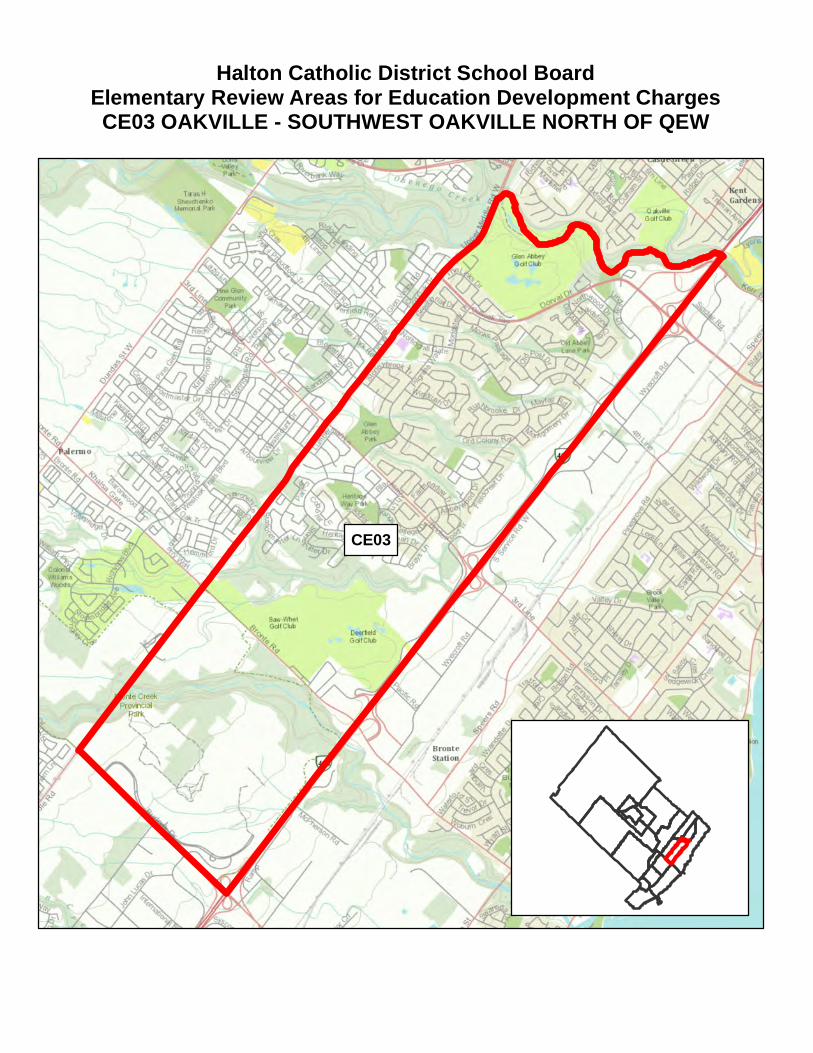
Halton Catholic District School BoardElementary Review Areas for Education Development ChargesCE03 OAKVILLE - SOUTHWEST OAKVILLE NORTH OF QEW
CE03
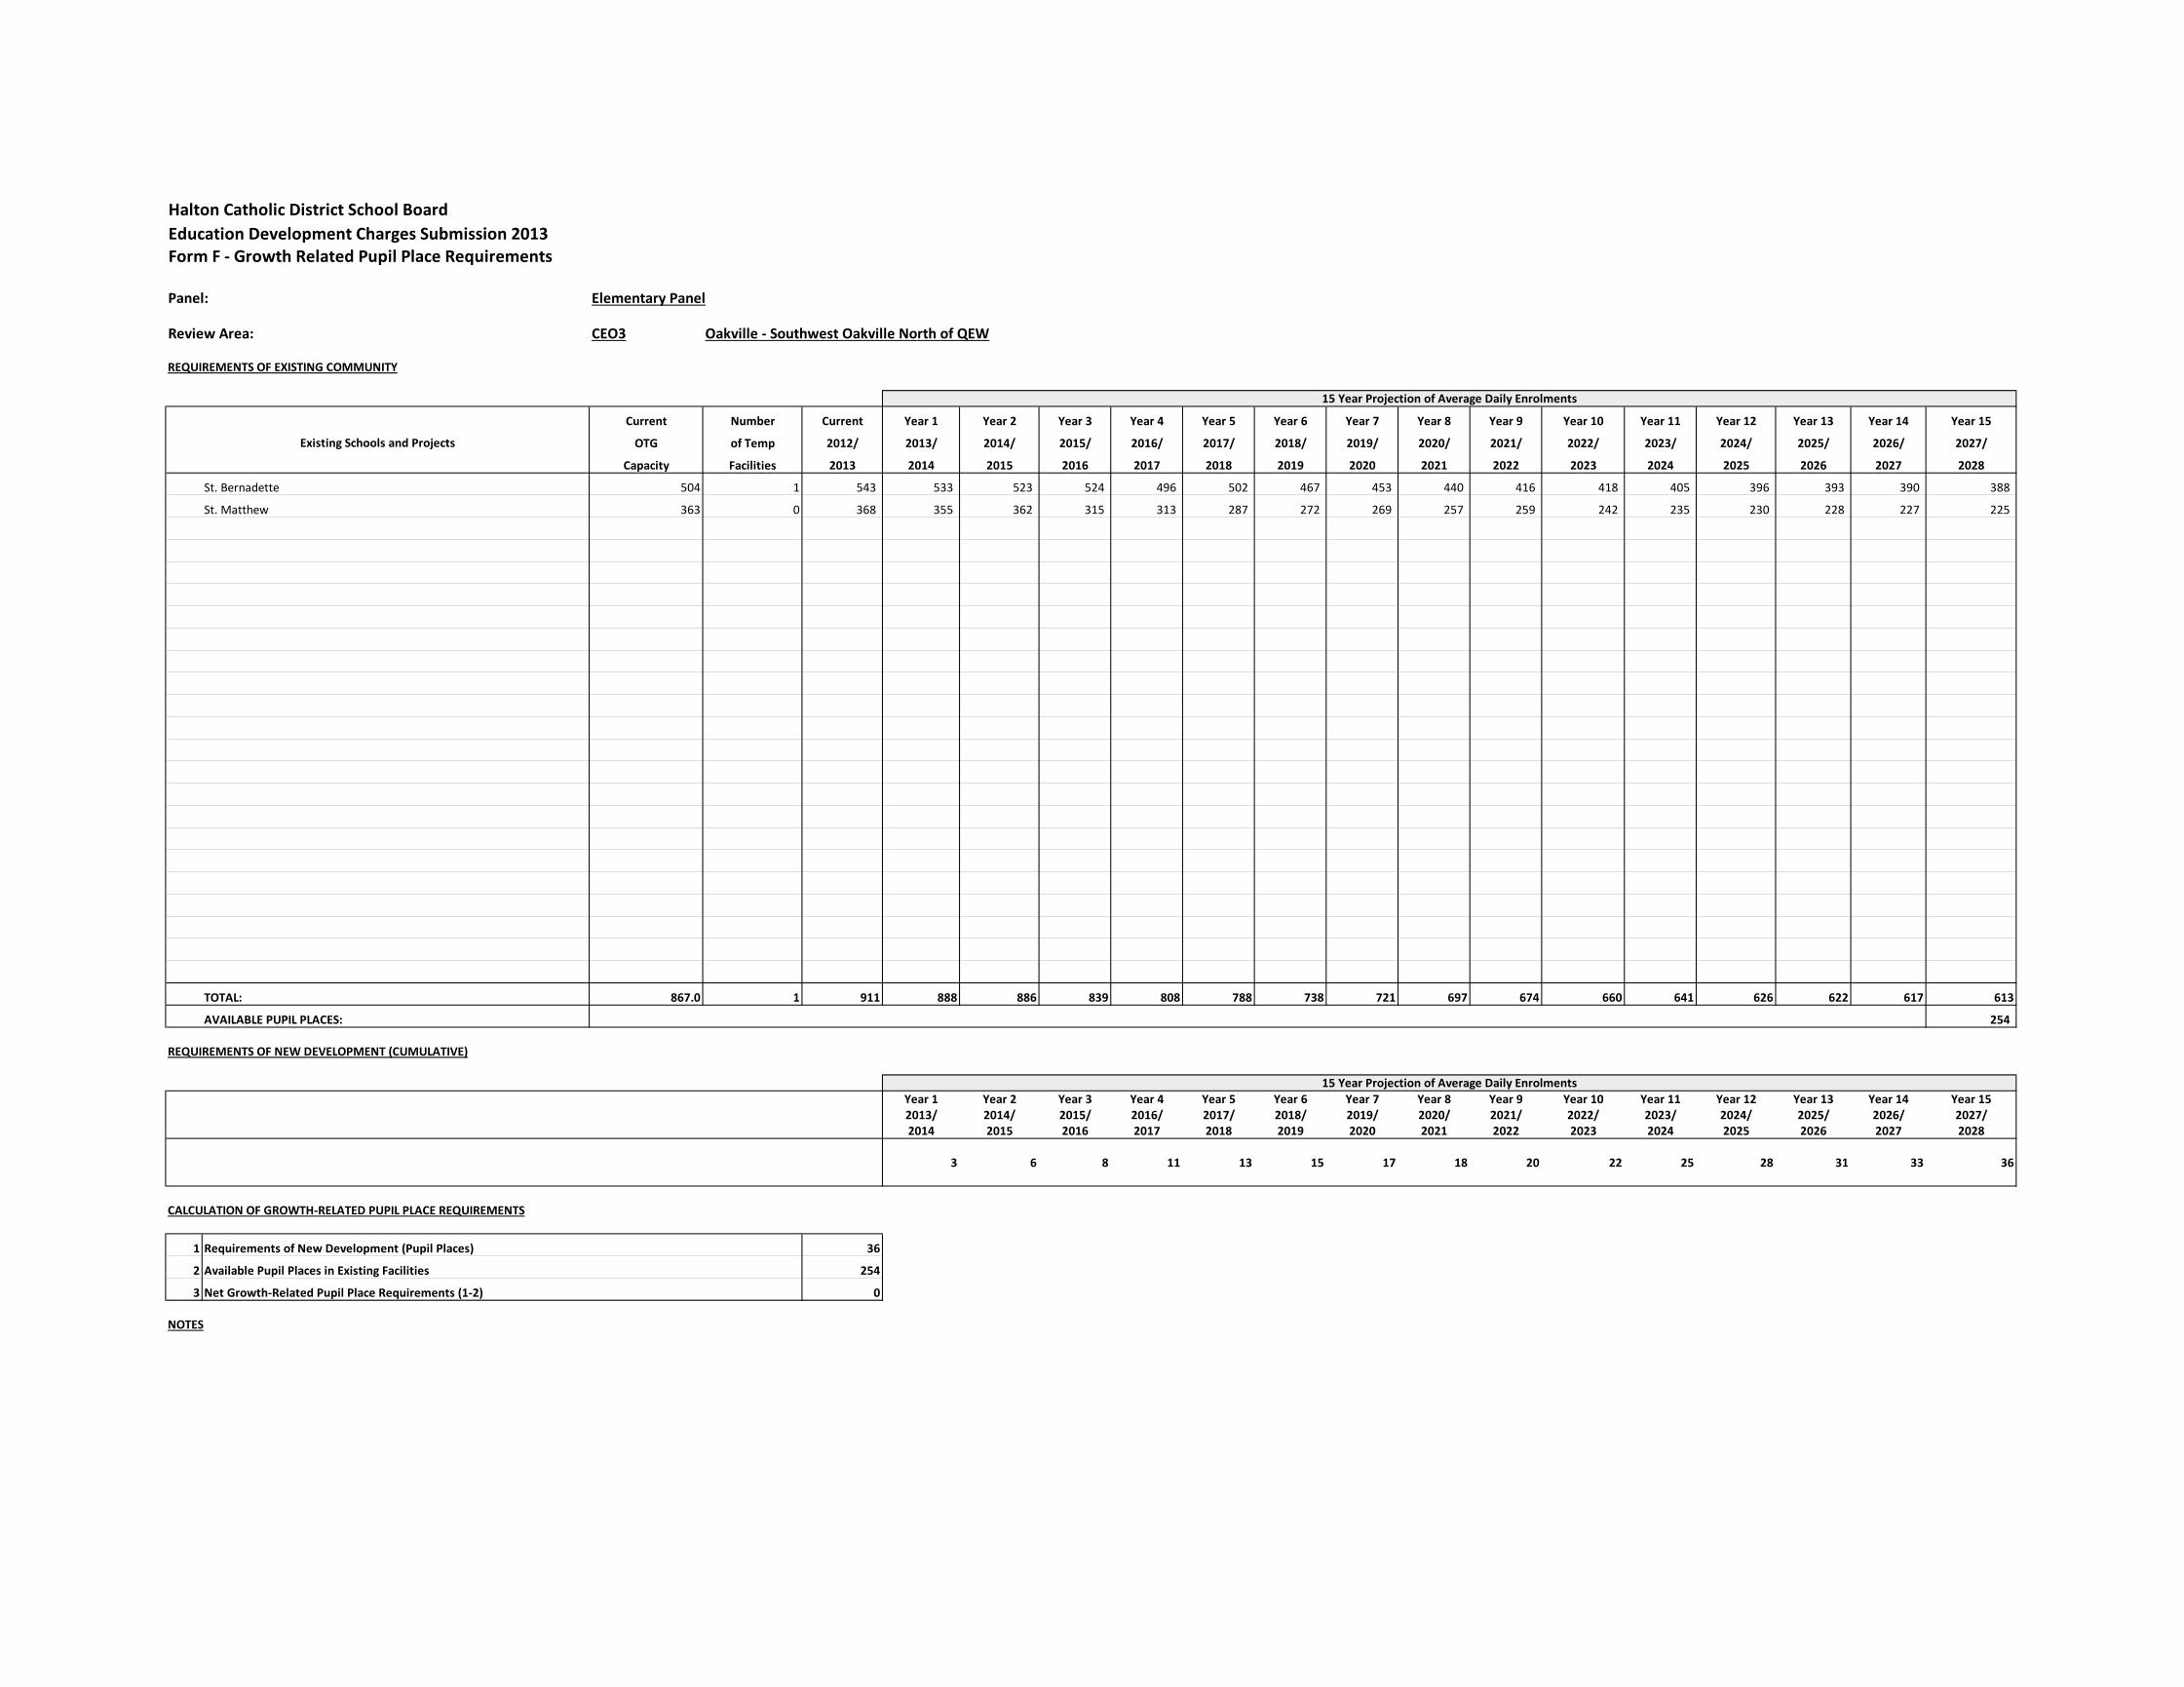
Halton Catholic District School BoardEducation Development Charges Submission 2013Form F - Growth Related Pupil Place Requirements
Panel: Elementary Panel
Review Area: CEO3 Oakville - Southwest Oakville North of QEW
REQUIREMENTS OF EXISTING COMMUNITY
Current Number Current Year 1 Year 2 Year 3 Year 4 Year 5 Year 6 Year 7 Year 8 Year 9 Year 10 Year 11 Year 12 Year 13 Year 14 Year 15
OTG of Temp 2012/ 2013/ 2014/ 2015/ 2016/ 2017/ 2018/ 2019/ 2020/ 2021/ 2022/ 2023/ 2024/ 2025/ 2026/ 2027/
Capacity Facilities 2013 2014 2015 2016 2017 2018 2019 2020 2021 2022 2023 2024 2025 2026 2027 2028
St. Bernadette 504 1 543 533 523 524 496 502 467 453 440 416 418 405 396 393 390 388
St. Matthew 363 0 368 355 362 315 313 287 272 269 257 259 242 235 230 228 227 225
TOTAL: 867.0 1 911 888 886 839 808 788 738 721 697 674 660 641 626 622 617 613
AVAILABLE PUPIL PLACES: 254
REQUIREMENTS OF NEW DEVELOPMENT (CUMULATIVE)
Year 1 Year 2 Year 3 Year 4 Year 5 Year 6 Year 7 Year 8 Year 9 Year 10 Year 11 Year 12 Year 13 Year 14 Year 152013/ 2014/ 2015/ 2016/ 2017/ 2018/ 2019/ 2020/ 2021/ 2022/ 2023/ 2024/ 2025/ 2026/ 2027/2014 2015 2016 2017 2018 2019 2020 2021 2022 2023 2024 2025 2026 2027 2028
3 6 8 11 13 15 17 18 20 22 25 28 31 33 36
CALCULATION OF GROWTH-RELATED PUPIL PLACE REQUIREMENTS
1 Requirements of New Development (Pupil Places) 36
2 Available Pupil Places in Existing Facilities 254
3 Net Growth-Related Pupil Place Requirements (1-2) 0
NOTES
Existing Schools and Projects
15 Year Projection of Average Daily Enrolments
15 Year Projection of Average Daily Enrolments

Halton Catholic District School BoardElementary Review Areas for Education Development Charges
CE04 OAKVILLE - SOUTHEAST OAKVILLE NORTH OF QEW
CE04

Halton Catholic District School BoardEducation Development Charges Submission 2013Form F - Growth Related Pupil Place Requirements
Panel: Elementary Panel
Review Area: CEO4 Oakville - Southeast Oakville North of QEW
REQUIREMENTS OF EXISTING COMMUNITY
Current Number Current Year 1 Year 2 Year 3 Year 4 Year 5 Year 6 Year 7 Year 8 Year 9 Year 10 Year 11 Year 12 Year 13 Year 14 Year 15
OTG of Temp 2012/ 2013/ 2014/ 2015/ 2016/ 2017/ 2018/ 2019/ 2020/ 2021/ 2022/ 2023/ 2024/ 2025/ 2026/ 2027/
Capacity Facilities 2013 2014 2015 2016 2017 2018 2019 2020 2021 2022 2023 2024 2025 2026 2027 2028
Holy Family 291 0 228 221 213 199 191 190 183 180 176 177 180 178 177 178 179 180
St. John (O) 282 0 198 192 187 179 175 176 168 167 167 171 167 164 164 164 165 166
St. Michael 268 0 238 237 233 227 223 212 205 198 197 198 194 191 190 191 192 193
TOTAL: 841.0 0 664 651 633 605 589 578 556 545 540 547 540 532 531 533 536 540
AVAILABLE PUPIL PLACES: 301
REQUIREMENTS OF NEW DEVELOPMENT (CUMULATIVE)
Year 1 Year 2 Year 3 Year 4 Year 5 Year 6 Year 7 Year 8 Year 9 Year 10 Year 11 Year 12 Year 13 Year 14 Year 152013/ 2014/ 2015/ 2016/ 2017/ 2018/ 2019/ 2020/ 2021/ 2022/ 2023/ 2024/ 2025/ 2026/ 2027/2014 2015 2016 2017 2018 2019 2020 2021 2022 2023 2024 2025 2026 2027 2028
2 5 7 9 12 13 13 14 15 16 19 21 24 26 29
CALCULATION OF GROWTH-RELATED PUPIL PLACE REQUIREMENTS
1 Requirements of New Development (Pupil Places) 29
2 Available Pupil Places in Existing Facilities 301
3 Net Growth-Related Pupil Place Requirements (1-2) 0
NOTES11,189 11,026 10,946 10,658 10,544 10,313 10,144 10,020 9,939 9,859 9,785 9,709 9,669 9,659 9,651 9,653
60 119 178 235 292 330 368 405 442 478 505 556 606 656 70511,189 11,086 11,065 10,836 10,779 10,605 10,474 10,387 10,343 10,300 10,263 10,214 10,225 10,266 10,307 10,359
15 Year Projection of Average Daily Enrolments
15 Year Projection of Average Daily Enrolments
Existing Schools and Projects
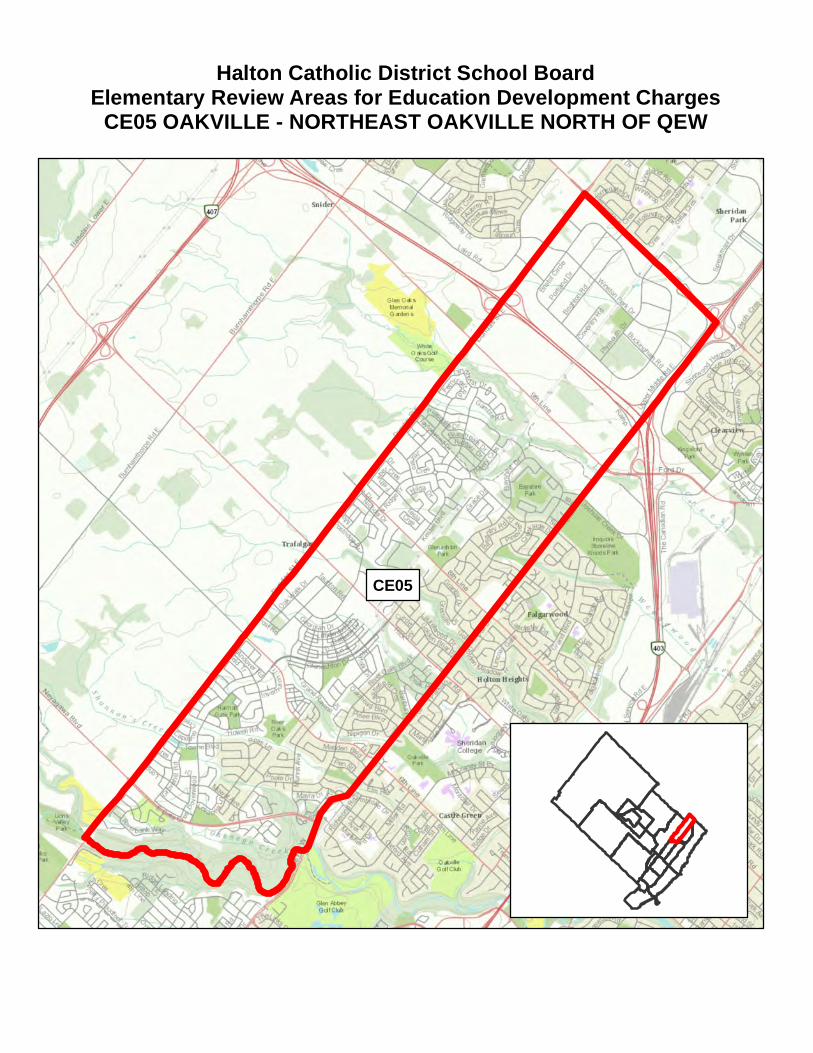
Halton Catholic District School BoardElementary Review Areas for Education Development Charges
CE05 OAKVILLE - NORTHEAST OAKVILLE NORTH OF QEW
CE05

Halton Catholic District School BoardEducation Development Charges Submission 2013Form F - Growth Related Pupil Place Requirements
Panel: Elementary Panel
Review Area: CEO5 Oakville - Northeast Oakville North of QEW
REQUIREMENTS OF EXISTING COMMUNITY
Current Number Current Year 1 Year 2 Year 3 Year 4 Year 5 Year 6 Year 7 Year 8 Year 9 Year 10 Year 11 Year 12 Year 13 Year 14 Year 15
OTG of Temp 2012/ 2013/ 2014/ 2015/ 2016/ 2017/ 2018/ 2019/ 2020/ 2021/ 2022/ 2023/ 2024/ 2025/ 2026/ 2027/
Capacity Facilities 2013 2014 2015 2016 2017 2018 2019 2020 2021 2022 2023 2024 2025 2026 2027 2028
Our Lady of Peace 478 0 508 475 459 437 435 435 440 440 453 452 456 452 450 449 449 449
St. Andrew 573 6 729 719 697 667 637 618 588 563 566 555 537 531 528 528 527 527
St. Marguerite d'Youville 504 3 626 605 570 557 524 489 480 456 450 437 432 427 425 424 424 424
TOTAL: 1,555.0 9 1,863 1,800 1,726 1,661 1,596 1,543 1,508 1,459 1,470 1,444 1,425 1,410 1,402 1,401 1,400 1,400
AVAILABLE PUPIL PLACES: 155
REQUIREMENTS OF NEW DEVELOPMENT (CUMULATIVE)
Year 1 Year 2 Year 3 Year 4 Year 5 Year 6 Year 7 Year 8 Year 9 Year 10 Year 11 Year 12 Year 13 Year 14 Year 152013/ 2014/ 2015/ 2016/ 2017/ 2018/ 2019/ 2020/ 2021/ 2022/ 2023/ 2024/ 2025/ 2026/ 2027/2014 2015 2016 2017 2018 2019 2020 2021 2022 2023 2024 2025 2026 2027 2028
13 25 37 48 60 71 81 91 101 110 122 134 145 156 166
CALCULATION OF GROWTH-RELATED PUPIL PLACE REQUIREMENTS
1 Requirements of New Development (Pupil Places) 166
2 Available Pupil Places in Existing Facilities 155
3 Net Growth-Related Pupil Place Requirements (1-2) 11
NOTES
15 Year Projection of Average Daily Enrolments
Existing Schools and Projects
15 Year Projection of Average Daily Enrolments
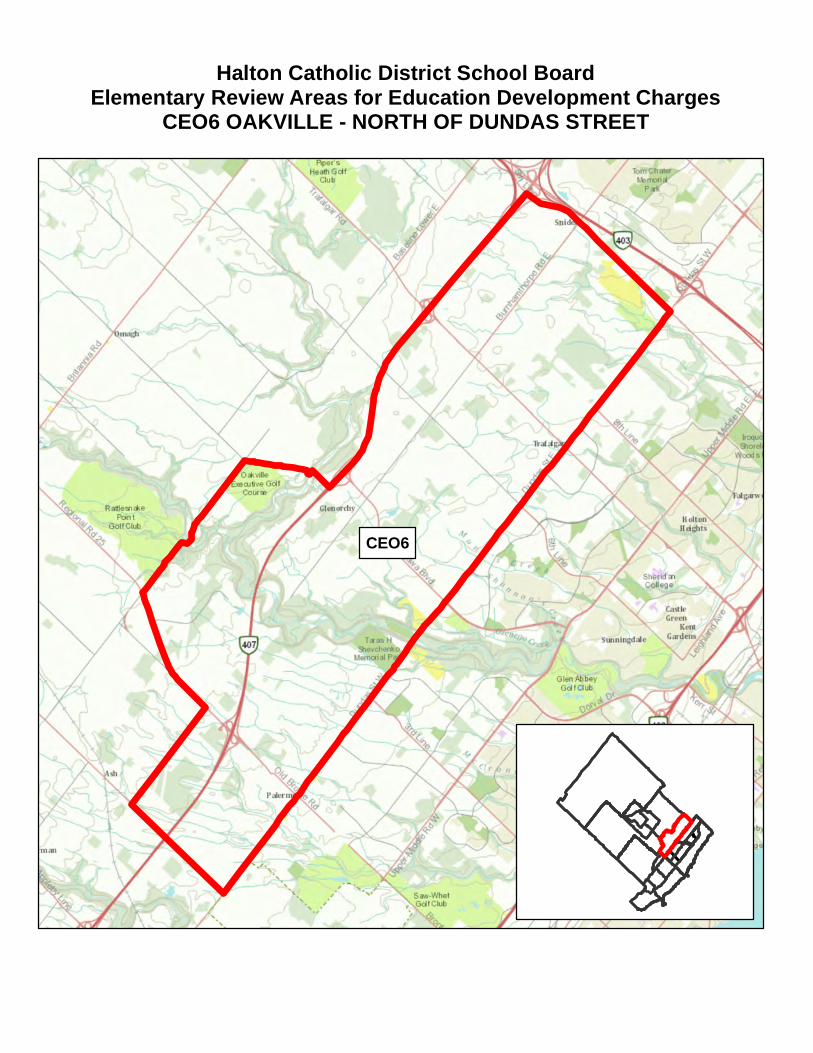
Halton Catholic District School BoardElementary Review Areas for Education Development Charges
CEO6 OAKVILLE - NORTH OF DUNDAS STREET
CEO6

Halton Catholic District School BoardEducation Development Charges Submission 2013Form F - Growth Related Pupil Place Requirements
Panel: Elementary Panel
Review Area: CEO6 Oakville - North of Dundas Street
REQUIREMENTS OF EXISTING COMMUNITY
Current Number Current Year 1 Year 2 Year 3 Year 4 Year 5 Year 6 Year 7 Year 8 Year 9 Year 10 Year 11 Year 12 Year 13 Year 14 Year 15
OTG of Temp 2012/ 2013/ 2014/ 2015/ 2016/ 2017/ 2018/ 2019/ 2020/ 2021/ 2022/ 2023/ 2024/ 2025/ 2026/ 2027/
Capacity Facilities 2013 2014 2015 2016 2017 2018 2019 2020 2021 2022 2023 2024 2025 2026 2027 2028
TOTAL: 0.0 0 0 0 0 0 0 0 0 0 0 0 0 0 0 0 0 0
AVAILABLE PUPIL PLACES: -
REQUIREMENTS OF NEW DEVELOPMENT (CUMULATIVE)
Year 1 Year 2 Year 3 Year 4 Year 5 Year 6 Year 7 Year 8 Year 9 Year 10 Year 11 Year 12 Year 13 Year 14 Year 152013/ 2014/ 2015/ 2016/ 2017/ 2018/ 2019/ 2020/ 2021/ 2022/ 2023/ 2024/ 2025/ 2026/ 2027/2014 2015 2016 2017 2018 2019 2020 2021 2022 2023 2024 2025 2026 2027 2028
138 275 413 550 688 806 924 1043 1161 1279 1332 1384 1437 1490 1542
CALCULATION OF GROWTH-RELATED PUPIL PLACE REQUIREMENTS
1 Requirements of New Development (Pupil Places) 1542
2 Available Pupil Places in Existing Facilities 0
3 Net Growth-Related Pupil Place Requirements (1-2) 1542
NOTES
15 Year Projection of Average Daily Enrolments
Existing Schools and Projects
15 Year Projection of Average Daily Enrolments
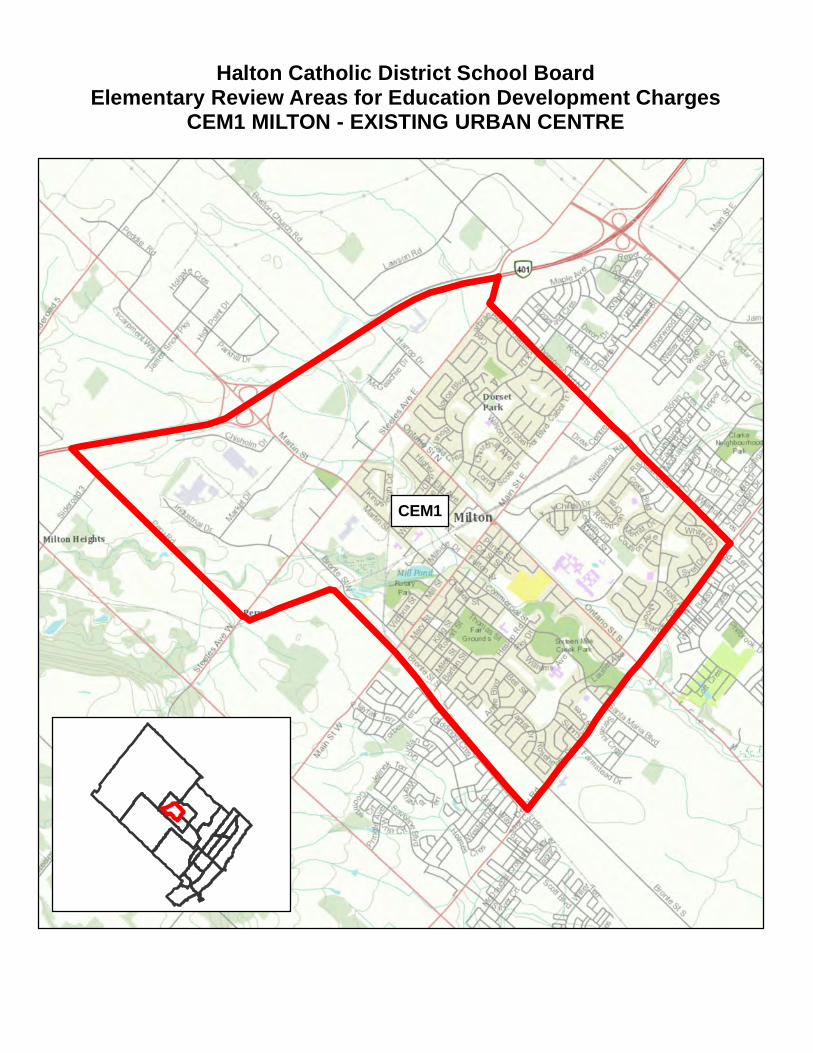
Halton Catholic District School BoardElementary Review Areas for Education Development Charges
CEM1 MILTON - EXISTING URBAN CENTRE
CEM1

Halton Catholic District School BoardEducation Development Charges Submission 2013Form F - Growth Related Pupil Place Requirements
Panel: Elementary Panel
Review Area: CEM1 Milton - Existing Urban Centre
REQUIREMENTS OF EXISTING COMMUNITY
Current Number Current Year 1 Year 2 Year 3 Year 4 Year 5 Year 6 Year 7 Year 8 Year 9 Year 10 Year 11 Year 12 Year 13 Year 14 Year 15
OTG of Temp 2012/ 2013/ 2014/ 2015/ 2016/ 2017/ 2018/ 2019/ 2020/ 2021/ 2022/ 2023/ 2024/ 2025/ 2026/ 2027/
Capacity Facilities 2013 2014 2015 2016 2017 2018 2019 2020 2021 2022 2023 2024 2025 2026 2027 2028
Holy Rosary (M) 383 0 355 343 338 319 321 320 301 292 281 280 274 276 276 275 274 273
Our Lady of Victory 291 1 304 308 305 310 313 317 319 316 310 314 308 311 310 309 307 306
St. Peter 619 4 709 727 760 775 801 819 824 837 836 837 828 834 833 829 826 823
TOTAL: 1,293.0 5 1,368 1,379 1,403 1,404 1,435 1,456 1,444 1,445 1,428 1,431 1,410 1,421 1,419 1,413 1,407 1,402
AVAILABLE PUPIL PLACES: 0
REQUIREMENTS OF NEW DEVELOPMENT (CUMULATIVE)
Year 1 Year 2 Year 3 Year 4 Year 5 Year 6 Year 7 Year 8 Year 9 Year 10 Year 11 Year 12 Year 13 Year 14 Year 152013/ 2014/ 2015/ 2016/ 2017/ 2018/ 2019/ 2020/ 2021/ 2022/ 2023/ 2024/ 2025/ 2026/ 2027/2014 2015 2016 2017 2018 2019 2020 2021 2022 2023 2024 2025 2026 2027 2028
15 29 43 57 70 86 101 115 129 143 154 164 174 184 194
CALCULATION OF GROWTH-RELATED PUPIL PLACE REQUIREMENTS
1 Requirements of New Development (Pupil Places) 194
2 Available Pupil Places in Existing Facilities 0
3 Net Growth-Related Pupil Place Requirements (1-2) 194
NOTES
15 Year Projection of Average Daily Enrolments
Existing Schools and Projects
15 Year Projection of Average Daily Enrolments
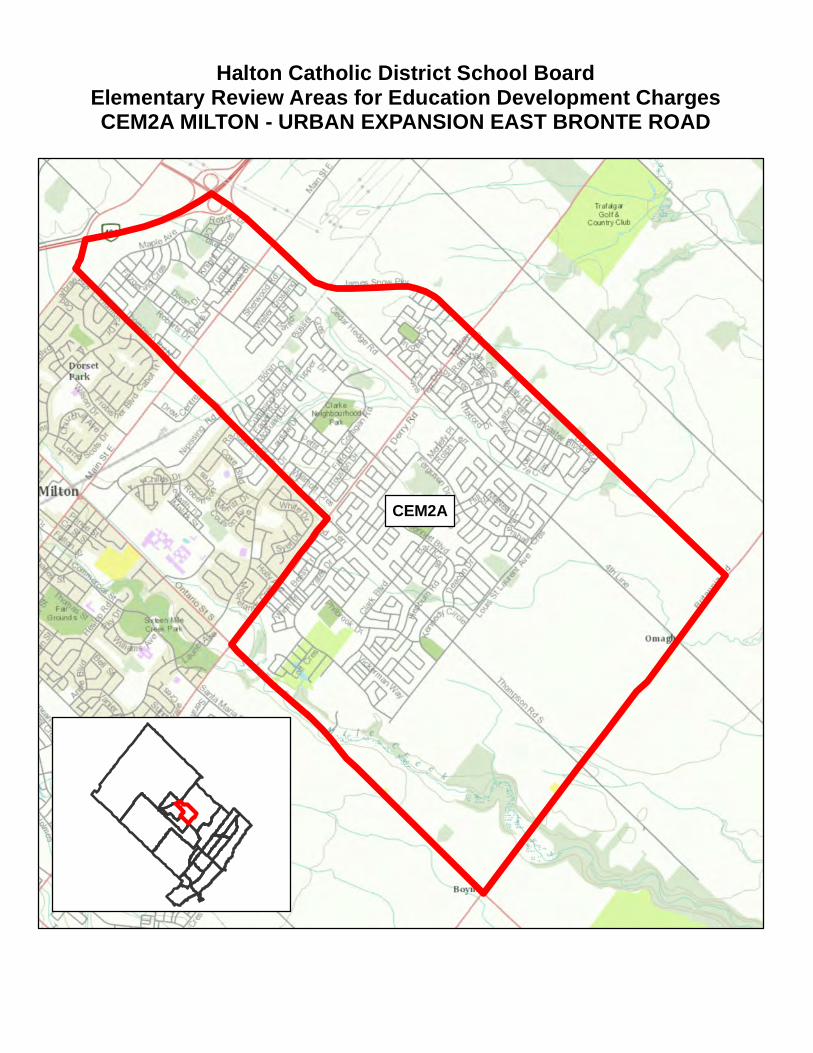
Halton Catholic District School BoardElementary Review Areas for Education Development ChargesCEM2A MILTON - URBAN EXPANSION EAST BRONTE ROAD
CEM2A

Halton Catholic District School BoardEducation Development Charges Submission 2013Form F - Growth Related Pupil Place Requirements
Panel: Elementary Panel
Review Area: CEM2A Milton - Urban Expansion East of Bronte Road
REQUIREMENTS OF EXISTING COMMUNITY
Current Number Current Year 1 Year 2 Year 3 Year 4 Year 5 Year 6 Year 7 Year 8 Year 9 Year 10 Year 11 Year 12 Year 13 Year 14 Year 15
OTG of Temp 2012/ 2013/ 2014/ 2015/ 2016/ 2017/ 2018/ 2019/ 2020/ 2021/ 2022/ 2023/ 2024/ 2025/ 2026/ 2027/
Capacity Facilities 2013 2014 2015 2016 2017 2018 2019 2020 2021 2022 2023 2024 2025 2026 2027 2028
Guardian Angels 570 10 843 809 827 826 815 811 816 791 780 765 776 776 777 782 786 789
Our Lady of Fatima 648 6 823 902 942 969 975 1,013 1,029 1,075 1,080 1,070 1,068 1,065 1,067 1,073 1,079 1,084
St. Anthony of Padua 570 3 694 744 794 832 862 879 894 912 910 924 916 915 917 922 927 931
TOTAL: 1,788.0 19 2,360 2,455 2,563 2,628 2,653 2,703 2,739 2,778 2,770 2,759 2,760 2,756 2,761 2,776 2,792 2,805
AVAILABLE PUPIL PLACES: 0
REQUIREMENTS OF NEW DEVELOPMENT (CUMULATIVE)
Year 1 Year 2 Year 3 Year 4 Year 5 Year 6 Year 7 Year 8 Year 9 Year 10 Year 11 Year 12 Year 13 Year 14 Year 152013/ 2014/ 2015/ 2016/ 2017/ 2018/ 2019/ 2020/ 2021/ 2022/ 2023/ 2024/ 2025/ 2026/ 2027/2014 2015 2016 2017 2018 2019 2020 2021 2022 2023 2024 2025 2026 2027 2028
121 239 353 465 573 673 770 864 954 1042 1064 1084 1103 1121 1138
CALCULATION OF GROWTH-RELATED PUPIL PLACE REQUIREMENTS
1 Requirements of New Development (Pupil Places) 1138
2 Available Pupil Places in Existing Facilities 0
3 Net Growth-Related Pupil Place Requirements (1-2) 1138
NOTES
15 Year Projection of Average Daily Enrolments
15 Year Projection of Average Daily Enrolments
Existing Schools and Projects
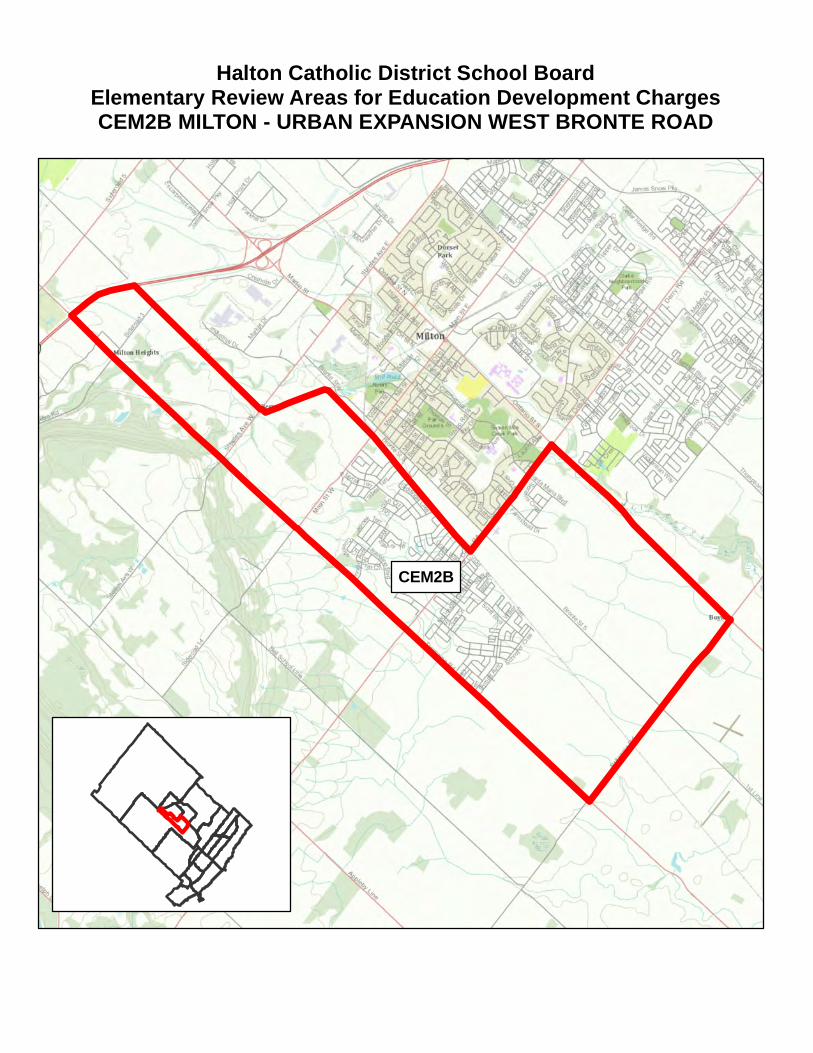
Halton Catholic District School BoardElementary Review Areas for Education Development ChargesCEM2B MILTON - URBAN EXPANSION WEST BRONTE ROAD
CEM2B

Halton Catholic District School BoardEducation Development Charges Submission 2013Form F - Growth Related Pupil Place Requirements
Panel: Elementary Panel
Review Area: CEM2B Milton - Urban Expansion West of Bronte Road
REQUIREMENTS OF EXISTING COMMUNITY
Current Number Current Year 1 Year 2 Year 3 Year 4 Year 5 Year 6 Year 7 Year 8 Year 9 Year 10 Year 11 Year 12 Year 13 Year 14 Year 15
OTG of Temp 2012/ 2013/ 2014/ 2015/ 2016/ 2017/ 2018/ 2019/ 2020/ 2021/ 2022/ 2023/ 2024/ 2025/ 2026/ 2027/
Capacity Facilities 2013 2014 2015 2016 2017 2018 2019 2020 2021 2022 2023 2024 2025 2026 2027 2028
Lumen Christi 648 7 790 860 919 991 1,051 1,096 1,132 1,142 1,142 1,116 1,098 1,096 1,097 1,081 1,064 1,046
New Milton #5 671 0 - - - - - - - - - - - - - - - -
New Milton #7 671 0 - - - - - - - - - - - - - - - -
TOTAL: 1,990.0 7 790 860 919 991 1,051 1,096 1,132 1,142 1,142 1,116 1,098 1,096 1,097 1,081 1,064 1,046
AVAILABLE PUPIL PLACES: 944
REQUIREMENTS OF NEW DEVELOPMENT (CUMULATIVE)
Year 1 Year 2 Year 3 Year 4 Year 5 Year 6 Year 7 Year 8 Year 9 Year 10 Year 11 Year 12 Year 13 Year 14 Year 152013/ 2014/ 2015/ 2016/ 2017/ 2018/ 2019/ 2020/ 2021/ 2022/ 2023/ 2024/ 2025/ 2026/ 2027/2014 2015 2016 2017 2018 2019 2020 2021 2022 2023 2024 2025 2026 2027 2028
154 304 449 591 728 787 843 898 950 1001 990 979 968 958 947
CALCULATION OF GROWTH-RELATED PUPIL PLACE REQUIREMENTS
1 Requirements of New Development (Pupil Places) 947
2 Available Pupil Places in Existing Facilities 944
3 Net Growth-Related Pupil Place Requirements (1-2) 3
NOTES
15 Year Projection of Average Daily Enrolments
Existing Schools and Projects
15 Year Projection of Average Daily Enrolments
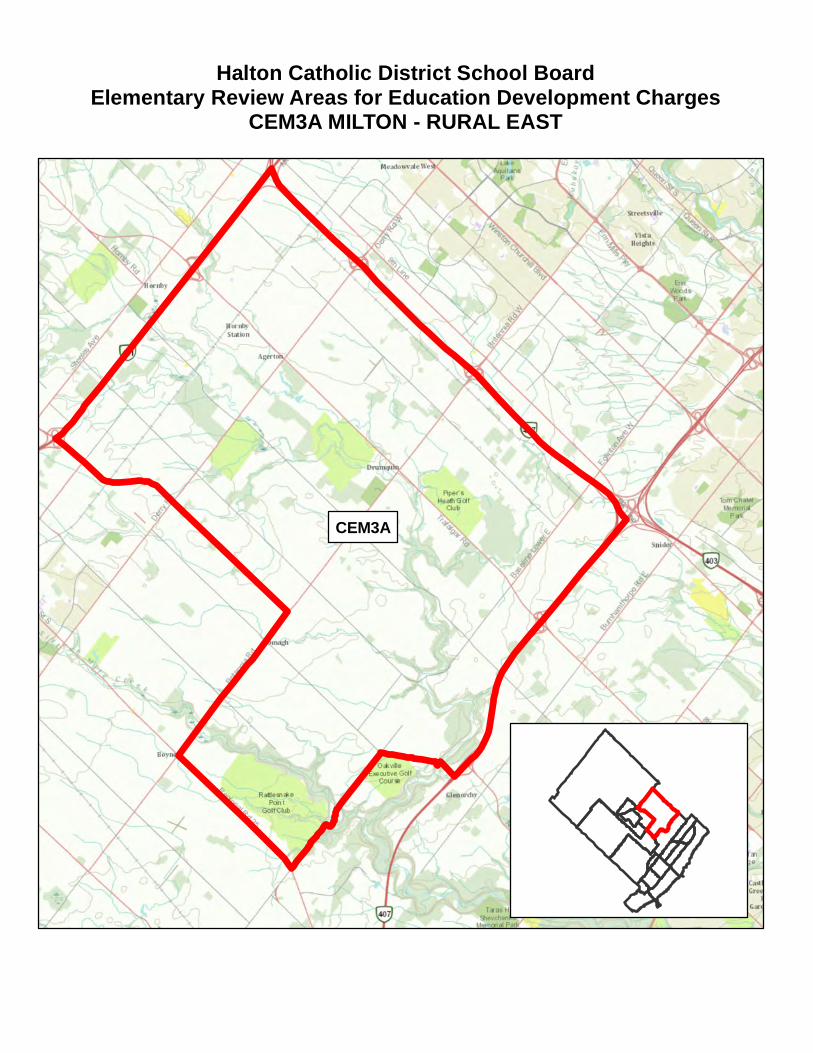
Halton Catholic District School BoardElementary Review Areas for Education Development Charges
CEM3A MILTON - RURAL EAST
CEM3A
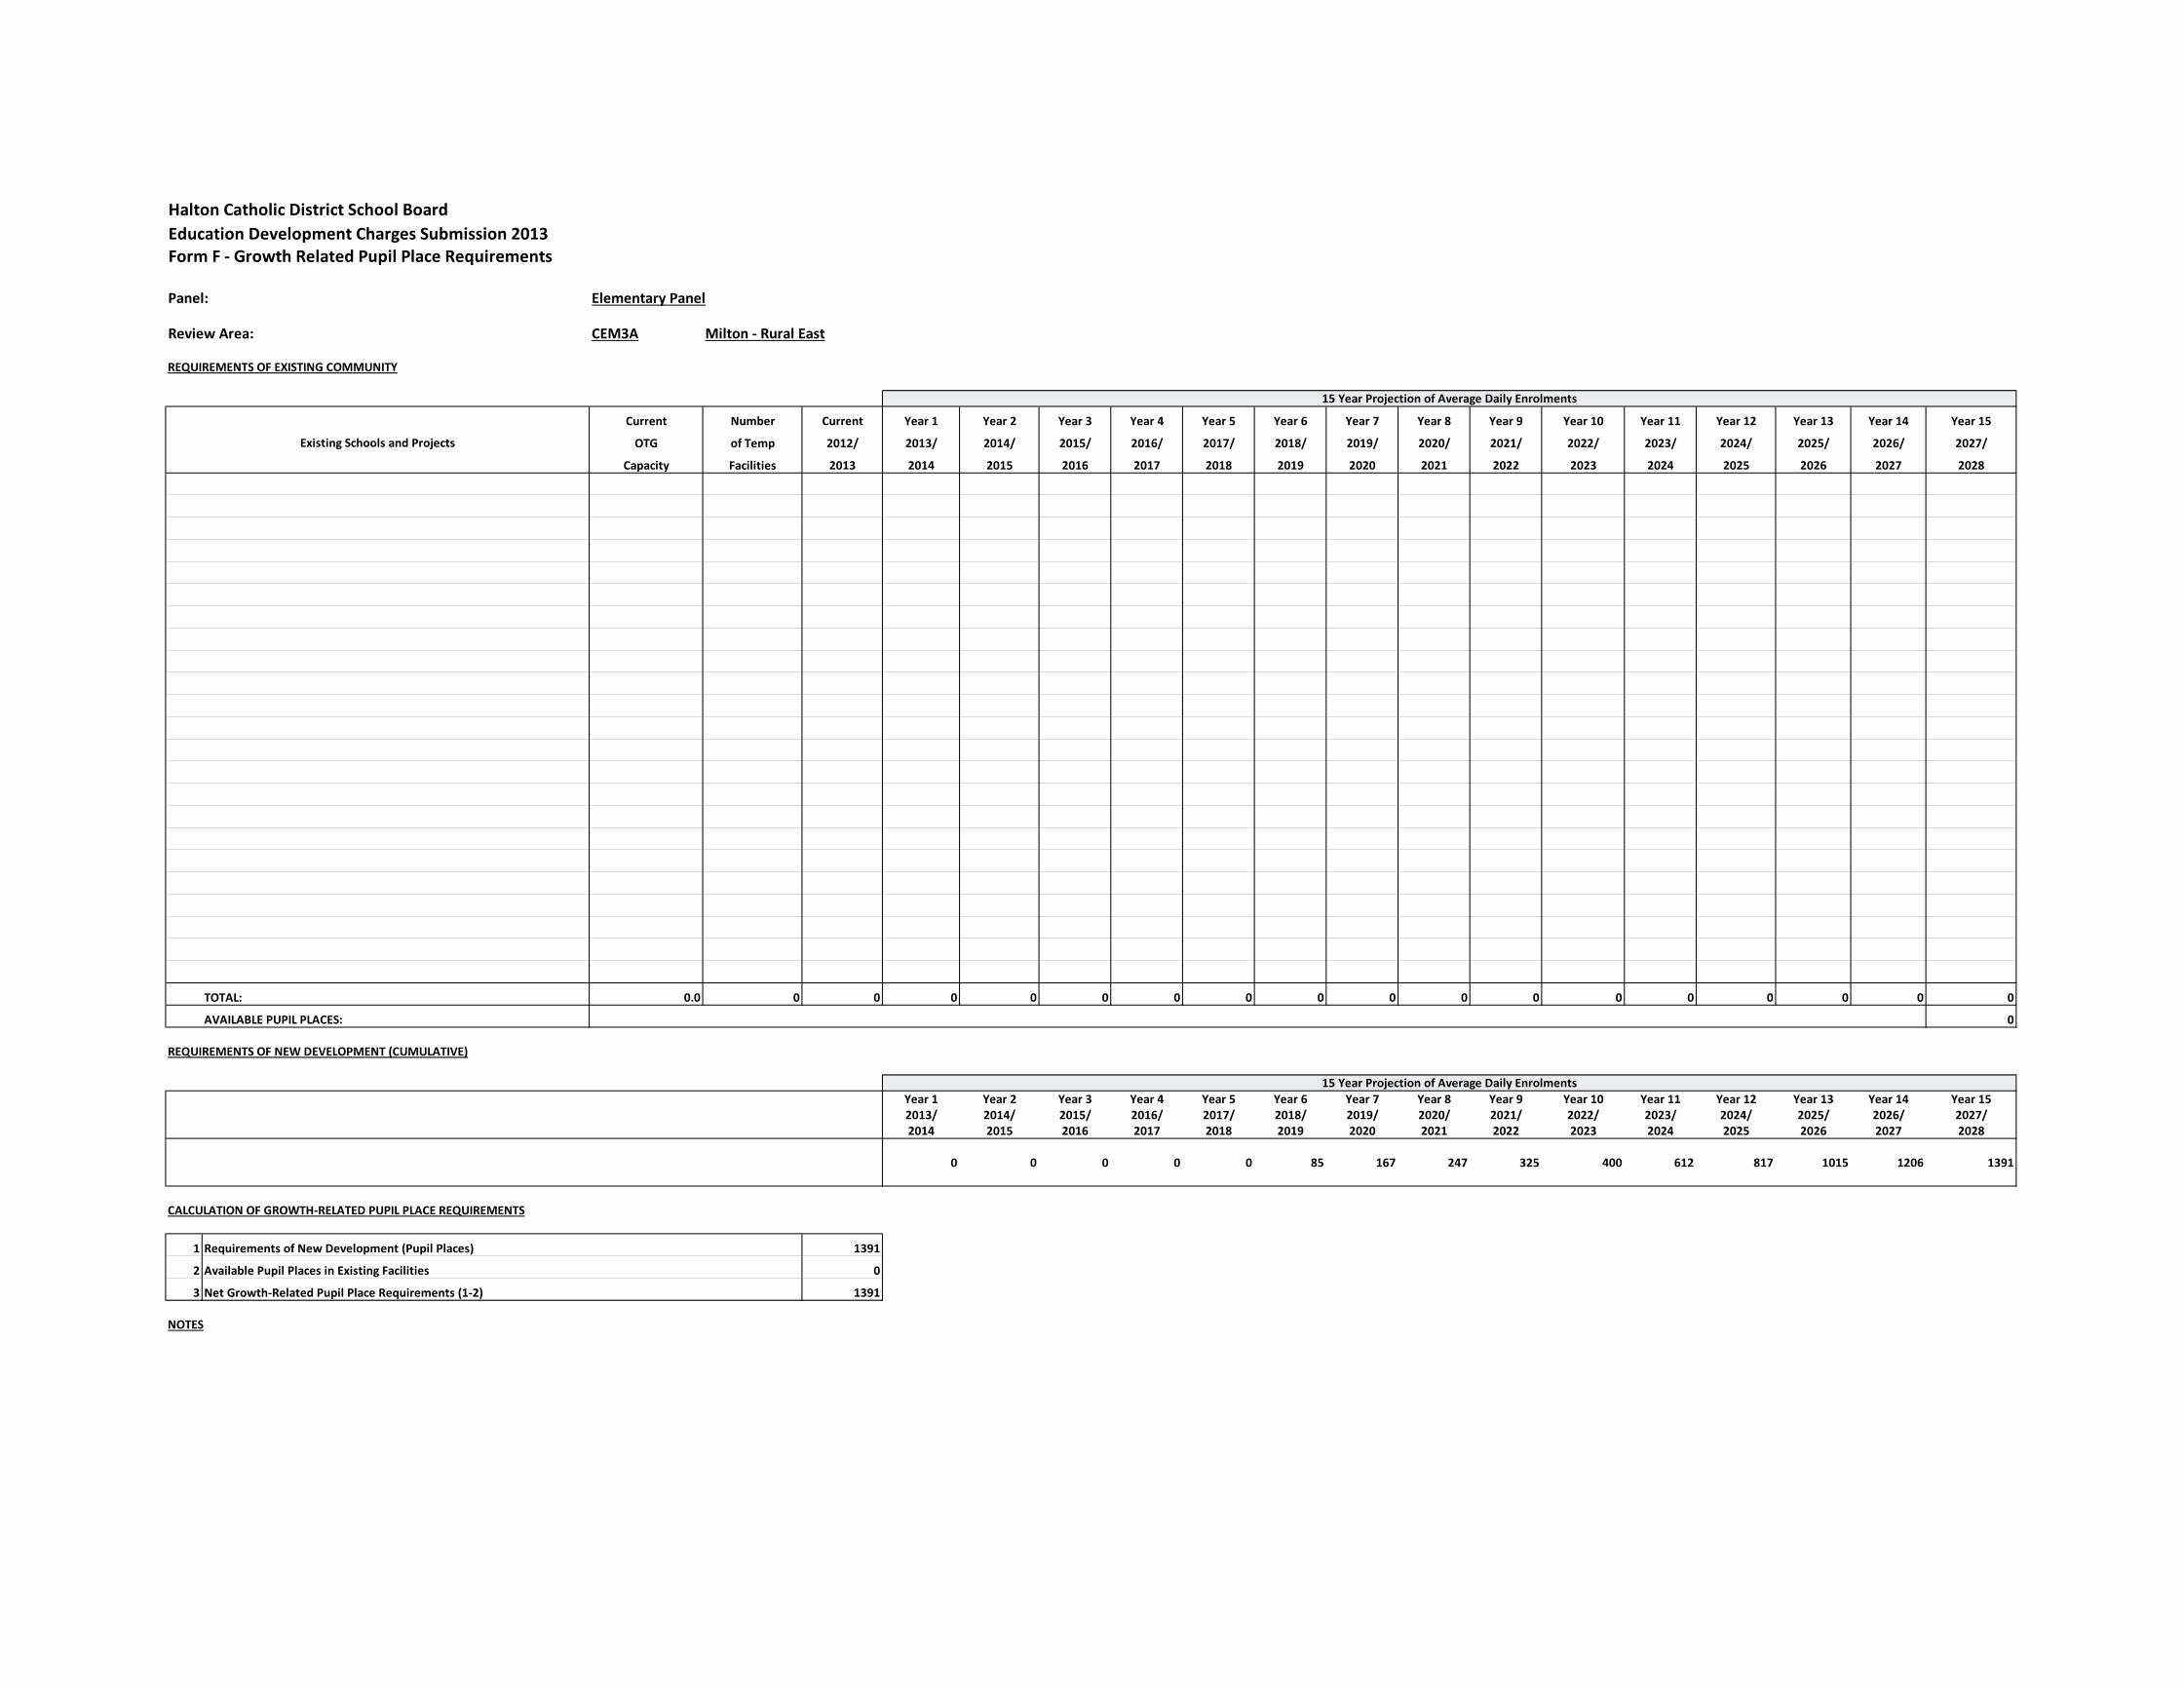
Halton Catholic District School BoardEducation Development Charges Submission 2013Form F - Growth Related Pupil Place Requirements
Panel: Elementary Panel
Review Area: CEM3A Milton - Rural East
REQUIREMENTS OF EXISTING COMMUNITY
Current Number Current Year 1 Year 2 Year 3 Year 4 Year 5 Year 6 Year 7 Year 8 Year 9 Year 10 Year 11 Year 12 Year 13 Year 14 Year 15
OTG of Temp 2012/ 2013/ 2014/ 2015/ 2016/ 2017/ 2018/ 2019/ 2020/ 2021/ 2022/ 2023/ 2024/ 2025/ 2026/ 2027/
Capacity Facilities 2013 2014 2015 2016 2017 2018 2019 2020 2021 2022 2023 2024 2025 2026 2027 2028
TOTAL: 0.0 0 0 0 0 0 0 0 0 0 0 0 0 0 0 0 0 0
AVAILABLE PUPIL PLACES: 0
REQUIREMENTS OF NEW DEVELOPMENT (CUMULATIVE)
Year 1 Year 2 Year 3 Year 4 Year 5 Year 6 Year 7 Year 8 Year 9 Year 10 Year 11 Year 12 Year 13 Year 14 Year 152013/ 2014/ 2015/ 2016/ 2017/ 2018/ 2019/ 2020/ 2021/ 2022/ 2023/ 2024/ 2025/ 2026/ 2027/2014 2015 2016 2017 2018 2019 2020 2021 2022 2023 2024 2025 2026 2027 2028
0 0 0 0 0 85 167 247 325 400 612 817 1015 1206 1391
CALCULATION OF GROWTH-RELATED PUPIL PLACE REQUIREMENTS
1 Requirements of New Development (Pupil Places) 1391
2 Available Pupil Places in Existing Facilities 0
3 Net Growth-Related Pupil Place Requirements (1-2) 1391
NOTES
15 Year Projection of Average Daily Enrolments
Existing Schools and Projects
15 Year Projection of Average Daily Enrolments
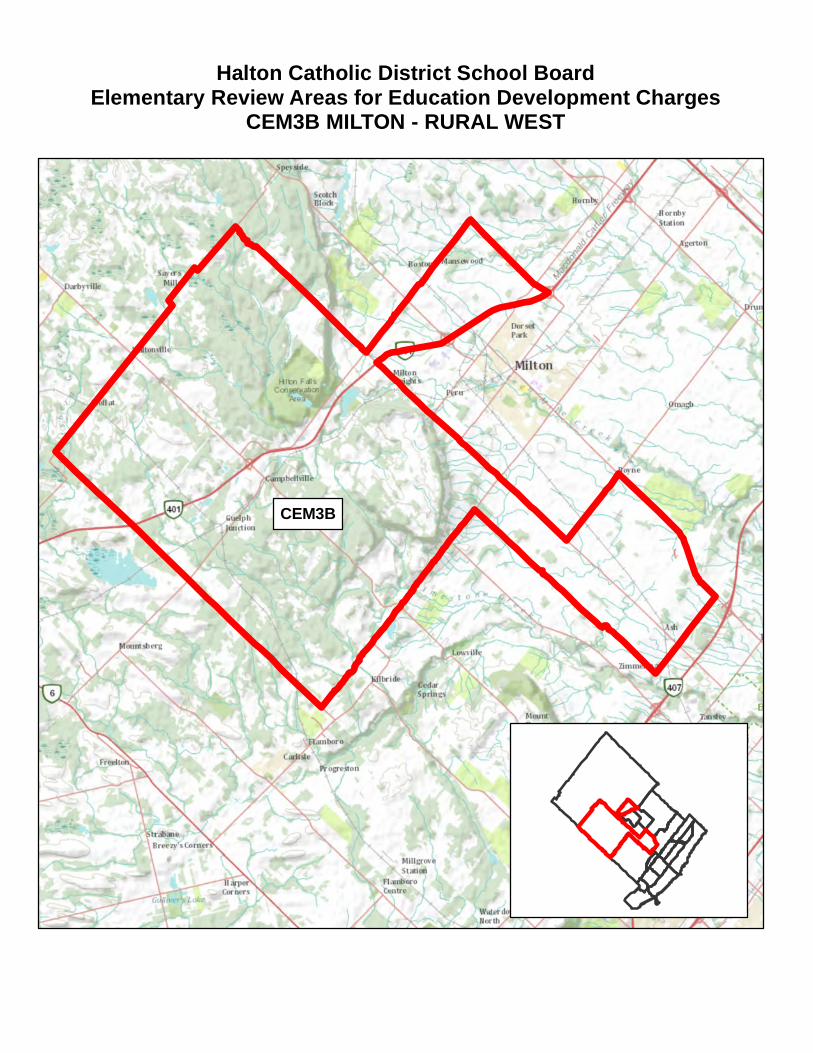
Halton Catholic District School BoardElementary Review Areas for Education Development Charges
CEM3B MILTON - RURAL WEST
CEM3B

Halton Catholic District School BoardEducation Development Charges Submission 2013Form F - Growth Related Pupil Place Requirements
Panel: Elementary Panel
Review Area: CEM3B Milton - Rural West
REQUIREMENTS OF EXISTING COMMUNITY
Current Number Current Year 1 Year 2 Year 3 Year 4 Year 5 Year 6 Year 7 Year 8 Year 9 Year 10 Year 11 Year 12 Year 13 Year 14 Year 15
OTG of Temp 2012/ 2013/ 2014/ 2015/ 2016/ 2017/ 2018/ 2019/ 2020/ 2021/ 2022/ 2023/ 2024/ 2025/ 2026/ 2027/
Capacity Facilities 2013 2014 2015 2016 2017 2018 2019 2020 2021 2022 2023 2024 2025 2026 2027 2028
TOTAL: 0.0 0 0 0 0 0 0 0 0 0 0 0 0 0 0 0 0 0
AVAILABLE PUPIL PLACES: 0
REQUIREMENTS OF NEW DEVELOPMENT (CUMULATIVE)
Year 1 Year 2 Year 3 Year 4 Year 5 Year 6 Year 7 Year 8 Year 9 Year 10 Year 11 Year 12 Year 13 Year 14 Year 152013/ 2014/ 2015/ 2016/ 2017/ 2018/ 2019/ 2020/ 2021/ 2022/ 2023/ 2024/ 2025/ 2026/ 2027/2014 2015 2016 2017 2018 2019 2020 2021 2022 2023 2024 2025 2026 2027 2028
1 1 2 3 3 13 22 31 40 48 72 95 117 139 160
CALCULATION OF GROWTH-RELATED PUPIL PLACE REQUIREMENTS
1 Requirements of New Development (Pupil Places) 160
2 Available Pupil Places in Existing Facilities 0
3 Net Growth-Related Pupil Place Requirements (1-2) 160
NOTES
Existing Schools and Projects
15 Year Projection of Average Daily Enrolments
15 Year Projection of Average Daily Enrolments
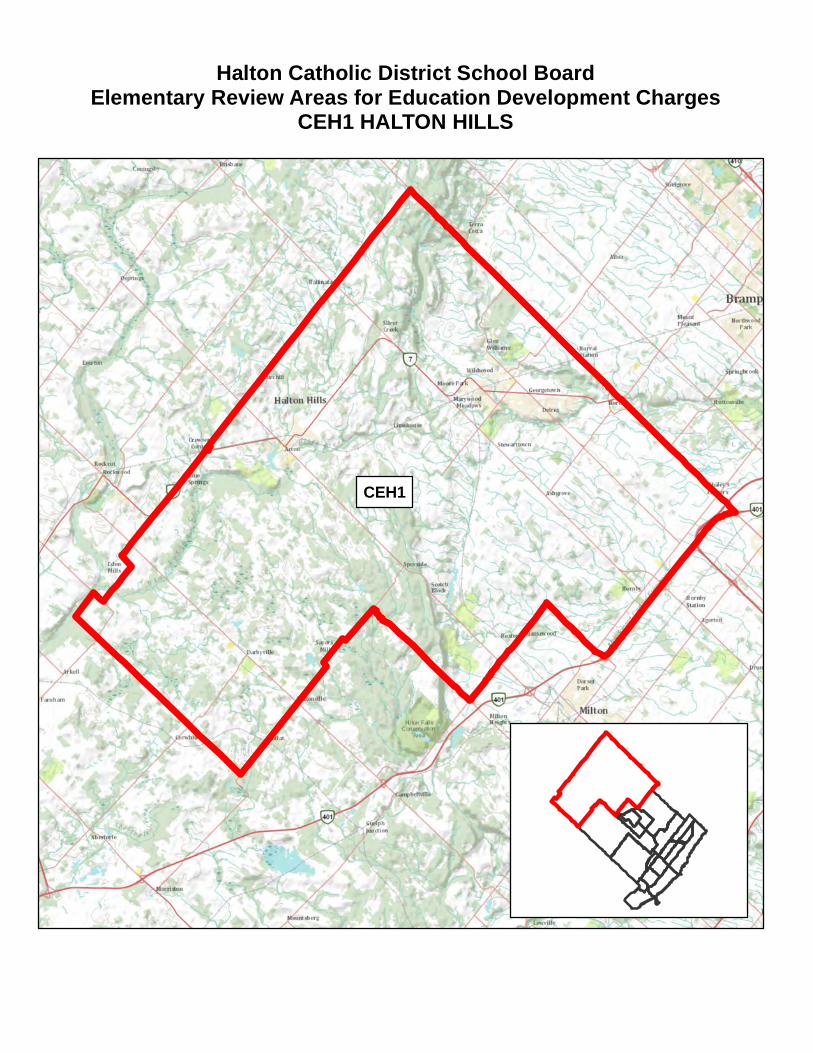
Halton Catholic District School BoardElementary Review Areas for Education Development Charges
CEH1 HALTON HILLS
CEH1
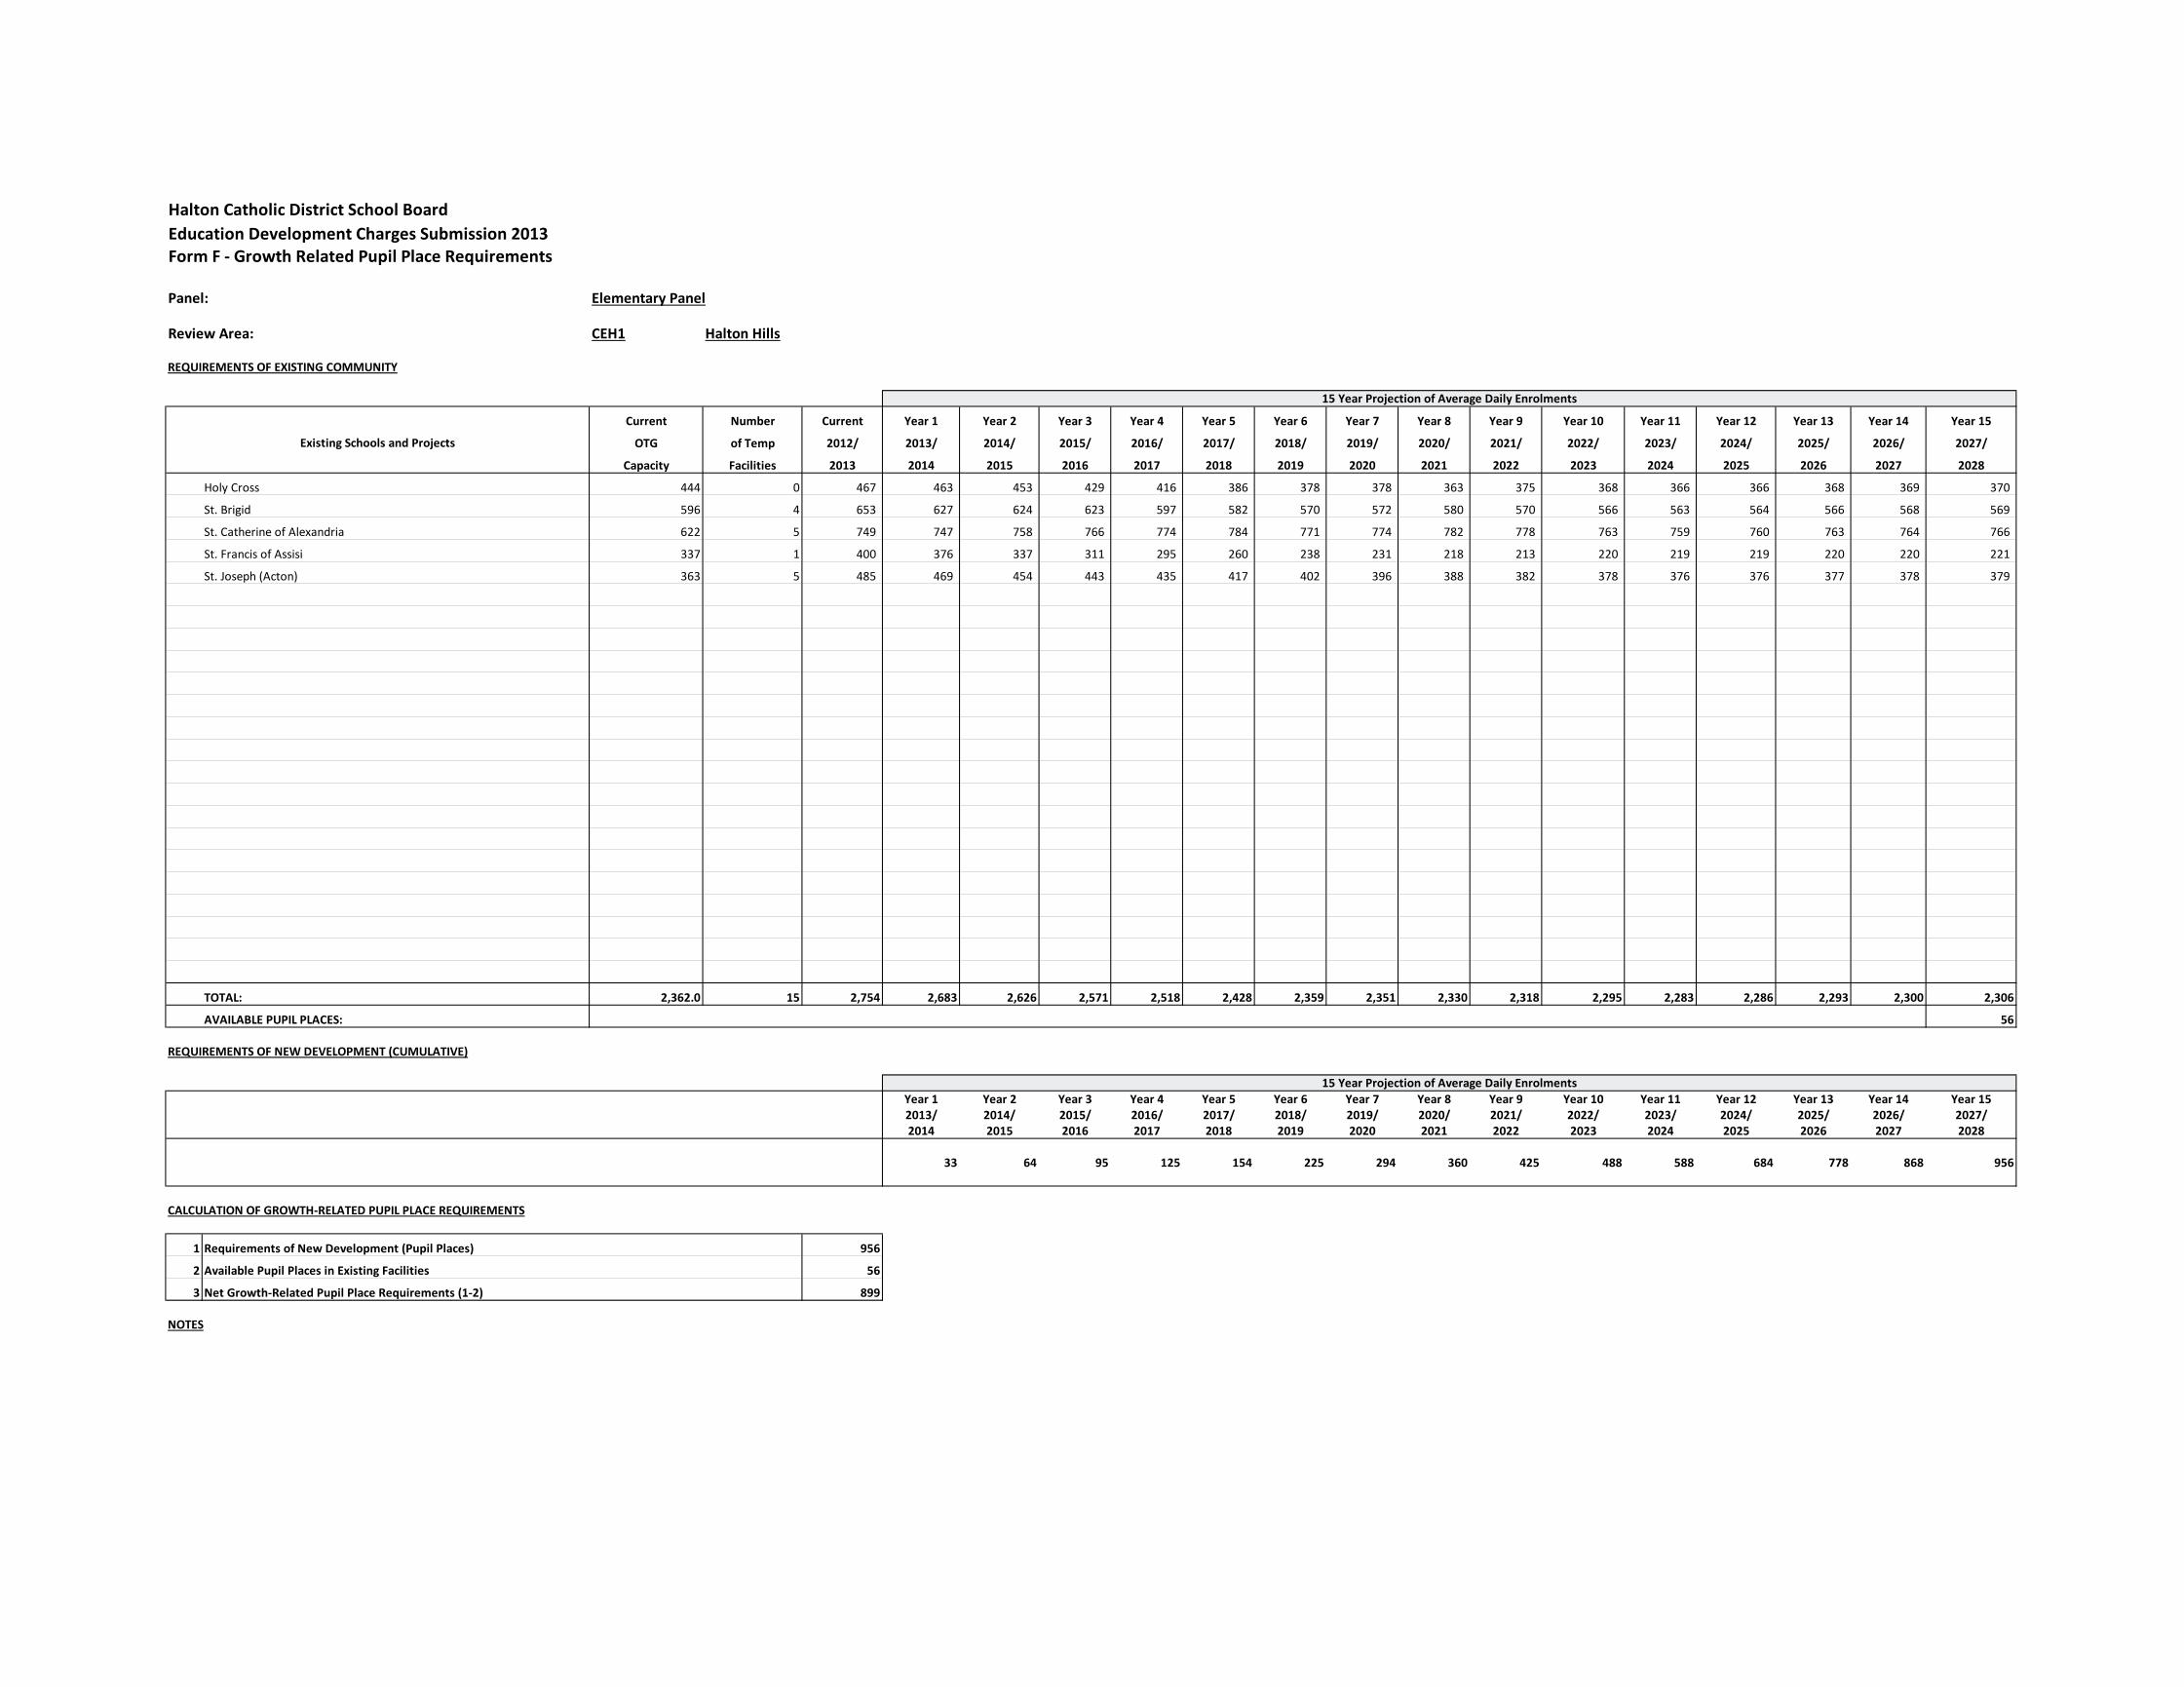
Halton Catholic District School BoardEducation Development Charges Submission 2013Form F - Growth Related Pupil Place Requirements
Panel: Elementary Panel
Review Area: CEH1 Halton Hills
REQUIREMENTS OF EXISTING COMMUNITY
Current Number Current Year 1 Year 2 Year 3 Year 4 Year 5 Year 6 Year 7 Year 8 Year 9 Year 10 Year 11 Year 12 Year 13 Year 14 Year 15
OTG of Temp 2012/ 2013/ 2014/ 2015/ 2016/ 2017/ 2018/ 2019/ 2020/ 2021/ 2022/ 2023/ 2024/ 2025/ 2026/ 2027/
Capacity Facilities 2013 2014 2015 2016 2017 2018 2019 2020 2021 2022 2023 2024 2025 2026 2027 2028
Holy Cross 444 0 467 463 453 429 416 386 378 378 363 375 368 366 366 368 369 370
St. Brigid 596 4 653 627 624 623 597 582 570 572 580 570 566 563 564 566 568 569
St. Catherine of Alexandria 622 5 749 747 758 766 774 784 771 774 782 778 763 759 760 763 764 766
St. Francis of Assisi 337 1 400 376 337 311 295 260 238 231 218 213 220 219 219 220 220 221
St. Joseph (Acton) 363 5 485 469 454 443 435 417 402 396 388 382 378 376 376 377 378 379
TOTAL: 2,362.0 15 2,754 2,683 2,626 2,571 2,518 2,428 2,359 2,351 2,330 2,318 2,295 2,283 2,286 2,293 2,300 2,306
AVAILABLE PUPIL PLACES: 56
REQUIREMENTS OF NEW DEVELOPMENT (CUMULATIVE)
Year 1 Year 2 Year 3 Year 4 Year 5 Year 6 Year 7 Year 8 Year 9 Year 10 Year 11 Year 12 Year 13 Year 14 Year 152013/ 2014/ 2015/ 2016/ 2017/ 2018/ 2019/ 2020/ 2021/ 2022/ 2023/ 2024/ 2025/ 2026/ 2027/2014 2015 2016 2017 2018 2019 2020 2021 2022 2023 2024 2025 2026 2027 2028
33 64 95 125 154 225 294 360 425 488 588 684 778 868 956
CALCULATION OF GROWTH-RELATED PUPIL PLACE REQUIREMENTS
1 Requirements of New Development (Pupil Places) 956
2 Available Pupil Places in Existing Facilities 56
3 Net Growth-Related Pupil Place Requirements (1-2) 899
NOTES
15 Year Projection of Average Daily Enrolments
Existing Schools and Projects
15 Year Projection of Average Daily Enrolments
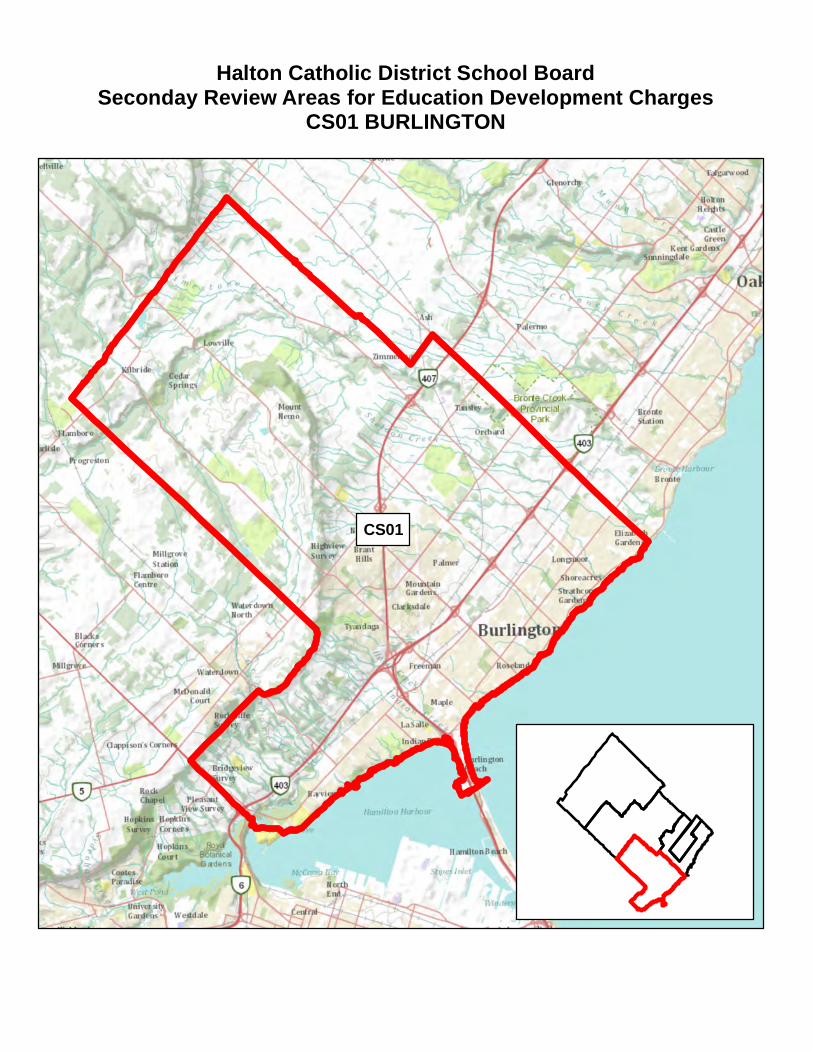
Halton Catholic District School BoardSeconday Review Areas for Education Development Charges
CS01 BURLINGTON
CS01
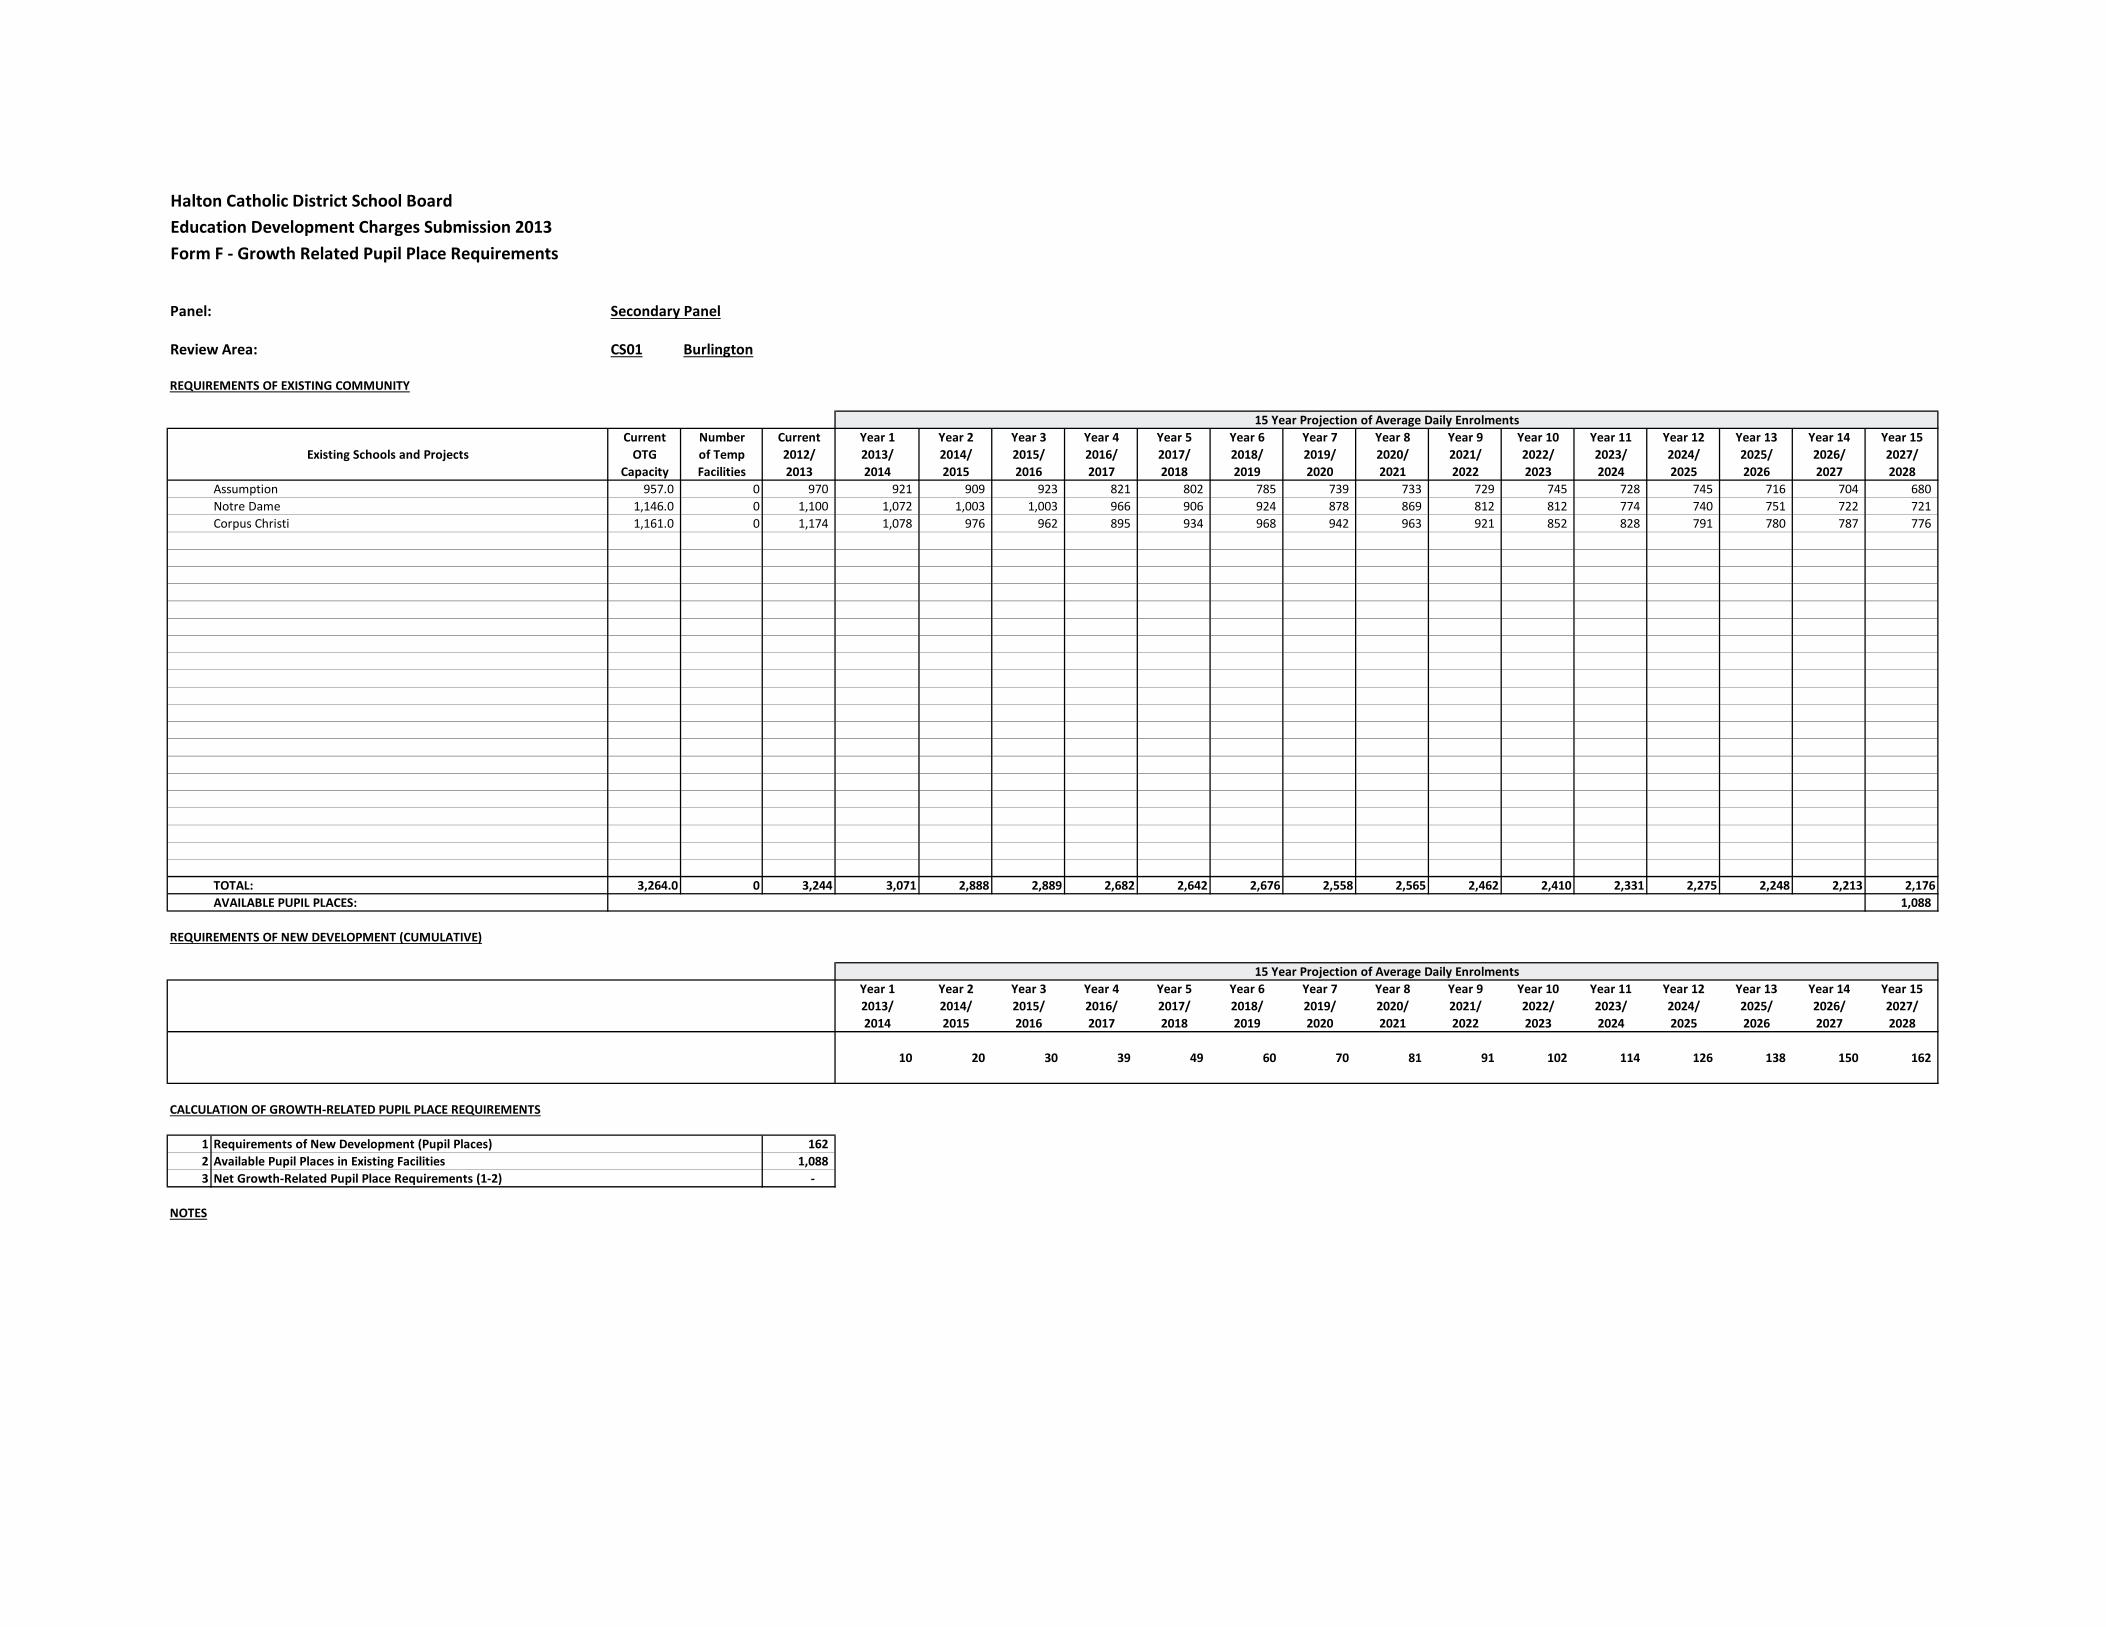
Halton Catholic District School BoardEducation Development Charges Submission 2013Form F - Growth Related Pupil Place Requirements
Panel: Secondary Panel
Review Area: CS01 Burlington
REQUIREMENTS OF EXISTING COMMUNITY
Current Number Current Year 1 Year 2 Year 3 Year 4 Year 5 Year 6 Year 7 Year 8 Year 9 Year 10 Year 11 Year 12 Year 13 Year 14 Year 15OTG of Temp 2012/ 2013/ 2014/ 2015/ 2016/ 2017/ 2018/ 2019/ 2020/ 2021/ 2022/ 2023/ 2024/ 2025/ 2026/ 2027/
Capacity Facilities 2013 2014 2015 2016 2017 2018 2019 2020 2021 2022 2023 2024 2025 2026 2027 2028Assumption 957.0 0 970 921 909 923 821 802 785 739 733 729 745 728 745 716 704 680 Notre Dame 1,146.0 0 1,100 1,072 1,003 1,003 966 906 924 878 869 812 812 774 740 751 722 721 Corpus Christi 1,161.0 0 1,174 1,078 976 962 895 934 968 942 963 921 852 828 791 780 787 776
TOTAL: 3,264.0 0 3,244 3,071 2,888 2,889 2,682 2,642 2,676 2,558 2,565 2,462 2,410 2,331 2,275 2,248 2,213 2,176AVAILABLE PUPIL PLACES: 1,088
REQUIREMENTS OF NEW DEVELOPMENT (CUMULATIVE)
Year 1 Year 2 Year 3 Year 4 Year 5 Year 6 Year 7 Year 8 Year 9 Year 10 Year 11 Year 12 Year 13 Year 14 Year 152013/ 2014/ 2015/ 2016/ 2017/ 2018/ 2019/ 2020/ 2021/ 2022/ 2023/ 2024/ 2025/ 2026/ 2027/2014 2015 2016 2017 2018 2019 2020 2021 2022 2023 2024 2025 2026 2027 2028
10 20 30 39 49 60 70 81 91 102 114 126 138 150 162
CALCULATION OF GROWTH-RELATED PUPIL PLACE REQUIREMENTS
1 Requirements of New Development (Pupil Places) 162 2 Available Pupil Places in Existing Facilities 1,088 3 Net Growth-Related Pupil Place Requirements (1-2) -
NOTES
15 Year Projection of Average Daily Enrolments
Existing Schools and Projects
15 Year Projection of Average Daily Enrolments
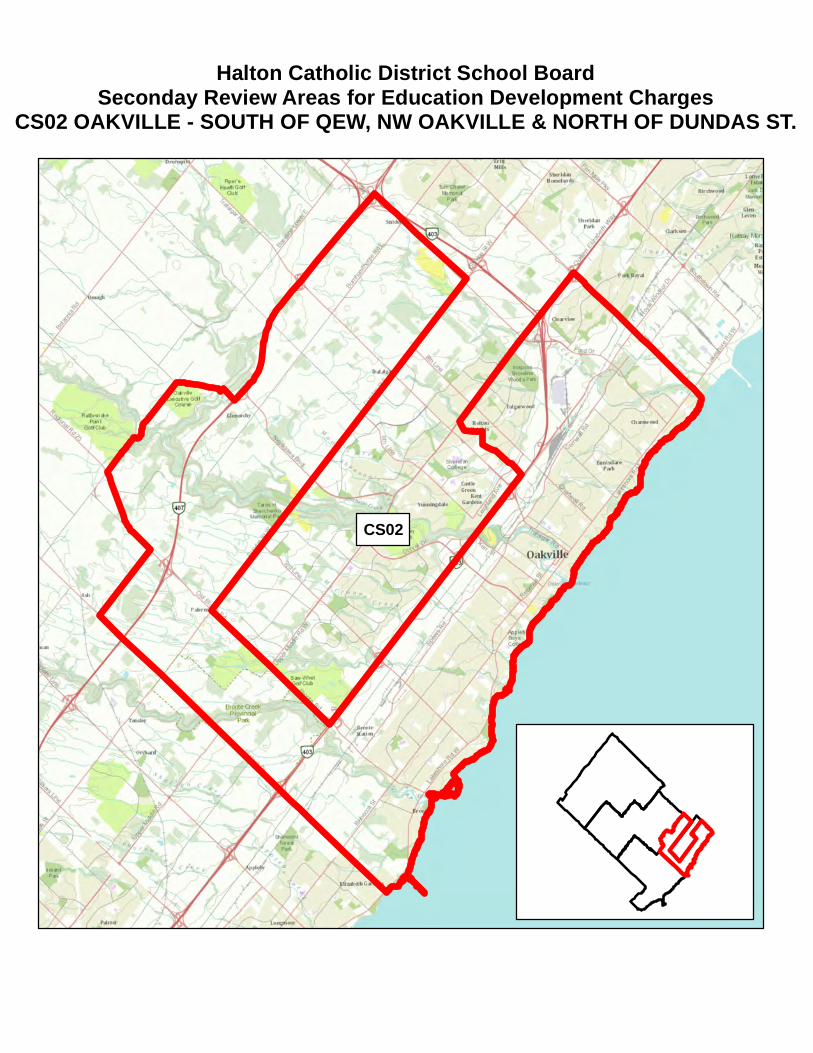
Halton Catholic District School BoardSeconday Review Areas for Education Development Charges
CS02 OAKVILLE - SOUTH OF QEW, NW OAKVILLE & NORTH OF DUNDAS ST.
CS02
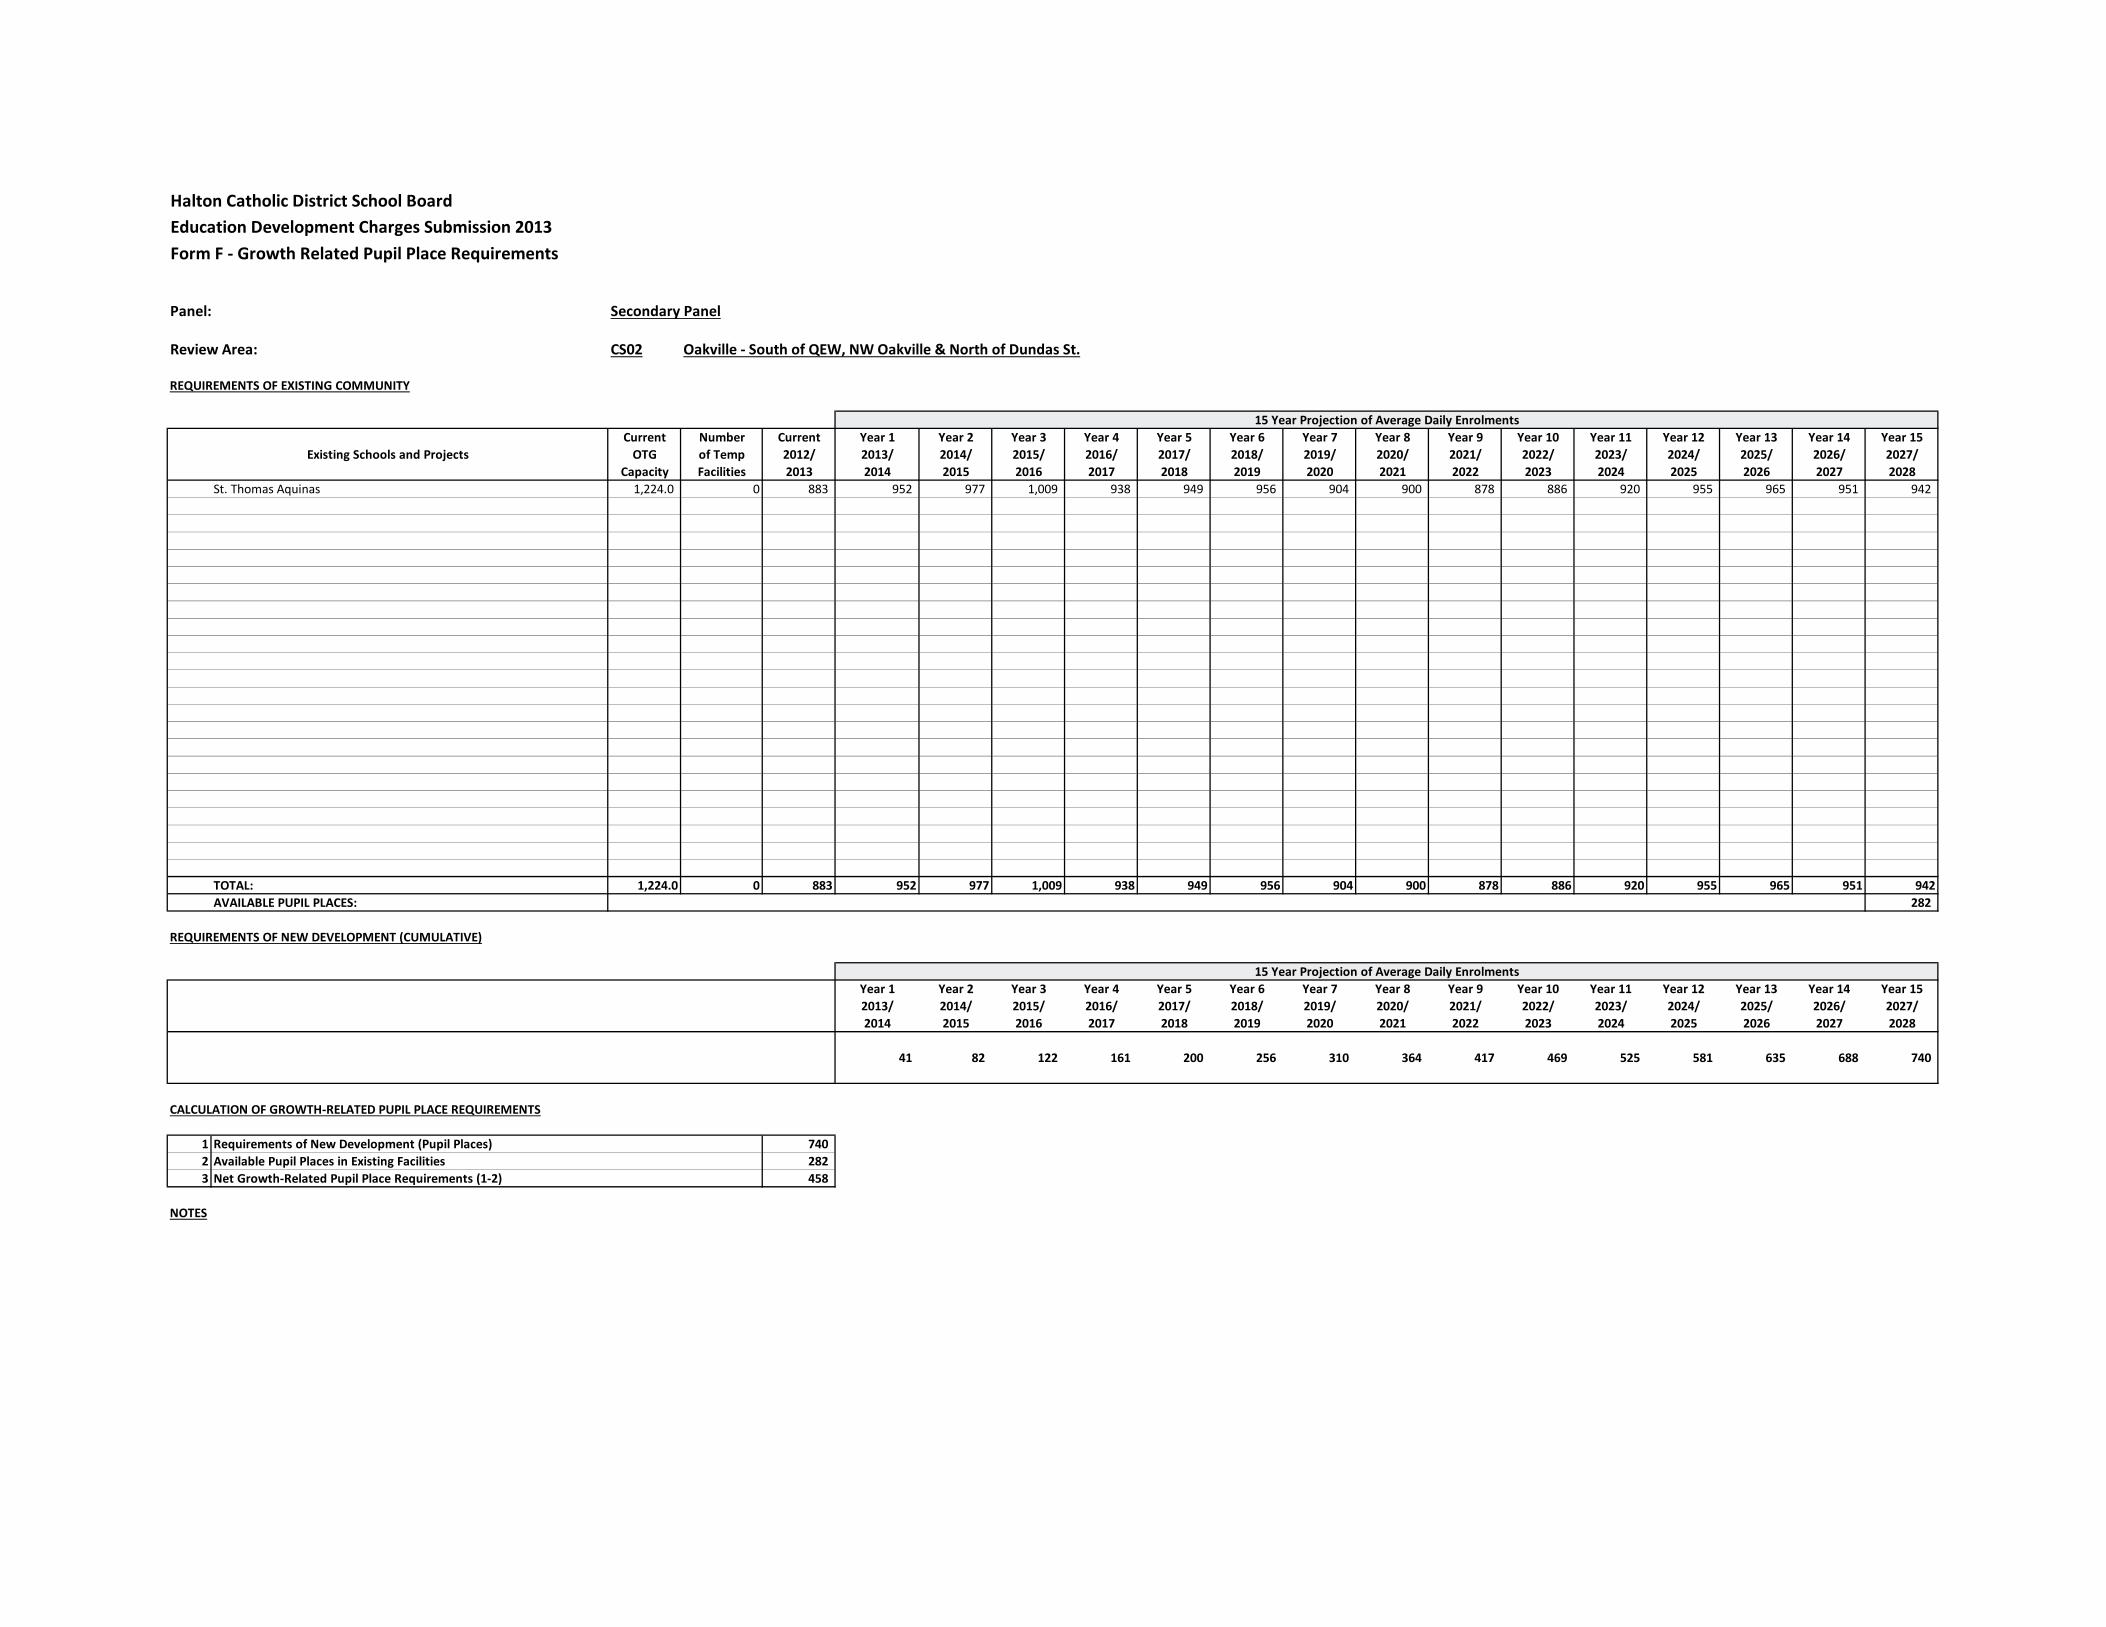
Halton Catholic District School BoardEducation Development Charges Submission 2013Form F - Growth Related Pupil Place Requirements
Panel: Secondary Panel
Review Area: CS02 Oakville - South of QEW, NW Oakville & North of Dundas St.
REQUIREMENTS OF EXISTING COMMUNITY
Current Number Current Year 1 Year 2 Year 3 Year 4 Year 5 Year 6 Year 7 Year 8 Year 9 Year 10 Year 11 Year 12 Year 13 Year 14 Year 15OTG of Temp 2012/ 2013/ 2014/ 2015/ 2016/ 2017/ 2018/ 2019/ 2020/ 2021/ 2022/ 2023/ 2024/ 2025/ 2026/ 2027/
Capacity Facilities 2013 2014 2015 2016 2017 2018 2019 2020 2021 2022 2023 2024 2025 2026 2027 2028St. Thomas Aquinas 1,224.0 0 883 952 977 1,009 938 949 956 904 900 878 886 920 955 965 951 942
TOTAL: 1,224.0 0 883 952 977 1,009 938 949 956 904 900 878 886 920 955 965 951 942AVAILABLE PUPIL PLACES: 282
REQUIREMENTS OF NEW DEVELOPMENT (CUMULATIVE)
Year 1 Year 2 Year 3 Year 4 Year 5 Year 6 Year 7 Year 8 Year 9 Year 10 Year 11 Year 12 Year 13 Year 14 Year 152013/ 2014/ 2015/ 2016/ 2017/ 2018/ 2019/ 2020/ 2021/ 2022/ 2023/ 2024/ 2025/ 2026/ 2027/2014 2015 2016 2017 2018 2019 2020 2021 2022 2023 2024 2025 2026 2027 2028
41 82 122 161 200 256 310 364 417 469 525 581 635 688 740
CALCULATION OF GROWTH-RELATED PUPIL PLACE REQUIREMENTS
1 Requirements of New Development (Pupil Places) 740 2 Available Pupil Places in Existing Facilities 282 3 Net Growth-Related Pupil Place Requirements (1-2) 458
NOTES
15 Year Projection of Average Daily Enrolments
15 Year Projection of Average Daily Enrolments
Existing Schools and Projects
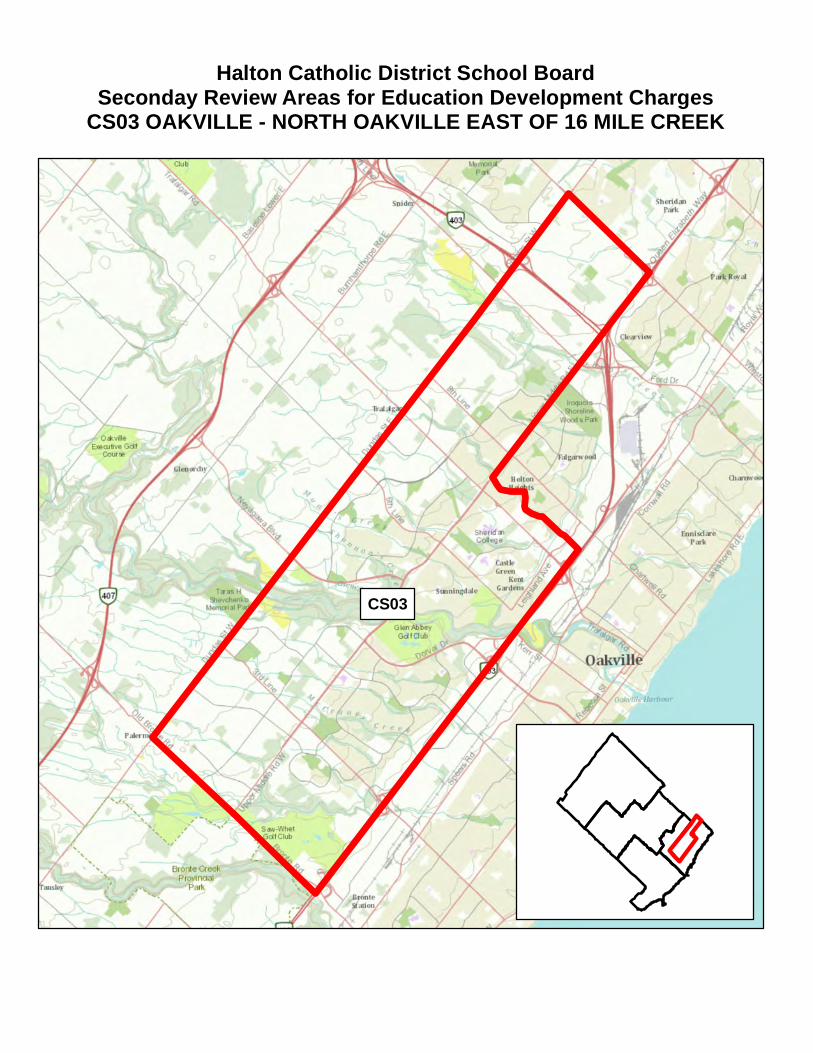
Halton Catholic District School BoardSeconday Review Areas for Education Development Charges
CS03 OAKVILLE - NORTH OAKVILLE EAST OF 16 MILE CREEK
CS03

Halton Catholic District School BoardEducation Development Charges Submission 2013Form F - Growth Related Pupil Place Requirements
Panel: Secondary Panel
Review Area: CS03 Oakville - North Oakville East of 16 Mile Creek
REQUIREMENTS OF EXISTING COMMUNITY
Current Number Current Year 1 Year 2 Year 3 Year 4 Year 5 Year 6 Year 7 Year 8 Year 9 Year 10 Year 11 Year 12 Year 13 Year 14 Year 15OTG of Temp 2012/ 2013/ 2014/ 2015/ 2016/ 2017/ 2018/ 2019/ 2020/ 2021/ 2022/ 2023/ 2024/ 2025/ 2026/ 2027/
Capacity Facilities 2013 2014 2015 2016 2017 2018 2019 2020 2021 2022 2023 2024 2025 2026 2027 2028Holy Trinity 1,245.0 5 1,431 1,310 1,238 1,221 1,184 1,153 1,103 1,073 980 930 910 859 880 860 830 809 St. Ignatius of Loyola 1,311.0 0 1,224 1,127 1,074 1,052 1,087 1,086 1,114 1,078 1,054 1,025 967 945 919 869 861 842
TOTAL: 2,556.0 5 2,655 2,437 2,313 2,273 2,271 2,239 2,217 2,151 2,035 1,956 1,877 1,804 1,799 1,730 1,691 1,650AVAILABLE PUPIL PLACES: 906
REQUIREMENTS OF NEW DEVELOPMENT (CUMULATIVE)
Year 1 Year 2 Year 3 Year 4 Year 5 Year 6 Year 7 Year 8 Year 9 Year 10 Year 11 Year 12 Year 13 Year 14 Year 152013/ 2014/ 2015/ 2016/ 2017/ 2018/ 2019/ 2020/ 2021/ 2022/ 2023/ 2024/ 2025/ 2026/ 2027/2014 2015 2016 2017 2018 2019 2020 2021 2022 2023 2024 2025 2026 2027 2028
9 17 26 35 43 59 74 89 104 119 142 164 186 208 230
CALCULATION OF GROWTH-RELATED PUPIL PLACE REQUIREMENTS
1 Requirements of New Development (Pupil Places) 230 2 Available Pupil Places in Existing Facilities 906 3 Net Growth-Related Pupil Place Requirements (1-2) -
NOTES
15 Year Projection of Average Daily Enrolments
Existing Schools and Projects
15 Year Projection of Average Daily Enrolments
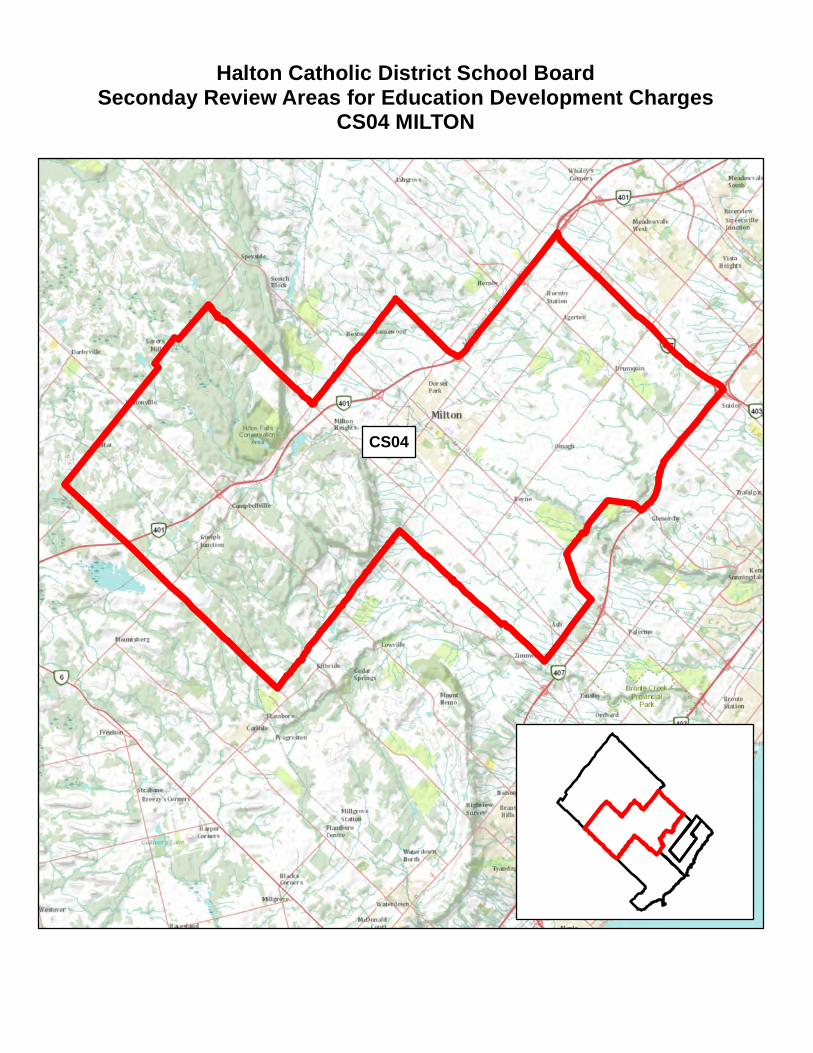
Halton Catholic District School BoardSeconday Review Areas for Education Development Charges
CS04 MILTON
CS04

Halton Catholic District School BoardEducation Development Charges Submission 2013Form F - Growth Related Pupil Place Requirements
Panel: Secondary Panel
Review Area: CS04 Milton
REQUIREMENTS OF EXISTING COMMUNITY
Current Number Current Year 1 Year 2 Year 3 Year 4 Year 5 Year 6 Year 7 Year 8 Year 9 Year 10 Year 11 Year 12 Year 13 Year 14 Year 15OTG of Temp 2012/ 2013/ 2014/ 2015/ 2016/ 2017/ 2018/ 2019/ 2020/ 2021/ 2022/ 2023/ 2024/ 2025/ 2026/ 2027/
Capacity Facilities 2013 2014 2015 2016 2017 2018 2019 2020 2021 2022 2023 2024 2025 2026 2027 2028Bishop P.F. Reding 933.0 33 1,703 1,714 1,734 1,771 1,796 1,878 2,057 2,180 2,346 2,529 2,638 2,703 2,661 2,622 2,569 2,579 New Milton Secondary 1,350.0 0 - - - - - - - - - - - - - - - -
TOTAL: 2,283.0 33 1,703 1,714 1,734 1,771 1,796 1,878 2,057 2,180 2,346 2,529 2,638 2,703 2,661 2,622 2,569 2,579AVAILABLE PUPIL PLACES: -
REQUIREMENTS OF NEW DEVELOPMENT (CUMULATIVE)
Year 1 Year 2 Year 3 Year 4 Year 5 Year 6 Year 7 Year 8 Year 9 Year 10 Year 11 Year 12 Year 13 Year 14 Year 152013/ 2014/ 2015/ 2016/ 2017/ 2018/ 2019/ 2020/ 2021/ 2022/ 2023/ 2024/ 2025/ 2026/ 2027/2014 2015 2016 2017 2018 2019 2020 2021 2022 2023 2024 2025 2026 2027 2028
75 149 221 293 363 486 607 726 842 957 1,029 1,099 1,169 1,237 1,303
CALCULATION OF GROWTH-RELATED PUPIL PLACE REQUIREMENTS
1 Requirements of New Development (Pupil Places) 1,303 2 Available Pupil Places in Existing Facilities - 3 Net Growth-Related Pupil Place Requirements (1-2) 1,303
NOTES
15 Year Projection of Average Daily Enrolments
Existing Schools and Projects
15 Year Projection of Average Daily Enrolments
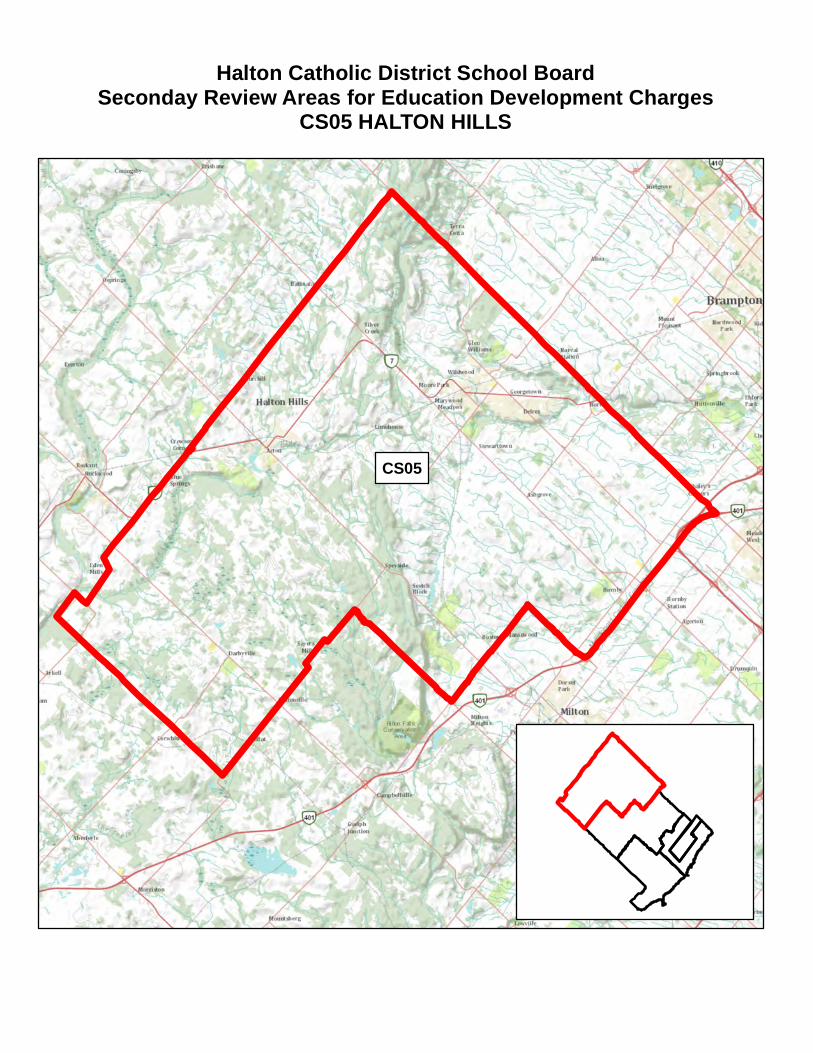
Halton Catholic District School BoardSeconday Review Areas for Education Development Charges
CS05 HALTON HILLS
CS05
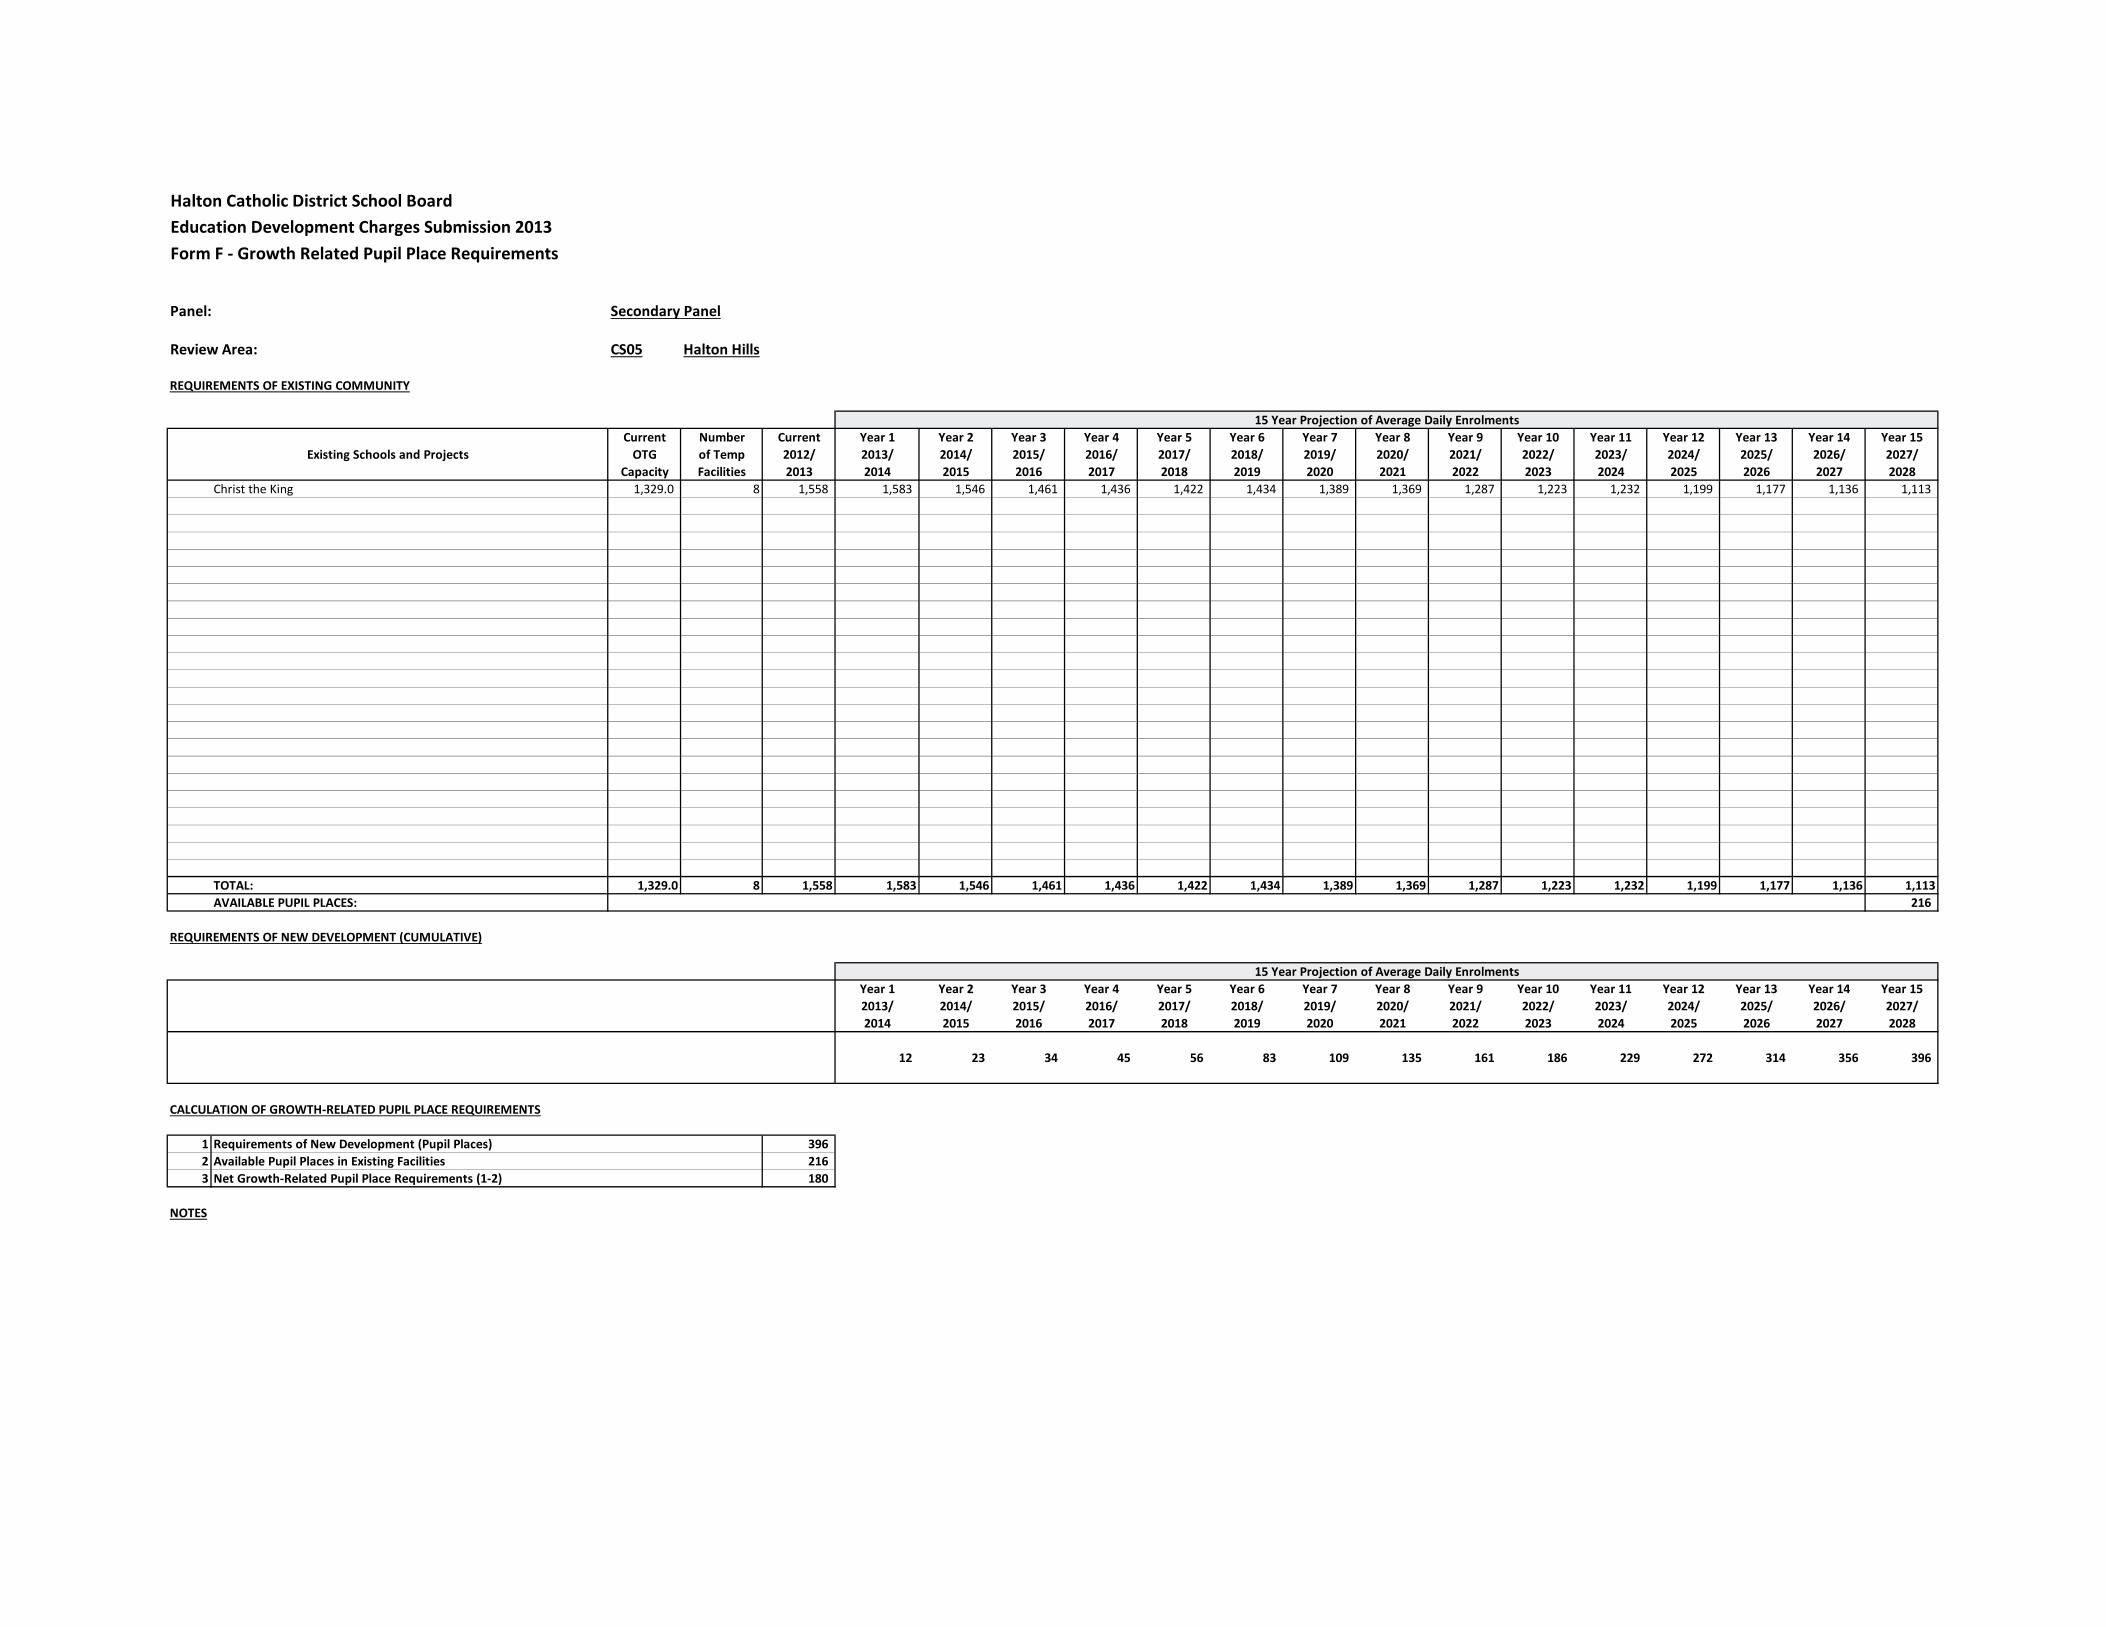
Halton Catholic District School BoardEducation Development Charges Submission 2013Form F - Growth Related Pupil Place Requirements
Panel: Secondary Panel
Review Area: CS05 Halton Hills
REQUIREMENTS OF EXISTING COMMUNITY
Current Number Current Year 1 Year 2 Year 3 Year 4 Year 5 Year 6 Year 7 Year 8 Year 9 Year 10 Year 11 Year 12 Year 13 Year 14 Year 15OTG of Temp 2012/ 2013/ 2014/ 2015/ 2016/ 2017/ 2018/ 2019/ 2020/ 2021/ 2022/ 2023/ 2024/ 2025/ 2026/ 2027/
Capacity Facilities 2013 2014 2015 2016 2017 2018 2019 2020 2021 2022 2023 2024 2025 2026 2027 2028Christ the King 1,329.0 8 1,558 1,583 1,546 1,461 1,436 1,422 1,434 1,389 1,369 1,287 1,223 1,232 1,199 1,177 1,136 1,113
TOTAL: 1,329.0 8 1,558 1,583 1,546 1,461 1,436 1,422 1,434 1,389 1,369 1,287 1,223 1,232 1,199 1,177 1,136 1,113AVAILABLE PUPIL PLACES: 216
REQUIREMENTS OF NEW DEVELOPMENT (CUMULATIVE)
Year 1 Year 2 Year 3 Year 4 Year 5 Year 6 Year 7 Year 8 Year 9 Year 10 Year 11 Year 12 Year 13 Year 14 Year 152013/ 2014/ 2015/ 2016/ 2017/ 2018/ 2019/ 2020/ 2021/ 2022/ 2023/ 2024/ 2025/ 2026/ 2027/2014 2015 2016 2017 2018 2019 2020 2021 2022 2023 2024 2025 2026 2027 2028
12 23 34 45 56 83 109 135 161 186 229 272 314 356 396
CALCULATION OF GROWTH-RELATED PUPIL PLACE REQUIREMENTS
1 Requirements of New Development (Pupil Places) 396 2 Available Pupil Places in Existing Facilities 216 3 Net Growth-Related Pupil Place Requirements (1-2) 180
NOTES
15 Year Projection of Average Daily Enrolments
Existing Schools and Projects
15 Year Projection of Average Daily Enrolments
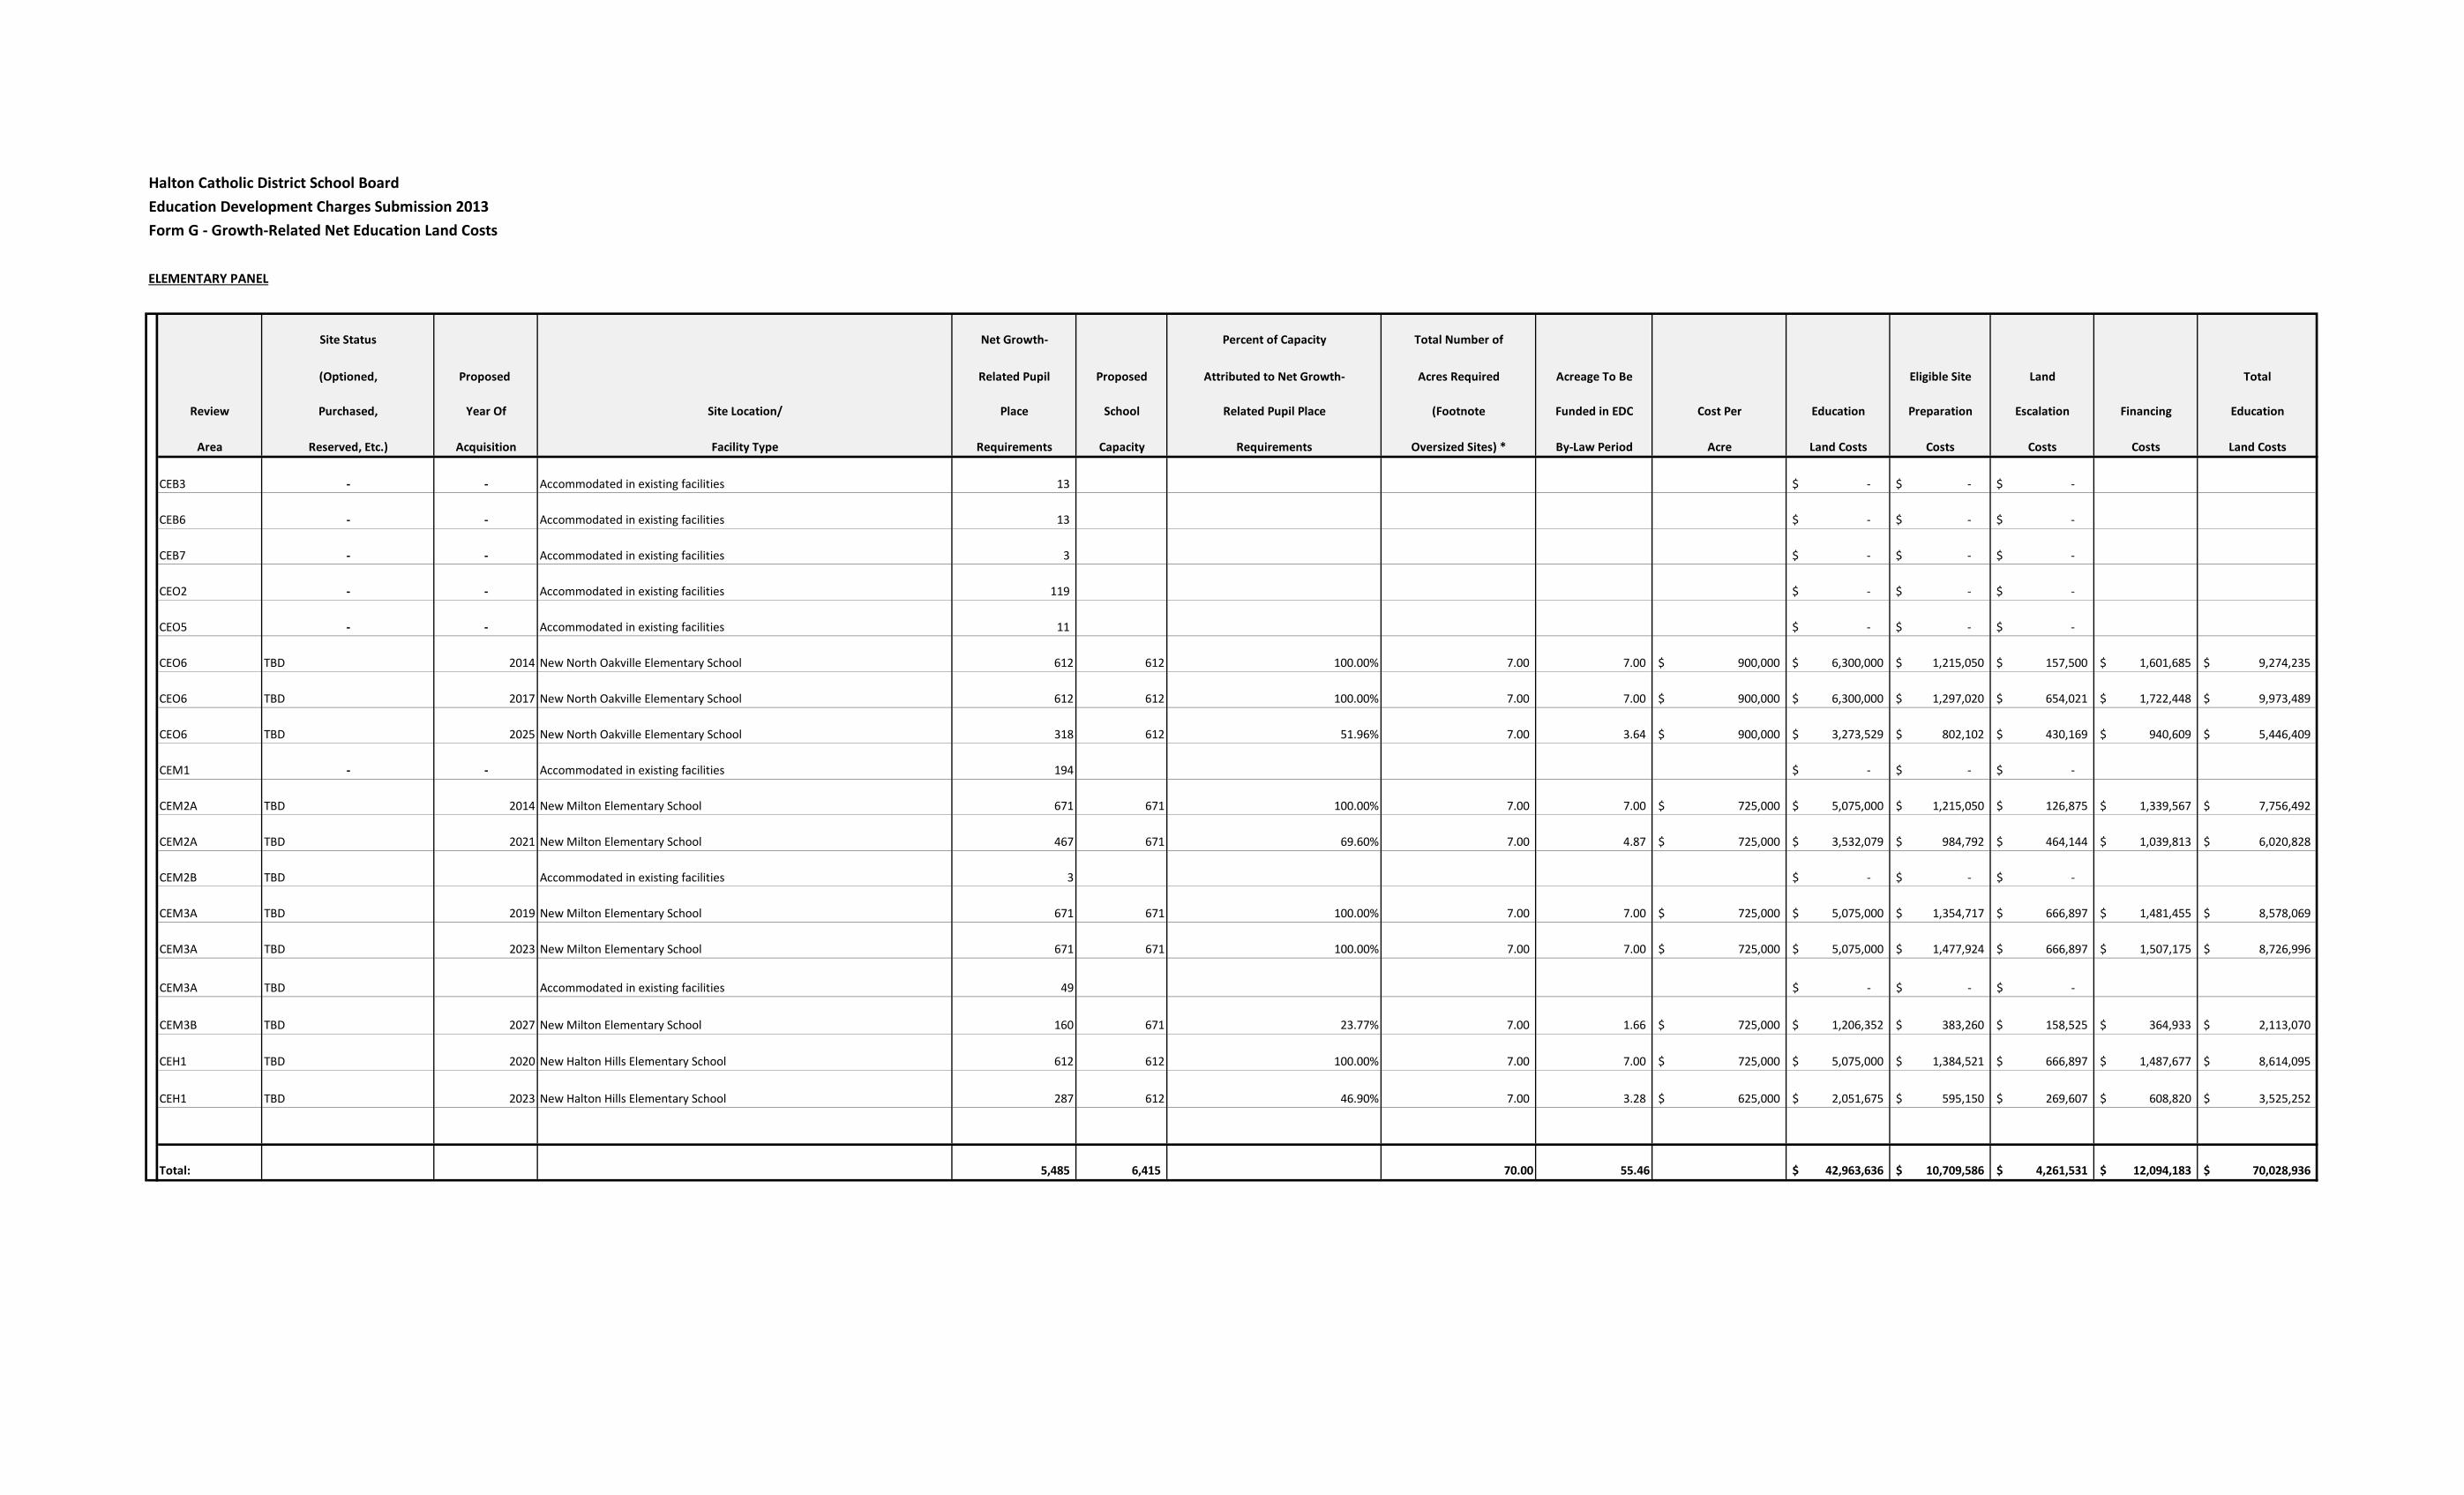
Halton Catholic District School BoardEducation Development Charges Submission 2013Form G - Growth-Related Net Education Land Costs
ELEMENTARY PANEL
Site Status Net Growth- Percent of Capacity Total Number of
(Optioned, Proposed Related Pupil Proposed Attributed to Net Growth- Acres Required Acreage To Be Eligible Site Land Total
Review Purchased, Year Of Site Location/ Place School Related Pupil Place (Footnote Funded in EDC Cost Per Education Preparation Escalation Financing Education
Area Reserved, Etc.) Acquisition Facility Type Requirements Capacity Requirements Oversized Sites) * By-Law Period Acre Land Costs Costs Costs Costs Land Costs
CEB3 - - Accommodated in existing facilities 13 -$ -$ -$
CEB6 - - Accommodated in existing facilities 13 -$ -$ -$
CEB7 - - Accommodated in existing facilities 3 -$ -$ -$
CEO2 - - Accommodated in existing facilities 119 -$ -$ -$
CEO5 - - Accommodated in existing facilities 11 -$ -$ -$
CEO6 TBD 2014 New North Oakville Elementary School 612 612 100.00% 7.00 7.00 900,000$ 6,300,000$ 1,215,050$ 157,500$ 1,601,685$ 9,274,235$
CEO6 TBD 2017 New North Oakville Elementary School 612 612 100.00% 7.00 7.00 900,000$ 6,300,000$ 1,297,020$ 654,021$ 1,722,448$ 9,973,489$
CEO6 TBD 2025 New North Oakville Elementary School 318 612 51.96% 7.00 3.64 900,000$ 3,273,529$ 802,102$ 430,169$ 940,609$ 5,446,409$
CEM1 - - Accommodated in existing facilities 194 -$ -$ -$
CEM2A TBD 2014 New Milton Elementary School 671 671 100.00% 7.00 7.00 725,000$ 5,075,000$ 1,215,050$ 126,875$ 1,339,567$ 7,756,492$
CEM2A TBD 2021 New Milton Elementary School 467 671 69.60% 7.00 4.87 725,000$ 3,532,079$ 984,792$ 464,144$ 1,039,813$ 6,020,828$
CEM2B TBD Accommodated in existing facilities 3 -$ -$ -$
CEM3A TBD 2019 New Milton Elementary School 671 671 100.00% 7.00 7.00 725,000$ 5,075,000$ 1,354,717$ 666,897$ 1,481,455$ 8,578,069$
CEM3A TBD 2023 New Milton Elementary School 671 671 100.00% 7.00 7.00 725,000$ 5,075,000$ 1,477,924$ 666,897$ 1,507,175$ 8,726,996$
CEM3A TBD Accommodated in existing facilities 49 -$ -$ -$
CEM3B TBD 2027 New Milton Elementary School 160 671 23.77% 7.00 1.66 725,000$ 1,206,352$ 383,260$ 158,525$ 364,933$ 2,113,070$
CEH1 TBD 2020 New Halton Hills Elementary School 612 612 100.00% 7.00 7.00 725,000$ 5,075,000$ 1,384,521$ 666,897$ 1,487,677$ 8,614,095$
CEH1 TBD 2023 New Halton Hills Elementary School 287 612 46.90% 7.00 3.28 625,000$ 2,051,675$ 595,150$ 269,607$ 608,820$ 3,525,252$
Total: 5,485 6,415 70.00 55.46 42,963,636$ 10,709,586$ 4,261,531$ 12,094,183$ 70,028,936$
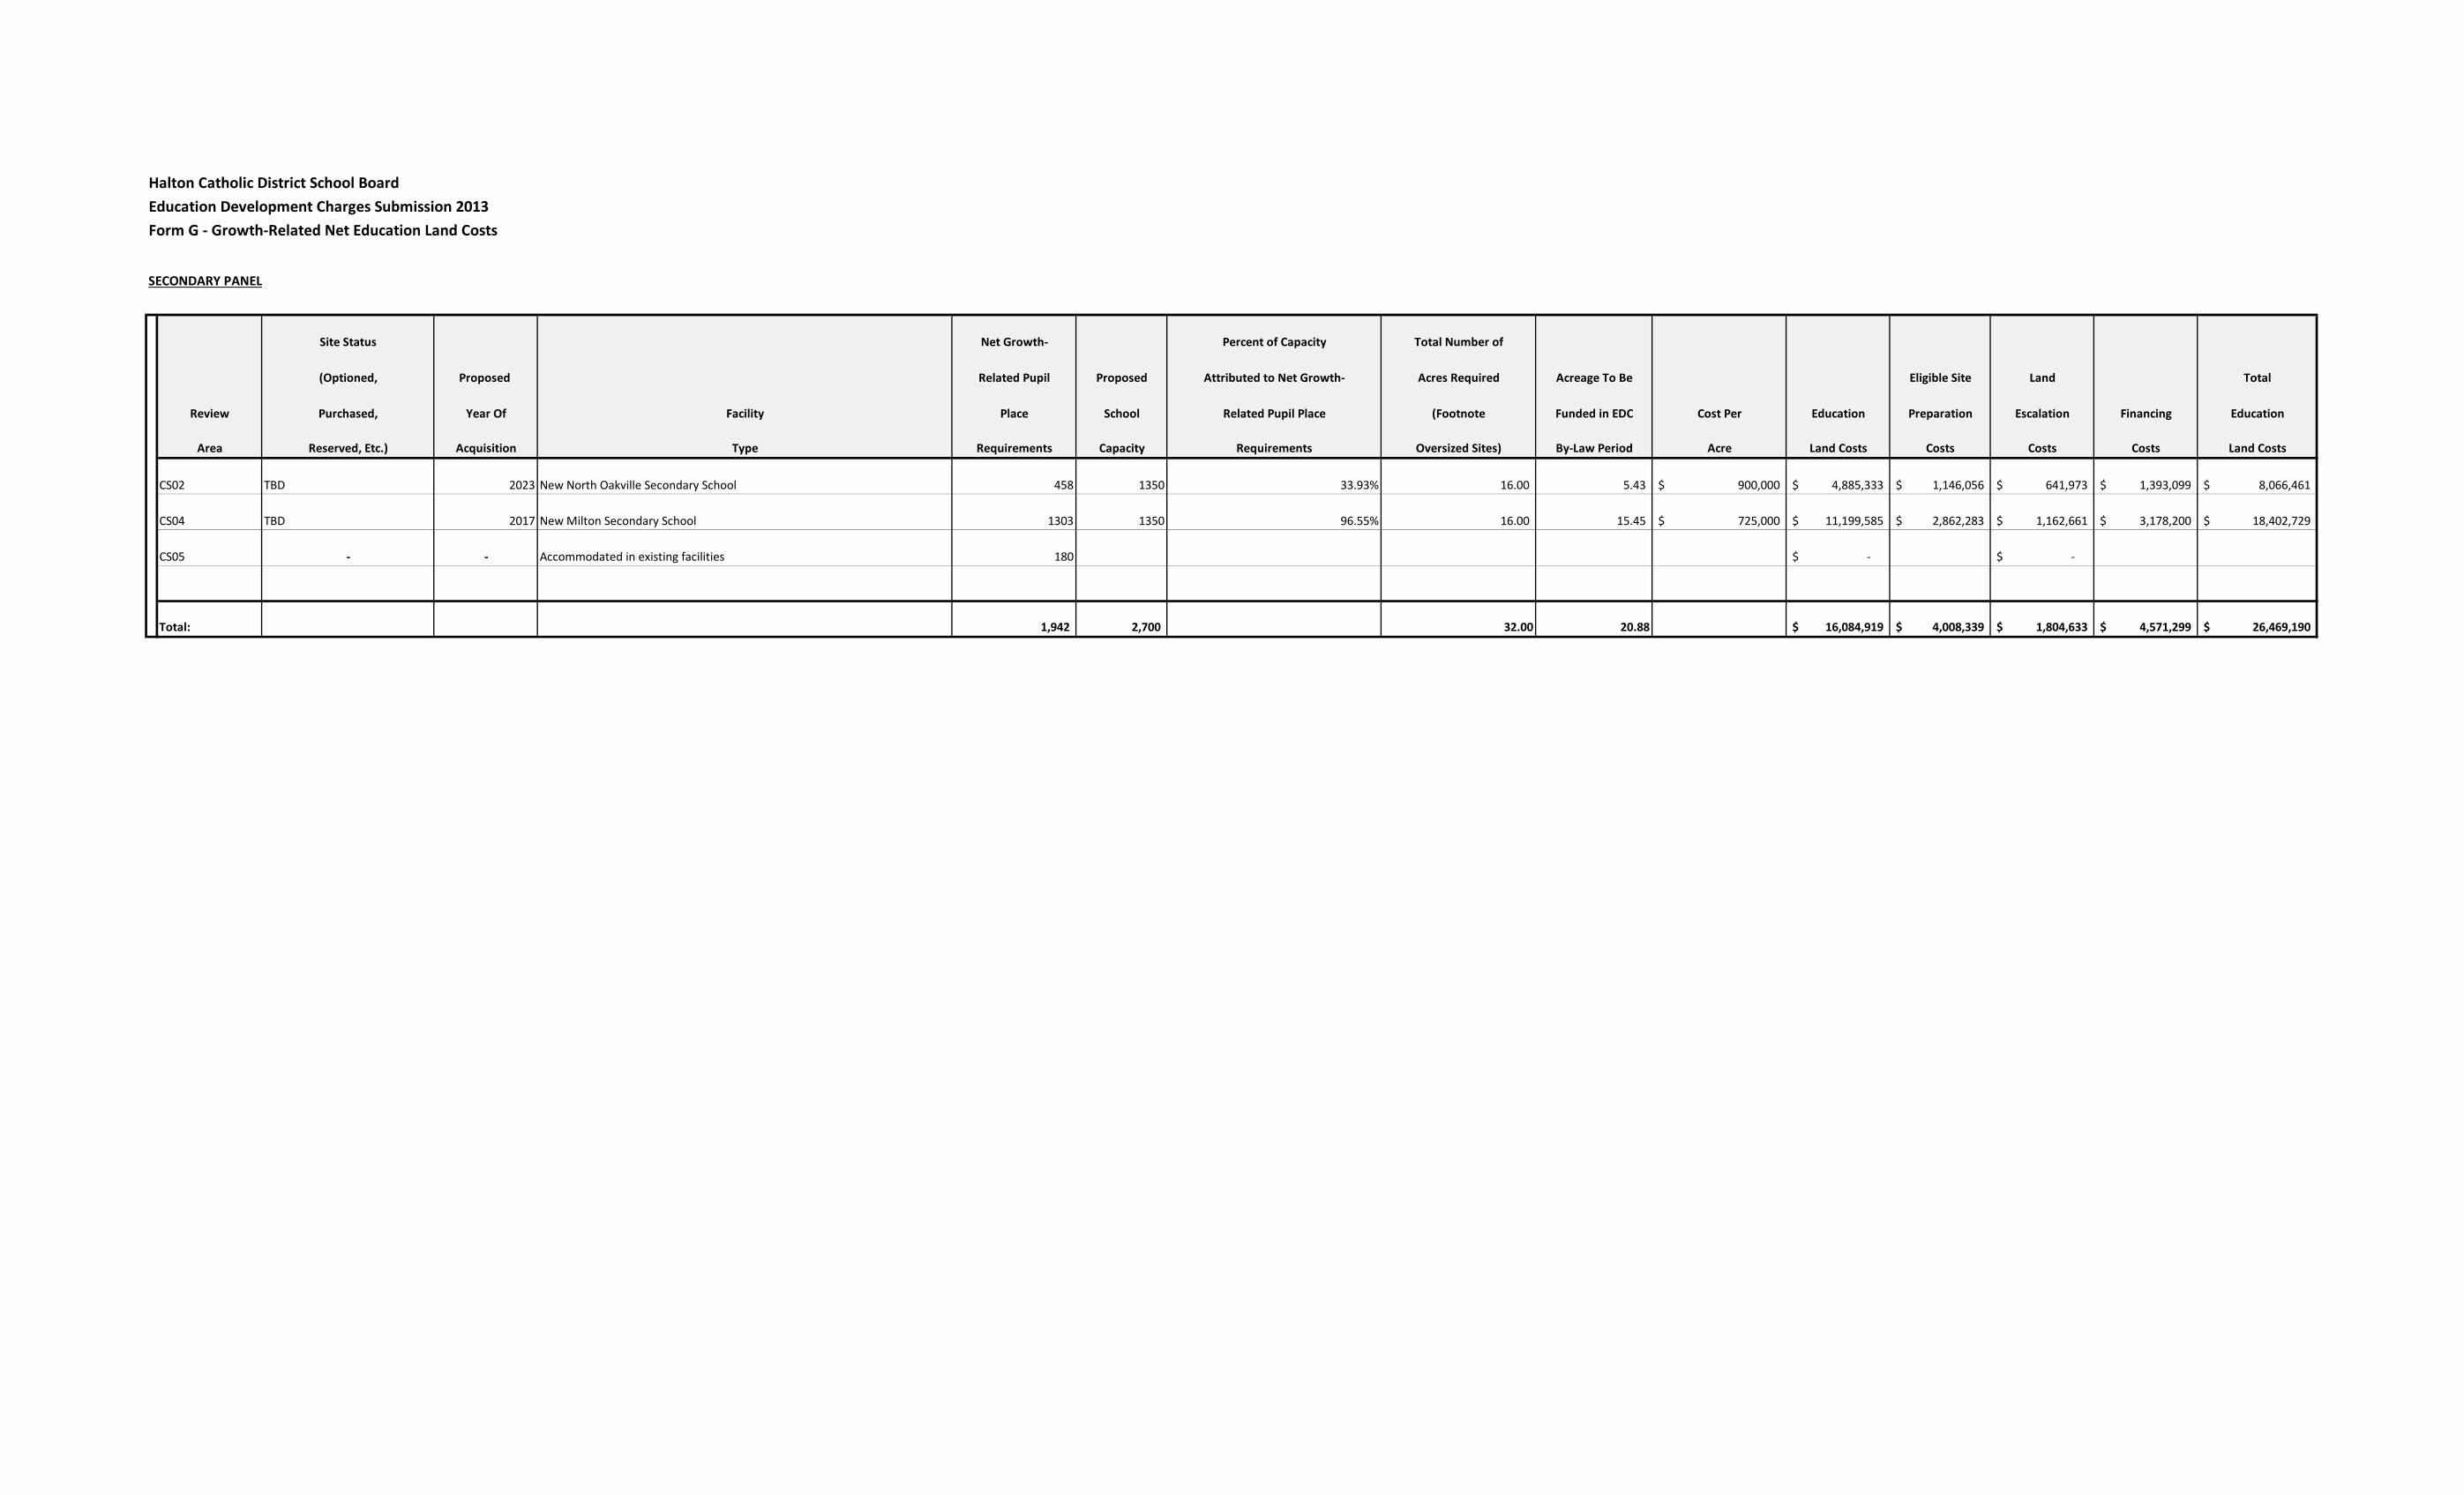
Halton Catholic District School BoardEducation Development Charges Submission 2013Form G - Growth-Related Net Education Land Costs
SECONDARY PANEL
Site Status Net Growth- Percent of Capacity Total Number of
(Optioned, Proposed Related Pupil Proposed Attributed to Net Growth- Acres Required Acreage To Be Eligible Site Land Total
Review Purchased, Year Of Facility Place School Related Pupil Place (Footnote Funded in EDC Cost Per Education Preparation Escalation Financing Education
Area Reserved, Etc.) Acquisition Type Requirements Capacity Requirements Oversized Sites) By-Law Period Acre Land Costs Costs Costs Costs Land Costs
CS02 TBD 2023 New North Oakville Secondary School 458 1350 33.93% 16.00 5.43 900,000$ 4,885,333$ 1,146,056$ 641,973$ 1,393,099$ 8,066,461$
CS04 TBD 2017 New Milton Secondary School 1303 1350 96.55% 16.00 15.45 725,000$ 11,199,585$ 2,862,283$ 1,162,661$ 3,178,200$ 18,402,729$
CS05 - - Accommodated in existing facilities 180 -$ -$
Total: 1,942 2,700 32.00 20.88 16,084,919$ 4,008,339$ 1,804,633$ 4,571,299$ 26,469,190$
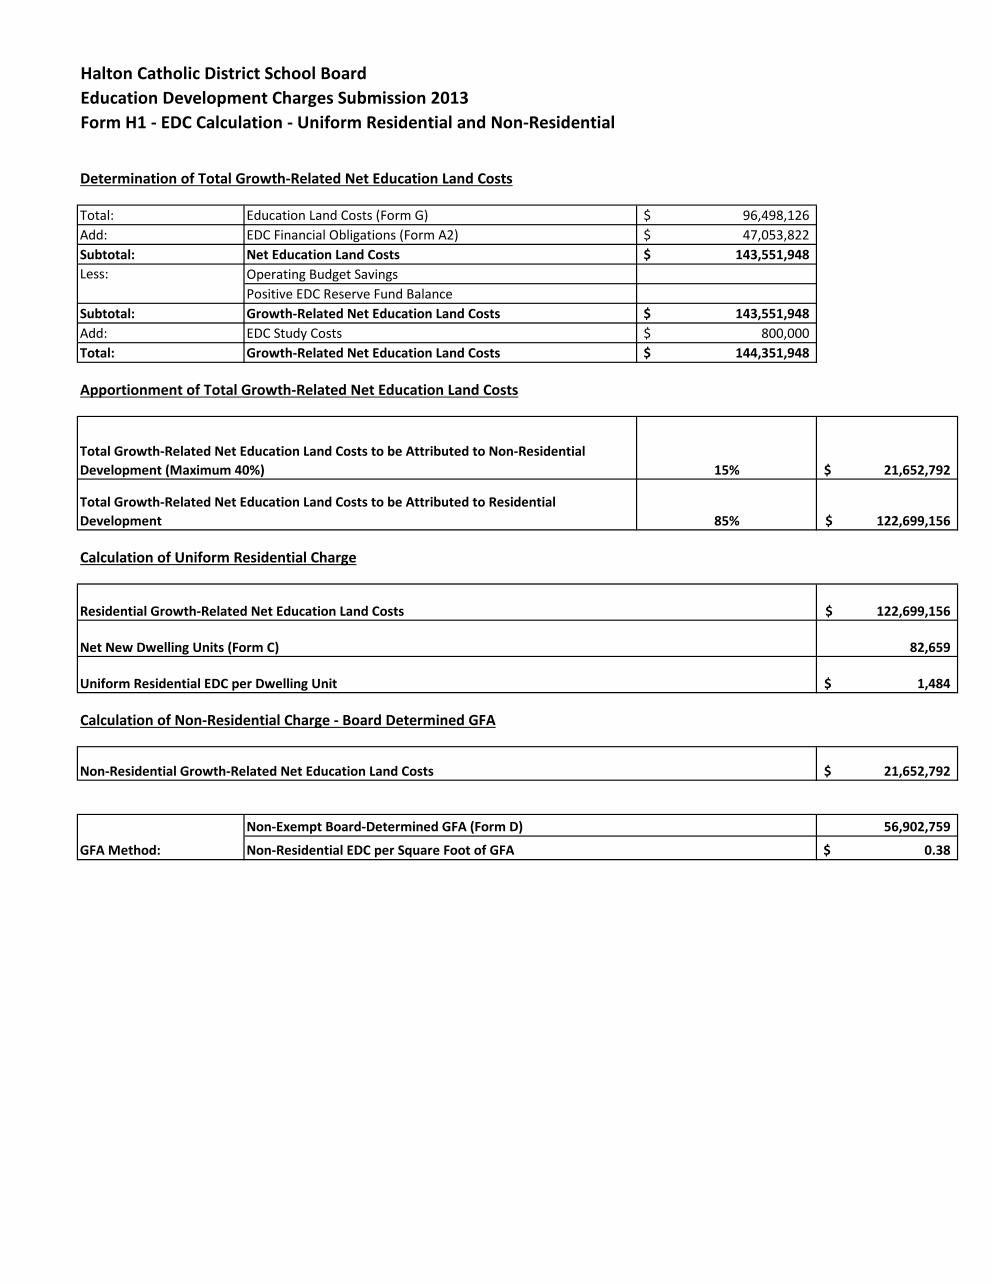
Halton Catholic District School BoardEducation Development Charges Submission 2013Form H1 - EDC Calculation - Uniform Residential and Non-Residential
Determination of Total Growth-Related Net Education Land Costs
Total: Education Land Costs (Form G) 96,498,126$ Add: EDC Financial Obligations (Form A2) 47,053,822$ Subtotal: Net Education Land Costs 143,551,948$
Operating Budget SavingsPositive EDC Reserve Fund Balance
Subtotal: Growth-Related Net Education Land Costs 143,551,948$ Add: EDC Study Costs 800,000$ Total: Growth-Related Net Education Land Costs 144,351,948$
Apportionment of Total Growth-Related Net Education Land Costs
Calculation of Uniform Residential Charge
Calculation of Non-Residential Charge - Board Determined GFA
56,902,759
0.38$ GFA Method:
Non-Exempt Board-Determined GFA (Form D)
Non-Residential EDC per Square Foot of GFA
Non-Residential Growth-Related Net Education Land Costs 21,652,792$
1,484$
Residential Growth-Related Net Education Land Costs
Net New Dwelling Units (Form C)
Uniform Residential EDC per Dwelling Unit
122,699,156$
82,659
21,652,792$
122,699,156$
Less:
Total Growth-Related Net Education Land Costs to be Attributed to Non-Residential Development (Maximum 40%)
Total Growth-Related Net Education Land Costs to be Attributed to Residential Development
15%
85%
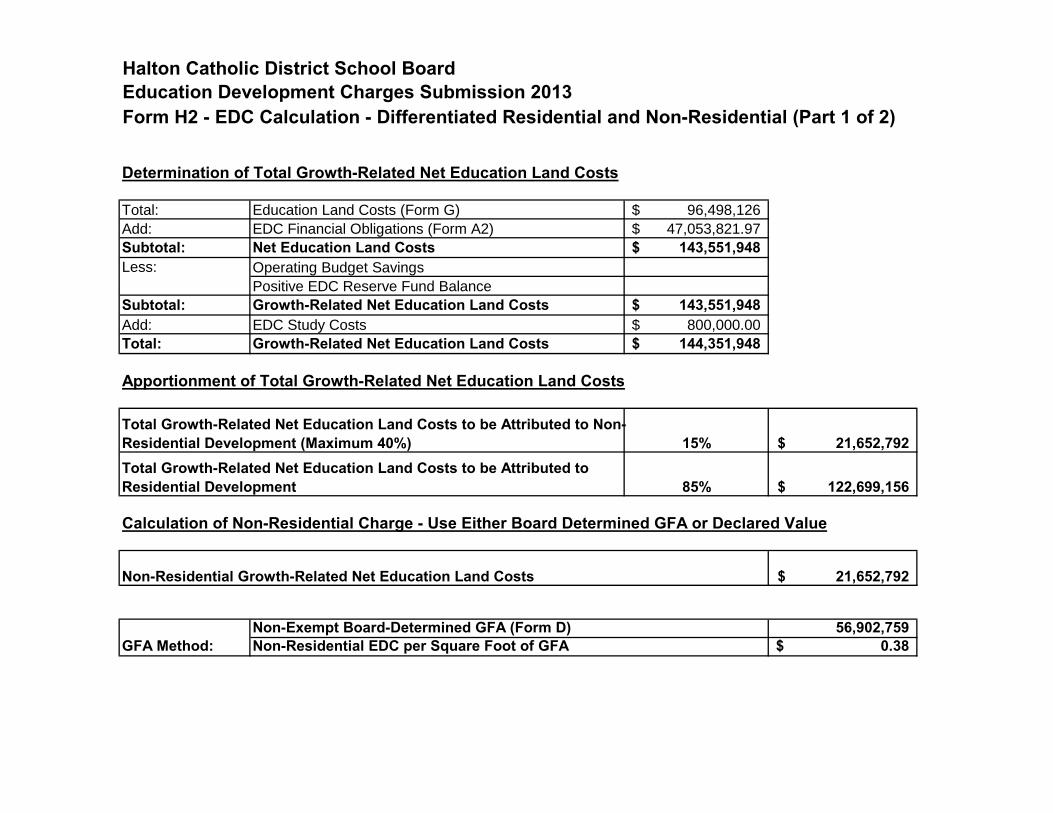
Halton Catholic District School BoardEducation Development Charges Submission 2013Form H2 - EDC Calculation - Differentiated Residential and Non-Residential (Part 1 of 2)
Determination of Total Growth-Related Net Education Land Costs
Total: Education Land Costs (Form G) 96,498,126$
Add: EDC Financial Obligations (Form A2) 47,053,821.97$
Subtotal: Net Education Land Costs 143,551,948$ Operating Budget Savings
Positive EDC Reserve Fund Balance
Subtotal: Growth-Related Net Education Land Costs 143,551,948$ Add: EDC Study Costs 800,000.00$
Total: Growth-Related Net Education Land Costs 144,351,948$
Apportionment of Total Growth-Related Net Education Land Costs
Calculation of Non-Residential Charge - Use Either Board Determined GFA or Declared Value
56,902,759 0.38$
21,652,792$
GFA Method:Non-Exempt Board-Determined GFA (Form D)Non-Residential EDC per Square Foot of GFA
Non-Residential Growth-Related Net Education Land Costs
Total Growth-Related Net Education Land Costs to be Attributed to Residential Development 85% 122,699,156$
Less:
Total Growth-Related Net Education Land Costs to be Attributed to Non-Residential Development (Maximum 40%) 15% 21,652,792$
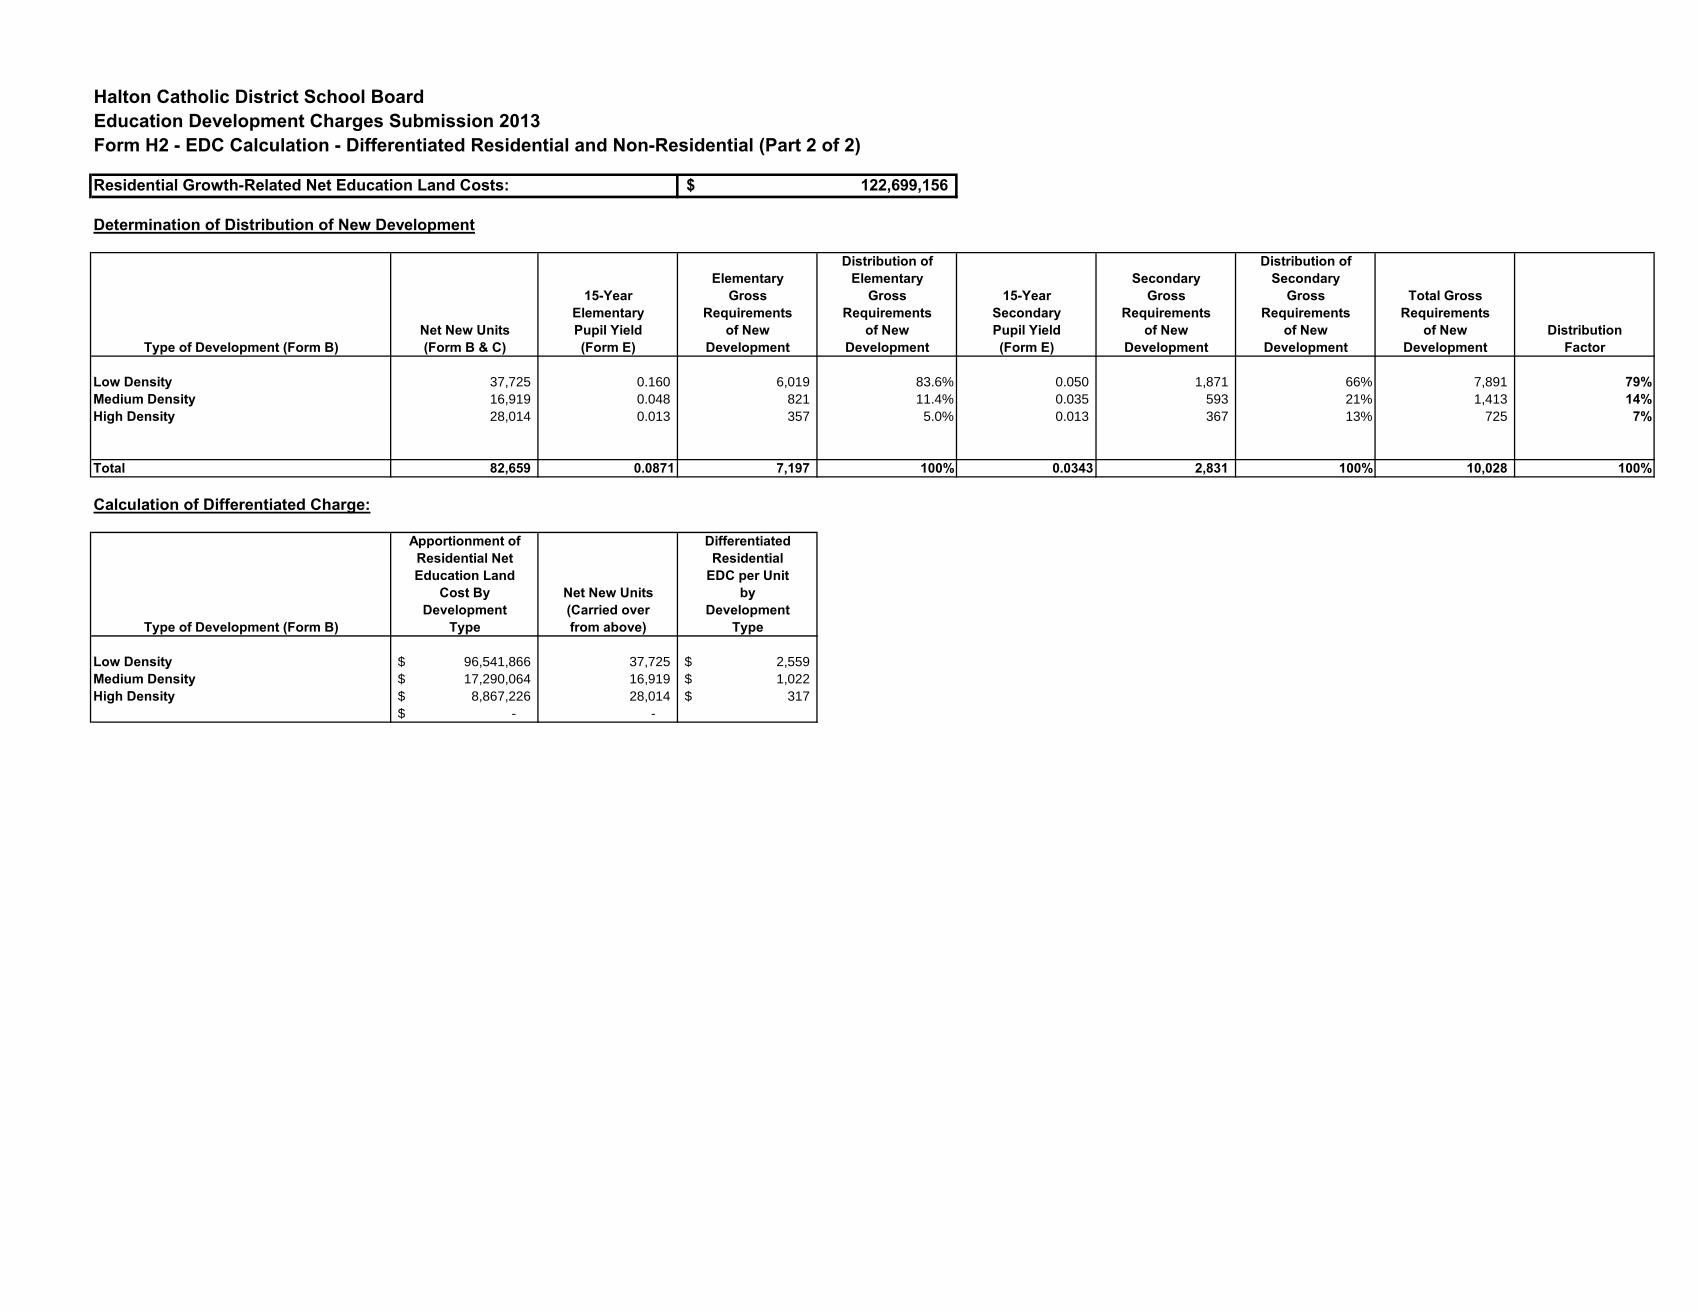
Halton Catholic District School BoardEducation Development Charges Submission 2013Form H2 - EDC Calculation - Differentiated Residential and Non-Residential (Part 2 of 2)
Residential Growth-Related Net Education Land Costs:
Determination of Distribution of New Development
Distribution of Distribution ofElementary Elementary Secondary Secondary
15-Year Gross Gross 15-Year Gross Gross Total GrossElementary Requirements Requirements Secondary Requirements Requirements Requirements
Net New Units Pupil Yield of New of New Pupil Yield of New of New of New DistributionType of Development (Form B) (Form B & C) (Form E) Development Development (Form E) Development Development Development Factor
Low Density 37,725 0.160 6,019 83.6% 0.050 1,871 66% 7,891 79%Medium Density 16,919 0.048 821 11.4% 0.035 593 21% 1,413 14%High Density 28,014 0.013 357 5.0% 0.013 367 13% 725 7%
Total 82,659 0.0871 7,197 100% 0.0343 2,831 100% 10,028 100%
Calculation of Differentiated Charge:
Apportionment of DifferentiatedResidential Net ResidentialEducation Land EDC per Unit
Cost By Net New Units byDevelopment (Carried over Development
Type of Development (Form B) Type from above) Type
Low Density 96,541,866$ 37,725 2,559$
Medium Density 17,290,064$ 16,919 1,022$
High Density 8,867,226$ 28,014 317$
-$ -
122,699,156$

Watson & Associates Economists Ltd. HDSB HCDSB FINAL EDC STUDY
APPENDIX B EDUCATION DEVELOPMENT CHARGE
PROPOSED DRAFT BY-LAWS
Watson & Associates Economists Ltd. HDSB HCDSB FINAL EDC STUDY
HALTON DISTRICT SCHOOL BOARD PROPOSED DRAFT BY-LAW

134632/449579 DOCS 12430517v2
HALTON DISTRICT SCHOOL BOARD
EDUCATION DEVELOPMENT CHARGES
BY-LAW, 2013
A by-law for the imposition of education development charges
WHEREAS section 257.54 (1) of the Education Act provides that a district school board may pass by-laws for the imposition of education development charges against land in its area of jurisdiction undergoing residential or non-residential development if there is residential development in the area of jurisdiction of the district school board that would increase education land costs and the residential or non-residential development require one or more of the actions identified in section 257.54(2) of the Education Act;
AND WHEREAS the Halton District School Board has referred to the Minister of Education the following estimates for approval:
(i) the total number of new elementary school pupils and new secondary school pupils; and
(ii) the number of elementary school sites and secondary school sites used to determine the net education land costs;
which estimates the Minister of Education approved on ●, in accordance with section 10 of Ontario Regulation 20/98;
AND WHEREAS the estimated average number of elementary school pupils of the Halton District School Board over the five years immediately following the day this by-law comes into force will exceed the total capacity of the Halton District School Board to accommodate the elementary school pupils throughout its jurisdiction on the day this by-law is passed;
AND WHEREAS the Halton District School Board has conducted a review of its education development charge policies and held a public meeting on May 22, 2013, in accordance with section 257.60 of the Education Act;
AND WHEREAS the Halton District School Board has given a copy of the education development charge background study relating to this by-law to the Minister of Education and to each school board having jurisdiction within the area to which this by-law applies;
AND WHEREAS the Halton District School Board has given notice and held public meetings on May 22, 2013 and June 19, 2013, in accordance with section 257.63(1) of the Education Act and permitted any person who attended the public meetings to make representations in respect of the proposed education development charges;
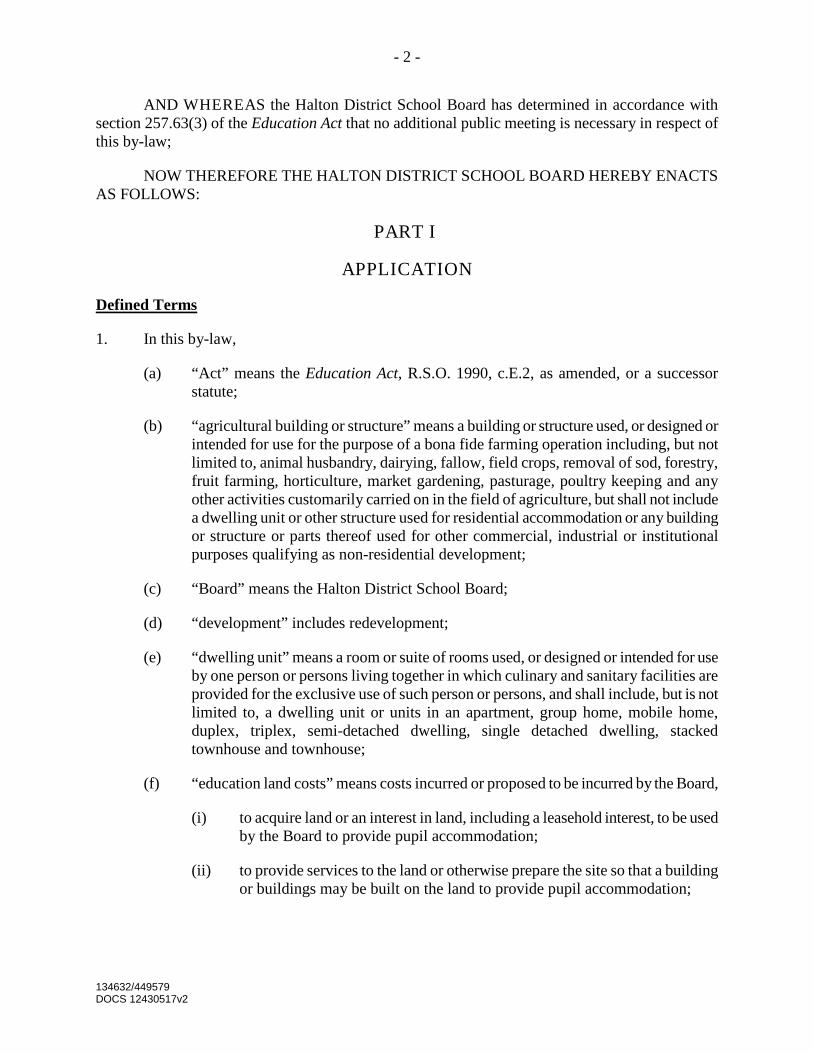
- 2 -
134632/449579 DOCS 12430517v2
AND WHEREAS the Halton District School Board has determined in accordance with section 257.63(3) of the Education Act that no additional public meeting is necessary in respect of this by-law;
NOW THEREFORE THE HALTON DISTRICT SCHOOL BOARD HEREBY ENACTS AS FOLLOWS:
PART I
APPLICATION
1. In this by-law,
Defined Terms
(a) “Act” means the Education Act, R.S.O. 1990, c.E.2, as amended, or a successor statute;
(b) “agricultural building or structure” means a building or structure used, or designed or intended for use for the purpose of a bona fide farming operation including, but not limited to, animal husbandry, dairying, fallow, field crops, removal of sod, forestry, fruit farming, horticulture, market gardening, pasturage, poultry keeping and any other activities customarily carried on in the field of agriculture, but shall not include a dwelling unit or other structure used for residential accommodation or any building or structure or parts thereof used for other commercial, industrial or institutional purposes qualifying as non-residential development;
(c) “Board” means the Halton District School Board;
(d) “development” includes redevelopment;
(e) “dwelling unit” means a room or suite of rooms used, or designed or intended for use by one person or persons living together in which culinary and sanitary facilities are provided for the exclusive use of such person or persons, and shall include, but is not limited to, a dwelling unit or units in an apartment, group home, mobile home, duplex, triplex, semi-detached dwelling, single detached dwelling, stacked townhouse and townhouse;
(f) “education land costs” means costs incurred or proposed to be incurred by the Board,
(i) to acquire land or an interest in land, including a leasehold interest, to be used by the Board to provide pupil accommodation;
(ii) to provide services to the land or otherwise prepare the site so that a building or buildings may be built on the land to provide pupil accommodation;
- 3 -
134632/449579 DOCS 12430517v2
(iii) to prepare and distribute education development charge background studies as required under the Act;
(iv) as interest on money borrowed to pay for costs described in paragraphs (i) and (ii); and
(v) to undertake studies in connection with an acquisition referred to in paragraph (i).
(g) “education development charge” means charges imposed pursuant to this by-law in accordance with the Act;
(h) “existing industrial building” means a building used for or in connection with,
(i) manufacturing, producing, processing, storing or distributing something,
(ii) research or development in connection with manufacturing, producing or processing something,
(iii) retail sales by a manufacturer, producer or processor of something they manufactured, produced or processed, if the retail sales are at the site where the manufacturing, production or processing takes place,
(iv) office or administrative purposes, if they are,
A. carried out with respect to manufacturing, producing, processing, storage or distributing of something, and
B. in or attached to the building or structure used for that manufacturing, producing, processing, storage or distribution;
(i) “gross floor area of non-residential development” means in the case of a non-residential building or structure or the non-residential portion of a mixed-use building or structure, the total floor area, measured between the outside of exterior walls or between the outside of exterior walls and the centre line of party walls dividing the building from another building, of all floors above the average level of finished ground adjoining the building at its exterior walls, and, for the purpose of this definition, the non-residential portion of a mixed-use building is deemed to include one-half of any area common to the residential and non-residential portions of such mixed-use building or structure;
(j) “local board” means a local board as defined in the Municipal Affairs Act, other than a board defined in section 257.53(1) of the Act;
- 4 -
134632/449579 DOCS 12430517v2
(k) “mixed use” means land, buildings or structures used, or designed or intended for use, for a combination of non-residential and residential uses;
(l) “non-residential building or structure” means a building or structure or portions thereof used, or designed or intended for use for other than residential use, and includes, but is not limited to, an office, retail, industrial or institutional building or structure;
(m) “non-residential development” means a development other than a residential development, and includes, but is not limited to, an office, retail, industrial or institutional development;
(n) “non-residential use” means lands, buildings or structures or portions thereof used, or designed or intended for use for other than residential use, and includes, but is not limited to, an office, retail, industrial or institutional use;
(o) “Planning Act” means the Planning Act, R.S.O. 1990, c. P.13, as amended;
(p) “Region” means the Regional Municipality of Halton;
(q) “Regulation” means Ontario Regulation 20/98, as amended, made under the Act;
(r) “residential development” means lands, buildings or structures developed or to be developed for residential use;
(s) “residential use” means lands, buildings or structures used, or designed or intended for use as a dwelling unit or units, and shall include a residential use accessory to a non-residential use and the residential component of a mixed use or of an agricultural use.
2. In this by-law where reference is made to a statute or a section of a statute such reference is deemed to be a reference to any successor statute or section.
3. (1) Subject to sections 3(2) and 3(3), this by-law applies to all lands in the Region.
Lands Affected
(2) This by-law shall not apply to lands that are owned by and are used for the purposes of:
(a) the Region or a local board thereof;
(b) a municipality or a local board thereof;
(c) a board as defined in section 257.53(1) of the Act;
- 5 -
134632/449579 DOCS 12430517v2
(d) a public hospital receiving aid under the Public Hospitals Act, R.S.O. 1990, c. P.40;
(e) a publicly-funded university, community college or a college of applied arts and technology established under the Ontario Colleges of Applied Art and Technology Act, 2002, S.O. 2002, c. 8, Schedule F, as amended;
(f) a seminary of learning maintained for educational purposes that is exempt from taxation under the Assessment Act, the whole profits from which are devoted or applied to such purposes;
(g) a place of worship owned by a religious organization that is exempt from taxation under the Assessment Act that is used primarily as a place of public worship;
(h) a cemetery or burying ground that is exempt from taxation under the Assessment Act; and
(i) The Toronto Area Transit Operating Authority (“GO Transit”).
(3) This by-law shall not apply to non-residential agricultural buildings or structures that are owned by and are used for the purposes of a bona fide farming operation.
4. (1) Education development charges shall be imposed against all lands, buildings or structures undergoing residential development if the development requires one or more of the following:
Approvals for Development
a) the passing of a zoning by-law or of an amendment thereto under section 34 of the Planning Act;
b) the approval of a minor variance under section 45 of the Planning Act;
c) a conveyance of land to which a by-law passed under subsection 50(7) of the Planning Act applies;
d) the approval of a plan of subdivision under section 51 of the Planning Act;
e) a consent under section 53 of the Planning Act;
f) the approval of a description under section 9 of the Condominium Act, 1998, S.O. 1998, c. 19; or
g) the issuing of a permit under the Building Code Act, 1992, S.O. 1992, c. 23 in relation to a building or structure.
- 6 -
134632/449579 DOCS 12430517v2
(2) In respect of a particular development an education development charge will be collected once, but this does not prevent the application of this by-law to future development on the same property.
5. (1) Education development charges shall be imposed against all lands, buildings or structures undergoing non-residential development which has the effect of creating gross floor area of non-residential development or of increasing existing gross floor area of non-residential development if the development requires one or more of the following:
a) the passing of a zoning by-law or of an amendment thereto under section 34 of the Planning Act;
b) the approval of a minor variance under section 45 of the Planning Act;
c) a conveyance of land to which a by-law passed under subsection 50(7) of the Planning Act applies;
d) the approval of a plan of subdivision under section 51 of the Planning Act;
e) a consent under section 53 of the Planning Act;
f) the approval of a description under section 9 of the Condominium Act, 1998, S.O. 1998, c. 19; or
g) the issuing of a permit under the Building Code Act, 1992, S.O. 1992, c. 23 in relation to a building or structure.
(2) In respect of a particular development an education development charge will be collected once, but this does not prevent the application of this by-law to future development on the same property.
6. The Board has determined that the residential development of land to which this by-law applies increases education land costs.
7. Subject to the provisions of this by-law, education development charges shall be imposed upon all categories of residential development and non-residential development.
Categories of Development and Uses of Land Subject to Education Development Charges
8. Subject to the provisions of this by-law, education development charges shall be imposed upon all uses of land, buildings or structures.
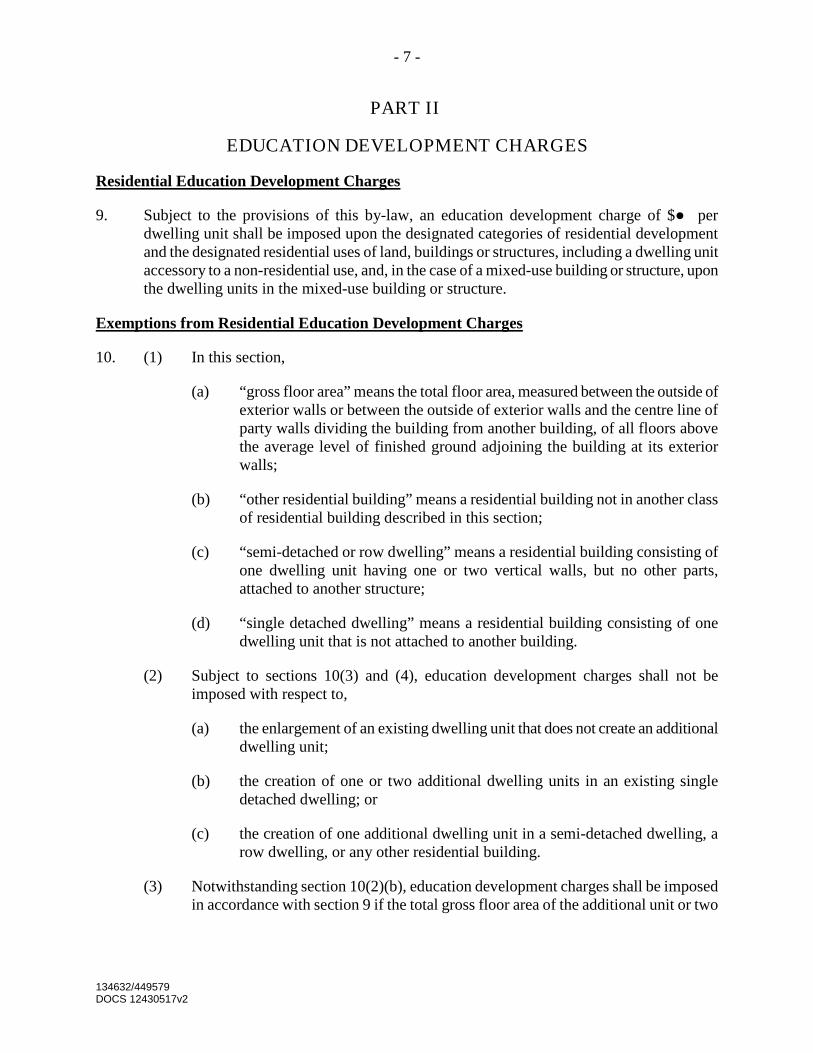
- 7 -
134632/449579 DOCS 12430517v2
PART II
EDUCATION DEVELOPMENT CHARGES
9. Subject to the provisions of this by-law, an education development charge of $● per dwelling unit shall be imposed upon the designated categories of residential development and the designated residential uses of land, buildings or structures, including a dwelling unit accessory to a non-residential use, and, in the case of a mixed-use building or structure, upon the dwelling units in the mixed-use building or structure.
Residential Education Development Charges
10. (1) In this section,
Exemptions from Residential Education Development Charges
(a) “gross floor area” means the total floor area, measured between the outside of exterior walls or between the outside of exterior walls and the centre line of party walls dividing the building from another building, of all floors above the average level of finished ground adjoining the building at its exterior walls;
(b) “other residential building” means a residential building not in another class of residential building described in this section;
(c) “semi-detached or row dwelling” means a residential building consisting of one dwelling unit having one or two vertical walls, but no other parts, attached to another structure;
(d) “single detached dwelling” means a residential building consisting of one dwelling unit that is not attached to another building.
(2) Subject to sections 10(3) and (4), education development charges shall not be imposed with respect to,
(a) the enlargement of an existing dwelling unit that does not create an additional dwelling unit;
(b) the creation of one or two additional dwelling units in an existing single detached dwelling; or
(c) the creation of one additional dwelling unit in a semi-detached dwelling, a row dwelling, or any other residential building.
(3) Notwithstanding section 10(2)(b), education development charges shall be imposed in accordance with section 9 if the total gross floor area of the additional unit or two
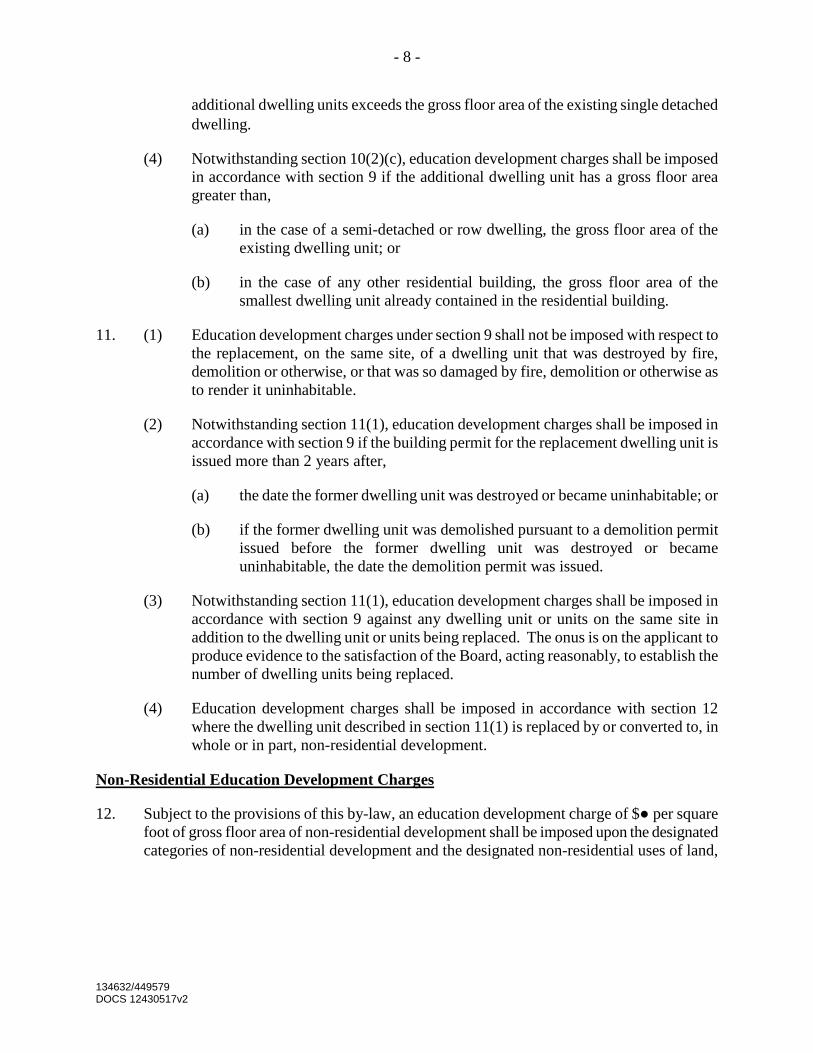
- 8 -
134632/449579 DOCS 12430517v2
additional dwelling units exceeds the gross floor area of the existing single detached dwelling.
(4) Notwithstanding section 10(2)(c), education development charges shall be imposed in accordance with section 9 if the additional dwelling unit has a gross floor area greater than,
(a) in the case of a semi-detached or row dwelling, the gross floor area of the existing dwelling unit; or
(b) in the case of any other residential building, the gross floor area of the smallest dwelling unit already contained in the residential building.
11. (1) Education development charges under section 9 shall not be imposed with respect to the replacement, on the same site, of a dwelling unit that was destroyed by fire, demolition or otherwise, or that was so damaged by fire, demolition or otherwise as to render it uninhabitable.
(2) Notwithstanding section 11(1), education development charges shall be imposed in accordance with section 9 if the building permit for the replacement dwelling unit is issued more than 2 years after,
(a) the date the former dwelling unit was destroyed or became uninhabitable; or
(b) if the former dwelling unit was demolished pursuant to a demolition permit issued before the former dwelling unit was destroyed or became uninhabitable, the date the demolition permit was issued.
(3) Notwithstanding section 11(1), education development charges shall be imposed in accordance with section 9 against any dwelling unit or units on the same site in addition to the dwelling unit or units being replaced. The onus is on the applicant to produce evidence to the satisfaction of the Board, acting reasonably, to establish the number of dwelling units being replaced.
(4) Education development charges shall be imposed in accordance with section 12 where the dwelling unit described in section 11(1) is replaced by or converted to, in whole or in part, non-residential development.
12. Subject to the provisions of this by-law, an education development charge of $● per square foot of gross floor area of non-residential development shall be imposed upon the designated categories of non-residential development and the designated non-residential uses of land,
Non-Residential Education Development Charges

- 9 -
134632/449579 DOCS 12430517v2
buildings or structures and, in the case of a mixed use building or structure, upon the non-residential uses in the mixed-use building or structure.
13. Notwithstanding section 12 of this by-law, education development charges shall not be imposed upon a non-residential development if the development does not have the effect of creating gross floor area of non-residential development or of increasing existing gross floor area of non-residential development.
Exemptions from Non-Residential Education Development Charges
14. (1) Education development charges under section 12 shall not be imposed with respect to the replacement, on the same site, of a non-residential building or structure that was destroyed by fire, demolition or otherwise, or that was so damaged by fire, demolition or otherwise as to render it unusable.
(2) Notwithstanding section 14(1), education development charges shall be imposed in accordance with section 12 if the building permit for the replacement non-residential building or structure is issued more than 5 years after,
(a) the date the former building or structure was destroyed or became unusable; or
(b) if the former building or structure was demolished pursuant to a demolition permit issued before the former building or structure was destroyed or became unusable, the date the demolition permit was issued.
(3) Notwithstanding section 14(1), if the gross floor area of the non-residential part of the replacement building or structure exceeds the gross floor area of the non-residential part of the building or structure being replaced, education development charges shall be imposed in accordance with section 12 against the additional gross floor area. The onus is on the applicant to produce evidence to the satisfaction of the Board, acting reasonably, to establish the gross floor area of the non-residential building or structure being replaced.
(4) Education development charges shall be imposed in accordance with section 9 if the non-residential building or structure described in section 14(1) is replaced by or converted to, in whole or in part, a dwelling unit or units.
(5) Education development charges under section 12 shall not be imposed in regard to a non-residential development with a gross floor area of 100 square feet or less.
15. If a development includes the enlargement of the gross floor area of an existing industrial building, the amount of the education development charge that is payable in respect of the enlargement shall be determined in accordance with the following rules:
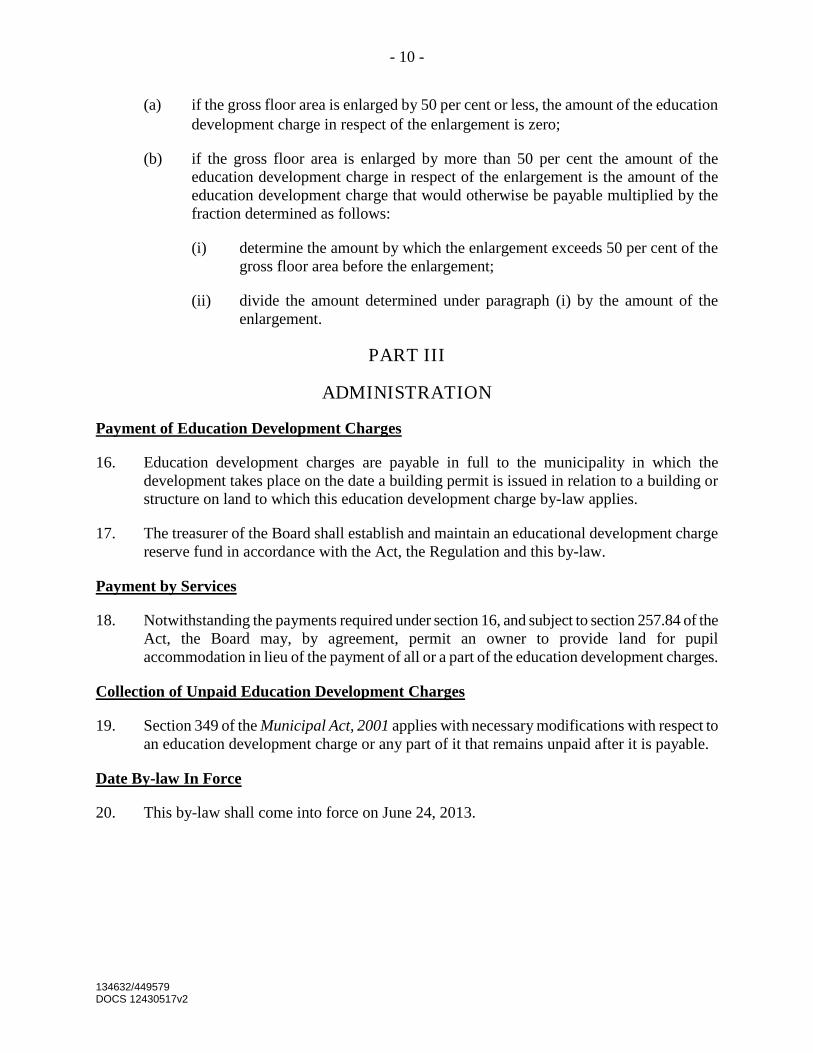
- 10 -
134632/449579 DOCS 12430517v2
(a) if the gross floor area is enlarged by 50 per cent or less, the amount of the education development charge in respect of the enlargement is zero;
(b) if the gross floor area is enlarged by more than 50 per cent the amount of the education development charge in respect of the enlargement is the amount of the education development charge that would otherwise be payable multiplied by the fraction determined as follows:
(i) determine the amount by which the enlargement exceeds 50 per cent of the gross floor area before the enlargement;
(ii) divide the amount determined under paragraph (i) by the amount of the enlargement.
PART III
ADMINISTRATION
16. Education development charges are payable in full to the municipality in which the development takes place on the date a building permit is issued in relation to a building or structure on land to which this education development charge by-law applies.
Payment of Education Development Charges
17. The treasurer of the Board shall establish and maintain an educational development charge reserve fund in accordance with the Act, the Regulation and this by-law.
18. Notwithstanding the payments required under section 16, and subject to section 257.84 of the Act, the Board may, by agreement, permit an owner to provide land for pupil accommodation in lieu of the payment of all or a part of the education development charges.
Payment by Services
19. Section 349 of the Municipal Act, 2001 applies with necessary modifications with respect to an education development charge or any part of it that remains unpaid after it is payable.
Collection of Unpaid Education Development Charges
20. This by-law shall come into force on June 24, 2013.
Date By-law In Force

- 11 -
134632/449579 DOCS 12430517v2
Date By-law Expires
21. This by-law shall expire five years after the date it comes into force, unless it is repealed at an earlier date.
22. The Halton District School Board Education Development Charges By-law. 2009, is hereby repealed effective June 24, 2013.
Repeal
23. In the event any provision, or part thereof, of this by-law is found by a court of competent jurisdiction to be ultra vires, such provision, or part thereof, shall be deemed to be severed, and the remaining portion of such provision and all other provisions of this by-law shall remain in full force and effect.
Severability
24. Nothing in this by-law shall be construed so as to commit or require the Board to authorize or proceed with any capital project at any time.
Interpretation
25. This by-law may be cited as the Halton District School Board Education Development Charges By-Law, 2013.
Short Title
ENACTED AND PASSED this 19th day of June, 2013.
Chairperson Director of Education and Secretary
Watson & Associates Economists Ltd. HDSB HCDSB FINAL EDC STUDY
HALTON CATHOLIC DISTRICT SCHOOL BOARD PROPOSED DRAFT BY-LAW

137742/449580 DOCS 12430347v2
HALTON CATHOLIC DISTRICT SCHOOL BOARD
EDUCATION DEVELOPMENT CHARGES
BY-LAW, 2013
A by-law for the imposition of education development charges
WHEREAS section 257.54 (1) of the Education Act provides that a district school board may pass by-laws for the imposition of education development charges against land in its area of jurisdiction undergoing residential or non-residential development if there is residential development in the area of jurisdiction of the district school board that would increase education land costs and the residential or non-residential development require one or more of the actions identified in section 257.54(2) of the Education Act;
AND WHEREAS the Halton Catholic District School Board has referred to the Minister of Education the following estimates for approval:
(i) the total number of new elementary school pupils and new secondary school pupils; and
(ii) the number of elementary school sites and secondary school sites used to determine the net education land costs;
which estimates the Minister of Education approved on ●, in accordance with section 10 of Ontario Regulation 20/98;
AND WHEREAS the estimated average number of elementary school pupils and secondary school pupils of the Halton Catholic District School Board over the five years immediately following the day this by-law comes into force will exceed the total capacity of the Halton Catholic District School Board to accommodate the elementary school pupils and the secondary school pupils throughout its jurisdiction on the day this by-law is passed;
AND WHEREAS the Halton Catholic District School Board has conducted a review of its education development charge policies and held a public meeting on May 21, 2013, in accordance with section 257.60 of the Education Act;
AND WHEREAS the Halton Catholic District School Board has given a copy of the education development charge background study relating to this by-law to the Minister of Education and to each school board having jurisdiction within the area to which this by-law applies;
AND WHEREAS the Halton Catholic District School Board has given notice and held public meetings on May 21, 2013 and June 18, 2013, in accordance with section 257.63(1) of the

- 2 -
137742/449580 DOCS 12430347v2
Education Act and permitted any person who attended the public meetings to make representations in respect of the proposed education development charges;
AND WHEREAS the Halton Catholic District School Board has determined in accordance with section 257.63(3) of the Education Act that no additional public meeting is necessary in respect of this by-law;
NOW THEREFORE THE HALTON CATHOLIC DISTRICT SCHOOL BOARD HEREBY ENACTS AS FOLLOWS:
PART I
APPLICATION
1. In this by-law,
Defined Terms
(a) “Act” means the Education Act, R.S.O. 1990, c.E.2, as amended, or a successor statute;
(b) “agricultural building or structure” means a building or structure used, or designed or intended for use for the purpose of a bona fide farming operation including, but not limited to, animal husbandry, dairying, fallow, field crops, removal of sod, forestry, fruit farming, horticulture, market gardening, pasturage, poultry keeping and any other activities customarily carried on in the field of agriculture, but shall not include a dwelling unit or other structure used for residential accommodation or any building or structure or parts thereof used for other commercial, industrial or institutional purposes qualifying as non-residential development;
(c) “Board” means the Halton Catholic District School Board;
(d) “development” includes redevelopment;
(e) “dwelling unit” means a room or suite of rooms used, or designed or intended for use by one person or persons living together in which culinary and sanitary facilities are provided for the exclusive use of such person or persons, and shall include, but is not limited to, a dwelling unit or units in an apartment, group home, mobile home, duplex, triplex, semi-detached dwelling, single detached dwelling, stacked townhouse and townhouse;
(f) “education land costs” means costs incurred or proposed to be incurred by the Board,
(i) to acquire land or an interest in land, including a leasehold interest, to be used by the Board to provide pupil accommodation;
- 3 -
137742/449580 DOCS 12430347v2
(ii) to provide services to the land or otherwise prepare the site so that a building or buildings may be built on the land to provide pupil accommodation;
(iii) to prepare and distribute education development charge background studies as required under the Act;
(iv) as interest on money borrowed to pay for costs described in paragraphs (i) and (ii); and
(v) to undertake studies in connection with an acquisition referred to in paragraph (i).
(g) “education development charge” means charges imposed pursuant to this by-law in accordance with the Act;
(h) “existing industrial building” means a building used for or in connection with,
(i) manufacturing, producing, processing, storing or distributing something,
(ii) research or development in connection with manufacturing, producing or processing something,
(iii) retail sales by a manufacturer, producer or processor of something they manufactured, produced or processed, if the retail sales are at the site where the manufacturing, production or processing takes place,
(iv) office or administrative purposes, if they are,
A. carried out with respect to manufacturing, producing, processing, storage or distributing of something, and
B. in or attached to the building or structure used for that manufacturing, producing, processing, storage or distribution;
(i) “gross floor area of non-residential development” means in the case of a non-residential building or structure or the non-residential portion of a mixed-use building or structure, the total floor area, measured between the outside of exterior walls or between the outside of exterior walls and the centre line of party walls dividing the building from another building, of all floors above the average level of finished ground adjoining the building at its exterior walls, and, for the purpose of this definition, the non-residential portion of a mixed-use building is deemed to include one-half of any area common to the residential and non-residential portions of such mixed-use building or structure;
- 4 -
137742/449580 DOCS 12430347v2
(j) “local board” means a local board as defined in the Municipal Affairs Act, other than a board defined in section 257.53(1) of the Act;
(k) “mixed use” means land, buildings or structures used, or designed or intended for use, for a combination of non-residential and residential uses;
(l) “non-residential building or structure” means a building or structure or portions thereof used, or designed or intended for use for other than residential use, and includes, but is not limited to, an office, retail, industrial or institutional building or structure;
(m) “non-residential development” means a development other than a residential development, and includes, but is not limited to, an office, retail, industrial or institutional development;
(n) “non-residential use” means lands, buildings or structures or portions thereof used, or designed or intended for use for other than residential use, and includes, but is not limited to, an office, retail, industrial or institutional use;
(o) “Planning Act” means the Planning Act, R.S.O. 1990, c. P.13, as amended;
(p) “Region” means the Regional Municipality of Halton;
(q) “Regulation” means Ontario Regulation 20/98, as amended, made under the Act;
(r) “residential development” means lands, buildings or structures developed or to be developed for residential use;
(s) “residential use” means lands, buildings or structures used, or designed or intended for use as a dwelling unit or units, and shall include a residential use accessory to a non-residential use and the residential component of a mixed use or of an agricultural use.
2. In this by-law where reference is made to a statute or a section of a statute such reference is deemed to be a reference to any successor statute or section.
3. (1) Subject to sections 3(2) and 3(3), this by-law applies to all lands in the Region.
Lands Affected
(2) This by-law shall not apply to lands that are owned by and are used for the purposes of:
(a) the Region or a local board thereof;
- 5 -
137742/449580 DOCS 12430347v2
(b) a municipality or a local board thereof;
(c) a board as defined in section 257.53(1) of the Act;
(d) a public hospital receiving aid under the Public Hospitals Act, R.S.O. 1990, c. P.40;
(e) a publicly-funded university, community college or a college of applied arts and technology established under the Ontario Colleges of Applied Art and Technology Act, 2002, S.O. 2002, c. 8, Schedule F, as amended;
(f) a seminary of learning maintained for educational purposes that is exempt from taxation under the Assessment Act, the whole profits from which are devoted or applied to such purposes;
(g) a place of worship owned by a religious organization that is exempt from taxation under the Assessment Act that is used primarily as a place of public worship;
(h) a cemetery or burying ground that is exempt from taxation under the Assessment Act; and
(i) The Toronto Area Transit Operating Authority (“GO Transit”).
(3) This by-law shall not apply to non-residential agricultural buildings or structures that are owned by and are used for the purposes of a bona fide farming operation.
4. (1) Education development charges shall be imposed against all lands, buildings or structures undergoing residential development if the development requires one or more of the following:
Approvals for Development
a) the passing of a zoning by-law or of an amendment thereto under section 34 of the Planning Act;
b) the approval of a minor variance under section 45 of the Planning Act;
c) a conveyance of land to which a by-law passed under subsection 50(7) of the Planning Act applies;
d) the approval of a plan of subdivision under section 51 of the Planning Act;
e) a consent under section 53 of the Planning Act;
- 6 -
137742/449580 DOCS 12430347v2
f) the approval of a description under section 9 of the Condominium Act, 1998, S.O. 1998, c. 19; or
g) the issuing of a permit under the Building Code Act, 1992, S.O. 1992, c. 23 in relation to a building or structure.
(2) In respect of a particular development an education development charge will be collected once, but this does not prevent the application of this by-law to future development on the same property.
5. (1) Education development charges shall be imposed against all lands, buildings or structures undergoing non-residential development which has the effect of creating gross floor area of non-residential development or of increasing existing gross floor area of non-residential development if the development requires one or more of the following:
a) the passing of a zoning by-law or of an amendment thereto under section 34 of the Planning Act;
b) the approval of a minor variance under section 45 of the Planning Act;
c) a conveyance of land to which a by-law passed under subsection 50(7) of the Planning Act applies;
d) the approval of a plan of subdivision under section 51 of the Planning Act;
e) a consent under section 53 of the Planning Act;
f) the approval of a description under section 9 of the Condominium Act, 1998, S.O. 1998, c. 19; or
g) the issuing of a permit under the Building Code Act, 1992, S.O. 1992, c. 23 in relation to a building or structure.
(2) In respect of a particular development an education development charge will be collected once, but this does not prevent the application of this by-law to future development on the same property.
6. The Board has determined that the residential development of land to which this by-law applies increases education land costs.
7. Subject to the provisions of this by-law, education development charges shall be imposed upon all categories of residential development and non-residential development.
Categories of Development and Uses of Land Subject to Education Development Charges
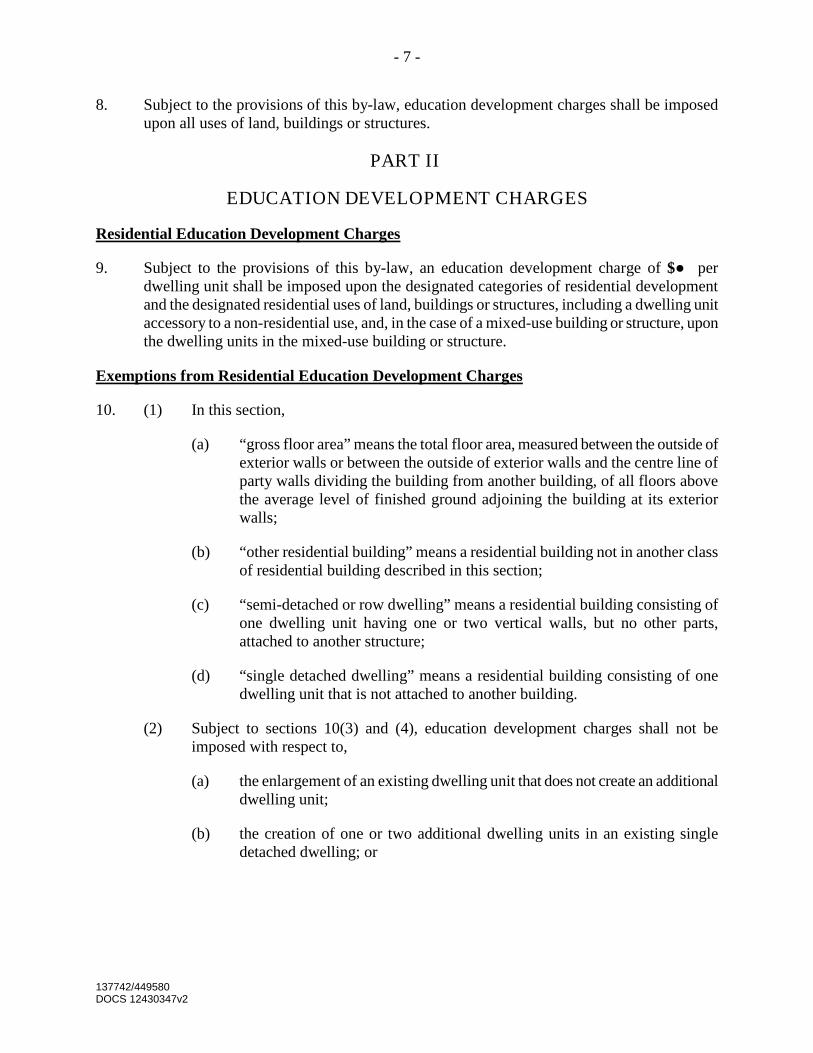
- 7 -
137742/449580 DOCS 12430347v2
8. Subject to the provisions of this by-law, education development charges shall be imposed upon all uses of land, buildings or structures.
PART II
EDUCATION DEVELOPMENT CHARGES
9. Subject to the provisions of this by-law, an education development charge of $● per dwelling unit shall be imposed upon the designated categories of residential development and the designated residential uses of land, buildings or structures, including a dwelling unit accessory to a non-residential use, and, in the case of a mixed-use building or structure, upon the dwelling units in the mixed-use building or structure.
Residential Education Development Charges
10. (1) In this section,
Exemptions from Residential Education Development Charges
(a) “gross floor area” means the total floor area, measured between the outside of exterior walls or between the outside of exterior walls and the centre line of party walls dividing the building from another building, of all floors above the average level of finished ground adjoining the building at its exterior walls;
(b) “other residential building” means a residential building not in another class of residential building described in this section;
(c) “semi-detached or row dwelling” means a residential building consisting of one dwelling unit having one or two vertical walls, but no other parts, attached to another structure;
(d) “single detached dwelling” means a residential building consisting of one dwelling unit that is not attached to another building.
(2) Subject to sections 10(3) and (4), education development charges shall not be imposed with respect to,
(a) the enlargement of an existing dwelling unit that does not create an additional dwelling unit;
(b) the creation of one or two additional dwelling units in an existing single detached dwelling; or
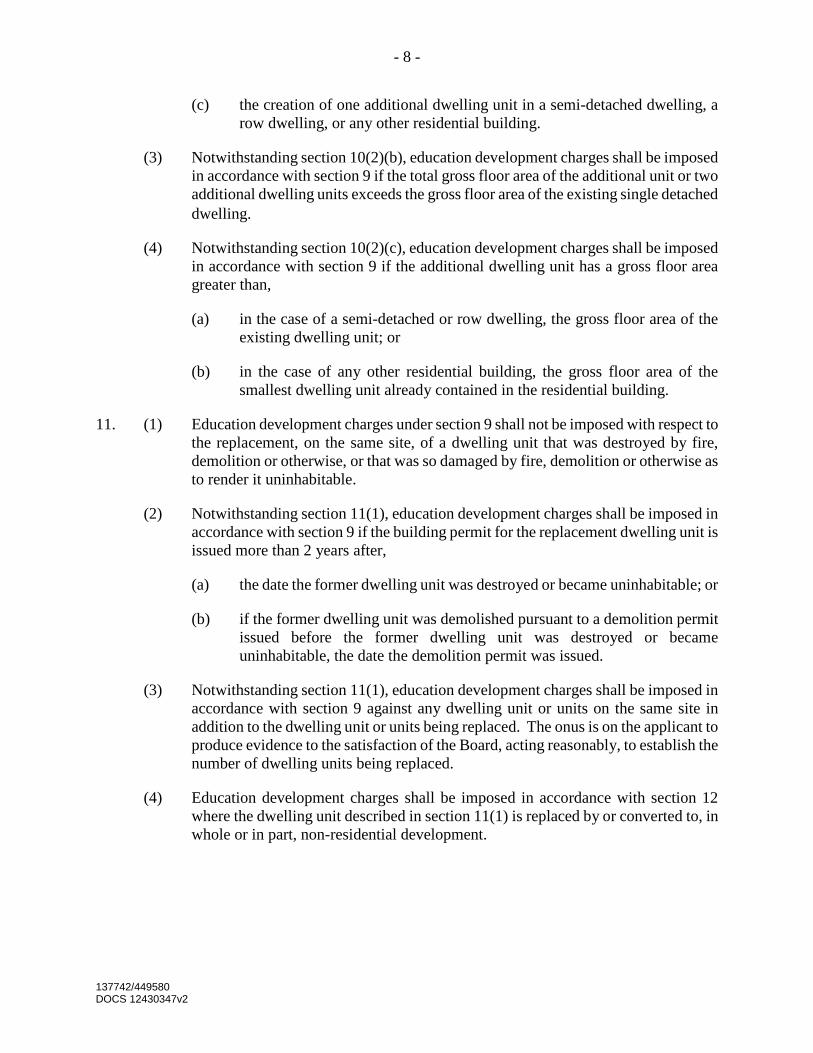
- 8 -
137742/449580 DOCS 12430347v2
(c) the creation of one additional dwelling unit in a semi-detached dwelling, a row dwelling, or any other residential building.
(3) Notwithstanding section 10(2)(b), education development charges shall be imposed in accordance with section 9 if the total gross floor area of the additional unit or two additional dwelling units exceeds the gross floor area of the existing single detached dwelling.
(4) Notwithstanding section 10(2)(c), education development charges shall be imposed in accordance with section 9 if the additional dwelling unit has a gross floor area greater than,
(a) in the case of a semi-detached or row dwelling, the gross floor area of the existing dwelling unit; or
(b) in the case of any other residential building, the gross floor area of the smallest dwelling unit already contained in the residential building.
11. (1) Education development charges under section 9 shall not be imposed with respect to the replacement, on the same site, of a dwelling unit that was destroyed by fire, demolition or otherwise, or that was so damaged by fire, demolition or otherwise as to render it uninhabitable.
(2) Notwithstanding section 11(1), education development charges shall be imposed in accordance with section 9 if the building permit for the replacement dwelling unit is issued more than 2 years after,
(a) the date the former dwelling unit was destroyed or became uninhabitable; or
(b) if the former dwelling unit was demolished pursuant to a demolition permit issued before the former dwelling unit was destroyed or became uninhabitable, the date the demolition permit was issued.
(3) Notwithstanding section 11(1), education development charges shall be imposed in accordance with section 9 against any dwelling unit or units on the same site in addition to the dwelling unit or units being replaced. The onus is on the applicant to produce evidence to the satisfaction of the Board, acting reasonably, to establish the number of dwelling units being replaced.
(4) Education development charges shall be imposed in accordance with section 12 where the dwelling unit described in section 11(1) is replaced by or converted to, in whole or in part, non-residential development.
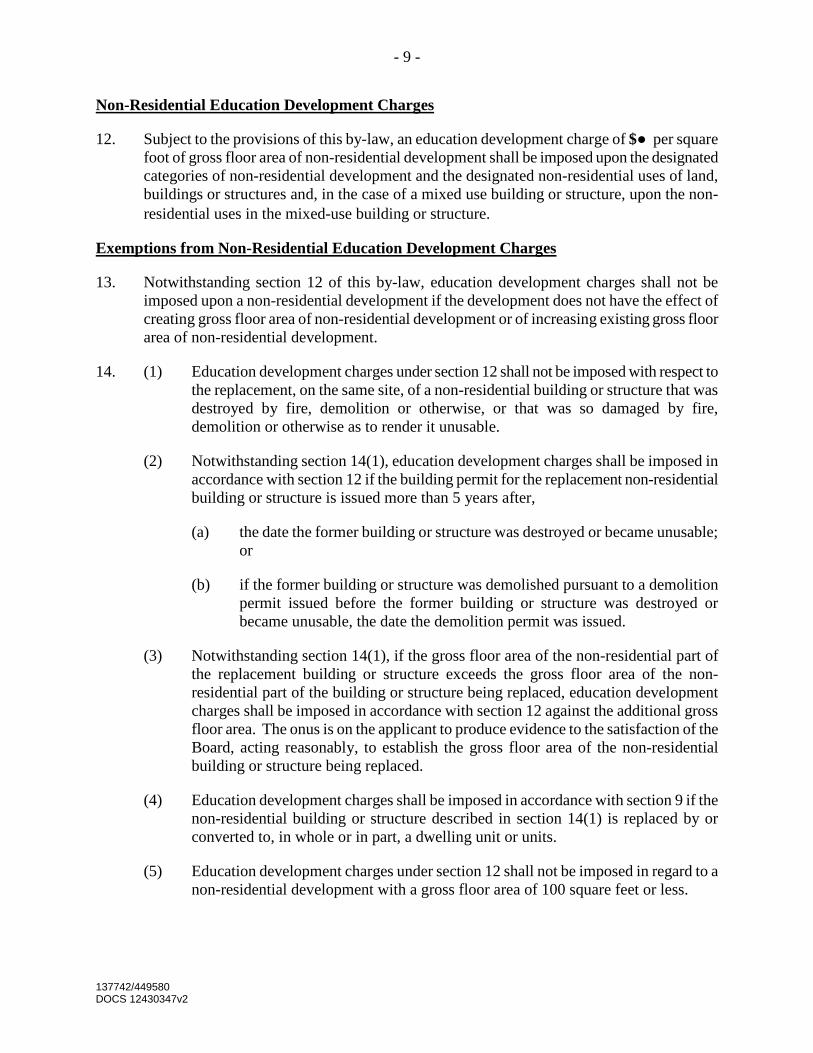
- 9 -
137742/449580 DOCS 12430347v2
12. Subject to the provisions of this by-law, an education development charge of $● per square foot of gross floor area of non-residential development shall be imposed upon the designated categories of non-residential development and the designated non-residential uses of land, buildings or structures and, in the case of a mixed use building or structure, upon the non-residential uses in the mixed-use building or structure.
Non-Residential Education Development Charges
13. Notwithstanding section 12 of this by-law, education development charges shall not be imposed upon a non-residential development if the development does not have the effect of creating gross floor area of non-residential development or of increasing existing gross floor area of non-residential development.
Exemptions from Non-Residential Education Development Charges
14. (1) Education development charges under section 12 shall not be imposed with respect to the replacement, on the same site, of a non-residential building or structure that was destroyed by fire, demolition or otherwise, or that was so damaged by fire, demolition or otherwise as to render it unusable.
(2) Notwithstanding section 14(1), education development charges shall be imposed in accordance with section 12 if the building permit for the replacement non-residential building or structure is issued more than 5 years after,
(a) the date the former building or structure was destroyed or became unusable; or
(b) if the former building or structure was demolished pursuant to a demolition permit issued before the former building or structure was destroyed or became unusable, the date the demolition permit was issued.
(3) Notwithstanding section 14(1), if the gross floor area of the non-residential part of the replacement building or structure exceeds the gross floor area of the non-residential part of the building or structure being replaced, education development charges shall be imposed in accordance with section 12 against the additional gross floor area. The onus is on the applicant to produce evidence to the satisfaction of the Board, acting reasonably, to establish the gross floor area of the non-residential building or structure being replaced.
(4) Education development charges shall be imposed in accordance with section 9 if the non-residential building or structure described in section 14(1) is replaced by or converted to, in whole or in part, a dwelling unit or units.
(5) Education development charges under section 12 shall not be imposed in regard to a non-residential development with a gross floor area of 100 square feet or less.
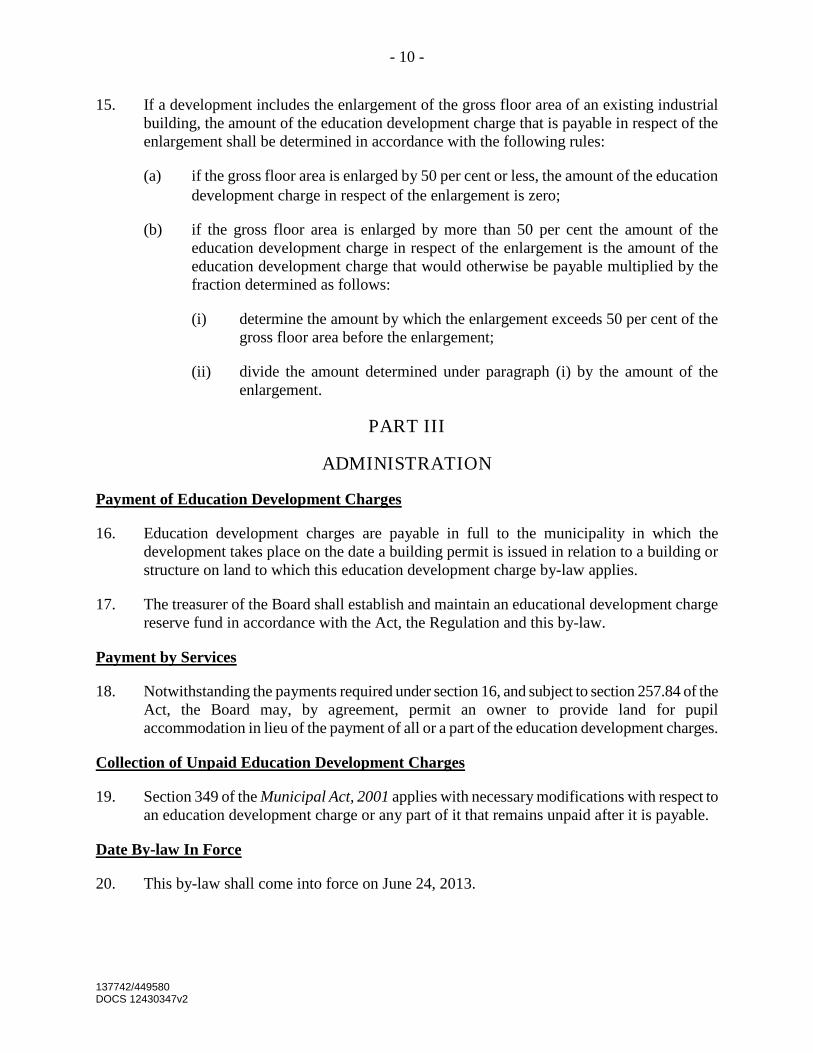
- 10 -
137742/449580 DOCS 12430347v2
15. If a development includes the enlargement of the gross floor area of an existing industrial building, the amount of the education development charge that is payable in respect of the enlargement shall be determined in accordance with the following rules:
(a) if the gross floor area is enlarged by 50 per cent or less, the amount of the education development charge in respect of the enlargement is zero;
(b) if the gross floor area is enlarged by more than 50 per cent the amount of the education development charge in respect of the enlargement is the amount of the education development charge that would otherwise be payable multiplied by the fraction determined as follows:
(i) determine the amount by which the enlargement exceeds 50 per cent of the gross floor area before the enlargement;
(ii) divide the amount determined under paragraph (i) by the amount of the enlargement.
PART III
ADMINISTRATION
16. Education development charges are payable in full to the municipality in which the development takes place on the date a building permit is issued in relation to a building or structure on land to which this education development charge by-law applies.
Payment of Education Development Charges
17. The treasurer of the Board shall establish and maintain an educational development charge reserve fund in accordance with the Act, the Regulation and this by-law.
18. Notwithstanding the payments required under section 16, and subject to section 257.84 of the Act, the Board may, by agreement, permit an owner to provide land for pupil accommodation in lieu of the payment of all or a part of the education development charges.
Payment by Services
19. Section 349 of the Municipal Act, 2001 applies with necessary modifications with respect to an education development charge or any part of it that remains unpaid after it is payable.
Collection of Unpaid Education Development Charges
20. This by-law shall come into force on June 24, 2013.
Date By-law In Force
- 11 -
137742/449580 DOCS 12430347v2
Date By-law Expires
21. This by-law shall expire five years after the date it comes into force, unless it is repealed at an earlier date.
22. The Halton Catholic District School Board Education Development Charges By-law, 2009, is hereby repealed effective June 24, 2013.
Repeal
23. In the event any provision, or part thereof, of this by-law is found by a court of competent jurisdiction to be ultra vires, such provision, or part thereof, shall be deemed to be severed, and the remaining portion of such provision and all other provisions of this by-law shall remain in full force and effect.
Severability
24. Nothing in this by-law shall be construed so as to commit or require the Board to authorize or proceed with any capital project at any time.
Interpretation
25. This by-law may be cited as the Halton Catholic District School Board Education Development Charges By-Law, 2013.
Short Title
ENACTED AND PASSED this 18th day of June, 2013.
Chairperson Director of Education and Secretary
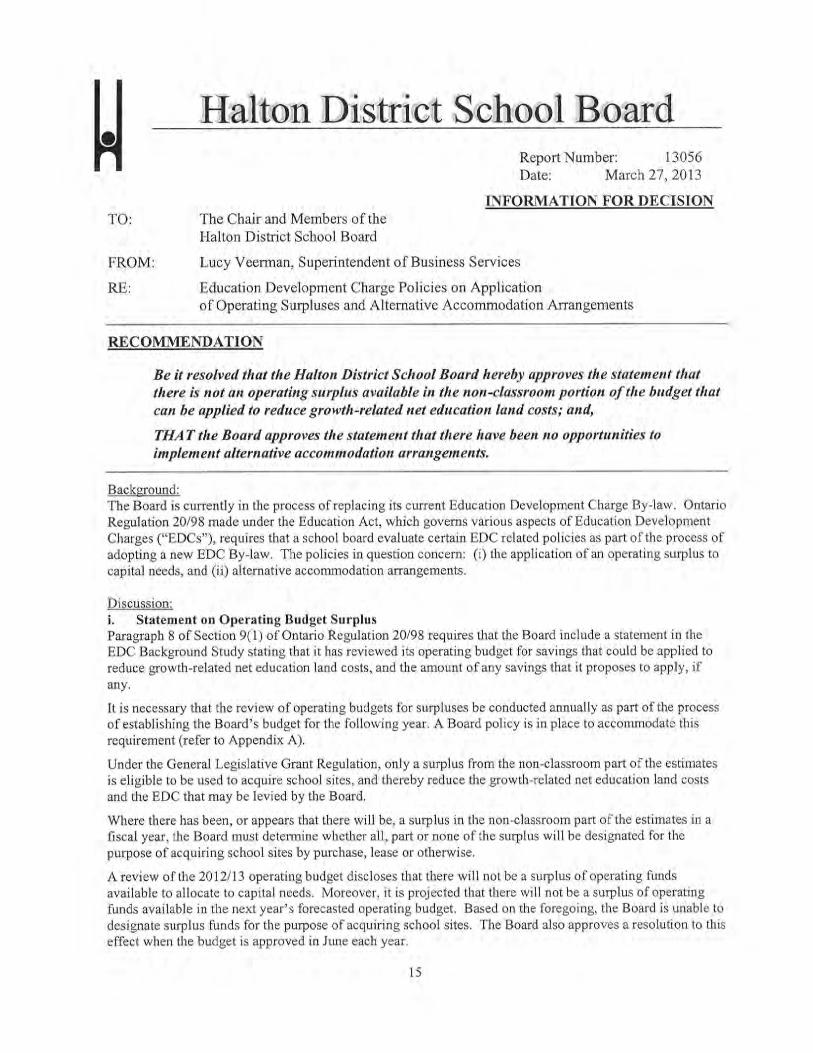
Watson & Associates Economists Ltd. HDSB HCDSB FINAL EDC STUDY
APPENDIX C EDUCATION DEVELOPMENT CHARGE POLICIES AND
STATEMENTS ON ALTERNATIVE ACCOMMODATION ARRANGEMENTS
AND OPERATING BUDGET SURPLUS
Watson & Associates Economists Ltd. HDSB HCDSB FINAL EDC STUDY
HALTON DISTRICT SCHOOL BOARD
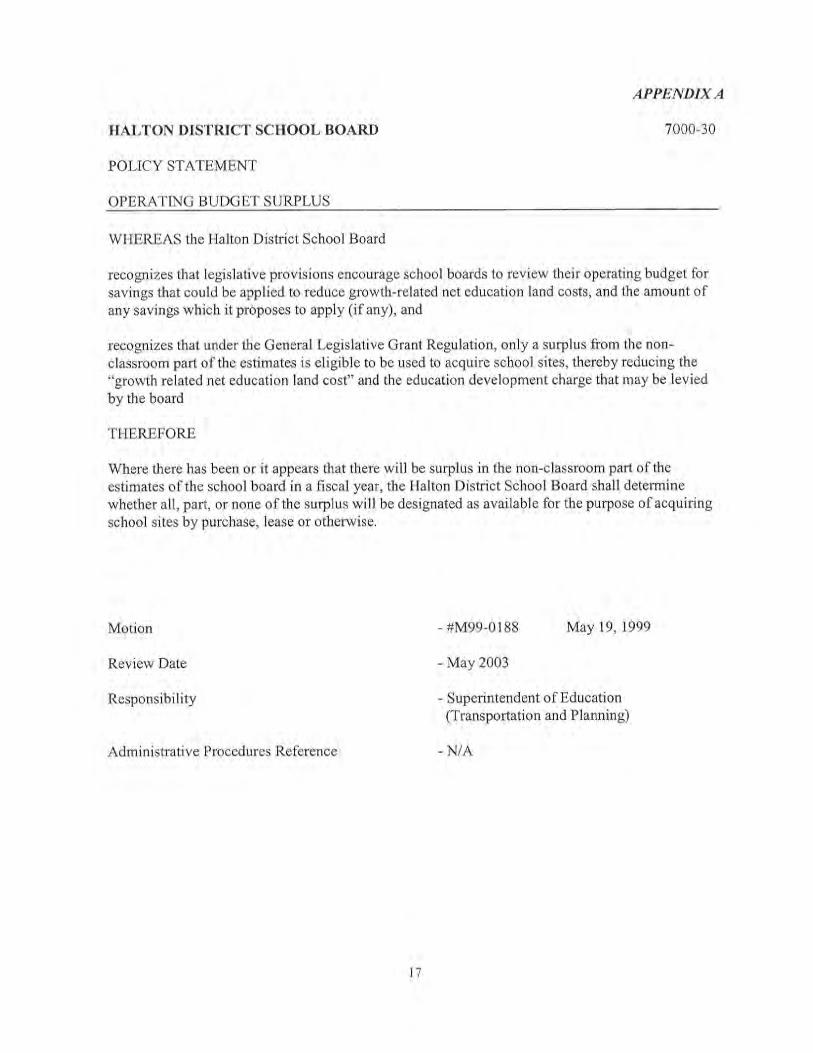
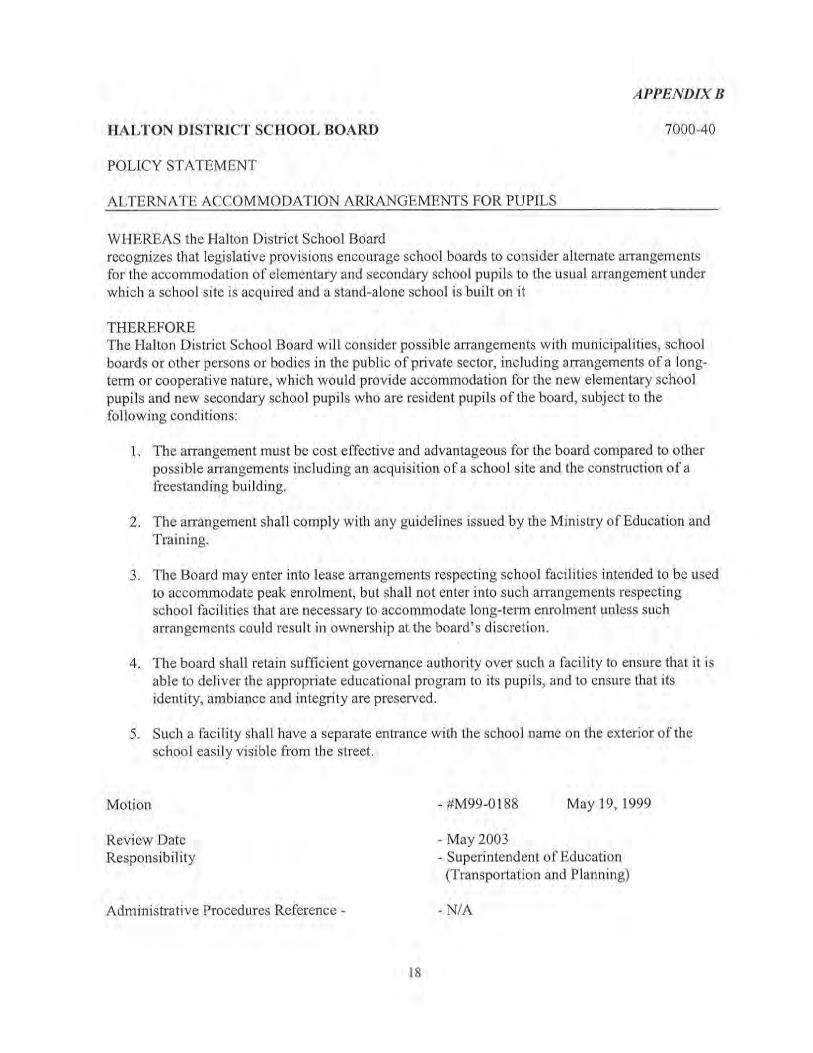
Watson & Associates Economists Ltd. HDSB HCDSB FINAL EDC STUDY
HALTON CATHOLIC DISTRICT SCHOOL BOARD
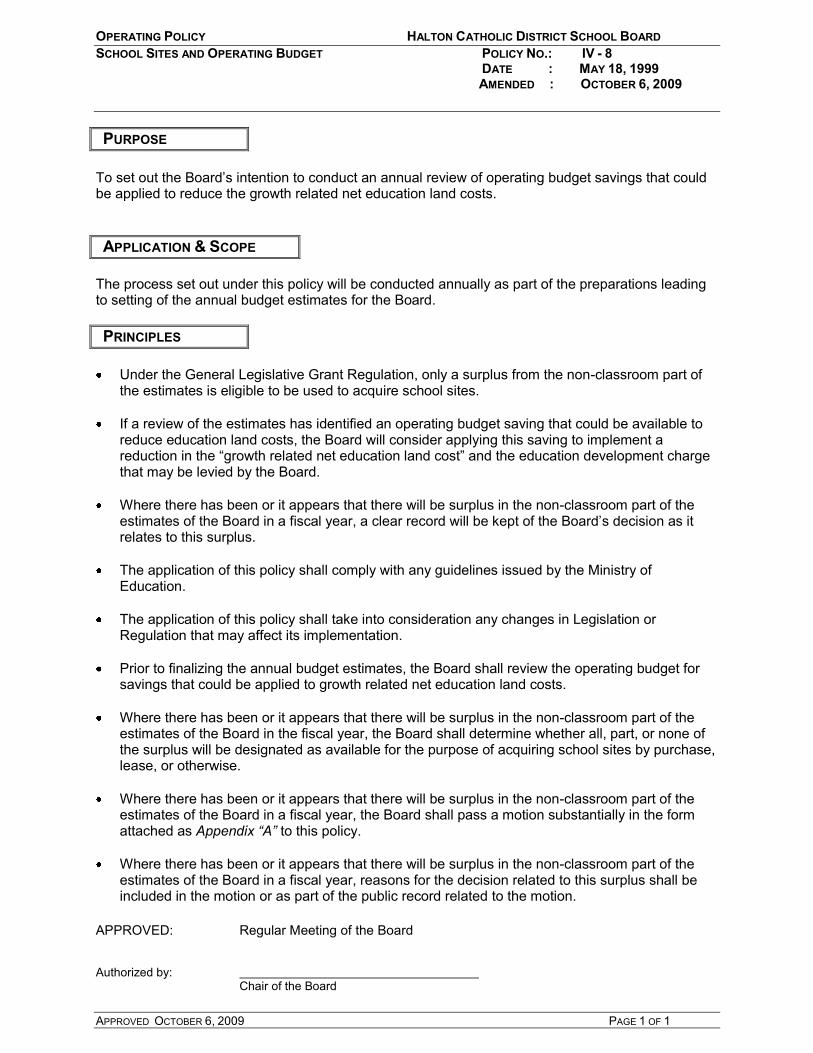
OPERATING POLICY HALTON CATHOLIC DISTRICT SCHOOL BOARD SCHOOL SITES AND OPERATING BUDGET POLICY NO.: IV - 8 DATE : MAY 18, 1999 AMENDED : OCTOBER 6, 2009
APPROVED OCTOBER 6, 2009 PAGE 1 OF 1
PURPOSE To set out the Board’s intention to conduct an annual review of operating budget savings that could be applied to reduce the growth related net education land costs. APPLICATION & SCOPE
The process set out under this policy will be conducted annually as part of the preparations leading to setting of the annual budget estimates for the Board. PRINCIPLES
Under the General Legislative Grant Regulation, only a surplus from the non-classroom part of
the estimates is eligible to be used to acquire school sites. If a review of the estimates has identified an operating budget saving that could be available to
reduce education land costs, the Board will consider applying this saving to implement a reduction in the “growth related net education land cost” and the education development charge that may be levied by the Board.
Where there has been or it appears that there will be surplus in the non-classroom part of the
estimates of the Board in a fiscal year, a clear record will be kept of the Board’s decision as it relates to this surplus.
The application of this policy shall comply with any guidelines issued by the Ministry of
Education. The application of this policy shall take into consideration any changes in Legislation or
Regulation that may affect its implementation. Prior to finalizing the annual budget estimates, the Board shall review the operating budget for
savings that could be applied to growth related net education land costs. Where there has been or it appears that there will be surplus in the non-classroom part of the
estimates of the Board in the fiscal year, the Board shall determine whether all, part, or none of the surplus will be designated as available for the purpose of acquiring school sites by purchase, lease, or otherwise.
Where there has been or it appears that there will be surplus in the non-classroom part of the
estimates of the Board in a fiscal year, the Board shall pass a motion substantially in the form attached as Appendix “A” to this policy.
Where there has been or it appears that there will be surplus in the non-classroom part of the
estimates of the Board in a fiscal year, reasons for the decision related to this surplus shall be included in the motion or as part of the public record related to the motion.
APPROVED: Regular Meeting of the Board Authorized by: Chair of the Board

APPENDIX “A”
Halton Catholic District School Board Board Motion Pursuant to the Policy entitled “School Sites – Operating Budget Surplus” Concerning the Use of Operating Budget Surpluses for the Acquisition of School Sites Whereas it appears that there will be a surplus in the non-classroom part of the budget in the amount of $X; Moved that: 1. The Board will designate $Y as available for the purpose of acquiring school sites by
purchase, lease or otherwise; 2. The Board’s reason for so deciding are as follows:
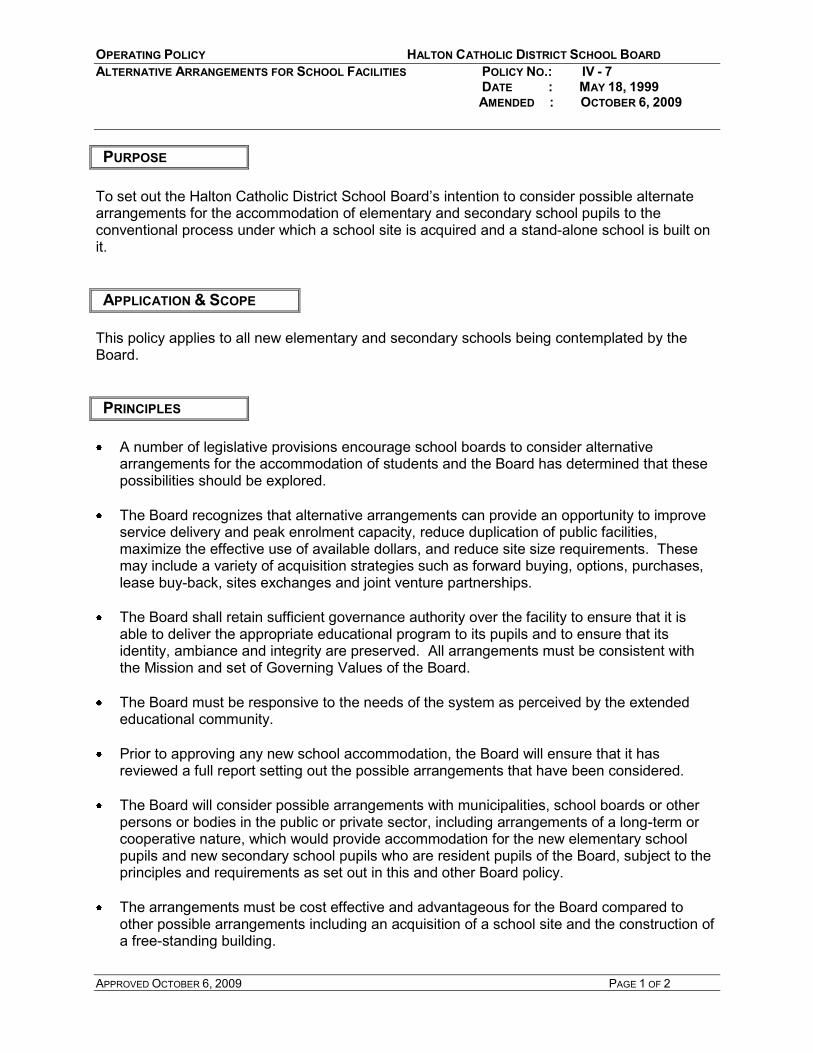
OPERATING POLICY HALTON CATHOLIC DISTRICT SCHOOL BOARD ALTERNATIVE ARRANGEMENTS FOR SCHOOL FACILITIES POLICY NO.: IV - 7 DATE : MAY 18, 1999 AMENDED : OCTOBER 6, 2009
APPROVED OCTOBER 6, 2009 PAGE 1 OF 2
PURPOSE To set out the Halton Catholic District School Board’s intention to consider possible alternate arrangements for the accommodation of elementary and secondary school pupils to the conventional process under which a school site is acquired and a stand-alone school is built on it. APPLICATION & SCOPE
This policy applies to all new elementary and secondary schools being contemplated by the Board. PRINCIPLES
A number of legislative provisions encourage school boards to consider alternative
arrangements for the accommodation of students and the Board has determined that these possibilities should be explored.
The Board recognizes that alternative arrangements can provide an opportunity to improve
service delivery and peak enrolment capacity, reduce duplication of public facilities, maximize the effective use of available dollars, and reduce site size requirements. These may include a variety of acquisition strategies such as forward buying, options, purchases, lease buy-back, sites exchanges and joint venture partnerships.
The Board shall retain sufficient governance authority over the facility to ensure that it is
able to deliver the appropriate educational program to its pupils and to ensure that its identity, ambiance and integrity are preserved. All arrangements must be consistent with the Mission and set of Governing Values of the Board.
The Board must be responsive to the needs of the system as perceived by the extended
educational community. Prior to approving any new school accommodation, the Board will ensure that it has
reviewed a full report setting out the possible arrangements that have been considered. The Board will consider possible arrangements with municipalities, school boards or other
persons or bodies in the public or private sector, including arrangements of a long-term or cooperative nature, which would provide accommodation for the new elementary school pupils and new secondary school pupils who are resident pupils of the Board, subject to the principles and requirements as set out in this and other Board policy.
The arrangements must be cost effective and advantageous for the Board compared to
other possible arrangements including an acquisition of a school site and the construction of a free-standing building.

OPERATING POLICY HALTON CATHOLIC DISTRICT SCHOOL BOARD ALTERNATIVE ARRANGEMENTS FOR SCHOOL FACILITIES POLICY NO.: IV - 7 DATE : MAY 18, 1999 AMENDED : OCTOBER 6, 2009
APPROVED OCTOBER 6, 2009 PAGE 2 OF 2
The arrangement shall comply with any guidelines issued by the Ministry of Education.
The Board may enter into lease arrangements respecting school facilities intended to be
used to accommodate peak enrolment, but shall not enter into such arrangements respecting school facilities that are necessary to accommodate long-term enrolment unless the arrangements could result in ownership at the Board’s discretion.
APPROVED: Regular Meeting of the Board Authorized by: Chair of the Board

Page 1 of 3 Z:\4 - Business Services - Administrative Assistant\Board And Administrative Council Meetings\Board Reports\2012-2013\13-04-16\8.1_EDC Policies\8.1_ EDC Policies On Application Of Operating Surplus Alt Accom Arangem'.Doc
Halton Catholic District School Board Regular Board Meeting Tuesday, April 16, 2013
ACTION REPORT ITEM 8.1
EDUCATION DEVELOPMENT CHARGE POLICIES ON APPLICATION OF OPERATING SURPLUSES AND
ALTERNATIVE ACCOMMODATION ARRANGEMENTS PURPOSE:
The purpose of this report is to evaluate certain Education Development Charge (EDC) related policies as part of adopting a new EDC By-law.
BACKGROUND:
The Board is currently in the process of replacing its current Education Development Charge By-law which expires on June 2, 2014. Ontario Regulation 20/98 of the Education Act, which governs various aspects of EDCs, requires that a school board evaluate certain policies as part of the process of adopting a new EDC By-law. The policies that must be evaluated pertain to:
(i) alternative accommodation arrangements, and (ii) the application of an operating surplus to capital needs.
POLICY EVALUATIONS:
i. Alternative Accommodation Arrangements
Paragraph 6 of Section 9(1) of Ontario Regulation 20/98 requires that the Board adopt a policy concerning possible arrangements with municipalities, school boards or other persons or bodies in the public or private sector, including arrangements of a long-term or co-operative nature, which would provide accommodation for new elementary school pupils and new secondary school pupils, without imposing EDCs, or with a reduction in such a charge. The Board adopted Operating Policy IV-7 “Alternative Arrangements for School Facilities” in 1999. The policy is attached as Appendix A. The alternative accommodation arrangements that the Board may wish to consider include purchases, lease/buy backs, site exchanges and joint-venture partnerships. These alternative arrangements, if properly structured, have the potential to reduce site size requirements, improve service delivery, reduce duplication of public facilities and maximize the use of available funds. Paragraph 7 of Section 9(1) of Ontario Regulation 20/98 requires that the Board include in the EDC Background Study a statement of how the policy concerning alternative accommodation arrangements was implemented, and if it was not implemented, an explanation of why it was not implemented. To date, there have not been any proposals for alternative accommodation arrangements presented to the Board. It is important to note that neither Ontario Regulation 20/98 nor the policy require the Board to independently pursue such opportunities.
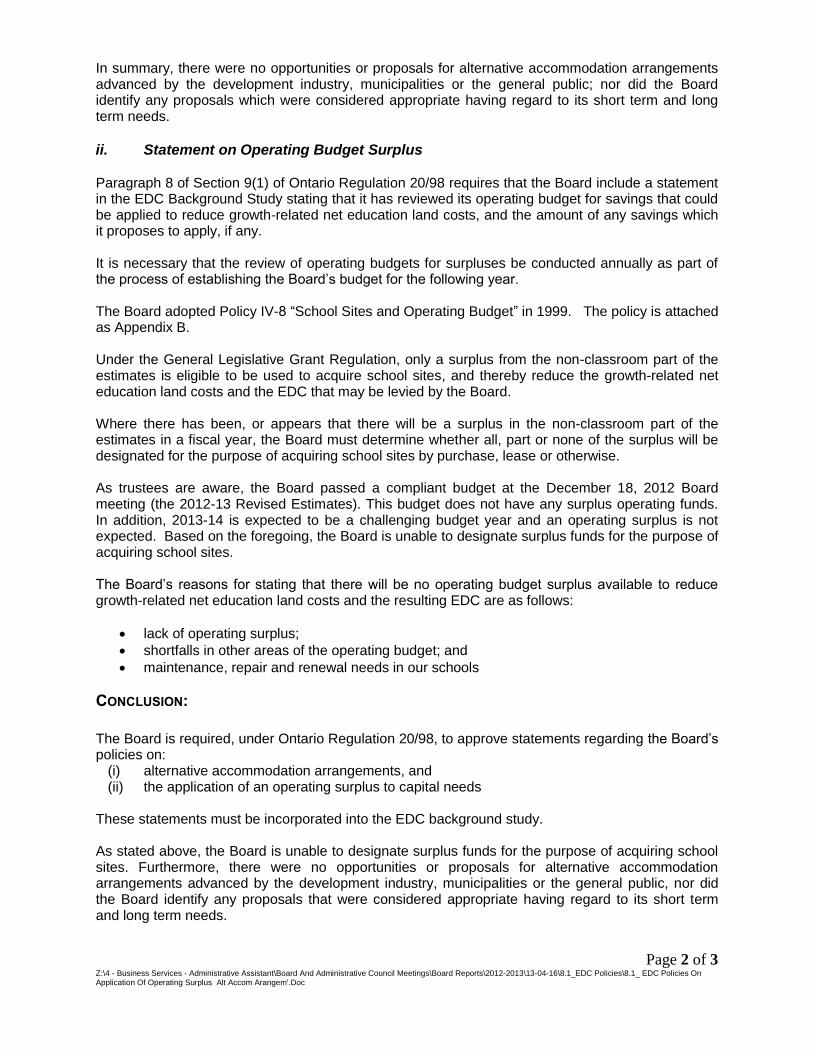
Page 2 of 3 Z:\4 - Business Services - Administrative Assistant\Board And Administrative Council Meetings\Board Reports\2012-2013\13-04-16\8.1_EDC Policies\8.1_ EDC Policies On Application Of Operating Surplus Alt Accom Arangem'.Doc
In summary, there were no opportunities or proposals for alternative accommodation arrangements advanced by the development industry, municipalities or the general public; nor did the Board identify any proposals which were considered appropriate having regard to its short term and long term needs.
ii. Statement on Operating Budget Surplus
Paragraph 8 of Section 9(1) of Ontario Regulation 20/98 requires that the Board include a statement in the EDC Background Study stating that it has reviewed its operating budget for savings that could be applied to reduce growth-related net education land costs, and the amount of any savings which it proposes to apply, if any. It is necessary that the review of operating budgets for surpluses be conducted annually as part of the process of establishing the Board’s budget for the following year. The Board adopted Policy IV-8 “School Sites and Operating Budget” in 1999. The policy is attached as Appendix B. Under the General Legislative Grant Regulation, only a surplus from the non-classroom part of the estimates is eligible to be used to acquire school sites, and thereby reduce the growth-related net education land costs and the EDC that may be levied by the Board. Where there has been, or appears that there will be a surplus in the non-classroom part of the estimates in a fiscal year, the Board must determine whether all, part or none of the surplus will be designated for the purpose of acquiring school sites by purchase, lease or otherwise. As trustees are aware, the Board passed a compliant budget at the December 18, 2012 Board meeting (the 2012-13 Revised Estimates). This budget does not have any surplus operating funds. In addition, 2013-14 is expected to be a challenging budget year and an operating surplus is not expected. Based on the foregoing, the Board is unable to designate surplus funds for the purpose of acquiring school sites. The Board’s reasons for stating that there will be no operating budget surplus available to reduce growth-related net education land costs and the resulting EDC are as follows:
lack of operating surplus;
shortfalls in other areas of the operating budget; and
maintenance, repair and renewal needs in our schools
CONCLUSION: The Board is required, under Ontario Regulation 20/98, to approve statements regarding the Board’s policies on:
(i) alternative accommodation arrangements, and (ii) the application of an operating surplus to capital needs
These statements must be incorporated into the EDC background study. As stated above, the Board is unable to designate surplus funds for the purpose of acquiring school sites. Furthermore, there were no opportunities or proposals for alternative accommodation arrangements advanced by the development industry, municipalities or the general public, nor did the Board identify any proposals that were considered appropriate having regard to its short term and long term needs.
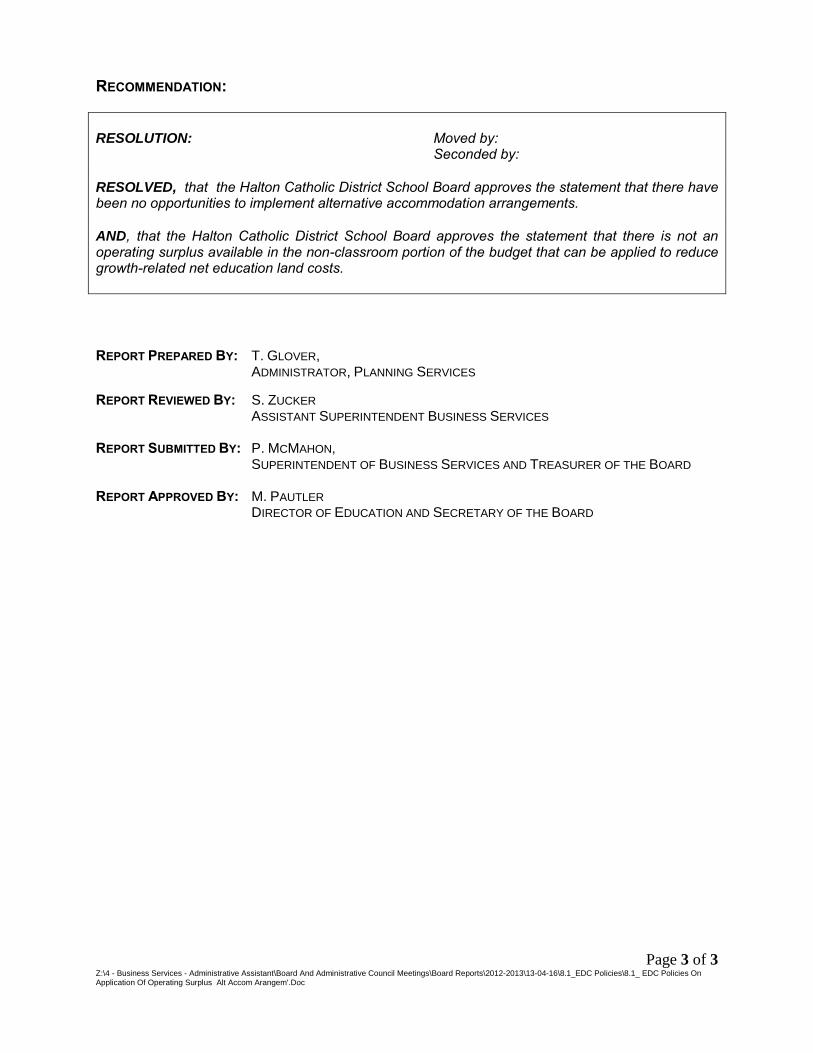
Page 3 of 3 Z:\4 - Business Services - Administrative Assistant\Board And Administrative Council Meetings\Board Reports\2012-2013\13-04-16\8.1_EDC Policies\8.1_ EDC Policies On Application Of Operating Surplus Alt Accom Arangem'.Doc
RECOMMENDATION:
RESOLUTION: Moved by: Seconded by: RESOLVED, that the Halton Catholic District School Board approves the statement that there have been no opportunities to implement alternative accommodation arrangements.
AND, that the Halton Catholic District School Board approves the statement that there is not an operating surplus available in the non-classroom portion of the budget that can be applied to reduce growth-related net education land costs.
REPORT PREPARED BY: T. GLOVER, ADMINISTRATOR, PLANNING SERVICES REPORT REVIEWED BY: S. ZUCKER ASSISTANT SUPERINTENDENT BUSINESS SERVICES REPORT SUBMITTED BY: P. MCMAHON,
SUPERINTENDENT OF BUSINESS SERVICES AND TREASURER OF THE BOARD REPORT APPROVED BY: M. PAUTLER DIRECTOR OF EDUCATION AND SECRETARY OF THE BOARD
Related Documents