Australian Aid—managed by GRM International on behalf of the Australian Government FINAL REPORT Annual Sector Financial Report (2013): An annual review of Indonesian education sector financing 07 July 2015

Welcome message from author
This document is posted to help you gain knowledge. Please leave a comment to let me know what you think about it! Share it to your friends and learn new things together.
Transcript

Australian Aid—managed by GRM International on behalf of the Australian Government
FINAL REPORT
Annual Sector Financial Report (2013): An annual review of Indonesian education sector financing 07 July 2015


ANNUAL SECTOR FINANCIAL REPORT (2013) i
TABLE OF CONTENTS
TABLE OF CONTENTS I
LIST OF TABLES AND FIGURES II
ABBREVIATIONS AND ACRONYMS V
PREFACE VII
EXECUTIVE SUMMARY VIII
1 INTRODUCTION, APPROACH AND METHODOLOGY 2
2 FINANCIAL PERFORMANCE AT NATIONAL LEVEL 7
3 FINANCIAL PERFORMANCE AT DISTRICT LEVEL 17
4 THE BOTTOM-LINE 64
5 NEXT STEPS 71
ANNEX A - EP LOGIC ARCHITECTURE 72
ANNEX B – STATISTICAL TABLE RELATED TO EP DISTRICTS 73

ANNUAL SECTOR FINANCIAL REPORT (2013) ii
LIST OF TABLES AND FIGURES
Figure 1: Education Expenditure as Proportion of Total National Public Expenditure, 2001-2013 . 9
Figure 2: National Public Expenditure on Education, Rp. Trillion 2001-2013 ............................... 11
Figure 3: Annual Growth in Education Expenditure (Rp. trillion), 2001-2013 .............................. 11
Figure 4: Education Expenditure as Proportion of GDP, 2001-2013 ............................................ 12
Figure 5: Composition of Aggregate District Education Expenditure, 2009-2011 ........................ 13
Figure 6: Number of Districts Included in ASFR Analysis, (2007-2013) ....................................... 18
Figure 7: Education Expenditure as % of Total District Budget (APBD 2006-2013) ..................... 18
Figure 8: Average District APBD and APBD for Education, 2006-2013 ....................................... 20
Figure 9: Rural and Urban District Education Expenditure as % of Total District Budget (APBD
2006-2013) .............................................................................................................................. 21
Figure 10: Education Expenditure as % of Total District Expenditure by Districts according to Poverty Quintile, (APBD 2006-2013) ....................................................................................... 22
Figure 11: Average District APBD and APBD for Education, by poverty quintile 2006-2013 ..... 22
Figure 12: Education Expenditure as % of Total District Expenditure by Island Grouping (APBD 2006-2013) .............................................................................................................................. 23
Figure 13: EP Districts - Average Education Allocations as Proportion of District Budget,2006-2013 24
Figure 14: EP Districts with Low Budget Allocation for Education (< than 20% of district budget), 2011-2013 ............................................................................................................................... 25
Figure 15: EP Districts with high Budget Allocation for Education (>than 50% of district budget), 2012-2013 ............................................................................................................................... 26
Figure 16: Districts with very low financial share for education (less than 15% of APBD Expenditure) 2010 -2013 ......................................................................................................... 27
Figure 17: Poorest Districts with very low financial share for education (less than 15% of APBD Expenditure) 2011-2013 .......................................................................................................... 28
Figure 18: APBD Education Expenditure as % of Total district Expenditure in BEP and Non-BEP Supported Districts (APBD 2006-2013) ................................................................................... 29
Figure 19: BEP Districts with low financial share for education (less than 20% of APBD Expenditure) 2009 and 2013 .................................................................................................... 30
Figure 20: Figure 22: Annual Growth in APBD Education Expenditure, 2007 -2013, by Poverty
Quintile 31
Figure 21: Annual Growth in District Education Expenditure, (APBD 2007-2013) .................... 33
Figure 22: Poorest Districts (Quintile 5), Negative Annual Growth in Education Expenditure,
(APBD 2011-2013) .................................................................................................................. 34
Figure 23: Total Number of Districts, with Negative Annual Growth in APBD Education Expenditure, 2007 -2013 .......................................................................................................... 35
Figure 24: Number of Districts with declining annual education expenditure, 2010 - 2013 ....... 35
Figure 25: EP Poorest Districts with declining annual education expenditure (2012 and 2013) .. 36

ANNUAL SECTOR FINANCIAL REPORT (2013) VERSION 1.0
iii
Figure 26: Component 1 districts with declining annual education expenditure (2013 vs 2012) 36
Figure 27: Component 2 districts with declining annual education expenditure (2013 vs 2012) 37
Figure 28: Component 1 & 2 districts with declining annual education expenditure (2013 vs
2012) 37
Figure 29: BEP and Non-BEP Districts - Annual Growth in District Education Expenditure, (APBD 2007-2013) .................................................................................................................. 38
Figure 30: Number of Districts, with Negative Annual Growth in APBD Education Expenditure (2009-2013) ............................................................................................................................. 38
Figure 31: Average District Education Expenditure per all Students, 2006-2013 (Rp. millions.) . 39
Figure 32: Comparison - Expenditure per All Students vs. Expenditure per Public Students, (Rp. millions) 41
Figure 33: Average APBD Education Expenditure per Student (Rp. millions), 2010-13 by Island 42
Figure 34: Papua: Average Annual Growth in District Education Budget, (Rp. millions) 2010-13 43
Figure 35: Average District Expenditure per Student, EP Districts and Others (Rp. millions) .... 44
Figure 36: EP Districts with Low Expenditure per Student, 2013 (Rp. Less than 2.63 million) ... 45
Figure 37: EP Districts with very high per student expenditure, 2013 (Rp. millions) .................. 46
Figure 38: Equity Slope of Funding - Average APBD Education Expenditure per Student (Rp millions), by Poverty Quintile, 2010-13 .................................................................................... 47
Figure 39: BEP District budget allocations per student, 2006-2013............................................ 48
Figure 40: Critical Education Funding Status (CEFS) Districts – Districts with low growth in education budget, low share of district budget and low expenditure per student, 2010-2013 .. 48
Figure 41: Realised Education Expenditure as % of Planned Expenditure 2006 -2007 ................ 49
Figure 42: Realised Education Expenditure as % of Planned Expenditure 2006-07, EP and Non-EP districts 50
Figure 43: Realised Education Expenditure as % of Planned Expenditure 2006 - 2007, by Poverty Quintile 51
Figure 44: BOS Grants as % of Education & Culture Budget 2006-2013 .................................... 52
Figure 45: BOS Grants as % of District Budget 2006-2013, by Poverty Quintile ........................ 54
Figure 46: Education and Health – Average shares of district budgets 2007-2013 ..................... 55
Figure 47: Per Capita Health and Education district expenditure, 2007-2013 ............................ 56
Figure 48: Health shares in poorest districts with very low education allocations, 2013 ............ 56
Figure 49: Health shares in districts with very high education allocations (>50%), 2013 ............ 57
Figure 50: Year Districts Created – Average shares of district budgets 2007-2013 ................... 57
Figure 51: Average District Allocations for Education, 2013 (Rp. million) ................................. 59
Figure 52: Average population size of districts by year created, 2013........................................ 59
Figure 53: Average allocations per student, by year district created .......................................... 60
Figure 54: Growth rates in total and education sector district budgets, 2010-2013................... 60
Figure 55: All districts, education share of district budget ......................................................... 61

ANNUAL SECTOR FINANCIAL REPORT (2013) VERSION 1.0
iv
Figure 56: Excluding newest districts, education share of district budget ................................... 61
Figure 57: Excluding Papua, education share of district budget .................................................. 62
Figure 58: Table 2: Progress against Key Indicators ................................................................... 66

ANNUAL SECTOR FINANCIAL REPORT (2013) v
ABBREVIATIONS AND ACRONYMS
Bahasa Indonesia English
ACER Dewan Penelitian Pendidikan Australia Australian Council for Educational Research
ADB Bank Pembangunan Asia Asian Development Bank
APK Angka Partisipasi Kasar Gross Enrolment Rate
APM Angka Partisipasi Murni Net Enrolment Rate
AusAID Badan Australia untuk Pembangunan
Internasional
Australian Agency for International
Development
AWP Rencana Kerja Tahunan Annual Work Plan
Balitbang Badan Penelitian dan Pengembangan Centre for Research and Development
Bappenas Badan Perencanaan Pembangunan Nasional National Development Planning Agency
BEP Program Pendidikan Dasar Australia-Indonesia Australia-Indonesia Basic Education Program
BOS Biaya Operasional Sekolah School Operational Fund
BOS Buku Biaya Operasional Sekolah Buku School Operation Funds for Textbooks
BSNP Badan Standar Nasional Pendidikan National Education Standards Board
CCR Rasio Kelas-Ruang Kelas Class-Classroom Ratio
CSAS Kontraktor untuk Layanan Kepenasehatan
Strategis
Contractor for Strategic Advisory Services
DFAT Departemen Luar Negeri dan Perdagangan Department of Foreign Affairs and Trade
(Australian)
DG Direktorat Jendral Directorate General
EC Komisi Eropa European Commission
EFA Pendidikan untuk Semua Education for All
ESP Rencana Strategis Pendidikan Education Strategic Plan
ESSP Education Sector Support Program Education Sector Support Program
ESWG Kelompok Kerja Sektor Pendidikan Education Sector Working Group
GDP Pendapatan Domestik Bruto Gross Domestic Product
GER Angka Pendaftaran Kasar Gross Enrolment Rate
GoA Pemerintah Australia Government of Australia
GOI Pemerintah Indonesia Government of Indonesia
JSS Sekolah Menengah Pertama Junior Secondary School
KPI Indikator Kunci dari Kunci Key Performance Indicator
LAKIP Laporan Akuntabilitas Kinerja Publik Public Performance Accountability Report
MCPM Kontraktor Pelaksana untuk Pengelolaan
Program
Managing Contractor Program Management
MDA Kajian Tengah Dekade Mid-Decade Assessment
MoF Departemen Keuangan Ministry of Finance
MoEC Departemen Pendidikan Nasional Ministry of Education and Culture

ANNUAL SECTOR FINANCIAL REPORT (2013) VERSION 1.0
vi
MoRA Departemen Agama Ministry of Religious Affairs
NER Angka Pendaftaran Murni Net Enrolment Rate
NFE Pendidikan Non-formal Non-Formal Education
PAM Matriks Aksi Kebijakan Policy Action Matrix
PCMU Unit Pengelola dan Koordinasi Program Program Coordination and Management Unit
PMPTK Peningkatan Mutu Pendidik dan Tenaga
Kependidikan
Quality Improvement of Teachers and
Education Personnel
POM Monitoring dan Pengawasan Kinerja Performance Oversight and Monitoring
PSC Komite Pengarah Program Program Steering Committee
PTP Matrix Matriks Sasaran dan Kinerja Program Program Targets and Performance Matrix
PUSLIT Pusat Penelitian Center for Research
PUSPENDIK Pusat Statistik Pendidikan Center for Education Statistics
Renstra Rencana Strategis Strategic Plan
Rp. Rupiah Rupiah
SCR Rasio Siswa Ruang Kelas Student Classroom Ratio
SD Sekolah Dasar Primary School
SIKD Sistem Informasi Keuangan Daerah Regional Finance Information system
SMA Sekolah Menengah Atas Senior Secondary School
SMP Sekolah Menengah Pertama Junior Secondary School
SWAP Pendekatan Sektor secara Luas Sector Wide Approach
SPI Indikator Kinerja Tambahan Supplementary Performance Indicator
STR Rasio Siswa Guru Student Teacher Ratio
SUSENAS Survei Sosial Ekonomi Nasional National Socio-Economic Survey
TA Bantuan Teknis Technical Assistance
ToR Kerangka Acuan Kerja Term of Reference
UN Perserikatan Bangsa-Bangsa United Nations
USAID Badan Amerika Serikat untuk Pembangunan
Internasional
United States Agency for International
Development
ANNUAL SECTOR FINANCIAL REPORT (2013) vii
PREFACE
This report is intended to provide high level monitoring of national and district trends in education
financing. The purpose of the monitoring is to inform the Governments of Indonesia and Australia as
they implement the Education Partnership (2011-2016).
This is the sixth Annual Sector Financial Report (previously known as the Annual Financial
Performance Report). It is a continuation of last year’s report published by the Performance
Oversight and Monitoring team of the Education Partnership, and a series of three annual reports
that were prepared by the same author for the Basic Education Program and delivered through the
Contractor for Strategic Advisory Services. Copies of these reports are held by the Australian
Embassy and the Indonesian Ministry of Education and Culture.
The author is Education Economist Mr. Adam Rorris. He has worked in close collaboration with, and
has benefitted from the support of, the Ministry of Finance and the Ministry of Education and
Culture (MoEC). The consultant acknowledges the support and advice of the many people that
contributed to the study. Data analysis support was provided by Mr. Ahmad Evandri. The views and
opinions expressed in this report are those of the author and do not necessarily reflect those of the
Governments of Indonesia or Australia.
Amendment history
Version Notes and modifications Created by/modified by
1.0 Initial Draft Report (20 February 2015) Creator: Adam Rorris
1.2 Second draft (23 February 2015) Modifier: Adam Rorris
1.4 Submitted Draft Report (16 March 2015) Modifier: Adam Rorris
1.5 Final Report (07 July 2015) Modifier: Simon Milligan

ANNUAL SECTOR FINANCIAL REPORT (2013) viii
EXECUTIVE SUMMARY
Background
The Annual Sector Financial Report (ASFR) 2013 monitors and reports on trends in education
financing in Indonesia. This is the sixth Annual Sector Financial Report (previously known as the
Annual Financial Performance Report) and follows a series of reports produced by the same author
for the AusAID supported Contractor Strategic Advisory Services (CSAS) team. The report is intended
for the use of high level government officials and education sector experts in the Governments of
Indonesia and Australia. It provides succinct analysis and is intended to be an accessible tool for
operational planning. The objectives of this report are:
1. To identify trends in the quantum and distribution of education funding in relation to
national policy and school needs.
2. To monitor education sector and school resourcing from the standpoint of the key RENSTRA
(2010-14) themes of access, quality improvement and improved accountability.
3. To provide a record of education financing in those districts directly benefiting from
Components 1 and 2 of the Australian-Indonesia Education Partnership (EP).
4. To inform the Government of Australia (GoA), the Government of Indonesia (GoI) and other
donors of the effectiveness and efficiency of current school funding mechanisms.
5. To support the capacity of GoI institutions to monitor and report on school financing.
The report has a particular focus on district level expenditures. District level expenditure patterns
are increasingly important as districts have increased responsibility for education management
under GoI’s decentralization policy. Monitoring patterns of expenditure by districts will become an
increasingly important role for the Ministry of Education and Culture (MoEC) and the Ministry of
Religious Affairs (MoRA) to ensure that national funding norms and procedures are being
implemented appropriately. Financial analysis of education allocations therefore needs to have a
district level disaggregation to assess the variability in fiscal capacity and actual allocations for
education resourcing.
A wide range in the poverty status of districts, and the importance of education in lifting district
populations out of poverty, mean that vulnerable groups stand to benefit most from well-targeted
education investment. Monitoring and evaluation of district level education financing provides the
tools to do so.
Key Performance Indicators and Analysis
The report analysis is framed by a set of Key Performance Indicators (KPI). The KPI focus attention on
the main themes outlined in MoEC’s RENSTRA for 2010-14 and the GoI’s financial commitment to
education. Most of these KPI are reported on at a national level by the GoI as part of its international
Education for All (EFA) reporting obligations. The district level KPIs were developed by the CSAS
consultancy to provide a specific indication of district level financial commitment and allocation of
funds for education.
ANNUAL SECTOR FINANCIAL REPORT (2013) VERSION 1.0
ix
Each of the indicators is described as being either a lead or lag indicator. Lag indicators are
summative in nature. They describe the current state of progress toward an expected outcome. Lead
indicators are those which capture the rate of movement towards an outcome or have a clear causal
relationship to a desired outcome.
A summary of the results and findings for each of the indicators is presented in table format as part
of this Executive Summary. This includes a summary assessment of the indicator result being
positive, negative or uneven. A `Positive’ result indicates it is supportive of MoEC’s RENSTRA
objectives for 2010-14; a ‘Negative’ result suggests it is contradictory to RENSTRA objectives; and an
‘Uneven’ result indicates large variation between districts.
This report has utilized the Enhanced Analytical Facility (EAF) as a database and warehousing tool.
The EAF has brought together education, finance and socio-economic data sets from a very wide
range of sources. Greater inter-relational analysis of these data sets and enhanced visualization
capacity from new software adds power and improves readability of the report. The EAF was again
updated for this 2013 report, with updates to financial and enrolment data for 2011 and the addition
of new data for 2012.
Key Findings
1. Strong real growth in national public expenditure for education in 2013.
The GoI had particularly impressive growth in real and nominal terms in 2006 and 2009. Since
2009, growth in education expenditures has marginally outpaced inflation, but there was a
plateau in the real increase of national funding for education until 2011. In 2012 and now 2013
we see consecutive significant increases in real terms for education funding.
2. Government commitment to meet a 20% target for education expenditure share of national
budget has been met for the fifth year in a row.
The national expenditures for education in 2013 met the 20% target. Education has benefited
from total national public revenues and expenditures which have grown at a significantly faster
rate than inflation.
3. Average district level education expenditures across Indonesia have increased from 27% of the
total district budget (APBD) in 2006 to nearly 34% share in 2013.
All of these gains were obtained during the period 2006-2011. This is a positive trend but in 2012
and 2013 the education budget has not kept up its share of expanding district budgets. The
ambitious plans for the education sector will be damaged if the districts allocation to the
education sector continues to decline.
4. The lowest average share of budget allocation for education was found in Papua (16%) which
now stands some distance from other island groups in allocating a very low share of its budget
for education.
While Maluku has shown growth since 2010, Papua has dropped again from an 18% education
share of district budgets in 2010 to 16% in 2013.
5. Nationally, 31 districts allocated less than 15% of their total district budget (APBD) on
education in 2013. Of these 31 districts, 24 are in the poorest quintile, and 22 of these poorest
are found in Papua

ANNUAL SECTOR FINANCIAL REPORT (2013) VERSION 1.0
x
Of the 31 districts spending less than 15% of their budget on education, 19 districts have
allocated less than 15% for four years 2010-2013. The continued pattern of spending of less than
15% towards education limits the ability of these districts to catch up with others, i.e. the equity
gap will further widen. This problem has a particular relevance for Papua as it is heavily
represented in this group.
6. In looking at districts by relative poverty status, the poorest quintile districts have slipped
further below the others in being the only ones that allocate less than 30% of their district
budget for education.
If the poorest districts do not accelerate their education spending they are likely to fall further
behind wealthier districts.
7. In 2013, 62 districts (13%) posted a decline in their education budget.
This is an improvement from 2012, when 97 districts posted a decline in their annual education
budget allocation.
8. The problem of contracting education budgets in poorest districts is focused on Papua.
Ten of the 17 poorest districts which recorded a decline in nominal annual district education
expenditure in 2013 are located in Papua.
9. Average district expenditure per student grew across the country and is highest in the poorest
districts.
Average education expenditure per student has grown to Rp. 3.5 million in 2013 from an
average Rp. 3.1 million in 2012. Highest allocations per student are found in the poorest districts
(quintile 5) at an average Rp. 3.8 million per student.
10. To achieve better learning outcomes across the poorest districts, the district governments in
poorest districts will need to keep growing their education spending more quickly and drive a
stronger ‘equity slope’ in education funding distribution.
In 2012 the slope of equity spending was halted, with slower growth in the poorest districts. In
2013 there was a spike in expenditure in the poorest districts and this needs to be sustained
over a number of years so the poorest districts can improve the quality and reach of their
education system.
11. There was only one district in 2013 that met Critical Education Funding Status (CEFS) criteria
compared to six districts in 2012.
The CEFS diagnostic tool developed by the ASFR identifies districts that have (i) low expenditure
per student, (ii) small education share of the district budget, and (iii) weak annual growth in their
education budget.
12. A correlation in low expenditure for education and health sectors suggests it will be useful to
investigate more closely those districts where and why there is low share of expenditure for
the social sector as a whole.
There is no sign that health sector is crowding out the education sector spending (or vice-versa)
at the district level. On the contrary, there is a strong correlation for districts that have
contracting education allocations to also be allocating less than the national average for health.

ANNUAL SECTOR FINANCIAL REPORT (2013) VERSION 1.0
xi
Possible Impacts on the Sustainability of Benefits Stemming from
EP Investments
1. At a macro level, there is solid evidence to suggest that the GoI will continue to invest heavily in
education. This should flow through in its support for district budgets. National funding for the
education sector is expected to remain strong. Adherence to a proportional budget allocation for
education enhances the ability of the education sector to anticipate future allocations and plan
accordingly by creating a more stable financing framework. The proportional allocation approach
toward education financing enhances predictability and steady growth of the education budget
in a growing economy.
2. In 2013, as for 2012, there were 18 EP districts (ten were C2 districts) that contributed less than
the 20% national target for education, which is considerably lower than the national average of
34% for education in 2013. This low share of funding for education in specific districts may
threaten the sustainability of EP investments in the future.This is especially the case for those
ten EP C2 districts which will require ongoing professional development costs.
3. In 2013 there were 19 districts with the highest poverty rates persistently over four years
allocating a significantly smaller share (less than 15%) of resources for education. This low
commitment from some of the poorest districts makes it harder for them to catch up on
educational development. It also indicates which districts may have further scope to grow their
education budget and cover the cost associated with PD and the maintenance of new school
buildings as might be funded under the EP.
4. Papua stands out as the one island that now spends the least for education as a proportion of
total district funds. There is scope to increase education funding in these areas to cover the
additional but modest recurrent costs associated with the EP investments.
5. Maluku island districts (unlike Papua) have left the low average share of budget for education
and are moving towards the national average. This suggests investment in the island might be
met with stronger counterpart funding activity.
6. Most EP districts are showing growth in per student allocations for education. This provides a
good financial base for further improvements. In 2013 there was a reduction in the number of EP
districts (40) that contracted their education budget - compared to 59 in 2012. This is a positive
improvement for the program and better positons more districts to assume financial
responsibility.
7. Growing BOS funds provide much needed discretionary funds to schools. The challenge for
government will be to put in place the appropriate training, monitoring and support to enable
the effective use of these funds as well as identifying the inevitable instances where these funds
are not properly expended or adequately reported.
8. Correlation in low budget allocations for education and health sectors suggests it will be useful
to work more closely with both the education and health programs to understand and improve
the situation as appropriate.

ANNUAL SECTOR FINANCIAL REPORT (2013) VERSION 1.0
12
Progress against Key Indicators
INDICATOR DESCRIPTION LEVEL RELATED
GOAL RESULT COMMENT AND IMPLICATIONS
KPI 1
Share of public
expenditure
Public
expenditure on
education as
percentage of
total public
expenditure
(covers MoEC and
MoRA
expenditure)
National Government
commitment Positive
Comment: Significant growth in
allocations as proportion of national
expenditure, from 12% 2001 (12%) to
20% by 2013.
Implications: Stable growth in
education financing is positive for
further investment.
KPI 2
Share of GDP
Public
expenditure on
education as
percentage of
GDP
National
Government
commitment Positive
Comment: Education expenditure, as
a proportion of GDP, increased from
3.3% in 2011 to 3.7% in 2013.
KPI 3
Share of non-
salary
resources
% share of
education budget
spending on non-
salary costs.
National Quality Positive
Comment: Non-salary share of
expenditures in 2011 increased to
25% of total district level
expenditures (up from 13% in 2010).
Implications: Growth in budget is not
being solely consumed by salaries.
New budget allocations were
especially strong for capital items.
KPI 4
District
commitment to
education
Education as % of
total public
expenditures
District
Government
commitment
Equity/access
Neutral
Comment: The strong increase in the
education share of district budgets in
2011 was reversed in last 2 years
2012 and 2013, with the education
share dropping to 34% from 36%.
Implications: Poorest districts with
low allocations for education should
be monitored
KPI 5
Annual growth
in spending in
the poorest
districts
Annual % change
in public
expenditures for
education in
lowest quintile
districts
compared to
national % change
in public
expenditure for
education
District
Equity/access Positive
Comment: Average growth in
education allocations improved for
poorest districts and there fewer
poorest districts allocating less than
15% of the budget for education.
Implications: Papua accounts for the
majority of poorest districts with
contracting budget allocations in
2013.
KPI 6
Average district
expenditure
per student
Public
expenditure from
APBD divided by
total number of
school students
District
Government
commitment
Quality
Positive
Comment: Average expenditure per
student across the country grew in
2013 at a reasonable rate.
Implications: Papua had average
growth in 2013 (unlike 2012) but it
still had 13 districts with contracting

ANNUAL SECTOR FINANCIAL REPORT (2013) VERSION 1.0
13
INDICATOR DESCRIPTION LEVEL RELATED
GOAL RESULT COMMENT AND IMPLICATIONS
budgets for education.
KPI 7
Actual
education
expenditure as
% of planned
expenditure
Realised APBD for
education as % of
planned APBD for
education
District Government
commitment Positive
Comment: Districts in 2007 (the last
year for which verified data are
available) managed to spend nearly
100% of their planned budget. This
was a significant improvement on
2006 where only 91% of funds were
spent nationally.
Implications: Updated data are
required to reach conclusions about
possible changes in expenditure
patterns
SPI 1
Discretionary
school funds as
% of total
district school
expenditure
Estimated BOS
expenditure as %
of total school
expenditure
District Quality Neutral
Comment: In 2013, were not further
indexed for inflation but are still
substantial following the previous
year increase in per student
allocations.
Implications: Principals and school
committees have substantial funds
for discretionary spending at school
level
SPI 2
Comparing
education and
health
allocations at
district level
Analysing
education and
health allocations
in low and high
allocation districts
for any
correlations
District Quality Positive
Comment: No evidence that
education and health expenditures
are crowding each other. Evidence
shows where education spending
contracts it also contracts for health.
Implications: Education and health
sectors may benefit from
cooperation.
SPI 3
Allocation
patterns and
statistical
impact of
newly
established
districts
Budget
comparisons
between old,
newer and
newest districts
Neutral
Comment: Older districts are more
likely to have larger populations and
larger education budgets. Newer
districts are more likely to be in a
rural area and remote and have
higher average per student
allocations.
Implications: Newest districts can
have very high initial per student
costs. Newest group of districts is
small and has not had any significant
distorting impact on this analysis.

ANNUAL SECTOR FINANCIAL REPORT (2013) VERSION 1.0
14
Risk Areas for the Education Partnership
Table 1: Possible Risks Affecting the EP
# FINDING POSSIBLE CONSEQUENCES FOR THE EP
RA1
Some EP districts (including some with
the highest poverty rates) are persistently
allocating a very low share of their
resources to education.
This low commitment may threaten districts’ ability to
sustain recurrent expenditures associated with EP
investments.
RA2 Papua has many districts performing
badly on numerous financing indicators.
EP investments in these two provinces run the risk of losing
effectiveness if they are not supported by district financial
commitment.
RA3
In 2013, 59 EP districts contracted their
education budget compared to the
previous year. This may continue into the
future.
Where this reflects a shifting priority away from education
it may jeopardise the ability of districts to meet future
financial commitments to professional development and
building maintenance.
RA4
Districts with very low budget share
allocations for education also often have
low budget share allocations for health.
It might be beneficial to coordinate the education and
health programs to investigate and support increased
allocations for the social sector as whole.
Suggested Next Steps
SUGGESTED NEXT STEPS (AND LEVEL OF URGENCY) PRIME RESPONSIBILITY
NS1: EP districts which have very small share of total district budget
allocated for education should be monitored and engaged in a
dialogue to understand current allocations and future plans.
Coordinate with DFAT health program (where there is health program
activity in these districts)
POM, with DFAT’s approval
NS2: Focus diagnostic and policy response efforts on the Papua island
group to understand the factors driving low education share of district
budgets
DFAT (with POM, where
appropriate)
NS3: Engage in dialogue with a sample of EP districts that reduced their
2013 education budget allocations compared to 2012. Detailed
diagnostics on (i) poorest EP districts that had an annual reduction in
their 2012 and 2013 Budget, and (ii) districts with annual drop greater
than 10%. Diagnoses to understand reasons for drop and monitor
change in allocations in 2014 and 2015 district budgets.
MOEC and POM (with DFAT’s
approval)
NS4: Liaise with MoEC and other central agencies so as promote the
introduction of district report cards on education. These report cards
should be produced on annual basis and include key educational
development and financial indicators.
DFAT
NB: Red - high urgency; orange - medium urgency; green - low urgency

Introduction, Approach and Methodology

ANNUAL SECTOR FINANCIAL REPORT (2013) 2
1 INTRODUCTION, APPROACH AND METHODOLOGY
1.1 The Education Partnership
The Government of Australia (GoA) has been investing in Indonesia’s basic education sector for a
number of years, most notably through the flagship Australia Indonesia Basic Education Program
(AIBEP) (2006-2011) and now through the Australia-Indonesia Education Partnership (EP): a five-year
program that is scheduled to operate from mid-2011 to mid-2016.
Australia is supporting GoI to achieve its policy goals in relation to access, quality and governance of
basic education (defined as primary and junior secondary education). The EP’s vision is to improve
education service delivery in Indonesia. To achieve this, it focuses on three goals:
• To increase participation in Junior Secondary Education (JSE) schooling.
• To improve the quality of education in public and private schools, including Madrasah.
• To improve sector governance through increased use of evidence for decision-making.
The EP recognizes that these goals are aspirational and are influenced by a multitude of factors,
many of which are outside the control or even direct influence of the Partnership. As such, the EP
focuses its effort on the attainment of four End-of-Partnership-Outcomes (EOPOs):
• Enrolment in JSE in targeted districts increases.
• Management of schools and Madrasah improves.
• Quality of Madrasah improves in line with National Education Standards.
• Policy-makers utilize research findings to inform education sector policy, planning and
budgeting.
These EOPOs describe the highest level of change over which the EP has significant influence (see
Annex A). The EP uses various modalities to deliver its support, e.g. earmarked budget support
(Components 1 and 2), project delivery (Component 3), and technical assistance to GoI agencies
(Components 1-4). Since late 2013, the majority of expenditure in Components 1 and 2 is made
through government systems.
1.2 The Annual Sector Financial Report
Objective
The objectives of the report are:
1. To identify trends in the quantum and distribution of education funding in relation to
national policy and school needs.
2. To monitor education sector and school resourcing addressing the key MoEC RENSTRA
(2010-14) themes of access, quality improvement and improved accountability.
3. To provide a record of education financing in those districts directly benefiting from
Components 1 and 2 of the Education Partnership.

ANNUAL SECTOR FINANCIAL REPORT (2013) VERSION 1.0 3
4. To inform GoA, GoI and other donors of the effectiveness and efficiency of current school
funding mechanisms.
5. To support the capacity of GoI institutions to monitor and report on school financing.
Scope of Analysis
District Level Disaggregation
District governments have an increasing importance in education provision under the GoI
decentralization policy. Financial analysis of education allocations therefore needs to have a district
level disaggregation to assess the variability in fiscal capacity and actual allocations for education
resourcing.
Key Performance Indicators
The Key Performance Indicators (KPI) focus on MoEC’s three main RENSTRA (2010-14) themes, and
GoI’s financial commitment to education. These indicators have been chosen based on the available
data so as to enable a quick snapshot to be presented without need for additional surveys and
interviews.
Three Supplementary Performance Indicators (SPI) sit below the KPIs. The SPIs offer a more nuanced
perspective across the three RENSTRA themes by assessing education expenditure at a district level.
Lead and Lag Indicators
Each of the indicators are described as being either a lead or lag indicator1.
Lag indicators are summative in nature. They describe the current state of progress toward an
expected outcome. For example, a lag indicator measuring government financial commitment
towards education is the percentage of total public expenditure allocated towards education.
Lead indicators are those which capture the rate of movement towards an outcome or have a clear
causal relationship to a desired outcome. For example, a lead indicator of government commitment
towards financial commitment towards education might be annual percentage real increase in the
education share of total public expenditure.
Selection of Indicators
The indicators have been drawn from a number of sources. One group of KPIs is used by GoI as part
of its EFA reporting obligations. Another set of indicators focuses mainly on the district level of
analysis. These have been selected to be of use for the Indonesian government and the Education
Partnership in promoting development of the basic education sector across Indonesia. These
indicators can be of use at the district level for planning and budgeting purposes.
1 Conceptually, “lead and lag indicators” have originated in the development of performance scorecards for
use by business analysts. They are adapted here for use within the education sector.
ANNUAL SECTOR FINANCIAL REPORT (2013) VERSION 1.0 4
1.3 The Evidence Base
Data Sources and Collections: Financial Data
National Level Financial Data
This report has used the same historical data for the period 2001-2008 that was presented in the
2012 report. Detailed financial data for 2009-2013 has been collected from Financial Note and
Indonesian Revised Budget Papers 2010-2013, as well as price inflation figures from the BPS
(Indonesia Bureau of Statistics). There have been some minor changes in figures from the earlier
reports but these have not produced any material changes in the findings.. These documents are
published by the Ministry of Finance.
District Level Financial
District level financial data have been collected from the Ministry of Finance (MoF) Regional
Financial Information System (SIKD). For district financial data for the years 2006-2007 the author
worked with the Officers of the SIKD section to be given access to the available SIKD records. The
SIKD collects in hard copy the budget and actual expenditures of all districts and provinces. A
painstaking process of manually sorting through the paper financial records of all districts and
provinces was undertaken.
From 2008 onwards it has been possible to access the electronic records of district budgets
submitted to the SIKD. Near complete financial records for all districts and provinces were obtained
for 2007 and for approximately 78% of all districts in 2006. Data collection from 2008 onwards has
been direct from the electronic records within the SIKD section of the MoF.
Data Sources and Collections: Non-Financial Data
Education
Data for student, teacher and school facilities are derived from the statistical collection of the
Education Census conducted by MoRA and MoEC. These data have been collected and stored in the
Enhanced Analytical Facility (EAF) that is kept with MoEC Balitbang. This database has been built
from available government statistical collections and represents authoritative government-
sanctioned data. The database includes population data collected from the Bureau of Central
Statistics (BPS).
Poverty
Poverty is an important analytical filter for the ASFR. Financial data analysis includes an examination
of poverty by segregating districts into poverty quintiles. The Poverty quintiles are based on the “P0”
poverty scale developed by Survei Sosial Ekonomi Nasional (SUSENAS). This scale captures the
incidence of poverty, i.e. the proportion of people living below the poverty line2. The ASFR indicators
2 The official method for calculating the incidence of poverty in Indonesia is the basic needs approach
developed by the BPS. The method is based on consumption related aspects of poverty with a poverty line

ANNUAL SECTOR FINANCIAL REPORT (2013) VERSION 1.0 5
and analysis are available to be used and incorporated within existing mandatory reports of MoEC
and MoRA.
The data underpinning most of the indicators at the district level are sourced from GoI statistical
collections. This should mean the indicators can be reported within other regular reports. At the
district level, these indicators will be useful and could be incorporated within their reporting
systems.
determined using average consumption in Rupiah for a list of basic essential food items and non-food bundle
items. An individual who is below the poverty line is considered to be poor. The PO index is the proportion of
all people living below that poverty line.

Financial Performance at National Level
ANNUAL SECTOR FINANCIAL REPORT (20123 7
2 FINANCIAL PERFORMANCE AT NATIONAL LEVEL
2.1 Introduction
Public funding for education in Indonesia is provided mostly by the central and provincial levels of
government, with the provincial level providing a smaller share. National level analysis of aggregate
public expenditure is complicated because of these different sources of funding and the
subsidization of salaries and services provided by the central level of government.
The national trends in the public financing of education are analyzed in this section. Key
Performance Indicators (KPIs) provide a macro-level assessment of government commitment
towards education. Each KPI has been assigned a ranking that indicates change on the year before
(neutral, positive, negative).
For the period 2001-2005 this report relies on data collected by the World Bank and presented in its
publication Investing in Indonesia’s Education (World Bank, 2007). For the period 2006-2008, the GoI
compiled comprehensive multi-year data on national and sub-national expenditures towards
education in its submission to the Supreme Court case on its legal obligation to allocate at least 20%
of the national budget towards education (Supreme Court Decision Number 13/PUU-VI/2008).
Detailed finance data for 2009 and 2010 was collected from the Financial Note and Indonesian
Revised Budget 2010, section III-2 (published by MoF, 2010), and from Financial Note and Indonesian
Proposed Budget 2011, section iv-100, MoF 2010. Financial data for 2013 was collected from Nota
Keuangan dan Rancangan Anggaran Pendapatan dan Belanja Negara Tahun Anggaran (published by
MoF 2013).
The key financial data underpinning the national level financing analysis are presented in the table
over-page.

ANNUAL SECTOR FINANCIAL REPORT (2013) VERSION 1.0 8
Table 2: National Level Education Financing Data 2001-2013 1
Item 2001 2002 2003 2004 2005 2006 2007 2008 2009 2010 2011 2012 2013
Nominal National
Education Expenditures
(Rp trillion) (1)
42.3 53.1 64.8 63.1 78.6 122.9
9
142.2 154 207.4
1
225.2 243.3 286.6 336.9
National Education
Expenditures (Rp trillion
2001 prices)
42.3 47.8 55.4 50.4 52.1 76.1 82.2 79.2 106.4 109.4 109.9 123.9 133.4
Education Exp. As % of
National Public Exp.
(% Total National Exp.)
12.% 15.8% 16.0% 14.2% 13.9% 17.6% 18.9% 15.6% 20.0% 20.0% 20.2% 20.2% 20.0%
National Education
Exp. (% GDP)
2.5% 2.8% 3.2% 2.8% 2.9% 3.7% 3.6% 3.1% 3.7% 3.5% 3.3% 3.5% 3.7%
Total Nominal National
Expenditures (Rp trillion)
352.8 336.5 405.4 445.3 565.1 699.1 752.4 989.5 1037.
1
1126.
2
1202.
0
1418.
5
1683.
0
GDP at Current Prices (4)
(Rp trillion)
1684.
0
1897.
8
2013.
6
2273.
1
2729.
7
3339.
2
3949.
3
4954.
0
5606.
0
6446.
9
7419.
2 8229
9084.
0
Total Real National
Expenditures (Rp.
Trillion 2001 prices)
352.8 302.7 346.3 356.0 374.5 432.7 435.0 508.8 532.2 547.3 543.1 613.4 666.6
1. Financial data for 2005-2008 from (CC: Constitutional Court Decision PUU-13/2008) where Government of Indonesia provided a
detailed breakdown of expenditure allocations. Data for 2001-2004 collected by World Bank and presented in its publication
Investing in Indonesia's Education (WB, 2007). Education expenditures and total national public expenditures 2009 -2013, from MoF
Financial Note and Indonesia Budget Year (for each relevant year).
2. Inflation data for 2001-2006 from BPS Key Indicators of Indonesia Table 5.2 Inflation Rate Year on Year 2002-2007 Statistic
http://dds.bps.go.id/eng/download_file/Booklet_indikatorkunci.pdf. This line compares expenditures at constant 2001 prices to
remove the cost of price inflation across years.Inflation rate for 2007-2009 from BPS Statistical Yearbook 2009 Table 12.5 Composite
Inflation Rate 2006-2009. Inflation rate For 2010-2011, BPS Statistical YearBook 2012
http://www.bps.go.id/eng/flip/flip11/index3.php. Inflation rate for 2012-2013BPS http://www.bps.go.id/eng/aboutus.php?inflasi=1
3. GDP at current prices from Bureau of Statistics 2001-2009, For 2010 - 2012, BPS Gross Domestic Product at Current Market Prices By
Industrial Origin (Billion Rupiahs), http://www.bps.go.id/eng/tab_sub/view.php?kat=2&tabel=1&daftar=1&id_subyek=11¬ab=1.
For 2013, GDP from BPS Statistical Yearbook 2014
http://www.bps.go.id/eng/hasil_publikasi/SI_2014/index3.php?pub=Statistik%20Indonesia%202014
1 National level data captures expenditures from all Ministries, not just MOEC and MORA.

ANNUAL SECTOR FINANCIAL REPORT (2013) VERSION 1.0 9
2.2 Key Performance Indicators
KPI 1: Education Expenditure as Proportion of Total Public Expenditure
Figure 1: Education Expenditure as Proportion of Total National Public Expenditure, 2001-
2013
KPI 1 EDUCATION EXPENDITURE AS PROPORTION OF TOTAL PUBLIC EXPENDITURE
STATUS AND TRENDS
Result Positive Data availability Full – all data required has been
collected and available for analysis
Observations
• GoI’s commitment to meet a 20% target for education expenditure share of national
budget has been met for the fifth year in a row (see Figure 1).
• The nominal value of public expenditures for education increased from 207 trillion in
2009 to 337 trillion by 2013 (see Figure 2 over-page).
• The public expenditure for education (not accounting for price inflation) increased
by approximately 60% between 2009 and 2013.
• The real value of public expenditure for education increased by 25% during the
period 2009- 2013. Almost all of the real increase in funding occurred in the two
years 2012 and 2013.
• The higher rate of inflation in 2013 compared to 2012 meant that the real increase
in education funding (Rp. 9.5 trillion in 2001 prices) was not as large as that recorded
in 2012 (Rp. 14 trillion) (see Figure 3 over page)
• In 2001 constant prices, national education expenditures increased more than 3
times their original 2001 value of Rp. 42 trillion to more than Rp. 124 trillion by
2013.
2001 2002 2003 2004 2005 2006 2007 2008 2009 2010 2011 2012 2013
Education Exp. As % of NationalPublic Exp.
(% Total National Exp.)12.0% 15.8% 16.0% 14.2% 13.9% 17.6% 18.9% 15.6% 20.0% 20.0% 20.2% 20.2% 20.0%
0.0%
5.0%
10.0%
15.0%
20.0%
25.0%National Public Education Exp
enditure as % of
National Public Exp
enditure

ANNUAL SECTOR FINANCIAL REPORT (2013) VERSION 1.0 10
KPI 1 EDUCATION EXPENDITURE AS PROPORTION OF TOTAL PUBLIC EXPENDITURE
STATUS AND TRENDS
• Annual increases in national education expenditure have been uneven. The growth
in public expenditure (while still positive) has been uneven in its nominal value and
2001 constant prices. Sharp increases in public expenditure for education in the
years 2003 and 2006 were followed by contractions in 2004 and 2008.
• Annual growth in national public expenditure for education in 2013 exceeded price
inflation for the second time since 2009. Growth in education expenditures had
marginally outpaced inflation since 2009 but there was a plateau in the real increase
of national funding for education. In 2012 and 2013 we see significant back to back
increases in real terms for education funding. When accounting for the eroding
impact of price inflation over time, the real increase in funding for education can be
observed. The periods 2003-2005 and 2007-2008 saw a virtual pause (or even a
slight decline) in real education expenditures
IMPLICATIONS AND MATTERS ARISING
For the
performance of the
education sector
• The national expenditures for education in 2013 met the 20% target. Like the
previous year, this has generated a large year-on-year increase in real funds
available for education. Education has benefited from total national public revenues
and expenditures which have grown at a significantly faster rate than inflation.
• Adherence to a proportional budget allocation for education should enhance the
ability of the education sector to anticipate future allocations and plan accordingly
by creating a more stable financing framework. The proportional allocation
approach toward education financing (i.e. 20% of available national public budget)
will enhance predictability and steady growth of the education budget. The
exception to this will be in the case of an economic downturn that depresses GoI
revenues or where there is a change government fiscal policy settings, leading to
reduced public expenditure as a proportion gross domestic product.
For the
performance of the
Education
Partnership
• National funding flowing to schools should not be reduced and total funds available
are unlikely to be reduced.

ANNUAL SECTOR FINANCIAL REPORT (2013) VERSION 1.0 11
Figure 2: National Public Expenditure on Education, Rp. Trillion 2001-2013
Figure 3: Annual Growth in Education Expenditure (Rp. trillion), 2001-2013
2001 2002 2003 2004 2005 2006 2007 2008 2009 2010 2011 2012 2013
Nominal National Education Expenditures 42.3 53.1 64.8 63.1 78.6 123.0 142.2 154.0 207.4 225.2 243.3 286.6 336.9
National Education Expenditures (constant2001 prices)
42.3 47.8 55.4 50.4 52.1 76.1 82.2 79.2 106.4 109.4 109.9 123.9 133.4
0.0
50.0
100.0
150.0
200.0
250.0
300.0
350.0
400.0
Tota
l E
xp
en
ditu
re (
Rp
. T
rilli
on
)

ANNUAL SECTOR FINANCIAL REPORT (2013) VERSION 1.0 12
KPI 2: Education Expenditure as Proportion of GDP
Figure 4: Education Expenditure as Proportion of GDP, 2001-2013
KPI 2 EDUCATION EXPENDITURE AS PROPORTION OF GDP
STATUS AND TRENDS
Result Positive Data availability Full - all data required has been collected
and available for analysis
Observations
• This indicator captures the national public budgeted commitment towards
education in relation to the economic wealth being generated. By mapping
education expenditure with GDP it avoids comparison problems with other countries
which may have different sized public sectors. The indicator is also useful for
comparing expenditure trends in a country which has altered the size of its public
sector across time. Generally, this indicator is used in tandem with “education share
of public expenditure”.
• Budgeted Education expenditure as a proportion of GDP increased from 3.5% in
2012 to 3.7% in 2013 (see Figure 4, above). Over a longer period, it rose from 2.5%
in 2001 to the high point of 3.7% in 2013. In 2007 when the latest comparison
figures are available, Indonesian education expenditure as a share of GDP (3.6%)
was equal to the East Asia regional average.
• While national education expenditure grew at the same pace as national public
expenditure for the period 2009-13, it has grown marginally faster than GDP during
this period.
IMPLICATIONS AND MATTERS ARISING
For the
performance of the
education sector
• Expressed as a percentage of GDP, future growth in public allocations will become
contingent on an increase in public expenditures as a proportion of GDP. In a year
such as 2013 where government grows public expenditures at a faster rate than
GDP, then public expenditure as a proportion of GDP will increase if government
enforces its policy setting of a minimum 20% allocation for education expenditure.

ANNUAL SECTOR FINANCIAL REPORT (2013) VERSION 1.0 13
KPI 2 EDUCATION EXPENDITURE AS PROPORTION OF GDP
STATUS AND TRENDS
Education expenditure as a percentage of GDP may decline if (i) fiscal settings
reduce public expenditures as a proportion of GDP, and (ii) the government does not
exceed the 20% target for education as a proportion of total public expenditure.
KPI 3: Education Non-salary Expenditure as Share of Total Expenditure
Figure 5: Composition of Aggregate District Education Expenditure, 2009-2011
KPI 3 EDUCATION NON-SALARY EXPENDITURE AS SHARE OF TOTAL EXPENDITURE
STATUS AND TRENDS
Result Positive Data availability
Partial. District supplied data from 2009-
2011. Data only refers to the district tier of
government and does not include
considerable non-salary payments likely to
be flowing from central level government
to districts and schools.
Observations
• School systems require a substantial share of non-salary related expenditures to (i)
provide a full range of resources (apart from teachers) to schools, and (ii) maintain
buildings and provide for additional capital and equipment needs.
• In 2011 the salary share of expenditures of total district level expenditures had come
down to 75% from 86% the year before (see Figure 5). In the context of the
additional salary costs associated with the teacher certification process, this is a very
positive achievement.
• New budget allocations were especially strong for capital items which doubled from
7% of total district budgets in 2010 to 14% in 2011.
• Budget allocations for operational costs also grew strongly from 6% in 2010 to 10%
in 2011.
IMPLICATIONS AND MATTERS ARISING
For the
performance of the
education sector
• In 2011 there was a significant year-to-year improvement in the share of resources
being allocated to non-salary expenses within the education budget. Unfortunately
there is little room for complacency in this respect due to the ongoing fiscal impact
of remuneration for teachers attaining teacher certification. Certified teachers will
garner at least 100% pay increases once they are certified. The cumulative impact of

ANNUAL SECTOR FINANCIAL REPORT (2013) VERSION 1.0 14
KPI 3 EDUCATION NON-SALARY EXPENDITURE AS SHARE OF TOTAL EXPENDITURE
STATUS AND TRENDS
these increases will act to severely constrain future increases in non-salary
expenditures. It will be increasingly important for districts and schools to ensure that
non-salary expenditures are effective and efficiently distributed.
For the
performance of the
Education
Partnership
• District budget allocations for non-salary items in education will be very important
to support the improvement in the quality of education. In particular the
Professional Development of principals and teachers will require the financial
support of districts beyond the EP funded interventions. EP districts which have very
little funding allocated for operational activities (outside of salaries) should be
monitored and engaged in a policy dialogue to understand current allocations and
future plans.

ANNUAL SECTOR FINANCIAL REPORT (2013) VERSION 1.0 15

Financial Performance at District Level

ANNUAL SECTOR FINANCIAL REPORT (2013) 17
3 FINANCIAL PERFORMANCE AT DISTRICT LEVEL
3.1 Introduction
District-level expenditure patterns are increasingly important because districts have increased
responsibility for education management under decentralisation. Monitoring patterns of
expenditure by districts will become an increasingly important role for MoEC and MoRA so they can
better ensure that national funding norms and procedures are being implemented appropriately.
The wide range of districts’ poverty status and the importance of education in lifting district
populations out of poverty also mean that vulnerable groups stand to benefit most from well-
targeted investments in education.
These district level analyses also can support the EP at the district level. Most directly, the
sustainability and success of Component 2 will depend on districts being able and willing to finance
professional development of key personnel, e.g. principals and supervisors. As such, it is important
to monitor trends in district level education financing.
This section provides comparisons of district-level education expenditures for 2006-2013. The year
2006 is a useful benchmark to identify the nature and extent of education spending at the district
level because it is before the commencement of the Australian government funded expenditures
through the BEP program that preceded the current EP.
The district-level analysis provides comparisons in district expenditures between (i) rural and urban
districts, (ii) EP and non-EP districts (with some reference to the earlier Australian funded BEP
districts, (ii) districts sorted into poverty quintile rankings, (iv) provinces, and (v) island groups.
Supplementary analysis in 2013 also compares (i) education and health sector allocations in districts
and (ii) allocations between districts based on the eir year of establishment (age of district).
The district poverty analysis is driven by the distribution of all districts (rural and urban) into poverty
quintiles. This means there are approximately 100 districts in each quintile. Quintile 1 (richest)
‘hosts’ the 100 districts which have the lowest percentage of individuals living in poverty. This
measure of poverty is taken from the BSP PO poverty index that is widely used for measuring
poverty in Indonesia.
The ASFR is based on data collected electronically for the period 2010 to 2013. District data prior to
this period have been collected directly from the SIKD section of MoF. The SIKD collected in hard
copy format the budget and actual expenditures of all districts and provinces. The non-financial data
(teacher and enrolments) have been collected from MoEC. Since 2010, these data have been
supplemented by data collected electronically from the MoF. The 2010 ASFR was the first to have an
entire year that was derived entirely from electronic records provided by SIKD MoF. The data
provided by the MoF is subjected to logic tests and assessed for it completeness by the study team.
The district analysis utilizes five KPIs to examine district financing of education across Indonesia. The
financial data only captures district government expenditures within each district. The financial
analysis does not therefore capture the allocations made by central or provincial governments which
may flow into the education sector within each district. It does not capture the MoRA allocations for
public and private Madrasah which are central government allocations. The district analysis is
therefore only useful as an indicator of district government priorities and expenditure patterns.

ANNUAL SECTOR FINANCIAL REPORT (2013) VERSION 1.0 18
The figure below presents the number of districts which have supplied data to MoF and MoEC that
has been used monitor the KPIs of the district level analysis.
Figure 6: Number of Districts Included in ASFR Analysis, (2007-2013)
3.2 Key Performance Indicators
KPI 4: District Financial Commitment to Education
Figure 7: Education Expenditure as % of Total District Budget (APBD 2006-2013)

ANNUAL SECTOR FINANCIAL REPORT (2013) VERSION 1.0 19
KPI 4 DISTRICT FINANCIAL COMMITMENT TO EDUCATION
STATUS AND TRENDS
Result Neutral Data availability
Financial data for 2013 were available for
496 districts and enrolment data for 490
districts.
Observations
• Average district level education expenditures across Indonesia increased from 27%
of the total district budget (APBD) in 2006 to just over 34% in 2013 (see Figure 7,
above).
• The strong increase in 2011 was reversed in 2012 and 2013 with the education share
dropping just over 2.5% from 36.7% in 2011.
• The consecutive reduction in the average education share of district budgets in 2012
and 2013 came after a sharp increase in 2011.
• The overall increased share of education expenditures at the district level from 31%
in 2009 to 34% in 2013 demonstrates that districts, on average, strengthened their
commitment toward education spending during the period 2009-2013.
• The slight reduction in share of allocations towards education is consistent for urban
and rural areas. Rural areas dropped from average 37% share in 2011 to 34% in
2013, with urban 35% to 33% respectively.
• While these averages show maintenance of financial commitment to education, it
does disguise some variation between districts, provinces and islands. Comparison
of the fluctuations of individual districts may not be useful as their expenditure may
be significantly affected by one-off large annual investments.
• The lowest average share of budget allocation for education continues to be found
in Papua (16%). This is in contrast to Maluku island group which has grown its share
of expenditure from a similar 16% in 2006 to 25% in 2013. Papua on the other has
been stuck in the range of 16%-18% education share of district budgets since 2006.
• Districts in Java have had a significant drop in the average education share of district
budgets, from 46% in 2011 to 42% in 2013 – this however is positive as these are
very high shares and may be crowding out other expenditures.
• The poorest quintile districts are a clear outlier with lowest average district
education budget of Rp. 228 trillion in 2013 compared to the all the other quintiles
which are grouped between Rp. 374 – 398 trillion
• Nationally, 31 districts allocated less than 15% of their total district budget (APBD) to
education in 2013. Of the 31 districts, 24 are in the poorest quintile.
• Of the 24 poorest districts spending less than 15% of their budget on education in
2013, 22 found in Papua.
• Nineteen districts have allocated four years in a row (2010-2013)less than 15% of
their total district budget (APBD) to education..
• The poorest districts have consistently committed the lowest proportion of their
budget towards education during the period 2006-2013.
• In 2013, the poorest districts accelerated their trend towards allocating a smaller
share of their budget for education with just 28% allocated. Districts in all other
poverty quintiles allocated more than 30%.
Observations about
EP districts
• On average, the EP districts committed a greater proportion of their budget towards
education than the non-participating districts. On average, EP districts allocated
between 35%-37% of their budget in 2013, compared with 31% for the non-
participating districts.
• Eighteen EP districts contributed less than the 20% national target to education with
the majority of these in Kalimantan. They were also considerably lower than the
national average of 34% for education in 2013.

ANNUAL SECTOR FINANCIAL REPORT (2013) VERSION 1.0 20
KPI 4 DISTRICT FINANCIAL COMMITMENT TO EDUCATION
STATUS AND TRENDS
• Nineteen(19) EP districts committed more than 50% of their total district budget
towards education in 2013 – compared with 36 districts in 2012. The reduction is
positive as 50% is a very high and unsustainable share with impact on other
spending areas.
Observations about
AIBEP districts
• From 2010 to 2013 there are eleven (11) BEP districts which have dedicated less
than 20% of their budget towards education in every year. Seven of the eleven BEP
districts that report spending less than 20% of their budget on education are
located on Maluku.
IMPLICATIONS AND MATTERS ARISING
For the
performance of the
education sector
• The recurring concern is that some districts with the highest poverty rates are
persistently allocating a significantly smaller share (less than 15%) of resources for
education than the national average.
• Maluku has now posted consecutive increases in its education share of expenditure
since 2008 and is above 25% share for education.
• Papua is the sole stand out in spending the least on education as a proportion of
total district funds.
For the
performance of the
Education
Partnership
• Focus diagnostic and policy response efforts on the Papua island group to
understand and improve district school funding in the near future.
Discussion
The average total district budget in 2013 (for all areas of expenditure, including education) grew by
approximately Rp. 150 billion on 2012 allocations (17% growth). This was faster than the growth in
the education expenditure, which grew at just over 14% year to year (2012-2013; see Figure 8,
below).
Figure 8: Average District APBD and APBD for Education, 2006-2013

ANNUAL SECTOR FINANCIAL REPORT (2013) VERSION 1.0 21
Annual district education expenditure has dropped off from an average 37% in 2011 to 34% in 2013.
The two years of declining average share of expenditure may signal that the gains of previous years
are under pressure at the district level.
While both urban and rural districts are showing a declining share of district budgets towards
education, it is the rural areas that have posted the biggest drop from 37% in 2011 to 34% in 2013.
(see Figure 9, below).
Figure 9: Rural and Urban District Education Expenditure as % of Total District Budget (APBD
2006-2013)
In 2013 there is a change with reduced allocation share towards education across districts in all
poverty quintiles. But there are differences in the rate of the decrease.
Poverty quintile analysis still reveals a disturbing picture where the poorest districts have
consistently committed the lowest proportion of their budget towards education during the period
2006-2013.
Districts in other poverty quintiles were allocating between 31%-38% of their budgets towards
education. Most concerning is that the poorest districts have, on average, been reducing their share
of expenditure at a faster rate than all other districts. Poorest quintile districts are now alone in
spending on average less than 30% of their budgets on education (28% in 2013).

ANNUAL SECTOR FINANCIAL REPORT (2013) VERSION 1.0 22
Figure 10: Education Expenditure as % of Total District Expenditure by Districts according to
Poverty Quintile, (APBD 2006-2013)
From 2009 onwards, the average size of district global budgets (for all sectors) directly corresponds
to their poverty quintile status. The richest quintile districts have an average district budget in 2013
of Rp. 1.2 trillion compared to the poorest districts Rp. 800 trillion. The other three quintiles are
distributed within this range according to their quintile rank.
In terms of aggregate education expenditure, the poorest quintile districts are the clear outlier with
the lowest average district education budget of Rp. 228 trillion compared to the all the other
quintiles which are grouped between Rp. 374 – 398 trillion (see Figure 11).
Figure 11: Average District APBD and APBD for Education, by poverty quintile 2006-2013

ANNUAL SECTOR FINANCIAL REPORT (2013) VERSION 1.0 23
Following the big increases in education expenditure in 2011, there have been sustained declines in
education share of expenditure in the island groups of Java, Sumatera and Kalimantan. Bali has
corrected its strong decline in 2012 with an increase to 35% share of budget in 2013.
Of particular concern, is that Papua alone remains below the average 20% commitment of district
funds towards education. It has further retreated from the 20% commitment, with expenditures
declining from 18% of funds in 2011 to 16% in 2012 and 2013.
The island groups of Maluku and Bali went in the opposite direction and posted an annual increase
the education share of district expenditures in 2013. (see Figure 14, below).
Figure 12: Education Expenditure as % of Total District Expenditure by Island Grouping (APBD
2006-2013)
Education Partnership (EP) districts
On average, the districts participating in the EP (see Annex B) commit a greater proportion of their
budget towards education than the non-participating districts. On average, Component 1 and 2
districts allocated 37% of their budget in 2013, compared with 31% for the non-participating districts
(see Figure 15, below).

ANNUAL SECTOR FINANCIAL REPORT (2013) VERSION 1.0 24
Figure 13: EP Districts - Average Education Allocations as Proportion of District Budget,2006-
2013
Eighteeen EP districts contributed less than the 20% national target for education and therefore
were considerably lower than the national average of 34% in 2013 (see Figure 16, below). Eleven of
the EP districts that allocated less than 20% in 2013 also allocated less than 20% in 2012.
ANNUAL SECTOR FINANCIAL REPORT (2013) VERSION 1.0 25
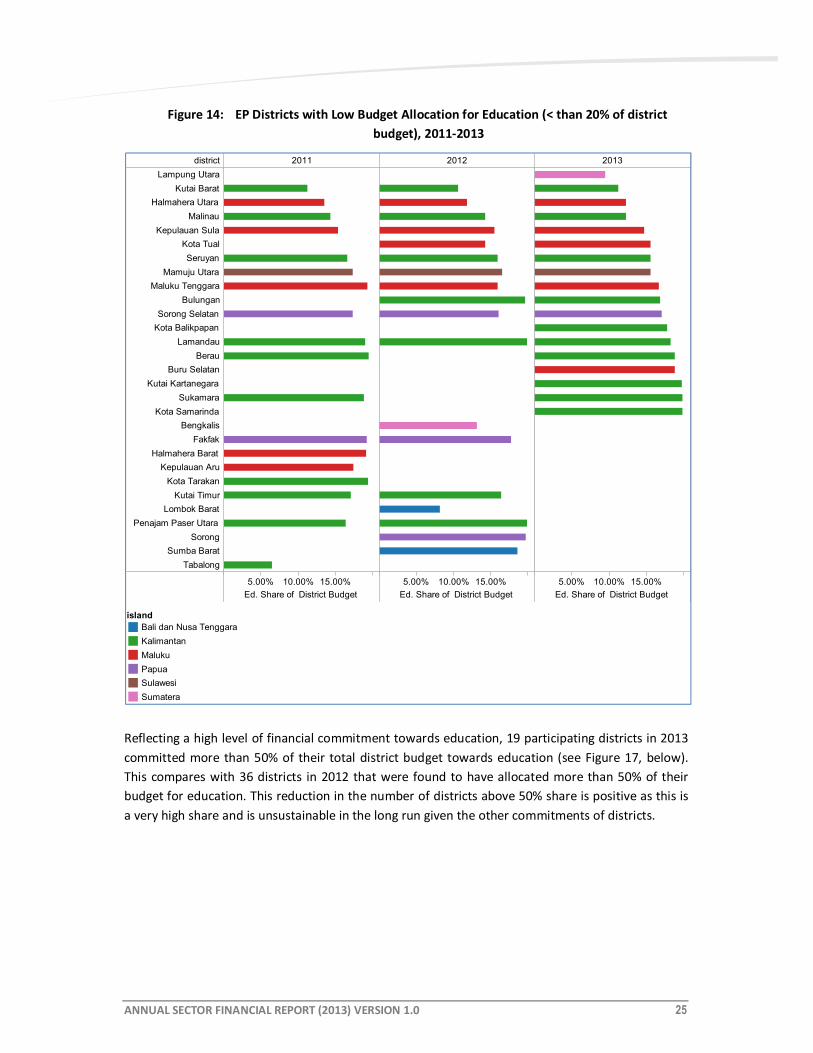
Figure 14: EP Districts with Low Budget Allocation for Education (< than 20% of district
budget), 2011-2013
Reflecting a high level of financial commitment towards education, 19 participating districts in 2013
committed more than 50% of their total district budget towards education (see Figure 17, below).
This compares with 36 districts in 2012 that were found to have allocated more than 50% of their
budget for education. This reduction in the number of districts above 50% share is positive as this is
a very high share and is unsustainable in the long run given the other commitments of districts.
district 2011 2012 2013
5.00% 10.00% 15.00%
Ed. Share of District Budget
5.00% 10.00% 15.00%
Ed. Share of District Budget
5.00% 10.00% 15.00%
Ed. Share of District Budget
Lampung Utara
Kutai Barat
Halmahera Utara
Malinau
Kepulauan Sula
Kota Tual
Seruyan
Mamuju Utara
Maluku Tenggara
Bulungan
Sorong Selatan
Kota Balikpapan
Lamandau
Berau
Buru Selatan
Kutai Kartanegara
Sukamara
Kota Samarinda
Bengkalis
Fakfak
Halmahera Barat
Kepulauan Aru
Kota Tarakan
Kutai Timur
Lombok Barat
Penajam Paser Utara
Sorong
Sumba Barat
Tabalong
island
Bali dan Nusa Tenggara
Kalimantan
Maluku
Papua
Sulawesi
Sumatera
ANNUAL SECTOR FINANCIAL REPORT (2013) VERSION 1.0 26
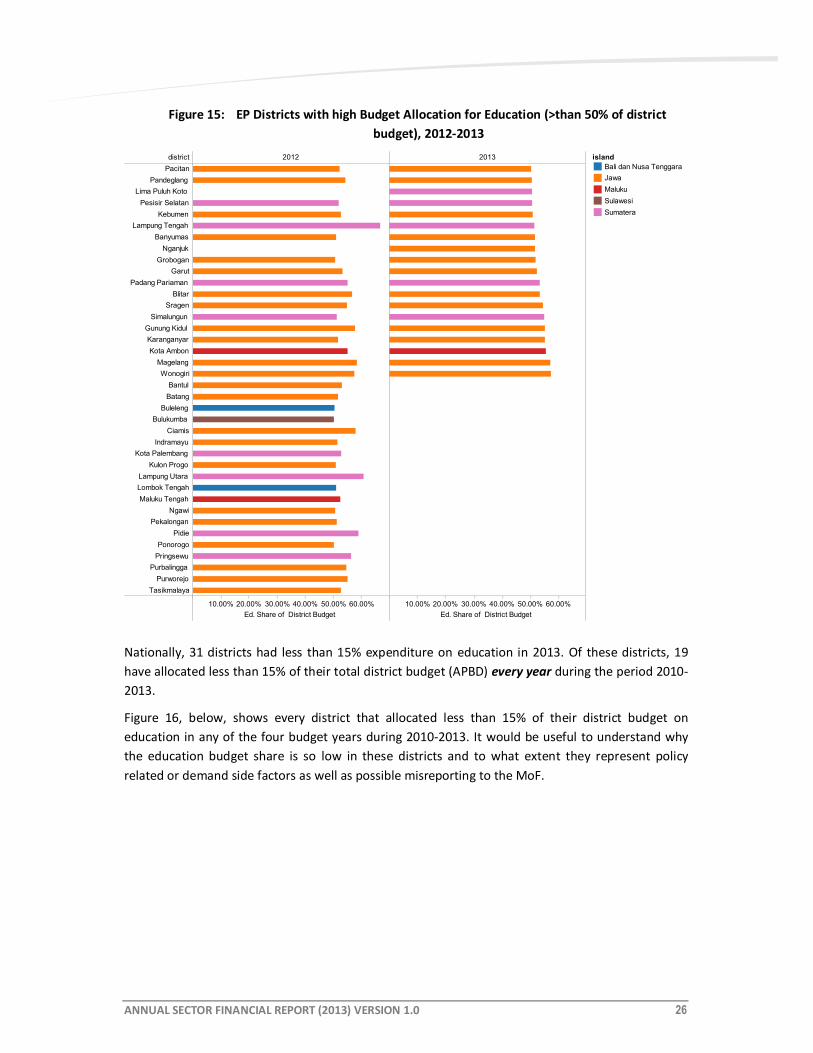
Figure 15: EP Districts with high Budget Allocation for Education (>than 50% of district
budget), 2012-2013
Nationally, 31 districts had less than 15% expenditure on education in 2013. Of these districts, 19
have allocated less than 15% of their total district budget (APBD) every year during the period 2010-
2013.
Figure 16, below, shows every district that allocated less than 15% of their district budget on
education in any of the four budget years during 2010-2013. It would be useful to understand why
the education budget share is so low in these districts and to what extent they represent policy
related or demand side factors as well as possible misreporting to the MoF.
district 2012 2013
10.00% 20.00% 30.00% 40.00% 50.00% 60.00%
Ed. Share of District Budget
10.00% 20.00% 30.00% 40.00% 50.00% 60.00%
Ed. Share of District Budget
Pacitan
Pandeglang
Lima Puluh Koto
Pesisir Selatan
Kebumen
Lampung Tengah
Banyumas
Nganjuk
Grobogan
Garut
Padang Pariaman
Blitar
Sragen
Simalungun
Gunung Kidul
Karanganyar
Kota Ambon
Magelang
Wonogiri
Bantul
Batang
Buleleng
Bulukumba
Ciamis
Indramayu
Kota Palembang
Kulon Progo
Lampung Utara
Lombok Tengah
Maluku Tengah
Ngawi
Pekalongan
Pidie
Ponorogo
Pringsewu
Purbalingga
Purworejo
Tasikmalaya
island
Bali dan Nusa Tenggara
Jawa
Maluku
Sulawesi
Sumatera

ANNUAL SECTOR FINANCIAL REPORT (2013) VERSION 1.0 27
Figure 16: Districts with very low financial share for education (less than 15% of APBD
Expenditure) 2010 -2013
* Districts that are blank for one year have exceeded the benchmark for that year.
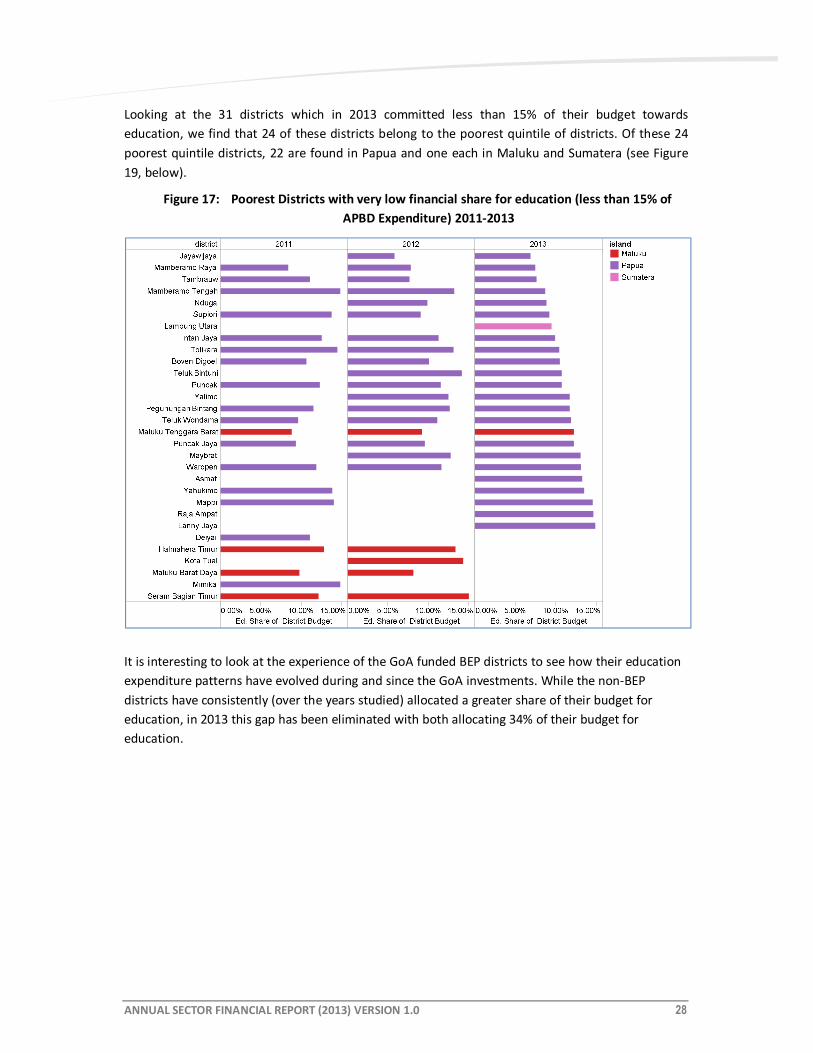
ANNUAL SECTOR FINANCIAL REPORT (2013) VERSION 1.0 28
Looking at the 31 districts which in 2013 committed less than 15% of their budget towards
education, we find that 24 of these districts belong to the poorest quintile of districts. Of these 24
poorest quintile districts, 22 are found in Papua and one each in Maluku and Sumatera (see Figure
19, below).
Figure 17: Poorest Districts with very low financial share for education (less than 15% of
APBD Expenditure) 2011-2013
It is interesting to look at the experience of the GoA funded BEP districts to see how their education
expenditure patterns have evolved during and since the GoA investments. While the non-BEP
districts have consistently (over the years studied) allocated a greater share of their budget for
education, in 2013 this gap has been eliminated with both allocating 34% of their budget for
education.

ANNUAL SECTOR FINANCIAL REPORT (2013) VERSION 1.0 29
Figure 18: APBD Education Expenditure as % of Total district Expenditure in BEP and Non-BEP
Supported Districts (APBD 2006-2013)
While BEP districts have committed a share of their district budget that is broadly in line with the
national average, there are some BEP districts that have spent considerably less.
This report presents four years of results from 2010 to 2013 showing there have been eleven (11)
BEP districts which have dedicated less than 20% of their budget towards education in every year.
Seven of the eleven BEP districts that report spending less than 20% of their budget on education
across the four years (2010-13) are located on Maluku. While some of the low figures may be due to
poor reporting, the persistence of these low allocations shares in consecutive years suggest there
are other factors involved.
Ed. Share of District Budget

ANNUAL SECTOR FINANCIAL REPORT (2013) VERSION 1.0 30
Figure 19: BEP Districts with low financial share for education (less than 20% of APBD
Expenditure) 2009 and 2013
* Districts that are blank for one year have exceeded the benchmark for that year.
district
year
2010 2011 2012 2013
10.00% 20.00%
Ed. Share of District Budg..
10.00% 20.00%
Ed. Share of District Budg..
10.00% 20.00%
Ed. Share of District Budg..
10.00% 20.00%
Ed. Share of District Budg..
Konawe
Kepulauan Aru
Sumbawa Barat
Lamandau
Halmahera Utara
Maluku Tenggara Barat
Halmahera Timur
Halmahera Selatan
Seram Bagian Timur
Konawe Utara
Sukamara
Maluku Tenggara
Kayong Utara
Halmahera Tengah
Mamuju
Kepulauan Sula
Halmahera Barat
Seruyan
Kolaka Utara
Balangan
Buton Utara
Katingan
Kepulauan Selayar
Konawe Selatan
Lombok Barat
Sumba Barat
Sumba Tengah
Tabalong
Tanah Bumbu
13.17%
16.62%
10.55%
16.11%
16.13%
14.25%
15.64%
15.33%
18.26%
8.16%
6.37%
8.14%
8.44%
9.92%
18.27%
19.87%
15.60%
12.27%
12.26%
12.40%
15.32%
16.68%
19.48%
14.77%
19.85%
island
Bali dan Nusa Tenggara
Kalimantan
Maluku
Sulawesi

ANNUAL SECTOR FINANCIAL REPORT (2013) VERSION 1.0 31
KPI 5: Annual Growth in Education Spending for the Poorest Districts
Figure 20: Figure 22: Annual Growth in APBD Education Expenditure, 2007 -2013, by Poverty
Quintile
KPI 5 ANNUAL GROWTH IN EDUCATION SPENDING FOR THE POOREST DISTRICTS
STATUS AND TRENDS
Result Positive Data availability
Financial data for 2013 were available for
496 districts and enrolment data for 490
districts.
Observations
• The poorest districts (i.e. those in the bottom quintile) recorded a 13% average
annual growth in their 2013 education budget on the previous year. This follows
weaker growth (7%) in 2012 (see Figure 20, above).
• The growth rates in 2013 need to take into account of the steeper inflation rate for
the year (8.4%) which is higher than previous years and eats into the real value of
the increase.
• In 2013, only 62 districts (13% of all districts) showed a decline in their education
budget. This is an improvement from 2012, when 97 districts (approximately 20%)
experienced a decline in annual education budget allocation.
• In 2013, 17 of the poorest districts experienced a contraction in their nominal
education expenditure (before accounting for inflation) compared to the previous
district annual budget. This is an improvement from the previous year when 31 of
poorest quintile districts experienced an annual decline.
• Papua accounts for 10 of the 17 poorest districts with contracting education budget
allocations in 2013.
• Urban districts with an average annual growth of 17% in year to year allocations
grew more strongly than urban districts (13%).
Observations about
EP districts
• In 2013 EP districts were in line with national average and grew their education
budgets by 14% on the previous year’s budget.

ANNUAL SECTOR FINANCIAL REPORT (2013) VERSION 1.0 32
KPI 5 ANNUAL GROWTH IN EDUCATION SPENDING FOR THE POOREST DISTRICTS
STATUS AND TRENDS
• While 40 EP districts contracted their education budget in 2013 compared to the
previous year, this was an improvement on 2012 when 59 contracted.
Observations about
AIBEP districts
• In 2013 for the first time since 2007, BEP districts had a slower rate of growth in
their education allocations (10%) compared to non-BEP districts (14%)
IMPLICATIONS AND MATTERS ARISING
For the
performance of the
education sector
• The poorest districts grew their education budgets at a rate that was closer to the
faster rates (16%) of the two richer quintile districts. This suggests some
improvement on previous years when they have been slipping further behind. Their
growth of education budgets is now significantly above the annual inflation rate.
• A reduction in the number of districts that are contracting their allocations for
education is a positive sign.
• A comparative diagnostic assessment should be considered for those poorest
districts which are continuing to reduce their education allocations with others that
have changed course and are now growing.
For the
performance of the
Education
Partnership
• There is merit in monitoring those EP districts that reduced their 2013 education
budget allocations in terms of their contributions and participation in EP funded
activities.
Discussion
The average annual growth rate of district education budgets in 2013 was a strong 14%. This follows
a similar growth in 2012 (12%). A 12% annual growth in nominal education spending is healthy but it
needs to be understood in the context of an 8.4% increase in prices as measured by the BPS
Consumer Price Index for 2013. The strongest growth was again shown in the urban districts, which
had annual growth of 17% compared with an 13% annual growth of rural districts (see Figure 21,
below).

ANNUAL SECTOR FINANCIAL REPORT (2013) VERSION 1.0 33
Figure 21: Annual Growth in District Education Expenditure, (APBD 2007-2013)
In 2013, 17 of the poorest districts experienced a contraction in their nominal education expenditure
(before accounting for inflation) compared to the previous district annual budget. This is an
improvement on the previous year when 31 of the poorest quintile districts experienced an annual
decline in the dedicated district budget funds for education..
Papua remains the focus of the decline. Ten of the seventeen districts recording a decline in nominal
annual district education expenditure are located in Papua.

ANNUAL SECTOR FINANCIAL REPORT (2013) VERSION 1.0 34
Figure 22: Poorest Districts (Quintile 5), Negative Annual Growth in Education Expenditure,
(APBD 2011-2013)
Poverty quintile analysis of districts with declining education budget allocations in 2013 shows them
to be distributed across all quintiles although 17 of the 62 are from the poorest quintile.

ANNUAL SECTOR FINANCIAL REPORT (2013) VERSION 1.0 35
Figure 23: Total Number of Districts, with Negative Annual Growth in APBD Education
Expenditure, 2007 -2013
In 2013 there were 40 EP districts that experienced a decline in their annual allocation for education,
which is a reduction compared to the previous year of 59 districts.
Figure 24: Number of Districts with declining annual education expenditure, 2010 - 2013
A specific focus is to observe the number of poorest districts (bottom 20% by poverty ranking) which
provided less for education than the previous year. In 2013, there were seven EP districts in the
poorest quintile which provided less for education than their previous budget. This is a
significantimprovement on the previous year when 14 districts provided less for education than the
previous year.
Number of Districts

ANNUAL SECTOR FINANCIAL REPORT (2013) VERSION 1.0 36
Figure 25: EP Poorest Districts with declining annual education expenditure (2012 and 2013)
The following four tables provide (i) the name of those EP districts which had an annual decline their
financial commitment towards education in 2013, and (ii) the percentage drop in their financial
commitment to education compared to the value of the previous year’s budget .
Figure 26: Component 1 districts with declining annual education expenditure (2013 vs 2012)
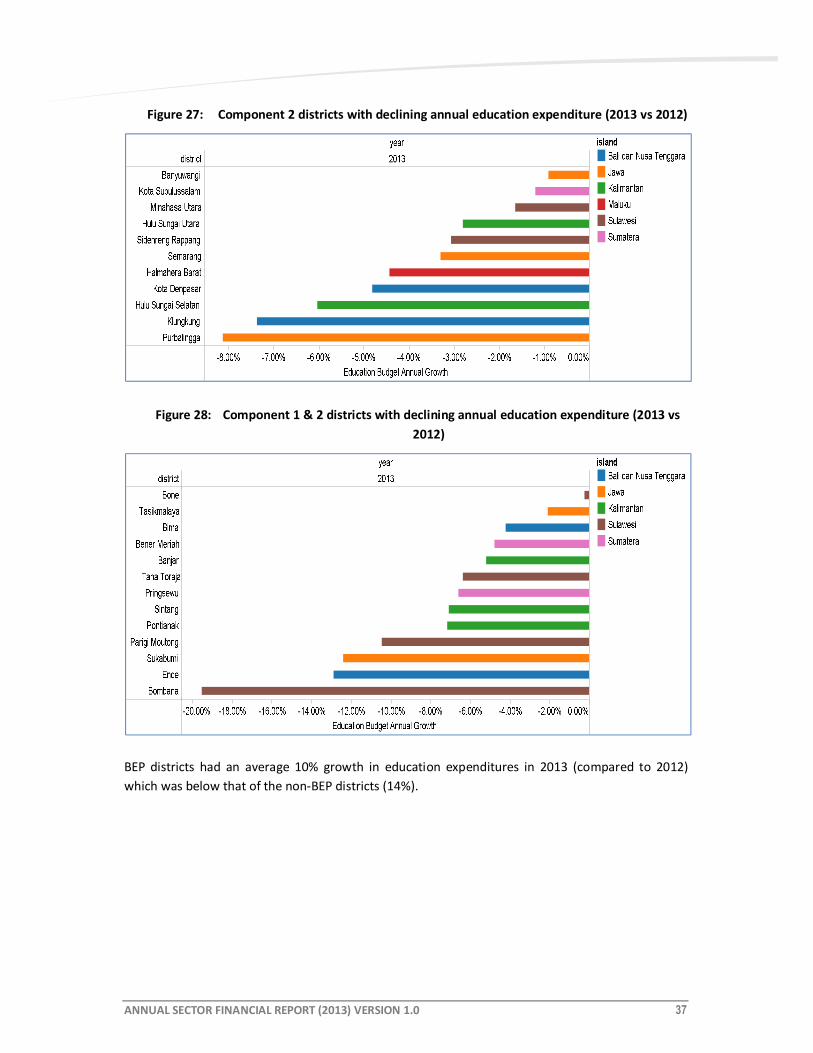
ANNUAL SECTOR FINANCIAL REPORT (2013) VERSION 1.0 37
Figure 27: Component 2 districts with declining annual education expenditure (2013 vs 2012)
Figure 28: Component 1 & 2 districts with declining annual education expenditure (2013 vs
2012)
BEP districts had an average 10% growth in education expenditures in 2013 (compared to 2012)
which was below that of the non-BEP districts (14%).

ANNUAL SECTOR FINANCIAL REPORT (2013) VERSION 1.0 38
Figure 29: BEP and Non-BEP Districts - Annual Growth in District Education Expenditure,
(APBD 2007-2013)
In 2013 there were 62 districts showing a decline in the education budget. This is an improvement
from 2012, where 97 districts experienced a decline in annual education budget allocation. In 2013,
12% of districts showed a decline in budget commitment towards education compared to 20% in
2012.
Figure 30: Number of Districts, with Negative Annual Growth in APBD Education Expenditure
(2009-2013)
Education Budget Annual ..
Education Budget Annual ..
Education Budget Annual ..

ANNUAL SECTOR FINANCIAL REPORT (2013) VERSION 1.0 39
KPI 6: Average District Expenditure per Student
Figure 31: Average District Education Expenditure per all Students, 2006-2013 (Rp. millions.)
KPI 6 AVERAGE DISTRICT EXPENDITURE PER STUDENT
STATUS AND TRENDS
Result Positive Data availability
Financial data for 2013 was available for
496 districts and enrolment data for 490
districts.
Observations
• Average expenditure per student across the country grew at about the same rate as
for 2012. Average education expenditure per student has grown to Rp. 3.5 million in
2013, from an average Rp. 3.1 million in 2012 (see Figure 31, above).
• Average per student expenditure is higher in rural districts and reached Rp. 3.6
million per student in 2013 compared to Rp. 3.2 million per student in the urban
areas.
• Highest allocations per student are found in the poorest districts (quintile 5) at an
average Rp. 3.8 million per student.
• The richest quintile districts are the outliers with per student expenditures at Rp.
3.1 million. The poorest districts are on average allocating 23% more per student
than the richest. This is a consistent trend over time.
• Districts in the far eastern region of the country tend to have significantly higher
costs per student than districts in the western region because of the lower density of
populations. Average expenditure per student in 2013 was again highest in the
island groups of Papua (Rp. 6.2 million) and Kalimantan (Rp. 5.7 million). Lowest
expenditure by a considerable margin is found on Java with Rp. 2.9 million per
student.
• Papua has again returned to growth in its education allocations after a contraction
2012.
• Papua had 13 districts contract budget allocations in 2013. This was an improvement
on 2012, when 17 districts showed a contraction on their previous year allocation.
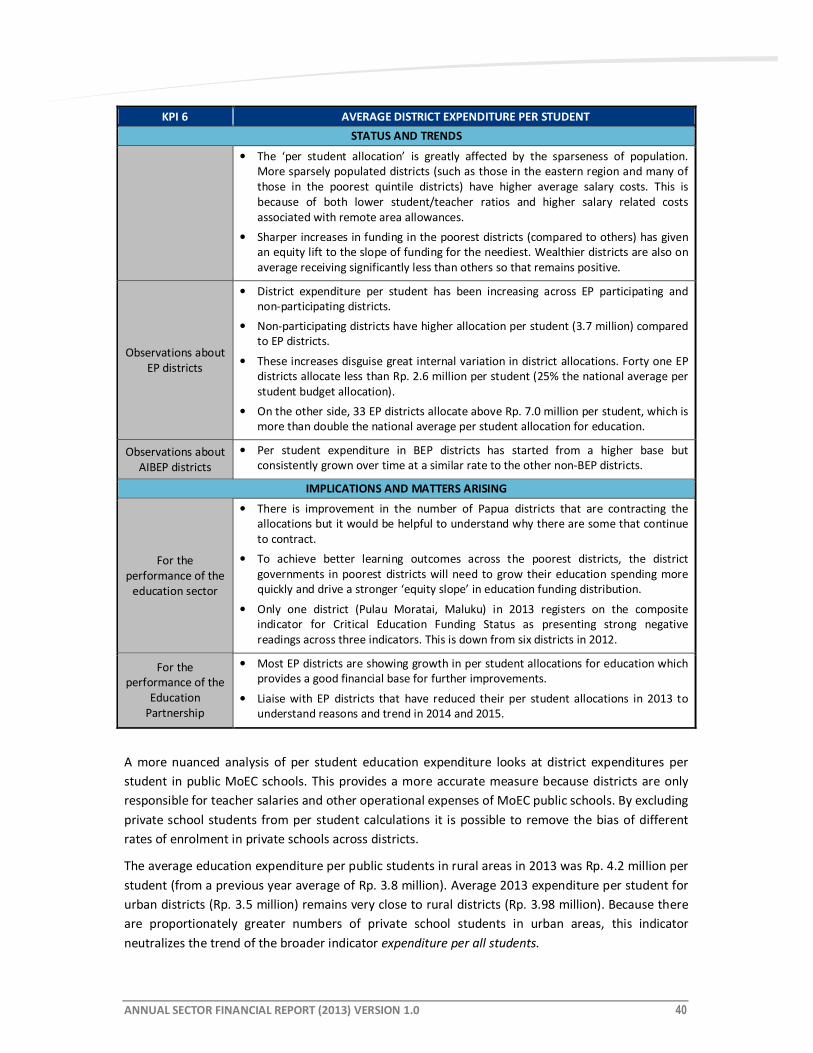
ANNUAL SECTOR FINANCIAL REPORT (2013) VERSION 1.0 40
KPI 6 AVERAGE DISTRICT EXPENDITURE PER STUDENT
STATUS AND TRENDS
• The ‘per student allocation’ is greatly affected by the sparseness of population.
More sparsely populated districts (such as those in the eastern region and many of
those in the poorest quintile districts) have higher average salary costs. This is
because of both lower student/teacher ratios and higher salary related costs
associated with remote area allowances.
• Sharper increases in funding in the poorest districts (compared to others) has given
an equity lift to the slope of funding for the neediest. Wealthier districts are also on
average receiving significantly less than others so that remains positive.
Observations about
EP districts
• District expenditure per student has been increasing across EP participating and
non-participating districts.
• Non-participating districts have higher allocation per student (3.7 million) compared
to EP districts.
• These increases disguise great internal variation in district allocations. Forty one EP
districts allocate less than Rp. 2.6 million per student (25% the national average per
student budget allocation).
• On the other side, 33 EP districts allocate above Rp. 7.0 million per student, which is
more than double the national average per student allocation for education.
Observations about
AIBEP districts
• Per student expenditure in BEP districts has started from a higher base but
consistently grown over time at a similar rate to the other non-BEP districts.
IMPLICATIONS AND MATTERS ARISING
For the
performance of the
education sector
• There is improvement in the number of Papua districts that are contracting the
allocations but it would be helpful to understand why there are some that continue
to contract.
• To achieve better learning outcomes across the poorest districts, the district
governments in poorest districts will need to grow their education spending more
quickly and drive a stronger ‘equity slope’ in education funding distribution.
• Only one district (Pulau Moratai, Maluku) in 2013 registers on the composite
indicator for Critical Education Funding Status as presenting strong negative
readings across three indicators. This is down from six districts in 2012.
For the
performance of the
Education
Partnership
• Most EP districts are showing growth in per student allocations for education which
provides a good financial base for further improvements.
• Liaise with EP districts that have reduced their per student allocations in 2013 to
understand reasons and trend in 2014 and 2015.
A more nuanced analysis of per student education expenditure looks at district expenditures per
student in public MoEC schools. This provides a more accurate measure because districts are only
responsible for teacher salaries and other operational expenses of MoEC public schools. By excluding
private school students from per student calculations it is possible to remove the bias of different
rates of enrolment in private schools across districts.
The average education expenditure per public students in rural areas in 2013 was Rp. 4.2 million per
student (from a previous year average of Rp. 3.8 million). Average 2013 expenditure per student for
urban districts (Rp. 3.5 million) remains very close to rural districts (Rp. 3.98 million). Because there
are proportionately greater numbers of private school students in urban areas, this indicator
neutralizes the trend of the broader indicator expenditure per all students.
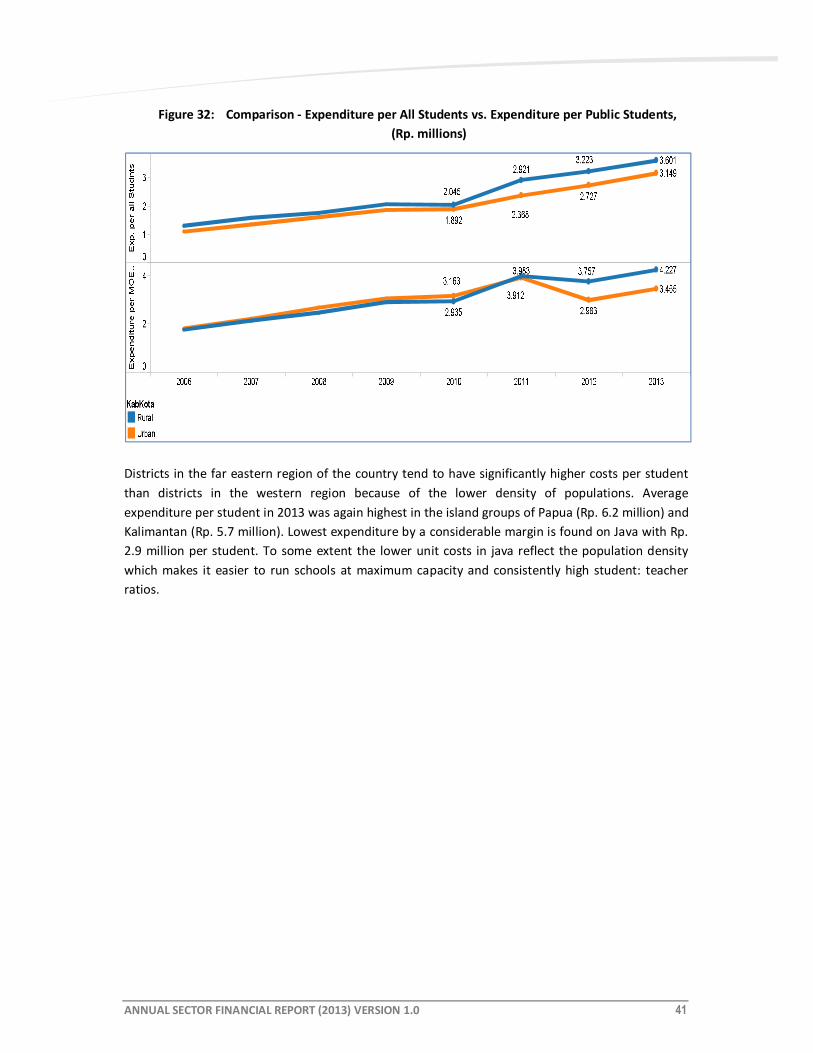
ANNUAL SECTOR FINANCIAL REPORT (2013) VERSION 1.0 41
Figure 32: Comparison - Expenditure per All Students vs. Expenditure per Public Students,
(Rp. millions)
Districts in the far eastern region of the country tend to have significantly higher costs per student
than districts in the western region because of the lower density of populations. Average
expenditure per student in 2013 was again highest in the island groups of Papua (Rp. 6.2 million) and
Kalimantan (Rp. 5.7 million). Lowest expenditure by a considerable margin is found on Java with Rp.
2.9 million per student. To some extent the lower unit costs in java reflect the population density
which makes it easier to run schools at maximum capacity and consistently high student: teacher
ratios.

ANNUAL SECTOR FINANCIAL REPORT (2013) VERSION 1.0 42
Figure 33: Average APBD Education Expenditure per Student (Rp. millions), 2010-13 by Island
Positive change in 2013 is shown by (i) average expenditure per student for education that increased
again in Papua districts (after contracting in 2012), and (ii) fewer Papua districts reduced their annual
per student allocation compared to the previous year.
The table below presents a breakdown of the average annual growth in district education budgets
within the Papua island group. It shows that with the exception of Kota Sorong in one year (2010)
the annual decline in district education budgets has only occurred in the poorest quintile districts. In
2012, seventeen (17) of the poorest districts in Papua (from a total 41 districts) showed an annual
decline in their allocations for education.
When we turn to 2013, we see that 13 districts had negative growth compared to the previous year,
which is still high but a reduction from the 17 with declining allocations in 2012.
Ed. Expenditure per All Students

ANNUAL SECTOR FINANCIAL REPORT (2013) VERSION 1.0 43
Figure 34: Papua: Average Annual Growth in District Education Budget, (Rp. millions) 2010-13
District expenditure per student has been increasing across EP districts and others. By 2013, the non-
participating districts had a higher average allocation for education (Rp. 3.7 mill.) compared to
participating districts (Rp. 3.1 – 3.6 mill.).
district
year
2011 2012 2013
0.00% 100.00%
Education Budget Annual Growth
0.00% 100.00%
Education Budget Annual Growth
0.00% 100.00%
Education Budget Annual Growth
Jayawijaya
Yalimo
Nduga
Supiori
Maybrat
Lanny Jaya
Kepulauan Yapen
Intan Jaya
Merauke
Mamberamo Raya
Keerom
Paniai
Tolikara
Manokwari
Teluk Bintuni
Sorong Selatan
Fakfak
Dogiyai
Kaimana
Asmat
Waropen
Nabire
Kota Sorong
Boven Digoel
Biak Numfor
Puncak Jaya
Kota Jayapura
Sorong
Mimika
Raja Ampat
Yahukimo
Puncak
Pegunungan Bintang
Sarmi
Mappi
Jayapura
Teluk Wondama
Deiyai
Mamberamo Tengah
p0Quintile
3
4
Poorest

ANNUAL SECTOR FINANCIAL REPORT (2013) VERSION 1.0 44
Figure 35: Average District Expenditure per Student, EP Districts and Others (Rp. millions)
These averages disguise great internal variation district allocations. For operational purposes it may
be useful to identify the low and high end outliers in terms of per student allocations. Compared to
the national average Rp. 3.5 million allocation per student, there are 41 EP disricts allocating less
than Rp. 2.63 million per student (which is less than 75% the national average expenditure per
student).
Some caution needs to be exercised in interpreting these figures. A high percentage of student
enrolments in the private school sector will provide a misleadingly low estimate of the actual
financing for schools. The private school enrolments are likely to have the biggest impact in the
richest urban districts with a likely higher share of well resourced private schools. The table below
shows there are nine districts (out of 41) which are in the richest quintile and committing less than
Rp. 2.63 million per student.

ANNUAL SECTOR FINANCIAL REPORT (2013) VERSION 1.0 45
Figure 36: EP Districts with Low Expenditure per Student, 2013 (Rp. Less than 2.63 million)
Conversely, there are 33 EP districts that are allocating more than Rp. 7 million per student which is
more than double the national average per student allocation for education.
district
year
2013
0.0 0.2 0.4 0.6 0.8 1.0 1.2 1.4 1.6 1.8 2.0 2.2 2.4 2.6
Ed. Expenditure per All Students
Lombok Tengah
Tangerang
Halmahera Utara
Sukabumi
Kota Depok
Bandung Barat
Bekasi
Bogor
Malang
Sumba Barat Daya
Bandung
Labuhan Batu
Nias Selatan
Tasikmalaya
Kota Denpasar
Lebak
Parigi Moutong
Kota Medan
Cianjur
Tulang bawang
Manggarai Timur
Mamuju
Mamuju Utara
Bangkalan
Serang
Jombang
Pandeglang
Tegal
Cirebon
Kepulauan Sula
Lampung Selatan
Gresik
Sidoarjo
Garut
Kota Tasikmalaya
Lombok Barat
Kota Bekasi
Cilacap
Lombok Timur
Semarang
Belu
p0Quintile
Richest
2
3
4
Poorest
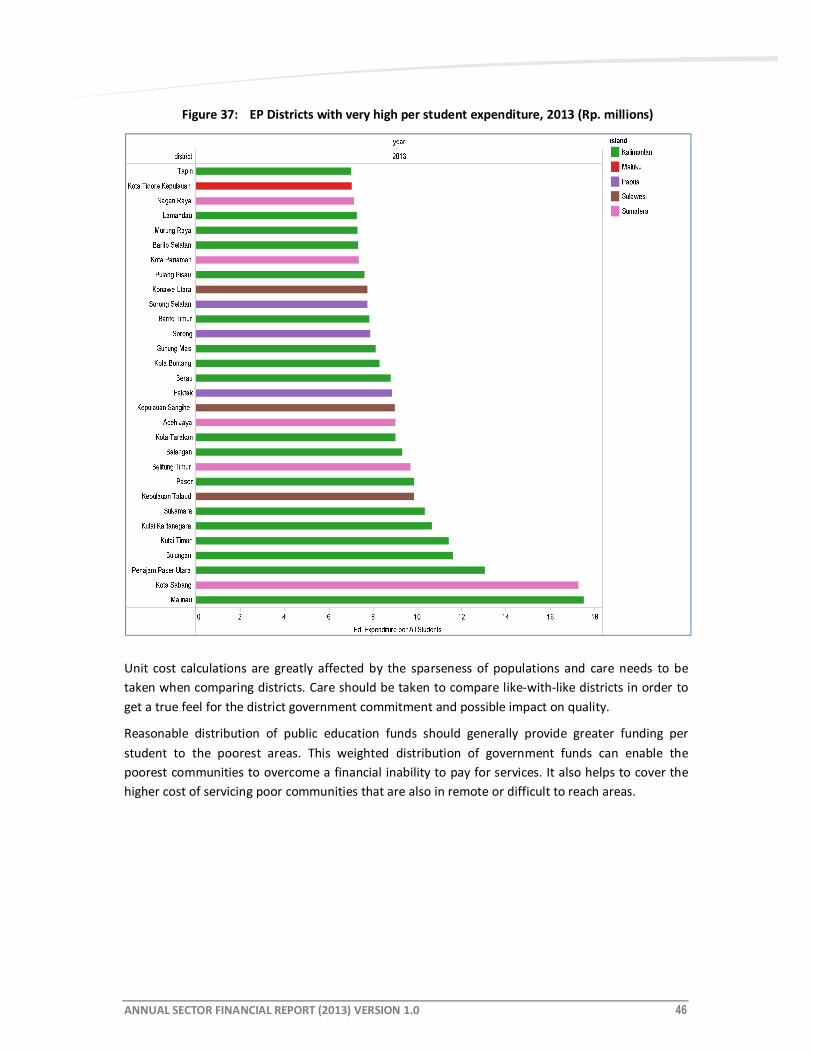
ANNUAL SECTOR FINANCIAL REPORT (2013) VERSION 1.0 46
Figure 37: EP Districts with very high per student expenditure, 2013 (Rp. millions)
Unit cost calculations are greatly affected by the sparseness of populations and care needs to be
taken when comparing districts. Care should be taken to compare like-with-like districts in order to
get a true feel for the district government commitment and possible impact on quality.
Reasonable distribution of public education funds should generally provide greater funding per
student to the poorest areas. This weighted distribution of government funds can enable the
poorest communities to overcome a financial inability to pay for services. It also helps to cover the
higher cost of servicing poor communities that are also in remote or difficult to reach areas.

ANNUAL SECTOR FINANCIAL REPORT (2013) VERSION 1.0 47
Figure 38: Equity Slope of Funding - Average APBD Education Expenditure per Student (Rp
millions), by Poverty Quintile, 2010-13
The chart above illustrates the ‘equity slope’ of district school funding. The ideal equity slope would
begin low at the left hand corner (least public resources per student for the wealthiest districts) and
slope upwards indicating that those districts with the lowest socio-economic profile and catering for
the most remote communities have the greatest public resources made available per student.
Indonesia has demonstrated a movement over time towards that kind of scenario. By 2011, districts
from the two poorest quintiles had grown their allocations at a faster rate than others. This was a
significant achievement in beginning to move away from a relatively flat distribution of district
education funding per student across poverty quintiles. It showed government policies have been
successful in moving towards a greater share of public resources being directed towards education
in poorer districts.
In 2012, because annual growth in district education allocations in the poorest districts was less than
for districts in other quintiles, there was a stalling in the move towards greater equity. The line for
2012 (the brown line in chart above) begins to flatten as it moves towards the poorest quintiles
instead of preserving a linear increase in the allocations.
This situation changes in 2013 with per student funding kicking upwards in the poorest quintile
districts does move towards rectify the funding situation that appeared in 2012. However the dip in
funding for quintile 3 remains and the increase in funding for the poorest districts has meant a flat
line between quintiles 2-5. The lower pre student funding for the richest districts (average Rp. 3.1
million) does suggest fewer public resources are being directed there than poorer districts.
To achieve better learning outcomes across the poorest districts, the district governments that are
part of poverty quintiles 2,3,4, will need to grow their education spending more quickly and drive a
stronger ‘equity slope’ in education funding distribution.
A quick comparison between BEP and non-BEP districts reveals that they are both growing their per
student allocations at the same rate. BEP districts continue to spend a steady 20% more than non-
BEP districts.

ANNUAL SECTOR FINANCIAL REPORT (2013) VERSION 1.0 48
Figure 39: BEP District budget allocations per student, 2006-2013
A Critical Education Funding Status (CEFS) diagnostic tool is based on three KPIs from this district
level analysis (KPIs 6, 7 and 8). The CEFS diagnostic tool identifies critical districts that have:
• low expenditure per student (less than Rp. 2.63 million) – equates to an expenditure which is
75% of the average expenditure per student in 2013
• small education share of the district budget (less than 15%)
• weak annual growth in their education budget (less than 5%).
These criteria have been adjusted from reports of previous years. The low expenditure per student
has been adjusted to reflect changes in prices and is now set as discounted benchmark from the
national average expenditure. The other two criteria have been tightened to capture more extreme
cases. All these criteria are applied consistently across years for time-series comparisons.
The figure below shows the one district meeting these criteria in 2013, compared to 6 districts
meeting criteria in 2012 and only two in 2011. It is a good sign that districts do not remain in the
CEFS category for more than one year. It suggests there is some corrective re-balancing occurring
within districts to prevent those already spending substantially less than average from declining their
commitments even further.
Figure 40: Critical Education Funding Status (CEFS) Districts – Districts with low growth in
education budget, low share of district budget and low expenditure per student, 2010-
2013

ANNUAL SECTOR FINANCIAL REPORT (2013) VERSION 1.0 49
KPI 7: Actual district education expenditure as % of planned education expenditure
Figure 41: Realised Education Expenditure as % of Planned Expenditure 2006 -2007
KPI 7 ACTUAL DISTRICT EDUCATION EXPENDITURE AS % OF PLANNED EDUCATION
EXPENDITURE
STATUS AND TRENDS
Result Negative Data availability Limited verified financial data for 2006
and 2007.
Observations
• Budget data for 2006 are from the ‘final revised budget’ documents and reflect the
final allocation. Revised budget data for 2007 were not available. Data collected are
from the ‘planned budget’ documents which reflect a bid by the district education
office for funds. This budget may then be revised downwards in the ‘revised final
budget’. The 2007 financial data are therefore not from identical planning
documents and may be responsible for an upwards shift in percentage of budget
realized as actual expenditure.
• Data for 2008 and 2009 have been collected but are not robust to update this
analysis from the previous report.
• Districts in 2007 managed to spend nearly 100% of their planned budget. This was a
significant improvement on 2006 where only 91% of funds were spent nationally.
• Poverty quintile analysis shows that the top two poverty quintile districts on average
overspent their planned education budget in 2007. The lowest average rate of
realisation was with the poorest quintile districts that only spent 91% of their
planned budget.
Observations about
EP districts
• In 2007 EP districts were largely spending around the national average of 100% of
budget funds, with the exception of Component 2 districts which were spending
90%.
Observations about
AIBEP districts
• The average BEP district increased its actual expenditure to 100% of budgeted
allocations in 2007. This was up from 92% expenditure in 2006.

ANNUAL SECTOR FINANCIAL REPORT (2013) VERSION 1.0 50
KPI 7 ACTUAL DISTRICT EDUCATION EXPENDITURE AS % OF PLANNED EDUCATION
EXPENDITURE
STATUS AND TRENDS
IMPLICATIONS AND MATTERS ARISING
For the
performance of the
education sector
• More recent actual expenditure data are required to make any comment on
implications for the education sector
For the
performance of the
Education
Partnership
• More recent actual expenditure data are required to make any comment on
implications for the Education Partnership
Figure 42: Realised Education Expenditure as % of Planned Expenditure 2006-07, EP and Non-
EP districts

ANNUAL SECTOR FINANCIAL REPORT (2013) VERSION 1.0 51
Figure 43: Realised Education Expenditure as % of Planned Expenditure 2006 - 2007, by
Poverty Quintile
Policy Implications: Too many districts may be failing to expend their allocated annual education
budgets. The difficulty of the poorest districts in expending their budgets is of a particular concern
given the access and quality problems in these districts. The quantum of funds may not be the
greatest problem facing some districts, and/or there may be other problems related to
disbursement restrictions and reporting or planning requirements.
However, more recent data is required to confirm that these findings still apply or if there have been
any significant changes.

ANNUAL SECTOR FINANCIAL REPORT (2013) VERSION 1.0 52
SPI 1: Discretionary School Expenditure as Percentage of Total Education Expenditure
Figure 44: BOS Grants as % of Education & Culture Budget 2006-2013
SPI 1 DISCRETIONARY SCHOOL EXPENDITURE AS PERCENTAGE OF TOTAL EDUCATION
EXPENDITURE
STATUS AND TRENDS
Result Neutral Data availability BOS grants are used as a proxy variable for
discretionary expenditure.
Observations
• The BOS grants distributed by districts provide a key source of discretionary funds
available to schools under their own management. They have injected a dramatic
new dimension to school resourcing. Direct payment to schools minimizes the
opportunities for leakage before the funds reach the school.
• BOS grants offer great potential for funding innovative and securely resourced
interventions at schools that have an ongoing recurrent funding base. This allows
school principals to plan around these allocations instead of pursuing submission
based grant models.
• In 2013, the BOS grants have marginally decreased as a proportion of the district
education budget as a result of no indexation in their value (see Figure 44, above).
IMPLICATIONS AND MATTERS ARISING
For the
performance of the
education sector
• BOS grants provide a critical injection of funds at the school level. It is important that
these funds are utilised as effectively as possible. The injection of such a large scale
of funds to schools poses an obvious fiduciary risk. This risk appears at the school
level where there have been wide spread reports of funds not being used
appropriately or not being accounted for as required.
• The challenge for government will be to put in place the appropriate training,
monitoring and support to enable the effective use of these funds as well as
identifying the inevitable instances where these funds are not properly expended or
adequately reported.
For the
performance of the
Education
Partnership
• DFAT may wish to help clarify and strengthen the role of the school committees in
the management of BOS funds as part of its current and/or upcoming programing.
BOS as % APBD
BOS as % APBD
BOS as % APBD

ANNUAL SECTOR FINANCIAL REPORT (2013) VERSION 1.0 53
Background: In 2011, the BOS grants were distributed to the district level of government which will
then make payments to schools. This flow of funding was designed to reflect the function and
responsibilities of local government towards education under the decentralization policy. It provided
districts with significantly greater non-salary related resources to distribute amongst their schools.
This was to help strengthen the relevance and importance of district monitoring and support teams
for schools within their jurisdiction. However, the policy increased the pressure and expectations of
schools that were relying upon the efficiency and effectiveness of the district offices.
The district management of the BOS distribution by district governments became a matter of
national controversy during 2011. The widespread failure of many districts to manage these funds
properly meant that delays and errors in the distribution of BOS funding were seen as a failure at the
local rather than central level. By late 2011, the disbursement and general management of BOS
funds by the district level was considered a gross failure. The program was subsequently brought
back under the control of MoEC for the 2012 school year. BOS funds in 2012 were distributed by the
province (acting as the representative of the central government) directly to the schools.
BOS grants, as a percentage of total education expenditure, are affected by the share of students
progressing to secondary education. The per capita BOS grants for junior secondary students are
35% higher in value than grants for primary students. Districts with higher proportionate enrolment
at secondary level have an increased proportionate weight in their BOS grants. As a consequence,
inter-poverty quintile comparisons are distorted by differences in secondary level enrolment rates.
The significance of the BOS expenditures in comparison with total district expenditures declined for
districts across all poverty quintiles between 2007 and 2008. This reflected the expanding outlays for
education being made by the district levels of government during this period. However by 2009 and
with the impact of the increase in the size of the per capita grants, the BOS had again risen in
significance to 2006 levels.
In 2011, the BOS funds represented a smaller share of total expenditure as teacher salaries and
allowances increased sharply. These salary and emolument increases are a flow-on effect of the
teacher certification process and will continue for a few more years (at least until 2015). In addition
to salary increases, 2011 saw increases in district allocations for capital expenditures and other
operational expenses.
In 2012, the BOS grants increased as a proportion of the district education budget as a result of
slower growth in the district education budget, and an increase in the value of the BOS grants
themselves. The per-pupil BOS allocation has increased from Rp 397,000 to Rp 580,000 per primary
student and from Rp. 570,000 to Rp. 710,000 per junior secondary student per year in 2012. The BOS
program covers around 44 million students in 228,000 primary and secondary schools.
In 2013 the BOS allocation in the national budget (APBN) was planned to amount Rp.23.4 trillion.
This was a drop of Rp.147.9 billion (0.6 percent) from its allocation in APBNP 2012 at Rp.23.6 trillion.
Keeping the same nominal value for per capita student allocations, combined with administrative
savings and allowing for price inflation, means that in real terms the value of the BOS subsidy has
decreased from the previous year.
Notwithstanding this pause in the nominal value of the per student allocation, the BOS funds are a
very important source of funding at the school level. These funds are meant to be primarily used to

ANNUAL SECTOR FINANCIAL REPORT (2013) VERSION 1.0 54
finance non-personnel spending in basic education in the context of compulsory education program,
and may be used for the financing of other activities as indicated in technical directives of MoEC. A
key objective is to release students from low-income households, who cannot afford to pay their
tuition fees and to relieve other students from this tuition fee burden so that they can access quality
education service for 9-years of compulsory basic education program. BOS aid is stimulus for regions
and not the substitute of obligations of the local government in the allocation of education budget.
The BOS grants represent a smaller proportion of total expenditures for schooling in the poorest
districts. This is because of the higher teacher costs (such as remote area allowances) and the lower
student:teacher ratios which increase the per student teacher cost in these districts. As a
consequence, the BOS funds represent a smaller contribution to the overall cost of delivering
services to these districts. All other poverty quintile districts are more closely bunched together. In
2013, analysis of BOS across poverty quintiles, shows they represent on average between 12%-14%
of district expenditures. These funds are clearly significant and roughly equal value in districts
irrespective of the wealth of each district.
Figure 45: BOS Grants as % of District Budget 2006-2013, by Poverty Quintile

ANNUAL SECTOR FINANCIAL REPORT (2013) VERSION 1.0 55
SPI 2 : Comparing Education and Health Budget Allocations at District Level
Figure 46: Education and Health – Average shares of district budgets 2007-2013
SPI 2 Comparing Education and Health Budget Allocations at District Level
STATUS AND TRENDS
Result Positive Data availability Aggregate health and education financial
data available for 490 districts.
Observations
• At a macro level both education and health expenditures have grown substantially
during period 2007-2013.
• The education sector had stronger growth during 2007-2011, but has had declining
shares since then.
• Health sector is coming off a lower base (8.5%) but has had consistent increase
every year in its share of district expenditure.
• Average Increases in education and health appear across rural districts and towns.
IMPLICATIONS AND MATTERS ARISING
For the
performance of the
education sector
• There is no sign that health sector is crowding out the education sector spending (or
vice-versa) at the district level.
• There is a strong correlation for districts that have contracting education allocations
to also be allocating less than the national average for health.
• Correlation in low expenditure for education and health sectors suggests it will be
useful to investigate more closely those districts in which there is low share of
expenditure for the social sector.
For the
performance of the
Education
Partnership
• DFAT may wish to coordinate the education and health social sector interventions of
its programs to increase government contributions in those districts which are
spending well below the national average for education and health.
• Coordinate a joint social sector assessment in a selection of districts that have
declining and/or low expenditures in education and health to understand the
reasons and effects.

ANNUAL SECTOR FINANCIAL REPORT (2013) VERSION 1.0 56
Figure 47: Per Capita Health and Education district expenditure, 2007-2013
Analysis of districts that are allocating less than 15% of their budget for education shows that they
are nearly all also allocating less than the national average (10%) for health. Of the 31 districts
allocating less than 15% of their budget towards education, only one (1) was meeting or exceeding
the 10% national average for district allocations towards health.
The strong direct correlation between low expenditures in education with health indicates there is
no crowding out by the health sector of education budget allocations. On the contrary, district
decisions for low priority appear to affect both the education and health components of the social
sector.
Figure 48: Health shares in poorest districts with very low education allocations, 2013
Looking at expenditures in districts where there is a large share of the budget for education (greater
than 50%) can indicate if education expenditures might be crowding out health expenditures. Of the

ANNUAL SECTOR FINANCIAL REPORT (2013) VERSION 1.0 57
27 districts that allocated more than 50% of their budget towards education, 15 allocated less than
10% for health. It is not possible on the basis of these figures to suggest there is a trend for this to be
occurring although it might be a factor in certain cases.
Figure 49: Health shares in districts with very high education allocations (>50%), 2013
SPI 3: The Allocation Patterns and Statistical Impact of Newly Established Districts
Figure 50: Year Districts Created – Average shares of district budgets 2007-2013
SPI3 Allocation Patterns and Statistical Impact of Newly Established Districts

ANNUAL SECTOR FINANCIAL REPORT (2013) VERSION 1.0 58
STATUS AND TRENDS
Result Neutral Data availability
Financial data for 2013 was available for
496 districts and enrolment data for 490
districts.
Observations
• The older the district the greater the percentage of its budget it tends to allocate
towards education.
• The older the district the greater its total budget for education.
• Newest districts are smaller, most likely to be found in Papua and Sumatera and
likely to spend more per student than others.
• Newest districts had very high annual growth rates in 2010 and 2011 in their total
APBD budgets and this was also reflected in their education allocations. In 2012 and
2013 the annual growth in total budget and education allocations has joined the
statistical average for older districts.
• The small number of newest districts (2007 onwards) means they have not distorted
the national level findings of the study.
IMPLICATIONS AND MATTERS ARISING
For the
performance of the
education sector
• The newest districts can have very high initial budget allocations for education and
these may be related to capital improvements and other establishment costs. In
such high spend setting it will be especially important to be sure that expenditure is
well targeted and sequenced with other investments.
For the
performance of the
Education
Partnership
• DFAT should identify EP districts that are affected by the separating off of smaller
districts as these may create significant cost and organisational impacts for districts,
schools and communities.
Districts created before 2003 have more than double the average budget of newer districts. Districts
created before 2003 had average education budget allocations of Rp. 420 billion compared to Rp.
148 billion for the newest districts established after 2007. In Papua, the oldest districts have the
largest budgets, but the newest districts have on average budgets that are larger than districts
created during the period 2003-07. So the newness effect on district budgets is no driven by Papua
geography but population size across geographical areas.

ANNUAL SECTOR FINANCIAL REPORT (2013) VERSION 1.0 59
Figure 51: Average District Allocations for Education, 2013 (Rp. million)
As the figure below shows, the higher per student allocations of the newest districts correlate with
the larger average population size of these districts. While districts created before 2003 have an
average population that is closer to 600,000 the newer districts have average populations that are
less than 200,000.
Figure 52: Average population size of districts by year created, 2013
Smaller districts are therefore more likely to be affected by the diseconomies of scale as well as the
effects of isolated populations in remote areas of Papua and Sumatera. This is captured by the figure
below which shows that newest districts have escalated per student costs compared to the other
two groups. Interestingly, this difference in unit cost structures begins to emerge in 2011 but then
the price gap remains at the same level for the next three years. It may indeed reflect the
introduction of special teacher allowances which apply for remote areas and hard to teach districts
that are found amongst the newest districts.

ANNUAL SECTOR FINANCIAL REPORT (2013) VERSION 1.0 60
Figure 53: Average allocations per student, by year district created
While the newest districts had very high growth rates (in excess of 100%) in their budgets during
2010 and 2011, by 2012 and into 2013, these districts had assumed growth rates that were very
much in line with the other older districts (around 10%).
Figure 54: Growth rates in total and education sector district budgets, 2010-2013
On interesting test is to see the impact some of the newest districts compared to special factors
associated with Papua itself. The figures below compare average budget share of districts for
education. The national average (i.e. of all districts) is compared with (i) an average that excludes the
newest districts established after 2007, and (ii) an average that excludes Papua districts.

ANNUAL SECTOR FINANCIAL REPORT (2013) VERSION 1.0 61
Figure 55: All districts, education share of district budget
0
The exclusion of newest districts (post 2007) has very little impact on the average share of distroct
budgets. It only really afects the poorest quintile by 1% point.
Figure 56: Excluding newest districts, education share of district budget
There is, however, a more significant impact when Papua is excluded from the calculations. The
poorest quintile of districts moves from being the only ones with an average allocation below 30%.
In fact, the poorest quintile moves into a mid-range distribution with 35% budget share for
education.
Papua is a specific high cost case with a substantial number of districts. In this case, the low average
budget share allocations for these districts are the critical mass that drag the poorest district group
below a 30% education share of budget expenditure.

ANNUAL SECTOR FINANCIAL REPORT (2013) VERSION 1.0 62
Figure 57: Excluding Papua, education share of district budget

The Bottom-Line

ANNUAL SECTOR FINANCIAL REPORT (2013) 64
4 THE BOTTOM-LINE
4.1 What do the trends in sector financing mean for the education
sector?
13. Strong real growth in national public expenditure for education in 2013.
The GoI had particularly impressive growth in real and nominal terms in 2006 and 2009. Since
2009, growth in education expenditures has marginally outpaced inflation, but there was a
plateau in the real increase of national funding for education until 2011. In 2012 and now 2013
we see consecutive significant increases in real terms for education funding.
14. Government commitment to meet a 20% target for education expenditure share of national
budget has been met for the fifth year in a row.
The national expenditures for education in 2013 met the 20% target. Education has benefited
from total national public revenues and expenditures which have grown at a significantly faster
rate than inflation.
15. Average district level education expenditures across Indonesia have increased from 27% of the
total district budget (APBD) in 2006 to nearly 34% share in 2013.
All of these gains were obtained during the period 2006-2011. This is a positive trend but in 2012
and 2013 the education budget has not kept up its share of expanding district budgets. The
ambitious plans for the education sector will be damaged if the districts allocation to the
education sector continues to decline.
16. The lowest average share of budget allocation for education was found in Papua (16%) which
now stands some distance from other island groups in allocating a very low share of its budget
for education.
While Maluku has shown growth since 2010, Papua has dropped again from an 18% education
share of district budgets in 2010 to 16% in 2013.
17. Nationally, 31 districts allocated less than 15% of their total district budget (APBD) on
education in 2013. Of these 31 districts, 24 are in the poorest quintile, and 22 of these poorest
are found in Papua
Of the 31 districts spending less than 15% of their budget on education, 19 districts have
allocated less than 15% for four years 2010-2013. The continued pattern of spending of less than
15% towards education limits the ability of these districts to catch up with others, i.e. the equity
gap will further widen. This problem has a particular relevance for Papua as it is heavily
represented in this group.
18. In looking at districts by relative poverty status, the poorest quintile districts have slipped
further below the others in being the only ones that allocate less than 30% of their district
budget for education.
If the poorest districts do not accelerate their education spending they are likely to fall further
behind wealthier districts.
19. In 2013, 62 districts (13%) posted a decline in their education budget.

ANNUAL SECTOR FINANCIAL REPORT (2013) 65
This is an improvement from 2012, when 97 districts posted a decline in their annual education
budget allocation.
20. The problem of contracting education budgets in poorest districts is focused on Papua.
Ten of the 17 poorest districts which recorded a decline in nominal annual district education
expenditure in 2013 are located in Papua.
21. Average district expenditure per student grew across the country and is highest in the poorest
districts.
Average education expenditure per student has grown to Rp. 3.5 million in 2013 from an
average Rp. 3.1 million in 2012. Highest allocations per student are found in the poorest districts
(quintile 5) at an average Rp. 3.8 million per student.
22. To achieve better learning outcomes across the poorest districts, the district governments in
poorest districts will need to keep growing their education spending more quickly and drive a
stronger ‘equity slope’ in education funding distribution.
In 2012 the slope of equity spending was halted, with slower growth in the poorest districts. In
2013 there was a spike in expenditure in the poorest districts and this needs to be sustained
over a number of years so the poorest districts can improve the quality and reach of their
education system.
23. There was only one district in 2013 that met Critical Education Funding Status (CEFS) criteria
compared to six districts in 2012.
The CEFS diagnostic tool developed by the ASFR identifies districts that have (i) low expenditure
per student, (ii) small education share of the district budget, and (iii) weak annual growth in their
education budget.
24. A correlation in low expenditure for education and health sectors suggests it will be useful to
investigate more closely those districts where and why there is low share of expenditure for
the social sector as a whole.
There is no sign that health sector is crowding out the education sector spending (or vice-versa)
at the district level. On the contrary, there is a strong correlation for districts that have
contracting education allocations to also be allocating less than the national average for health.
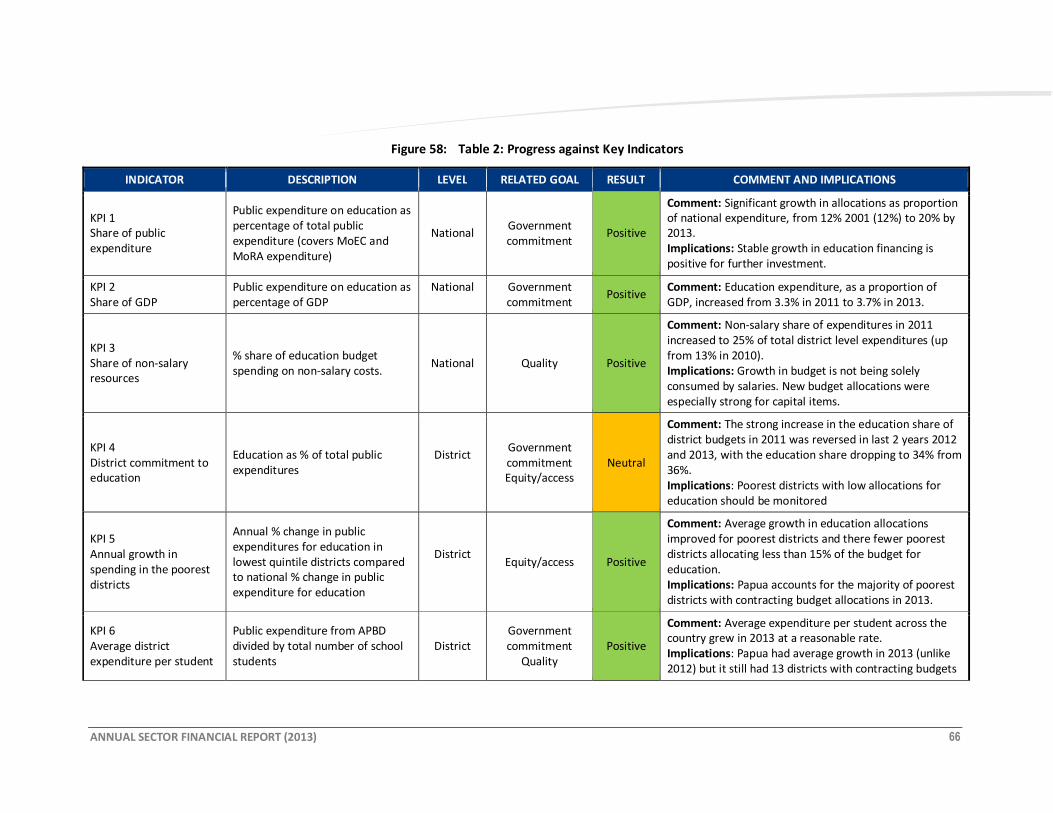
ANNUAL SECTOR FINANCIAL REPORT (2013) 66
Figure 58: Table 2: Progress against Key Indicators
INDICATOR DESCRIPTION LEVEL RELATED GOAL RESULT COMMENT AND IMPLICATIONS
KPI 1
Share of public
expenditure
Public expenditure on education as
percentage of total public
expenditure (covers MoEC and
MoRA expenditure)
National Government
commitment Positive
Comment: Significant growth in allocations as proportion
of national expenditure, from 12% 2001 (12%) to 20% by
2013.
Implications: Stable growth in education financing is
positive for further investment.
KPI 2
Share of GDP
Public expenditure on education as
percentage of GDP
National
Government
commitment Positive
Comment: Education expenditure, as a proportion of
GDP, increased from 3.3% in 2011 to 3.7% in 2013.
KPI 3
Share of non-salary
resources
% share of education budget
spending on non-salary costs. National Quality Positive
Comment: Non-salary share of expenditures in 2011
increased to 25% of total district level expenditures (up
from 13% in 2010).
Implications: Growth in budget is not being solely
consumed by salaries. New budget allocations were
especially strong for capital items.
KPI 4
District commitment to
education
Education as % of total public
expenditures
District
Government
commitment
Equity/access
Neutral
Comment: The strong increase in the education share of
district budgets in 2011 was reversed in last 2 years 2012
and 2013, with the education share dropping to 34% from
36%.
Implications: Poorest districts with low allocations for
education should be monitored
KPI 5
Annual growth in
spending in the poorest
districts
Annual % change in public
expenditures for education in
lowest quintile districts compared
to national % change in public
expenditure for education
District
Equity/access Positive
Comment: Average growth in education allocations
improved for poorest districts and there fewer poorest
districts allocating less than 15% of the budget for
education.
Implications: Papua accounts for the majority of poorest
districts with contracting budget allocations in 2013.
KPI 6
Average district
expenditure per student
Public expenditure from APBD
divided by total number of school
students
District
Government
commitment
Quality
Positive
Comment: Average expenditure per student across the
country grew in 2013 at a reasonable rate.
Implications: Papua had average growth in 2013 (unlike
2012) but it still had 13 districts with contracting budgets
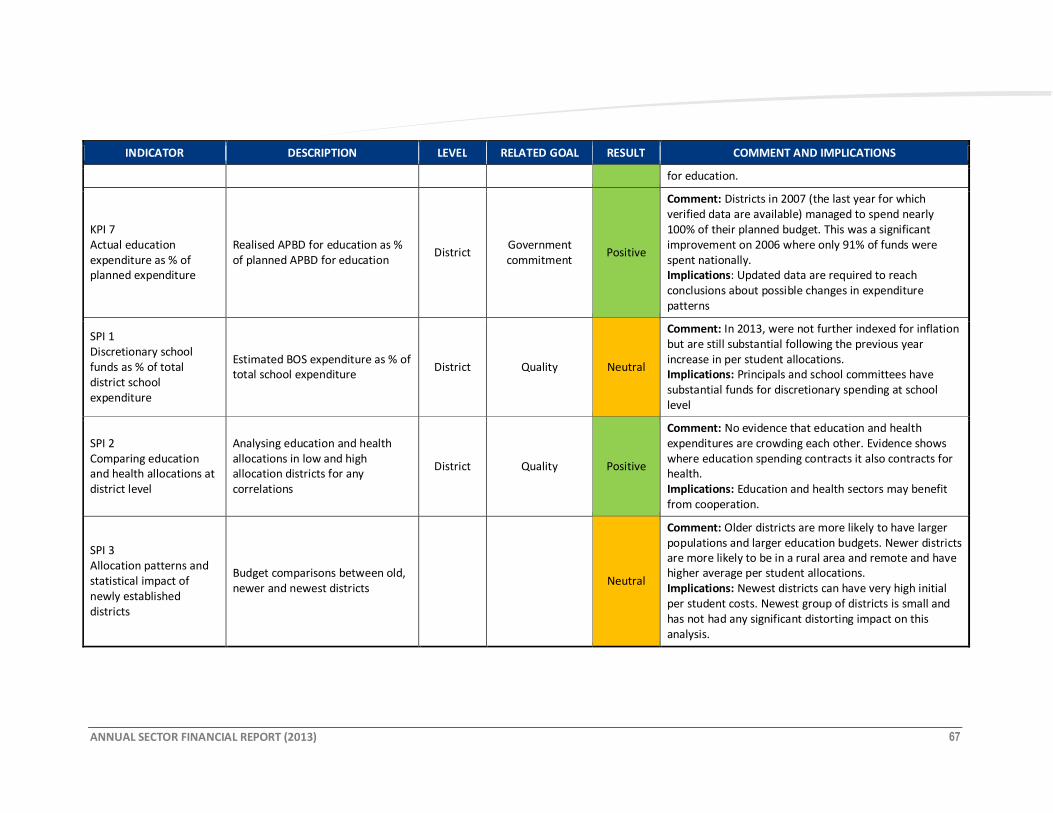
ANNUAL SECTOR FINANCIAL REPORT (2013) 67
INDICATOR DESCRIPTION LEVEL RELATED GOAL RESULT COMMENT AND IMPLICATIONS
for education.
KPI 7
Actual education
expenditure as % of
planned expenditure
Realised APBD for education as %
of planned APBD for education District
Government
commitment Positive
Comment: Districts in 2007 (the last year for which
verified data are available) managed to spend nearly
100% of their planned budget. This was a significant
improvement on 2006 where only 91% of funds were
spent nationally.
Implications: Updated data are required to reach
conclusions about possible changes in expenditure
patterns
SPI 1
Discretionary school
funds as % of total
district school
expenditure
Estimated BOS expenditure as % of
total school expenditure District Quality Neutral
Comment: In 2013, were not further indexed for inflation
but are still substantial following the previous year
increase in per student allocations.
Implications: Principals and school committees have
substantial funds for discretionary spending at school
level
SPI 2
Comparing education
and health allocations at
district level
Analysing education and health
allocations in low and high
allocation districts for any
correlations
District Quality Positive
Comment: No evidence that education and health
expenditures are crowding each other. Evidence shows
where education spending contracts it also contracts for
health.
Implications: Education and health sectors may benefit
from cooperation.
SPI 3
Allocation patterns and
statistical impact of
newly established
districts
Budget comparisons between old,
newer and newest districts Neutral
Comment: Older districts are more likely to have larger
populations and larger education budgets. Newer districts
are more likely to be in a rural area and remote and have
higher average per student allocations.
Implications: Newest districts can have very high initial
per student costs. Newest group of districts is small and
has not had any significant distorting impact on this
analysis.

ANNUAL SECTOR FINANCIAL REPORT (2013) 68
4.2 What do the trends in sector financing mean for the Education
Partnership?
Possible Impacts on the Sustainability of Benefits Stemming from EP Investments
9. At a macro level, there is solid evidence to suggest that the GoI will continue to invest heavily in
education. This should flow through in its support for district budgets. National funding for the
education sector is expected to remain strong. Adherence to a proportional budget allocation for
education enhances the ability of the education sector to anticipate future allocations and plan
accordingly by creating a more stable financing framework. The proportional allocation approach
toward education financing enhances predictability and steady growth of the education budget
in a growing economy.
10. In 2013, as for 2012, there were 18 EP districts (ten were C2 districts) that contributed less than
the 20% national target for education, which is considerably lower than the national average of
34% for education in 2013. This low share of funding for education in specific districts may
threaten the sustainability of EP investments in the future.This is especially the case for those
ten EP C2 districts which will require ongoing professional development costs.
11. In 2013 there were 19 districts with the highest poverty rates persistently over four years
allocating a significantly smaller share (less than 15%) of resources for education. This low
commitment from some of the poorest districts makes it harder for them to catch up on
educational development. It also indicates which districts may have further scope to grow their
education budget and cover the cost associated with PD and the maintenance of new school
buildings as might be funded under the EP.
12. Papua stands out as the one island that now spends the least for education as a proportion of
total district funds. There is scope to increase education funding in these areas to cover the
additional but modest recurrent costs associated with the EP investments.
13. Maluku island districts (unlike Papua) have left the low average share of budget for education
and are moving towards the national average. This suggests investment in the island might be
met with stronger counterpart funding activity.
14. Most EP districts are showing growth in per student allocations for education. This provides a
good financial base for further improvements. In 2013 there was a reduction in the number of EP
districts (40) that contracted their education budget - compared to 59 in 2012. This is a positive
improvement for the program and better positons more districts to assume financial
responsibility.
15. Growing BOS funds provide much needed discretionary funds to schools. The challenge for
government will be to put in place the appropriate training, monitoring and support to enable
the effective use of these funds as well as identifying the inevitable instances where these funds
are not properly expended or adequately reported.
16. Correlation in low budget allocations for education and health sectors suggests it will be useful
to work more closely with both the education and health programs to understand and improve
the situation as appropriate.

ANNUAL SECTOR FINANCIAL REPORT (2013) 69
Implications for the EP Management: Risks and Opportunities
As the previous section would suggest, the evolving context poses several risks to the aspirations of
the EP. The four most significant and realistic risks are captured in Table xx, below.
Table 3: Possible Risks Affecting the EP
# FINDING POSSIBLE CONSEQUENCES FOR THE EP
RA1
Some EP districts (including some with
the highest poverty rates) are persistently
allocating a very low share of their
resources to education.
This low commitment may threaten districts’ ability to
sustain recurrent expenditures associated with EP
investments.
RA2 Papua has many districts performing
badly on numerous financing indicators.
EP investments in these two provinces run the risk of losing
effectiveness if they are not supported by district financial
commitment.
RA3
In 2013, 59 EP districts contracted their
education budget compared to the
previous year. This may continue into the
future.
Where this reflects a shifting priority away from education
it may jeopardise the ability of districts to meet future
financial commitments to professional development and
building maintenance.
RA4
Districts with very low budget share
allocations for education also often have
low budget share allocations for health.
It might be beneficial to coordinate the education and
health programs to investigate and support increased
allocations for the social sector as whole.
Next steps

ANNUAL SECTOR FINANCIAL REPORT (2013) 71
5 NEXT STEPS
SUGGESTED NEXT STEPS (AND LEVEL OF URGENCY) PRIME RESPONSIBILITY
NS1: EP districts which have very small share of total district budget
allocated for education should be monitored and engaged in a
dialogue to understand current allocations and future plans.
Coordinate with DFAT health program (where there is health program
activity in these districts)
POM, with DFAT’s approval
NS2: Focus diagnostic and policy response efforts on the Papua island
group to understand the factors driving low education share of district
budgets
DFAT (with POM, where
appropriate)
NS3: Engage in dialogue with a sample of EP districts that reduced their
2013 education budget allocations compared to 2012. Detailed
diagnostics on (i) poorest EP districts that had an annual reduction in
their 2012 and 2013 Budget, and (ii) districts with annual drop greater
than 10%. Diagnoses to understand reasons for drop and monitor
change in allocations in 2014 and 2015 district budgets.
MOEC and POM (with DFAT’s
approval)
NS4: Liaise with MoEC and other central agencies so as promote the
introduction of district report cards on education. These report cards
should be produced on annual basis and include key educational
development and financial indicators.
DFAT
NB: Red - high urgency; orange - medium urgency; green – low urgency
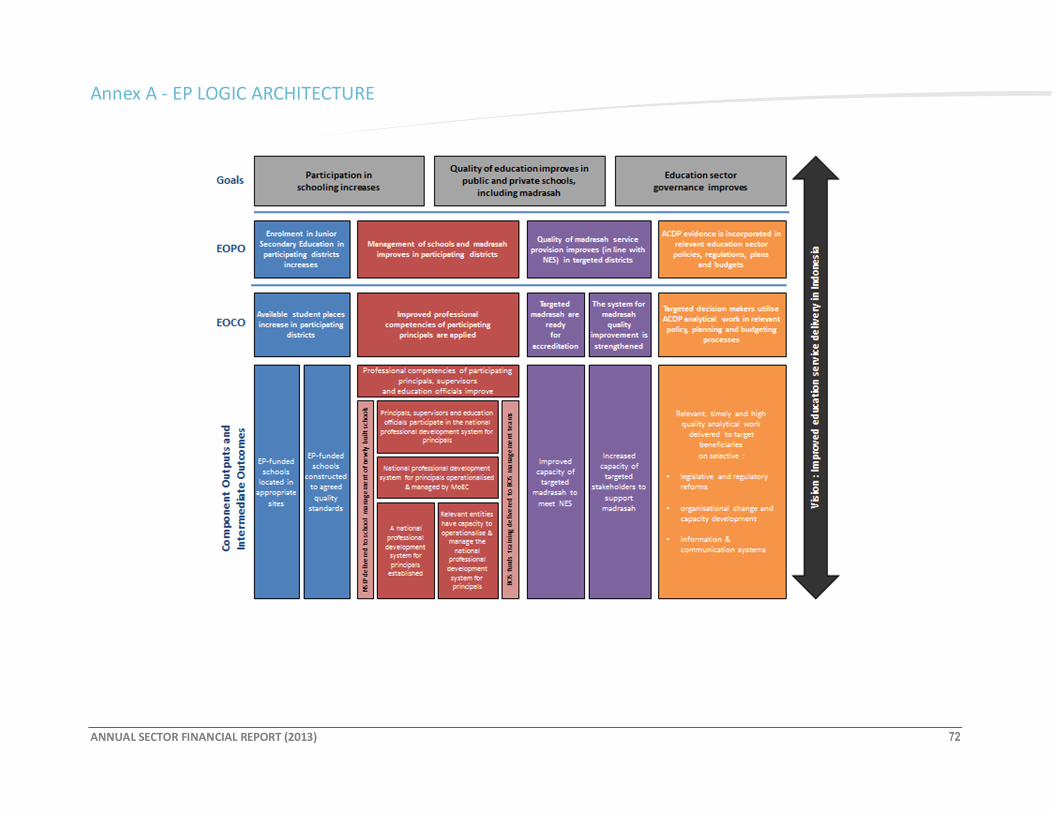
ANNUAL SECTOR FINANCIAL REPORT (2013) 72
Annex A - EP LOGIC ARCHITECTURE

ANNUAL SECTOR FINANCIAL REPORT (2013) 73
Annex B – Statistical Table Related to EP Districts
Component 1: AIEP 2013
Island/District
Education
Expenditure per
Student (Rp.
Million)
Education
Share of
District
Budget
Education
Budget
Annual
Growth
Education
District Budget
(Rp. Million)
Bali and Nusa Tenggara
Belu 2.62 35.63% -13.63% 273,508
Flores Timur 4.68 40.65% 2.22% 283,683
Kupang 3.56 29.79% -10.92% 255,450
Lombok Tengah 0.73 28.92% -71.33% 145,003
Sabu Raijua 4.23 24.75% -32.65% 85,006
Sumba Barat 3.05 25.56% 164.94% 114,858
Sumba Barat Daya 1.88 32.20% 4.70% 167,088
Sumba Timur 3.52 35.41% 18.35% 258,771
Sumbawa 3.18 33.83% -5.02% 299,115
Java
Bandung 1.96 44.72% -4.56% 1,253,687
Bandung Barat 1.70 39.04% -7.13% 561,011
Bangkalan 2.28 38.43% 3.63% 526,901
Batang 3.53 43.56% -2.92% 457,051
Bekasi 1.84 32.08% 22.74% 989,142
Cianjur 2.21 49.83% 34.30% 1,068,954
Garut 2.44 52.22% 17.01% 1,429,332
Grobogan 2.89 51.87% 25.50% 797,204
Indramayu 2.76 45.83% 9.25% 958,253
Kebumen 3.18 50.76% 14.67% 829,733
Kediri 3.17 46.05% 3.62% 782,779
Lebak 2.18 45.57% 11.80% 666,048
Pasuruan 3.00 44.50% 20.20% 843,215
Ponorogo 4.53 49.53% 9.13% 676,886
Probolinggo 2.70 42.70% 5.20% 578,998
Purwakarta 2.67 36.16% 19.54% 509,305
Situbondo 4.07 43.00% 10.98% 488,790
Tangerang 1.48 32.93% 27.08% 930,943
Tuban 3.49 44.47% 12.01% 674,884
Kalimantan
Balangan 9.33 29.70% 18.28% 214,872
Barito Kuala 5.81 38.42%
301,013
Barito Timur 7.82 27.38% 5.00% 168,657
Bengkayang 4.44 33.91% 40.73% 248,169
Ketapang 3.38 27.07% 13.41% 325,602
Landak 3.36 34.14% 12.95% 306,437
Malinau 17.50 12.33% 12.15% 302,108
Sekadau 4.19 31.18% -0.62% 182,383

ANNUAL SECTOR FINANCIAL REPORT (2013) 74
Component 1: AIEP 2013
Island/District
Education
Expenditure per
Student (Rp.
Million)
Education
Share of
District
Budget
Education
Budget
Annual
Growth
Education
District Budget
(Rp. Million)
Sukamara 10.33 19.87% 14.03% 107,946
Maluku
Buru 4.78 27.25% 13.01% 152,806
Buru Selatan 5.11 18.89% 21.35% 81,234
Maluku Tengah 4.74 48.60% 6.45% 496,526
Sulawesi
Banggai 4.67 38.92% 30.20% 374,799
Banggai Kepulauan 4.24 30.88% 3.65% 199,441
Bolaang Mongondow 4.34 33.64% 11.53% 205,656
Bolaang Mongondow
Selatan 6.57 24.96% 5.35% 88,729
Bolaang Mongondow
Timur 5.75 21.00% 14.55% 78,236
Bulukumba 4.60 48.85% 15.21% 417,047
Buton 3.99 37.65% 65.93% 337,209
Kepulauan Sangihe 8.96 37.44% 1.96% 228,643
Kota Bitung 3.64 27.08% 0.97% 157,702
Luwu 3.30 39.82% 22.20% 305,940
Luwu Utara 3.26 33.89% -2.87% 252,261
Mamasa 3.81 30.48% 2.79% 163,448
Mamuju Utara 2.27 15.62% 8.69% 77,205
Muna 5.27 45.73% 42.13% 427,170
Pinrang 3.99 42.15% 13.60% 339,272
Poso 6.24 37.08% -5.40% 292,701
Toraja Utara 3.01 32.58% 4.21% 202,702
Sumatera
Batu Bara 3.33 38.06% 27.89% 319,187
Bintan 6.90 22.64% 19.25% 205,108
Dairi 3.87 41.96% 28.02% 320,269
Empat Lawang 2.92 22.65% 28.31% 153,028
Humbang Hasundutan 4.45 38.56% 14.13% 254,247
Indragiri Hulu 4.86 29.37% 34.27% 436,790
Karo 3.96 39.16% -9.54% 334,576
Kepahiang 5.48 31.17% 31.45% 161,454
Kota Payakumbuh 5.53 36.96% 20.79% 204,957
Labuhan Batu 2.02 32.66% -7.72% 260,575
Lampung Selatan 2.40 42.70% -6.58% 483,523
Lampung Tengah 3.39 51.45% 5.36% 820,503
Lampung Utara 3.40 9.50% 29.34% 464,073
Mandailing Natal 2.87 42.98% 10.17% 336,410

ANNUAL SECTOR FINANCIAL REPORT (2013) 75
Component 1: AIEP 2013
Island/District
Education
Expenditure per
Student (Rp.
Million)
Education
Share of
District
Budget
Education
Budget
Annual
Growth
Education
District Budget
(Rp. Million)
Merangin 4.66 38.75% 38.59% 369,718
Muara Enim 3.32 33.92% 14.10% 560,861
Muaro Jambi 4.59 32.99% 20.39% 314,834
Musi Banyuasin 4.91 20.69% 12.88% 637,797
Nias Selatan 2.05 25.24% -13.43% 205,989
Nias Utara 2.95 24.66% 45.86% 118,534
Ogan Komering Ilir 3.41 34.30% 11.99% 517,621
OKU Selatan 3.16 28.71% 25.41% 220,608
Pasaman Barat 3.19 38.00% 0.43% 297,042
Sarolangun 4.38 33.06% -4.82% 268,501
Seluma 5.05 31.54% 11.28% 199,285
Simalungun 3.91 54.82% 7.24% 765,872
Tanggamus 3.29 42.83% 7.48% 395,801
Tanjung Jabung Barat 4.32 21.24% 17.88% 271,790
Tapanuli Selatan 4.16 32.64% 23.52% 297,686
Tapanuli Tengah 3.74 35.50% 32.16% 317,469
Toba Samosir 5.75 39.53% 23.30% 306,648
Tulang bawang 2.21 28.27% 20.49% 201,657
Component 2: AIEP 2013
Island/District
Education
Expenditure per
Student (Rp.
Million)
Education
Share of
District
Budget
Education
Budget
Annual
Growth
Education
District
Budget
(Rp. Million)
Bali and Nusa Tenggara
Badung 5.33 20.07% 27.63% 573,908
Bangli 5.43 33.84% 16.00% 232,994
Gianyar 5.00 40.61% 9.72% 469,749
Jembrana 5.08 37.98%
273,440
Klungkung 5.94 33.62% -7.38% 217,599
Kota Bima 5.22 37.90% 3.66% 207,293
Kota Denpasar 2.16 25.83% -4.82% 349,772
Lombok Barat 2.53 39.12% 15.69% 375,175
Sumba Tengah 5.19 27.40% 17.47% 101,414
Java
Bantul 4.57 47.71% 1.93% 646,616
Banyumas 3.56 51.60% 19.03% 1,082,757
Banyuwangi 2.68 42.95% -0.92% 809,354

ANNUAL SECTOR FINANCIAL REPORT (2013) 76
Component 2: AIEP 2013
Island/District
Education
Expenditure per
Student (Rp.
Million)
Education
Share of
District
Budget
Education
Budget
Annual
Growth
Education
District
Budget
(Rp. Million)
Bojonegoro 3.78 39.16% 14.13% 839,952
Cilacap 2.58 44.38% 15.53% 920,165
Demak 2.66 44.31% 4.54% 581,571
Gresik 2.43 31.36% 10.02% 567,829
Gunung Kidul 5.95 55.11% 10.25% 681,462
Jombang 2.31 41.14% 1.24% 594,721
Karanganyar 5.08 55.18% 23.48% 742,864
Kendal 3.30 46.97% 15.75% 649,990
Kota Banjar 4.71 33.80% 50.52% 192,849
Kota Batu 4.22 27.09% 2.48% 153,250
Kota Bekasi 2.58 39.59% 62.33% 1,198,030
Kota Cimahi 3.86 40.99% 24.46% 421,204
Kota Depok 1.54 25.92% 16.65% 470,988
Kota Jakarta Barat
Kota Jakarta Selatan
Kota Jakarta Timur
Kota Jakarta Utara
Kota Madiun 5.81 40.14% 17.56% 298,719
Kota Magelang 5.27 36.46% 8.20% 224,974
Kota Sukabumi 3.68 33.11% 29.29% 278,820
Kota Surakarta 3.56 38.94% 2.02% 546,251
Kota Tangerang 3.30 38.40% 57.81% 1,155,724
Kota Tasikmalaya 2.49 33.45% 11.66% 365,946
Kota Tegal 3.88 36.37% 11.70% 251,275
Kota Yogyakarta 3.58 35.64% 18.07% 404,537
Kulon Progo 5.91 49.33% 9.27% 461,433
Lumajang 3.72 45.67% 21.21% 659,999
Madiun 5.30 47.46% 9.71% 553,067
Magelang 4.23 57.11% 9.13% 863,392
Malang 1.86 33.03% 4.73% 787,855
Ngawi 4.50 49.27% 13.71% 639,528
Pati 3.88 46.70% 17.58% 829,073
Pekalongan 3.46 47.57% 8.34% 580,538
Purbalingga 3.22 48.69% -8.13% 548,938
Purworejo 4.28 48.96% 0.96% 616,215
Semarang 2.60 39.20% -3.30% 445,721
Serang 2.30 41.00% 15.93% 713,119
Sidoarjo 2.43 33.07% 8.44% 853,947
Sleman 4.52 45.00% 15.29% 779,972
Sragen 4.34 54.56% 11.87% 751,932

ANNUAL SECTOR FINANCIAL REPORT (2013) 77
Component 2: AIEP 2013
Island/District
Education
Expenditure per
Student (Rp.
Million)
Education
Share of
District
Budget
Education
Budget
Annual
Growth
Education
District
Budget
(Rp. Million)
Sukoharjo 4.38 48.25% 11.39% 614,904
Sumedang 3.49 44.37% 7.20% 729,309
Tegal 2.34 46.19% 6.11% 681,321
Kalimantan
Barito Selatan 7.33 30.20% 14.63% 228,190
Berau 8.80 18.85% 3.75% 378,853
Gunung Mas 8.11 28.26% 17.44% 200,443
Hulu Sungai Selatan 6.14 36.61% -6.04% 267,396.00
Hulu Sungai Utara 4.96 33.66% -2.82% 248,490
Kota Balikpapan 3.75 17.80% 4.73% 447,561
Kota Banjar Baru 4.55 35.57% 13.69% 204,046
Kota Banjarmasin 3.80 38.39% 21.70% 523,726
Kota Bontang 8.28 20.26% 5.77% 305,527
Kota Palangka Raya 6.70 41.38% 17.77% 349,881
Kota Pontianak 3.39 37.07% 29.40% 490,053
Kota Samarinda 3.57 19.93% 2.30% 563,458
Kota Tarakan 9.01 20.27% 3.85% 364,464
Kotabaru 4.89 26.48% 11.94% 314,064
Kotawaringin Timur 3.79 29.23% 8.82% 323,345
Kutai Barat 5.92 11.30% 42.28% 250,568
Kutai Kartanegara 10.64 19.84% 27.23% 1,531,841
Penajam Paser Utara 13.05 25.50% 41.05% 432,041
Pulang Pisau 7.60 33.66% 4.87% 210,848
Tabalong 6.32 29.80% 42.88% 320,789
Tanah Laut 6.18 33.76% 18.18% 371,138
Tapin 7.00 27.71% 3.94% 244,447
Maluku
Halmahera Barat 3.40 21.35% -4.44% 106,314
Halmahera Utara 1.49 12.27% 18.12% 79,314
Kepulauan Aru 6.22 29.00% 28.91% 148,059
Kepulauan Sula 2.39 14.77% 10.11% 106,652
Kota Ambon 5.80 55.58% 17.77% 461,598
Kota Ternate 4.83 33.14% 4.71% 211,823
Kota Tidore Kepulauan 7.03 32.05% 7.51% 180,338
Kota Tual 3.47 15.59% 15.36% 57,092
Maluku Tenggara 2.84 16.68% 16.92% 88,094
Seram Bagian Barat 3.71 35.25% 13.03% 204,866
Papua
Fakfak 8.84 20.25% 34.23% 169,306
Kota Jayapura 5.00 36.18% 27.38% 321,302

ANNUAL SECTOR FINANCIAL REPORT (2013) 78
Component 2: AIEP 2013
Island/District
Education
Expenditure per
Student (Rp.
Million)
Education
Share of
District
Budget
Education
Budget
Annual
Growth
Education
District
Budget
(Rp. Million)
Manokwari 4.35 25.23% 2.96% 234,527
Sorong 7.87 21.57% 34.38% 204,216
Sorong Selatan 7.74 17.10% 8.74% 98,980
Sulawesi
Barru 6.75 45.23% 17.06% 272,863
Bone Bolango 6.57 37.22% 7.36% 208,481
Gorontalo 3.88 44.67% 7.16% 325,565
Gowa 3.09 44.98% 18.51% 467,038
Kepulauan Selayar 5.06 22.54% 5.34% 142,622
Kepulauan Talaud 9.84 31.77% 40.74% 188,843
Kota Gorontalo 5.87 37.29% 17.43% 268,459
Kota Kendari 4.58 36.04% 1.60% 332,045
Kota Kotamobagu 3.93 28.86% -2.78% 121,992
Kota Palu 5.40 41.26% 22.57% 426,904
Kota Tomohon 4.90 23.97% 6.53% 105,637
Minahasa Utara 5.41 35.49% -1.65% 208,126
Sidenreng Rappang 4.61 37.03% -3.07% 277,378
Soppeng 6.69 46.63% 6.12% 325,946
Wakatobi 5.55 31.30% 8.41% 154,938
Sumatera
Aceh Barat Daya 5.30 29.49% 18.58% 172,907
Aceh Jaya 9.01 28.41% 12.27% 150,577
Aceh Selatan 5.54 39.70% 56.17% 295,074
Aceh Singkil 4.13 26.56% 25.99% 126,070
Aceh Tenggara 4.30 37.84% 37.23% 231,869
Belitung 5.47 25.71% 10.87% 186,279
Bengkalis 6.93 20.23% 95.35% 956,801
Bengkulu Selatan 6.64 40.01% 20.79% 248,919
DharmasRaya 4.90 33.25% 18.06% 205,861
Kota Banda Aceh 6.52 41.03% 10.15% 366,769
Kota Bengkulu 3.99 40.29% 15.15% 305,669
Kota Binjai 4.05 36.06% 20.42% 293,666
Kota Dumai 4.47 23.22% 17.58% 276,209
Kota Langsa 4.54 34.47% 15.44% 180,767
Kota Lhokseumawe 4.56 31.66% 22.69% 210,575
Kota Lubuk linggau 3.84 29.97% 12.82% 203,603
Kota Medan 2.19 26.54% 9.02% 1,200,930
Kota Metro 5.40 39.16% 18.37% 246,915
Kota Padang 3.99 44.61% 13.01% 749,009
Kota Palembang 3.65 47.68% 15.49% 1,222,086

ANNUAL SECTOR FINANCIAL REPORT (2013) 79
Component 2: AIEP 2013
Island/District
Education
Expenditure per
Student (Rp.
Million)
Education
Share of
District
Budget
Education
Budget
Annual
Growth
Education
District
Budget
(Rp. Million)
Kota Pangkal Pinang 4.59 29.26% 17.04% 185,447
Kota Pariaman 7.34 40.24% 21.47% 195,594
Kota Sabang 17.26 26.16% 8.29% 119,802
Kota Subulussalam 3.44 24.26% -1.20% 83,076
Kota Tanjung Pinang 5.16 27.14% 25.06% 230,935
Lima Puluh Koto 6.63 50.66% 26.93% 475,311
Nagan Raya 7.13 34.90% 16.15% 232,283
Ogan Ilir 4.93 38.14% 42.54% 408,101
Pesisir Selatan 4.59 50.68% 16.72% 517,400
Samosir 4.89 32.63% 10.92% 186,249
Sawahlunto/Sijunjung 5.71 40.81% 14.66% 273,138
Simeulue 6.38 30.02% 17.49% 151,890
Solok 4.99 48.26% 17.14% 409,436
Tanah Datar 4.61 44.07% 2.15% 349,567
Tapanuli Utara 4.49 47.09% 24.21% 389,133
Component 1 and 2: AIEP 2013
Island/District
Education
Expenditure per
Student (Rp.
Million)
Education
Share of
District
Budget
Education
Budget
Annual
Growth
Education
District
Budget
(Rp. Million)
Bali and Nusa Tengarra
Alor 4.58 34.71% 7.07% 231,701
Bima 3.09 37.89% -4.24% 385,725
Buleleng 5.08 48.27% 16.43% 676,512
Ende 3.96 39.96% -12.91% 278,263
Karang Asem 5.09 41.66% 6.21% 437,250
Kota Kupang 4.77 45.45% 63.04% 382,046
Lembata 4.85 27.39% 18.13% 144,232
Lombok Timur 2.60 44.69% 8.75% 679,824
Lombok Utara 3.79 28.92% 35.92% 145,003
Manggarai 2.67 36.58% 6.74% 241,034
Manggarai Timur 2.22 39.03% 11.37% 213,793
Nagekeo 4.81 35.40% 17.47% 169,523
Ngada 4.32 33.90% 51.07% 166,067
Rote Ndao 4.56 28.50% 11.89% 139,074
Sikka 3.11 33.35% 6.32% 226,562
Sumbawa Barat 7.00 22.83% 22.64% 177,530
Tabanan 6.24 40.42% 9.13% 461,835

ANNUAL SECTOR FINANCIAL REPORT (2013) 80
Component 1 and 2: AIEP 2013
Island/District
Education
Expenditure per
Student (Rp.
Million)
Education
Share of
District
Budget
Education
Budget
Annual
Growth
Education
District
Budget
(Rp. Million)
Timor Tengah Selatan 3.39 43.83% 27.26% 408,366
Timor Tengah Utara 3.33 35.58% 13.36% 228,792
Java
Blitar 4.37 53.36% 3.30% 796,743
Bogor 1.85 39.12% 69.73% 1,922,662
Bondowoso 4.07 43.80% 14.73% 508,402
Brebes 2.70 49.23% 18.88% 930,998
Ciamis 2.91 49.15% 1.08% 854,435
Cirebon 2.36 44.30% 14.33% 1,013,271
Kota Malang 3.38 38.85% 16.94% 599,661
Nganjuk 4.53 51.70% 52.65% 838,489
Pacitan 5.35 50.35% 5.03% 490,439
Pandeglang 2.33 50.44% 3.98% 700,640
Sukabumi 1.53 39.64% -12.42% 786,374
Tasikmalaya 2.11 46.57% -2.13% 740,389
Wonogiri 5.24 57.33% 13.74% 866,099
Kalimantan
Banjar 4.33 33.55% -5.22% 376,654
Bulungan 11.59 16.94% 5.20% 324,699
Kapuas 5.66 36.75% 17.59% 438,112
Katingan 6.87 23.20% 30.18% 232,274
Kayong Utara 5.54 24.28% 9.10% 127,999
Kota Singkawang 5.00 32.72% 26.36% 233,961
Kotawaringin Barat 3.75 21.21% 6.26% 194,793
Kubu Raya 3.17 40.01% 6.67% 373,907
Kutai Timur 11.42 21.54% 58.45% 699,010
Lamandau 7.28 18.27% 4.70% 110,339
Melawi 4.87 31.00% 29.30% 214,235
Murung Raya 7.29 24.63% 25.22% 200,659
Paser 9.83 23.45% 53.99% 521,021
Pontianak 3.65 33.28% -7.18% 201,166
Sambas 4.08 44.89% 20.36% 469,553
Sanggau 4.09 35.13% 1.62% 362,823
Seruyan 4.56 15.60% 17.78% 135,050
Sintang 3.19 26.93% -7.11% 286,506
Tanah Bumbu 4.05 20.56% 16.80% 249,988
Sulawesi
Bantaeng 5.49 38.21% 50.49% 234,332
Boalemo 4.47 31.10% 3.06% 147,144
Bombana 3.34 23.75% -19.57% 124,609

ANNUAL SECTOR FINANCIAL REPORT (2013) 81
Component 1 and 2: AIEP 2013
Island/District
Education
Expenditure per
Student (Rp.
Million)
Education
Share of
District
Budget
Education
Budget
Annual
Growth
Education
District
Budget
(Rp. Million)
Bone 3.01 36.15% -0.25% 492,411
Buton Utara 6.36 25.79% 22.93% 117,670
Donggala 4.36 39.62% 12.29% 316,057
Enrekang 4.16 34.51% 9.70% 217,857
Jeneponto 3.55 41.23% 30.59% 310,491
Konawe Utara 7.73 22.31% 31.68% 127,113
Luwu Timur 3.46 25.09% 7.59% 208,561
Majene 5.05 36.50% 13.51% 211,395
Mamuju 2.26 25.19% 13.41% 211,616
Maros 4.90 39.14% 60.54% 364,107
Minahasa Selatan 5.48 42.57% 36.06% 250,626
Morowali 5.76 33.09% 25.10% 286,698
Pangkajene Kepulauan 5.25 43.57% 13.56% 383,775
Parigi Moutong 2.19 27.69% -10.50% 208,000
Pohuwato 5.80 31.28% 18.19% 181,217
Polewali Mandar 3.56 47.98% 7.71% 351,830
Sigi 5.61 39.18% 11.33% 256,535
Sinjai 5.06 46.15% 5.75% 297,450
Tana Toraja 2.79 29.04% -6.39% 190,533
Toli Toli 3.57 29.49% 4.27% 192,735
Wajo 4.22 30.45% 3.26% 308,536
Sumatera
Aceh Barat 6.36 39.00% 7.54% 270,218
Aceh Besar 5.60 41.31% 17.91% 373,068
Aceh Tamiang 3.56 36.12% 1.70% 229,158
Aceh Tengah 6.14 37.53% 15.72% 277,874
Aceh Timur 3.32 35.21% 29.69% 310,232
Aceh Utara 3.41 34.85% 34.10% 473,240
Bangka 4.40 33.68% 20.47% 272,899
Bangka Barat 4.68 30.80% 20.07% 182,791
Bangka Selatan 4.06 23.66% 1.50% 143,207
Bangka Tengah 4.52 25.03% 5.71% 143,045
BanyuAsin 3.80 37.60% 21.32% 574,524
Belitung Timur 9.69 31.64% 42.93% 216,893
Bener Meriah 4.40 30.99% -4.80% 147,936
Bengkulu Utara 3.91 33.07% 19.23% 239,563
Bireuen 4.64 41.30% 15.60% 426,641
Deli Serdang 2.81 44.20% 15.26% 1,053,278
Gayo Lues 5.56 23.43% 6.67% 121,663
Kampar 5.05 41.66% 19.40% 792,469

ANNUAL SECTOR FINANCIAL REPORT (2013) 82
Component 1 and 2: AIEP 2013
Island/District
Education
Expenditure per
Student (Rp.
Million)
Education
Share of
District
Budget
Education
Budget
Annual
Growth
Education
District
Budget
(Rp. Million)
Kaur 5.19 28.98% 6.82% 135,315
Kerinci 4.70 32.39% 3.07% 241,287
Kota Batam 3.19 28.18% 23.03% 497,943
Kuantan Singingi 5.12 28.97% 19.89% 355,218
Mukomuko 4.04 23.89% 10.46% 159,359
Ogan Komering Ulu 4.26 29.92% 35.36% 331,631
Padang Pariaman 4.97 53.31% 9.28% 487,366
Pelalawan 5.13 22.00% 30.78% 355,141
Pidie 4.33 42.69% 62.04% 411,996
Pidie Jaya 4.69 32.56% 12.77% 154,878
Pringsewu 4.82 48.97% -6.63% 390,683
Rejang Lebong 4.04 35.62% 6.98% 238,442
Rokan Hulu 2.90 22.99% 10.95% 329,427
Serdang Bedagai 3.34 43.79% 19.10% 460,050
Tebo 3.47 32.01% 1.34% 240,380
Australia’s Education Partnership with Indonesia
Education Partnership Performance Oversight and Monitoring
EP-POM
19th
floor Ratu Plaza Building
Jl. Jend. Sudirman No. 9
Jakarta 10270
T: 021 720 6616
F: 021 720 6616 ext.100
Australian Aid – managed by GRM International Pty Ltd
www.kemitraanpendidikan.or.id
Related Documents