AEGIS Water Treatment Controller Technical Manual

Welcome message from author
This document is posted to help you gain knowledge. Please leave a comment to let me know what you think about it! Share it to your friends and learn new things together.
Transcript
AEGISWater Treatment Controller
Technical Manual

AEGIS Technical Manual
6/09 2Aegis_Tech
Contents
Safety
1. Overview1.1 Applications1.2 Sensor Inputs & Control Outputs1.3 Communications1.4 Field Upgrades1.5 Data Logging
2. Installation-Commissioning2.1 Cabling–Wiring2.2 Water Meters–Flowswitches–Contact Sets
3. Control Configuration3.1 Control Method3.2 Special Controls Insight
4. Sensors4.1 Compensation Insight4.2 Calibration Defaults
5. Application Notes5.1 Calculate ppm5.2 Copy Volume5.3 Feed-Verify & Inventory5.4 Frequency Controlled Pumps5.5 Password Security5.6 Relay & Frequency Controls Comparison5.7 System Alarms & Indicating LEDs5.8 Units for Volumes & Temperatures5.9 XML: URL Encoded Requests
6. Applications6.1 Adjusting Inhibitor Feed with Varying Cycles

AEGIS Technical Manual
6/09 3Aegis_Tech
7. Sensor Driver Card Manuals7.1 CT: Conductivity Temperature7.2 B: Boiler Conductivity7.3 OP: ORP-pH7.4 CI: Dual 4-20mA Current Input7.5 IO: 4-20mA Output7.6 CR: Corrosion Rate7.7 PT: pH-Temperature
Appendices
A: Revision Log

AEGIS Technical Manual
6/09 4Aegis_Tech
Safety Electrical Shock Hazard
Opening the controller enclosure with the controller plugged in, exposes the userto AC line voltages on the backmost of the two controller circuit boards.
Ground the controller AC power to the ground screw labeled and located on the bottom, right ofthe aluminum backplate.
External, 120VAC socket or optional plug boxes are provided with controllers installed in North
America. Both are grounded to the ground screw labeled located on the bottom, center of thealuminum backplate.
USER WARNING : CAUTION
Water Treatment Controllers operate steam and water valves and may pumphazardous, corrosive and toxic chemicals. Opening the controller enclosureexposes user to the risk of electrical shock at power line voltages.
Understand fully the implications of the control setpoints, interlocks and alarms thatyou select. Harm to personnel and damage to equipment may result from mis-application.
Unplug or turn OFF the AC power to the controller if you have any concernsregarding safety or incorrect controller operation and notify supervisory staff.
YOUR CONTROLLERAEGIS Controllers are supplied in many different configurations, part numbers andsensor sets. Applications extend beyond water treatment.
The HELP section available in the Aegis_User manual, depicts the installationplumbing header showing the sensor set supplied with your controller. It alsoincludes the information for terminating the sensors supplied with your specificcontroller part number.
The START-UP section available in the Aegis_User manual, is specific to yourapplication and details modifying the default controller settings for your site.

AEGIS Technical Manual
6/09 5Aegis_Tech
1. Overview
1.1 ApplicationsAegis controllers are optimized for water treatment applications. These controllers measure the sensors usedto control water treatment chemical feed pumps, blowdown valves and bleed solenoids.
The control methods used to do both conventional and complex water treatment are built-in.Sensor sets are easily modified post-purchase to meet changing site needs.ON-OFF, AC powered pumps and solenoids may be mixed with frequency controlled pumps.
Aegis controllers do a lot more than the summary information in the following table:
Application Measures ControlsCooling Towers Tower Conductivity
Make-up ConductivitypHORPCorrosion RateMake-up VolumeGray water make-upBleed VolumeWater TemperatureFlowswitchTank level switchesChemical fed volume
Bleed on tower conductivity, on cycles of concentration, onratio of make-up to bleed volume….Feed Inhibitor on ppm setpoints, based on bleed,proportional to make-up, base feed….Feed pH correction acid ON/OFF, proportionately, by make-up volume… Control both acid & caustic.Feed bleach on ORP using a pot feeder, or proportional.Base feed bleach and shock during biocide feed events.Sum or difference water meters to feed inhibitor.Prebleed and Lockout biocide feeds.Block some chemical feed while others feed.Feed on corrosion rate, temperature…..Calculate ppm based on volume fed & cycles ofconcentration.
Boilers Boiler Conductivity for 1 to3 boilers.Condensate ConductivityFeed water volume foreach boilerSteam demandCondensate pHDay tank levels.Verify feed
Captured sample & continuous blowdown controls.Feed treatment based on each boiler make-up & meteramine based on the sum of make-ups or the steam demand.Feed sulfite on temperature or base feed.Operate condensate bypass valves.Log, monitor and control on hardness analyzers.Log and an alarm on condensate pH. Average pH to controltime lagged condensate pH.Mix & blend day tanks.
Waste Water ORP, pHMake-up and drainvolumes and rates.Tank high & low levels.Conductivity
Hold & mix to hit target, conductivity, pH, ORP, temperatureprior to drain.Feed flocculants on volume, turbidity…Sequence feeds, mixing and discharge.Alarm on fail to feed.
Process Conductivity-ResistivityCorrosion RateUp to 4 pHs or ORPsRates as 4-20mAAny mix of water metersand contact sets notexceeding 8
Feed or control based on ON/OFF setpoints, volumemeasured, volume fed, time of day, day of week, base feed.Alarm on runtime or volume fed or high or low sensor levels.Delay on alarm to avoid transient states alarming.Sequence on contact sets.Invert the logical sense of contact sets.Ratio sensors and volumes.Meter on volume fed.

AEGIS Technical Manual
6/09 6Aegis_Tech
1.2 Sensor Inputs & Control OutputsUsers can change the default names of sensors, pumps and valves to meaningful, site specific names.For example, although you may name controller meter input ‘P’ to ‘City Make-up’, ‘P’ identifies where the meter is connected and the letter ‘P’ is used to represent the ‘City Make-up’ input in controls and data logging.
The controller uses the letters ‘A’ thru ‘Z’ to identify sensor, water meter,flowswitch and contact set inputs andthe numbers 1 to 9 to identify AC power switching relays and frequency outputs.
‘A’ to ‘G’ and ‘O’ to ‘V’ exist as terminal blocks where inputs are connected. Sensor inputs ‘H’ to ‘N’ and meter/contact set inputs ‘W’ to ‘Z’ are used to implement more complex control and monitoring functions.
Any input may be used to control any output or outputs.
I/O Point Function NotesSensor A Fixed conductivity sensor
driveSupport for both cooling tower and boiler-condensatesensors.Most controllers have at least one conductivity sensor.
Sensor B Fixed thermal sensordrive
Support for the 10mV/K and CTF type temperature sensors,Thermal compensation for the ‘A’ conductivity or stand-alonefeedwater thermal sensor
SensorsC-D and E-F
Two sensor card slots.Each slot can take asingle or dual sensordriver card
Plug & Play sensor cards auto-reconfigure the controllerwhen the card is installed.Available Card set: Conductivity-Temperature, Single & DualBoiler Conductivity, Single & Dual pH-ORP, pH-Temperature, Single & Dual Corrosion Rate, Dual 4-20mAinput. Single & Dual 4-20mA output.
Sensor G Fixed 4-20mA input Support for loop powered and isolated 4-20mA levels onChlorine or ClO2 or feed rate or turbidity…
Sensors H to N Phantom sensor inputsused for control andlogging.
Inputs used to for calculated and manually entered values:Calculated ppm & inventory-tank levels. Manually entereddrop count-chemical test results…
Meter-ContactsO to V
Eight digital inputs,individually configurableas meter-volume orcontact set inputs
Meter-volume inputs totalize, display volume today and thisyear, calculate turbine ‘K’ factors and debounce contact head meters.Contact sets are flow and level switches. They are used tointerlock and to initiate feeds.
Meter-ContactsW to Z
Phantom digital inputsused for control andlogging.
A 4-20 GPM input may be converted to a volume @ ‘X’ A relay state may be ‘mirrored’ by phantom input ‘Y’ which is used to start a rinse sequence by controlling relay No.4
Relays 1 to 5 AC Line poweredON/OFF controls
Controller powered outputs switch 120 or 230VAC pumps,valves & solenoids ON/OFF. Log time ON.Alarm on runtime per actuation & per day.Relays 2-5 are SPDT for motorized valves requiring powerOPEN & power CLOSE.
FrequencyOutputs 6 to 9
DC isolated,non-mechanical0 to 400Hz
Variable speed feeds, with presets for popular pumpml/stroke and maximum rate. Calculates & logs volume fed.Use volume fed to calculate ppm & inventory.

AEGIS Technical Manual
6/09 7Aegis_Tech
1.3 Communications
1.3.1 USB ServicesAll Aegis controllers include a USB port which is used for three purposes:1. Upload of logged data in XML format to a notebook PC or a PDA operating as a USB host.2. Download of View-Configuration Sets into the AEGIS.3. Upload of the current controller configuration from the AEGIS to support generation of View-Configuration
Sets and for controller cloning.
1.3.2 Configuration-View sets:Controllers with the ‘LB’ Ethernet option are loaded with from 1 to 15 View-Configurations. One of these isselected when the controller is manufactured to be the ‘as shipped’ view-configuration.
Installed View-Configurations represent possible, future uses of the controller.For example ORP and/or make-up conductivity sensors and controls are routinely added to installedcontrollers. Configuration and Views are preloaded to support these upgrades.
1.3.3 LAN TCP-IP:The LB controller option adds a 10 Base T, RJ45 Ethernet port with a user assigned static IP. The controlleroperates as an HTML micro-server for command & control using IE7 and Mozilla’s Firefox browsers. Logged data is served as an XML file in response to an HTML request.
1.3.3 Modem:The RM controller option adds a 57,600 baud micro modem that provides a PPP connection so that remoteusers can browse the controller. AJAX supports the same graphical View interface used by on-site users.
1.4 Field Upgrades
Sensor driver cards can be added after installation by powering OFF the controller, plugging in the upgradecard and powering ON. The controller recognizes the new hardware and auto-configures, modifying the LCDdisplay to add the new sensor inputs and sub-menus. The diagnostic browser view auto-enables the newsensors and displays their current values.
No additional hardware is required to connect another water meter, flow or level switch. Enable the input andthe new device appears automatically in all of the selection and configuration menus.
1.5 Data Logging
Each enabled input and output is logged by the controller as a user set interval from 5 to 1440 minutes. EachI/O can be independently logged at its own rate. The default rate for all I/O is 60 minutes with a 600 sample logsize. Sensors log minimum, maximum and average. Water meters log volume. Contact sets log time ON.Power Relays controlling pumps and valves, log ON time in seconds.Frequency controlled pumps log volume pumped in mL in each log period..
Alarms are time & date stamped. The last 25 controller activities are time and date stamped with the user ID.Note: Data logging of relay ON time stops when AC fuse fails since without a fuse a relay
can’t power ON a pump, valve or solenoid.

AEGIS Technical Manual
6/09 8Aegis_Tech
2. Installation-Commissioning
2.1 Cabling–Wiring
2.1.1 Controller Wiring Terminals
Controllers consist of two circuit boards, a front Measure circuit board and a back Power board.The front, Measure circuit board supports 7 sensor inputs & 8 digital Inputs.It includes a 2 line x 16 character LCD display, USB Type ‘B’ jack and a microcontroller module.
S1 S2 T
Running
+DC PowerOutput O P Q R S T
A & B
U VG+
Power IN18 VDC
‘A’ ‘B’RS485
4-20mAConductivityRed Blk Wht Grn Meter & Contact Set Inputs
‘+’
LCD Display
ControlModule
withOptionalEthernet
Jack
OptionalSensorCard
Socket
OptionalSensor
CardSocket
Sensors‘C’ & ‘D’
Sensors‘E’ & ‘F’
USB‘B’ Size
Jack
Modem PowerExpansion
ConductivityTemperature
Sensor
Sensors‘A’ & ‘B’
Sensor‘G’
RJ45Ethernet
Jack
Turbine& Current
LoopPower
Contact Head& Turbine Meters
Flow & Level Switches
OptionalModem
Cable toPowerCard
Measure Card

AEGIS Technical Manual
6/09 9Aegis_Tech
2.1.1 Controller Wiring Terminals cont.
The back, Power circuit board has 5 ON/OFF Power Relays, 4 Variable Frequency Feed outputs andthe controller power supply.The Ai, industrial version of the Aegis, includes an enclosure door mounted AC Power ON/OFF switch.
L LM N N NEUTRALS
AC
A & B A & BA & B A & B A & B
AC POWER
AC RELAYS 1-3 AC RELAYS 4-5RUN R1
NOR2
NC NOR3
NC NOR4
NC NOR5
NC NO
DC
P6A B
P7A B
P8A B
P9A B
FREQUENCY CONTROLS
115V
5 Power RelayON/OFFControls
4 PumpFrequencyControls
LineVoltageSelect Relay
Fuse
To Measure Card
Power CardCable toMeasure
Card
AC PowerIN & fused
Auxiliary PowerOUT
VariableFrequency
PumpControls
AC Power toSolenoids,
Valves & Pumps
AC Powercabling tooptional
door mountedON/OFF
A blue tinted electrical shield, secured by two thumbscrews, covers the terminals of the Power board.Controllers may be supplied prewired with either 120VAC NEMA sockets or with an optional plug box.Variable frequency pump control cables may be pre-wired.

AEGIS Technical Manual
6/09 10Aegis_Tech
2.1.2 Enclosure Entries
Enclosure: Cable-Conduit Entries
Bottom, frontsurface
of enclosureHinge side
of enclosure
A = PG9, Pump No.1, 39/64" or 15.2mmB = PG9, Pump No.2, 39/64" or 15.2mmC = PG9, Pump No.3, 39/64" or 15.2mmD = PG13.5, Ethernet, 18.6mmE = PG9, CTF Sensor, 39/64" or 15.2mmF = PG9, AC Power cord, 39/64" or 15.2mmG = ½"NPT, Solenoid, 51/64"H = PG9, Pump No.4, 39/64" or 15.2mmI = PG11, Pumps 6-9, ¾" or 18.4mmJ = PG11, Sensors, ¾" or 18.4mm
0.6"
0.6" 0.6" 0.6"
0.7"½" Conduit
A B C
0.75" 0.75"
0.8" 0.6"
D E
F G H I J
Warning 1:Remove the controller frame assembly prior to drilling additional enclosure entries to prevent damage towiring and circuit boards. The frame assembly is secured by 4 Phillips corner screws.
Warning 2:Do not put conduit entries in the top of the enclosure.Resulting conduit condensation and failure to seal may damage controller circuit boards.Paralleling sensors within the enclosure cabling with AC power will cause measurement errors.

AEGIS Technical Manual
6/09 11Aegis_Tech
2.1.3 Wiring Rules
Analog Sensor WiringAnalog sensors (pH, ORP, conductivity, corrosion rate, temperature, 4-20mA…), contact sets, water metersand flowswitches may be cabled in a common conduit without causing operational problems.
Do not mix AC Line, 120VAC & 240VAC wiring with any sensor or communications cable in a commonconduit. Grounded, metallic conduit is preferred in areas where variable frequency drives operate.
Sensor cables, with the exception of pH sensors, may be extended in paired AWG22, 0.25mm2 cable.Ensure that cabling splices are accessible in conduit fittings or junction boxes.
Verify that the shields on contact head water meters are also spliced when meter cables are extended.Ground cable shields at one end only to the internal frame lower bottom grounding screw.
Ethernet LAN CablingCAT5 LAN cabling is limited to a maximum of 300ft / 100m from controller to access hub.Do not exceed this limit.
AC Controller PowerPower the controller using a dedicated, separate breaker in the local lighting-distribution panel.Do not route the controller AC power in common conduit with variable frequency pump drives.
AC Power to Valves & SolenoidsController ON/OFF relays switch and power the AC line to valves & solenoids. Ensure that each valve &solenoid has a dedicated neutral cable between the controller and the valve or solenoid. Do not share acommon neutral to multiple valves or solenoids.
Fractional Horsepower Chemical Feed PumpsThe controller ON/OFF relays are fused at 5 amps total which will power multiple solenoid driven chemicalfeed pumps and solenoid coils. Fractional horsepower chemical feed pumps cannot be directly powered bythe controller. Use the controller 120VAC control output to switch a motor start relay with a 120VAC coil.Fractional horsepower feed pumps are commonly used in high pressure boiler chemical feed applicationsand waste water polymer feeds.Typically the motor inrush current requires a dedicated breaker and separate AC feed from the controllerAC power breaker.

AEGIS Technical Manual
6/09 12Aegis_Tech
2.2 Water Meters–Flowswitches–Contact Sets
Water meters, flowswitches and ‘dry’ contact sets are connected to input terminals ‘O’ through ‘V’ and a ground terminal. 5VDC limited by 10K puts 1/2mA through a closed contact set.
Hall effect Turbines and Paddlewheel water meters are powered by the 15-22VDC controller supply, thermallyfused at 100mA.
S1 S2 T+DC Power
Output O P Q R S T
A & B
U VG+4-20mA
ConductivityRed Blk Wht Grn Meter & Contact Set Inputs
Connecting Meters & Flowswitches
Upper, Measure Card
Dry Contact SetFlowswitches& InterlocksSeametrics type
Turbine WaterMeters
Contact HeadWater Meters
Water Meters, Flowswitches and ContactSets may be connected any digital input 'O'
to 'V'
Black
Red
Red
Black
White
Red
Red
Controllers are defaulted toinput ‘O’ as make-up meterand input ‘S’ as the
flowswitch, operatinginterlock
Connect cabling shields at the controller ends of the cable only, to any ground terminal either on the Measurecard or on the aluminum backplate, bottom, center

AEGIS Technical Manual
6/09 13Aegis_Tech
3. Control Configuration
3.1 Control Method
3.1.1 Relays 1 to 5Sets the deadband response of an ON/OFF relays controlled by sensors A..N.Not applicable to relays controlled by volume meters or contact sets O..Z.
Method Function Examples
Rising Setpoint ON: Sensor > Turn ON SetpointOFF: Sensor < Turn OFF Setpoint
Tower BleedBoiler BlowdownCondensate BypassAcid Feed
Falling Setpoint ON: Sensor < Turn ON SetpointOFF: Sensor > Turn OFF Setpoint
Oxidant FeedCaustic Feed
Between Setpoints ON: Sensor < Turn ON Setpoint& Sensor > Turn OFF Setpoint
OFF: Sensor > Turn ON SetpointSensor < Turn OFF Setpoint
Blocking ControlsLevel Controls
Event Rising Rising SetpointOperates only during Timed Events
Acid wash–flushCleaning controls
Event Falling Falling SetpointOperates only during Timed Events
Oxidant slug feeds
Event Between Between SetpointsOperates only during Timed Events
Blocking–sequencingcontrols
3.1.2 Frequency Controlled Pumps 6 to 9Sets the variable frequency control range for pumps controlled by sensors A..N.Not applicable to pumps controlled by volume meters or contact sets O..Z.
Method Function Examples
Always Frequency varies proportional tosensor value when value betweensetpointsON & maximum SPM when Sensorgreater than Turn ONOFF when Sensor less than TurnOFF
Proportional acid or oxidantcontrols.Replaces 4-20mA controlledpumps.
During Events Control active during events untilevent volume pumped.
Proportional oxidant feedduring a feed event.

AEGIS Technical Manual
6/09 14Aegis_Tech
3.2 Special Control Insight
3.2.1 Bleed & Feed Inhibitor FeedsBleed & Feed use is limited to sites where the bleed OR the inhibitor pump is undersized and therenot enough time between bleed periods to pump inhibitor.Bleed then Feed is the preferred inhibitor feed method for sites, which do not have a make-up watermeter.Sites which have wide variation in make-up conductivity typically will have problems maintaining thetarget inhibitor level using Bleed & Feed.Poor location of feed point and bleed take-off may result in inhibitor being pumped down the drain.Bleed setpoint dead band should be set to 1% for short bleed and short feed periods.
3.2.2 Bleed then Feed Inhibitor FeedsBleed then Feed is the preferred inhibitor feed method for sites that do not have a make-up or bleedwater meter.Do not use Bleed then Feed at sites where the bleed or inhibitor feed pump is undersized. There maynot be enough time between bleed periods to feed inhibitor.Sites which have wide variation in make-up conductivity typically will have problems maintaining thetarget inhibitor level using Bleed then Feed.Bleed setpoint dead band should be set to 1% for short bleed then feed periods.
3.2.3 Percentage Time–Base Feed Inhibitor, Boiler Treatment, Oxidant FeedsCommonly used method to feed boiler chemicals where a contact set closes when the boiler is on-line.Typically boiler chemistry is verified by the operator, adjusting % time or mL/minute feed rate asrequired to hit the target ppm.Reliable method of control for static systems or where users manually adjust feed rates in responseto on-site testing or process changes.Particularly useful where a contact set or flowswitch opens when the system is offline. PercentageTime or Base Feed Time controls do NOT accumulate time when the interlock is OFF.
3.2.4 Prebleed–Lockout Biocide FeedsUsed where you can’t get the site to start the re-circulation pump early on biocide feed days.Since Prebleeding dumps both inhibitor and water, avoid it if possible.It’s preferable to feed biocides into a tower that’s not under thermal load where you can get the kill time at the target concentration without make-up diluting the biocide.
If you need to use this control, keep it as simple as possible. If you only need Prebleed but notLockout, then zero the Lockout time. Lockout times that extend into the high load period may causethe tower to overcycle. On site staff may be concerned that the controller has not opened the bleedeven though the conductivity is greater than the Turn On setpoint.

AEGIS Technical Manual
6/09 15Aegis_Tech
3.2.5 Captured Sample Boiler Blowdown Controls: Relays 1-5Start-upControllers with more than one boiler blowdown control should always be commissioned one boiler ata time. It’s easy to cross-wire sensors, valves and/or interlocks and very difficult to diagnose sinceplumbing problems are also common on start-up.Disconnect the sensors, valves and interlocks for all boilers but one.Verify each boiler’s valve operates and its sensor measures the boiler water conductivity and it’s interlock stops blowdown. Then repeat for the next boiler.Sensor WatchThis sub-menu option on the controlling conductivity sensor is the best tool to identify plumbingproblems and flashing. Read the AEGIS user manual section on Captured Sample and then viewSensor Watch through a Sample-Measure-Blowdown sequence.If you are seeing flashing at the sensor, you are likely to have control tracking problems as the sensortries to measure a varying mix of steam & water after the sampling valve closes. Extending theMEASURE period to 120 seconds sometimes helps but corrective action to remove the cause offlashing always improves control.PlumbingMake sure that the throttling valve is always downstream of the valve or solenoid and installedcorrectly. If you install a throttling needle valve backwards, you’ll be replacing it.The optimum control occurs when any flashing occurs downstream of the throttling valve.This is particularly important on boilers operating at less than 100psi steam since steam ratedsolenoids are more sensitive to flashed deposits than motorized valves.
If this boiler previously had a continuous blowdown controller installed and did not have a throttlingvalve, locate the orifice union and ensure that it is downstream of the sensor and blowdown valve.
Although it’s convenient to have the blowdown valve accessible so you can see the stem position, it’s not necessary for the correct operation of the controller. You can install the sensor, blowdown valveand throttling valve on horizontal or vertical runs of the surface blowdown line above or below theboiler water line. Maintenance may be difficult, but blowdown function will not be compromised. Thelonger the piping run to the sensor, the more water you’ll remove to get a sample.
Missing, Corroded or Intermittently Immersed Surface Blowdown LinesAn internal surface blowdown line that extends below the boiler water level is an option on someboilers. You’ll see this fault occasionally on a new installation start-up. Sensor Watch displays a lowvalue with not much variance, measuring only steam.
If the boiler water level drops below the bottom of the surface blowdown line as load varies you won’t able to control blowdown. If you are not flashing at low loads, the best way to see this problem is totemporarily remove the Captured Sample special control & adjust setpoint to blowdown. If the SensorWatch value isn’t stable, the surface blowdown line is not always immersed.
Corroded surface blowdown lines are rare but not unknown.Get suspect piping inspected during the next outage but don’t use this as a cause of control problems unless you are able to eliminate all other causes.

AEGIS Technical Manual
6/09 16Aegis_Tech
3.2.6 Time Modulation: Relays 1-5Application: Cycles a chemical feed pump ON/OFF, decreasing the ON time as the controlling
sensor approaches the Turn OFF setpointTypically used for pH control, reducing acid feed as the Turn OFF setpoint isapproached.Use if you can’t use a variable frequency controlled pump.
Setup: User selects a relay & selects Time Modulation Special ControlUser sets Time Period in seconds, minimum 60, maximum 600 seconds.
Operation: Relay ON time = [ (Control–Turn OFF Setpoint) / Deadband ] x Periodwhere Deadband = Turn ON–Turn OFF setpoints.Relay ON 100% of Period when Control is greater than Turn ON setpointRelay is OFF when Control is less than Turn OFF setpoint.
Example: Acid Pumps Turn ON = 10pH and Turn OFF = 8pH. Period = 120 secondsAt pH >= 10, Pump ON for 120 seconds in every 120 secondsAt pH = 9.5, Pump ON for 90 seconds in every 120 secondsAt pH = 9.0, Pump ON for 60 seconds in every 60 secondsAt pH = 8.5, Pump ON for 30 seconds in every 120 secondsAt pH <= 8.0, Pump OFF
Notes: Time Modulation control is not applicable when the system response time is faster than5x the Period. In the previous Example; If the measured pH moves from 10 to 8 in lessthan 300 seconds, Time Modulation may not improve control.Process buffering, pump setting, feed point and system volume all affect the responseto chemical feed.Time modulation also works on Falling Setpoints.
3.2.7P Timed Cycling: Pumps 6 to 9Application: Large volume systems where the response to a chemical feed or control action
is slow or delayed in time and continuous, proportional feed over or undershoots.Swimming pool pH, conductivity and ORP controls are typical applications.
Setup: User selects a pump & selects Timed Cycling Special ControlUser sets Period in minutes, minimum 1, maximum 360 minutes.User sets Feed Volume in mL, minimum 1, maximum 10000 (10L, 3.785G)
Operation: Pumps setpoint volume @ MAX SPM.Time Modulation turns OFF the pump after Feed mL.Note: If the time to feed the user set volume is greater than the Period, the pump turnsOFF for 10 seconds & then starts the next feed cycle.This overfeed is an error in setting either the feed volume (too high) or the period (tooshort)Time Modulation keeps the pump OFF for ‘Period ’ minutes where ‘Period’ is reduced by the pump feed time.During the OFF period, the system has time to respond to the ON Time feed.
Example: Time Cycling Feed = 250mL , Period = 60 minutesIt takes 14 minutes for a 18mL/minute pump to feed 250mL so the pump is ON for 14minutes and OFF for 46 minutes.If the controlling sensor measures below the TurnOFF setpoint during the feed period,the pump turns OFF.

AEGIS Technical Manual
6/09 17Aegis_Tech
3.2.7R Timed Cycling–Relays 1 to 5Application: Large volume systems where the response to a chemical feed or control action
is delayed in time.Swimming pool pH, conductivity and ORP controls are typical applications.
Setup: User selects a relay & selects Time Modulation Special ControlUser sets ON Time in minutes, minimum 1, maximum 360 minutes.User sets Period in minutes, minimum 1, maximum 360 minutes.Controller forces Period >= ON Time.
Operation: Setpoint Controls turn ON the relay.Time Modulation turns OFF the relay after ON Time minutes.Time Modulation keeps the relay OFF for ‘Period – ON Time’ minutes.During the OFF period, the system has time to respond to the ON Time feed.
Example: Time Modulation ON Time = 10 minutes, Period = 60 minutesBrine feed is controlled on conductivity using a Falling Setpoint.Conductivity setpoint control turns ON the Pool Brine feed relay.After 10 minutes the Pool Brine feed turns OFF.After another 50 minutes the Pool Brine feed turns ON for another 10 minutes if belowthe Turn ON setpoint or remains OFF if the conductivity is above the Turn OFFsetpoint.
Notes: Condensate systems are also slow to respond to amine feed.However the response time may vary with time of year and steam production.
3.2.8 Holding TimeApplication: Holding Time averages the value of a controlling sensor over a user-defined period.
Averaging lowers the effect of process transients and limits the effect of the delaybetween feed and measuring the effect of the feed. Control of amine feed by a pHsensor in the condensate return is a typical use of Holding Time control.
Notes: The number of samples used for control is the Period / Log Rate.Log entries are an average over the Log Period.You may choose to reduce the Log Period to increase response to transients orincrease the Log Period to limit transient response.The same effect may be achieved by altering the Holding Time Period.

AEGIS Technical Manual
6/09 18Aegis_Tech
3.2.9 Varying CyclesApplication: Cooling towers where the make-up conductivity varies widely and ismeasured by a separate conductivity sensor. The bleed (cycles of concentration) iscontrolled by the ratio of the tower-to-make up conductivity within three user setranges. As the make-up conductivity changes, the cycles of concentration changes.Typically, at lower make-up conductivities, higher cycles of concentration are possible.
This special control solves operational problems, but requires care when setting cyclesor concentration setpoints and maximum cooling tower conductivity.If your site has seasonal changes, it’s preferable to simply modify the bleed setpoints.
Warning: When the make-up conductivity falls, the bleed setpoint increases butthe bulk of the water in the cooling tower has not changed.Example: If make-up conductivity changes from 500uS to 100uS, the cycles ofconcentration setpoint may change from 2 cycles to 4 cycles. However @ 4 cycles, thebulk of the water in the tower may be scaling.Short Holding Time: If the holding time ( time required to exchange the tower water )is short, then the 100uS make-up will quickly dilute the tower water to below scaling.Non-Scaling: You may not be hardness cycles limited, so even @ 4 cycles, you maynot be in a scaling condition.

AEGIS Technical Manual
6/09 19Aegis_Tech
4. Sensors
4.1 Compensation
4.1.1 Analog Sensors A..N
Type Setup NotesThermal(Conductivity)
User selected thermal sensorA..N.User set %/degreecompensation.
Applied to conductivity sensors.Zero at 70F or 20C, dependent on ‘metric units’ switch setting.The defaults are 0.97%/F or 1.746%/C
Thermal(pH)
User selected thermal sensorA..N.
Applied to pH sensors.Zero compensation at 7 pH.Compensation adjusts sensor gain (slope)+0.00467%/C above 25C & -0.0058%/C below 25CpH thermal compensation can only be applied todirectly connected pH sensors and not to4-20mA inputs which may represent pH.
Rate-to-Volume User selected water meterO..Z displays and logsresulting volume.User selected rate/minuteor rate/hour
Typically a 4-20mA input proportional to gpmmakeup rate or LBh steam production is converted tovolume to feed ON/OFF based on volume & timesetpoints.Frequency controlled pumps can be controlleddirectly by the 4-20mA level.
Corrosion Rate User set alloy number, default1.00, Carbon SteelUser selected conductivitysensor A..N, corrects corrosionrate for conductivity.
Controller sets alloy to default and conductivitysensor to ‘none’ on CR driver installation.Conductivity sensor optional.Remove driver to remove compensation.
Manual Entry Logs the results of ppm testing or any analog value.Any analog input without a driver card, may be usedfor Manual Entry and phantom inputs ‘H’ to ‘N’.Remove by setting compensation to ‘none’
Calculated Feed Verification calculatedppm log.
Remove by setting to ‘none’ in Feed Verify control.
Inventory Feed Verification calculatedtank volume log.
Remove by setting to ‘none’ in Feed Verify control.Pumped volume may also be copied to an Inventoryinput, reducing the tank volume by the volumepumped.
Note: pH thermal compensation is seldom used in cooling towers since the pH is typicallybetween 7 & 8 so the effect or thermal compensation is minimal.

AEGIS Technical Manual
6/09 20Aegis_Tech
4.1.2 Water Meter Sensors O..Z
Switching from Contact Set to Water Meter clears the log on the switched input.
Type Setup Notes
Contact Head User set volume/contact Contact Head compensation turns ON softwaredebouncing.Volume counts on contact closure.Contact opening ignored.
Turbine orPaddlewheel
User set ‘K’ factor, pulses/unit volume
Counts pulse on falling edge, 400Hz max.Ignores rising edge.
4.1.3 Contact Sets, Flowswitches, Fail-to-Sample Sensors O..Z
Switching from Water Meter to Contact Set clears log.
Type Setup Notes
Contact Set User selects Contact Set Contact sets are ON when closed and OFF whenopen.ON time is logged.Contact sets used for interlocking, prevent relaysfrom turning ON when contact set is OFF, or open.
Contact sets may be configured as ‘inverted’ to act and disply as ON when they are OFF.
Contact sets may be configured to ‘mirror’ a controlled relay of frequency controlled pump, acting& displaying as ‘ON’ when the relay or pump is ‘ON’

AEGIS Technical Manual
6/09 21Aegis_Tech
4.2 Calibration
4.2.1 Single Point Calibration
All inputs A..Z with the exception of 4-20mA, type ‘CI’ inputs, are single point calibrations.Calibration of contact set inputs is blocked.
SENSORS A..N:Conductivity, Calculated: Sensor GAIN is adjusted so that the sensor value matches the
user’s calibration value.
Temperature, pH, ORP Sensor OFFSET is adjusted so the sensor value& Corrosion Rate matches the user’s calibration value.
Inventory, Manual: Sensor OFFSET is set so the sensor value matches the user’s calibration value. Since the GAIN on these inputs is zero, theOFFSET is the input value for control and logging.
During calibration, users have the option to Reset to Factory, which resets the sensor GAIN & OFFSET todefault values (Refer to section 4.2.3).
If the calibration OFFSET or GAIN is outside fault limits, users are offered the option to OVERRIDE.OFFSET or GAIN outside of the fault limits typically indicates a sensor, cabling or driver fault.
Users have the option to manually enter OFFSET and GAIN by selecting Sensor then Configure
The value of a sensor = Measured Level (mV) x GAIN + OFFSET.
This value may be modified by sensor compensation.Compensation (Temperature, Rate-Volume, Corrosion Rate…) is applied after GAIN & OFFSET.
WATER METERS O..Z:The user calibration value is Volume/contact for contact head metersand ‘K’ factor (Pulses per unit volume) for turbine and paddlewheel meters.
4.2.2 Two Point CalibrationTwo point calibration is limited to sensor type ‘CI’, the dual 4-20mA input driver.There are no fault limits on GAIN or OFFSET for ‘CI’ drivers.Refer to Section 7.4.

AEGIS Technical Manual
6/09 22Aegis_Tech
4.2.3 Reset to Factory
New sensor driver cards & reconfigured water meters are Reset to Factory on Power on.User selected Reset to Factory loads the GAIN, OFFSET set from the following table.
Sensor Type DriverType
FactoryGain
FactoryOffset
FaultMAX
FaultMIN
Boiler–CondensateConductivity
Type = BoilerType = Condensate
B
2.08.0
-15-90
GAIN
1012
GAIN
0.53.0
Calculated Value 100 0 None none
ConductivityRange >100uSRange <100uS
CT5.60.4
-35-10
GAIN10
0.55
GAIN2.5
0.25
Conductivity CTF(includes flowswitch)
CTFCond.
Temp.
10.6
-0.0905
-13.6
234.7
GAIN14.85
OFFSET255
GAIN6.36
OFFSET215
Corrosion Rate CR 1 0 None None
4-20mA Current Input CI 1 0 None None
Manual Entry 1 0 0 0
ORP - pHType = pHType = ORP
OP
0.017-1
70
OFFSET850
OFFSET6
-50
TemperatureUS unitsMetric units
CT
0.180.1
-459.4-273
OFFSET-430-253
OFFSET-590-293
Water meterContact HeadTurbine
100100
None None

AEGIS Technical Manual
6/09 23Aegis_Tech
5. Application Notes
5.1 Calculate ppm
5.1.1 Calculation Method
The controller can automatically calculate inhibitor ppm by measuring three values:1. The volume of inhibitor pumped into the tower.2. The volume of make-up water.3. The cycles of concentration
And there’s more than one way to measure or set the 3 values:
1. Inhibitor VolumeThe volume of inhibitor can be measured by a meter installed in the output of the inhibitor pump(see Sidebar) or calculated by the number of strokes of a frequency controlled pump.
2. Tower Make-upTower make-up volume may be measured by the potable water make-up meter.The tower may also have grey water make-up from an RO or wastewater recovery stream measured by aseparate meter.Depending on the inhibitor feed method, you may elect to sum the gray water volume to the make-up meterOR sum the Make-up & gray meters, to a third, phantom meter.(Refer to 5.2 Copy_Volume)
3. Cycles of ConcentrationThe most accurate way to measure the Cycles value is to install a water meter on the bleed line,The ratio of the make-up volume to the bleed volume is the cycles of concentration.
If the tower make-up conductivity is constant, you can also use a fixed cycles of concentration since as long asyou are in conductivity control, the cycles of concentration is fixed by the bleed setpoint.
Sidebar:Accurate, positive displacement, 1mL/pulse Tacmina type meters may also be installed on the suction side ofhigher pressure, fraction HP pumps used for boiler feed.
Lower cost, stroke counters on the pump output may be accurate enough for inhibitor ppm calculations andwork very well for fail-to-feed alarms.
The calculated volume fed by frequency-controlled pumps may be accurate enough for calculating ppm withoutcalibration. Higher accuracy requires pumping from a graduated cylinder and calibrating the mL/stroke.

AEGIS Technical Manual
6/09 24Aegis_Tech
5.1.1 Calculation Method cont.
Calculating Inhibitor ppmSince the inhibitor feed system includes a make-up water meter, you will be controlling inhibitor based on towerload by volume-time (ON-OFF Pump) or volume-ppm (Frequency controlled Pump) setpoints.
The ppm of inhibitor in the tower water = 1000000 x Cycles x Inhibitor Volume / Make-up Volume
Example: If the tower has made-up 25,000 gallons today & you’ve fed 3500mLof inhibitor & you are running 2.5 cycles of concentration.
Inhibitor ppm = 92.5 = 1,000,000 x ( 2.5 x 3500mL ) / (3785mL/G x 25000G )
5.2.2 Configuration
Inhibitor Feed Meter: ’Chemical Volume’Enable anunused physical meter input in the ‘O’ to ‘V’ range and connect the 1mL/pulse feed meter or stroke counter to the enabled input.If you are feeding Inhibitor using a frequency controlled pump, you can use the pumped volume calculatedfrom the pump strokes x the mL/stroke in place of an actual feed meter.
In rare cases, you may be feeding inhibitor from more than one source, perhaps a frequency controlled pumpand a 1mL/stroke feed meter. If this is the case, use the ‘Copy Volume to’ configuration to copyboth inhibitorvolumes to a phantom volume input in the ‘W’ to ‘Z’ range.Then use the phantom volume as the ‘Chemical Volume’
The controller assumes inhibitor feed meter measures in mL, ignoring the user set units.
If you are using a pulse counter, calibrate the ‘Chemical Volume’ meter in mL. For example, if you are feeding at 0.1mL pulse, configure the pulse counter as a Turbine Meterwith a ‘K’ Factor = 10.
Tower Make-up Meter: ‘Make-up Volume’The ppm calculation converts make-up volume to mL based on the current System Units setting:US units converts measured make-up volume x 3785 mL/Gallon.Metric converts measured make-up volume x 1000 mL/L.
Typically meter input ‘O’ is used as the cooling tower or process make-up meter.If more than one meter is used for make-up, use the ‘Copy Volume to’ configuration to copy the make-upvolume to a phantom volume meter in the ‘W’ to ‘Z’ range.
Inhibitor ppm Input: ‘Calculate ppm’Enable an unused, phantom input in the ‘H’ to ‘N’ range.Use a phantom input because ppm is calculated and not a physical, wired sensor.
After you select ‘Calculate ppm’, you’ll need to select the ‘Chemical Volume’ and ‘Make-up Volume’ meter locations in the ‘O’ to ‘Z’ range.
If a bleed meter is available, set ‘Cycles method’ to ‘Meter Cycles’, otherwise select ‘Fixed Cycles’ and set ‘Cycles’ to the ratio of the Cooling Tower / Feedwater Makeup conductivities.
AEGIS Technical Manual
6/09 25Aegis_Tech
5.2.3 Operation
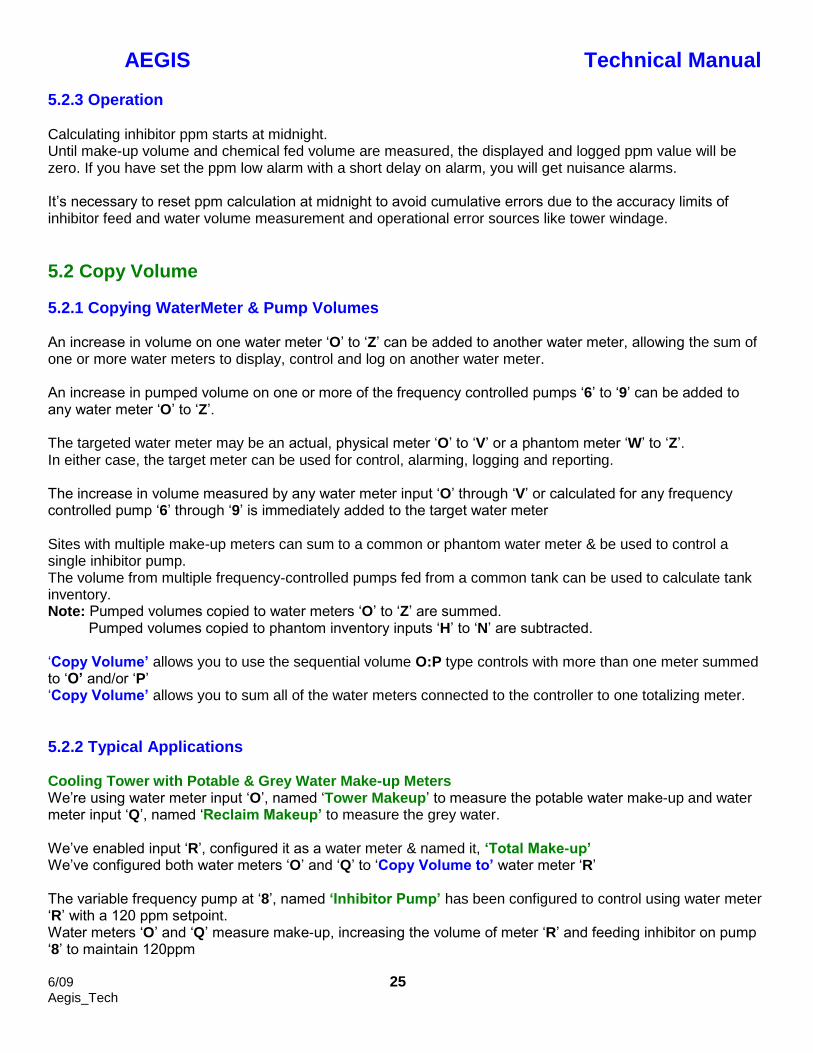
Calculating inhibitor ppm starts at midnight.Until make-up volume and chemical fed volume are measured, the displayed and logged ppm value will bezero. If you have set the ppm low alarm with a short delay on alarm, you will get nuisance alarms.
It’s necessary to reset ppm calculation at midnight to avoid cumulative errors due to the accuracy limits ofinhibitor feed and water volume measurement and operational error sources like tower windage.
5.2 Copy Volume
5.2.1 Copying WaterMeter & Pump Volumes
An increase in volume on one water meter ‘O’ to ‘Z’ can be added to another water meter, allowing the sum ofone or more water meters to display, control and log on another water meter.
An increase in pumped volume on one or more of the frequency controlled pumps ‘6’ to ‘9’ can be added to any water meter ‘O’ to ‘Z’.
The targeted water meter may be an actual, physical meter ‘O’ to ‘V’ or a phantom meter ‘W’ to ‘Z’.In either case, the target meter can be used for control, alarming, logging and reporting.
The increase in volume measured by any water meter input ‘O’ through ‘V’ or calculated for any frequencycontrolled pump ‘6’ through ‘9’ is immediately added to the target water meter
Sites with multiple make-up meters can sum to a common or phantom water meter & be used to control asingle inhibitor pump.The volume from multiple frequency-controlled pumps fed from a common tank can be used to calculate tankinventory.Note: Pumped volumes copied to water meters ‘O’ to ‘Z’ are summed. Pumped volumes copied to phantom inventory inputs ‘H’ to ‘N’ are subtracted.
‘Copy Volume’allows you to use the sequential volume O:P type controls with more than one meter summedto ‘O’ and/or ‘P’ ‘Copy Volume’allows you to sum all of the water meters connected to the controller to one totalizing meter.
5.2.2 Typical Applications
Cooling Tower with Potable & Grey Water Make-up MetersWe’re using water meter input ‘O’, named ‘Tower Makeup’ to measure the potable water make-up and watermeter input ‘Q’, named ‘Reclaim Makeup’ to measure the grey water.
We’ve enabled input ‘R’, configured it as a water meter & named it,‘Total Make-up’We’ve configured both water meters ‘O’ and ‘Q’ to ‘Copy Volume to’ water meter ‘R’
The variable frequency pump at ‘8’, named ‘Inhibitor Pump’has been configured to control using water meter‘R’ with a 120 ppm setpoint.Water meters ‘O’ and ‘Q’ measure make-up, increasing the volume of meter ‘R’ and feeding inhibitor on pump ‘8’ to maintain 120ppm

AEGIS Technical Manual
6/09 26Aegis_Tech
5.2.2 Typical Applications cont.
Two Frequency Controlled Inhibitor Pumps, One Inhibitor Tank LevelWe’ve enabled phantom input ‘J’, increased its resolution to 3 digits after the decimal & renamed it Inhibitor Tank.We’ve configured frequency controlled inhibitor pumps ‘6’ and ‘8’ to copy pumped volume to ‘J’ which automatically sets ‘J’ compensation to Inventory and puts 100 gallons (or liters) into the tank.
We’ve put 40 gallons of Inhibitor into the 55 Gallon tank and using the keypad, we’ve calibrated Inhibitor TankJ to read 40.000 gallons.We’ve set the Inhibitor Tank J Low Alarm = 10 Gallons & the High Alarm = 60with the Delay on Alarm = 0 minutes.
As inhibitor is pumped from either pump ‘6’ or ‘9’, the displayed tank volume on the LCD display and the browser view falls.At below 10 Gallons, an alarm shows on the LCD and the browser icon switches to the RED Alarm state.
5.3.3 OperationMeters targeted by ‘Copy Volume’ cannot be disabled OR changed to a contact type input.
A water meter or frequency controlled pump cannot be copied more than once.So you cannot copy meter ‘Q’ to both meters ‘X’ & ‘Y’. However two meters can be copied to a third meter anda fourth meter can be copied to a fifth meter up to the maximum of 12 meter inputs in any one controller
In the limit, 11 meters, ‘O’ to ‘Y’ can be copied to meter 12, ‘Z’. Note that 3 of the 11 meters, ‘W’ to ‘Y’ are phantom meters representing either rate-to-volume conversionsand/or volumes of frequency-controlled pumps.
NOTE:If the ‘Copy Volume to’ option does not appear, then this meter is the target of ‘Copy Volume’ and therefore cannot not be ‘Copied’ to any other meter, blocking an infinite count.
Diagnostic:Selecting Sensor/Diagnostic for a water meter that is the ‘Copy Volume’ target for another water meter or pump volume will display Status: Target Meter
Constraints:1. Any water meter used to sum volumes from other meters cannot be set to ‘Copy Volume’ to prevent
an inadvertent infinite count when you sum to a meter which ‘Copies’ to the originating meter.2. You cannot disable a water meter with ‘Copy Volume’ set or make it into a contact inputuntil you set
the ‘Copy’ compensation to ‘none’3. You cannot disable the target meter of a meter set to ‘Copy Volume’ until all of the meters targeting
the summing meter are either targeted on other meters OR have the ‘Copy Volume’ set to ‘none’4. Rate-to-Volume compensation volume incremental values are copied between water meters.5. All meters must use the same units to sum volumes or the sum has no meaning.

AEGIS Technical Manual
6/09 27Aegis_Tech
5.3 Feed Verify & Inventory
5.3.1 Methods
Any water meter input may used to verify flow while a pump, solenoid or valve is ON.Once the user set a time limit for an increase in volume expires, a ‘Fail-to-Feed’ alarm occurs.
Any water meter’s measured volume can be directed to any analog sensor input ‘H’ through ‘N’ and used to calculate tank inventory.
Volume Meters: Verify FeedChemical Pumps may have a precise 1mL/pulse positive displacement Tacmina type sensor on the pumpoutput tubing OR a switch on the pump outlet that provides a contact closure every time the pump strokes.Water Meters: Verify Bleed, Blowdown, Drawdown, Make-upContact head or turbine type water meters may be installed on make-up, bleed, drain or dilution piping to verifythat the valve or solenoid has operated or opened and flow is not blocked or valved off.
Tank InventoryThe volume measured by any water meter input ‘O’ through ‘V’ or calculated for any frequency controlled pump ‘6’ through ‘9’ is subtracted from the input used to display & log tank volume. .
When you add liquid to the tank, you tell the controller the new tank volume by Calibrating the sensor input ‘H’ through ‘N’ used as an Inventory target.Any sensor input or inputs ‘H’ through ‘N’ may be used to calculate volume.
If more than one pump is drawing from the same tank:1. Use the same Inventory sensor location for each pump & measuring meter2. Refer to the previous Copy_Volume application note.
5.3.2 Typical Feed Verify Applications
Verifying an Inhibitor FeedThe inhibitor pump controlled by relay 1, has a device on its output that provides a contact closure every timethe pump strokes. We’re going to use it to verify that we’re actually feeding inhibitor.We’ve enabled unused meter input ‘Q’, and named it Inhibitor Verify.
We’ve configured Inhibitor Verify Q with Compensation = Feed Verify and Verify Output = 1:Inhibitor.We’ve left the Wait-to-Verify at the default 30 seconds.
Each time the Inhibitor Pump turns ON, the controller verifies that a contact closure is measured by InhibitorVerify Q every 30 seconds or less. 30 seconds ensures that even at a low stroke rate, we’ll see a contact closure every 30 seconds unless we’ve lost prime, emptied the drum, blocked a feed…
If Inhibitor Verify Q does not measure a contact closure every 30 seconds while the Inhibitor Pump in ON,Q will alarm.

AEGIS Technical Manual
6/09 28Aegis_Tech
5.3.2 Typical Feed Verify Applications cont.
Verifying a BleedWe’re using the bleed in this example, but the same method can be used to verify that any valve or solenoid actually operated and flow is occurring.
Debris occasionally blocks the bleed & while we alarm on high conductivity we’d like to know as soon as the bleed fails.We’ve using the existing bleed meter input ‘P’, named Bleed Volume.
We’ve configured Bleed Volume P with Compensation = Feed Verify and Verify Output = 2:Tower Bleed.We’ve extended the Wait-to-Verify from the default 30 seconds to 300 seconds or 5 minutes.Bleed Volume P is a 10 Gallons/contact meter & it takes some time after the bleed opens to measure 10Gallons.
Each time the Bleed turns ON, the controller verifies that a contact closure is measured by Bleed Volume Pevery 300 seconds or less.If Bleed Volume P does not measure a contact closure every 5 minutes while the Bleed in ON, P will alarm.
Note: Feed verify compensation does not prevent meter P from being used elsewhere in the controller forcontrol, ppm calculations, O:P sequential feeds and P may be copied to other meters to sum discharge.

AEGIS Technical Manual
6/09 29Aegis_Tech
5.4 Frequency Controlled Pumps
5.4.2 Feed Rate Setting
The controller knows the pump’s mL/stroke and maximum stroke rate (Maximum SPM).Once you select the pump feed method or control mode, the controller sets the optimum Pump Speed.
Modes User Sets Pump Speed
SensorControlled
pH
ORP
TurnOFF :pH or ORP setpoint
100%ON :pH or ORP setpoint
Proportional control.
pH:As the tower cycles up, the pH rises.The acid pump is OFF at pH < TurnOFF.The pump speed increases linearly between TurnOFFand 100%ON setpoints.ORP:As the tower operates bleach is consumed and the ORPfalls.The hypochlorite pump is OFF at ORP > TurnOFFThe pump speed increases linearly between TurnOFFand 100%ON setpoints.
Water Meterppm
Controlled
Measure:Volume measured on meter
Feed:ppm of product to feed
The tower make-up meter measures volume.The controller turns ON the pump at Maximum SPM,adding the volume required to meet the ppm setpoint.Example: Measure 250 Gallons, Feed 125 ppm
Bleed& Feed
InhibitormL/minute setpoint Inhibitor Pump ON when Bleed Solenoid ON.
Bleedthen FeedInhibitor
mL/minute setpointInhibitor pump feeds at maximum SPM as soon as bleedsolenoid turns OFF.Volume fed proportional to time bleed solenoid ON.
BaseFeed mL/minute setpoint
Pump feeds at user set rate unless flowswitch turns OFFfeed.
BiocideFeed
Events
Start Day# & TimeFeed Volume Pumps user set volume at maximum SPM after Prebleed.
TimedCycling
User sets cycle period inminutes and ON volume in mL.
Pumps user set volume (1mL to 10L) at maximum SPMat the start every user set period if above TurnONsetpoint.
Contact SetControls
TurnON secondsTurnOFF seconds
TurnON@ user set seconds after contacts close &display ‘ON’Turn OFF user set seconds after TurnON .Fed at maximum SPM.

AEGIS Technical Manual
6/09 30Aegis_Tech
5.4.2 Technical: Frequency-Stroke Controls
1 Gallon = 3785 mL. Set pump frequency control to External & Stroke to 100%GPH = Gallons per hour GPD = Gallons per day
Pump Defaults–User Adjustment Range & ResolutionPump default mL/stroke is set for a 40psi head, typical for cooling tower chemical injection piping.The user mL/stroke adjust is limited to +25% and–70% for ProMinent pumps.The user mL/stroke adjust is limited to 0.01mL/stroke and 10ml/stroke for ‘Other’ type pumps.In both cases the adjust resolution is 0.01mL
‘Other’ type Pump spm rates are limited to a minimum of 50 spm and a maximum of 400 spm
Maximum Feed RateA pump’s maximum feed rated is it’s rated maximum strokes/minute x mL/stroke.Example: A ProMinent 1602 pump is rated 180spm with a default of 0.24 mL/stroke
The maximum feed rate for this pump = 180 x 0.24 x 60 = 2592 mL/hour,0.685 GPH, 15.44 GPD
At the–70% minimum user adjust: 0.78 L/hour, 0.2 GPHAt the +25% maximum user adjust: 3.24 L/hour, 0.856 GPH
Minimum Feed Rate or Turn DownThe minimum pump frequency is set to 0.1 SPM; a turn down of 1800:1 for a 180 SPM pumpand 2400:1 for a 240 SPM pump.The 0.1 SPM limit turns the pump drive LED ON for 5 minutes and OFF for five minutes; a maximum for anobserver visually verifying that a pump is stroking.
Minimum feed rate only applies to pumps that are controlled by analog sensors; pH, ORP, temperature, flowrate… Other pump controls operate at either the user set mL/minute or MAX SPM, so minimum feed rate is notapplicable.
Control ResolutionControl resolution = 1mS. I 1mS defines the precision of variable frequency controlExample: At 180 spm, a 1mS control resolution is 667 feed rates
At 10 spm, a 1mS control resolution is 6000 feed rates
As the example clarifies, control resolution is more important at high pump speeds.Between 179 and 180 spm, there are 667 possible feed rates.
For a pump operating at 400 spm, the control resolution 150 feed rates
Setpoint ResolutionSetpoints for ‘Base Feed’, ‘Bleed & Feed’ and ‘Bleed then Feed’ mL/minute have 0.01mL resolution.The resolution limit matches the user adjustable mL/stroke resolution
Setpoints for ‘ppm’ are integers.Setpoints for volume meters are integers @ user set resolution.Setpoints for biocide feed volumes are 0.01G resolution.

AEGIS Technical Manual
6/09 31Aegis_Tech
5.4.2 Technical: Frequency-Stroke Controls cont.
Setpoint Range ResponseWhen the user adjusts the mL/minute feed setpoint OR selects a new pump OR adjusts the pump mL/strokesetting, the controller verifies that the new setting or pump can deliver the required feed rate.
If the pump cannot deliver the required feed rate to meet the current setpoints, the controller sets the pump toits maximum feed rate and notifies the user that the pump is maxed.
Volume AccuracyFor most applications, the default mL/stroke accuracy is applicable since users will adjust feed rates based onwet chemistry test results. In this context, repeatability and linearity are more important for concentrationcontrol than mL/stroke accuracy.
Error sources extend beyond the pump control accuracy to the precision of feed chemical blending, wetchemistry test accuracy & resolution …
1. If your wet chemistry shows a 10% higher than expected ppm. Lower the mL/stroke setting for theinhibitor pump by 10%. Don’t change the feed setpoints.
2. If you are interested is tracking down ppm error sources, start by pumping 100mL from a graduatedcylinder and adjusting the pump mL/stroke to correct for the displayed increase in volume pumped.
5.5 Password Security
5.5.1 Overview
AEGIS controllers use 4 levels of password for controller access and to stamp the activity log:Public Operator Maintenance AdministratorRefer to Section 6.5.4 for default user IDs and passwords.
Passwords are defaulted OFF for keypad users and ON for browser users.Passwords cannot be turned OFF for browser users.
There are 7 user configurable passwords which are distributed between Operators & Configurers.
Passwords are a maximum of 9 letters and numbers and are case sensitive. The controller blocks the use ofHTML delimiter characters by limiting password content to letters and numbers only.
The controller blocks duplicate passwords since the password identifies the user on keypad log in.

AEGIS Technical Manual
6/09 32Aegis_Tech
5.5.2 Password Level Activities
Password Level Activities Notes
Public
1 per AEGIS
Views current state and clears alarms,select System or Diagnostic view.
Cannot adjust or edit.
Password not required for keypad orbrowser use.
Browser access to controller wide alarmreset only.
Operator
1..7 per AEGIS
default 4
Calibrate sensors. Prime Pumps.Set 4 & 20mA levels.
Changes setpoints and feed rates.
Can view but not edit all controllerconfigure level settings
Can edit own user ID & password.
Keypad users, password only editing.
Controller default user ID is Operator1 thruOperator4 with default passwords 1..4.
Configure
1..7 per AEGIS
default 3
Configure controls, interlocks andblocking.
Sets sensor compensation, feedalarms & limits.
Sets biocide timing, Prebleed, Lockout& cycle days.
Zeroes water meters
All Operator Activities
Can edit own user ID & password.
Keypad users, password only editing.
Controller default user ID is Configure5 thruConfigure7 with default passwords 5..7.
Administrator
1 per AEGIS
Set IP address and networkparameters.
All Operator & Configure Activities
Browser: Can define other users asOperator or Configure
Cannot view other users passwords.
Can edit own password, default ‘AAAA’
Cannot edit ‘Admin’ user id

AEGIS Technical Manual
6/09 33Aegis_Tech
5.5.3 Browser Passwords & Lockout
After 5 unsuccessful attempts to log on, the controller locks out both Ethernet and modem accessLocked out users will see an Alarmed status message in place of Password Incorrect .
Browser & modem resets at 7:00AM or when AC power OFF/ON.Therefore the maximum lockout time is 24 hours and the minimum is less than a minute.
This feature blocks scripting attacks on controllers and cannot be disabled.There is no limit on the number of keypad password attempts.
Changing all passwords from their default values is strongly recommended for Ethernet and modem connectedcontrollers.
Passwords can be reset to the factory default by logging on as the Reset Pswrds user.Refer to Section 6.5.5
5.5.4 LCD Passwords
Passwords are defaulted OFF for keypad users.
The System/Password menu item does not display unless System/Configure has turned passwords ON.Once passwords are turned ON, only the administrator can access System/Configure to turn Passwords OFF
If passwords are ON, you are prompted with the required password level; Admin / Configure / Operate whenyou attempt to execute a command which reconfigures the controller.Passwords are not required to view the current state.
Default Passwords & User IDsUser Type User ID Default
PasswordOperator Operator1
Operator2Operator3Operator4
1234
Configure Configure5Configure6Configure7
567
Administrator admin AAAA
Kepypad-LCD access cannot change User Type or ID.
NOTE1: If you are going to use keypad passwords, your first action after turning passwords ON should be tochange the admin and all other passwords since leaving any password at it’s default value bypasses password protection.NOTE2: Only the ‘admin’ user can load a new controller view-configuration.

AEGIS Technical Manual
6/09 34Aegis_Tech
5.5.5 Password Reset
Contact Aquatrac with the controller serial number to obtain a reset password which resets all passwords tothe Section 5.5.4 factory defaults.Proof of controller ownership is understandably required.AEGIS controllers have no backdoor or super user password.If you forget the password, this is the way to recover controller access.
5.6 Relay & Frequency Controls Comparison
ON/OFF Controls :Relays R1 to R5 are used for ON/OFF controls.The relay switches 120VAC ON or OFF, powering pumps, solenoids and motorized valves.
Frequency Controls :P6 to P9 pulse outputs control pump frequency. The pump is always plugged into an AC supply and thepumping rate is set by the frequency of pulses from the controller.
Modes Frequency Controls ON/OFF Controls
ControlSetpoints
Sensors:Setpoints are TurnOFF & 100%ONProportional variable frequency control.Meters:Setpoints are ppm & volume.Contact Sets: See Notes 1Setpoints are seconds& feed volume In mL100%ON @ user set seconds after contactsclose then feed setpoint volume.
Sensors:Setpoints are TurnOFF & TurnONRelay is OFF or ON.Meters:Setpoints are volume & ON time.Contact Sets: See Notes 1Setpoints are seconds.TurnON@ user set seconds after contactsclose.Turn OFF user set seconds after ON.
ControlEquations
Up to four SensorsOR up to four Water metersOR one Contact Set.Sensors may use ‘+’,’-‘,’x’ or ‘/’ operators.Watermeters may use ‘+’, sum operator.
Up to four SensorsOR up to four Water metersOR one Contact Set.Sensors may use ‘+’,’-‘,’x’ or ‘/’ operators.Watermeters may use ‘+’, sum & ‘:’, sequential operators.
TimedEvents
User sets event volume.Event ends on volume fed
User sets ON time.Event ends when time elapsed.
DataLogging
Logs volume fed in each log interval Log ON time in each log interval
FeedLimits
Limit = Volume per Feed @ MAX SPMLimit = Volume/Day Notes 2
Limit = Time ON per actuationLimit = Time ON /Day Notes 2
Failto Feedor Bleed
A watermeter input must measure a countevery user set seconds at any non zerocontrol frequency. Notes 3
A watermeter input must measure a countwithin a user set seconds of turning on thecontrol relay. Notes 3
ControlMethod
‘Aways’ OR‘During Events’
Rising, Falling & Between setpoints.ORRising, Falling & Between during events.

AEGIS Technical Manual
6/09 35Aegis_Tech
5.6 Relay & Frequency Controls Comparison cont.
Modes Frequency Controls ON/OFF ControlsBlocking Up to 4 Relay or Frequency controls may
block .Blocks on any Relay ON or any Frequencyat a non-zero SPM.
Up to 4 Relay or Frequency controls mayblock .Blocks on any Relay ON or any Frequencyat a non-zero SPM.
Interlocking Up to 4 Contact Sets may interlock..Contact Sets may be ORed or ANDed
Up to 4 Contact Sets may interlock..Contact Sets may be ORed or ANDed
Bleed &Feed
User sets mL/minute.Feed ON when bleed ON.Controller blocks setpoints greater thanpump mL/min x MAX SPM
Feed ON for user set % of every 5 minutesthat bleed is ON
Bleed thenFeed
User set mL/minute on Bleed ON time tocalculate volume owed.Feeds at MAX SPM when bleed turns OFF
User sets % of 5 minutes of each bleed ONtime.Feeds after bleed turns OFF.
% Timeor
‘Base Feed’
User set mL/minuteController blocks setpoints greater thanpump mL/min x MAX SPM
User sets % of every 5 minutes ON time.
PreBleedLockout
User sets Prebleed time & conductivitylimits.User sets Lockout time.
User sets Prebleed time & conductivitylimits.User sets Lockout time.
CapturedSample
Not applicable User sets SAMPLE, MEASURE,BLOWDOWN & WAIT times.
TimeModulation
Not applicable Pump ON time reduced as sensorapproaches TurnOFF setpoint.
TimedCycling
User sets cycle period in minutes and ONvolume in mL.
User sets cycle period in minutes and ONtime in minutes.
HoldingTime
User sets holding time in minutesSensor value averaged over the holdingtime.
User sets holding time in minutesSensor value averaged over the holdingtime.
FeedVerification
Meter control. Not applicable to PumpsNotes 3
Meter control. Not applicable to RelaysNotes 3
VariableCycles
Not applicable User sets three cycles of concentrationsetpoints and a maximum conductivity.
Pump TypeSelection
User selects Pump Type which sets defaultmL/stroke & Max. SPM..‘Other’ type allow user to set MAX SPM.All types allow user to modifymL/stroke.Checks that existing feed rates are possiblewhen user changes pumps or set to MAXSPM and alarm message if feed ratemodified.Pump changes update the event log.
Not applicable
CopyVolume to
Sums to water meters.Subtracts from Sensors (Inventory)Notes 4
Not applicable

AEGIS Technical Manual
6/09 36Aegis_Tech
5.6 Relay & Frequency Controls Comparison cont.
Notes1. Contact Sets
Runs once per controlling contact closure.In addition to being able to use Contact sets to turn ON & OFF relays and frequencycontrols, contact sets can have the following compensation:Mirror:Contact set Closed when user set output ON and OPEN when output OFF.May be used with phantom contact sets U to Z.If used with inputs O to T, the physical input is ignored by the controller.Invert ON/OFF:Switches the logical sense of the contact set so you can control on contacts openingand if you also select Mirror, a relay turning OFFApplications: Allows a control only when relay changes stateFlushing or priming feed headers.Day tank fill, drain, filter backwash or mixer sequence controlsNeutralization timing controls.
2. Feed LimitsUsers may set OFF on Alarm, turning OFF a Relay or Frequency on limit.Users may also set Midnite Reset to reset a feed limited output at midnight
3. Feed Verify Bleed VerifyUsers may set Feed Verify compensation on any water meter by selecting the Relay orFrequency output and the Wait-to-Verify delay to alarm in seconds.Allowing a variable delay to alarm widens applications and supports very low feedrates.User selects Verify Output pump, valve or solenoid.User selects optional Inventory Location and fed volume is subtracted from the tankvolume.
4. Copy Volume toUsers may copy the volume pumped to any water meter input, summing the pumpedvolume with the meter-measured volume.Meters may also be copied to other metersInventoryUsers may also copy the pump volume to a sensor input where the volume pumped issubtracted from the tank volume.More than one frequency controlled pump volume may be subtracted from a singletank.

AEGIS Technical Manual
6/09 37Aegis_Tech
5.7 System Alarms & Indicating LEDs
5.7.1 System AlarmsAlarms not specific to any sensor or control.
Name Alarm Message & Cause EffectRelay 1-5 Fuse “Fuse opens”
AC line Fuse faults, opens@ 5 Amps to the solenoids, valves &pumps powered by Relays 1 to 5
120-230VAC Pumps, solenoids & valves OFF.Data logging on R1 to R5 shows zero ON time.Variable frequency controls continue to operate.
15VDC External “Low Alarm”Wiring errors or a fault on any sensorpowered by the controller 15-20VDC‘DC Power Output’ supply
Correct wiring. Remove defective sensor.15VDC thermal fuse auto-recovers.While alarmed: sensors, meters and current loopspowered by the 15VDC supply will not operate.
Internal 2.5V “Out of Range”Sensor, meter or contact set wringerror or driver card fault.
Used to auto-calibrate all sensor measurements toremove power supply drift error.All sensor measurements stop auto-calibration.
Power-on fault “Controls Removed”One or both sensor driver cards havebeen removed or type changed.
The pump or solenoid controlled by the removedsensor turns OFF. Re-configure the control.
5.7.2 Indicating LEDs
Name Location Function
Running Front Measure boardRight side center
ON when the controlling processor on the upper measure circuitboard is communicating with processor that measures watermeters and contact sets and supports a USB connection..OFF when the USB password is accepted & the controller isOFFLINE.
RUN Back Power boardabove the NEUTRALSwiring block
ON when the controlling processor on the upper measure circuitboard is communicating with the lower power control processor.ON when the AC line fuse powering R1 to R5 is NOT open.OFF when the USB password is accepted & the controller isOFFLINE.
R1, R2R3, R4R5
Lower Power boardAbove Relay1 to Relay5AC wiring terminals
ON whenever the Relay is ON.ON when the NO wiring terminal is at the AC power voltage.
P6,P7P8,P9
Lower Power boardAbove Pump6 to Pump8controlCable terminal
ON for 50% of the pump frequency period.Mirrors the time that the electronic contact set pulsing the pumpis closed.Example: A pump running at 10 SPM would have it’s indicating LED on for 3 Seconds and OFF 3 Seconds since 10Strokes/Minute is a 6 second period & 5.5% of rated for a180SPM rated pump.
LCD Backlight ON when the controller is AC powered and its internal 5VDCsupply is @ 5VDC.

AEGIS Technical Manual
6/09 38Aegis_Tech
5.8 Units for Volumes & Temperatures
5.8.1 Metric–US Units Selection
Controller units are selected by the Metric/US Units keypad and/or browser switch.
Although the increasing use of ppm controls and frequency controlled pumps moves more sites to Metric units,the familiarity with gallons of feedwater make-up and GPM recirculation rates indicates that sites will continueto use both unit systems.This application note details how the controller applies the Metric/US Units switch setting.
Warning: Sensor values, meter and pumped volumes are logged with the units applicable at the time of logentry. Typically the Metric/US Units switch is set once, when the controller is commissioned, since changingunits causes problems with interpreting data logs, & adjusting feed, timeout and alarm setpoints.
5.8.2 Water Meter Volumes
The measured and displayed water meter volumes, volume per contact, K Factor and the high and low alarmsare all in the units set by the Metric/US Units switch.
Although the user set units for each volume meter and sensor input are ignored, you may mix volume units aslong as you don’t combine volumes measured with different units.
US Units: All volumes measured in Gallons.Metric: All volumes in Liters
Zeroing a Water MeterSwitching a water meter to a contact set and then back to a water meter will zero the meter and set the defaultunits to L or Gal, depending on the Metric/US Units switch.
Rate-to-VolumeThe rate displaying on the sensor input converts to a volume based only on the Rate Minute / Rate Hour switchsetting. If you are measuring rate in GPM or LPM then the volume logged by the target water is in Gallons orLiters respectively.Note that in both examples the volume units are set by the measured rate units and not by the Metric/USUnits switch.
Example1: A stream demand meter measuring 1200 lbs/hour, would increase the volumeon the target meter by 20 lbs per minute, 28,800lbs/day.Set the units on the target meter to ‘lbs’.
Example2: An RO waste meter measuring 10 GPM, would increase the volumeon the target meter by 10 gallons per minute, 600 gallons for every hour.Set the units on the target meter to ‘gal’.

AEGIS Technical Manual
6/09 39Aegis_Tech
5.8.2 Water Meter Volumes cont.
Copy Volume to:Copying between water meters uses the units set by the Metric/US Units switch.Copying a volume from a frequency controlled pump to a water meter converts mL to Gallons if the Metric/USUnits switch is set to US Units.Copying a volume from a frequency controlled pump to a an Inventory sensor input, converts pump mL toeither Liters or Gallons depending on the Metric/US Units switch setting.
5.8.3 Pump Volumes
Frequency controlled pump volumes are measured in mL.The Metric/US Units switch selects the display units for volumes greater than 100mL.
Frequency controlled pumps are specified in mL/stroke with mL/stroke calibration limits enforced by thecontroller.
Unit Conversion: mL to Gallons multiply mL x 0.0002642Liters to Gallons multiply L x 0.2642
5.8.4 Inventory Volumes
Tank inventory volumes are calculated using the units set by the Metric/US Units switch.The user set units for a sensor input ‘H’ to ‘N’ used for Inventory are ignored.
The controller converts the mL pumped by the frequency controlled pumps to either Gallons or Liters,depending on the setting of the Metric/US Units switch.
If you are using a water meter input volume to calculate inventory, the controller assumes that the meter ismeasuring in mL. The controller converts the measured mL to Gallons or Liters prior to adjusting the inventorylevel.
If you are using pumped volume from a frequency controlled pump to calculate inventory, the controller appliesthe correct conversion when calculating inventory based on the setting of the Metric/US Units switch.

AEGIS Technical Manual
6/09 40Aegis_Tech
5.8.5 1mL/Pulse Meters
In addition to the Tacmina 1mL/pulse feed meters, there are a number of devices and some pumps, whichprovide a contact closure or pulse on pumped volume. In all cases, the controller assumes that the volumerepresented by the pulse or contact closure is measured in mL.
Set the Volume/contact for the Tacmina or volume measuring device to the correct mL value.The controller will make the correct assumptions.
The mL assumption is required for two controller sensor compensations & not required for type of control:1. Inventory: The drum or tote volume is reduced as the volume meter measures.2. ppm: The volume of inhibitor pumped in mL is used to calculate ppm using the volume of make-up (in
Gallons or Liters) and the cycles of concentration.3. Sequential Meter Feed: The O:P sequential control equation may use either a Tacmina type volume
meter(mL) or a bleed meter(L or Gallons) for meter‘P’. In either case, control is unaffected by eithervolume meter’s units.
Warning: Do not sum volume meters with different units. The result is meaningless.For example you can sum make-up meters and you can sum feed verify meters, but you cannot sum aMake-up meter (Gallons or Liters) and a Feed Verify meter (mL).
5.8.6 Temperatures
Temperature default units are set by the Metric/US Units switch for each input, which measures a temperatureand is then used for each conductivity or pH sensor, which may be temperature compensated.
Default offsets & gains for thermal sensors are set to the defaults corresponding to the Metric/US Unitsswitch.
US Units: Temperature units = ‘F’. Metric: Temperature units = ‘C’.
Warning: Remember that even if you change the default units on a temperature input, the controller internallyapplies the units set by the Metric/US Units switch.
Aquatrac strongly recommends that you do not change the default units on any temperature used for control orfor temperature compensation of conductivity or pH. Errors in both temperature calibration and tracking overtemperature for conductivity and/or temperature compensated pH will result.
5.8.7 User Assigned Units
User assigned units have no effect on controller volumes, inventory, ppm and temperature compensationcalculations.
You are free to assign whatever units you wish and to mix unit types in any one controller bearing in mind howthe controller handles unit conversions in Metric & US Units modes.
If you need to override the units on any input, you can edit the OFFSET & GAIN that’s applied to the target input.

AEGIS Technical Manual
6/09 41Aegis_Tech
5.9 XML: URL Encoded Requests
This application note details the syntax used for URL encoded XML data log upload commands.
URL encoded commands are formatted as: URL/taco.cgi?F0 = Field0Value & F1 = Field1Value …. Where URL = IP address of the AEGIS controller.
Example using the AEGIS default IP: http//10.10.6.106/taco.cgi?F0=CL&F1=AAAA&F2=GLogs in as admin & requests Sensor Input ‘G’ log using the default value for F3
Command Command# : Syntax : Password Function & notes
CL CL: Communications LogF0 F1CL [ Password ]
F2[ I/O A..Z or 1..9 or 0 = system ]
F3[ Report Type, Defaults to log ]
F4[ Number of log entries ]
F1 Any valid password @ Operate, Configureor Admin level. Password also logs into thecontroller by setting the userid cookie. Onevalid password provides both log & browseraccess.
F2 Inputs A..Z as caps. Outputs 1..9Defaults to zero & system
F3 No F3 value gets the log for an I/Oor default System report.
F4 No F4 value gets all entriesMost recent entry first allows data baseupdates based on log period & mostrecent data base entry.
Action on incorrect password: XML Header only confirms command rec’d. No controller data sent.Five incorrect passwords disconnect until 7:00 AM. Identical to password response on browser log-inAction on disabled I/O: XML header only.
F3Value
F2 Field Notes
0or ‘none’
F2 = A..Z, 1..9Header & Data logF2 = 0, System 35 Character enabled string ‘A..Z1..9’ With disabled I/O as ‘spaces.
Alarmed I/O string + ‘SYS’ if System Alarmed
Data logs are most recent first.
Request enabled parameters first ashttp//10.10.6.106/taco.cgi?F0=CL&F1=AAAA&F2=0
Non-zero F3 values will be used for futurereporting.
Action on illegal F3 values: Same response as zero or ‘none’.

AEGIS Technical Manual
6/09 42Aegis_Tech
6. Applications
6.1 Adjusting Inhibitor Feed with Varying Cycles
6.1.1 Problem
Varying Cycles changes the cooling tower cycles of concentration as the make-up conductivity varies.You are likely to require more or less inhibitor feed at different cycles of concentration.This application explains how to adjust the inhibitor feed rate as the make-up conductivity varies.
The inhibitor is fed proportional to make-up or bleed volume, controlled by a make-up or bleed water meter.As the load on the tower increases, more water is required & more inhibitor is fed to maintain a constant, targetppm in the recirculating cooling water.
Note: This solution can be generalized to applications where you need to use a continuously reading sensor( temperature, pH, corrosion rate, ORP…) to modify a feed rate based on an incremental volume measurement.
6.1.2 Setup: Controller Configuration
I/O Usage Function, Configuration Notes
‘O’ Tower Make-up Measures make-up water volume. Use ‘P’ if bleed meter controlling inhibitor
‘E’ Make-up Cond. Measures make-up conductivity.
‘6’ Inhibitor Pump Controlled by ‘E’.Interlocked by ‘X’
Setpoints reflect the expected range ofmake-up conductivity.
Use ‘1’ if ON/OFF inhibitor pump
‘9’ Feed Track Unused pump controlled by ‘O’ Set the pump ‘9’ and pump ‘6’ pump types to be the same so that both max. SPM &ml/stroke match.
‘X’ Feed State ON when ‘9’ Feed Track ON‘X’ is configured to mirror ‘9’
‘Mirroring’ turns ON ‘X’ whenever ‘9’ is ON.
‘X’ is a phantom input enabled to track the state of pump ‘9’.

AEGIS Technical Manual
6/09 43Aegis_Tech
6.1.3 Solution
We configured the Aegis controllers as detailed in Section 6.1.2 & now we’ll add site specific setpoints.
Example: We expect the tower make-up conductivity to vary between 500uS and 100uS.At 500uS we need to feed @ 50ppm and at 100uS we need to feed at 20ppm.
Control Configuration Notes
‘9’ Feed Track Measure volume = 100 GallonsThen feed = 50 ppm
Set to the feed rate @ 500uS, the maximummake-up conductivity
‘6’ Inhibitor Pump 100% ON = 500uSTurn OFF = -167 uS
Setpoints are uS but the difference betweensetpoints is set by the target ppm range.
When the make-up conductivity is 500uS, pumps 9 & 6 feed the same amount; whatever’s required to maintain 50 ppm of inhibitor.
At 100uS we need to feed 20ppm which is 20/50 or 40% of the 500uS rate.The full range of control from 0% to 100% is therefore (500–100) / 0.4 = 667uS.If 500uS is 100% than 0% = 500uS–667uS = -167uS.
Let’s check:At 300uS we should be feeding @ 35ppm or at 70% of the 50ppm rate.Actual pump speed = (300 +167) / 667 x 100% = 70%., OK!
6.1.4 Summary & Options
We’re using a sensor value to modify the feed rate of a chemical fed proportional to a water meter volume.
We’ve used a simple example however there are many permutations that add flexibility:A. You could frequency limit one of the pumps by setting it’s type to ‘other’. Handy if all you have is an
oversized pump & usually preferred over reducing the stroke.B. You can modify the ml/stroke for the Feed rack and/or Inhibitor Pumps.C. You can control the Inhibitor pump on the difference between Temperature & Make-up Conductivity. As
the temperature increases, the difference decreases & you feed more inhibitor.

AEGIS Technical Manual
6/09 44Aegis_Tech
7. Sensor Driver Card Manuals
7.1 CT: Conductivity TemperatureSafety5 VDC, 1V AC maximum on field wiring terminals.24 VDC maximum on internal card surfaces.
7.1.1 InstallationServicesThe CT driver measures conductivity and temperature, connecting to a single immersed sensor.Usually the sensor is installed in a cooling tower recirculating loop, although thermally compensated sensorsmay be installed in condensate streams, RO piping, downstream of sample coolers on boiler blowdowns…Up to 2 CT’s may be installed in an Aegis controller in addition to the fixed ‘A’ & ‘B’ inputs which can be configured to be a third CT driver.Thermal compensation of conductivity is provided by the controller software.
Card Installation1. Turn OFF the controller AC power2. CT driver cards may be installed in either the Sensors ‘C’ & ‘D’ or Sensors ‘E’ & ‘F’ slot.3. Turn ON the controller after installing the CT Driver and the controller will auto-configure, displaying both
conductivity and temperature on the LCD display and browser.
Sensor TypesAquatrac type A261200, A261205 cooling tower and A261016 hot water, boiler-condensate sensorsThese sensors contain a 10mV/K type sensor rated up 125C.
Sensor Wiring
Conductivity sensor cabling may be extended up to 200ft /60m, using two pair AWG22 / 0.25 mm2, cable spliced tothe sensor cable using wire nuts or crimped connectorslocated in an electrical fitting or enclosure.
Do not install sensor cabling in the same conduit as ACpower cabling.
Conductivity sensor cabling may share a commonconduit with other sensors, water meter and contactset cabling.
S+ S- T+ T-
Part: CT
Conductivity&
Temperature
>100uS
Conductivitiesgreater than 100uS
ConductivityTemperature
Sensor
Rd Bk Wh Gn
<100uS
Conductivitiesless than 100uS( Install jumper )
>100uS
<100uS
>100uS
<100uS
Red to S+Black to S-White to T+Green to T-

AEGIS Technical Manual
6/09 45Aegis_Tech
7.1.2 Configuration - Operation
Range Selection
Cooling towers–Waste Water–RO Streams:The default range for the CT driver is >100uS. Installing a jumper on the>100uS pins does not change the default range. Use this range forconductivities from 200uS to 20,000uS.
Condensate–Low Conductivity:Jumper the <100uS pins for conductivities in the 1 to 100uS range.Constant pressure condensate conductivities may also be measuredwith the single or dual B driver using sensors without thermalcompensation.
Changing Ranges:Turn the controller OFF before changing rangesControllers check range on power up, loading defaultOffset and Gain on range change.
S+ S- T+ T-
Part: CT
Conductivity&
Temperature
>100uS
Rd Bk Wh Gn
<100uS

AEGIS Technical Manual
6/09 46Aegis_Tech
7.1.2 Configuration–Operation cont.
Diagnostics: Conductivity Input
Parameter LCDDisplay
Browser Value : Use
Sensor Location OK C: Installation slot. LCD displays slot letter on screen.Input Card Type OK OK Conductivity: verifies driver card typeCurrent State OK OK Operational / Alarmed:Displayed Value OK OK 1088 uS: Current measured conductivity, display user set units,
‘uS’ default. Displayed with user set resolutionPeriod Maximum OK 1094 uS: Data from current log interval. Used to assess
controls.Period Minimum OK 1082 uS:Period Average OK 1086 uS:Sample Size OK 426: Samples in Period Max. Min. & AverageCurrent Period OK 36 minutes: Elapsed time in current log periodLog Period OK 60 minutes: User set log period 5 to 1440 minutesCompensation OK OK Thermal Compen. / None:Measured Level OK OK 184.9 mV: Raw sensor level in mV, before Gain & Offset after
ID Level correction.Gain Multiplier OK OK 5.6420: Calibration adjusts Gain. Displayed Value = Measured
Level x Gain Multiplier + Offset AdjustThermal Compensation is applied after Gain & Offset if selected
Default Gain OK OK 5.6000: Factory default Gain. Gain selected by Input Card IDOffset Adjust OK OK -35.0000: Offset. May be user adjusted.Default Offset OK OK -35.0000: Factory default Offset. Offset selected by Input Card
IDInput Card ID OK OK 77 mV: Drive level at >100uS range. Design level = 75mV.
1007 mV: Drive level at <100uS range. Design level = 1005mV.Drive Level OK 0.0 mV: Unused in CT driver.
Range Default Gain CalibrationGain Span
Default Offset
>100uS 5.6 2.5 to 10 -35<100uS 0.4 .25 to .55 -10
Calibration: A calculated gain outside of the Calibration Gain Span requires a user selected Override tocomplete calibration.
Driver Verification Test:Connect 1K ohm resistor to ‘S+’ & ‘S-‘. Set Range to ‘>100uS’. Measured Level = 187.5mV +/-5mV

AEGIS Technical Manual
6/09 47Aegis_Tech
7.1.2 Configuration–Operation cont.
Diagnostics: Temperature Input
Parameter LCDDisplay
Browser Value : Use
Sensor Location OK D: Installation slot. LCD displays slot letter on screen.Input Card Type OK OK Temperature: verifies driver card typeCurrent State OK OK Operational / Alarmed:Displayed Value OK OK 78.47 F: Current measured conductivity, display user set units,
‘F’/’C’ are defaults. Displayed with user set resolution.‘Metric’ switch selects ‘C’ as default.
Period Maximum OK 78.55 F: Data from current log interval.Period Minimum OK 78.30 F:Period Average OK 78.45 F:Sample Size OK 1320: Samples in Period Max. Min. & AverageCurrent Period OK 37 minutes: Elapsed time in current log periodLog Period OK 60 minutes: User set log period 5 to 1440 minutesCompensation OK OK None:Measured Level OK OK 2988.1 mV: Raw sensor level in mV, before Gain & Offset.
10mV/K = 298.8K, 25.8CGain Multiplier OK OK 0.18: Gain. May be user adjusted.Default Gain OK OK 0.18: Factory default Gain. Gain selected Metric switch.
Metric Default Gain = 0.1Offset Adjust OK OK -461.4: Calibration adjusts Offset. Displayed Value = Measured
Level x Gain Multiplier + Offset Adjust. .Default Offset OK OK -459.4: Factory default Offset.
Offset selected by Input Card IDMetric Default Offset = -273
Input Card ID OK OK 3003 mV: Ignored by controller, card ID set by conductivityinput.
Drive Level OK 0.0 mV: Unused in CT driver.
Units Default Gain CalibrationOffset Span
Default Offset
F 0.18 -430 to–590 -459.4C / MetricOption Set
0.10 -253 to -293 -273.0
Calibration: A calculated offset outside of the Calibration Offset Span requires a user selected Override tocomplete calibration.
Driver Verification Test:Connect 1K ohm resistor to ‘T+’ & ‘T-‘. Measured Level = 680 +/-5mVMeasured Level = 680uA thermal sensor drive x 1K ohm

AEGIS Technical Manual
6/09 48Aegis_Tech
7.1.3 Specifications
Range / Function Drive>100uS100–10,000uS
Resolution: 1uSAccuracy: +/-5uS
75mV AC
>100uS10,000 - 20,000uS
Tracks reduced resolution& accuracy
75mV AC
<100uS1-100 uS
Resolution: 1uSAccuracy: +/-1uS
1005mV AC
Temperature32–250F0–125C
Resolution: 0.1F / 0.1CAccuracy: 1 F/C
Temperature compensation ofconductivity is %/Degree from 70For 20C
680uAConstant current.5 VDC MAX.
Notes:1. Accuracy stated after sensor calibration.2. Excludes errors due to extending sensor cabling.
7.1.4 Revisions
Date Revision5/31/07 Corrected 1.4 Sensor Wiring color coding to match corrected
driver card text.Actual text on CT driver cards is correct and unchanged.Previously, text inverted WHITE & GREEN
7/2/08 Reformatted for Aegis manual

AEGIS Technical Manual
6/09 49Aegis_Tech
7.2 CT: Boiler ConductivitySafety250mV AC maximum on field wiring terminals.24 VDC maximum on internal card surfaces.
7.2.1 Installation
ServicesThe B driver measures one or two conductivities.Each of the two sensor drives may be jumper configured for boiler or condensate conductivity measurement.Up to two dual or single ‘B’ drivers may be installed in an Aegis controller.
Driver Card Installation1. Turn OFF the controller AC power2. The single and dual B driver cards may be installed in either the Sensors ‘C’ & ‘D’ or Sensors ‘E’ & ‘F’ slot.3. Turn ON the controller after installing the B Driver and the controller will auto-configure, displaying one or
both conductivities on the LCD display and browser.
Sensor TypesAquatrac type A261000, A261001 & A261CHP boiler-condensate sensors
Sensor Wiring
Sensor 1Sensor 2 Sensor 1
Sensor cabling isnot polarized
Part: OP
pH or ORP
S1 S1 S2 S2Part: B
CN
D
BL
R
Sensor 2
CN
D
BL
R
Sensor 1
Boileror
Condensate
S1 S1 S2 S2Part: B
Dual Boileror
Dual Condensateor
Boiler & Condensate
CN
D
BL
R
Sensor 2
CN
D
BL
R
Sensor 1

AEGIS Technical Manual
6/09 50Aegis_Tech
Sensor Wiring cont.
Conductivity sensor cabling may be extended up to 200ft / 60m, using single pair AWG22 / 0.25 mm2, cablespliced to the sensor cable using wire nuts or crimped connectors located in an electrical fitting or enclosure.
Do not install sensor cabling in the same conduit as any AC power cabling, particularly cabling used to powersteam rated solenoids and/or motorized boiler blowdown valves.
Conductivity sensor cabling may share a common conduit with other conductivity & fail-to-sample sensors,water meter and contact set cabling.
7.2.2 Configuration - Operation
Range Selection
Boiler Blowdown:The default range for the B driver is BLR. Installing a jumper onthe BLR pins does not change the default range.Use this range for conductivities from 200uS to 10,000uS.
Condensate–Low Conductivity:Jumper the CND pins for conductivities in the 1 to 200uS range.
Changing Ranges:Turn controller OFF before changing rangesControllers check range on power up, loading defaultOffset and Gain on range change.
Dual Condensate2 Jumpers
Sensor 1
CN
D
BL
R
Sensor 2
CN
D
BL
R
Dual BoilerNo Jumpers
Sensor 1
CN
D
BL
R
Sensor 2
CN
D
BL
R
Boiler &Condensate
1 JumperSensor 1
CN
D
BL
R
Sensor 2
CN
D
BL
R
S1 S1 S2 S2Part: B
Dual Boileror
Dual Condensateor
Boiler & Condensate
CN
D
BL
R
Sensor 2
CN
D
BL
R
Sensor 1
BoilerNo Jumper
Sensor 1
CN
D
BL
R
CondensateJumper
Sensor 1
CN
D
BL
R
Part: OP
pH or ORP
S1 S1 S2 S2Part: B
CN
D
BL
R
Sensor 2
CN
D
BL
R
Sensor 1
Boileror
Condensate

AEGIS Technical Manual
6/09 51Aegis_Tech
7.2.2 Configuration–Operation cont.
Diagnostics
Parameter LCDDisplay
Browser Value : Use
Sensor Location OK E: Installation slot. LCD displays slot letter on screen.Input Card Type OK OK Boiler Conductivity: verifies driver card typeCurrent State OK OK Operational / Alarmed:Displayed Value OK OK 3148 uS: Current measured conductivity, displays user set
units, ‘uS’ default. Displayed with user set resolutionNote: If the sensor is used for Captured Sample control of ablowdown valve, this value and all log values update at the endof the Measure period.
Period Maximum OK 3214 uS: Data from current log interval. Used to assesscontrols.
Period Minimum OK 3091 uS:Period Average OK 3162 uS:Sample Size OK 231: Samples in Period Max. Min. & AverageCurrent Period OK 19 minutes: Elapsed time in current log periodLog Period OK 60 minutes: User set log period 5 to 1440 minutesCompensation OK OK None:Measured Level OK OK 1062.3 mV: Raw sensor level in mV, before Gain & Offset after
ID Level correction.Displayed in real time for sensors used for Captured Samplecontrols.
Gain Multiplier OK OK 2.142: Calibration adjusts Gain.Displayed Value = Measured Level x Gain Multiplier + OffsetAdjust
Default Gain OK OK 2.0000: Factory default Gain. Gain selected by Input Card IDOffset Adjust OK OK 0.0000: Offset. May be user adjusted.Default Offset OK OK -15.0000: Factory default Offset.
Offset selected by Input Card IDInput Card ID OK OK 51 mV: Drive level at BLR, boiler range. Design level = 50mV.
206 mV: Drive level at CND, condensate range.Design level = 208mV.
Range Default Gain CalibrationGain Span
Default Offset
BLR 2.0 10 to 0.5 -15CND 8.0 12 to 3 -90
Calibration: A calculated gain outside of the Calibration Gain Span requires a user selected Override tocomplete calibration. The wide span allows for the range of temperatures at the sensor.
Driver Verification Test:Connect 1K ohm resistor to ‘S1’ & ‘S1‘ or ‘S2’ & ‘S2’. BLR Range, Measured Level = 129mV +/-5mV. CND Range, Measured Level = 520mV +/-10mV

AEGIS Technical Manual
6/09 52Aegis_Tech
7.2.3 Specifications
Range / Function DriveBLR Boiler100–10,000uS
Resolution: 1uSAccuracy: +/-25uS
50mV AC
CND Condensate1 - 200uS
Resolution: 1uSAccuracy: +/-2uS
208mV AC
Notes:1. Accuracy stated after sensor calibration.2. Exclude errors due to extending sensor cabling.

AEGIS Technical Manual
6/09 53Aegis_Tech
7.3 OP: ORP - pHSafety+/-1VDC maximum on field wiring terminals.24 VDC maximum on internal card surfaces.
7.3.1 Installation
ServicesThe OP driver measures ORP and pH sensors.The driver can be configured to measure dual pH, dual ORP, pH & ORP, single pH and single ORP.Up to two dual sensor or two single sensor ‘OP’ drivers may be installed in an Aegis controller.
Driver Card Installation1. Turn OFF the controller AC power2. OP driver cards may be installed in either the Sensors ‘C’ & ‘D’ or Sensors ‘E’ & ‘F’ slot.3. Connect the pH and/or ORP sensors to the driver field wiring terminals.4. Turn ON the controller after installing the OP Driver and the controller will auto-configure, displaying the
installed sensor or sensors on the LCD display and browser.
Sensor TypesAquatrac pH types A261100, A261102, SXT-HPP and ORP types A261105, ORP-FF, SXT-HPOGenerally, all ORP and pH sensors with a single coaxial cable may be used with the OP drivers.
Sensor Wiring
Sensor 1Sensor 2 Sensor 1
Sensor, Entry &Solution Ground
Sensor, Entry &Solution Ground
Bare Shield to '-'Clear, center wire to '+'
1+ 1- 2+ 2-
2O PO
Part: OP
pH or ORP
IDS2S1
1+ 1- 2+ 2-
IDS2S1
2O PO
Part: OP
Dual pH orDual ORP orpH & ORP

AEGIS Technical Manual
6/09 54Aegis_Tech
Sensor Wiring cont.
ORP sensor cabling may be extended up to 200ft / 60m, using single pair AWG22 / 0.25 mm2, cable spliced tothe sensor cable using wire nuts or crimped connectors located in an electrical fitting or enclosure. Higherinternal impedance pH sensor’s cabling cannot be extended more than 25ft, 10m.
Do not install sensor cabling in the same conduit as AC power cabling.
ORP, pH sensor cabling may share a common conduit with other sensors, water meter and contact setcabling. Solution grounds are single conductor AWG18-22 / 0.25-0.75 mm2.
Warning 1: Do not install pH sensors without installing and connecting a solution ground. Unstable, driftingpHs will occur if the solution ground is disconnected.
Warning 2:Turn OFF the controller before connecting or disconnecting pH and ORP sensors.
7.3.2 Configuration - Operation
Sensor Set Selection
Changing Sensor Set:Turn controller OFF before changing sensor selection jumpers.Controllers check selection jumpers on power up, loading defaultOffset and Gain on range change.
2O PO
2O PO
pHNo Jumper
ORPJumper
1+ 1- 2+ 2-
2O PO
Part: OP
pH or ORP
IDS2S1
2O PO
2O PO
2O PO
Dual pHNo Jumper
Dual ORPJumper 2O
pH & ORPJumper PO
1+ 1- 2+ 2-
IDS2S1
2O PO
Part: OP
Dual pH orDual ORP orpH & ORP

AEGIS Technical Manual
6/09 55Aegis_Tech
7.3.2 Configuration–Operation cont.
Driver Test Header
COMV
+ -
DVM
millivolts
IDS2S1
S1 = Sensor 1 mV x -1S2 = Sensor 2 mV x -1ID = Card ID Level
ID = Card ID LevelDual pH 1150Dual ORP 1345pH & ORP 1450Single pH 1050Single ORP 1250

AEGIS Technical Manual
6/09 56Aegis_Tech
7.3.2 Configuration–Operation cont.
Diagnostics: pH Input
Parameter LCDDisplay
Browser Value : Use
Sensor Location OK A: Installation slot. LCD displays slot letter on screen.Input Card Type OK OK pH Sensor: verifies driver card typeCurrent State OK OK Operational / Alarmed:Displayed Value OK OK 8.12 pH: Current measured pH, display user set units, ‘pH’
default. Displayed with user set resolutionPeriod Maximum OK 8.15 pH: Data from current log interval. Used to assess controls.Period Minimum OK 8.05 pH:Period Average OK 8.10 pH:Sample Size OK 122: Samples in Period Max. Min. & AverageCurrent Period OK 18 minutes: Elapsed time in current log periodLog Period OK 15 minutes: User set log period 5 to 1440 minutesCompensation OK OK None:Measured Level OK OK 62.3 mV: Raw sensor level in mV, before Gain & Offset after ID
Level correction.Gain Multiplier OK OK 0.0170: User set GainDefault Gain OK OK 0.0170: Factory default Gain, 59mV/pH
Gain selected by Input Card IDOffset Adjust OK OK 7.2361: Offset. Calibration adjusts Offset.
Displayed Value = Measured Level x Gain Multiplier + OffsetAdjust
Default Offset OK OK 7.0000: Factory default Offset. Offset selected by Input Card IDInput Card ID OK OK 1147 mV: Dual pH Design level = 1150 mV.
Single pH Design level = 1050 mVPH–ORP Design level = 1450 mV
SensorType
Default Gain CalibrationOffset Span
Default Offset
PH 0.017 6 - 8 7
Calibration: A calculated offset outside of the Calibration Offset Span requires a user selected Override tocomplete calibration.
Driver Verification Test:Connect a pH sensor, center conductor to 1+ and shield to 1-. Immerse sensor into pH10 buffer and connect asolution ground wire with an exposed wire end immersed in the buffer. Measured Level = 170mV +/-25mV

AEGIS Technical Manual
6/09 57Aegis_Tech
7.3.2 Configuration–Operation cont.
Diagnostics: ORP Input
Parameter LCDDisplay
Browser Value : Use
Sensor Location OK B: Installation slot. LCD displays slot letter on screen.Input Card Type OK OK ORP Sensor: verifies driver card typeCurrent State OK OK Operational / Alarmed:Displayed Value OK OK 321 mV: Current measured ORP, display user set units, ‘mV’
default. Displayed with user set resolutionPeriod Maximum OK 340 pH: Data from current log interval. Used to assess controls.Period Minimum OK 306 pH:Period Average OK 318 pH:Sample Size OK 411: Samples in Period Max. Min. & AverageCurrent Period OK 38 minutes: Elapsed time in current log periodLog Period OK 120 minutes: User set log period 5 to 1440 minutesCompensation OK OK None:Measured Level OK OK 307.4 mV: Raw sensor level in mV, before Gain & Offset after
ID Level correction.Gain Multiplier OK OK -1.0000: User set GainDefault Gain OK OK -1.0000: Factory default Gain,
Gain selected by Input Card IDOffset Adjust OK OK 13.612: Offset. Calibration adjusts Offset.
Displayed Value = Measured Level x Gain Multiplier + OffsetAdjust
Default Offset OK OK 0.0000: Factory default Offset.Offset selected by Input Card ID
Input Card ID OK OK 1145 mV: Dual ORP Design level = 1344 mV.Single ORP Design level = 1250 mVPH–ORP Design level = 1450 mV
SensorType
Default Gain CalibrationOffset Span
Default Offset
ORP -1 +50 to -50 0
Calibration: A calculated offset outside of the Calibration Offset Span requires a user selected Override tocomplete calibration.

AEGIS Technical Manual
6/09 58Aegis_Tech
7.3.3 Specifications
Function NotesInput Range +/- 1000mV
0-14 pH
Resolution ORP: 0.1mVPH: 0.01 pH
Accuracy +/- 0.1mV+/- 0.02pH
Requires installed solution groundfor each measured sensor.
Input Impedance > 500 MOhm Fully differential.10M ohm power OFF inputresistance
Notes:Accuracy stated after sensor calibration.

AEGIS Technical Manual
6/09 59Aegis_Tech
7.4 CI: Dual 4-20mA Current InputSafety30 VDC maximum on field wiring terminals.30 VDC maximum on internal card surfaces.
7.4.1 Installation
ServicesThe CI driver measures two 4-20mA current loops.The CI driver terminates each current loop with 50 ohms, referenced to electrical ground.Each 4-20mA input is polarity and thermally protected.Up to two CI drivers may be installed in an Aegis controller in addition to the fixed 4-20mA input at controllerinput ‘G’.
Card Installation1. Turn OFF the controller AC power2. CI drivercards may be installed in either the Sensors ‘C’ & ‘D’ or Sensors ‘E’ & ‘F’ slot.3. Turn ON the controller after installing the CI Driver and the controller will auto-configure, displaying both
inputs as millivolt levels, 200mV=4mA to 1000mV=20mA.
Driver Wiring
4-20mACurrentLoop
DualInput
- +
Powered Loop
4-20mAOutput
15 VDC
Controlle r DCSupply
- +
LoopPoweredSensor
Current Loop Inputsm ay be any com bination
or pow ered andloop pow ered
Green light turnsON w hen loop
current greaterthan 3.5 m A
15 to 22 VDC SupplyTherm ally fused at
100 m A
1+ 2+Part: CI
Loop 2>3.5 mA
Loop 1>3.5 mA

AEGIS Technical Manual
6/09 60Aegis_Tech
7.4.1 Installation cont.
Driver Wiring
AWG22 / 0.25 mm2, current loop cabling may be extended several hundred feet or meters without causingmeasurement errors. The maximum cable length is determined by the open loop voltage and the cable gauge.
Do not install current loop cabling in the same conduit as AC power cabling.
Current loop cabling may share a common conduit with other sensors, water meter and contact set cabling.
7.4.2 Configuration - Operation
Diagnostics
Parameter LCDDisplay
Browser Value : Use
Sensor Location OK C: Installation slot. LCD displays slot letter on screen.Input Card Type OK OK 4-20mA Input: verifies driver card typeCurrent State OK OK Operational / Alarmed:Displayed Value OK OK 1836 gpm: Current measured conductivity, display user set
units, ‘---’ default. Displayed with user set resolutionPeriod Maximum OK 1920 gpm: Data from current log interval. Used to assess
controls.Period Minimum OK 1110 gpm:Period Average OK 1412 gpm:Sample Size OK 1110: Samples in Period Max. Min. & AverageCurrent Period OK 46 minutes: Elapsed time in current log periodLog Period OK 60 minutes: User set log period 5 to 1440 minutesCompensation OK OK None / Rate-to-Volume:Measured Level OK OK 787.5 mV: Raw sensor level in mV, before Gain & Offset after
ID Level correction.Current Loop OK 15.75 mA: Calculated loop current. Input‘G’terminated by 100
ohms otherwise terminated with 49.9 ohms.Gain Multiplier OK OK 3.1250: Calibration adjusts Gain. Displayed Value = Measured
Level x Gain Multiplier + Offset AdjustDefault Gain OK OK 1.0000: Factory default Gain. Gain selected by Input Card IDOffset Adjust OK OK -625: Offset. May be user adjusted.Default Offset OK OK 0.0000: Factory default Offset. Offset selected by Input Card IDInput Card ID OK OK 2218 mV: Design level = 2216mV.
Driver Verification Test:Connect a 2K ohm (Optionally use 2 x 1K, 5%, 1/4W) resistor between controller +15 VDC terminal and CIDriver terminal 1+.Measured Level will be nominally 500mV if the +15VDC terminal is @ 20VDC.Actual Level varies with the unregulated +15VDC supply and equals: 49.9 x ( VDC / (2000 + 49.9)) , where thecontroller terminate the loop with 49.9 ohms and a 2,000 ohm test resistor is installed.

AEGIS Technical Manual
6/09 61Aegis_Tech
7.4.2 Configuration - Operation cont.
CalibrationCurrent loops where 4mA is NOT equal to zero, GPM, uS… require two point calibration to convert themeasured current into end user units.
The current loop may be calibrated using either the Keypad or the Browser, by either calculating the Offset &Gain or driving the current loop between two values.
Two Point Calibration.1. Configure the device or sensor controlling the current loop to operate at 4mA.2. Select Sensors / Calibrate and @ ‘Enter first value’ key the 4mA level in site units. For example if your
current loop was spanned 0-2500GPM = 4-20mA, you would key 0 & Enter3. Configure the device or sensor controlling the current loop to operate at 20mA.4. Key the 20mA level @ the ‘Enter second Value’ prompt. In our example you would key 2500 & Enter5. The controller will then calculate the Offset & Gain required to convert the measured current to user
units. In our 0-2500GPM example Gain = 3.125 & Offset = 625.
Any two loop currents may be used to calibrate. The previous 4mA & 20mA example is the optimum.Accuracy improves as the difference between the two calibration currents increase.
Calculating Offset & Gain1. The input Offset Adjust and Gain Multiplier may be manually set using Sensors / Configuration.2. This method to convert a measured current to a user value may be used if it’s not easy to drive the
current loop between 4 & 20 mA.
At 4mA the 50ohm loop terminating resistor measures 200mV ( 50 x 0.004).At 20mA the 50ohm loop terminating resistor measures 1000mV ( 50 x 0.020).As the current loop varies from 4-20mA, the controller measures a mV change from 200 to 1000; an800mV change.
If the site 4mA_Level & 20mA_Level are known.Gain Multiplier = ( 20mA_Level–4mA_Level ) / 800Offset Adjust = -200 x Gain Multiplier
Example: 4mA_Level = 0 GPM & 20mA_Level = 2500 GPMGain Multiplier = 2500 /800 = 3.125Offset Adjust = -200 x 3.125 = 625
Check: At 4mA we’ll measure 200mV and display 200 x 3.125 –625 = 0 GPMAt 20mA we’ll measure 1000mV and display 1000 x 3.125 –625 = 2500 GPM
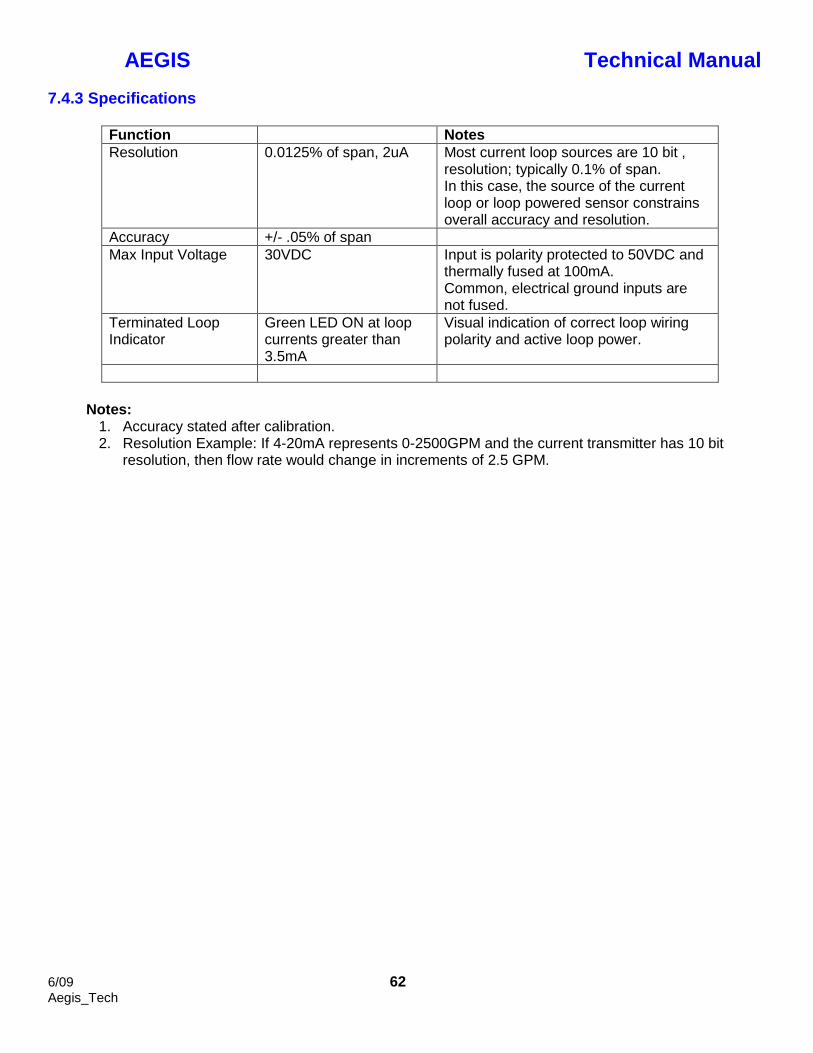
AEGIS Technical Manual
6/09 62Aegis_Tech
7.4.3 Specifications
Function NotesResolution 0.0125% of span, 2uA Most current loop sources are 10 bit ,
resolution; typically 0.1% of span.In this case, the source of the currentloop or loop powered sensor constrainsoverall accuracy and resolution.
Accuracy +/- .05% of spanMax Input Voltage 30VDC Input is polarity protected to 50VDC and
thermally fused at 100mA.Common, electrical ground inputs arenot fused.
Terminated LoopIndicator
Green LED ON at loopcurrents greater than3.5mA
Visual indication of correct loop wiringpolarity and active loop power.
Notes:1. Accuracy stated after calibration.2. Resolution Example: If 4-20mA represents 0-2500GPM and the current transmitter has 10 bit
resolution, then flow rate would change in increments of 2.5 GPM.

AEGIS Technical Manual
6/09 63Aegis_Tech
7.5 IO: 4-20mA OutputSafety30 VDC maximum on field wiring terminals.24 VDC maximum on internal card surfaces.
7.5.1 Installation
ServicesThe IO driver provides one or two, DC isolated, loop powered 4-20mA outputs.Up to two dual, 4-20mA output ‘IO’ drivers may be installed in an Aegis controller.The current output level 0% to 100% is logged by the controller.
Card Installation1. Turn OFF the controller AC power2. IO drivercards may be installed in either the Sensors ‘C’ & ‘D’ or Sensors ‘E’ & ‘F’ slot.3. Turn ON the controller after installing the IO Driver and the controller will auto-configure, displaying the
current output, on the LCD display and browser.
Current Loop Wiring
15 VDC
Controller DC Supply
- +
Loop PoweredPump or Valve
15 to 22 VDC SupplyThermally fused at 100
mA
+24V IN
RemoteMonitor
4-20mA Input
ProportionalControl
+24V IN
DistributedControl System
4-20mA Input
1+ 1- 2+ 2-Part: IO
Single 4-20mAOutput
1+ 1- 2+ 2-Part: IO
Dual 4-20mAOutput

AEGIS Technical Manual
6/09 64Aegis_Tech
7.5.1 Installation cont.
Current Loop Wiring
AWG22 / 0.25 mm2, current loop cabling may be extended several hundred feet or meters without causingmeasurement errors. The maximum cable length is determined by the open loop voltage and the cable gauge.
Do not install current loop cabling in the same conduit as AC power cabling.
Current loop cabling may share a common conduit with other sensors, water meter and contact set cabling.
7.5.2 Configuration - Operation
Diagnostics
Parameter LCDDisplay
Browser Value : Use
Sensor Location OK Installation slot. LCD displays slot letter on screen.Input Card Type OK OK 4-20mA Output: verifies driver card typeStatus OK OK Manual / Auto Loop open alarmDisplayed Value OK OK 12.0 mA & 50.0%:
Displays both current mA level & % of spanDisplayed with user set resolution
Period Maximum OK 52.6% Data from current log interval. Used to assess controls.Period Minimum OK 48.1%:Period Average OK 50.2%:Sample Size OK 48: Samples in Period Max. Min. & AverageCurrent Period OK 21 minutes: Elapsed time in current log periodLog Period OK 60 minutes: User set log period 5 to 1440 minutesTrim Span OK OK 950: 20mA span. Keypad adjustableTrim Zero OK OK 9: 4mA zero. Keypad adjustableInput Card ID OK OK 2467 mV: Design level = 2460mV.
Manual - AutoA 4-20mA output may be switched from Auto control to Manual.Manual mode allows the user to set an output from 0% to 100% to base feed, set up feed rates and verifymonitoring inputs.On return to Auto the 4-20mA span and controlling sensor or relay are restored, unchanged.

AEGIS Technical Manual
6/09 65Aegis_Tech
7.5.2 Configuration - Operation cont.
Hardware Calibration
COMV
+ -
DVM
DC Volts
Verifying Loop Current
15 VDC
Controller DC Supply
1+ 1- 2+ 2-Part: IO
Dual 4-20mAOutput
Loop Terminating Resistor,Typically 249 ohms
1. Insert a mA meter in series withcurrent loop cabling.
OR2. Test with loop disconnected
as shown on right
4mA = 1V20mA = 5V
Hardware Calibration is used to compensate for component level errors.It’s only available via the keypad and forces the current loop to 20mA to adjust SPAN and to 4mA to adjust ZERO. Trim Zero default = 9 Trim Span default = 950

AEGIS Technical Manual
6/09 66Aegis_Tech
7.5.3 Specifications
Function NotesResolution & Accuracy 0.1% & +/- 0.15%
DC Isolated Terminals 1+ & 1- DCisolated from 2+ & 2-
Outputs DC isolated from electricalground–controller common.
Loop Polarity Auto-correcting Driver input terminals are notsensitive to polarity.
Max Loop Voltage 30VDC. Current loops powered by thecontroller unregulated 15VDCsupply do not exceed 24VDC.
Minimum LoopTermination
10 ohms. LMI solenoid drive pump,proportional control input = 22ohms

AEGIS Technical Manual
6/09 67Aegis_Tech
7.6 CR: Corrosion RateSafety100mV DC maximum on field wiring terminals.24 VDC maximum on internal card surfaces.
7.6.1 Installation
ServicesThe CR driver measures one or two corrosion rates using Linear Polarization Resistance.Dual CR drivers allow two alloys, copper & steel for example, to be monitored concurrently..Up to two dual and one single ‘CR’ drivers may be installed in an Aegis controller.
Card Installation1. Turn OFF the controller AC power2. The single and dual CR drivercards may be installed in either the Sensors ‘C’ & ‘D’ or Sensors ‘E’ & ‘F’ slot.3. Turn ON the controller after installing the CR Driver and the controller will auto-configure, displaying one or
both corrosion rates on the LCD display and browser.
Sensor TypesAquatrac type CRS-SEN corrosion rate sensors.Alloy sensor sets available in steel, copper, admiralty and cupro-nickel
Sensor Wiring
Sensor 1Sensor 2 Sensor 1
Sensor cabling isnot polarized
S1 S1 S2 S2
Part: CR
DualCorrosion
Rate
Part: OP
pH or ORP
S1 S1 S2 S2
Part: CR
SingleCorrosion
Rate

AEGIS Technical Manual
6/09 68Aegis_Tech
7.6.1 Installation cont.
Sensor Wiring
Corrosion rate sensor cabling may be extended up to 200ft / 60m, using single pair AWG22 / 0.25 mm2, cablespliced to the sensor cable using wire nuts or crimped connectors located in an electrical fitting or enclosure.
Do not install sensor cabling in the same conduit as any AC power cabling.
Corrosion Rate sensor cabling may share a common conduit with other sensors, water meter and contact setcabling.
7.6.2 Configuration - Operation
Setup-Calibration
Alloy Number:The Alloy Number is used to convert the Linear Polarization Current to a rate of metal loss in mils/year.The default Alloy Number is 1.000, Carbon Steel.Common alloy numbers are Copper @ 2.00, 90/10 Cupro-Nickel @ 1.80, Zinc @ 1.29, Admiralty @ 1.67
Conductivity Sensor:If the controller includes a conductivity sensor installed in the same sample stream at the corrosion ratesensor, the corrosion rate measurement may be corrected for conductivity.Conductivity correction has little effect at 1000uS with correction increasing as conductivity falls.At low conductivities, LPR faults and alarms.
Calibration:The CR driver can operate without calibration with nominally 0.05 mpy of static error caused by componentoffsets in the driver card.If you disconnect the sensor and calibrate for 0 mpy, the controller will correct the Offset for the static error.This is a one-time calibration unless you move the CR driver to another controller slot. A new slot, resets theoffset calibration.

AEGIS Technical Manual
6/09 69Aegis_Tech
7.6.2 Configuration - Operation cont.
Diagnostics
Parameter LCDDisplay
Browser Value : Use
Sensor Location OK E: Installation slot. LCD displays slot letter on screen.Input Card Type OK OK Corrosion Rate: verifies driver card typeCurrent State OK OK Operational / Alarmed:Displayed Value OK OK 1.23 mpy: Current measured corrosion rate,
Displayed with user set resolutionUpdates every 128 seconds
Period Maximum OK 1.28 mpy: Data from current log interval.Period Minimum OK 1.21 mpy:Period Average OK 1.22 mpy:Sample Size OK 106: Samples in Period Max. Min. & AverageCurrent Period OK 26 minutes: Elapsed time in current log periodLog Period OK 60 minutes: User set log period 5 to 1440 minutesCompensation OK OK Corrosion Rate: Sequences through six steps,
repeating every 128 secondsAnodic Level OK OK 52.1 mV: Anodic & Cathodic levels should be opposite in sign
and nominally the same value.Cathodic Level OK OK -48.6 mV:Pitting Level OK OK 1.2 mV: Pitting should always be less than either Anodic or
Cathodic. Pitting alarms are blocked for corrosion rates lessthan 2mpy.A Pitting level higher than the Anodic or Cathodic level isan invalid corrosion rate measurement.Replace pitted sensor tips.
Measured Level OK OK 6.8 mV: Raw sensor level in mVDisplayed in real time as the CR driver sequences.
Gain Multiplier OK OK 1.0000: User set Gain.Default Gain OK OK 1.0000: Factory default Gain. Gain selected by Input Card IDOffset Adjust OK OK -0.532: Offset.
Calibration adjusts Offset for hardware error.Default Offset OK OK 0.0000: Factory default Offset.
Offset selected by Input Card IDInput Card ID OK OK 1614 mV: Dual Design level = 1611mV.
Single Design level = 1548mVDrive Level OK OK 1209.9 mV: Offset correction allied to measured values.
Inserted by driver card optical isolation.
Driver Verification Test:Connect 10K ohm resistor to ‘S1’ & ‘S1‘ or ‘S2’ & ‘S2’. Configure with Alloy Number =1.000 & no conductivity sensor.Controller will display nominally 0.5mpy.Anodic & Cathodic Levels will be nominally +/-50mV with pitting level +/-10mV.

AEGIS Technical Manual
6/09 70Aegis_Tech
7.6.3 Specifications
Function NotesResolution 0.1mpy Linear Polarization Resistance, LPR is applicable
where general corrosion is the dominant corrosionmode.
LPR is useful in measuring relative corrosionrates, process upsets and the immediate effect ofchanging treatment programs or operatingconditions.
LPR is not an applicable technique forprocesses where pitting is the dominantcorrosion mechanism.
Aluminum alloys and Stainless steels in coolingwater and waste water stream usually pit.
Sensor Drive DCIsolated.
Each sensor drive is separately electricallyisolated from controller common and electricalground.
Uncalibrated Error 0.05 mpyNominal
Calibration with sensor disconnected removesThe effect of Uncalibrated Error
Notes:1. Accuracy with respect to weight loss measurements is typically 50% to 200%.2. The first valid corrosion rate measurement occurs 4 minutes after Power ON and is updated every
2 minutes thereafter.
CR Driver Revision Log01/01/04 Initial release Version 037 CR Driver cards 16 Second measurement cycle05/05/05 Version 054 CR Driver cards 128 Second measurement cycle09/05/05 Rate with 10K test resistor now 0.5mpy
was 5mpy. Uncalibrated error reducedfrom 0.5mpy to 0.05mpy
Requires controller firmwareVersion T095 and later.
07/02/08 Reformatted for Aegis controllers

AEGIS Technical Manual
6/09 71Aegis_Tech
7.7 PT: pH - TemperatureSafety+/-1VDC maximum on field wiring terminals.24 VDC maximum on internal card surfaces.
7.7.1 Installation
ServicesThe PT, pH-Temperature driver measures a pH sensor and a temperature using a platinum RTD.
The driver can be jumper configured to measure either 100 ohm or 1000 ohm RTDs.The controller detects the location of the RTD selection jumper on power up and auto-configures.
Up to two ‘PT’ drivers may be installed in an Aegis controller.
Although most installations will use the PT driver temperature input to thermally compensate the pH input, thepH and temperature inputs of the PT driver may be also used independently to control pumps and solenoids.
Temperature Compensation of pHCooling Tower ApplicationsThe amount of pH variation with temperature increases as the pH increases above pH 7 or decreasesbelow pH 7. Cooling towers operating around pH 8 and over a narrow temperature range are seldomtemperature compensated. The pH error due to temperature in cooling towers is nominally 0.1pH whichdoes not justify the cost and complexity of pH temperature compensation.Process ApplicationsTemperature changes the mV/pH response of the pH sensor. The following table shows how the responseof the pH sensor varies with temperature and the error that temperature compensation of pH corrects.
The 8pH column is included to demonstrate the minimal effect temperature has in the 50-90Ftypical cooling tower application range.
Temperature millivolts/pH mV@ 4pH
pH error
mV @ 7pH
pH error
mV @ 8pH
pH error
mV @ 10pH
pH error
0C or 32F -54.2 162.6mV
0.25pH
0mV
0pH
-54.2mV
0.08pH
-162.6mV
0.25pH
25C or 77F -59.16 177.5mV 0mV -59.2mV -177.5mV
100C or 212F -74.04 222.12
0.79pH
0mV
0pH
-74.04mV
0.25pH
-222.12
0.79pH
The mV/pH value is the controller pH sensor GAIN.The controller’s default pH sensor 25C GAIN is 0.017, nominally 1 / 59.16 mV/pH
When the pH sensor Compensation is set to Temperature, the controller adjusts the pH sensor GAINbased on the value measured at the selected Temperature sensor.

AEGIS Technical Manual
6/09 72Aegis_Tech
7.7.1 Installation cont.
Controller ServicesThe controller provides services to calibrate the RTD temperature and to warn you of wiring & operationalproblems. The controller limits the range of temperatures that can be used for pH temperaturecompensation to limit operating problems on a defective or mis-calibrated RTD sensor.
1. Temperature compensation of pH can only be applied to pH sensors connected to pH input cards.4-20mA inputs representing pH cannot be thermally compensated since these sensors are usuallycompensated at the pH to 4-20mA converter.
2. Compensating temperatures are only applied in the range of 0-100C, 0-212F. Out of rangetemperatures are not used for compensation. No thermal compensation of pH occurs.Set the HIGH & LOW alarms on the compensating thermal sensor to detect this fault.
3. Any temperature sensor, including the RTD sensor connected to the PT Driver card may be used totemperature compensate a pH sensor.
4. RTD calibration is limited to +/-20 degrees before a calibration error occurs. The warning may beoverridden by the user.
5. The default RTD is 0.00385 ohm/ohm/C where the default GAIN = 1/0.00385 = 259.74. If you are usingand RTD with a response other than 0.00385, use SENSOR / CONFIGURE to set the correct GAIN.
6. Disconnected RDT sensors will display–50C or–50F. When the controller measures an RTD voltageof less than 1000mV, it sets the RTD temperature to–50C or -50F.
7. When you select SYSTEM / CONFIGURE / Metric Units, the controller displays RTD temperatures indegrees C independent of the user set units for temperature.
8. Temperature compensation of a pH sensor can also be configured and monitored using the keypadand controller LCD display
Card Installation1. Turn OFF the controller AC power2. PT driver cards may be installed in either the Sensors ‘C’ & ‘D’ or Sensors ‘E’ & ‘F’ slot.3. Connect the pH and RTD sensors to the driver field wiring terminals.4. Set the PT driver jumper to match the pH sensor RTD value, either 100 ohms or 1000 ohms. If youdon’t know the RTD value, measure the resistance between the two AWG24 sensor temperature wires.
5. Turn ON the controller after installing the PT Driver and the controller will auto-configure, displaying theinstalled sensor or sensors on the LCD display and browser.
Sensor Part NumbersAquatrac immersion rated pH sensor part numbers A261107, A261108 and A261109 includea thermal compensation RTD,Generally, any pH sensor with a single coaxial cable and a 2 wire 100 ohm or 1000 ohm RTD may be usedwith the PT drivers.

AEGIS Technical Manual
6/09 73Aegis_Tech
7.7.1 Installation cont.
Sensor Wiring
ImmersionRated
pH Sensor& RTD pH Sensor
& RTD
Sensor, Entry &Solution Ground
Connect the Coaxial cablewires to ‘pH’ & the
AWG24 wires to ‘Temp’
pHTemp
IDCommon
Part: PT
pH &Temperature
pH+ pH-Center Shield
Temp+
1K100RRTD
Immersion pH sensorsusally do not require asolution ground since
both the vessel and thecontroller are grounded. pH sensors installed
in plastic pipingusually require asolution ground.
pHTemp
IDCommon
Part: PT
pH &Temperature
pH+ pH-Center Shield
Temp+
1K100RRTD
At temperatures below 75F / 25C, higher internal pH impedance limits a pH sensor’s cabling to nominally 25ft or 10m.At temperatures above 100F /40C in conductive process streams, pH sensor cablingmay be extended to typically 50ft, 20m without using a sensor amplifier.
Do not install pH sensor cabling in the same conduit as AC power cabling.
pH sensor cabling may share a common conduit with other sensors, water meter and contact set cabling.Solution grounds are single conductor AWG18-22 / 0.25-0.75 mm2.
Warning:Turn OFF the controller before connecting or disconnecting pH sensors & selecting RTD.

AEGIS Technical Manual
6/09 74Aegis_Tech
7.7.2 Configuration - Operation
RTD SelectionChanging the Selected RTD Set:Turn controller OFF before changing the RTD selection jumper.Controllers check the RTD selection jumper on power up, auto-configuring the temperature measurement.
Jumper 1Kfor 1000 ohmRTD
Jumper 100Rfor 100 ohmRTD
pHTemp
IDCommon
Part: PT
pH &Temperature
pH+ pH-Center Shield
Temp+
1K100RRTD
Driver Test Header
VCom
- +
DVM
millivolts
pHTempIDCommon
pH = +/- 200mV, Sensor millivoltsTemp = 3000 to 4000mV
RTD current + RTD driveID = Card ID Level, 1850mV

AEGIS Technical Manual
6/09 75Aegis_Tech
7.7.3 Diagnostics pH Input
Parameter LCDDisplay
Browser Value : Use
Sensor Location OK A: Installation slot. LCD displays slot letter on screen.Input Card Type OK OK pH Sensor: verifies driver card typeCurrent State OK OK Operational / Alarmed:Displayed Value OK OK 8.12 pH: Current measured pH, display user set units, ‘pH’
default. Displayed with user set resolutionPeriod Maximum OK 8.15 pH: Data from current log interval. Used to assess controls.Period Minimum OK 8.05 pH:Period Average OK 8.10 pH:Sample Size OK 122: Samples in Period Max. Min. & AverageCurrent Period OK 18 minutes: Elapsed time in current log periodLog Period OK 15 minutes: User set log period 5 to 1440 minutesCompensation OK OK None or Thermal Compen.Measured Level OK OK 62.3 mV: Raw sensor level in mV, before Gain & Offset after ID
Level correction.Gain Multiplier OK OK 0.0170: User set GainDefault Gain OK OK 0.0170: Factory default Gain, 59mV/pH
Gain selected by Input Card IDOffset Adjust OK OK 7.2361: Offset. Calibration adjusts Offset.
Displayed Value = Measured Level x Gain Multiplier + OffsetAdjust
Default Offset OK OK 7.0000: Factory default Offset. Offset selected by Input Card IDInput Card ID OK OK 1854 mV: PT driver Design level = 1850 mV.
Note: The ID level identifies this pH input as a PT driver.pH-ORP driver only cards have lower Input Card IDs
SensorType
Default Gain CalibrationOffset Span
Default Offset
PH 0.017 6–8 7
Calibration: A calculated offset outside of the Calibration Offset Spanrequires a user selected Override to complete calibration.
Driver Verification Test:Connect a pH sensor, center conductor to pH+ and shield to pH-. Immerse sensor into pH10 buffer andconnect a solution ground wire with an exposed wire end immersed in the buffer.Measured Level = +170mV +/-25mV

AEGIS Technical Manual
6/09 76Aegis_Tech
7.7.3 Diagnostics: Temperature Input
Parameter LCDDisplay
Browser Value : Use
Sensor Location OK B: Installation slot. LCD displays slot letter on screen.Input Card Type OK OK 100 ohm RTD OR 1000 ohm RTD : verifies driver card typeCurrent State OK OK Operational / Alarmed:Displayed Value OK OK 128F: Current measured temperature, display user set units, ‘F’
OR ‘C” if ‘Metric’ selected default. Displayed with user set resolution
Period Maximum OK 132 F: Data from current log interval. Used to assess controls.Period Minimum OK 126 F:Period Average OK 129 F:Sample Size OK 186: Samples in Period Max. Min. & AverageCurrent Period OK 38 minutes: Elapsed time in current log periodLog Period OK 60 minutes: User set log period 5 to 1440 minutes, Default 60Compensation OK OK None. Note: Do not apply any type of Compensation to a
thermal sensor use to compensate a pH sensorMeasured Level OK OK 3126 mV: Raw sensor level in mV, before Gain & Offset after ID
Level correction.Gain Multiplier OK OK 259.74: User set Gain. Do not change this value unless you
have changed the RTD type.Default Gain OK OK 259.74: Factory default Gain,
= 1/ 0.00385 ohm / ohm /cOffset Adjust OK OK -4.012: Offset. Calibration adjusts Offset.
Displayed Value = (Measured Level x Gain Multiplier & RTD totemperature conversion) + Offset Adjust
Default Offset OK OK 0.0000: Factory default Offset.Offset selected by Input Card ID
Input Card ID OK OK 100 ohm RTD = 43 mV RTD drive measurement level1000 ohm RTD = 327 mV
SensorType
Default Gain CalibrationOffset Span
Default Offset
RTD 259.74 +20 to -20 0
Calibration: A calculated offset outside of the Calibration Offset Spanrequires a user selected Override to complete calibration.

AEGIS Technical Manual
6/09 77Aegis_Tech
7.7.4 Specifications
Function NotesInput Range 0-14 pH
100 ohm or 1000 ohmPlatinum RTD.
Defaults to 0.00385 ohm/ohm/CRTD, Resistive Thermal Device
Resolution pH: 0.01 pHTemperature: 0.1C or0.05F
User controls pH and temperaturedisplayed resolution from 0 to 3digits after the decimal point.
Accuracy +/- 0.05F/C+/- 0.02pH
Requires installed solution groundfor non-immersion pH sensors.
pH Input Impedance > 500 MOhm Fully differential.20M ohm power OFF inputresistance
Notes: Accuracy stated after sensor calibration.
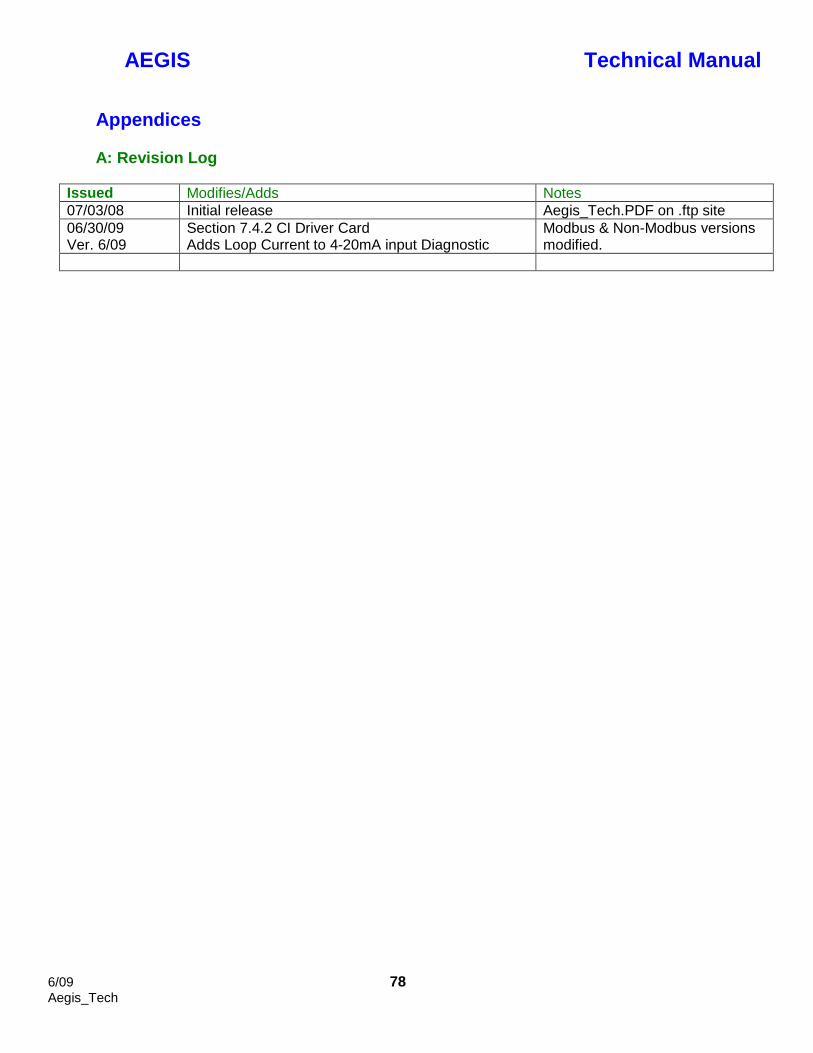
AEGIS Technical Manual
6/09 78Aegis_Tech
Appendices
A: Revision Log
Issued Modifies/Adds Notes07/03/08 Initial release Aegis_Tech.PDF on .ftp site06/30/09Ver. 6/09
Section 7.4.2 CI Driver CardAdds Loop Current to 4-20mA input Diagnostic
Modbus & Non-Modbus versionsmodified.
Related Documents


![AEGIS: A Fast Authenticated Encryption Algorithm …2013 [31]. AEGIS-128L is introduced into this submission. 4 Chapter 2 Speci cation The speci cation of AEGIS-128, AEGIS-256 and](https://static.cupdf.com/doc/110x72/5f06a2a57e708231d418f98b/aegis-a-fast-authenticated-encryption-algorithm-2013-31-aegis-128l-is-introduced.jpg)


