CUSTOMIZED DESIGN AND DEVELOPMENT OF TRANSTIBIAL PROSTHETIC SOCKET FOR IMPROVED COMFORT USING REVERSE ENGINEERING & ADDITIVE MANUFACTURING Ph.D. Thesis CHITRESH NAYAK (2012RME9543) DEPARTMENT OF MECHANICAL ENGINEERING MALAVIYA NATIONAL INSTITUTE OF TECHNOLOGY JAIPUR JLN MARG, JAIPUR – 302017, INDIA July, 2017

Welcome message from author
This document is posted to help you gain knowledge. Please leave a comment to let me know what you think about it! Share it to your friends and learn new things together.
Transcript

CUSTOMIZED DESIGN AND DEVELOPMENT OF TRANSTIBIAL
PROSTHETIC SOCKET FOR IMPROVED COMFORT USING
REVERSE ENGINEERING & ADDITIVE MANUFACTURING
Ph.D. Thesis
CHITRESH NAYAK
(2012RME9543)
DEPARTMENT OF MECHANICAL ENGINEERING
MALAVIYA NATIONAL INSTITUTE OF TECHNOLOGY
JAIPUR
JLN MARG, JAIPUR – 302017, INDIA
July, 2017

i
CUSTOMIZED DESIGN AND DEVELOPMENT OF TRANSTIBIAL
PROSTHETIC SOCKET FOR IMPROVED COMFORT USING
REVERSE ENGINEERING & ADDITIVE MANUFACTURING
CHITRESH NAYAK
(2012RME9543)
Thesis submitted
as a partial fulfillment of the requirements of the degree of
Doctor of Philosophy
to the
Department of Mechanical Engineering
Malaviya National Institute of Technology, Jaipur
Jaipur – 302017, India
July, 2017

ii
Dedicated to
My Parents

iii
Malaviya National Institute of Technology, Jaipur
Mechanical Engineering Department
CERTIFICATE
This is to certify that the thesis entitled “Customized Design and Development
of Transtibial Prosthetic socket for Improved Comfort using Reverse Engineering &
Additive Manufacturing” being submitted by Mr. Chitresh Nayak (Roll No:
2102RME9543) in partial fulfilment of the requirements for the award of Doctor of
Philosophy in Mechanical Engineering to the Malaviya National Institute of
Technology, Jaipur is an authentic record of research work carried out by him under my
supervision and guidance. To the best my knowledge, the results contained in this thesis
have not been submitted, in part or in full, to any other University or Institute for the
award of any Degree or Diploma.
Dr. Amit Singh
(Supervisor)
Assistant Professor
Mechanical Engineering Department
MNIT, Jaipur-302017 (Rajasthan)
Dr. Himanshu Chaudhary
(Co-Supervisor)
Associate Professor
Mechanical Engineering Department
MNIT, Jaipur-302017 (Rajasthan)
The Ph.D. viva voce examination of Mr. Chitresh Nayak has been conducted by
the Oral Defense Committee (ODC) constituted by the Dean (Academic Affairs), as per
9.4.3, vide letter No: F.4 (P) Ph.D./Acad/MNIT/2016/1611 dated 5th July 2017 on
wednesday, condect the viva-voce examination dated 20th July, 2017. The ODC declares
that the student has successfully defended the thesis in the viva-voce examination.
Dr. Prashant Kumar Jain
(External Examiner)
Associate Professor
Mechanical Engineering Department
IIITDM, Jabalpur

iv
ACKNOWLEDGEMENTS
I would like to express my deep and sincere gratitude to my thesis supervisors,
Dr. Amit Singh and Dr. Himanshu Chaudhary, for their invaluable guidance and support
throughout my research. They are excellent teachers, and their knowledge and logical
way of thinking have been of great value for me. This research is impossible without
their inspiring guidance, experience, and subject knowledge.
I also take this opportunity to express my heartfelt thanks to the members of the
Departmental Research Evaluation Committee (DREC), Dr. T. C. Gupta and Dr. Dinesh
Kumar, who spared their valuable time and experiences to evaluate my research plan and
synopsis. I would also like to thank Prof. G. S. Dangayach, Head of the Mechanical
Engineering Department and his office team for helping in all administrative works
regarding thesis.
I am grateful to my parents (Jagdish Prasad Sharma and Geeta Sharma), sister
(Arpana Shukla) and brother (Aditya Nayak) for their tremendous amount of inspiration
and moral support they have given me since my childhood. I also thank my friends, Dr.
Amit Aherwar, Dr. Kailash Chaudhary, Dr. Sanyog Rawat, Dr. Umesh Dwivedi, Dr.
Deepak Unune, Manoj Gupta, Sivadasan. M., Vimal Pathak, Ramanpreet Singh, Prashant
Athanker, Abhishek Tripathi, Vijendra Jain, Umesh Surhar and Sagar Kumar who made
my stay memorable in the department. Finally, but not the least I am very thankful to my
son Rishi Raj Nayak and wife Aruna Nayak who have surrendered their priority and time
for me.
Chitresh Nayak Department of Mechanical Engineering
Malaviya National Institute of Technology, Jaipur
v
ABSTRACT
The main objective of this thesis is to design and develop of transtibial prosthetic
socket to improve patient’s comfort. The manufacturing of residual limb prosthesis
socket that is comfortable for the amputee depends on prosthetic practitioner’s
knowledge of socket biomechanics and skill. It involves multistage manual corrections
depending upon the clinical condition of the patient's residual limb which may be
affected by shrinkage or possible damage of Plaster of Paris (PoP) mold.
The research reported in this thesis involves five parts: The first part consists of
process simplified through digitization, it integrates conventional PoP processes, reverse
engineering (RE), and additive manufacturing (AM) technologies to design and develop
a socket. The stereolithography (STL) file generated from the scan data was modeled on
a fused deposition modeling (FDM) based AM. The second part consists of identification
of optimum pressure distribution of the prosthetic socket under specific load using finite
element analysis (FEA). Plaster of Paris (PoP) sockets of different clinical cases and
below Knee (BK) amputees having different stump geometries have been considered in
this thesis. The quantification of location, intensity, and distribution of stress-strain on
the socket leads to improved socket design. The third part predicts the pressure
distribution/ pressure measurement around the lower limb/prosthetic socket with the help
of Fuji film. Also, a sensor based methodology for effective pressure measurement at the
stump-socket interface integrating regression technique and genetic algorithm (GA). An
experimental setup is developed for force investigation of the lower limb socket using the
FlexiForce sensor. The fourth part evaluates the effects of patient-specific physiological
parameters viz. height, weight, and stump length on pressure development at the
transtibial prosthetic limb/socket interface. The measured maximum pressure data related
to subject's physiological parameters is used to develop the (ANN) model. The fifth part
consisting of fitment of socket based on topology optimization was assessed with the
help of INSPECTPLUS and GEOMAGIC reverse engineering tools.
Technological advances in prosthetics have attracted the curiosity of researchers
in monitoring design and developments of the sockets to sustain maximum pressure
without any soft tissue damage, skin breakdown, and painful sores. This approach takes
the guess work out of prosthetic practitioner’s job, ensures better fitment, and shortens

vi
the total fabrication time leading to improved patient satisfaction. This study will provide
an important platform for the design and development of patient-specific prosthetic
socket which can ensure the maximum pressure conditions at stance and ambulation
conditions. This will help the prosthetist in developing an accurate socket in the first trial
providing comfort for the patients by adequate socket fitting.

vii
TABLE OF CONTENTS
Certificate iii
Acknowledgements iv
Abstract v-vi
Contents vii-x
List of Figures xi-xiii
List of Tables xiv
List of Abbreviations xv-xvi
CHAPTERS Page No.
Chapter 1: Introduction 1-12
1.1 Background and Motivation 1
1.2 Transtibial Amputation 3
1.3 Transtibial prosthetic sockets 4
1.4 Importance of socket fitting 7
1.5 Thesis Statement 10
1.6 Hypothesis 10
1.7 Thesis Organization 11
Summary 12
Chapter 2: Literature Survey 13-51
2.1 On the basis of prosthetic socket fit and design 14
2.1.1 Residual limb volume measurement techniques 14
2.1.2 Prosthesis socket fabrication 16
2.1.3 Types of prosthetic socket 17
2.2 On the basis of geometry acquisition of socket 22
2.2.1 Internal geometries 22
2.2.2 External geometries 24
2.3 On the basis of finite element analysis socket optimization 27
2.4 On the basis of pressure measurement and stress distribution 30
2.5 On the basis of additive manufacturing 38
2.6 The Knowledge Gap in Earlier Investigations 50

viii
CHAPTERS Page No.
2.7 Objectives of the Present Work 50
Summary 51
Chapter 3: An Automated Process for Designing Prosthetic
Socket 53-73
3.1 Traditional Methods of Prosthetic Socket Fabrication 53
3.1.1 Stump Measurement 54
3.1.2 Plaster Casting Method 55
3.1.3 Modification of Mould 56
3.1.4 Fabrication of soft plastic socket 57
3.1.5 Fitting of the socket 59
3.2 Proposed Methodology for Prosthesis Socket Manufacturing 60
3.2.1 Scanning processes 63
3.2.2 Digitization (data capturing) 64
3.2.3 Scanning of Clinically Significant Cases 65
3.2.4 Post processing of point cloud data 67
3.3 RE tool Application 67
3.4 CATIA Methodology for Generating Free Form Surface from the Point Cloud Data 69
3.4.1 Filtering technique effect 69
3.4.2 Mesh smoothing process analysis 70
3.4.3 Decimation and optimization mesh process 70
3.4.4 Surface generation 71
3.5 Importance of PoP socket scanning 71
Summary 73
Chapter 4: Finite Element Analyses of CAD model of Socket
obtained using RE 74-93
4.1 Geometry acquisition and digitization of PoP socket 74
4.2 Creating CAD Model 77
4.3 Generation of Finite Element model 77
4.3.1 Mid-surface 78
4.3.2 Mesh Generation 79
ix
CHAPTERS Page No.
4.3.3 Element Quality Check 81
4.3.4 Material Properties 82
4.3.5 Loads and Boundary Conditions 83
4.3.6 Stress Distribution 84
4.4 Socket thickness design based on aspect ratio criteria 88
Summary 93
Chapter 5: Experimental Pressure measurement between stump
and socket 94-116
5.1 Measuring interface Pressure using sensors 94
5.2 FUJIFILM Pressure Film 95
5.3 Pressure measurement on stump 97
5.4 Flexi force pressure sensors 99
5.4.1 Genetic Algorithm 101
5.4.2 Experimental Setup 102
5.4.3 Circuit Construction 104
5.4.4 Data Acquisition 104
5.4.5 Optimization problem formulation 107
Summary 112
Chapter 6: Investigations into effect of Physiological Parameters
on Socket Design using Artificial Neural Network Analysis 113-133
6.1 Evaluation Methodology 113
6.2 Experimental Details 117
6.3 Artificial Neural Networks 125
6.4 Taguchi Experimental Analysis 130
Summary 133
Chapter 7: Additive Manufacturing of socket based on Topology
optimization 134-149
7.1 Design Optimization 134
7.2 Transtibial socket model preparation 136
7.3 Topology optimization of socket model 138
7.4 Prosthetic socket fabrication using additive manufacturing 142
x
CHAPTERS Page No.
7.5 FDM based Additive Manufacturing for Generating Topology Optimized Sockets
144
7.5.1 Fabrication of 3D printing socket 144
7.5.2 Dimensional evaluation 147
Summary 149
Chapter 8: Conclusions and Future Scope 150-152
8.1 Contribution of the research work 150
8.2 Scope for future work 152
Reference 153-174
List of Publications 175-176
Brief Bio Data of the Author 177

xi
LIST OF FIGURES
Figure
No.
Title Page
No.
1.1 Amputation regions on below-knee 4
1.2 Transitibial prosthetic socket 6
2.1 Measurement devices 15
2.2 Socket design based on a plaster cast 17
2.3 Patellar Tendon Bearing Socket 18
2.4 Total Surface Bearing Socket 19
2.5 PTB & TSB Socket 21
2.6 FE mesh model of residual limb, Prosthetic socket and bones 28
2.7 Optimized prosthetic feet using SLS technology 30
2.8 Experimental equipment 31
2.9 Experimental Sensor 32
2.10 Socket axis locator 32
2.11 Experimental devices 33
2.12 Pressure transducer mounted on the measurement site of PCast system
34
2.13 (a) Sensor placement on limb (b) Strain ascent (c) Stair descent 35
2.14 (a) F-socket sensor (b) Sensors placed inside the socket 36
2.15 Location of strain gauge on socket 37
2.16 (a) Strain gauge based transducer (b) Pressure being applied on socket
38
2.17 Additive manufacturing of socket 39
2.18 Prosthetic Socket manufactured by SLS technology 40
3.1 Stump measurement of amputee’s limb 54
3.2 Wrapping POP bandages, applies pressure on the pressure-tolerant areas at patella tendon
55
3.3 Manually modifications at patella tendon area 57
3.4 Fabrication and finishing of socket 58
3.5 Soft-socket trail with patient in supine 59
3.6 Comparison between traditional and proposed integrated RE and AM based socket
61
3.7 Flowchart of reverse engineering 62
3.8 PoP Socket used for scanning 63
3.9 (a) Scanning of Plaster of Paris socket model 64

xii
Figure
No.
Title Page
No.
3.9 (b) 3D scanning arrangement 65
3.10 Stumps of different causalities – Case study 66
4.1 (a) Preparing PoP bandage (b) Cover the stump wit click film
(c) Marking the pressure relief area at the patellar tendon (d) PoP cast is removed from the Patient residual limb
75
4.2 Digitization of PoP cast, then scan view of anterior and posterior 76
4.3 Flow chart of steps for FEM analysis on Altair HyperWorks 78
4.4 Extracting the mid-surfaces from outer and inner surfaces in
HyperMesh
79
4.5 Meshed models with different element types 80
4.6 Mesh model of PoP socket of P1, P2 and P3 (right and left Limb) 80
4.7 Loads and boundary conditions of patient P2 83
4.8 Anterior and Posterior deflection pattern and Von Mises stress
distribution of P1
84
4.9 Anterior and Posterior deflection pattern and Von Mises stress distribution of P2
84
4.10 Anterior and Posterior deflection pattern and Von Mises stress distribution of P3 left limb
85
4.11 Anterior and Posterior deflection pattern and Von Mises stress distribution of P3 right limb
85
4.12 Geometry of the short and long below-knee stump 88
4.13 Anterior and posterior view of the short stump socket (HDPE) deflection at different thickness 3mm, 4mm, 5mm and 6mm
89
4.14 Anterior and posterior view of long stump socket (HDPE) Maximum Von-Misses Stress at different thickness 3mm, 4mm, 5mm and 6mm
90
4.15 Displacement and von mises stress in pressure tolerant area verses
thickness
92
5.1 Pressure measurement around the residual limb 96
5.2 Layout of the pressure sensing regions 97
5.3 Pressure distribution recorded around the residual limb during static load-bearing
98
5.4 FlexiForce pressure sensor 100
5.5 Flexiforce set up with a National Instrument system 103
5.6 Circuit diagram 104
5.7 The pressure points and fitting of sensor on the limb 105
5.8 Half load condition 109
xiii
Figure
No.
Title Page
No.
5.9 Full load condition 110
5.10 Walking load condition 111
6.1 Strain gauge 115
6.2 Anatomical physiognomies of the limb 116
6.3 Different views of prosthesis mounted with strain gauges 117
6.4 Loads to the prosthesis 118
6.5 Photograph of instrumentation with patients 118
6.6 Graphical representation of pressure measurement at critical region 123
6.7 Performance of network with varying number of neurons 128
6.8 ANN 3-8-1 architecture 129
6.9 Effect of physiological parameters on maximum pressure at
limb/socket interface
132
7.1 Topology optimization of automobile upper control arm 135
7.2 Scanned original socket model 137
7.3 Flowchart of topology optimization of socket 139
7.4 (a) Elemental thickness distribution of P1 (left) and P2 (right) 141
7.4 (b) Elemental thickness distribution of P3 (left) and P3 (right) 141
7.5 Elemental density distribution for (a) Patient 1 (b) Patient 2 142
7.6 R3D2 FDM-based additive manufacturing machine 146
7.7 Optimized Prosthetic socket using AM 147
7.8 Average deviation showing (a) Lateral and Medial (b) Posterior and
Anterior view
148
7.9 Point-to-Point deviation with actual CAD model 149

xiv
LIST OF TABLES
Table
No.
Title Page
No.
1.1 Jaipur limb fitments of artificial limb throughout the world 3
2.1 Comparison between PTB and TSB socket 20
2.2 Summary of FE modeling methodologies 41
2.3 Pressure transducers used in transtibial socket 44
4.1 General information of below Knee Amputees 75
4.2 Finite element model properties 81
4.3 Properties of different socket materials 82
4.4 Von Mises stress distribution at different regions for PoP socket 86
4.5 Displacement at different regions for PoP socket 86
4.6 Peak values of stresses and displacement at different regions for PoP socket 86
5.1 General information about patients 100
5.2 Physical Properties and performance FlexiForce Standard Model A201 101
5.3 Static and dynamic pressure (kPa) data using Flexiforce sensor 106
5.4 ANOVA table for half load 107
5.5 ANOVA table for full load 108
5.6 ANOVA table for walking load 108
6.1 Summary and characteristics of nine male test Patients 115
6.2 Strain gauge specifications 116
6.3 Pressure at different condition at different regions 119
6.4 Pressure values computed from strain-data logger system at different regions
125
6.5 Data for ANN training 126
6.6 Comparison of actual measured and ANN predicted values 129
6.7 Physiological parametric design and predicted pressure values 130
6.8 The results of ANOVA performed at the 95% confidence level 132
7.1 Dimension specification of socket models 137
7.2 Topology optimization parameters 140

xv
List of Abbreviations
__________________________________________________________
ABS Acrylonitrile Butadene Styrene AK Above Knee ANOVA Analysis of Variance
AM Additive manufacturing AP Antero-Posterior
ANN Artificial Neural Network BK Below knee BMVSS Bhagwan Mahaveer Viklang Sahayata Samiti
BPNN Backpropagation neural network CAE Computer Aided Engineering
CAM Computer Aided Manufacturing CASD Computer-aided socket design CASM Computer-aided socket manufacture
CPU Central Processing Unit CT Computed Tomography
DAQ Data acquisition FE Finite Element FEM Finite element method
FEA Finite Element Analysis FDM Fused Deposition Modeling
GA Genetic algorithm HB Higher-the-better HDPE High-density polyethylene
HT Height KP Kick point
LB Lower-the-better LDPE Low-density polyethylene LT Lateral tibia
LG Lateral Gastrocnemius ML Medio-Lateral
MG Medial Gastrocnemius MT Medial tibia MRI Magnetic Resonance Imaging
NB Nominal-the-best NGO Non-governmental organization
POP Plaster of Paris PD Popliteal depression PPT Pain-pressure tolerance
PT Patellar tendon PTB Patellar Tendon Bearing
RP Rapid Prototyping RE Reverse Engineering SLA Stereo lithography Apparatus
STL Stereo lithography SLS Selective Laser Sintering
ST Stump Length

xvi
TSB Total Surface Bearing TTA Transtibial Amputee TT Transtibial
WT Weight 1D One dimensional
2D Two dimensional 3D Three dimensional

Introduction 1
CHAPTER 1
INTRODUCTION
This thesis concerns the customized design of lower limb prosthesis socket
for below knee amputees, called ―trans-tibial‖. The process and procedures
employed for prosthesis design are crucial to improve the quality of fit, affecting the
quality of the amputee‘s life. In following section, background and motivation for
research work is briefly discussed; finally, an overview of thesis organization is
described.
1.1 Background and motivation
Artificial arms and legs, or prostheses, are designed to restore a degree of
natural function to amputees. Mechanical devices that allow amputees to walk again
or continue to use two hands have probably been in use since ancient times, the most
notable one being is the simple peg leg. A surgical procedure for amputation,
however, was not widely successful until around 600 B.C. At present, the prosthetic
socket is easily manufactured within a day. The prosthetic socket has radically
improved the life-quality of millions of amputees globally. Currently, there are more
than 30 millions of people worldwide who have amputations (Alcaide et al. 2013),
with the help of prosthesis amputees can improve the quality of life. Most involve
the lower limb at the transtibial level (Murdoch et al.; 1996, Wilson et al.; 1989).
Amputation can occur at any stages of their lives. The loss of a limb represents a
very traumatic event in one‘s life. After China, India has the highest number of
diabetic people in the world. In developing countries, including India, the
amputation rate is about 45% of diabetic foot problems, with an estimated 50,000
amputations occurring per year (Peters et al. 2016).
Amputation has important economic costs and strong physiological effects
due to the loss of functionality. Prosthetic devices represent the best solution to
restore lost functions to individuals that have undergone an amputation after
diseases or accidents. The prosthesis is an artificial extension that substitutes a
missing body part such as an upper or lower body extremity. The amputee needs a
prosthetic device and services which become a permanent event. They have a deep

Introduction 2
interaction with the human body and their functionality, comfort, and fit, depends on
the way in which the device is interfaced with the residual limb.
The number of lower- limb amputees is increasing every year globally
(Dilingham et al. 2002). Patients wearing prosthetic socket often experience
discomfort. During the last decades, there has been a steady increase in the number
of amputations due to peripheral vascular disease (54%) including diabetes mellitus
and peripheral arterial disease, trauma (45%) and cancer (less than 2%) including
tumors and congenital defects (Ziegler-Graham et al., 2008). Although not all causes
of limb loss are avoidable, the leading causes of amputation, difficulties from
diabetes and peripheral artery disease which can often prevented, and then reduced
through patient edification, disease management and regular foot screening.
In India, Bhagwan Mahaveer Viklang Sahayata Samiti (BMVSS), also
known as Jaipur Foot organization, a non-governmental organization (NGO), a
non-profit organization, is a major developer and distributor of prosthetic, orthotic,
and assistive devices throughout the developing world. The organization was started
in Jaipur, India in 1975 and now has 16 centers throughout India and some free
camps held every year in various locations of the country. With the help of BMVSS,
Jaipur Foot camps also have been conducted in 25 countries as shown in Table 1.1.
The Jaipur Foot fabricated and fitted approximately 23,000 patients annually.
BMVSS services about 80,000 patients each year by providing all artificial limbs,
calipers, crutches, ambulatory aids like wheelchairs, hand paddled tricycles and
other assistances and appliances entirely free of cost to the physically challenged
people. Using an outside funding source, they distribute all their products free to
amputees. (www.Jaipurfoot.org).
Introduction 3
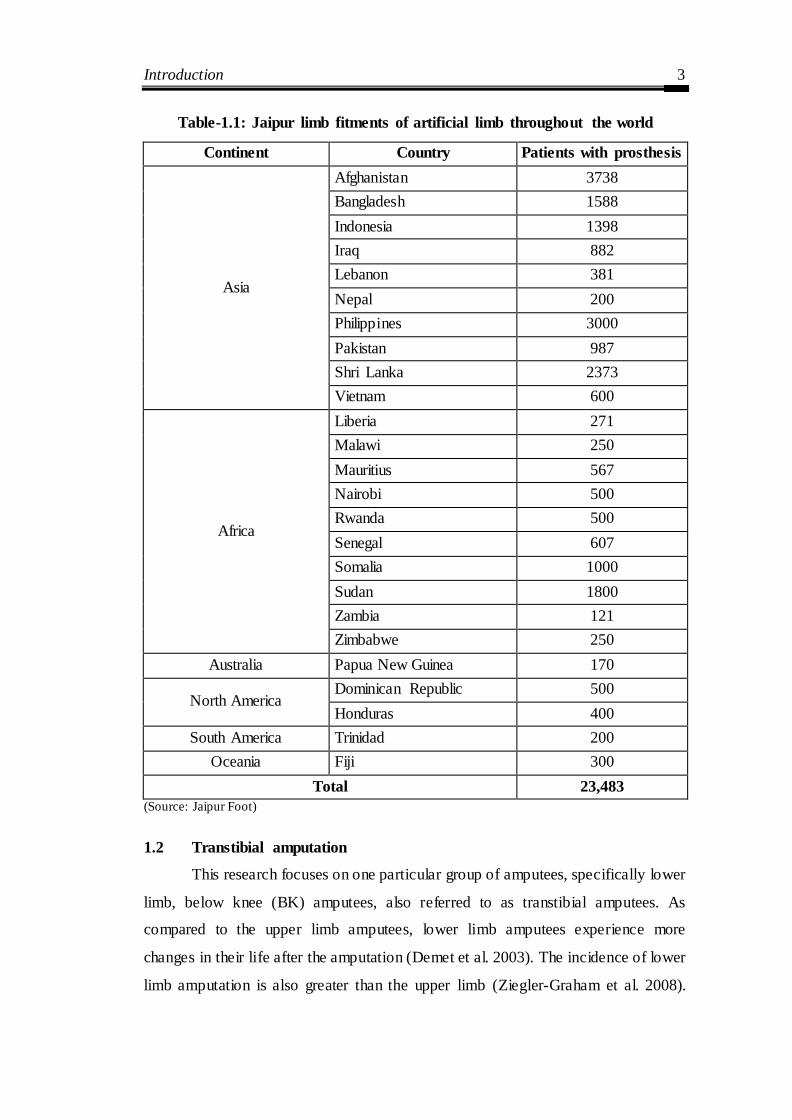
Table-1.1: Jaipur limb fitments of artificial limb throughout the world
Continent Country Patients with prosthesis
Asia
Afghanistan 3738
Bangladesh 1588
Indonesia 1398
Iraq 882
Lebanon 381
Nepal 200
Philippines 3000
Pakistan 987
Shri Lanka 2373
Vietnam 600
Africa
Liberia 271
Malawi 250
Mauritius 567
Nairobi 500
Rwanda 500
Senegal 607
Somalia 1000
Sudan 1800
Zambia 121
Zimbabwe 250
Australia Papua New Guinea 170
North America Dominican Republic 500
Honduras 400
South America Trinidad 200
Oceania Fiji 300
Total 23,483
(Source: Jaipur Foot)
1.2 Transtibial amputation
This research focuses on one particular group of amputees, specifically lower
limb, below knee (BK) amputees, also referred to as transtibial amputees. As
compared to the upper limb amputees, lower limb amputees experience more
changes in their life after the amputation (Demet et al. 2003). The incidence of lower
limb amputation is also greater than the upper limb (Ziegler-Graham et al. 2008).

Introduction 4
Trans-tibial amputations have a clear benefit over higher-level leg amputations since
the knee joint remains the artificial leg replaces functional and less mass. However,
the bony structure and the low, soft tissue coverage make it susceptible to pressure
and friction related injuries.
Amputees need a prosthetic device after limb surgery, which is an artificial
extension that replaces a missing body part. The pressure interface between the
residual limb and prosthetic socket has a significant influence on an amputee's
satisfaction and comfort. The customized socket is fitted around the amputee‘s
residual limb that supports body weight bearing throughout specific regions.
Traditionally, fitment of socket depends on prosthetic practitioner‘s knowledge of
socket biomechanics and skill. The contact pressure distribution at the socket-socket
interface has been a critical consideration for the practice of socket design. Lower
limb prosthetic socket offers interaction between the patient's stump and the
prosthesis (Powelson et al. 2012 and Ryait et al. 2012).
Figure-1.1: Amputation regions on below-knee (Seymour, 2002)
1.3 Transtibial Prosthetic sockets
The trans-tibial prosthetic socket is used for lower-limb amputees, who have
their leg amputated below the knee, i.e. across the tibia. Prosthetic is an artificial
add-on that substitutes a lost human body part. The socket portion of the trans-tibial

Introduction 5
prosthesis is the crucial element which determines the successful rehabilitatio n of
the patient (Sewell et al. 2012). The design of prosthesis socket is a challenge due to
the complex geometry of the stump which differs from one amputee to other.
Prosthesis socket aims to performance as an interface between the amputee‘s limb
and his prosthesis (Mak et al. 2001 and Moo et al. 2009).
The socket offers a perfect interface between prosthesis and residual limb,
which is designed to provide comfort, proper load transmission, and efficient
moment control. The appropriate pressure distribution between the limb/socket
interfaces is a significant factor in the socket design and fit (Mak et al. 2001). The
bone closer to the surface is one of the subtle areas which should not be exposed to
high pressure; on the other hand, pressure must be sustained by the limb's areas of
thick tissue. The prosthesis socket has critical importance as the residual limb does
not possess the same weight-bearing competencies as foot (Goh et al. 2004). The
trans-tibial prosthetic patients experience pressure between socket and stump while
performing routine actions. Therefore, a pressure measurement at the limb-socket
interface provides key information on processes of socket manufacturing, fitting and
modification. The prosthetics select the best socket design depending on the patient's
skin integrity and situation of the residual limb. Achieving a good socket-stump
interface, provides a comfortable transmission of body weight, supporting the
amputee‘s limb during the standing phase and walking, sufficient control of motion
and transfer forces from the residual limb to the prosthesis during patient‘s daily
activities, it desires to be lightweight.
The purpose of a prosthetic socket is to integrate the prosthesis as a well-
designed extension of the residual limb by providing coupling between the stump
and the prosthesis. The entire load from the residual limb is transferred to prosthesis
through the stump‘s soft tissues in contact with prosthetic socket, liner and socks.
The primary factor in determining the comfort of prosthesis and its effectiveness in
restoring the amputee mobility is the fit of prosthetic socket. Prosthetic replacement
is one of the most significant rehabilitation programs for amputee loses their limbs.
The transtibial prosthesis is collected primarily from three parts: socket, shank and
foot as shown in Figure 1.2.
Introduction 6
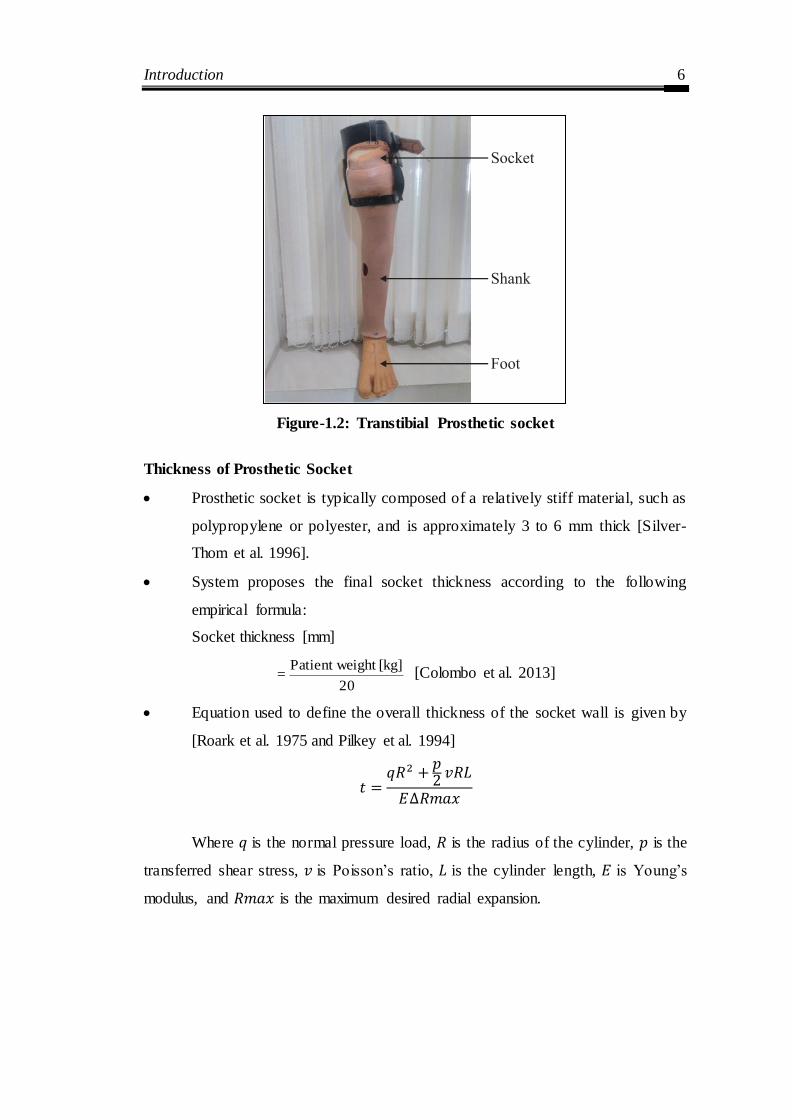
Figure-1.2: Transtibial Prosthetic socket
Thickness of Prosthetic Socket
Prosthetic socket is typically composed of a relatively stiff material, such as
polypropylene or polyester, and is approximately 3 to 6 mm thick [Silver-
Thom et al. 1996].
System proposes the final socket thickness according to the following
empirical formula:
Socket thickness [mm]
20
[kg]ight Patient we = [Colombo et al. 2013]
Equation used to define the overall thickness of the socket wall is given by
[Roark et al. 1975 and Pilkey et al. 1994]
Where is the normal pressure load, is the radius of the cylinder, is the
transferred shear stress, is Poisson‘s ratio, is the cylinder length, is Young‘s
modulus, and is the maximum desired radial expansion.

Introduction 7
1.4 Importance of socket fitting
Fitting a socket is a craftsmanship that continues to progress. If the socket
doesn‘t fit correctly, it will cause pain, sores, and blisters to the person wearing it
and prosthesis will feel heavy and cumbersome. The socket is the main interface
between prosthesis and residual stump of the patient. It helps to transfer load from
above i.e. head-trunk and swinging limb to prosthesis during walking. The other
important function of the socket is to control the residual joint motion (the main
joint which is saved after the amputation). An optimum socket fitment will cause
minimum pseudo-joint motion (motion due to slippage or stump socket poisoning).
But the residual stump, not a symmetrical structure and it varies from one individual
to another.
A new amputee will have gradual changes in the residual stump. These
changes in stump shape take place for a number of reasons and varying degree,
depending on patient‘s activities, weight, amputation procedure, health and other
issues. Therefore, each patient will have a unique condition of the stump which
requires specific socket fitment to accommodate these changes.
Traditional socket making becomes a hit and trial approach as check socket
is prepared based on subjective feedback from amputee and the skill of the
prosthetic practitioner. The main reason for this time-consuming socket fitting
process is the various sources of pain in stump due to interface pressure. Stump-
socket friction during walking varies depending upon socket design; material also
affects the comfort of the residual limb. Also, ill- fit prosthesis causes severe
discomfort due to uncontrolled pressure on the already distressed residual limb.
Therefore, to improve the patient condition in prosthetic fitment advance technology
can play a crucial role.
Conventional techniques used externally obtained anthropomorphic data to
produce prosthetic socket through a laborious, experience-based artisan skill.
Reverse Engineering (RE) has the competence to shorten the product development
cycle time by process integration and manual intervention. A topographical image of
the stump is acquired using an optical digitizer and eventually creates a positive
Introduction 8
mold. Furthermore, researchers have applied the concept of Reverse Engineering
using CAD technology for possibilities of developing prosthetic sockets through
Additive Manufacturing. Tay et al. (2002) described a CASD/CASM method for
prosthetic socket manufacturing. It was found that FDM provided excellent
fabrication results, but a major drawback is long construction time (about 30 hrs)
which was not reflected to be cost-effective. Patient-specific prosthetic socket using
RP technique proved that the socket fabricated using this method is beneficial in
durability, time saving, cost and accuracy of the socket than other manual methods.
However, comfortable prosthetic sockets manufactured by 3D printing have been
used in preliminary fittings with patients. One of the principle benefits of FDM
technology is the use of various materials which includes ceramic materials,
polymers (synthetic and natural), metals and biodegradable materials with a
promising avenue for cost reduction in the development of prosthetic socket
(Herbert et al. 2005, Hsu et al. 2010, Sengeh et al. 2013 & Tzeng et al. 2015).
A good custom-made model can only be achieved if the measurement and
the casting of the stump are precise and manufacturing is accurate. The traditional
manual production of artificial limbs is carried out by first creating negative, and a
positive cast of the asymmetric shaped residual limb which may lead to inaccuracy
and ultimately results in the pain and difficulty in prosthetic use (Bowker et al., 1992
and Rogers et al. 2007).
Integration of advanced tools like reverse engineering, CAD, and FEM plays
an essential role in improving the design, analysis, and manufacturing of the socket.
Finite element method (FEM) is applied to predict pressure and stress occurring in
prosthetics in Clinical Biomechanics (Krishna et al. 2015 & Jia e t al. 2004). The
behavior of prosthetic socket has been studied based on certain assumptions, such as
ignoring the friction/slip at the limb-socket coupling and the pre-stressed produced
by donning the limb into a shape-modified socket (Zachariah et al. 2000 & Zhang et
al. 2000). FE models for BK amputees have also been originated to manifest the
stress-strain coupling among socket and stump (Lee et al. 2007 & Portnoy et al.
2009). In another approach, contact interface is modeled considering the friction/slip

Introduction 9
circumstances and pre-stresses applied to the limb within a correct socket (Lee et al.
2004).
At present, automation has been used to help fit amputees with prosthetic
limbs. Eighty-five percent of prosthetic facilities prepare a mold from the design of a
model of the patient‘s lower limb, using CAD/CAM. Laser-guided measuring and
fitting are also available. The advent of digital technology for prosthetic and orthotic
practice plays a significant role in the clinical treatment. Pressure is one of the most
important factors for proper fit, comfort, and capability to bearing the load of the
prosthetic socket. Fuji film has been determined to be an exact and reliable method
for determining contact areas and stresses within the stump-socket. The possibility
of using the Fujifilm pressure measurement system providing reliable information
on socket fit. The method discussed can be used for designing, fabrication, and
application of the transtibial prosthetic socket.
Prosthetic socket is a freeform shape in which numerous control factors
collectively find out the performance output (i.e. Pressure), and there is enormous
scope in it for application of opposite statistical techniques for process optimization.
But unfortunately, no studies were found on the relation between amputee‘s
physiological parameters and the maximum pressure measured at the limb/socket
interface. The present work addresses this aspect by adopting regression technique,
genetic algorithm (GA) and statical method to optimize the process parameters. An
experimental setup is developed for force investigation of the lower limb socket
using the FlexiForce sensor. The pressure values at the limb/socket interface were
clinically measured during stance and walking conditions of different patients using
strain gauges placed at critical locations of the stump for each patient. But when we
require characterizing all the likely combinations of the prosthetic socket, a
prediction model based on Artificial Neural Network (ANN) can be formed. A well
trained or designed prediction model can be used to predict the output (Pressure) for
any combinations of the input variables (height, weight, and stump length).
Against this background, the present research work has been undertaken to
study the customized prosthetic socket design and optimization of the interface

Introduction 10
pressure between stump-socket. For this, firstly develop a novel digital process for
customized prosthetic socket design and afterward effective pressure measurement at
the stump-socket interface under different loading conditions, evaluation of amputee‘s
physiological parameters, and statistical interpretation of the various test results.
1.5 Thesis Statement
This thesis presents a CAD/CAE based approach for producing a topology optimized
prosthetic socket for transtibial amputees using anthropomorphic data obtained from
surface scanning. The fundamental goal of a comfortable socket design is to maintain
reduced socket interface pressure on anatomical landmarks including the fibula head,
tibia, medial tibial flare, lateral femoral condyle and the medial femoral condyle.
Increasing compliance over these locations while maintaining structural integrity for
dynamic walking activities is crucial. Unlike previous works, this thesis presents a
novel approach for developing a CAD model of Prosthesis socket. Based on finite
element analysis and experimental pressure measurements, interface contact peak
pressures at the anatomical features were predicted. The resulting peak pressures were
redistributed using topology optimization and finally, the improved socket design was
3D printed using FDM-based additive manufacturing technology. The accuracy of the
resulting socket was verified using the traditional methodology.
1.6 Hypothesis
A CAD/CAE based fabricated topology optimized socket using a transtibial mapping
generated from the quantitative 3D anthropomorphic data of a residual limb will
maintain reduced socket-residual limb interface peak contact pressures for an
amputee. Improved comfort resulting from lower peak pressures is anticipated in a
topology optimized socket over a conventional socket.
Introduction 11
1.7 Thesis organization
This thesis contains eight chapters which are arranged as follows:
Chapter One: Introduction
The background, motivation and significance of the research work to
develop a customized prosthesis socket design are presented in this chapter. It also
highlights the outlines the organization of the thesis.
Chapter Two: Literature Review
This chapter included a literature review and developed for the customized
prosthetic socket to deliver a summary of the base of knowledge previously
available including the issues of interest. It presents the research works on lower
limb prosthesis sockets as well as the various technologies employed by various
investigators.
Chapter Three: Reverse Engineering (RE) and Computer Aided Design (CAD)
based Customized Prosthetic Socket Design
This chapter discusses the traditional and innovative approach to developing
a customize socket design. It presents the detail fabrication of below-knee socket at
Bhagwan Mahaveer Viklang Sahayata Samiti (BMVSS).
Chapter Four: Finite Element Analyses of CAD Model of Socket Obtained
using Reverse Engineering
This chapter presents a new perspective for identifying stress to optimize and
improve socket design using finite element analysis (FEA) method. The method to
reduce the stress on socket through topology optimization is also presented.
Chapter Five: Experimental Pressure measurement between stump and socket
This chapter presents a discussion on results of pressure distribution around
the residual limb under different loading conditions. It includes two different types
of sensors for optimized pressure between stump-socket interfaces.

Introduction 12
Chapter Six: Prosthetic socket pressure prediction using ANN
This chapter includes, predicting the pressure under different operating
condition using artificial neural networks (ANN) technique and the compared with
experimental results. Finally, the outcomes of pressure behavior optimized by
Taguchi experimental design and the most significant factor are determined by
ANOVA.
Chapter Seven: Additive manufacturing of socket based on Topology
optimization
This chapter presents, the dimensional evaluation of AM socket based on
topology optimization
Chapter Eight: Conclusions and Future Scope
The experimental and analytical results obtained are summarized in this
chapter. It also addresses the contributions and future scope of the research work.
Chapter Summary
This chapter describes the background, motivation, and significance of the
research work and it also contains brief information about the seven chapters of the
thesis.

Literature Review 13
CHAPTER 2
LITERATURE REVIEW
Introduction
This chapter presents an extensive literature review which provides
background information on the research topics of the current investigation. This is a
multidisciplinary research covering a broad range of subjects including pressure
sensors, additive manufacturing and FEM Analysis with reverse engineering of
customized prosthesis socket design. Several review papers such as Sander (1995),
Cummings (1996), Silver-Thorn et al. (1996), Zhang et al. (1998), Mak et al. (2001),
Linde et al. (2004), Baars et al. (2005), Collins et al. (2006), Sagawa et al. (2011),
Sander (2011), Gholizadeh et al. (2014), Andrysek (2010) Sang et al. (2016), Al-
Fakih et al. (2016) has been published on prosthetic socket design & manufacturing,
stump-socket interface stress measurement and evaluation considerations for
prostheses in the developing world. In a previous study, researchers have integrated
the rapid product design and development with an goal to treat many concepts of 3D
scanning, CAD-based modeling, and 3D printing, 3D scanning technique combined
with RE and rapid prototyping (RP) principles for inspection of part quality,
introduced an approach that combines scanning technology, computer aided design,
and Rapid Prototyping.
Traditional fabrication of these sockets has always been a time-consuming
and complicated task. However, recent studies and investigation have shown the
feasibility of using scanning technology, computer aided design (CAD), Finite
Element Analysis and 3D Printing techniques in prosthetics. Therefore, the goal of
this thesis was to use existing technologies to improve the current procedure for
prosthesis socket design.
The methods available in the literature can be classified as follows:
On the basis of prosthetic socket fit and design
On the basis of geometry acquisition and CAD based digitization of socket
On the basis of optimization of the socket using Finite Element Analysis
On the basis of pressure measurement and stress distribution
On the basis of additive manufacturing

Literature Review 14
At the end of the chapter, a summary of the literature survey and the
knowledge gap in the previous investigations are presented.
2.1 On the basis of prosthetic socket fit and design
Traditional prosthetic socket manufacturing processes invariably is an artistic
and a labour intensive process. In this method prosthetist must know the complete
topology of the amputee‘s stump and needless to say, many factors affect the design
and quality of fit. A suction socket for the above-knee prosthesis was created at the
University of California (UC), Berkeley by (Eberhart et al., 1954). Additionally,
several corrections/innovations in below-knee socket design created by prosthetic
practitioners in several parts of the developing country (Radcliffe and Foort; 1961,
Berlemont et al., 1969, Kay et al., 1975, Michael et al., 1986).
2.1.1 Residual limb volume measurement techniques
Amputee wears prosthetic socket which must oblige a broad range of
function because of the residual limb volume changes during the entire day. It is
required that the socket, adjust to accommodate changes in volume to maintain
proper fit and comfort. Wilson et al. (1987) describe a preliminary prosthesis socket
design with six amputees, by fabrication techniques for adjustable volume trans-
tibial socket. The authors defined the purpose of their socket as custom fitted; using
existing prosthetic molding, modification, and fabrication techniques; control
volume equally or selectively between proximal and distal parts of the residual limb;
have standard prosthetic Cosmesis, and be light but durable. The main problems
arrive at maintaining the prosthesis socket comfortable and an accurate fit. It is due
to changes in residual limb volume and shape due to edema and muscle atrophy
occurring post-amputation (Golbranson et al., 1988).
Insufficient control of residual limb volume leads to delay prosthetic fitting.
The advantage of early fitting with a prosthesis have been suggested to include
achieving a more normal gait re-education; accomplishing a more independent life;
undertaking more active physical training; gaining psychological advantages such as
better acceptance of the amputation and restoration of body image; hastening the
maturation of the residual limb; and adapting the residual limb form to the definitive
socket (Lilja et al., 1997). Day-to-day changes in the volume of the residual limb
Literature Review 15
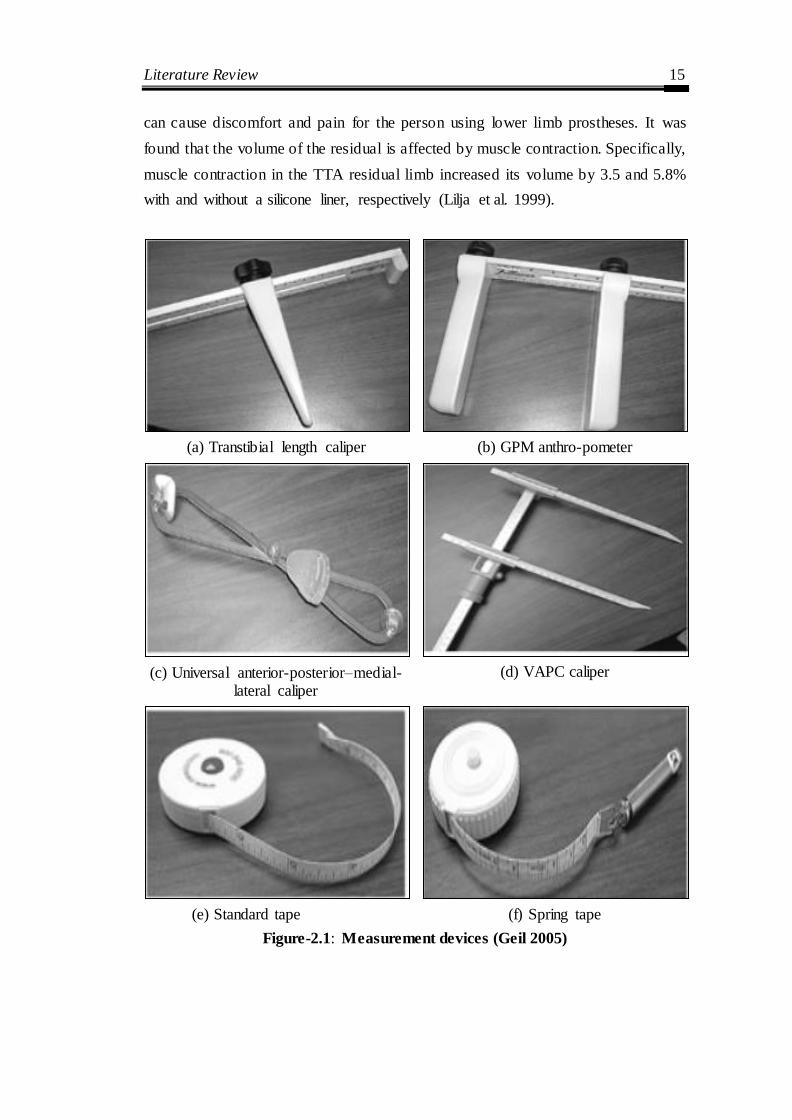
can cause discomfort and pain for the person using lower limb prostheses. It was
found that the volume of the residual is affected by muscle contraction. Specifically,
muscle contraction in the TTA residual limb increased its volume by 3.5 and 5.8%
with and without a silicone liner, respectively (Lilja et al. 1999).
(a) Transtibial length caliper (b) GPM anthro-pometer
(c) Universal anterior-posterior–medial-lateral caliper
(d) VAPC caliper
(e) Standard tape (f) Spring tape
Figure-2.1: Measurement devices (Geil 2005)

Literature Review 16
The accurate measurement of the residual limb at different anatomical
landmark which, depending on the tools such as transtibial length caliper, universal
anterior-posterior–medial- lateral caliper, standard tape, spring tape, and
circumferential tape as shown in Figure 2.1 (Geil, 2005 and Boonhong 2007). It also
depends on the Prosthetic practitioner‘s skill (Vannier et al., 1997), on the
measurement condition of the patient‘s stump. Markers on the limb identify standard
anthropometric dimensions, usually in correspondence with the articulation, the
critical parameters are observed to be such as stump length (from the under patella
support to tibia apex) and femoral condyle position. Further, casting reliability
following the shape of the socket with the control of manual dexterity during
refinement has also been reported to be a major factor (Buis et al., 2003 & Convery
et al., 2003).
2.1.2 Prosthesis socket fabrication
Prosthetic socket is the primary interface between the amputee‘s residual
limb and the artificial leg. Unlike other components, such as knee links and foot,
which are modular, the socket is custom made on the stump. A good custom-fit
model can only be achieved if the measurement and the casting of the stump are
precise and manufacturing is accurate. State-of-the-art socket developed has its
limitations. Prosthetic socket manufacture is carried out exclusively according to the
external shape of the amputation stump using manual casting methods (Foot at al.
1979, Radcliffe et al. 1957).
To create a socket by traditional manufacturing, the prosthetist has to capture
the free-form profile of the residual limb by wrapping a cast around it; either the
residual limb is loaded or unloaded. It depends on the performance and skills of the
prosthetist. Initially, creating negative and a positive cast of the asymmetric shaped
residual limb led to inaccuracy and ultimately results in the pain and difficulty in
prosthetic use (Bowker et al., 1992 & Rogers et al., 2007) as shown in Figure 2.2.
The effusion of the cast creates a positive model which serves as a negative form to
shape the prosthetic socket using plastic material (Lee et al. 1997). Alterations can
be done on the negative mold before a positive mold completely from it. However,
modifications are commonly made to the positive mold. The anatomical points of
Literature Review 17
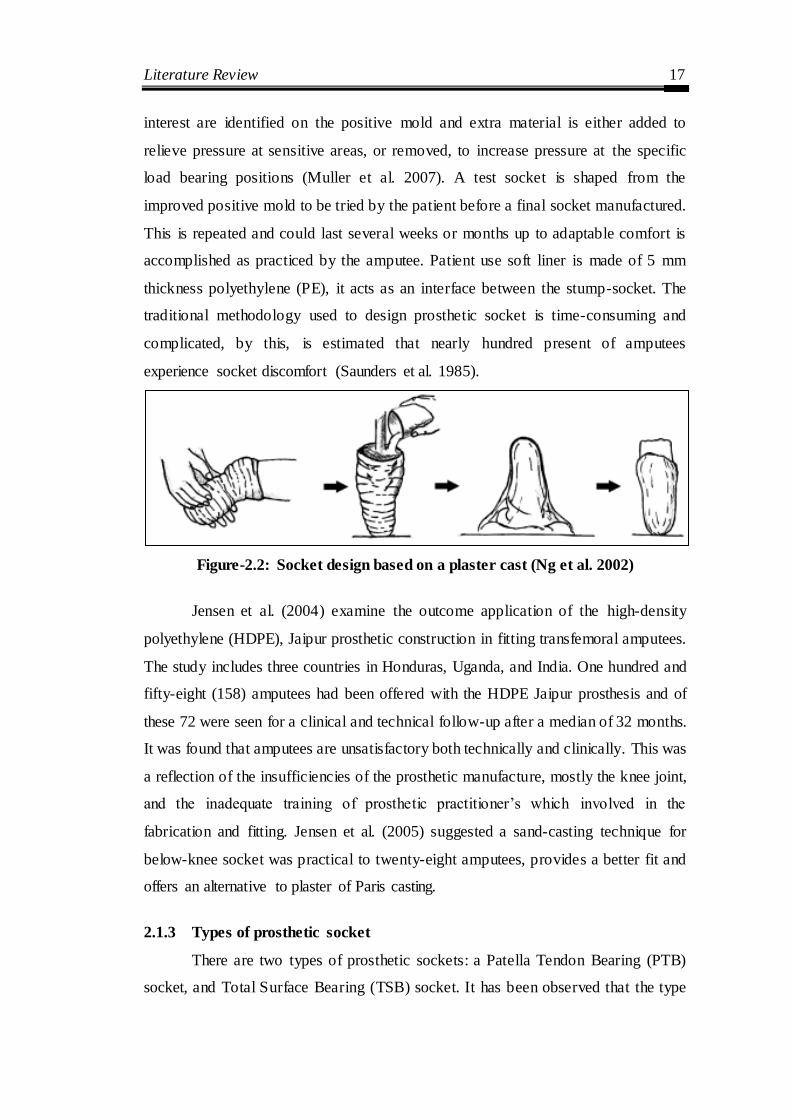
interest are identified on the positive mold and extra material is either added to
relieve pressure at sensitive areas, or removed, to increase pressure at the specific
load bearing positions (Muller et al. 2007). A test socket is shaped from the
improved positive mold to be tried by the patient before a final socket manufactured.
This is repeated and could last several weeks or months up to adaptable comfort is
accomplished as practiced by the amputee. Patient use soft liner is made of 5 mm
thickness polyethylene (PE), it acts as an interface between the stump-socket. The
traditional methodology used to design prosthetic socket is time-consuming and
complicated, by this, is estimated that nearly hundred present of amputees
experience socket discomfort (Saunders et al. 1985).
Figure-2.2: Socket design based on a plaster cast (Ng et al. 2002)
Jensen et al. (2004) examine the outcome application of the high-density
polyethylene (HDPE), Jaipur prosthetic construction in fitting transfemoral amputees.
The study includes three countries in Honduras, Uganda, and India. One hundred and
fifty-eight (158) amputees had been offered with the HDPE Jaipur prosthesis and of
these 72 were seen for a clinical and technical follow-up after a median of 32 months.
It was found that amputees are unsatisfactory both technically and clinically. This was
a reflection of the insufficiencies of the prosthetic manufacture, mostly the knee joint,
and the inadequate training of prosthetic practitioner‘s which involved in the
fabrication and fitting. Jensen et al. (2005) suggested a sand-casting technique for
below-knee socket was practical to twenty-eight amputees, provides a better fit and
offers an alternative to plaster of Paris casting.
2.1.3 Types of prosthetic socket
There are two types of prosthetic sockets: a Patella Tendon Bearing (PTB)
socket, and Total Surface Bearing (TSB) socket. It has been observed that the type

Literature Review 18
of prosthetic socket used by an amputee affects the physical and the biomechanical
situation of the residual limb.
Patella Tendon Bearing (PTB) Sockets
Patella Tendon Bearing (PTB) (See Figure 2.3) Socket is also known as
Specific Weight Bearing sockets, as the socket is molded to forces or load onto
specific areas of the stump. Created from work done at the Symposium of below
Knee Prosthetics at Berkeley, California in 1957 were formally introduced in 1959
(Radcliffe and Foort, 1961).
Figure-2.3: Patellar Tendon Bearing Socket
PTB socket design work on the principles of total contact and selective
loading theory. The design of PTB socket has changed little over the years. Total
contact theory states that all surfaces of the stump are in contact with inner walls of
the socket which does not mean total support of body weight. Selective loading
theory states to determine the pressure tolerant or intolerant of the stump. Selective
loading theory refers to the identification of specific areas of the stump that are
tolerant or intolerant of pressure. Biomechanics of the stump is described by
(Murphy et al. 1962). Pressure tolerant areas are Patella tendon, the medial flare of
tibia and popliteal area/ gastrocnemius belly. Pressure intolerant areas are a Tibial
crest, including tibial tuberosity, distal ends of the tibia and fibula, Head of the fibula
& peroneal nerve. The PTB socket design assists in controlling pressure distribution,
Literature Review 19
which changes throughout the gait cycle. (Sanders et al. 1997) was found that
maximal pressure at the anterior distal and mid portion of the stump in the first 50% of
stance, and this is shifted to anteromedial and lateroproximal sites through late stance.
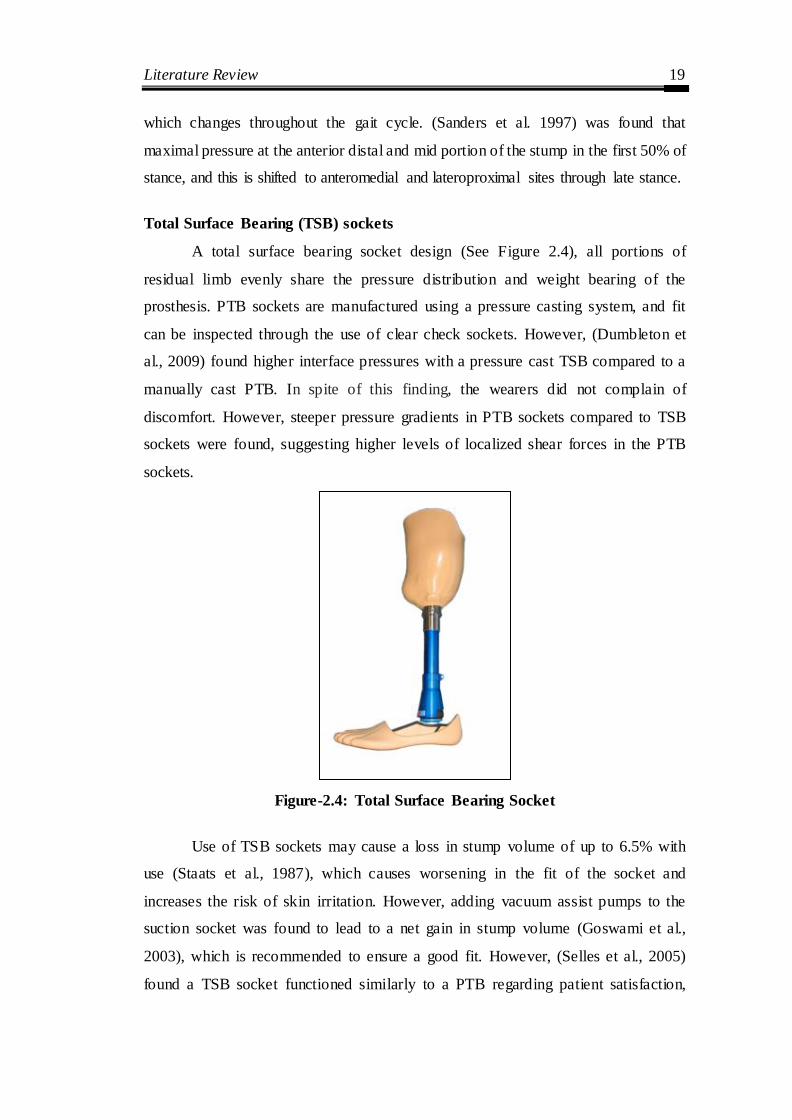
Total Surface Bearing (TSB) sockets
A total surface bearing socket design (See Figure 2.4), all portions of
residual limb evenly share the pressure distribution and weight bearing of the
prosthesis. PTB sockets are manufactured using a pressure casting system, and fit
can be inspected through the use of clear check sockets. However, (Dumbleton et
al., 2009) found higher interface pressures with a pressure cast TSB compared to a
manually cast PTB. In spite of this finding, the wearers did not complain of
discomfort. However, steeper pressure gradients in PTB sockets compared to TSB
sockets were found, suggesting higher levels of localized shear forces in the PTB
sockets.
Figure-2.4: Total Surface Bearing Socket
Use of TSB sockets may cause a loss in stump volume of up to 6.5% with
use (Staats et al., 1987), which causes worsening in the fit of the socket and
increases the risk of skin irritation. However, adding vacuum assist pumps to the
suction socket was found to lead to a net gain in stump volume (Goswami et al.,
2003), which is recommended to ensure a good fit. However, (Selles et al., 2005)
found a TSB socket functioned similarly to a PTB regarding patient satisfaction,
Literature Review 20
ADL‘s, and gait characteristics. In TSB socket, there is a greater range of knee
flexion, less traumatisation of the skin and lighter than a PTB, It has less pistoning
than a PTB (Yigiter et al., 2002). Manufacturing and fitting pressure cast TSB
sockets can be less time consuming than PTB sockets (Hachisuka et al., 1998).
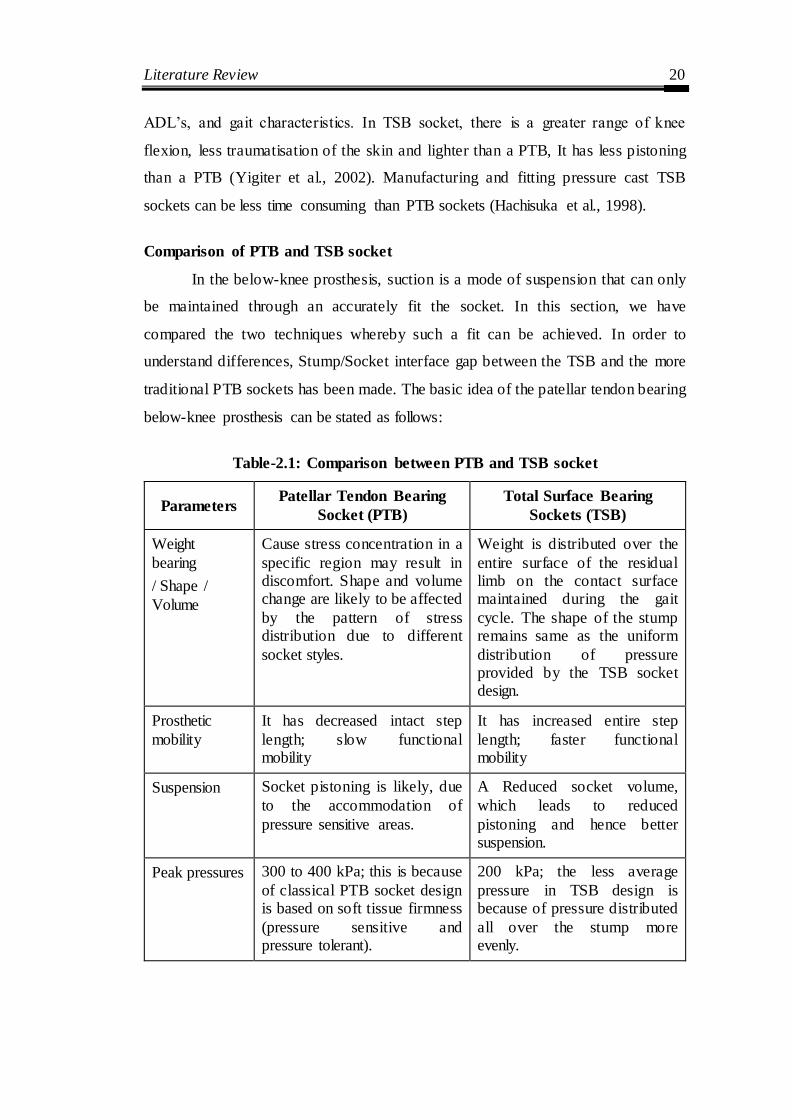
Comparison of PTB and TSB socket
In the below-knee prosthesis, suction is a mode of suspension that can only
be maintained through an accurately fit the socket. In this section, we have
compared the two techniques whereby such a fit can be achieved. In order to
understand differences, Stump/Socket interface gap between the TSB and the more
traditional PTB sockets has been made. The basic idea of the patellar tendon bearing
below-knee prosthesis can be stated as follows:
Table-2.1: Comparison between PTB and TSB socket
Parameters Patellar Tendon Bearing
Socket (PTB)
Total Surface Bearing
Sockets (TSB)
Weight
bearing
/ Shape /
Volume
Cause stress concentration in a
specific region may result in discomfort. Shape and volume change are likely to be affected
by the pattern of stress distribution due to different
socket styles.
Weight is distributed over the
entire surface of the residual limb on the contact surface maintained during the gait
cycle. The shape of the stump remains same as the uniform
distribution of pressure provided by the TSB socket design.
Prosthetic
mobility
It has decreased intact step
length; slow functional mobility
It has increased entire step
length; faster functional mobility
Suspension Socket pistoning is likely, due
to the accommodation of
pressure sensitive areas.
A Reduced socket volume,
which leads to reduced
pistoning and hence better suspension.
Peak pressures 300 to 400 kPa; this is because
of classical PTB socket design is based on soft tissue firmness
(pressure sensitive and pressure tolerant).
200 kPa; the less average
pressure in TSB design is because of pressure distributed
all over the stump more evenly.
Literature Review 21
Parameters Patellar Tendon Bearing
Socket (PTB)
Total Surface Bearing
Sockets (TSB)
Proprioception Diminished proprioception,
which may result in less control movement.
Enhanced proprioception,
therefore more controlled movement.
Pressures Distribution
Uneven distribution of pressure along the entire
residual limb-socket interface and hence, large forces applied to small areas.
Even distribution of pressure along the entire residual limb-
socket interface and forces are applied to the whole area of the stump.
Blood
Circulation
Improper blood circulation
within the stump due to uneven distribution of pressure.
Blood flow is seen to be
enhanced inside the stump.
Material Low-cost interface material
can be used for PTB socket
manufacturing. Ex. EVA can be used.
High-cost interface material is
required for making a standard
TSB socket. Ex. Silicone liner is used as a soft insert.
Fitting/
Comfort
Socket comfort or fitting are
compromised, and Ill- fitting sockets may result in
deterioration of the stump, excessive shrinkage or edema.
Socket fitting is far better as
compared to PTB Socket.
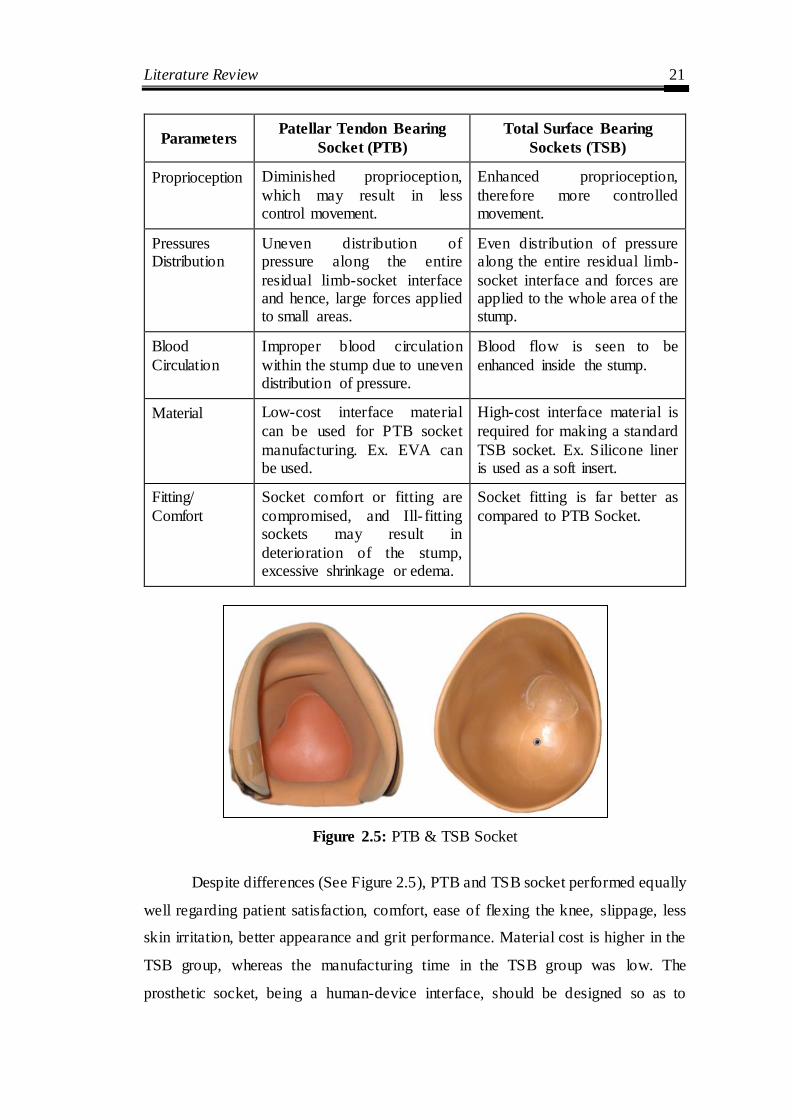
Figure 2.5: PTB & TSB Socket
Despite differences (See Figure 2.5), PTB and TSB socket performed equally
well regarding patient satisfaction, comfort, ease of flexing the knee, slippage, less
skin irritation, better appearance and grit performance. Material cost is higher in the
TSB group, whereas the manufacturing time in the TSB group was low. The
prosthetic socket, being a human-device interface, should be designed so as to

Literature Review 22
achieve flexible, lightweight, optimal load transmission, stability, and efficient
control of motion. Some early designs of the prosthetic socket such as the ―plug fit,‖
were designed as a simple conical shape with very little biomechanical rationale
involved. Over the years, it became obvious that a biomechanical understanding of the
interaction between the prosthetic socket and the residual limb is crucial to improving
the socket design. With an understanding of the residual limb anatomy and the
biomechanical principles involved, more flexible designs soon came about.
2.2 On the basis of geometry acquisition of socket and CAD based
digitization of socket
The residual lower limb focuses on constant morphological changes (Nawijn
et al. 2005), both in short and long term; these changes require a new socket
realization when any significant variation occurs. A variety of image processes has
been explored for the application in socket design. At present, there are different
techniques existing to acquire internal and external geometry of residual limb.
2.2.1 Internal geometries
The main methods for obtaining residual limb parts (bone, muscle, soft
tissue, skin and blood vessels) Computed Tomography (CT) (Smith et al. 2001)
(Lacroix et al. 2011), Magnetic Resonance Imaging (MRI) (Buis et al. 2006)
(Douglas et al. 1998), and Ultrasound (Douglas et al. 2002) that have been
integrated into CAD/CAM socket design. These noninvasive methods create cross-
section geometrical images of the residual limb, and it is possible to
analytical/reconstruct and to visualize 3D the inner part of a limb by the apparatus
using computers.
Computed Tomography is a part of traditional radiology. CT scan makes use
a wide beam of ionizing radiation in the form of X-rays. Computer handled
combinations of many X-ray images taken from a different angle to produce cross-
sectional images of specific areas, 3D model of the residual limb, permitting the user
to see both soft and hard tissues inside the limb without cutting (Webb, 1988). The
results of the CT are better than the traditional radiology regarding diagnostic
imaging of soft tissue, with using a quite high radiation dose for the patient.
Literature Review 23
Previous studies depicted that CT scan has a precision and accuracy value of 0.88
mm and 2.2 mm respectively (Commean, 1996). CT data acquisition offers faster
scanning less than a minute as compared to 3D geometry created by the FEM model
of the prosthetic stump is about 8-10 minutes (Kovacs et al. 2010). Computed
tomography (CT) permitted the integration of patient-specific stump-socket
geometry into a CAD/CAM system, performing modifications, and milling a
positive plaster likeness. In spite of being static analyses, these studies offered high
image quality and the benefit of seeing the skin. However, significant CT
disadvantages from movement artifacts were reported (Smith et al. 1995 & 1996).
Similar to CT, MRI requires the patient to adopt a horizontal position. This
posture suffers the effect of gravitational forces on the soft tissue distribution of the
residuum in connection with the skeletal structure. Nowadays, alternative MRI
scanner designs, such as upright systems, allow the patient to be also acquired in a
vertical position, avoiding the soft tissues flattering. MRI images look similar to a
CT image; however, in MRI images bones are dark in color. MRI used for learning
the shape and volume of the residual limb (Zhang et al. 1998). MRI provides high-
resolution images that show a clear difference between the tissues. However, it is
expensive and requires a longer scan time: for the whole residual limb, due to which
a compromise solution between details and scan time (approximately 10 minutes) is
obtained by using a slice thickness of 2 mm associated with 0.6 mm of in-plane
resolution (Buis et al. 2006).
Ultrasound offers the potential for imaging internal residual limb structures,
therefore contribution new vision not achieved with any of the previous technology.
However, ultrasonic imaging is a very time-consuming process, with a scanning
time of 13 minutes, creation it highly disposed to subject tremor and movement (He
et al. 1996 & 1997). One additional investigation has been reported on limb
prosthetics using ultrasound (Singh et al. 2007).
The limitations of the technology are a few such as it takes a long time to
produce an image, high cost and a scan involve ionizing radiation (Faulkner et al.
1989). Ionizing radiation (x-rays or γ-ray) contain sufficient energy to ionize atoms

Literature Review 24
and molecules within the body, causing serious and lasting biological damage. The
absorbed dose, measured per unit mass of the body, is usually considered
acceptable, but it strictly depends on the time of exposition (Dougherty, 2009).
Frequent discussions and extensively scanned areas lead to incremental considerably
the absorbed dose, making this technique harmful and then unsuitable. Smith et al.
(2013) evaluated the accuracy of the image segmentation process, printing process,
and bone surface reconstruction.
2.2.2 External geometries
After various attempts to get a customized socket, scanning is found to be
one of the best methods. However, scanning of the live residual limb is a
challenging task. It may lead to inconvenience to the patient and has a psychological
impact and physical fatigue because of holding the patient in the same posture for a
long time and patients often tend to be skeptical of scanner rays. (Varady et al.
1997) reported the possibility and problems of use of 3D scanning in interpreting
topology of simple geometries
There are two methods used to execute optical scanning is silhouetting
(Schreiner et al. 1995 & Smith et al. 1995) and fringe projection (Commean et al.
1996). With the help of silhouetting, the outline of the residual limb is observed
from different angles. By fringe projection, a fringe is used to view from different
angles of the residual limb. Both methods create 3D digital images taken from
various locations around the limb which help to calculate the volume of the residual
limb. An optical scanner is having the fast processing time, scanner acquired images
in 1.1 seconds (Schreiner et al. 1995), in 1.5 seconds (Sender et al. 2008) and 0.75
seconds (Commean et al. 1996). By collecting 3D numerical data describing the
surface of the limb and specific modification site locations; a positive mold is
produced with the help of a high-resolution numerical control (NC) milling machine
(Engsberg et al. 1992).
Another approach based on reverse engineering employs a non-contact
scanner to get the digitized point cloud data of the lower limb. Fernie et al. (1985)
and Oberg et al. (1989) introduced laser scanning for residual limb volume

Literature Review 25
measurement in the field of prosthetics and orthotics. Then, Lilja et al. (1995) and
Johansson et al. (1998) calculated the volume of residual limb taking images at
multiple positions of the limb. The advantage of this design is that the laser light is
perpendicular to the surface of the residual limb which causes minimum distortion
with scanning time 10 seconds. The strength of laser scanning approaches is that
there is no uncertainty in identifying features in the images (Turner-Smith 1997).
The CAD/CAM technology is based on three-dimensional digital programs,
on where the less possibility of human error with the rapid fabrication of the final
socket. At present, the reconstructive and corrective medicine is based on virtual
reality. A computer-aided socket design (CASD) and manufacture (CASM) method
for lower limb amputees have been established at the Medical Engineering Resource
Unit (MERU) of the University of British Columbia at Vancouver (Novicov et al.
1982 & Dean et al. 1985). The CASD system is a collaborative software package
written in PASCAL. (Sunders et al. 1985) reported the design of below-knee sockets
improved comfort for the amputee through software controlling. (Krouskop et al.
1987) Extended this method to investigate CAD technology can be used to design
socket for above-knee amputees. The CAD/CAM method offers a controlled method
for shape capturing of patient‘s lower limb with modification, an accurate method
for positive mould fabrication, a decrease in manufacture time, determines manual
correction areas, quality of fit, and an easy to sending the physical model efficiently
over the hand cast model techniques (Torres Moreno et al., 1995; Lemaire and
Johnson, 1995 & 1996). A physical model of socket obtained after 3D scanning that
can convert into a CAD model using a commercial software system such as
CANFIT, CAPOD, CADVIEW, rapid-Form. However, some limitations, several
non-contact scanners generate an enormous amount of point data. This leads to a
massive file size that needs an extensive finishing time and makes difficult to
transfer it from one place to another. Moreover, enormous time and skill are
required for surface operation on these point data.
Computer-aided design (CAD) system to construct the CAD model of that
residual limb (Hsu et al. 2001) under static and dynamic conditions. The scanned
socket model is transferred directly through a CAD interface used for rapid product

Literature Review 26
development. Varady et al. (1997) reported the possibility and problems of use of
3D scanning in interpreting topology of simple geometries. As per after mentioning,
direct scanning of the human stump either with Magnetic Resonance Imaging
(MRI), Computed Tomography (CT), the 3D scanner was involved (Bibb et al.
2000). Cugini et al. (2006) and Colombo et al. (2006) integrated reverse engineering
non-contact laser scanning and two medical imaging technologies, computer
tomography (CT) and magnetic resonance imaging (MRI) tools to optimize
reconstruct a 3D lower limb socket prosthesis design. Also, a key role is played by
the digital geometric model of the residual limb, which replaces the plaster cast
socket design. Virtual Socket Laboratory (VSL) (Facoetti et al. 2010) prepares the
socket virtual prototype directly on the digital model of the patient‘s residual limb
and simulates the real activities. The benefits of laser scanning are fast scanning
process, accuracy, consistency and clean.
Various studies demonstrated the benefits of CAD/CAM systems to design
and manufacture prosthetic socket (Spaeth et al. 2006, Oberg et al. 1993, McGarry
et al. 2005 & Hsu et al. 2000). Houston et al. (1992) conducted subjective
knowledge-based on the design of CAD/CAM studies with the below-knee
prosthetic socket. Geil et al. (2007) recorded six basic anthropometric dimensions
from CAD shape files of three positive foam models of the residual limbs of persons
with transtibial amputations. Smith et al. (2001) found no significant differences
between manual and CAD/CAM socket designs. Similarly, Sanders et al. (2007 &
2011) compared manufactured socket profile and CAD data file shapes by central
fabrication facilities for a collection of below knee amputee sockets. CAD/CAM
methodology has been used for lower limb amputees providing seamless variable
impedance prosthetic (VIPr) socket (Sengeh & Herr, 2013). Lilja et al. (1995) found
a linear, almost constant systematic error of +2.5 percent, which could easily be
corrected for, and a small random error, represented by a CV of less than 0.5
percent. Sander et al. (2011) used different computed metrics for error evaluation
(volume, shaping and size) and made the decision about clinical judgment by
comparing with these computed metrics.

Literature Review 27
The prosthesis socket having close interaction with the residual limb required
a highly customized product to accomplish comfort (Frillici et al. 2008). Colombo et
al. (2010) presented 3D model, develop a special custom-fit prosthesis socket for
lower limb amputees. Based on the same approach, Colombo et al. (2013)
introduced the virtual digital limb of patients using digital models and virtual tools.
By using human-design interface, prosthetist could modify the socket quickly and
manufacture. After various attempts to get a customized socket, scanning is found to
be one of the best methods. However, scanning of the live residual limb is a
challenging task. It may lead to inconvenience to the patient and has a psychological
impact and physical fatigue because of holding the patient in the same posture for a
long time and patients often tend to be skeptical of scanner rays. The current process
of prosthetic socket design in orthopedic technology with the integration of modern
techniques helps to achieve patient-specific socket.
2.3 On the basis of finite element analysis socket optimization
Finite element (FE) analysis is a powerful technique for assessing the
effectiveness of the developed prosthesis socket model in the last three decades. The
main advantage of using FE is to predict stress, strain, and displacement of free-
form shape for understanding load transfer in the prosthesis. Also, estimate the
interface stresses between prosthetic socket and stump. Furthermore, FE analysis
eliminates the need of building physical prosthesis by systematically investigating
different parameters. These FE models can be classified into three main parts. The
first category comprises of linear static analysis considering assumptions of linear
material properties, infinitesimal deformation and linear boundary condition without
taking any interface friction and slip. These types of models involve comparatively
small CPU time. The second category includes nonlinear analysis, considering the
nonlinear material properties, significant deformation, and nonlinear boundary
conditions, comprising friction/slip contact boundary. This kind of nonlinear FE
analysis usually needs specific iterative procedures. These nonlinear methodologies
mostly provide highly accurate solutions, however, requires more CPU time. The
third category includes dynamic models. Investigation of this type involves taking
Literature Review 28
into account dynamic loads, material inertial effects and time-dependent material
properties.
Krouskop et al. (1987) proposed a finite element method as a possible tool to
create a prosthetic socket design shape for above-knee (AK) amputees. In a parallel
effort, Steege et al. (1987a, b) established the first FE model for below-knee (BK)
residual limb and predict interface pressure between stump and socket. Subsequently,
simplified through readily accessible commercial FE computer software (Lee et al.
1992), numerous FE models have been established. If the model is not a valid
representation of the real situation, the result will be misleading. Hence, the
development of the FE model for stump/socket interface needs to be carefully
monitored, critically assessed and validated. Silver-Thorn et al. (1996) presented a
review of stress investigation engaged in experimental measurement methods and
computational model of the prosthetic socket. In another review, Zachariah, and
Sanders (2000) discussed in details FE model, then compared to experimental data
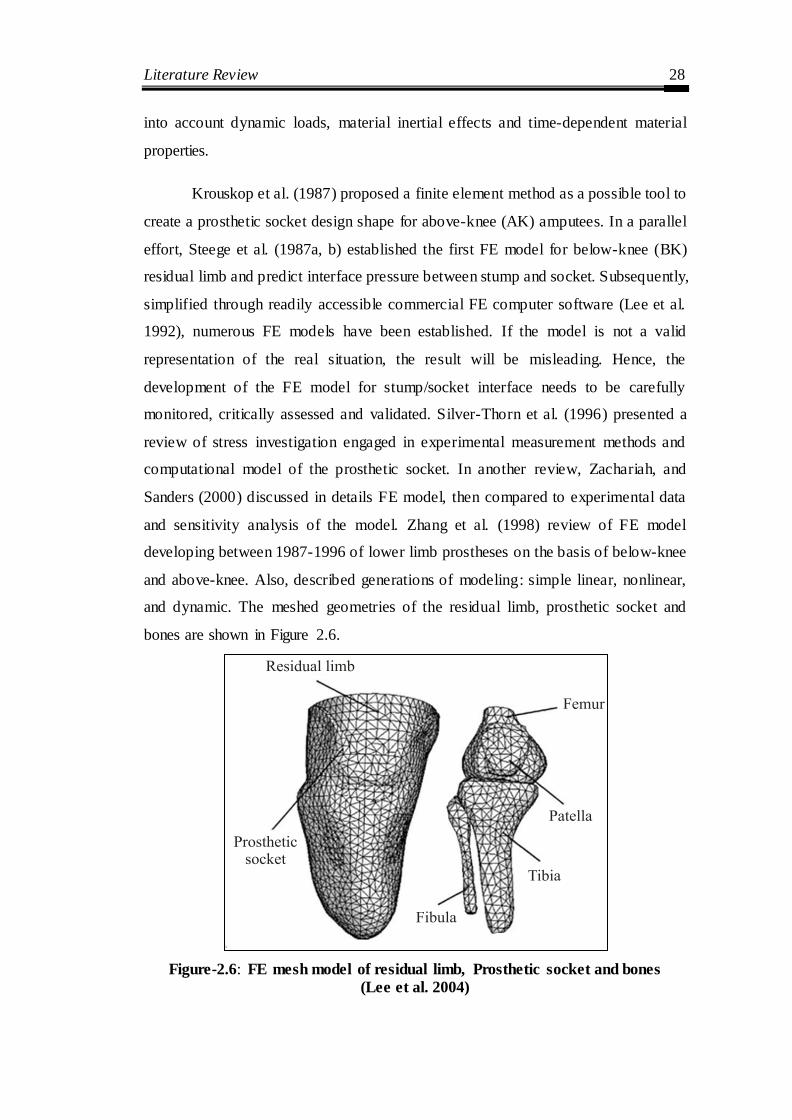
and sensitivity analysis of the model. Zhang et al. (1998) review of FE model
developing between 1987-1996 of lower limb prostheses on the basis of below-knee
and above-knee. Also, described generations of modeling: simple linear, nonlinear,
and dynamic. The meshed geometries of the residual limb, prosthetic socket and
bones are shown in Figure 2.6.
Figure-2.6: FE mesh model of residual limb, Prosthetic socket and bones
(Lee et al. 2004)
Literature Review 29
Many studies have investigated the integration of advanced technology to
evaluate the prosthesis socket design (Colombo et al. 2013). Pandey et al. (2014)
Analysis of traditional and reverse engineering (RE) based fabrication of sockets
used in artificial limbs is presented using the real data from amputees. The FEA tool
is used for parametric study and evaluation of prosthetic socket mechanisms (Geil et
al. 2002 & Saunders et al. 2003). Wu et al. (2003) Proposed finite element analysis
(FEA) technique for the evaluation protocol using pain-pressure tolerance (PPT) of
soft‐tissue to determine socket design parameters. It is useful for better
understanding of the actual socket fabrication from design. Colombo et al. (2006)
used RE techniques to obtain a digital model, which includes both the external shape
and the inner parts to integrate rapid prototyping technology. Colombo et al. (2010)
Used an integration of computer aided design (CAD), and FEA approaches to
analyze the residual limb-socket interaction over the stump. They created digital
models of the stump-socket and performed simulations for the realization of the
physical prototype.
In the field of biomechanics, FEM uses to analyze the behavior structures of
the prosthesis socket to investigate the contact pressure between computer-
interfaced prosthesis (Shankar et al. 2013, 2014). Compliant feature designs were
analyzed, using FEM to relieve pressure between the residual limb and socket under
quasi-static loading condition (Faustini et al. 2006). Similarly, Portnoy et al. (2007)
developed a patient-specific FE parametric biomechanical model of the residual
limb that predicts stresses transmitted through the muscle flap by the shin bones
during static and dynamic loading. The calculations of stress-strain condition at the
interface of the socket and stump of five transfemoral amputees were proposed by
Lacroix et al. (2011). They used patient-specific geometrical data acquired from CT
and laser scans in socket donning methodology for FEM based modeling
To identify possible structure design, topology optimization technique is
used for reducing mass and improving the performance of socket. Prasanna et al.
(2011) described the structural topology accounting for different material,
mechanical properties and weight of the socket. Faustini et al. (2005 & 2006)
identifying optimal compliant features using topology optimization, then integrating
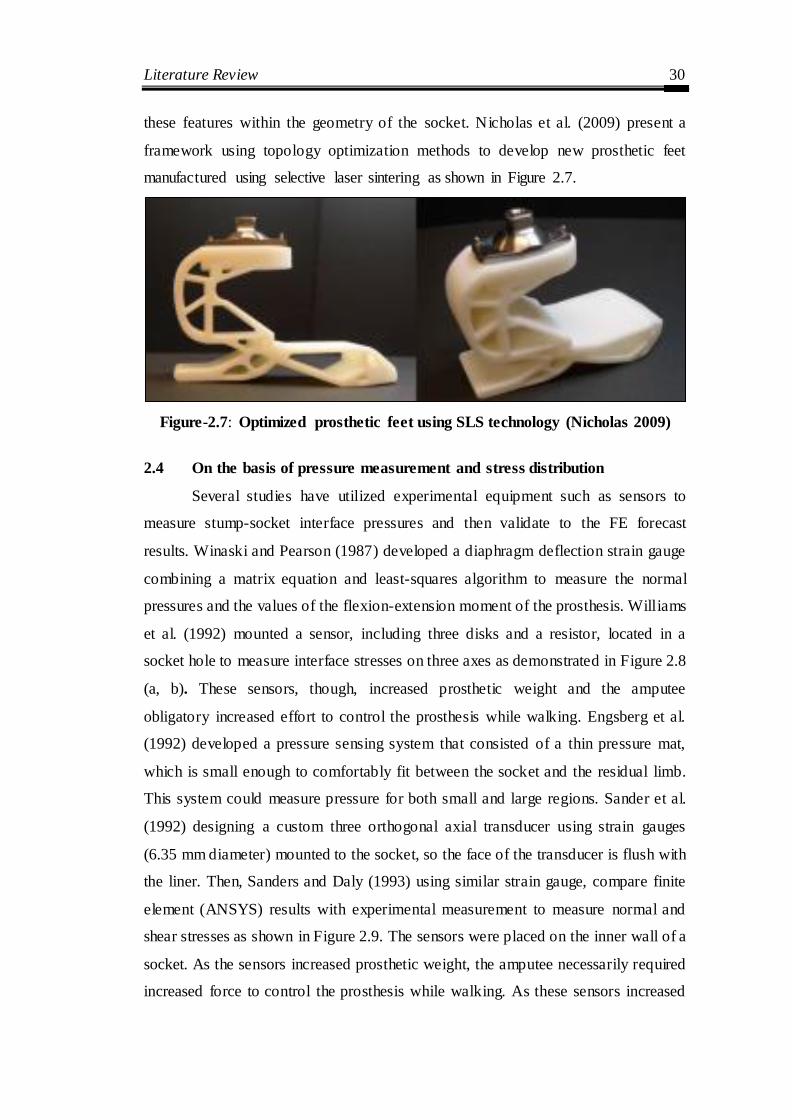
Literature Review 30
these features within the geometry of the socket. Nicholas et al. (2009) present a
framework using topology optimization methods to develop new prosthetic feet
manufactured using selective laser sintering as shown in Figure 2.7.
Figure-2.7: Optimized prosthetic feet using SLS technology (Nicholas 2009)
2.4 On the basis of pressure measurement and stress distribution
Several studies have utilized experimental equipment such as sensors to
measure stump-socket interface pressures and then validate to the FE forecast
results. Winaski and Pearson (1987) developed a diaphragm deflection strain gauge
combining a matrix equation and least-squares algorithm to measure the normal
pressures and the values of the flexion-extension moment of the prosthesis. Williams
et al. (1992) mounted a sensor, including three disks and a resistor, located in a
socket hole to measure interface stresses on three axes as demonstrated in Figure 2.8
(a, b). These sensors, though, increased prosthetic weight and the amputee
obligatory increased effort to control the prosthesis while walking. Engsberg et al.
(1992) developed a pressure sensing system that consisted of a thin pressure mat,
which is small enough to comfortably fit between the socket and the residual limb.
This system could measure pressure for both small and large regions. Sander et al.
(1992) designing a custom three orthogonal axial transducer using strain gauges
(6.35 mm diameter) mounted to the socket, so the face of the transducer is flush with
the liner. Then, Sanders and Daly (1993) using similar strain gauge, compare finite
element (ANSYS) results with experimental measurement to measure normal and
shear stresses as shown in Figure 2.9. The sensors were placed on the inner wall of a
socket. As the sensors increased prosthetic weight, the amputee necessarily required
increased force to control the prosthesis while walking. As these sensors increased

Literature Review 31
prosthetic weight, the amputee necessarily used increased force to control the
prosthesis while walking. Convery and Buis (1998) used force sensing resistors
(FSR) (Figure 2.10), measurement of dynamic interface pressures between stump-
socket, during the stance phase of gait with a trans-tibial amputee. The sensors were
located on the inner wall of a PTB socket, and the data on ground reaction forces
was obtained from a force platform. The interface pressure distributions measured at
the stance phase in four surfaces of a stump, i.e. anterior surface, a lateral surface,
posterior surface and medial surface. Then, Convery et al. (1999) used the same
system, the resulting outcomes the pressure gradients within the hydrocast socket
were less than those within the hand cast PTB socket.
(a) Experimental components
(a)
(b) (c)
Figure-2.8: Experimental equipment (Williams, 1992)

Literature Review 32
Figure-2.9: Experimental Sensor (Sanders, 1993)
Figure-2.10: Socket axis locator (Convery, 1998)
Zhang et al. (1996) investigated the pressure distribution with the Tekscan
sensor in specific regions at lower limb prosthesis socket. It was found that interface
pressure increase with the decrease of friction while walking four steps, and
maximum pressure occurs over the patellar tendon area (212 kPa). Then, Zhang et
al. (1998, 2000) designed a conventional strain-gauge diaphragm method for the
effective measurement of normal force on the below-knee stump with a prosthesis
(Figure 2.11). The data was collected at 200 Hz for 20 seconds. A self-made tool
using force transducers measured normal and shear stresses. Two receivers captured
two phases of heel strike and toe off. However, these sensors increased prosthetic

Literature Review 33
weight and required enhanced force to control the prosthesis while walking. The peak
pressure over the patella tendon (215 kPa) and longitudinal shear stress were
measured over the lateral tibia (44 kPa). Sanders et al. (1997) investigated the
interface pressure and shear stresses at thirteen sites on two subjects with unilateral
transtibial amputation using PTB sockets. The results were suggested that skin across
the distal tibial crest was in tension at the time of the first and second peaks in the
shank axial force. Kim and Newman (2003) evaluated the effectiveness of the patellar
tendon bar using an experimental device, P-Scan pressure transducers, to measure
interface pressures between the below-knee residual limb and prosthetic socket.
(a) Experimental sensor layout (b) A sensor mounted on the socket
(c) Installation of equipment
Figure-2.11: Experimental devices (Zhang, 1998)
Zachariah and Sanders (2001) determined the interface stress ratio of
standing to walk at the same position of the residual limb. It was found that

Literature Review 34
correlation coefficient of 0.88 during standing with full weight bearing on the
prosthetic limb and peak stress. The fit of the socket used to interface an external
prosthesis to an amputee‘s residual limb has been manifest to be of vital importance
to prosthesis users (Legro et al. 1999, Dillingham et al. 2001) Presented in a study of
78 trauma-related amputees that, although 95% tended to wear their prostheses
extensively (>80hr/week), only 43% reported satisfaction with prosthetic comfort.
Similarly, (Nielsen et al. 1991) found that out of 109 amputees, 57% reported
moderate to severe pain most of the time while wearing their prosthesis. Then,
polliack et al. (2002) developed 4x4 matrix array of 16 capacitance pressure
mounted on a silicon substrate had an acceptable level of accuracy error, hysteresis
error and drift error.
Figure-2.12: Pressure transducer mounted on the measurement site of
PCast system (Goh, 2003)
Goh et al. (2003) used piston-type transducers to investigate the interface
pressure distribution of five amputees wearing a TSB socket developed by a
pressure profile of the PCast prosthetic socket technique (See Figure 2.12). It was
found that the hydrostatic pressure profile was not observed during standing or gait,
nor was there a standard pressure profile for the PCast socket. Zhang et al. (2000)
measured limb-socket surface forces during different activities such as standing up
from a chair or walking. Also, Dou et al. (2006) used portable, real-time, Pliance
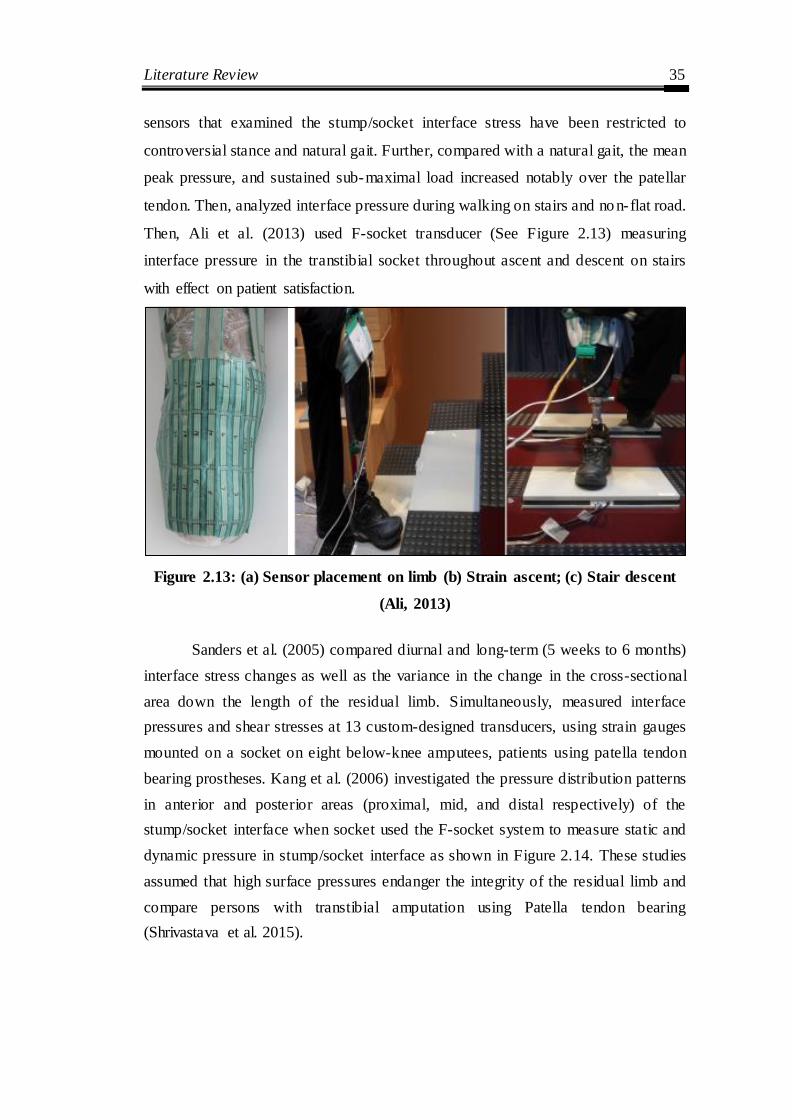
Literature Review 35
sensors that examined the stump/socket interface stress have been restricted to
controversial stance and natural gait. Further, compared with a natural gait, the mean
peak pressure, and sustained sub-maximal load increased notably over the patellar
tendon. Then, analyzed interface pressure during walking on stairs and no n-flat road.
Then, Ali et al. (2013) used F-socket transducer (See Figure 2.13) measuring
interface pressure in the transtibial socket throughout ascent and descent on stairs
with effect on patient satisfaction.
Figure 2.13: (a) Sensor placement on limb (b) Strain ascent; (c) Stair descent
(Ali, 2013)
Sanders et al. (2005) compared diurnal and long-term (5 weeks to 6 months)
interface stress changes as well as the variance in the change in the cross-sectional
area down the length of the residual limb. Simultaneously, measured interface
pressures and shear stresses at 13 custom-designed transducers, using strain gauges
mounted on a socket on eight below-knee amputees, patients using patella tendon
bearing prostheses. Kang et al. (2006) investigated the pressure distribution patterns
in anterior and posterior areas (proximal, mid, and distal respectively) of the
stump/socket interface when socket used the F-socket system to measure static and
dynamic pressure in stump/socket interface as shown in Figure 2.14. These studies
assumed that high surface pressures endanger the integrity of the residual limb and
compare persons with transtibial amputation using Patella tendon bearing
(Shrivastava et al. 2015).

Literature Review 36
Figure-2.14 (a) F-socket sensor and (b) Sensors placed inside the socket
(Kang, 2006)
Skin problems are common in transtibial amputees and are exacerbated as
70% of amputees suffer from vascular diseases and associated comorbidities. The
anterior distal tibia is a common area of skin breakdown due to increased pressure at
loading response. The internal stresses are monitored between the residuum of
transtibial amputation prosthetic during their daily activities (Portnoy et al. 2012).
Nowadays, Electromyography (EMG) signals are widely used for the
clinical/biomedical application. EMG signals acquired from residual limb muscles
require advance methods. Transmission techniques for acquisition of the EMG
(Electromyogram) signal using LabVIEW is a useful tool (Dev et al. 2015) that
quantifies the coordination between hip-thigh muscles (Bansal et al. 2011).
Piezoelectric sensors identify different phases during a gait cycle for, sit to stand,
and stair ascent (Sayed et al. 2015).
In prostheses, the interaction between stump-socket occurs due to improper
design which increases pressure/friction and subsequent surface damage to the soft
tissue. This damage is manifested in local that increases in the temperature of the
affected area. The socket is considered as an element of primary importance in the
makeup of prosthesis. Each socket is a tailor- made the device, designed to fit the
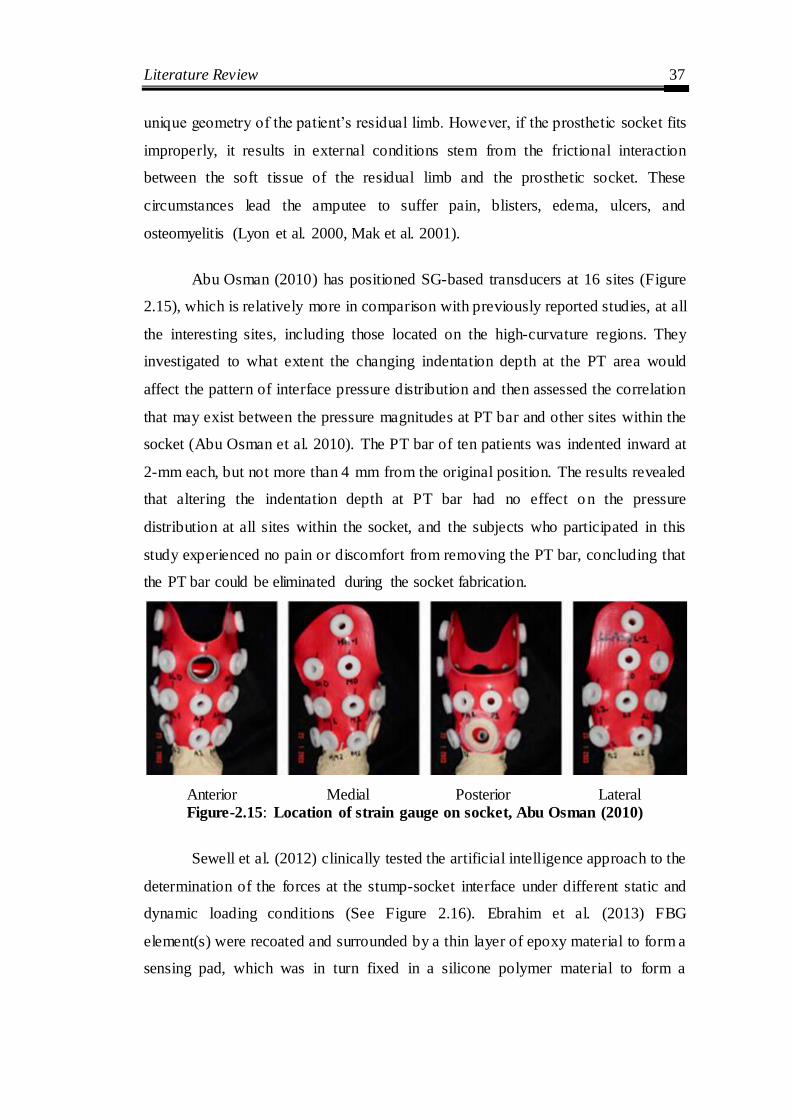
Literature Review 37
unique geometry of the patient‘s residual limb. However, if the prosthetic socket fits
improperly, it results in external conditions stem from the frictional interaction
between the soft tissue of the residual limb and the prosthetic socket. These
circumstances lead the amputee to suffer pain, blisters, edema, ulcers, and
osteomyelitis (Lyon et al. 2000, Mak et al. 2001).
Abu Osman (2010) has positioned SG-based transducers at 16 sites (Figure
2.15), which is relatively more in comparison with previously reported studies, at all
the interesting sites, including those located on the high-curvature regions. They
investigated to what extent the changing indentation depth at the PT area would
affect the pattern of interface pressure distribution and then assessed the correlation
that may exist between the pressure magnitudes at PT bar and other sites within the
socket (Abu Osman et al. 2010). The PT bar of ten patients was indented inward at
2-mm each, but not more than 4 mm from the original position. The results revealed
that altering the indentation depth at PT bar had no effect o n the pressure
distribution at all sites within the socket, and the subjects who participated in this
study experienced no pain or discomfort from removing the PT bar, concluding that
the PT bar could be eliminated during the socket fabrication.
Anterior Medial Posterior Lateral Figure-2.15: Location of strain gauge on socket, Abu Osman (2010)
Sewell et al. (2012) clinically tested the artificial intelligence approach to the
determination of the forces at the stump-socket interface under different static and
dynamic loading conditions (See Figure 2.16). Ebrahim et al. (2013) FBG
element(s) were recoated and surrounded by a thin layer of epoxy material to form a
sensing pad, which was in turn fixed in a silicone polymer material to form a

Literature Review 38
pressure sensor. Rajtukova et al. (2014) study the anterior side of the stump, three
loadable and two non- loadable areas was monitored using the TACTILUS tactile
pressure sensor (Sensor Products Inc., Madison, New Jersey, USA).
Figure 2.16: (a) Strain gauge based transducer (b) Pressure being applied on
socket (Sewell, 2012)
2.5 On the basis of additive manufacturing
Presently, the prosthetic socket is manufactured by thermoforming plastic
over positive plaster mold. A digital process starts with 3D scanning, collecting data
from the surface of the socket and generate a 3D model file to CAD software for 3D
printing. Modifications are made electronically rather than manually, which replace
the conventional fabrication of the prosthetic socket. Squirt-shape is a rapid
prototyping of a prosthetic socket was accompanied by (Rovick in 1992) at
Northwestern University. The SLA and its CAD and computer-aided manufacturing
(CAM) software had been just available for implementation in AM of custom
Orthotists and Prosthetists practitioners. The wooden CNC carved socket, plaster
residual limb model, and SLA socket from this well- recognized innovative
application of AM in O&P is shown in Figure 2.17 (a). In this research, the socket is
fabricated by the layer-to-layer concept (See Figure 2.17 (b)) to fabricate a socket
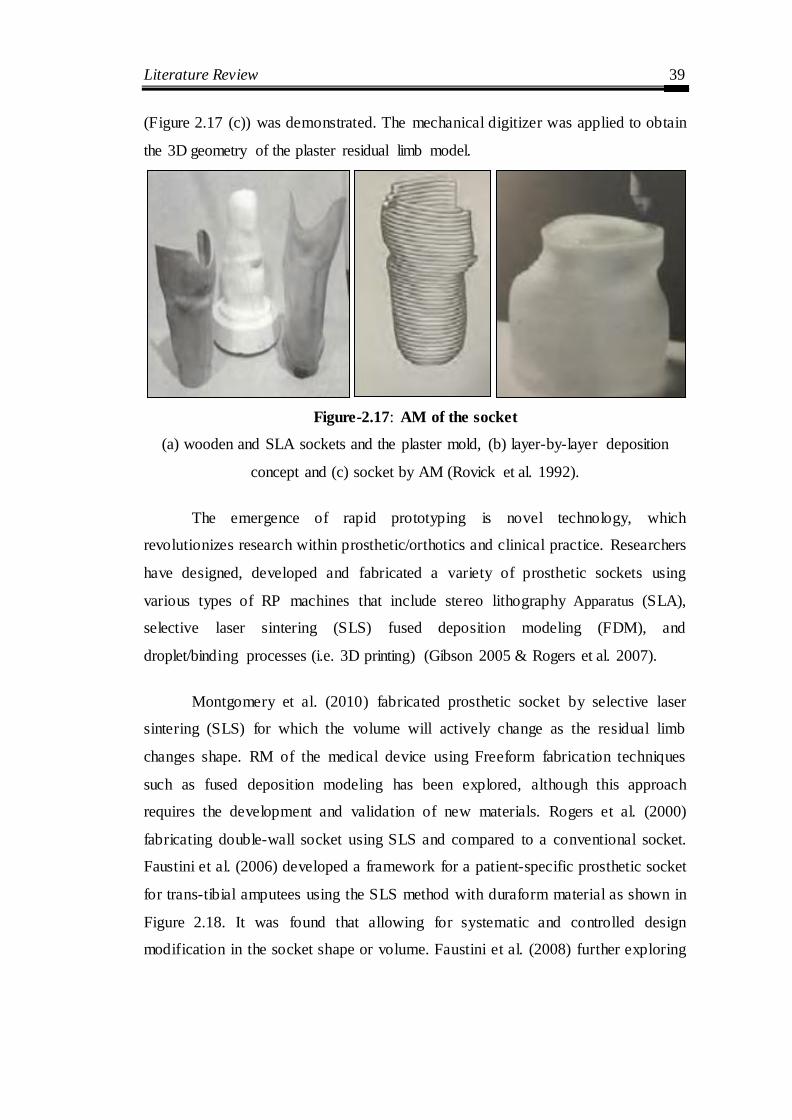
Literature Review 39
(Figure 2.17 (c)) was demonstrated. The mechanical digitizer was applied to obtain
the 3D geometry of the plaster residual limb model.
Figure-2.17: AM of the socket
(a) wooden and SLA sockets and the plaster mold, (b) layer-by-layer deposition
concept and (c) socket by AM (Rovick et al. 1992).
The emergence of rapid prototyping is novel technology, which
revolutionizes research within prosthetic/orthotics and clinical practice. Researchers
have designed, developed and fabricated a variety of prosthetic sockets using
various types of RP machines that include stereo lithography Apparatus (SLA),
selective laser sintering (SLS) fused deposition modeling (FDM), and
droplet/binding processes (i.e. 3D printing) (Gibson 2005 & Rogers et al. 2007).
Montgomery et al. (2010) fabricated prosthetic socket by selective laser
sintering (SLS) for which the volume will actively change as the residual limb
changes shape. RM of the medical device using Freeform fabrication techniques
such as fused deposition modeling has been explored, although this approach
requires the development and validation of new materials. Rogers et al. (2000)
fabricating double-wall socket using SLS and compared to a conventional socket.
Faustini et al. (2006) developed a framework for a patient-specific prosthetic socket
for trans-tibial amputees using the SLS method with duraform material as shown in
Figure 2.18. It was found that allowing for systematic and controlled design
modification in the socket shape or volume. Faustini et al. (2008) further exploring

Literature Review 40
the feasibility of using an SLS-based manufacturing to identifying the most
appropriate material for socket manufacturing.
Figure-2.18: Prosthetic Socket manufactured by SLS technology (Faustini
2008)
The rapid socket manufacturing machine (RSMM) and fused deposition
modeling (FDM) were compared with traditional socket manufacturing processes
and studied with respect to the accuracy, labour- intensive, fabrication data, and
biological evaluation of the new socket throughout the gait (Gho et al. 2002, Ng et
al. 2002 and Fuh et al. 2005). Hopkinson et al. (2003) reported on cost analysis; that
was achieved to compare a traditional manufacturing route with layer manufacturing
processes (stereolithography, fused deposition modeling and laser sintering)
regarding the unit cost for parts made in several quantities. Then, results showed
that, for some geometry, it was more economical to use layer manufacturing
methods than it used traditional approaches for production in the thousands.
However, comfortable prosthetic sockets manufactured by 3D printing have been
used in preliminary fittings with patients. One of the principle benefits of FDM
technology is the use of various materials which includes ceramic materials,
polymers (synthetic and natural), metals and biodegradable materials with a
promising avenue for cost reduction in the development of prosthetic socket.
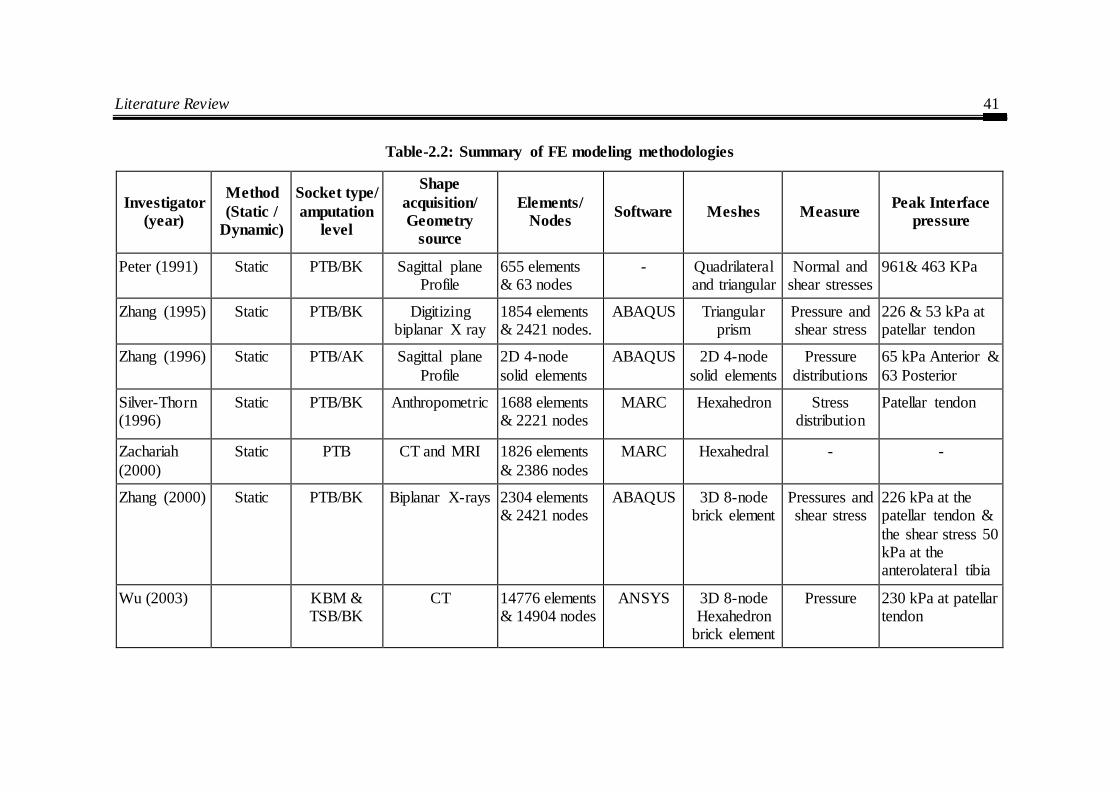
Literature Review 41
Table-2.2: Summary of FE modeling methodologies
Investigator
(year)
Method
(Static /
Dynamic)
Socket type/
amputation
level
Shape
acquisition/
Geometry
source
Elements/
Nodes Software Meshes Measure
Peak Interface
pressure
Peter (1991) Static PTB/BK Sagittal plane Profile
655 elements & 63 nodes
- Quadrilateral and triangular
Normal and shear stresses
961& 463 KPa
Zhang (1995) Static PTB/BK Digitizing biplanar X ray
1854 elements & 2421 nodes.
ABAQUS Triangular prism
Pressure and shear stress
226 & 53 kPa at patellar tendon
Zhang (1996) Static PTB/AK Sagittal plane
Profile
2D 4-node
solid elements
ABAQUS 2D 4-node
solid elements
Pressure
distributions
65 kPa Anterior &
63 Posterior
Silver-Thorn (1996)
Static PTB/BK Anthropometric
1688 elements & 2221 nodes
MARC Hexahedron Stress distribution
Patellar tendon
Zachariah
(2000)
Static PTB CT and MRI 1826 elements
& 2386 nodes
MARC Hexahedral - -
Zhang (2000) Static PTB/BK Biplanar X-rays 2304 elements & 2421 nodes
ABAQUS 3D 8-node brick element
Pressures and shear stress
226 kPa at the patellar tendon &
the shear stress 50 kPa at the anterolateral tibia
Wu (2003) KBM & TSB/BK
CT 14776 elements & 14904 nodes
ANSYS 3D 8-node Hexahedron
brick element
Pressure 230 kPa at patellar tendon

Literature Review 42
Investigator
(year)
Method
(Static /
Dynamic)
Socket type/
amputation
level
Shape
acquisition/
Geometry
source
Elements/
Nodes Software Meshes Measure
Peak Interface
pressure
Lin (2005) Static KBM/BK CT images 11788 elements
ANSYS
Tetrahedral Interface stresses and
sliding distance
590, 230, 660 & 190 Kpa on the
anterior, lateral, posterior and
medial surfaces of the stump,
Lee (2004) Dynamic PTB/AK MRI 22301 elements & 6030 nodes
ABAQUS Tetrahedral structural
Normal and shear stresses
250, 109 & 205 kPa at the patellar
tendon, popliteal depression &
medial tibia
Jai (2004) Dynamic PTB/BK MRI 22301 elements & 6030 nodes
ABAQUS Tetrahedral structural
Pressure and shear stress
292 kPa at the middle patella tendon (PT)
Goh (2005) Static BK CAPOD prosthetic
workstation
9477 elements & 14140 nodes
Developed
In-house CAD soft.
Tetrahedral structural
Pressure distribution
80.1 kPa
Jeffrey
(2006)
Dynamic BK CT 111 672
elements and 20 481 nodes.
- Tetrahedral
structural
Temperature 34 0C at Popliteal
depression

Literature Review 43
Investigator
(year)
Method
(Static /
Dynamic)
Socket type/
amputation
level
Shape
acquisition/
Geometry
source
Elements/
Nodes Software Meshes Measure
Peak Interface
pressure
Faustini (2006)
Dynamic PTB ShapeMaker 3000 laser
scanning
7582 elements
& 22 570
nodes.
CAD software
Tetrahedral structural
Stress 45.2 Mpa
Lee (2007) Dynamic PTB/BK ShapeMaker 4.3 laser scanning
22301 element ABAQUS 6.4
tetrahedral structural
Pressure distribution
260 at Popliteal muscle, 230 at
mid Patellar tendon, 200 at Anteromedial
tibia & 160 at anterolateral tibia
Portnoy
(2007)
Static/
Dynamic
BK Slice 290 triangles
(3-node) elements
MSC
NASTRAN 2003
Phantom
mesh
Stress Patellar tendon
Prasanna
(2011)
Static PTB/BK White light
scanner
15017 elements
& 7678 node
ANSYS/
COMET, 250
Shell 63 and
solid 92
Pressure and
shear stress
173 at Patellar
tendon & 79 at Popliteal area
Linlin Zhang (2013)
Static
TSB/AK CT 19592 elements Mimics v10.01/
Altair
Tetrahedral elements
Normal stress 80.57 kPa
Colombo (2014)
Dynamic AK MRI 64042 element &13096 node
Abaqus package V
6.9
3-noded triangular
elements
Pressure 200 Kpa

Literature Review 44
Table-2.3 Pressure transducers used in transtibial socket
Investigator
(year)
Method
(Static /
Dynamic)
No. of
Subject/
socket
type
Reason for
Amputation/
Liner
Positioning
of the sensor
Sensor type/
Instrument
Measurement
sites
Parameters
to measure
Highest
Pressure
Area
Sanders (1992)
Dynamic 03/PTB Trauma/ Pelite liner
Skin/Soft tissue
Diaphragm strain gauge
Anterior Sites & Posterior
Sites
Normal & shear stress
205 kPa & 54 kPa
Sanders (1993)
Dynamic 03/PTB Trauma/ Pelite liner
Skin/Soft tissue
Piston-type Strain gauge
Anterior Sites & Posterior
Sites
Normal & shear stress
Interface stress
waveforms
Zhang (1995)
Static 01/PTB Unknown/ Pelite liner
(1.5 mm)
Socket/skin Tekscan (Version 3.6)
Anterior, posterior,
medial & lateral
Frictional action
Patellar tendon
area (212 kPa)
Sanders (1997)
Dynamic 02/PTB Traumatic
/ Pelite liner
Mounted on socket wall
Piston-type Strain gauge
13 sites Pressure and shear stress
Anterior sites
Convery (1998)
Dynamic 01/
PTB & Hydrocast
Unknown/ Silicone
sleeve
Stump/socket Piezoresistive
(F-socket)
Overall impression of
the interface
Pressure distribution
Patellar tendon
area (244 kPa)

Literature Review 45
Investigator
(year)
Method
(Static /
Dynamic)
No. of
Subject/
socket
type
Reason for
Amputation/
Liner
Positioning
of the sensor
Sensor type/
Instrument
Measurement
sites
Parameters
to measure
Highest
Pressure
Area
Zhang (1998)
Static and Dynamic
05/PTB and TSB
Unknown/ Pelite liner
Skin/Soft tissue
Force transducer Anterior & posterior
Pressures and bi-axial
shear stresses
During walking
320 kPa at Popliteal
area & 61 kPa at medial
tibia area
Convery
(1999)
Dynamic 01/PTB Traumatic
Injury/ No
liner
Sump/socket
interface
Tekscan, Force
sensing resistors (FSR)
Overall
impression of the interface
Pressure
distribution
Patellar
tendon area (244
kPa)
Sanders (2000)
Dynamic 01/PTB Traumatic
Injury/ Ply sock
Skin/Soft tissue
Custom designed sensors
13 sites Changes in interfaces
stresses & stump shape
over time
-
Goh (2003) Dynamic 05/PTB & PCast
Peripheral Vascular
disease and
Traumatic injuries/
Silicon liner
Mounted on socket wall
Piston-type Strain gauge
16 sites Pressure distribution
81.32 at 25% of
gait cycle

Literature Review 46
Investigator
(year)
Method
(Static /
Dynamic)
No. of
Subject/
socket
type
Reason for
Amputation/
Liner
Positioning
of the sensor
Sensor type/
Instrument
Measurement
sites
Parameters
to measure
Highest
Pressure
Area
Sanders (2005)
Dynamic 08/PTB and TSB
Traumatic
Injury/ silicone liner
(6 mm)
Soft tissue /socket
Force transducer 13 sites Pressure & shear stress
99.4 kPa & 11.7
Dou (2006) Dynamic 01/PTB Pressure ulcers/
silicone liner
(6 mm)
Stump/socket Capacitive (Pliance pressure
system)
Antero- posterior &
Medio-lateral planes
Pressure distribution
215.8 kPa over the
Patella tendon
Kang (2006) static and
dynamic
10/TSB Vascular
diseases, trauma & diabetes
mellitus/ Silicone
Liner
Stump/socket F-socket Anterior and
posterior area
Pressure
distribution
Anterior
Proximal (230.6)
Portnoy (2008)
Static 01/PTB Unknown/ Unknown
Socket/ limb Piezoresistive sensors
Anterior and posterior area
Pressure and shear strain
100kPa at tibia crest
Wolf (2009) Dynamic 12/TSB Trauma and Tumor/
Silicone liner
Socket/ limb Pliance S 2052, Novel
Stair-up/down,
ramp-
up/down & walking
Pressure 244.73 kpa at the calf
muscle
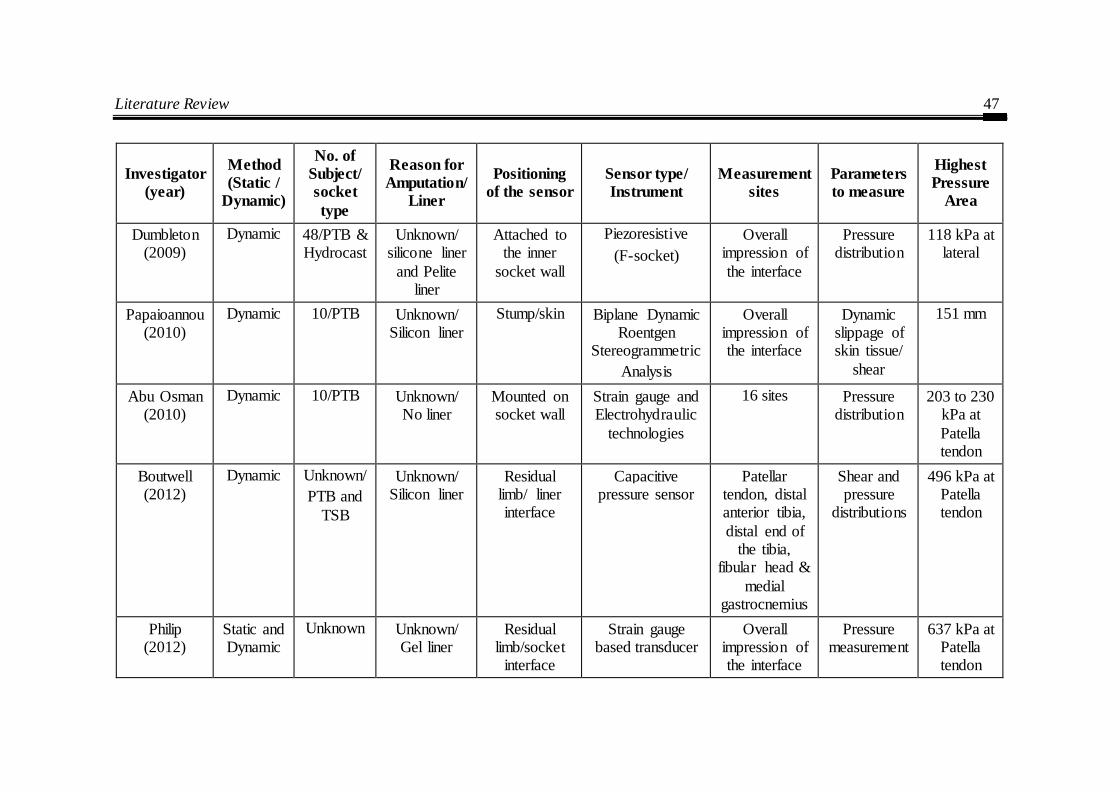
Literature Review 47
Investigator
(year)
Method
(Static /
Dynamic)
No. of
Subject/
socket
type
Reason for
Amputation/
Liner
Positioning
of the sensor
Sensor type/
Instrument
Measurement
sites
Parameters
to measure
Highest
Pressure
Area
Dumbleton (2009)
Dynamic 48/PTB & Hydrocast
Unknown/ silicone liner
and Pelite liner
Attached to the inner
socket wall
Piezoresistive
(F-socket)
Overall impression of
the interface
Pressure distribution
118 kPa at lateral
Papaioannou (2010)
Dynamic 10/PTB Unknown/ Silicon liner
Stump/skin Biplane Dynamic Roentgen
Stereogrammetric
Analysis
Overall impression of the interface
Dynamic slippage of skin tissue/
shear
151 mm
Abu Osman (2010)
Dynamic 10/PTB Unknown/ No liner
Mounted on socket wall
Strain gauge and Electrohydraulic
technologies
16 sites Pressure distribution
203 to 230 kPa at
Patella tendon
Boutwell (2012)
Dynamic Unknown/
PTB and
TSB
Unknown/ Silicon liner
Residual limb/ liner interface
Capacitive pressure sensor
Patellar tendon, distal anterior tibia,
distal end of the tibia,
fibular head &
medial gastrocnemius
Shear and pressure
distributions
496 kPa at Patella tendon
Philip (2012)
Static and Dynamic
Unknown
Unknown/ Gel liner
Residual limb/socket
interface
Strain gauge based transducer
Overall impression of the interface
Pressure measurement
637 kPa at Patella tendon
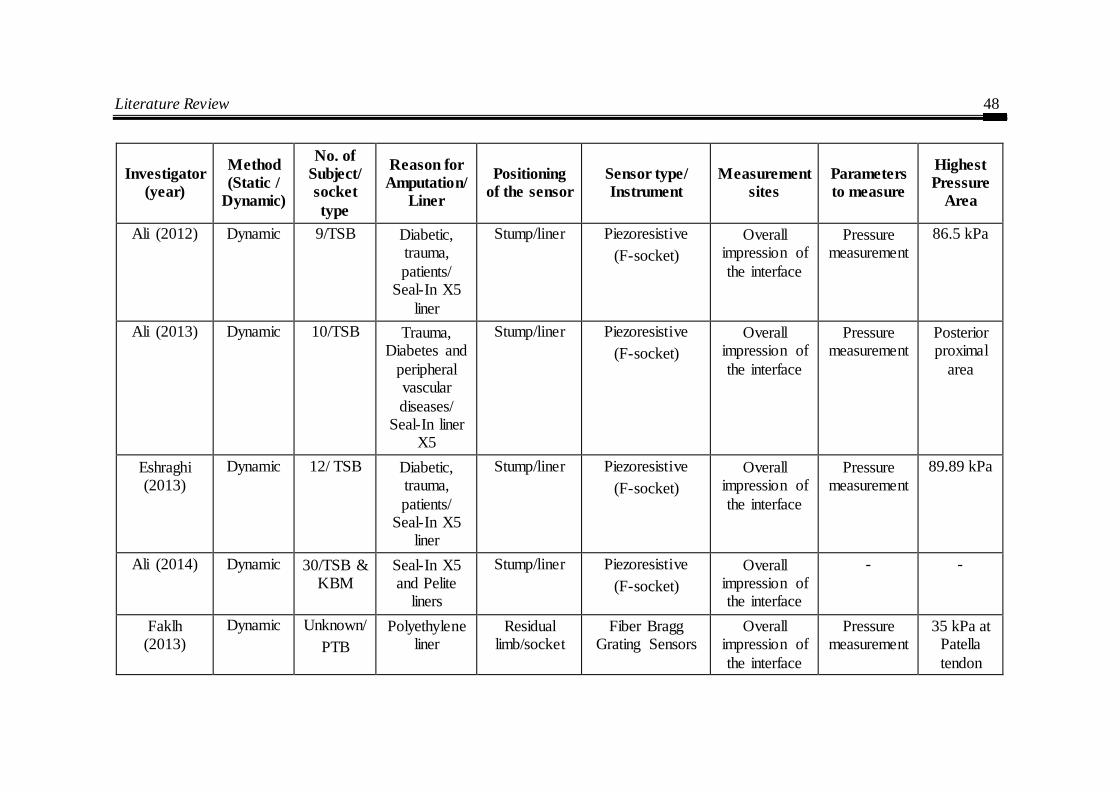
Literature Review 48
Investigator
(year)
Method
(Static /
Dynamic)
No. of
Subject/
socket
type
Reason for
Amputation/
Liner
Positioning
of the sensor
Sensor type/
Instrument
Measurement
sites
Parameters
to measure
Highest
Pressure
Area
Ali (2012) Dynamic 9/TSB Diabetic, trauma,
patients/ Seal-In X5
liner
Stump/liner Piezoresistive
(F-socket)
Overall impression of
the interface
Pressure measurement
86.5 kPa
Ali (2013) Dynamic 10/TSB Trauma, Diabetes and
peripheral vascular
diseases/ Seal-In liner
X5
Stump/liner Piezoresistive
(F-socket)
Overall impression of
the interface
Pressure measurement
Posterior proximal
area
Eshraghi (2013)
Dynamic 12/ TSB Diabetic, trauma,
patients/ Seal-In X5
liner
Stump/liner Piezoresistive
(F-socket)
Overall impression of
the interface
Pressure measurement
89.89 kPa
Ali (2014) Dynamic 30/TSB & KBM
Seal-In X5 and Pelite
liners
Stump/liner Piezoresistive
(F-socket)
Overall impression of the interface
- -
Faklh (2013)
Dynamic Unknown/
PTB
Polyethylene liner
Residual limb/socket
Fiber Bragg Grating Sensors
Overall impression of
the interface
Pressure measurement
35 kPa at Patella
tendon

Literature Review 49
Investigator
(year)
Method
(Static /
Dynamic)
No. of
Subject/
socket
type
Reason for
Amputation/
Liner
Positioning
of the sensor
Sensor type/
Instrument
Measurement
sites
Parameters
to measure
Highest
Pressure
Area
Sayed (2014)
Static and Dynamic
1 No liner Stump/Socket Piezoelectric Overall impression of
the interface
Pressure measurement
27 kPa anterior
proximal
Safari
(2015)
Static 6/PTB Discomfort,
pain or poor socket fit/ Pelite liner
Stump/socket Novel Pliance Anterior
distal, Fibular Head,
Popliteal &
Patella tendon.
Pressure
measurement
404.76
kPa Patella tendon

Literature Review 50
Against this literature review, the present work has been undertaken to
investigate the pressure measurement between the socket and residual limb. The
focus has been on the fabrication of customized prosthesis socket to integrate
advanced technology.
2.6 The Knowledge Gap in Earlier Investigations
This exhaustive literature review presented above reveals the following
knowledge gap that helped to set the objectives of this research work:
1. Though much work has been reported on traditional prosthetic socket
manufacturing. However, integration of using Reverse Engineering (RE),
computer-aided design (CAD) and Additive Manufacturing (AM) is
infrequent.
2. Study of computerized and FEM modeling assessments still do not match
prosthetic evaluations with topology optimization and is scarcely reported in
the literature.
3. Studies carried out worldwide on to measuring interface pressure between
stump-socket. However, no study has been found particularly on clinically
significant cases and its impact on the success of the prosthesis.
4. Taguchi method, in spite of being a simple, efficient and systematic
approach to optimizing designs for performance, quality and cost, is used
only in a limited number of applications worldwide. Its implementation in
parametric appraisal of stump-socket interface pressure has hardly been
reported.
5. The understanding of clinically meaningful changes in socket fit and its
effect on biomechanical outcomes. Further, safe and comfortable pressure
thresholds under various conditions should be determined through a
systematic approach.
2.7 The objectives of this work are outlined as follows:
The scope of this present work is to design patient-specific prosthesis socket
integrating reverse engineering, computer-aided design, additive manufacturing and
pressure sensors. Therefore, the objectives of this research work are:

Literature Review 51
1. To overcome the limitations of traditional manufacturing process of socket
by Semi-automating the existing process using Reverse Engineering (RE),
computer-aided design (CAD) and Additive Manufacturing (AM).
2. To analyze the structural response of patella tendon bearing (PTB) socket
designs with topology optimization using Finite Element Analysis (FEA)
study.
3. To measure and predict pressures site at the amputee‘s stump/socket
interface at low-cost to reduce potentially harmful contact pressure which
leads to increase patient‘s comfort.
4. An experimental investigation to obtain critical pressure points for clinically
significant cases such as a short-stump, long-stump, diabetic stump,
peripheral vascular disease, traumatic injuries.
5. To establish a mathematical model using artificial neural networks (ANN)
for the relationship between interface pressure and amputee‘s physiological
parameters for PTB socket.
6. Development of Topology optimized socket using FDM-based Additive
Manufacturing and to investigate the dimensional accuracy of the 3D Printed
Socket.
Chapter Summary
The chapter reviews the literature available on plaster casting, geometry
acquisition, FE analysis & method, experimental equipment principles and additive
manufacturing. The following points summarize this chapter.
Techniques of volume measurement for the residual limb and its effect on
the fabrication of prosthesis socket were reviewed in section 2.1.
Reviews of the literature regarding geometry acquire internal and external
geometry of patients-specific residual limb is described in section 2.2.
The three features of FE analysis were described in section 2.3, to assist the
determination of suitable socket shape. Also, present a summary of FE
modeling methodologies in Table 1.2.

Literature Review 52
Several measurement techniques have been reported in section 2.4; which
includes a strain gauge, capacitive, piezoresistive and optical sensors for
pressure measurement and prediction at stump-socket interface (Table 1.3).
In section 2.5, literature on the socket manufacturing using various RP
machines were presented.
The knowledge gap in past research.
The objective of the present work.
Reverse Engineering (RE) and Computer Aided Design (CAD).... 53
CHAPTER 3
REVERSE ENGINEERING (RE) AND COMPUTER AIDED DESIGN (CAD) BASED CUSTOMIZED PROSTHETIC
SOCKET DESIGN
Introduction
This chapter introduces an important aspect of an innovative approach to
develop customized design process of below-knee prosthesis socket. As per the
condition of each amputee stump, socket varies from one to another bone which
needs to be customized. Computer-aided tools help in shortening and eradicating
numerous repetitive tasks that reduce the gap between the digital model and the
actual product. Use of these tools assists in realizing free-form objects such as
custom fit products as described by a stringent interaction with the residual limb. In
this chapter, the development of a semi-automated methodology which integrates
traditional process and reverses engineering methodology for developing a CAD
model of prosthesis socket is discussed. Also, chapter proposes an integrated
methodology for measuring the accuracy of 3D models generated by RE employing
commercial CAD tools. Determination of key factors and how they influence the 3D
model accuracy from RE is evaluated. In order to the digital model accuracy, the
correct use of the surface reconstruction process employed in RE is of vital
importance. The stereolithography (STL) file generated from the scan data was
modeled on a fused deposition modeling (FDM) based AM. Its fitment was assessed
with the help of INSPECTPLUS and GEOMAGIC reverse engineering tools. The
aim is to minimize manual operations for duplicating the plaster models of residual
limbs and to accelerate the design and manufacturing process of the prosthetic
socket with better quality of fit. Further, this chapter presents the computer-aided
modeling of the prosthetic socket design.
3.1 Traditional methods of Prosthesis Socket Fabrication
The prostheses fabrication process presented in work is adapted from
Bhagwan Mahaveer Viklang Sahayata Samiti (famous as Jaipur Foot), Jaipur, India.
Traditional prosthetic socket fabrication is invariably an artistic or a labour intensive
process, meeting fitness and consideration of amputee satisfaction. In this method,
the prosthetic practitioner must know the complete topology of the amputee‘s stump

Reverse Engineering (RE) and Computer Aided Design (CAD).... 54
and many assumptions that ultimately affect the quality of fit are being made. Socket
manufacturing is always custom-made because each patient presents a different level
of amputation, specific healing states, various muscular tones, which lead to an
essentially handcrafted production process and therefore may lack in accuracy.
However, through hand casting there is a chance for the uncontrolled deformation of
the soft tissues, leading to bad socket fit in the future. Fabrication of the prosthetic
socket for below-knee (BK) amputees has always been a time-consuming and
complicated task, and experience is not easily captured on the stump. As the
conditions of each patient‘s stump are different. Therefore, each socket has to be
customized to the patients. Thus, much expertise is also required on the part of the
prosthetist. Due to its freeform shape, it's hard to perform design, analysis and
automate the fabrication process of the socket. Fabrication of socket follows
numerous steps: measurement, wrapping, casting, modification, Thermoforming,
and assemble.
3.1.1 Stump Measurements
After, qualitative assessment such as muscle/limb strength, joint function,
skin grafting, scarring, site of pain in the stump, the condition of limb etc. by the
Prosthetic practitioner‘s, the measurement process starts. It has different steps to
measure the length of leg, which include reference measurements of the sound limb
to measurement on the residual limb from the medial tibial plateau to the heel/floor.
Figure-3.1: Stump measurement of amputee’s limb in BMVSS, Jaipur, India
As shown in Figure 3.1, the circular width of the stump is measured at mid patella
level, and further, it continues every one inch below, until the distal end of the
stump. Similarly, the stump length is measured and recorded by measuring tape
from the head of the fibula or lower end of the patella to distal end of the stump. The

Reverse Engineering (RE) and Computer Aided Design (CAD).... 55
AP (Antero-Posterior) and ML (Medio-Lateral) diametric measurement of the knee
at the condylar level and the patellar tendon level are also measured by using AP
and ML caliper. This technique helps a lot in making a positive mould with correct
dimensions.
3.1.2 Plaster Casting method
The next step after the measurement is casting or molding procedures which
are as displayed in Figure 3.2. Firstly, the stump is covered via cling film. The
required number of six inches of PoP bandages is submerged (wet) in water and when
sufficiently soaked, is taken out and excessive water is squeezed before use. Casting
process starts with wrapping one or two layers of PoP bandages on the patient's stump
using the figure of 8 wrapping method. It starts from the front slightly above the
patella and spirally down till the end and starts again up in the back of the stump to
the posterior crease of the knee. Smoothing of the plaster over the surface of the
stump is done by moving the hand around the stump and working towards the knee.
Figure-3.2: Wrapping POP bandages, applies pressure on the pressure-tolerant
areas at patella tendon in BMVSS, Jaipur, India
As the plaster starts solidifying, Prosthesis applies pressure of the thumb and
fingers on the pressure-tolerant areas of the stump to outline different soft

Reverse Engineering (RE) and Computer Aided Design (CAD).... 56
tissue/bones landmark and redistribution of more load on those areas. The depth of
the fingertip impression in the popliteal area serves as a measure of tissue firmness
is and is indication of how much modification of the model is required. The
geometry of the residual stump is captured through the casting which is a
duplication of the topographic shape of the stump. The dried cast is safely removed
from the patient‘s stump known as negative cast.
3.1.3 Modification of the mould
The obtained negative cast is then filled with PoP paste, supported by a rod
(mandrel) at a bench-vice. When the plaster gets dried, the plaster bandage is cut
lengthwise down the posterior surface and removed. In this way, the positive plaster
mold is obtained. The socket model is manually modified in Figure 3.3, as to
transmit an optimum weight of the residual bones to the prosthetic socket.
Before modifying this positive mould according to standard PTB total
contact socket modification principles, initial girth measurement has been noted
over this positive mould. These girth values are compared with the manually
measured girth values of the patient‘s stump. Our aim is to increase stump-socket
contact pressure on the pressure tolerant areas and to decrease contact pressure in
sensitive areas. It‘s a general finding that for the positive mould, the volume gets
increased in comparison to hand measurement as taken over the residual stump by 5-
7%, therefore initially these extra materials are removed from all over the mould
with the help of the flat Surform file. The inferior patellar tendon area which is one
of the most important pressure tolerant areas is modified by cutting away the plaster
model midway between the lower edge of the patella and the tubercle of the tibia to
a certain depth according to the patient‘s stump condition.
The prosthetic practitioner accommodates the material allocation at ―pressure
sensitive‖ and bulk areas to relieve pressure at sensitive regions and to improve the
pressure distribution. In the traditional method, the modification of the plaster is
primarily performed on the basis of experiences, skill, and craftsmanship using
manual measurement data taken on the patient‘s stump. As a result, current socket
design and fitting are mostly subjective to wide variation.
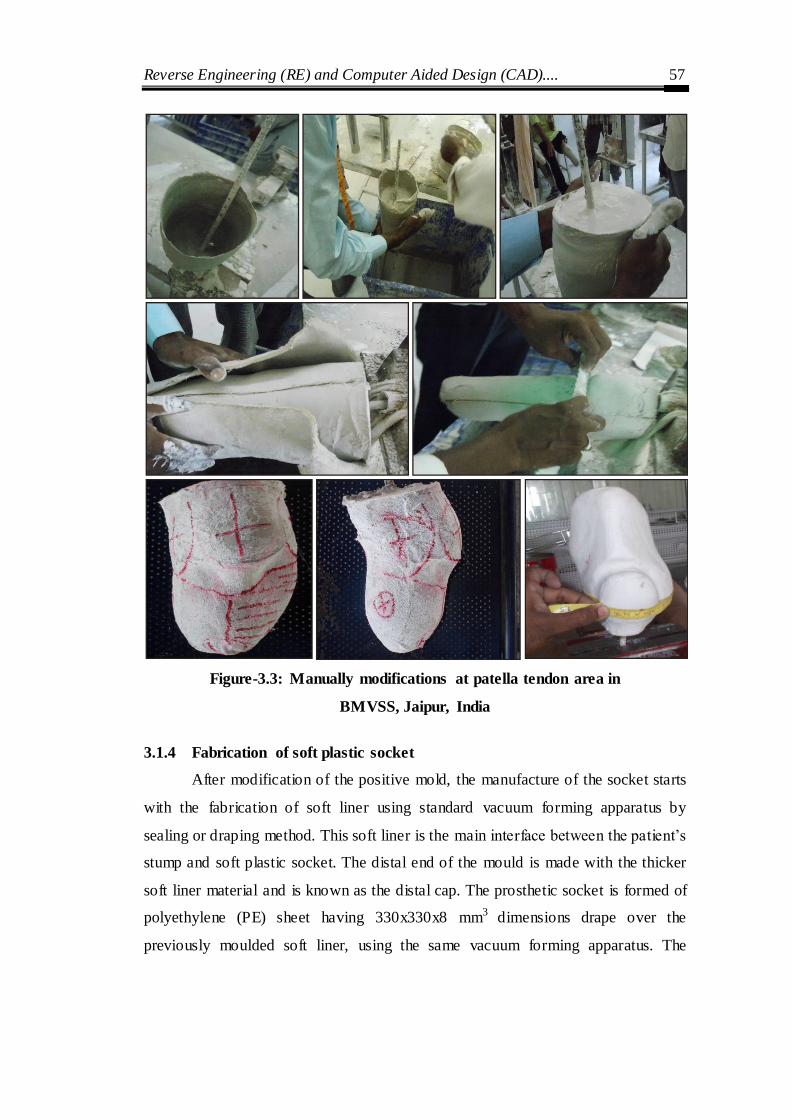
Reverse Engineering (RE) and Computer Aided Design (CAD).... 57
Figure-3.3: Manually modifications at patella tendon area in
BMVSS, Jaipur, India
3.1.4 Fabrication of soft plastic socket
After modification of the positive mold, the manufacture of the socket starts
with the fabrication of soft liner using standard vacuum forming apparatus by
sealing or draping method. This soft liner is the main interface between the patient‘s
stump and soft plastic socket. The distal end of the mould is made with the thicker
soft liner material and is known as the distal cap. The prosthetic socket is formed of
polyethylene (PE) sheet having 330x330x8 mm3 dimensions drape over the
previously moulded soft liner, using the same vacuum forming apparatus. The

Reverse Engineering (RE) and Computer Aided Design (CAD).... 58
plastic sheet falls by itself on the mould with uniform thickness rather than being
pulled down and shaped onto the PoP profile using felt blankets or asbestos gloves.
Figure-3.4: Fabrication and finishing of socket in BMVSS, Jaipur, India
A piece of HDPE pipe is hung on a rod with PE sheet placed in an electric
oven as in Figure 3.4, which is heated to 200°C for 30 minutes. For this, the positive
mould is kept inverted on a standard vacuum forming apparatus. Socket trial may be
helpful in all cases, but mainly in old user cases where the patient already knows the
comfortable level of pressure that he can bear. It also provides another chance to the

Reverse Engineering (RE) and Computer Aided Design (CAD).... 59
prosthetist to check fitting and re-draw the socket alignment line in a weight bearing
condition of the patient. For socket trail, the soft plastic is removed out of the
positive mould. The proximal brim of the soft socket is trimmed and buffed. A small
hole of 2 cm diameter is made at the distal end of the socket for pulling stockinette
during the trial.
3.1.5 Fitting of the Socket
To check the fitting of the socket as shown in Figure 3.5, the patient is made
to lie in a supine position on the examination table with the patient‘s stump lying
near to the side of the prosthesis. Stockinet is sleeved over the residual stump, and
then the trail socket is sleeved over the residual stump, by pulling the distal end of
the stockinet out of the hole created at the distal end of the socket. At this stage, it is
observed whether the donning of the socket is difficult or ease. Once the socket is
fitted onto the stump, the patient is made to stand on the sound side with the
compensatory blocks beneath the wore socket.
Figure-3.5: Soft-socket trail with patient in supine
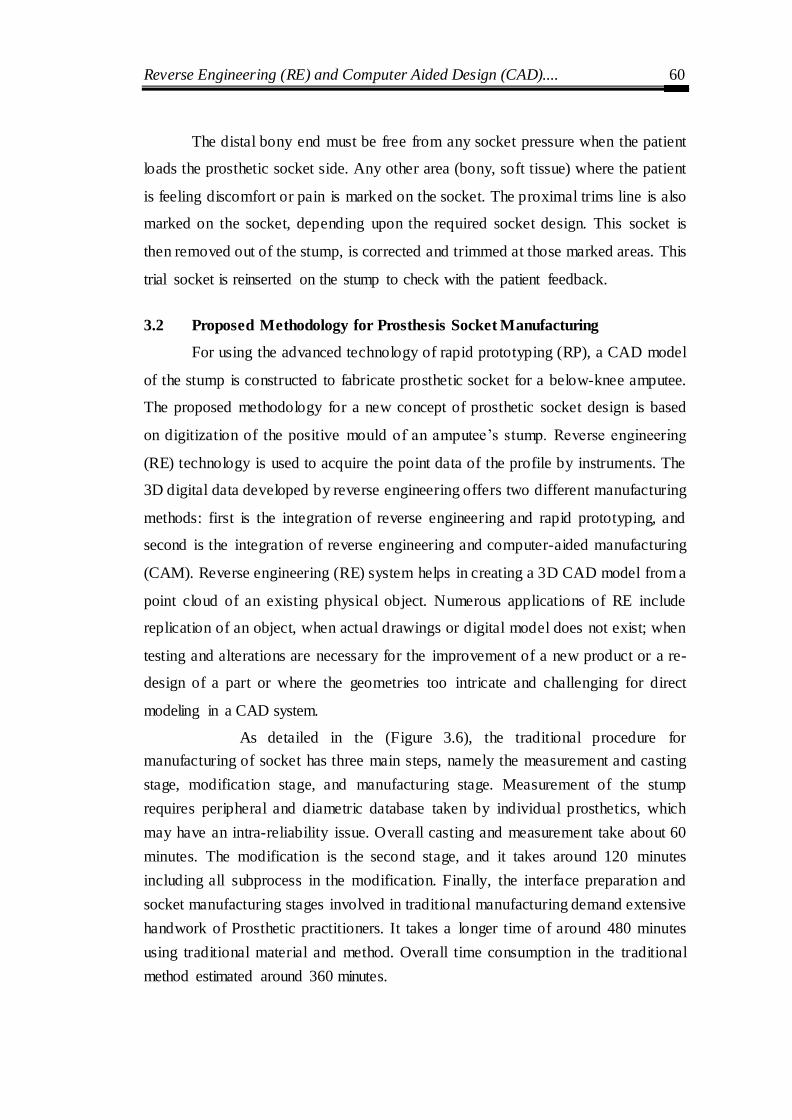
Reverse Engineering (RE) and Computer Aided Design (CAD).... 60
The distal bony end must be free from any socket pressure when the patient
loads the prosthetic socket side. Any other area (bony, soft tissue) where the patient
is feeling discomfort or pain is marked on the socket. The proximal trims line is also
marked on the socket, depending upon the required socket design. This socket is
then removed out of the stump, is corrected and trimmed at those marked areas. This
trial socket is reinserted on the stump to check with the patient feedback.
3.2 Proposed Methodology for Prosthesis Socket Manufacturing
For using the advanced technology of rapid prototyping (RP), a CAD model
of the stump is constructed to fabricate prosthetic socket for a below-knee amputee.
The proposed methodology for a new concept of prosthetic socket design is based
on digitization of the positive mould of an amputee‘s stump. Reverse engineering
(RE) technology is used to acquire the point data of the profile by instruments. The
3D digital data developed by reverse engineering offers two different manufacturing
methods: first is the integration of reverse engineering and rapid prototyping, and
second is the integration of reverse engineering and computer-aided manufacturing
(CAM). Reverse engineering (RE) system helps in creating a 3D CAD model from a
point cloud of an existing physical object. Numerous applications of RE include
replication of an object, when actual drawings or digital model does not exist; when
testing and alterations are necessary for the improvement of a new product or a re-
design of a part or where the geometries too intricate and challenging for direct
modeling in a CAD system.
As detailed in the (Figure 3.6), the traditional procedure for
manufacturing of socket has three main steps, namely the measurement and casting
stage, modification stage, and manufacturing stage. Measurement of the stump
requires peripheral and diametric database taken by individual prosthetics, which
may have an intra-reliability issue. Overall casting and measurement take about 60
minutes. The modification is the second stage, and it takes around 120 minutes
including all subprocess in the modification. Finally, the interface preparation and
socket manufacturing stages involved in traditional manufacturing demand extensive
handwork of Prosthetic practitioners. It takes a longer time of around 480 minutes
using traditional material and method. Overall time consumption in the traditional
method estimated around 360 minutes.
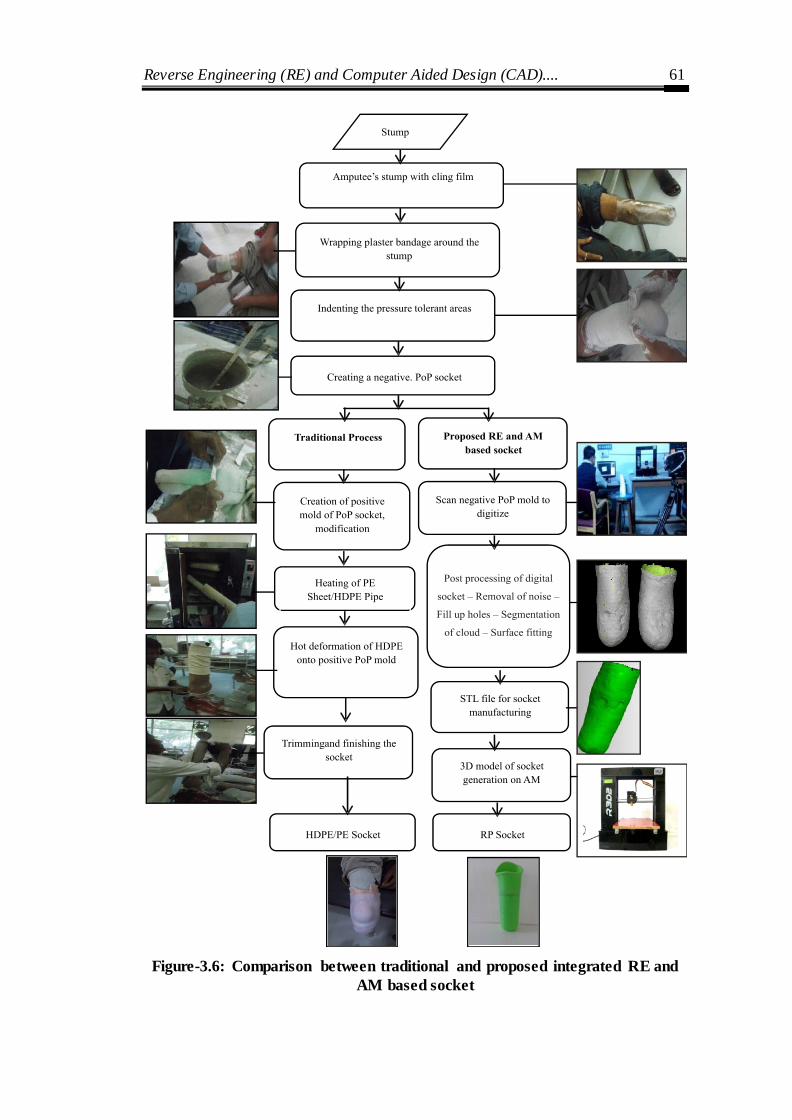
Reverse Engineering (RE) and Computer Aided Design (CAD).... 61
Figure-3.6: Comparison between traditional and proposed integrated RE and
AM based socket

Reverse Engineering (RE) and Computer Aided Design (CAD).... 62
In the proposed method, the manufacturing of negative PoP mold is same as
in the traditional method which is about 30 minutes. This is done with an intention
to avoid direct scanning on the human body (residual stump) in proposed method.
The scanning and Post Processing of the negative mold takes about 40 minutes.
Figure-3.7: Flowchart of reverse engineering
The non-contact 3D laser scanner is used to scan each layer of the positive
mould by rotating table and translating the sensor horizontally. After the first layer is
scanned, the sensor moves vertically to the next layer, and a horizontal scanning
process is repeated. Once the whole mould is completely scanned layer-by- layer, the
external geometry of the positive mould is obtained. The output an STL format file
obtained with the help of the solid modeling of the CAD software, it used in the RP
machine to manufacture a prosthetic socket as shown in Figure 3.7. This present
socket design approach, can decrease the training duration for prosthetists, lower
production costs, and augment amputee care.
The 3D models with free-form socket profile are widely used in various
medical applications such as surgery planning, customized inserts, and bio-
mechanical work. In the same context, the design and development of prosthesis
socket is a challenge due to the complex geometry of the stump which differs from
one amputee to other. The precision of the produced 3D model is of utmost
importance for the outcome of the result, particularly when different software
processes the captured point data. So, it becomes important to examine the accuracy
of the developed digital model with reference to the actual physical model. Several

Reverse Engineering (RE) and Computer Aided Design (CAD).... 63
RE software tools are available that suits the requirements needed by design
personnel and operators. Prior using difficult mathematical approximations, they
attempt to obtain the desired accuracy of 3D models by regulating various key
factors through continuous approximations using commercially available CAD
application tools.
3.2.1 Scanning processes
Employing the reverse engineering technology, the first stage is to obtain the
point data of the residual limb by scanning. In the proposed approach, the 3D laser
scanner can scan the geometry of residual limb easily and quickly. This method is
novel as all the earlier scanning procedures involved direct scanning on the limb of
the patient, which psychological fear of rays (ionizing radiation from MRI or CT
scan) and have experienced a little vibration during scanning.
Figure-3.8: PoP Socket used for scanning
The object being a tubular segment, capturing the inside profile was not
possible. Hence, it was decided to split it into two half‘s as shown in Figure 3.8. The
socket size was not possible to accommodate in a single field of view. Hence, the
complete acquisition of the PoP socket to capture the surface point clouds about

Reverse Engineering (RE) and Computer Aided Design (CAD).... 64
thirty scans, which is taken from different orientations. The tie point stickers were
also used for proper surface earmarking. Respective cloud point segments were
captured in steps and processed through INTEGRATION, and REGISTRATION
option in the COMETPLUS software
3.2.2 Digitization (data capturing)
Digitization of lower limb PoP socket was scanned using a non-contact blue
light scanner (Steinbichler‘s COMET L3D). The mean acquisition rate of the
COMET L3D scanner is about 50,000 points per second. The version used in this
study for data acquisition has a resolution of 1 Mpx and 1170 x 880 pixels. The
socket was placed on a rotary table which makes the scanning process more efficient
and faster. The complete digitization process for handling the point clouds was
controlled by the 3D scanner software (COMET PLUS). To change the point of
view between one scan to another scan, the part was fixed in the working volume
and the scanner location was changed. No additional data processing was needed,
since the RE software merges multiple scans in one point cloud either automatically
or by manually selecting N points. For efficient scanning and identification of
previous scans, tie points are placed on the socket surface uniformly. The 3D point
cloud was exported in IGES format and the raw data of the socket composed of
11,585 points.
Figure-3.9: (a) Scanning of Plaster of Paris socket model

Reverse Engineering (RE) and Computer Aided Design (CAD).... 65
Figure-3.9: (b) 3D scanning arrangement
Once the negative PoP socket mold of a patient‘s stump is ready, then the
proposed method begins with its digitization in Figure 3.9 (a). A scanner was used to
scan the plaster cast (PoP) mold as shown in Figure 3.9 (b). The scanner scans each
layer of the negative mold by rotating the mold on the plate, and the sensor is
translated horizontally. The sensor was moved from location to location to cover the
complete surface of the PoP socket with a tie spot as a referral point. This step
eliminates direct scanning of the patient‘s stump and initiates digitization.
The study focuses on an accurate 3D surface generation of a complex profile.
This free-form surface is generated from a plaster of Paris (PoP) socket model of an
amputee. The external dimensions of the socket are 105 mm (maximum diameter)
with a height of 252 mm.
3.2.3 Scanning of Clinically Significant Cases
Different clinically significant stump examples which require a different
level of care and attention were considered as a case study, and the same is exhibited
in Figure 3.10. All the five cases considered here are pertinent to patients in the age
group of 35 to 45 who have been using Patellar Tendon Bearing (PTB) sockets for

Reverse Engineering (RE) and Computer Aided Design (CAD).... 66
10 to 12 years. Age, the cause of causality, the profile of the stump, etc. are all
important in the diagnosis and design of prosthesis socket.
(a) (b) (c) (d) (e)
Figure-3.10: Stumps of different causalities–Case study
(a) Short stump, (b) Diabetic, (c) Peripheral vascular disease, (d), (e) Traumatic injuries
Short Stump
The length of the residual limb is divided into three levels, i.e., short stump,
normal stump and long stump. Short stump restricts control and alignment with
prosthesis socket. It does not facilitate the revolving function and interferes with the
grip and flexibility of the socket. This classification largely depends on the stump
diameter- length ratio (Colombo et al. 2013). In the case of stump ratio greater than
1, it falls into the normal stump category. Normally, for comfortable fitment a stump
of length 10 mm is required. For a short stumpy; ‗Below Knee Amputee‘ stump
ratio is almost unity or less than one and in such cases the stump becomes a dome
shape and is unstable inside the prosthetic socket. A short stump inside a
conventional PTB prosthesis hence causes strain, pain, and blisters on the patient.
Diabetic and Peripheral Vascular Disease Patient
Lower limb amputations make up to 90% of all amputations. They are most
commonly caused by patients with diabetes and peripheral vascular disease. (Baars
et al., 2008) mentioned that the patient could not walk continually and comfortably,
hence needed frequent consultation. Diabetic patients suffer from open blisters on
the distal part of the stump due to rigid fitting and donning of the prosthesis. It can
cause sensations like an electric shock or even trigger phantom limb pain. This can
result in infection and ulcers. Vascular disease with poor blood circulation is also
Reverse Engineering (RE) and Computer Aided Design (CAD).... 67
more frequent. The limb where the tumor exists is removed to prevent the incidence
of cancer. All the above factors cumulatively could lead to further amputation.
3.2.4 Post Processing of Point Cloud Data
This step enhances the quality and accuracy of digital socket model. The
primary output from any of the scanning or measuring techniques discussed before
it‘s become a large set of X-Y-Z coordinates cloud, maybe incomplete with
tessellated surface definitions. The post processing of the cloud data was done with
the post processing software COMETPLUS*.
Data acquisition of PoP socket requires multiple scans; during which surface
outside of the intended object can also get captured. This unintended data is called
noise. Noise removal is a necessary task to acquire the desired accuracy of socket
model. The next step is filling with holes in the scanned socket model that may have
been introduced due to the occlusion; different views scan during scanning. A
curvature-based filling option ensures that the polygonal structure used to fill holes
in high-curvature. After that, tetrahedral meshes are created by using an iterative
closing algorithm available in RE interface. A tetrahedral mesh ensures effective
surface development on the point cloud data. The cloud data after removing the
noise is subjected to feature based segmentation. It re-ensures surface edges,
boundary and areas of the scanned surface. Further, surfaces are divided based on
their geometry like a conical shape, dome shape, and the transition shape and each
of them is to be fitted with a clean surface, loft surface and bounded surface
segments. This helps to reconstruct the complete part profile compensate for missing
definition. Then, surface optimization is performed on the socket data and this
process is known as decimation. The point cloud surfaces of the socket are then
tessellated and saved as STL file.
As the resultant mesh size was large, it is better to represent it accurately with
less number of triangles. The process of lowering the number of triangle meshes
which makes it suitable for processing and handling of the data is known as
decimation. It can be executed on the whole mesh or on any selected area of the
mesh file. There are two types of decimation available, first is a chordal deviation

Reverse Engineering (RE) and Computer Aided Design (CAD).... 68
method and second is edge length criteria. However, this study does not consider the
decimation process as it can lead to a reduction in accuracy in regions with high
curvature, also it may infuence the outcome of the results. Next step is to optimize
the triangle meshes as this process re-allocates the triangle meshes. The usefulness
of this process is to obtain homogeneity in meshes. This process performs edge split
and collapses depending on whether the edge is too long or too short.
3.3 RE tools application
The objective of RE system is to transform unorganized 3D point clouds into a
surface replica with desired precision and accuracy. There are two segments
available in these systems: one module converts the raw data into a triangle mesh
and the second module reconstructs a digital surface model from a triangle mesh
file. The present study employed two different CAD tools: CATIA V5R16 and
SolidWorks 2010. For CATIA study, mesh file was formed using module Digitized
Shape Editor and the surface model was reconstructed using the Quick Surface
Reconstruction module and for Solid Works, Scan to 3D module was used. After
data capturing three important steps include:
Step 1 - Processing of unorganized 3D point data. The outliers associated with
point cloud data were removed, followed by the use of adaptive and homogeneous
filtering techniques applied with different percentages. The initial point data
captured comprises of all the geometric features of the object. The initial raw points
consist of the higher amount of noise produced as a result of the 3D scanning
process. Consequently, a huge amount of data size produced and for effective
handling and processing of this data, a suitable filtering technique is applied which
results in reducing the redundant points without losing object original geometry.
Step 2 –Development of triangle meshes and processing. The development of
triangle meshes popularly known as tessellation. It is a process to build triangles by
joining three neighboring points and replicates the same procedure until a network is
formed to create a definite, lucid and consistent triangulated surface. In general, the
initial raw mesh consists of sharp boundaries and non-manifold vertices; all these
discrepancies need to be rectified to assurance accurate surface generation. Further,
Reverse Engineering (RE) and Computer Aided Design (CAD).... 69
it is essential that the meshes are cleaned and refined. The residual unwanted
triangle meshes removed and created holes are filled. Occasionally, the triangle
meshes are extremely dense which enhances the difficulty in handling and
processing the file data. The solution to this problem is re-meshing and decimation
of the mesh file. Smoothing the mesh moreover, helps in improving the accuracy of
the generated surface model.
Step 3 – Generation of surface model and feature identification. The accuracy of
the socket surface model was analyzed using the parameters including mean
deviations (AD), maximum and standard deviation. Three different techniques were
employed for the surface reconstruction from a triangular mesh file: feature
recognition, surface fitting and NURBS surface patching. Subsequently, for regular
features or prismatic profiles, not many software applications are available that
allows semi or fully automated procedure for recognition of various features, highly
depends on the intricacy of the profile. Several individual surfaces are linked
resulting in an approximate global surface with automatic creation of arbitrary
topology. The surface fitting technique was not applied in the current work. Since
the development of each surface fits to characterize the whole surface of a part
requires sufficient user expertise that will reflect on the outcome of the final result.
3.4 CATIA Methodology for Generating Free Form Surface from the Point
Cloud Data
The first part of the current work was realized by means of CATIA software. It
includes critical parameters of the filtering process, the mesh generation process and
the settings applicable for smoothing process before surface reconstruction. For free-
form geometry, it is important to carefully remove all outlier points manually after
choosing initial point data of the concerned zone. The mesh file W signifies the
default procedure employed without using any filtering or smoothing techniques
prior to surface reconstruction.
3.4.1 Filtering technique effect
The Digitized Shape Editor module was used for the reduction of noise and
redundant points by using two different types of filtering criteria. Use of the

Reverse Engineering (RE) and Computer Aided Design (CAD).... 70
adaptive filtering cause reduction in the point data based on a chord height deviation
analysis criteria. This technique helps in removing points from flat zones, but
preserves data close to the edges, boundaries and high curvature zones.
The use of homogeneous Fltering allows a uniform reduction in the point cloud data.
Different point filtering percentages (15%, 22%, 30% and 45%) were applied to
point data using both the filtering techniques. The default value taken by the
software for filtering is 22%, which was used as the control for comparison purpose.
The resultant files were studied and examined using reduced points (%), number of
faces, reduction in mean and maximum deviation. The best result was provided by
the homogeneous filtering technique for mesh (H) with 30% of reduced points with
a reduction in a maximum deviation of 55.27% and mean deviation 25.67%. For the
adaptive filter, mesh (A) with 15% of reduced points shows best results with a
reduction in a maximum deviation of 72.31% and in mean deviation 35.76%.
3.4.2 Mesh smoothing process analysis
The process of mesh smoothing prime objective is to enhance the accuracy of the
reconstructed surface, which can be used by operator input and shows global effects.
There are two techniques available (single effect or the dual effect) for mesh
smoothing from which the consumer can choose either of the ones. The importance
of the single effect is that it will rub out the sharp edges present in the mesh
resulting in the reduction of the volume of the object (shrinkage in the direction of
the center of gravity of the object). The second technique lessens the distance
between the surface and outliers; furthermore, it also reduces the deletion of the
minor internal radius.
3.4.3 Decimation and Optimization mesh process
As the resultant mesh size was large, it is better to represent it accurately with less
number of triangles. The process of lowering the number of triangle mesh which
makes it suitable for processing and handling of the data is known as decimation. It
can be executed on the whole mesh or any selected area of the mesh file. There are
two types of decimation available, first is a chordal deviation method and second is
an edge length criterion. However, this study does not consider the decimation

Reverse Engineering (RE) and Computer Aided Design (CAD).... 71
process as it can lead to a reduction in accuracy in regions with high curvature; also
it may influence the outcome of the results. Next step is to optimize the triangle
meshes as this process re-allocates the triangle meshes. The usefulness of this
process is to obtain homogeneity in meshes. This process performs edge split and
collapses depending on whether the edge is too long or too short.
3.4.4 Surface generation
The process of surface generation begins with triangle meshes. The complexity of
the free- form structure of socket peripheral can be duplicated through automated
reconstruction commands. In this work, the generation of the free-form surface was
accomplished by the automatic setting of Surface Reconstruction module. The
parameters that were analyzed include output surfaces, the percentage of points
within tolerance, maximum and average surface deviation. The key input factors
include the average surface deviation and the surface detail.
One important input parameter set by the operator was an average surface
deviation to achieve the desired accuracy of the surface generated. At a lesser value,
it provides small surface deviation, but in contrast number of surfaces generated also
increases, which in turn increases the size of data. With the increase in the surface
details from 250 to 7500, a significant reduction is shown in the maximum and mean
surface deviation. The variation shown was more evident up to a surface facet of
1250, and another noticeable result was observed in an increase in the number of
surfaces beyond this value. The surface detail of 1250 appears to be the standard
value as beyond which it seems that there was not any significant variation in the
results. This means that after this reference value, there does not seem any additiona l
benefit for increasing the refinement.
3.5 Importance of PoP socket scanning
To date, conventional prosthetic socket making depends on upon the skills
and experiences of the prosthetic practitioner. The present work reduces the effort of
the prosthetic practitioner by employing automation process so that he/she gets
consistent outcome measures indicating successful rehabilitation.

Reverse Engineering (RE) and Computer Aided Design (CAD).... 72
In the proposed method, the patient‘s psychological fear of rays (ionizing
radiation from MRI or CT scan) for the stump measurement is alleviated, as the
direct scanning of the live limb is harmful to human health. Although many
technical literatures are available for integration of rapid manufacturing and
traditional manufacturing through reverse engineering, whereas no report was found
for converting PoP socket to AM socket.
Scanning of the negative cast can help in providing the more clear condition
of the residual stump, as the negative cast is prepared by generating appropriate
pressure points on the cast based on the clinical condition of the residual stump.
Hence, the scanner can easily capture those marked points for digitization.
Moreover, the socket design related database can be available for storage and
iterative redesign in the future. The individual patient database may provide a
clinical record of the different changes (volume, shape, colour, etc.) in the stump
and overall impact of the prosthetic devices.
It‘s a general observation of P&O practitioner that the volume of the positive
mold gets increased by 5 to 7 % in comparison to manual tape measurement of the
residual stump when the positive mold is prepared from the negative mold. The
positive mold modification becomes laborious with the traditional method scanning.
Therefore, PoP cast (negative mold) scanning simplified the processes.
The work includes the assessment of the accuracy of the PoP socket digital
model developed by RE procedure and determination of the key factors which
influences the free-form, dimension and geometric accuracy. The investigation of
absolute accuracy is very problematic since the only reference available to the user
is the original model. However, the digital and the actual model are used for
comparing the dimensional deviations at each corresponding point.
Assessment of the accuracy of the PoP socket digital model developed by RE
procedure and determination of the key factors which influences the free-form,
dimensional and geometric accuracy. The investigation of absolute accuracy is very
problematic since the only reference available for the user is the original model.

Reverse Engineering (RE) and Computer Aided Design (CAD).... 73
The methodology presented in this thesis shows that inexperienced users
have an extra advantage in working on instinctive and automated tools like
ScanTo3D and digitized shape editor. On the contrary, an expert technician can help
in improving the quality and accuracy of prosthetic digital models generated using a
vigilant selection of different point processing parameters using a variety of CAD
tools. The software used in this study has better flexibility in selecting different
point processing parameters. The accuracy obtained for the developed PoP socket
model in this study is in accordance with published literature results (Lin et al.
2005), for the use in medical applications and FEM analysis.
Chapter Summary
This chapter has delivered:
The descriptions of materials and methods used in the fabrication of
traditional prosthesis socket manufacturing.
The 3D scanning for the PoP socket of the stump is employed in the place of
expensive CAD models obtained through CT/MRI.
Propose the development of a semi-automated methodology which integrates
traditional process and reverses engineering methodology for developing a
CAD model of prosthesis socket.
This chapter provides an optimum balance for the best accuracy obtainable
with maximum allowable deviation to lesser computer handling and
processing time.
A step by step alternating RE process with emphasis on using commercial
software tools is proposed in this study that can also develop accurate digital
surface models compared to conventional one step point cloud processing.
The result obtained for the developed digital model is by the prosthetic and
orthotic practice and FEM analysis.

Finite Element Analyses of CAD model of Socket obtained using RE 74
CHAPTER 4
FINITE ELEMENT ANALYSES OF CAD MODEL OF SOCKET
OBTAINED USING REVERSE ENGINEERING
Introduction
This chapter is focused on performing nonlinear static analysis using a
hyper-elastic material model for the soft tissue which was carried out to determine
the pre-stresses due to the donning procedure as well as the stresses developed due
to body weight application. The model created for this study utilizes high-density
linear elements and the mesh was verified to converge. The results of this study are
not specific to one particular individual, therefore applying the procedure developed
herein to a specific individual‘s anatomical geometry and prosthesis lead ing to
results which can guide the redesign of the prosthesis socket. This chapter proposed
a new perspective in socket analysis and design. The chapter also provides a
comfortable interface for the distribution of load and understanding interface
pressure over the residual limb. The stress distributions of the prosthesis socket were
analyzed using the finite element analysis (FEA) method.
The finite element analysis was performed using the following methodology; the
model geometry was first obtained and refined, the pre-processing stage of the FE
model was completed by creating a mesh, load and boundary conditions were
applied followed by defining element types, contact and material models. Lastly, the
analysis was run and the results were post-processed. This chapter is subdivided into
sections describing each of these steps in more detail.
4.1 Geometry acquisition and digitization of PoP socket
The residual limb geometry was developed by surface fitting point cloud
data generated by scanning a physical model of a person‘s trans tibial stump obtained
by scanning of the negative cast of the patient‘s stump. Three below-knee male
amputees participated in this study. The patients selected for the study were two
unilateral and one bilateral amputation with Patellar Tendon Bearing (PTB) sockets
having a uniform thickness of 5 mm with cotton liner. General information about the
patients is given in Table 4.1.

Finite Element Analyses of CAD model of Socket obtained using RE 75
Table-4.1: General information of below Knee Amputees
Patient Age
(year)
Height
(cm)
Weight
(kg)
Prosthesis
in use
(year)
Type of
Amputee
Causes of
Amputation
Side and
Stump
length (cm)
P1 36 161 61 11 Unilateral Traumatic Left 11.1
(±2. 0)
P2 48 176 70 24 Unilateral
Trauma-
vascular
disease
Right 6.3
(±2. 0)
P3 50 153 56 28 Bilateral Trauma- diabetic
Right 18 (±2. 0)
Left 15
(±2. 0)
P1 patient1, P2 patient2, P3 patient3
The prosthetic socket is made up of a typical stiff material, such as
polypropylene or polyester having approximately 3 to 6 mm thickness (Steege et al.,
1996). In practice, the socket thickness is decided by an empirical formula derived
from the weight of the patients, i.e., (kg/20) (Duchemin et al., 2008).
The external volumetric geometry of the prosthesis socket of the residual
limb surface was obtained from Bhagwan Mahaveer Viklang Sahayata Samiti
(BMVSS) in Jaipur, India. Socket model is totally based on patient‘s actual
geometry and dimension. Four PoP sockets were cast for each patient in the
sequence shown in Figure 4.1 (a-d).
Figure-4.1: (a) Preparing PoP bandage (b) Cover the stump wit click film
(c) Marking the pressure relief area at the patellar tendon (d) PoP cast is
removed from the Patient residual limb
Initially, the external geometries of the lower limb surface of the patient are
precisely reproduced using PoP cast slurry. Then, the PoP cast was scanned using

Finite Element Analyses of CAD model of Socket obtained using RE 76
Steinbichler 3Dscanner COMET L3D as shown in Figure 4.2. It was difficult to
capture the inside profile points due to the tubular segment of the cast. Due to large
socket size, it was not possible to perform full scanning in a single field of view.
Hence, the surface point clouds were captured in thirty equal steps. This non-contact
3D scanner is best suited for digitizing nonrigid (green state) objects having
complex geometry like PoP cast socket mold. After capturing of Point cloud data,
Geomagic software was used for constructing comparable CAD models of a socket.
Owing to the complex geometry, precise meshing software, i.e. Hypermesh was
used for creating a volume mesh of the CAD model followed by mesh refining.
Final analysis of the socket was performed using HyperWorks.
Figure-4.2: Digitization of PoP cast, and then scans view of anterior and
posterior
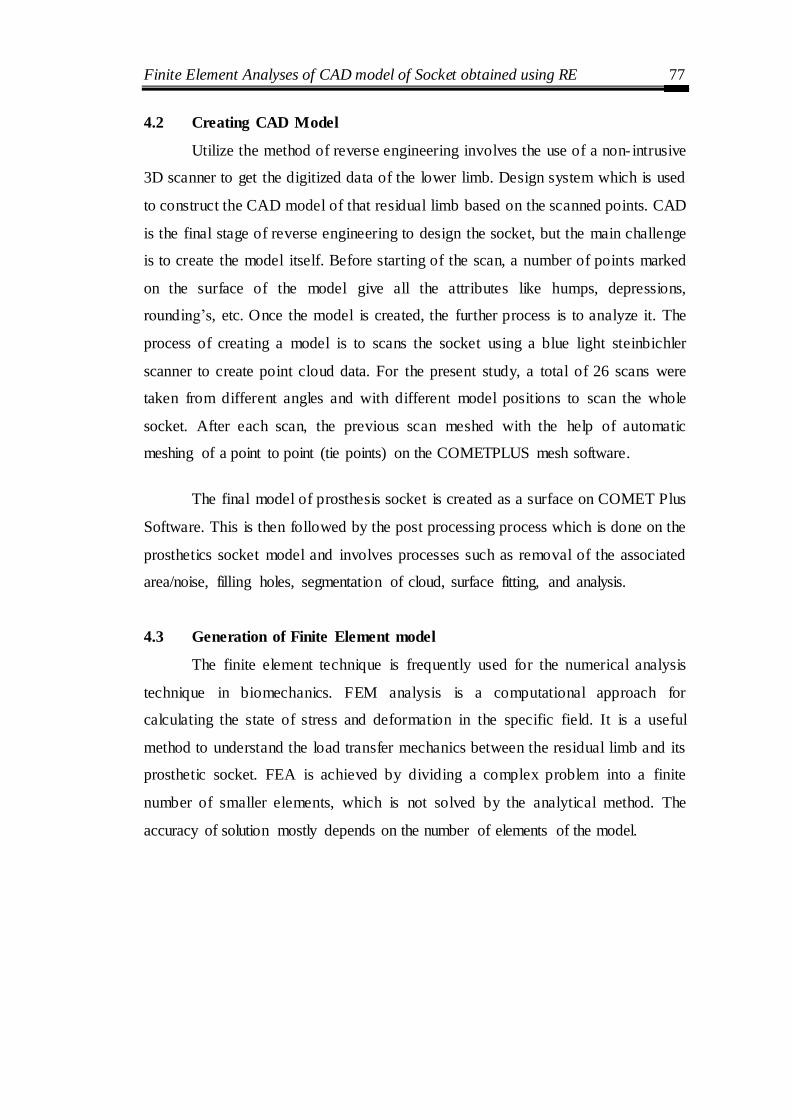
Finite Element Analyses of CAD model of Socket obtained using RE 77
4.2 Creating CAD Model
Utilize the method of reverse engineering involves the use of a non- intrusive
3D scanner to get the digitized data of the lower limb. Design system which is used
to construct the CAD model of that residual limb based on the scanned points. CAD
is the final stage of reverse engineering to design the socket, but the main challenge
is to create the model itself. Before starting of the scan, a number of points marked
on the surface of the model give all the attributes like humps, depressions,
rounding‘s, etc. Once the model is created, the further process is to analyze it. The
process of creating a model is to scans the socket using a blue light steinbichler
scanner to create point cloud data. For the present study, a total of 26 scans were
taken from different angles and with different model positions to scan the whole
socket. After each scan, the previous scan meshed with the help of automatic
meshing of a point to point (tie points) on the COMETPLUS mesh software.
The final model of prosthesis socket is created as a surface on COMET Plus
Software. This is then followed by the post processing process which is done on the
prosthetics socket model and involves processes such as removal of the associated
area/noise, filling holes, segmentation of cloud, surface fitting, and analysis.
4.3 Generation of Finite Element model
The finite element technique is frequently used for the numerical analysis
technique in biomechanics. FEM analysis is a computational approach for
calculating the state of stress and deformation in the specific field. It is a useful
method to understand the load transfer mechanics between the residual limb and its
prosthetic socket. FEA is achieved by dividing a complex problem into a finite
number of smaller elements, which is not solved by the analytical method. The
accuracy of solution mostly depends on the number of elements of the model.

Finite Element Analyses of CAD model of Socket obtained using RE 78
Figure-4.3: Flow chart of steps for FEM analysis on Altair Hyper Works
In developing the finite element model, first obtained the socket model
geometry then refined. In the pre-processing stage, FE model was then
accomplished by generating a mesh, applying load and boundary conditions,
defining element types and material models. Finally, the analysis was run and the
results were post-processed (Figure 4.3).
4.3.1 Mid-surfaces
There were no geometric irregularities, particularly free edges when the
model was imported in HyperMesh. The geometry is a thin walled 3D structure and
it contains outer and inner surfaces, and its two of the dimensions are very large in
comparison to the third dimension. Therefore shell elements are chosen. So after
visualizing, the mid-surface was extracted as shown in Figure 4.4 and thickness of

Finite Element Analyses of CAD model of Socket obtained using RE 79
the geometry is virtually assigned to the 2D elements. Mathematically, the element
thickness (specified by the user) is assigned to half in the + Z direction (element top)
and the other half in the – Z direction (element bottom).
Figure-4.4: Extracting the mid-surfaces from outer and inner surfaces in
HyperMesh
4.3.2 Mesh Generation:
2D elements are used for prosthetic socket design for mesh generation and
divided into three basic element shapes e.g. tria, quad and mixed.
Tria: There are two types of tria elements: Equilateral (trias) and Right
Angled tria (R-trias) elements. R-trias are used only for specific applications
such as mold flow analysis.
Quad: Quadrilateral elements have been proved to be useful for finite
element and finite volume methods, and for some applications, they are
preferred to triangles or tetrahedra. Therefore quadrilateral and hexahedral
mesh generation have become a topic of intense research. By connecting
polygon nodes to their respective nodes on the object boundary, one gets a
quadrilateral element mesh in the boundary region.
Mixed: The mixed mode, the element type is the most common element type
used due to better mesh pattern that it produces.
Meshed models with different mesh types are as shown in Figure 4.5. Note
the more homogeneous mesh pattern resulting from ―mixed‖ meshing.
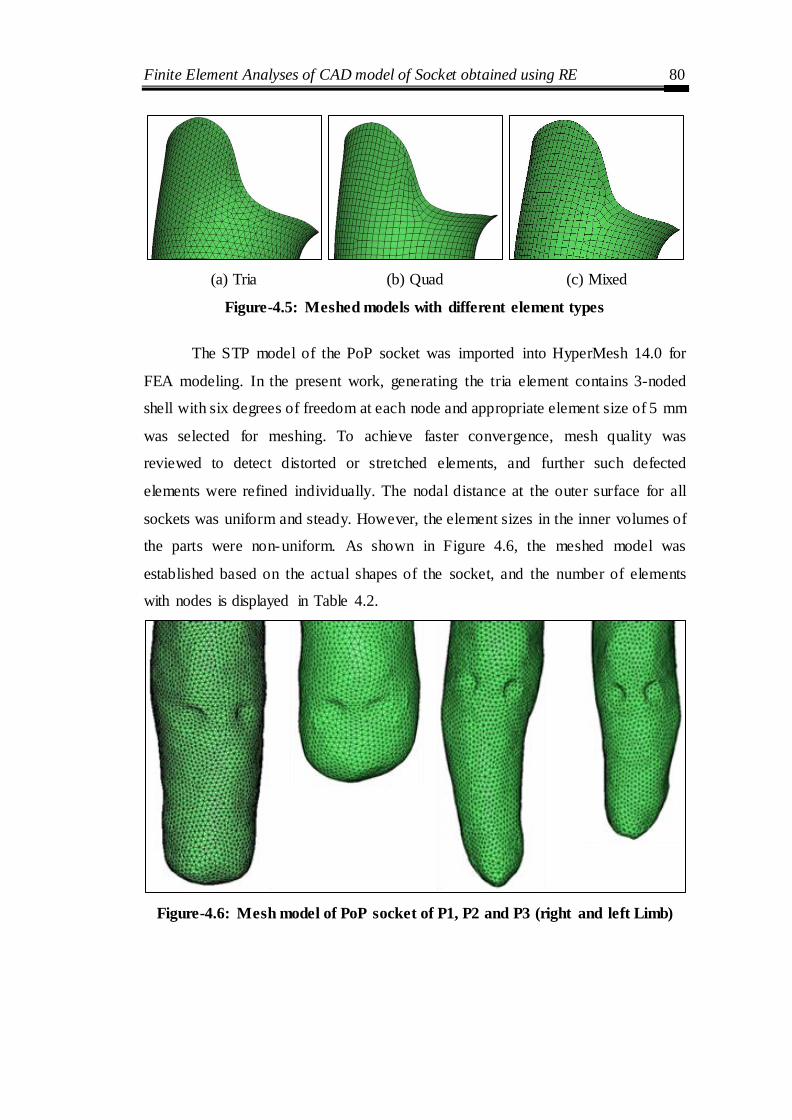
Finite Element Analyses of CAD model of Socket obtained using RE 80
(a) Tria (b) Quad (c) Mixed
Figure-4.5: Meshed models with different element types
The STP model of the PoP socket was imported into HyperMesh 14.0 for
FEA modeling. In the present work, generating the tria element contains 3-noded
shell with six degrees of freedom at each node and appropriate element size of 5 mm
was selected for meshing. To achieve faster convergence, mesh quality was
reviewed to detect distorted or stretched elements, and further such defected
elements were refined individually. The nodal distance at the outer surface for all
sockets was uniform and steady. However, the element sizes in the inner volumes of
the parts were non-uniform. As shown in Figure 4.6, the meshed model was
established based on the actual shapes of the socket, and the number of elements
with nodes is displayed in Table 4.2.
Figure-4.6: Mesh model of PoP socket of P1, P2 and P3 (right and left Limb)

Finite Element Analyses of CAD model of Socket obtained using RE 81
Table-4.2: Finite element model properties
Parameters P1 P2 P3
Amputee side Left Right Right Left
Mesh Type 3D Shell Tria
Elements
3D Shell Tria Elements
3D Shell Tria
Elements
3D Shell Tria Elements
Element size 5 mm 5 mm 5 mm 5 mm
Number of mesh elements
8467 5010 6487 5950
Number of nodes 4269 2540 3278 3009
4.3.3 Element Quality Check
In FEA modeling, element quality greatly affects the accuracy of the analysis
results. The FEA modeler must take into consideration element quality, and thereby
judge whether the analysis results are meaningful. There are many important quality
parameters that need to be checked that affect the accuracy of the analysis results.
Some of them are as follows:
The Warpage is the amount by which an element deviates from being planar.
Since three points define a plane, this check only applies to quads, while tria
elements do not have such problems. In this socket model warpage of up to
five degrees is acceptable.
Aspect Ratio is the ratio of the longest edge of an element to either its
shortest edge or the shortest distance from a corner node to the opposing
edge. Aspect ratios should rarely exceed 5:1.
The skew of triangular elements is calculated by finding the minimum angle
between the vector from each node to the opposing mid-side, and the vector
between the two adjacent mid-sides at each node of the element. The
minimum angle found is subtracted from ninety degrees and reported as the
element‘s skew.
Chordal Deviation of curved surfaces can be approximated by using many
short lines instead of a true curve. The chordal deviation is the perpendicular
distance between the actual curve and the approximating line segments.
Finite Element Analyses of CAD model of Socket obtained using RE 82
Jacobian measures the deviation of an element from its ideal or "perfect"
shape, such as a triangle‘s deviation from equilateral. The Jacobian value
ranges from 0.0 to 1.0, where 1.0 represents a perfect shaped element. In this
case of Jacobian evaluation at the Gauss points, values of 0.7 and above are
acceptable.
In all three types of meshed models were inspected and compared based on
the various quality parameters using check elements. As in mixed type mesh, there
were less no. of distorted elements, and mesh generation is smoother, so it is chosen
for further modeling. After a number of iterations and inspections, an element size
of 5 mm is chosen. The distorted/failed elements are corrected using various tools
available in HyperMesh.
4.3.4 Material Properties
To perform static analysis, the mechanical properties of the liner, bones, and
socket were assumed linear, elastic, isotropic and homogeneous (Zachariah et al.
2000, Zhang et al. 2000, Lee et al. 2004). From the literature, it was found that these
non- linearities were disregarded in socket analysis. For soft tissues, young‘s
modulus and the Poisson‘s ratio of 200 kPa and 0.49 was considered as material
properties (Jia et al. 2004). For this study, HDPE material is used, for which the
physical properties are enlisted in Table 4.3.
Table-4.3: Properties of different socket materials (Wu et al. 2003)
Material
Young’s
modulus
(Mpa)
Ultimate
stress
(Mpa)
Density
(Kg/m3)
Poisson’s
ratio
Polypropylene 1500 80 910 0.3
High-density polyethylene (HDPE)
800 37 950 0.39
Low-density polyethylene (LDPE)
280 25 920 0.41
Polyurethane 1500 39 830 0.3

Finite Element Analyses of CAD model of Socket obtained using RE 83
4.3.5 Loads and Boundary Conditions
The bottom of the socket was spatially restrained (a degree of freedom
constrained) and the distal end of prosthesis socket base attached to pylon as shown
in Figure 4.7. A shaft, along with the artificial foot is attached to the bottom end of
the socket which is flat. The stiffness of the shaft is of a higher order as compared to
the socket. Therefore, predetermined boundary condition up to 3 cm distance from
the tip of the socket‘s distal end was applied. Loading was based on the weights of
the patients in the range of (56-70) Kg and an approximate height of the patients is
in the range of (153-176) cm. However, from a study point of view, a generalized
weight of 80 kg is assumed. Thus, the total load due to gravity, i.e. 800 N vertical
downward load was applied under the static condition and the load is evenly
distributed on the patellar tendon (PT), medial tibia (MT), lateral tibia (LT),
popliteal depression (PD) and kick point (KP) stance phase of the gait during the
cycle. This load is applied at the top end of the socket. To distribute this force
equally on all the nodes of the top end, an independent node at the center is created,
and it was connected to all the nodes on edge through the rigid 1D element. From
the previous literature, it was observed that most researchers analyzed transfemoral
and transtibial prosthesis applied load equivalent to half (400 N) or full body weight
(800 N) at the femoral head, or they applied forces equivalent to the reaction forces
extracted from larger FE models (Jaime et al. 2012, Jia et al. 2004, lee et al. 2008).
Force=8.00e-02
Figure-4.7: Loads and boundary conditions of patient P2

Finite Element Analyses of CAD model of Socket obtained using RE 84
4.3.6 Stress Distribution
The deflection and stress distribution for the socket are shown in Figure (4.8
to 4.11). The von Mises stress distributions and displacements (in the y-direction) at
the stump-socket interface are essential for socket design. For 800 N downward
vertical load, the maximum stress of 1681 kPa, 2101 kPa, 1831 (L) kPa and 2782
(R) kPa respectively was observed in three patients as given in Table 4.4. Peaks of
stress arise on the anterior side in all cases except P3 (left). However, the same P3
patient has developed extremely stress (2782 kPa) on his right leg anterior side (at
kick point).
Figure-4.8: Anterior and Posterior deflection pattern and Von Mises stress
distribution of P1
Figure-4.9: Anterior and Posterior deflection pattern and Von Mises stress
distribution of P2
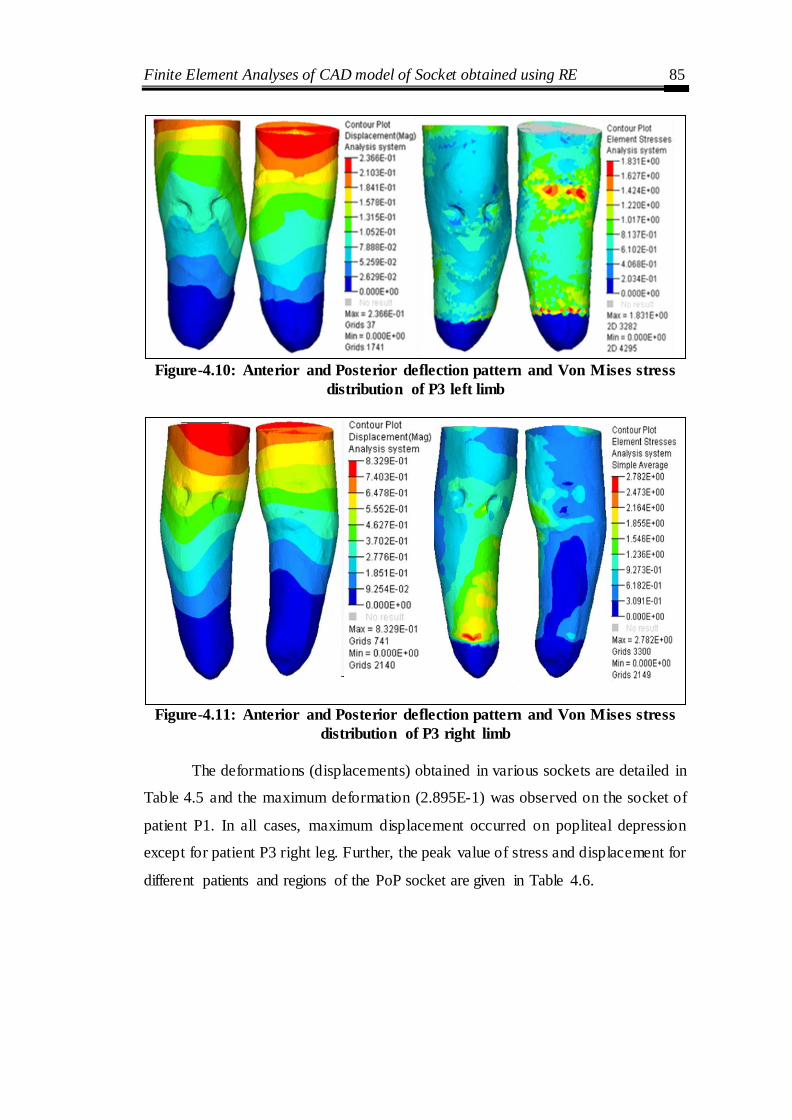
Finite Element Analyses of CAD model of Socket obtained using RE 85
Figure-4.10: Anterior and Posterior deflection pattern and Von Mises stress
distribution of P3 left limb
Figure-4.11: Anterior and Posterior deflection pattern and Von Mises stress
distribution of P3 right limb
The deformations (displacements) obtained in various sockets are detailed in
Table 4.5 and the maximum deformation (2.895E-1) was observed on the socket of
patient P1. In all cases, maximum displacement occurred on popliteal depression
except for patient P3 right leg. Further, the peak value of stress and displacement for
different patients and regions of the PoP socket are given in Table 4.6.

Finite Element Analyses of CAD model of Socket obtained using RE 86
Table-4.4: Von Mises stress distribution at different regions for PoP socket
Regions
Stress
P1 (kPa) P2 (kPa) P3 (kPa)
Left Right
Lateral Tibia (LT) 1121 1401 1017 927
Gastrocnemius (G) 1121 1634 813 1236
Patellar Tendon (PT) 1681 2101 1222 1855
Kick Point (KP) 1681 1634 1017 2782
Medial Tibia (MT) 933 1167 610 2164
Medial Gastrocnemius (MG) 744 700 813 618
Popliteal Depression (PD) 933 466 1831 1546
Lateral Gastrocnemius (LG) 560 700 1222 618
Table-4.5: Displacement at different regions for PoP socket
Regions
Displacement
P1 (mm) P2 (mm) P3 (mm)
Left Right
Lateral Tibia (LT) 1.737E-1 8.827E-2 7.888E-2 3.702E-1
Gastrocnemius (G) 1.158 E-1 5.884E-2 5.259E-2 2.776E-1
Patellar Tendon (PT) 2.895E-1 5.884E-2 1.052E-1 5.552E-1
Kick Point (KP) 1.158 E-1 2.942E-2 5.259E-2 9.254E-2
Medial Tibia (MT) 1.737E-1 1.177E-1 7.888E-2 1.851E-1
Medial Gastrocnemius (MG) 1.737E-1 8.827E-2 1.052E-1 9.254E-2
Popliteal Depression (PD) 2.895E-1 1.471E-1 1.578E-1 4.627E-1
Lateral Gastrocnemius (LG) 1.737E-1 8.827E-2 7.888E-2 1.851E-1
Table-4.6: Peak values of stresses and displacement at different regions
for PoP socket
P1 P2 P3
Left Right
Maximum stress (kPa) 1681
(PT) (KP)
2101
(PT)
1831
(PD)
2782
(KP)
Maximum deflection (mm)
2.895E-1 (PD) (PT)
1.471E-1 (PD)
1.578E-1 (PD)
5.552E-1 (PT)
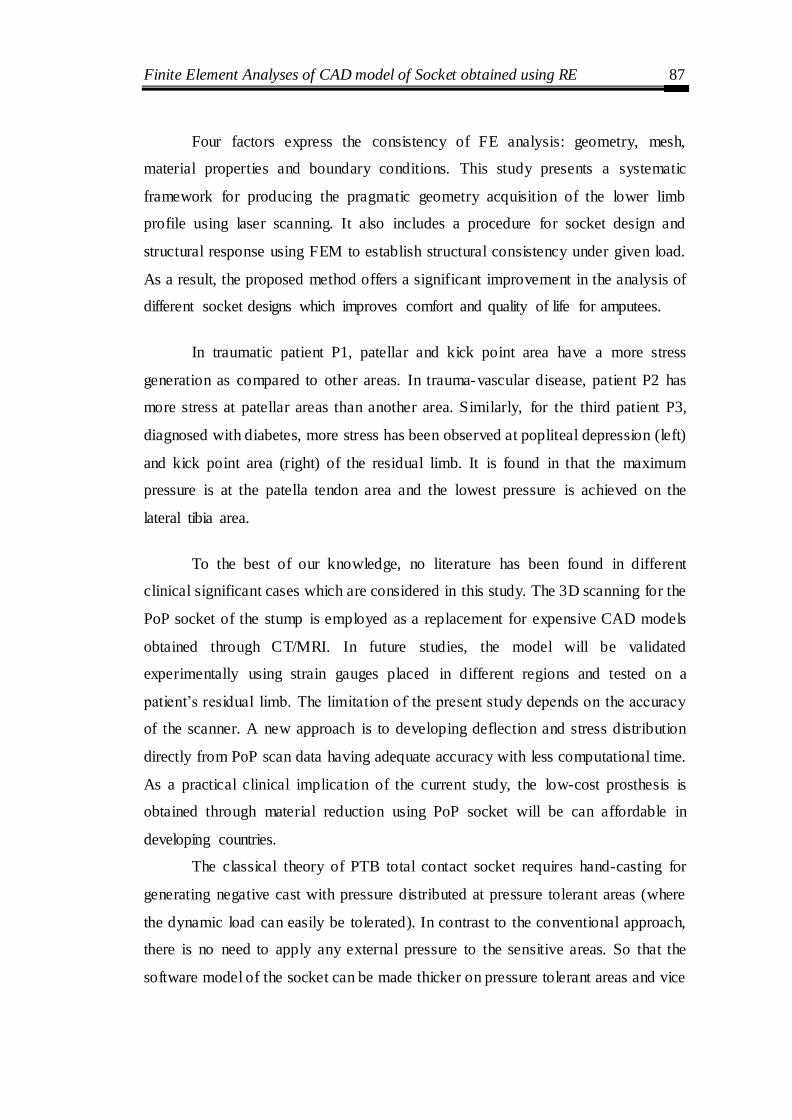
Finite Element Analyses of CAD model of Socket obtained using RE 87
Four factors express the consistency of FE analysis: geometry, mesh,
material properties and boundary conditions. This study presents a systematic
framework for producing the pragmatic geometry acquisition of the lower limb
profile using laser scanning. It also includes a procedure for socket design and
structural response using FEM to establish structural consistency under given load.
As a result, the proposed method offers a significant improvement in the analysis of
different socket designs which improves comfort and quality of life for amputees.
In traumatic patient P1, patellar and kick point area have a more stress
generation as compared to other areas. In trauma-vascular disease, patient P2 has
more stress at patellar areas than another area. Similarly, for the third patient P3,
diagnosed with diabetes, more stress has been observed at popliteal depression (left)
and kick point area (right) of the residual limb. It is found in that the maximum
pressure is at the patella tendon area and the lowest pressure is achieved on the
lateral tibia area.
To the best of our knowledge, no literature has been found in different
clinical significant cases which are considered in this study. The 3D scanning for the
PoP socket of the stump is employed as a replacement for expensive CAD models
obtained through CT/MRI. In future studies, the model will be validated
experimentally using strain gauges placed in different regions and tested on a
patient‘s residual limb. The limitation of the present study depends on the accuracy
of the scanner. A new approach is to developing deflection and stress distribution
directly from PoP scan data having adequate accuracy with less computational time.
As a practical clinical implication of the current study, the low-cost prosthesis is
obtained through material reduction using PoP socket will be can affordable in
developing countries.
The classical theory of PTB total contact socket requires hand-casting for
generating negative cast with pressure distributed at pressure tolerant areas (where
the dynamic load can easily be tolerated). In contrast to the conventional approach,
there is no need to apply any external pressure to the sensitive areas. So that the
software model of the socket can be made thicker on pressure tolerant areas and vice

Finite Element Analyses of CAD model of Socket obtained using RE 88
versa. Practically as this approach utilizes prosthetist skill, it gives a pre-assessment
of the socket fit which decreases hit and trial of the socket. The advantages of using
this approach that gets a simulation model of the PoP cast for analysis and less time-
consuming in the modification of the prosthetic socket. By involving the expert
personnel in the automation of prosthesis the human-touch intact, it increases the
sustainability of the engineered product.
4.4 Socket thickness design based on aspect ratio criteria
Meshed model of the Prosthesis socket with a commonly used aspect ratio
are analyzed for stress distribution using finite element method. An optimum socket
thickness was arriving for a given socket. Thickness is an important parameter as too
less thickness leads to the failure of socket and greater thickness leads to discomfort
to patients. Geometry information about the short and long below-knee stump is
shown in Figure 4.12. The transfer of power via the stump-prosthesis interface is
almost impossible with short stumps when conventional fitting techniques are used.
Figure-4.12: Geometry of the short and long below-knee stump
L-stump length, D- stump diameter, e- eccentricity of the force
The design of the conventional patella tendon bearing (PTB) prosthesis is
based on specialized regions of load transfer. The vertical load is carried mainly on
the impression of the socket in the region of the patellar tendon. The regions on both
sides of the tibial crest, the distal posterior surface, and the poplitea provide
additional support in standing and ambulation. When the stump is short, it becomes
spherical and the moment's transfer mechanism becomes quite inefficient.
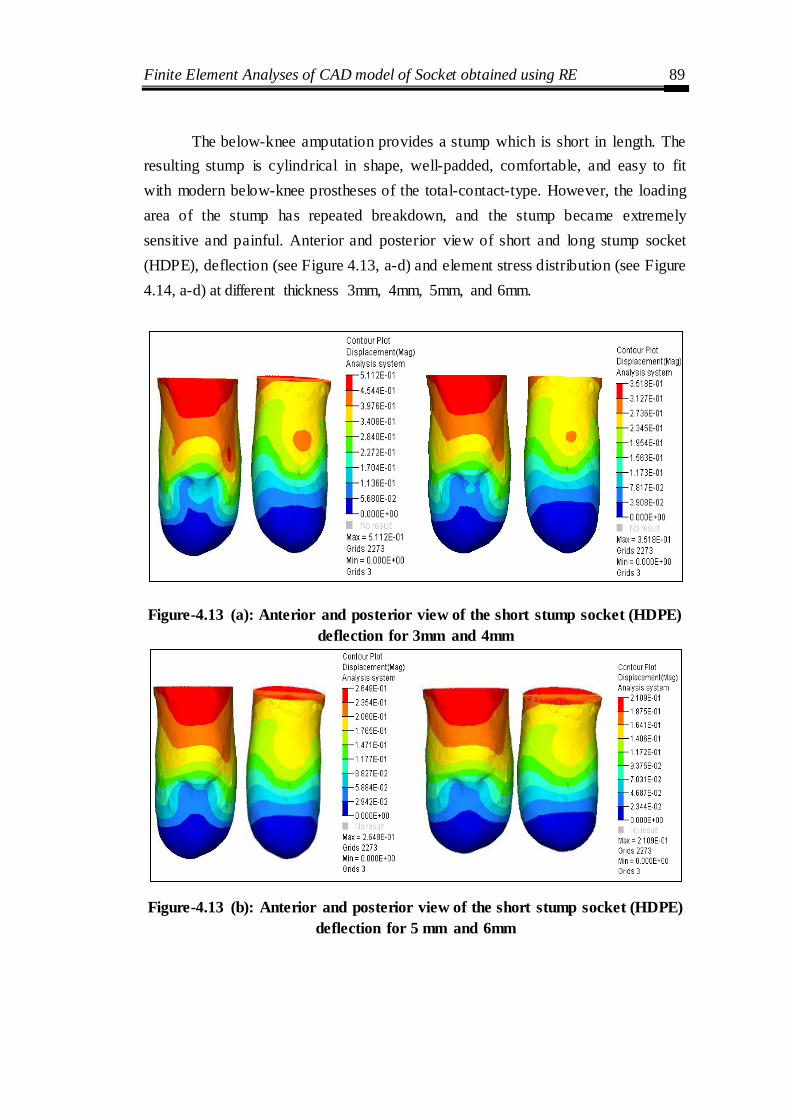
Finite Element Analyses of CAD model of Socket obtained using RE 89
The below-knee amputation provides a stump which is short in length. The
resulting stump is cylindrical in shape, well-padded, comfortable, and easy to fit
with modern below-knee prostheses of the total-contact-type. However, the loading
area of the stump has repeated breakdown, and the stump became extremely
sensitive and painful. Anterior and posterior view of short and long stump socket
(HDPE), deflection (see Figure 4.13, a-d) and element stress distribution (see Figure
4.14, a-d) at different thickness 3mm, 4mm, 5mm, and 6mm.
Figure-4.13 (a): Anterior and posterior view of the short stump socket (HDPE)
deflection for 3mm and 4mm
Figure-4.13 (b): Anterior and posterior view of the short stump socket (HDPE)
deflection for 5 mm and 6mm
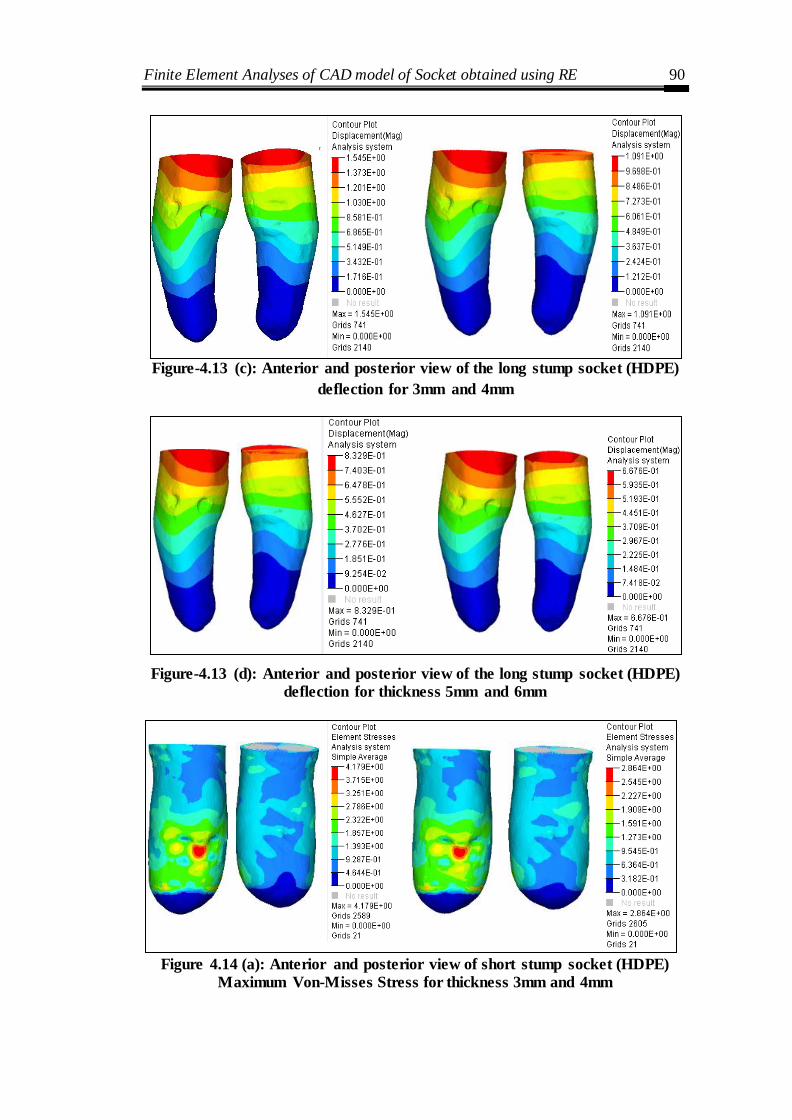
Finite Element Analyses of CAD model of Socket obtained using RE 90
Figure-4.13 (c): Anterior and posterior view of the long stump socket (HDPE)
deflection for 3mm and 4mm
Figure-4.13 (d): Anterior and posterior view of the long stump socket (HDPE)
deflection for thickness 5mm and 6mm
Figure 4.14 (a): Anterior and posterior view of short stump socket (HDPE)
Maximum Von-Misses Stress for thickness 3mm and 4mm

Finite Element Analyses of CAD model of Socket obtained using RE 91
Figure 4.14 (b): Anterior and posterior view of short stump socket (HDPE)
Maximum Von-Misses Stress for thickness 5mm and 6mm
Figure 4.14 (c): Anterior and posterior view of long stump socket (HDPE)
Maximum Von-Misses Stress for thickness 3mm and 4mm
Figure 4.14: Anterior and posterior view of long stump socket (HDPE)
Maximum Von-Misses Stress for thickness 5mm and 6mm
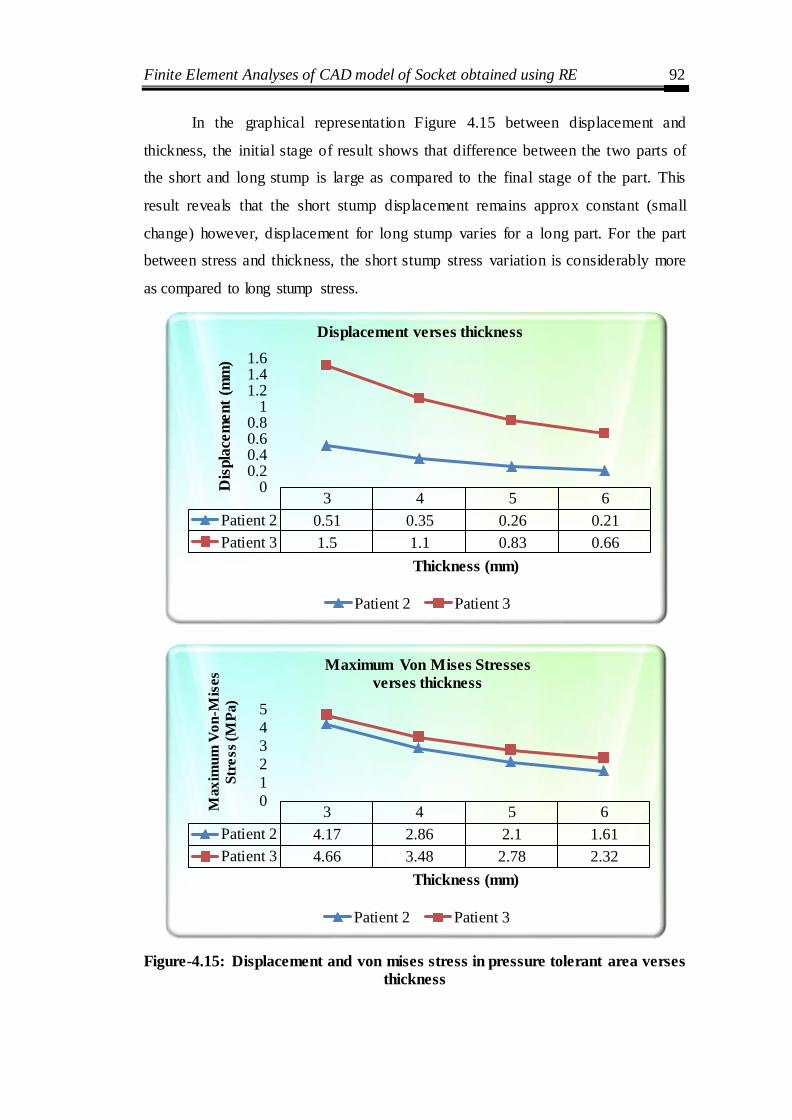
Finite Element Analyses of CAD model of Socket obtained using RE 92
In the graphical representation Figure 4.15 between displacement and
thickness, the initial stage of result shows that difference between the two parts of
the short and long stump is large as compared to the final stage of the part. This
result reveals that the short stump displacement remains approx constant (small
change) however, displacement for long stump varies for a long part. For the part
between stress and thickness, the short stump stress variation is considerably more
as compared to long stump stress.
Figure-4.15: Displacement and von mises stress in pressure tolerant area verses
thickness
3 4 5 6
Patient 2 0.51 0.35 0.26 0.21
Patient 3 1.5 1.1 0.83 0.66
00.20.40.60.8
11.21.41.6
Dis
pla
cem
ent
(mm
)
Thickness (mm)
Displacement verses thickness
Patient 2 Patient 3
3 4 5 6
Patient 2 4.17 2.86 2.1 1.61
Patient 3 4.66 3.48 2.78 2.32
0
1
2
3
4
5
Max
imu
m V
on
-Mis
es
Str
ess
(MP
a)
Thickness (mm)
Maximum Von Mises Stresses
verses thickness
Patient 2 Patient 3

Finite Element Analyses of CAD model of Socket obtained using RE 93
Chapter Summary
This chapter presents a novel approach to improve the design of the BK
prosthetic socket through FE analysis. A scientific understanding of pressure-
displacement intensity at the socket- limb interface is essential for the improvement
of prosthetic socket design.
The results provide significant insight into the socket design and a roadmap
for customization of the sockets. Although stress–strain patterns and magnitudes
have shown similar behavior for all the patients, however patient-specific solution is
needed for comfortable socket design as the peak value of stress was found to vary.
Experimental Pressure Measurement Between Slump & Socket 94
CHAPTER 5
EXPERIMENTAL PRESSURE MEASUREMENT BETWEEN
STUMP AND SOCKET
Introduction
This chapter discusses how to predict the pressure distribution around the
residual limb under different loading conditions. The methodo logy for pressure
measurement in the residual limb is to insert a pressure film in the prosthetic socket
and record the pressure between stump-socket with the help of FUJIFILM. Further,
these measurements are used to perform the pressure distribution to assist clinicians
in designing ventilated sockets avoiding mechanical failures. Then, the focus is to
evaluate the pressure distribution between the limb and socket at specific regions.
Regression technique is used to develop analytical models for each of the loading
conditions (half, full and walking). Subsequently, the population-based genetic
algorithm has been utilized to predict the pressure regions (Min-Max) by optimizing
the developed mathematical model. This methodology helps to correlate the
simulation study results with the experimental results.
5.1 Measuring Interface Pressure using sensors
The distribution of pressure at the interface between the residual limb stump
and the prosthetic socket has played a significant role in the rehabilitation of socket
design. Biomechanics of stump-socket interface, especially the pressure and force
distribution, have an effect on patient satisfaction and function. The information
obtained has been used either to increase the understanding of socket load transfer,
to evaluate the socket design, or to validate the computational modeling. Interface
pressure measurements require a proper measurement technique, which includes the
use of sensors, their placement at the prosthetic interface, as well as the related data
acquisition and conditioning approach. An ideal system should be able to
continually monitor real interfacial stresses; both pressure and shear, without
significant interference to the original interface conditions. A variety of sensors were
used to measure the socket pressure. They can be classified, based on their operation
principle, sensor size, range, number of sensors and output device

Experimental Pressure Measurement Between Slump & Socket 95
5.2 FUJIFILM Pressure Film
The pressure measurements in the stump-socket interface prosthesis were
carried out using the FUJIFILM (Japan). Pre-sensor is a measuring system
developed by Fuji Photo Film Co., Ltd. and used in medical applications. One
healthy male with right below-knee amputee 48-year-old, the unilateral subject was
selected to participate in the study. The patient wears patellar tendon bearing (PTB)
prosthesis socket with a uniform thickness of 5 mm with cotton liner.
Ultra super low pressure (LLLW) pressure film having pressure range (0.2-
0.6 Mpa) was used in two sheet type A and C. Type A film is a base material coated
with the colour forming material and film C is coated with a colour developing
material. The coated sides of each film must face in front of each other and the
flexible pressure sensing mats. During the application of normal operating pressure,
the microcapsules are broken, and the colour- forming material transfers to the colour
developing material and reacts, thereby generating a red colour. This sheet-based
medium uses a chemical release mechanism to produce a pink stain on the sheet-
surface and a greater pressure produces a darker stain.
In this experimental wok, pressure film (FUJIFILM) was placed at critical
locations of stump (anterior, medial, posterior and lateral area) and pressure at this
level is to refered as a continuous pressure which is detected by change in colour to
red and the density change according to intensity of applied pressure. Pressure was
applied for five seconds and further maintained for another five seconds. The density
of red allows graphical evaluation of the strength of force. The colour intensity is
directly proportional to the actual pressure. This pressure map was be visually
inspected and compared to a colour calibration chart.
The patient did not report any pain throughout the employment of their
transtibial prosthesis. In another word, stump soft tissue integrity was not disturbed,
and they did not feel any significant pressure in the socket. The cutting of Fuji film
into residual limb shape needs careful placement of film. The Film was sliced into
strips according to limb dimension. The patient is made to stand, and a plumb line
was dropped at the tip of the head of the fibula. The distance between the anterior
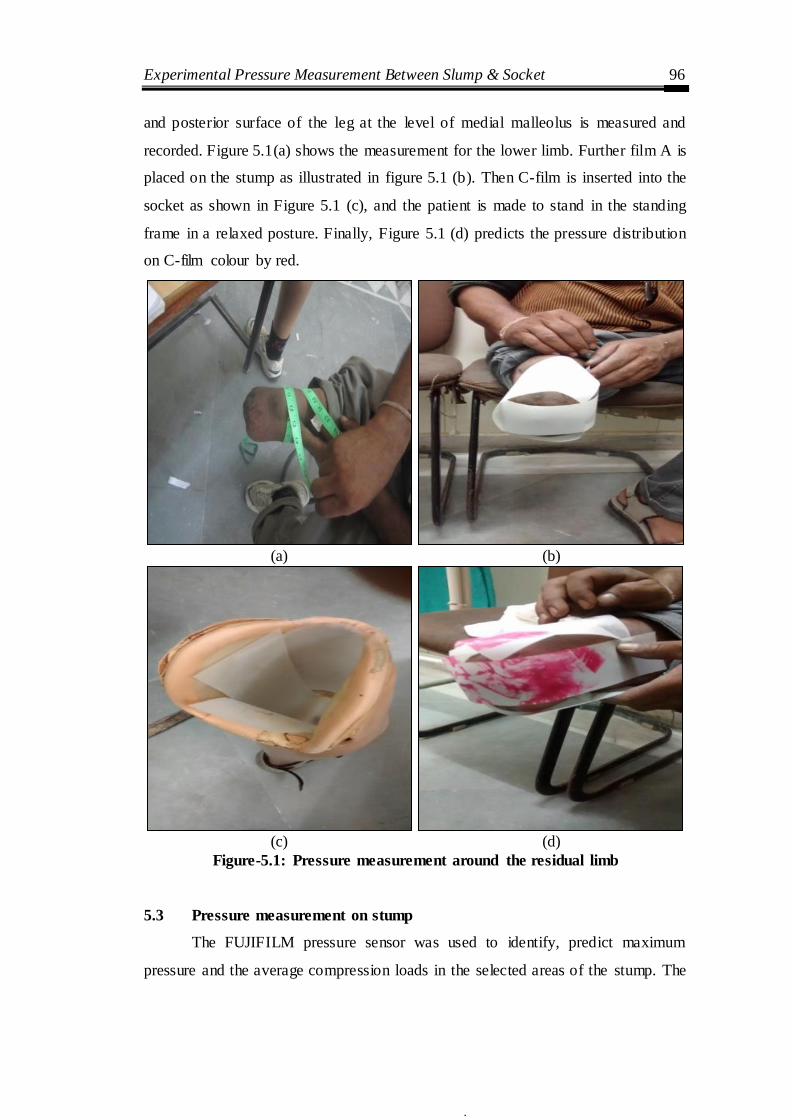
Experimental Pressure Measurement Between Slump & Socket 96
and posterior surface of the leg at the level of medial malleolus is measured and
recorded. Figure 5.1(a) shows the measurement for the lower limb. Further film A is
placed on the stump as illustrated in figure 5.1 (b). Then C-film is inserted into the
socket as shown in Figure 5.1 (c), and the patient is made to stand in the standing
frame in a relaxed posture. Finally, Figure 5.1 (d) predicts the pressure distribution
on C-film colour by red.
(a) (b)
(c) (d)
Figure-5.1: Pressure measurement around the residual limb
5.3 Pressure measurement on stump
The FUJIFILM pressure sensor was used to identify, predict maximum
pressure and the average compression loads in the selected areas of the stump. The
a b

Experimental Pressure Measurement Between Slump & Socket 97
measurements using the FUJIFILM system were carried out in the room at a
constant temperature (22-25°C), and humidity during the entire measuring is 65%.
As it is a dynamic measuring with a pressure sensor, it is necessary to ensure the
absenteeism of obstacles during the execution of the measurements walking by a
subject with a pressure sensor. Figure 5.2 depicts the layout of the pressure sensing
regions at Anterior, Lateral, Medial and Posterior sides of the lower limb of the
stump.
LG-Lateral Gastrocnemius, PP-Postero Proximal, MG-Medial Gastrocnemius, PD-Postero Distal,
MT-Media; Tibia, PT-Patellar Tendon, KP-Kick Point, LT-Lateral Tibia, G - Gastrocnemius
* All dimensions in cm and overall dimension of socket is (37.5 x 18.5 x 0.4)
Figure 5.2: Layout of the pressure sensing regions
Figure 5.3 demonstrates how the pressure distribution resulted at posterior,
medial, anterior and lateral display in a 2D configuration and varied during the
stance phase of gait. This film has the advantage of being highly customizable and
being adaptable enough to fit any stump size. The result shows that the pressures on
the patellar tendon and lateral tibial condyle regions are similar and shows little
change in pressure with alignment. The pressure distribution obtained through
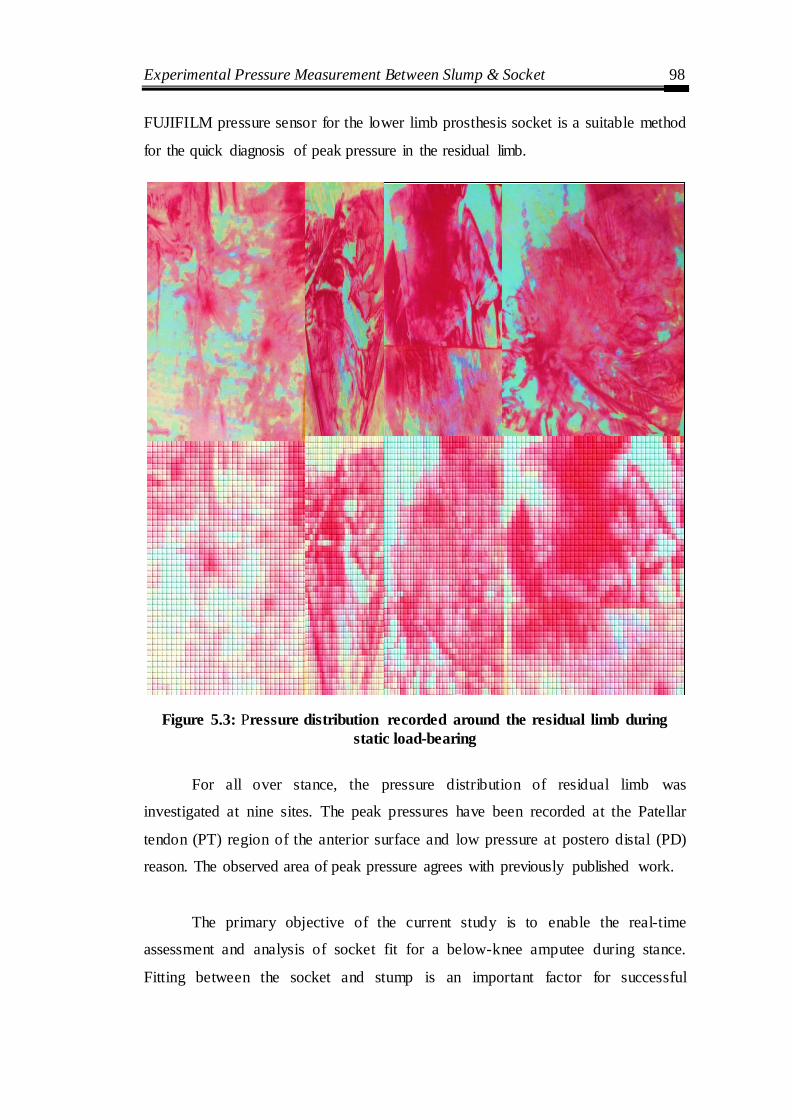
Experimental Pressure Measurement Between Slump & Socket 98
FUJIFILM pressure sensor for the lower limb prosthesis socket is a suitable method
for the quick diagnosis of peak pressure in the residual limb.
Figure 5.3: Pressure distribution recorded around the residual limb during
static load-bearing
For all over stance, the pressure distribution of residual limb was
investigated at nine sites. The peak pressures have been recorded at the Patellar
tendon (PT) region of the anterior surface and low pressure at postero distal (PD)
reason. The observed area of peak pressure agrees with previously published work.
The primary objective of the current study is to enable the real-time
assessment and analysis of socket fit for a below-knee amputee during stance.
Fitting between the socket and stump is an important factor for successful
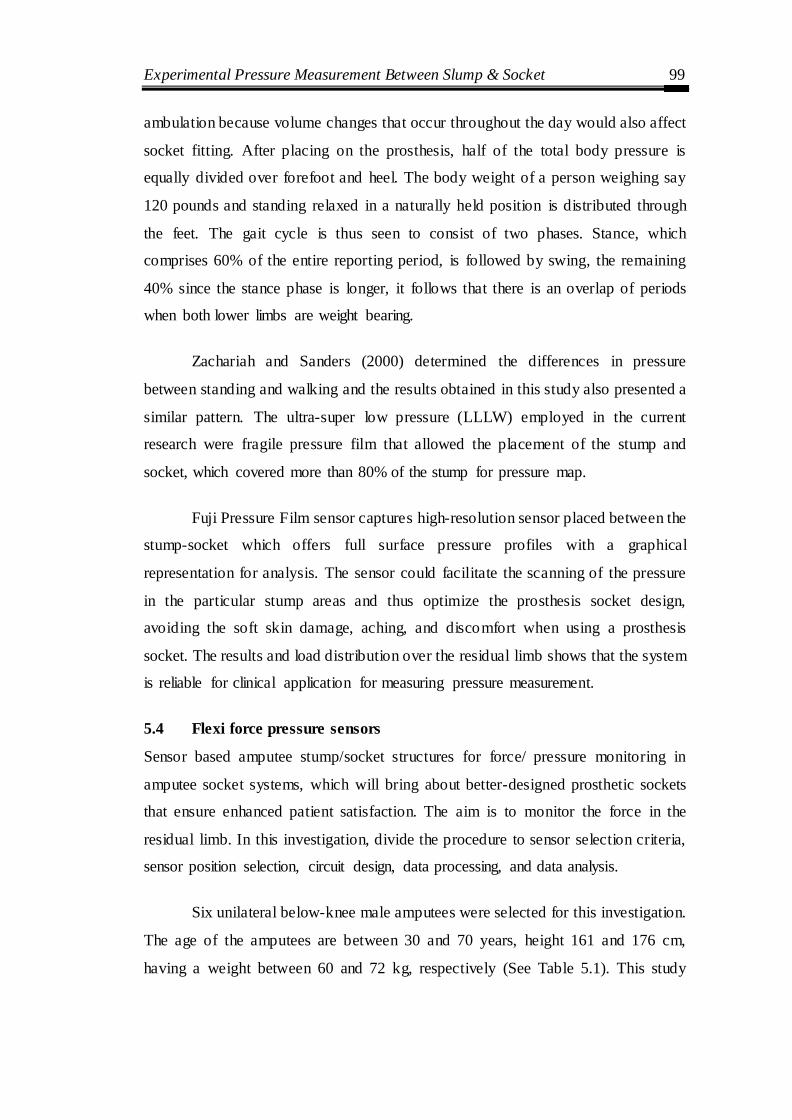
Experimental Pressure Measurement Between Slump & Socket 99
ambulation because volume changes that occur throughout the day would also affect
socket fitting. After placing on the prosthesis, half of the total body pressure is
equally divided over forefoot and heel. The body weight of a person weighing say
120 pounds and standing relaxed in a naturally held position is distributed through
the feet. The gait cycle is thus seen to consist of two phases. Stance, which
comprises 60% of the entire reporting period, is followed by swing, the remaining
40% since the stance phase is longer, it follows that there is an overlap of periods
when both lower limbs are weight bearing.
Zachariah and Sanders (2000) determined the differences in pressure
between standing and walking and the results obtained in this study also presented a
similar pattern. The ultra-super low pressure (LLLW) employed in the current
research were fragile pressure film that allowed the placement of the stump and
socket, which covered more than 80% of the stump for pressure map.
Fuji Pressure Film sensor captures high-resolution sensor placed between the
stump-socket which offers full surface pressure profiles with a graphical
representation for analysis. The sensor could facilitate the scanning of the pressure
in the particular stump areas and thus optimize the prosthesis socket design,
avoiding the soft skin damage, aching, and discomfort when using a prosthesis
socket. The results and load distribution over the residual limb shows that the system
is reliable for clinical application for measuring pressure measurement.
5.4 Flexi force pressure sensors
Sensor based amputee stump/socket structures for force/ pressure monitoring in
amputee socket systems, which will bring about better-designed prosthetic sockets
that ensure enhanced patient satisfaction. The aim is to monitor the force in the
residual limb. In this investigation, divide the procedure to sensor selection criteria,
sensor position selection, circuit design, data processing, and data analysis.
Six unilateral below-knee male amputees were selected for this investigation.
The age of the amputees are between 30 and 70 years, height 161 and 176 cm,
having a weight between 60 and 72 kg, respectively (See Table 5.1). This study
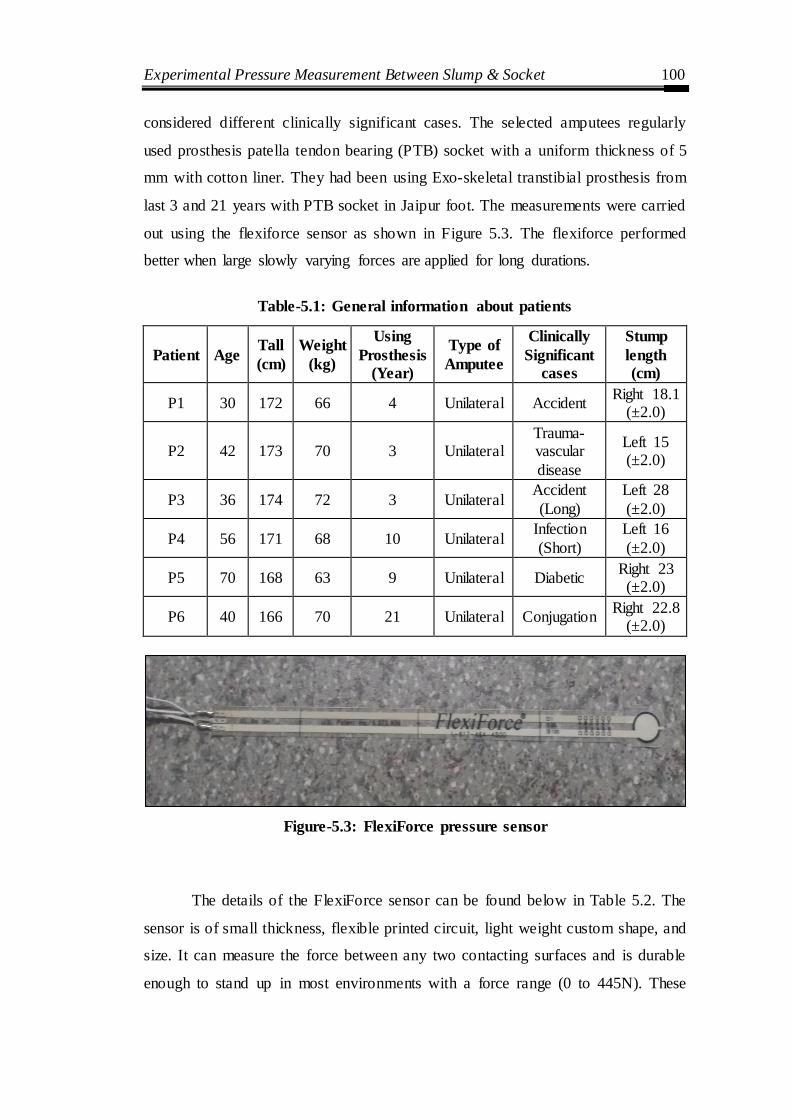
Experimental Pressure Measurement Between Slump & Socket 100
considered different clinically significant cases. The selected amputees regularly
used prosthesis patella tendon bearing (PTB) socket with a uniform thickness of 5
mm with cotton liner. They had been using Exo-skeletal transtibial prosthesis from
last 3 and 21 years with PTB socket in Jaipur foot. The measurements were carried
out using the flexiforce sensor as shown in Figure 5.3. The flexiforce performed
better when large slowly varying forces are applied for long durations.
Table-5.1: General information about patients
Patient Age Tall
(cm)
Weight
(kg)
Using
Prosthesis (Year)
Type of
Amputee
Clinically
Significant
cases
Stump
length (cm)
P1 30 172 66 4 Unilateral Accident Right 18.1
(±2.0)
P2 42 173 70 3 Unilateral Trauma-vascular
disease
Left 15 (±2.0)
P3 36 174 72 3 Unilateral Accident
(Long)
Left 28
(±2.0)
P4 56 171 68 10 Unilateral Infection
(Short)
Left 16
(±2.0)
P5 70 168 63 9 Unilateral Diabetic Right 23 (±2.0)
P6 40 166 70 21 Unilateral Conjugation Right 22.8
(±2.0)
Figure-5.3: FlexiForce pressure sensor
The details of the FlexiForce sensor can be found below in Table 5.2. The
sensor is of small thickness, flexible printed circuit, light weight custom shape, and
size. It can measure the force between any two contacting surfaces and is durable
enough to stand up in most environments with a force range (0 to 445N). These

Experimental Pressure Measurement Between Slump & Socket 101
sensors can be easily integrated between stump-socket interfaces. The sensor
measures both static and dynamic forces between stump and socket. It is constructed
from two layers of the substrate; substrate is composed of polyester film (or
Polyimide in the case of the High-Temperature Sensors). On each layer, a
conductive material (silver) is applied, followed by a layer of pressure-sensitive ink.
The adhesive is then used to laminate the two layers of substrate together to form the
sensor. The sensor acts as a variable resistor in an electrical circuit. When the sensor is
unloaded, its resistance is very high (greater than 5 MΩ); when a force is applied to
the sensor, the resistance decreases. Table.5.1 indicates the properties of this sensor.
Table-5.2: Physical Properties and performance FlexiForce Standard Model A201
S.
No Parameters Value Unit
1 Thickness 0.208 mm
2 Length 197 mm
3 Width 14 mm
4 Sensing Area 9.53 mm
5 Standard Force Ranges 0-445 N
6 Linearity (Error) < ±3%
7 Repeatability < ± 2.5% of Full Scale
8 Response Time < 5 μsec
9 Operating Temperature -9 to 60 °C
5.4.1 Genetic Algorithm
Genetic Algorithm (GA) is a population-based search and optimization
techniques originally introduced by Holland, 1992. It is a heuristic tool, which is
based on the Darwin principle of natural selection involving evolutionary processes
such as selection, mutation, and crossover. The population means a group or a set of
solutions. The design variables are encoded into the solution strings of a finite
length, and the search starts with a population of the encoded solutions created at
random instead of the single point in the solution space. Based on the solutions in
the current population, it uses the genetic operators to replace the old population
with the new population of solutions till the termination criteria are satisfied. Thus,

Experimental Pressure Measurement Between Slump & Socket 102
this algorithm assesses only the objective function, and genetic operators - selection,
crossover, and mutation are used for exploring the search space. One can specify the
bounds and constraints for the variables in this algorithm. GA begins with the
initialization of randomly generated individuals of chromosomes. In each
generation, it performs processes of fitness evaluation compared with the best value
and modified. Here, modification means crossover and random mutation to form a
new population. During crossover, parent chromosomes are selected to produce
child chromosomes after possible recombination. The new population is then used in
the next iteration of the algorithm. The algorithm is run until some stopping criterion
is met such as a maximum number of generations of adequate fitness level.
The principal aim of using a genetic algorithm in this study is to predict
maximum and minimum pressure at the specific region of a socket interface. This
objective is achieved by optimizing the developed analytical model of pressure
using sensor based measurements and regression analysis. Based on the constraint
condition the parameters are optimized by the genetic algorithm. The genetic
algorithm determines optimal pressure values and recommends the values of process
parameters, height, weight, and stump length.
5.4.2 Experimental Setup
The experiments were carried out on amputees using an experimental setup
as shown in Figure 3. One step down transformer is used to convert AC voltage of
220 V to 9-0-9V and also, analog to digital converter (ADC) in the form of an IC is
used to convert AC to DC voltage. An analog-to-digital converter (ADC, A/D, or A
to D) is a device that converts a continuous physical quantity (usually voltage) to a
digital number that represents the quantity's amplitude. The conversion involves
quantization of the input, so it necessarily introduces a small amount of error.
Furthermore, instead of continuously performing the conversion, an ADC does the
conversion periodically, sampling the input. The result is a sequence of digital
values that have been converted from a continuous-time and continuous-amplitude
analog signal to a discrete-time and discrete-amplitude digital signal.
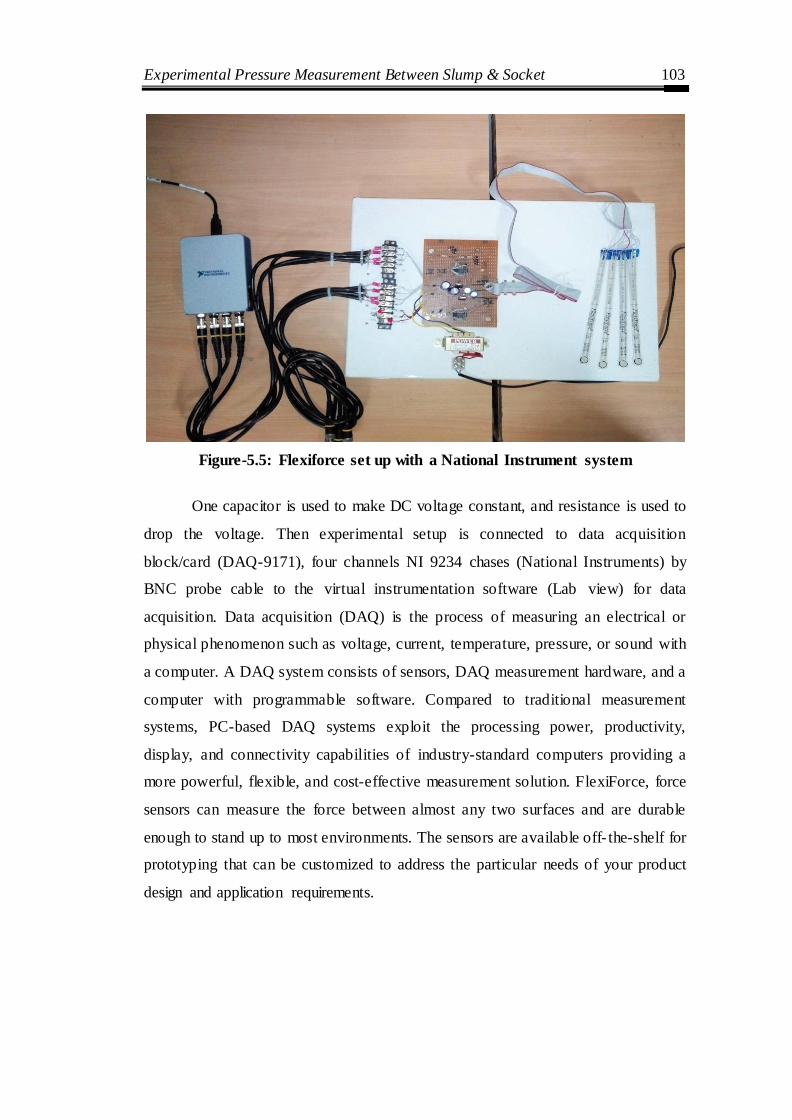
Experimental Pressure Measurement Between Slump & Socket 103
Figure-5.5: Flexiforce set up with a National Instrument system
One capacitor is used to make DC voltage constant, and resistance is used to
drop the voltage. Then experimental setup is connected to data acquisition
block/card (DAQ-9171), four channels NI 9234 chases (National Instruments) by
BNC probe cable to the virtual instrumentation software (Lab view) for data
acquisition. Data acquisition (DAQ) is the process of measuring an electrical or
physical phenomenon such as voltage, current, temperature, pressure, or sound with
a computer. A DAQ system consists of sensors, DAQ measurement hardware, and a
computer with programmable software. Compared to traditional measurement
systems, PC-based DAQ systems exploit the processing power, productivity,
display, and connectivity capabilities of industry-standard computers providing a
more powerful, flexible, and cost-effective measurement solution. FlexiForce, force
sensors can measure the force between almost any two surfaces and are durable
enough to stand up to most environments. The sensors are available off- the-shelf for
prototyping that can be customized to address the particular needs of your product
design and application requirements.

Experimental Pressure Measurement Between Slump & Socket 104
5.4.3 Circuit Construction
There are many ways to integrate the FlexiForce sensor into an application.
One way is to incorporate it into a force-to-voltage circuit. A means of calibration
must then be established to convert the output into the appropriate engineering units.
Depending on the setup, an adjustment could be made to adjust the sensitivity of the
sensor.
In this case, as shown in Figure 5.6, it is driven with a -5 V DC excitation
voltage. This circuit uses an inverting operational amplifier arrangement to produce
an analog output based on the sensor resistance and a fixed reference resistance
(RF). An analog-to-digital converter can be used to change this voltage to a digital
output. In this circuit, the sensitivity of the sensor could be adjusted by changing the
reference resistance (RF) and drive voltage (VT); a lower reference resistance and
drive voltage will make the sensor less sensitive, and increase its active force range.
Figure-5.6: Circuit diagram
5.4.4 Data Acquisition
In the present study, eight specific regions are identified to measure pressure
at different loading conditions (half, full and walking). Before initiating a
measurement, all hardware components of the FFS system (socket, connecting the
cable, converter) must be appropriately connected. The FFS is placed between the
liner and socket at eight specific regions. After wearing the prosthesis, an amputee is

Experimental Pressure Measurement Between Slump & Socket 105
advised to take a half load on both legs, full load on amputation side and walk 10-12
meters for dynamic pressure measurement. Further, a pressure measurement at all
eight regions can be viewed simultaneously in real- time using the software on
laptop/PC screen and the measurement can be repeated, if required.
The Flexible Force Sensor is an ultra-thin force sensor that is ready to plug-
n-play shown in Figure 5.7. The FFS works like any other bridge transducer, by
converting non- linear resistance changes to a linear output voltage proportional to
force. Paper-thin, the FlexiForce circuit is only 0.208 mm thick making it ideal to
measure the force between virtually any two surfaces. The FFS is a complete
sensing solution that is easy to use and accurate for a variety of applications.
Figure-5.7: The pressure points (Left) and fitting of sensor (Right) on the limb
The measured pressure at the eight specific regions is presented in Table 5.3.
For this study, three trials were performed and an average of the pressure data is
selected and reported. The maximum pressure at all the three (half, full and walking)
conditions are shown in bold. From Table 5.3, it was observed that the strongest
impact of maximum pressure between stump-socket interfaces is on the patella
tendon bearing (PTB).
Anterior Medial Lateral Posterior
3
1 5
8
7
6 4 2
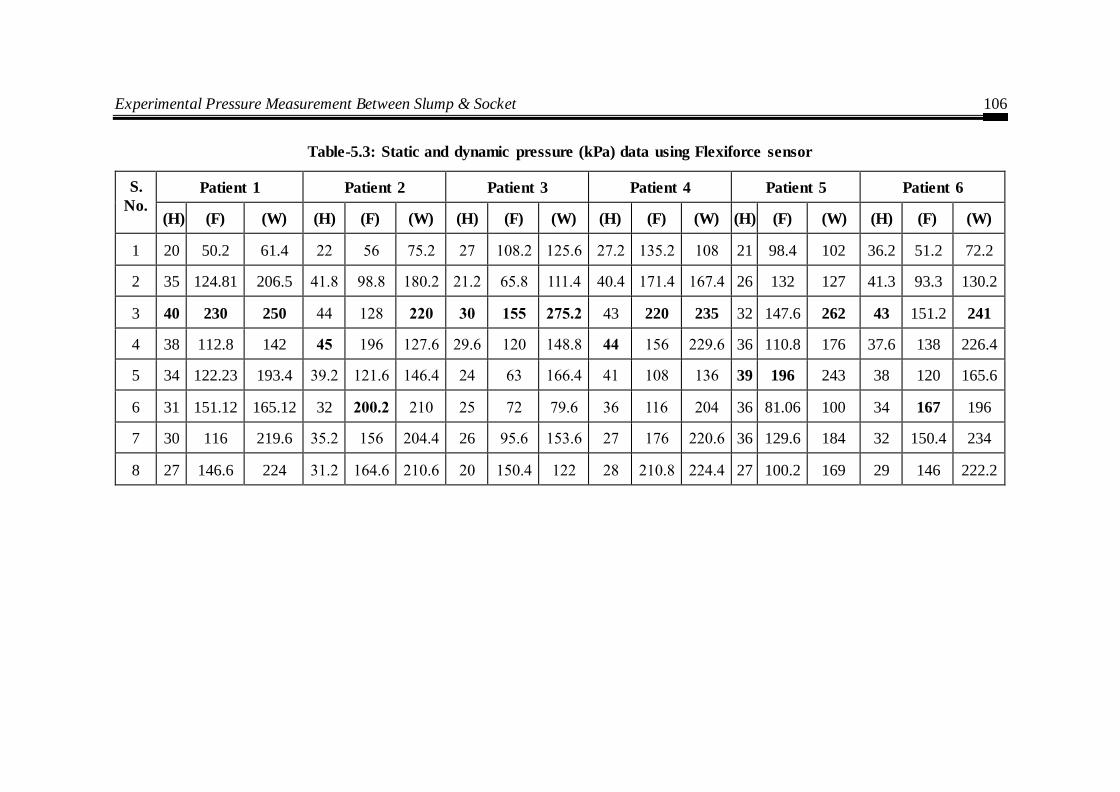
Experimental Pressure Measurement Between Slump & Socket 106
Table-5.3: Static and dynamic pressure (kPa) data using Flexiforce sensor
S.
No.
Patient 1 Patient 2 Patient 3 Patient 4 Patient 5 Patient 6
(H) (F) (W) (H) (F) (W) (H) (F) (W) (H) (F) (W) (H) (F) (W) (H) (F) (W)
1 20 50.2 61.4 22 56 75.2 27 108.2 125.6 27.2 135.2 108 21 98.4 102 36.2 51.2 72.2
2 35 124.81 206.5 41.8 98.8 180.2 21.2 65.8 111.4 40.4 171.4 167.4 26 132 127 41.3 93.3 130.2
3 40 230 250 44 128 220 30 155 275.2 43 220 235 32 147.6 262 43 151.2 241
4 38 112.8 142 45 196 127.6 29.6 120 148.8 44 156 229.6 36 110.8 176 37.6 138 226.4
5 34 122.23 193.4 39.2 121.6 146.4 24 63 166.4 41 108 136 39 196 243 38 120 165.6
6 31 151.12 165.12 32 200.2 210 25 72 79.6 36 116 204 36 81.06 100 34 167 196
7 30 116 219.6 35.2 156 204.4 26 95.6 153.6 27 176 220.6 36 129.6 184 32 150.4 234
8 27 146.6 224 31.2 164.6 210.6 20 150.4 122 28 210.8 224.4 27 100.2 169 29 146 222.2
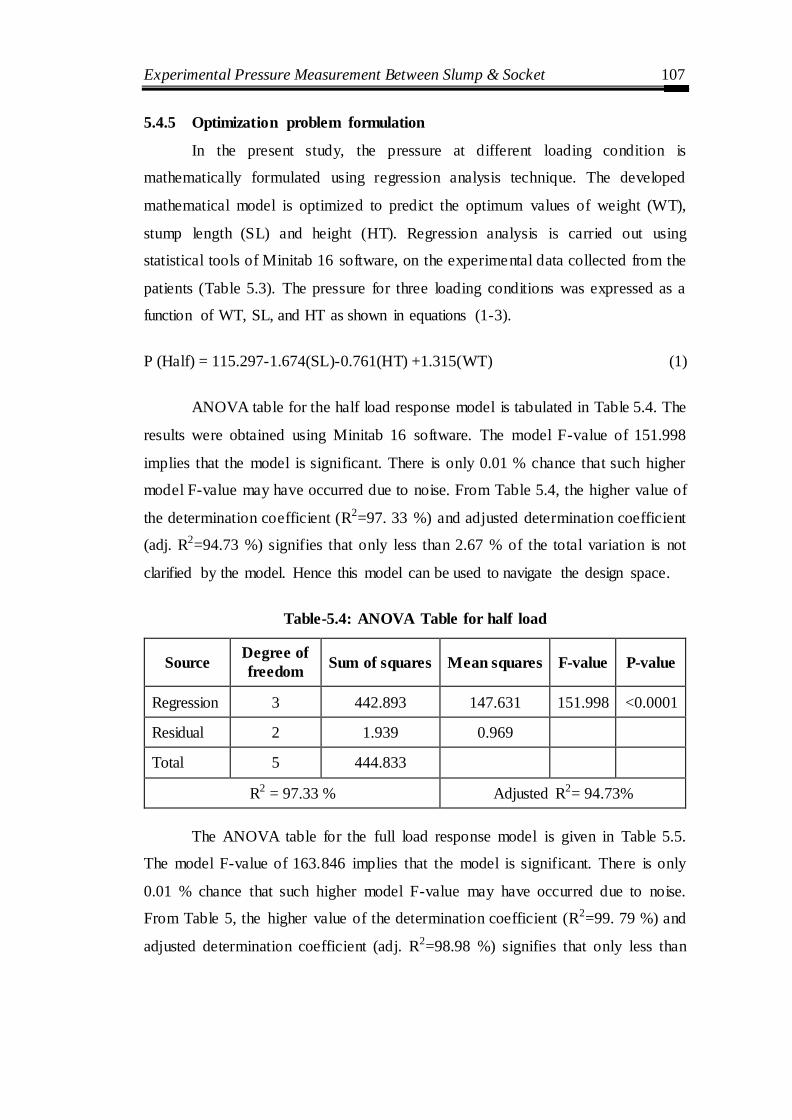
Experimental Pressure Measurement Between Slump & Socket 107
5.4.5 Optimization problem formulation
In the present study, the pressure at different loading condition is
mathematically formulated using regression analysis technique. The developed
mathematical model is optimized to predict the optimum values of weight (WT),
stump length (SL) and height (HT). Regression analysis is carried out using
statistical tools of Minitab 16 software, on the experimental data collected from the
patients (Table 5.3). The pressure for three loading conditions was expressed as a
function of WT, SL, and HT as shown in equations (1-3).
P (Half) = 115.297-1.674(SL)-0.761(HT) +1.315(WT) (1)
ANOVA table for the half load response model is tabulated in Table 5.4. The
results were obtained using Minitab 16 software. The model F-value of 151.998
implies that the model is significant. There is only 0.01 % chance that such higher
model F-value may have occurred due to noise. From Table 5.4, the higher value of
the determination coefficient (R2=97. 33 %) and adjusted determination coefficient
(adj. R2=94.73 %) signifies that only less than 2.67 % of the total variation is not
clarified by the model. Hence this model can be used to navigate the design space.
Table-5.4: ANOVA Table for half load
Source Degree of
freedom Sum of squares Mean squares F-value P-value
Regression 3 442.893 147.631 151.998 <0.0001
Residual 2 1.939 0.969
Total 5 444.833
R2 = 97.33 % Adjusted R2= 94.73%
The ANOVA table for the full load response model is given in Table 5.5.
The model F-value of 163.846 implies that the model is significant. There is only
0.01 % chance that such higher model F-value may have occurred due to noise.
From Table 5, the higher value of the determination coefficient (R2=99. 79 %) and
adjusted determination coefficient (adj. R2=98.98 %) signifies that only less than

Experimental Pressure Measurement Between Slump & Socket 108
0.21 % of the total variation is not clarified by the model. Hence this model can be
used to navigate the design space.
P (Full) = 471.323 -1.271(SL)+1. 0265(HT)-6.361(WT) (2)
Table-5.5: ANOVA table for full load
Source Degree of
freedom Sum of squares Mean squares F-value P-value
Regression 3 4244.231 1414.744 163.846 <0.0001
Residual 2 17.26919 8.634595
Total 5 4261.5
R2 = 99.79 Adjusted R2= 98.98
The ANOVA table for the walking load response model is given in Table
5.6. The model F-value of 361.573 suggests that the model is significant. There is
only 0.01 % chance that such higher model F-value may have happened due to
noise. From Table 6, the higher value of the determination coefficient (R2=99. 90 %)
and adjusted determination coefficient (adj. R2=98.53 %) signifies that only less
than 0.1 % of the total variation is not clarified by the model. Hence this model can
be used to navigate the design space.
P(Walking) = 162.266 +5.933(SL)+1.543(HT)- 4.462(WT) (3)
Table-5.6: ANOVA table for walking load
Source Degree of
freedom Sum of squares Mean squares F-value P-value
Regression 3 1934.433 644.8111 361.573 <0.0001
Residual 2 3.566694 1.783347
Total 5 1938
R2 = 99.90 Adjusted R2= 98.53
All the patients were satisfied; there were no reports on the subject, sensing
abnormal pressure or any discomfort to their residual while using a prosthesis. The

Experimental Pressure Measurement Between Slump & Socket 109
stroke of the subject, measured from the data acquired while walking on the flat
floor and average speed is 6.23 Sec/gait cycle.
The current study employed MATLAB R2014a optimal tool box to obtain
GA result. The GA program was run using a different setting of genetic parameters
to predict the value of height, stump length and weight for minimized value of the
maximum and minimum pressure at eight specific regions. The parameters of GA
algorithm are a number of iteration 100 population size 20. A uniform crossover
scheme is used with mutation having adaptive feasibility.
(a) (b)
(c) (d)
Figure 5.8: Half load condition (a) convergence plot for minimum pressure (b) best
individual parameters for minimum pressure (c) Convergence plot for maximum pressure (d) best individual parameters for maximum pressure
0 20 40 60 80 10010
15
20
25
30
35
40
45
Generation
Fitness v
alu
e
Best: 13.389 Mean: 13.3891
Best f itness
Mean fitness
1 2 30
50
100
150
200
Number of variables (3)
Curr
ent
best
indiv
idual
Current Best Individual
0 20 40 60 80 100-65
-60
-55
-50
-45
-40
Generation
Fitness v
alu
e
Best: -62.3456 Mean: -62.3378
Best f itness
Mean fitness
1 2 30
50
100
150
200
Number of variables (3)
Curr
ent
best
indiv
idual
Current Best Individual
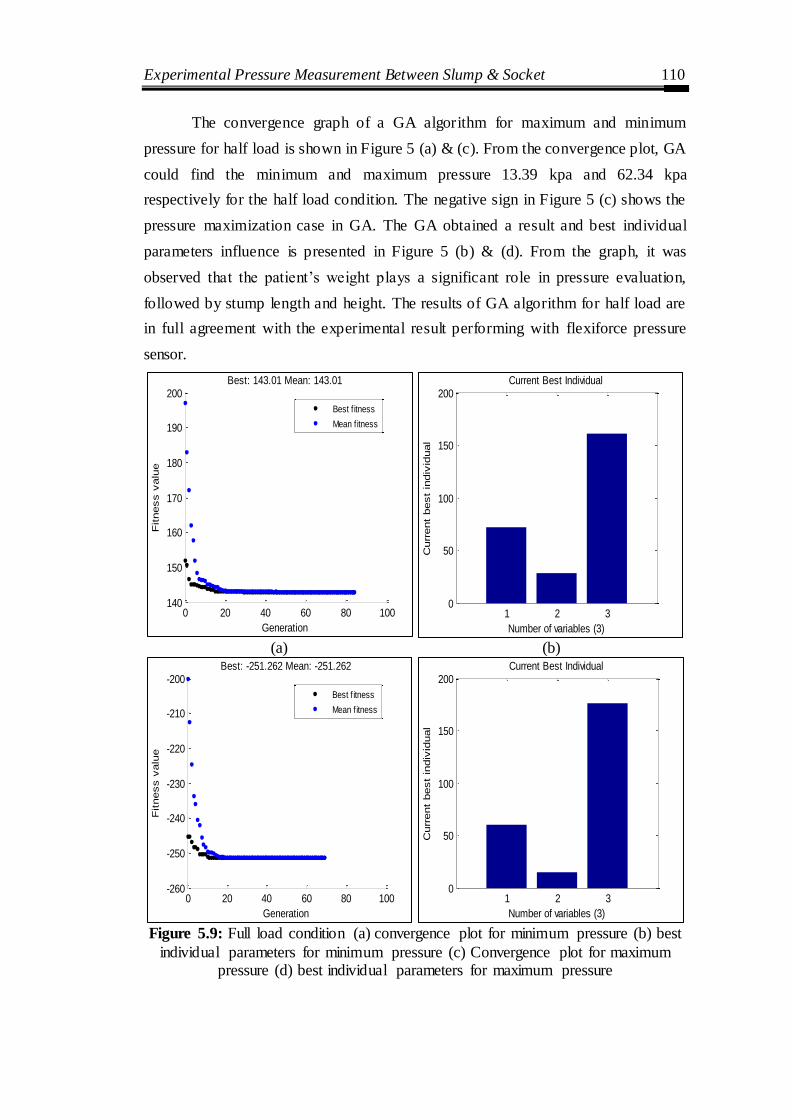
Experimental Pressure Measurement Between Slump & Socket 110
The convergence graph of a GA algorithm for maximum and minimum
pressure for half load is shown in Figure 5 (a) & (c). From the convergence plot, GA
could find the minimum and maximum pressure 13.39 kpa and 62.34 kpa
respectively for the half load condition. The negative sign in Figure 5 (c) shows the
pressure maximization case in GA. The GA obtained a result and best individual
parameters influence is presented in Figure 5 (b) & (d). From the graph, it was
observed that the patient‘s weight plays a significant role in pressure evaluation,
followed by stump length and height. The results of GA algorithm for half load are
in full agreement with the experimental result performing with flexiforce pressure
sensor.
(a) (b)
Figure 5.9: Full load condition (a) convergence plot for minimum pressure (b) best
individual parameters for minimum pressure (c) Convergence plot for maximum pressure (d) best individual parameters for maximum pressure
0 20 40 60 80 100140
150
160
170
180
190
200
Generation
Fitness v
alu
e
Best: 143.01 Mean: 143.01
Best f itness
Mean fitness
1 2 30
50
100
150
200
Number of variables (3)
Curr
ent
best
indiv
idual
Current Best Individual
0 20 40 60 80 100-260
-250
-240
-230
-220
-210
-200
Generation
Fitness v
alu
e
Best: -251.262 Mean: -251.262
Best f itness
Mean fitness
1 2 30
50
100
150
200
Number of variables (3)
Curr
ent
best
indiv
idual
Current Best Individual
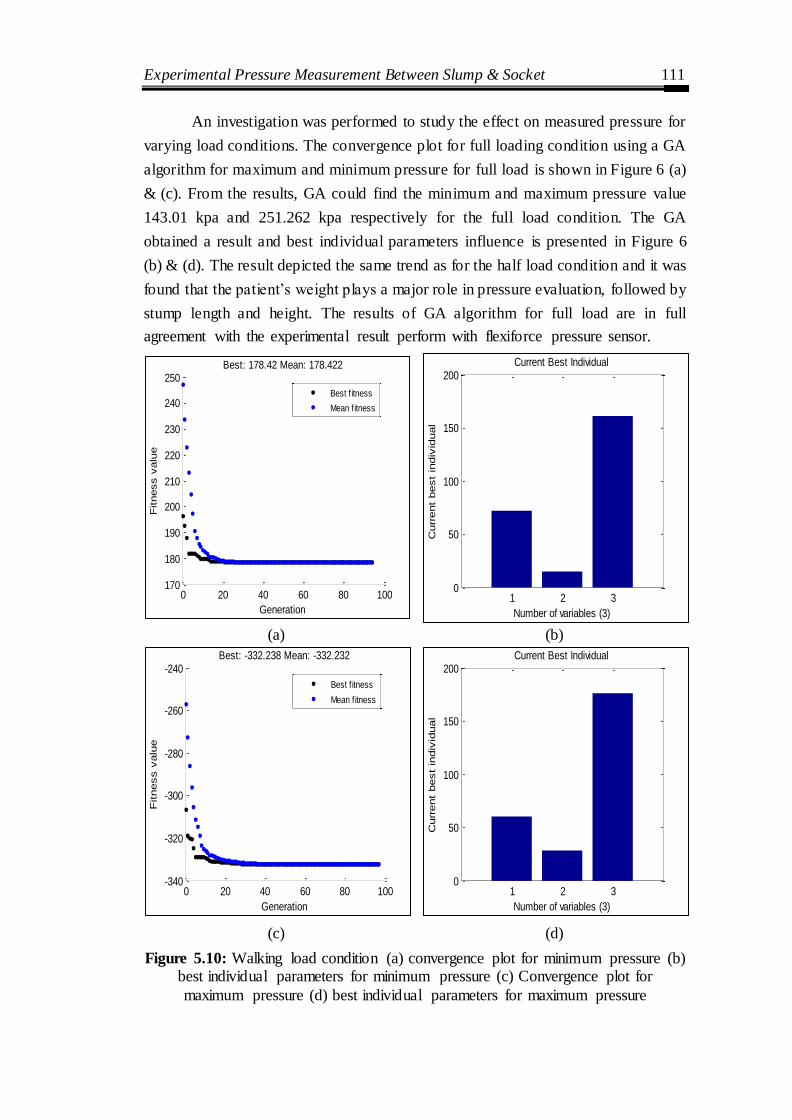
Experimental Pressure Measurement Between Slump & Socket 111
An investigation was performed to study the effect on measured pressure for
varying load conditions. The convergence plot for full loading condition using a GA
algorithm for maximum and minimum pressure for full load is shown in Figure 6 (a)
& (c). From the results, GA could find the minimum and maximum pressure value
143.01 kpa and 251.262 kpa respectively for the full load condition. The GA
obtained a result and best individual parameters influence is presented in Figure 6
(b) & (d). The result depicted the same trend as for the half load condition and it was
found that the patient‘s weight plays a major role in pressure evaluation, followed by
stump length and height. The results of GA algorithm for full load are in full
agreement with the experimental result perform with flexiforce pressure sensor.
(a) (b)
(c) (d)
Figure 5.10: Walking load condition (a) convergence plot for minimum pressure (b) best individual parameters for minimum pressure (c) Convergence plot for
maximum pressure (d) best individual parameters for maximum pressure
0 20 40 60 80 100170
180
190
200
210
220
230
240
250
Generation
Fitness v
alu
e
Best: 178.42 Mean: 178.422
Best f itness
Mean fitness
1 2 30
50
100
150
200
Number of variables (3)
Curr
ent
best
indiv
idual
Current Best Individual
0 20 40 60 80 100-340
-320
-300
-280
-260
-240
Generation
Fitness v
alu
e
Best: -332.238 Mean: -332.232
Best f itness
Mean fitness
1 2 30
50
100
150
200
Number of variables (3)
Curr
ent
best
indiv
idual
Current Best Individual

Experimental Pressure Measurement Between Slump & Socket 112
The last investigation was performed for the walking condition to study the
effect on measured pressure. The convergence plot for walking condition using GA
algorithm for maximum and minimum pressure for walking is shown in Figure 7 (a)
& (c). From the graph, GA could find the minimum and maximum pressure 173.422
kpa and 332.232 kpa respectively for the full load condition. The GA obtained a
result and best individual parameters influence is presented in Figure 7 (b) & (d).
The result depicted same trend as for the half load condition and it was found that
the patient‘s weight plays a major role in pressure evaluation, followed by stump
length and height. The results of GA algorithm for walking load are in full
agreement with the experimental result performing with flexiforce pressure sensor.
Chapter summary
Fuji film was determined to be an exact and reliable method for determining
contact areas and stresses within stump socket can also be applied in the testing and
modification of the lower limb prosthesis socket.
A new methodology was developed using the low-cost piezo-resistive
flexiforce sensor for quantitatively analyzing the pressure distribution at eight
specific regions. Six clinically significant cases were considered for pressure
prediction under different loading conditions. It was found that a patient‘s weight
plays a major role in pressure evaluation followed by stump length. The present
approach significantly evaluates the pressure variation for different loading
condition. The adopted methodology helps in providing pressure monitoring system
for socket fitting which will help in better-designed prosthetic sockets that ensure
enhanced patient satisfaction.

Investigations into effect of physiological parameters on socket design ………. 113
CHAPTER 6
INVESTIGATIONS INTO EFFECT OF PHYSIOLOGICAL
PARAMETERS ON SOCKET DESIGN USING ARTIFICIAL
NEURAL NETWORK ANALYSIS
Introduction
This chapter discusses a ANN based methodology to forecast the interface
pressure between limb and socket under different critical region of the socket. The
purpose of this chapter is to evaluate the effects of Patient-specific physiological
parameters viz. height, weight, and stump length on pressure development at the
transtibial prosthetic limb/socket interface. In addition, the Taguchi approach for
evaluating the statistical significance of amputee‘s physiological parameters on the
maximum pressure developed at limb/socket. The pressure data were collected by
measuring the micro-strains developed at limb/socket interface for nine Patients
during stance and ambulation conditions using strain gauges placed in different
regions of the socket. Then, the ANN model was used to predict the maximum
pressure values for Taguchi based parametric design of physio logical parameters.
6.1 Evaluation Methodology
Amali et al. (2006) developed an ANN model to evaluate the pressure
distribution between the residual limb/socket for below-knee amputees. Also, for
understanding the complex relation between the surface strain measured at
limb/socket interface and the internal pressure exerted owing to the Patient‘s
physiologic properties. Sewell et al. (2012) had developed an inverse problem
approach for static and dynamic pressure predictions for prosthetic socket fitting
assessment. They designed backpropagation ANN, which forecasts the pressure at
the residual limb/socket interface utilizing the strain measurements from the socket
surface.
These studies described the pressure measurement at limb/socket interfaces,
which will be help in the realization of the intricate problems confronted during a
socket fitting or a new socket design. However, these studies, could not deliver

Investigations into effect of physiological parameters on socket design ………. 114
convenient clinical tools which could aid the assessment of the prosthetic socket. In
addition, no prior studies available reported the relation between Patient‘s
physiological parameters and the pressure measured at the limb/socket interface.
Psychological factors are among an essential aspect, which should be taken into
account while investigating lower limb prosthesis (Horgan et al. 2004). The pressure
developed on the limb/socket interface during ambulation condition may be either
constructive or destructive to the amputee (Neumann et al. 2004). The excess
pressure at limb/socket interface can lead to soft tissue damage, skin breakdown
leading to painful sores. Therefore, it is vital to understand the relation between
Patient‘s physiological parameters and the maximum value of the pressure measured
at the limb/socket interface.
Numerous studies have been reported to evaluate the pressure distribution
aiming for best quality of the socket fit. The acquisition of accurate data from the
pressure measurements at limb/sockets interface requires a precise measuring
technology, including a suitable sensor, the positioning of sensor and data collection.
To collect strain data in different condition such as ―half load, full load and walking
condition‖, nine volunteer trans-tibial amputees were investigated. The Patients (P)
are selected using following clinically significant criteria: amputation due to
vascular disease, trauma (P2), diabetes (P7), infection (P4), short stump (P2) and
long stump (P3), conjugation (P6) and accidental causes (P1, P5, and P8). All
Patients were unilateral, below-knee amputees aged between 26 to 70. They often
used patellar tendon bearing (PTB) sockets with a uniform thickness of 5 mm with
cotton liner. The youngest Patient (P8) was 26 years old and has been using a
prosthesis 12 years, therefore walked a little quicker than others. It represents the
replacement of the lost function of the ankle joint and the foot, which is essential for
smooth and natural walking. Table 6.1 describes the general physiological
information about the Patients.
Strain Gauges have a small patch of silicone, a metal that shows a change in
their electrical resistance in response to any applied mechanical load (See Figure
6.1) (Tiwana et al. 2012 and Poeggel et al. 2015). Strain gauges are very sensitive
and susceptible to moisture and variations of heat; consequently, they are over and

Investigations into effect of physiological parameters on socket design ………. 115
over again used in Wheatstone bridge configurations to overcome these issues
(Stefanescu at al. 2011).
Figure-6.1: Strain gauge
Table-6.1: Physiolgical characteristics of nine male test Patients
Patient Age
(years) Height (cm)
Weight (kg)
Time using
prosthesis (years)
Type of amputee
Reason for amputation
Amputated side
Stump length (cm)
P1 30 172 66 4 Unilateral Accident Right 18.1
(±2. 0)
P2 42 173 70 3 Unilateral
Trauma vascular disease (Short)
Left
15 (±2. 0)
P3 36 174 72 3 Unilateral Accident (Long)
Left 28
(±2. 0)
P4 56 171 68 10 Unilateral Infection Left 16
(±2. 0)
P5 70 168 63 9 Unilateral Accident Right 23
(±2. 0)
P6 40 166 70 21 Unilateral Conjugation Right 22.8
(±2. 0)
P7 46 162 63 8 Unilateral Diabetic Right 20.3
(±2. 0)
P8 26 168 52 12 Unilateral Accident Left 25
(±2. 0)
P9 50 167 64 15 Unilateral Accident Left 19.1
(±2. 0)
One of the major aspects in socket design is to identify the crucial locations
for strain measurement. Moreover, the anatomical physiognomies of the limb play a
major role in deciding the proper pressure at specific zones to cause the accurate fit

Investigations into effect of physiological parameters on socket design ………. 116
and avoid pain. In this study, eight regions that produce minimal surface distortion
were considered as shown in Figure 6.2.
Figure-6.2: Anatomical physiognomies of the limb
To measure surface strains, a transducer is used. The transducer can measure
the strain response due to internal pressure exerted owing to the Patient‘s
physiological properties at different conditions. The accuracy and repeatability of
the transducer are vital to collect reliable data. The strain measurement through the
strain gauges is frequently used to monitor structures to get accurate and repeatable
responses due to the loading of the component. The strain gauges offer various
benefits such as generous response for a small load and do not slip when these are
bonded. The output of the gauges can be caught quickly in electronic format.
Therefore, the strain gauges are more suitable for this application. The specifications
of the strain gauges used in this work are given in Table 6.2.
Table-6.2: Strain gauge specifications
Type Metallic foil type strain gauge
Resistance 120 Ω
Gauge factor ranges ± 2.13
Gauge length 7 mm
Gauge width 3 mm
Reading Displays strain as microstrain

Investigations into effect of physiological parameters on socket design ………. 117
The strain gauges are placed at eight locations which are bounded outside the
socket using a glue gun. The actual instrumented photograph of the socket along
with glued strain gauge in different views viz. anterior, lateral, medial, and posterior
are shown in Figure 6.3. The strain gauges are then attached to the data logger to
measure microstrain during stance and ambulation conditions.
(a) Anterior (b) Lateral
(c) Medial (d) Posterior
Figure-6.3: Different views of prosthesis mounted with strain gauges
6.2 Experimental Details
An eight channel strain gauge data logger is utilized to collect microstrain
values at the stump/socket interface. To gather strain data at different condition, the
load on the socket was varied by changing the body weight of the Patient under

Investigations into effect of physiological parameters on socket design ………. 118
different load conditions to the walking condition as shown in Figure 6.4. Figure 6.5
represents the patient with a prosthesis, instrumented strain gauges, data logger and
software process readings.
50% 100% Load Walking
Figure-6.4: Loads to the prosthesis
Figure-6.5: Photograph of instrumentation with patient

Artificial Neural Network Analysis for Prosthetic Socket Design 119
Table-6.3: Pressure at different condition at different regions
S. No.
Patient 1 Patient 2 Patient 3
50% (Half) 100% (Full) Walking Average 50% (Half) 100% (Full) Walking Average 50% (Half) 100% (Full) Walking Average
1 24.8 58.26 73.04 52.033 52.6 110.4 92 85 43.2 47.2 43.2 44.533
2 64.8 303.08 247.1 204.993 79.2 128 135 114.067 77.6 117.6 159.2 118.133
3 205.44 324.91 346.5 292.283 142.4 197.6 220 186.667 372.8 571.2 763.2 569.067
4 177 112.8 132 140.6 126.4 160.8 176 154.4 237.6 338 526.4 367.33
5 102.5 122.23 193.4 139.4 68.8 97.6 103 21.133 48 120 145.6 104.53
6 87.34 161.15 155.72 134.737 65.6 81.04 90 78.88 116.8 233.6 296 215.467
7 118.6 216 229.8 188.13 116.8 169.6 184 156.8 124.8 210.4 264 199.73
8 55.25 186.89 233.59 158.577 47.2 68 89 68.0667 72 156 262.4 163.467
Patient 4 Patient5 Patient 6
1 20 68 85.6 57.867 78 128.8 37.6 81.47 35.2 147.2 108 96.8
2 48.8 104.8 199.2 117.6 27.2 56.8 102.4 62.133 106.4 198.4 198.4 167.733
3 134.4 228 223.2 195.2 178.4 195.2 375.2 249.6 216 456 529.6 400.533
4 193.6 296 157.6 86.667 69.6 120 128.8 106.1 166.4 340 259.2 255.2
5 159.2 121.6 126.4 51.467 44 63 66.4 57.8 51.2 108 136 98.4
6 120 210.4 220 183.467 32 72 73.6 59.2 101.6 216 304 207.2
7 95.2 176 234.4 168.53 42.4 85.6 93.6 73.87 77.6 176 220.8 10.933
8 87.2 169.6 221.6 159.467 103.2 150.4 112 121.87 108.8 260.8 294.4 221.333
Patient 7 Patient 8 Patient 9
1 31.2 58.4 25.6 38.4 25.6 32 32 29.867 35.3 50.6 98.1 61.33
2 68 110.4 44.8 74.4 84 98.4 67.2 83.2 65 116 146 109
3 144 197.6 160.8 167.467 111.2 167.2 112.8 130.4 143 196.2 265.1 201.45
4 153 184.8 57.6 131.8 90.4 121.6 60 90.667 120 163 240.1 174.33
5 43.2 72.8 40.8 52.267 41.6 35.2 38.4 38.4 77.5 159.6 199 145.33
6 47.2 77.6 111.2 78.6667 84 68.8 56 69.6 68 131 182 127
7 55.2 100 42.4 65.867 58.4 61.6 41.68 26.107 79 137 197 137.67
8 134.4 161.6 106.4 134.133 95.2 109.6 77.72 94.1733 61 114 173 116
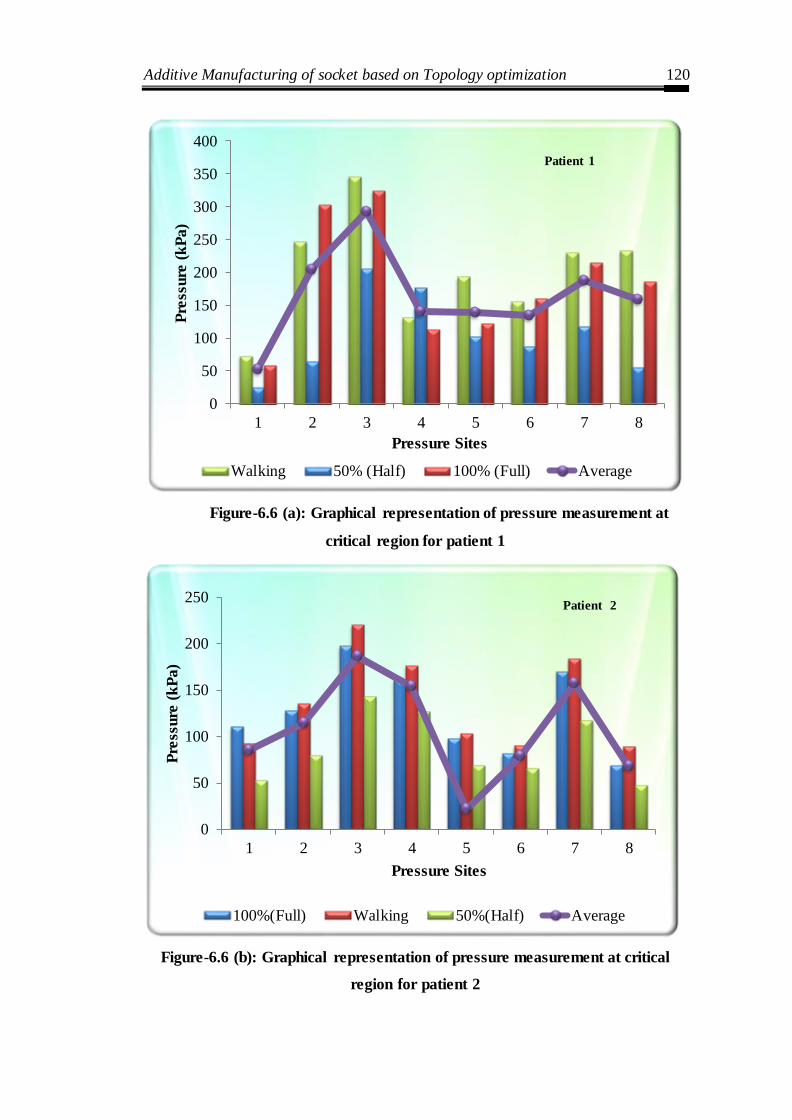
Additive Manufacturing of socket based on Topology optimization 120
Figure-6.6 (a): Graphical representation of pressure measurement at
critical region for patient 1
Figure-6.6 (b): Graphical representation of pressure measurement at critical
region for patient 2
0
50
100
150
200
250
300
350
400
1 2 3 4 5 6 7 8
Pre
ssure
(k
Pa)
Pressure Sites
Walking 50% (Half) 100% (Full) Average
Patient 1
0
50
100
150
200
250
1 2 3 4 5 6 7 8
Pre
ssure
(k
Pa)
Pressure Sites
100%(Full) Walking 50%(Half) Average
Patient 2

Additive Manufacturing of socket based on Topology optimization 121
Figure-6.6 (c): Graphical representation of pressure measurement at critical
region for patient 3
Figure-6.6 (d): Graphical representation of pressure measurement at critical
region for patient 4
0
100
200
300
400
500
600
700
800
900
1 2 3 4 5 6 7 8
Pre
ssu
re (
kP
a)
Pressure Sites
100%(Full) Walking 50%(Half) Average
Patient 3
0
50
100
150
200
250
300
350
1 2 3 4 5 6 7 8
Pre
ssure
(k
Pa)
Pressure Sites
50%(Half) 100%(Full) Walking Average
Patient 4

Additive Manufacturing of socket based on Topology optimization 122
Figure-6.6 (e): Graphical representation of pressure measurement at critical
region for patient 5
Figure-6.6 (f): Graphical representation of pressure measurement at critical
region for patient 6
0
50
100
150
200
250
300
350
400
1 2 3 4 5 6 7 8
Pre
ssure
(k
Pa)
Pressure Sites
100%(Full) Walking 50%(Half) Average
Patient 5
0
100
200
300
400
500
600
1 2 3 4 5 6 7 8
Pre
ssure
(k
Pa)
Pressure Sites
100%(Full) Walking 50%(Half) Average
Patient 6

Additive Manufacturing of socket based on Topology optimization 123
Figure-6.6 (g): Graphical representation of pressure measurement at critical
region for patient 7
Figure-6.6 (h): Graphical representation of pressure measurement at critical
region for patient 8
0
50
100
150
200
250
1 2 3 4 5 6 7 8
Pre
ssure
(k
Pa)
Pressure Sites
50 (Half) 100 (Full) Walking Average
Patient 7
0
20
40
60
80
100
120
140
160
180
1 2 3 4 5 6 7 8
Pre
ssure
(k
Pa)
Pressure Sites
100 (Full) Walking 50 (Half) Average
Patient 8

Additive Manufacturing of socket based on Topology optimization 124
Figure-6.6 (i): Graphical representation of pressure measurement at critical
region for patient 9
The zero load condition is defined at which Patient lifts his prosthesis above
the ground. Then, the Patient was requested to introduce different load conditions of
prosthesis viz. 50% load, full load and walking load as shown in Table 6.3 with
pictorial representation in Figure 6.6 (a-i). The strain was measured at different
conditions and stated above and subsequently processed to calculate the pressure
values using the following formula.
Where,
E= Young modulus of material (Silicon rubber)
= stress
=Strain
The pressure values at 50%, 100%, walking load conditions were calculated
using equation (1) and the average value of pressure is listed in Table 6.4. It has
been noted that the zone three i.e. patellar tendon had maximum pressure developed
0
50
100
150
200
250
300
1 2 3 4 5 6 7 8
Pre
ssure
(k
Pa)
Pressure Sites
100 (Full) Walking 50 (Half) Average
Patient 9
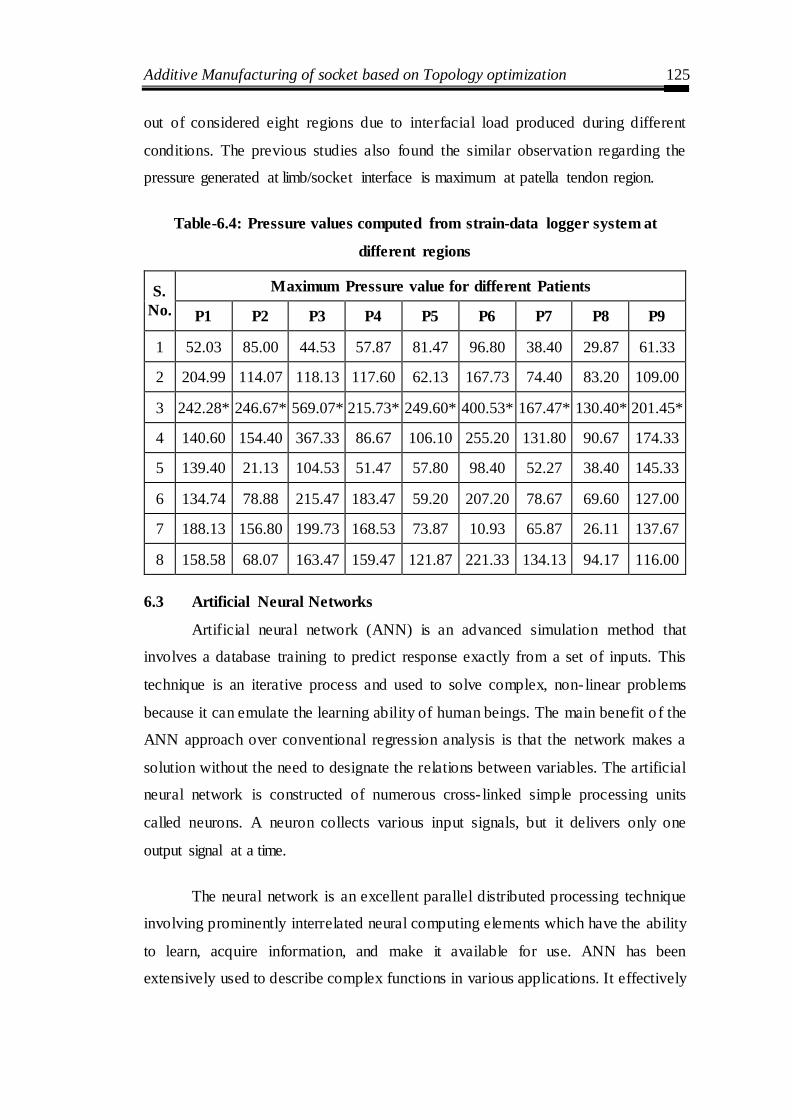
Additive Manufacturing of socket based on Topology optimization 125
out of considered eight regions due to interfacial load produced during different
conditions. The previous studies also found the similar observation regarding the
pressure generated at limb/socket interface is maximum at patella tendon region.
Table-6.4: Pressure values computed from strain-data logger system at
different regions
S.
No.
Maximum Pressure value for different Patients
P1 P2 P3 P4 P5 P6 P7 P8 P9
1 52.03 85.00 44.53 57.87 81.47 96.80 38.40 29.87 61.33
2 204.99 114.07 118.13 117.60 62.13 167.73 74.40 83.20 109.00
3 242.28* 246.67* 569.07* 215.73* 249.60* 400.53* 167.47* 130.40* 201.45*
4 140.60 154.40 367.33 86.67 106.10 255.20 131.80 90.67 174.33
5 139.40 21.13 104.53 51.47 57.80 98.40 52.27 38.40 145.33
6 134.74 78.88 215.47 183.47 59.20 207.20 78.67 69.60 127.00
7 188.13 156.80 199.73 168.53 73.87 10.93 65.87 26.11 137.67
8 158.58 68.07 163.47 159.47 121.87 221.33 134.13 94.17 116.00
6.3 Artificial Neural Networks
Artificial neural network (ANN) is an advanced simulation method that
involves a database training to predict response exactly from a set of inputs. This
technique is an iterative process and used to solve complex, non- linear problems
because it can emulate the learning ability of human beings. The main benefit o f the
ANN approach over conventional regression analysis is that the network makes a
solution without the need to designate the relations between variables. The artificial
neural network is constructed of numerous cross- linked simple processing units
called neurons. A neuron collects various input signals, but it delivers only one
output signal at a time.
The neural network is an excellent parallel distributed processing technique
involving prominently interrelated neural computing elements which have the ability
to learn, acquire information, and make it available for use. ANN has been
extensively used to describe complex functions in various applications. It effectively

Additive Manufacturing of socket based on Topology optimization 126
implemented in biomedical engineering and applications, explaining numerous
problems in areas of lower limb prosthetic, clinical outcomes, signal processing,
medical diagnosis and health care. ANN has been a widely used modeling tool for
unknown or semi-unknown processes.
In the present analysis, height, weight, and stump length are taken as the
three input parameters. Each of these parameters is categorized by one neuron and
therefore the input layer in the ANN structure has three neurons. The database is
constructed considering experiments at the limit ranges of each parameter.
Experimental result sets are used to train the ANN to understand the input-output
correlations. The database is then divided into three types, namely: (i) a training
category, which is exclusively used to adjust the network weights and (ii) a test
category, which corresponds to the set that validates the results of the training
protocol. Generally, seventy-five percent data (patterns) is used for training and
twenty-five percent for testing
Table-6.5: Data for ANN training
Patient Height (cm) Weight (Kg) Stump
Length (cm)
Max.
Pressure
(unit)
P1 172 66 18.1 242.28
P2 173 70 15 246.67
P3 174 72 28 569.07
P4 171 68 16 215.73
P5 168 63 23 249.60
P6 166 70 22.8 400.53
P7 162 63 20.3 167.47
P8 168 52 25 130.40
P9 167 64 19 201.45
The actual measured pressure data on transtibial prosthetic sockets was used
to develop the ANN model. ANN model is established, which is used for
interpolation of the incomplete pressure data set that was available for the analysis.

Additive Manufacturing of socket based on Topology optimization 127
The experimentally measured maximum pressure values on transtibial prosthetic
sockets for different Patients based on their physiological parameters (Table 6.5)
were used in ANN modeling. The developed ANN model can be used to predict the
maximum pressure in relevance to Patient‘s physiological parameters useful for the
statistical analysis.
The data shown in Table 6.5 was used to train the back propagation feed
forward ANN model. The feed forward neural network is built on various
interconnected artificial neurons, classified into the input, hidden, and output layers.
The information is accessible by the interconnected weights that can be altered in
learning phase. The output of neuron at any layer is calculated by
∑
Where,
= final output from jth neuron
= tansig activation function
= number of neurons in the previous layer
= synaptic weight between ith and jth neuron
= output from ith neuron
= bias at jth neuron
In back-propagation technique, an input is generated by the neural networks
to compute the output of individual neurons. The output was calculated as an error
between the anticipated output, Tj, and the actual output, Yj. By the least squares
method, the quadratic error function (Ej) among the actual output and the network
output is computed by the following equation.
∑
The gradient search algorithm was used for minimizing the mean square
error of network output. The mean square is computed using the formula
∑∑ ( )
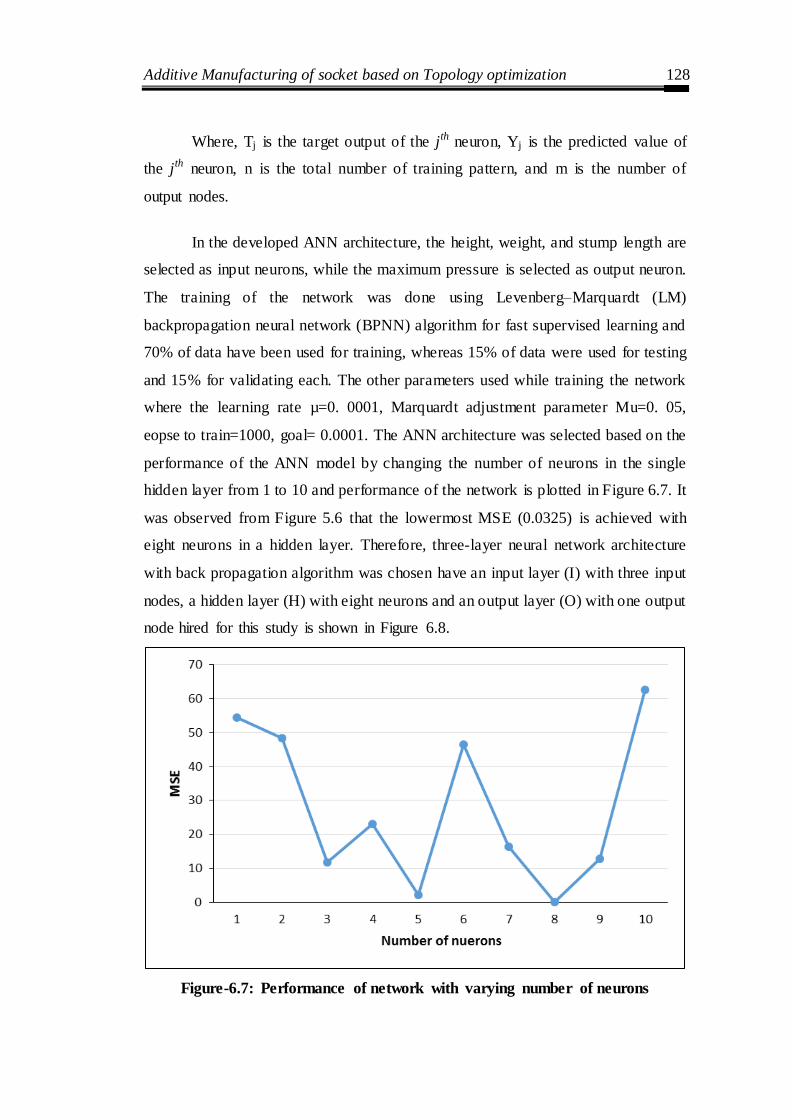
Additive Manufacturing of socket based on Topology optimization 128
Where, Tj is the target output of the jth neuron, Yj is the predicted value of
the jth neuron, n is the total number of training pattern, and m is the number of
output nodes.
In the developed ANN architecture, the height, weight, and stump length are
selected as input neurons, while the maximum pressure is selected as output neuron.
The training of the network was done using Levenberg–Marquardt (LM)
backpropagation neural network (BPNN) algorithm for fast supervised learning and
70% of data have been used for training, whereas 15% of data were used for testing
and 15% for validating each. The other parameters used while training the network
where the learning rate µ=0. 0001, Marquardt adjustment parameter Mu=0. 05,
eopse to train=1000, goal= 0.0001. The ANN architecture was selected based on the
performance of the ANN model by changing the number of neurons in the single
hidden layer from 1 to 10 and performance of the network is plotted in Figure 6.7. It
was observed from Figure 5.6 that the lowermost MSE (0.0325) is achieved with
eight neurons in a hidden layer. Therefore, three-layer neural network architecture
with back propagation algorithm was chosen have an input layer (I) with three input
nodes, a hidden layer (H) with eight neurons and an output layer (O) with one output
node hired for this study is shown in Figure 6.8.
Figure-6.7: Performance of network with varying number of neurons

Additive Manufacturing of socket based on Topology optimization 129
Figure-6.8: ANN 3-8-1 architecture
To check the prediction capability of the developed ANN model, the
maximum pressure data for three different Patients were collected and compared
with the ANN predicted pressure values. The comparison of ANN predicted and
actual measured values as shown in Table 6.6. It was perceived that the established
ANN model has a superb ability to forecast maximum pressure developed at a
limb/socket interface. The average absolute percentage error of 4.62% and
maximum absolute error 6.00% found in ANN prediction as compared to actual
measured values, both of which are well within the tolerable limits. Therefore, the
developed ANN model is reliable enough to use for the prediction of maximum
pressure values based on physiological parameters.
Table-6.6: Comparison of actual measured and ANN predicted values
Patient‘s Physiological parameters Maximum pressure at limb-socket interface
Sr. No
Patient No.
Height Weight Stump length
Actual measured
ANN predicted
Absolute % error
1 S10 163 65 19 186.65 175.44 6.00
2 S11 165 66 18.2 279.54 265.30 5.09
3 S12 170 69 23 351.69 361.51 2.79
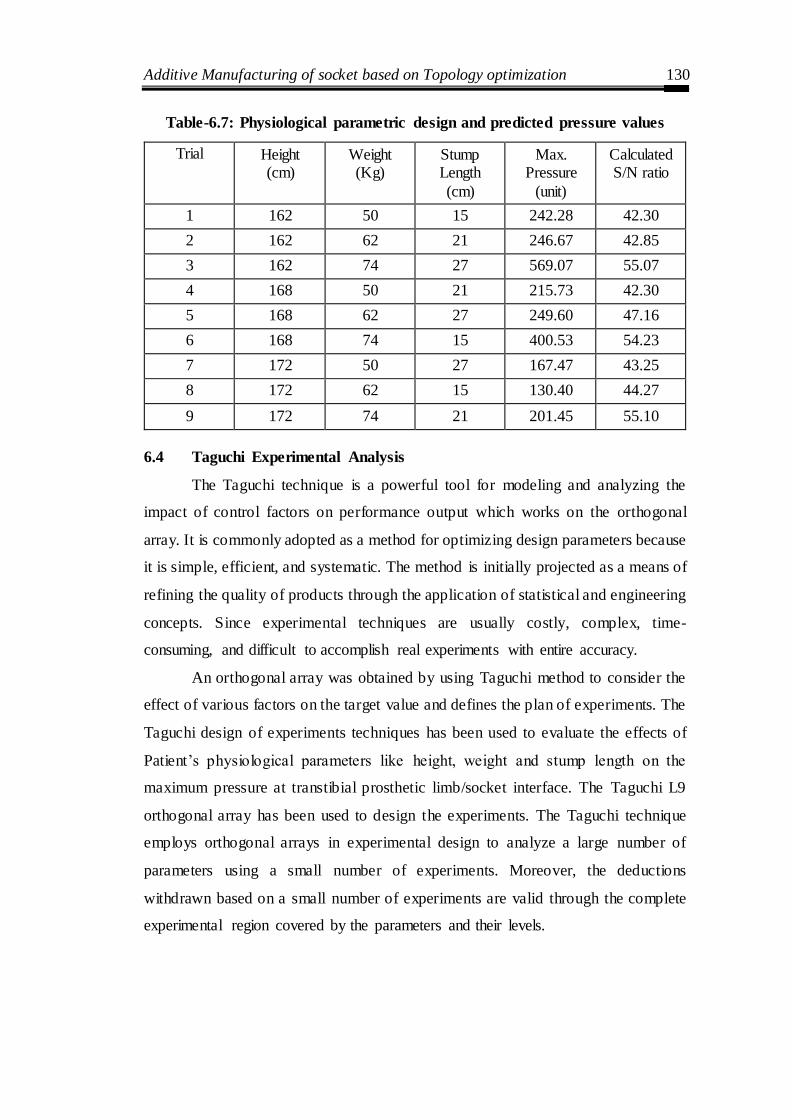
Additive Manufacturing of socket based on Topology optimization 130
Table-6.7: Physiological parametric design and predicted pressure values
Trial Height (cm)
Weight (Kg)
Stump Length
(cm)
Max. Pressure
(unit)
Calculated S/N ratio
1 162 50 15 242.28 42.30
2 162 62 21 246.67 42.85
3 162 74 27 569.07 55.07
4 168 50 21 215.73 42.30
5 168 62 27 249.60 47.16
6 168 74 15 400.53 54.23
7 172 50 27 167.47 43.25
8 172 62 15 130.40 44.27
9 172 74 21 201.45 55.10
6.4 Taguchi Experimental Analysis
The Taguchi technique is a powerful tool for modeling and analyzing the
impact of control factors on performance output which works on the orthogonal
array. It is commonly adopted as a method for optimizing design parameters because
it is simple, efficient, and systematic. The method is initially projected as a means of
refining the quality of products through the application of statistical and engineering
concepts. Since experimental techniques are usually costly, complex, time-
consuming, and difficult to accomplish real experiments with entire accuracy.
An orthogonal array was obtained by using Taguchi method to consider the
effect of various factors on the target value and defines the plan of experiments. The
Taguchi design of experiments techniques has been used to evaluate the effects of
Patient‘s physiological parameters like height, weight and stump length on the
maximum pressure at transtibial prosthetic limb/socket interface. The Taguchi L9
orthogonal array has been used to design the experiments. The Taguchi technique
employs orthogonal arrays in experimental design to analyze a large number of
parameters using a small number of experiments. Moreover, the deductions
withdrawn based on a small number of experiments are valid through the complete
experimental region covered by the parameters and their levels.
Additive Manufacturing of socket based on Topology optimization 131
Therefore, the Taguchi L9 orthogonal array was nominated to investigate the
effects of Patient‘s physiological parameters on the amount of pressure developed at
transtibial prosthetic limb/socket interface. The developed ANN model was used to
predict the maximum pressure values for different parametric settings based on
Taguchi L9 matrices. Table 6.7 shows the trials along with corresponding
parametric settings and ANN predicted maximum pressure values for the
corresponding trial. The S/N ratio considers both the mean and the variability into
account. It is the ratio of the mean (signal) to the standard deviation (noise). The
ratio depends on the quality characteristics of the product/process to be optimized.
The Taguchi method can be classified as three types of S/N ratios are used
for different characteristic: lower-the-better (LB), higher-the-better (HB) and
nominal-the-best (NB). The experimental observations are transformed into a signal-
to-noise (S/N) ratio. There are several S/N ratios available depending on the type of
characteristics. Since the lowest maximum pressure developed on the transtibial
prosthetic socket signifies the better conditions, the smaller, the better S/N ratio is
used and can be calculated as logarithmic transformation with the following
equation:
(∑
)
Where y is the value of the maximum pressure predicted by ANN, and n is
the number of the trials.
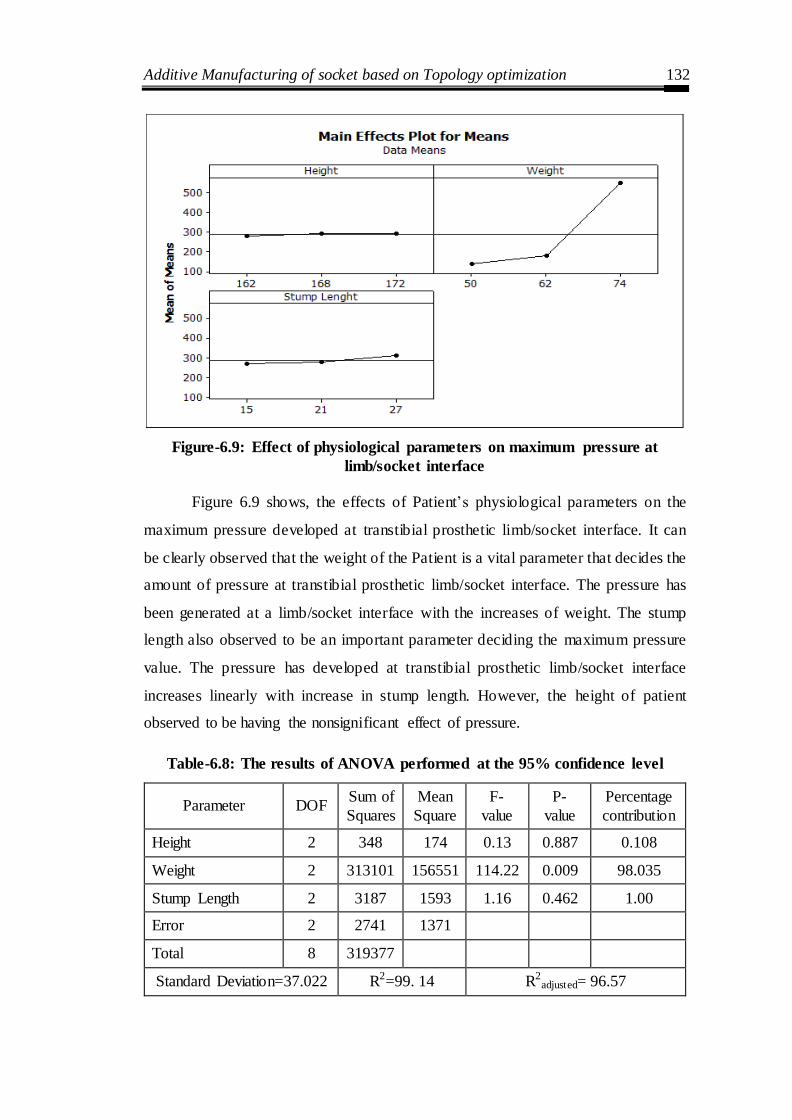
Additive Manufacturing of socket based on Topology optimization 132
Figure-6.9: Effect of physiological parameters on maximum pressure at
limb/socket interface
Figure 6.9 shows, the effects of Patient‘s physiological parameters on the
maximum pressure developed at transtibial prosthetic limb/socket interface. It can
be clearly observed that the weight of the Patient is a vital parameter that decides the
amount of pressure at transtibial prosthetic limb/socket interface. The pressure has
been generated at a limb/socket interface with the increases of weight. The stump
length also observed to be an important parameter deciding the maximum pressure
value. The pressure has developed at transtibial prosthetic limb/socket interface
increases linearly with increase in stump length. However, the height of patient
observed to be having the nonsignificant effect of pressure.
Table-6.8: The results of ANOVA performed at the 95% confidence level
Parameter DOF Sum of
Squares
Mean
Square
F-
value
P-
value
Percentage
contribution
Height 2 348 174 0.13 0.887 0.108
Weight 2 313101 156551 114.22 0.009 98.035
Stump Length 2 3187 1593 1.16 0.462 1.00
Error 2 2741 1371
Total 8 319377
Standard Deviation=37.022 R2=99. 14 R2adjusted= 96.57

Additive Manufacturing of socket based on Topology optimization 133
The relative significance of Patient‘s physiological parameters on the
maximum pressure at limb/socket interface was examined by ANOVA. The results
of ANOVA at 95% confidence level for Patient‘s physiological parameters are
presented in Table 6.8. The p-value less than 0.5 directs the parameters which have a
significant effect on response and therefore, the weight and stump length are found
to be significant parameters. From ANOVA, the Patient‘s weight was seen to be
most important parameters which play a vital role in deciding the amount of
pressure developed at transtibial prosthetic limb/socket interface. The weight
contributes 98.035% on pressure generated followed by stump length, which
contributes 1.00%. The stump height was observed to be a not significant parameter
for pressure distribution. The large value of the determination coefficient (R2=99.
14%) indicates that only less than 0.86 % of the total variations in pressure
experienced by the transtibial prosthetic socket are not clarified by model. The large
value of the adjusted determination coefficient (R2adjusted=96. 57%) promises
significance of the model.
6.6 Chapter summary
The following vital conclusions were drawn:
For all Patients, it was observed that the patellar tendon region experiences
maximum pressure.
The ANN model with 3-8-1 architecture was observed to be the best model
to predict the maximum pressure value with the mean square error 0.0325.
The ANN model was found to be reliable in predicting maximum pressure
values with an average absolute percentage error of 4.62% and maximum
absolute percentage error of 6.00%.
The Taguchi analysis indicates that the maximum pressure value increases
with an increase in the weight of the Patient significantly.
The results of ANOVA suggest that the weight, and stump length affects
significantly on deciding the maximum pressure values each contributing
98.035% and 1.0% significantly.

Additive Manufacturing of socket based on Topology optimization 134
CHAPTER 7
ADDITIVE MANUFACTURING OF SOCKET BASED ON
TOPOLOGY OPTIMIZATION
Introduction
This chapter presents the topology optimization based additive manufacturing of
prosthetic socket to minimize the structural weight to the compliance of the
prosthetic socket. In the first part CAD model of the socket obtained through reverse
engineering procedures explained in chapter 3 is used for generating the meshed
model of the socket. Further, based on the inputs from the ANN and optimization
model discussed in chapter 6, Topology optimization was performed on the meshed
model to generate the compliant socket. Finally, the resulting topology optimized
socket was fabricated using an FDM-based Additive Manufacturing machine. The
steps and procedure and discussed in this chapter.
7.1 Design optimization
For successful rehabilitation of lower limb amputees, a well-designed, flexible and
better fit prosthetic socket is mandatory. The socket is an important part of below
knee prosthesis which defines the comfort level in the patients. The socket provides
the interface between the prosthesis and residual limb, and its design influences the
prosthetic fit affecting cost, comfort, energy expenditure, and eventually helps
during patient ambulation period. Several studies have been reported which suggests
that the attainment of these goals presents a challenge to the prosthesis practitioners.
The primary concern for the patient discomfort and pain is the presence of high
contact pressure at different specific regions of the residual limb. The contact
pressure at these regions can be as high as 1000 KPa (Sewell et al., 2012), adversely
affecting patient recovery and poses serious health issues like cancer. Therefore, it
becomes primarily important to relieving such high pressure from sensitive regions,
providing patient satisfaction and comfort. One promising solution to this problem is
by reducing the stiffness of the socket and redistribution of pressure by making a
socket walls complaint at these high-pressure areas. Some of the previous

Additive Manufacturing of socket based on Topology optimization 135
approaches provided local compliance (concentric spiral slots) by realizing a socket
wall thickness reduction. However, it was found that the results are not good enough
for relieving high pressure from sensitive areas.
The present work deals with introducing the concept of topology
optimization (TO) in the field of the prosthetic socket for effective pressure
reduction, better socket fitting and patient comfort. TO method can produce an
optimum material distribution that optimizes some specific performance criteria
specified by the part designer, even when an initial design concept is lacking. TO
can be referred to as structural technique which combines with a numerical solution
method (i.e. the finite element method) for optimal mass distribution in a given
domain. It helps in describing the regions where the material is needed and where
voids are needed. This method has the capability to direct and elucidate in which
places skeletal materials are required to endure the expected loads (e.g., for
mastication) and also for soft tissue support structures. Due to this, TO allows for
greater design freedom than only shape and size optimization (see Figure 7.1).
Figure-7.1: Topology optimization of automobile upper control arm
Since its inception in the late 1980s, TO is widely used in designing
industrial components and has become an area of active research. The first solutions
to a topology optimization problem were provided by Michell. For cases of simple
loading and boundary conditions, he provided optimal topologies for truss- like
structures. Earlier, this concept was used only for mechanical structural problems,
but now it has gained wide acceptance among other disciplines as well. The
application areas in which TO have been used includes automobile, aircraft,

Additive Manufacturing of socket based on Topology optimization 136
implants, fluid flow and acoustics. Such development is due to the evolution of
some conventional topology optimization techniques and new advanced promising
methods.
There are different methods available for topology optimization: (1) density
based methods (2) Hard kill methods (3) Boundary-variation methods (4)
biologically inspired methods. However, the present work takes into account the
first method for topology optimization. As for continuum structures, density based
methods are most popular material parameterization techniques. The density
approach deals with associating only one design variable with each individual
element. Solid Isotropic Material with Penalization (SIMP) is one of the popular
density based methods. The density based methods work on a fixed area of finite
elements having the main aim of minimizing an objective function by categorizing
whether each component consists of solid material or void. In structural topology
optimization, compliance is often referred as the objective, and constraints are
placed on the volume of material and stiffness or deflection that may be utilized.
7.2 Transtibial socket model preparation
The original socket model of four different patients was taken for investigation. The
PoP socket is scanned using contactless laser scanning and surface model is
reconstructed. The four socket models are extracted from 3D scan using the software
COMET PLUS (Steinbichler, Germany) as shown in Figure 7.2. Using measurement
tools, the appropriate design domain is extracted and the dimensions details were
recorded and reported in Table 7.1.
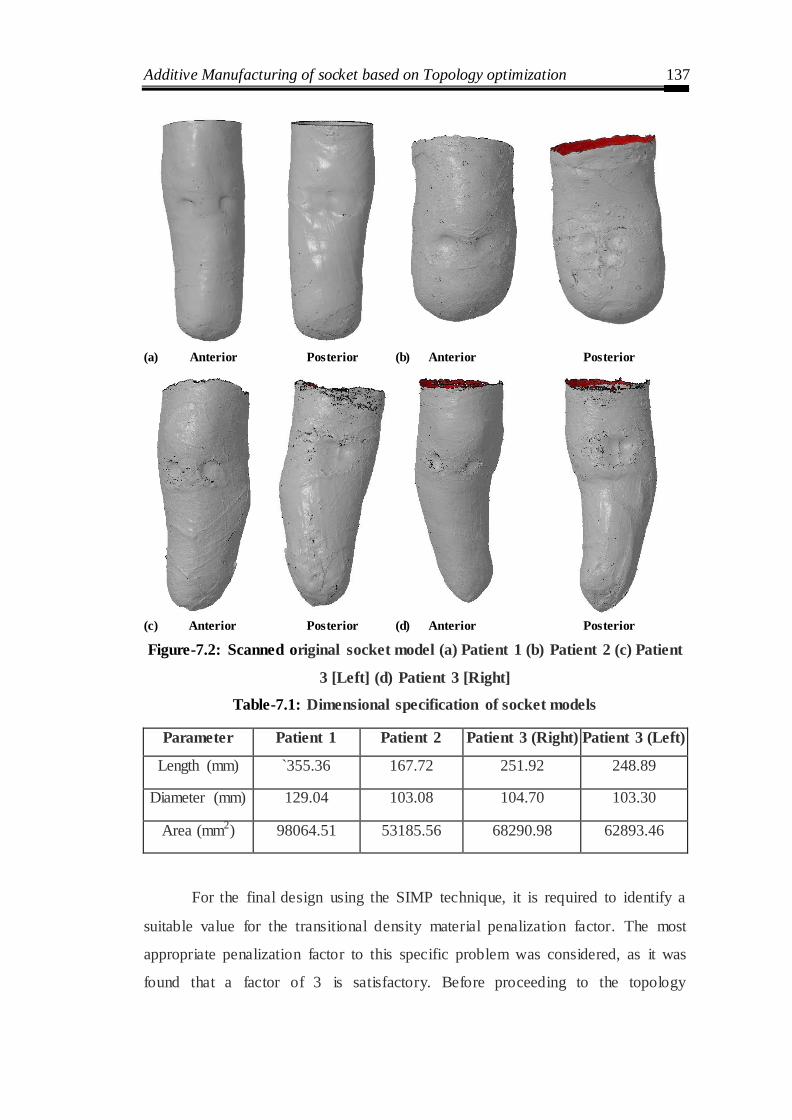
Additive Manufacturing of socket based on Topology optimization 137
(a) Anterior Posterior (b) Anterior Posterior
(c) Anterior Posterior (d) Anterior Posterior
Figure-7.2: Scanned original socket model (a) Patient 1 (b) Patient 2 (c) Patient
3 [Left] (d) Patient 3 [Right]
Table-7.1: Dimensional specification of socket models
Parameter Patient 1 Patient 2 Patient 3 (Right) Patient 3 (Left)
Length (mm) `355.36 167.72 251.92 248.89
Diameter (mm) 129.04 103.08 104.70 103.30
Area (mm2) 98064.51 53185.56 68290.98 62893.46
For the final design using the SIMP technique, it is required to identify a
suitable value for the transitional density material penalization factor. The most
appropriate penalization factor to this specific problem was considered, as it was
found that a factor of 3 is satisfactory. Before proceeding to the topology

Additive Manufacturing of socket based on Topology optimization 138
optimization analysis, certain assumptions are made i.e. the material of socket is
isotropic and homogeneous.
7.3 Topology Optimization of socket model
The topological optimization of socket is performed considering tetrahedral
elements for mesh generation. Tetrahedral elements are used where high accuracy is
desired in terms of geometry and stress solutions. The Altair's Opti Struct software
was used for performing topology optimization. To be able to set up the problem
and review the results, HyperMesh and HyperView are also used. HyperMesh is the
pre-processor which is used to discretize (mesh) a CAD model, set boundary
conditions, properties and options and to set up the problem to be solved
(optimization, static analysis, model analysis etc.). From HyperMesh, a model which
completely describes the problem is exported and then processed using Optistruct.
Further, the results from Optistruct are evaluated using the post-processor
HyperView. The socket needs to be flexible, but strong, to permit normal gait
movement, but not twist/bend under pressure to improve amputee rehabilitation,
care and reducing the weight with the cost of the prosthetic.

Additive Manufacturing of socket based on Topology optimization 139
Figure 7.3: Flowchart of topology optimization of socket
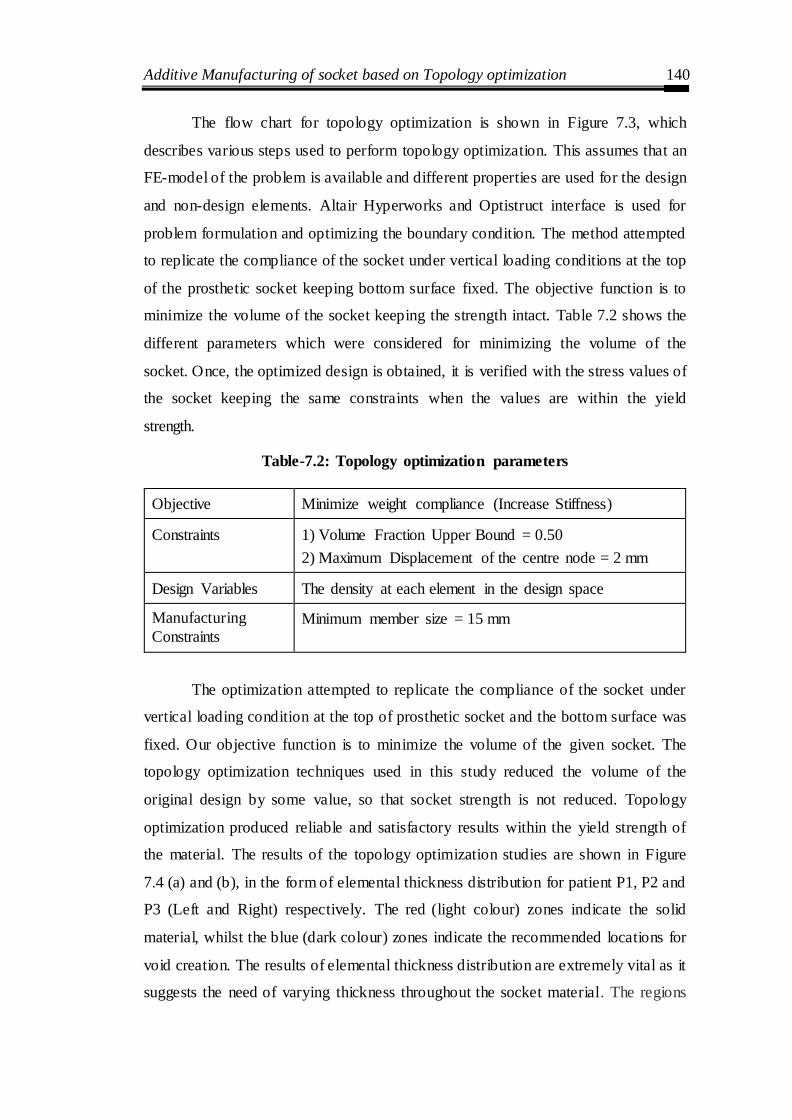
Additive Manufacturing of socket based on Topology optimization 140
The flow chart for topology optimization is shown in Figure 7.3, which
describes various steps used to perform topology optimization. This assumes that an
FE-model of the problem is available and different properties are used for the design
and non-design elements. Altair Hyperworks and Optistruct interface is used for
problem formulation and optimizing the boundary condition. The method attempted
to replicate the compliance of the socket under vertical loading conditions at the top
of the prosthetic socket keeping bottom surface fixed. The objective function is to
minimize the volume of the socket keeping the strength intact. Table 7.2 shows the
different parameters which were considered for minimizing the volume of the
socket. Once, the optimized design is obtained, it is verified with the stress values of
the socket keeping the same constraints when the values are within the yield
strength.
Table-7.2: Topology optimization parameters
Objective Minimize weight compliance (Increase Stiffness)
Constraints 1) Volume Fraction Upper Bound = 0.50
2) Maximum Displacement of the centre node = 2 mm
Design Variables The density at each element in the design space
Manufacturing
Constraints Minimum member size = 15 mm
The optimization attempted to replicate the compliance of the socket under
vertical loading condition at the top of prosthetic socket and the bottom surface was
fixed. Our objective function is to minimize the volume of the given socket. The
topology optimization techniques used in this study reduced the volume of the
original design by some value, so that socket strength is not reduced. Topology
optimization produced reliable and satisfactory results within the yield strength of
the material. The results of the topology optimization studies are shown in Figure
7.4 (a) and (b), in the form of elemental thickness distribution for patient P1, P2 and
P3 (Left and Right) respectively. The red (light colour) zones indicate the solid
material, whilst the blue (dark colour) zones indicate the recommended locations for
void creation. The results of elemental thickness distribution are extremely vital as it
suggests the need of varying thickness throughout the socket material. The regions
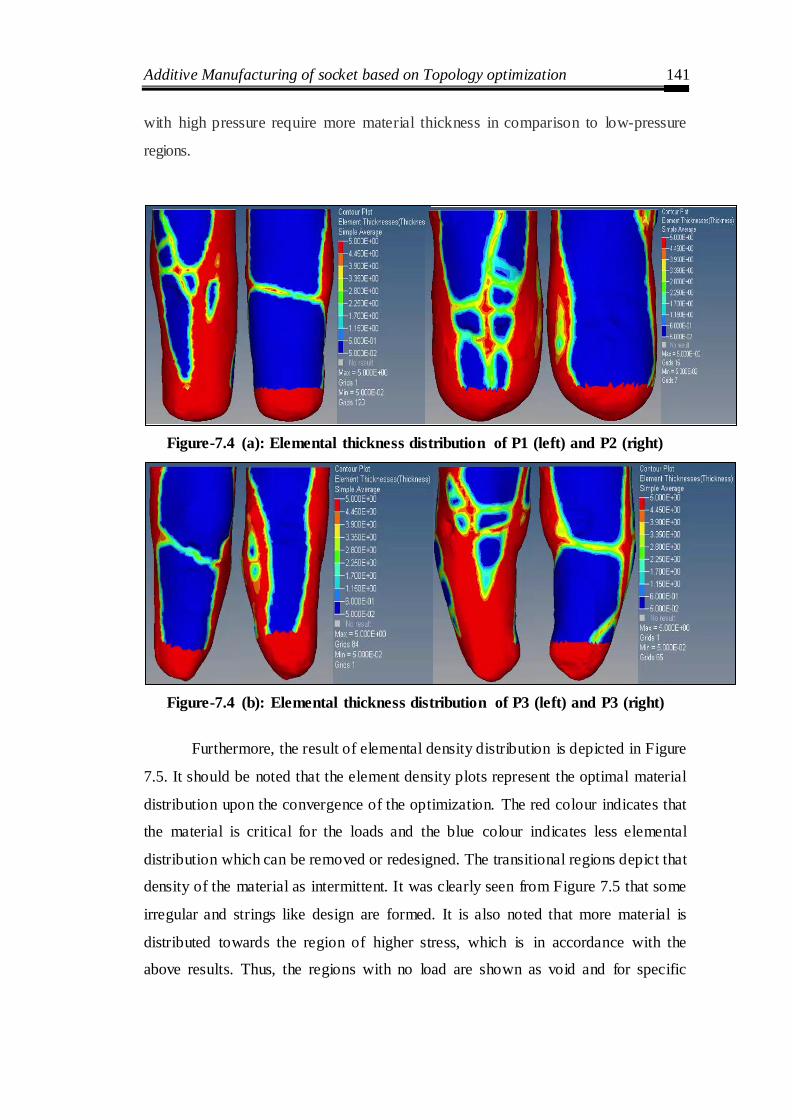
Additive Manufacturing of socket based on Topology optimization 141
with high pressure require more material thickness in comparison to low-pressure
regions.
Figure-7.4 (a): Elemental thickness distribution of P1 (left) and P2 (right)
Figure-7.4 (b): Elemental thickness distribution of P3 (left) and P3 (right)
Furthermore, the result of elemental density distribution is depicted in Figure
7.5. It should be noted that the element density plots represent the optimal material
distribution upon the convergence of the optimization. The red colour indicates that
the material is critical for the loads and the blue colour indicates less elemental
distribution which can be removed or redesigned. The transitional regions depict that
density of the material as intermittent. It was clearly seen from Figure 7.5 that some
irregular and strings like design are formed. It is also noted that more material is
distributed towards the region of higher stress, which is in accordance with the
above results. Thus, the regions with no load are shown as void and for specific
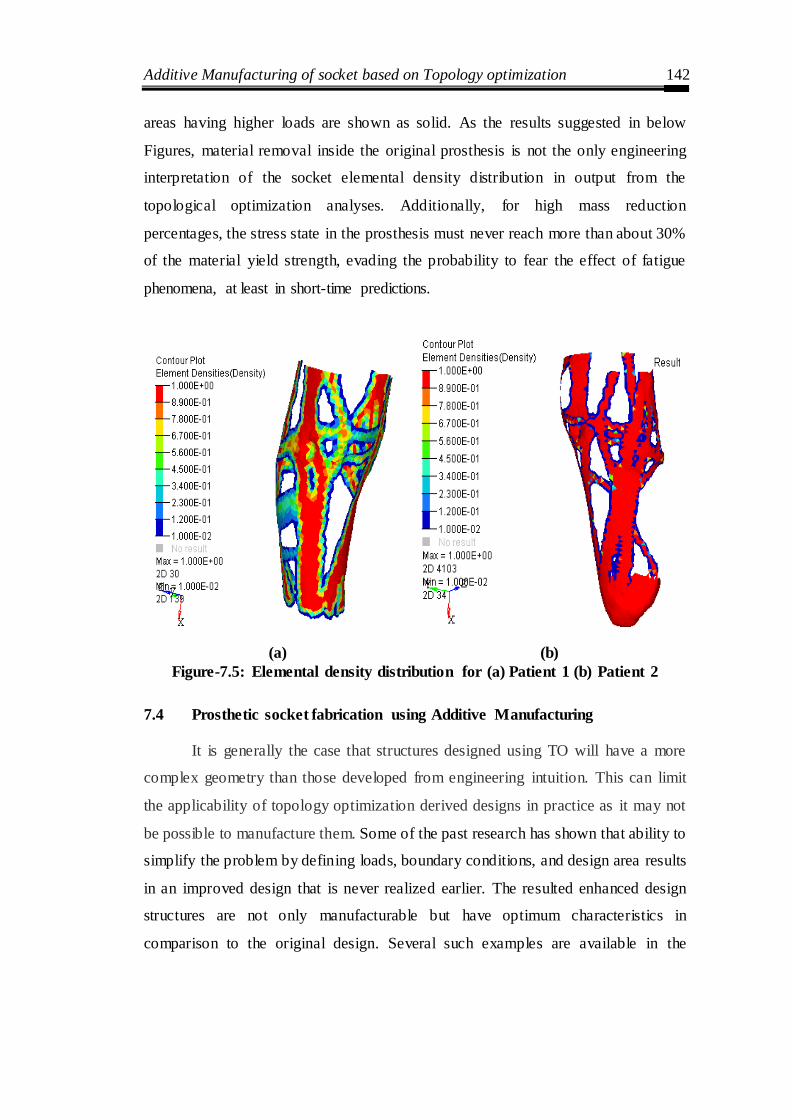
Additive Manufacturing of socket based on Topology optimization 142
areas having higher loads are shown as solid. As the results suggested in below
Figures, material removal inside the original prosthesis is not the only engineering
interpretation of the socket elemental density distribution in output from the
topological optimization analyses. Additionally, for high mass reduction
percentages, the stress state in the prosthesis must never reach more than about 30%
of the material yield strength, evading the probability to fear the effect of fatigue
phenomena, at least in short-time predictions.
(a) (b)
Figure-7.5: Elemental density distribution for (a) Patient 1 (b) Patient 2
7.4 Prosthetic socket fabrication using Additive Manufacturing
It is generally the case that structures designed using TO will have a more
complex geometry than those developed from engineering intuition. This can limit
the applicability of topology optimization derived designs in practice as it may not
be possible to manufacture them. Some of the past research has shown that ability to
simplify the problem by defining loads, boundary conditions, and design area results
in an improved design that is never realized earlier. The resulted enhanced design
structures are not only manufacturable but have optimum characteristics in
comparison to the original design. Several such examples are available in the
Additive Manufacturing of socket based on Topology optimization 143
literature showing the need of manufacturing optimized design structures and
profiles.
Manufacturability of optimized design has been a big hurdle in the adoption
of TO technology for research studies and industrial applications. The conventional
manufacturing machines are inadequate to fabricate such complex profiles with
intricate features. The additive manufacturing (AM) enables the fabrication of
geometrically complex objects with intricate features which are the ideal
requirement for TO, exploiting the design freedom offered by AM. These two
technologies will fit well providing excellent optimum designs in reality to the outer
world.
In light of additive manufacturing capability to manufacture any intricate
design and topology, it unlocks the possibility to overcome the limitation imposed
by traditional manufacturing techniques. There are a large variety of AM
technologies that are available in the market based on different working principles.
However, the high cost and large AM machine dimensions limit it to only research
studies and bigger industries. In the past few years, there was a clamor to bring AM
within reach of small industries, consumers and technology hobbyists (John et al.,
2011). There are seven categories of AM technologies available as given by ASTM
along with their terminology and definitions.
Recently, the truss ground structure has been specified by optimizing the
cross-sectional area (Zegard et al., 2014). This study tested the applicability of AM
by printing the part and examining it further. It was found that there are certain
geometrical differences among the printed and original structures. This account for
the need of including process is variability, uncertainty, issues and limitations before
printing the part. Several other studies have reported about the general idea of
combining AM and TO technologies and their interaction effects to take advantage
of material removal (Emmelmann et al., 2011; Villalpando et al., 2014).
Consequently, the final topologies would be restricted to overhang angles less than
this experimentally determined angle.

Additive Manufacturing of socket based on Topology optimization 144
Apart from this, researchers are just beginning to explore the medical
application of these two technologies (i.e. AM and TO) mainly for tissue scaffolds.
Recent literature has shown the studies related to tissue scaffold optimization for
multi- functionality requirement (Almeida and Bartolo, 2013; Dias et al., 2014). The
main criteria for optimization are maximum load handling with enough porosity to
allow fluid to flow through the material. Several other studies have been reported in
the same area of tissue scaffolds but with different optimization criteria (Challis et
al., 2010; Chen et al., 2011; Guest and Prevost, 2006, 2007).
The AM technology mostly used in integration with TO is selective laser
melting (SLM). In SLM, a laser completely melts metallic powder particles together
forming a 3D component. As SLM is recognized for its choice of manufacturing
constraints permitting difficult geometries and high material efficiency. Several
researchers have integrated TO and SLM with the objective of enhanced design and
making most of two technologies (Emmelmann et al. 2011; Tomlin et al. 2011; Muir
2013). However, SLM has certain specific issues related to it. Kruh et al., 2010 and
Song et al., 2014 has discussed various challenges and issues related to SLM
printing and emphasize on issues that need to tackle prior to its use.
7.5 FDM-based Additive Manufacturing for Generating Topology Optimised
Sockets
For improved gait support and comfort, it is important to fabricate socket with high
stiffness and flexibility, providing varying thickness wall. There are primarily two
methods for fabrication of such a socket. The first one is a single wall approach that
fulfills the need of high and low compliance in a series fashion. For rigid regions,
material needs to be thicker than a nominal thickness, and area needs to be flexible
are thinner. The second approach consists of printing socket using double wall
thickness. The inner wall is thinner as compared to outer wall for enhancing the
flexibility and maintaining the rigidity from inside. The present study concerns with
only single wall approach.
7.5.1 Fabrication of 3D printed socket
RP is an emergent technology. Integration of Three-dimensional (3D) printing, 3D
scanning, and reverse engineering are relatively novel technologies used for
Additive Manufacturing of socket based on Topology optimization 145
fabrication of custom-made parts with complex shapes profiles. Additive
Manufacturing (AM) technologies follow layer-by- layer material deposition
technique allowing the fabrication of intricate and freeform shapes with simplicity.
In the area of medical application, the real benefits become more extensively known
and appreciated. The FDM-based 3D printer was chosen from several RP processes
because it requires minimum post-processing with good mechanical properties.
The STL file has extensively used the format in rapid prototyping. The STL
file model is obtained by tessellation of the original model from the scanner is
loaded in a 3D printer for digital manufacturing. The complex freeform shape of a
prosthetic socket results in a huge size of the file when tessellated. The process of
printing the parts on the R3D2 ELAM system begins with the CAD model saved in
STL format. The surface defining the design must not contain any discontinuity
(non-manifold edge). The part could be reoriented and repaired for optimum print
quality using Netfabb and MeshMixer. Slic3r was used to slice the part with suitable
layer thickness and for adjusting other printing parameters before the G-code was
generated. Initially, the extruder head and printer bed were heated to a predefined
temperature and then extruder head begins to extrude molten plastic to build
prototype taking shape from bottom to top layer by layer. Acetone–ABS mixture is
used on the printer bed for effective part adherence. The acetone solution offers a
satisfactory adhesion of the part on printer bed during the printing process.
The use of the low-cost entry- level 3D printer, R3D2 FDM-based printer
consists of horizontal translating (x-y) heated bed platform with a usable build area
of 200 x 220 mm and vertical translating (z-direction) extruder fitted with a nozzle.
Also, the maximum build height of the machine is 200 mm as shown in Figure 7.6.
It is a layer-by- layer extrusion-based rapid prototyping process. The extrusion process
is directed by a stepper motor with a feed of 1.8 mm diameter Acrylonitrile Butadiene
Styrene (ABS) filament into a heated 0.15 mm diameter nozzle. The R3D2 ELAM
machine is used to fabricate parts with a layer thickness of 0.075 mm. AM Machine
extrudes the filament through its heated nozzle to build a socket layer by layer.
Extruder temperature was set at 220°C, then the filament enters at 210°C for first, and
outer layer temperature with the bed temperature of the printer was 60°C. The AM
socket may require mild sanding or sandpaper polish to remove seam or burr.

Additive Manufacturing of socket based on Topology optimization 146
Figure-7.6: R3D2 FDM-based additive manufacturing machine
The time taken to form the prosthesis socket by 3D printer was 480 minutes
and complete prosthesis. The weight of the prosthesis is 256 grams and the wall
thickness of the prosthesis socket varied from 3.2 mm at the distal end to 4.5 mm at
patella-tendon of the stump. The overall time of socket manufactured by the
proposed method is 250 minutes. Therefore, the proposed RE and AM integrated
digital manufacturing process of the socket overcomes all above hassles associated
with traditional manufacturing. The finished AM socket is shown in the bottom of
the (Figure 3.6). For the prosthetic socket, both traditional and proposed processes
of manufacturing are schematically represented.
Based on the results of Topology Optimisation a test socket is fabricated
using FDM-based additive manufacturing machine (see Figure 7.7). The Printed
socket is then verified for dimensional accuracy. As geometric fidelity is one of the
critical issues with AM technology. In the same context, the initially printed socket
is compared with its CAD model for geometric deviation before the final printing of
the socket. The procedure followed for geometric inspection is same as was used in
Chapter 3. starting with the scanning of the socket and further inspecting it in the
inspection software (Steinbichler).
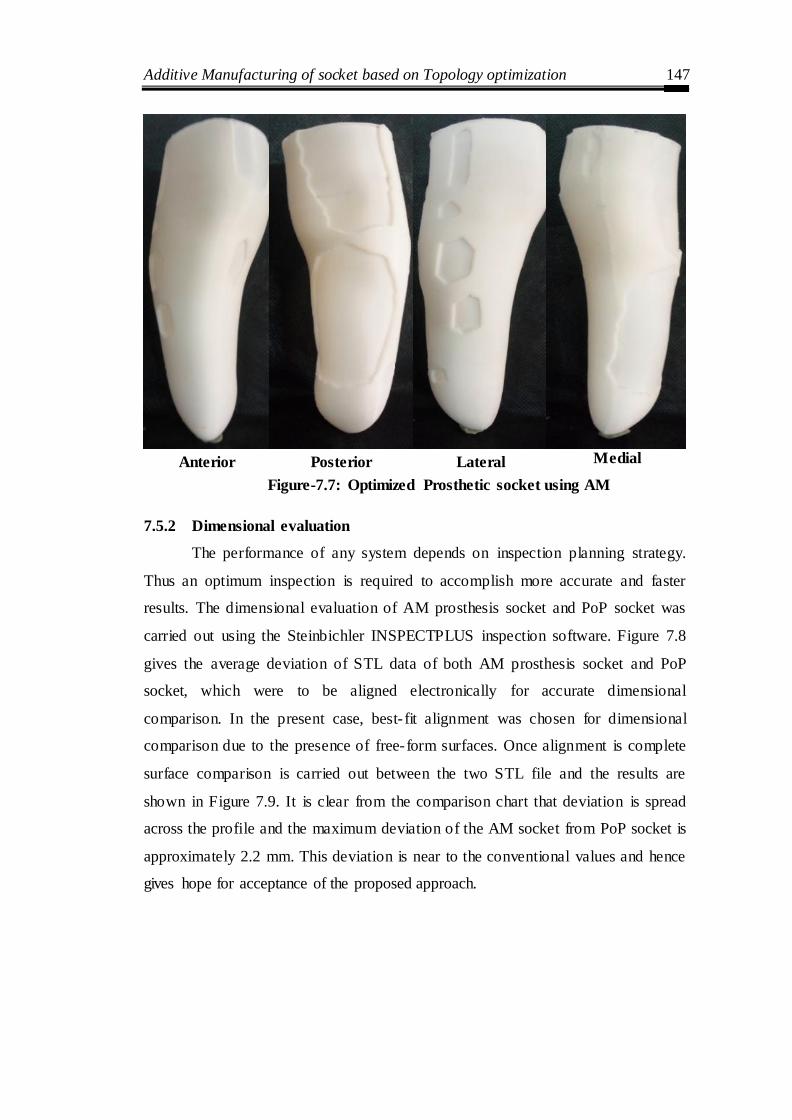
Additive Manufacturing of socket based on Topology optimization 147
Anterior Posterior Lateral Medial
Figure-7.7: Optimized Prosthetic socket using AM
7.5.2 Dimensional evaluation
The performance of any system depends on inspection planning strategy.
Thus an optimum inspection is required to accomplish more accurate and faster
results. The dimensional evaluation of AM prosthesis socket and PoP socket was
carried out using the Steinbichler INSPECTPLUS inspection software. Figure 7.8
gives the average deviation of STL data of both AM prosthesis socket and PoP
socket, which were to be aligned electronically for accurate dimensional
comparison. In the present case, best- fit alignment was chosen for dimensional
comparison due to the presence of free-form surfaces. Once alignment is complete
surface comparison is carried out between the two STL file and the results are
shown in Figure 7.9. It is clear from the comparison chart that deviation is spread
across the profile and the maximum deviation of the AM socket from PoP socket is
approximately 2.2 mm. This deviation is near to the conventional values and hence
gives hope for acceptance of the proposed approach.

Additive Manufacturing of socket based on Topology optimization 148
Figure-7.8: Average deviation showing (a) Lateral and Medial (b) Posterior and
Anterior view

Additive Manufacturing of socket based on Topology optimization 149
Figure-7.9: Point-to-Point deviation with actual CAD model
Chapter Summary
A framework for modeling and topology optimization of prosthetic sockets
has been developed resulting in improved fabrication accuracy for the individual
patients.
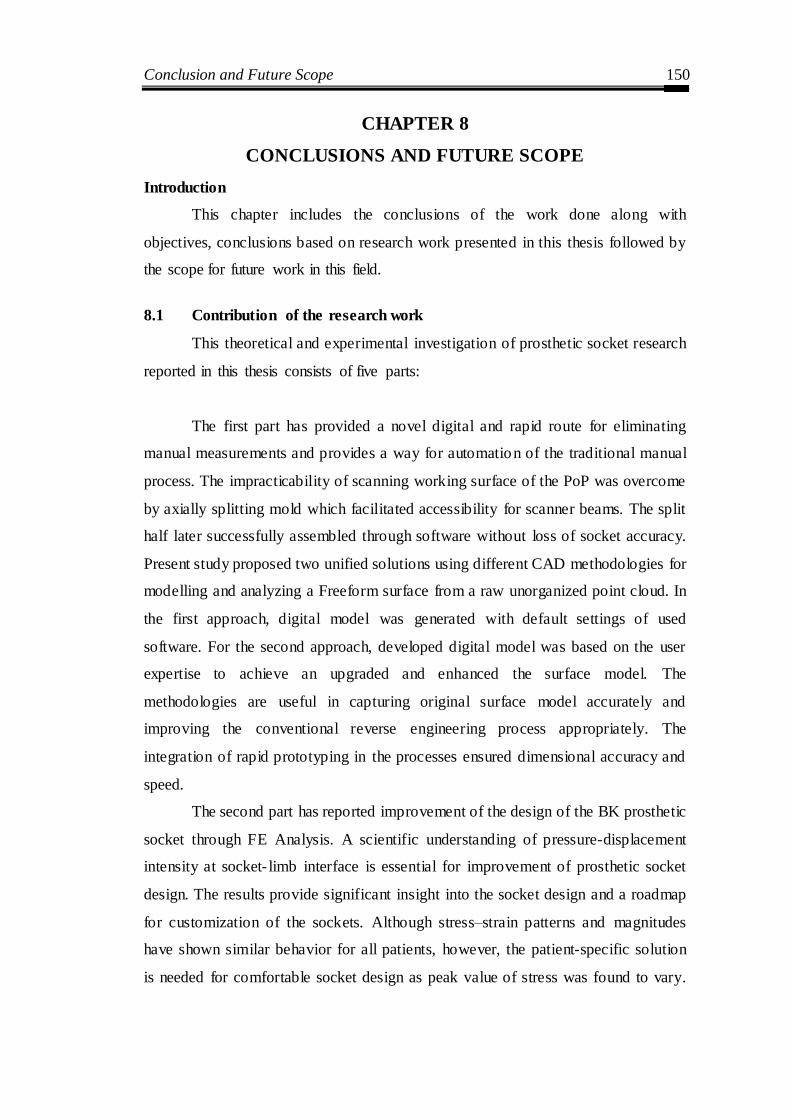
Conclusion and Future Scope 150
CHAPTER 8
CONCLUSIONS AND FUTURE SCOPE
Introduction
This chapter includes the conclusions of the work done along with
objectives, conclusions based on research work presented in this thesis followed by
the scope for future work in this field.
8.1 Contribution of the research work
This theoretical and experimental investigation of prosthetic socket research
reported in this thesis consists of five parts:
The first part has provided a novel digital and rapid route for eliminating
manual measurements and provides a way for automation of the traditional manual
process. The impracticability of scanning working surface of the PoP was overcome
by axially splitting mold which facilitated accessibility for scanner beams. The split
half later successfully assembled through software without loss of socket accuracy.
Present study proposed two unified solutions using different CAD methodologies for
modelling and analyzing a Freeform surface from a raw unorganized point cloud. In
the first approach, digital model was generated with default settings of used
software. For the second approach, developed digital model was based on the user
expertise to achieve an upgraded and enhanced the surface model. The
methodologies are useful in capturing original surface model accurately and
improving the conventional reverse engineering process appropriately. The
integration of rapid prototyping in the processes ensured dimensional accuracy and
speed.
The second part has reported improvement of the design of the BK prosthetic
socket through FE Analysis. A scientific understanding of pressure-displacement
intensity at socket- limb interface is essential for improvement of prosthetic socket
design. The results provide significant insight into the socket design and a roadmap
for customization of the sockets. Although stress–strain patterns and magnitudes
have shown similar behavior for all patients, however, the patient-specific solution
is needed for comfortable socket design as peak value of stress was found to vary.
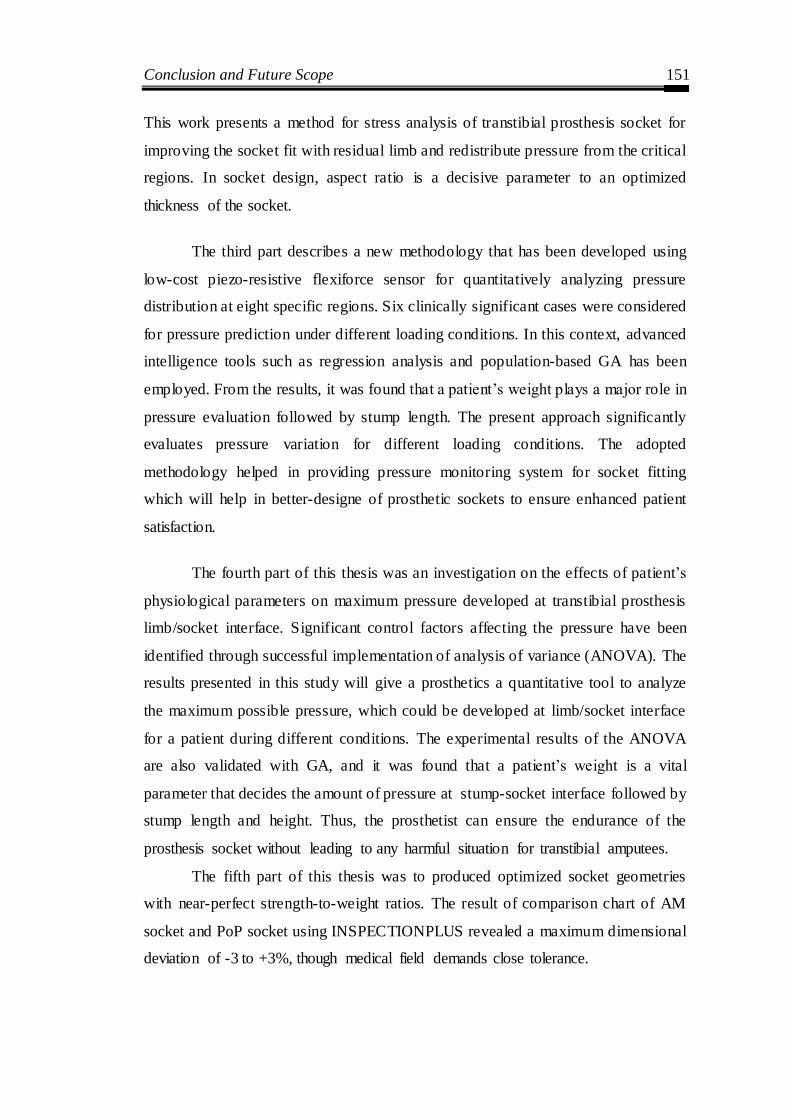
Conclusion and Future Scope 151
This work presents a method for stress analysis of transtibial prosthesis socket for
improving the socket fit with residual limb and redistribute pressure from the critical
regions. In socket design, aspect ratio is a decisive parameter to an optimized
thickness of the socket.
The third part describes a new methodology that has been developed using
low-cost piezo-resistive flexiforce sensor for quantitatively analyzing pressure
distribution at eight specific regions. Six clinically significant cases were considered
for pressure prediction under different loading conditions. In this context, advanced
intelligence tools such as regression analysis and population-based GA has been
employed. From the results, it was found that a patient‘s weight plays a major role in
pressure evaluation followed by stump length. The present approach significantly
evaluates pressure variation for different loading conditions. The adopted
methodology helped in providing pressure monitoring system for socket fitting
which will help in better-designe of prosthetic sockets to ensure enhanced patient
satisfaction.
The fourth part of this thesis was an investigation on the effects of patient‘s
physiological parameters on maximum pressure developed at transtibial prosthesis
limb/socket interface. Significant control factors affecting the pressure have been
identified through successful implementation of analysis of variance (ANOVA). The
results presented in this study will give a prosthetics a quantitative tool to analyze
the maximum possible pressure, which could be developed at limb/socket interface
for a patient during different conditions. The experimental results of the ANOVA
are also validated with GA, and it was found that a patient‘s weight is a vital
parameter that decides the amount of pressure at stump-socket interface followed by
stump length and height. Thus, the prosthetist can ensure the endurance of the
prosthesis socket without leading to any harmful situation for transtibial amputees.
The fifth part of this thesis was to produced optimized socket geometries
with near-perfect strength-to-weight ratios. The result of comparison chart of AM
socket and PoP socket using INSPECTIONPLUS revealed a maximum dimensional
deviation of -3 to +3%, though medical field demands close tolerance.

Conclusion and Future Scope 152
8.2 Scope for future work
The following aspects could also be incorporated in this research work that
should be taken up in the future:
1. The present study can be further explored by attempting digital
manufacturing of socket through high-end AM machine and 3D scanner with
50-micron accuracy.
2. The topology optimization techniques used to reduce volume of the socket
can be manufactured by different additive methods.
3. The present study may be extended further to optimize both digital
manufacturing system and developed analysis algorithm, to achieve more
perfect results and a more user independent system.
4. The present study can be extended further to measuring gait cycle of
amputees walking with prostheses.

References 153
REFERENCES
1. Abu Osman, N.A., Spence, W.D., Solomonidis, S.E., Paul, J.P., Weir, A.M.
(2010). Transducers for the determination of the pressure and shear stress
distribution at the stump-Socket interface of trans-tibial amputees. Proc. Inst.
Mech. Eng. Part B J. Eng. Manuf. 224 (8), 1239–1250.
2. Abu Osman, N.A., Spence, W.D., Solomonidis, S.E., Paul, J.P., Weir, A.M.
(2010). The patellar tendon bar! Is it a necessary feature? Med. Eng. Phys.,
32(7), 760-765.
3. Alcaide-Aguirre, R.E., Morgenroth, D.C., Ferris, D.P. (2013). Motor control
and learning with lower limb myoelectric control in amputees. J. Rehabil.
Res. Dev. 50(5), 687-698.
4. Al-Fakih, E.A., Abu Osman N.A., Eshraghi, A., Mahamd Adikan, F.R..
(2013). The Capability of Fiber Bragg Grating Sensors to Measure
Amputees‘ Trans-Tibial Stump/Socket Interface Pressures. Sensors.13(8),
10348-10357.
5. Al-Fakih, E.A., Abu Osman, N.A., Mahmad Adikan, F.R. (2016). Techniques
for Interface Stress Measurements within Prosthetic Sockets of Transtibial
Amputees: A Review of the Past 50 Years of Research. Sensors, 16(7), 11-
19.
6. Ali, S., Abu Osman, N.A., Eshraghi, A., Gholizadeh, H., Wan Abas,
W.A.B.B. (2013). Interface pressure in transtibial socket during ascent and
descent on stairs and its effect on patient satisfaction. Clin.
Biomech. 28(9-10), 994-999.
7. Ali, S., Osman, N.A.A., Mortaza, N., Eshraghi, A., Gholizadeh, H., Abas,
W.A.B.B.W. (2012). Clinical investigation of the interface pressure in the
trans-tibial socket with dermo and seal- in x5 liner during walking and their
effect on patient satisfaction. Clin. Biomech. 27(9), 943-948.
8. Almeida, H., Brtolo, P. (2013). Topological optimisation of scaffolds for
tissue engineering. Procedia Engineering, 59, 298–306.

References 154
9. Amali, R., Noroozi, S., Vinney, J., Sewell, P. Andrews, S. (2006). Predicting
interfacial loads between the prosthetic socket and the residual limb for
below knee amputees – a case study. Strain. 42(1), 3-10.
10. Andrysek J. (2010). Lower-limb prosthetic technologies in the developing
world: A review of literature from 1994–2010. Prosthetics and Orthotics
International. 34(4), 378–398.
11. Baars, E.C.T., Geertzen, J.H.B. (2005). Literature review of the possible
advantages of silicon liner socket use in trans-tibial prostheses, Prosthetics
and Orthotics International. 29(1), 27-37.
12. Bansal, G., Bhatia, D., Joshi, D., Anand, S., Tewari, RP. (2011) Coordination
between lower limb muscles in different locomotion activities, Int. J.
Biomedical Engineering and Technology. 6(2), 129-141.
13. Berlemont, M., Weber, R., Willot, J.P. (1969). Ten years of experience with
the immediate application of prosthetic devices to amputees of the lower
extremities on the operating table, Prosthet Orthot Int. 3, 8-18.
14. Bibb, R., Freeman, P., Brown, R., Sugar, A., Evans P., Bocca, A. (2000). An
investigation of three-dimensional scanning of human body surfaces and its
use in the design and manufacture of prostheses, Proceedings of the
Institution of Mechanical Engineers, Part H. Journal of Engineering in
Medicine. 214(6), 589-594.
15. Boonhong, J. (2007). Validity and reliability of girth measurement
(circumference measurement) for calculating residual limb volume in below-
knee amputees. Chula Med J. 51, 77–88.
16. Bouten, D. C., Colin, D., Oomens C. W. J. (2010). Pressure Ulcer Research,
Current and Future Perspectives, Springer. Berlin, Germany.
17. Bowker, H.K., Quigly, J.W. (1992). Prosthetic Management: Overview,
Methods, and Materials. Prosthetic and Rehabilitation Principles, Mosby-
Year Book. 67-79.
18. Brackett, I. Ashcroft, and R. Hague. (2011). Topology optimization for
additive manufacturing. Pages 348–362.
19. Buis, A.W., Blair, A., Convery, P., Sockalingam, S., McHugh, B. (2003).
Pilot study: Data-capturing consistency of two transtibial casting concepts,

References 155
using a manikin stump model: A comparison between the hands on PTB and
hands-off ICECAST compact concepts. Prosthetics and orthotics
International. 27(2), 100-106.
20. Buis, A.W.P., Condon, B., Brennan, D., McHugh, B., Hadley, D. (2006).
Magnetic resonance imaging technology in transtibial socket research: A
pilot study. Journal of Rehabilitation Research & Development JRRD. 43(7),
883-890.
21. Challis, A., Roberts, J., Grotowski, L., Zhang, C., Sercombe, T. (2010).
Prototypes for bone implant scaffolds designed via topology optimization
and manufactured by solid freeform fabrication. Advanced Engineering
Materials, 12(11), 1106–1110.
22. Chen, M., Schellekens, S., Zhou, J., Cadman, W., Li, R., Appleyard, Q.
(2011). Design optimization of scaffold microstructures using wall shear
stress criterion towards regulated flow-induced erosion. Journal of
Biomechanical Engineering, 133(8).
23. Collins, D.M., Karmarkar, A., Relich, R., Pasquina, P.F., Cooper, R.A (2006).
Review of Research on Prosthetic Devices for Lower Extremity Amputation.
34(5), 379-438.
24. Colombo G., Filippi, S., Rizzi, C., Rotini, Rotini, F. (2010). A new design
paradigm for the development of custom-fit soft sockets for lower limb
prostheses. Computers in Industry, 61(6), 513-523.
25. Colombo, G., Berretti, M., Bonacini, D. and Magrassi, G. (2006). Reverse
and rapid prototyping techniques to innovate prosthesis socket design, Paper
presented at SPIE-IS&T Electronic Imaging, SPIE, Vol. 6056, 60560P.
26. Colombo, G., Facoetti, G., Gabbiadini, S., Rizzi, C. (2013) Socket modelling
assistant for prosthesis design, International Journal of Computer Aided
Engineering and Technology, 5(2-3), 216-241.
27. Colombo, G., Morotti, R., Rizzi, C. (2014). FE Analysis of Contact between
Residual Limb and Socket during Simulation of Amputee Motion.
Computer-Aided Design and Applications. 11(4), 381-388.

References 156
28. Commean, P.K, Smith, K.E., Cheverud, J.M., Vannier, M.W. (1996).
Precision of surface measurements for below-knee residua. Archives of Physical
Medicine and Rehabilitation, 77(5), 477-486.
29. Convery, P and Buis, AWP (1999). Socket/stump interface dynamic pressure
distributions recorded during the prosthetic stance phase of gait of a
transtibial amputee wearing a hydrocast socket. Prosthetics and Orthotics
International, 23(2), 107-112.
30. Convery, P., Buis, A.W., Wilkie, R., Sockalingam, S., Blair, A., McHugh, B.
(2003). Measurement of the consistency of patellar tendon-bearing cast
rectification, Prosthetics and orthotics International. 27(3), 207-213.
31. Convery, P., Buis, A.W.P. (1998) Conventional patellar-tendon-bearing
(PTB) socket/stump interface dynamic pressure distribution recorded during
the prosthetic stance phase of gait of a trans-tibial amputee. Prosthetic
Orthotic International, 22, 193-198.
32. Cugini, U, Bertetti, M., Bonacini, D., Corradini, C., Magrassi, G. (2006).
Innovative Implementation in Socket Design: Digital Models to Customize
the Product. In: Proceedings of ArtAbilitation, vol. 1, 54–61, ISBN: 87-
7606r-r015-2.
33. Cummings, D., (1996). Prosthetics in the developing world: a review of the
literature, Prosthetics and Orthotics International, 20(1), 51-60.
34. Dean, D, Saunders, CG (1985). A software package for design and manufacture
of prosthetic sockets for transtibial amputees. IEEE Trans Biomed Eng,
32(4), 257-262.
35. Deb, K. (1998). Genetic algorithm in search and optimization: the technique
and applications, in: Proceedings of International Workshop on Soft
Computing and Intelligent Systems, Calcutta, India, 58–87.
36. Demet, K, Martinet, N, Guillemin, F, Paysant, J, Andre J-M (2003). Health
related quality of life and related factors in 539 persons with amputation of
upper and lower limb. Disabil Rehabil, 25(9), 480-6.
37. Dev, R., Singh, AK. (2015). Distortion analysis of EMG signal using
LabVIEW as an effective tool, Int. J. Biomedical Engineering and
Technology, 19(2), 187-204.
References 157
38. Dias, M., Guedes, J., Flanagan, C., Hollister, S., Fernandes, P. (2014).
Optimization of scaffold design for bone tissue engineering: A
computational and experimental study. Medical Engineering and Physics,
36(4), 448–457.
39. Dillingham T. R., Pezzin L. E., and MacKenzie E. J. (2002). Limb
amputation and limb deficiency: epidemiology and recent trends in the
United States, Southern Medical Journal, 95(8), 875–883.
40. Dillingham, T.R.., Pezzin, L. E., MacKenzie, E. J., Burgess, AR. (2001). Use
and satisfaction with prosthetic devices among persons with trauma-related
amputations: A long-term outcome study, American Journal of Physical
Medicine and Rehabilitation, 80(8), 563-571.
41. Dou, P., Jia, X., Suo, S., Wang, R and Zhang M. (2006). Pressure
distribution at the stump/socket interface in transtibial amputees during
walking on stairs, slope and non-flat road. Clinical Biomechanics. 21(10),
1067–1073.
42. Dougherty, G., Digital image processing for medical applications. (2009).
Cambridge University Press.
43. Douglas T., Solomonidis S., Sandham W., Spence W., (2002). Ultrasound
Imaging in Lower Limb Prosthetics. IEEE Transactions On Neural Systems
And Rehabilitation Engineering, 10(1), 11-21.
44. Douglas, T.S., Solomonidis, S.E., Lee, V.S.P. Spence, W.D., Sandham,
W.A., Hadley, D.M. (1998). Automatic segmentation of magnetic resonance
images of the trans-femoral residual limb, Medical Engineering & Physics
20(10), 756–763.
45. Duchemin, L., Bousson, V., Raossanaly, C., Bergot, C., Laredo, J.D.,
Skalli, W., Mitton, D., (2008). Prediction of mechanical properties of cortical
bone by quantitative computed tomography, Medical Engineering & Physics,
30(3), 321–328.
46. Dumbleton, T., Buis, A.W.P., McFadyen, A., McHugh, B.F., McKay, G.,
Murray, K.D., Sexton, S., (2009). Dynamic interface pressure distributions
of two transtibial prosthetic socket concepts, Journal of Rehabilitation
Research & Development, 46(3), 405-416.
References 158
47. Eberhart, H.D., McKennon, J.C. (1960). Suction-socket suspension of the
above-knee prosthesis, in Klopsteg PE, Wilson PD: Human Limbs and Their
Substitutes. McGraw-Hill International Book Co, New York, 1954.
Reprinted by Hafner Press, New York .
48. Emmelmann, C., Sander, P., Kranz, J., Wycisk, E. (2011). Laser additive
manufacturing and bionics: Redefining lightweight design, 12, 364–368.
49. Engsberg, J.R., Clynch, G.S., Lee, A.S., Allan, J.S., Harder J.A. (1992). A
CAD CAM method for custom below-knee sockets, Prosthetics and
Orthotics International 16(3), 183-188.
50. Engsberg, J.R., Springer, M.J., Harder, J.A. (1992). Quantifying interface
pressures in below-knee amputee sockets. J Assoc Child Prosthet Orthot
Clin. 27(3), 81-88.
51. Facoetti, G., Gabbiadini, S., Colombo, G., Rizzi, C. (2010). Knowledge-
based system for guided 158odelling of sockets for lower limb prostheses,
Computer Aided Design Application 7(5), 723-737.
52. Faulkner, V.W., Walsh, N.E. (1989). Computer Designed Prosthetic Socket
from Analysis of Computed Tomography Data, Journal of Prosthetics &
Orthotics 1(3), 154-164.
53. Faustini, M. C., Neptune, R. R., Crawford, R. H., Rogers, W. E., and Bosker,
G., (2006). An Experimental and Theoretical Framework for Manufacturing
Prosthetic Sockets for Transtibial Amputees, IEEE Trans. Neural Syst.
Rehabil. Eng., 14 (3), 304–310.
54. Faustini, M. C., Neptune, R. R., Crawford, R. H., Stanhope, S. J., (2008).
Manufacture of Passive Dynamic Ankle-Foot Orthoses Using Selective
Laser Sintering, IEEE Trans. Biomed. Eng., 55 (2), 784–790.
55. Faustini, M.C., Neptune, R., Crawford, R.H. (2006). The quasi-static
response of compliant prosthetic sockets for transtibial amputees using finite
element methods, Medical Engineering & Physics, 28(2), 114-121.
56. Faustini, M.C., Richard, H.C., Richard, R. N., William, E. R., Gordon, B.
(2005). Design and analysis of orthogonally compliant features for local
contact pressure relief in transtibial prostheses, Journal of Biomechanical
Engineering. 127(6), 946-951.
References 159
57. Fernie, G.R., Griggs G., Bartlett, S, Lunau, K. (1985). Shape sensing for
computer aided below-knee prosthetic socket design. Prosthet Orthot Int. 9(1),
12–16.
58. Foort, J. (1979). Socket design for the above-knee amputee. Prosthetics and
Orthotics Int; 3(2), 73-81.
59. Frillici, F.S., Rissone P., Rizzi C., Rotini F. (2008). The role of simulation
tools to innovate the prosthesis socket design process, Intelligent Production
Machines and Systems, Whittles Publishing, 612–619, ISBN: 978-1904445-
52-4.
60. Fuh, J.Y.H., Feng, W., Wong, Y.S. (2006). Modeling, analysis and
fabrication of below-knee prosthetic sockets using rapid prototyping, in
Gibson I (ed.), Advanced Manufacturing Technology for Medical Applications:
Reverse Engineering, Software Conversion and Rapid Prototyping,
Engineering Research Series, John Wiley & Sons.
61. Geil, M. (2007). Consistency, precision and accuracy of optical and
electromagnetic shape-capturing systems for digital measurement of
residual- limb anthropometrics of persons with transtibial amputation,
Journal of Rehabilitation Research and Development. 44(4), 515-524.
62. Geil, M. D. (2005). Consistency and accuracy of measurement of lower- limb
amputee anthropometrics. Journal of Prosthetics & Orthotics, 42(2), 131-
140.
63. Gholizadeh, H., Abu Osman, N.A., Eshraghi, A., Ali, S., (2014).
Transfemoral prosthesis suspension systems: A systematic review of the
literature. American journal of Physical Medicine and Rehabilitation, 93(9),
809-823.
64. Gibson, I., editor. (2005). Advanced manufacturing technology for medical
applications: reverse engineering, software conversion and rapid prototyping.
John Wiley & Sons.
65. Goh JCH, Lee PVS, Chong SY. (2004). Comparative study between patellar-
tendon-bearing and pressure cast prosthetic sockets. Journal of
Rehabilitation Research & Development. 41(3B), 491–501.

References 160
66. Goh, J.C., Lee, P.V., Ng P. (2002). Structural integrity of polypropylene
prosthetic sockets manufactured using the polymer deposition technique,
Proceedings of the Institution of Mechanical Engineers, Part H: Journal of
Engineering in Medicine 216(6), 359-368.
67. Goh, J.C.H., Lee, P.V.S and Chong, S.Y. (2003). Stump/socket pressure
profiles of the pressure cast prosthetic socket. Clinical Biomechanics. 18(3),
237–243.
68. Golbranson, F., Wirta, R., Kuncir, E., Lieber, R., Oishi, C. (1988). Volume
changes occurring in postoperative below-knee residual limbs. J Rehabil Res
Dev. 25(2), 11–18.
69. Goswami, J., Lynn, R., Street, G., Harlander, M. (2003). Walking in a
vacuum-assisted socket shifts the stump fluid balance, Prosthetics &
Orthotics International, 27(2), 107-113.
70. Guest, J. K., Prevost, J. H. (2006). Optimizing multifunctional materials:
design of microstructures for maximized stiffness and fluid permeability.
International Journal of Solids and Structures, 43(22):7028–7047.
71. Guest, J. K., Prevost, J. H. (2007). Design of maximum permeability
material structures. Computer Methods in Applied Mechanics and
Engineering, 196(4), 1006–1017.
72. Hachisuka, K., Dozono, K., Ogata, H., Ohmine, S., Shitama, H., Shinkoda,
K. (1998). Total surface bearing below-knee prosthesis: Advantages,
disadvantages, and clinical implications, Archives of Physical Medicine &
Rehabilitation, 79(7), 783-789.
73. He, P., Xue, K., Chen, Q., Murka, P., Schall, S. (1996). A PC-based
ultrasonic data acquisition system for computer-aided prosthetic socket
design. IEEE Trans Rehabil Eng. 4(2):114–19.
74. He, P., Xue, K., Murka, P. (1997). 3-D imaging of residual limbs using
ultrasound. J Rehabil Res Dev. 34(3), 269–78.
75. Herbert, N., Simpson, D., Spence, W, Ion, W. (2005). A preliminary
investigation into the development of 3-D printing of prosthetic sockets,
Journal of Prosthetics and Orthotics 42(2), 141-146.

References 161
76. Hopkinson, N., Dickens, P.M. (2003). Analysis of rapid manufacturing-using
layer manufacturing processes for production, Proceedings of the Institute of
Mechanical Engineers, Part C: Journal of Mechanical Engineering Science
217 (C1), 31-39.
77. Horgan, O., MacLachlan, M. (2004). Psychosocial adjustment to lower- limb
amputation: a review. Disability and Rehabilitation. 26(14-15), 837–850.
78. Houston, V.L. (1992). Automated Fabrication of Mobility Aids (AFMA):
Below-knee CASD/CAM Testing and Evaluation Program Results, Journal
of Rehabilitation Research and Development 29 (4), 78-124.
79. Hsu, L.H., Au, H.W., Chou, Y.L., Huang, G.F. (2001). Recognition for the
boundary of pressure-tolerant and pressure-relief areas on the scanned points
of residual limb, Biomedical engineering applications, basis & communications
13, 276-282.
80. Hsu, L.H., Hsu, F.M., Chou, Y.L., Hsu, L.Y. Leong, H., Huang, K.F. (2001).
An algorithm to construct the CAD model of a residual limb. Biomedical
engineering applications basis and communication, 13(3), 149-158.
81. Hsu, L.H., Hsu, L.Y., Chou, Y.L., Chien, C.W., Huang, G.F. (2000).
Automated shape modification for the cadmodel of residual limb,
Biomedical engineering applications, basis & communications 14: 251.
82. Hsu, L.H., Huang, G.H., Lu, C.T., Hong, D.Y., Liu, S.H. (2010). The
Development of a Rapid Prototyping Prosthetic Socket Coated with a Resin
Layer for Transtibial Amputees, Prosthetics and orthotics International
34:37.
83. Jaime, A.V., Patino, F.R.J. (2012). Incidence of the boundary condition
between bone and soft tissue in a finite element model of a transfemoral
amputee, Annals of Biomedical Engineering, 36(4), 405-414.
84. Jensen, J.S., Craig, J.G., Mtalo, L.B., Zelaya, C.M. (2004). Clinical field
follow-up of high density polyethylene (HDPE) – Jaipur prosthetic technology
for trans-femoral amputees. Prosthetics and Orthotics International, 28, 152-
16

References 162
85. Jensen, J.S., Poetsma, P.A., Thanh, N.H. (2005). Sand-casting technique for
trans-tibial prostheses. Prosthetics and Orthotics International August 29(2),
165–175.
86. Jia, X., Zhang, M., Lee, W.C.C. (2004). Load transfer mechanics between
transtibial prosthetic socket and residual limb-Dynamic effects, Journal of
Biomechanics, 37(9), 1371–1377.
87. Johansson, S., Oberg, T. (1998). Accuracy and precision of volumetric
determinations using two commercial CAD systems for prosthetics: A
technical note. J Rehabil Res Dev. 35(1), 27–33.
88. Kang, P., Kim, J., and Roh, J. (2006). Pressure Distribution in Stump/Socket
Interface in Response to Socket Flexion Angle Changes in Transtibial
Prostheses with Silicone. Liner. PTK. 13(4).
89. Kay, H.W., Newman, J.D. (1975). Relative incidences of new amputations.
Orthot Prosthet, 29:3-16.
90. Kim, W.D., Lim, D., Hong, K.S. (2003). An evaluation of the effectiveness
of the patellar tendon bearing bar in the trans-tibial patellar-tendon-bearing
prosthesis socket. Prosthet Orthot Int. 27(1), 23–35.
91. Kovacs, L., Eder, M., Volf, S., Raith, S., Pecher, M., Pathak, H., Müller, C.,
and Gottinger, F. Patient-Specific Optimization of Prosthetic Socket
Construction and Fabrication Using Innovative Manufacturing Processes: A
Project in Progress. In Materialise World Conference 2010. Leuven, Belgium.
92. Krishna, V.G., Rao, L.B. (2015). Modelling and analysis of a synovial joint,
Int. J. Biomedical Engineering and Technology, 17(2), 178-191.
93. Krouskop, T.A. (1987). Computer aided design of a prosthetic socket for an
above-knee amputee. Journal of Rehabilitation Research and Development
24(2), 31–38.
94. Kruth, J. P., Badrossamay, M., Yasa, E., Deckers, J., Thijs, L., Van
Humbeeck, J. (2010). Part and material properties in selective laser melting
of metals. In Proceedings of the 16th International Symposium on
Electromachining.
References 163
95. Lacroix, D., Pantino, J.F.R. (2011). Finite element analysis of donning
procedure of a prosthetic transfemoral socket, Annals of Biomedical
Engineering. 39 (12), 2972-2983.
96. Lee, A.J.C. (1992). The place of numerical and experimental methods in
biomedical engineering. In: Middleton, J., Pande, G.N., Williams, K.R.
(Eds.), Recent Advances in Computer Methods in Biomechanics and
Biomedical Engineering. Books and Journal International Ltd., Swansea, 1–7.
97. Lee, V.S.P., Solomonidis, SE, Spence, W.D. (1997). Stump-socket interface
pressure as an aid to socket design in prostheses for trans- femoral amputees-
a preliminary study. Proc Inst Mech Eng, 211(2), 167-180.
98. Lee, W.C.C., Frossard, L. A., Hagberg, K., Haggstrom, E., Gow, D. L.,
Steven, G., Branemark, R. (2008). Magnitude and variability of loading on
the osseointegrated implant of transfemoral amputees during walking,
Medical engineering and physics, 30(7), 825-833.
99. Lee, W.C.C., Zhang, M. (2007). Using computational simulation to aid in the
prediction of socket fit: a preliminary study, Medical Engineering and
Physics, 29(8), 923–929.
100. Lee, W.C.C., Zhang, M., Jia, X., Cheung, J.T.M. (2004). Finite element
163odelling of the contact interface between trans-tibial residual limb and
prosthetic socket, Medical Engineering & Physics, 26(8), 655–662.
101. Legro, M.W., Reiber, G., del Aguila, M., Ajax, M.J., Boone, D.A., Larsen,
J.A., Smith, D.G., Sangereozan, B. (1999). Issues of importance reported by
persons with lower limb amputation and prostheses, Journal of Rehabilitation
Research and Development, 36(3) 155-163.
102. Lei, N., Moon, S., Bi, G. (2011). Additive manufacturing and topology
optimization to support product family design. Pages 505–510, 2014.
103. Lemaire E.D. (1994). A CAD analysis programme for prosthetics and
orthotics, Prosthet. Orthot. Int., 18(2), 112-117.
104. Lemaire E.D., Johnson, F., (1996). A quantitative method for comparing and
evaluating manual prosthetic socket modifications. IEEE Trans Rehabil Eng
4(4), 303-309.

References 164
105. Lenka, P.K., Choudhury, A. R. (2011). Analysis of transtibial prosthetic
socket materials using finite element method. Journal of Biomedical Science
and Engineering, 4(12), 762-768.
106. Lilja, M., Johansson, S., Oberg, T. (1999). Relaxed versus activated stump
muscles during casting for tran-tibial prostheses. Prosthet Orthot Int. 23:13–
20.
107. Lilja, M., Oberg, T. (1995). Volumetric determinations with CAD/ CAM in
prosthetics and orthotics: Errors of measurement. J Rehabil Res Dev.
32(2),141–48.
108. Lilja, M., Oberg, T. (1997). Proper time for definitive transtibial prosthetic
fitting. J Prosthet Orthot. 9(2), 90–95.
109. Lin, Y.P., Wang, C.T., Dai. K.R. (2005). Reverse engineering in CAD model
reconstruction of customized artificial joint‖, Medical engineering and
physics, 27(2), 189-193.
110. Linde, H.V.D., Hofstad, C.J., Geurts, A.C.H, Postema, K., Geertzen, J.H.B.,
Limbeek JV. (2004). A systematic literature review of the effect of different
prosthetic components on human functioning with a lower- limb prosthesis.
Journal of Rehabilitation Research & Development. 41(4), 555-570.
111. Linlin, Zhang, Ming Zhu, Ling Shen, Feng Zheng (2013). Finite Element
Analysis of the Contact Interface Between Trans-femoral Stump and
Prosthetic Socket, 35th Annual International Conference of the IEEE EMBS
Osaka, Japan, 3 – 7 July,
112. Lyon, C.C., Kulkarni, J, Zimerson, E., Van Ross, E., Beck, M.H. (2000).
Skin disorders in amputees. Journal of the American Academy of
Dermatology. 42(3), 501-507.
113. Mak, A.F.T., Zhang, M., Boone, D.A. (2001). State-of-the-art research in
lower-limb prosthetic biomechanics-socket interface, Journal of Rehabilitation
Research and Development, 38(2), 161-174.
114. McGarry, T, McHugh, B, Buis, A, McKay, G. (2008). Evaluation of the
effect of shape on a contemporary CAD system. Prosthet Orthot Int.; 32(2),
145–54.

References 165
115. McGarry, T., McHugh, B. (2005). Evaluation of a Contemporary CAD/CAM
System, Prosthetics & Orthotics International 29(3), 221.
116. Michael, J.W. (1986). Upper limb powered components-current concepts.
Clin Prosthet Orthot, 10:66-74.
117. Montgomery, John, T., Meagan, R. Vaughan, Richard, H. Crawford (2010).
Design of an actively actuated prosthetic socket. Rapid Prototyping Journal,
16(3), 194-201.
118. Moo, E.K., Abu Osman, N.A., Pingguan-Murphy, B., Wan Abas, W.A.B.,
Spence, W.D., Solomonidis, S.E., (2009). Interface pressure profile analysis
for patellar tendon-bearing socket and hydrostatic socket, Acta of
Bioengineering and Biomechanics, 11(4), 37-43.
119. Muir, M. (2013). Multidisciplinary optimisation of a business jet main exit
door hinge for production by additive manufacturing. In The 8th UK Altair
Technology Conference.
120. Muller, M, Staats, TB, Leach, M, Fothergill, I. (2007). Total surface bearing
transtibial socket design impression techniques. J Proc. Available
at http://www.oandp.org/publications/jop/2007/2007-49.asp.
121. Murdoch, G., Bennett, W. A. (1996). Amputation: Surgical Practice and
Patient Management. Boston: Butterworth-Heinemann.
122. Murphy, E.F., Wilson, A.B. (1962). Anatomical and physiological
considerations in below-knee prosthetics, Artificial Limbs, 6(2), 4-15.
123. Nawijn, S.E, van der Linde, H., Emmelot, C.H. Hofstad C.J. (2005): Stump
management after transtibial amputation: A systematic review. Prosthetics &
Orthotics International, 29(1), 13-26.
124. Neumann, E.S., Brink, J., Yalamanchili, K., Lee, J.S. (2013). Regression
estimates of pressure on transtibial residual limbs using load cell
measurements of the forces and moments occurring at the base of the socket.
Journal of Prosthetics and Orthotics. 25(1), 1–12.
125. Ng, P, Lee, P.S.V., Goh, J.C.H. (2002). Prosthetic sockets fabrication using
rapid prototyping technology. Rapid Prototyping Journal, 8 (1), 53 – 59.
126. Nicholas, P.F., Brian, J.S., Carolyn, C.S., Richard, R.N. (2009). Topology
optimization and freeform fabrication framework for developing prosthetic

References 166
feet 20th Annual International Solid Freeform Fabrication Symposium.
University of Texas at Austin, pp. 607-619.
127. Nielsen, C.C. (1991). A survey of amputees: functional level and life
satisfaction, information needs, and the prosthetist‘s role. J Prosthet Orthot;
3(3), 125–130.
128. Novicov, A., Foort, J. (1982). Computer aided socket design for amputees.
ConfBiosteriometrics-82, Appendix 5, University of British Columbia,
Vancouver, Canada, 1-4.
129. Oberg K, Kofman, J, Karisson, A, Lindström, B, Siglad, G. (1989). The
CAPOD system—A Scandinavian CAD/CAM system for prosthetic sockets.
J Prosthet Orthot. 1(3), 139–48.
130. Oberg, T., Lilja, M., Johansson, T., Karsznia, A. (1993). Clinical Evaluation
of Trans-tibial Prosthesis Sockets: Comparison between CAD CAM and
Conventionally Produced Sockets, Prosthetics and orthotics International
17:164.
131. Pandey, R., Pattanaik, L.N. (2014). A fuzzy QFD approach to implement
reverse engineering in prosthetic socket development. Int. J. Industrial and
Systems Engineering, 17(1), 1-14.
132. Peters, E.J., Lipsky, B.A., Aragon-Sanchez, J. (2016). Interventions in the
management of infection in the foot in diabetes: a systematic review,
Diabetes Metabolism Res Reviews, 32(1), 145-153.
133. Pilkey W. D., Formulas for Stress, Strain, and Structural Matrices. New
York: Wiley, 1994.
134. Poeggel, S., Tosi, D., Duraibabu, D., Leen, G., McGrath, D., Lewis,
E. (2015). Optical fibre pressure sensors in medical applications. Sensors,
15, 17115–17148.
135. Polliack AA, Craig DD, Sieh RC, Landsberger S, Mcneal DR. (2002).
Laboratory and clinical tests of a prototype pressure sensor for 166odellin
assessment of prosthetic socket fit. Prosthet Orthot Int. 26(1), 23-34.
136. Portnoy, S., Kristal, A., Gefen, A., Siev-Ner, I. (2012). Outdoor dynamic
subject-specific evaluation of internal stresses in the residual limb: Hydraulic
References 167
energy-stored prosthetic foot compared to conventional energy-stored
prosthetic feet, Gait Posture, 35(1), 121-125.
137. Portnoy, S., Siev-Ner, I., Yizhar, Z. (2009). Surgical and Morphological
Factors that Affect Internal Mechanical Loads in Soft Tissues of the
Transtibial Residuum, Annals of Biomedical Engineering, 37(12), 2583-2605.
138. Portnoy, S., Yarnitzky, G., Yizhar, Z., Kristal, A., Oppenheim, U., Siev-Ner,
I., Gefen, A. (2007). Real-time patient-specific finite element analysis of
internal stresses in the soft tissues of a residual limb: A new tool for
prosthetic fitting, Annals of Biomedical Engineering, 35(1), 120–135.
139. Powelson, T., Yang, J. (2012). Literature review of prosthetics for transtibial
amputees, Int. J. Biomechatronics and Biomedical Robotics, 2(1), 50-64.
140. Qin, S. F., Prieto, P. A., Wright, D. K. (2008). A Novel Form Design and
CAD Modelling Approach, Elsevier, Computer in Industry 59(4), 364-369.
141. Radcliffe, C. W., and J. Foort (1961). The patellar-tendon-bearing below-
knee prosthesis, Biomechanics Laboratory, University of California (Berkeley
and San Francisco).
142. Radcliffe, C.M., Johnson N.C., Foort, J. (1957). Some experiences with
prosthetic problems of above-knee amputees. Artif Limbs; spring; 41-75.
143. Rajtukova, V., Hudak, R., Zivcak, J., Halfarova, P., and Kudrikova, R.
(2014). Pressure Distribution in Transtibial Prostheses Socket and the Stump
Interface. Procedia Engineering. 96, 374 – 381.
144. Roark R. J.and Young W. C., Formulas for Stress and Strain.New York:
McGraw-Hill, 1975.
145. Rogers, B., Bosker, G. W., Crawford, R. H., Faustini, M. C., Neptune, R.R.,
Walden, G., and Gitter, A. J., (2007). ―Advanced trans-tibial socket fabrication
using selective laser sintering‖. Prosthetics and Orthotics International, 31(1),
88-100.
146. Rogers, B., Stephens, S., Gitter, A., Bosker, G. Crawford, R. (2000). Double-
wall, transtibial prosthetic socket fabricated using selective laser sintering: a
case study. J Prosthet Orthot 12(3), 97 – 100.
References 168
147. Rovick, J. (1992). An additive fabrication technique for the computer-aided
manufacturing of sockets. 7th World Congress of the International Society for
Prosthetics and Orthotics, Chicago, IL.
148. Rovick, J., Chan, R., Van Vorhis, R., Childress, D. (1992). Computer-aided
manufacturing in prosthetics: Various possibilities using industrial
equipment. In Proceedings of the 7th World Congress of the International
Society for Prosthetics and Orthotics.
149. Ryait, H.S., Arora, A.S., Agarwal, R. (2012). Realisation of SEMG-based
multi- functional prototype elbow prosthesis, Int. J. Biomedical Engineering
and Technology, 9(1), 72-87.
150. Safari, M.R., Tafti, N., Aminian, G. (2015). Socket interface pressure and
amputee reported outcomes for comfortable and uncomfortable conditions
of patellar tendon bearing socket: A pilot study. Assist. Technol. 27(1),
24–31.
151. Sagawa, Y., Turcot, K., Armand, S., Thevenon, A., Vuillerme, N., Watelain,
E. (2011). Biomechanics and physiological parameters during gait in lower-
limb amputees: a systematic review, Gait Posture, 33(4), 511–26.
152. Sander, J.E., (1995). Interface mechanics in external prosthetics: review of
interface stress measurement techniques, Medical and biological engineering
and computing, 33(4), 509-516.
153. Sanders JE, Daly CH, Burgess EM. (1992). Interface shear stresses during
ambulation with a prosthetic limb. Journal of Rehabilitation Research and
Development. 29(4), 1-8.
154. Sanders, J.E. (2007). CAD/CAM transtibial prosthetic sockets from central
fabrication facilities: how accurate are they? Journal of Rehabilitation
Research and Development 44(3), 395-405.
155. Sanders, J.E., Daly, C.H. (1993). Normal and shear stresses on a residual
limb in a prosthetic socket during ambulation: comparison of finite element
results with experimental measurements. Journal of Rehabilitation Research
and Development, 30(2), 191–204.

References 169
156. Sanders, J.E., Fatone, S. (2011). Residual limb volume change: systematic
review of measurement and management, Journal of Rehabilitation Research
and Development, 48(8), 949–986.
157. Sanders, J.E., Lam, D., Dralle, A., Okumura, R., 1997, Interface pressures
and shear stresses at thirteen socket sites on two persons with transtibial
amputation, Journal of Rehabilitation, Research and Development , 34(1),
19-43.
158. Sanders, J.E., Lam, D., Dralle, A.J. and Okumura, R. (1997). Interface
pressures and shear stresses at thirteen socket sites on two persons with
transtibial amputation. Journal of Rehabilitation Research and Development.
34(1), 19–43.
159. Sanders, J.E., Lee, GS. (2008). A means to accommodate residual limb
movement during optical scanning: A technical note. IEEE Trans Neural
Syst Rehabil Eng. 16(5), 505–519.
160. Sanders, J.E., Rogers E.L., Sorenson, E.A., Lee, G.S. (2007). Abrahamson.
CAD/CAM trans-tibial prosthetic sockets from central fabrication facilities:
how accurate are they? J. Rehabil. Res. Dev. 44 (3), 395–405,
161. Sanders, J.E., Severance, M.R., Myers, T.R., Ciol, M.A. (2011). Central
fabrication: carved positive assessment. Prosthet Orthot Int. 35(1):81–89.
162. Sanders, J.E., Zachariah, S.G., Jacobsen, A.K. and Fergason, J.R. (2005).
Changes in interface pressures and shear stresses over time on transtibial
amputee subjects ambulating with prosthetic limbs: comparison of diurnal
and six-month differences. Journal of Biomechanics. 38(8):1566–1573.
163. Sang, Y., Li, X., Luo, Y. (2016). Biomechanical design considerations for
transradial prosthetic interface: A review, Proceedings of the Institution of
Mechanical Engineers, Part H: Journal of Engineering in Medicine, 230(3),
239-250.
164. Saunders, C.G., Foort, J., Bannon, M., Dean, D., Panych, L. (1985). Computer
aided design of prosthetic sockets for belowknee amputees. Prosthetics and
Orthotics International, 9, 17-22.
165. Sayed, A.M.E., Hamzaid, N.A., Kenneth Tan, Y.S., Abu Osman, NA. (2015)
Detection of Prosthetic Knee Movement Phases via In-Socket Sensors: A
References 170
Feasibility Study, Hindawi Publishing Corporation the Scientific World
Journal, 923286, 13 pages.
166. Schreiner, R.E., Sanders, J.E. (1995). A silhouetting shape sensor for the
residual limb of a below-knee amputee. IEEE Trans Rehabil Eng., 3(3), 242–
53.
167. Selles, R.W., Janssens, P.J., Jongenengel, C.D., Bussmann, J.B. (2005). A
randomized controlled trial comparing functional outcome and cost
efficiency of a total surface-bearing socket versus a conventional patellar
tendon-bearing socket in transtibial amputees, Archives of Physical Medicine
& Rehabilitation, 86(1),154-161.
168. Sengeh, D.M., Herr, H. A. (2013). Variable- impedance prosthetic socket for
a transtibial amputee designed from magnetic resonance imaging data. JPO:
Journal of Prosthetics and Orthotics, 25(3), 129-137.
169. Sewell, P., Noroozi, S., Vinney, J., Amali, R. (2012). Andrews S. Static and
dynamic pressure prediction for prosthetic socket fitting assessment utilising
an inverse problem approach. Artificial Intelligence in Medicine, 54(1), 29–
41.
170. Seymour, N., (2002). Transtibial components-Clinical decision making,
prosthics and orthotics, SUNY upstate medical university, Syracuse, New
york, 8, 175-208.
171. Shankar, S., Manikandan, M., Kalayarasan, M. (2014). Dynamic contact
analysis of total hip prosthesis during the normal active walking cycle,
Int. J. Biomedical Engineering and Technology, 15(2), 114-127.
172. Shankar, S., Prakash, L., Kalayarasan, M. (2013). Finite element analysis of
different contact bearing couples for human hip prosthesis, Int. J. Biomedical
Engineering and Technology, 11(1), 66-80.
173. Shrivastava, P., Pavri, K. (2015). Frontal Plane Analysis At Knee In
Transtibial Amputation. International Journal of Pharma and Bio Sciences;
6(2), 595 – 601.
174. Silver-Thorn, M.B., Steege, J.W., Childress, D.S. (1996). A review of
prosthetic interface stress investigations, Journal of Rehabilitation Research
and Development, 33(3), 253–266.
References 171
175. Singh R, Hunter J, Philip A. (2007). Fluid collections in amputee stumps: A
common phenomenon. Arch Phys Med Rehabil. 88(5), 661–63.
176. Smith, D., Burgess, E.M., The use of CAD/CAM technology in prosthetics
and Orthotics Current clinical models and a view to the future, Journal of
Rehabilitation Research & Development. 38(3), 327-334.
177. Smith, E.J., Anstey, J.A., Venne, G, Ellis, R.E. (2013). Using additive
manufacturing in accuracy evaluation of reconstructions from computed
tomography, Proceedings of the Institution of Mechanical Engineers, Part H:
Journal of Engineering in Medicine, 227(5), 551-559.
178. Smith, K.E., Commean, P.K., Bhatia, G., Vannier, M.W. (1995). Validation
of spiral CT and optical surface scanning for lower limb stump volumetry.
Prosthet Orthot Int. 19(2), 97–107.
179. Smith, K.E., Commean, P.K., Robertson, D.D., Pilgram, T., Mueller, M.J.
(2001). Precision and accuracy of computed tomography foot measurements,
Arch Phys Med Rehabil, 82(7), 925-9.
180. Smith, K.E., Commean, P.K., Vannier, M.W. (1996). In vivo 3D
measurement of soft tissue change due to lower limb prostheses using spiral
computed tomography. Radiology 200, 843–850.
181. Smith, K.E., Vannier, M.W., Commean, P.K. (1995). Spiral CT volumetry of
below knee residua. IEEE Trans. Rehabil. Eng. 3(3), 235–241.
182. Song, B., Dong, S., Deng, S., Liao, H., Coddet, C. (2014). Microstructure
and tensile properties of iron parts fabricated by selective laser melting.
Optics & Laser Technology, 56, 451-460.
183. Spaeth, J.P. (2006). Laser imaging and computer-aided design and computer-
aided manufacturing in prosthetics and Orthotics, Physical medicine and
rehabilition clinic of north America 17(1), 245-263.
184. Staats, T.B., Lundt, J. (1987). The UCLA total surface bearing suction
below-knee prosthesis, Clinical Prosthetics and Orthotics, 11(3), 118-130.
185. Steege, J.W., Scnur, D.S. (1987). Finite element analysis as a method of
pressure prediction at the below knee socket interface. In: Proceedings of
RESNA 10th Annual Conference, California, 814–816.

References 172
186. Steege, J.W., Scnur, D.S., Childress, D.S. (1987). Prediction of pressure at
the below knee socket interface by finite element analysis. In: ASME
Symposium on the Biomechanics of Normal and Pathological Gait, Boston,
BED 4, 39–43.
187. Steege, M.B.J.W., Childress, D.S. (1996). A review of prosthetic interface
stress investigations, Journal of Rehabilitation Research and Development,
33(3), 253-266.
188. Stefanescu, D.M. (2011). Wheatstone bridge-the basic circuit for strain
gauge force transducers. In Handbook of Force Transducers; Springer:
Berlin, Germany, 347–360.
189. Tay, F.E., Manna, M.A., Liu, L.X. (2002). A CASD/ CASM method for
prosthetic socket fabrication using the FDM technology, Rapid Prototyping
Journal 8(4), 258-262.
190. Tiwana, M.I., Redmond, S. J., Lovell, N. H. (2012). A review of tactile
sensing technologies with applications in biomedical engineering. Sens.
Actuators A Phys. 179, 17–31.
191. Tomlin, M., Meyer, J. (2011). Topology optimization of an additive layer
manufactured (alm) aerospace part. In The 7th Altair CAE Technology
Conference, Gaydon.
192. Torres Moreno, R., Lemaire, E.D., Wood, I.R., Vazquezvela Sanchez, E.,
Martel, G.G., Morrison, J.B., Daly, C.H. (1995). The evolution of C A D / C
A M technology in the design and manufacture of lower limb prosthetic
sockets. Revista de la Sociedad Mexicana de Medicina Fisica y
Rehabilitation 7 (4), 85-100.
193. Turner-Smith, A. (1997). Structured light surface measurement techniques,‖
Orr J, Shelton J. Optical measurement methods in biomechanics. Germany:
Chapman & Hall, 39-58.
194. Tzeng, M.J., Hsu, L.H., Chang, S.H. (2015). Development and evaluation of
a CAD/3DP process for transtibial socket fabrication, Biomedical engineering:
applications, basis and communications 27(5), 1550044.
References 173
195. Vannier, M.W., Commean, P.K., Smith, K.E. (1997). Three-dimensional
lower- limb residual measurement systems error analysis, Journal of
Prosthetics & Orthotics 9:67.
196. Varady, T., Martin, R.R., Cox, J. (1997). Reverse Engineering of Geometric
Models – an Introduction, Computer-aided Design 29(4), 255.
197. Villalpando, L., Eiliat, H., Urbanic, R. (2014). An optimization approach for
components built by fused deposition 173odelling with parametric internal
structures. 17, 800–805.
198. Webb, S. (1988). The physics of medical imaging, Taylor & Francis.
199. Williams, R.B., Porter, D, Roberts, V.C., Regan, J.F. (1992). Triaxial force
transducer for investigating stresses at the stump/socket interface. Med Biol
Eng Comput 30(1), 89-96.
200. Wilson, A., Schuch, C., Nitschke, R. (1987). A variable volume socket for
below-knee prostheses. Clin Prosthet Orthot. 11(1), 11–19.
201. Wilson, A.B. (1989). Limb Prosthetics. New York: Demos Medical Pub.
202. Winarski, D.J., Pearson, J.R. (1987). Least-square matrix correlations
between stump stress and prosthesis load for below-knee amputees. J.
Biomech. Engng, 109,238- 246.
203. Wu, C.L., Chang, C.H., Hsu, A.T., Lin, C.C., Chen, S.I., Chang, G.L. (2003).
A proposal for the pre-evaluation protocol of below-knee socket design:
integration pain tolerance with finite element analysis. J. Chin. Inst.
Eng. 26(6), 853–860.
204. Yigiter, K., Sener, G., Bayar, K. (2002). Comparison of the effects of
patellar tendon bearing and total surface bearing sockets on prosthetic fit and
rehabilitation‖, Prosthetics and Orthotics International, 26(3), 206-212.
205. Zachariah, S.G., Sanders, J.E. (2000). Finite element estimates of interface
stress in the transtibial prosthesis using gap elements are different form those
using automated contact, Journal of Biomechanics, 33(7), 895–899.
206. Zachariah, S.G., Sanders, J.E. (2001). Standing interface stresses as a
predictor of walking interface stresses in the trans-tibial prosthesis. Prosthet
Orthot Int. 25(1), 34-40.

References 174
207. Zegard, T., Paulino G.H. (2014). GRAND- Ground structure based topology
optimization for arbitray 2D domains using MATLAB. Structural and
Multidisciplinary optimization, 50(5), 861-882.
208. Zhang M, Lord M, Turner-Smith AR, Roberts VC. Development of a
nonlinear finite element modelling of the below-knee prosthetic socket
interface. Med Eng Phys 1995;17(8):559–66.
209. Zhang, M., Arthur, F.T.M., Roberts, V.C. (1998). Finite element modelling
of a residual lower- limb in a prosthetic socket: a survey of the development
in the first decade, Medical Engineering & Physics 20(5), 360–373.
210. Zhang, M., Mak, F.T., Chung, A.I.K, Chung, K.H. MRI investigation of
musculoskeletal action of transfemoral residual limb inside a prosthetic
socket. 1998 Proceedings of the 20th Annual International Conference of the
IEEE Engineering in Medicine and Biology Society. 20:2741Y2743.
211. Zhang, M., Roberts, C. (2000). Comparison of computational analysis with
clinical measurement of stresses on below-knee residual limb in a prosthetic
socket. Medical Engineering & Physics. 22(9), 607–612.
212. Zhang, M., Turner-Smith, A.R., Tanner A and Roberts VC. (1998). Clinical
investigation of the pressure and shear stress on the transtibial stump with a
prosthesis. Medical Engineering & Physics, 20(3), 188–198.
213. Zhang, M., Turner-Smith, Roberts, V.C. and Tanner A. (1996). Frictional
action at lower limb/prosthetic socket interface. Medical Engineering &
Physics. 18(3), 207–214.
214. Ziegler-Graham K., MacKenzie E.J., Ephraim, P.L., Travison, T.G.,
Brookmeyer, R. (2008). Estimating the prevalence of limb loss in the United
States: 2005 to 2050. Arch Phys Med Rehabil, 89(3), 422-429.
Publications 175
PAPERS PUBLISHED/ACCEPTED BASED ON THIS WORK
Peer Reviewed International Journal Publications:
1. Nayak C., Singh A., Chaudhary H., 2017, ―Sensor based transtibial socket
pressure determination using regression analysis and genetic algorithm‖,
Journal of Advanced Manufacturing Systems (under review).
2. Nayak C., Singh A., Chaudhary H., 2017, ―An Investigation on Effects of
Amputee‘s Physiological Parameters on Maximum Pressure developed at the
Prosthetic Socket Interface using Artificial Neural Network‖. Technology
and Health Care. IOS press (Accepted) (Issue not assigned).
3. Nayak C., Singh A., Chaudhary H., 2017, ―Topology Optimization of
Transtibial Prosthesis Socket using Finite Element Analysis‖, International
Journal of Biomedical Engineering and Technology, 24(4):323-337.
4. Nayak C., Singh A., Chaudhary H., Tripathi A., 2016, ―A novel approach for
customized prosthetic socket design‖, Biomedical engineering applications,
basis & communications, 28 (3):1650022 (1-10). DOI 10.4015/S1016237216
500228
5. Nayak C., Singh A., Chaudhary H., 2016, ―Pressure distribution at lower
limb/prosthetic socket interface‖, International Journal of Pharma and Bio
Sciences, 7(3):(B) 1258-1262.
6. Pathak V., Nayak C., Singh A., Chaudhary H., 2016, ―A virtual reverse
engineering methodology for accuracy control of transtibial prosthetic
socket‖, Biomedical engineering applications, basis & communications,
28(4):1650037 (1-9).
7. Pathak V., Nayak C., Singh A., Chaudhary H., 2016, ―An integrated reverse
engineering approach for accuracy control of free- form objects‖, Archive of
Mechanical Engineering, De Gruyter, 63(4):635-651.

Publications 176
International/National Conferences
1. Nayak C., Singh A., Chaudhary H., 2015, ―Mesh Generation From Point
Cloud Data For Transtibial Prosthesis Socket Using Altair Hypermesh‖,
Altair Technology Conference 2015 (I-ATC2015), Modelling &
visualization, July 14-15, Bangalore, India.
2. Nayak C., Singh A., Chaudhary H., 2015, ―Stress analysis of transtibial
prosthetic socket thickness using finite element method‖, Indian Conference
on Applied Mechanics (INCAM), IIT Delhi, 13-15 July 2015.
3. Nayak C., Singh A., Chaudhary H., 2014, ―Customized prosthetic socket
fabrication using 3D scanning and printing‖, International Conference on
Additive Manufacturing, September 1-2, Bangalore, India.
4. Nayak C., Singh A., Chaudhary H., 2014, ―A Review on Stump-Socket
Interface Pressure Distribution‖, National Conference on Bio- Mechanical
Sciences, (NCBMS 2014) March 7-8, Bhubaneswar, India, I.K. International
Publishing House Pvt. Ltd. ISBN: 978-93-82332-86-2: 253-258.
5. Nayak C., Singh A., Chaudhary H., 2013, ―Using Reverse Engineering and
Rapid Prototyping to compare the PTB and TSB Socket Design for lower
limb prosthesis‖, International Conference on Additive Manufacturing,
October 6-7, Bangalore, India.

Publications 177
BRIEF BIO-DATA OF THE AUTHOR
Name : Chitresh Nayak
Date of birth : August 09, 1980
Address for correspondence : Kamal Singh ka Bagh, Nayak Kothi, Gwalior
(Madhya Pradesh) India – 474001
Education:
Degree Discipline Institute Board/
University
Percentage Year
Senior Secondary
PCM Shanti Nikatan School
Hoshangabad
MP Board 61 1998
B.E Mechanical Engineering
SRCEM Gwalior RGPV Bhaopal
73 2002
M.Tech Production Technology
MITS Gwalior RGPV Bhaopal
73.73 2008
Ph.D Mechanical Engineering
Malaviya National Institute of
Technology Jaipur
Autonomous 8.33
(Course work)
Thesis submitted
in Dec 2016
Teaching/Industrial/Research Experience:
University / Institute Duration Post
MNIT, Jaipur, (Rajasthan) January 2013-December 2016
Ph.D. Research Scholar
Amity University, Madhya
Pradesh, Gwalior
July 2012-January
2013
Assistant Professor in Department of
Mechanical & Automation Engineering
Amity University
Rajasthan, Jaipur
August 2008-July
2012
Lecturer/ Sr. Lecturer in Department of
Mechanical & Automation Engineering
Maharana Pratap College of
Technology, Gwalior
August 2007-
August 2008
Lecturer in Department of Mechanical
Engineering
Magnum Steel Plant July 2004-July 2006
Production Engineering
Related Documents