2012
Dec 31, 2015
Delving into VectorVest 7. 2012. Jim Tebay [email protected]. Disclaimer. Although every precaution has been taken in the preparation of this presentation, the author assumes no liability for errors or omissions It is offered without a warranty of any kind, either expressed or implied - PowerPoint PPT Presentation
Welcome message from author
This document is posted to help you gain knowledge. Please leave a comment to let me know what you think about it! Share it to your friends and learn new things together.
Transcript

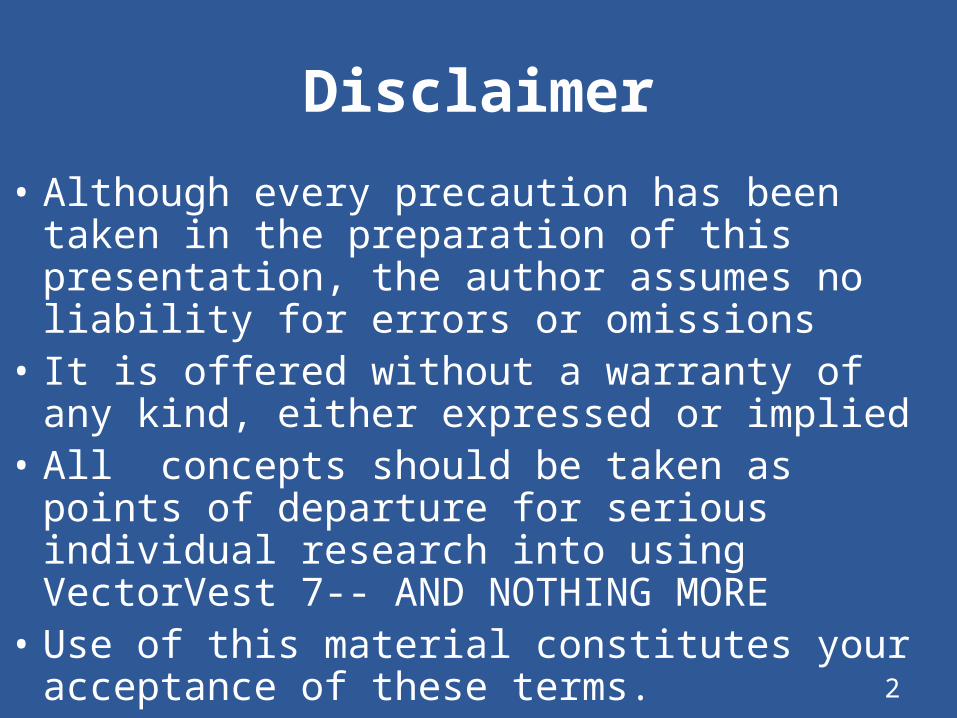
Disclaimer
• Although every precaution has been taken in the preparation of this presentation, the author assumes no liability for errors or omissions
• It is offered without a warranty of any kind, either expressed or implied
• All concepts should be taken as points of departure for serious individual research into using VectorVest 7-- AND NOTHING MORE
• Use of this material constitutes your acceptance of these terms.
2
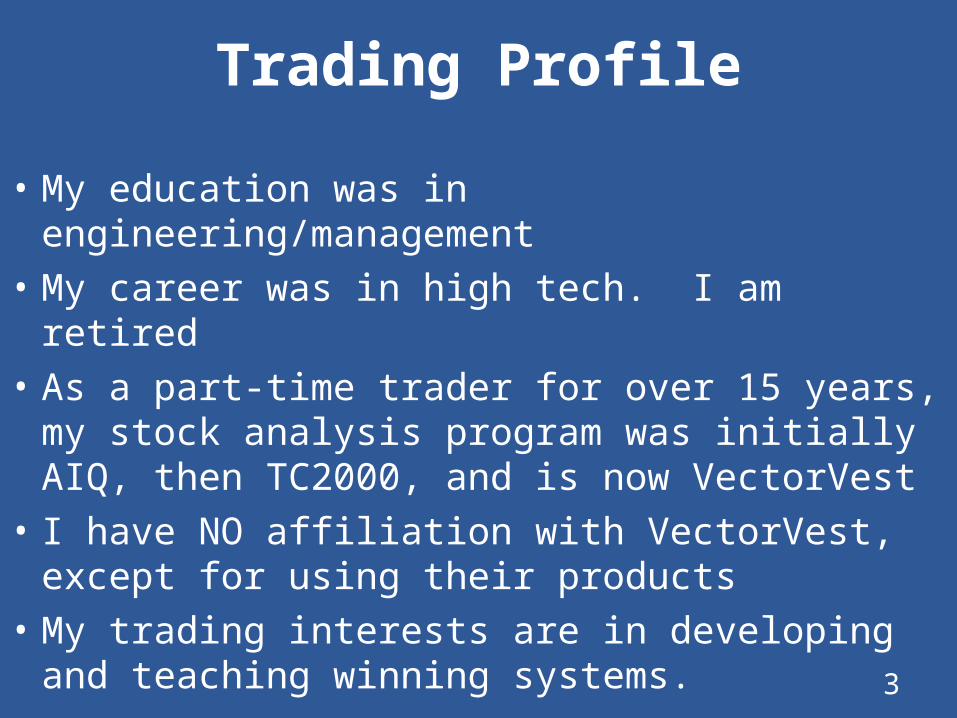
Trading Profile
• My education was in engineering/management
• My career was in high tech. I am retired• As a part-time trader for over 15 years,
my stock analysis program was initially AIQ, then TC2000, and is now VectorVest
• I have NO affiliation with VectorVest, except for using their products
• My trading interests are in developing and teaching winning systems. 3
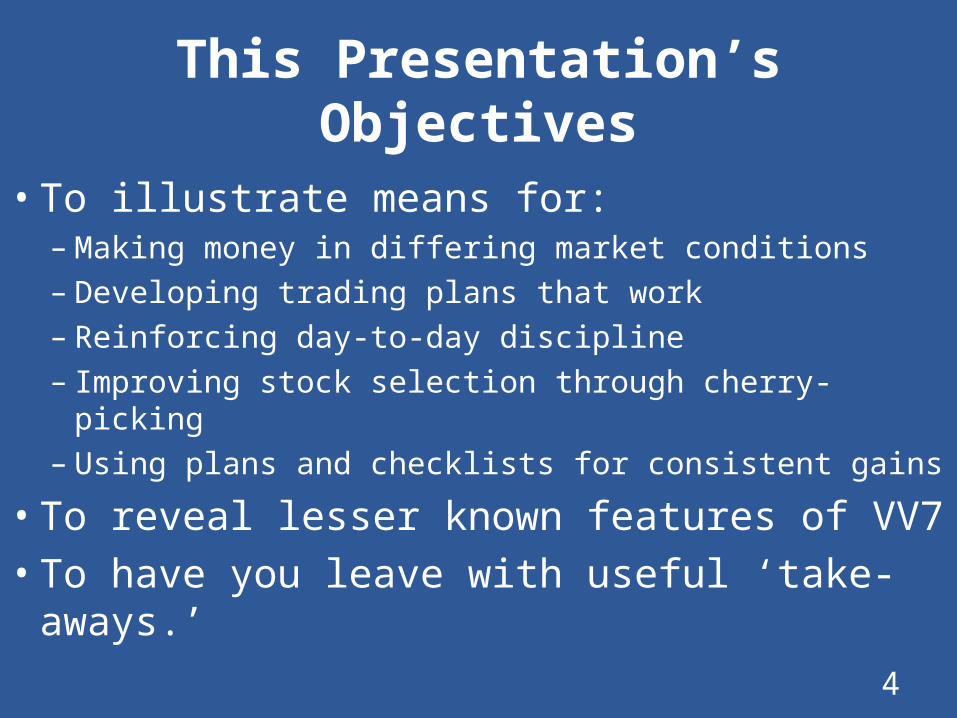
This Presentation’sObjectives
• To illustrate means for:–Making money in differing market conditions– Developing trading plans that work– Reinforcing day-to-day discipline– Improving stock selection through cherry-picking–Using plans and checklists for consistent gains
• To reveal lesser known features of VV7• To have you leave with useful ‘take-
aways.’4

5
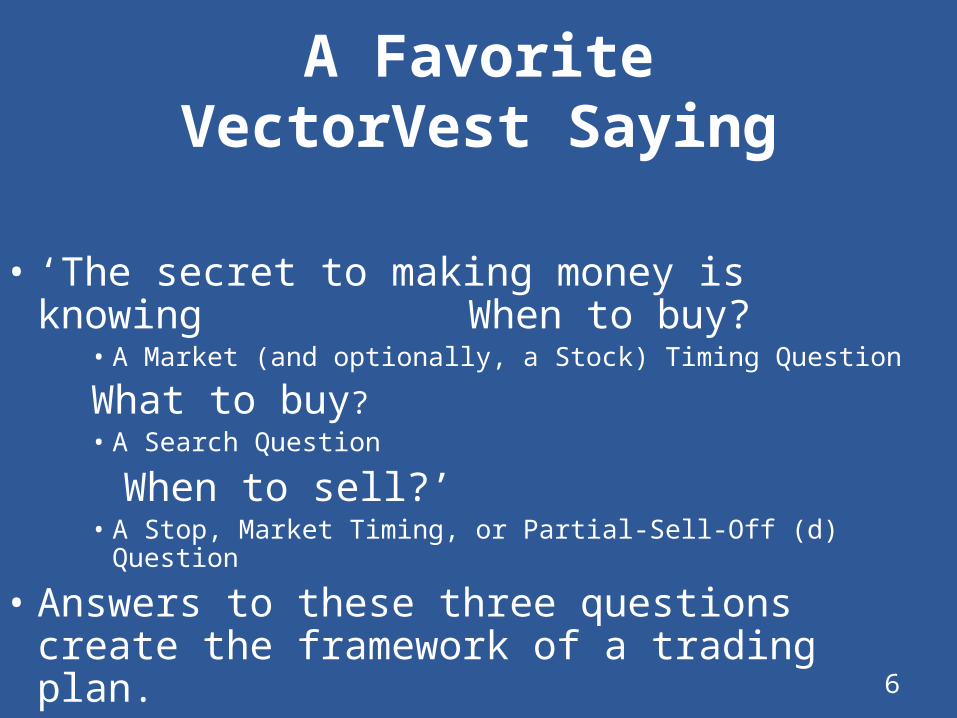
A FavoriteVectorVest Saying
• ‘The secret to making money is knowing When to buy?
• A Market (and optionally, a Stock) Timing Question
What to buy?• A Search Question
When to sell?’• A Stop, Market Timing, or Partial-Sell-Off (d) Question
• Answers to these three questions create the framework of a trading plan.
6

Making the Questions Meaningful
1. When to buy?• At date of (or after) entry signal from one of the
four built-in VectorVest’s market timers or from a custom timer (when timing for an entire portfolio) • And, if used, date of an entry signal from a
stock timer (when timing for an individual position in portfolio)• And, if used, a follow-through from prior day • Specifically, 10 to 10:30 AM Eastern, if
possible• Or, if back testing, at the outset of a specific
look-back period.
7

Questions (Cont)
2. What to buy?• Selected stocks from a built-in or modified
search, or • Selected stocks from Derby Winner searches• Then, from the above, cherry-picked stocks (d)
(see later slides re cherry-picking)
3. When to sell?• At date of exit signal from stop loss and/or
target stop (for individual stocks in portfolio)• Or, a date from standard or custom market
timer (for entire portfolio)• Or, let the portfolio extinguish (as individual
positions get stopped out) • Or, through partial profit-taking (d). 8
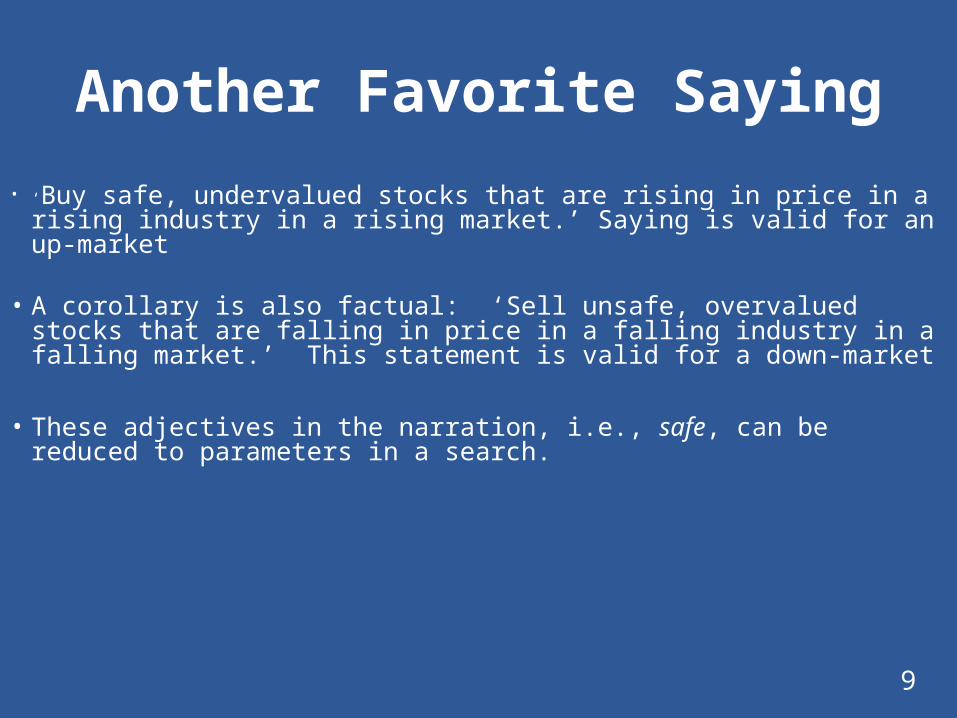
Another Favorite Saying
• ‘Buy safe, undervalued stocks that are rising in price in a rising industry in a rising market.’ Saying is valid for an up-market
• A corollary is also factual: ‘Sell unsafe, overvalued stocks that are falling in price in a falling industry in a falling market.’ This statement is valid for a down-market
• These adjectives in the narration, i.e., safe, can be reduced to parameters in a search.
9
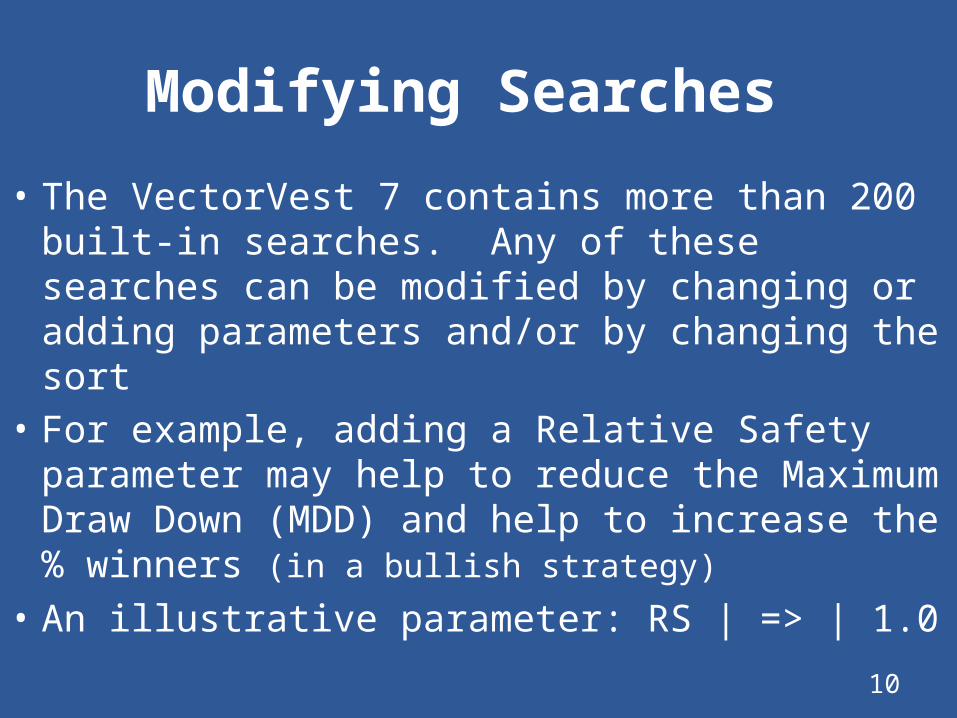
Modifying Searches
• The VectorVest 7 contains more than 200 built-in searches. Any of these searches can be modified by changing or adding parameters and/or by changing the sort
• For example, adding a Relative Safety parameter may help to reduce the Maximum Draw Down (MDD) and help to increase the % winners (in a bullish strategy)
• An illustrative parameter: RS | => | 1.010
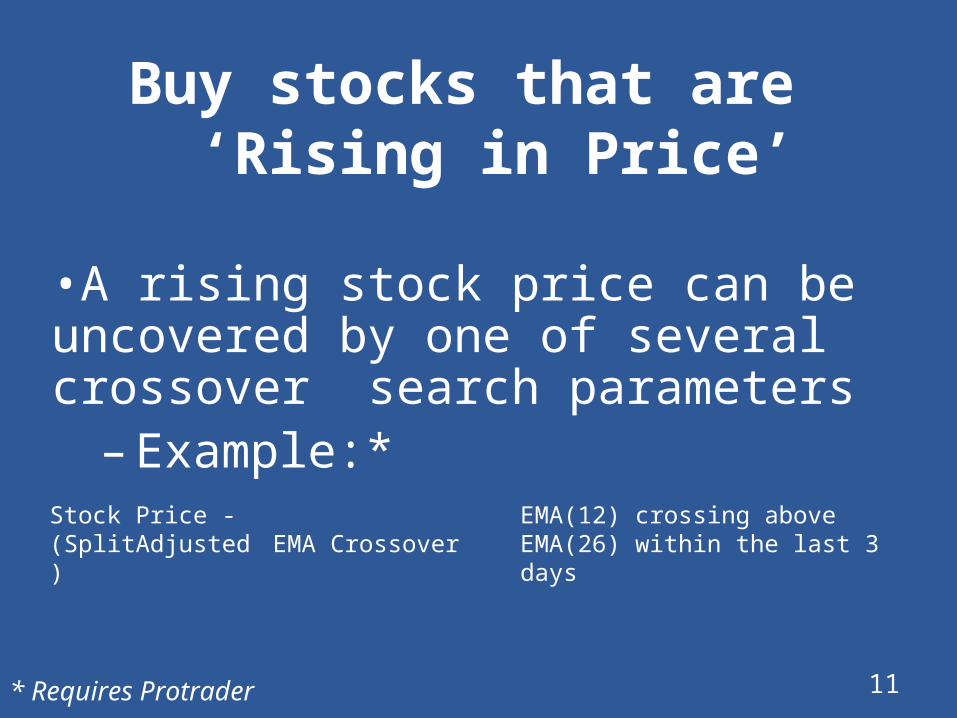
Buy stocks that are ‘Rising in Price’
•A rising stock price can be uncovered by one of several crossover search parameters–Example:*
* Requires Protrader 11
Stock Price -(SplitAdjusted)
EMA CrossoverEMA(12) crossing above EMA(26) within the last 3 days

Buy Stocks that arefrom ‘Rising Industries’
• A rising industry price can be ‘timed’ by using a trending search parameter: Industry Price | Trending | Daily[---++]
• In this example, the industry price started trending up two days ago.
12
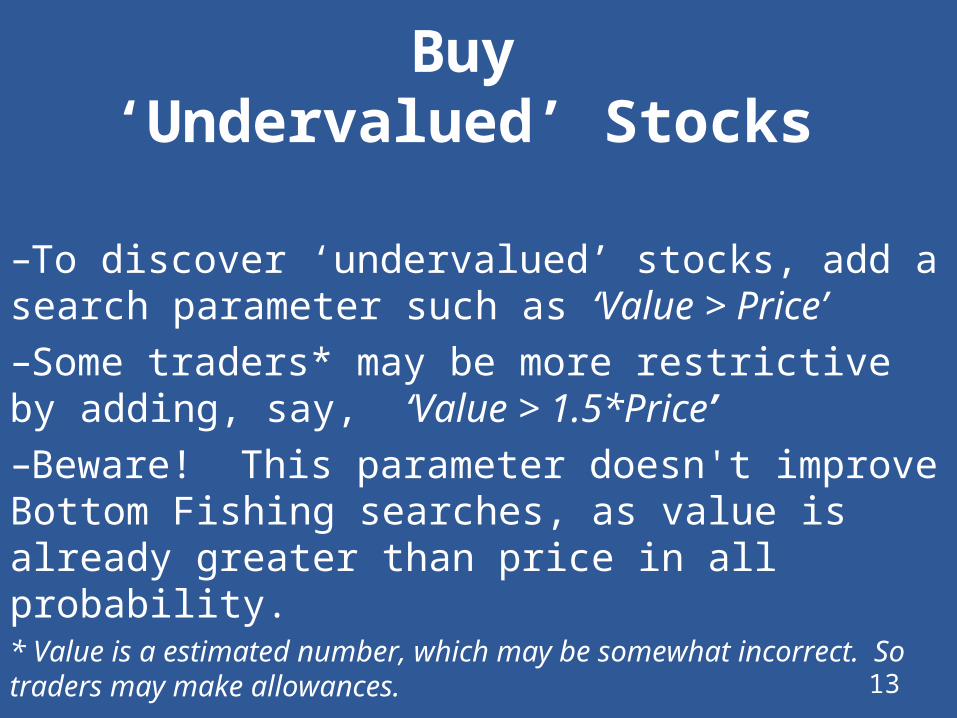
Buy‘Undervalued’ Stocks
–To discover ‘undervalued’ stocks, add a search parameter such as ‘Value > Price’ –Some traders* may be more restrictive by adding, say, ‘Value > 1.5*Price’–Beware! This parameter doesn't improve Bottom Fishing searches, as value is already greater than price in all probability.* Value is a estimated number, which may be somewhat incorrect. So traders may make allowances.
13
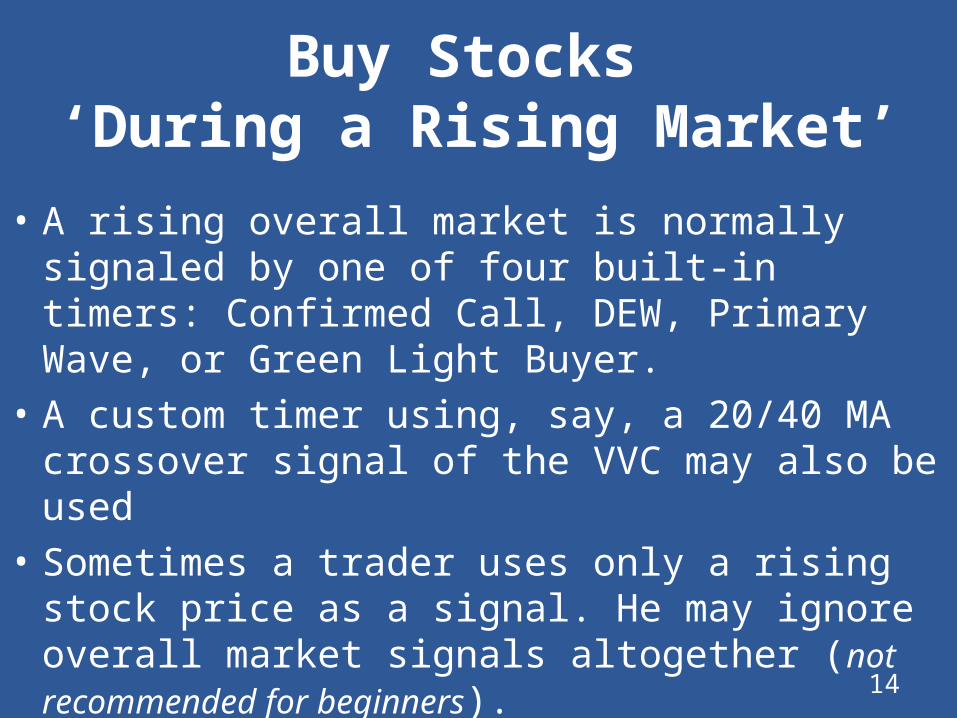
Buy Stocks ‘During a Rising Market’
• A rising overall market is normally signaled by one of four built-in timers: Confirmed Call, DEW, Primary Wave, or Green Light Buyer.
• A custom timer using, say, a 20/40 MA crossover signal of the VVC may also be used
• Sometimes a trader uses only a rising stock price as a signal. He may ignore overall market signals altogether (not recommended for beginners).
14
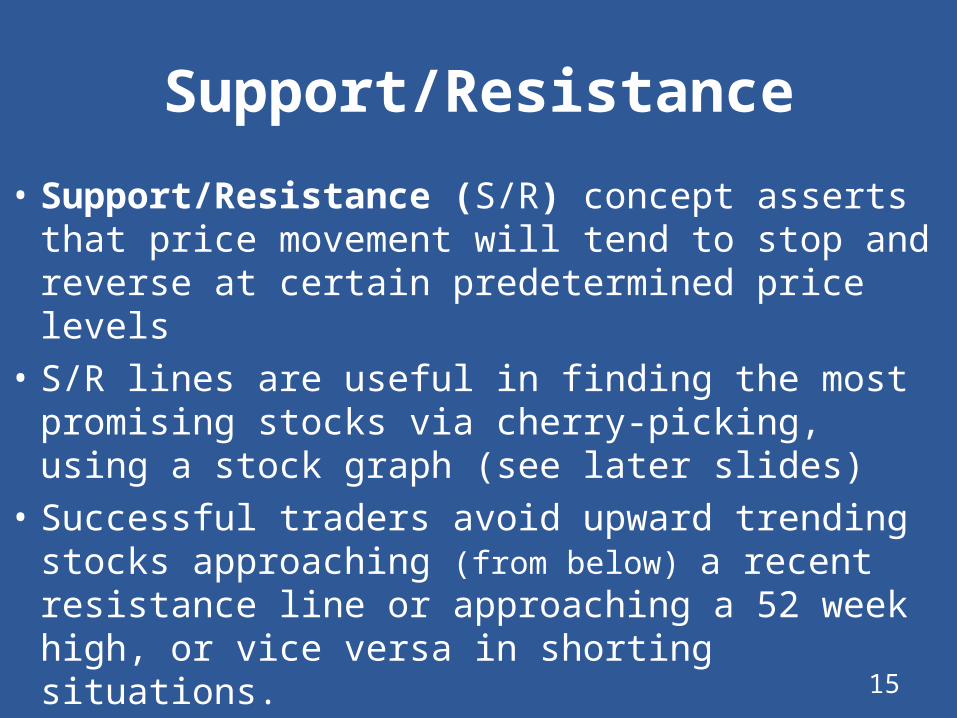
Support/Resistance
• Support/Resistance (S/R) concept asserts that price movement will tend to stop and reverse at certain predetermined price levels
• S/R lines are useful in finding the most promising stocks via cherry-picking, using a stock graph (see later slides)
• Successful traders avoid upward trending stocks approaching (from below) a recent resistance line or approaching a 52 week high, or vice versa in shorting situations. 15
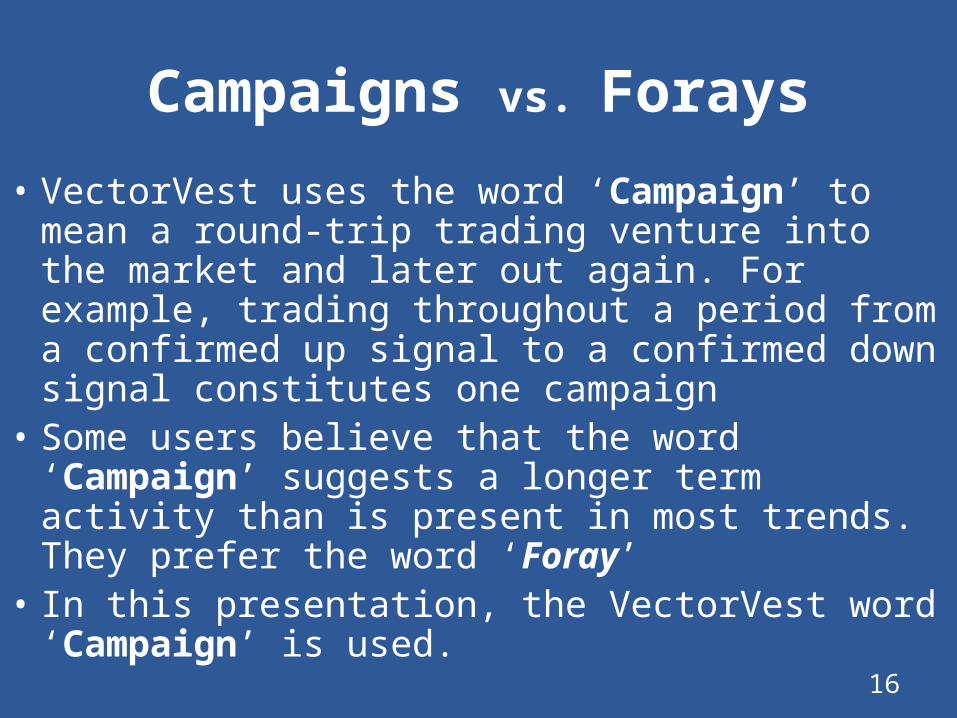
Campaigns vs. Forays
• VectorVest uses the word ‘Campaign’ to mean a round-trip trading venture into the market and later out again. For example, trading throughout a period from a confirmed up signal to a confirmed down signal constitutes one campaign
• Some users believe that the word ‘Campaign’ suggests a longer term activity than is present in most trends. They prefer the word ‘Foray’
• In this presentation, the VectorVest word ‘Campaign’ is used. 16
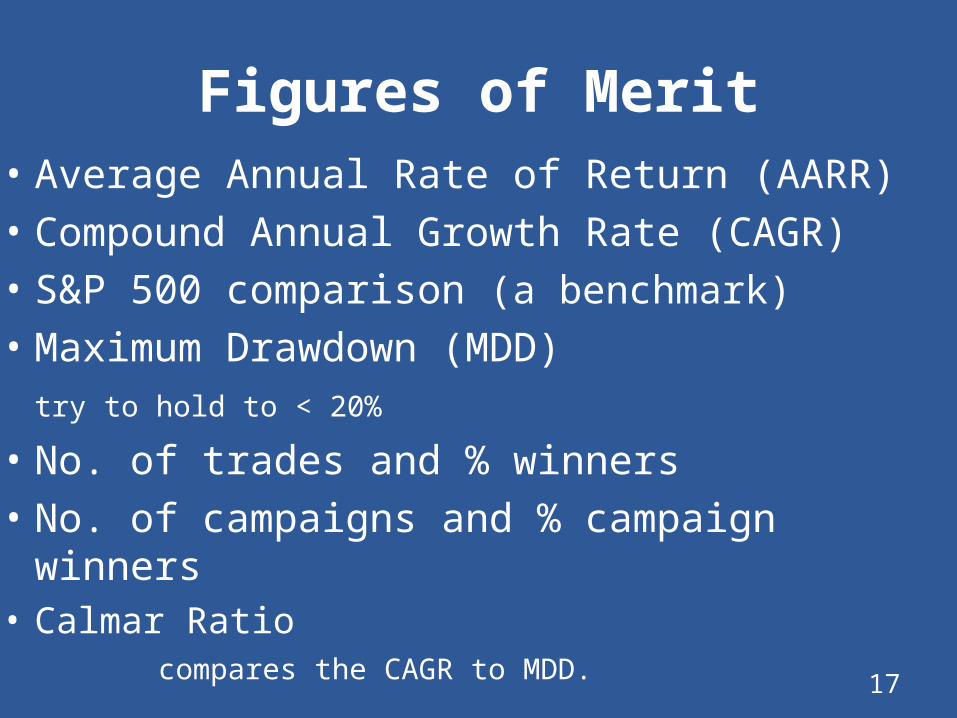
Figures of Merit• Average Annual Rate of Return (AARR)• Compound Annual Growth Rate (CAGR)• S&P 500 comparison (a benchmark)• Maximum Drawdown (MDD)
try to hold to < 20%
• No. of trades and % winners• No. of campaigns and % campaign
winners• Calmar Ratio
compares the CAGR to MDD. 17

S&P 500 Monthly Chartfor 10 Years
18
S&P 500 lost 22% over these 10 years? % in these 10 years
Benchmarks
19
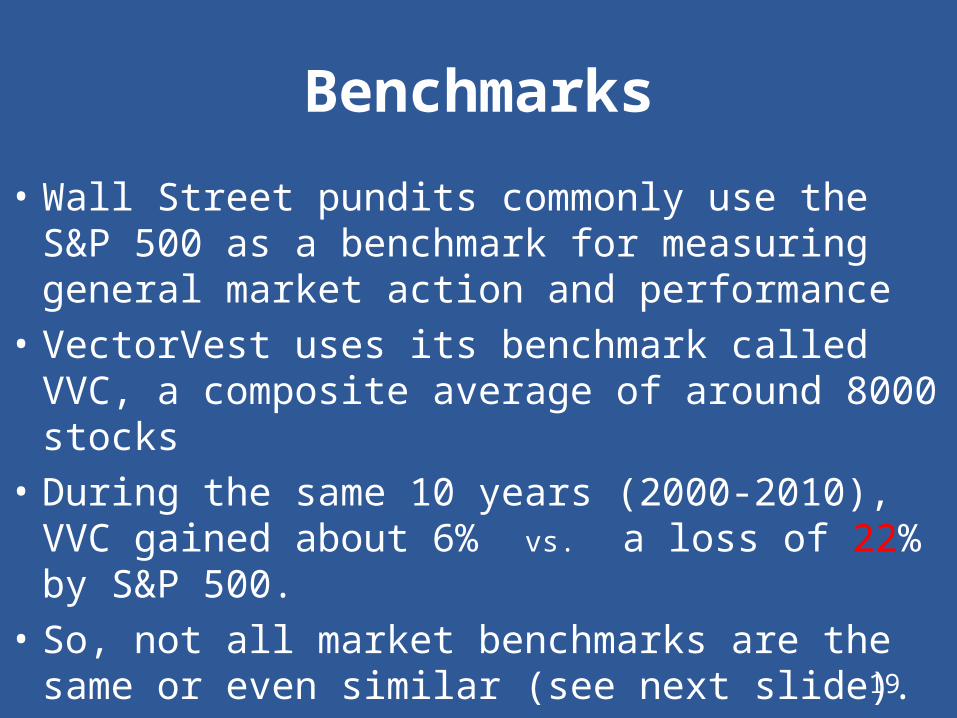
• Wall Street pundits commonly use the S&P 500 as a benchmark for measuring general market action and performance
• VectorVest uses its benchmark called VVC, a composite average of around 8000 stocks
• During the same 10 years (2000-2010), VVC gained about 6% vs. a loss of 22% by S&P 500.
• So, not all market benchmarks are the same or even similar (see next slide).
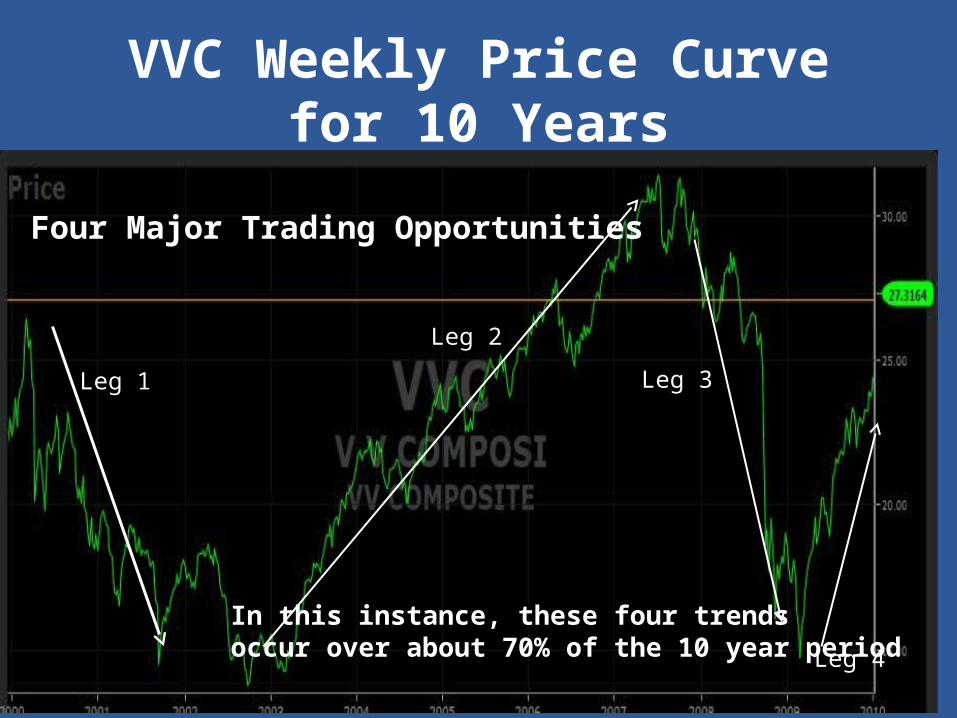
VVC Weekly Price Curvefor 10 Years
20
Four Major Trading Opportunities
Leg 1
Leg 2
Leg 3
Leg 4
In this instance, these four trends occur over about 70% of the 10 year period

Making Moneyin Differing
Market Conditions
For Educational Purposes Only
21

Educational Studies
• The following 4 studies are all conducted automatically using the VectorVest 7 back tester with Autotester and Protrader
• Each leg is displayed on the preceding slide 20. No discretionary actions such as cherry-picking or other important, though manual, trading steps can be done in the automatic mode
• Any VV 7 user can replicate these studies• The testing period dates are chosen to
demon-strate high performances, that is, they are ‘showcased.’ 22
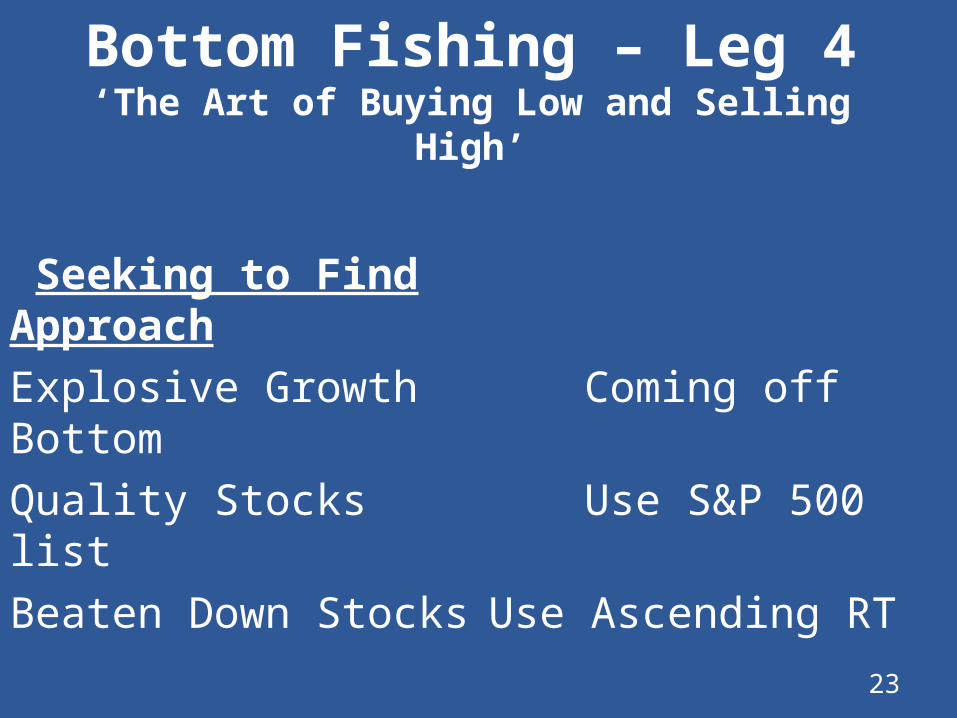
Bottom Fishing – Leg 4‘The Art of Buying Low and Selling
High’
Seeking to Find ApproachExplosive Growth Coming off BottomQuality Stocks Use S&P 500 listBeaten Down Stocks Use Ascending RT
23
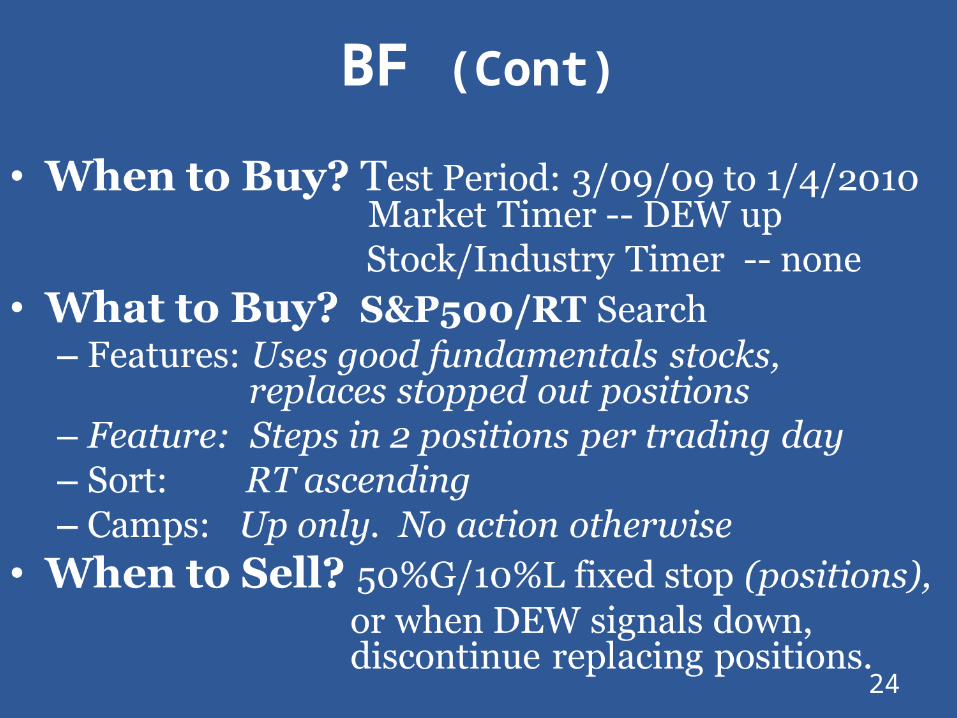
BF (Cont)
24
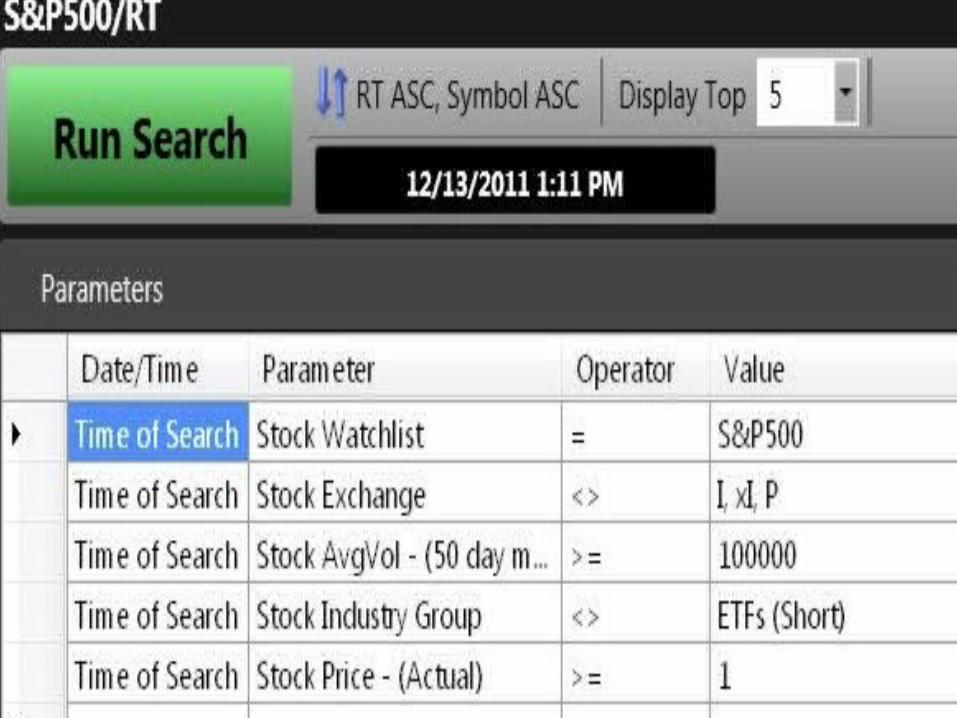
SearchAggressive
1

Bottom Fishing (Cont)
• Results – Explosive!– AARR: 293% – CAGR: 343%– S&P: 79%–No. of Trades & %Winners: 96 64%–No. of Campaigns & %Winners: 11 89%–Maximum drawdown: 14% – Calmar Ratio: 35
* Commissions included but not slippage26
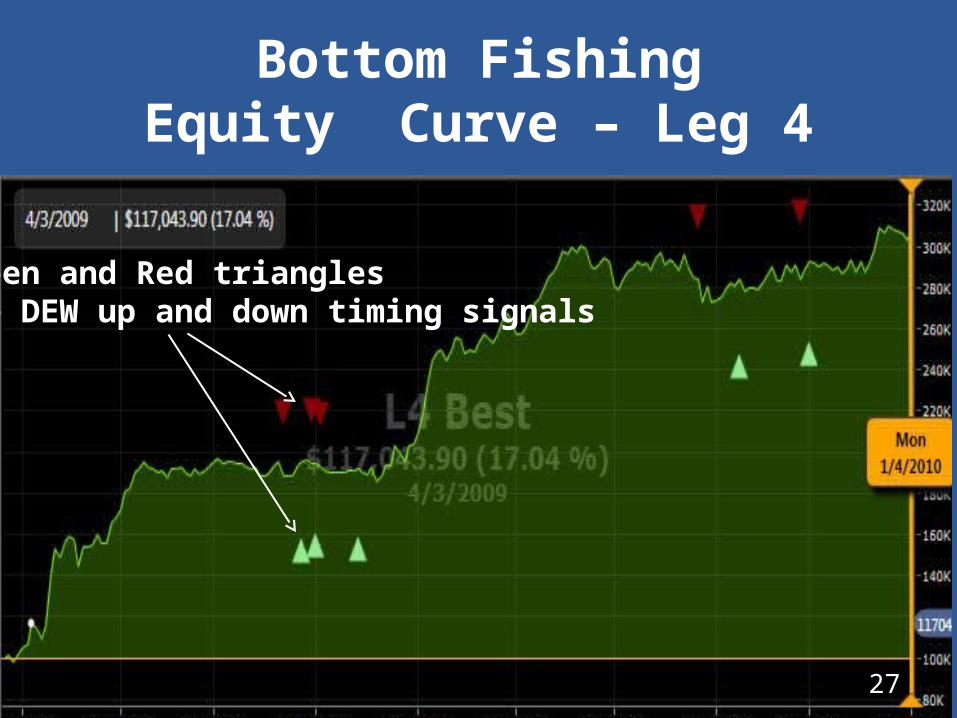
Bottom FishingEquity Curve – Leg 4
27
Green and Red triangles are DEW up and down timing signals

Stock Timing Enhancement
• A stock timing parameter, 1-day MACD Crossover, added to the search, modifies the outcome. It reduces the maximum drawdown (MDD) and increases the % winners, although also reducing the AARR– AARR: 127% – Trade winners: 68%–No of campaigns 11–MDD: 10%– Calmar ratio: 15
28
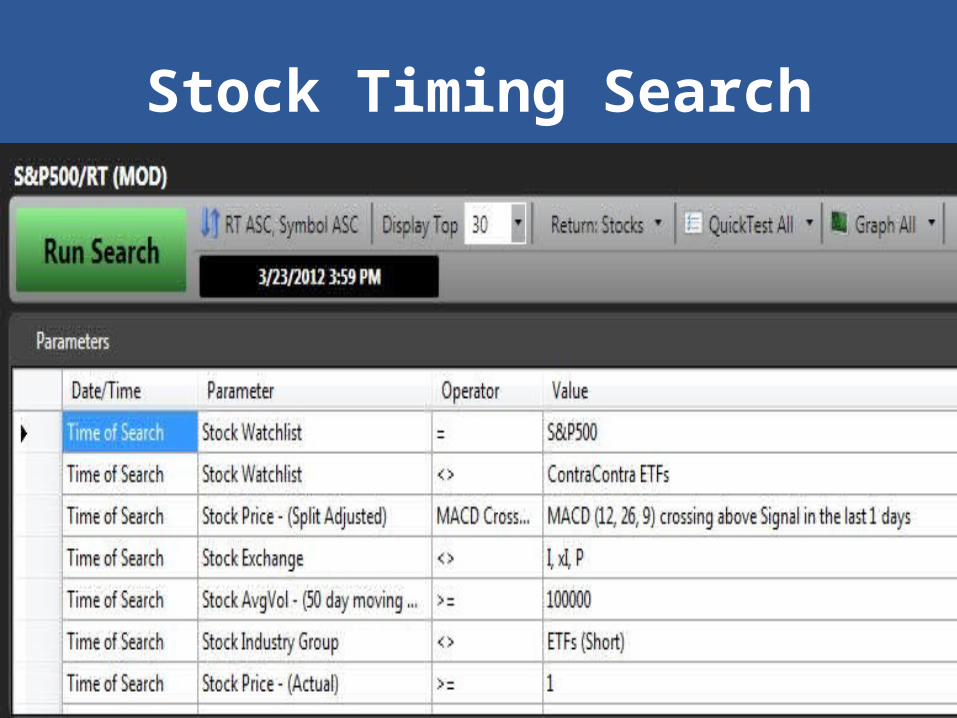
Stock Timing Search
29

Stock TimingEquity Curve
30

RS Study
• As noted in slide 10, adding an RS parameter will generally reduce the MDD and increase %winners. It will also generally reduce profitability
• This study adds RS | >= | 0.9 parameterBasic Study RS Study
AARR %: 313 98CAGR %: 277 92MDD %: 14 10Calmar Ratio: 20 9%Winners: 62 65 31
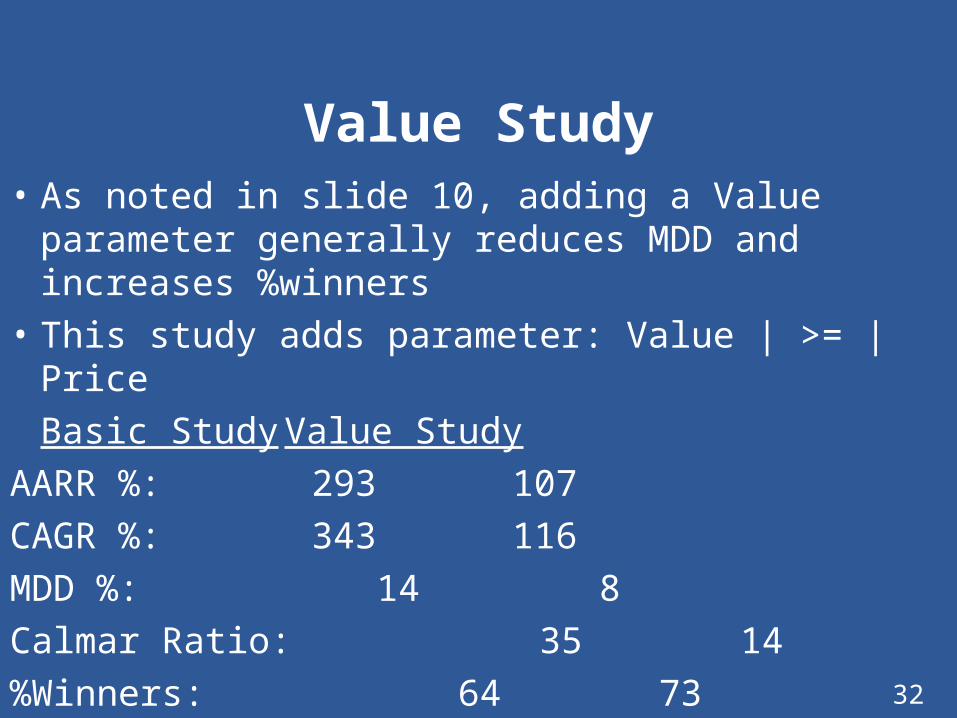
Value Study• As noted in slide 10, adding a Value
parameter generally reduces MDD and increases %winners
• This study adds parameter: Value | >= | Price Basic Study Value Study
AARR %: 293 107CAGR %: 343 116MDD %: 14 8Calmar Ratio: 35 14%Winners: 64 73 32

What’s the Best Timer for BFs?
Timer CAGR(%) MDD(%) Calmar Ratio
C Call 324 14 24DEW 343 14 35PW 219 14 16GLB 70 6 13
Either the Confirmed Call or the DEW timer works well When in doubt, run comparative tests in out-of-sample periods. 33

Optimization via Scientific Method
• The past several slides (pertaining to Stock Timing, Value, Safety, and Market
Timing) illustrate a well-known application of the scientific method
• That is, one variable is tested while all others are held constant
• Caution! Such optimizing may lead to curve fitting (see later slides).
34

Notable Opportunity
• BF strategies are probably the most profitable of all, so a trader should take full advantage of them
• Major* BFs occur about 2 times per year, with the trends typically lasting about 4-6 weeks
• The longest BF trend in recent times was 14 weeks
• In addition, minor BFs occur fairly frequently.
* A major BF starts after the MTI reverses from being near or below 0.6 and the BSR from being near or below 0.2. 35
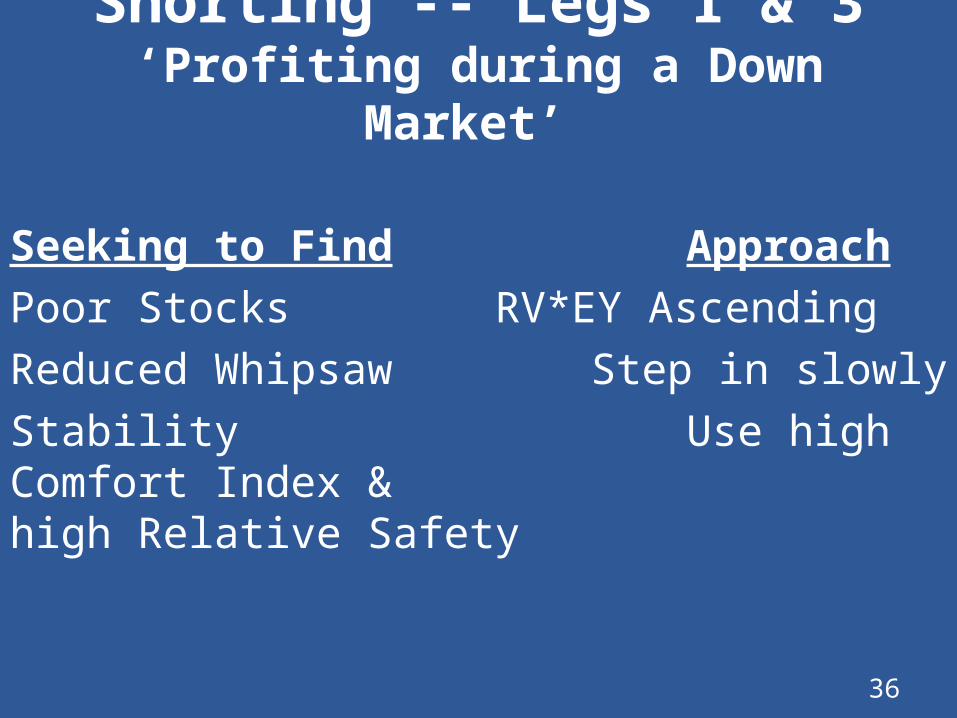
Shorting -- Legs 1 & 3‘Profiting during a Down
Market’
Seeking to Find ApproachPoor Stocks RV*EY AscendingReduced Whipsaw Step in slowlyStability Use high Comfort Index & high Relative Safety
36
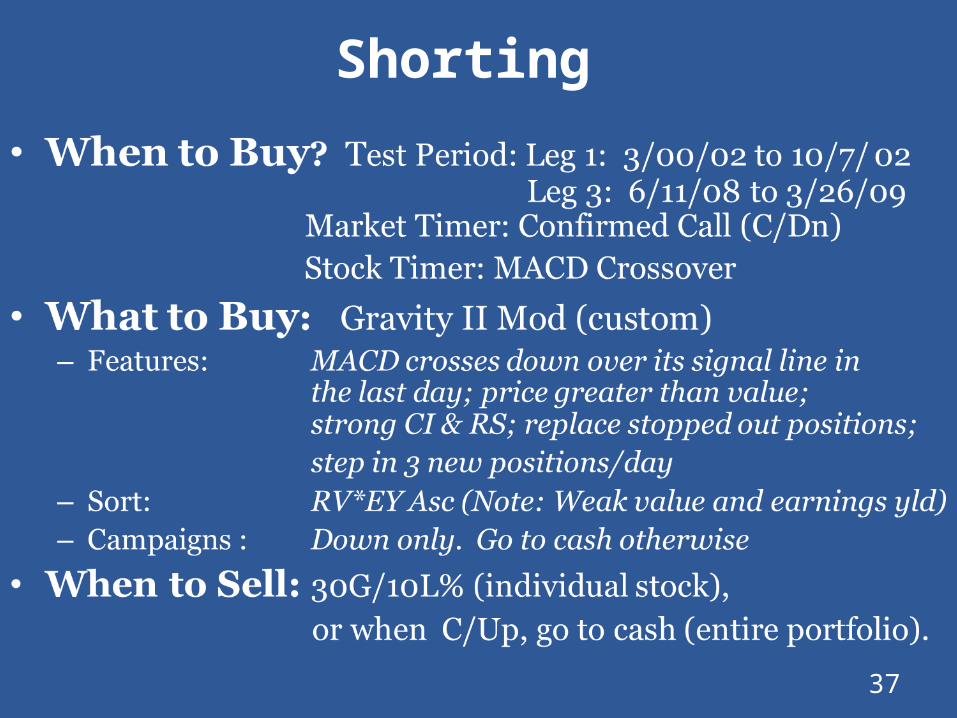
Shorting
37
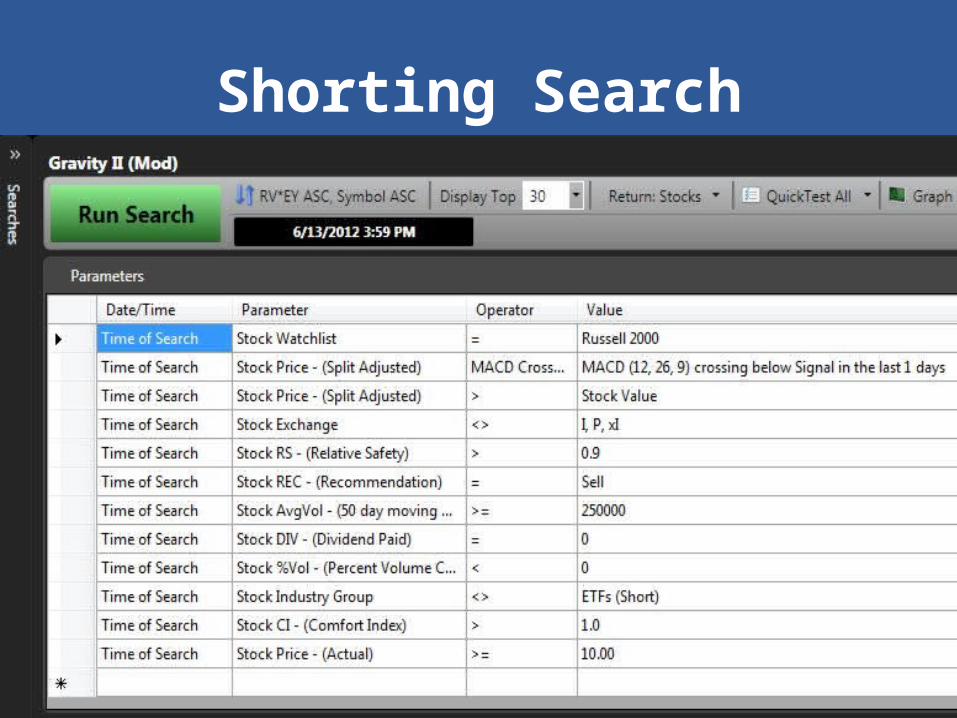
Shorting Search
38

Shorting -- Leg 1
• Results –AARR: 27%–CAGR: 23% –Trade Winners: 53%–Maximum drawdown: 14%–Calmar ratio ~ 2
Commissions included but not corrected for slippage.39

Shorting -- Leg 3
• Results –AARR: 19%–CAGR: 19% –Trade Winners: 50%–Maximum drawdown: 12%–Calmar ratio ~2
Commissions included but not corrected for slippage.
40
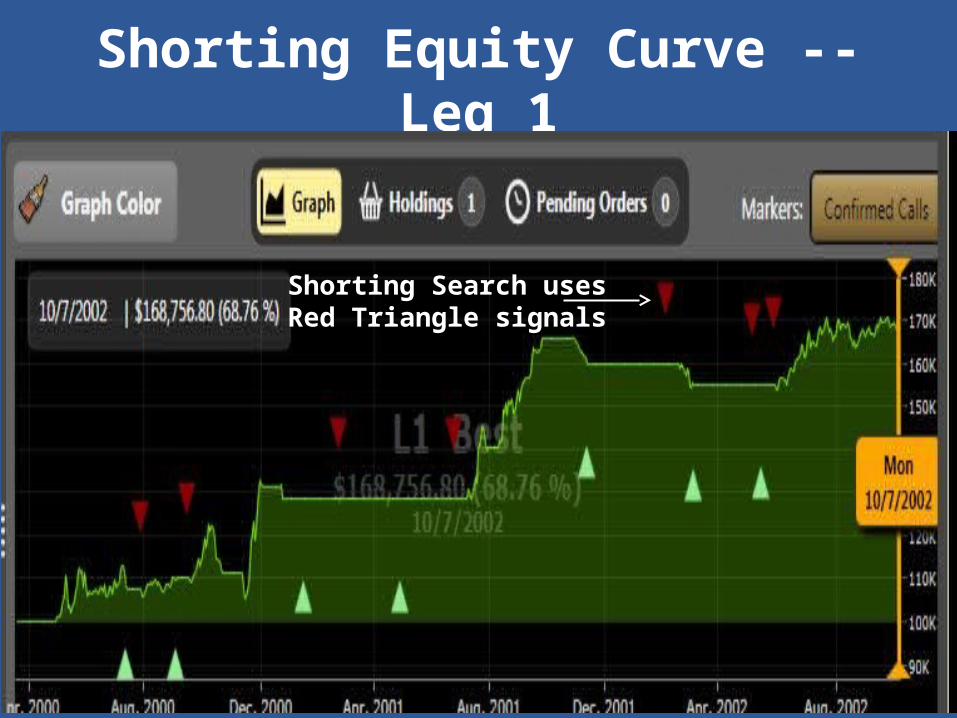
Shorting Equity Curve -- Leg 1
41
Shorting Search uses Red Triangle signals
Why CI Indicator?
• def: CI indicates a stock's ability to resist severe and/or lengthy price declines
• A high CI parameter, in a search, can reduce drawdowns
• See SOTW of 7/31/2009 for more CI details.
42
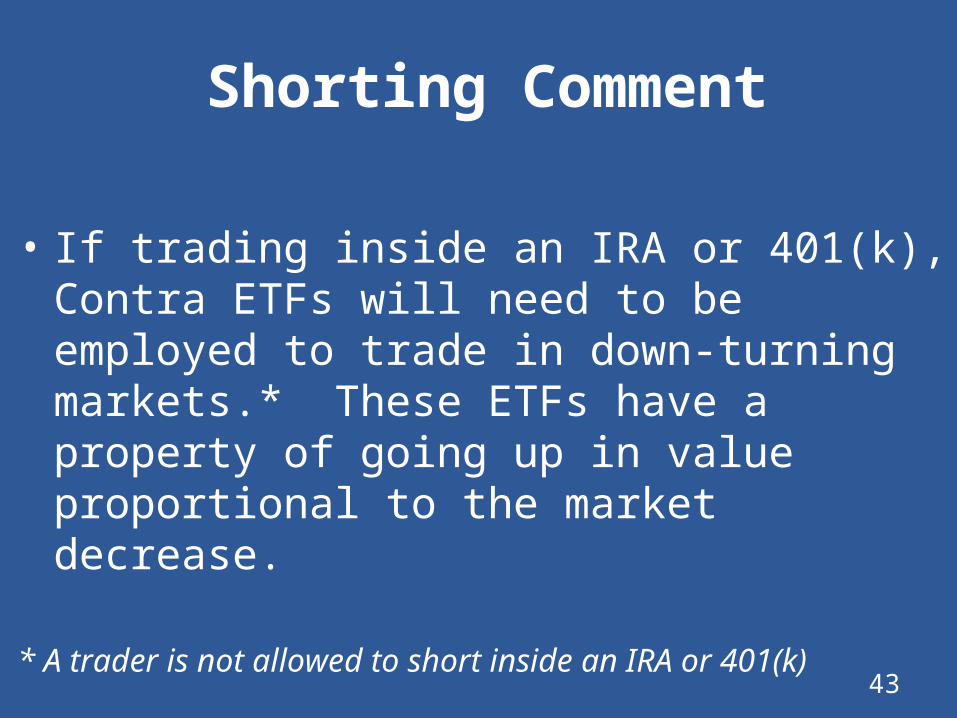
Shorting Comment
• If trading inside an IRA or 401(k), Contra ETFs will need to be employed to trade in down-turning markets.* These ETFs have a property of going up in value proportional to the market decrease.
* A trader is not allowed to short inside an IRA or 401(k)
43

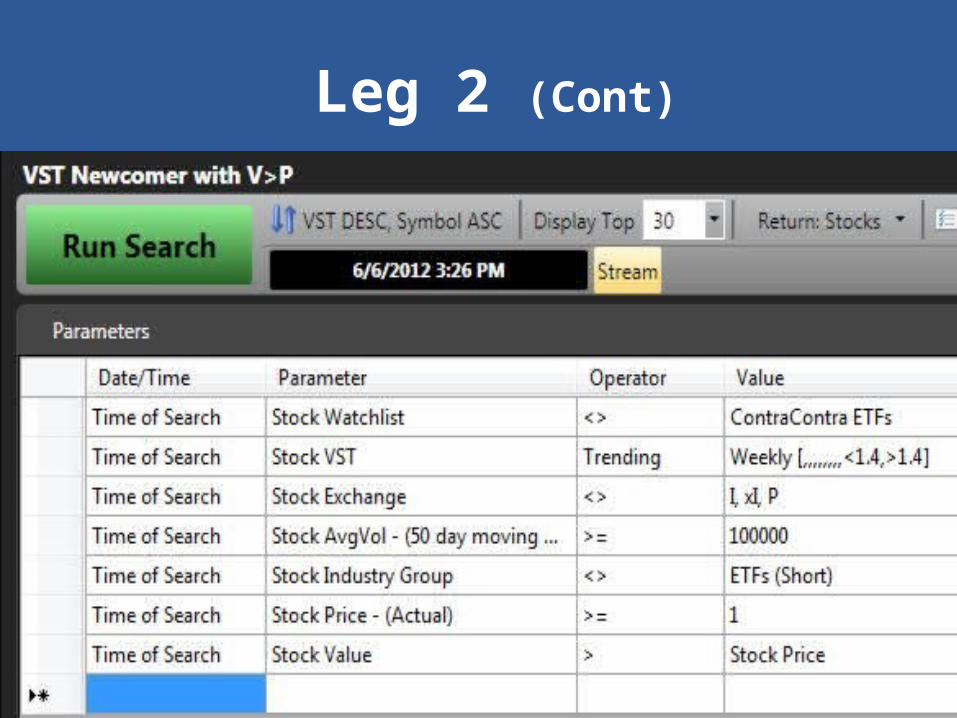
Long – Leg 2‘Trading a Nice Uptrend’
• When? Test Period: 3/21/2003 to 7/12/2007 Market Timer: Confirmed Call
Stock Timer: None
• What? VST Newcomer with V>P (custom)– Feature: Parameter Value > Price – Feature: No Step In– Campaigns: Up only. Go to cash otherwise
• When? REC <> Buy (individual stocks)
or, when C/Dn (entire portfolio).44
Leg 2 (Cont)
45
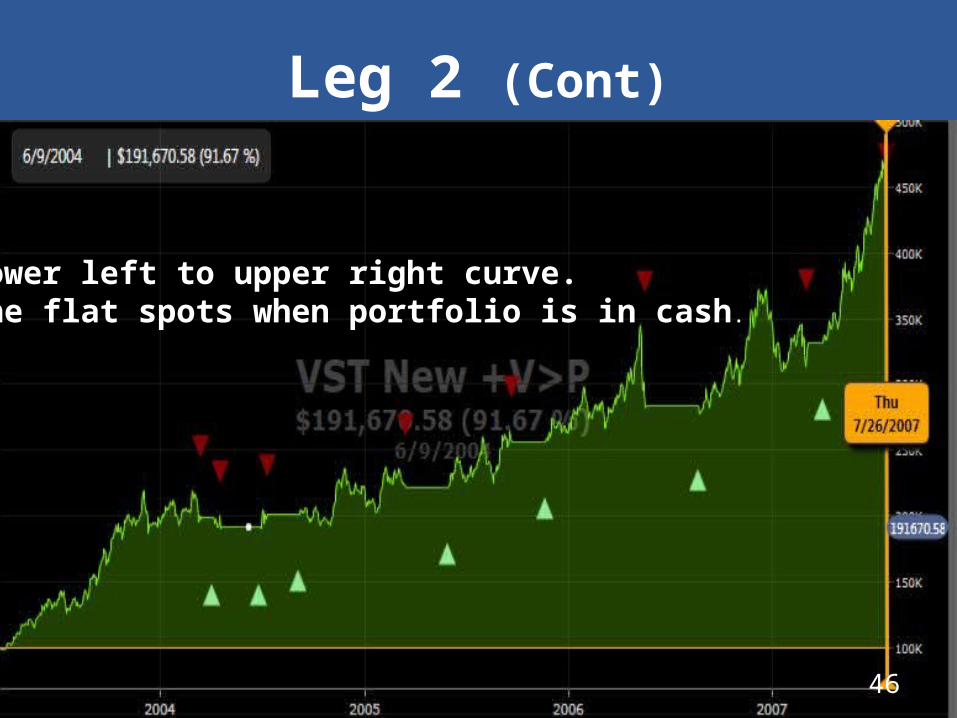
Leg 2 (Cont)
46
Nice lower left to upper right curve. Note the flat spots when portfolio is in cash.

Trending Long (Cont)
• Results AARR: 75%* CAGR: 39%No. of Trade & %Winners: 257 48%No. of Campaigns & %Winners: 15 80%Maximum drawdown: 19% Calmar Ratio: 2Duration of trend over 51 months
* Commissions included but not slippage
47

Trending Long Conclusions
• Most any trader should be pleased to have a strategy that produces such a high return, accompanied by tolerable maximum draw down, over such a long trend
• Several other VST-based strategies are built-in to VV7 and may produce similar or possibly better results.
48
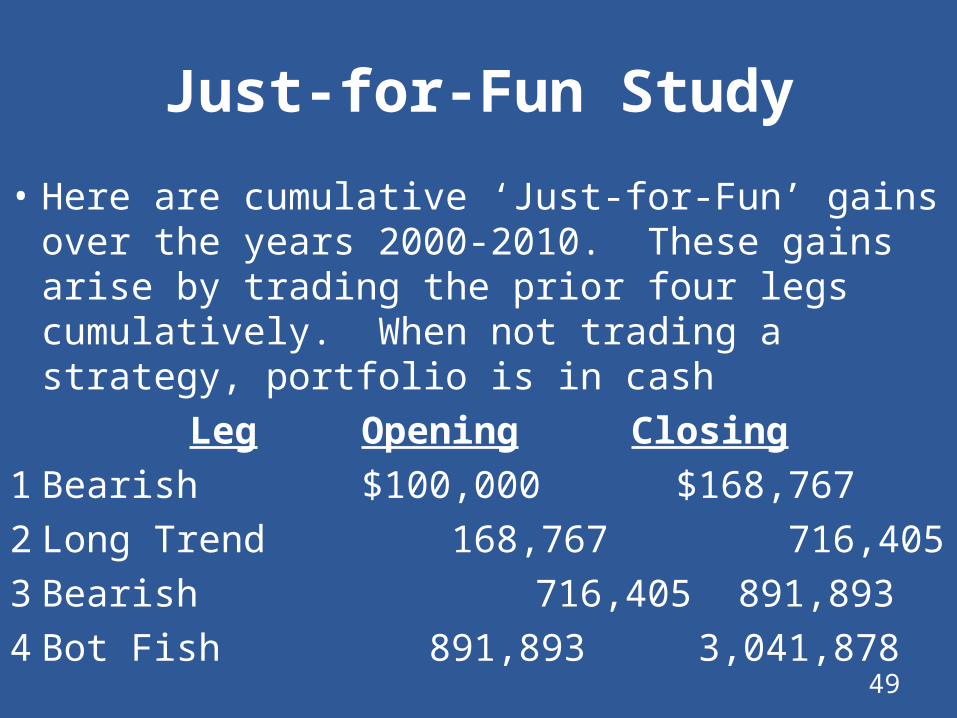
Just-for-Fun Study
• Here are cumulative ‘Just-for-Fun’ gains over the years 2000-2010. These gains arise by trading the prior four legs cumulatively. When not trading a strategy, portfolio is in cash
Leg Opening Closing1 Bearish $100,000 $168,7672 Long Trend 168,767 716,4053 Bearish 716,405 891,8934 Bot Fish 891,893 3,041,878 49
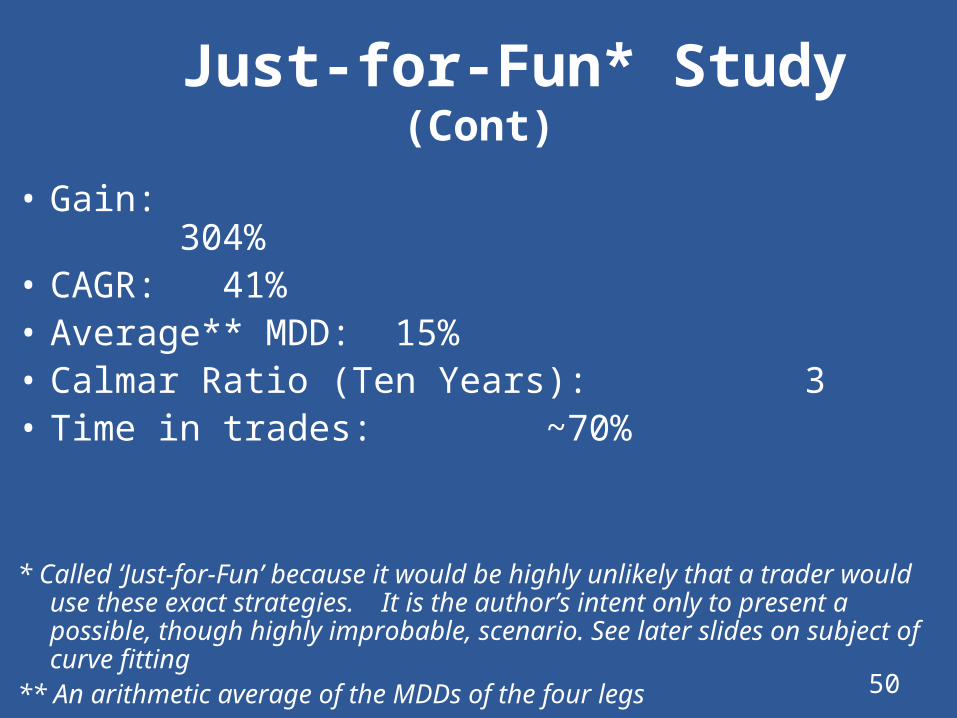
Just-for-Fun* Study (Cont)
• Gain: 304%• CAGR: 41%• Average** MDD: 15%• Calmar Ratio (Ten Years): 3• Time in trades: ~70%
* Called ‘Just-for-Fun’ because it would be highly unlikely that a trader would use these exact strategies. It is the author’s intent only to present a possible, though highly improbable, scenario. See later slides on subject of curve fitting
** An arithmetic average of the MDDs of the four legs 50
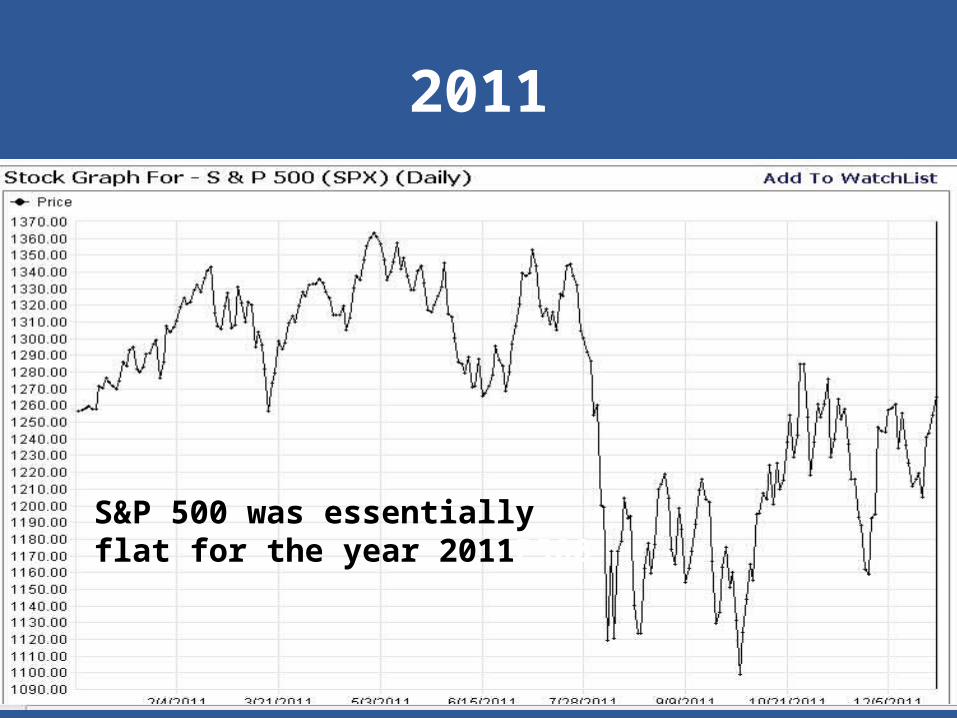
2011
1
S&P 500 was essentiallyflat for the year 2011P500
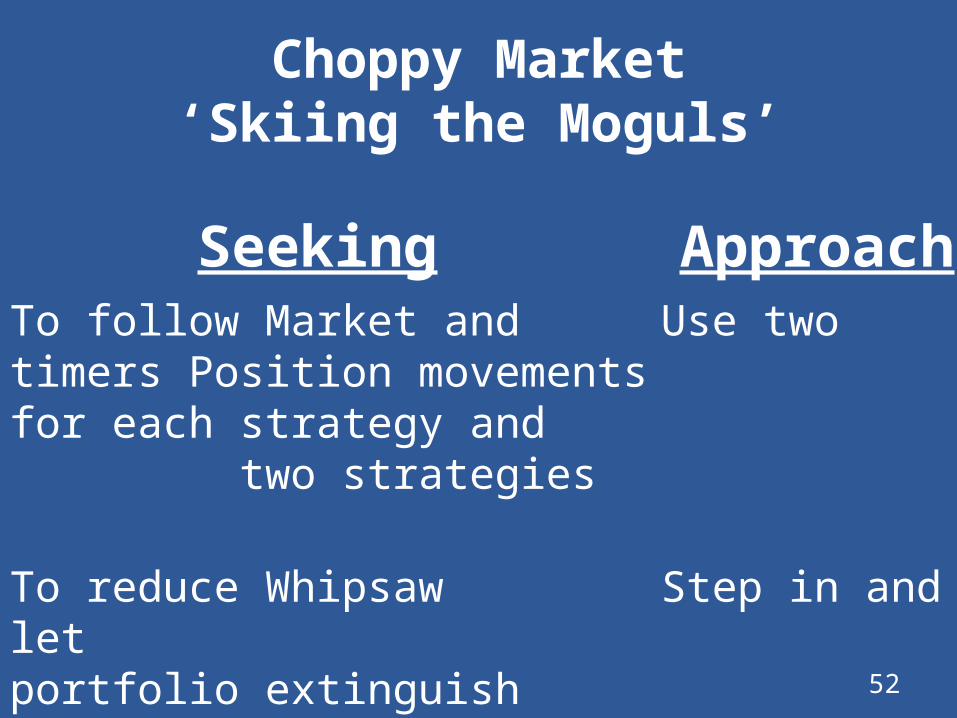
Choppy Market‘Skiing the Moguls’
Seeking ApproachTo follow Market and Use two timers Position movements for each strategy and two strategies
To reduce Whipsaw Step in and let portfolio
extinguish 52
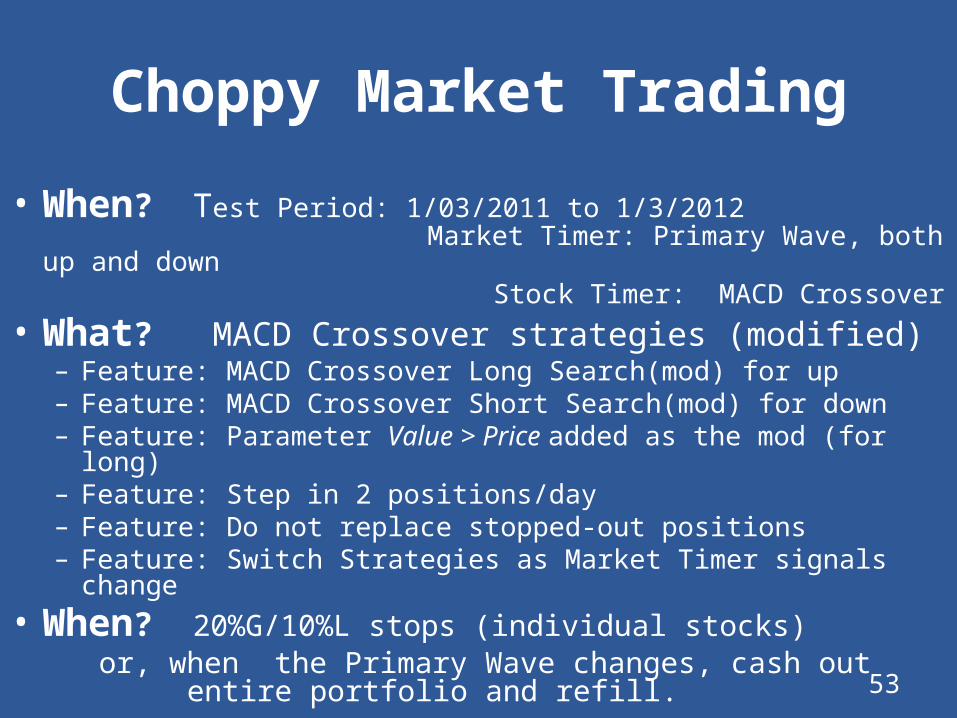
Choppy Market Trading
• When? Test Period: 1/03/2011 to 1/3/2012 Market Timer: Primary Wave, both up
and down Stock Timer: MACD Crossover
• What? MACD Crossover strategies (modified) – Feature: MACD Crossover Long Search(mod) for up– Feature: MACD Crossover Short Search(mod) for down– Feature: Parameter Value > Price added as the mod (for
long)– Feature: Step in 2 positions/day– Feature: Do not replace stopped-out positions– Feature: Switch Strategies as Market Timer signals change
• When? 20%G/10%L stops (individual stocks) or, when the Primary Wave changes, cash out
entire portfolio and refill. 53
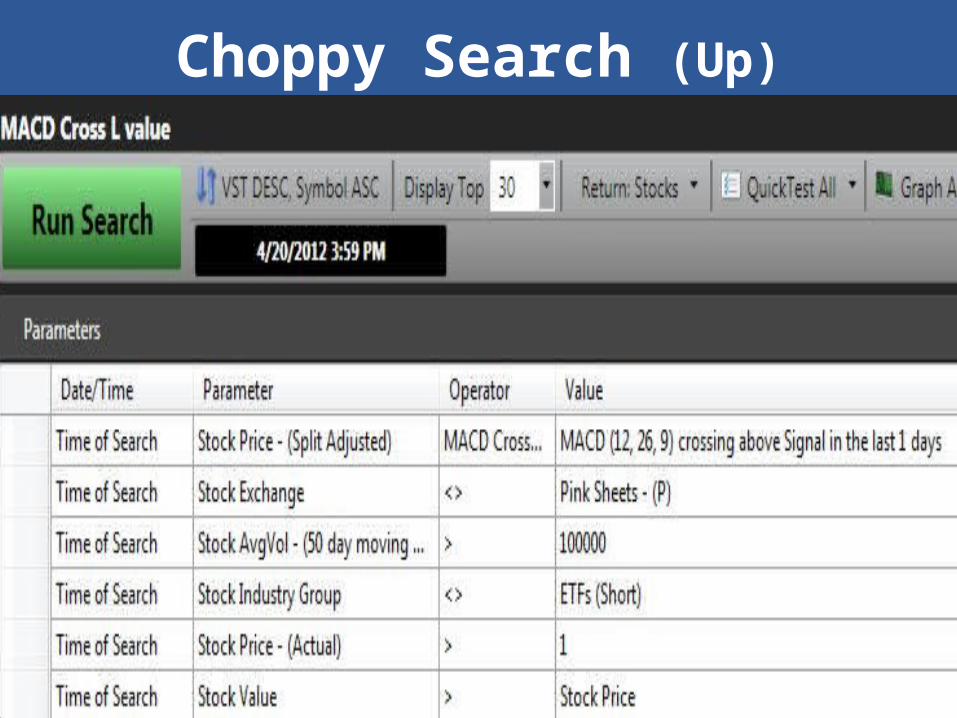
Choppy Search (Up)
1

Choppy Results (Cont)
–AARR: 40% –CAGR:* 40% –Winners: 52%–Max. drawdown: ~10% WOW!–Calmar Ratio: ~4–No. of Campaigns: 54**
* Commissions included but not slippage** Many campaigns due to choppiness
55

Choppy Mkt. Equity Curve

Choppy Market Conclusions
• Often traders dread choppy markets, as the downside risk may seem to be greater than the upside potential
• This strategy’s performance was exceptional in 2011
• The key is a strategy that pick stocks just starting to rise in price as the overall market is rising (and vice versa when shorting)
• See SOTW of 5/6/2011 for alternate way to trade in a choppy market. 57

Variety of Strategies
58
• Market Conditions: – Bottom fishing, Two bearish trends, Bullish trend, and
Choppy• Market Timers (all built-in):
– 2 Confirmed Call, 1 DEW, and 1 Primary Wave• Stock Timer
– Added as a search parameter to enhance performance• Searches:
– 1 standard and 3 custom• Stops:
– 20%G/10%L, 30%G/10%L, 50%G/10%L, and REC <> Buy
• Durations: – 12, 14, 17, and 51 months.

Caution
• Most important, these strategies may or may not be transportable to another time period
• They may be ‘curve fitted’. Another time frame may not contain price movement enough like the original to get similar results
• Do not assume that any SOTWs or especially any contest winning strategies are ‘transportable’
• The longer the back test period, the less likely there will be significant curve fitting.
59
Caution (Cont)
• Out-of-sample and longer-period back testing are methods for determining if a strategy is robust
• Bottom fishing strategies, like S&P500/RT, are not curve fitted (except for step-in days) and are robust
• The other prior three studies probably are ‘curve fitted’
• For example, the choppy strategy does not perform at all well for the year 2010. 60
What to Do?
• Since built-in strategies do not necessarily transport effectively, what does a trader do?
• Choose another prior time period, test over longer periods and compare. If similar results occur, OK
• Or, use Derby Winners. The safest searches are those matched as both one-day and 5-day winners. Consider modifying as shown earlier
• If the Derby Winners are evenly mixed (some bullish and some bearish), stay on the sideline until market action clarifies. But, if 8 out of 10 are moving in the same direction, go with it.
61

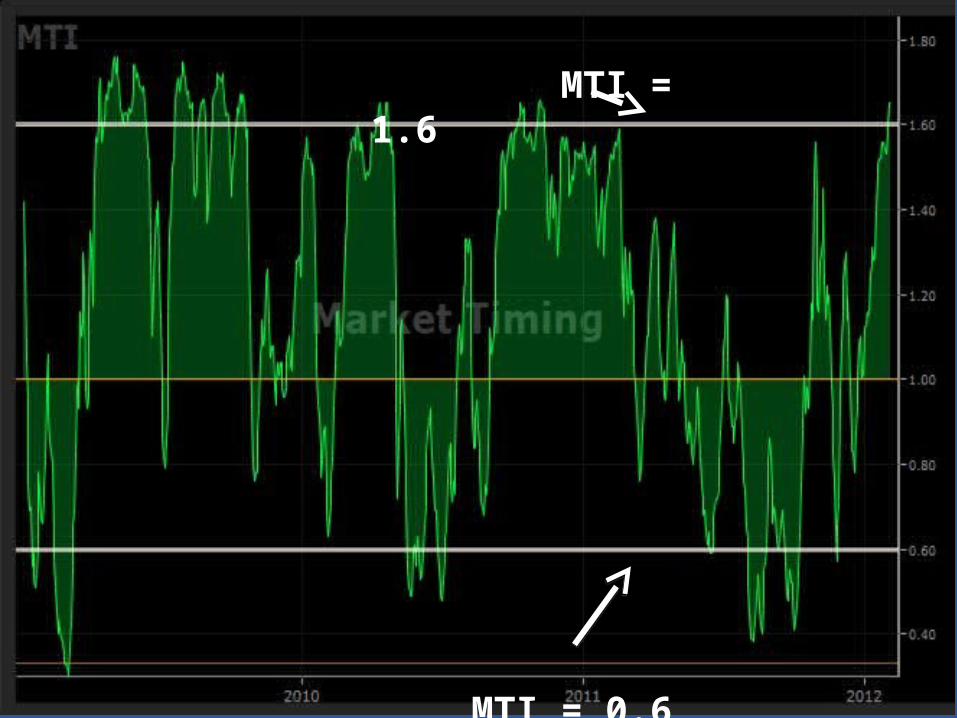
MTIA Powerful Indicator
62
Practical Use of MTI
• Use the Market Timing Indicator (MTI) with MACD and Views for decision aids on market conditions, entry and exit dates, and stop adjustments
• The MTI tends to have a congested and somewhat rounded tops and sharp V-shaped bottoms
• When a rising MTI nears or reaches 1.60, the market is overbought and is looking for a top. When a falling MTI is nearing 0.6 and BSR is near 0.2, it’s oversold and is looking for a bottom
• The next slide shows MTI with 1.6 and 0.6 marker lines.
63
64
MTI = 1.6
MTI = 0.6
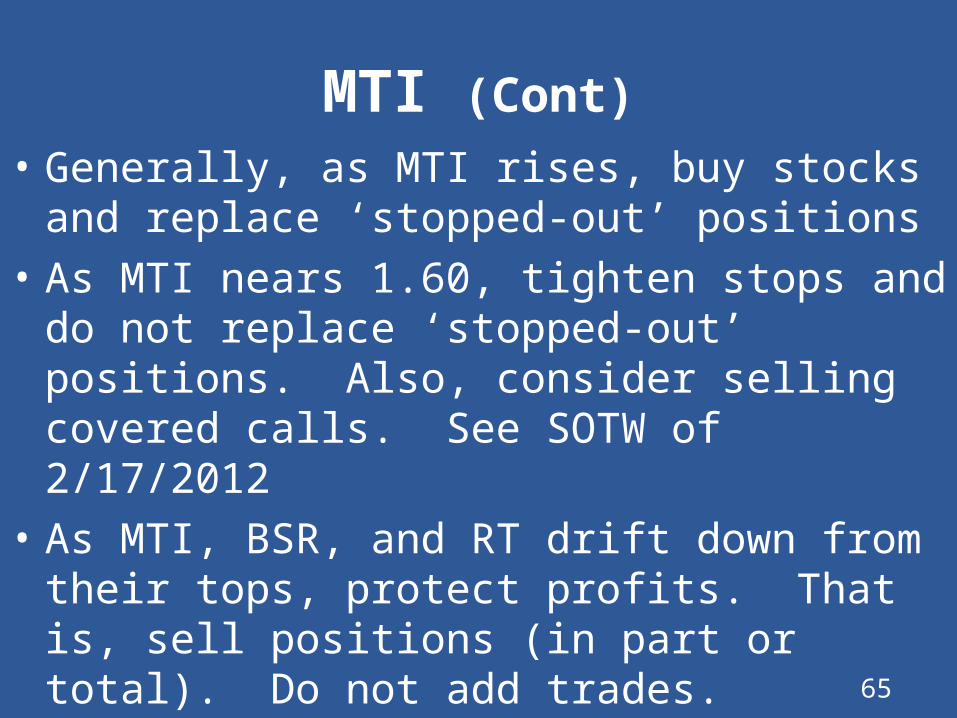
MTI (Cont)• Generally, as MTI rises, buy stocks and
replace ‘stopped-out’ positions• As MTI nears 1.60, tighten stops and do
not replace ‘stopped-out’ positions. Also, consider selling covered calls. See SOTW of 2/17/2012
• As MTI, BSR, and RT drift down from their tops, protect profits. That is, sell positions (in part or total). Do not add trades.
65
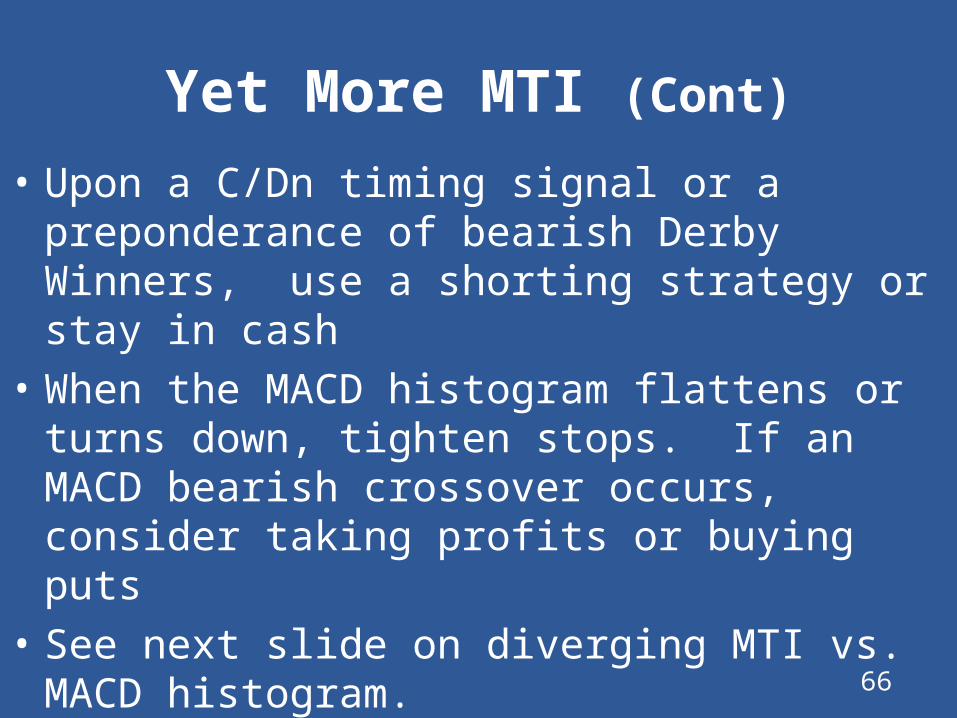
Yet More MTI (Cont)
• Upon a C/Dn timing signal or a preponderance of bearish Derby Winners, use a shorting strategy or stay in cash
• When the MACD histogram flattens or turns down, tighten stops. If an MACD bearish crossover occurs, consider taking profits or buying puts
• See next slide on diverging MTI vs. MACD histogram. 66

67
Note the divergence ofMTI vs. MACD
MTI (Cont)
• Switch from MTI graph to Views each day to get guidance on entry or exit decisions, as well as to acquire the best searches from Derby Winner Selections.
68
Real World Trading
• The results of the prior studies were all obtained by auto back testing. VV7 has an excellent back tester but it is limited in certain ways
• A seasoned trader would also do the following:– Cherry-pick stocks (d) before trading by studying
their graphs (see SOTW of 3/30/2012 and appendix for full description on how to cherry-pick).
– For determining follow-through, verify that the opening of today’s VVC exceeds yesterday’s close (for up-trend) and vice versa
69
Real World (Cont)
– Enter broker limit orders after 10 to 10:30 AM if a follow-through. Set stop losses right after the order is filled
– Look at portfolio positions each EOD. Adjust stops using stock volatility (d)
– Sell (cover) any stocks not creating 1% gains after 3 trading days (d)
– As the up-trend momentum decreases (as seen by MACD), cease replacing ‘stopped out’ positions . Tighten stops,
profit -take or go to cash before a C/Dn (d)– Use margin during instances of a well-established
up-trend (d) 70

Ideal Graph
71
Smooth Rising Price CurveValue > PriceLow Daily Range, No Spikes, No GapsRising EPS
Value
See appendix for practical Graph Settings for Cherry-Picking

More Real World• Apply the 10% catastrophic portfolio and
1% position risk rules*• To reduce whipsaw losses, step in 2 0r 3
positions per day into a new portfolio, if using DEW, Primary Wave, or Green Light Buyer market timers.
* If a 10% or greater loss occurs from the whole portfolio, go into cash for at least two weeks. Hold any one position’s maximum loss to no greater than 1% of the entire portfolio value.
72

More (Cont)
• As the momentum of an up-trend fades, discontinue replacing ‘stopped-out’ positions. Let the portfolio extinguish or hedge (d) (see SOTW of 4/13/12)
• Go to cash, buy puts, or switch to a bear search, if a follow-through occurs after two red lights (in color guard) (d). 73
Beyond VectorVest
A consistently profitable trader would also –write and use trading plans (see next)–use a ‘Stock Selection Guide’ daily (next)–monitor open positions daily and adjust
stops as necessary–write a critique after each trade is
closed out–maintain an Equity Curve 74

VectorVest Trading PlanVectorVest Trading PlanBottom FishingBottom Fishing
BackgroundBackgroundBottom fishing (BF) is the easiest and most profitable of Bottom fishing (BF) is the easiest and most profitable of
all possible strategies. Unfortunately, opportunities to trade a all possible strategies. Unfortunately, opportunities to trade a true BF only occur 2 or 3 times a year on average. The trend true BF only occur 2 or 3 times a year on average. The trend typically lasts 6 weeks and may last longer.typically lasts 6 weeks and may last longer.ObjectivesObjectives
Achieve an average annual gain of 50% or greater during each true bottom fishing campaign.
Achieve this gain with a maximum drawdown equal to or less than 20%.StrategiesStrategies
Read the Views, the Color Guard, and Market Timing Graph EOD daily to detect the bottom and the ensuing rally. Complete a Stock Selection Guide daily. Read (listen to) the many SOTWs on BF.
Get trading list ready; the turnaround from the bottom comes fast. Use proven BF searches such as S&P500/RT. Cherry pick search results to select smooth price curves with increasing EPS. Place best prospects in a watchlist.
75

Plan (Cont)
Strategies (Cont)
Using the watchlist, start to ‘step in’ positions at first green light in price column (following a Confirmed Down).
Place trades around 10:30 AM the following day after determining follow-through, using limit orders. Place stop orders on filled positions.
As trend gets established, either switch to DEW timer or continue using Green light.
Start with G50/L10 or 10% trailing stops. Replace ‘stopped out’ positions as long as MACD
histogram is rising. When MACD histogram flattens and then decays, do not replace further. Let the portfolio extinguish.
As MTI moves up above 1.4, consider switching out of BF and into another up trending search.
76
Plan (Cont)
Control RoutinesControl Routines Enter each trade into a Stock Selection Guide with
description of reason for picking, stop settings, expected result and actual outcome.
Monitor the portfolio daily and adjust stops as and if necessary.
Prepare and maintain an Equity Curve. Compare results relative to benchmarks like one of VV’s Model Portfolios, i.e., Yellow Brick Road.
A true bottom fishing campaign is defined as entering the upturn, with a BF search, after the MTI is turning up from or near 0.6 and the BSR is increasing from or near 0.2.
An early indication is when one or more BF searches appear in 1-day Derby Winners.
Other BF searches may appear to be better when reading the Derby Winners. They may be used instead.
As a general rule, step in only 1 or 2 positions at first. As the trend becomes better established, add more rapidly.77
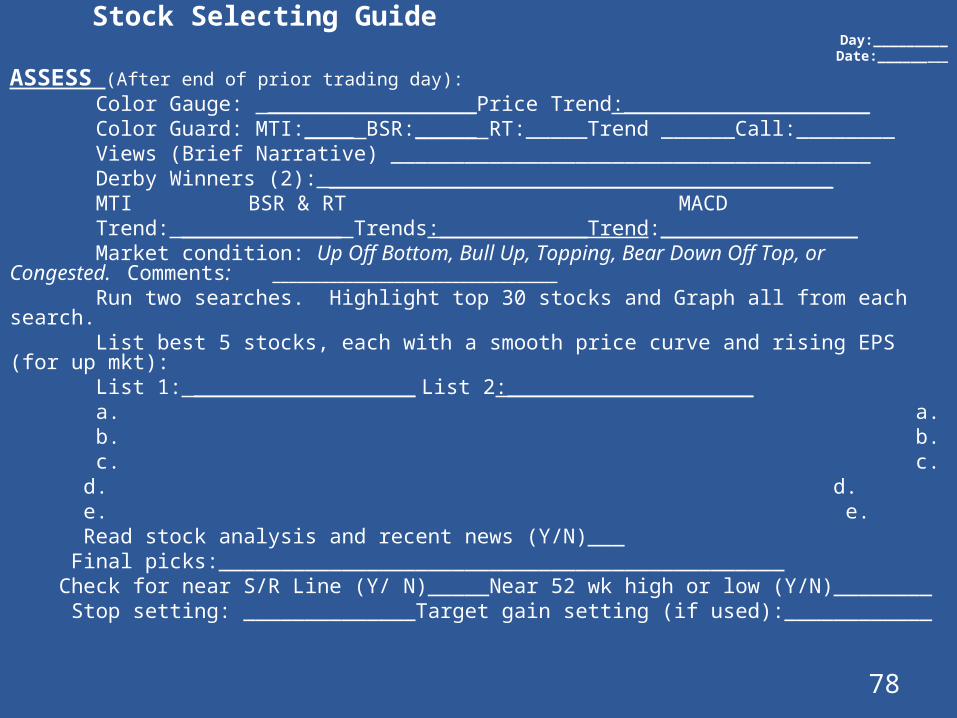
Stock Selecting GuideDay:_________Date:_________
ASSESS (After end of prior trading day): Color Gauge: _________________Price Trend:____________________ Color Guard: MTI:____ BSR:_____ RT:_____Trend ______Call:________ Views (Brief Narrative) _______________________________________ Derby Winners (2): _________________________________________ MTI BSR & RT MACD Trend: _____________ Trends:____________Trend:________________ Market condition: Up Off Bottom, Bull Up, Topping, Bear Down Off Top, or Congested. Comments: ___________________________________ Run two searches. Highlight top 30 stocks and Graph all from each search. List best 5 stocks, each with a smooth price curve and rising EPS (for up mkt): List 1: __________________ List 2:____________________ a. a. b. b. c. c. d. d. e. e. Read stock analysis and recent news (Y/N)___ Final picks:______________________________________________ Check for near S/R Line (Y/ N)_____Near 52 wk high or low (Y/N)________ Stop setting: ______________Target gain setting (if used):____________
78

Guide (Cont)
DECIDE (by 10 to 10:30 AM): Europe trend and US Futures: _________ Green or Red light in the price column yesterday? (Y or N)____Which?______ Follow through this morning? (Y/ N) _____
ACT (with broker): Enter trades and stops today? (Y/N) _____ _ If Y, go long or short?_______ Why?____________________________________________________ Fill prices:________________________________________________ Stops entered (describe):______________________________________ OUTCOME -- To be filled in after position(s) is (are) sold:___________________
______________________________________________________
ADDITIONAL COMMENTS: ____________________________________________________________________________________________________________
79

Lesser Known Features Disclosed
• Relating market timers to market conditions• Using stock price timers • Exploiting Value > Price, RS, and/or CI
parameters• Cherry-picking stocks • Being aware of and avoiding ‘curve fitting’• Using MTI and MACD combinations• Separating discretionary from rule-based
choices• Benefitting from smart margin use. 80

Credits
• A special thanks to Jim Becker, Nancy Nallin, Dan Chisholm and Herb Geissler, moderators of Pompano Beach, Sarasota, Orlando, and Pittsburgh VectorVest User Groups respectively for inviting the author to present to their groups
• Thanks to Ed S. of Orlando, whose eagle eye caught many logic mistakes in an earlier draft
• Thanks to Todd Shaffer, VectorVest Director of Research, for his input on curve fitting
• A personal thanks to Jean, my wife, for her editing.
81

Graph Settings forCherry-Picking
• Initially one year, then 3 months• Price: candles with 200, 50, 20, 10 SMA• Support/Resistance: with 300 bars of data
& 3 touches• Volume: with 50 day MA• EPS (look for smooth upward curve)• Value (above price for uptrend)• MACD (default settings of 12, 26, 9)• Opt: Stochastic (default settings of slow, 14,
3).
Related Documents