Petrusplaat Reservoir

Welcome message from author
This document is posted to help you gain knowledge. Please leave a comment to let me know what you think about it! Share it to your friends and learn new things together.
Transcript

Petrusplaat Reservoir
Welcome
to the Biesbosch Water
Production Plant
André Bannink, policy advisor

Presentation outline
1. Drinking water in the
Netherlands– Facts and figures
– How is it organised?
2. RIWA Association of River
Water Works– Who are we and what do we do?
3. Drinking water production at
this location– Visit to Reservoir

Introduction to
Dutch water supply

Amsterdam
The Hague
Rotterdam
Rhine
MeuseScheldt
Eems
The Netherlands
area: 41.000 km2 / population: 16.7 million = most densely
populated western country

Development and investment
stages of Dutch Water Supply
1853: first urban water supply (Amsterdam)
1918: start rural supply towards 100%
connections per household
1945: tremendous economic growth
1960: deterioration of river quality
1975: start up scaling and consolidation of
water suppliers

Development of water supply
Number of Dutch water companies
0
50
100
150
200
250
1853
1859
1865
1871
1877
1883
1889
1895
1901
1907
1913
1919
1925
1931
1937
1943
1949
1955
1961
1967
1973
1979
1985
1991
1997
2003
2009

Drinking Water Supply in the
Netherlands - Facts and figures
*thousand connections
01-01-2012
Brabant Water
1102
Evides
1020
Vitens
2530
Dunea
610 336
Oasen
Waternet
490
WML
538
PWN
770
WMD
200
WBG
279
10 Not-for-profit public
companies
• shares owned by
government (provinces and
municipalities)
• 5 000 employees (full time
units)
• 7 874 thousand
connections
• 119 thousand kilometres
pipeline (mains)

Drinking Water Supply in the
Netherlands - Facts and figures • Consumption
120 litres per
person per day
• Sales 1,130 billion
m3 per year
• Price € 1.50 per
m3
• Turn over
€ 1,460 million

35%
65%

Sources for drinking water in Europe
0%
10%
20%
30%
40%
50%
60%
70%
80%
90%
100%
B D
DK EL I E F
IRL
LU
X
NL O P
FIN
S
UK
LV
EE
LT PL
CY
MT
SK
CZ
HU SI
BU
RO
NO IS CH
groundwater surface water other water
Fro
m: A
dri
ana H
uls
man
, H
2O
#6 2
006


Delta of four
River Basins
1. Rhine
2. Meuse
3. Scheldt
4. Eems
• Lots of chemical
and heavy
industry (eg. Ruhr
area)
• Large areas of
agriculture
• Many major cities

The Netherlands -
Pressures
~ Most Densely Populated
Western Country
– 16.7 Million People on 41.000
km2
~ 3rd Exporter of Agricultural
Produce in the World
– Very intense production
– High Use of Minerals en
Pesticides

Ground Water

Ground
water
• Over 250
pumping
stations
• Over 120 000
hectares
groundwater
protection
area
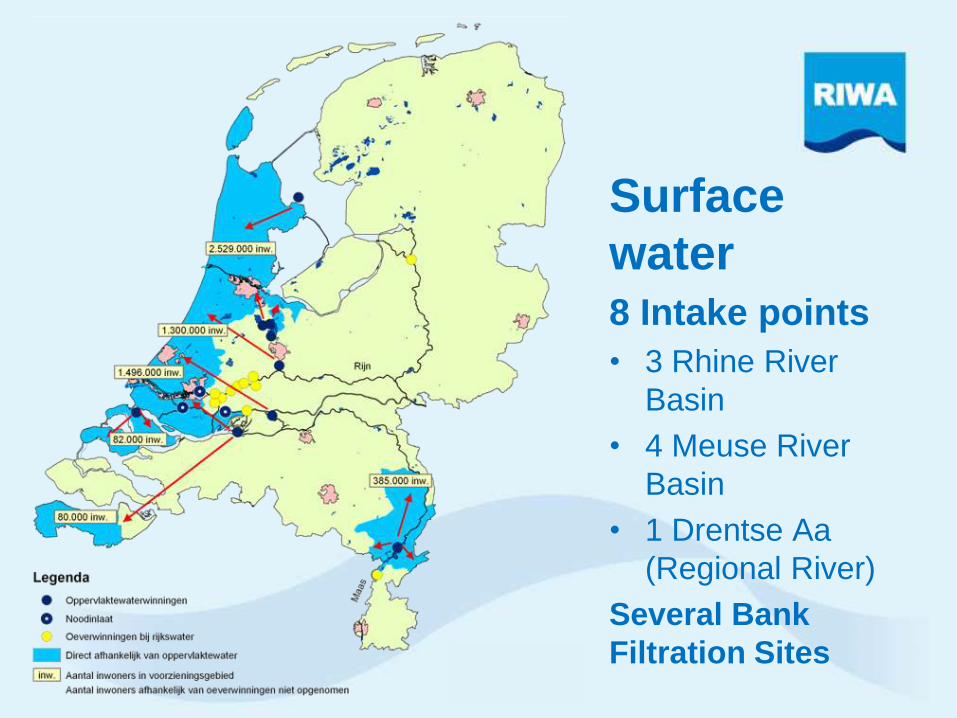
Surface
water8 Intake points
• 3 Rhine River
Basin
• 4 Meuse River
Basin
• 1 Drentse Aa
(Regional River)
Several Bank
Filtration Sites

Water in The Netherlands – Who is
responsible for what?National level
• Government – national water policy (Ministry of Infrastructure and
the Environment)
• Rijkswaterstaat – river navigation, coastal flood protection
Regional level
• 12 Provincial Governments – ground water policy
• 26 Water Boards – regional flood protection, surface water quality,
wastewater treatment
• 10 Water Companies – water supply
Local level
• 421 Municipalities – sewer system, municipal water systems

Regulatory environment
Drinking Water Act (2011)
• ownership restricted to local/regional authorities
• national supervision with main focus on water quality /
continuity (public health), new ”costs”
• companies governed by local/regional shareholders
(investments, tariffs, efficiency)

Regulatory environment (2)
• safeguarding water quality/continuity
− water safety plans (water quality)
− contingency management (risk analysis,
capacity planning, security measures,
reliability plan, crisis management plan,
emergency water supply, exercises)

Regulatory environment (3)
• full cost recovery
• reasonable tariffs
• limitation to profit (wacc)
• mandatory benchmarking

Public limited liability company
Governmental
Supervision (VROM-
Inspectorate)
Public Shareholders
(municipalities,
provinces)
Supervisory Board
Accountant Managing Director Workers Council
Supporting Staff
Department Department Department
regulator

National benchmarking scheme
• voluntary programme since 1997
− initiated by national discussions on privatisation and
liberalisation of public services
• objectives
− improving efficiency by learning
− transparency
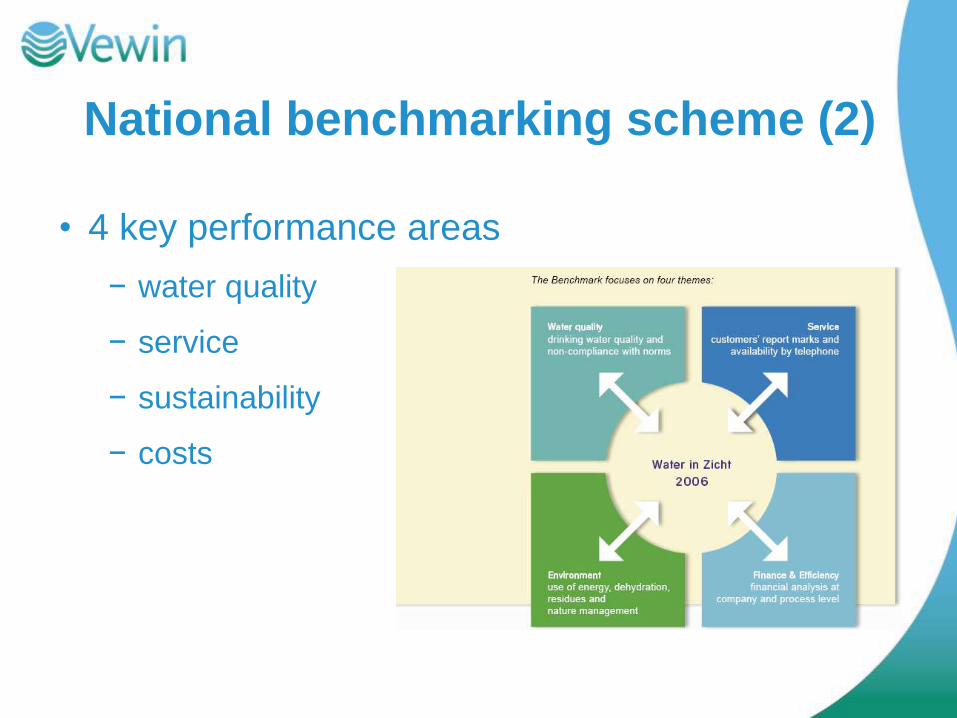
National benchmarking scheme (2)
• 4 key performance areas
− water quality
− service
− sustainability
− costs

Vewin’s benchmarking activities
National
• late 1980’s: first benchmarking efforts (regional)
• since 1997: voluntary, national benchmarking
programme
• 2011: mandatory national benchmarking
International
• since 2006: voluntary, international benchmarking
(European Benchmarking Co-operation)

European benchmarking
• initiative of national water associations and utilities of
Denmark, Finland, Netherlands, Norway, Sweden (2005)
for cross-border comparisons
• mission: to facilitate water utilities in the continuous
process of improving performance and transparency
a simple, web based, international benchmarking
programme for water services and
a platform to learn from best practices in
management and operations

RIWA-MeuseAssociation of Drinking Water Companies that
use the River Meuse as source for drinking water production

What RIWA-Meuse stands for
Clean Resources for Drinking Water
• Pollutants can be reduced through technical treatment methods
• However all treatment methods have limits: – They can not eliminate 100% of a substance
– They do not selectively remove just one undesirable substance
– Their effectiveness does not remain constant over time
– The treatment method itself can produce new chemical compounds

Meuse River
Basin• Surface: 36 000 km2
• Length: 925 km
• Average flow: 230 m³/s
• Abstraction for drinking water production 2011: 482 Mm³ (= 15,3 m³/s or 6.6% of averageflow)– 1976: 120 m3/s (15.3 m3/s = 12.7%)
– 2003: 125 m3/s (15.3 m3/s = 12.2%)
• Drinking water resource for 6 million consumers– Netherlands
– Belgium
– France


Monitoring water quality
• Rijkswaterstaat monitors the
River Meuse 24/7 at the
Belgian/Dutch border
• In case of an emergency they
notify the Drinking Water
Companies
– Drinking Water Companies decide
whether they should stop the intake

Intensive monitoring
• Specific parameters
– Additional to regulatory requirements
• Base of our activities
– Putting drinking water quality issues on
the agenda
• Working closely together with
Rijkswaterstaat
• Publish report on water quality
annually

Pressures on Water Quality
• Organic micro-pollutants
– Majority: Pesticides, Industrial
– New: MTBE, EDCs, pharmaceuticals
• Heavy Metals & Nutrients
(NO3 SO4, Ca/Mg, HM)
• Natural Origin (Fe, Mn, Color)
• Micro-organisms (Pathogens)

Drinking water relevant
substances Meuse
Goal:
• To focus our attention to the most
relevant substances from drinking water
perspective
– Motivated by Water Frame Work Directive
• To focus our monitoring on existing
contaminants, as well as upcoming and
new contaminants

Rele
va
nt s
ub
sta
nces
for
drin
kin
g w
ate
r pro
du
ctio
n
from
the R
ive
r Me
use

Some monitoring results 2011

Putting water quality
issues on the agenda
• Participation in the International Meuse
Commission
– Recognized Non Governmental Organization
• Publicity
– International Meuse Prize
– Annual report on water quality
– Website (www.riwa-maas.org)
– Media (newspaper, radio)

Helping to solve
water quality issuesProject funded by WFD-Innovation
Program
• April 2010 - September 2012
• Budget € 1.7 million
• 100 Farmers and contractors worked on
reducing emissions of plant protection
products
– 47 bought new equipment/purifiers
– 14% less PPP-use, 84% less emission

International Meuse
Prize Winner 2012

EU Water Framework
Directive (WFD)
Recital 1
• Water is not a commercial product like any other
but, rather, a heritage which must be
protected, defended and treated as such
General Objective
• To achieve a good ecological status and a good
chemical status of surface waters and ground
water
• In 2015, with exemptions until 2021-2027

Drinking Water
Resources in WFD
Article 7.1• Identify water bodies used for abstraction of
drinking water
Article 7.2• Drinking water must be produced under the
water treatment regime applied (no furtherdeterioration)
Article 7.3• Protection of water bodies
– avoid deterioration
– reduce level of purification

What is done to achieve
WFD article 7 goals?International Meuse Commission
• Working Groups will look into measurements
Netherlands
• Delineation of protection zones
• Composition of Area Files
First steps towards Programs of Measures for Second Phase of River Basin Management Plan (2015-2021)

The Biesbosch reservoirs:the first treatment step in drinkingwater production from river water

Rotterdam
Evides water company
• 2 million consumers
• 1 million connections
• 14,000 km mains
• 160 Mm3/year drinking water
• 110 Mm3/year industrial water
• waste water treatment plants (Amsterdam Airport, The Hague)
• 560 personnel; turnover 210 M€/y; investments 80 M€/y
• shareholders: municipal (by law)
Zeeland & Zuid-
Holland provinces

Infiltration of surface
water (Haringvliet)
Surface water (Meuse)
Ground water
Evides’ raw water sources

The Biesbosch reservoirs
intake
River Meuse
River Rhine

Biesbosch reservoirs
• Investments (1968-2010) M€ 200
• Production capacity (2010) 260 Mm3/y
• Water production (2010) 190 Mm3
• Water tariff (2010): 0.05 €/m3
• Intake pumping station 16 m3/s
• Transport pumping station 9 m3/s
• Transport pipeline to Berenplaat 28 km; Ø 1.8 m
• Transport pipeline to Braakman 103 km; Ø 1.1 – 0.7 m

Infrastructuur voor industriewatervoorziening
en ruwwatertransport voor drinkwaterproductie
Opjaagstation of winlocatie
Productielocatie
Dunea
Oasen
Vitens
Brabant Water
PidpaAWW
VMW
TMvW
VMW
Braakman
DeCoMBR DDA
DeCu
Yara
Koegors
St. Jansteen
Vogelwaarde
Zandvliet
Kraaijenberg
Wouw
Bath
KruiningenDe Wranghe
Baanhoek
Pergem
DWP Botlek
PWP Huntsman
Petrusplaat
Maasdam
KPE
Veerweg
Geervliet
Zevenbergen (Brabant Water)
Kralingen
Berenplaat

Biesbosch reservoirs lay-out
Meuse River
Monitoring
Keizersveer
Intake
Reservoir DeGijster
Honderden Dertig
Petrus-plaat
Surface (ha) 305 210 100
Volume (Mm3) 40 33 13
Depth (m) (avg-max) 13-27 15-27 13-15
Retention time (wks) 11 9 4

Functions of the Biesbosch reservoirs
• Storage for low flow periods
• Storage for inferior water quality periods
• Quality improvement during storage
• ± Constant water quality for WTP’s

Main problems of river water quality
• ammonium (until the 80-s): sewerage, agriculture
• heavy metals: industry
• turbidity: catchment area, sewerage
• microbiological pathogens (Cryptosporidium, Giardia): sewerage, animal husbandry
• pesticides, herbicides: agriculture, municipal weed kill, industrial spills
• radio activity: nuclear power plants
• unknown micropollutants
• “emerging” substances (medicines, estrogenics, nanochemicals)

Monitoring
station Keizersveer
Intake
On line
Temperature
Oxygen
EC
Turbidity
pH
On line
Temperature
Oxygen
EC
Turbidity
pH
Biomonitors
Laboratory
analyses

Duration of intake stops
0
30
60
90
19
83
19
84
19
85
19
86
19
87
19
88
19
89
19
90
19
91
19
92
19
93
19
94
19
95
19
96
19
97
19
98
19
99
20
00
20
01
20
02
20
03
20
04
20
05
20
06
20
07
20
08
20
09
20
10
Du
rati
on
(d
ays)
Radioactivity
Organics
Inorganics
Oil
Turbidity
Low flow

De Gijster after an intake stop (45 d)
Diuron
(herbicide)
1993

3 reservoir system enhances removal (reactor kinetics)
1 10 100 1000 10000
1 bekken
Petrusplaat
Honderd en
Dertig
De Gijster
Maas
Enteroviruses (pfu/m3)

Water quality improvements as a result of intake policy and storage
Removal percentage
0 25 50 75 100
C. perfringens
E. coli
Enterococci
Cryptosporidium
Iron
Manganese
Turbidity
Lead
Ammonium

straat 2
MDP1 Chemicaliën
UV1
VWK
AKF1
UV2MDP2
AKF2
straat 1


22 June 2010
謝謝各位的注意聆聽,不知是否有何問題?

Lets walk to the Reservoir
Related Documents


