1 The Impact of Anti-Black Racism on Approval of Barack Obama’s Job Performance and on Voting in the 2012 Presidential Election Josh Pasek University of Michigan Jon A. Krosnick Stanford University Trevor Tompson NORC at the University of Chicago October, 2012 Jon Krosnick is University Fellow at Resources for the Future. Please direct all correspondence to Josh Pasek, Assistant Professor, Department of Communication Studies, 105 S. State Street, Ann Arbor, MI 48109, or Jon Krosnick, 432 McClatchy Hall, Stanford University, Stanford, CA 94305, email: [email protected].

2012 Voting and Racism
Dec 19, 2015
racism
Welcome message from author
This document is posted to help you gain knowledge. Please leave a comment to let me know what you think about it! Share it to your friends and learn new things together.
Transcript
1
The Impact of Anti-Black Racism on Approval of Barack Obama’s Job Performance
and on Voting in the 2012 Presidential Election
Josh Pasek
University of Michigan
Jon A. Krosnick
Stanford University
Trevor Tompson
NORC at the University of Chicago
October, 2012
Jon Krosnick is University Fellow at Resources for the Future. Please direct all correspondence to Josh Pasek, Assistant Professor, Department of Communication Studies, 105 S. State Street, Ann Arbor, MI 48109, or Jon Krosnick, 432 McClatchy Hall, Stanford University, Stanford, CA 94305, email: [email protected].
2
The Impact of Anti-Black Racism on Approval of Barack Obama’s Job Performance
and on Voting in the 2012 Presidential Election
Executive Summary
Anti-Black attitudes became slightly more common between 2008 and 2012.
Sizable proportions of both Democrats and Republicans manifested anti-
Black attitudes, though anti-Black attitudes were more common among
Republicans than among Democrats.
People who identified themselves as Republicans in 2012 expressed anti-
Black attitudes more often than did Republican identifiers in 2008.
People with more negative attitudes toward Blacks were less likely to
approve of President Obama’s job performance.
The influence of racial attitudes on approval of Mr. Obama’s job performance
decreased between 2010 and 2012.
If anti-Black attitudes had been converted to be neutral, about 2 to 3
percentage points more people would have approved of President Obama’s
job performance in 2010 and 2012.
If both anti-Black and pro-Black attitudes had been converted to be neutral,
the proportion of Americans disapproving of President Obama’s job
performance would have been 1 to 3 percentage points lower in both 2010
and 2012.

3
In 2012, holding negative attitudes toward Blacks increased the likelihoods
of voting for Mr. Romney and not voting at all and decreased the likelihood of
voting for Mr. Obama.
Neutralizing anti-Black attitudes led to a projected increase in Mr. Obama’s
2012 vote share of 4 percentage points and a projected decrease in Mr.
Romney’s 2012 vote share of 5 percentage points.
Converting both anti-Black and pro-Black attitudes to neutral led to a
projected increase in Mr. Obama’s 2012 vote share of 2 percentage points
and a projected decrease in Mr. Romney’s 2012 vote share of 3 percentage
points.
The Impact of Anti-Black Racism on Approval of Barack Obama’s Job Performance
and on Voting in the 2012 Presidential Election
Many scholarly investigations suggest that anti-Black attitudes have had a
moderate influence on the outcome of the 2008 U.S. presidential election. Some
individuals with anti-Black sentiments seem to have voted for John McCain when
they would otherwise have voted for President Obama or abstained (see, e.g., Pasek
et al., 2009). A variety of estimates using differing data sources and relying on
various plausible assumptions projected that President Obama would have received
between two and 12 additional percentage points of the vote had anti-Black
attitudes in America been neutral instead (Highton, 2011; Hutchings, 2010; Jackman
& Vavreck, 2011; Lewis-Beck & Tien, 2008; Piston, 2010; Schaffner, 2011).
Since 2008, the American people have learned a great deal about President
Obama. For a variety of reasons, this additional exposure could lead to changes in
the amount and influence of anti-Black attitudes in 2012. A large body of research
in social psychology illustrates that non-contentious intergroup contact often
results in diminished prejudice (Pettigrew, 1998). And by gaining a great deal of
information about Mr. Obama and his actions during the last 4 years, Americans are
poised to evaluate him on the basis of such information rather than making
inferences based on his group membership, a process known as individuation
(Neuberg & Fiske, 1987). Or Americans could engage in “subtyping”, whereby they
come to view their attitudes toward Blacks in general as only minimally relevant to

5
Mr. Obama, if people view him as an atypical Black, to whom conventional
stereotypes do not apply.
Alternatively, if some Americans view President Obama’s policies and actions
as motivated toward advancing the interests of Blacks at the expense of Whites,
those people today may be inclined to use their attitudes toward Blacks to evaluate
Mr. Obama (cf. Tesler & Sears, 2010a; 2010b; Valentino & Brader, 2011; Wilson &
Davis, 2012).
If people did engage in subtyping, then it is unlikely that learning about Mr.
Obama would have changed more general anti-Black sentiments in the nation. But if
people learned about Mr. Obama and generalized their feelings toward him and
beliefs about him to other Blacks, then the nation’s evaluations of Blacks might have
become more positive or more negative, depending on people’s reactions to him.
In this paper, we explore the extent of implicit and explicit anti-Black
attitudes in 2012 and the degree to which such attitudes shape the American
public’s evaluations of Mr. Obama’s performance in office and their intentions
regarding voting in the 2012 election. In doing so, we compare the current extent
and impact of prejudice now with their extent and impact in previous years.
Method
Data
Data come from three surveys conducted by the Associated Press, GfK
(formerly Knowledge Networks), Stanford University, and – in the case of the most
recent data – the University of Michigan. All data were collected by GfK from
representative probability samples of American adults who were recruited via mail

6
and telephone to complete questionnaires regularly via the Internet. Data for the
first survey were collected from 2,228 individuals between August 25 and
September 8, 2008. Data for the second survey were collected between December
23, 2009, and January 10, 2010, from 1,037 respondents. The third survey involved
data collected from 1,071 individuals between August 30 and September 11, 2012.
We refer to these surveys as the 2008, 2010, and 2012 surveys, respectively.
All three surveys’ data were weighted to match Current Population Survey
statistics on all American adults at the time of each data collection.
Explicit Racial Attitudes (Symbolic Racism)
Explicit racial attitudes were gauged using questions designed to measure
“Symbolic Racism” (Henry & Sears, 2002). The questions, averaged into a single
index, were:
“Irish, Italians, Jewish1, and other minorities overcame prejudice and worked
their way up. Blacks should do the same without special favors.” (Coding:
Strongly disagree = 0, Somewhat disagree = .25, Neither agree nor disagree
= .50, Somewhat agree = .75, Strongly agree = 1).
“Generations of slavery have created conditions that make it difficult for
Blacks to work their way out of the lower class.” (Coding: Strongly agree = 0,
Somewhat agree = .25, Neither agree nor disagree = .50, Somewhat disagree
= .75, Strongly disagree = 1).
“It’s really a matter of some people just not trying hard enough; if Blacks
would only try harder, they could be just as well off as whites.” (Coding:
1 This word was changed to “Jews” in the 2012 survey.
7
Strongly disagree = 0, Somewhat disagree = .25, Neither agree nor disagree
= .50, Somewhat agree = .75, Strongly agree = 1).
“Over the past few years, Blacks have gotten less than they deserve.” (Coding:
Strongly agree = 0, Somewhat agree = .25, Neither agree nor disagree = .50,
Somewhat disagree = .75, Strongly disagree = 1).
“Over the past few years, Blacks have gotten more economically than they
deserve.” (Coding: Strongly disagree = 0, Somewhat disagree = .25, Neither
agree nor disagree = .50, Somewhat agree = .75, Strongly agree = 1).
“Some people say that Black leaders have been trying to push too fast. Others
feel that they haven’t pushed fast enough. What do you think?” (Coding:
Haven’t pushed fast enough = 0, Pushing at about the right speed = .50,
Trying to push too fast = 1).
“How much of the racial tension that exists in the United States today do you
think Blacks are responsible for creating?” (Coding: Not much at all = 0, Some
= .33, Most = .67, All of it = 1).
“How much discrimination against Blacks do you feel there is in the United
States today, limiting their chances to get ahead?” (Coding: A lot = 0, Some
= .33, A little = .67, None at all = 1).
Implicit Racial Attitudes (AMP)
Implicit racial attitudes were measured using the Affect Misattribution
Procedure (AMP). Respondents saw a series of Chinese ideographs, one at a time,
and assigned each one to one of two categories, more pleasant and less pleasant,
placing approximately half of the ideographs in each. After respondents completed

8
a sequence of practice trials during which only ideographs were shown, more
ideographs were shown, but each one was preceded by a quick flash of a photograph
of the face of either an African-American male or a White male (24 of each were
used). When a face precedes an ideograph, people’s affective reactions to the face
influence their later assessments of the ideograph (Payne, Cheng, Govorun, &
Stewart, 2005). People who have favorable feelings toward the face are more likely
to label the ideograph as pleasant, and people who have unfavorable feelings toward
the face are more likely to label the ideograph as unpleasant.
Two scores were calculated for each respondent: the proportion of trials
rated as pleasant when an African-American face was shown, and the proportion
rated as pleasant when a White face was shown. We subtracted the score for trials
with African-American faces from the score for trials with White faces and then
recoded the result to range from 0 (meaning all ideographs preceded by African-
American faces were labeled as more pleasant and all ideographs preceded by
White faces were labeled as less pleasant) to 1 (meaning all ideographs preceded by
African-American faces were labeled as more pleasant and all ideographs preceded
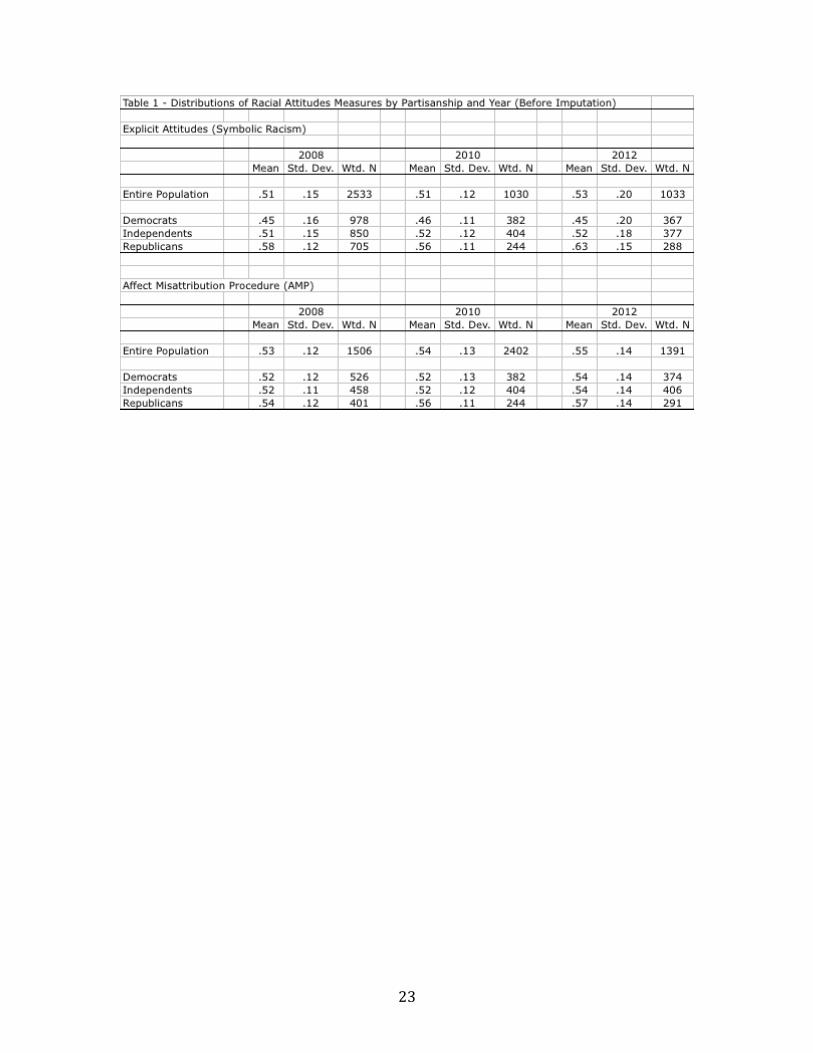
by White faces were labeled as less pleasant). Descriptive statistics for racial
attitude measures are shown in Table 1.
Approval of President Obama’s Job Performance
Respondents in 2010 and 2012 were asked:
“Overall, do you approve, disapprove, or neither approve nor disapprove of
the way Barack Obama is handling his job as President?” “Strongly approve”,
9
“Somewhat approve”, “Have mixed feelings”, “Somewhat disapprove”, and
“Strongly disapprove.”
Turnout
Respondents were determined to be “likely voters” or not during 2008 and
2012 using responses to five questions.
Turnout likelihood. Respondents in 2008 and 2012 were asked, “On
[November 6, 2012/November 4, 2008], the election for President will be held.
Using a 1-to-10 scale, where 10 means you are completely certain you will vote and
1 means you are completely certain you will NOT vote, how likely are you to vote in
the upcoming presidential election? You can use any number between 1 and 10 to
indicate how strongly you feel about your likelihood to vote.” Respondents who
selected 8, 9, or 10 were classified as having a moderate or greater turnout
likelihood. Respondents who selected 10 were classified as having a high turnout
likelihood. People who selected any other answer were classified as having a low
turnout likelihood.
Registration status. Respondents in 2008 and 2012 were asked, “Are you
registered to vote?” Response options were “Yes, at my current address”, “Yes, but
at a different address”, “No”, and “Not Sure”. Respondents who selected “Yes, at my
current address” were coded as registered, and all other respondents were coded as
not registered.
Voted in a prior election. Respondents in 2008 were asked, “In talking to
people about elections, we often find that a lot of people were not able to vote
because they weren’t registered, they were sick, or they just didn’t have time.

10
Which one of the following statements best describes you?” Response options were
“I did not vote in the 2004 presidential election”, “I'm sure I voted in the 2004
presidential election”, “I thought about voting in the 2004 presidential election, but
didn’t”, and “I usually vote, but didn't in the 2004 presidential election”.
Respondents who answered “I'm sure I voted in the 2004 presidential election”
were classified as prior voters, all other individuals were considered non-prior
voters.
Respondents in 2012 were asked, “Did you happen to have voted in the 2008
election?” Individuals who responded “Yes” were classified as prior voters, and all
others were considered non-prior voters.
Know where to vote. Respondents in 2008 and 2012 were asked, “Do you
happen to know where people in your neighborhood go to vote, or not?”
Respondents who answered “Yes” were classified as knowing where to vote, and
those who answered “No” were classified as not knowing.
Identifying likely voters. Individuals were classified as likely voters if they
were registered, knew where to vote, and either reported high turnout likelihood,
reported moderate turnout likelihood and voted in the prior election and reported
voting frequently, or reported moderate turnout likelihood and were too young to
have voted in past presidential elections.
Candidate Choice
In 2012, respondents were asked, “If the 2012 general election for President
were being held today and these were the candidates, would you vote for…”
Response options were, “Barack Obama, the Democrat”, “Mitt Romney, the

11
Republican”, “Gary Johnson, the Libertarian”, ”Jill Stein, the Green Party candidate”,
“Someone else”, and “Don’t know”. The order of the first two candidates was
randomized.
Respondents who answered “Don’t Know” were asked, “If you had to choose,
is there one of these candidates that you lean more towards?” Response options
were “Barack Obama, the Democrat”, “Mitt Romney, the Republican”, “Gary Johnson,
the Libertarian”, ”Jill Stein, the Green Party candidate”, “No, don’t lean toward any of
these candidates”, and “Don’t know”.
Responses to both of these questions and the turnout question were used to
assign each respondent to one of four categories: (1) a likely voter who would vote
for President Obama, (2) a likely voter who would vote for Mitt Romney, (3) a likely
voter who would vote for a Non-Major Party Candidate (Bob Barr, Ralph Nader,
Gary Johnson, or Jill Stein, Someone else, or No, don’t lean toward any of these
candidates), or someone not categorized as a likely voter.
Additional Measures
Additional measures used in the analyses are shown in Appendix A.
Multiple Imputation
We created five datasets, one for each year, and one for each adjacent year
pair: 2008-2010 and 2010-2012. To replace missing values in each dataset, we
implemented multiple imputation with deletion via chained equations (MICE).
Because multiple imputation relies on Monte Carlo simulations, imputed values for a
variable varied slightly across datsets, leading to slight differences in the coefficient
for the variable in multiple-year equations than in single-year equations.

12
Results
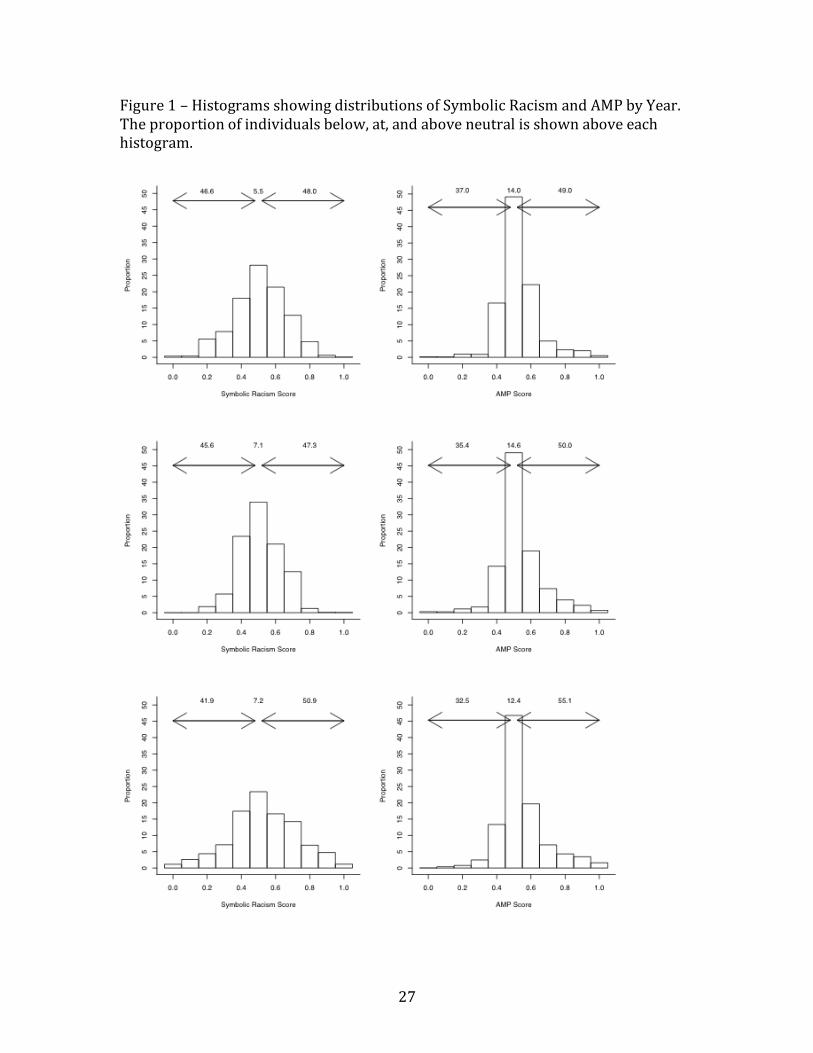
Distribution of Racial Attitudes
The proportion of Americans expressing explicit anti-Black attitudes held
steady between 47.6% in 2008 and 47.3% in 2010, and increased slightly and
significantly to 50.9% in 2012. The proportion of Americans explicitly expressing
pro-Black attitudes declined slightly from 46.7% in 2008 to 45.6% in 2010 and
41.9% in 2012 (see column 1 of Figure 1; 2=10.0(4) p=.04 for both comparisons).
Thus, anti-Black attitudes increased by 3.3 percentage points between 2008 and
2012, and pro-Black attitudes decreased by 4.8 percentage points during that time.2
Similarly, the proportion of Americans manifesting anti-Black attitude scores
on the implicit measure increased from 49.3% in 2008 to 51.1% in 2010 and 55.7%
in 2012. And the proportion of American receiving pro-Black attitudes scores
declined from 36.5% in 2008 to 35.5% in 2010 and 32.4% in 2012 (see column 2 of
Figure 1; 2=10.0(4) p=.04 for both comparisons). Thus, anti-Black attitudes
increased by 6.4 percentage points from 2008 to 2012, and pro-Black attitudes
decreased by 4.1 percentage points during that time (for the distributions of
attitudes, see Figure 1).3
Racial Attitudes of Democrats, Republicans, and Independents
Consistent with past research (Sniderman & Carmines, 1997; Tesler & Sears,
2010b), explicit anti-Black attitudes were more common among Republicans than
2 The mean of explicit attitudes was relatively constant from .507 in 2008 to .508 in 2010 and increased significantly (p<.001) to .529 in 2012. 3 The mean of implicit attitudes shifted from .526 in 2008 to .534 in 2010 (p<.04) and increased to .548 in 2012 (p<.04).

13
among Democrats in all years. In 2008, the proportion of people expressing anti-
Black attitudes was 31% among Democrats, 49% among independents, and 71%
among Republicans, highly significant differences (p<.001). In 2012, the proportion
of people expressing anti-Black attitudes was 32% among Democrats, 48% among
independents, and 79% among Republicans, again highly significant differences
(p<.001).
The gap between Democrats and Republicans was significantly greater in
2012 than it was in 2008 (p=.004), though much of the change may be attributable
to differences between people who called themselves Republicans in 2008 and
people who called themselves Republicans in 2012. The extent of explicit anti-Black
attitudes was notably larger in the latter of these groups than in the former (71% vs.
79%). In contrast, the extent of explicit anti-Black attitudes was equivalent among
people who called themselves Democrats in 2008 and people who called themselves
Democrats in 2012 (31% vs. 32%).
Implicit anti-Black attitudes manifested almost the identical pattern but with
smaller differences between the parties, higher apparent levels of anti-Black
attitudes among Democrats, and lower apparent levels of such attitudes among
Republicans. In 2008, the proportion of people expressing anti-Black attitudes was
46% among Democrats, 48% among independents, and 53% among Republicans,
statistically significant differences (p=.03). In 2012, the proportion of people
expressing anti-Black attitudes was 55% among Democrats, 49% among
independents, and 64% among Republicans, again highly significant differences
(p<.001).
14
Approval of President Obama’s Performance
In an ordinal logistic regression predicting job approval in 2012 using a
variety of demographic variables as well as party identification, liberal-conservative
ideology, and both measures of racial attitudes, more explicit anti-Black attitudes
were strongly associated with lower likelihood of approval (b=-2.87, p<.001; Table
2).4 Controlling for explicit attitudes, implicit racial attitudes explained no
additional variance in approval (b=.64, p=.16).5
With existing racial attitudes in 2012, the model predicts that 34.5% of
people would approve of President Obama’s performance, 37.7% would disapprove,
and 27.7% would neither approve nor disapprove (results not far from the raw
survey’s actual results that 35.0% of Americans approved of the President’s
4 According to earlier studies of racial attitudes (cf. Pasek et al., 2009), this model provides a middle-of-the-road estimate of the influence of racial attitudes on job approval. We estimated the parameters of two additional equations to understand the potential range of the influence that racial attitudes might have had: (1) a parsimonious equation predicting approval of President Obama’s performance using only racial attitudes and demographic variables, and (2) an enhanced equation including all of the predictors in the primary equation and also including perceptions of the economy and of a variety of President Obama’s traits.
Using parameter estimates generated for each of these equations, we predicted the proportions of individuals who would be expected to give approving, disapproving, and neutral answers (1) at actual levels of racial attitudes, (2) if all anti-Black sentiment were transformed to be neutral, and (3) if everyone held neutral racial attitudes. In the most parsimonious model, with anti-Black attitudes neutralized, President Obama’s approval would have been 40.2% and his disapproval would have been 28.9%, with 30.8% expressing mixed feelings. With all racial attitudes neutralized, job approval would have been 34.3%, disapproval would have been 32.8%, and mixed feelings would also have comprised 32.8% of the population. In the most exhaustive model, with anti-Black attitudes neutralized, President Obama’s job approval would have been 34.4%, with 37.1% disapproving and 28.5% neutral. With all racial attitudes neutralized, 34.0% would have approved of the president’s performance with 37.2% disapproving and 28.7% neutral. 5 Implicit attitudes were not significantly related even when explicit attitudes were removed from the model.
15
performance, 37.8% disapproved, and 27.2% neither approved nor disapproved).
If anti-Black sentiments were transformed to be neutral, the model predicts that
36.6% would approve, 34.2% would disapprove, and 29.1% would neither approve
nor disapprove. That is, the proportion approving would be expected to increase by
two percentage points. If we were to neutralize both pro-and anti-Black attitudes,
the model predicts that 33.8% would approve, 35.6% would disapprove, and 30.6%
would neither approve nor disapprove, a net decrease in disapproval of 1.5
percentage points.6
6 Predicted values of approval were created in each imputation iteration for each respondent based on the estimated parameters of ordinal logit regression equations. Using each respondent’s levels of anti-Black attitudes, demographic characteristics, partisanship, and ideology, he or she was assigned a predicted probability for each of the five levels of approval. A weighted average of these probabilities produced an estimate of the distribution of approval across all outcomes for each of the imputation iterations. These averages were then averaged to produce an estimated predicted probability for each level of approval for the entire sample. The “strongly approve” and “somewhat approve” categories were combined to produce a predicted probability of approving. The “strongly disapprove” and “somewhat disapprove” categories were combined to produce an estimated probability of disapproval.
To produce estimate probabilities with no anti-Black attitudes, values of both Symbolic Racism and the AMP that were above .5 were replaced with values of .5 in each of the imputation iterations when producing predicted values. To produce estimates with no pro-Black or anti-Black attitudes, all values of the AMP and Symbolic Racism were set to .5.
Because the Symbolic Racism measure did not have an obvious neutral point, we identified the neutral point empirically using a variety of other measures of anti-Black attitudes that did have obvious neutral points According to the 2008, 2010, and 2012 survey data, means and medians (both weighted and unweighted) of Symbolic Racism were consistently very close to .50 among individuals who were neutral on these other measures of anti-Black attitudes. The other measures used were the AMP, two questions asking about whether respondents liked or disliked Blacks and Whites (neutral respondents were those who answered identically for Blacks and Whites), and stereotypes (friendly, determined to succeed, law abiding, hard-working, intelligent at school, smart at everyday things, good neighbors, dependable, keep up their property, violent, boastful, complaining, lazy and irresponsible) of Blacks and Whites (again, neutral respondents were those whose
16
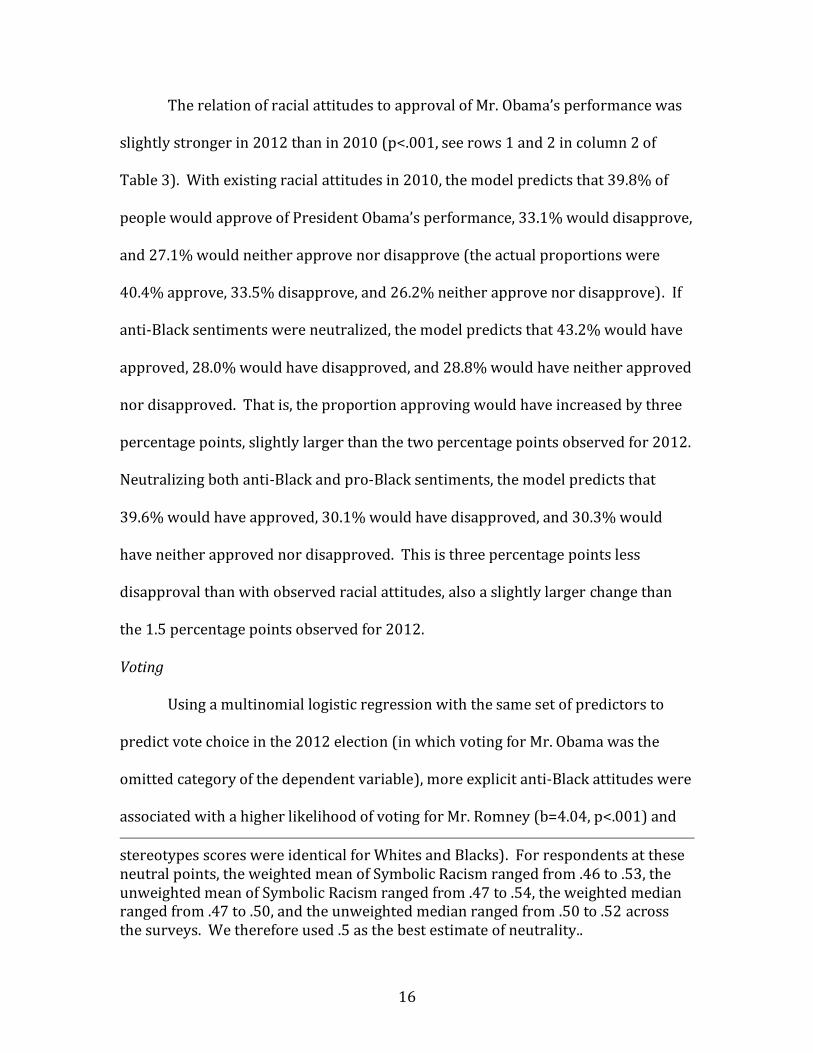
The relation of racial attitudes to approval of Mr. Obama’s performance was
slightly stronger in 2012 than in 2010 (p<.001, see rows 1 and 2 in column 2 of
Table 3). With existing racial attitudes in 2010, the model predicts that 39.8% of
people would approve of President Obama’s performance, 33.1% would disapprove,
and 27.1% would neither approve nor disapprove (the actual proportions were
40.4% approve, 33.5% disapprove, and 26.2% neither approve nor disapprove). If
anti-Black sentiments were neutralized, the model predicts that 43.2% would have
approved, 28.0% would have disapproved, and 28.8% would have neither approved
nor disapproved. That is, the proportion approving would have increased by three
percentage points, slightly larger than the two percentage points observed for 2012.
Neutralizing both anti-Black and pro-Black sentiments, the model predicts that
39.6% would have approved, 30.1% would have disapproved, and 30.3% would
have neither approved nor disapproved. This is three percentage points less
disapproval than with observed racial attitudes, also a slightly larger change than
the 1.5 percentage points observed for 2012.
Voting
Using a multinomial logistic regression with the same set of predictors to
predict vote choice in the 2012 election (in which voting for Mr. Obama was the
omitted category of the dependent variable), more explicit anti-Black attitudes were
associated with a higher likelihood of voting for Mr. Romney (b=4.04, p<.001) and
stereotypes scores were identical for Whites and Blacks). For respondents at these neutral points, the weighted mean of Symbolic Racism ranged from .46 to .53, the unweighted mean of Symbolic Racism ranged from .47 to .54, the weighted median ranged from .47 to .50, and the unweighted median ranged from .50 to .52 across the surveys. We therefore used .5 as the best estimate of neutrality..

17
was associated with a higher likelihood of not voting at all (b=1.65, p=.007; see
Table 4). Controlling for the impact of explicit anti-Black attitudes, implicit racial
attitudes explained no additional variance in electoral choices.
Given current actual levels of anti-Black attitudes, the model predicts that the
President would receive 47.1% of the vote and that Mr. Romney would receive
41.8% of the vote. Transforming all anti-Black attitudes into neutral attitudes,
President Obama is predicted to receive 51.1% of the vote, 4.0 percentage points
more than currently. Mr. Romney is predicted to receive 37.2% of the vote, 4.6
percentage points fewer than currently. Neutralizing pro-Black attitudes as well
results in a predicted 49.1% of the vote share for President Obama, yielding a net
benefit of two percentage points. Mr. Romney would be expected to get 39.0% of
the vote under these conditions.7
Discussion
These analyses suggest that Mr. Obama’s approval rating has been 2 to 3
percentage points lower in 2010 and 2012 than it would have been in the absence of
anti-Black attitudes. And the impact of such attitudes on Mr. Obama’s and Mr. 7 We estimated the parameters of the parsimonious and exhaustive models predicting electoral choice to assess the potential range of the effects of racial attitudes. In the most parsimonious model, President Obama is predicted to receive 44.6% of the vote to Mr. Romney’s 46.1% of the vote under actual levels of racial attitudes. After neutralizing anti-Black attitudes, Mr. Obama is predicted to get 55.5% of the vote, compared to Mr. Romney’s 34.1% of the vote. If anti- Black and pro-Black attitudes are neutralized, Mr. Obama is predicted to get 49.5% of the vote, and Mr. Romney is predicted to get 39.8% of the vote. In the exhaustive model, President Obama is predicted to get 44.5% of the vote, and Mr. Romney is predicted to get 45.0% of the vote under actual levels of racial attitudes. After neutralizing anti-Black attitudes, Mr. Obama is predicted to get 44.7% of the vote, compared to Mr. Romney’s 43.6% of the vote. If anti- Black and pro-Black attitudes are neutralized, Mr. Obama is predicted to get 45.2% of the vote, and Mr. Romney is predicted to get 44.0% of the vote.
18
Romney’s vote shares appear to be 4 to 5 percentage points. These latter numbers
are quite similar to our estimate that Mr. Obama may have lost about 5 percentage
points of the popular vote in 2008 due to anti-Black attitudes (Pasek et al. 2009).
According to both explicit and implicit measures of racial attitudes, it appears
that the Obama Administration has not been a time of decline in anti-Black attitudes
in America. Indeed, these data suggest that anti-Black attitudes have become
slightly more prevalent over those years, especially during the last two years.
Anti-Black attitudes appeared at notable levels among Democrats,
independents, and Republicans, but at higher rates among Republicans than
Democrats. This gap was larger according to the explicit attitude measure than
according to the implicit measure. Thus, Democrats and Republicans appear more
similar at the implicit level than at the explicit level.
These estimates of the possible impact of anti-Black attitudes on
performance evaluations and voting are based on a series of assumptions, so the
results should be interpreted recognizing the role that these assumptions may play.
For example, estimates regarding 2012 voting behavior are based upon data
collected in late August and early September. And the question we asked to assess
candidate choice began “if the . . . election . . . were being held today”, thus asking
respondents to make their choice based on current knowledge, not based on
guesses about what will occur later. Many events have happened since then and will
continue to occur as we approach election day, and these events may alter the
impact of anti-Black attitudes.
19
A second assumption underlying this analysis is that the implicit and explicit
measures assess racial attitudes and only racial attitudes. Some scholars have
speculated that the survey questions used here purporting to tap Symbolic Racism
may tap other constructs (Tesler & Sears, 2010b). If such confounding is present,
the apparent impact of anti-Black attitudes here may be partly or mainly due to
other constructs. To minimize this likelihood, we report results controlling for
other variables. So it is best to think of the effects reported here as upper-bound
estimates.
Conclusion
In sum, these results suggest that anti-Black sentiment seems to have
increased slightly in America over the course of Mr. Obama’s term and that this
sentiment may be shaping evaluations of Mr. Obama’s presidency as well as the
likelihood that individuals will vote for him in 2012.
20
References
Block, R., Jr. (2011). Backing Barack Because He's Black: Racially Motivated Voting
in the 2008 Election. Social Science Quarterly, 92(2), 423–446.
doi:10.1111/j.1540-6237.2011.00776.x
Henry, P. J., & Sears, D. O. (2002). The Symbolic Racism 2000 Scale. Political
Psychology, 23(2), 253–283. doi:10.1111/0162-895X.00281
Highton, B. (2011). Prejudice Rivals Partisanship and Ideology When Explaining the
2008 Presidential Vote across the States. PS: Political Science and Politics, 44(03),
530–535. doi:10.1017/S104909651100062X
Hutchings, V. L. (2010). Change or More of The Same?: Evaluating Racial Attitudes in
the Obama Era. Public Opinion Quarterly, 73(5), 917–942.
doi:10.1093/poq/nfp080
Jackman, S., & Vavreck, L. (2011). How Does Obama Match-Up? Counterfactuals &
the Role of Obama's Race in 2008.
Lewis-Beck, M. S., & Tien, C. (2008). The Job of President and the Jobs Model
Forecast: Obama for '08? PS: Political Science and Politics, 41(04), 1–4.
doi:10.1017/S1049096508081262
Moore, D. W. (2008). The Opinion Makers: An Insider Exposes the Truth Behind the
Polls. Beacon Press.
Neuberg, S. L., & Fiske, S. T. (1987). Motivational influences on impression
formation: Outcome dependency, accuracy-driven attention, and individuating
processes. Journal of Personality and Social Psychology, 53(3), 431–444.
doi:10.1037/0022-3514.53.3.431

21
Pasek, J., Tahk, A., Lelkes, Y., Krosnick, J. A., Payne, B. K., Akhtar, O., & Tompson, T.
(2009). Determinants of Turnout and Candidate Choice in the 2008 U.S.
Presidential Election: Illuminating the Impact of Racial Prejudice and Other
Considerations. Public Opinion Quarterly, 73(5), 943–994.
doi:10.1093/poq/nfp079
Payne, B. K., Cheng, C. M., Govorun, O., & Stewart, B. D. (2005). An inkblot for
attitudes: Affect misattribution as implicit measurement. Journal of Personality
and Social Psychology, 89(3), 277–293. doi:10.1037/0022-3514.89.3.277
Payne, B. K., Krosnick, J. A., Pasek, J., Lelkes, Y., Akhtar, O., & Tompson, T. (2010).
Implicit and explicit prejudice in the 2008 American presidential election.
Journal of Experimental Social Psychology, 46(2), 367–374.
doi:10.1016/j.jesp.2009.11.001
Pettigrew, T. F. (1998). Intergroup Contact Theory. Annual Review of Psychology,
49(1), 65–85. doi:10.1146/annurev.psych.49.1.65
Philpot, T. S., Shaw, D. R., & McGowen, E. B. (2010). Winning the Race: Black Voter
Turnout in the 2008 Presidential Election. Public Opinion Quarterly, 73(5), 995–
1022. doi:10.1093/poq/nfp083
Piston, S. (2010). How Explicit Racial Prejudice Hurt Obama in the 2008 Election.
Political Behavior, 32(4), 431–451. doi:10.1007/s11109-010-9108-y
Schaffner, B. F. (2011). Racial Salience and the Obama Vote. Political Psychology,
32(6), 963–988. doi:10.1111/j.1467-9221.2011.00848.x
Sniderman, P. M., & Carmines, E. G. (1997). Reaching beyond race. Harvard
University Press.

22
Tesler, M., & Sears, D. (2010a). President Obama and the Growing Polarization of
Partisan Attachments by Racial Attitudes and Race. Presented at the Annual
Meeting of the American Political Science Association, Washington, DC.
Tesler, M., & Sears, D. O. (2010b). Obama's Race. Chicago: University Of Chicago
Press.
Valentino, N. A., & Brader, T. (2011). The Sword's Other Edge: Perceptions of
Discrimination and Racial Policy Opinion after Obama. Public Opinion Quarterly,
75(2), 201–226. doi:10.1093/poq/nfr010
Wilson, D., & Davis, D. (2012). Racial Resentment and Targeted Anger at Barack
Obama and the Federal Government. Presented at the Annual Meeting of the
American Political Science Association, New Orleans, LA.
23

24

25

26
27
Figure 1 – Histograms showing distributions of Symbolic Racism and AMP by Year. The proportion of individuals below, at, and above neutral is shown above each histogram.

28
Appendix A –Wordings for Additional Measures
Age. Age was represented by a set of dummy variables for six categories: 25–34, 35–44, 45–54, 55–64, 65–74, and 75 or older. Respondents ages 18–24 constituted the omitted, comparison category. Education. Respondents were asked: “What is the highest degree or level of education that you have completed?” Education was represented by dummy variables for three levels: high school graduate, some college, and bachelors degree or higher. Respondents without a high school diploma constituted the omitted, comparison category. Income. Income was represented by a set of dummy variables for five annual income levels: $15,000–$34,999, $35,000–$59,999, $60,000–$74,999, $75,000–$99,999, and $100,000 or more. Respondents with incomes less than $15,000 constituted the omitted, comparison category. Region. Region was represented by a set of dummy variables for three census regions in the United States: Midwest, South, and West. Respondents living in the Northeast region constituted the omitted, comparison category. Female. A dummy variable was coded 1 for females and 0 for males. Race. In a series of dummy variables, respondents were coded as “White, Non-Hispanic”, “Black, Non-Hispanic”, “Hispanic”, or “Other/Multiple”. White, Non-Hispanic individuals represented the omitted comparison category. Party Identification. Respondents were asked: “Do you consider yourself a Democrat, Republican, an Independent, a supporter of some other party, or none of these?” Two dummy variables identified Democrats and Republicans. All others were treated as independents and were the omitted category. Ideology. Respondents were asked: “Generally speaking, do you consider yourself very liberal, somewhat liberal, moderate, somewhat conservative, or very conservative. Two dummy variables identified liberals and conservatives. All others were treated as moderates and were the omitted category.
Related Documents