School District of Lancaster 2011-2012 Student Survey Final Report Prepared for School District of Lancaster Prepared by Center for Opinion Research Franklin & Marshall College September 2012 Franklin & Marshall College Floyd Institute for Public Policy

Welcome message from author
This document is posted to help you gain knowledge. Please leave a comment to let me know what you think about it! Share it to your friends and learn new things together.
Transcript
School District of Lancaster 2011-2012 Student Survey
Final Report
Prepared for School District of Lancaster
Prepared by Center for Opinion Research Franklin & Marshall College
September 2012
Franklin & Marshall College
Floyd Institute for Public Policy
Table of Contents
Report Overview…………………………………………………………...………….
Survey Methodology………………………………………………………………....
Summary Report………………………………………………………………...……
Total Elementary School Marginal Frequency Report……………………….
Buchanan Elementary School Marginal Frequency Report...……….………….. Burrowes Elementary School Marginal Frequency Report ….……...………….. Carter & MacRae Elementary School Marginal Frequency Report ...….……… Fulton Elementary School Marginal Frequency Report ….……...…..………….. Hamilton Elementary School Marginal Frequency Report ….……......………… King Elementary School Marginal Frequency Report ….……...……..………..... Lafayette Elementary School Marginal Frequency Report ….……….………..... Martin Elementary School Marginal Frequency Report ….……..…………......... Price Elementary School Marginal Frequency Report ….……..…………........... Ross Elementary School Marginal Frequency Report ….……..……...…........... Washington Elementary School Marginal Frequency Report ….…….…........... Wharton Elementary School Marginal Frequency Report ….…….…........……..
Wickersham Elementary School Marginal Frequency Report ….……....………. Total Middle School Marginal Frequency Report…...………………..……..… Hand Middle School Marginal Frequency Report ….…….….…………….……… Lincoln Middle School Marginal Frequency Report …….….……….………..…… Reynolds Middle School Marginal Frequency Report …….….……….……..…… Wheatland Middle School Marginal Frequency Report …….……….………..….. Total High School Marginal Frequency Report…...……………………………. J.P. McCaskey High School Marginal Frequency Report ….…….…….............. McCaskey East High School Marginal Frequency Report ….…….……............. Buehrle High School Marginal Frequency Report …….……….…….……............ Phoenix High School Marginal Frequency Report …….……….…….……...........
4
3
B
C
D
E
F
G
H
I
J
K
L
M
N
O
P
Q
R
S
T
U
V
W
X
Y
A
School District of Lancaster 2011-2012 Student Survey
3
Report Overview
This report provides information about the School District of Lancaster 2011-2012 student
survey. The student survey was developed by Franklin & Marshall College staff in
collaboration with District staff. The data from the student survey is used to evaluate a number
of district programs. Included in this report are the following:
1. Survey Methodology – provides background information on the survey methodology,
including measures used, participants and sampling procedures, and survey procedures.
2. Summary Report – this report was presented to the School District of Lancaster School
Board Educational Excellence Committee on September 4, 2012. It summarizes selected
survey findings.
3. Marginal Frequency Reports – these reports display the actual question wording, order,
and results. The reports list each individual question and the percentage of responses for
each response category. Responses to some questions may total slightly more or slightly
less than 100% due to rounding. Comparison data is presented for items asked in previous
years.
Three grade span reports (elementary, middle, and high) are provided, along with building-
level reports. Building-level results are only provided if the sample size is 30 or higher.
Because Buehrle Alternative School and Phoenix Academy serve both middle and high
school students, separate middle and high school reports are provided for these buildings.
School District of Lancaster 2011-2012 Student Survey
4
Survey Methodology
Measures and Instrumentation
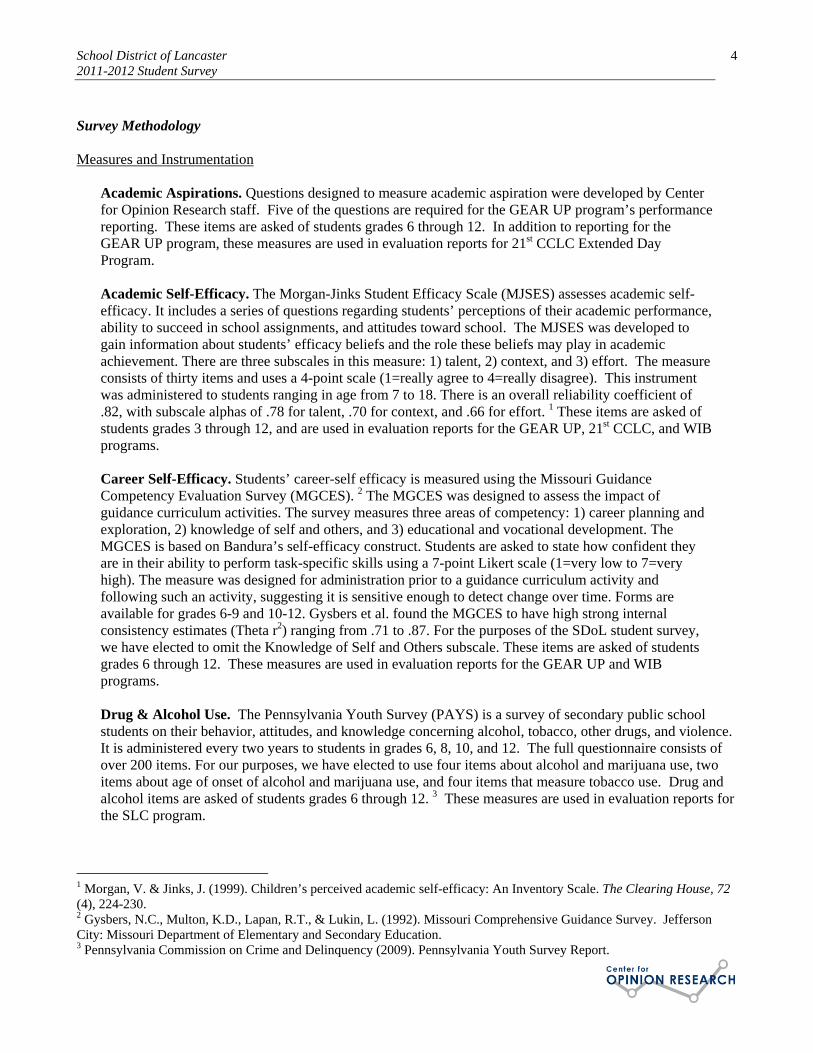
Academic Aspirations. Questions designed to measure academic aspiration were developed by Center for Opinion Research staff. Five of the questions are required for the GEAR UP program’s performance reporting. These items are asked of students grades 6 through 12. In addition to reporting for the GEAR UP program, these measures are used in evaluation reports for 21st CCLC Extended Day Program. Academic Self-Efficacy. The Morgan-Jinks Student Efficacy Scale (MJSES) assesses academic self-efficacy. It includes a series of questions regarding students’ perceptions of their academic performance, ability to succeed in school assignments, and attitudes toward school. The MJSES was developed to gain information about students’ efficacy beliefs and the role these beliefs may play in academic achievement. There are three subscales in this measure: 1) talent, 2) context, and 3) effort. The measure consists of thirty items and uses a 4-point scale (1=really agree to 4=really disagree). This instrument was administered to students ranging in age from 7 to 18. There is an overall reliability coefficient of .82, with subscale alphas of .78 for talent, .70 for context, and .66 for effort. 1 These items are asked of students grades 3 through 12, and are used in evaluation reports for the GEAR UP, 21st CCLC, and WIB programs.
Career Self-Efficacy. Students’ career-self efficacy is measured using the Missouri Guidance Competency Evaluation Survey (MGCES). 2 The MGCES was designed to assess the impact of guidance curriculum activities. The survey measures three areas of competency: 1) career planning and exploration, 2) knowledge of self and others, and 3) educational and vocational development. The MGCES is based on Bandura’s self-efficacy construct. Students are asked to state how confident they are in their ability to perform task-specific skills using a 7-point Likert scale (1=very low to 7=very high). The measure was designed for administration prior to a guidance curriculum activity and following such an activity, suggesting it is sensitive enough to detect change over time. Forms are available for grades 6-9 and 10-12. Gysbers et al. found the MGCES to have high strong internal consistency estimates (Theta r2) ranging from .71 to .87. For the purposes of the SDoL student survey, we have elected to omit the Knowledge of Self and Others subscale. These items are asked of students grades 6 through 12. These measures are used in evaluation reports for the GEAR UP and WIB programs. Drug & Alcohol Use. The Pennsylvania Youth Survey (PAYS) is a survey of secondary public school students on their behavior, attitudes, and knowledge concerning alcohol, tobacco, other drugs, and violence. It is administered every two years to students in grades 6, 8, 10, and 12. The full questionnaire consists of over 200 items. For our purposes, we have elected to use four items about alcohol and marijuana use, two items about age of onset of alcohol and marijuana use, and four items that measure tobacco use. Drug and alcohol items are asked of students grades 6 through 12. 3 These measures are used in evaluation reports for the SLC program.
1 Morgan, V. & Jinks, J. (1999). Children’s perceived academic self-efficacy: An Inventory Scale. The Clearing House, 72 (4), 224-230. 2 Gysbers, N.C., Multon, K.D., Lapan, R.T., & Lukin, L. (1992). Missouri Comprehensive Guidance Survey. Jefferson City: Missouri Department of Elementary and Secondary Education. 3 Pennsylvania Commission on Crime and Delinquency (2009). Pennsylvania Youth Survey Report.
School District of Lancaster 2011-2012 Student Survey
5
Bullying & Violence. Items from the Pennsylvania Youth Survey (PAYS) are also used to assess exposure to violence on school property. We included four items which measure frequency of threatened and actual attacks on school property over the last 12 months. We also included items related to cyberbullying. These items are asked of students grades 6 through 12. Emergency Management. Two questions designed to measure awareness of emergency management procedures at school were developed by Center staff. These questions are asked of students grades 3 through 12 and will be used to evaluate the REMS program. Food Services. Questions designed to measure satisfaction with school lunch services were developed by Center staff. These questions are asked of students in grades 6 through 12. Hidden Delinquency. Hidden delinquency will be measured using a 10-item, additive scale developed for the 1995 National Longitudinal Survey of Adolescent Health (Add Health).4 The Add Health survey was administered to a nationally representative sample of more than 20,000 adolescents in grades 7 through 12. Students self-report frequency of involvement in delinquent activities during the past year on a four-point scale from never (0) to five or more times (3). This scale has a Cronbach’s alpha reliability coefficient of .84. These items are asked of students grades 6 through 12. These measures can be used in evaluation reports for the 21st CCLC and SLC programs. Peer Academic Climate. McInerney’s Facilitating Conditions Questionnaire (FCQ) was designed to examine how external factors in students’ social environment may impact academic behavior and achievement. The FCQ was administered to students in grades 5-12. For the purposes of the student survey, we have chosen to use items measuring peer academic climate. These items have a reliability coefficient of .68 to .74.5 These items are asked of students grades 6 through 12. These measures can be used in evaluation reports for the SLC program. Perceptions of Police. Questions designed to measure perception of, confidence in, and comfort with police officers were developed by Center staff. These questions were originally designed for the Lancaster City Police’s TEAM Program Evaluation conducted by the Center in 2003. These items are asked of students grades 3 through 12. These measures can be used in evaluating the impact of the School Resource Officers. School Climate. Questions designed to measure school climate were developed by Center staff. Many of these questions were adopted and modified from questions asked of parents and community members in the SDoL Culture/Climate Survey conducted in 2005 by the Center. These items are asked of students grades 3 through 12, and are used to assess overall climate in the district. Social & Emotional Development. The Strengths and Difficulties Questionnaire (SDQ) consists of 25 items which relate to specific attributes and is designed to identify social-emotional delays in children. Each statement is rated on a three-point scale (0=not true, 1=somewhat true, or 2=certainly true). The 25 items are divided into five subscales: 1) conduct problems; 2) emotional symptoms; 3) hyperactivity; 4) peer problems; and 5) prosocial behavior. Subscales contain five items each. Three versions of this measure exist: the self-report form for ages 11-17, the parent or teacher form for ages 4-10, and the parent or teacher form for ages 11-17. This measure has high to strong test-retest reliability, an internal
4 Demuth, S. & Brown, S. L. (2004). Family structure, family processes, and adolescent delinquency: The significance of parental absence versus parental gender. Journal of Research in Crime and Delinquency, 41 (1), 58-81. 5 McInerney, D.M., Dowson, M., & Yeung, A.S. (2005). Facilitating conditions for school motivation: Construct Validity and Applicability. Educational and Psychological Measurement, 65 (6), 1046-1066.
School District of Lancaster 2011-2012 Student Survey
6
consistency coefficient of .61 to .82, and moderate predictive validity. 6 These items are asked of students grades 6 through 12.
Participants
The student survey is administered to all district students in grades 3 through 12. In order for a student to participate, the student’s parent or guardian must provide passive consent. That is, if parents do not wish for their child to participate, they must sign and return the survey opt-out form to the district. A notification is mailed to parents at least one month prior to survey administration summarizing the survey and detailing parental rights to opt their child out of participation.
Procedures
The survey is administered each spring to students during a designated time period. Center staff coordinates with district administration to determine the survey’s administration period. Each classroom teacher is provided an administration packet containing an instruction sheet, class roster, and accompanying survey packets. Questionnaires are printed by Scantron. Once the school district has provided the student data file, Scantron overprints the questionnaires with student school identification number. The student’s name appears on the front page of the survey packet for teacher distribution purposes. Once surveys have been distributed, this perforated front page can be removed by the student so that all responses remain confidential.
Forms There are three separate forms of the student survey for each of the three grade spans – elementary, middle, and high school. The Center coordinated with district personnel to develop forms that are age-appropriate, taking into consideration developmentally appropriate language and reading levels.
6 Goodman, R., Meltzer, H., & Bailey, V. (1998). The Strengths and Difficulties Questionnaire: A pilot study on the validity of the self-report version. European Child & Adolescent Psychiatry and Allied Disciplines, 7, 125-130.
Report A
Student Survey Summary Report
2011-2012 Student Survey Overview Franklin & Marshall College Berwood Yost and Kelly Frey, September 2012
1
School District of Lancaster 2011-2012 Student Survey
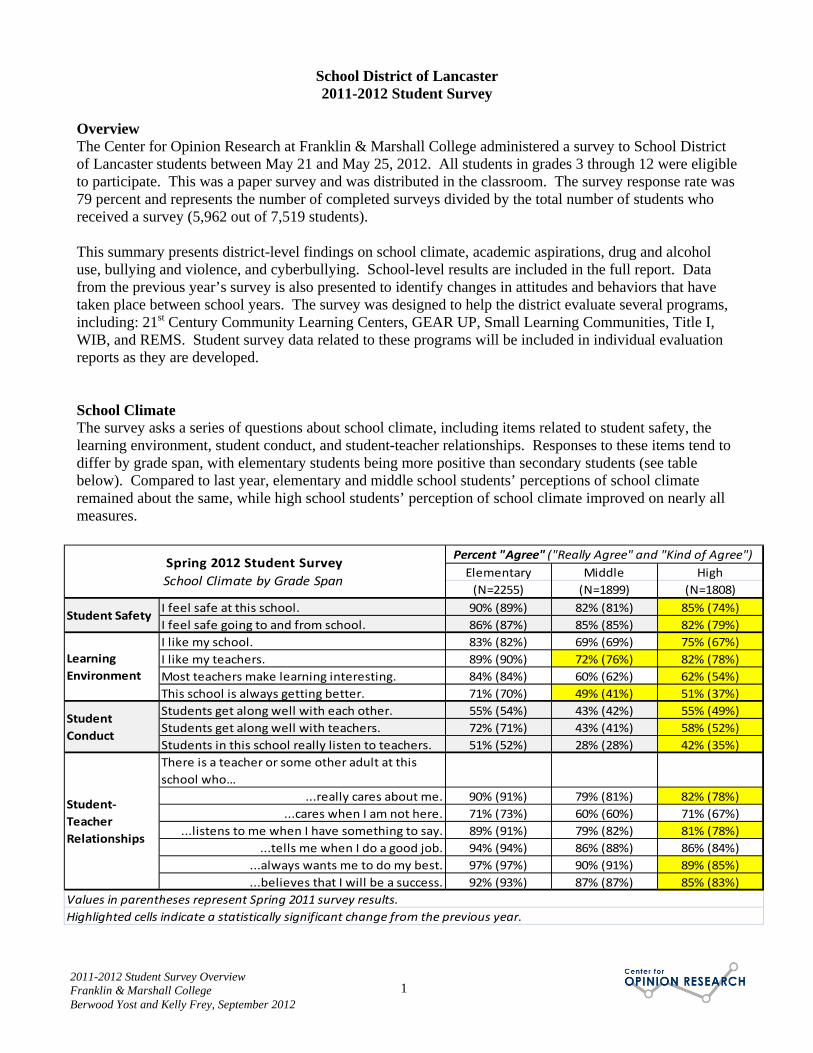
Overview The Center for Opinion Research at Franklin & Marshall College administered a survey to School District of Lancaster students between May 21 and May 25, 2012. All students in grades 3 through 12 were eligible to participate. This was a paper survey and was distributed in the classroom. The survey response rate was 79 percent and represents the number of completed surveys divided by the total number of students who received a survey (5,962 out of 7,519 students). This summary presents district-level findings on school climate, academic aspirations, drug and alcohol use, bullying and violence, and cyberbullying. School-level results are included in the full report. Data from the previous year’s survey is also presented to identify changes in attitudes and behaviors that have taken place between school years. The survey was designed to help the district evaluate several programs, including: 21st Century Community Learning Centers, GEAR UP, Small Learning Communities, Title I, WIB, and REMS. Student survey data related to these programs will be included in individual evaluation reports as they are developed. School Climate The survey asks a series of questions about school climate, including items related to student safety, the learning environment, student conduct, and student-teacher relationships. Responses to these items tend to differ by grade span, with elementary students being more positive than secondary students (see table below). Compared to last year, elementary and middle school students’ perceptions of school climate remained about the same, while high school students’ perception of school climate improved on nearly all measures.
Elementary Middle High
(N=2255) (N=1899) (N=1808)
I feel safe at this school. 90% (89%) 82% (81%) 85% (74%)
I feel safe going to and from school. 86% (87%) 85% (85%) 82% (79%)
I like my school. 83% (82%) 69% (69%) 75% (67%)
I like my teachers. 89% (90%) 72% (76%) 82% (78%)
Most teachers make learning interesting. 84% (84%) 60% (62%) 62% (54%)
This school is always getting better. 71% (70%) 49% (41%) 51% (37%)
Students get along well with each other. 55% (54%) 43% (42%) 55% (49%)
Students get along well with teachers. 72% (71%) 43% (41%) 58% (52%)
Students in this school really listen to teachers. 51% (52%) 28% (28%) 42% (35%)
There is a teacher or some other adult at this
school who…
...really cares about me. 90% (91%) 79% (81%) 82% (78%)
...cares when I am not here. 71% (73%) 60% (60%) 71% (67%)
...listens to me when I have something to say. 89% (91%) 79% (82%) 81% (78%)
...tells me when I do a good job. 94% (94%) 86% (88%) 86% (84%)
...always wants me to do my best. 97% (97%) 90% (91%) 89% (85%)
...believes that I will be a success. 92% (93%) 87% (87%) 85% (83%)
Highlighted cells indicate a statistically significant change from the previous year.
Values in parentheses represent Spring 2011 survey results.
Percent "Agree" ("Really Agree" and "Kind of Agree")Spring 2012 Student Survey
School Climate by Grade Span
Student Safety
Learning
Environment
Student‐
Teacher
Relationships
Student
Conduct
2011-2012 Student Survey Overview Franklin & Marshall College Berwood Yost and Kelly Frey, September 2012
2
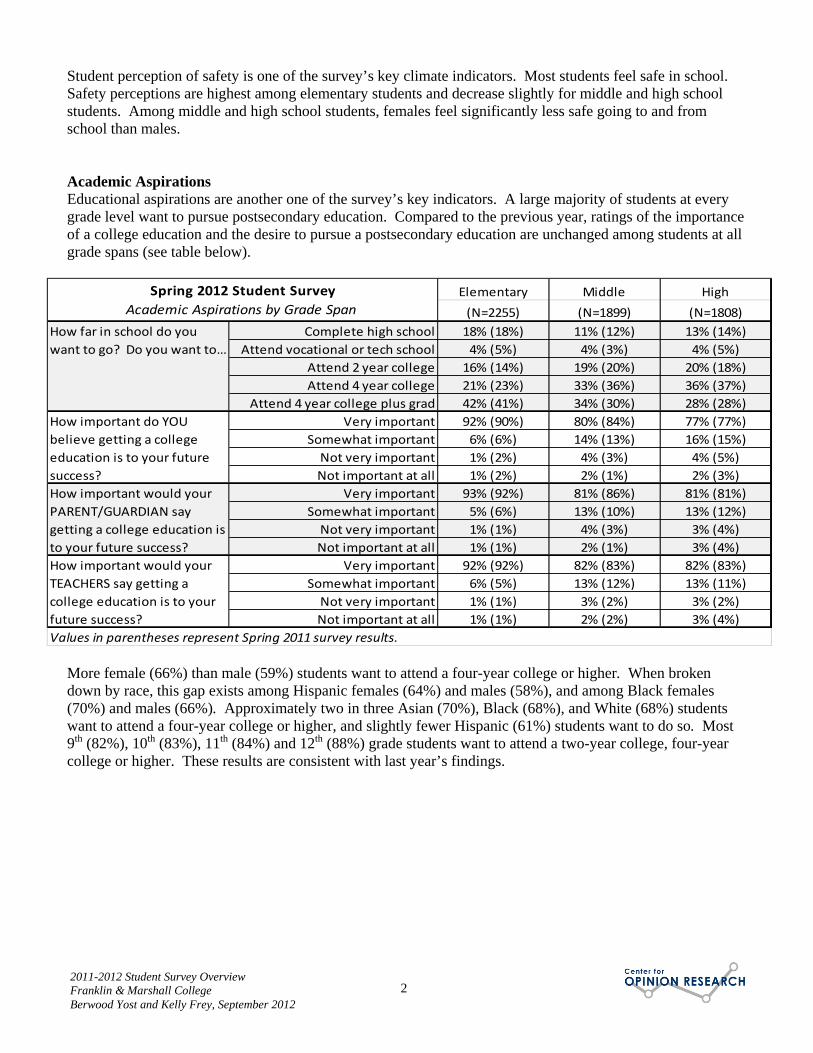
Student perception of safety is one of the survey’s key climate indicators. Most students feel safe in school. Safety perceptions are highest among elementary students and decrease slightly for middle and high school students. Among middle and high school students, females feel significantly less safe going to and from school than males. Academic Aspirations Educational aspirations are another one of the survey’s key indicators. A large majority of students at every grade level want to pursue postsecondary education. Compared to the previous year, ratings of the importance of a college education and the desire to pursue a postsecondary education are unchanged among students at all grade spans (see table below).
More female (66%) than male (59%) students want to attend a four-year college or higher. When broken down by race, this gap exists among Hispanic females (64%) and males (58%), and among Black females (70%) and males (66%). Approximately two in three Asian (70%), Black (68%), and White (68%) students want to attend a four-year college or higher, and slightly fewer Hispanic (61%) students want to do so. Most 9th (82%), 10th (83%), 11th (84%) and 12th (88%) grade students want to attend a two-year college, four-year college or higher. These results are consistent with last year’s findings.
Elementary Middle High
(N=2255) (N=1899) (N=1808)
Complete high school 18% (18%) 11% (12%) 13% (14%)
Attend vocational or tech school 4% (5%) 4% (3%) 4% (5%)
Attend 2 year college 16% (14%) 19% (20%) 20% (18%)
Attend 4 year college 21% (23%) 33% (36%) 36% (37%)
Attend 4 year college plus grad 42% (41%) 34% (30%) 28% (28%)
Very important 92% (90%) 80% (84%) 77% (77%)
Somewhat important 6% (6%) 14% (13%) 16% (15%)
Not very important 1% (2%) 4% (3%) 4% (5%)
Not important at all 1% (2%) 2% (1%) 2% (3%)
Very important 93% (92%) 81% (86%) 81% (81%)
Somewhat important 5% (6%) 13% (10%) 13% (12%)
Not very important 1% (1%) 4% (3%) 3% (4%)
Not important at all 1% (1%) 2% (1%) 3% (4%)
Very important 92% (92%) 82% (83%) 82% (83%)
Somewhat important 6% (5%) 13% (12%) 13% (11%)
Not very important 1% (1%) 3% (2%) 3% (2%)
Not important at all 1% (1%) 2% (2%) 3% (4%)
Spring 2012 Student Survey
Academic Aspirations by Grade Span
Values in parentheses represent Spring 2011 survey results.
How far in school do you
want to go? Do you want to…
How important do YOU
believe getting a college
education is to your future
success?
How important would your
PARENT/GUARDIAN say
getting a college education is
to your future success?
How important would your
TEACHERS say getting a
college education is to your
future success?
2011-2012 Student Survey Overview Franklin & Marshall College Berwood Yost and Kelly Frey, September 2012
3
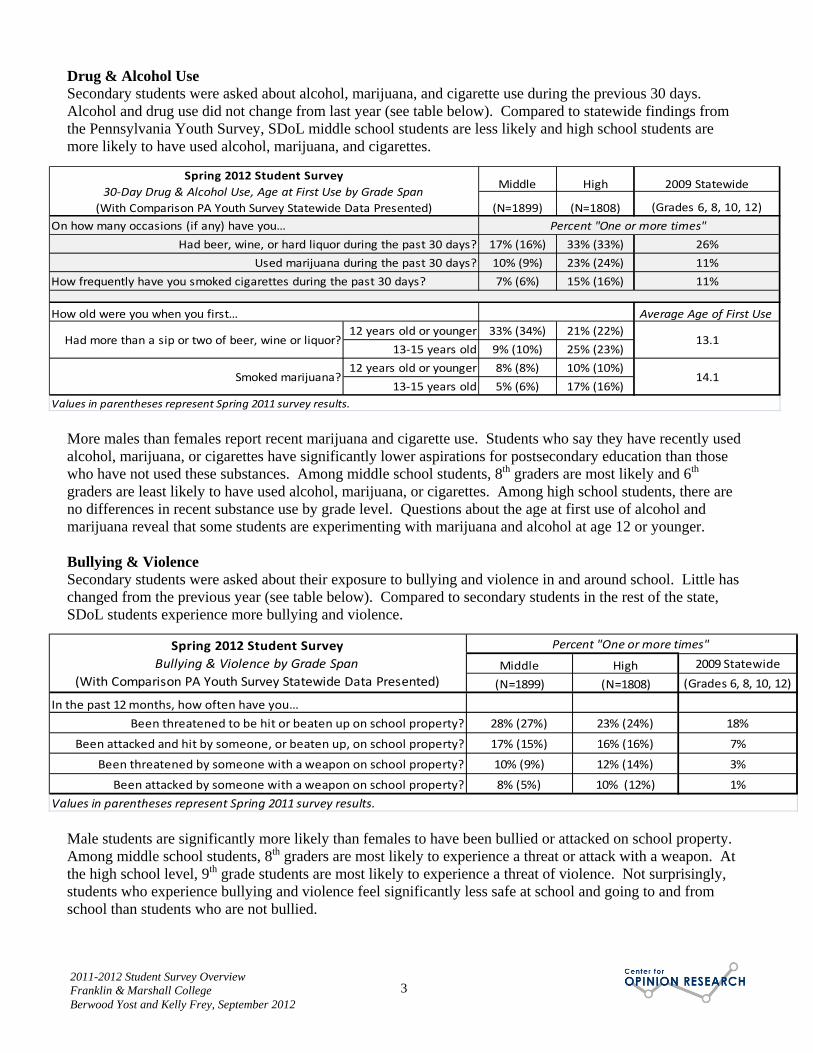
Drug & Alcohol Use Secondary students were asked about alcohol, marijuana, and cigarette use during the previous 30 days. Alcohol and drug use did not change from last year (see table below). Compared to statewide findings from the Pennsylvania Youth Survey, SDoL middle school students are less likely and high school students are more likely to have used alcohol, marijuana, and cigarettes.
More males than females report recent marijuana and cigarette use. Students who say they have recently used alcohol, marijuana, or cigarettes have significantly lower aspirations for postsecondary education than those who have not used these substances. Among middle school students, 8th graders are most likely and 6th graders are least likely to have used alcohol, marijuana, or cigarettes. Among high school students, there are no differences in recent substance use by grade level. Questions about the age at first use of alcohol and marijuana reveal that some students are experimenting with marijuana and alcohol at age 12 or younger. Bullying & Violence Secondary students were asked about their exposure to bullying and violence in and around school. Little has changed from the previous year (see table below). Compared to secondary students in the rest of the state, SDoL students experience more bullying and violence.
Male students are significantly more likely than females to have been bullied or attacked on school property. Among middle school students, 8th graders are most likely to experience a threat or attack with a weapon. At the high school level, 9th grade students are most likely to experience a threat of violence. Not surprisingly, students who experience bullying and violence feel significantly less safe at school and going to and from school than students who are not bullied.
Middle High 2009 Statewide
(N=1899) (N=1808) (Grades 6, 8, 10, 12)
17% (16%) 33% (33%) 26%
10% (9%) 23% (24%) 11%
7% (6%) 15% (16%) 11%
Average Age of First Use
12 years old or younger 33% (34%) 21% (22%)
13‐15 years old 9% (10%) 25% (23%)
12 years old or younger 8% (8%) 10% (10%)
13‐15 years old 5% (6%) 17% (16%)
Values in parentheses represent Spring 2011 survey results.
Spring 2012 Student Survey
30‐Day Drug & Alcohol Use, Age at First Use by Grade Span
(With Comparison PA Youth Survey Statewide Data Presented)
On how many occasions (if any) have you…
Had beer, wine, or hard liquor during the past 30 days?
Used marijuana during the past 30 days?
How frequently have you smoked cigarettes during the past 30 days?
How old were you when you first…
Percent "One or more times"
Had more than a sip or two of beer, wine or liquor?
Smoked marijuana?
13.1
14.1
Middle High 2009 Statewide
(N=1899) (N=1808) (Grades 6, 8, 10, 12)
In the past 12 months, how often have you…
Been threatened to be hit or beaten up on school property? 28% (27%) 23% (24%) 18%
Been attacked and hit by someone, or beaten up, on school property? 17% (15%) 16% (16%) 7%
Been threatened by someone with a weapon on school property? 10% (9%) 12% (14%) 3%
Been attacked by someone with a weapon on school property? 8% (5%) 10% (12%) 1%
Spring 2012 Student Survey
Bullying & Violence by Grade Span
(With Comparison PA Youth Survey Statewide Data Presented)
Values in parentheses represent Spring 2011 survey results.
Percent "One or more times"
2011-2012 Student Survey Overview Franklin & Marshall College Berwood Yost and Kelly Frey, September 2012
4
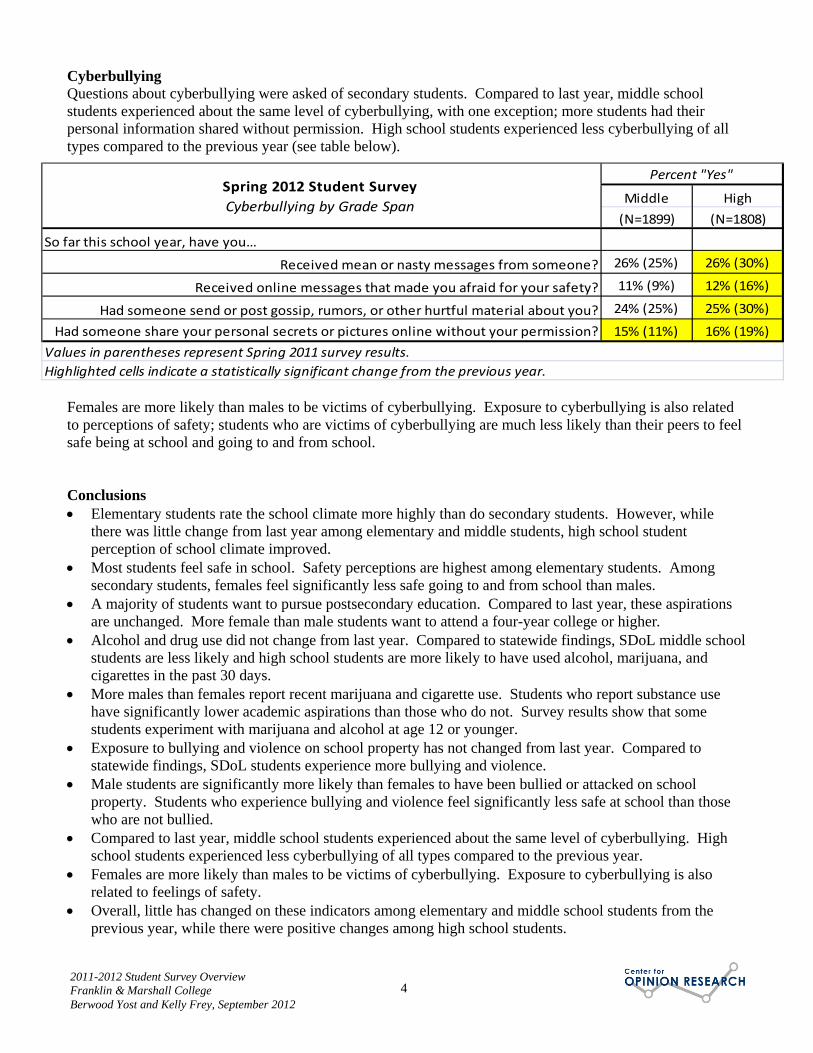
Cyberbullying Questions about cyberbullying were asked of secondary students. Compared to last year, middle school students experienced about the same level of cyberbullying, with one exception; more students had their personal information shared without permission. High school students experienced less cyberbullying of all types compared to the previous year (see table below).
Females are more likely than males to be victims of cyberbullying. Exposure to cyberbullying is also related to perceptions of safety; students who are victims of cyberbullying are much less likely than their peers to feel safe being at school and going to and from school. Conclusions Elementary students rate the school climate more highly than do secondary students. However, while
there was little change from last year among elementary and middle students, high school student perception of school climate improved.
Most students feel safe in school. Safety perceptions are highest among elementary students. Among secondary students, females feel significantly less safe going to and from school than males.
A majority of students want to pursue postsecondary education. Compared to last year, these aspirations are unchanged. More female than male students want to attend a four-year college or higher.
Alcohol and drug use did not change from last year. Compared to statewide findings, SDoL middle school students are less likely and high school students are more likely to have used alcohol, marijuana, and cigarettes in the past 30 days.
More males than females report recent marijuana and cigarette use. Students who report substance use have significantly lower academic aspirations than those who do not. Survey results show that some students experiment with marijuana and alcohol at age 12 or younger.
Exposure to bullying and violence on school property has not changed from last year. Compared to statewide findings, SDoL students experience more bullying and violence.
Male students are significantly more likely than females to have been bullied or attacked on school property. Students who experience bullying and violence feel significantly less safe at school than those who are not bullied.
Compared to last year, middle school students experienced about the same level of cyberbullying. High school students experienced less cyberbullying of all types compared to the previous year.
Females are more likely than males to be victims of cyberbullying. Exposure to cyberbullying is also related to feelings of safety.
Overall, little has changed on these indicators among elementary and middle school students from the previous year, while there were positive changes among high school students.
Middle High
(N=1899) (N=1808)
So far this school year, have you…
Received mean or nasty messages from someone? 26% (25%) 26% (30%)
Received online messages that made you afraid for your safety? 11% (9%) 12% (16%)
Had someone send or post gossip, rumors, or other hurtful material about you? 24% (25%) 25% (30%)
Had someone share your personal secrets or pictures online without your permission? 15% (11%) 16% (19%)
Spring 2012 Student Survey
Cyberbullying by Grade Span
Values in parentheses represent Spring 2011 survey results.
Percent "Yes"
Highlighted cells indicate a statistically significant change from the previous year.
Report B
Marginal Frequency Report Total Elementary School Sample
School District of Lancaster, 2011-2012 Student Survey May 21-25, 2012 Marginal Frequency Report – Total Sample Elementary School Students N=2255
Center for Opinion Research 1 Franklin & Marshall College
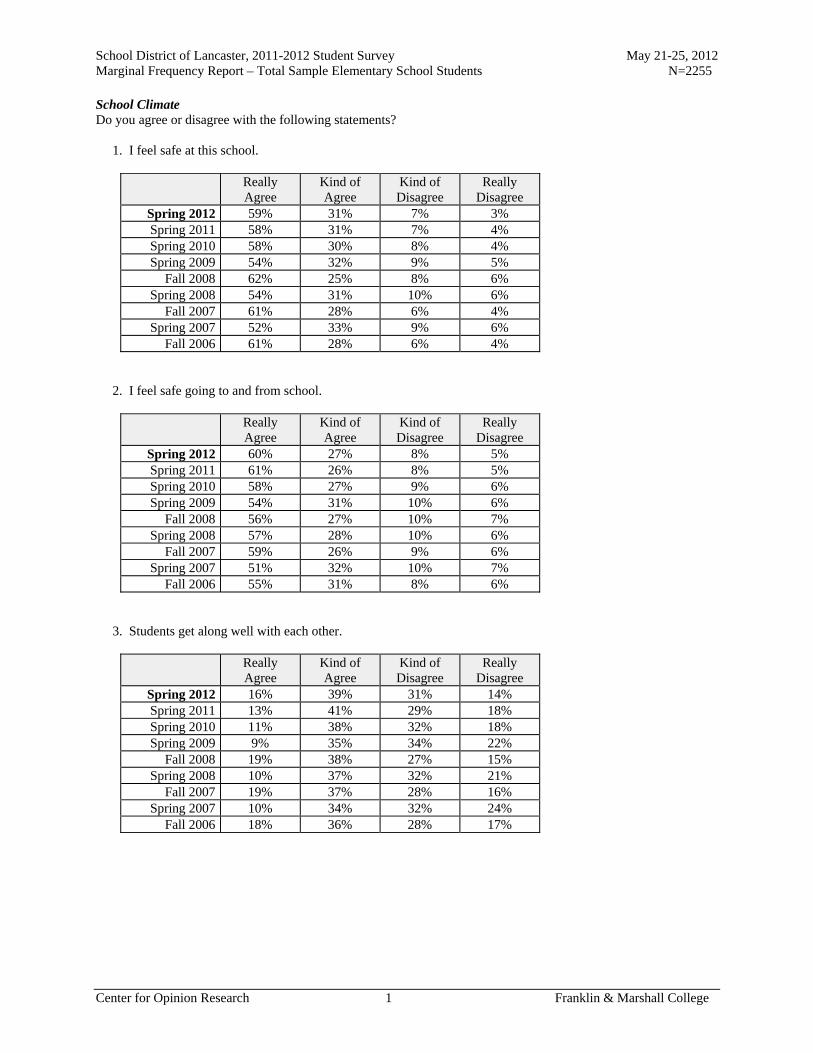
School Climate Do you agree or disagree with the following statements? 1. I feel safe at this school.
Really Agree
Kind of Agree
Kind of Disagree
Really Disagree
Spring 2012 59% 31% 7% 3% Spring 2011 58% 31% 7% 4% Spring 2010 58% 30% 8% 4% Spring 2009 54% 32% 9% 5%
Fall 2008 62% 25% 8% 6% Spring 2008 54% 31% 10% 6%
Fall 2007 61% 28% 6% 4% Spring 2007 52% 33% 9% 6%
Fall 2006 61% 28% 6% 4% 2. I feel safe going to and from school.
Really Agree
Kind of Agree
Kind of Disagree
Really Disagree
Spring 2012 60% 27% 8% 5% Spring 2011 61% 26% 8% 5% Spring 2010 58% 27% 9% 6% Spring 2009 54% 31% 10% 6%
Fall 2008 56% 27% 10% 7% Spring 2008 57% 28% 10% 6%
Fall 2007 59% 26% 9% 6% Spring 2007 51% 32% 10% 7%
Fall 2006 55% 31% 8% 6% 3. Students get along well with each other.
Really Agree
Kind of Agree
Kind of Disagree
Really Disagree
Spring 2012 16% 39% 31% 14% Spring 2011 13% 41% 29% 18% Spring 2010 11% 38% 32% 18% Spring 2009 9% 35% 34% 22%
Fall 2008 19% 38% 27% 15% Spring 2008 10% 37% 32% 21%
Fall 2007 19% 37% 28% 16% Spring 2007 10% 34% 32% 24%
Fall 2006 18% 36% 28% 17%

School District of Lancaster, 2011-2012 Student Survey May 21-25, 2012 Marginal Frequency Report – Total Sample Elementary School Students N=2255
Center for Opinion Research 2 Franklin & Marshall College
4. Students get along well with teachers.
Really Agree
Kind of Agree
Kind of Disagree
Really Disagree
Spring 2012 33% 39% 21% 8% Spring 2011 30% 41% 22% 8% Spring 2010 29% 41% 21% 9% Spring 2009 27% 40% 22% 10%
Fall 2008 38% 37% 17% 8% Spring 2008 23% 44% 23% 11%
Fall 2007 38% 38% 18% 6% Spring 2007 25% 42% 24% 9%
Fall 2006 36% 38% 16% 10% 5. I like my school.
Really Agree
Kind of Agree
Kind of Disagree
Really Disagree
Spring 2012 59% 24% 9% 8% Spring 2011 59% 22% 10% 9% Spring 2010 56% 24% 10% 10% Spring 2009 55% 24% 11% 10%
Fall 2008 59% 23% 9% 8% Spring 2008 50% 28% 11% 11%
Fall 2007 62% 24% 8% 6% Spring 2007 49% 27% 11% 13%
Fall 2006 63% 22% 8% 7% 6. I like my teachers.
Really Agree
Kind of Agree
Kind of Disagree
Really Disagree
Spring 2012 70% 19% 7% 4% Spring 2011 70% 20% 6% 4% Spring 2010 70% 20% 6% 4% Spring 2009 64% 23% 7% 5%
Fall 2008 74% 17% 5% 4% Spring 2008 64% 23% 8% 4%
Fall 2007 77% 16% 4% 3% Spring 2007 64% 23% 8% 5%
Fall 2006 74% 17% 5% 4%

School District of Lancaster, 2011-2012 Student Survey May 21-25, 2012 Marginal Frequency Report – Total Sample Elementary School Students N=2255
Center for Opinion Research 3 Franklin & Marshall College
7. There is a teacher or some other adult at this school who really cares about me.
Really Agree
Kind of Agree
Kind of Disagree
Really Disagree
Spring 2012 70% 19% 6% 5% Spring 2011 73% 18% 5% 4% Spring 2010 72% 19% 5% 5% Spring 2009 71% 19% 6% 4%
Fall 2008 70% 19% 6% 5% Spring 2008 67% 21% 7% 5%
Fall 2007 70% 18% 6% 5% Spring 2007 65% 20% 7% 7%
Fall 2006 71% 17% 6% 6% 8. There is a teacher or some other adult at this school who cares when I am not here.
Really Agree
Kind of Agree
Kind of Disagree
Really Disagree
Spring 2012 44% 27% 12% 17% Spring 2011 46% 27% 11% 16% Spring 2010 48% 26% 10% 15% Spring 2009 50% 25% 11% 14%
Fall 2008 50% 23% 11% 15% Spring 2008 44% 26% 12% 18%
Fall 2007 50% 22% 10% 18% Spring 2007 40% 26% 12% 21%
Fall 2006 47% 23% 11% 19% 9. There is a teacher or some other adult at this school who listens to me when I have something to say.
Really Agree
Kind of Agree
Kind of Disagree
Really Disagree
Spring 2012 68% 21% 7% 4% Spring 2011 68% 22% 5% 4% Spring 2010 70% 19% 6% 6% Spring 2009 65% 24% 7% 4%
Fall 2008 69% 21% 6% 5% Spring 2008 63% 25% 7% 5%
Fall 2007 69% 19% 7% 5% Spring 2007 60% 24% 9% 7%
Fall 2006 68% 20% 6% 6%
School District of Lancaster, 2011-2012 Student Survey May 21-25, 2012 Marginal Frequency Report – Total Sample Elementary School Students N=2255
Center for Opinion Research 4 Franklin & Marshall College
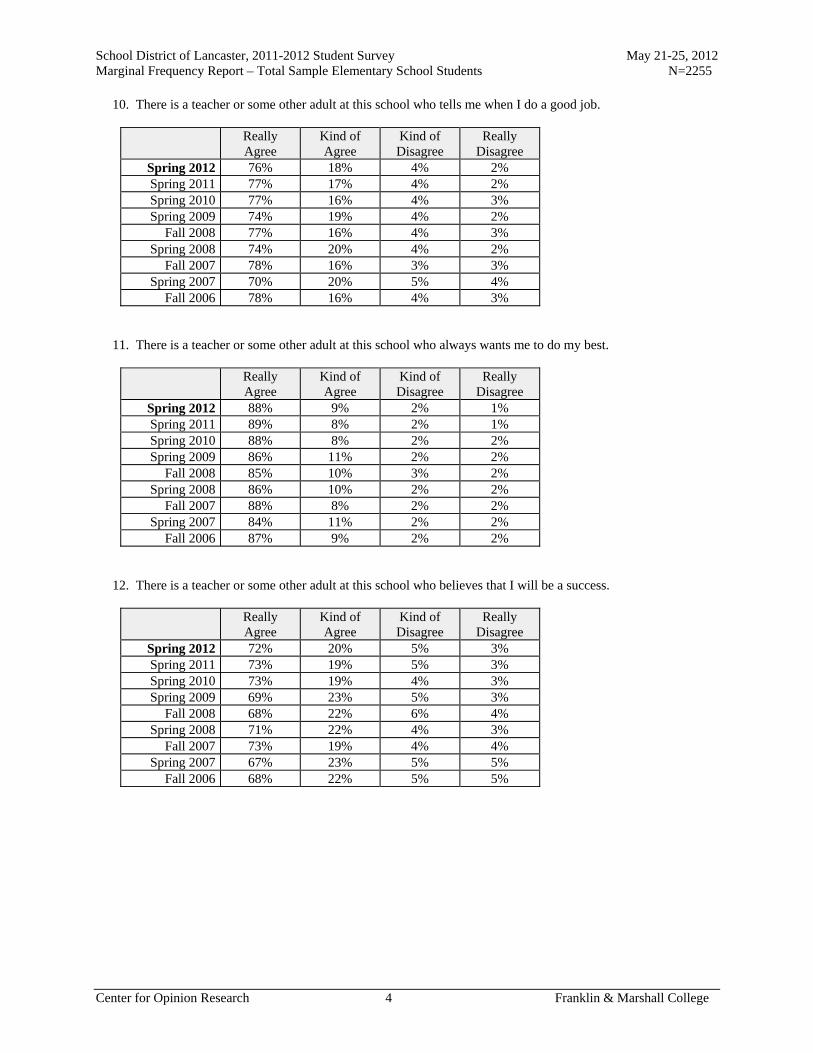
10. There is a teacher or some other adult at this school who tells me when I do a good job.
Really Agree
Kind of Agree
Kind of Disagree
Really Disagree
Spring 2012 76% 18% 4% 2% Spring 2011 77% 17% 4% 2% Spring 2010 77% 16% 4% 3% Spring 2009 74% 19% 4% 2%
Fall 2008 77% 16% 4% 3% Spring 2008 74% 20% 4% 2%
Fall 2007 78% 16% 3% 3% Spring 2007 70% 20% 5% 4%
Fall 2006 78% 16% 4% 3% 11. There is a teacher or some other adult at this school who always wants me to do my best.
Really Agree
Kind of Agree
Kind of Disagree
Really Disagree
Spring 2012 88% 9% 2% 1% Spring 2011 89% 8% 2% 1% Spring 2010 88% 8% 2% 2% Spring 2009 86% 11% 2% 2%
Fall 2008 85% 10% 3% 2% Spring 2008 86% 10% 2% 2%
Fall 2007 88% 8% 2% 2% Spring 2007 84% 11% 2% 2%
Fall 2006 87% 9% 2% 2% 12. There is a teacher or some other adult at this school who believes that I will be a success.
Really Agree
Kind of Agree
Kind of Disagree
Really Disagree
Spring 2012 72% 20% 5% 3% Spring 2011 73% 19% 5% 3% Spring 2010 73% 19% 4% 3% Spring 2009 69% 23% 5% 3%
Fall 2008 68% 22% 6% 4% Spring 2008 71% 22% 4% 3%
Fall 2007 73% 19% 4% 4% Spring 2007 67% 23% 5% 5%
Fall 2006 68% 22% 5% 5%

School District of Lancaster, 2011-2012 Student Survey May 21-25, 2012 Marginal Frequency Report – Total Sample Elementary School Students N=2255
Center for Opinion Research 5 Franklin & Marshall College
13. Students in this school really listen to teachers.
Really Agree
Kind of Agree
Kind of Disagree
Really Disagree
Spring 2012 13% 38% 35% 14% Spring 2011 12% 40% 33% 15% Spring 2010 13% 40% 32% 15% Spring 2009 11% 37% 34% 18%
Fall 2008 17% 38% 28% 16% Spring 2008 12% 35% 35% 18%
Fall 2007 19% 40% 26% 15% Spring 2007 12% 34% 33% 22%
Fall 2006 19% 38% 26% 17% 14. Most teachers make learning interesting.
Really Agree
Kind of Agree
Kind of Disagree
Really Disagree
Spring 2012 52% 31% 11% 6% Spring 2011 52% 32% 10% 6% Spring 2010 54% 30% 10% 6% Spring 2009 51% 31% 11% 6%
Fall 2008 60% 25% 9% 6% Spring 2008 53% 32% 10% 5%
Fall 2007 63% 25% 8% 4% Spring 2007 50% 31% 11% 8%
Fall 2006 62% 25% 8% 5% 15. This school is always getting better.
Really Agree
Kind of Agree
Kind of Disagree
Really Disagree
Spring 2012 38% 33% 16% 12% Spring 2011 38% 31% 17% 13% Spring 2010 40% 29% 18% 14% Spring 2009 36% 28% 19% 17%
Fall 2008 42% 27% 16% 15% Spring 2008 37% 32% 18% 13%
Fall 2007 47% 28% 15% 11% Spring 2007 35% 30% 19% 16%
Fall 2006 48% 27% 12% 13%
School District of Lancaster, 2011-2012 Student Survey May 21-25, 2012 Marginal Frequency Report – Total Sample Elementary School Students N=2255
Center for Opinion Research 6 Franklin & Marshall College
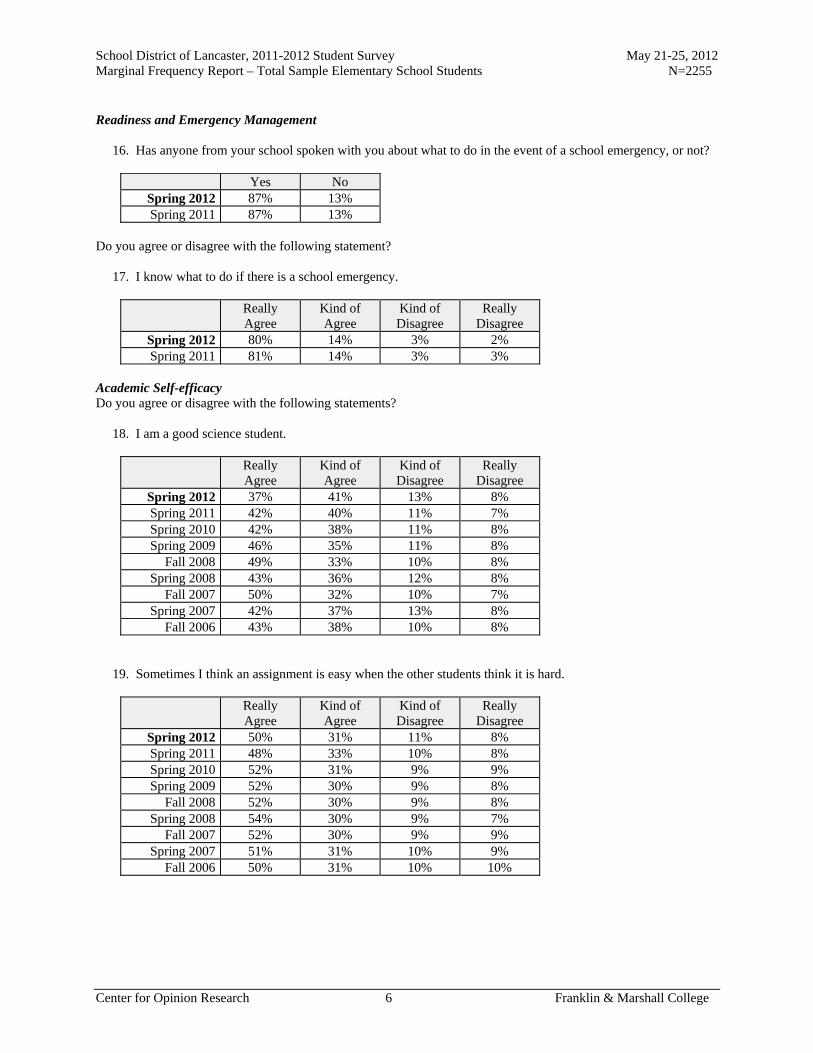
Readiness and Emergency Management 16. Has anyone from your school spoken with you about what to do in the event of a school emergency, or not?
Yes No Spring 2012 87% 13% Spring 2011 87% 13%
Do you agree or disagree with the following statement? 17. I know what to do if there is a school emergency.
Really Agree
Kind of Agree
Kind of Disagree
Really Disagree
Spring 2012 80% 14% 3% 2% Spring 2011 81% 14% 3% 3%
Academic Self-efficacy Do you agree or disagree with the following statements? 18. I am a good science student.
Really Agree
Kind of Agree
Kind of Disagree
Really Disagree
Spring 2012 37% 41% 13% 8% Spring 2011 42% 40% 11% 7% Spring 2010 42% 38% 11% 8% Spring 2009 46% 35% 11% 8%
Fall 2008 49% 33% 10% 8% Spring 2008 43% 36% 12% 8%
Fall 2007 50% 32% 10% 7% Spring 2007 42% 37% 13% 8%
Fall 2006 43% 38% 10% 8% 19. Sometimes I think an assignment is easy when the other students think it is hard.
Really Agree
Kind of Agree
Kind of Disagree
Really Disagree
Spring 2012 50% 31% 11% 8% Spring 2011 48% 33% 10% 8% Spring 2010 52% 31% 9% 9% Spring 2009 52% 30% 9% 8%
Fall 2008 52% 30% 9% 8% Spring 2008 54% 30% 9% 7%
Fall 2007 52% 30% 9% 9% Spring 2007 51% 31% 10% 9%
Fall 2006 50% 31% 10% 10%

School District of Lancaster, 2011-2012 Student Survey May 21-25, 2012 Marginal Frequency Report – Total Sample Elementary School Students N=2255
Center for Opinion Research 7 Franklin & Marshall College
20. I am good social studies student.
Really Agree
Kind of Agree
Kind of Disagree
Really Disagree
Spring 2012 38% 38% 16% 9% Spring 2011 42% 37% 14% 8% Spring 2010 43% 36% 13% 8% Spring 2009 43% 35% 13% 9%
Fall 2008 48% 32% 12% 8% Spring 2008 43% 36% 13% 8%
Fall 2007 48% 32% 11% 9% Spring 2007 39% 37% 15% 9%
Fall 2006 44% 34% 12% 10% 21. My teacher thinks I am smart.
Really Agree
Kind of Agree
Kind of Disagree
Really Disagree
Spring 2012 68% 22% 6% 4% Spring 2011 71% 20% 5% 4% Spring 2010 71% 20% 5% 4% Spring 2009 70% 21% 5% 4%
Fall 2008 71% 20% 5% 5% Spring 2008 68% 23% 6% 4%
Fall 2007 71% 21% 4% 4% Spring 2007 65% 23% 6% 5%
Fall 2006 66% 23% 6% 5% 22. I am a good math student.
Really Agree
Kind of Agree
Kind of Disagree
Really Disagree
Spring 2012 56% 27% 10% 7% Spring 2011 59% 27% 8% 6% Spring 2010 60% 27% 6% 6% Spring 2009 59% 26% 8% 7%
Fall 2008 62% 24% 6% 7% Spring 2008 60% 25% 8% 6%
Fall 2007 60% 26% 8% 7% Spring 2007 56% 28% 10% 7%
Fall 2006 57% 27% 8% 8%

School District of Lancaster, 2011-2012 Student Survey May 21-25, 2012 Marginal Frequency Report – Total Sample Elementary School Students N=2255
Center for Opinion Research 8 Franklin & Marshall College
23. My classmates usually get better grades than I do.
Really Agree
Kind of Agree
Kind of Disagree
Really Disagree
Spring 2012 23% 30% 27% 20% Spring 2011 19% 31% 28% 22% Spring 2010 19% 31% 28% 22% Spring 2009 18% 29% 29% 24%
Fall 2008 20% 27% 26% 26% Spring 2008 17% 28% 30% 24%
Fall 2007 20% 29% 26% 25% Spring 2007 20% 30% 27% 24%
Fall 2006 21% 30% 24% 25% 24. I usually understand my homework assignments.
Really Agree
Kind of Agree
Kind of Disagree
Really Disagree
Spring 2012 50% 35% 10% 5% Spring 2011 50% 34% 11% 4% Spring 2010 49% 35% 10% 6% Spring 2009 51% 32% 12% 5%
Fall 2008 55% 31% 9% 5% Spring 2008 53% 32% 10% 5%
Fall 2007 56% 29% 9% 5% Spring 2007 49% 32% 12% 7%
Fall 2006 52% 33% 9% 6% 25. I could get the best grades in class if I tried hard enough.
Really Agree
Kind of Agree
Kind of Disagree
Really Disagree
Spring 2012 74% 18% 4% 3% Spring 2011 77% 15% 4% 4% Spring 2010 77% 16% 4% 3% Spring 2009 76% 15% 5% 4%
Fall 2008 74% 16% 5% 5% Spring 2008 74% 18% 4% 4%
Fall 2007 79% 15% 3% 3% Spring 2007 73% 19% 4% 4%
Fall 2006 78% 16% 4% 2%
School District of Lancaster, 2011-2012 Student Survey May 21-25, 2012 Marginal Frequency Report – Total Sample Elementary School Students N=2255
Center for Opinion Research 9 Franklin & Marshall College
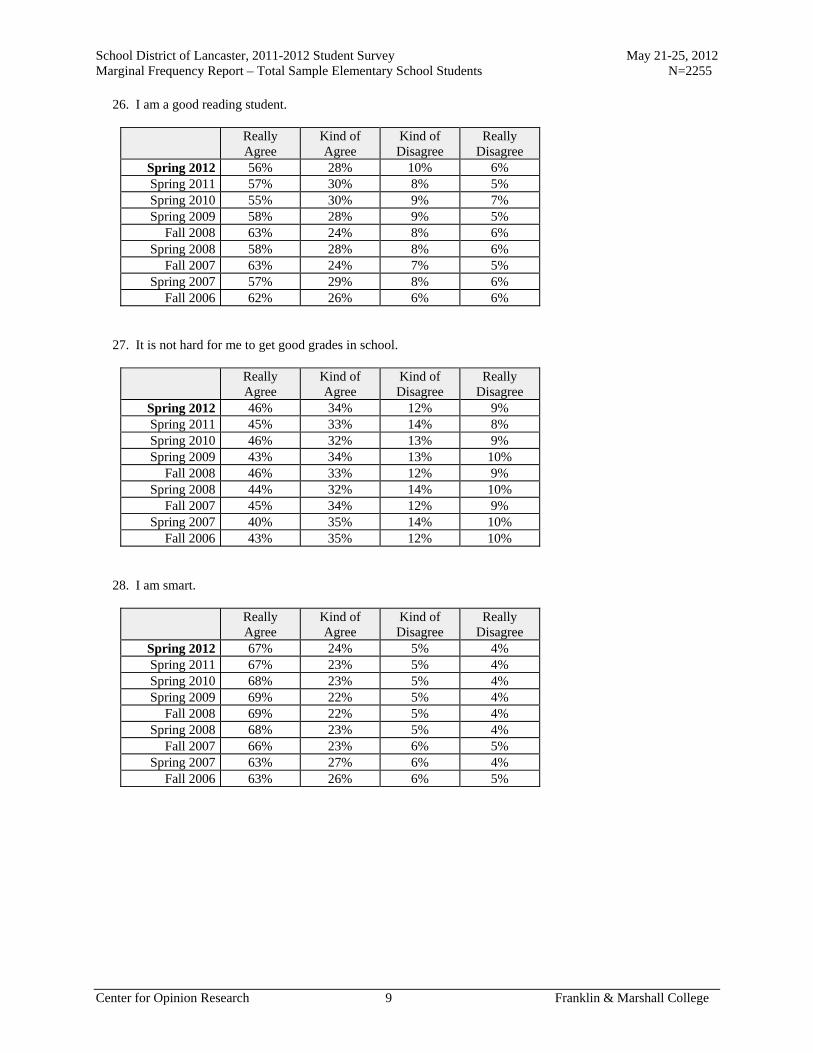
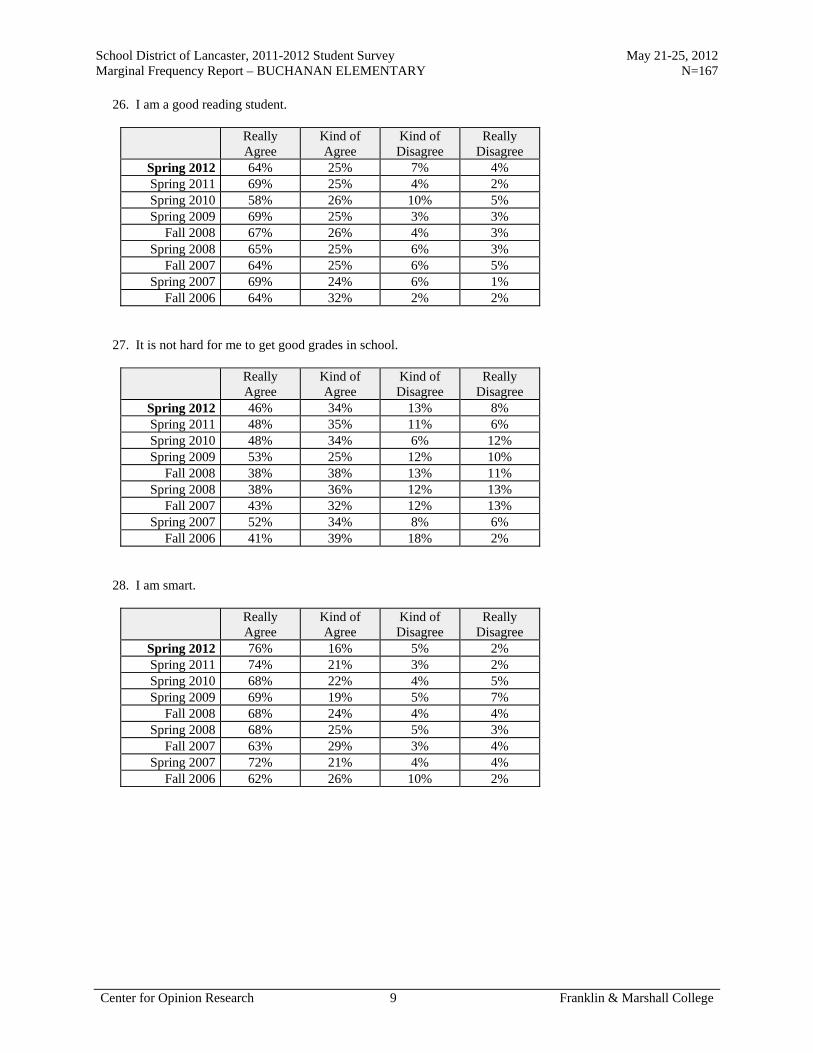
26. I am a good reading student.
Really Agree
Kind of Agree
Kind of Disagree
Really Disagree
Spring 2012 56% 28% 10% 6% Spring 2011 57% 30% 8% 5% Spring 2010 55% 30% 9% 7% Spring 2009 58% 28% 9% 5%
Fall 2008 63% 24% 8% 6% Spring 2008 58% 28% 8% 6%
Fall 2007 63% 24% 7% 5% Spring 2007 57% 29% 8% 6%
Fall 2006 62% 26% 6% 6% 27. It is not hard for me to get good grades in school.
Really Agree
Kind of Agree
Kind of Disagree
Really Disagree
Spring 2012 46% 34% 12% 9% Spring 2011 45% 33% 14% 8% Spring 2010 46% 32% 13% 9% Spring 2009 43% 34% 13% 10%
Fall 2008 46% 33% 12% 9% Spring 2008 44% 32% 14% 10%
Fall 2007 45% 34% 12% 9% Spring 2007 40% 35% 14% 10%
Fall 2006 43% 35% 12% 10% 28. I am smart.
Really Agree
Kind of Agree
Kind of Disagree
Really Disagree
Spring 2012 67% 24% 5% 4% Spring 2011 67% 23% 5% 4% Spring 2010 68% 23% 5% 4% Spring 2009 69% 22% 5% 4%
Fall 2008 69% 22% 5% 4% Spring 2008 68% 23% 5% 4%
Fall 2007 66% 23% 6% 5% Spring 2007 63% 27% 6% 4%
Fall 2006 63% 26% 6% 5%

School District of Lancaster, 2011-2012 Student Survey May 21-25, 2012 Marginal Frequency Report – Total Sample Elementary School Students N=2255
Center for Opinion Research 10 Franklin & Marshall College
29. When the teacher asks a question I usually know the answer even if the other students don't.
Really Agree
Kind of Agree
Kind of Disagree
Really Disagree
Spring 2012 34% 44% 15% 7% Spring 2011 36% 45% 13% 6% Spring 2010 36% 43% 13% 7% Spring 2009 38% 41% 14% 7%
Fall 2008 42% 39% 14% 6% Spring 2008 38% 42% 14% 6%
Fall 2007 40% 41% 12% 6% Spring 2007 36% 43% 16% 6%
Fall 2006 40% 39% 13% 8% 30. I work hard in school.
Really Agree
Kind of Agree
Kind of Disagree
Really Disagree
Spring 2012 71% 22% 4% 2% Spring 2011 73% 21% 4% 2% Spring 2010 73% 21% 4% 2% Spring 2009 72% 22% 4% 2%
Fall 2008 77% 17% 4% 2% Spring 2008 70% 24% 4% 3%
Fall 2007 76% 18% 4% 2% Spring 2007 70% 23% 4% 3%
Fall 2006 78% 16% 3% 3% 31. Most of my classmates work harder on their homework than I do.
Really Agree
Kind of Agree
Kind of Disagree
Really Disagree
Spring 2012 22% 28% 28% 22% Spring 2011 20% 28% 27% 25% Spring 2010 19% 31% 27% 23% Spring 2009 17% 26% 30% 26%
Fall 2008 19% 26% 26% 29% Spring 2008 18% 25% 29% 28%
Fall 2007 19% 26% 26% 29% Spring 2007 20% 28% 26% 26%
Fall 2006 22% 27% 24% 27%

School District of Lancaster, 2011-2012 Student Survey May 21-25, 2012 Marginal Frequency Report – Total Sample Elementary School Students N=2255
Center for Opinion Research 11 Franklin & Marshall College
32. I always get good grades when I try hard.
Really Agree
Kind of Agree
Kind of Disagree
Really Disagree
Spring 2012 73% 20% 5% 3% Spring 2011 76% 18% 4% 2% Spring 2010 75% 17% 5% 2% Spring 2009 75% 18% 4% 3%
Fall 2008 77% 16% 4% 3% Spring 2008 75% 19% 4% 2%
Fall 2007 76% 16% 4% 4% Spring 2007 75% 18% 4% 3%
Fall 2006 74% 17% 5% 4% 33. I usually do not get good grades in math because it is too hard.
Really Agree
Kind of Agree
Kind of Disagree
Really Disagree
Spring 2012 14% 20% 19% 47% Spring 2011 13% 19% 17% 50% Spring 2010 13% 19% 18% 50% Spring 2009 12% 18% 18% 53%
Fall 2008 15% 18% 18% 48% Spring 2008 12% 18% 19% 50%
Fall 2007 16% 20% 17% 47% Spring 2007 15% 20% 20% 45%
Fall 2006 19% 22% 18% 41% 34. Most of my classmates like to do math because it is easy.
Really Agree
Kind of Agree
Kind of Disagree
Really Disagree
Spring 2012 47% 28% 17% 9% Spring 2011 46% 27% 18% 10% Spring 2010 48% 26% 16% 10% Spring 2009 48% 27% 15% 10%
Fall 2008 49% 26% 15% 10% Spring 2008 45% 28% 16% 10%
Fall 2007 50% 25% 15% 10% Spring 2007 44% 28% 18% 10%
Fall 2006 45% 26% 16% 14%

School District of Lancaster, 2011-2012 Student Survey May 21-25, 2012 Marginal Frequency Report – Total Sample Elementary School Students N=2255
Center for Opinion Research 12 Franklin & Marshall College
35. I would get better grades if my teacher liked me more.
Really Agree
Kind of Agree
Kind of Disagree
Really Disagree
Spring 2012 16% 10% 13% 61% Spring 2011 15% 12% 15% 59% Spring 2010 15% 10% 14% 61% Spring 2009 14% 10% 14% 62%
Fall 2008 20% 11% 13% 56% Spring 2008 15% 10% 15% 60%
Fall 2007 18% 11% 13% 59% Spring 2007 16% 12% 14% 58%
Fall 2006 20% 12% 13% 55% 36. I will graduate from high school.
Really Agree
Kind of Agree
Kind of Disagree
Really Disagree
Spring 2012 84% 12% 2% 2% Spring 2011 84% 12% 1% 2% Spring 2010 85% 12% 1% 2% Spring 2009 83% 14% 1% 2%
Fall 2008 84% 12% 2% 3% Spring 2008 83% 13% 2% 2%
Fall 2007 85% 10% 2% 2% Spring 2007 81% 15% 2% 2%
Fall 2006 80% 12% 3% 4% 37. I go to a good school.
Really Agree
Kind of Agree
Kind of Disagree
Really Disagree
Spring 2012 67% 20% 7% 6% Spring 2011 66% 21% 7% 6% Spring 2010 63% 21% 9% 8% Spring 2009 61% 21% 9% 9%
Fall 2008 66% 19% 8% 6% Spring 2008 60% 24% 9% 7%
Fall 2007 69% 20% 6% 5% Spring 2007 59% 24% 9% 8%
Fall 2006 67% 17% 8% 8%

School District of Lancaster, 2011-2012 Student Survey May 21-25, 2012 Marginal Frequency Report – Total Sample Elementary School Students N=2255
Center for Opinion Research 13 Franklin & Marshall College
38. Adults who have good jobs probably were good students when they were young.
Really Agree
Kind of Agree
Kind of Disagree
Really Disagree
Spring 2012 73% 19% 5% 4% Spring 2011 74% 20% 4% 2% Spring 2010 72% 19% 5% 3% Spring 2009 71% 20% 6% 3%
Fall 2008 73% 18% 5% 4% Spring 2008 70% 22% 5% 4%
Fall 2007 72% 19% 5% 3% Spring 2007 68% 23% 6% 4%
Fall 2006 73% 18% 4% 4% 39. When I am old enough, I will go to college.
Really Agree
Kind of Agree
Kind of Disagree
Really Disagree
Spring 2012 81% 12% 3% 4% Spring 2011 82% 11% 2% 4% Spring 2010 81% 12% 3% 3% Spring 2009 81% 12% 4% 3%
Fall 2008 80% 11% 4% 5% Spring 2008 79% 14% 3% 4%
Fall 2007 80% 12% 4% 5% Spring 2007 77% 15% 4% 4%
Fall 2006 78% 12% 4% 6% 40. No one cares if I do well in school.
Really Agree
Kind of Agree
Kind of Disagree
Really Disagree
Spring 2012 10% 9% 10% 71% Spring 2011 10% 10% 12% 69% Spring 2010 11% 9% 11% 69% Spring 2009 10% 8% 13% 70%
Fall 2008 15% 9% 12% 64% Spring 2008 9% 7% 11% 73%
Fall 2007 13% 8% 10% 68% Spring 2007 11% 9% 12% 68%
Fall 2006 15% 10% 10% 64%

School District of Lancaster, 2011-2012 Student Survey May 21-25, 2012 Marginal Frequency Report – Total Sample Elementary School Students N=2255
Center for Opinion Research 14 Franklin & Marshall College
41. What I learn in school is not important.
Really Agree
Kind of Agree
Kind of Disagree
Really Disagree
Spring 2012 8% 5% 7% 80% Spring 2011 8% 5% 6% 82% Spring 2010 10% 5% 6% 80% Spring 2009 8% 4% 8% 80%
Fall 2008 12% 5% 8% 76% Spring 2008 8% 4% 8% 80%
Fall 2007 12% 4% 6% 78% Spring 2007 9% 5% 8% 78%
Fall 2006 13% 5% 6% 76% 42. It does not matter if I do well in school.
Really Agree
Kind of Agree
Kind of Disagree
Really Disagree
Spring 2012 9% 5% 8% 78% Spring 2011 8% 5% 8% 79% Spring 2010 10% 5% 7% 78% Spring 2009 9% 4% 8% 78%
Fall 2008 15% 5% 9% 72% Spring 2008 9% 4% 7% 79%
Fall 2007 13% 5% 7% 75% Spring 2007 10% 5% 8% 77%
Fall 2006 16% 5% 7% 72% 43. Students who get better grades than I do get more help from the teacher than I do.
Really Agree
Kind of Agree
Kind of Disagree
Really Disagree
Spring 2012 16% 15% 19% 50% Spring 2011 15% 11% 21% 53% Spring 2010 15% 12% 20% 54% Spring 2009 14% 11% 20% 55%
Fall 2008 19% 11% 17% 54% Spring 2008 13% 12% 19% 56%
Fall 2007 16% 11% 17% 55% Spring 2007 16% 12% 19% 53%
Fall 2006 19% 11% 15% 54%
School District of Lancaster, 2011-2012 Student Survey May 21-25, 2012 Marginal Frequency Report – Total Sample Elementary School Students N=2255
Center for Opinion Research 15 Franklin & Marshall College
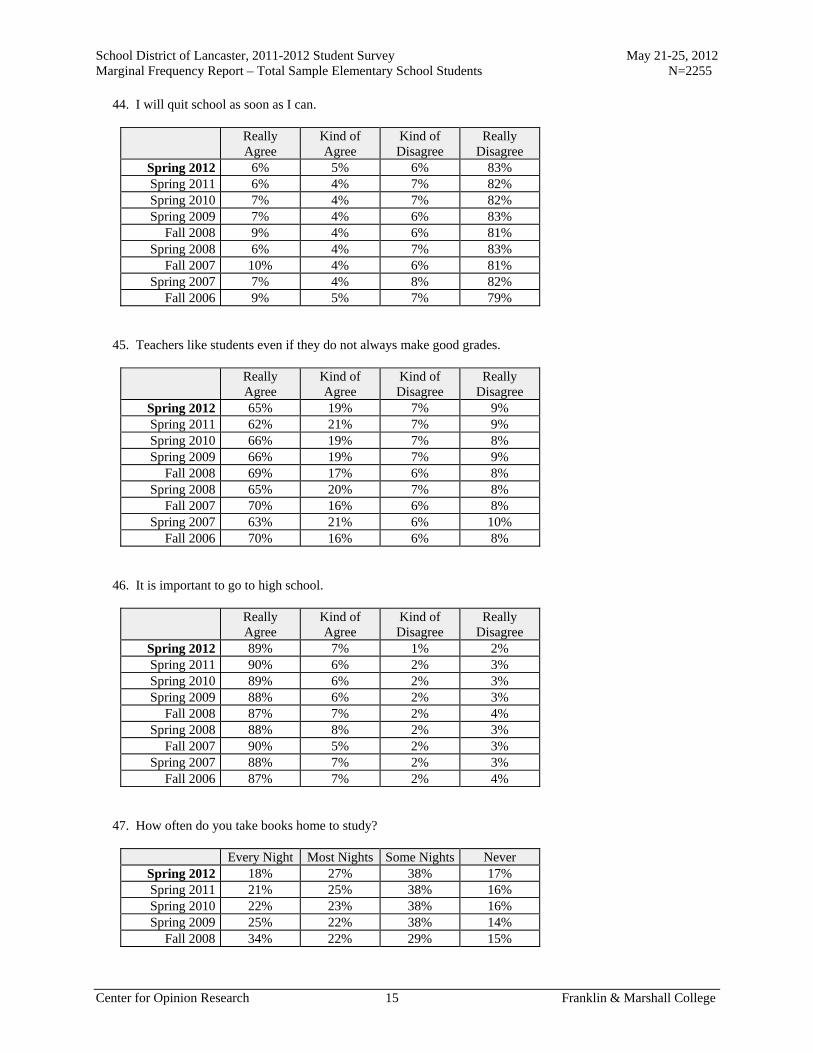
44. I will quit school as soon as I can.
Really Agree
Kind of Agree
Kind of Disagree
Really Disagree
Spring 2012 6% 5% 6% 83% Spring 2011 6% 4% 7% 82% Spring 2010 7% 4% 7% 82% Spring 2009 7% 4% 6% 83%
Fall 2008 9% 4% 6% 81% Spring 2008 6% 4% 7% 83%
Fall 2007 10% 4% 6% 81% Spring 2007 7% 4% 8% 82%
Fall 2006 9% 5% 7% 79% 45. Teachers like students even if they do not always make good grades.
Really Agree
Kind of Agree
Kind of Disagree
Really Disagree
Spring 2012 65% 19% 7% 9% Spring 2011 62% 21% 7% 9% Spring 2010 66% 19% 7% 8% Spring 2009 66% 19% 7% 9%
Fall 2008 69% 17% 6% 8% Spring 2008 65% 20% 7% 8%
Fall 2007 70% 16% 6% 8% Spring 2007 63% 21% 6% 10%
Fall 2006 70% 16% 6% 8% 46. It is important to go to high school.
Really Agree
Kind of Agree
Kind of Disagree
Really Disagree
Spring 2012 89% 7% 1% 2% Spring 2011 90% 6% 2% 3% Spring 2010 89% 6% 2% 3% Spring 2009 88% 6% 2% 3%
Fall 2008 87% 7% 2% 4% Spring 2008 88% 8% 2% 3%
Fall 2007 90% 5% 2% 3% Spring 2007 88% 7% 2% 3%
Fall 2006 87% 7% 2% 4% 47. How often do you take books home to study?
Every Night Most Nights Some Nights Never Spring 2012 18% 27% 38% 17% Spring 2011 21% 25% 38% 16% Spring 2010 22% 23% 38% 16% Spring 2009 25% 22% 38% 14%
Fall 2008 34% 22% 29% 15%

School District of Lancaster, 2011-2012 Student Survey May 21-25, 2012 Marginal Frequency Report – Total Sample Elementary School Students N=2255
Center for Opinion Research 16 Franklin & Marshall College
Academic Aspirations 48. How far in school do you want to go?
Complete
high school
Attend vocational/technical
school
Attend 2-year college
Attend 4-year college
Attend 4-year college plus go to
grad school Spring 2012 18% 4% 16% 20% 42% Spring 2011 18% 5% 14% 22% 41% Spring 2010 20% 5% 14% 22% 39% Spring 2009 18% 4% 15% 22% 42%
Fall 2008 22% 4% 13% 21% 40% Spring 2008 20% 5% 16% 22% 37%
Fall 2007 24% 4% 14% 20% 37% Spring 2007 19% 4% 16% 22% 40%
Fall 2006 22% 5% 13% 20% 40% 49. How important do you believe getting a college education is to your future success? Would you say it is...
Very
important Somewhat important
Not very important
Not important at
all Spring 2012 92% 6% 1% 1% Spring 2011 90% 6% 2% 2% Spring 2010 91% 6% 1% 1% Spring 2009 91% 6% 1% 2%
Fall 2008 90% 6% 2% 2% Spring 2008 90% 8% 1% 1%
Fall 2007 90% 6% 2% 2% Spring 2007 90% 7% 2% 1%
Fall 2006 88% 8% 2% 2% 50. How important would your parent/guardian say getting a college education is to your future success? Would your parents say it is...
Very
important Somewhat important
Not very important
Not important at
all Spring 2012 93% 5% 1% 1% Spring 2011 92% 6% 1% 1% Spring 2010 92% 6% 1% 1% Spring 2009 93% 5% 1% 1%
Fall 2008 91% 6% 1% 2% Spring 2008 92% 6% 1% 1%
Fall 2007 90% 7% 2% 1% Spring 2007 92% 6% 1% 1%
Fall 2006 90% 7% 2% 2%

School District of Lancaster, 2011-2012 Student Survey May 21-25, 2012 Marginal Frequency Report – Total Sample Elementary School Students N=2255
Center for Opinion Research 17 Franklin & Marshall College
51. How important would your teachers say getting a college education is to your future success? Would your teachers say it is...
Very
important Somewhat important
Not very important
Not important at
all Spring 2012 92% 6% 1% 1% Spring 2011 92% 5% 1% 1% Spring 2010 91% 6% 2% 1% Spring 2009 93% 5% 1% 1%
Fall 2008 92% 6% 1% 1% Spring 2008 92% 6% 1% 1%
Fall 2007 90% 6% 2% 2% Spring 2007 91% 7% 1% 2%
Fall 2006 91% 5% 1% 2% Perceptions of Police Do you agree or disagree with the following statements about police officers? 52. I respect police officers.
Really Agree
Kind of Agree
Kind of Disagree
Really Disagree
Spring 2012 90% 6% 2% 2% Spring 2011 88% 7% 2% 2% Spring 2010 87% 8% 3% 3% Spring 2009 83% 11% 3% 3%
Fall 2008 86% 8% 2% 4% Spring 2008 79% 12% 5% 5%
Fall 2007 83% 7% 5% 5% Spring 2007 80% 10% 5% 5%
Fall 2006 82% 8% 4% 6% 53. I am comfortable approaching police officers.
Really Agree
Kind of Agree
Kind of Disagree
Really Disagree
Spring 2012 60% 26% 7% 7% Spring 2011 58% 26% 8% 8% Spring 2010 57% 27% 7% 9% Spring 2009 55% 26% 8% 11%
Fall 2008 61% 23% 7% 9% Spring 2008 55% 23% 11% 11%
Fall 2007 58% 21% 9% 12% Spring 2007 55% 22% 10% 13%
Fall 2006 58% 23% 8% 12%

School District of Lancaster, 2011-2012 Student Survey May 21-25, 2012 Marginal Frequency Report – Total Sample Elementary School Students N=2255
Center for Opinion Research 18 Franklin & Marshall College
54. I would consider police work as a career.
Really Agree
Kind of Agree
Kind of Disagree
Really Disagree
Spring 2012 40% 19% 15% 26% Spring 2011 40% 19% 14% 26% Spring 2010 38% 20% 14% 28% Spring 2009 38% 20% 13% 29%
Fall 2008 44% 19% 12% 25% Spring 2008 40% 21% 13% 26%
Fall 2007 44% 18% 11% 27% Spring 2007 39% 20% 12% 29%
Fall 2006 39% 18% 13% 30% 55. In general, I do not trust the police.
Really Agree
Kind of Agree
Kind of Disagree
Really Disagree
Spring 2012 11% 8% 11% 71% Spring 2011 12% 9% 11% 68% Spring 2010 13% 9% 12% 67% Spring 2009 14% 10% 12% 65%
Fall 2008 17% 8% 10% 64% Spring 2008 12% 13% 14% 61%
Fall 2007 16% 11% 10% 64% Spring 2007 15% 13% 13% 59%
Fall 2006 17% 11% 11% 61% 56. Police do not belong in schools unless there has been a crime.
Really Agree
Kind of Agree
Kind of Disagree
Really Disagree
Spring 2012 27% 10% 15% 49% Spring 2011 26% 11% 14% 48% Spring 2010 28% 10% 14% 48% Spring 2009 28% 11% 13% 49%
Fall 2008 34% 10% 12% 45% Spring 2008 33% 14% 16% 38%
Fall 2007 38% 13% 11% 38% Spring 2007 37% 15% 14% 35%
Fall 2006 39% 11% 12% 37%
Report C
Marginal Frequency Report Buchanan Elementary School
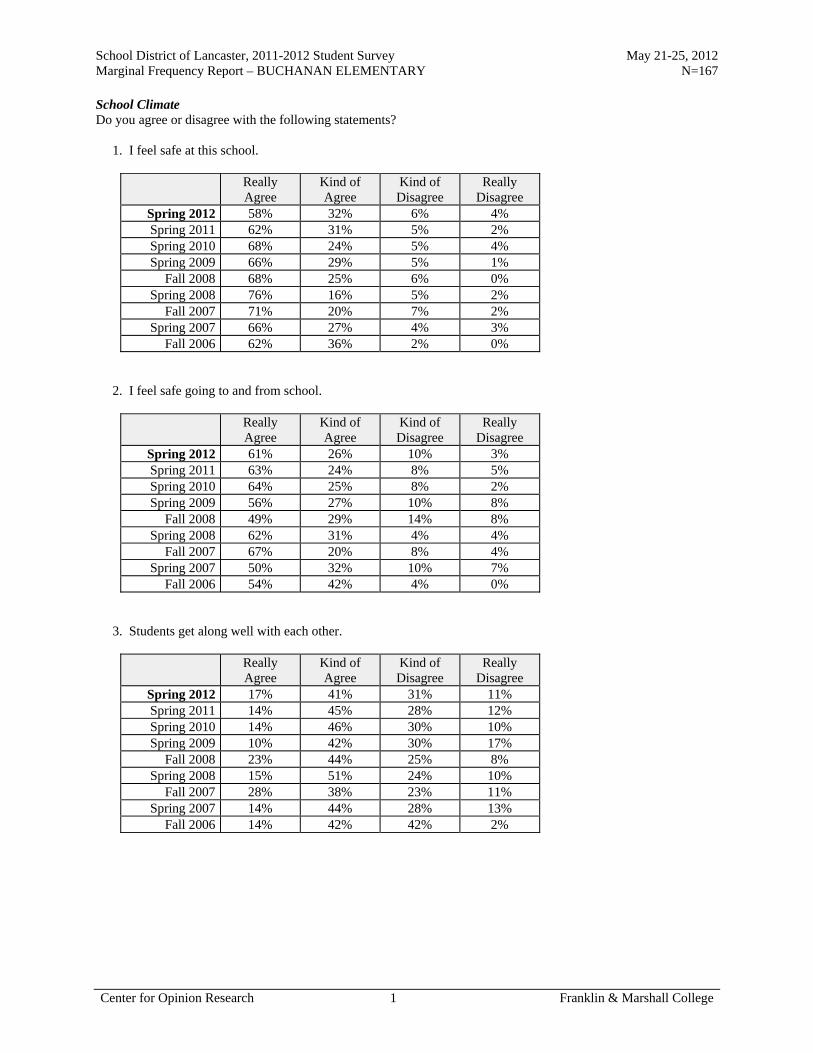
School District of Lancaster, 2011-2012 Student Survey May 21-25, 2012 Marginal Frequency Report – BUCHANAN ELEMENTARY N=167
Center for Opinion Research 1 Franklin & Marshall College
School Climate Do you agree or disagree with the following statements? 1. I feel safe at this school.
Really Agree
Kind of Agree
Kind of Disagree
Really Disagree
Spring 2012 58% 32% 6% 4% Spring 2011 62% 31% 5% 2% Spring 2010 68% 24% 5% 4% Spring 2009 66% 29% 5% 1%
Fall 2008 68% 25% 6% 0% Spring 2008 76% 16% 5% 2%
Fall 2007 71% 20% 7% 2% Spring 2007 66% 27% 4% 3%
Fall 2006 62% 36% 2% 0% 2. I feel safe going to and from school.
Really Agree
Kind of Agree
Kind of Disagree
Really Disagree
Spring 2012 61% 26% 10% 3% Spring 2011 63% 24% 8% 5% Spring 2010 64% 25% 8% 2% Spring 2009 56% 27% 10% 8%
Fall 2008 49% 29% 14% 8% Spring 2008 62% 31% 4% 4%
Fall 2007 67% 20% 8% 4% Spring 2007 50% 32% 10% 7%
Fall 2006 54% 42% 4% 0% 3. Students get along well with each other.
Really Agree
Kind of Agree
Kind of Disagree
Really Disagree
Spring 2012 17% 41% 31% 11% Spring 2011 14% 45% 28% 12% Spring 2010 14% 46% 30% 10% Spring 2009 10% 42% 30% 17%
Fall 2008 23% 44% 25% 8% Spring 2008 15% 51% 24% 10%
Fall 2007 28% 38% 23% 11% Spring 2007 14% 44% 28% 13%
Fall 2006 14% 42% 42% 2%

School District of Lancaster, 2011-2012 Student Survey May 21-25, 2012 Marginal Frequency Report – BUCHANAN ELEMENTARY N=167
Center for Opinion Research 2 Franklin & Marshall College
4. Students get along well with teachers.
Really Agree
Kind of Agree
Kind of Disagree
Really Disagree
Spring 2012 39% 41% 17% 4% Spring 2011 39% 44% 16% 2% Spring 2010 40% 43% 14% 3% Spring 2009 38% 40% 15% 6%
Fall 2008 53% 40% 7% 1% Spring 2008 46% 42% 10% 2%
Fall 2007 53% 31% 13% 2% Spring 2007 48% 35% 14% 3%
Fall 2006 40% 48% 8% 4% 5. I like my school.
Really Agree
Kind of Agree
Kind of Disagree
Really Disagree
Spring 2012 66% 18% 10% 6% Spring 2011 69% 19% 8% 4% Spring 2010 70% 17% 7% 6% Spring 2009 70% 16% 9% 5%
Fall 2008 65% 24% 7% 4% Spring 2008 66% 24% 5% 5%
Fall 2007 66% 23% 7% 4% Spring 2007 61% 22% 7% 10%
Fall 2006 66% 24% 4% 6% 6. I like my teachers.
Really Agree
Kind of Agree
Kind of Disagree
Really Disagree
Spring 2012 78% 16% 5% 2% Spring 2011 84% 13% 2% 1% Spring 2010 77% 16% 5% 2% Spring 2009 67% 23% 7% 3%
Fall 2008 79% 17% 4% 1% Spring 2008 78% 16% 5% 2%
Fall 2007 81% 17% 1% 2% Spring 2007 77% 16% 4% 3%
Fall 2006 78% 16% 2% 4%

School District of Lancaster, 2011-2012 Student Survey May 21-25, 2012 Marginal Frequency Report – BUCHANAN ELEMENTARY N=167
Center for Opinion Research 3 Franklin & Marshall College
7. There is a teacher or some other adult at this school who really cares about me.
Really Agree
Kind of Agree
Kind of Disagree
Really Disagree
Spring 2012 75% 17% 5% 2% Spring 2011 81% 16% 2% 1% Spring 2010 70% 20% 4% 6% Spring 2009 74% 15% 6% 5%
Fall 2008 75% 18% 4% 4% Spring 2008 72% 20% 6% 2%
Fall 2007 74% 16% 7% 4% Spring 2007 68% 26% 2% 4%
Fall 2006 76% 20% 4% 0% 8. There is a teacher or some other adult at this school who cares when I am not here.
Really Agree
Kind of Agree
Kind of Disagree
Really Disagree
Spring 2012 48% 34% 8% 10% Spring 2011 51% 27% 12% 10% Spring 2010 58% 21% 10% 11% Spring 2009 52% 24% 13% 11%
Fall 2008 58% 18% 12% 12% Spring 2008 47% 21% 15% 17%
Fall 2007 50% 19% 12% 19% Spring 2007 47% 27% 10% 16%
Fall 2006 44% 24% 12% 20% 9. There is a teacher or some other adult at this school who listens to me when I have something to say.
Really Agree
Kind of Agree
Kind of Disagree
Really Disagree
Spring 2012 75% 18% 7% 1% Spring 2011 73% 20% 5% 1% Spring 2010 69% 23% 6% 2% Spring 2009 73% 21% 3% 3%
Fall 2008 72% 22% 4% 2% Spring 2008 70% 22% 6% 2%
Fall 2007 66% 24% 8% 2% Spring 2007 64% 26% 7% 3%
Fall 2006 67% 23% 10% 0%

School District of Lancaster, 2011-2012 Student Survey May 21-25, 2012 Marginal Frequency Report – BUCHANAN ELEMENTARY N=167
Center for Opinion Research 4 Franklin & Marshall College
10. There is a teacher or some other adult at this school who tells me when I do a good job.
Really Agree
Kind of Agree
Kind of Disagree
Really Disagree
Spring 2012 76% 20% 2% 1% Spring 2011 76% 18% 6% 0% Spring 2010 79% 16% 1% 3% Spring 2009 81% 13% 6% 1%
Fall 2008 76% 18% 5% 1% Spring 2008 72% 24% 2% 2%
Fall 2007 74% 20% 2% 3% Spring 2007 78% 16% 3% 4%
Fall 2006 86% 10% 2% 2% 11. There is a teacher or some other adult at this school who always wants me to do my best.
Really Agree
Kind of Agree
Kind of Disagree
Really Disagree
Spring 2012 95% 4% 0% 1% Spring 2011 90% 8% 2% 1% Spring 2010 90% 7% 2% 0% Spring 2009 93% 6% 1% 0%
Fall 2008 90% 9% 1% 1% Spring 2008 91% 7% 0% 2%
Fall 2007 89% 7% 2% 1% Spring 2007 92% 5% 1% 2%
Fall 2006 92% 6% 0% 2% 12. There is a teacher or some other adult at this school who believes that I will be a success.
Really Agree
Kind of Agree
Kind of Disagree
Really Disagree
Spring 2012 84% 13% 2% 1% Spring 2011 76% 21% 2% 1% Spring 2010 75% 14% 7% 4% Spring 2009 81% 15% 4% 1%
Fall 2008 73% 23% 4% 0% Spring 2008 80% 17% 2% 1%
Fall 2007 72% 21% 4% 2% Spring 2007 78% 19% 0% 3%
Fall 2006 84% 14% 2% 0%

School District of Lancaster, 2011-2012 Student Survey May 21-25, 2012 Marginal Frequency Report – BUCHANAN ELEMENTARY N=167
Center for Opinion Research 5 Franklin & Marshall College
13. Students in this school really listen to teachers.
Really Agree
Kind of Agree
Kind of Disagree
Really Disagree
Spring 2012 10% 46% 36% 8% Spring 2011 9% 48% 36% 8% Spring 2010 13% 49% 28% 10% Spring 2009 17% 44% 29% 11%
Fall 2008 16% 46% 31% 7% Spring 2008 22% 46% 21% 11%
Fall 2007 23% 51% 18% 7% Spring 2007 16% 41% 36% 7%
Fall 2006 12% 54% 25% 10% 14. Most teachers make learning interesting.
Really Agree
Kind of Agree
Kind of Disagree
Really Disagree
Spring 2012 55% 31% 10% 4% Spring 2011 57% 29% 12% 2% Spring 2010 56% 29% 8% 7% Spring 2009 53% 27% 13% 7%
Fall 2008 62% 25% 7% 5% Spring 2008 57% 32% 9% 2%
Fall 2007 66% 25% 7% 2% Spring 2007 56% 32% 6% 6%
Fall 2006 56% 33% 6% 6% 15. This school is always getting better.
Really Agree
Kind of Agree
Kind of Disagree
Really Disagree
Spring 2012 44% 26% 20% 10% Spring 2011 37% 32% 21% 10% Spring 2010 42% 30% 15% 13% Spring 2009 43% 24% 22% 10%
Fall 2008 46% 27% 10% 16% Spring 2008 48% 32% 13% 8%
Fall 2007 54% 25% 13% 8% Spring 2007 44% 30% 18% 8%
Fall 2006 42% 33% 12% 14%
School District of Lancaster, 2011-2012 Student Survey May 21-25, 2012 Marginal Frequency Report – BUCHANAN ELEMENTARY N=167
Center for Opinion Research 6 Franklin & Marshall College
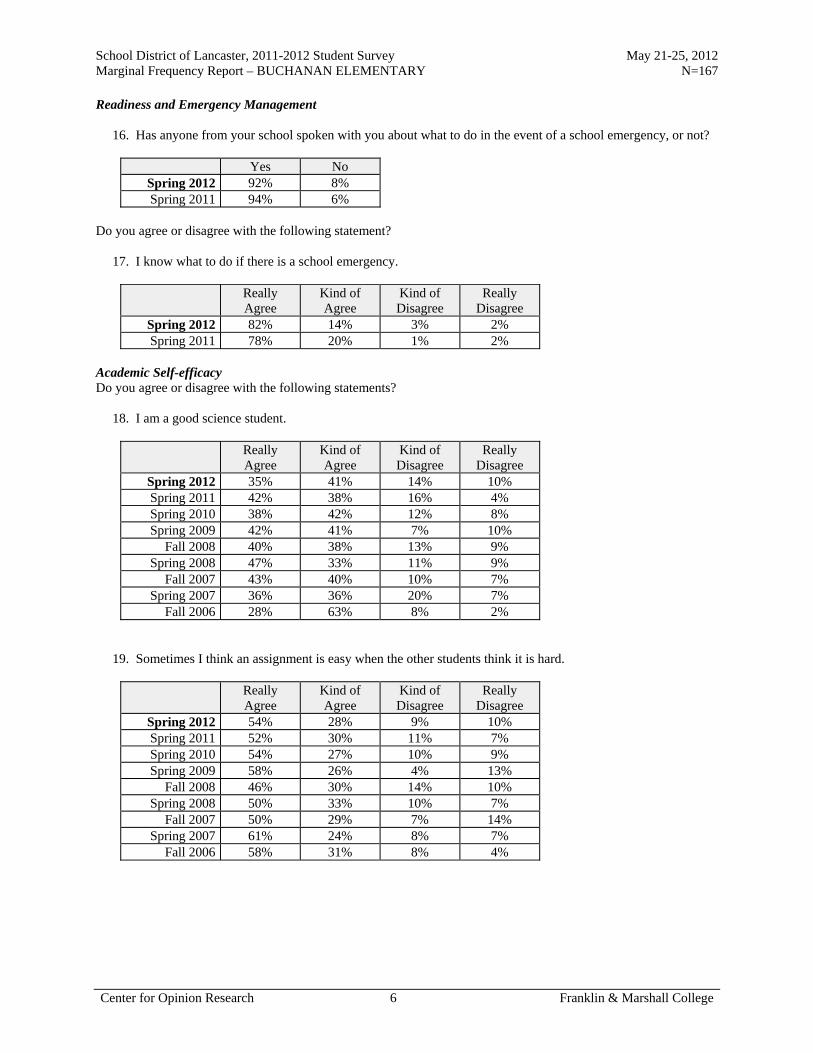
Readiness and Emergency Management 16. Has anyone from your school spoken with you about what to do in the event of a school emergency, or not?
Yes No Spring 2012 92% 8% Spring 2011 94% 6%
Do you agree or disagree with the following statement? 17. I know what to do if there is a school emergency.
Really Agree
Kind of Agree
Kind of Disagree
Really Disagree
Spring 2012 82% 14% 3% 2% Spring 2011 78% 20% 1% 2%
Academic Self-efficacy Do you agree or disagree with the following statements? 18. I am a good science student.
Really Agree
Kind of Agree
Kind of Disagree
Really Disagree
Spring 2012 35% 41% 14% 10% Spring 2011 42% 38% 16% 4% Spring 2010 38% 42% 12% 8% Spring 2009 42% 41% 7% 10%
Fall 2008 40% 38% 13% 9% Spring 2008 47% 33% 11% 9%
Fall 2007 43% 40% 10% 7% Spring 2007 36% 36% 20% 7%
Fall 2006 28% 63% 8% 2% 19. Sometimes I think an assignment is easy when the other students think it is hard.
Really Agree
Kind of Agree
Kind of Disagree
Really Disagree
Spring 2012 54% 28% 9% 10% Spring 2011 52% 30% 11% 7% Spring 2010 54% 27% 10% 9% Spring 2009 58% 26% 4% 13%
Fall 2008 46% 30% 14% 10% Spring 2008 50% 33% 10% 7%
Fall 2007 50% 29% 7% 14% Spring 2007 61% 24% 8% 7%
Fall 2006 58% 31% 8% 4%

School District of Lancaster, 2011-2012 Student Survey May 21-25, 2012 Marginal Frequency Report – BUCHANAN ELEMENTARY N=167
Center for Opinion Research 7 Franklin & Marshall College
20. I am good social studies student.
Really Agree
Kind of Agree
Kind of Disagree
Really Disagree
Spring 2012 45% 31% 13% 11% Spring 2011 44% 39% 10% 6% Spring 2010 47% 34% 11% 8% Spring 2009 42% 46% 6% 6%
Fall 2008 50% 29% 8% 13% Spring 2008 45% 37% 12% 6%
Fall 2007 42% 39% 10% 8% Spring 2007 37% 46% 11% 5%
Fall 2006 39% 45% 6% 10% 21. My teacher thinks I am smart.
Really Agree
Kind of Agree
Kind of Disagree
Really Disagree
Spring 2012 76% 17% 5% 2% Spring 2011 81% 15% 2% 2% Spring 2010 75% 16% 5% 4% Spring 2009 68% 21% 4% 7%
Fall 2008 76% 18% 3% 4% Spring 2008 75% 19% 5% 2%
Fall 2007 72% 19% 5% 4% Spring 2007 79% 18% 1% 1%
Fall 2006 67% 21% 8% 4% 22. I am a good math student.
Really Agree
Kind of Agree
Kind of Disagree
Really Disagree
Spring 2012 54% 28% 11% 7% Spring 2011 68% 24% 4% 5% Spring 2010 60% 28% 5% 7% Spring 2009 60% 28% 8% 4%
Fall 2008 67% 21% 6% 6% Spring 2008 58% 28% 11% 4%
Fall 2007 53% 29% 11% 7% Spring 2007 55% 26% 10% 9%
Fall 2006 62% 27% 12% 0%

School District of Lancaster, 2011-2012 Student Survey May 21-25, 2012 Marginal Frequency Report – BUCHANAN ELEMENTARY N=167
Center for Opinion Research 8 Franklin & Marshall College
23. My classmates usually get better grades than I do.
Really Agree
Kind of Agree
Kind of Disagree
Really Disagree
Spring 2012 18% 27% 32% 24% Spring 2011 12% 32% 26% 30% Spring 2010 16% 24% 30% 29% Spring 2009 18% 17% 37% 27%
Fall 2008 20% 30% 20% 30% Spring 2008 20% 21% 34% 25%
Fall 2007 22% 28% 22% 29% Spring 2007 17% 33% 24% 25%
Fall 2006 20% 30% 36% 14% 24. I usually understand my homework assignments.
Really Agree
Kind of Agree
Kind of Disagree
Really Disagree
Spring 2012 50% 39% 8% 3% Spring 2011 50% 39% 9% 2% Spring 2010 50% 36% 7% 7% Spring 2009 49% 28% 12% 11%
Fall 2008 54% 30% 10% 7% Spring 2008 61% 22% 14% 3%
Fall 2007 52% 33% 9% 6% Spring 2007 57% 31% 8% 4%
Fall 2006 44% 48% 8% 0% 25. I could get the best grades in class if I tried hard enough.
Really Agree
Kind of Agree
Kind of Disagree
Really Disagree
Spring 2012 73% 18% 5% 4% Spring 2011 77% 16% 5% 1% Spring 2010 72% 22% 3% 3% Spring 2009 79% 10% 4% 7%
Fall 2008 73% 18% 6% 3% Spring 2008 68% 22% 4% 6%
Fall 2007 81% 12% 3% 3% Spring 2007 75% 18% 3% 5%
Fall 2006 79% 19% 2% 0%
School District of Lancaster, 2011-2012 Student Survey May 21-25, 2012 Marginal Frequency Report – BUCHANAN ELEMENTARY N=167
Center for Opinion Research 9 Franklin & Marshall College
26. I am a good reading student.
Really Agree
Kind of Agree
Kind of Disagree
Really Disagree
Spring 2012 64% 25% 7% 4% Spring 2011 69% 25% 4% 2% Spring 2010 58% 26% 10% 5% Spring 2009 69% 25% 3% 3%
Fall 2008 67% 26% 4% 3% Spring 2008 65% 25% 6% 3%
Fall 2007 64% 25% 6% 5% Spring 2007 69% 24% 6% 1%
Fall 2006 64% 32% 2% 2% 27. It is not hard for me to get good grades in school.
Really Agree
Kind of Agree
Kind of Disagree
Really Disagree
Spring 2012 46% 34% 13% 8% Spring 2011 48% 35% 11% 6% Spring 2010 48% 34% 6% 12% Spring 2009 53% 25% 12% 10%
Fall 2008 38% 38% 13% 11% Spring 2008 38% 36% 12% 13%
Fall 2007 43% 32% 12% 13% Spring 2007 52% 34% 8% 6%
Fall 2006 41% 39% 18% 2% 28. I am smart.
Really Agree
Kind of Agree
Kind of Disagree
Really Disagree
Spring 2012 76% 16% 5% 2% Spring 2011 74% 21% 3% 2% Spring 2010 68% 22% 4% 5% Spring 2009 69% 19% 5% 7%
Fall 2008 68% 24% 4% 4% Spring 2008 68% 25% 5% 3%
Fall 2007 63% 29% 3% 4% Spring 2007 72% 21% 4% 4%
Fall 2006 62% 26% 10% 2%

School District of Lancaster, 2011-2012 Student Survey May 21-25, 2012 Marginal Frequency Report – BUCHANAN ELEMENTARY N=167
Center for Opinion Research 10 Franklin & Marshall College
29. When the teacher asks a question I usually know the answer even if the other students don't.
Really Agree
Kind of Agree
Kind of Disagree
Really Disagree
Spring 2012 29% 46% 20% 5% Spring 2011 38% 50% 11% 1% Spring 2010 39% 38% 13% 9% Spring 2009 41% 37% 14% 8%
Fall 2008 31% 52% 8% 10% Spring 2008 33% 41% 22% 3%
Fall 2007 42% 36% 15% 7% Spring 2007 34% 45% 18% 3%
Fall 2006 28% 55% 16% 2% 30. I work hard in school.
Really Agree
Kind of Agree
Kind of Disagree
Really Disagree
Spring 2012 80% 16% 2% 1% Spring 2011 78% 19% 1% 2% Spring 2010 78% 14% 6% 3% Spring 2009 81% 14% 2% 3%
Fall 2008 79% 20% 2% 0% Spring 2008 75% 20% 2% 2%
Fall 2007 78% 17% 2% 3% Spring 2007 80% 17% 1% 1%
Fall 2006 75% 23% 2% 0% 31. Most of my classmates work harder on their homework than I do.
Really Agree
Kind of Agree
Kind of Disagree
Really Disagree
Spring 2012 17% 18% 37% 28% Spring 2011 15% 30% 28% 26% Spring 2010 13% 32% 26% 30% Spring 2009 13% 18% 35% 33%
Fall 2008 20% 20% 26% 34% Spring 2008 14% 25% 31% 30%
Fall 2007 18% 24% 23% 35% Spring 2007 14% 31% 23% 32%
Fall 2006 16% 24% 39% 20%

School District of Lancaster, 2011-2012 Student Survey May 21-25, 2012 Marginal Frequency Report – BUCHANAN ELEMENTARY N=167
Center for Opinion Research 11 Franklin & Marshall College
32. I always get good grades when I try hard.
Really Agree
Kind of Agree
Kind of Disagree
Really Disagree
Spring 2012 74% 18% 7% 1% Spring 2011 81% 16% 1% 2% Spring 2010 76% 16% 5% 3% Spring 2009 79% 12% 3% 6%
Fall 2008 75% 17% 5% 3% Spring 2008 75% 19% 5% 1%
Fall 2007 74% 15% 4% 7% Spring 2007 85% 12% 2% 2%
Fall 2006 81% 10% 8% 2% 33. I usually do not get good grades in math because it is too hard.
Really Agree
Kind of Agree
Kind of Disagree
Really Disagree
Spring 2012 12% 15% 20% 53% Spring 2011 7% 11% 21% 60% Spring 2010 12% 16% 14% 59% Spring 2009 11% 13% 9% 68%
Fall 2008 8% 17% 21% 54% Spring 2008 10% 19% 21% 50%
Fall 2007 15% 15% 17% 53% Spring 2007 14% 21% 14% 51%
Fall 2006 10% 18% 22% 51% 34. Most of my classmates like to do math because it is easy.
Really Agree
Kind of Agree
Kind of Disagree
Really Disagree
Spring 2012 35% 27% 24% 14% Spring 2011 41% 22% 27% 10% Spring 2010 38% 24% 23% 15% Spring 2009 34% 21% 24% 21%
Fall 2008 40% 28% 16% 17% Spring 2008 43% 25% 21% 12%
Fall 2007 52% 20% 12% 15% Spring 2007 39% 29% 19% 14%
Fall 2006 45% 24% 18% 14%

School District of Lancaster, 2011-2012 Student Survey May 21-25, 2012 Marginal Frequency Report – BUCHANAN ELEMENTARY N=167
Center for Opinion Research 12 Franklin & Marshall College
35. I would get better grades if my teacher liked me more.
Really Agree
Kind of Agree
Kind of Disagree
Really Disagree
Spring 2012 11% 2% 10% 77% Spring 2011 6% 9% 11% 74% Spring 2010 10% 7% 12% 71% Spring 2009 17% 9% 10% 64%
Fall 2008 5% 8% 16% 71% Spring 2008 10% 9% 6% 74%
Fall 2007 12% 8% 11% 69% Spring 2007 9% 8% 8% 75%
Fall 2006 15% 8% 8% 69% 36. I will graduate from high school.
Really Agree
Kind of Agree
Kind of Disagree
Really Disagree
Spring 2012 87% 11% 0% 2% Spring 2011 90% 8% 2% 1% Spring 2010 90% 6% 1% 4% Spring 2009 86% 10% 1% 3%
Fall 2008 85% 12% 0% 3% Spring 2008 85% 13% 2% 0%
Fall 2007 83% 11% 3% 3% Spring 2007 87% 9% 1% 2%
Fall 2006 81% 15% 2% 2% 37. I go to a good school.
Really Agree
Kind of Agree
Kind of Disagree
Really Disagree
Spring 2012 67% 25% 6% 2% Spring 2011 74% 18% 7% 1% Spring 2010 80% 10% 5% 5% Spring 2009 75% 17% 3% 5%
Fall 2008 73% 16% 6% 5% Spring 2008 70% 21% 6% 3%
Fall 2007 77% 16% 5% 2% Spring 2007 76% 15% 4% 6%
Fall 2006 65% 25% 6% 4%

School District of Lancaster, 2011-2012 Student Survey May 21-25, 2012 Marginal Frequency Report – BUCHANAN ELEMENTARY N=167
Center for Opinion Research 13 Franklin & Marshall College
38. Adults who have good jobs probably were good students when they were young.
Really Agree
Kind of Agree
Kind of Disagree
Really Disagree
Spring 2012 77% 17% 5% 1% Spring 2011 68% 26% 5% 2% Spring 2010 79% 14% 2% 5% Spring 2009 68% 21% 7% 4%
Fall 2008 71% 23% 3% 4% Spring 2008 71% 20% 5% 4%
Fall 2007 72% 16% 6% 6% Spring 2007 64% 26% 6% 4%
Fall 2006 69% 28% 2% 2% 39. When I am old enough, I will go to college.
Really Agree
Kind of Agree
Kind of Disagree
Really Disagree
Spring 2012 85% 13% 0% 2% Spring 2011 88% 10% 1% 1% Spring 2010 86% 9% 1% 4% Spring 2009 89% 9% 2% 0%
Fall 2008 88% 4% 4% 4% Spring 2008 82% 14% 2% 3%
Fall 2007 87% 9% 0% 3% Spring 2007 84% 13% 1% 1%
Fall 2006 94% 4% 0% 2% 40. No one cares if I do well in school.
Really Agree
Kind of Agree
Kind of Disagree
Really Disagree
Spring 2012 4% 6% 10% 81% Spring 2011 5% 8% 13% 74% Spring 2010 10% 3% 9% 78% Spring 2009 10% 6% 9% 75%
Fall 2008 10% 8% 14% 68% Spring 2008 8% 8% 8% 76%
Fall 2007 11% 7% 10% 72% Spring 2007 9% 4% 10% 78%
Fall 2006 10% 6% 14% 71%

School District of Lancaster, 2011-2012 Student Survey May 21-25, 2012 Marginal Frequency Report – BUCHANAN ELEMENTARY N=167
Center for Opinion Research 14 Franklin & Marshall College
41. What I learn in school is not important.
Really Agree
Kind of Agree
Kind of Disagree
Really Disagree
Spring 2012 8% 3% 5% 83% Spring 2011 5% 4% 5% 87% Spring 2010 5% 4% 6% 84% Spring 2009 4% 3% 4% 89%
Fall 2008 3% 3% 10% 85% Spring 2008 5% 3% 5% 88%
Fall 2007 8% 1% 2% 89% Spring 2007 6% 1% 5% 88%
Fall 2006 6% 6% 2% 86% 42. It does not matter if I do well in school.
Really Agree
Kind of Agree
Kind of Disagree
Really Disagree
Spring 2012 6% 5% 6% 84% Spring 2011 4% 3% 7% 86% Spring 2010 9% 2% 5% 85% Spring 2009 9% 4% 5% 82%
Fall 2008 6% 3% 8% 83% Spring 2008 6% 2% 4% 88%
Fall 2007 9% 5% 3% 82% Spring 2007 8% 4% 5% 83%
Fall 2006 6% 2% 6% 86% 43. Students who get better grades than I do get more help from the teacher than I do.
Really Agree
Kind of Agree
Kind of Disagree
Really Disagree
Spring 2012 10% 6% 23% 61% Spring 2011 7% 4% 19% 70% Spring 2010 8% 10% 16% 66% Spring 2009 9% 9% 20% 62%
Fall 2008 12% 14% 13% 60% Spring 2008 8% 14% 15% 63%
Fall 2007 13% 8% 17% 62% Spring 2007 8% 6% 17% 68%
Fall 2006 10% 6% 26% 59%

School District of Lancaster, 2011-2012 Student Survey May 21-25, 2012 Marginal Frequency Report – BUCHANAN ELEMENTARY N=167
Center for Opinion Research 15 Franklin & Marshall College
44. I will quit school as soon as I can.
Really Agree
Kind of Agree
Kind of Disagree
Really Disagree
Spring 2012 3% 2% 6% 90% Spring 2011 1% 2% 8% 88% Spring 2010 4% 2% 6% 88% Spring 2009 3% 2% 2% 93%
Fall 2008 3% 4% 4% 88% Spring 2008 2% 4% 7% 87%
Fall 2007 6% 5% 2% 87% Spring 2007 4% 1% 2% 93%
Fall 2006 2% 2% 6% 90% 45. Teachers like students even if they do not always make good grades.
Really Agree
Kind of Agree
Kind of Disagree
Really Disagree
Spring 2012 68% 17% 7% 8% Spring 2011 70% 16% 8% 6% Spring 2010 71% 16% 5% 8% Spring 2009 75% 14% 6% 5%
Fall 2008 79% 12% 4% 4% Spring 2008 75% 14% 6% 5%
Fall 2007 77% 12% 7% 4% Spring 2007 76% 14% 5% 5%
Fall 2006 69% 22% 6% 4% 46. It is important to go to high school.
Really Agree
Kind of Agree
Kind of Disagree
Really Disagree
Spring 2012 93% 6% 0% 1% Spring 2011 90% 5% 1% 4% Spring 2010 89% 7% 1% 3% Spring 2009 91% 6% 1% 2%
Fall 2008 93% 3% 1% 4% Spring 2008 88% 8% 2% 2%
Fall 2007 93% 3% 2% 2% Spring 2007 95% 3% 0% 2%
ll 2006 98% 2% 0% 0%
School District of Lancaster, 2011-2012 Student Survey May 21-25, 2012 Marginal Frequency Report – BUCHANAN ELEMENTARY N=167
Center for Opinion Research 16 Franklin & Marshall College
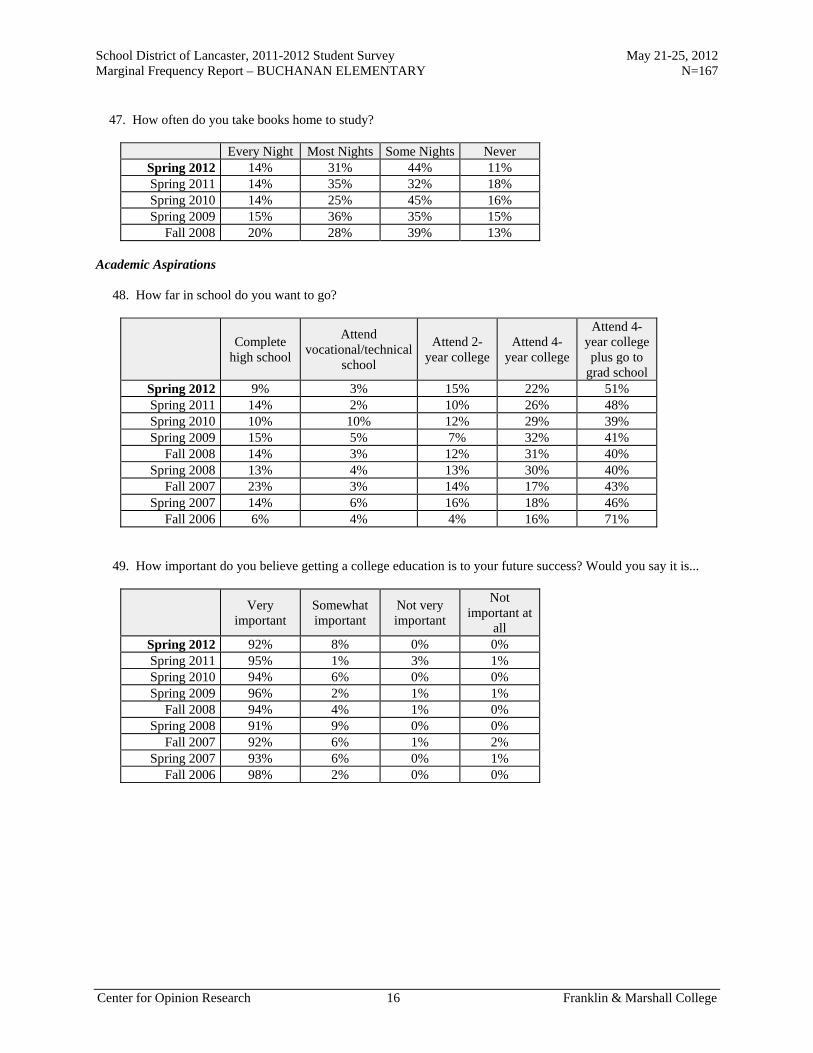
47. How often do you take books home to study?
Every Night Most Nights Some Nights Never Spring 2012 14% 31% 44% 11% Spring 2011 14% 35% 32% 18% Spring 2010 14% 25% 45% 16% Spring 2009 15% 36% 35% 15%
Fall 2008 20% 28% 39% 13% Academic Aspirations 48. How far in school do you want to go?
Complete
high school
Attend vocational/technical
school
Attend 2-year college
Attend 4-year college
Attend 4-year college plus go to
grad school Spring 2012 9% 3% 15% 22% 51% Spring 2011 14% 2% 10% 26% 48% Spring 2010 10% 10% 12% 29% 39% Spring 2009 15% 5% 7% 32% 41%
Fall 2008 14% 3% 12% 31% 40% Spring 2008 13% 4% 13% 30% 40%
Fall 2007 23% 3% 14% 17% 43% Spring 2007 14% 6% 16% 18% 46%
Fall 2006 6% 4% 4% 16% 71% 49. How important do you believe getting a college education is to your future success? Would you say it is...
Very
important Somewhat important
Not very important
Not important at
all Spring 2012 92% 8% 0% 0% Spring 2011 95% 1% 3% 1% Spring 2010 94% 6% 0% 0% Spring 2009 96% 2% 1% 1%
Fall 2008 94% 4% 1% 0% Spring 2008 91% 9% 0% 0%
Fall 2007 92% 6% 1% 2% Spring 2007 93% 6% 0% 1%
Fall 2006 98% 2% 0% 0%
School District of Lancaster, 2011-2012 Student Survey May 21-25, 2012 Marginal Frequency Report – BUCHANAN ELEMENTARY N=167
Center for Opinion Research 17 Franklin & Marshall College
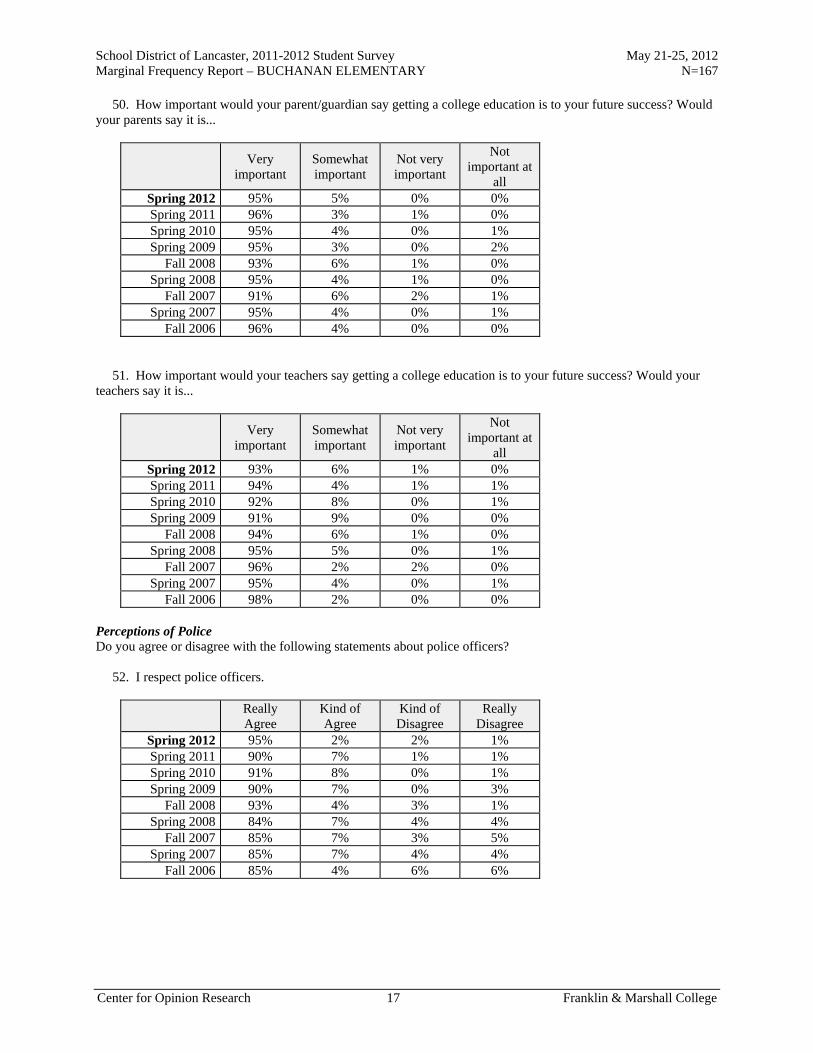
50. How important would your parent/guardian say getting a college education is to your future success? Would your parents say it is...
Very
important Somewhat important
Not very important
Not important at
all Spring 2012 95% 5% 0% 0% Spring 2011 96% 3% 1% 0% Spring 2010 95% 4% 0% 1% Spring 2009 95% 3% 0% 2%
Fall 2008 93% 6% 1% 0% Spring 2008 95% 4% 1% 0%
Fall 2007 91% 6% 2% 1% Spring 2007 95% 4% 0% 1%
Fall 2006 96% 4% 0% 0% 51. How important would your teachers say getting a college education is to your future success? Would your teachers say it is...
Very
important Somewhat important
Not very important
Not important at
all Spring 2012 93% 6% 1% 0% Spring 2011 94% 4% 1% 1% Spring 2010 92% 8% 0% 1% Spring 2009 91% 9% 0% 0%
Fall 2008 94% 6% 1% 0% Spring 2008 95% 5% 0% 1%
Fall 2007 96% 2% 2% 0% Spring 2007 95% 4% 0% 1%
Fall 2006 98% 2% 0% 0% Perceptions of Police Do you agree or disagree with the following statements about police officers? 52. I respect police officers.
Really Agree
Kind of Agree
Kind of Disagree
Really Disagree
Spring 2012 95% 2% 2% 1% Spring 2011 90% 7% 1% 1% Spring 2010 91% 8% 0% 1% Spring 2009 90% 7% 0% 3%
Fall 2008 93% 4% 3% 1% Spring 2008 84% 7% 4% 4%
Fall 2007 85% 7% 3% 5% Spring 2007 85% 7% 4% 4%
Fall 2006 85% 4% 6% 6%

School District of Lancaster, 2011-2012 Student Survey May 21-25, 2012 Marginal Frequency Report – BUCHANAN ELEMENTARY N=167
Center for Opinion Research 18 Franklin & Marshall College
53. I am comfortable approaching police officers.
Really Agree
Kind of Agree
Kind of Disagree
Really Disagree
Spring 2012 60% 32% 4% 4% Spring 2011 54% 35% 7% 5% Spring 2010 53% 38% 3% 6% Spring 2009 64% 22% 10% 4%
Fall 2008 66% 22% 7% 4% Spring 2008 58% 23% 12% 8%
Fall 2007 60% 14% 15% 12% Spring 2007 62% 25% 6% 7%
Fall 2006 55% 26% 8% 10% 54. I would consider police work as a career.
Really Agree
Kind of Agree
Kind of Disagree
Really Disagree
Spring 2012 34% 21% 16% 28% Spring 2011 36% 22% 21% 21% Spring 2010 36% 14% 16% 34% Spring 2009 40% 22% 16% 22%
Fall 2008 47% 23% 11% 19% Spring 2008 40% 23% 11% 26%
Fall 2007 37% 18% 16% 29% Spring 2007 36% 19% 14% 31%
Fall 2006 26% 22% 10% 42% 55. In general, I do not trust the police.
Really Agree
Kind of Agree
Kind of Disagree
Really Disagree
Spring 2012 7% 6% 11% 76% Spring 2011 7% 7% 10% 76% Spring 2010 8% 2% 13% 76% Spring 2009 8% 3% 9% 80%
Fall 2008 12% 7% 9% 72% Spring 2008 6% 8% 12% 74%
Fall 2007 15% 6% 11% 68% Spring 2007 11% 6% 11% 72%
Fall 2006 12% 10% 10% 69%
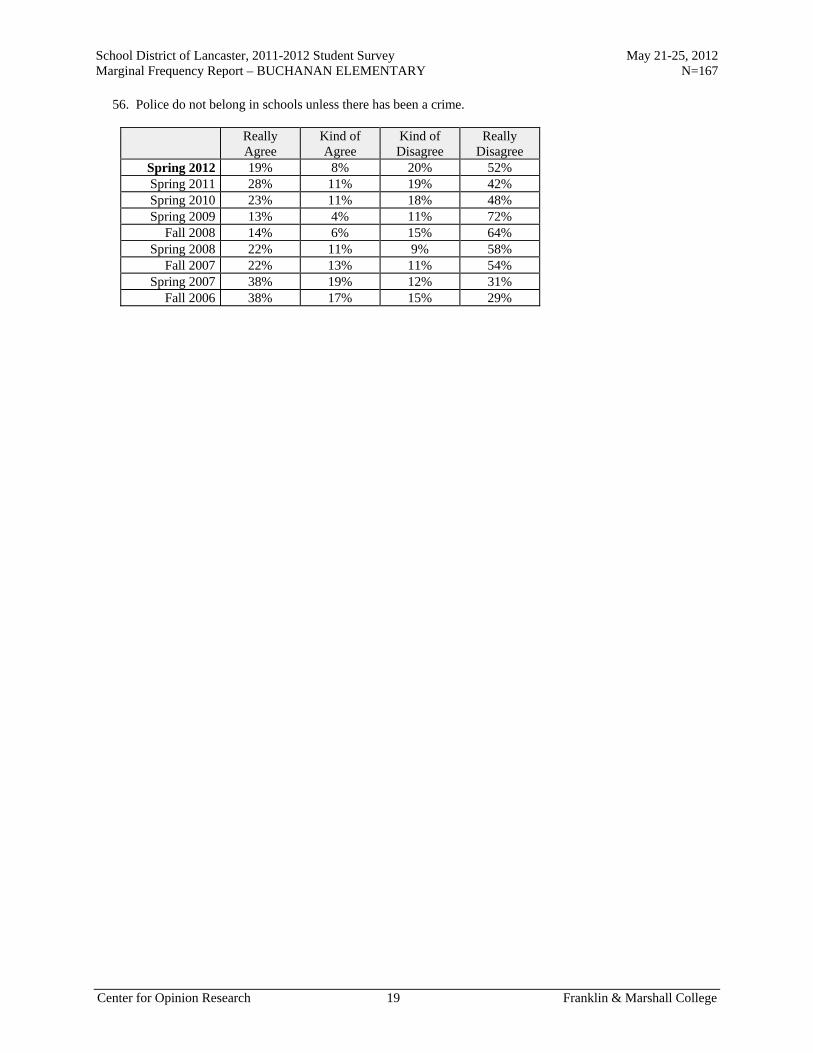
School District of Lancaster, 2011-2012 Student Survey May 21-25, 2012 Marginal Frequency Report – BUCHANAN ELEMENTARY N=167
Center for Opinion Research 19 Franklin & Marshall College
56. Police do not belong in schools unless there has been a crime.
Really Agree
Kind of Agree
Kind of Disagree
Really Disagree
Spring 2012 19% 8% 20% 52% Spring 2011 28% 11% 19% 42% Spring 2010 23% 11% 18% 48% Spring 2009 13% 4% 11% 72%
Fall 2008 14% 6% 15% 64% Spring 2008 22% 11% 9% 58%
Fall 2007 22% 13% 11% 54% Spring 2007 38% 19% 12% 31%
Fall 2006 38% 17% 15% 29%

Report D
Marginal Frequency Report Burrowes Elementary School

School District of Lancaster, 2011-2012 Student Survey May 21-25, 2012 Marginal Frequency Report – BURROWES ELEMENTARY N=163
Center for Opinion Research 1 Franklin & Marshall College
School Climate Do you agree or disagree with the following statements? 1. I feel safe at this school.
Really Agree
Kind of Agree
Kind of Disagree
Really Disagree
Spring 2012 54% 35% 8% 2% Spring 2011 59% 30% 8% 3% Spring 2010 56% 31% 8% 5% Spring 2009 39% 39% 13% 9%
Fall 2008 55% 26% 14% 6% Spring 2008 43% 31% 13% 13%
Fall 2007 51% 32% 7% 10% Spring 2007 40% 33% 17% 10%
Fall 2006 45% 31% 15% 8% 2. I feel safe going to and from school.
Really Agree
Kind of Agree
Kind of Disagree
Really Disagree
Spring 2012 62% 23% 8% 6% Spring 2011 60% 28% 9% 2% Spring 2010 53% 30% 12% 5% Spring 2009 58% 22% 11% 9%
Fall 2008 57% 24% 9% 10% Spring 2008 55% 27% 10% 8%
Fall 2007 50% 30% 11% 9% Spring 2007 54% 26% 11% 10%
Fall 2006 50% 31% 8% 11% 3. Students get along well with each other.
Really Agree
Kind of Agree
Kind of Disagree
Really Disagree
Spring 2012 15% 43% 30% 12% Spring 2011 12% 48% 23% 17% Spring 2010 6% 36% 37% 22% Spring 2009 7% 27% 35% 31%
Fall 2008 15% 30% 30% 26% Spring 2008 8% 28% 37% 27%
Fall 2007 16% 30% 29% 25% Spring 2007 7% 25% 28% 41%
Fall 2006 18% 29% 28% 24%

School District of Lancaster, 2011-2012 Student Survey May 21-25, 2012 Marginal Frequency Report – BURROWES ELEMENTARY N=163
Center for Opinion Research 2 Franklin & Marshall College
4. Students get along well with teachers.
Really Agree
Kind of Agree
Kind of Disagree
Really Disagree
Spring 2012 33% 46% 15% 6% Spring 2011 28% 45% 21% 6% Spring 2010 22% 49% 20% 9% Spring 2009 20% 37% 26% 17%
Fall 2008 31% 36% 22% 11% Spring 2008 16% 44% 28% 13%
Fall 2007 33% 30% 23% 14% Spring 2007 17% 31% 34% 17%
Fall 2006 25% 35% 20% 20% 5. I like my school.
Really Agree
Kind of Agree
Kind of Disagree
Really Disagree
Spring 2012 56% 25% 9% 9% Spring 2011 57% 26% 9% 8% Spring 2010 64% 19% 7% 10% Spring 2009 43% 27% 15% 15%
Fall 2008 53% 26% 10% 11% Spring 2008 40% 31% 16% 14%
Fall 2007 56% 23% 14% 6% Spring 2007 35% 30% 11% 25%
Fall 2006 48% 21% 12% 18% 6. I like my teachers.
Really Agree
Kind of Agree
Kind of Disagree
Really Disagree
Spring 2012 76% 18% 4% 2% Spring 2011 65% 23% 9% 3% Spring 2010 71% 19% 8% 2% Spring 2009 57% 24% 8% 11%
Fall 2008 71% 17% 4% 7% Spring 2008 64% 21% 8% 8%
Fall 2007 78% 12% 6% 4% Spring 2007 60% 21% 11% 7%
Fall 2006 74% 12% 5% 9%

School District of Lancaster, 2011-2012 Student Survey May 21-25, 2012 Marginal Frequency Report – BURROWES ELEMENTARY N=163
Center for Opinion Research 3 Franklin & Marshall College
7. There is a teacher or some other adult at this school who really cares about me.
Really Agree
Kind of Agree
Kind of Disagree
Really Disagree
Spring 2012 68% 20% 8% 4% Spring 2011 62% 28% 6% 4% Spring 2010 68% 26% 2% 4% Spring 2009 63% 21% 7% 9%
Fall 2008 66% 19% 9% 6% Spring 2008 67% 20% 7% 6%
Fall 2007 71% 16% 6% 6% Spring 2007 59% 22% 9% 10%
Fall 2006 66% 18% 10% 5% 8. There is a teacher or some other adult at this school who cares when I am not here.
Really Agree
Kind of Agree
Kind of Disagree
Really Disagree
Spring 2012 44% 29% 7% 19% Spring 2011 42% 30% 14% 14% Spring 2010 50% 28% 10% 12% Spring 2009 39% 26% 14% 21%
Fall 2008 49% 22% 12% 17% Spring 2008 42% 29% 11% 19%
Fall 2007 50% 22% 5% 23% Spring 2007 39% 27% 9% 25%
Fall 2006 44% 18% 10% 28% 9. There is a teacher or some other adult at this school who listens to me when I have something to say.
Really Agree
Kind of Agree
Kind of Disagree
Really Disagree
Spring 2012 67% 22% 8% 3% Spring 2011 68% 22% 4% 6% Spring 2010 73% 17% 5% 5% Spring 2009 58% 26% 6% 10%
Fall 2008 67% 20% 7% 6% Spring 2008 62% 24% 9% 5%
Fall 2007 68% 21% 6% 5% Spring 2007 49% 24% 22% 6%
Fall 2006 62% 21% 8% 8%

School District of Lancaster, 2011-2012 Student Survey May 21-25, 2012 Marginal Frequency Report – BURROWES ELEMENTARY N=163
Center for Opinion Research 4 Franklin & Marshall College
10. There is a teacher or some other adult at this school who tells me when I do a good job.
Really Agree
Kind of Agree
Kind of Disagree
Really Disagree
Spring 2012 79% 17% 2% 2% Spring 2011 81% 14% 3% 1% Spring 2010 76% 18% 2% 4% Spring 2009 69% 20% 6% 5%
Fall 2008 76% 16% 3% 4% Spring 2008 75% 20% 3% 2%
Fall 2007 79% 13% 5% 3% Spring 2007 65% 26% 9% 0%
Fall 2006 78% 16% 5% 1% 11. There is a teacher or some other adult at this school who always wants me to do my best.
Really Agree
Kind of Agree
Kind of Disagree
Really Disagree
Spring 2012 86% 11% 2% 1% Spring 2011 88% 8% 4% 1% Spring 2010 91% 6% 2% 1% Spring 2009 79% 13% 3% 5%
Fall 2008 84% 11% 2% 4% Spring 2008 87% 10% 1% 1%
Fall 2007 87% 9% 3% 1% Spring 2007 79% 17% 3% 1%
Fall 2006 88% 9% 3% 1% 12. There is a teacher or some other adult at this school who believes that I will be a success.
Really Agree
Kind of Agree
Kind of Disagree
Really Disagree
Spring 2012 72% 24% 4% 1% Spring 2011 73% 22% 4% 1% Spring 2010 76% 20% 1% 2% Spring 2009 63% 25% 7% 5%
Fall 2008 63% 24% 9% 4% Spring 2008 72% 19% 5% 4%
Fall 2007 72% 20% 4% 4% Spring 2007 64% 25% 6% 5%
Fall 2006 61% 27% 4% 8%

School District of Lancaster, 2011-2012 Student Survey May 21-25, 2012 Marginal Frequency Report – BURROWES ELEMENTARY N=163
Center for Opinion Research 5 Franklin & Marshall College
13. Students in this school really listen to teachers.
Really Agree
Kind of Agree
Kind of Disagree
Really Disagree
Spring 2012 13% 43% 33% 10% Spring 2011 13% 50% 22% 15% Spring 2010 11% 41% 33% 15% Spring 2009 7% 26% 38% 29%
Fall 2008 14% 32% 32% 21% Spring 2008 9% 31% 34% 26%
Fall 2007 14% 35% 26% 25% Spring 2007 9% 28% 29% 33%
Fall 2006 17% 25% 32% 26% 14. Most teachers make learning interesting.
Really Agree
Kind of Agree
Kind of Disagree
Really Disagree
Spring 2012 46% 38% 11% 6% Spring 2011 49% 33% 13% 4% Spring 2010 53% 36% 7% 3% Spring 2009 40% 33% 15% 13%
Fall 2008 52% 26% 12% 9% Spring 2008 49% 34% 11% 7%
Fall 2007 55% 27% 14% 4% Spring 2007 37% 35% 17% 11%
Fall 2006 52% 26% 10% 13% 15. This school is always getting better.
Really Agree
Kind of Agree
Kind of Disagree
Really Disagree
Spring 2012 31% 38% 18% 12% Spring 2011 38% 35% 14% 13% Spring 2010 38% 37% 14% 11% Spring 2009 23% 26% 22% 28%
Fall 2008 33% 29% 21% 18% Spring 2008 28% 30% 22% 20%
Fall 2007 40% 30% 17% 13% Spring 2007 22% 26% 28% 24%
Fall 2006 37% 19% 21% 23%

School District of Lancaster, 2011-2012 Student Survey May 21-25, 2012 Marginal Frequency Report – BURROWES ELEMENTARY N=163
Center for Opinion Research 6 Franklin & Marshall College
Readiness and Emergency Management 16. Has anyone from your school spoken with you about what to do in the event of a school emergency, or not?
Yes No Spring 2012 86% 14% Spring 2011 82% 18%
Do you agree or disagree with the following statement? 17. I know what to do if there is a school emergency.
Really Agree
Kind of Agree
Kind of Disagree
Really Disagree
Spring 2012 84% 13% 1% 2% Spring 2011 85% 12% 2% 0%
Academic Self-efficacy Do you agree or disagree with the following statements? 18. I am a good science student.
Really Agree
Kind of Agree
Kind of Disagree
Really Disagree
Spring 2012 41% 44% 12% 3% Spring 2011 49% 37% 10% 3% Spring 2010 49% 37% 10% 5% Spring 2009 52% 35% 11% 2%
Fall 2008 48% 38% 8% 7% Spring 2008 53% 33% 9% 4%
Fall 2007 56% 31% 8% 4% Spring 2007 52% 30% 10% 7%
Fall 2006 49% 35% 9% 7% 19. Sometimes I think an assignment is easy when the other students think it is hard.
Really Agree
Kind of Agree
Kind of Disagree
Really Disagree
Spring 2012 45% 36% 12% 8% Spring 2011 42% 41% 11% 6% Spring 2010 47% 37% 9% 7% Spring 2009 51% 33% 11% 5%
Fall 2008 54% 30% 10% 6% Spring 2008 58% 28% 7% 7%
Fall 2007 52% 28% 11% 9% Spring 2007 40% 36% 13% 12%
Fall 2006 45% 34% 8% 13%

School District of Lancaster, 2011-2012 Student Survey May 21-25, 2012 Marginal Frequency Report – BURROWES ELEMENTARY N=163
Center for Opinion Research 7 Franklin & Marshall College
20. I am good social studies student.
Really Agree
Kind of Agree
Kind of Disagree
Really Disagree
Spring 2012 35% 42% 16% 6% Spring 2011 40% 44% 14% 2% Spring 2010 54% 31% 12% 2% Spring 2009 38% 32% 22% 8%
Fall 2008 43% 35% 16% 7% Spring 2008 46% 36% 10% 7%
Fall 2007 48% 35% 11% 6% Spring 2007 40% 30% 20% 10%
Fall 2006 40% 34% 14% 11% 21. My teacher thinks I am smart.
Really Agree
Kind of Agree
Kind of Disagree
Really Disagree
Spring 2012 65% 26% 8% 2% Spring 2011 66% 27% 4% 3% Spring 2010 72% 21% 3% 4% Spring 2009 66% 21% 5% 8%
Fall 2008 65% 24% 4% 7% Spring 2008 72% 15% 7% 6%
Fall 2007 73% 16% 7% 4% Spring 2007 61% 25% 10% 4%
Fall 2006 66% 22% 5% 7% 22. I am a good math student.
Really Agree
Kind of Agree
Kind of Disagree
Really Disagree
Spring 2012 54% 32% 10% 4% Spring 2011 47% 36% 11% 6% Spring 2010 58% 29% 8% 5% Spring 2009 51% 27% 11% 11%
Fall 2008 63% 21% 8% 8% Spring 2008 61% 24% 9% 6%
Fall 2007 64% 24% 9% 4% Spring 2007 55% 30% 10% 4%
Fall 2006 62% 25% 7% 6%

School District of Lancaster, 2011-2012 Student Survey May 21-25, 2012 Marginal Frequency Report – BURROWES ELEMENTARY N=163
Center for Opinion Research 8 Franklin & Marshall College
23. My classmates usually get better grades than I do.
Really Agree
Kind of Agree
Kind of Disagree
Really Disagree
Spring 2012 20% 36% 29% 15% Spring 2011 19% 37% 27% 17% Spring 2010 14% 38% 24% 24% Spring 2009 22% 26% 26% 26%
Fall 2008 21% 24% 24% 31% Spring 2008 18% 30% 25% 28%
Fall 2007 22% 25% 24% 29% Spring 2007 21% 21% 30% 29%
Fall 2006 21% 27% 20% 32% 24. I usually understand my homework assignments.
Really Agree
Kind of Agree
Kind of Disagree
Really Disagree
Spring 2012 32% 54% 9% 4% Spring 2011 48% 37% 11% 5% Spring 2010 42% 40% 11% 6% Spring 2009 42% 34% 17% 6%
Fall 2008 52% 33% 7% 7% Spring 2008 47% 36% 8% 10%
Fall 2007 46% 37% 9% 8% Spring 2007 40% 42% 13% 5%
Fall 2006 54% 28% 13% 5% 25. I could get the best grades in class if I tried hard enough.
Really Agree
Kind of Agree
Kind of Disagree
Really Disagree
Spring 2012 74% 22% 4% 0% Spring 2011 74% 19% 4% 3% Spring 2010 79% 16% 1% 4% Spring 2009 77% 13% 5% 4%
Fall 2008 74% 17% 4% 6% Spring 2008 79% 14% 4% 2%
Fall 2007 82% 10% 5% 4% Spring 2007 71% 22% 4% 3%
Fall 2006 82% 9% 5% 4%

School District of Lancaster, 2011-2012 Student Survey May 21-25, 2012 Marginal Frequency Report – BURROWES ELEMENTARY N=163
Center for Opinion Research 9 Franklin & Marshall College
26. I am a good reading student.
Really Agree
Kind of Agree
Kind of Disagree
Really Disagree
Spring 2012 60% 26% 12% 3% Spring 2011 56% 32% 10% 2% Spring 2010 53% 32% 12% 4% Spring 2009 61% 26% 8% 5%
Fall 2008 64% 24% 7% 5% Spring 2008 63% 24% 10% 3%
Fall 2007 66% 24% 6% 4% Spring 2007 55% 29% 8% 7%
Fall 2006 76% 19% 2% 3% 27. It is not hard for me to get good grades in school.
Really Agree
Kind of Agree
Kind of Disagree
Really Disagree
Spring 2012 38% 39% 15% 8% Spring 2011 38% 41% 17% 4% Spring 2010 41% 40% 15% 4% Spring 2009 42% 32% 13% 13%
Fall 2008 50% 30% 12% 8% Spring 2008 44% 30% 13% 13%
Fall 2007 47% 30% 11% 11% Spring 2007 38% 41% 13% 8%
Fall 2006 42% 34% 13% 10% 28. I am smart.
Really Agree
Kind of Agree
Kind of Disagree
Really Disagree
Spring 2012 66% 27% 5% 2% Spring 2011 67% 24% 6% 3% Spring 2010 69% 24% 4% 3% Spring 2009 69% 22% 6% 4%
Fall 2008 72% 19% 5% 4% Spring 2008 68% 26% 4% 3%
Fall 2007 72% 21% 5% 2% Spring 2007 66% 28% 4% 2%
Fall 2006 65% 26% 5% 3%

School District of Lancaster, 2011-2012 Student Survey May 21-25, 2012 Marginal Frequency Report – BURROWES ELEMENTARY N=163
Center for Opinion Research 10 Franklin & Marshall College
29. When the teacher asks a question I usually know the answer even if the other students don't.
Really Agree
Kind of Agree
Kind of Disagree
Really Disagree
Spring 2012 24% 53% 18% 6% Spring 2011 31% 52% 13% 5% Spring 2010 30% 50% 12% 8% Spring 2009 38% 37% 18% 7%
Fall 2008 43% 38% 13% 6% Spring 2008 41% 44% 9% 6%
Fall 2007 42% 43% 8% 6% Spring 2007 36% 43% 18% 4%
Fall 2006 41% 33% 17% 8% 30. I work hard in school.
Really Agree
Kind of Agree
Kind of Disagree
Really Disagree
Spring 2012 71% 24% 5% 1% Spring 2011 66% 30% 1% 3% Spring 2010 70% 25% 5% 1% Spring 2009 64% 23% 6% 7%
Fall 2008 70% 22% 6% 2% Spring 2008 74% 20% 2% 4%
Fall 2007 72% 18% 5% 4% Spring 2007 58% 32% 6% 4%
Fall 2006 76% 19% 3% 2% 31. Most of my classmates work harder on their homework than I do.
Really Agree
Kind of Agree
Kind of Disagree
Really Disagree
Spring 2012 19% 35% 28% 18% Spring 2011 24% 28% 30% 17% Spring 2010 25% 26% 30% 19% Spring 2009 14% 29% 32% 26%
Fall 2008 19% 28% 25% 29% Spring 2008 15% 27% 30% 28%
Fall 2007 15% 26% 26% 33% Spring 2007 21% 27% 27% 25%
Fall 2006 23% 29% 21% 27%

School District of Lancaster, 2011-2012 Student Survey May 21-25, 2012 Marginal Frequency Report – BURROWES ELEMENTARY N=163
Center for Opinion Research 11 Franklin & Marshall College
32. I always get good grades when I try hard.
Really Agree
Kind of Agree
Kind of Disagree
Really Disagree
Spring 2012 68% 26% 3% 4% Spring 2011 80% 13% 4% 3% Spring 2010 72% 20% 5% 2% Spring 2009 74% 20% 4% 2%
Fall 2008 79% 13% 3% 5% Spring 2008 77% 19% 2% 2%
Fall 2007 80% 11% 6% 4% Spring 2007 74% 22% 2% 1%
Fall 2006 73% 15% 6% 5% 33. I usually do not get good grades in math because it is too hard.
Really Agree
Kind of Agree
Kind of Disagree
Really Disagree
Spring 2012 11% 24% 24% 41% Spring 2011 11% 26% 19% 44% Spring 2010 9% 25% 22% 43% Spring 2009 10% 26% 17% 47%
Fall 2008 16% 20% 14% 49% Spring 2008 14% 14% 17% 55%
Fall 2007 18% 16% 11% 55% Spring 2007 15% 19% 16% 49%
Fall 2006 15% 30% 11% 45% 34. Most of my classmates like to do math because it is easy.
Really Agree
Kind of Agree
Kind of Disagree
Really Disagree
Spring 2012 38% 35% 18% 9% Spring 2011 37% 36% 14% 13% Spring 2010 44% 30% 17% 9% Spring 2009 40% 28% 20% 12%
Fall 2008 49% 26% 14% 12% Spring 2008 48% 29% 13% 10%
Fall 2007 47% 28% 14% 11% Spring 2007 38% 27% 20% 15%
Fall 2006 46% 24% 12% 18%

School District of Lancaster, 2011-2012 Student Survey May 21-25, 2012 Marginal Frequency Report – BURROWES ELEMENTARY N=163
Center for Opinion Research 12 Franklin & Marshall College
35. I would get better grades if my teacher liked me more.
Really Agree
Kind of Agree
Kind of Disagree
Really Disagree
Spring 2012 16% 13% 16% 56% Spring 2011 11% 17% 20% 52% Spring 2010 16% 13% 12% 60% Spring 2009 20% 11% 12% 57%
Fall 2008 24% 14% 15% 47% Spring 2008 14% 14% 14% 58%
Fall 2007 21% 14% 10% 55% Spring 2007 17% 18% 11% 54%
Fall 2006 30% 8% 13% 49% 36. I will graduate from high school.
Really Agree
Kind of Agree
Kind of Disagree
Really Disagree
Spring 2012 83% 12% 3% 2% Spring 2011 80% 16% 2% 2% Spring 2010 80% 18% 1% 1% Spring 2009 83% 12% 2% 3%
Fall 2008 84% 9% 4% 3% Spring 2008 84% 14% 1% 1%
Fall 2007 91% 4% 1% 4% Spring 2007 88% 10% 1% 1%
Fall 2006 80% 12% 3% 4% 37. I go to a good school.
Really Agree
Kind of Agree
Kind of Disagree
Really Disagree
Spring 2012 67% 19% 6% 8% Spring 2011 61% 25% 8% 6% Spring 2010 62% 26% 6% 7% Spring 2009 53% 21% 13% 13%
Fall 2008 61% 20% 12% 7% Spring 2008 54% 20% 12% 14%
Fall 2007 61% 24% 8% 8% Spring 2007 34% 30% 16% 19%
Fall 2006 56% 19% 10% 16%

School District of Lancaster, 2011-2012 Student Survey May 21-25, 2012 Marginal Frequency Report – BURROWES ELEMENTARY N=163
Center for Opinion Research 13 Franklin & Marshall College
38. Adults who have good jobs probably were good students when they were young.
Really Agree
Kind of Agree
Kind of Disagree
Really Disagree
Spring 2012 72% 21% 4% 2% Spring 2011 78% 20% 1% 0% Spring 2010 78% 15% 5% 2% Spring 2009 69% 18% 9% 5%
Fall 2008 70% 19% 6% 6% Spring 2008 68% 21% 7% 4%
Fall 2007 70% 21% 8% 1% Spring 2007 64% 25% 9% 2%
Fall 2006 69% 20% 6% 4% 39. When I am old enough, I will go to college.
Really Agree
Kind of Agree
Kind of Disagree
Really Disagree
Spring 2012 79% 12% 6% 3% Spring 2011 80% 11% 4% 4% Spring 2010 82% 13% 2% 2% Spring 2009 80% 12% 3% 5%
Fall 2008 76% 16% 4% 4% Spring 2008 82% 11% 5% 2%
Fall 2007 81% 9% 1% 8% Spring 2007 79% 14% 3% 4%
Fall 2006 80% 11% 4% 6% 40. No one cares if I do well in school.
Really Agree
Kind of Agree
Kind of Disagree
Really Disagree
Spring 2012 10% 8% 17% 65% Spring 2011 7% 11% 13% 68% Spring 2010 7% 11% 11% 71% Spring 2009 12% 10% 16% 62%
Fall 2008 14% 11% 14% 62% Spring 2008 10% 7% 11% 72%
Fall 2007 16% 9% 13% 62% Spring 2007 16% 8% 16% 60%
Fall 2006 18% 12% 9% 62%

School District of Lancaster, 2011-2012 Student Survey May 21-25, 2012 Marginal Frequency Report – BURROWES ELEMENTARY N=163
Center for Opinion Research 14 Franklin & Marshall College
41. What I learn in school is not important.
Really Agree
Kind of Agree
Kind of Disagree
Really Disagree
Spring 2012 4% 6% 10% 80% Spring 2011 8% 8% 7% 77% Spring 2010 8% 2% 4% 86% Spring 2009 12% 7% 8% 73%
Fall 2008 10% 2% 11% 77% Spring 2008 8% 4% 7% 81%
Fall 2007 11% 3% 9% 77% Spring 2007 11% 9% 10% 71%
Fall 2006 17% 7% 8% 68% 42. It does not matter if I do well in school.
Really Agree
Kind of Agree
Kind of Disagree
Really Disagree
Spring 2012 6% 3% 10% 81% Spring 2011 9% 6% 6% 79% Spring 2010 7% 4% 5% 85% Spring 2009 11% 4% 14% 71%
Fall 2008 16% 4% 12% 69% Spring 2008 9% 5% 7% 79%
Fall 2007 16% 5% 6% 73% Spring 2007 9% 9% 6% 75%
Fall 2006 20% 7% 11% 63% 43. Students who get better grades than I do get more help from the teacher than I do.
Really Agree
Kind of Agree
Kind of Disagree
Really Disagree
Spring 2012 12% 20% 22% 46% Spring 2011 18% 9% 27% 46% Spring 2010 14% 11% 24% 51% Spring 2009 21% 19% 17% 43%
Fall 2008 17% 15% 18% 50% Spring 2008 12% 15% 12% 62%
Fall 2007 17% 16% 13% 54% Spring 2007 20% 16% 16% 48%
Fall 2006 22% 12% 16% 50%
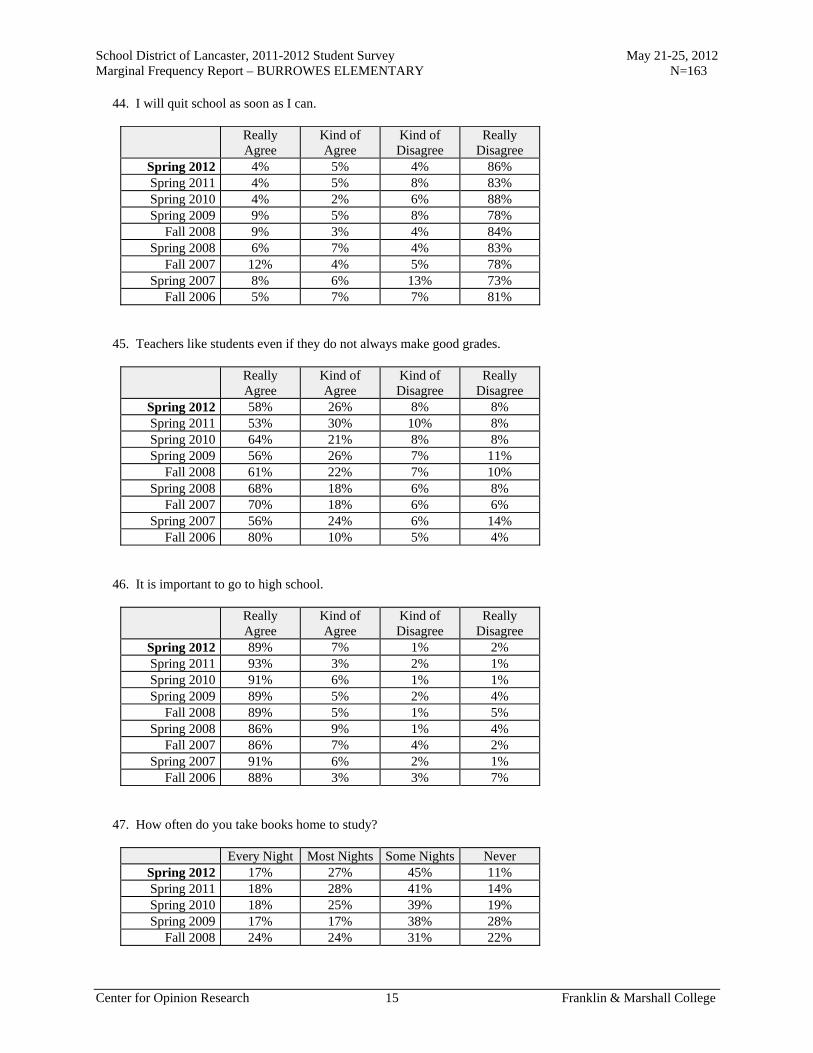
School District of Lancaster, 2011-2012 Student Survey May 21-25, 2012 Marginal Frequency Report – BURROWES ELEMENTARY N=163
Center for Opinion Research 15 Franklin & Marshall College
44. I will quit school as soon as I can.
Really Agree
Kind of Agree
Kind of Disagree
Really Disagree
Spring 2012 4% 5% 4% 86% Spring 2011 4% 5% 8% 83% Spring 2010 4% 2% 6% 88% Spring 2009 9% 5% 8% 78%
Fall 2008 9% 3% 4% 84% Spring 2008 6% 7% 4% 83%
Fall 2007 12% 4% 5% 78% Spring 2007 8% 6% 13% 73%
Fall 2006 5% 7% 7% 81% 45. Teachers like students even if they do not always make good grades.
Really Agree
Kind of Agree
Kind of Disagree
Really Disagree
Spring 2012 58% 26% 8% 8% Spring 2011 53% 30% 10% 8% Spring 2010 64% 21% 8% 8% Spring 2009 56% 26% 7% 11%
Fall 2008 61% 22% 7% 10% Spring 2008 68% 18% 6% 8%
Fall 2007 70% 18% 6% 6% Spring 2007 56% 24% 6% 14%
Fall 2006 80% 10% 5% 4% 46. It is important to go to high school.
Really Agree
Kind of Agree
Kind of Disagree
Really Disagree
Spring 2012 89% 7% 1% 2% Spring 2011 93% 3% 2% 1% Spring 2010 91% 6% 1% 1% Spring 2009 89% 5% 2% 4%
Fall 2008 89% 5% 1% 5% Spring 2008 86% 9% 1% 4%
Fall 2007 86% 7% 4% 2% Spring 2007 91% 6% 2% 1%
Fall 2006 88% 3% 3% 7% 47. How often do you take books home to study?
Every Night Most Nights Some Nights Never Spring 2012 17% 27% 45% 11% Spring 2011 18% 28% 41% 14% Spring 2010 18% 25% 39% 19% Spring 2009 17% 17% 38% 28%
Fall 2008 24% 24% 31% 22%

School District of Lancaster, 2011-2012 Student Survey May 21-25, 2012 Marginal Frequency Report – BURROWES ELEMENTARY N=163
Center for Opinion Research 16 Franklin & Marshall College
Academic Aspirations 48. How far in school do you want to go?
Complete
high school
Attend vocational/technical
school
Attend 2-year college
Attend 4-year college
Attend 4-year college plus go to
grad school Spring 2012 13% 7% 19% 16% 45% Spring 2011 16% 3% 19% 25% 37% Spring 2010 19% 4% 12% 25% 39% Spring 2009 22% 2% 16% 25% 35%
Fall 2008 22% 3% 13% 22% 40% Spring 2008 17% 2% 18% 21% 42%
Fall 2007 20% 5% 15% 19% 41% Spring 2007 17% 1% 13% 31% 38%
Fall 2006 25% 2% 13% 19% 41% 49. How important do you believe getting a college education is to your future success? Would you say it is...
Very
important Somewhat important
Not very important
Not important at
all Spring 2012 92% 7% 1% 0% Spring 2011 94% 5% 0% 1% Spring 2010 93% 4% 2% 0% Spring 2009 90% 7% 1% 1%
Fall 2008 93% 3% 2% 1% Spring 2008 94% 5% 0% 1%
Fall 2007 92% 3% 2% 2% Spring 2007 90% 8% 1% 1%
Fall 2006 89% 8% 3% 0% 50. How important would your parent/guardian say getting a college education is to your future success? Would your parents say it is...
Very
important Somewhat important
Not very important
Not important at
all Spring 2012 94% 4% 1% 1% Spring 2011 91% 7% 2% 0% Spring 2010 94% 5% 1% 0% Spring 2009 94% 3% 2% 1%
Fall 2008 94% 5% 0% 1% Spring 2008 96% 2% 1% 2%
Fall 2007 90% 8% 2% 0% Spring 2007 93% 6% 1% 1%
Fall 2006 88% 9% 0% 3%
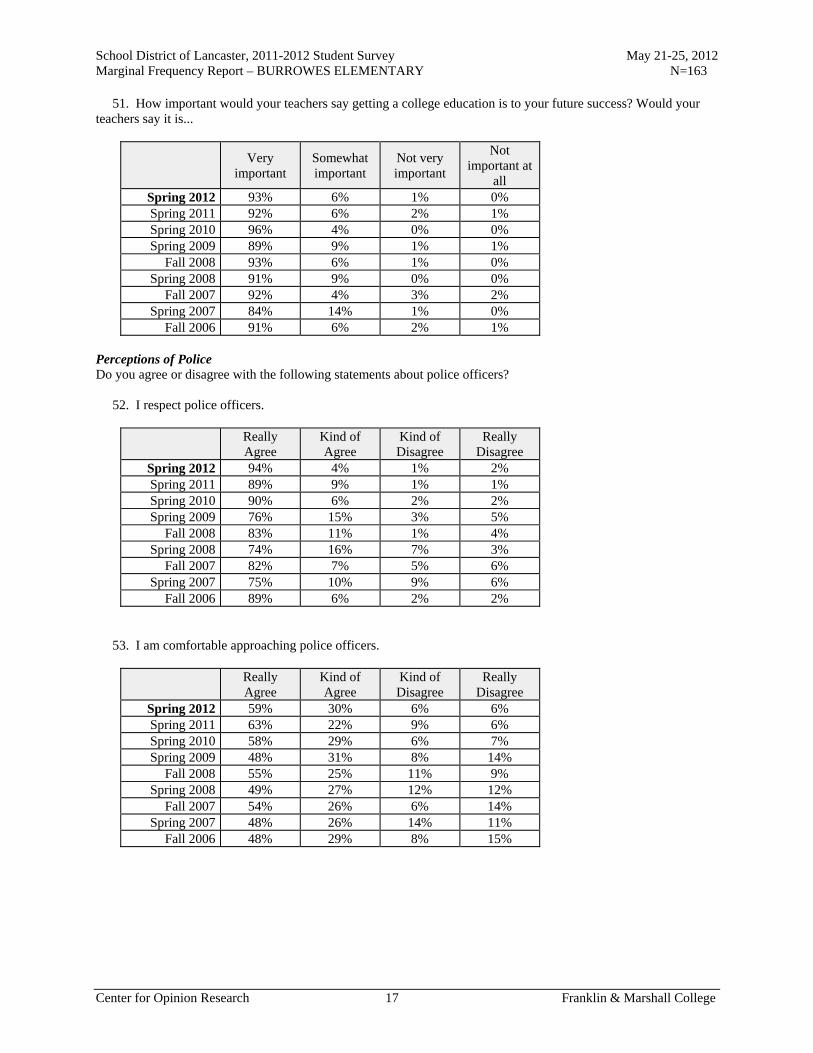
School District of Lancaster, 2011-2012 Student Survey May 21-25, 2012 Marginal Frequency Report – BURROWES ELEMENTARY N=163
Center for Opinion Research 17 Franklin & Marshall College
51. How important would your teachers say getting a college education is to your future success? Would your teachers say it is...
Very
important Somewhat important
Not very important
Not important at
all Spring 2012 93% 6% 1% 0% Spring 2011 92% 6% 2% 1% Spring 2010 96% 4% 0% 0% Spring 2009 89% 9% 1% 1%
Fall 2008 93% 6% 1% 0% Spring 2008 91% 9% 0% 0%
Fall 2007 92% 4% 3% 2% Spring 2007 84% 14% 1% 0%
Fall 2006 91% 6% 2% 1% Perceptions of Police Do you agree or disagree with the following statements about police officers? 52. I respect police officers.
Really Agree
Kind of Agree
Kind of Disagree
Really Disagree
Spring 2012 94% 4% 1% 2% Spring 2011 89% 9% 1% 1% Spring 2010 90% 6% 2% 2% Spring 2009 76% 15% 3% 5%
Fall 2008 83% 11% 1% 4% Spring 2008 74% 16% 7% 3%
Fall 2007 82% 7% 5% 6% Spring 2007 75% 10% 9% 6%
Fall 2006 89% 6% 2% 2% 53. I am comfortable approaching police officers.
Really Agree
Kind of Agree
Kind of Disagree
Really Disagree
Spring 2012 59% 30% 6% 6% Spring 2011 63% 22% 9% 6% Spring 2010 58% 29% 6% 7% Spring 2009 48% 31% 8% 14%
Fall 2008 55% 25% 11% 9% Spring 2008 49% 27% 12% 12%
Fall 2007 54% 26% 6% 14% Spring 2007 48% 26% 14% 11%
Fall 2006 48% 29% 8% 15%

School District of Lancaster, 2011-2012 Student Survey May 21-25, 2012 Marginal Frequency Report – BURROWES ELEMENTARY N=163
Center for Opinion Research 18 Franklin & Marshall College
54. I would consider police work as a career.
Really Agree
Kind of Agree
Kind of Disagree
Really Disagree
Spring 2012 38% 21% 20% 21% Spring 2011 40% 18% 20% 22% Spring 2010 39% 22% 12% 26% Spring 2009 33% 23% 15% 29%
Fall 2008 40% 22% 15% 22% Spring 2008 41% 21% 15% 23%
Fall 2007 45% 22% 8% 25% Spring 2007 32% 24% 17% 28%
Fall 2006 41% 19% 13% 27% 55. In general, I do not trust the police.
Really Agree
Kind of Agree
Kind of Disagree
Really Disagree
Spring 2012 8% 4% 12% 75% Spring 2011 9% 8% 10% 73% Spring 2010 10% 6% 14% 69% Spring 2009 14% 8% 20% 58%
Fall 2008 16% 8% 15% 60% Spring 2008 13% 18% 16% 53%
Fall 2007 11% 13% 14% 63% Spring 2007 19% 14% 17% 50%
Fall 2006 20% 10% 7% 63% 56. Police do not belong in schools unless there has been a crime.
Really Agree
Kind of Agree
Kind of Disagree
Really Disagree
Spring 2012 27% 10% 16% 47% Spring 2011 20% 16% 21% 43% Spring 2010 18% 9% 15% 59% Spring 2009 27% 10% 16% 47%
Fall 2008 33% 12% 13% 42% Spring 2008 27% 13% 23% 37%
Fall 2007 29% 13% 14% 44% Spring 2007 32% 16% 13% 40%
Fall 2006 33% 16% 8% 43%
Report E
Marginal Frequency Report Carter & MacRae Elementary School
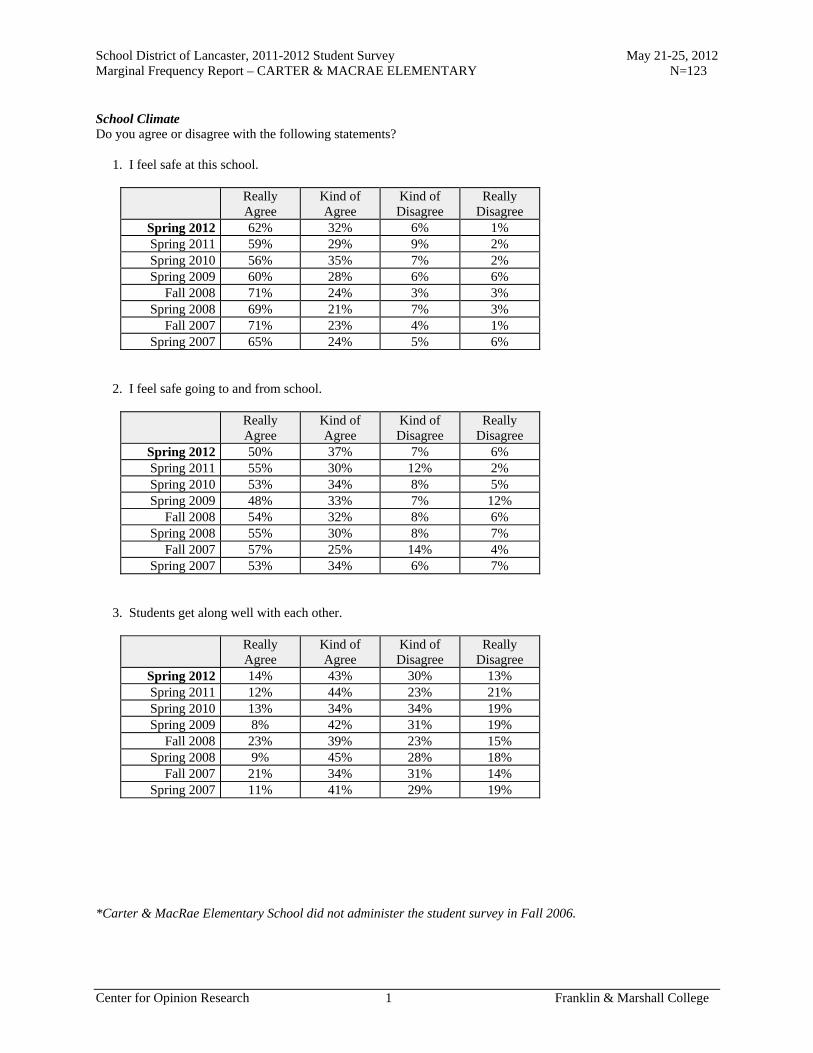
School District of Lancaster, 2011-2012 Student Survey May 21-25, 2012 Marginal Frequency Report – CARTER & MACRAE ELEMENTARY N=123
Center for Opinion Research 1 Franklin & Marshall College
School Climate Do you agree or disagree with the following statements? 1. I feel safe at this school.
Really Agree
Kind of Agree
Kind of Disagree
Really Disagree
Spring 2012 62% 32% 6% 1% Spring 2011 59% 29% 9% 2% Spring 2010 56% 35% 7% 2% Spring 2009 60% 28% 6% 6%
Fall 2008 71% 24% 3% 3% Spring 2008 69% 21% 7% 3%
Fall 2007 71% 23% 4% 1% Spring 2007 65% 24% 5% 6%
2. I feel safe going to and from school.
Really Agree
Kind of Agree
Kind of Disagree
Really Disagree
Spring 2012 50% 37% 7% 6% Spring 2011 55% 30% 12% 2% Spring 2010 53% 34% 8% 5% Spring 2009 48% 33% 7% 12%
Fall 2008 54% 32% 8% 6% Spring 2008 55% 30% 8% 7%
Fall 2007 57% 25% 14% 4% Spring 2007 53% 34% 6% 7%
3. Students get along well with each other.
Really Agree
Kind of Agree
Kind of Disagree
Really Disagree
Spring 2012 14% 43% 30% 13% Spring 2011 12% 44% 23% 21% Spring 2010 13% 34% 34% 19% Spring 2009 8% 42% 31% 19%
Fall 2008 23% 39% 23% 15% Spring 2008 9% 45% 28% 18%
Fall 2007 21% 34% 31% 14% Spring 2007 11% 41% 29% 19%
*Carter & MacRae Elementary School did not administer the student survey in Fall 2006.
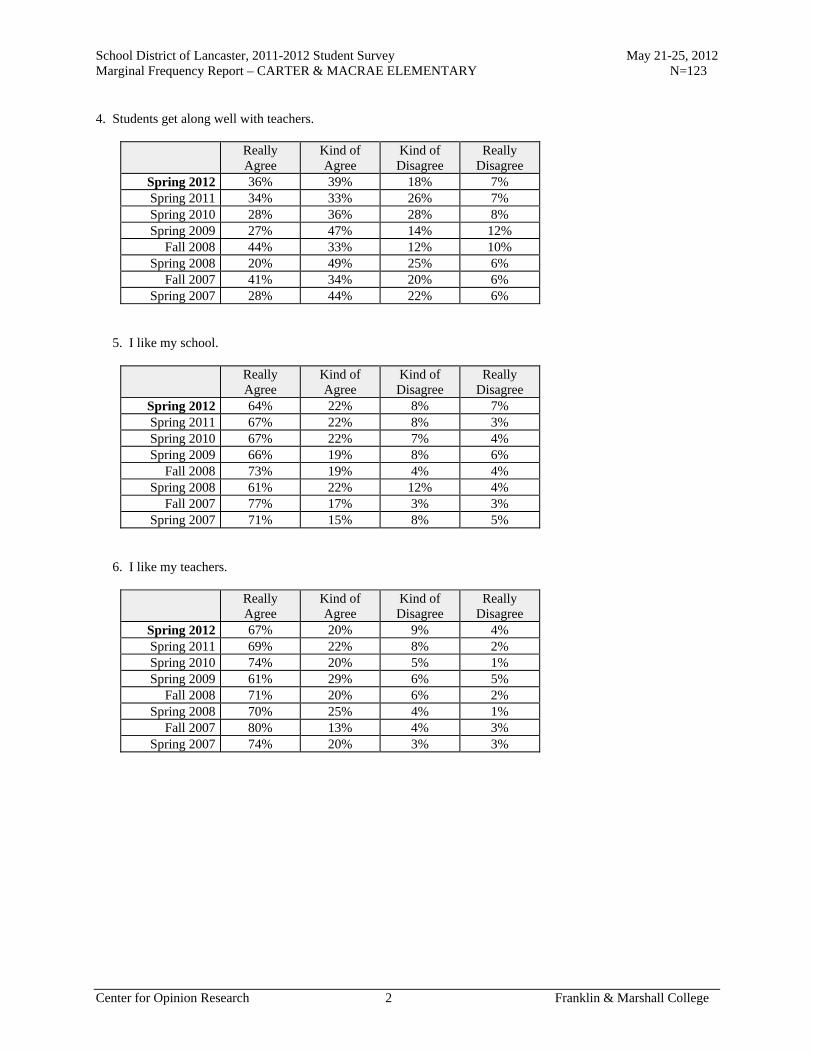
School District of Lancaster, 2011-2012 Student Survey May 21-25, 2012 Marginal Frequency Report – CARTER & MACRAE ELEMENTARY N=123
Center for Opinion Research 2 Franklin & Marshall College
4. Students get along well with teachers.
Really Agree
Kind of Agree
Kind of Disagree
Really Disagree
Spring 2012 36% 39% 18% 7% Spring 2011 34% 33% 26% 7% Spring 2010 28% 36% 28% 8% Spring 2009 27% 47% 14% 12%
Fall 2008 44% 33% 12% 10% Spring 2008 20% 49% 25% 6%
Fall 2007 41% 34% 20% 6% Spring 2007 28% 44% 22% 6%
5. I like my school.
Really Agree
Kind of Agree
Kind of Disagree
Really Disagree
Spring 2012 64% 22% 8% 7% Spring 2011 67% 22% 8% 3% Spring 2010 67% 22% 7% 4% Spring 2009 66% 19% 8% 6%
Fall 2008 73% 19% 4% 4% Spring 2008 61% 22% 12% 4%
Fall 2007 77% 17% 3% 3% Spring 2007 71% 15% 8% 5%
6. I like my teachers.
Really Agree
Kind of Agree
Kind of Disagree
Really Disagree
Spring 2012 67% 20% 9% 4% Spring 2011 69% 22% 8% 2% Spring 2010 74% 20% 5% 1% Spring 2009 61% 29% 6% 5%
Fall 2008 71% 20% 6% 2% Spring 2008 70% 25% 4% 1%
Fall 2007 80% 13% 4% 3% Spring 2007 74% 20% 3% 3%

School District of Lancaster, 2011-2012 Student Survey May 21-25, 2012 Marginal Frequency Report – CARTER & MACRAE ELEMENTARY N=123
Center for Opinion Research 3 Franklin & Marshall College
7. There is a teacher or some other adult at this school who really cares about me.
Really Agree
Kind of Agree
Kind of Disagree
Really Disagree
Spring 2012 68% 21% 5% 6% Spring 2011 69% 24% 4% 3% Spring 2010 67% 24% 4% 5% Spring 2009 70% 19% 7% 4%
Fall 2008 72% 21% 4% 3% Spring 2008 67% 22% 5% 6%
Fall 2007 77% 15% 2% 6% Spring 2007 75% 12% 4% 8%
8. There is a teacher or some other adult at this school who cares when I am not here.
Really Agree
Kind of Agree
Kind of Disagree
Really Disagree
Spring 2012 42% 28% 15% 14% Spring 2011 38% 33% 11% 18% Spring 2010 44% 28% 8% 21% Spring 2009 46% 28% 12% 14%
Fall 2008 46% 28% 10% 16% Spring 2008 47% 31% 6% 16%
Fall 2007 44% 26% 13% 18% Spring 2007 40% 22% 12% 26%
9. There is a teacher or some other adult at this school who listens to me when I have something to say.
Really Agree
Kind of Agree
Kind of Disagree
Really Disagree
Spring 2012 71% 22% 6% 2% Spring 2011 70% 21% 3% 5% Spring 2010 67% 20% 7% 5% Spring 2009 63% 25% 8% 5%
Fall 2008 73% 17% 3% 7% Spring 2008 67% 24% 5% 4%
Fall 2007 76% 17% 3% 4% Spring 2007 75% 15% 7% 3%

School District of Lancaster, 2011-2012 Student Survey May 21-25, 2012 Marginal Frequency Report – CARTER & MACRAE ELEMENTARY N=123
Center for Opinion Research 4 Franklin & Marshall College
10. There is a teacher or some other adult at this school who tells me when I do a good job.
Really Agree
Kind of Agree
Kind of Disagree
Really Disagree
Spring 2012 78% 14% 4% 4% Spring 2011 80% 14% 4% 1% Spring 2010 84% 10% 5% 1% Spring 2009 73% 22% 3% 2%
Fall 2008 78% 15% 2% 5% Spring 2008 79% 15% 2% 4%
Fall 2007 84% 13% 3% 0% Spring 2007 81% 10% 2% 7%
11. There is a teacher or some other adult at this school who always wants me to do my best.
Really Agree
Kind of Agree
Kind of Disagree
Really Disagree
Spring 2012 89% 8% 3% 0% Spring 2011 86% 8% 5% 1% Spring 2010 90% 6% 4% 0% Spring 2009 83% 13% 2% 1%
Fall 2008 87% 6% 5% 1% Spring 2008 90% 7% 1% 2%
Fall 2007 92% 5% 1% 2% Spring 2007 89% 7% 0% 4%
12. There is a teacher or some other adult at this school who believes that I will be a success.
Really Agree
Kind of Agree
Kind of Disagree
Really Disagree
Spring 2012 65% 26% 6% 3% Spring 2011 78% 19% 2% 1% Spring 2010 77% 18% 2% 2% Spring 2009 61% 29% 6% 4%
Fall 2008 70% 21% 4% 4% Spring 2008 64% 26% 4% 6%
ll 2007 73% 20% 5% 3% Spring 2007 77% 16% 2% 5%
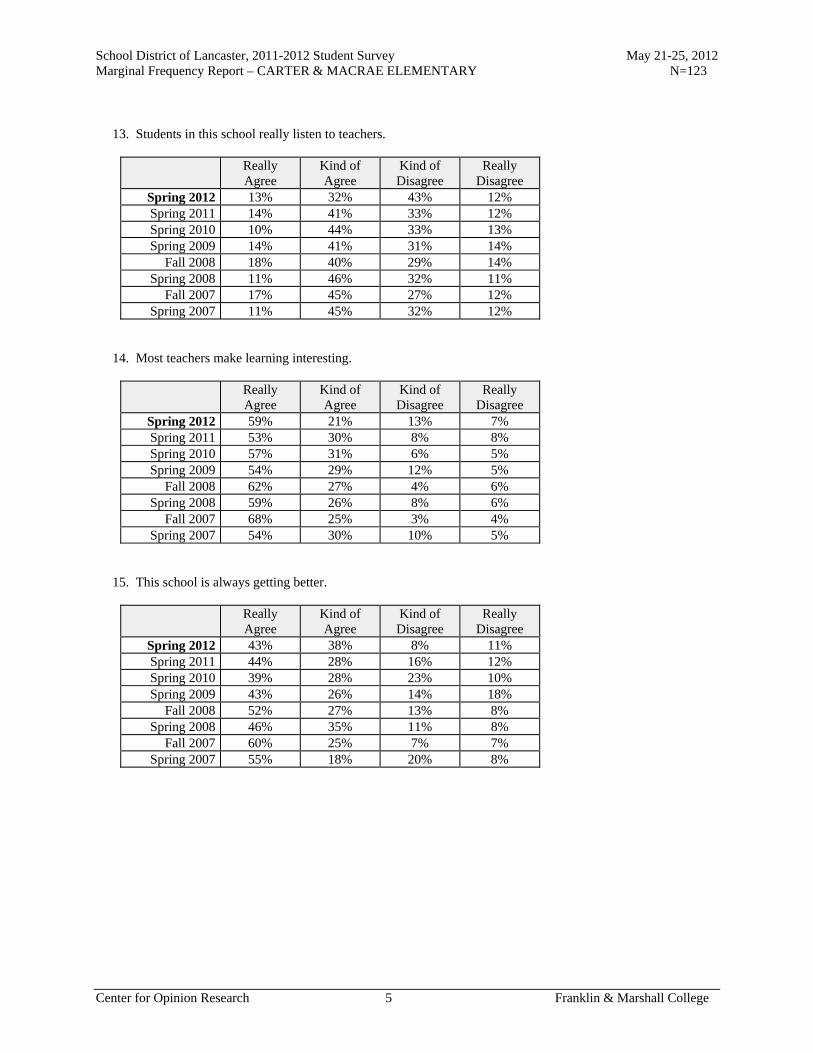
School District of Lancaster, 2011-2012 Student Survey May 21-25, 2012 Marginal Frequency Report – CARTER & MACRAE ELEMENTARY N=123
Center for Opinion Research 5 Franklin & Marshall College
13. Students in this school really listen to teachers.
Really Agree
Kind of Agree
Kind of Disagree
Really Disagree
Spring 2012 13% 32% 43% 12% Spring 2011 14% 41% 33% 12% Spring 2010 10% 44% 33% 13% Spring 2009 14% 41% 31% 14%
Fall 2008 18% 40% 29% 14% Spring 2008 11% 46% 32% 11%
Fall 2007 17% 45% 27% 12% Spring 2007 11% 45% 32% 12%
14. Most teachers make learning interesting.
Really Agree
Kind of Agree
Kind of Disagree
Really Disagree
Spring 2012 59% 21% 13% 7% Spring 2011 53% 30% 8% 8% Spring 2010 57% 31% 6% 5% Spring 2009 54% 29% 12% 5%
Fall 2008 62% 27% 4% 6% Spring 2008 59% 26% 8% 6%
Fall 2007 68% 25% 3% 4% Spring 2007 54% 30% 10% 5%
15. This school is always getting better.
Really Agree
Kind of Agree
Kind of Disagree
Really Disagree
Spring 2012 43% 38% 8% 11% Spring 2011 44% 28% 16% 12% Spring 2010 39% 28% 23% 10% Spring 2009 43% 26% 14% 18%
Fall 2008 52% 27% 13% 8% Spring 2008 46% 35% 11% 8%
Fall 2007 60% 25% 7% 7% Spring 2007 55% 18% 20% 8%
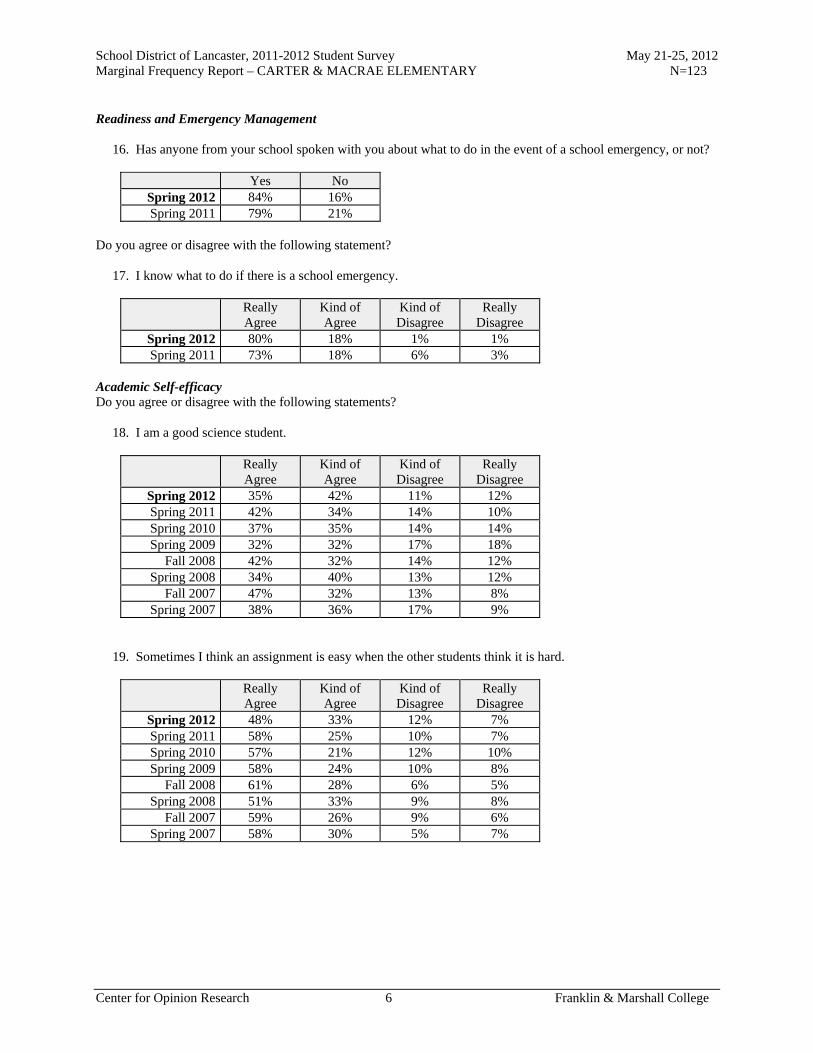
School District of Lancaster, 2011-2012 Student Survey May 21-25, 2012 Marginal Frequency Report – CARTER & MACRAE ELEMENTARY N=123
Center for Opinion Research 6 Franklin & Marshall College
Readiness and Emergency Management 16. Has anyone from your school spoken with you about what to do in the event of a school emergency, or not?
Yes No Spring 2012 84% 16% Spring 2011 79% 21%
Do you agree or disagree with the following statement? 17. I know what to do if there is a school emergency.
Really Agree
Kind of Agree
Kind of Disagree
Really Disagree
Spring 2012 80% 18% 1% 1% Spring 2011 73% 18% 6% 3%
Academic Self-efficacy Do you agree or disagree with the following statements? 18. I am a good science student.
Really Agree
Kind of Agree
Kind of Disagree
Really Disagree
Spring 2012 35% 42% 11% 12% Spring 2011 42% 34% 14% 10% Spring 2010 37% 35% 14% 14% Spring 2009 32% 32% 17% 18%
Fall 2008 42% 32% 14% 12% Spring 2008 34% 40% 13% 12%
Fall 2007 47% 32% 13% 8% Spring 2007 38% 36% 17% 9%
19. Sometimes I think an assignment is easy when the other students think it is hard.
Really Agree
Kind of Agree
Kind of Disagree
Really Disagree
Spring 2012 48% 33% 12% 7% Spring 2011 58% 25% 10% 7% Spring 2010 57% 21% 12% 10% Spring 2009 58% 24% 10% 8%
Fall 2008 61% 28% 6% 5% Spring 2008 51% 33% 9% 8%
Fall 2007 59% 26% 9% 6% Spring 2007 58% 30% 5% 7%
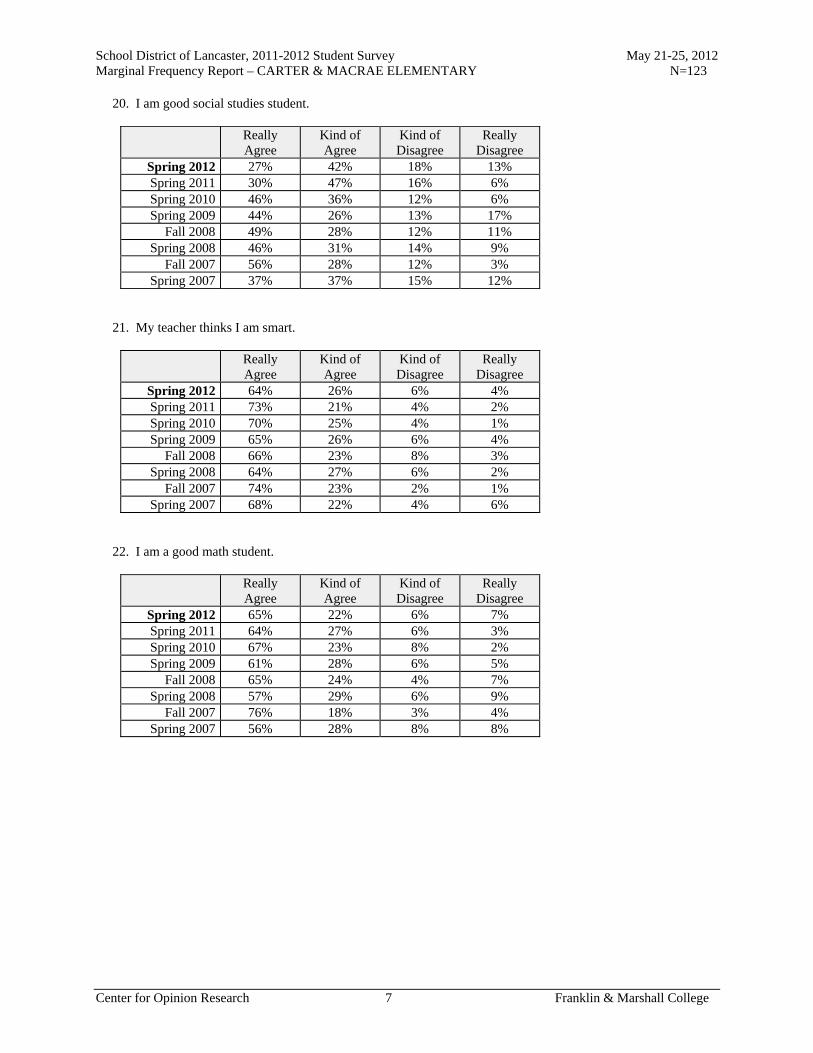
School District of Lancaster, 2011-2012 Student Survey May 21-25, 2012 Marginal Frequency Report – CARTER & MACRAE ELEMENTARY N=123
Center for Opinion Research 7 Franklin & Marshall College
20. I am good social studies student.
Really Agree
Kind of Agree
Kind of Disagree
Really Disagree
Spring 2012 27% 42% 18% 13% Spring 2011 30% 47% 16% 6% Spring 2010 46% 36% 12% 6% Spring 2009 44% 26% 13% 17%
Fall 2008 49% 28% 12% 11% Spring 2008 46% 31% 14% 9%
Fall 2007 56% 28% 12% 3% Spring 2007 37% 37% 15% 12%
21. My teacher thinks I am smart.
Really Agree
Kind of Agree
Kind of Disagree
Really Disagree
Spring 2012 64% 26% 6% 4% Spring 2011 73% 21% 4% 2% Spring 2010 70% 25% 4% 1% Spring 2009 65% 26% 6% 4%
Fall 2008 66% 23% 8% 3% Spring 2008 64% 27% 6% 2%
Fall 2007 74% 23% 2% 1% Spring 2007 68% 22% 4% 6%
22. I am a good math student.
Really Agree
Kind of Agree
Kind of Disagree
Really Disagree
Spring 2012 65% 22% 6% 7% Spring 2011 64% 27% 6% 3% Spring 2010 67% 23% 8% 2% Spring 2009 61% 28% 6% 5%
Fall 2008 65% 24% 4% 7% Spring 2008 57% 29% 6% 9%
Fall 2007 76% 18% 3% 4% Spring 2007 56% 28% 8% 8%
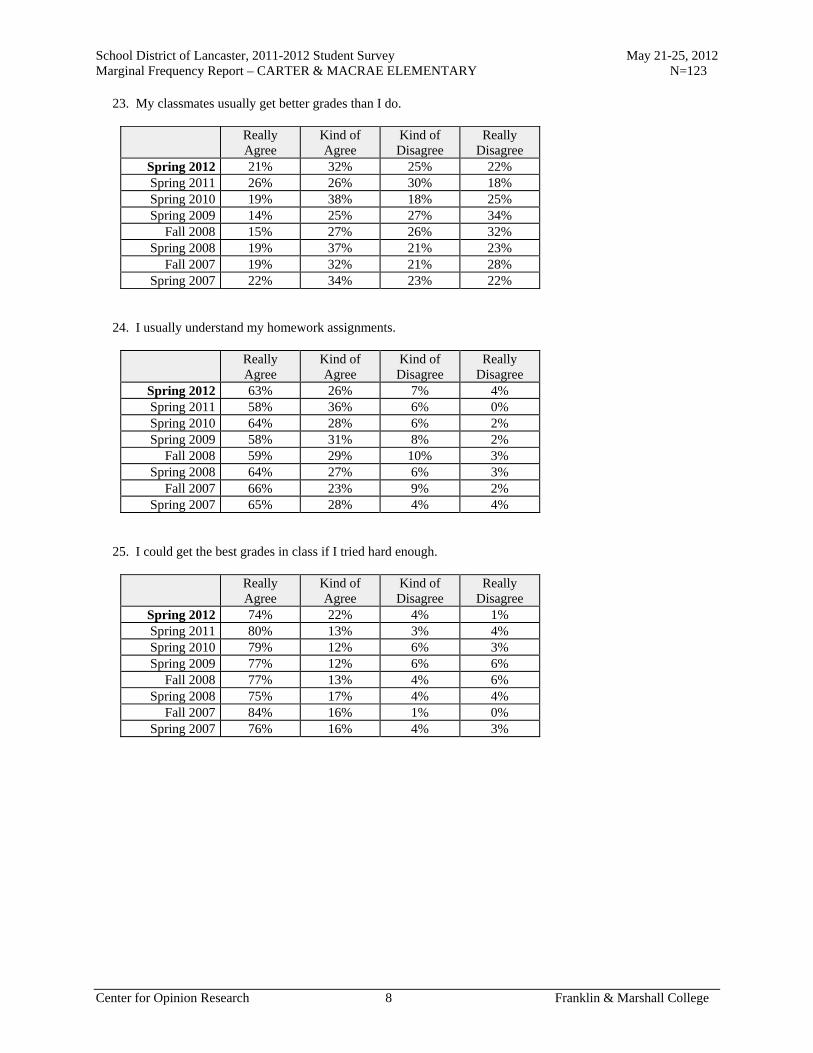
School District of Lancaster, 2011-2012 Student Survey May 21-25, 2012 Marginal Frequency Report – CARTER & MACRAE ELEMENTARY N=123
Center for Opinion Research 8 Franklin & Marshall College
23. My classmates usually get better grades than I do.
Really Agree
Kind of Agree
Kind of Disagree
Really Disagree
Spring 2012 21% 32% 25% 22% Spring 2011 26% 26% 30% 18% Spring 2010 19% 38% 18% 25% Spring 2009 14% 25% 27% 34%
Fall 2008 15% 27% 26% 32% Spring 2008 19% 37% 21% 23%
Fall 2007 19% 32% 21% 28% Spring 2007 22% 34% 23% 22%
24. I usually understand my homework assignments.
Really Agree
Kind of Agree
Kind of Disagree
Really Disagree
Spring 2012 63% 26% 7% 4% Spring 2011 58% 36% 6% 0% Spring 2010 64% 28% 6% 2% Spring 2009 58% 31% 8% 2%
Fall 2008 59% 29% 10% 3% Spring 2008 64% 27% 6% 3%
Fall 2007 66% 23% 9% 2% Spring 2007 65% 28% 4% 4%
25. I could get the best grades in class if I tried hard enough.
Really Agree
Kind of Agree
Kind of Disagree
Really Disagree
Spring 2012 74% 22% 4% 1% Spring 2011 80% 13% 3% 4% Spring 2010 79% 12% 6% 3% Spring 2009 77% 12% 6% 6%
Fall 2008 77% 13% 4% 6% Spring 2008 75% 17% 4% 4%
Fall 2007 84% 16% 1% 0% Spring 2007 76% 16% 4% 3%
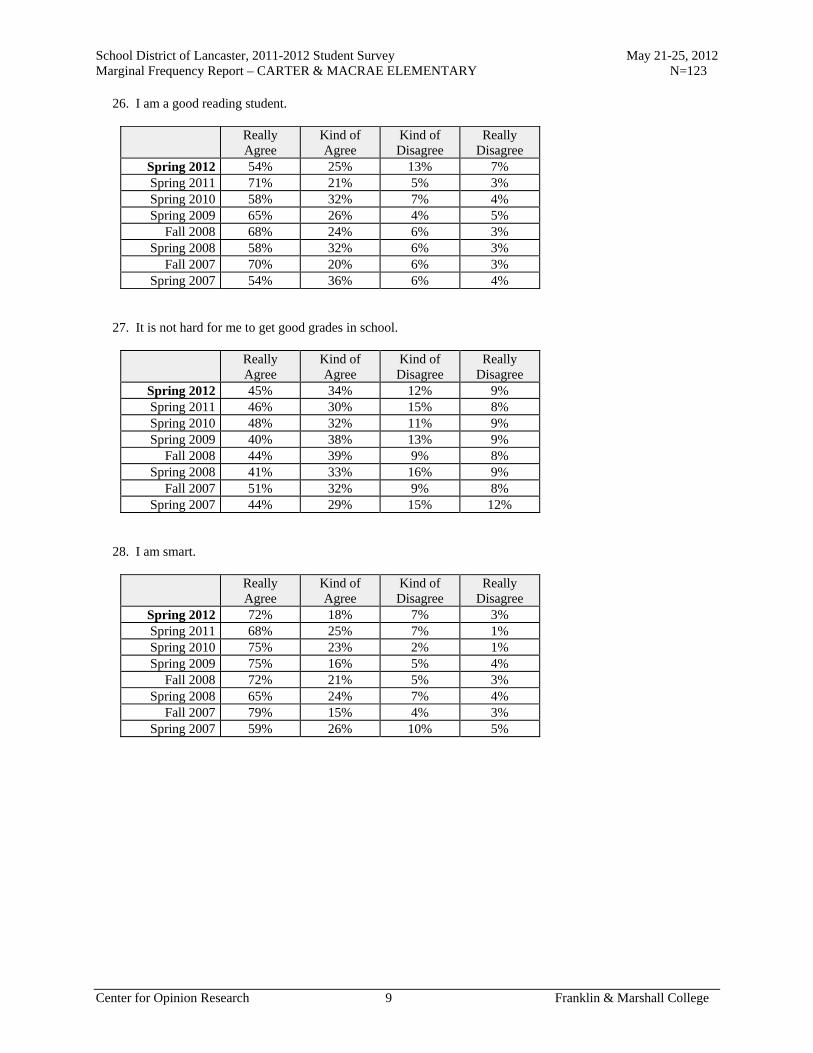
School District of Lancaster, 2011-2012 Student Survey May 21-25, 2012 Marginal Frequency Report – CARTER & MACRAE ELEMENTARY N=123
Center for Opinion Research 9 Franklin & Marshall College
26. I am a good reading student.
Really Agree
Kind of Agree
Kind of Disagree
Really Disagree
Spring 2012 54% 25% 13% 7% Spring 2011 71% 21% 5% 3% Spring 2010 58% 32% 7% 4% Spring 2009 65% 26% 4% 5%
Fall 2008 68% 24% 6% 3% Spring 2008 58% 32% 6% 3%
Fall 2007 70% 20% 6% 3% Spring 2007 54% 36% 6% 4%
27. It is not hard for me to get good grades in school.
Really Agree
Kind of Agree
Kind of Disagree
Really Disagree
Spring 2012 45% 34% 12% 9% Spring 2011 46% 30% 15% 8% Spring 2010 48% 32% 11% 9% Spring 2009 40% 38% 13% 9%
Fall 2008 44% 39% 9% 8% Spring 2008 41% 33% 16% 9%
Fall 2007 51% 32% 9% 8% Spring 2007 44% 29% 15% 12%
28. I am smart.
Really Agree
Kind of Agree
Kind of Disagree
Really Disagree
Spring 2012 72% 18% 7% 3% Spring 2011 68% 25% 7% 1% Spring 2010 75% 23% 2% 1% Spring 2009 75% 16% 5% 4%
Fall 2008 72% 21% 5% 3% Spring 2008 65% 24% 7% 4%
Fall 2007 79% 15% 4% 3% Spring 2007 59% 26% 10% 5%
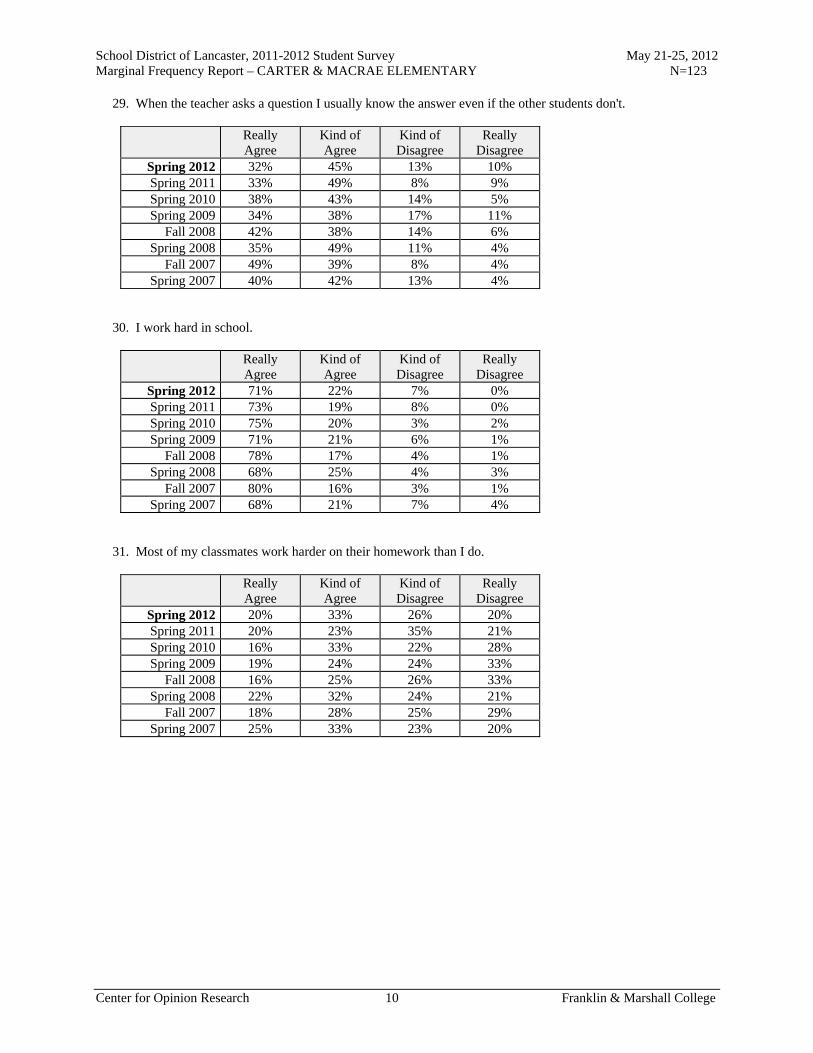
School District of Lancaster, 2011-2012 Student Survey May 21-25, 2012 Marginal Frequency Report – CARTER & MACRAE ELEMENTARY N=123
Center for Opinion Research 10 Franklin & Marshall College
29. When the teacher asks a question I usually know the answer even if the other students don't.
Really Agree
Kind of Agree
Kind of Disagree
Really Disagree
Spring 2012 32% 45% 13% 10% Spring 2011 33% 49% 8% 9% Spring 2010 38% 43% 14% 5% Spring 2009 34% 38% 17% 11%
Fall 2008 42% 38% 14% 6% Spring 2008 35% 49% 11% 4%
Fall 2007 49% 39% 8% 4% Spring 2007 40% 42% 13% 4%
30. I work hard in school.
Really Agree
Kind of Agree
Kind of Disagree
Really Disagree
Spring 2012 71% 22% 7% 0% Spring 2011 73% 19% 8% 0% Spring 2010 75% 20% 3% 2% Spring 2009 71% 21% 6% 1%
Fall 2008 78% 17% 4% 1% Spring 2008 68% 25% 4% 3%
Fall 2007 80% 16% 3% 1% Spring 2007 68% 21% 7% 4%
31. Most of my classmates work harder on their homework than I do.
Really Agree
Kind of Agree
Kind of Disagree
Really Disagree
Spring 2012 20% 33% 26% 20% Spring 2011 20% 23% 35% 21% Spring 2010 16% 33% 22% 28% Spring 2009 19% 24% 24% 33%
Fall 2008 16% 25% 26% 33% Spring 2008 22% 32% 24% 21%
Fall 2007 18% 28% 25% 29% Spring 2007 25% 33% 23% 20%
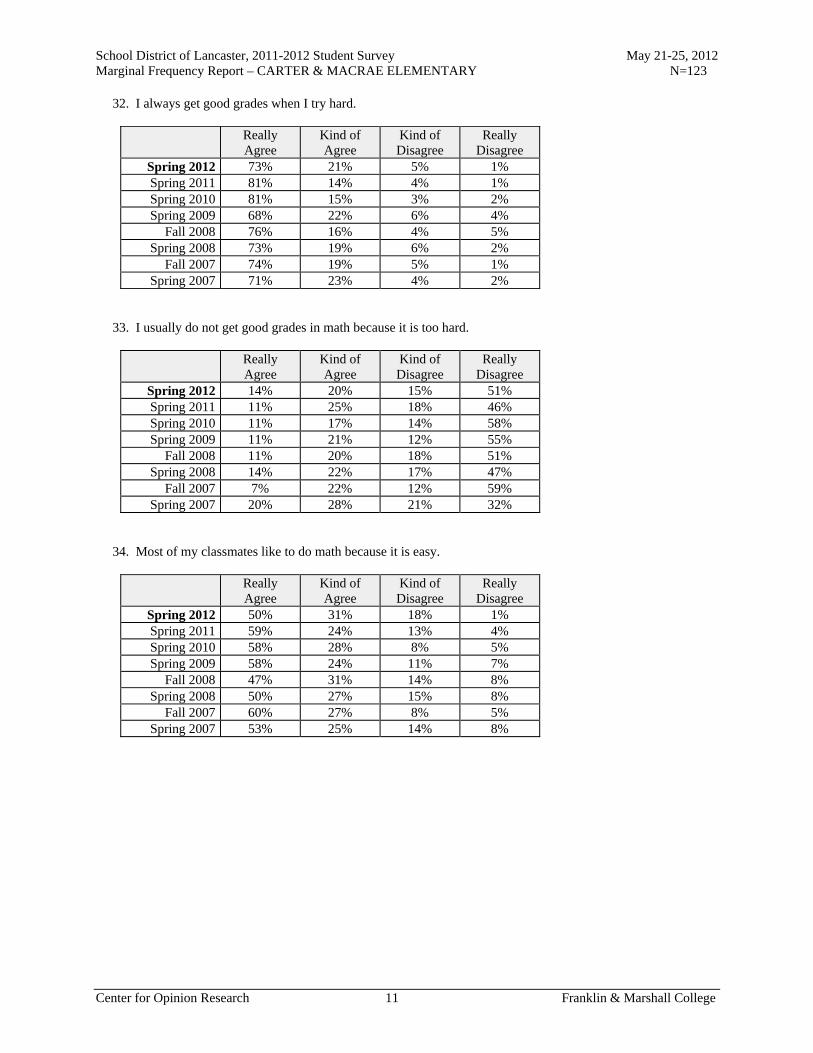
School District of Lancaster, 2011-2012 Student Survey May 21-25, 2012 Marginal Frequency Report – CARTER & MACRAE ELEMENTARY N=123
Center for Opinion Research 11 Franklin & Marshall College
32. I always get good grades when I try hard.
Really Agree
Kind of Agree
Kind of Disagree
Really Disagree
Spring 2012 73% 21% 5% 1% Spring 2011 81% 14% 4% 1% Spring 2010 81% 15% 3% 2% Spring 2009 68% 22% 6% 4%
Fall 2008 76% 16% 4% 5% Spring 2008 73% 19% 6% 2%
Fall 2007 74% 19% 5% 1% Spring 2007 71% 23% 4% 2%
33. I usually do not get good grades in math because it is too hard.
Really Agree
Kind of Agree
Kind of Disagree
Really Disagree
Spring 2012 14% 20% 15% 51% Spring 2011 11% 25% 18% 46% Spring 2010 11% 17% 14% 58% Spring 2009 11% 21% 12% 55%
Fall 2008 11% 20% 18% 51% Spring 2008 14% 22% 17% 47%
Fall 2007 7% 22% 12% 59% Spring 2007 20% 28% 21% 32%
34. Most of my classmates like to do math because it is easy.
Really Agree
Kind of Agree
Kind of Disagree
Really Disagree
Spring 2012 50% 31% 18% 1% Spring 2011 59% 24% 13% 4% Spring 2010 58% 28% 8% 5% Spring 2009 58% 24% 11% 7%
Fall 2008 47% 31% 14% 8% Spring 2008 50% 27% 15% 8%
Fall 2007 60% 27% 8% 5% Spring 2007 53% 25% 14% 8%

School District of Lancaster, 2011-2012 Student Survey May 21-25, 2012 Marginal Frequency Report – CARTER & MACRAE ELEMENTARY N=123
Center for Opinion Research 12 Franklin & Marshall College
35. I would get better grades if my teacher liked me more.
Really Agree
Kind of Agree
Kind of Disagree
Really Disagree
Spring 2012 18% 12% 14% 57% Spring 2011 17% 15% 14% 54% Spring 2010 14% 11% 10% 65% Spring 2009 11% 10% 11% 67%
Fall 2008 16% 9% 11% 64% Spring 2008 12% 13% 21% 54%
Fall 2007 21% 16% 13% 50% Spring 2007 13% 15% 16% 56%
36. I will graduate from high school.
Really Agree
Kind of Agree
Kind of Disagree
Really Disagree
Spring 2012 83% 12% 2% 3% Spring 2011 86% 11% 1% 2% Spring 2010 86% 14% 1% 0% Spring 2009 77% 19% 2% 1%
Fall 2008 80% 15% 2% 3% Spring 2008 75% 19% 1% 4%
Fall 2007 84% 12% 2% 2% Spring 2007 72% 21% 4% 3%
37. I go to a good school.
Really Agree
Kind of Agree
Kind of Disagree
Really Disagree
Spring 2012 69% 18% 10% 2% Spring 2011 74% 17% 7% 2% Spring 2010 73% 16% 8% 3% Spring 2009 71% 16% 7% 6%
Fall 2008 78% 14% 5% 3% Spring 2008 69% 22% 5% 4%
Fall 2007 80% 11% 6% 3% Spring 2007 74% 15% 8% 3%
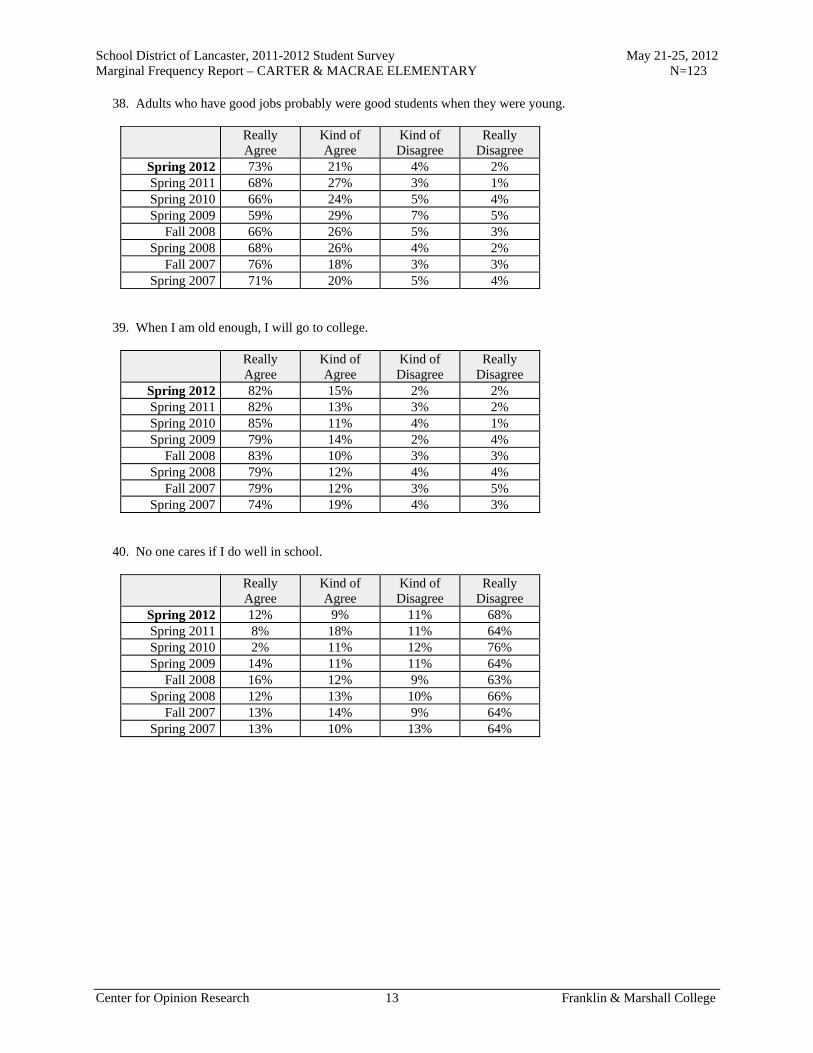
School District of Lancaster, 2011-2012 Student Survey May 21-25, 2012 Marginal Frequency Report – CARTER & MACRAE ELEMENTARY N=123
Center for Opinion Research 13 Franklin & Marshall College
38. Adults who have good jobs probably were good students when they were young.
Really Agree
Kind of Agree
Kind of Disagree
Really Disagree
Spring 2012 73% 21% 4% 2% Spring 2011 68% 27% 3% 1% Spring 2010 66% 24% 5% 4% Spring 2009 59% 29% 7% 5%
Fall 2008 66% 26% 5% 3% Spring 2008 68% 26% 4% 2%
Fall 2007 76% 18% 3% 3% Spring 2007 71% 20% 5% 4%
39. When I am old enough, I will go to college.
Really Agree
Kind of Agree
Kind of Disagree
Really Disagree
Spring 2012 82% 15% 2% 2% Spring 2011 82% 13% 3% 2% Spring 2010 85% 11% 4% 1% Spring 2009 79% 14% 2% 4%
Fall 2008 83% 10% 3% 3% Spring 2008 79% 12% 4% 4%
Fall 2007 79% 12% 3% 5% Spring 2007 74% 19% 4% 3%
40. No one cares if I do well in school.
Really Agree
Kind of Agree
Kind of Disagree
Really Disagree
Spring 2012 12% 9% 11% 68% Spring 2011 8% 18% 11% 64% Spring 2010 2% 11% 12% 76% Spring 2009 14% 11% 11% 64%
Fall 2008 16% 12% 9% 63% Spring 2008 12% 13% 10% 66%
Fall 2007 13% 14% 9% 64% Spring 2007 13% 10% 13% 64%
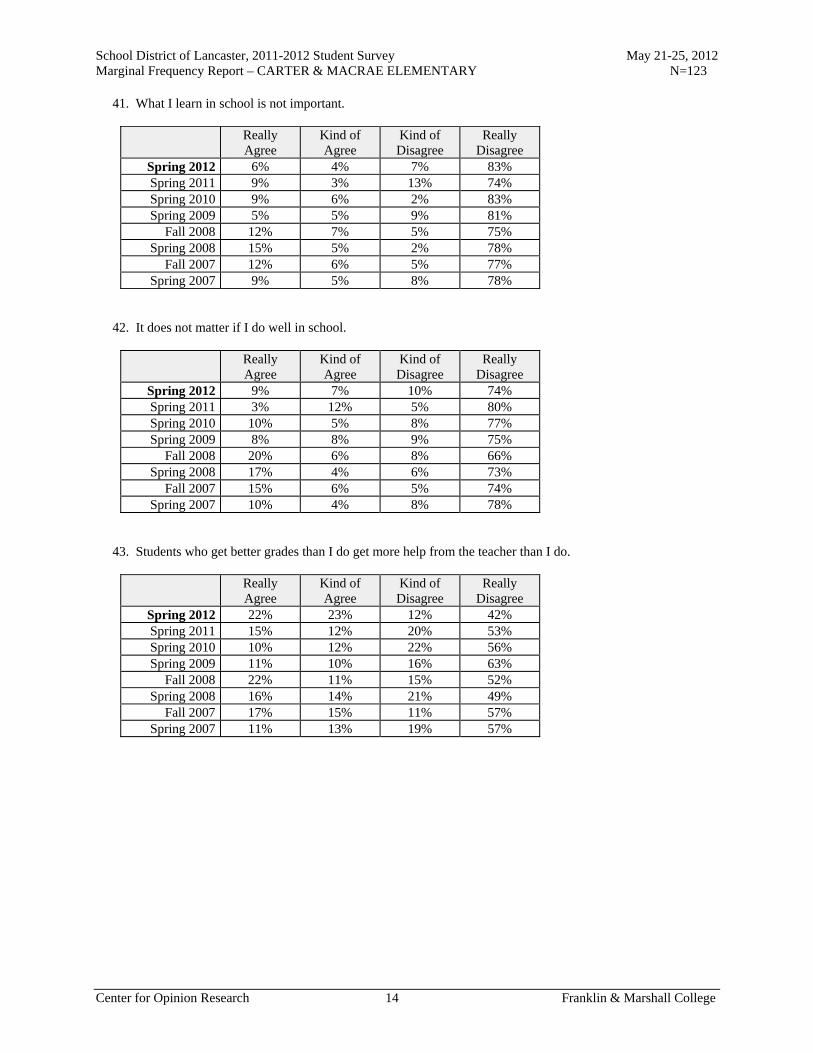
School District of Lancaster, 2011-2012 Student Survey May 21-25, 2012 Marginal Frequency Report – CARTER & MACRAE ELEMENTARY N=123
Center for Opinion Research 14 Franklin & Marshall College
41. What I learn in school is not important.
Really Agree
Kind of Agree
Kind of Disagree
Really Disagree
Spring 2012 6% 4% 7% 83% Spring 2011 9% 3% 13% 74% Spring 2010 9% 6% 2% 83% Spring 2009 5% 5% 9% 81%
Fall 2008 12% 7% 5% 75% Spring 2008 15% 5% 2% 78%
Fall 2007 12% 6% 5% 77% Spring 2007 9% 5% 8% 78%
42. It does not matter if I do well in school.
Really Agree
Kind of Agree
Kind of Disagree
Really Disagree
Spring 2012 9% 7% 10% 74% Spring 2011 3% 12% 5% 80% Spring 2010 10% 5% 8% 77% Spring 2009 8% 8% 9% 75%
Fall 2008 20% 6% 8% 66% Spring 2008 17% 4% 6% 73%
Fall 2007 15% 6% 5% 74% Spring 2007 10% 4% 8% 78%
43. Students who get better grades than I do get more help from the teacher than I do.
Really Agree
Kind of Agree
Kind of Disagree
Really Disagree
Spring 2012 22% 23% 12% 42% Spring 2011 15% 12% 20% 53% Spring 2010 10% 12% 22% 56% Spring 2009 11% 10% 16% 63%
Fall 2008 22% 11% 15% 52% Spring 2008 16% 14% 21% 49%
Fall 2007 17% 15% 11% 57% Spring 2007 11% 13% 19% 57%
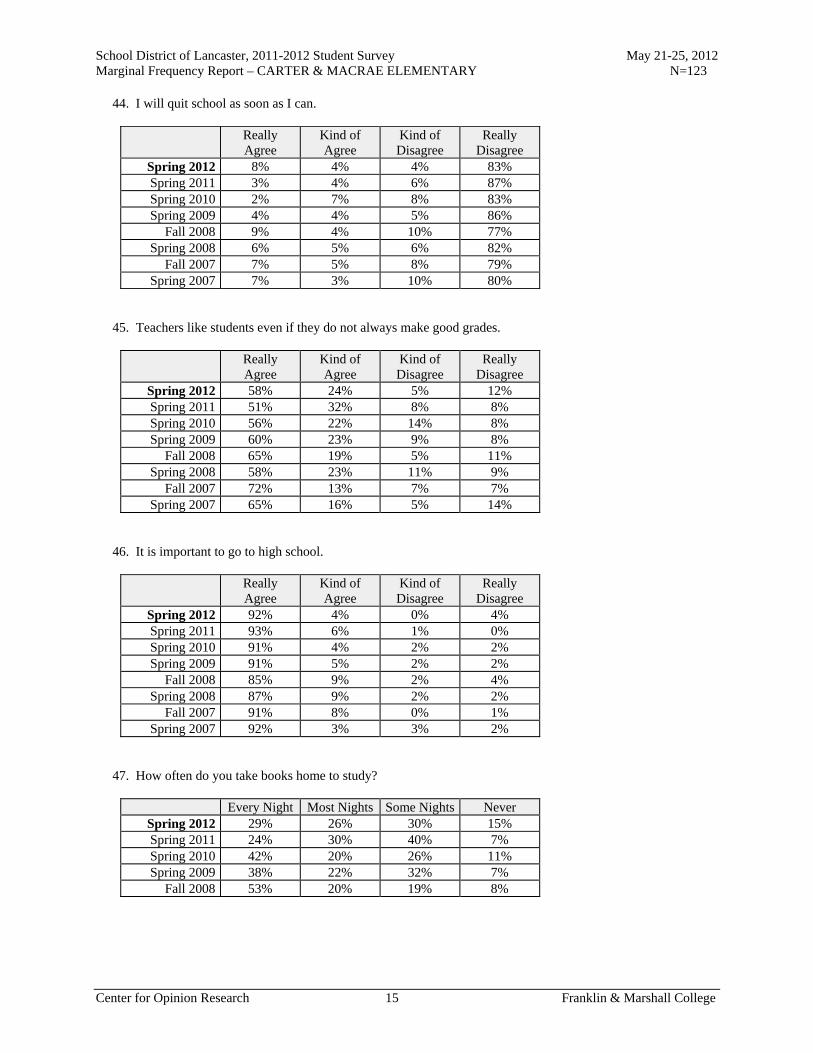
School District of Lancaster, 2011-2012 Student Survey May 21-25, 2012 Marginal Frequency Report – CARTER & MACRAE ELEMENTARY N=123
Center for Opinion Research 15 Franklin & Marshall College
44. I will quit school as soon as I can.
Really Agree
Kind of Agree
Kind of Disagree
Really Disagree
Spring 2012 8% 4% 4% 83% Spring 2011 3% 4% 6% 87% Spring 2010 2% 7% 8% 83% Spring 2009 4% 4% 5% 86%
Fall 2008 9% 4% 10% 77% Spring 2008 6% 5% 6% 82%
Fall 2007 7% 5% 8% 79% Spring 2007 7% 3% 10% 80%
45. Teachers like students even if they do not always make good grades.
Really Agree
Kind of Agree
Kind of Disagree
Really Disagree
Spring 2012 58% 24% 5% 12% Spring 2011 51% 32% 8% 8% Spring 2010 56% 22% 14% 8% Spring 2009 60% 23% 9% 8%
Fall 2008 65% 19% 5% 11% Spring 2008 58% 23% 11% 9%
Fall 2007 72% 13% 7% 7% Spring 2007 65% 16% 5% 14%
46. It is important to go to high school.
Really Agree
Kind of Agree
Kind of Disagree
Really Disagree
Spring 2012 92% 4% 0% 4% Spring 2011 93% 6% 1% 0% Spring 2010 91% 4% 2% 2% Spring 2009 91% 5% 2% 2%
Fall 2008 85% 9% 2% 4% Spring 2008 87% 9% 2% 2%
Fall 2007 91% 8% 0% 1% Spring 2007 92% 3% 3% 2%
47. How often do you take books home to study?
Every Night Most Nights Some Nights Never Spring 2012 29% 26% 30% 15% Spring 2011 24% 30% 40% 7% Spring 2010 42% 20% 26% 11% Spring 2009 38% 22% 32% 7%
Fall 2008 53% 20% 19% 8%
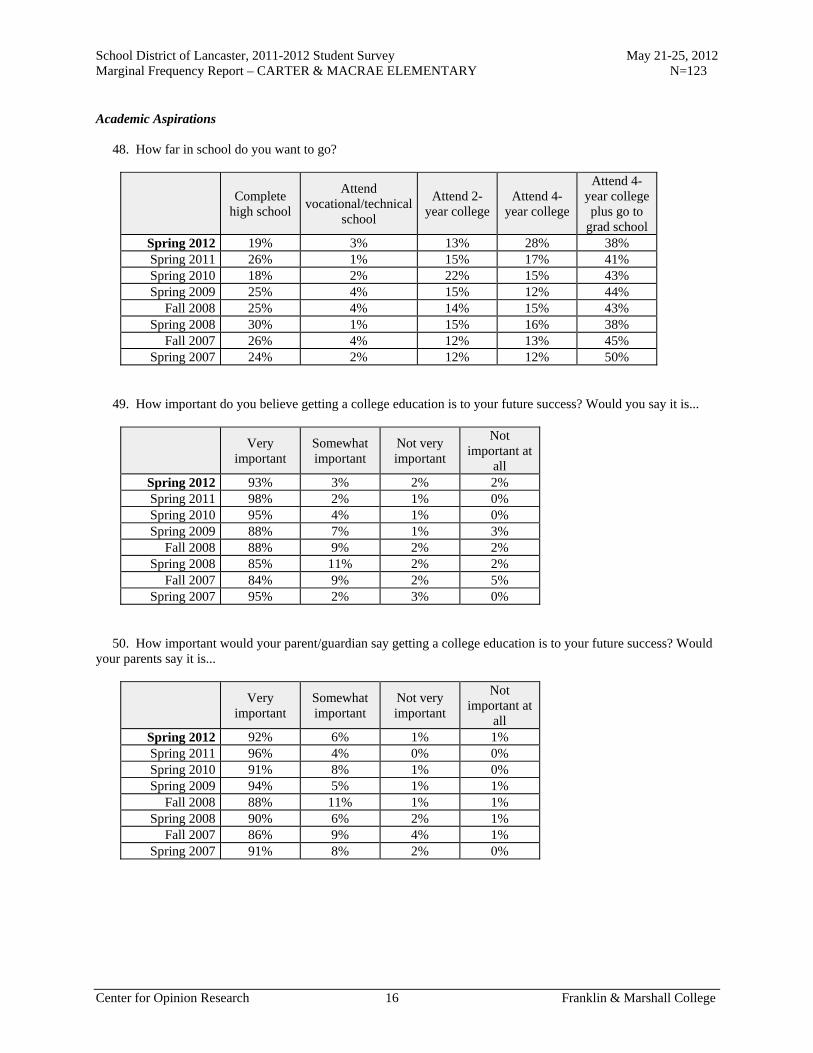
School District of Lancaster, 2011-2012 Student Survey May 21-25, 2012 Marginal Frequency Report – CARTER & MACRAE ELEMENTARY N=123
Center for Opinion Research 16 Franklin & Marshall College
Academic Aspirations 48. How far in school do you want to go?
Complete
high school
Attend vocational/technical
school
Attend 2-year college
Attend 4-year college
Attend 4-year college plus go to
grad school Spring 2012 19% 3% 13% 28% 38% Spring 2011 26% 1% 15% 17% 41% Spring 2010 18% 2% 22% 15% 43% Spring 2009 25% 4% 15% 12% 44%
Fall 2008 25% 4% 14% 15% 43% Spring 2008 30% 1% 15% 16% 38%
Fall 2007 26% 4% 12% 13% 45% Spring 2007 24% 2% 12% 12% 50%
49. How important do you believe getting a college education is to your future success? Would you say it is...
Very
important Somewhat important
Not very important
Not important at
all Spring 2012 93% 3% 2% 2% Spring 2011 98% 2% 1% 0% Spring 2010 95% 4% 1% 0% Spring 2009 88% 7% 1% 3%
Fall 2008 88% 9% 2% 2% Spring 2008 85% 11% 2% 2%
Fall 2007 84% 9% 2% 5% Spring 2007 95% 2% 3% 0%
50. How important would your parent/guardian say getting a college education is to your future success? Would your parents say it is...
Very
important Somewhat important
Not very important
Not important at
all Spring 2012 92% 6% 1% 1% Spring 2011 96% 4% 0% 0% Spring 2010 91% 8% 1% 0% Spring 2009 94% 5% 1% 1%
Fall 2008 88% 11% 1% 1% Spring 2008 90% 6% 2% 1%
Fall 2007 86% 9% 4% 1% Spring 2007 91% 8% 2% 0%
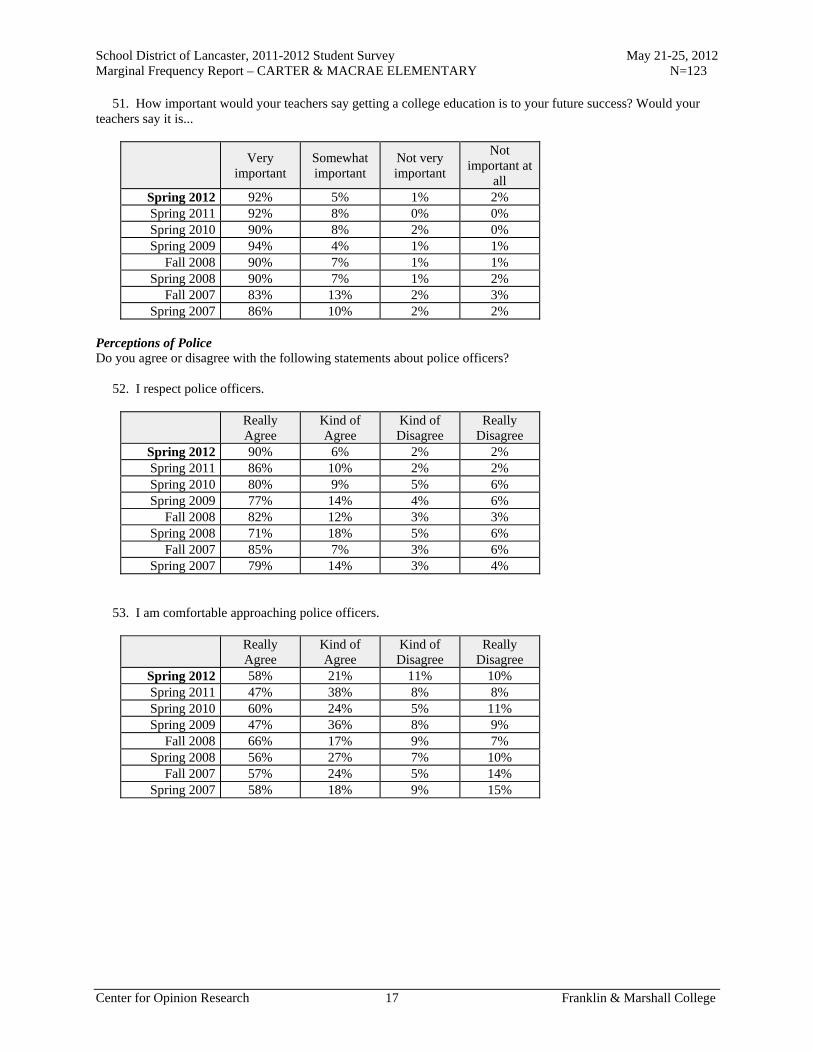
School District of Lancaster, 2011-2012 Student Survey May 21-25, 2012 Marginal Frequency Report – CARTER & MACRAE ELEMENTARY N=123
Center for Opinion Research 17 Franklin & Marshall College
51. How important would your teachers say getting a college education is to your future success? Would your teachers say it is...
Very
important Somewhat important
Not very important
Not important at
all Spring 2012 92% 5% 1% 2% Spring 2011 92% 8% 0% 0% Spring 2010 90% 8% 2% 0% Spring 2009 94% 4% 1% 1%
Fall 2008 90% 7% 1% 1% Spring 2008 90% 7% 1% 2%
Fall 2007 83% 13% 2% 3% Spring 2007 86% 10% 2% 2%
Perceptions of Police Do you agree or disagree with the following statements about police officers? 52. I respect police officers.
Really Agree
Kind of Agree
Kind of Disagree
Really Disagree
Spring 2012 90% 6% 2% 2% Spring 2011 86% 10% 2% 2% Spring 2010 80% 9% 5% 6% Spring 2009 77% 14% 4% 6%
Fall 2008 82% 12% 3% 3% Spring 2008 71% 18% 5% 6%
Fall 2007 85% 7% 3% 6% Spring 2007 79% 14% 3% 4%
53. I am comfortable approaching police officers.
Really Agree
Kind of Agree
Kind of Disagree
Really Disagree
Spring 2012 58% 21% 11% 10% Spring 2011 47% 38% 8% 8% Spring 2010 60% 24% 5% 11% Spring 2009 47% 36% 8% 9%
Fall 2008 66% 17% 9% 7% Spring 2008 56% 27% 7% 10%
Fall 2007 57% 24% 5% 14% Spring 2007 58% 18% 9% 15%

School District of Lancaster, 2011-2012 Student Survey May 21-25, 2012 Marginal Frequency Report – CARTER & MACRAE ELEMENTARY N=123
Center for Opinion Research 18 Franklin & Marshall College
54. I would consider police work as a career.
Really Agree
Kind of Agree
Kind of Disagree
Really Disagree
Spring 2012 41% 22% 15% 23% Spring 2011 40% 23% 12% 24% Spring 2010 40% 20% 13% 27% Spring 2009 38% 24% 12% 26%
Fall 2008 49% 22% 12% 18% Spring 2008 44% 20% 16% 20%
Fall 2007 53% 19% 12% 17% Spring 2007 37% 23% 12% 28%
55. In general, I do not trust the police.
Really Agree
Kind of Agree
Kind of Disagree
Really Disagree
Spring 2012 12% 10% 10% 68% Spring 2011 14% 17% 10% 59% Spring 2010 19% 6% 9% 66% Spring 2009 21% 9% 9% 62%
Fall 2008 24% 12% 10% 54% Spring 2008 14% 18% 8% 60%
Fall 2007 17% 14% 4% 64% Spring 2007 16% 15% 12% 57%
56. Police do not belong in schools unless there has been a crime.
Really Agree
Kind of Agree
Kind of Disagree
Really Disagree
Spring 2012 36% 9% 14% 40% Spring 2011 32% 16% 19% 33% Spring 2010 40% 15% 12% 32% Spring 2009 40% 15% 8% 37%
Fall 2008 42% 14% 11% 34% Spring 2008 47% 13% 15% 26%
Fall 2007 53% 12% 12% 23% Spring 2007 45% 12% 13% 30%

Report F
Marginal Frequency Report Fulton Elementary School

School District of Lancaster, 2011-2012 Student Survey May 21-25, 2012 Marginal Frequency Report – FULTON ELEMENTARY N=172
Center for Opinion Research 1 Franklin & Marshall College
School Climate Do you agree or disagree with the following statements? 1. I feel safe at this school.
Really Agree
Kind of Agree
Kind of Disagree
Really Disagree
Spring 2012 58% 29% 11% 2% Spring 2011 59% 30% 6% 5% Spring 2010 56% 33% 6% 6% Spring 2009 59% 29% 9% 3%
Fall 2008 70% 22% 5% 3% Spring 2008 58% 30% 7% 4%
Fall 2007 61% 31% 6% 2% Spring 2007 63% 29% 5% 3%
Fall 2006 74% 18% 4% 4% 2. I feel safe going to and from school.
Really Agree
Kind of Agree
Kind of Disagree
Really Disagree
Spring 2012 57% 28% 9% 6% Spring 2011 62% 26% 9% 3% Spring 2010 65% 21% 8% 6% Spring 2009 50% 32% 12% 7%
Fall 2008 56% 28% 10% 6% Spring 2008 54% 22% 12% 12%
Fall 2007 60% 26% 11% 3% Spring 2007 56% 29% 9% 6%
Fall 2006 62% 26% 6% 5% 3. Students get along well with each other.
Really Agree
Kind of Agree
Kind of Disagree
Really Disagree
Spring 2012 13% 38% 32% 17% Spring 2011 18% 34% 27% 21% Spring 2010 17% 38% 22% 23% Spring 2009 9% 25% 42% 23%
Fall 2008 17% 36% 28% 19% Spring 2008 9% 36% 33% 22%
Fall 2007 11% 39% 35% 15% Spring 2007 13% 35% 29% 22%
Fall 2006 23% 37% 21% 19%

School District of Lancaster, 2011-2012 Student Survey May 21-25, 2012 Marginal Frequency Report – FULTON ELEMENTARY N=172
Center for Opinion Research 2 Franklin & Marshall College
4. Students get along well with teachers.
Really Agree
Kind of Agree
Kind of Disagree
Really Disagree
Spring 2012 35% 39% 17% 9% Spring 2011 33% 34% 21% 12% Spring 2010 35% 34% 17% 14% Spring 2009 28% 36% 23% 13%
Fall 2008 39% 39% 15% 8% Spring 2008 18% 46% 22% 14%
Fall 2007 31% 44% 21% 5% Spring 2007 24% 44% 21% 11%
Fall 2006 40% 37% 15% 8% 5. I like my school.
Really Agree
Kind of Agree
Kind of Disagree
Really Disagree
Spring 2012 55% 24% 12% 8% Spring 2011 52% 21% 15% 13% Spring 2010 54% 22% 10% 14% Spring 2009 55% 23% 9% 13%
Fall 2008 58% 23% 12% 7% Spring 2008 53% 27% 10% 10%
Fall 2007 63% 23% 10% 4% Spring 2007 44% 36% 12% 8%
Fall 2006 67% 19% 8% 6% 6. I like my teachers.
Really Agree
Kind of Agree
Kind of Disagree
Really Disagree
Spring 2012 69% 21% 5% 5% Spring 2011 66% 20% 8% 7% Spring 2010 65% 20% 8% 7% Spring 2009 66% 19% 8% 7%
Fall 2008 73% 16% 8% 2% Spring 2008 60% 25% 8% 7%
Fall 2007 71% 23% 3% 3% Spring 2007 64% 25% 6% 5%
Fall 2006 75% 15% 3% 7%

School District of Lancaster, 2011-2012 Student Survey May 21-25, 2012 Marginal Frequency Report – FULTON ELEMENTARY N=172
Center for Opinion Research 3 Franklin & Marshall College
7. There is a teacher or some other adult at this school who really cares about me.
Really Agree
Kind of Agree
Kind of Disagree
Really Disagree
Spring 2012 62% 24% 8% 5% Spring 2011 72% 20% 6% 2% Spring 2010 74% 16% 4% 6% Spring 2009 71% 18% 7% 4%
Fall 2008 74% 15% 7% 5% Spring 2008 77% 16% 6% 2%
Fall 2007 68% 22% 6% 4% Spring 2007 73% 18% 4% 4%
Fall 2006 80% 11% 4% 4% 8. There is a teacher or some other adult at this school who cares when I am not here.
Really Agree
Kind of Agree
Kind of Disagree
Really Disagree
Spring 2012 43% 31% 11% 15% Spring 2011 46% 25% 12% 16% Spring 2010 44% 27% 13% 17% Spring 2009 48% 27% 9% 17%
Fall 2008 54% 22% 15% 10% Spring 2008 45% 28% 9% 18%
Fall 2007 48% 21% 13% 17% Spring 2007 45% 24% 11% 20%
Fall 2006 56% 19% 7% 18% 9. There is a teacher or some other adult at this school who listens to me when I have something to say.
Really Agree
Kind of Agree
Kind of Disagree
Really Disagree
Spring 2012 58% 26% 12% 4% Spring 2011 59% 27% 6% 8% Spring 2010 69% 16% 7% 8% Spring 2009 60% 29% 7% 4%
Fall 2008 66% 24% 7% 4% Spring 2008 65% 22% 10% 4%
Fall 2007 71% 18% 6% 4% Spring 2007 62% 24% 6% 9%
Fall 2006 66% 22% 7% 6%

School District of Lancaster, 2011-2012 Student Survey May 21-25, 2012 Marginal Frequency Report – FULTON ELEMENTARY N=172
Center for Opinion Research 4 Franklin & Marshall College
10. There is a teacher or some other adult at this school who tells me when I do a good job.
Really Agree
Kind of Agree
Kind of Disagree
Really Disagree
Spring 2012 78% 15% 5% 2% Spring 2011 77% 16% 5% 2% Spring 2010 78% 13% 1% 7% Spring 2009 74% 20% 3% 3%
Fall 2008 79% 14% 4% 3% Spring 2008 73% 21% 5% 2%
Fall 2007 76% 17% 2% 5% Spring 2007 72% 21% 4% 3%
Fall 2006 76% 15% 4% 5% 11. There is a teacher or some other adult at this school who always wants me to do my best.
Really Agree
Kind of Agree
Kind of Disagree
Really Disagree
Spring 2012 82% 14% 2% 2% Spring 2011 88% 10% 1% 2% Spring 2010 84% 8% 3% 4% Spring 2009 85% 10% 4% 0%
Fall 2008 86% 11% 1% 2% Spring 2008 90% 7% 2% 1%
Fall 2007 92% 7% 0% 2% Spring 2007 87% 10% 1% 2%
Fall 2006 91% 7% 0% 2% 12. There is a teacher or some other adult at this school who believes that I will be a success.
Really Agree
Kind of Agree
Kind of Disagree
Really Disagree
Spring 2012 61% 22% 13% 3% Spring 2011 68% 18% 10% 4% Spring 2010 68% 22% 6% 5% Spring 2009 67% 24% 6% 3%
Fall 2008 64% 25% 7% 4% Spring 2008 70% 24% 5% 2%
Fall 2007 74% 18% 4% 3% Spring 2007 69% 21% 6% 4%
Fall 2006 71% 20% 5% 4%

School District of Lancaster, 2011-2012 Student Survey May 21-25, 2012 Marginal Frequency Report – FULTON ELEMENTARY N=172
Center for Opinion Research 5 Franklin & Marshall College
13. Students in this school really listen to teachers.
Really Agree
Kind of Agree
Kind of Disagree
Really Disagree
Spring 2012 14% 42% 33% 11% Spring 2011 18% 35% 30% 17% Spring 2010 24% 35% 27% 13% Spring 2009 15% 34% 34% 18%
Fall 2008 18% 39% 29% 15% Spring 2008 6% 38% 34% 21%
Fall 2007 16% 39% 33% 12% Spring 2007 10% 28% 40% 21%
Fall 2006 22% 35% 26% 18% 14. Most teachers make learning interesting.
Really Agree
Kind of Agree
Kind of Disagree
Really Disagree
Spring 2012 44% 31% 16% 9% Spring 2011 46% 34% 9% 11% Spring 2010 58% 23% 8% 11% Spring 2009 53% 30% 13% 5%
Fall 2008 58% 28% 10% 4% Spring 2008 51% 32% 14% 3%
Fall 2007 60% 31% 4% 6% Spring 2007 44% 36% 13% 7%
Fall 2006 65% 23% 6% 6% 15. This school is always getting better.
Really Agree
Kind of Agree
Kind of Disagree
Really Disagree
Spring 2012 37% 30% 19% 14% Spring 2011 34% 30% 18% 18% Spring 2010 37% 27% 14% 22% Spring 2009 33% 29% 17% 21%
Fall 2008 42% 30% 13% 15% Spring 2008 43% 27% 18% 12%
Fall 2007 45% 29% 16% 10% Spring 2007 35% 35% 19% 12%
Fall 2006 52% 28% 8% 12%
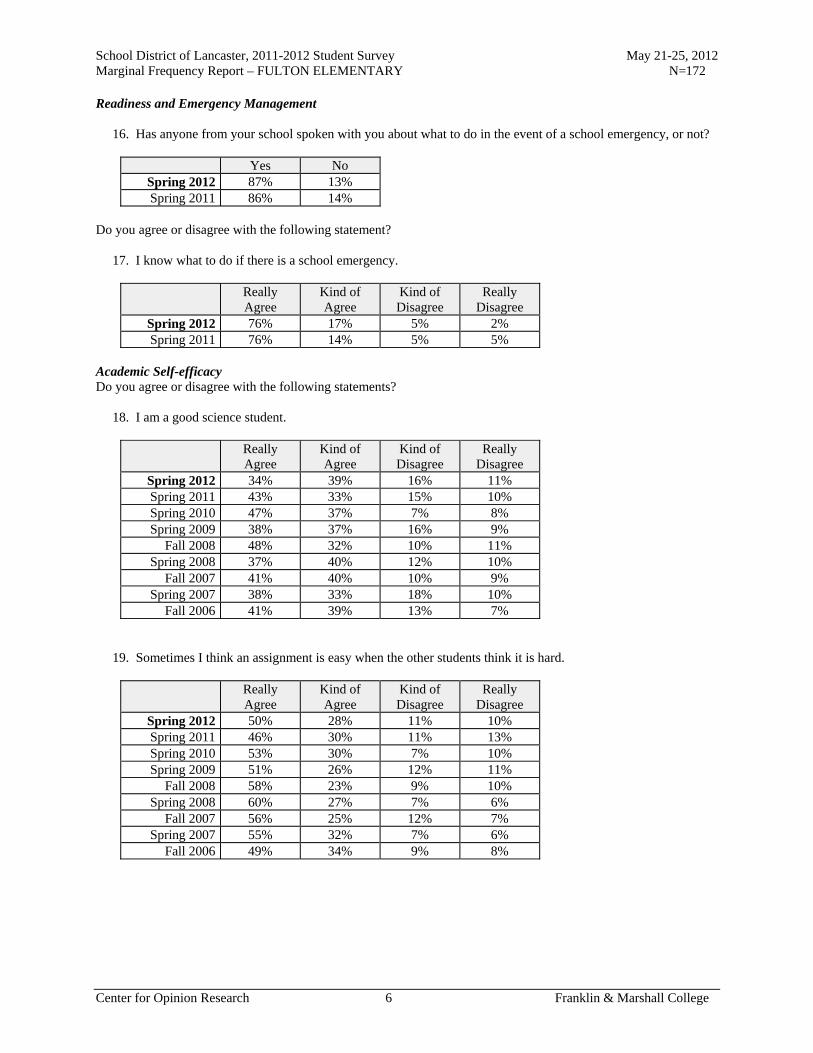
School District of Lancaster, 2011-2012 Student Survey May 21-25, 2012 Marginal Frequency Report – FULTON ELEMENTARY N=172
Center for Opinion Research 6 Franklin & Marshall College
Readiness and Emergency Management 16. Has anyone from your school spoken with you about what to do in the event of a school emergency, or not?
Yes No Spring 2012 87% 13% Spring 2011 86% 14%
Do you agree or disagree with the following statement? 17. I know what to do if there is a school emergency.
Really Agree
Kind of Agree
Kind of Disagree
Really Disagree
Spring 2012 76% 17% 5% 2% Spring 2011 76% 14% 5% 5%
Academic Self-efficacy Do you agree or disagree with the following statements? 18. I am a good science student.
Really Agree
Kind of Agree
Kind of Disagree
Really Disagree
Spring 2012 34% 39% 16% 11% Spring 2011 43% 33% 15% 10% Spring 2010 47% 37% 7% 8% Spring 2009 38% 37% 16% 9%
Fall 2008 48% 32% 10% 11% Spring 2008 37% 40% 12% 10%
Fall 2007 41% 40% 10% 9% Spring 2007 38% 33% 18% 10%
Fall 2006 41% 39% 13% 7% 19. Sometimes I think an assignment is easy when the other students think it is hard.
Really Agree
Kind of Agree
Kind of Disagree
Really Disagree
Spring 2012 50% 28% 11% 10% Spring 2011 46% 30% 11% 13% Spring 2010 53% 30% 7% 10% Spring 2009 51% 26% 12% 11%
Fall 2008 58% 23% 9% 10% Spring 2008 60% 27% 7% 6%
Fall 2007 56% 25% 12% 7% Spring 2007 55% 32% 7% 6%
Fall 2006 49% 34% 9% 8%

School District of Lancaster, 2011-2012 Student Survey May 21-25, 2012 Marginal Frequency Report – FULTON ELEMENTARY N=172
Center for Opinion Research 7 Franklin & Marshall College
20. I am good social studies student.
Really Agree
Kind of Agree
Kind of Disagree
Really Disagree
Spring 2012 46% 35% 14% 6% Spring 2011 45% 29% 15% 11% Spring 2010 44% 29% 19% 8% Spring 2009 45% 31% 15% 9%
Fall 2008 45% 35% 12% 8% Spring 2008 46% 34% 13% 7%
Fall 2007 49% 33% 9% 10% Spring 2007 44% 35% 11% 11%
Fall 2006 55% 25% 12% 9% 21. My teacher thinks I am smart.
Really Agree
Kind of Agree
Kind of Disagree
Really Disagree
Spring 2012 57% 29% 6% 7% Spring 2011 65% 20% 10% 5% Spring 2010 67% 22% 4% 7% Spring 2009 67% 25% 5% 3%
Fall 2008 70% 22% 4% 4% Spring 2008 67% 22% 5% 5%
Fall 2007 71% 19% 3% 6% Spring 2007 65% 22% 7% 6%
Fall 2006 66% 24% 4% 6% 22. I am a good math student.
Really Agree
Kind of Agree
Kind of Disagree
Really Disagree
Spring 2012 48% 28% 13% 10% Spring 2011 62% 26% 6% 5% Spring 2010 68% 23% 4% 5% Spring 2009 59% 22% 9% 10%
Fall 2008 58% 28% 5% 9% Spring 2008 62% 24% 8% 7%
Fall 2007 60% 27% 7% 6% Spring 2007 57% 30% 9% 5%
Fall 2006 55% 30% 7% 9%

School District of Lancaster, 2011-2012 Student Survey May 21-25, 2012 Marginal Frequency Report – FULTON ELEMENTARY N=172
Center for Opinion Research 8 Franklin & Marshall College
23. My classmates usually get better grades than I do.
Really Agree
Kind of Agree
Kind of Disagree
Really Disagree
Spring 2012 30% 27% 26% 17% Spring 2011 22% 25% 31% 23% Spring 2010 24% 24% 34% 17% Spring 2009 20% 26% 29% 25%
Fall 2008 27% 26% 24% 23% Spring 2008 18% 26% 28% 28%
Fall 2007 17% 30% 28% 25% Spring 2007 19% 31% 25% 26%
Fall 2006 23% 30% 26% 20% 24. I usually understand my homework assignments.
Really Agree
Kind of Agree
Kind of Disagree
Really Disagree
Spring 2012 47% 34% 14% 4% Spring 2011 49% 33% 13% 5% Spring 2010 46% 39% 10% 5% Spring 2009 52% 33% 11% 4%
Fall 2008 54% 29% 10% 7% Spring 2008 53% 37% 6% 3%
Fall 2007 56% 29% 11% 3% Spring 2007 52% 31% 10% 7%
Fall 2006 61% 30% 7% 3% 25. I could get the best grades in class if I tried hard enough.
Really Agree
Kind of Agree
Kind of Disagree
Really Disagree
Spring 2012 72% 19% 3% 6% Spring 2011 73% 17% 5% 4% Spring 2010 76% 18% 5% 1% Spring 2009 74% 17% 6% 3%
Fall 2008 78% 12% 6% 5% Spring 2008 73% 18% 6% 3%
Fall 2007 79% 16% 2% 3% Spring 2007 81% 14% 3% 2%
Fall 2006 77% 18% 3% 2%

School District of Lancaster, 2011-2012 Student Survey May 21-25, 2012 Marginal Frequency Report – FULTON ELEMENTARY N=172
Center for Opinion Research 9 Franklin & Marshall College
26. I am a good reading student.
Really Agree
Kind of Agree
Kind of Disagree
Really Disagree
Spring 2012 55% 32% 5% 8% Spring 2011 54% 32% 10% 4% Spring 2010 61% 28% 5% 6% Spring 2009 56% 32% 8% 4%
Fall 2008 61% 26% 8% 4% Spring 2008 58% 28% 8% 6%
Fall 2007 63% 24% 8% 4% Spring 2007 64% 25% 6% 5%
Fall 2006 66% 26% 5% 3% 27. It is not hard for me to get good grades in school.
Really Agree
Kind of Agree
Kind of Disagree
Really Disagree
Spring 2012 41% 34% 16% 10% Spring 2011 50% 27% 14% 9% Spring 2010 57% 25% 12% 7% Spring 2009 41% 33% 18% 8%
Fall 2008 51% 30% 9% 10% Spring 2008 39% 30% 14% 17%
Fall 2007 42% 37% 12% 9% Spring 2007 41% 33% 16% 9%
Fall 2006 44% 36% 7% 12% 28. I am smart.
Really Agree
Kind of Agree
Kind of Disagree
Really Disagree
Spring 2012 58% 28% 9% 5% Spring 2011 58% 26% 11% 5% Spring 2010 75% 16% 4% 5% Spring 2009 70% 20% 5% 4%
Fall 2008 73% 16% 5% 6% Spring 2008 64% 26% 6% 5%
Fall 2007 67% 24% 3% 6% Spring 2007 65% 29% 4% 3%
Fall 2006 67% 25% 4% 5%

School District of Lancaster, 2011-2012 Student Survey May 21-25, 2012 Marginal Frequency Report – FULTON ELEMENTARY N=172
Center for Opinion Research 10 Franklin & Marshall College
29. When the teacher asks a question I usually know the answer even if the other students don't.
Really Agree
Kind of Agree
Kind of Disagree
Really Disagree
Spring 2012 30% 43% 17% 10% Spring 2011 31% 41% 16% 12% Spring 2010 48% 34% 12% 6% Spring 2009 42% 37% 17% 5%
Fall 2008 44% 37% 9% 10% Spring 2008 37% 40% 17% 6%
Fall 2007 35% 43% 16% 7% Spring 2007 38% 40% 16% 6%
Fall 2006 42% 39% 14% 5% 30. I work hard in school.
Really Agree
Kind of Agree
Kind of Disagree
Really Disagree
Spring 2012 77% 18% 3% 2% Spring 2011 74% 17% 8% 2% Spring 2010 73% 20% 3% 4% Spring 2009 69% 22% 6% 3%
Fall 2008 77% 16% 5% 2% Spring 2008 68% 27% 3% 2%
Fall 2007 75% 20% 2% 3% Spring 2007 77% 19% 3% 1%
Fall 2006 78% 16% 4% 3% 31. Most of my classmates work harder on their homework than I do.
Really Agree
Kind of Agree
Kind of Disagree
Really Disagree
Spring 2012 19% 28% 33% 20% Spring 2011 20% 29% 22% 29% Spring 2010 24% 31% 29% 16% Spring 2009 21% 25% 28% 26%
Fall 2008 21% 28% 20% 31% Spring 2008 17% 24% 31% 27%
Fall 2007 17% 29% 27% 27% Spring 2007 22% 22% 25% 31%
Fall 2006 22% 26% 22% 30%

School District of Lancaster, 2011-2012 Student Survey May 21-25, 2012 Marginal Frequency Report – FULTON ELEMENTARY N=172
Center for Opinion Research 11 Franklin & Marshall College
32. I always get good grades when I try hard.
Really Agree
Kind of Agree
Kind of Disagree
Really Disagree
Spring 2012 66% 23% 6% 4% Spring 2011 71% 18% 9% 3% Spring 2010 75% 17% 6% 2% Spring 2009 77% 17% 4% 2%
Fall 2008 81% 12% 2% 5% Spring 2008 77% 16% 3% 3%
Fall 2007 79% 15% 3% 3% Spring 2007 78% 17% 4% 1%
Fall 2006 77% 16% 4% 4% 33. I usually do not get good grades in math because it is too hard.
Really Agree
Kind of Agree
Kind of Disagree
Really Disagree
Spring 2012 14% 24% 21% 41% Spring 2011 14% 21% 15% 50% Spring 2010 11% 18% 17% 54% Spring 2009 15% 16% 15% 54%
Fall 2008 20% 18% 21% 42% Spring 2008 9% 19% 18% 54%
Fall 2007 10% 22% 22% 45% Spring 2007 10% 18% 20% 51%
Fall 2006 18% 25% 15% 42% 34. Most of my classmates like to do math because it is easy.
Really Agree
Kind of Agree
Kind of Disagree
Really Disagree
Spring 2012 46% 27% 16% 11% Spring 2011 50% 24% 16% 11% Spring 2010 58% 21% 14% 7% Spring 2009 57% 23% 10% 10%
Fall 2008 54% 18% 21% 7% Spring 2008 42% 31% 15% 12%
Fall 2007 50% 22% 16% 12% Spring 2007 46% 26% 16% 11%
Fall 2006 51% 22% 15% 12%

School District of Lancaster, 2011-2012 Student Survey May 21-25, 2012 Marginal Frequency Report – FULTON ELEMENTARY N=172
Center for Opinion Research 12 Franklin & Marshall College
35. I would get better grades if my teacher liked me more.
Really Agree
Kind of Agree
Kind of Disagree
Really Disagree
Spring 2012 19% 15% 9% 57% Spring 2011 16% 15% 14% 56% Spring 2010 25% 15% 12% 48% Spring 2009 17% 7% 19% 57%
Fall 2008 26% 11% 15% 48% Spring 2008 13% 13% 13% 62%
Fall 2007 14% 9% 16% 61% Spring 2007 18% 10% 14% 59%
Fall 2006 25% 13% 14% 48% 36. I will graduate from high school.
Really Agree
Kind of Agree
Kind of Disagree
Really Disagree
Spring 2012 76% 17% 2% 4% Spring 2011 82% 15% 2% 1% Spring 2010 85% 12% 1% 2% Spring 2009 80% 16% 0% 4%
Fall 2008 83% 13% 1% 2% Spring 2008 85% 12% 1% 2%
Fall 2007 85% 10% 3% 2% Spring 2007 79% 18% 1% 2%
Fall 2006 86% 9% 2% 4% 37. I go to a good school.
Really Agree
Kind of Agree
Kind of Disagree
Really Disagree
Spring 2012 62% 24% 8% 6% Spring 2011 60% 21% 8% 11% Spring 2010 67% 14% 11% 8% Spring 2009 62% 19% 8% 11%
Fall 2008 61% 26% 7% 7% Spring 2008 61% 25% 7% 7%
Fall 2007 69% 19% 7% 5% Spring 2007 59% 27% 9% 5%
Fall 2006 67% 18% 7% 8%

School District of Lancaster, 2011-2012 Student Survey May 21-25, 2012 Marginal Frequency Report – FULTON ELEMENTARY N=172
Center for Opinion Research 13 Franklin & Marshall College
38. Adults who have good jobs probably were good students when they were young.
Really Agree
Kind of Agree
Kind of Disagree
Really Disagree
Spring 2012 66% 23% 4% 7% Spring 2011 76% 19% 2% 3% Spring 2010 72% 18% 6% 5% Spring 2009 76% 18% 5% 0%
Fall 2008 73% 19% 4% 4% Spring 2008 74% 17% 5% 5%
Fall 2007 80% 15% 2% 3% Spring 2007 74% 21% 2% 3%
Fall 2006 74% 18% 4% 4% 39. When I am old enough, I will go to college.
Really Agree
Kind of Agree
Kind of Disagree
Really Disagree
Spring 2012 75% 11% 7% 7% Spring 2011 78% 13% 6% 3% Spring 2010 80% 10% 5% 4% Spring 2009 80% 13% 4% 3%
Fall 2008 78% 13% 6% 4% Spring 2008 79% 13% 3% 5%
Fall 2007 78% 13% 4% 5% Spring 2007 79% 16% 2% 3%
Fall 2006 77% 12% 2% 8% 40. No one cares if I do well in school.
Really Agree
Kind of Agree
Kind of Disagree
Really Disagree
Spring 2012 10% 13% 10% 68% Spring 2011 10% 11% 14% 66% Spring 2010 16% 11% 10% 64% Spring 2009 9% 8% 20% 63%
Fall 2008 20% 5% 7% 68% Spring 2008 11% 6% 9% 74%
Fall 2007 12% 7% 10% 70% Spring 2007 11% 10% 10% 68%
Fall 2006 22% 10% 10% 58%

School District of Lancaster, 2011-2012 Student Survey May 21-25, 2012 Marginal Frequency Report – FULTON ELEMENTARY N=172
Center for Opinion Research 14 Franklin & Marshall College
41. What I learn in school is not important.
Really Agree
Kind of Agree
Kind of Disagree
Really Disagree
Spring 2012 6% 9% 8% 78% Spring 2011 7% 3% 7% 84% Spring 2010 15% 8% 7% 70% Spring 2009 8% 6% 10% 75%
Fall 2008 14% 3% 7% 75% Spring 2008 8% 4% 6% 82%
Fall 2007 10% 4% 4% 82% Spring 2007 9% 7% 5% 79%
Fall 2006 15% 6% 7% 72% 42. It does not matter if I do well in school.
Really Agree
Kind of Agree
Kind of Disagree
Really Disagree
Spring 2012 9% 5% 11% 75% Spring 2011 7% 5% 7% 81% Spring 2010 15% 8% 6% 70% Spring 2009 10% 8% 10% 72%
Fall 2008 19% 6% 6% 69% Spring 2008 9% 5% 3% 83%
Fall 2007 7% 5% 6% 82% Spring 2007 12% 6% 3% 80%
Fall 2006 16% 3% 10% 72% 43. Students who get better grades than I do get more help from the teacher than I do.
Really Agree
Kind of Agree
Kind of Disagree
Really Disagree
Spring 2012 16% 22% 19% 44% Spring 2011 11% 14% 21% 54% Spring 2010 18% 14% 20% 48% Spring 2009 17% 12% 21% 50%
Fall 2008 20% 8% 10% 62% Spring 2008 8% 13% 14% 65%
Fall 2007 13% 12% 18% 57% Spring 2007 19% 9% 14% 57%
Fall 2006 21% 10% 13% 55%

School District of Lancaster, 2011-2012 Student Survey May 21-25, 2012 Marginal Frequency Report – FULTON ELEMENTARY N=172
Center for Opinion Research 15 Franklin & Marshall College
44. I will quit school as soon as I can.
Really Agree
Kind of Agree
Kind of Disagree
Really Disagree
Spring 2012 7% 5% 9% 79% Spring 2011 4% 5% 8% 83% Spring 2010 14% 5% 10% 71% Spring 2009 8% 5% 8% 79%
Fall 2008 10% 4% 7% 79% Spring 2008 6% 4% 6% 84%
Fall 2007 10% 4% 4% 81% Spring 2007 10% 3% 6% 82%
Fall 2006 11% 5% 8% 75% 45. Teachers like students even if they do not always make good grades.
Really Agree
Kind of Agree
Kind of Disagree
Really Disagree
Spring 2012 63% 21% 5% 11% Spring 2011 62% 15% 7% 16% Spring 2010 69% 14% 7% 10% Spring 2009 67% 17% 8% 8%
Fall 2008 70% 18% 4% 8% Spring 2008 67% 19% 7% 6%
Fall 2007 76% 14% 4% 6% Spring 2007 72% 13% 4% 11%
Fall 2006 76% 13% 3% 9% 46. It is important to go to high school.
Really Agree
Kind of Agree
Kind of Disagree
Really Disagree
Spring 2012 81% 11% 4% 5% Spring 2011 91% 6% 1% 3% Spring 2010 88% 7% 2% 3% Spring 2009 87% 5% 3% 4%
Fall 2008 87% 8% 2% 2% Spring 2008 90% 7% 2% 1%
Fall 2007 93% 3% 3% 2% Spring 2007 92% 4% 2% 2%
Fall 2006 86% 7% 2% 5% 47. How often do you take books home to study?
Every Night Most Nights Some Nights Never Spring 2012 21% 33% 29% 17% Spring 2011 32% 22% 36% 11% Spring 2010 30% 22% 34% 14% Spring 2009 26% 21% 38% 14%
Fall 2008 35% 27% 26% 12%

School District of Lancaster, 2011-2012 Student Survey May 21-25, 2012 Marginal Frequency Report – FULTON ELEMENTARY N=172
Center for Opinion Research 16 Franklin & Marshall College
Academic Aspirations 48. How far in school do you want to go?
Complete
high school
Attend vocational/technical
school
Attend 2-year college
Attend 4-year college
Attend 4-year college plus go to
grad school Spring 2012 22% 3% 14% 13% 48% Spring 2011 20% 7% 12% 18% 43% Spring 2010 27% 7% 13% 13% 40% Spring 2009 18% 5% 14% 17% 46%
Fall 2008 27% 5% 10% 14% 44% Spring 2008 19% 3% 15% 17% 45%
Fall 2007 24% 4% 16% 20% 36% Spring 2007 15% 2% 19% 16% 47%
Fall 2006 29% 4% 15% 13% 39% 49. How important do you believe getting a college education is to your future success? Would you say it is...
Very
important Somewhat important
Not very important
Not important at
all Spring 2012 86% 10% 2% 2% Spring 2011 89% 7% 3% 1% Spring 2010 87% 7% 2% 4% Spring 2009 89% 7% 1% 3%
Fall 2008 90% 7% 1% 2% Spring 2008 88% 8% 2% 2%
Fall 2007 90% 6% 2% 2% Spring 2007 94% 4% 0% 2%
Fall 2006 89% 5% 2% 4% 50. How important would your parent/guardian say getting a college education is to your future success? Would your parents say it is...
Very
important Somewhat important
Not very important
Not important at
all Spring 2012 93% 4% 2% 1% Spring 2011 94% 4% 2% 1% Spring 2010 88% 8% 2% 2% Spring 2009 91% 6% 2% 1%
Fall 2008 91% 7% 0% 2% Spring 2008 92% 5% 1% 2%
Fall 2007 93% 4% 1% 1% Spring 2007 95% 4% 0% 0%
Fall 2006 90% 6% 2% 2%

School District of Lancaster, 2011-2012 Student Survey May 21-25, 2012 Marginal Frequency Report – FULTON ELEMENTARY N=172
Center for Opinion Research 17 Franklin & Marshall College
51. How important would your teachers say getting a college education is to your future success? Would your teachers say it is...
Very
important Somewhat important
Not very important
Not important at
all Spring 2012 90% 8% 1% 1% Spring 2011 95% 3% 1% 1% Spring 2010 90% 4% 5% 2% Spring 2009 92% 6% 1% 0%
Fall 2008 96% 1% 2% 1% Spring 2008 92% 7% 0% 1%
Fall 2007 90% 8% 1% 1% Spring 2007 94% 4% 0% 1%
Fall 2006 91% 4% 2% 3% Perceptions of Police Do you agree or disagree with the following statements about police officers? 52. I respect police officers.
Really Agree
Kind of Agree
Kind of Disagree
Really Disagree
Spring 2012 82% 13% 2% 2% Spring 2011 87% 10% 2% 2% Spring 2010 86% 7% 4% 3% Spring 2009 79% 12% 3% 5%
Fall 2008 90% 4% 2% 4% Spring 2008 81% 9% 5% 5%
Fall 2007 85% 9% 4% 2% Spring 2007 82% 9% 5% 5%
Fall 2006 86% 7% 1% 7% 53. I am comfortable approaching police officers.
Really Agree
Kind of Agree
Kind of Disagree
Really Disagree
Spring 2012 56% 32% 10% 3% Spring 2011 63% 20% 10% 7% Spring 2010 59% 25% 5% 11% Spring 2009 47% 33% 8% 13%
Fall 2008 54% 30% 8% 8% Spring 2008 59% 17% 12% 12%
Fall 2007 61% 27% 7% 6% Spring 2007 57% 22% 7% 14%
Fall 2006 62% 20% 6% 13%

School District of Lancaster, 2011-2012 Student Survey May 21-25, 2012 Marginal Frequency Report – FULTON ELEMENTARY N=172
Center for Opinion Research 18 Franklin & Marshall College
54. I would consider police work as a career.
Really Agree
Kind of Agree
Kind of Disagree
Really Disagree
Spring 2012 31% 22% 19% 29% Spring 2011 39% 24% 10% 27% Spring 2010 42% 22% 13% 23% Spring 2009 40% 17% 14% 29%
Fall 2008 45% 19% 11% 25% Spring 2008 38% 17% 16% 29%
Fall 2007 46% 22% 9% 23% Spring 2007 42% 20% 8% 30%
Fall 2006 38% 17% 10% 35% 55. In general, I do not trust the police.
Really Agree
Kind of Agree
Kind of Disagree
Really Disagree
Spring 2012 7% 9% 19% 65% Spring 2011 12% 12% 12% 64% Spring 2010 16% 11% 8% 64% Spring 2009 17% 10% 9% 64%
Fall 2008 12% 9% 12% 67% Spring 2008 7% 12% 16% 66%
Fall 2007 12% 9% 11% 68% Spring 2007 17% 8% 15% 60%
Fall 2006 20% 9% 7% 64% 56. Police do not belong in schools unless there has been a crime.
Really Agree
Kind of Agree
Kind of Disagree
Really Disagree
Spring 2012 30% 11% 16% 43% Spring 2011 27% 12% 12% 49% Spring 2010 39% 12% 10% 39% Spring 2009 32% 10% 13% 45%
Fall 2008 22% 9% 14% 55% Spring 2008 32% 13% 14% 41%
Fall 2007 34% 14% 9% 42% Spring 2007 33% 15% 11% 41%
Fall 2006 40% 10% 9% 41%

Report G
Marginal Frequency Report Hamilton Elementary School

School District of Lancaster, 2011-2012 Student Survey May 21-25, 2012 Marginal Frequency Report – HAMILTON ELEMENTARY N=208
Center for Opinion Research 1 Franklin & Marshall College
School Climate Do you agree or disagree with the following statements? 1. I feel safe at this school.
Really Agree
Kind of Agree
Kind of Disagree
Really Disagree
Spring 2012 57% 37% 6% 0% Spring 2011 60% 33% 4% 3% Spring 2010 55% 33% 8% 3% Spring 2009 61% 27% 9% 4%
Fall 2008 62% 24% 11% 4% Spring 2008 50% 36% 7% 7%
Fall 2007 63% 31% 2% 4% Spring 2007 65% 28% 3% 4%
Fall 2006 66% 24% 5% 5% 2. I feel safe going to and from school.
Really Agree
Kind of Agree
Kind of Disagree
Really Disagree
Spring 2012 58% 29% 8% 5% Spring 2011 62% 25% 8% 6% Spring 2010 52% 36% 10% 2% Spring 2009 61% 29% 6% 4%
Fall 2008 55% 25% 13% 7% Spring 2008 54% 29% 13% 4%
Fall 2007 54% 34% 10% 2% Spring 2007 53% 32% 11% 4%
Fall 2006 57% 30% 8% 5% 3. Students get along well with each other.
Really Agree
Kind of Agree
Kind of Disagree
Really Disagree
Spring 2012 23% 40% 27% 10% Spring 2011 16% 48% 26% 10% Spring 2010 12% 43% 32% 13% Spring 2009 9% 36% 34% 21%
Fall 2008 23% 37% 29% 12% Spring 2008 11% 38% 35% 16%
Fall 2007 18% 43% 28% 10% Spring 2007 13% 42% 28% 18%
Fall 2006 23% 35% 28% 15%

School District of Lancaster, 2011-2012 Student Survey May 21-25, 2012 Marginal Frequency Report – HAMILTON ELEMENTARY N=208
Center for Opinion Research 2 Franklin & Marshall College
4. Students get along well with teachers.
Really Agree
Kind of Agree
Kind of Disagree
Really Disagree
Spring 2012 36% 39% 18% 7% Spring 2011 28% 45% 19% 9% Spring 2010 26% 40% 25% 8% Spring 2009 29% 45% 19% 8%
Fall 2008 32% 41% 20% 7% Spring 2008 21% 48% 26% 4%
Fall 2007 41% 39% 16% 5% Spring 2007 28% 45% 19% 8%
Fall 2006 39% 40% 13% 8% 5. I like my school.
Really Agree
Kind of Agree
Kind of Disagree
Really Disagree
Spring 2012 56% 24% 12% 7% Spring 2011 58% 23% 10% 8% Spring 2010 55% 25% 12% 8% Spring 2009 52% 25% 15% 8%
Fall 2008 57% 21% 16% 7% Spring 2008 50% 25% 15% 10%
Fall 2007 59% 28% 7% 6% Spring 2007 57% 23% 11% 9%
Fall 2006 63% 24% 6% 7% 6. I like my teachers.
Really Agree
Kind of Agree
Kind of Disagree
Really Disagree
Spring 2012 73% 17% 7% 3% Spring 2011 66% 23% 7% 4% Spring 2010 64% 24% 6% 5% Spring 2009 69% 15% 10% 6%
Fall 2008 70% 18% 6% 7% Spring 2008 70% 19% 8% 3%
Fall 2007 78% 16% 4% 2% Spring 2007 71% 16% 9% 4%
Fall 2006 76% 18% 3% 3%

School District of Lancaster, 2011-2012 Student Survey May 21-25, 2012 Marginal Frequency Report – HAMILTON ELEMENTARY N=208
Center for Opinion Research 3 Franklin & Marshall College
7. There is a teacher or some other adult at this school who really cares about me.
Really Agree
Kind of Agree
Kind of Disagree
Really Disagree
Spring 2012 73% 19% 3% 4% Spring 2011 74% 17% 4% 5% Spring 2010 64% 25% 7% 4% Spring 2009 70% 20% 7% 2%
Fall 2008 62% 21% 11% 5% Spring 2008 62% 23% 10% 5%
Fall 2007 65% 24% 7% 4% Spring 2007 60% 23% 9% 7%
Fall 2006 60% 22% 11% 8% 8. There is a teacher or some other adult at this school who cares when I am not here.
Really Agree
Kind of Agree
Kind of Disagree
Really Disagree
Spring 2012 40% 27% 13% 21% Spring 2011 44% 28% 14% 14% Spring 2010 33% 30% 15% 22% Spring 2009 45% 24% 16% 14%
Fall 2008 38% 24% 15% 24% Spring 2008 39% 24% 19% 19%
Fall 2007 42% 24% 12% 22% Spring 2007 32% 27% 20% 22%
Fall 2006 35% 25% 16% 24% 9. There is a teacher or some other adult at this school who listens to me when I have something to say.
Really Agree
Kind of Agree
Kind of Disagree
Really Disagree
Spring 2012 70% 19% 7% 3% Spring 2011 71% 20% 6% 4% Spring 2010 72% 17% 5% 6% Spring 2009 66% 21% 11% 2%
Fall 2008 67% 22% 9% 3% Spring 2008 60% 28% 9% 3%
Fall 2007 71% 17% 7% 6% Spring 2007 65% 22% 9% 4%
Fall 2006 71% 18% 3% 8%

School District of Lancaster, 2011-2012 Student Survey May 21-25, 2012 Marginal Frequency Report – HAMILTON ELEMENTARY N=208
Center for Opinion Research 4 Franklin & Marshall College
10. There is a teacher or some other adult at this school who tells me when I do a good job.
Really Agree
Kind of Agree
Kind of Disagree
Really Disagree
Spring 2012 75% 18% 4% 3% Spring 2011 75% 19% 4% 2% Spring 2010 76% 14% 6% 4% Spring 2009 76% 18% 4% 2%
Fall 2008 69% 18% 6% 7% Spring 2008 71% 24% 3% 2%
Fall 2007 76% 14% 6% 5% Spring 2007 71% 20% 4% 5%
Fall 2006 80% 14% 4% 2% 11. There is a teacher or some other adult at this school who always wants me to do my best.
Really Agree
Kind of Agree
Kind of Disagree
Really Disagree
Spring 2012 90% 7% 1% 1% Spring 2011 89% 9% 1% 2% Spring 2010 85% 10% 2% 3% Spring 2009 85% 10% 4% 1%
Fall 2008 82% 11% 4% 4% Spring 2008 84% 12% 3% 1%
Fall 2007 89% 8% 1% 2% Spring 2007 86% 9% 4% 2%
Fall 2006 88% 10% 1% 1% 12. There is a teacher or some other adult at this school who believes that I will be a success.
Really Agree
Kind of Agree
Kind of Disagree
Really Disagree
Spring 2012 72% 22% 4% 2% Spring 2011 66% 22% 8% 4% Spring 2010 69% 19% 8% 3% Spring 2009 67% 26% 5% 2%
Fall 2008 70% 19% 5% 6% Spring 2008 71% 22% 3% 4%
Fall 2007 66% 26% 4% 5% Spring 2007 63% 24% 8% 6%
Fall 2006 64% 26% 6% 4%

School District of Lancaster, 2011-2012 Student Survey May 21-25, 2012 Marginal Frequency Report – HAMILTON ELEMENTARY N=208
Center for Opinion Research 5 Franklin & Marshall College
13. Students in this school really listen to teachers.
Really Agree
Kind of Agree
Kind of Disagree
Really Disagree
Spring 2012 13% 39% 40% 9% Spring 2011 13% 42% 32% 13% Spring 2010 9% 39% 37% 15% Spring 2009 9% 40% 35% 16%
Fall 2008 13% 36% 32% 19% Spring 2008 15% 33% 38% 13%
Fall 2007 20% 44% 29% 8% Spring 2007 18% 37% 29% 17%
Fall 2006 19% 40% 30% 12% 14. Most teachers make learning interesting.
Really Agree
Kind of Agree
Kind of Disagree
Really Disagree
Spring 2012 48% 37% 10% 4% Spring 2011 62% 32% 4% 3% Spring 2010 54% 26% 13% 6% Spring 2009 56% 26% 12% 6%
Fall 2008 55% 30% 12% 4% Spring 2008 50% 38% 10% 2%
Fall 2007 62% 26% 9% 2% Spring 2007 58% 29% 7% 6%
Fall 2006 65% 23% 7% 5% 15. This school is always getting better.
Really Agree
Kind of Agree
Kind of Disagree
Really Disagree
Spring 2012 34% 35% 20% 11% Spring 2011 40% 34% 18% 8% Spring 2010 42% 24% 21% 12% Spring 2009 43% 26% 16% 14%
Fall 2008 36% 29% 19% 16% Spring 2008 35% 31% 20% 14%
Fall 2007 41% 31% 20% 8% Spring 2007 38% 37% 13% 12%
Fall 2006 51% 23% 14% 12%

School District of Lancaster, 2011-2012 Student Survey May 21-25, 2012 Marginal Frequency Report – HAMILTON ELEMENTARY N=208
Center for Opinion Research 6 Franklin & Marshall College
Readiness and Emergency Management 16. Has anyone from your school spoken with you about what to do in the event of a school emergency, or not?
Yes No Spring 2012 81% 19% Spring 2011 87% 13%
Do you agree or disagree with the following statement? 17. I know what to do if there is a school emergency.
Really Agree
Kind of Agree
Kind of Disagree
Really Disagree
Spring 2012 76% 17% 2% 5% Spring 2011 83% 12% 4% 2%
Academic Self-efficacy Do you agree or disagree with the following statements? 18. I am a good science student.
Really Agree
Kind of Agree
Kind of Disagree
Really Disagree
Spring 2012 34% 44% 14% 7% Spring 2011 40% 45% 7% 8% Spring 2010 41% 38% 13% 8% Spring 2009 37% 43% 14% 6%
Fall 2008 47% 36% 9% 8% Spring 2008 48% 35% 12% 5%
Fall 2007 56% 29% 12% 3% Spring 2007 41% 44% 10% 5%
Fall 2006 39% 37% 12% 12% 19. Sometimes I think an assignment is easy when the other students think it is hard.
Really Agree
Kind of Agree
Kind of Disagree
Really Disagree
Spring 2012 49% 27% 17% 7% Spring 2011 41% 38% 12% 9% Spring 2010 54% 30% 7% 9% Spring 2009 53% 28% 9% 10%
Fall 2008 51% 27% 9% 14% Spring 2008 48% 31% 14% 7%
Fall 2007 45% 32% 11% 11% Spring 2007 53% 34% 7% 5%
Fall 2006 46% 30% 14% 11%

School District of Lancaster, 2011-2012 Student Survey May 21-25, 2012 Marginal Frequency Report – HAMILTON ELEMENTARY N=208
Center for Opinion Research 7 Franklin & Marshall College
20. I am good social studies student.
Really Agree
Kind of Agree
Kind of Disagree
Really Disagree
Spring 2012 33% 42% 15% 10% Spring 2011 36% 40% 13% 11% Spring 2010 38% 33% 20% 10% Spring 2009 33% 47% 15% 4%
Fall 2008 37% 36% 16% 11% Spring 2008 45% 38% 10% 7%
Fall 2007 42% 34% 15% 9% Spring 2007 40% 34% 20% 6%
Fall 2006 36% 38% 14% 12% 21. My teacher thinks I am smart.
Really Agree
Kind of Agree
Kind of Disagree
Really Disagree
Spring 2012 70% 21% 6% 3% Spring 2011 69% 22% 5% 4% Spring 2010 64% 23% 6% 6% Spring 2009 70% 19% 5% 6%
Fall 2008 66% 19% 8% 7% Spring 2008 75% 19% 3% 3%
Fall 2007 64% 27% 8% 2% Spring 2007 62% 23% 9% 6%
Fall 2006 61% 31% 4% 3% 22. I am a good math student.
Really Agree
Kind of Agree
Kind of Disagree
Really Disagree
Spring 2012 49% 34% 10% 6% Spring 2011 53% 34% 7% 5% Spring 2010 55% 26% 10% 9% Spring 2009 58% 29% 6% 8%
Fall 2008 57% 28% 8% 7% Spring 2008 62% 23% 8% 7%
Fall 2007 52% 29% 9% 10% Spring 2007 54% 31% 8% 7%
Fall 2006 57% 29% 9% 5%

School District of Lancaster, 2011-2012 Student Survey May 21-25, 2012 Marginal Frequency Report – HAMILTON ELEMENTARY N=208
Center for Opinion Research 8 Franklin & Marshall College
23. My classmates usually get better grades than I do.
Really Agree
Kind of Agree
Kind of Disagree
Really Disagree
Spring 2012 16% 32% 28% 24% Spring 2011 21% 28% 34% 17% Spring 2010 22% 28% 33% 18% Spring 2009 18% 38% 29% 14%
Fall 2008 21% 31% 33% 14% Spring 2008 20% 26% 38% 16%
Fall 2007 18% 31% 30% 21% Spring 2007 23% 33% 24% 19%
Fall 2006 19% 37% 24% 20% 24. I usually understand my homework assignments.
Really Agree
Kind of Agree
Kind of Disagree
Really Disagree
Spring 2012 47% 38% 10% 5% Spring 2011 46% 38% 11% 5% Spring 2010 47% 35% 12% 6% Spring 2009 51% 33% 13% 2%
Fall 2008 49% 39% 6% 6% Spring 2008 52% 36% 10% 3%
Fall 2007 52% 35% 6% 7% Spring 2007 55% 30% 8% 7%
Fall 2006 47% 39% 9% 4% 25. I could get the best grades in class if I tried hard enough.
Really Agree
Kind of Agree
Kind of Disagree
Really Disagree
Spring 2012 71% 20% 7% 2% Spring 2011 74% 21% 3% 3% Spring 2010 83% 14% 2% 2% Spring 2009 78% 13% 5% 4%
Fall 2008 68% 19% 7% 6% Spring 2008 71% 19% 7% 3%
Fall 2007 78% 16% 2% 3% Spring 2007 71% 19% 5% 5%
Fall 2006 80% 15% 3% 1%

School District of Lancaster, 2011-2012 Student Survey May 21-25, 2012 Marginal Frequency Report – HAMILTON ELEMENTARY N=208
Center for Opinion Research 9 Franklin & Marshall College
26. I am a good reading student.
Really Agree
Kind of Agree
Kind of Disagree
Really Disagree
Spring 2012 43% 38% 12% 7% Spring 2011 51% 33% 12% 3% Spring 2010 52% 31% 9% 8% Spring 2009 53% 34% 11% 2%
Fall 2008 58% 24% 14% 4% Spring 2008 54% 29% 10% 7%
Fall 2007 62% 25% 9% 4% Spring 2007 54% 29% 9% 8%
Fall 2006 59% 27% 8% 6% 27. It is not hard for me to get good grades in school.
Really Agree
Kind of Agree
Kind of Disagree
Really Disagree
Spring 2012 39% 35% 18% 7% Spring 2011 38% 35% 18% 9% Spring 2010 49% 29% 15% 7% Spring 2009 42% 41% 10% 6%
Fall 2008 36% 46% 7% 11% Spring 2008 41% 36% 15% 8%
Fall 2007 37% 37% 16% 10% Spring 2007 38% 36% 13% 12%
Fall 2006 46% 32% 14% 8% 28. I am smart.
Really Agree
Kind of Agree
Kind of Disagree
Really Disagree
Spring 2012 67% 25% 6% 2% Spring 2011 65% 30% 2% 4% Spring 2010 68% 20% 10% 2% Spring 2009 70% 25% 4% 1%
Fall 2008 66% 20% 9% 6% Spring 2008 70% 24% 3% 3%
Fall 2007 60% 24% 10% 5% Spring 2007 60% 31% 7% 3%
Fall 2006 62% 31% 4% 3%

School District of Lancaster, 2011-2012 Student Survey May 21-25, 2012 Marginal Frequency Report – HAMILTON ELEMENTARY N=208
Center for Opinion Research 10 Franklin & Marshall College
29. When the teacher asks a question I usually know the answer even if the other students don't.
Really Agree
Kind of Agree
Kind of Disagree
Really Disagree
Spring 2012 38% 41% 16% 5% Spring 2011 37% 44% 14% 5% Spring 2010 35% 44% 12% 8% Spring 2009 42% 43% 13% 3%
Fall 2008 42% 32% 18% 8% Spring 2008 41% 38% 15% 6%
Fall 2007 37% 44% 10% 8% Spring 2007 39% 43% 12% 6%
Fall 2006 32% 48% 16% 5% 30. I work hard in school.
Really Agree
Kind of Agree
Kind of Disagree
Really Disagree
Spring 2012 71% 21% 6% 2% Spring 2011 74% 23% 3% 0% Spring 2010 75% 18% 5% 3% Spring 2009 69% 24% 6% 1%
Fall 2008 76% 18% 4% 2% Spring 2008 73% 21% 4% 2%
Fall 2007 74% 19% 4% 2% Spring 2007 73% 20% 3% 4%
Fall 2006 77% 17% 1% 4% 31. Most of my classmates work harder on their homework than I do.
Really Agree
Kind of Agree
Kind of Disagree
Really Disagree
Spring 2012 19% 29% 27% 25% Spring 2011 20% 30% 29% 20% Spring 2010 16% 32% 30% 22% Spring 2009 20% 32% 27% 21%
Fall 2008 22% 22% 29% 27% Spring 2008 17% 23% 40% 21%
Fall 2007 17% 25% 33% 25% Spring 2007 19% 28% 28% 25%
Fall 2006 16% 27% 29% 28%

School District of Lancaster, 2011-2012 Student Survey May 21-25, 2012 Marginal Frequency Report – HAMILTON ELEMENTARY N=208
Center for Opinion Research 11 Franklin & Marshall College
32. I always get good grades when I try hard.
Really Agree
Kind of Agree
Kind of Disagree
Really Disagree
Spring 2012 68% 24% 4% 3% Spring 2011 67% 28% 3% 3% Spring 2010 72% 20% 6% 2% Spring 2009 68% 24% 5% 2%
Fall 2008 69% 26% 1% 4% Spring 2008 69% 25% 4% 2%
Fall 2007 70% 21% 5% 4% Spring 2007 74% 19% 4% 3%
Fall 2006 77% 16% 4% 3% 33. I usually do not get good grades in math because it is too hard.
Really Agree
Kind of Agree
Kind of Disagree
Really Disagree
Spring 2012 13% 22% 19% 46% Spring 2011 17% 15% 20% 47% Spring 2010 14% 19% 20% 47% Spring 2009 12% 20% 15% 54%
Fall 2008 16% 19% 18% 47% Spring 2008 18% 14% 20% 48%
Fall 2007 17% 21% 22% 40% Spring 2007 20% 22% 16% 43%
Fall 2006 14% 19% 22% 45% 34. Most of my classmates like to do math because it is easy.
Really Agree
Kind of Agree
Kind of Disagree
Really Disagree
Spring 2012 46% 31% 12% 11% Spring 2011 40% 30% 21% 9% Spring 2010 46% 29% 16% 9% Spring 2009 48% 32% 14% 6%
Fall 2008 47% 28% 17% 8% Spring 2008 42% 27% 18% 12%
Fall 2007 44% 28% 16% 12% Spring 2007 41% 30% 19% 9%
Fall 2006 43% 28% 15% 14%

School District of Lancaster, 2011-2012 Student Survey May 21-25, 2012 Marginal Frequency Report – HAMILTON ELEMENTARY N=208
Center for Opinion Research 12 Franklin & Marshall College
35. I would get better grades if my teacher liked me more.
Really Agree
Kind of Agree
Kind of Disagree
Really Disagree
Spring 2012 14% 7% 15% 63% Spring 2011 14% 10% 19% 57% Spring 2010 13% 11% 16% 60% Spring 2009 11% 10% 18% 61%
Fall 2008 16% 14% 12% 58% Spring 2008 19% 6% 19% 56%
Fall 2007 21% 14% 14% 50% Spring 2007 16% 9% 12% 62%
Fall 2006 14% 8% 13% 66% 36. I will graduate from high school.
Really Agree
Kind of Agree
Kind of Disagree
Really Disagree
Spring 2012 80% 15% 4% 0% Spring 2011 81% 17% 0% 1% Spring 2010 85% 13% 1% 1% Spring 2009 84% 16% 0% 1%
Fall 2008 81% 16% 1% 1% Spring 2008 84% 12% 2% 1%
Fall 2007 86% 10% 2% 2% Spring 2007 80% 13% 3% 4%
Fall 2006 84% 13% 2% 0% 37. I go to a good school.
Really Agree
Kind of Agree
Kind of Disagree
Really Disagree
Spring 2012 67% 19% 8% 6% Spring 2011 68% 19% 7% 6% Spring 2010 69% 19% 6% 6% Spring 2009 64% 19% 11% 7%
Fall 2008 67% 19% 8% 6% Spring 2008 61% 24% 8% 8%
Fall 2007 69% 20% 7% 4% Spring 2007 68% 20% 7% 5%
Fall 2006 72% 15% 7% 7%

School District of Lancaster, 2011-2012 Student Survey May 21-25, 2012 Marginal Frequency Report – HAMILTON ELEMENTARY N=208
Center for Opinion Research 13 Franklin & Marshall College
38. Adults who have good jobs probably were good students when they were young.
Really Agree
Kind of Agree
Kind of Disagree
Really Disagree
Spring 2012 75% 18% 4% 3% Spring 2011 77% 20% 2% 2% Spring 2010 66% 21% 11% 2% Spring 2009 77% 20% 3% 1%
Fall 2008 73% 19% 5% 2% Spring 2008 71% 19% 8% 2%
Fall 2007 73% 22% 4% 1% Spring 2007 68% 24% 6% 3%
Fall 2006 77% 15% 3% 5% 39. When I am old enough, I will go to college.
Really Agree
Kind of Agree
Kind of Disagree
Really Disagree
Spring 2012 78% 13% 3% 6% Spring 2011 82% 16% 0% 1% Spring 2010 80% 13% 3% 5% Spring 2009 86% 9% 2% 3%
Fall 2008 77% 12% 3% 8% Spring 2008 79% 14% 4% 3%
Fall 2007 81% 11% 4% 4% Spring 2007 77% 12% 4% 7%
Fall 2006 82% 10% 4% 4% 40. No one cares if I do well in school.
Really Agree
Kind of Agree
Kind of Disagree
Really Disagree
Spring 2012 10% 10% 8% 71% Spring 2011 12% 7% 6% 74% Spring 2010 11% 10% 10% 69% Spring 2009 9% 10% 10% 71%
Fall 2008 14% 13% 11% 62% Spring 2008 9% 9% 11% 70%
Fall 2007 13% 13% 12% 61% Spring 2007 12% 14% 7% 66%
Fall 2006 14% 13% 7% 66%

School District of Lancaster, 2011-2012 Student Survey May 21-25, 2012 Marginal Frequency Report – HAMILTON ELEMENTARY N=208
Center for Opinion Research 14 Franklin & Marshall College
41. What I learn in school is not important.
Really Agree
Kind of Agree
Kind of Disagree
Really Disagree
Spring 2012 6% 4% 7% 83% Spring 2011 7% 6% 5% 82% Spring 2010 10% 6% 9% 75% Spring 2009 6% 4% 8% 81%
Fall 2008 13% 6% 7% 74% Spring 2008 8% 3% 12% 77%
Fall 2007 12% 7% 8% 73% Spring 2007 13% 4% 6% 77%
Fall 2006 17% 6% 3% 74% 42. It does not matter if I do well in school.
Really Agree
Kind of Agree
Kind of Disagree
Really Disagree
Spring 2012 10% 7% 6% 77% Spring 2011 8% 5% 7% 80% Spring 2010 8% 5% 6% 81% Spring 2009 6% 5% 8% 81%
Fall 2008 14% 3% 10% 73% Spring 2008 10% 6% 9% 76%
Fall 2007 16% 5% 7% 73% Spring 2007 13% 8% 4% 74%
Fall 2006 19% 5% 7% 70% 43. Students who get better grades than I do get more help from the teacher than I do.
Really Agree
Kind of Agree
Kind of Disagree
Really Disagree
Spring 2012 14% 15% 19% 52% Spring 2011 11% 12% 27% 50% Spring 2010 20% 12% 26% 42% Spring 2009 14% 11% 24% 52%
Fall 2008 19% 11% 24% 47% Spring 2008 16% 9% 22% 52%
Fall 2007 17% 15% 20% 47% Spring 2007 20% 15% 16% 49%
Fall 2006 17% 14% 18% 50%
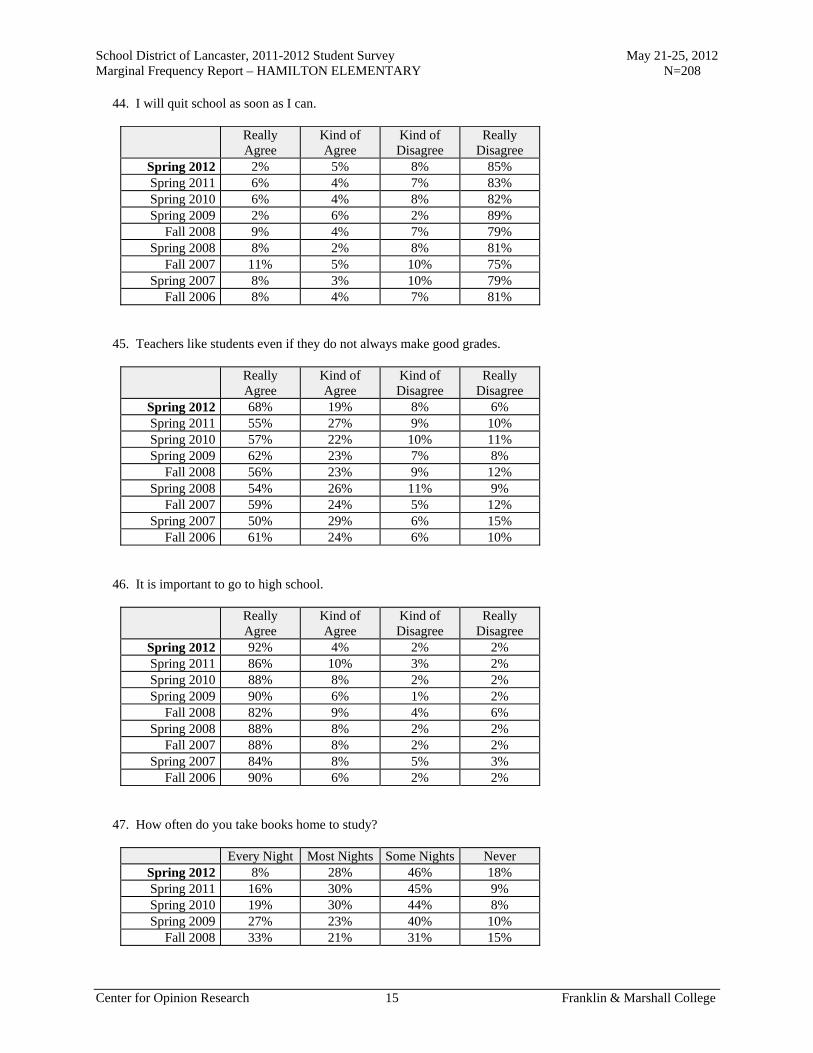
School District of Lancaster, 2011-2012 Student Survey May 21-25, 2012 Marginal Frequency Report – HAMILTON ELEMENTARY N=208
Center for Opinion Research 15 Franklin & Marshall College
44. I will quit school as soon as I can.
Really Agree
Kind of Agree
Kind of Disagree
Really Disagree
Spring 2012 2% 5% 8% 85% Spring 2011 6% 4% 7% 83% Spring 2010 6% 4% 8% 82% Spring 2009 2% 6% 2% 89%
Fall 2008 9% 4% 7% 79% Spring 2008 8% 2% 8% 81%
Fall 2007 11% 5% 10% 75% Spring 2007 8% 3% 10% 79%
Fall 2006 8% 4% 7% 81% 45. Teachers like students even if they do not always make good grades.
Really Agree
Kind of Agree
Kind of Disagree
Really Disagree
Spring 2012 68% 19% 8% 6% Spring 2011 55% 27% 9% 10% Spring 2010 57% 22% 10% 11% Spring 2009 62% 23% 7% 8%
Fall 2008 56% 23% 9% 12% Spring 2008 54% 26% 11% 9%
Fall 2007 59% 24% 5% 12% Spring 2007 50% 29% 6% 15%
Fall 2006 61% 24% 6% 10% 46. It is important to go to high school.
Really Agree
Kind of Agree
Kind of Disagree
Really Disagree
Spring 2012 92% 4% 2% 2% Spring 2011 86% 10% 3% 2% Spring 2010 88% 8% 2% 2% Spring 2009 90% 6% 1% 2%
Fall 2008 82% 9% 4% 6% Spring 2008 88% 8% 2% 2%
Fall 2007 88% 8% 2% 2% Spring 2007 84% 8% 5% 3%
Fall 2006 90% 6% 2% 2% 47. How often do you take books home to study?
Every Night Most Nights Some Nights Never Spring 2012 8% 28% 46% 18% Spring 2011 16% 30% 45% 9% Spring 2010 19% 30% 44% 8% Spring 2009 27% 23% 40% 10%
Fall 2008 33% 21% 31% 15%

School District of Lancaster, 2011-2012 Student Survey May 21-25, 2012 Marginal Frequency Report – HAMILTON ELEMENTARY N=208
Center for Opinion Research 16 Franklin & Marshall College
Academic Aspirations 48. How far in school do you want to go?
Complete
high school
Attend vocational/technical
school
Attend 2-year college
Attend 4-year college
Attend 4-year college plus go to
grad school Spring 2012 18% 7% 15% 19% 41% Spring 2011 16% 4% 12% 29% 38% Spring 2010 14% 2% 14% 24% 45% Spring 2009 10% 3% 11% 25% 51%
Fall 2008 17% 2% 16% 23% 42% Spring 2008 20% 4% 10% 27% 39%
Fall 2007 21% 3% 18% 21% 36% Spring 2007 23% 2% 19% 18% 39%
Fall 2006 16% 2% 21% 23% 38% 49. How important do you believe getting a college education is to your future success? Would you say it is...
Very
important Somewhat important
Not very important
Not important at
all Spring 2012 92% 6% 2% 0% Spring 2011 90% 7% 2% 2% Spring 2010 94% 5% 0% 1% Spring 2009 94% 5% 1% 1%
Fall 2008 89% 7% 2% 3% Spring 2008 87% 10% 2% 0%
Fall 2007 87% 8% 3% 2% Spring 2007 92% 6% 1% 1%
Fall 2006 88% 10% 2% 1% 50. How important would your parent/guardian say getting a college education is to your future success? Would your parents say it is...
Very
important Somewhat important
Not very important
Not important at
all Spring 2012 90% 7% 2% 0% Spring 2011 91% 7% 2% 0% Spring 2010 96% 4% 0% 0% Spring 2009 94% 2% 4% 0%
Fall 2008 89% 7% 2% 3% Spring 2008 89% 7% 2% 2%
Fall 2007 87% 10% 4% 0% Spring 2007 92% 5% 0% 2%
Fall 2006 91% 7% 0% 2%

School District of Lancaster, 2011-2012 Student Survey May 21-25, 2012 Marginal Frequency Report – HAMILTON ELEMENTARY N=208
Center for Opinion Research 17 Franklin & Marshall College
51. How important would your teachers say getting a college education is to your future success? Would your teachers say it is...
Very
important Somewhat important
Not very important
Not important at
all Spring 2012 90% 8% 2% 0% Spring 2011 89% 7% 2% 2% Spring 2010 90% 9% 1% 1% Spring 2009 92% 4% 1% 3%
Fall 2008 89% 7% 2% 3% Spring 2008 91% 8% 1% 1%
Fall 2007 85% 8% 5% 3% Spring 2007 87% 7% 3% 4%
Fall 2006 94% 5% 1% 0% Perceptions of Police Do you agree or disagree with the following statements about police officers? 52. I respect police officers.
Really Agree
Kind of Agree
Kind of Disagree
Really Disagree
Spring 2012 91% 5% 2% 2% Spring 2011 95% 5% 0% 0% Spring 2010 90% 7% 2% 1% Spring 2009 83% 13% 2% 2%
Fall 2008 87% 8% 1% 4% Spring 2008 84% 9% 6% 1%
Fall 2007 81% 11% 4% 4% Spring 2007 83% 9% 2% 6%
Fall 2006 83% 12% 1% 4% 53. I am comfortable approaching police officers.
Really Agree
Kind of Agree
Kind of Disagree
Really Disagree
Spring 2012 59% 24% 7% 10% Spring 2011 56% 31% 9% 4% Spring 2010 62% 25% 6% 7% Spring 2009 58% 22% 10% 10%
Fall 2008 55% 28% 5% 12% Spring 2008 55% 25% 12% 8%
Fall 2007 58% 20% 10% 13% Spring 2007 58% 25% 12% 6%
Fall 2006 60% 22% 9% 10%

School District of Lancaster, 2011-2012 Student Survey May 21-25, 2012 Marginal Frequency Report – HAMILTON ELEMENTARY N=208
Center for Opinion Research 18 Franklin & Marshall College
54. I would consider police work as a career.
Really Agree
Kind of Agree
Kind of Disagree
Really Disagree
Spring 2012 37% 17% 16% 29% Spring 2011 45% 17% 15% 22% Spring 2010 36% 26% 14% 24% Spring 2009 36% 18% 12% 34%
Fall 2008 40% 21% 19% 21% Spring 2008 36% 22% 15% 27%
Fall 2007 44% 24% 10% 21% Spring 2007 48% 25% 9% 18%
Fall 2006 40% 21% 17% 23% 55. In general, I do not trust the police.
Really Agree
Kind of Agree
Kind of Disagree
Really Disagree
Spring 2012 16% 5% 11% 68% Spring 2011 9% 6% 10% 74% Spring 2010 10% 11% 9% 71% Spring 2009 14% 11% 8% 68%
Fall 2008 13% 11% 15% 61% Spring 2008 12% 16% 13% 59%
Fall 2007 19% 12% 14% 55% Spring 2007 16% 9% 10% 65%
Fall 2006 14% 12% 13% 62% 56. Police do not belong in schools unless there has been a crime.
Really Agree
Kind of Agree
Kind of Disagree
Really Disagree
Spring 2012 28% 9% 17% 46% Spring 2011 25% 11% 14% 49% Spring 2010 23% 9% 12% 55% Spring 2009 16% 13% 14% 56%
Fall 2008 18% 11% 14% 57% Spring 2008 21% 14% 24% 41%
Fall 2007 21% 15% 10% 54% Spring 2007 26% 13% 14% 48%
Fall 2006 24% 10% 12% 54%
Report H
Marginal Frequency Report King Elementary School

School District of Lancaster, 2011-2012 Student Survey May 21-25, 2012 Marginal Frequency Report – KING ELEMENTARY N=193
Center for Opinion Research 1 Franklin & Marshall College
School Climate Do you agree or disagree with the following statements? 1. I feel safe at this school.
Really Agree
Kind of Agree
Kind of Disagree
Really Disagree
Spring 2012 54% 34% 8% 4% Spring 2011 55% 34% 7% 4% Spring 2010 57% 30% 9% 3% Spring 2009 56% 34% 7% 3%
Fall 2008 64% 21% 9% 6% Spring 2008 60% 28% 9% 3%
Fall 2007 64% 29% 5% 1% Spring 2007 56% 28% 11% 5%
Fall 2006 58% 31% 7% 4% 2. I feel safe going to and from school.
Really Agree
Kind of Agree
Kind of Disagree
Really Disagree
Spring 2012 54% 27% 12% 7% Spring 2011 60% 28% 7% 5% Spring 2010 60% 23% 9% 8% Spring 2009 51% 31% 12% 6%
Fall 2008 56% 28% 8% 8% Spring 2008 58% 26% 11% 4%
Fall 2007 62% 25% 6% 6% Spring 2007 46% 34% 11% 9%
Fall 2006 49% 33% 11% 6% 3. Students get along well with each other.
Really Agree
Kind of Agree
Kind of Disagree
Really Disagree
Spring 2012 16% 32% 35% 17% Spring 2011 10% 37% 34% 20% Spring 2010 12% 38% 32% 18% Spring 2009 11% 40% 29% 20%
Fall 2008 21% 36% 31% 12% Spring 2008 15% 35% 33% 17%
Fall 2007 20% 43% 28% 8% Spring 2007 13% 28% 33% 27%
Fall 2006 23% 35% 26% 16%

School District of Lancaster, 2011-2012 Student Survey May 21-25, 2012 Marginal Frequency Report – KING ELEMENTARY N=193
Center for Opinion Research 2 Franklin & Marshall College
4. Students get along well with teachers.
Really Agree
Kind of Agree
Kind of Disagree
Really Disagree
Spring 2012 29% 36% 26% 9% Spring 2011 34% 32% 25% 9% Spring 2010 27% 40% 23% 10% Spring 2009 32% 38% 25% 6%
Fall 2008 41% 32% 17% 10% Spring 2008 26% 40% 20% 14%
Fall 2007 45% 32% 20% 3% Spring 2007 24% 37% 28% 10%
Fall 2006 41% 33% 19% 7% 5. I like my school.
Really Agree
Kind of Agree
Kind of Disagree
Really Disagree
Spring 2012 63% 22% 11% 4% Spring 2011 58% 22% 12% 8% Spring 2010 52% 27% 12% 9% Spring 2009 55% 28% 11% 6%
Fall 2008 60% 22% 6% 12% Spring 2008 57% 24% 12% 8%
Fall 2007 67% 20% 8% 5% Spring 2007 48% 29% 10% 13%
Fall 2006 64% 21% 8% 7% 6. I like my teachers.
Really Agree
Kind of Agree
Kind of Disagree
Really Disagree
Spring 2012 71% 17% 9% 3% Spring 2011 73% 20% 4% 2% Spring 2010 73% 16% 10% 2% Spring 2009 65% 27% 5% 3%
Fall 2008 69% 19% 5% 8% Spring 2008 64% 21% 10% 5%
Fall 2007 82% 10% 6% 3% Spring 2007 59% 28% 8% 4%
Fall 2006 73% 18% 7% 3%

School District of Lancaster, 2011-2012 Student Survey May 21-25, 2012 Marginal Frequency Report – KING ELEMENTARY N=193
Center for Opinion Research 3 Franklin & Marshall College
7. There is a teacher or some other adult at this school who really cares about me.
Really Agree
Kind of Agree
Kind of Disagree
Really Disagree
Spring 2012 76% 16% 3% 6% Spring 2011 73% 19% 5% 3% Spring 2010 74% 17% 5% 4% Spring 2009 77% 17% 3% 2%
Fall 2008 71% 15% 4% 9% Spring 2008 70% 18% 5% 7%
Fall 2007 74% 15% 5% 5% Spring 2007 76% 14% 4% 5%
Fall 2006 71% 15% 5% 8% 8. There is a teacher or some other adult at this school who cares when I am not here.
Really Agree
Kind of Agree
Kind of Disagree
Really Disagree
Spring 2012 47% 23% 12% 18% Spring 2011 48% 26% 9% 17% Spring 2010 46% 33% 8% 14% Spring 2009 59% 20% 8% 12%
Fall 2008 54% 22% 10% 14% Spring 2008 48% 24% 11% 18%
Fall 2007 61% 22% 8% 9% Spring 2007 47% 27% 9% 17%
Fall 2006 49% 24% 8% 19% 9. There is a teacher or some other adult at this school who listens to me when I have something to say.
Really Agree
Kind of Agree
Kind of Disagree
Really Disagree
Spring 2012 63% 20% 10% 7% Spring 2011 66% 24% 6% 4% Spring 2010 73% 16% 7% 4% Spring 2009 70% 23% 4% 3%
Fall 2008 68% 22% 4% 6% Spring 2008 61% 27% 8% 4%
Fall 2007 68% 18% 7% 7% Spring 2007 61% 23% 8% 8%
Fall 2006 72% 17% 5% 6%

School District of Lancaster, 2011-2012 Student Survey May 21-25, 2012 Marginal Frequency Report – KING ELEMENTARY N=193
Center for Opinion Research 4 Franklin & Marshall College
10. There is a teacher or some other adult at this school who tells me when I do a good job.
Really Agree
Kind of Agree
Kind of Disagree
Really Disagree
Spring 2012 80% 15% 2% 3% Spring 2011 80% 16% 4% 0% Spring 2010 78% 15% 3% 4% Spring 2009 77% 18% 4% 1%
Fall 2008 78% 13% 5% 4% Spring 2008 78% 16% 4% 3%
Fall 2007 76% 17% 4% 3% Spring 2007 76% 15% 6% 3%
Fall 2006 80% 12% 4% 4% 11. There is a teacher or some other adult at this school who always wants me to do my best.
Really Agree
Kind of Agree
Kind of Disagree
Really Disagree
Spring 2012 86% 11% 1% 2% Spring 2011 90% 7% 1% 2% Spring 2010 88% 8% 3% 1% Spring 2009 86% 12% 2% 0%
Fall 2008 80% 13% 2% 5% Spring 2008 84% 10% 3% 2%
Fall 2007 83% 12% 3% 2% Spring 2007 84% 12% 2% 1%
Fall 2006 90% 6% 3% 2% 12. There is a teacher or some other adult at this school who believes that I will be a success.
Really Agree
Kind of Agree
Kind of Disagree
Really Disagree
Spring 2012 72% 18% 7% 3% Spring 2011 76% 18% 5% 2% Spring 2010 69% 23% 6% 2% Spring 2009 72% 22% 3% 2%
Fall 2008 69% 19% 6% 7% Spring 2008 72% 23% 4% 2%
Fall 2007 74% 16% 4% 5% Spring 2007 71% 20% 4% 5%
Fall 2006 72% 18% 5% 5%

School District of Lancaster, 2011-2012 Student Survey May 21-25, 2012 Marginal Frequency Report – KING ELEMENTARY N=193
Center for Opinion Research 5 Franklin & Marshall College
13. Students in this school really listen to teachers.
Really Agree
Kind of Agree
Kind of Disagree
Really Disagree
Spring 2012 13% 36% 30% 20% Spring 2011 14% 32% 33% 22% Spring 2010 15% 36% 32% 18% Spring 2009 12% 35% 39% 14%
Fall 2008 22% 32% 28% 18% Spring 2008 13% 34% 35% 17%
Fall 2007 20% 40% 28% 12% Spring 2007 15% 26% 31% 28%
Fall 2006 20% 35% 21% 24% 14. Most teachers make learning interesting.
Really Agree
Kind of Agree
Kind of Disagree
Really Disagree
Spring 2012 61% 26% 9% 4% Spring 2011 56% 33% 7% 4% Spring 2010 56% 32% 8% 3% Spring 2009 56% 28% 11% 5%
Fall 2008 60% 26% 10% 4% Spring 2008 55% 32% 9% 3%
Fall 2007 70% 17% 10% 3% Spring 2007 51% 31% 10% 8%
Fall 2006 70% 20% 6% 6% 15. This school is always getting better.
Really Agree
Kind of Agree
Kind of Disagree
Really Disagree
Spring 2012 35% 38% 16% 12% Spring 2011 37% 27% 23% 14% Spring 2010 36% 30% 20% 14% Spring 2009 38% 28% 19% 15%
Fall 2008 44% 20% 18% 18% Spring 2008 41% 29% 25% 5%
Fall 2007 53% 25% 15% 7% Spring 2007 33% 32% 16% 19%
Fall 2006 48% 25% 14% 12%
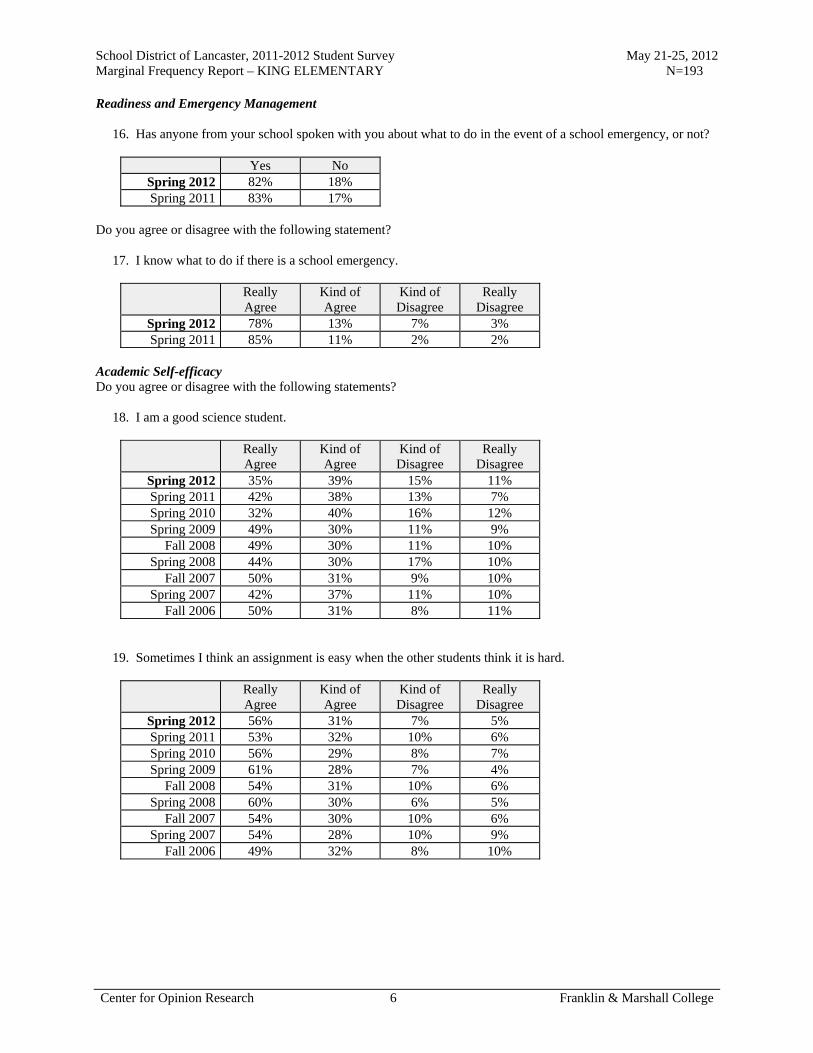
School District of Lancaster, 2011-2012 Student Survey May 21-25, 2012 Marginal Frequency Report – KING ELEMENTARY N=193
Center for Opinion Research 6 Franklin & Marshall College
Readiness and Emergency Management 16. Has anyone from your school spoken with you about what to do in the event of a school emergency, or not?
Yes No Spring 2012 82% 18% Spring 2011 83% 17%
Do you agree or disagree with the following statement? 17. I know what to do if there is a school emergency.
Really Agree
Kind of Agree
Kind of Disagree
Really Disagree
Spring 2012 78% 13% 7% 3% Spring 2011 85% 11% 2% 2%
Academic Self-efficacy Do you agree or disagree with the following statements? 18. I am a good science student.
Really Agree
Kind of Agree
Kind of Disagree
Really Disagree
Spring 2012 35% 39% 15% 11% Spring 2011 42% 38% 13% 7% Spring 2010 32% 40% 16% 12% Spring 2009 49% 30% 11% 9%
Fall 2008 49% 30% 11% 10% Spring 2008 44% 30% 17% 10%
Fall 2007 50% 31% 9% 10% Spring 2007 42% 37% 11% 10%
Fall 2006 50% 31% 8% 11% 19. Sometimes I think an assignment is easy when the other students think it is hard.
Really Agree
Kind of Agree
Kind of Disagree
Really Disagree
Spring 2012 56% 31% 7% 5% Spring 2011 53% 32% 10% 6% Spring 2010 56% 29% 8% 7% Spring 2009 61% 28% 7% 4%
Fall 2008 54% 31% 10% 6% Spring 2008 60% 30% 6% 5%
Fall 2007 54% 30% 10% 6% Spring 2007 54% 28% 10% 9%
Fall 2006 49% 32% 8% 10%

School District of Lancaster, 2011-2012 Student Survey May 21-25, 2012 Marginal Frequency Report – KING ELEMENTARY N=193
Center for Opinion Research 7 Franklin & Marshall College
20. I am good social studies student.
Really Agree
Kind of Agree
Kind of Disagree
Really Disagree
Spring 2012 39% 37% 15% 10% Spring 2011 52% 28% 14% 6% Spring 2010 42% 38% 13% 7% Spring 2009 47% 37% 11% 5%
Fall 2008 53% 27% 10% 10% Spring 2008 42% 38% 14% 7%
Fall 2007 53% 33% 9% 5% Spring 2007 36% 40% 15% 9%
Fall 2006 47% 33% 12% 8% 21. My teacher thinks I am smart.
Really Agree
Kind of Agree
Kind of Disagree
Really Disagree
Spring 2012 72% 17% 4% 7% Spring 2011 73% 19% 5% 3% Spring 2010 75% 17% 4% 4% Spring 2009 74% 20% 4% 1%
Fall 2008 74% 14% 6% 6% Spring 2008 68% 23% 8% 1%
Fall 2007 72% 19% 5% 4% Spring 2007 68% 22% 6% 4%
Fall 2006 70% 19% 6% 5% 22. I am a good math student.
Really Agree
Kind of Agree
Kind of Disagree
Really Disagree
Spring 2012 63% 23% 7% 7% Spring 2011 65% 23% 8% 4% Spring 2010 63% 28% 6% 4% Spring 2009 65% 26% 6% 3%
Fall 2008 68% 21% 5% 7% Spring 2008 64% 21% 11% 4%
Fall 2007 62% 25% 8% 6% Spring 2007 56% 27% 8% 8%
Fall 2006 55% 25% 10% 10%

School District of Lancaster, 2011-2012 Student Survey May 21-25, 2012 Marginal Frequency Report – KING ELEMENTARY N=193
Center for Opinion Research 8 Franklin & Marshall College
23. My classmates usually get better grades than I do.
Really Agree
Kind of Agree
Kind of Disagree
Really Disagree
Spring 2012 24% 30% 23% 24% Spring 2011 18% 31% 25% 26% Spring 2010 17% 26% 31% 26% Spring 2009 20% 26% 30% 25%
Fall 2008 19% 27% 26% 28% Spring 2008 18% 34% 28% 20%
Fall 2007 23% 33% 26% 18% Spring 2007 23% 30% 25% 23%
Fall 2006 23% 27% 23% 27% 24. I usually understand my homework assignments.
Really Agree
Kind of Agree
Kind of Disagree
Really Disagree
Spring 2012 55% 28% 13% 4% Spring 2011 52% 34% 11% 2% Spring 2010 55% 32% 10% 3% Spring 2009 59% 31% 6% 4%
Fall 2008 56% 29% 9% 6% Spring 2008 56% 32% 8% 4%
Fall 2007 58% 30% 8% 4% Spring 2007 43% 35% 15% 7%
Fall 2006 43% 37% 9% 11% 25. I could get the best grades in class if I tried hard enough.
Really Agree
Kind of Agree
Kind of Disagree
Really Disagree
Spring 2012 79% 12% 7% 2% Spring 2011 76% 16% 1% 6% Spring 2010 84% 12% 2% 2% Spring 2009 79% 17% 1% 2%
Fall 2008 75% 16% 5% 4% Spring 2008 75% 19% 5% 2%
Fall 2007 76% 18% 4% 3% Spring 2007 74% 17% 5% 4%
Fall 2006 77% 15% 6% 3%
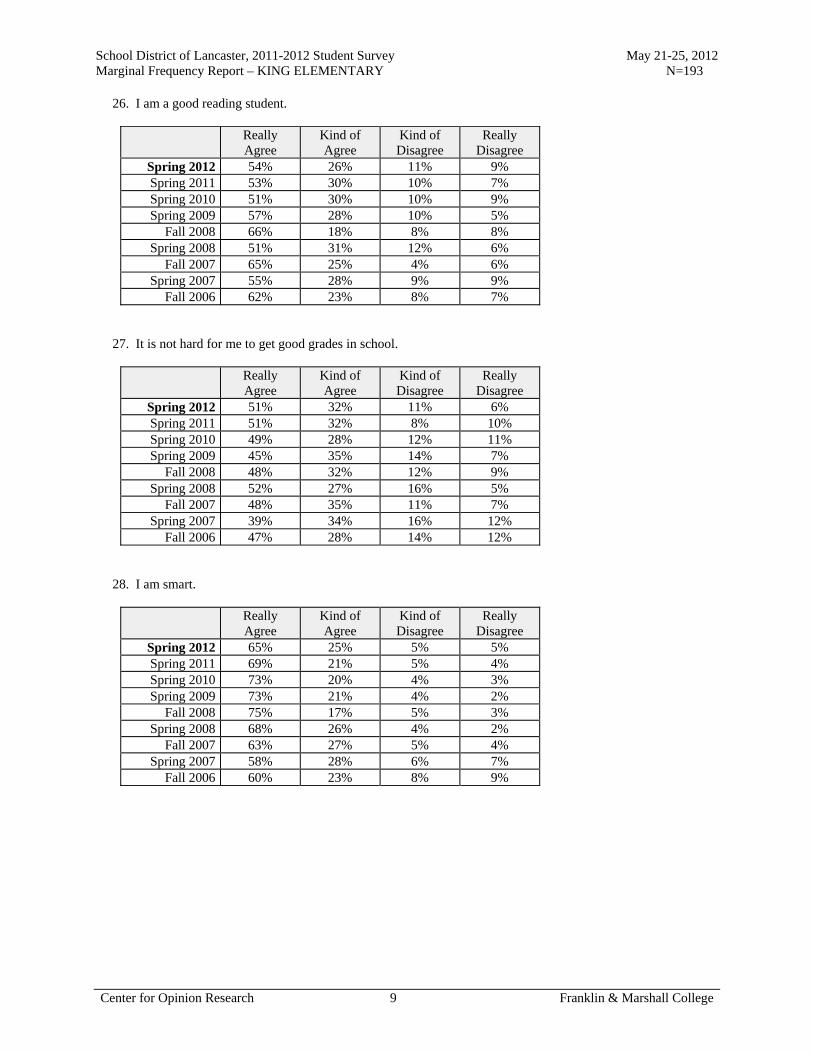
School District of Lancaster, 2011-2012 Student Survey May 21-25, 2012 Marginal Frequency Report – KING ELEMENTARY N=193
Center for Opinion Research 9 Franklin & Marshall College
26. I am a good reading student.
Really Agree
Kind of Agree
Kind of Disagree
Really Disagree
Spring 2012 54% 26% 11% 9% Spring 2011 53% 30% 10% 7% Spring 2010 51% 30% 10% 9% Spring 2009 57% 28% 10% 5%
Fall 2008 66% 18% 8% 8% Spring 2008 51% 31% 12% 6%
Fall 2007 65% 25% 4% 6% Spring 2007 55% 28% 9% 9%
Fall 2006 62% 23% 8% 7% 27. It is not hard for me to get good grades in school.
Really Agree
Kind of Agree
Kind of Disagree
Really Disagree
Spring 2012 51% 32% 11% 6% Spring 2011 51% 32% 8% 10% Spring 2010 49% 28% 12% 11% Spring 2009 45% 35% 14% 7%
Fall 2008 48% 32% 12% 9% Spring 2008 52% 27% 16% 5%
Fall 2007 48% 35% 11% 7% Spring 2007 39% 34% 16% 12%
Fall 2006 47% 28% 14% 12% 28. I am smart.
Really Agree
Kind of Agree
Kind of Disagree
Really Disagree
Spring 2012 65% 25% 5% 5% Spring 2011 69% 21% 5% 4% Spring 2010 73% 20% 4% 3% Spring 2009 73% 21% 4% 2%
Fall 2008 75% 17% 5% 3% Spring 2008 68% 26% 4% 2%
Fall 2007 63% 27% 5% 4% Spring 2007 58% 28% 6% 7%
Fall 2006 60% 23% 8% 9%

School District of Lancaster, 2011-2012 Student Survey May 21-25, 2012 Marginal Frequency Report – KING ELEMENTARY N=193
Center for Opinion Research 10 Franklin & Marshall College
29. When the teacher asks a question I usually know the answer even if the other students don't.
Really Agree
Kind of Agree
Kind of Disagree
Really Disagree
Spring 2012 39% 43% 12% 6% Spring 2011 36% 46% 11% 7% Spring 2010 42% 42% 11% 6% Spring 2009 47% 37% 12% 4%
Fall 2008 47% 36% 12% 6% Spring 2008 41% 42% 13% 4%
Fall 2007 40% 42% 14% 4% Spring 2007 36% 42% 13% 8%
Fall 2006 48% 31% 8% 13% 30. I work hard in school.
Really Agree
Kind of Agree
Kind of Disagree
Really Disagree
Spring 2012 67% 23% 5% 4% Spring 2011 77% 17% 5% 1% Spring 2010 74% 21% 3% 1% Spring 2009 69% 27% 2% 2%
Fall 2008 79% 13% 4% 4% Spring 2008 70% 24% 6% 0%
Fall 2007 76% 18% 4% 2% Spring 2007 68% 24% 6% 3%
Fall 2006 78% 17% 2% 3% 31. Most of my classmates work harder on their homework than I do.
Really Agree
Kind of Agree
Kind of Disagree
Really Disagree
Spring 2012 24% 34% 24% 18% Spring 2011 16% 24% 31% 28% Spring 2010 15% 31% 24% 30% Spring 2009 16% 28% 26% 30%
Fall 2008 18% 26% 26% 30% Spring 2008 20% 23% 29% 28%
Fall 2007 25% 31% 22% 21% Spring 2007 23% 34% 21% 22%
Fall 2006 31% 27% 20% 22%

School District of Lancaster, 2011-2012 Student Survey May 21-25, 2012 Marginal Frequency Report – KING ELEMENTARY N=193
Center for Opinion Research 11 Franklin & Marshall College
32. I always get good grades when I try hard.
Really Agree
Kind of Agree
Kind of Disagree
Really Disagree
Spring 2012 75% 14% 6% 5% Spring 2011 77% 15% 6% 2% Spring 2010 81% 13% 4% 2% Spring 2009 83% 14% 2% 0%
Fall 2008 80% 11% 4% 4% Spring 2008 74% 20% 4% 1%
Fall 2007 74% 18% 4% 5% Spring 2007 70% 22% 3% 5%
Fall 2006 69% 18% 7% 5% 33. I usually do not get good grades in math because it is too hard.
Really Agree
Kind of Agree
Kind of Disagree
Really Disagree
Spring 2012 16% 19% 15% 50% Spring 2011 13% 20% 15% 51% Spring 2010 10% 19% 15% 56% Spring 2009 10% 15% 13% 62%
Fall 2008 15% 19% 19% 47% Spring 2008 10% 19% 20% 51%
Fall 2007 21% 25% 15% 39% Spring 2007 17% 22% 18% 43%
Fall 2006 27% 23% 13% 37% 34. Most of my classmates like to do math because it is easy.
Really Agree
Kind of Agree
Kind of Disagree
Really Disagree
Spring 2012 48% 30% 14% 8% Spring 2011 57% 25% 12% 6% Spring 2010 61% 21% 13% 5% Spring 2009 55% 31% 8% 6%
Fall 2008 56% 24% 11% 9% Spring 2008 54% 24% 16% 5%
Fall 2007 56% 22% 13% 8% Spring 2007 47% 28% 15% 10%
Fall 2006 50% 20% 17% 13%

School District of Lancaster, 2011-2012 Student Survey May 21-25, 2012 Marginal Frequency Report – KING ELEMENTARY N=193
Center for Opinion Research 12 Franklin & Marshall College
35. I would get better grades if my teacher liked me more.
Really Agree
Kind of Agree
Kind of Disagree
Really Disagree
Spring 2012 17% 14% 14% 55% Spring 2011 18% 13% 13% 55% Spring 2010 18% 11% 12% 59% Spring 2009 9% 12% 10% 69%
Fall 2008 22% 11% 12% 54% Spring 2008 20% 6% 19% 55%
Fall 2007 21% 11% 10% 57% Spring 2007 19% 14% 16% 51%
Fall 2006 28% 11% 14% 48% 36. I will graduate from high school.
Really Agree
Kind of Agree
Kind of Disagree
Really Disagree
Spring 2012 86% 8% 2% 4% Spring 2011 83% 12% 2% 2% Spring 2010 86% 12% 1% 1% Spring 2009 87% 10% 1% 2%
Fall 2008 81% 14% 2% 3% Spring 2008 83% 11% 4% 2%
Fall 2007 85% 12% 1% 2% Spring 2007 73% 20% 4% 3%
Fall 2006 74% 15% 6% 5% 37. I go to a good school.
Really Agree
Kind of Agree
Kind of Disagree
Really Disagree
Spring 2012 68% 22% 5% 5% Spring 2011 63% 25% 7% 5% Spring 2010 58% 24% 11% 7% Spring 2009 57% 27% 9% 7%
Fall 2008 68% 17% 7% 8% Spring 2008 60% 26% 9% 4%
Fall 2007 71% 18% 6% 5% Spring 2007 53% 29% 9% 9%
Fall 2006 64% 18% 9% 10%

School District of Lancaster, 2011-2012 Student Survey May 21-25, 2012 Marginal Frequency Report – KING ELEMENTARY N=193
Center for Opinion Research 13 Franklin & Marshall College
38. Adults who have good jobs probably were good students when they were young.
Really Agree
Kind of Agree
Kind of Disagree
Really Disagree
Spring 2012 74% 18% 6% 3% Spring 2011 73% 21% 4% 2% Spring 2010 75% 19% 4% 2% Spring 2009 72% 20% 6% 2%
Fall 2008 72% 17% 5% 6% Spring 2008 66% 23% 6% 5%
Fall 2007 70% 20% 5% 5% Spring 2007 68% 21% 7% 4%
Fall 2006 73% 18% 4% 5% 39. When I am old enough, I will go to college.
Really Agree
Kind of Agree
Kind of Disagree
Really Disagree
Spring 2012 79% 12% 5% 4% Spring 2011 84% 10% 1% 5% Spring 2010 80% 10% 6% 5% Spring 2009 85% 10% 1% 4%
Fall 2008 79% 10% 5% 6% Spring 2008 76% 14% 3% 7%
Fall 2007 75% 15% 2% 8% Spring 2007 76% 15% 4% 5%
Fall 2006 76% 13% 6% 5% 40. No one cares if I do well in school.
Really Agree
Kind of Agree
Kind of Disagree
Really Disagree
Spring 2012 16% 8% 12% 64% Spring 2011 12% 10% 17% 61% Spring 2010 12% 10% 11% 67% Spring 2009 6% 5% 9% 80%
Fall 2008 17% 8% 11% 65% Spring 2008 11% 4% 10% 75%
Fall 2007 23% 7% 8% 62% Spring 2007 19% 10% 11% 59%
Fall 2006 22% 10% 8% 59%

School District of Lancaster, 2011-2012 Student Survey May 21-25, 2012 Marginal Frequency Report – KING ELEMENTARY N=193
Center for Opinion Research 14 Franklin & Marshall College
41. What I learn in school is not important.
Really Agree
Kind of Agree
Kind of Disagree
Really Disagree
Spring 2012 11% 5% 10% 74% Spring 2011 9% 8% 6% 77% Spring 2010 10% 1% 4% 85% Spring 2009 8% 2% 8% 82%
Fall 2008 11% 5% 8% 76% Spring 2008 9% 4% 9% 78%
Fall 2007 19% 6% 4% 70% Spring 2007 9% 6% 5% 81%
Fall 2006 19% 5% 4% 72% 42. It does not matter if I do well in school.
Really Agree
Kind of Agree
Kind of Disagree
Really Disagree
Spring 2012 14% 3% 9% 74% Spring 2011 10% 4% 12% 74% Spring 2010 9% 6% 8% 76% Spring 2009 7% 3% 6% 84%
Fall 2008 16% 6% 9% 69% Spring 2008 8% 4% 8% 80%
Fall 2007 19% 6% 7% 69% Spring 2007 17% 3% 8% 72%
Fall 2006 21% 5% 7% 66% 43. Students who get better grades than I do get more help from the teacher than I do.
Really Agree
Kind of Agree
Kind of Disagree
Really Disagree
Spring 2012 20% 13% 20% 48% Spring 2011 18% 10% 16% 56% Spring 2010 13% 12% 12% 64% Spring 2009 12% 8% 18% 62%
Fall 2008 19% 9% 18% 55% Spring 2008 13% 11% 19% 57%
Fall 2007 21% 10% 17% 52% Spring 2007 22% 12% 15% 52%
Fall 2006 26% 10% 12% 52%

School District of Lancaster, 2011-2012 Student Survey May 21-25, 2012 Marginal Frequency Report – KING ELEMENTARY N=193
Center for Opinion Research 15 Franklin & Marshall College
44. I will quit school as soon as I can.
Really Agree
Kind of Agree
Kind of Disagree
Really Disagree
Spring 2012 9% 6% 7% 77% Spring 2011 6% 5% 7% 82% Spring 2010 7% 5% 5% 83% Spring 2009 5% 2% 6% 86%
Fall 2008 8% 5% 6% 81% Spring 2008 8% 4% 7% 82%
Fall 2007 13% 2% 4% 82% Spring 2007 10% 3% 6% 81%
Fall 2006 13% 8% 8% 71% 45. Teachers like students even if they do not always make good grades.
Really Agree
Kind of Agree
Kind of Disagree
Really Disagree
Spring 2012 67% 18% 6% 8% Spring 2011 65% 22% 8% 6% Spring 2010 67% 20% 4% 8% Spring 2009 74% 12% 5% 8%
Fall 2008 71% 15% 6% 8% Spring 2008 70% 16% 7% 7%
Fall 2007 72% 14% 3% 12% Spring 2007 61% 21% 7% 11%
Fall 2006 72% 12% 5% 10% 46. It is important to go to high school.
Really Agree
Kind of Agree
Kind of Disagree
Really Disagree
Spring 2012 89% 7% 2% 3% Spring 2011 90% 7% 1% 2% Spring 2010 89% 5% 1% 5% Spring 2009 93% 5% 1% 1%
Fall 2008 84% 7% 2% 7% Spring 2008 88% 8% 2% 1%
Fall 2007 91% 5% 1% 3% Spring 2007 86% 8% 1% 4%
Fall 2006 85% 8% 2% 5% 47. How often do you take books home to study?
Every Night Most Nights Some Nights Never Spring 2012 23% 18% 37% 22% Spring 2011 17% 20% 38% 25% Spring 2010 26% 19% 36% 19% Spring 2009 29% 20% 36% 14%
Fall 2008 47% 12% 26% 14%

School District of Lancaster, 2011-2012 Student Survey May 21-25, 2012 Marginal Frequency Report – KING ELEMENTARY N=193
Center for Opinion Research 16 Franklin & Marshall College
Academic Aspirations 48. How far in school do you want to go?
Complete
high school
Attend vocational/technical
school
Attend 2-year college
Attend 4-year college
Attend 4-year college plus go to
grad school Spring 2012 27% 3% 17% 15% 38% Spring 2011 20% 3% 13% 24% 40% Spring 2010 20% 4% 16% 25% 35% Spring 2009 20% 5% 15% 20% 40%
Fall 2008 28% 4% 6% 16% 45% Spring 2008 18% 10% 20% 18% 34%
Fall 2007 29% 4% 13% 19% 36% Spring 2007 24% 6% 14% 20% 36%
Fall 2006 28% 8% 10% 20% 35% 49. How important do you believe getting a college education is to your future success? Would you say it is...
Very
important Somewhat important
Not very important
Not important at
all Spring 2012 93% 5% 1% 1% Spring 2011 88% 7% 3% 2% Spring 2010 92% 5% 1% 2% Spring 2009 95% 2% 1% 1%
Fall 2008 90% 6% 3% 2% Spring 2008 91% 8% 1% 0%
Fall 2007 91% 6% 2% 1% Spring 2007 90% 6% 2% 2%
Fall 2006 86% 7% 4% 3% 50. How important would your parent/guardian say getting a college education is to your future success? Would your parents say it is...
Very
important Somewhat important
Not very important
Not important at
all Spring 2012 92% 5% 3% 0% Spring 2011 93% 5% 0% 2% Spring 2010 92% 6% 0% 1% Spring 2009 96% 3% 1% 0%
Fall 2008 92% 6% 1% 2% Spring 2008 93% 5% 1% 0%
Fall 2007 88% 9% 1% 1% Spring 2007 91% 6% 3% 1%
Fall 2006 86% 9% 1% 3%

School District of Lancaster, 2011-2012 Student Survey May 21-25, 2012 Marginal Frequency Report – KING ELEMENTARY N=193
Center for Opinion Research 17 Franklin & Marshall College
51. How important would your teachers say getting a college education is to your future success? Would your teachers say it is...
Very
important Somewhat important
Not very important
Not important at
all Spring 2012 94% 5% 0% 1% Spring 2011 93% 4% 1% 2% Spring 2010 94% 4% 1% 1% Spring 2009 96% 2% 1% 0%
Fall 2008 93% 4% 1% 1% Spring 2008 94% 4% 1% 1%
Fall 2007 88% 7% 2% 3% Spring 2007 92% 5% 1% 1%
Fall 2006 86% 8% 3% 4% Perceptions of Police Do you agree or disagree with the following statements about police officers? 52. I respect police officers.
Really Agree
Kind of Agree
Kind of Disagree
Really Disagree
Spring 2012 92% 6% 0% 2% Spring 2011 88% 6% 3% 3% Spring 2010 86% 9% 3% 2% Spring 2009 89% 7% 3% 2%
Fall 2008 83% 7% 3% 7% Spring 2008 78% 13% 4% 5%
Fall 2007 87% 4% 5% 4% Spring 2007 77% 14% 6% 3%
Fall 2006 76% 7% 7% 10% 53. I am comfortable approaching police officers.
Really Agree
Kind of Agree
Kind of Disagree
Really Disagree
Spring 2012 68% 21% 6% 5% Spring 2011 63% 20% 8% 9% Spring 2010 62% 23% 7% 7% Spring 2009 59% 24% 9% 8%
Fall 2008 65% 17% 7% 10% Spring 2008 55% 24% 12% 9%
Fall 2007 66% 19% 6% 9% Spring 2007 56% 21% 8% 15%
Fall 2006 60% 21% 7% 12%
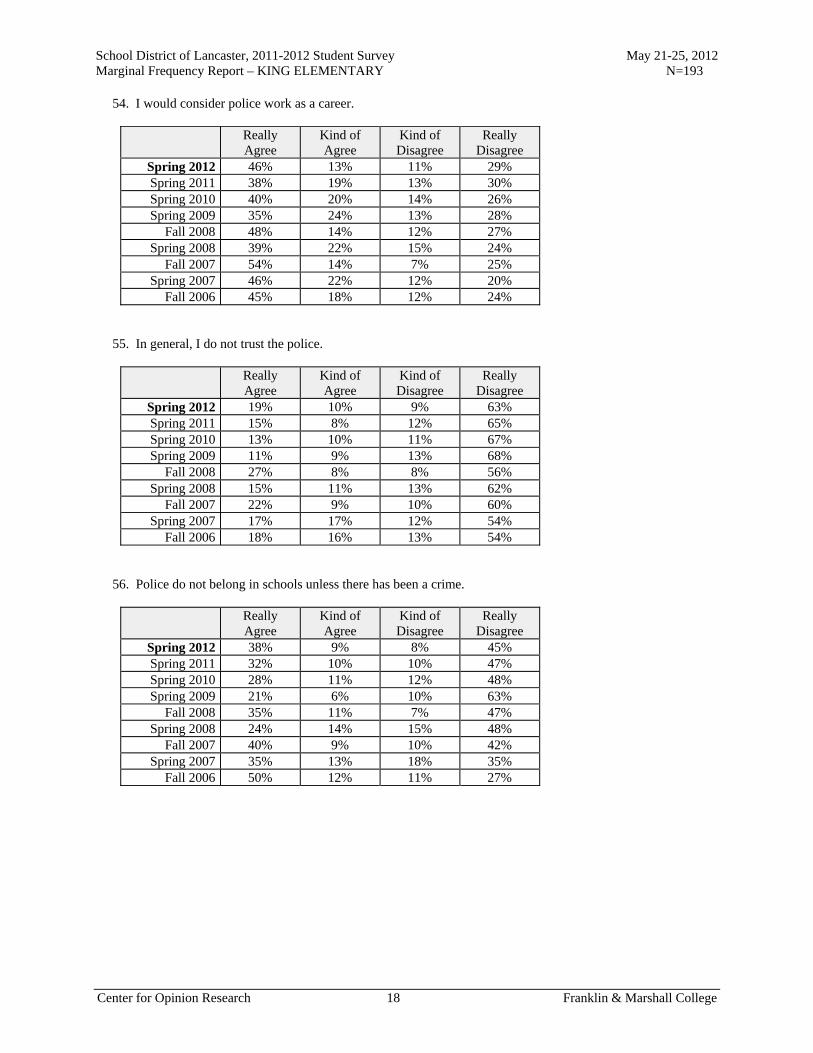
School District of Lancaster, 2011-2012 Student Survey May 21-25, 2012 Marginal Frequency Report – KING ELEMENTARY N=193
Center for Opinion Research 18 Franklin & Marshall College
54. I would consider police work as a career.
Really Agree
Kind of Agree
Kind of Disagree
Really Disagree
Spring 2012 46% 13% 11% 29% Spring 2011 38% 19% 13% 30% Spring 2010 40% 20% 14% 26% Spring 2009 35% 24% 13% 28%
Fall 2008 48% 14% 12% 27% Spring 2008 39% 22% 15% 24%
Fall 2007 54% 14% 7% 25% Spring 2007 46% 22% 12% 20%
Fall 2006 45% 18% 12% 24% 55. In general, I do not trust the police.
Really Agree
Kind of Agree
Kind of Disagree
Really Disagree
Spring 2012 19% 10% 9% 63% Spring 2011 15% 8% 12% 65% Spring 2010 13% 10% 11% 67% Spring 2009 11% 9% 13% 68%
Fall 2008 27% 8% 8% 56% Spring 2008 15% 11% 13% 62%
Fall 2007 22% 9% 10% 60% Spring 2007 17% 17% 12% 54%
Fall 2006 18% 16% 13% 54% 56. Police do not belong in schools unless there has been a crime.
Really Agree
Kind of Agree
Kind of Disagree
Really Disagree
Spring 2012 38% 9% 8% 45% Spring 2011 32% 10% 10% 47% Spring 2010 28% 11% 12% 48% Spring 2009 21% 6% 10% 63%
Fall 2008 35% 11% 7% 47% Spring 2008 24% 14% 15% 48%
Fall 2007 40% 9% 10% 42% Spring 2007 35% 13% 18% 35%
Fall 2006 50% 12% 11% 27%

Report I
Marginal Frequency Report Lafayette Elementary School
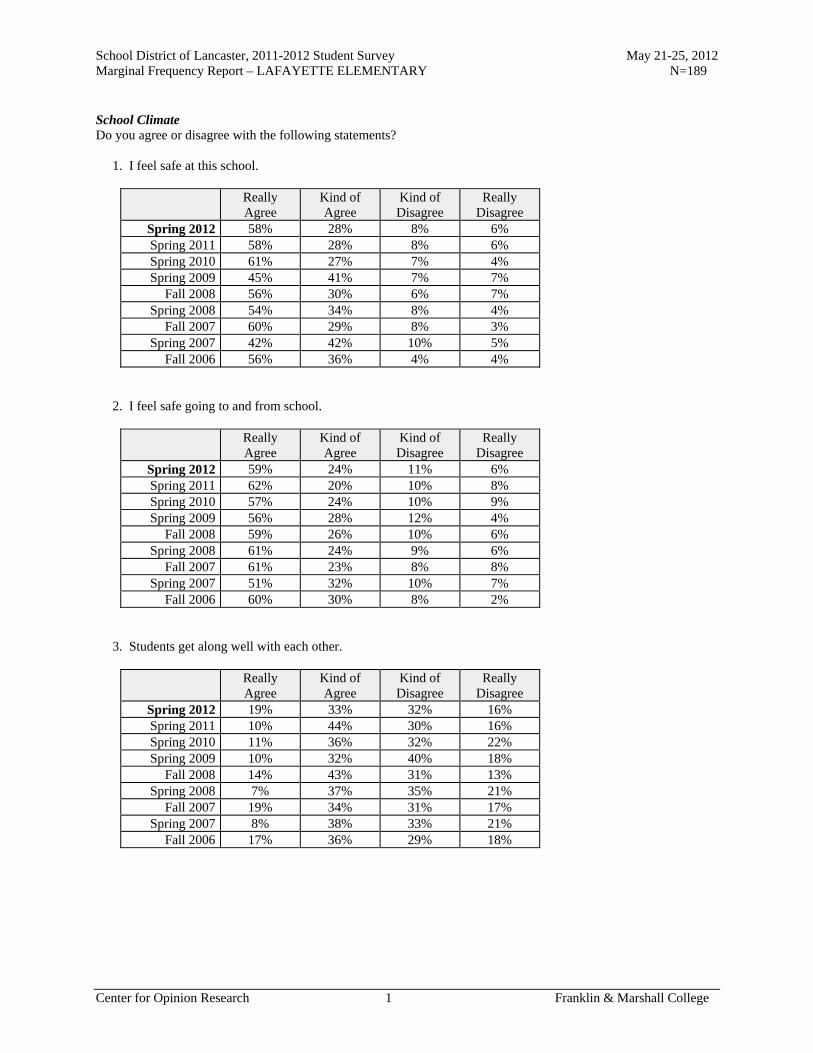
School District of Lancaster, 2011-2012 Student Survey May 21-25, 2012 Marginal Frequency Report – LAFAYETTE ELEMENTARY N=189
Center for Opinion Research 1 Franklin & Marshall College
School Climate Do you agree or disagree with the following statements? 1. I feel safe at this school.
Really Agree
Kind of Agree
Kind of Disagree
Really Disagree
Spring 2012 58% 28% 8% 6% Spring 2011 58% 28% 8% 6% Spring 2010 61% 27% 7% 4% Spring 2009 45% 41% 7% 7%
Fall 2008 56% 30% 6% 7% Spring 2008 54% 34% 8% 4%
Fall 2007 60% 29% 8% 3% Spring 2007 42% 42% 10% 5%
Fall 2006 56% 36% 4% 4% 2. I feel safe going to and from school.
Really Agree
Kind of Agree
Kind of Disagree
Really Disagree
Spring 2012 59% 24% 11% 6% Spring 2011 62% 20% 10% 8% Spring 2010 57% 24% 10% 9% Spring 2009 56% 28% 12% 4%
Fall 2008 59% 26% 10% 6% Spring 2008 61% 24% 9% 6%
Fall 2007 61% 23% 8% 8% Spring 2007 51% 32% 10% 7%
Fall 2006 60% 30% 8% 2% 3. Students get along well with each other.
Really Agree
Kind of Agree
Kind of Disagree
Really Disagree
Spring 2012 19% 33% 32% 16% Spring 2011 10% 44% 30% 16% Spring 2010 11% 36% 32% 22% Spring 2009 10% 32% 40% 18%
Fall 2008 14% 43% 31% 13% Spring 2008 7% 37% 35% 21%
Fall 2007 19% 34% 31% 17% Spring 2007 8% 38% 33% 21%
Fall 2006 17% 36% 29% 18%

School District of Lancaster, 2011-2012 Student Survey May 21-25, 2012 Marginal Frequency Report – LAFAYETTE ELEMENTARY N=189
Center for Opinion Research 2 Franklin & Marshall College
4. Students get along well with teachers.
Really Agree
Kind of Agree
Kind of Disagree
Really Disagree
Spring 2012 32% 33% 25% 11% Spring 2011 30% 46% 18% 6% Spring 2010 34% 43% 16% 8% Spring 2009 22% 50% 21% 7%
Fall 2008 32% 41% 20% 7% Spring 2008 19% 44% 26% 11%
Fall 2007 40% 39% 12% 9% Spring 2007 21% 45% 26% 8%
Fall 2006 38% 39% 14% 10% 5. I like my school.
Really Agree
Kind of Agree
Kind of Disagree
Really Disagree
Spring 2012 48% 32% 9% 11% Spring 2011 56% 22% 11% 11% Spring 2010 51% 24% 12% 13% Spring 2009 54% 24% 10% 13%
Fall 2008 54% 23% 14% 10% Spring 2008 44% 32% 10% 13%
Fall 2007 60% 28% 6% 7% Spring 2007 37% 30% 16% 17%
Fall 2006 66% 24% 6% 4% 6. I like my teachers.
Really Agree
Kind of Agree
Kind of Disagree
Really Disagree
Spring 2012 62% 23% 10% 6% Spring 2011 67% 21% 7% 5% Spring 2010 74% 14% 8% 3% Spring 2009 60% 25% 9% 6%
Fall 2008 71% 19% 5% 5% Spring 2008 60% 25% 11% 4%
Fall 2007 79% 15% 4% 2% Spring 2007 60% 24% 10% 6%
Fall 2006 80% 14% 3% 2%

School District of Lancaster, 2011-2012 Student Survey May 21-25, 2012 Marginal Frequency Report – LAFAYETTE ELEMENTARY N=189
Center for Opinion Research 3 Franklin & Marshall College
7. There is a teacher or some other adult at this school who really cares about me.
Really Agree
Kind of Agree
Kind of Disagree
Really Disagree
Spring 2012 58% 22% 11% 10% Spring 2011 70% 17% 6% 7% Spring 2010 71% 17% 7% 5% Spring 2009 72% 14% 8% 6%
Fall 2008 70% 16% 8% 6% Spring 2008 65% 26% 6% 4%
Fall 2007 68% 22% 4% 7% Spring 2007 63% 21% 8% 8%
Fall 2006 82% 14% 1% 3% 8. There is a teacher or some other adult at this school who cares when I am not here.
Really Agree
Kind of Agree
Kind of Disagree
Really Disagree
Spring 2012 34% 30% 17% 19% Spring 2011 46% 30% 9% 15% Spring 2010 43% 29% 12% 15% Spring 2009 48% 22% 11% 19%
Fall 2008 56% 18% 8% 18% Spring 2008 48% 25% 11% 16%
Fall 2007 62% 23% 3% 12% Spring 2007 47% 21% 12% 20%
Fall 2006 59% 20% 9% 12% 9. There is a teacher or some other adult at this school who listens to me when I have something to say.
Really Agree
Kind of Agree
Kind of Disagree
Really Disagree
Spring 2012 62% 22% 10% 7% Spring 2011 68% 20% 6% 7% Spring 2010 67% 17% 6% 10% Spring 2009 60% 24% 9% 6%
Fall 2008 70% 20% 8% 3% Spring 2008 67% 19% 9% 6%
Fall 2007 72% 17% 5% 6% Spring 2007 60% 23% 7% 10%
Fall 2006 78% 15% 5% 2%

School District of Lancaster, 2011-2012 Student Survey May 21-25, 2012 Marginal Frequency Report – LAFAYETTE ELEMENTARY N=189
Center for Opinion Research 4 Franklin & Marshall College
10. There is a teacher or some other adult at this school who tells me when I do a good job.
Really Agree
Kind of Agree
Kind of Disagree
Really Disagree
Spring 2012 68% 23% 5% 4% Spring 2011 72% 20% 5% 3% Spring 2010 72% 20% 5% 3% Spring 2009 68% 22% 7% 3%
Fall 2008 74% 20% 5% 2% Spring 2008 68% 22% 8% 2%
Fall 2007 77% 17% 2% 4% Spring 2007 68% 23% 4% 5%
Fall 2006 79% 18% 2% 2% 11. There is a teacher or some other adult at this school who always wants me to do my best.
Really Agree
Kind of Agree
Kind of Disagree
Really Disagree
Spring 2012 80% 14% 3% 3% Spring 2011 91% 6% 2% 2% Spring 2010 87% 9% 2% 2% Spring 2009 82% 15% 1% 2%
Fall 2008 86% 10% 3% 1% Spring 2008 85% 12% 1% 1%
Fall 2007 85% 8% 3% 4% Spring 2007 82% 14% 1% 3%
Fall 2006 90% 8% 2% 1% 12. There is a teacher or some other adult at this school who believes that I will be a success.
Really Agree
Kind of Agree
Kind of Disagree
Really Disagree
Spring 2012 66% 20% 4% 9% Spring 2011 71% 17% 6% 5% Spring 2010 72% 18% 4% 6% Spring 2009 60% 29% 5% 7%
Fall 2008 66% 20% 8% 6% Spring 2008 70% 21% 4% 5%
Fall 2007 78% 14% 4% 4% Spring 2007 60% 29% 4% 7%
Fall 2006 72% 20% 5% 2%

School District of Lancaster, 2011-2012 Student Survey May 21-25, 2012 Marginal Frequency Report – LAFAYETTE ELEMENTARY N=189
Center for Opinion Research 5 Franklin & Marshall College
13. Students in this school really listen to teachers.
Really Agree
Kind of Agree
Kind of Disagree
Really Disagree
Spring 2012 15% 30% 35% 20% Spring 2011 13% 42% 36% 9% Spring 2010 11% 41% 32% 16% Spring 2009 10% 38% 34% 18%
Fall 2008 20% 35% 27% 18% Spring 2008 10% 30% 35% 25%
Fall 2007 22% 40% 21% 16% Spring 2007 10% 31% 32% 27%
Fall 2006 19% 38% 25% 18% 14. Most teachers make learning interesting.
Really Agree
Kind of Agree
Kind of Disagree
Really Disagree
Spring 2012 46% 30% 14% 10% Spring 2011 47% 38% 8% 7% Spring 2010 53% 33% 8% 6% Spring 2009 50% 34% 8% 8%
Fall 2008 60% 23% 11% 6% Spring 2008 60% 27% 9% 5%
Fall 2007 57% 30% 7% 5% Spring 2007 46% 34% 12% 8%
Fall 2006 65% 26% 8% 1% 15. This school is always getting better.
Really Agree
Kind of Agree
Kind of Disagree
Really Disagree
Spring 2012 34% 34% 15% 16% Spring 2011 42% 28% 16% 14% Spring 2010 36% 28% 17% 19% Spring 2009 37% 31% 12% 19%
Fall 2008 42% 21% 14% 23% Spring 2008 34% 29% 17% 21%
Fall 2007 44% 26% 18% 12% Spring 2007 29% 27% 18% 26%
Fall 2006 45% 30% 13% 11%

School District of Lancaster, 2011-2012 Student Survey May 21-25, 2012 Marginal Frequency Report – LAFAYETTE ELEMENTARY N=189
Center for Opinion Research 6 Franklin & Marshall College
Readiness and Emergency Management 16. Has anyone from your school spoken with you about what to do in the event of a school emergency, or not?
Yes No Spring 2012 88% 12% Spring 2011 87% 13%
Do you agree or disagree with the following statement? 17. I know what to do if there is a school emergency.
Really Agree
Kind of Agree
Kind of Disagree
Really Disagree
Spring 2012 80% 10% 4% 6% Spring 2011 84% 12% 2% 3%
Academic Self-efficacy Do you agree or disagree with the following statements? 18. I am a good science student.
Really Agree
Kind of Agree
Kind of Disagree
Really Disagree
Spring 2012 51% 37% 10% 3% Spring 2011 49% 34% 9% 8% Spring 2010 53% 29% 10% 8% Spring 2009 53% 32% 8% 7%
Fall 2008 55% 31% 9% 5% Spring 2008 50% 35% 8% 8%
Fall 2007 60% 27% 7% 5% Spring 2007 52% 32% 10% 6%
Fall 2006 42% 38% 10% 10% 19. Sometimes I think an assignment is easy when the other students think it is hard.
Really Agree
Kind of Agree
Kind of Disagree
Really Disagree
Spring 2012 46% 34% 10% 11% Spring 2011 49% 34% 11% 6% Spring 2010 44% 29% 12% 14% Spring 2009 48% 31% 14% 8%
Fall 2008 48% 34% 8% 10% Spring 2008 62% 21% 8% 9%
Fall 2007 58% 25% 6% 11% Spring 2007 52% 32% 9% 8%
Fall 2006 58% 29% 5% 8%

School District of Lancaster, 2011-2012 Student Survey May 21-25, 2012 Marginal Frequency Report – LAFAYETTE ELEMENTARY N=189
Center for Opinion Research 7 Franklin & Marshall College
20. I am good social studies student.
Really Agree
Kind of Agree
Kind of Disagree
Really Disagree
Spring 2012 46% 35% 10% 10% Spring 2011 46% 30% 16% 8% Spring 2010 47% 30% 10% 13% Spring 2009 40% 35% 16% 8%
Fall 2008 53% 28% 10% 9% Spring 2008 46% 28% 14% 12%
Fall 2007 50% 30% 11% 10% Spring 2007 43% 34% 18% 6%
Fall 2006 46% 35% 12% 7% 21. My teacher thinks I am smart.
Really Agree
Kind of Agree
Kind of Disagree
Really Disagree
Spring 2012 65% 18% 8% 9% Spring 2011 68% 20% 6% 6% Spring 2010 66% 20% 8% 6% Spring 2009 63% 22% 9% 6%
Fall 2008 68% 19% 6% 7% Spring 2008 62% 26% 4% 8%
Fall 2007 68% 21% 5% 7% Spring 2007 67% 19% 6% 8%
Fall 2006 68% 23% 4% 5% 22. I am a good math student.
Really Agree
Kind of Agree
Kind of Disagree
Really Disagree
Spring 2012 50% 23% 13% 14% Spring 2011 49% 26% 12% 12% Spring 2010 52% 30% 7% 11% Spring 2009 49% 38% 6% 8%
Fall 2008 58% 26% 9% 7% Spring 2008 59% 24% 9% 8%
Fall 2007 63% 22% 7% 8% Spring 2007 56% 27% 10% 8%
Fall 2006 60% 27% 6% 7%

School District of Lancaster, 2011-2012 Student Survey May 21-25, 2012 Marginal Frequency Report – LAFAYETTE ELEMENTARY N=189
Center for Opinion Research 8 Franklin & Marshall College
23. My classmates usually get better grades than I do.
Really Agree
Kind of Agree
Kind of Disagree
Really Disagree
Spring 2012 24% 27% 29% 21% Spring 2011 20% 22% 33% 25% Spring 2010 22% 31% 28% 18% Spring 2009 16% 30% 26% 28%
Fall 2008 20% 29% 24% 27% Spring 2008 17% 23% 31% 29%
Fall 2007 22% 27% 21% 30% Spring 2007 21% 34% 27% 18%
Fall 2006 20% 28% 30% 22% 24. I usually understand my homework assignments.
Really Agree
Kind of Agree
Kind of Disagree
Really Disagree
Spring 2012 52% 29% 14% 5% Spring 2011 53% 33% 8% 7% Spring 2010 53% 29% 10% 7% Spring 2009 50% 33% 12% 5%
Fall 2008 61% 30% 6% 4% Spring 2008 54% 29% 10% 8%
Fall 2007 62% 25% 9% 4% Spring 2007 48% 37% 7% 8%
Fall 2006 56% 30% 6% 8% 25. I could get the best grades in class if I tried hard enough.
Really Agree
Kind of Agree
Kind of Disagree
Really Disagree
Spring 2012 72% 20% 3% 5% Spring 2011 78% 12% 4% 5% Spring 2010 75% 17% 6% 2% Spring 2009 74% 17% 6% 3%
Fall 2008 76% 18% 3% 3% Spring 2008 74% 15% 4% 8%
Fall 2007 77% 15% 4% 4% Spring 2007 70% 22% 4% 4%
Fall 2006 82% 14% 2% 1%

School District of Lancaster, 2011-2012 Student Survey May 21-25, 2012 Marginal Frequency Report – LAFAYETTE ELEMENTARY N=189
Center for Opinion Research 9 Franklin & Marshall College
26. I am a good reading student.
Really Agree
Kind of Agree
Kind of Disagree
Really Disagree
Spring 2012 55% 25% 14% 6% Spring 2011 55% 34% 7% 4% Spring 2010 52% 32% 9% 7% Spring 2009 56% 23% 16% 6%
Fall 2008 57% 25% 11% 7% Spring 2008 58% 27% 8% 8%
Fall 2007 65% 18% 13% 3% Spring 2007 54% 31% 8% 7%
Fall 2006 66% 22% 7% 6% 27. It is not hard for me to get good grades in school.
Really Agree
Kind of Agree
Kind of Disagree
Really Disagree
Spring 2012 55% 31% 7% 8% Spring 2011 51% 29% 12% 9% Spring 2010 48% 28% 10% 13% Spring 2009 44% 32% 14% 10%
Fall 2008 48% 30% 13% 9% Spring 2008 49% 30% 9% 11%
Fall 2007 47% 33% 12% 8% Spring 2007 44% 34% 12% 10%
Fall 2006 45% 39% 8% 8% 28. I am smart.
Really Agree
Kind of Agree
Kind of Disagree
Really Disagree
Spring 2012 67% 19% 7% 7% Spring 2011 66% 21% 6% 7% Spring 2010 64% 20% 10% 6% Spring 2009 66% 28% 3% 4%
Fall 2008 66% 24% 5% 6% Spring 2008 70% 23% 2% 4%
Fall 2007 69% 20% 7% 5% Spring 2007 61% 28% 4% 6%
Fall 2006 66% 23% 5% 6%
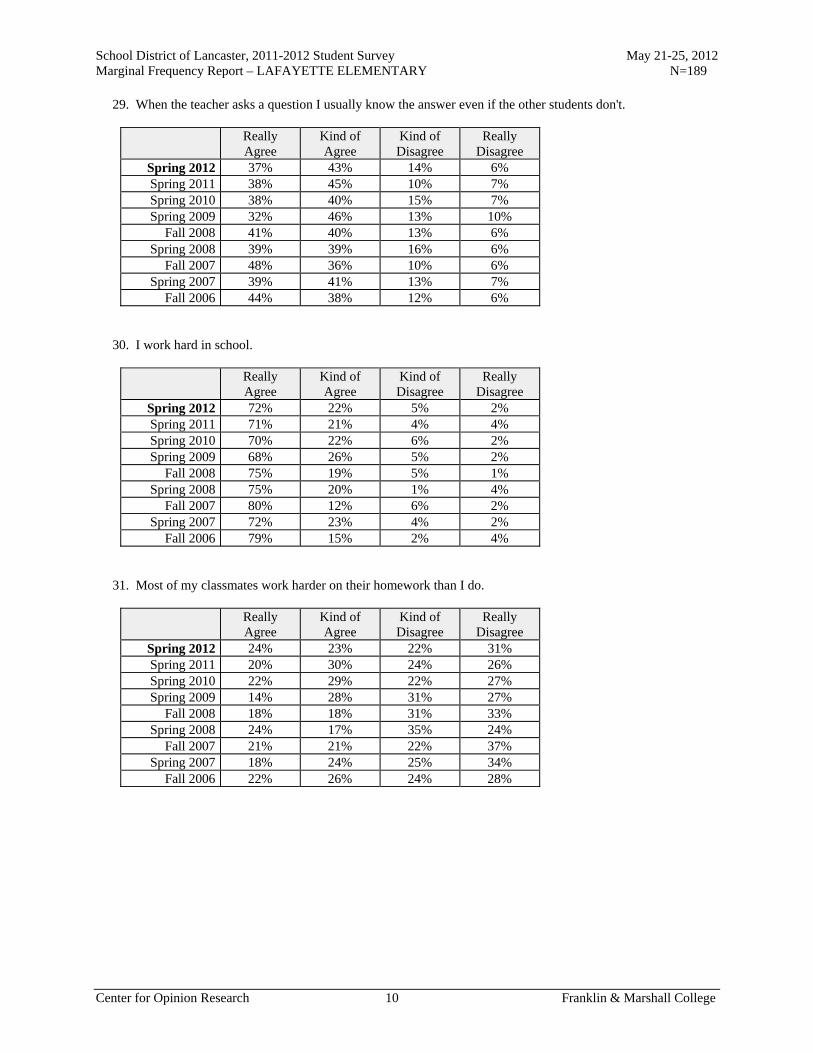
School District of Lancaster, 2011-2012 Student Survey May 21-25, 2012 Marginal Frequency Report – LAFAYETTE ELEMENTARY N=189
Center for Opinion Research 10 Franklin & Marshall College
29. When the teacher asks a question I usually know the answer even if the other students don't.
Really Agree
Kind of Agree
Kind of Disagree
Really Disagree
Spring 2012 37% 43% 14% 6% Spring 2011 38% 45% 10% 7% Spring 2010 38% 40% 15% 7% Spring 2009 32% 46% 13% 10%
Fall 2008 41% 40% 13% 6% Spring 2008 39% 39% 16% 6%
Fall 2007 48% 36% 10% 6% Spring 2007 39% 41% 13% 7%
Fall 2006 44% 38% 12% 6% 30. I work hard in school.
Really Agree
Kind of Agree
Kind of Disagree
Really Disagree
Spring 2012 72% 22% 5% 2% Spring 2011 71% 21% 4% 4% Spring 2010 70% 22% 6% 2% Spring 2009 68% 26% 5% 2%
Fall 2008 75% 19% 5% 1% Spring 2008 75% 20% 1% 4%
Fall 2007 80% 12% 6% 2% Spring 2007 72% 23% 4% 2%
Fall 2006 79% 15% 2% 4% 31. Most of my classmates work harder on their homework than I do.
Really Agree
Kind of Agree
Kind of Disagree
Really Disagree
Spring 2012 24% 23% 22% 31% Spring 2011 20% 30% 24% 26% Spring 2010 22% 29% 22% 27% Spring 2009 14% 28% 31% 27%
Fall 2008 18% 18% 31% 33% Spring 2008 24% 17% 35% 24%
Fall 2007 21% 21% 22% 37% Spring 2007 18% 24% 25% 34%
Fall 2006 22% 26% 24% 28%

School District of Lancaster, 2011-2012 Student Survey May 21-25, 2012 Marginal Frequency Report – LAFAYETTE ELEMENTARY N=189
Center for Opinion Research 11 Franklin & Marshall College
32. I always get good grades when I try hard.
Really Agree
Kind of Agree
Kind of Disagree
Really Disagree
Spring 2012 75% 16% 6% 3% Spring 2011 74% 17% 7% 3% Spring 2010 73% 17% 6% 3% Spring 2009 75% 18% 3% 3%
Fall 2008 72% 19% 6% 3% Spring 2008 75% 19% 4% 2%
Fall 2007 77% 15% 5% 3% Spring 2007 72% 19% 5% 4%
Fall 2006 77% 14% 4% 5% 33. I usually do not get good grades in math because it is too hard.
Really Agree
Kind of Agree
Kind of Disagree
Really Disagree
Spring 2012 18% 19% 16% 47% Spring 2011 13% 24% 13% 50% Spring 2010 19% 17% 18% 45% Spring 2009 10% 24% 26% 40%
Fall 2008 11% 21% 16% 51% Spring 2008 16% 17% 16% 51%
Fall 2007 18% 19% 14% 50% Spring 2007 16% 19% 22% 44%
Fall 2006 23% 18% 18% 42% 34. Most of my classmates like to do math because it is easy.
Really Agree
Kind of Agree
Kind of Disagree
Really Disagree
Spring 2012 48% 23% 17% 11% Spring 2011 45% 22% 17% 16% Spring 2010 53% 25% 12% 9% Spring 2009 44% 27% 18% 10%
Fall 2008 50% 23% 18% 9% Spring 2008 48% 29% 14% 9%
Fall 2007 54% 21% 13% 13% Spring 2007 45% 26% 17% 11%
Fall 2006 52% 25% 12% 11%

School District of Lancaster, 2011-2012 Student Survey May 21-25, 2012 Marginal Frequency Report – LAFAYETTE ELEMENTARY N=189
Center for Opinion Research 12 Franklin & Marshall College
35. I would get better grades if my teacher liked me more.
Really Agree
Kind of Agree
Kind of Disagree
Really Disagree
Spring 2012 21% 13% 16% 50% Spring 2011 15% 15% 11% 59% Spring 2010 22% 9% 14% 54% Spring 2009 14% 11% 12% 63%
Fall 2008 21% 13% 13% 52% Spring 2008 18% 9% 15% 58%
Fall 2007 18% 8% 15% 59% Spring 2007 17% 13% 11% 59%
Fall 2006 20% 12% 11% 56% 36. I will graduate from high school.
Really Agree
Kind of Agree
Kind of Disagree
Really Disagree
Spring 2012 87% 9% 3% 2% Spring 2011 83% 13% 2% 3% Spring 2010 80% 14% 2% 3% Spring 2009 82% 16% 1% 1%
Fall 2008 84% 12% 1% 4% Spring 2008 86% 9% 3% 2%
Fall 2007 83% 11% 4% 2% Spring 2007 89% 11% 0% 0%
Fall 2006 83% 9% 4% 4% 37. I go to a good school.
Really Agree
Kind of Agree
Kind of Disagree
Really Disagree
Spring 2012 63% 20% 7% 11% Spring 2011 65% 18% 8% 9% Spring 2010 57% 23% 10% 10% Spring 2009 54% 26% 10% 11%
Fall 2008 62% 21% 7% 9% Spring 2008 59% 20% 9% 12%
Fall 2007 65% 22% 6% 7% Spring 2007 49% 31% 8% 12%
Fall 2006 70% 17% 8% 5%
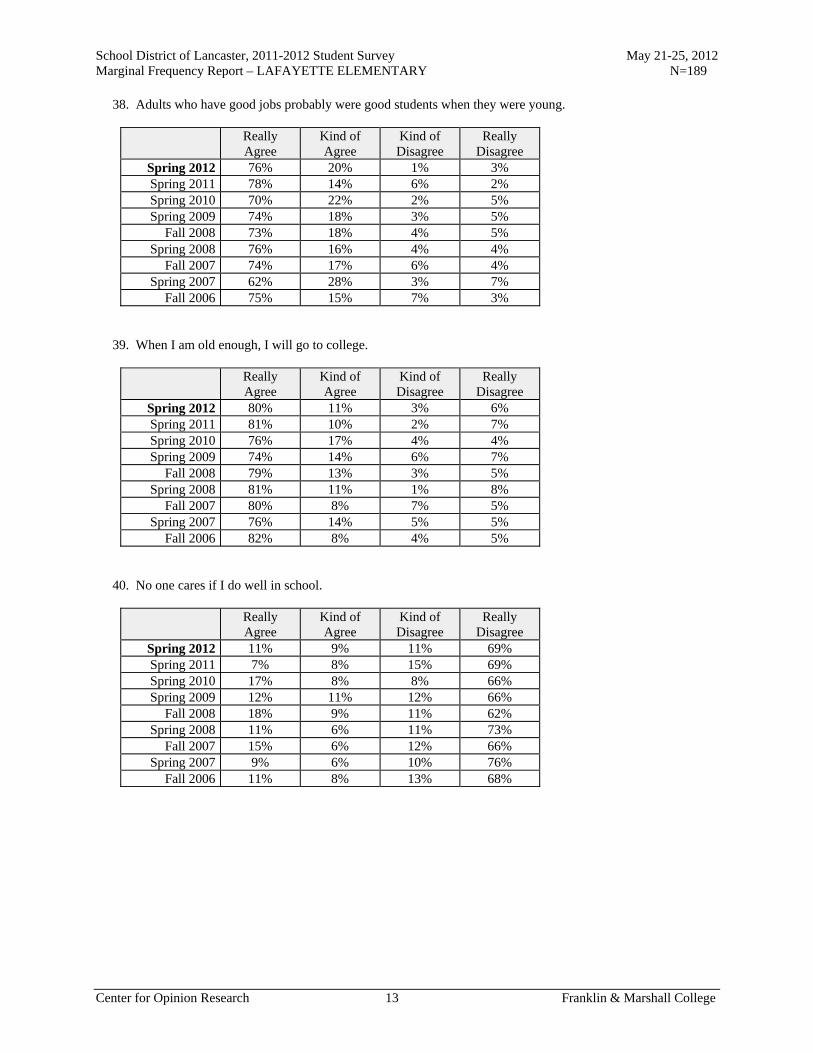
School District of Lancaster, 2011-2012 Student Survey May 21-25, 2012 Marginal Frequency Report – LAFAYETTE ELEMENTARY N=189
Center for Opinion Research 13 Franklin & Marshall College
38. Adults who have good jobs probably were good students when they were young.
Really Agree
Kind of Agree
Kind of Disagree
Really Disagree
Spring 2012 76% 20% 1% 3% Spring 2011 78% 14% 6% 2% Spring 2010 70% 22% 2% 5% Spring 2009 74% 18% 3% 5%
Fall 2008 73% 18% 4% 5% Spring 2008 76% 16% 4% 4%
Fall 2007 74% 17% 6% 4% Spring 2007 62% 28% 3% 7%
Fall 2006 75% 15% 7% 3% 39. When I am old enough, I will go to college.
Really Agree
Kind of Agree
Kind of Disagree
Really Disagree
Spring 2012 80% 11% 3% 6% Spring 2011 81% 10% 2% 7% Spring 2010 76% 17% 4% 4% Spring 2009 74% 14% 6% 7%
Fall 2008 79% 13% 3% 5% Spring 2008 81% 11% 1% 8%
Fall 2007 80% 8% 7% 5% Spring 2007 76% 14% 5% 5%
Fall 2006 82% 8% 4% 5% 40. No one cares if I do well in school.
Really Agree
Kind of Agree
Kind of Disagree
Really Disagree
Spring 2012 11% 9% 11% 69% Spring 2011 7% 8% 15% 69% Spring 2010 17% 8% 8% 66% Spring 2009 12% 11% 12% 66%
Fall 2008 18% 9% 11% 62% Spring 2008 11% 6% 11% 73%
Fall 2007 15% 6% 12% 66% Spring 2007 9% 6% 10% 76%
Fall 2006 11% 8% 13% 68%

School District of Lancaster, 2011-2012 Student Survey May 21-25, 2012 Marginal Frequency Report – LAFAYETTE ELEMENTARY N=189
Center for Opinion Research 14 Franklin & Marshall College
41. What I learn in school is not important.
Really Agree
Kind of Agree
Kind of Disagree
Really Disagree
Spring 2012 10% 5% 10% 74% Spring 2011 8% 3% 6% 82% Spring 2010 12% 6% 8% 75% Spring 2009 7% 6% 6% 81%
Fall 2008 15% 4% 11% 70% Spring 2008 9% 4% 10% 77%
Fall 2007 12% 4% 5% 78% Spring 2007 6% 5% 10% 80%
Fall 2006 10% 3% 8% 80% 42. It does not matter if I do well in school.
Really Agree
Kind of Agree
Kind of Disagree
Really Disagree
Spring 2012 10% 4% 10% 75% Spring 2011 9% 4% 7% 80% Spring 2010 13% 4% 10% 73% Spring 2009 12% 3% 6% 79%
Fall 2008 11% 6% 11% 72% Spring 2008 6% 5% 10% 80%
Fall 2007 13% 3% 8% 76% Spring 2007 7% 6% 9% 79%
Fall 2006 10% 5% 7% 78% 43. Students who get better grades than I do get more help from the teacher than I do.
Really Agree
Kind of Agree
Kind of Disagree
Really Disagree
Spring 2012 20% 16% 16% 49% Spring 2011 16% 14% 19% 51% Spring 2010 16% 13% 19% 52% Spring 2009 15% 10% 23% 53%
Fall 2008 16% 14% 16% 54% Spring 2008 16% 12% 18% 55%
Fall 2007 20% 7% 18% 55% Spring 2007 17% 10% 24% 50%
Fall 2006 19% 9% 17% 55%
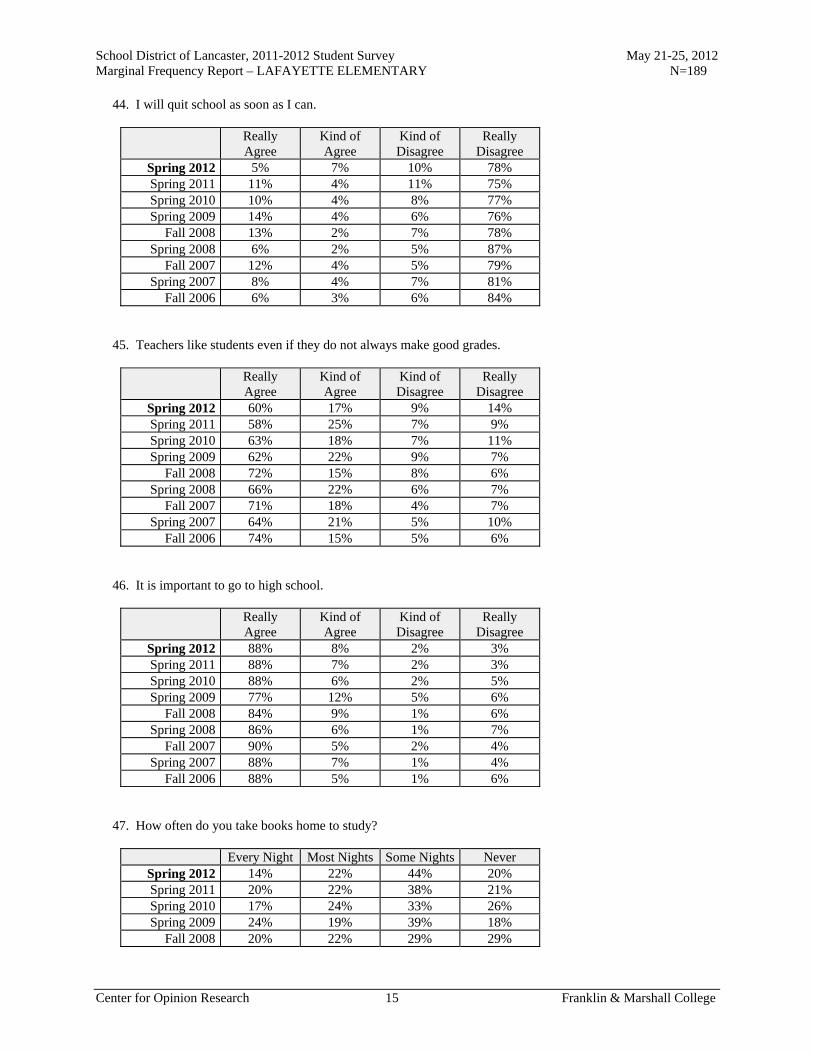
School District of Lancaster, 2011-2012 Student Survey May 21-25, 2012 Marginal Frequency Report – LAFAYETTE ELEMENTARY N=189
Center for Opinion Research 15 Franklin & Marshall College
44. I will quit school as soon as I can.
Really Agree
Kind of Agree
Kind of Disagree
Really Disagree
Spring 2012 5% 7% 10% 78% Spring 2011 11% 4% 11% 75% Spring 2010 10% 4% 8% 77% Spring 2009 14% 4% 6% 76%
Fall 2008 13% 2% 7% 78% Spring 2008 6% 2% 5% 87%
Fall 2007 12% 4% 5% 79% Spring 2007 8% 4% 7% 81%
Fall 2006 6% 3% 6% 84% 45. Teachers like students even if they do not always make good grades.
Really Agree
Kind of Agree
Kind of Disagree
Really Disagree
Spring 2012 60% 17% 9% 14% Spring 2011 58% 25% 7% 9% Spring 2010 63% 18% 7% 11% Spring 2009 62% 22% 9% 7%
Fall 2008 72% 15% 8% 6% Spring 2008 66% 22% 6% 7%
Fall 2007 71% 18% 4% 7% Spring 2007 64% 21% 5% 10%
Fall 2006 74% 15% 5% 6% 46. It is important to go to high school.
Really Agree
Kind of Agree
Kind of Disagree
Really Disagree
Spring 2012 88% 8% 2% 3% Spring 2011 88% 7% 2% 3% Spring 2010 88% 6% 2% 5% Spring 2009 77% 12% 5% 6%
Fall 2008 84% 9% 1% 6% Spring 2008 86% 6% 1% 7%
Fall 2007 90% 5% 2% 4% Spring 2007 88% 7% 1% 4%
Fall 2006 88% 5% 1% 6% 47. How often do you take books home to study?
Every Night Most Nights Some Nights Never Spring 2012 14% 22% 44% 20% Spring 2011 20% 22% 38% 21% Spring 2010 17% 24% 33% 26% Spring 2009 24% 19% 39% 18%
Fall 2008 20% 22% 29% 29%
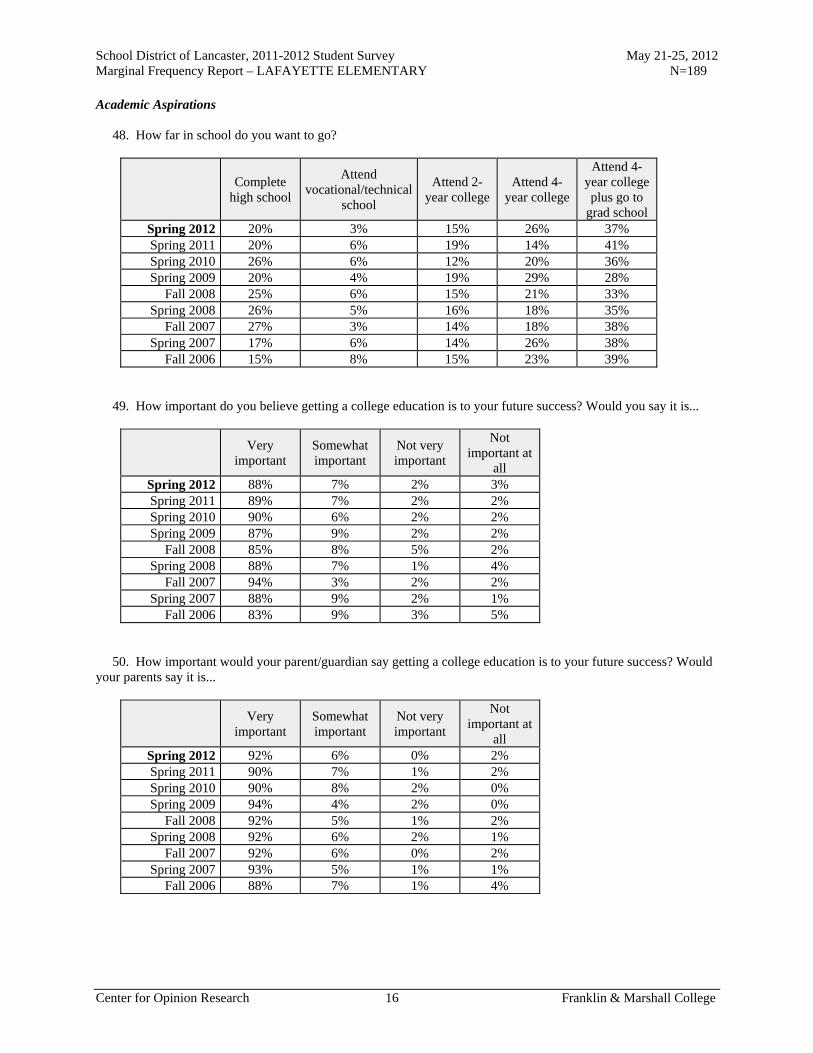
School District of Lancaster, 2011-2012 Student Survey May 21-25, 2012 Marginal Frequency Report – LAFAYETTE ELEMENTARY N=189
Center for Opinion Research 16 Franklin & Marshall College
Academic Aspirations 48. How far in school do you want to go?
Complete
high school
Attend vocational/technical
school
Attend 2-year college
Attend 4-year college
Attend 4-year college plus go to
grad school Spring 2012 20% 3% 15% 26% 37% Spring 2011 20% 6% 19% 14% 41% Spring 2010 26% 6% 12% 20% 36% Spring 2009 20% 4% 19% 29% 28%
Fall 2008 25% 6% 15% 21% 33% Spring 2008 26% 5% 16% 18% 35%
Fall 2007 27% 3% 14% 18% 38% Spring 2007 17% 6% 14% 26% 38%
Fall 2006 15% 8% 15% 23% 39% 49. How important do you believe getting a college education is to your future success? Would you say it is...
Very
important Somewhat important
Not very important
Not important at
all Spring 2012 88% 7% 2% 3% Spring 2011 89% 7% 2% 2% Spring 2010 90% 6% 2% 2% Spring 2009 87% 9% 2% 2%
Fall 2008 85% 8% 5% 2% Spring 2008 88% 7% 1% 4%
Fall 2007 94% 3% 2% 2% Spring 2007 88% 9% 2% 1%
Fall 2006 83% 9% 3% 5% 50. How important would your parent/guardian say getting a college education is to your future success? Would your parents say it is...
Very
important Somewhat important
Not very important
Not important at
all Spring 2012 92% 6% 0% 2% Spring 2011 90% 7% 1% 2% Spring 2010 90% 8% 2% 0% Spring 2009 94% 4% 2% 0%
Fall 2008 92% 5% 1% 2% Spring 2008 92% 6% 2% 1%
Fall 2007 92% 6% 0% 2% Spring 2007 93% 5% 1% 1%
Fall 2006 88% 7% 1% 4%

School District of Lancaster, 2011-2012 Student Survey May 21-25, 2012 Marginal Frequency Report – LAFAYETTE ELEMENTARY N=189
Center for Opinion Research 17 Franklin & Marshall College
51. How important would your teachers say getting a college education is to your future success? Would your teachers say it is...
Very
important Somewhat important
Not very important
Not important at
all Spring 2012 84% 13% 2% 1% Spring 2011 90% 7% 2% 2% Spring 2010 91% 7% 1% 1% Spring 2009 93% 4% 1% 1%
Fall 2008 92% 6% 1% 1% Spring 2008 93% 5% 1% 1%
Fall 2007 90% 5% 2% 3% Spring 2007 94% 4% 0% 2%
Fall 2006 90% 4% 1% 5% Perceptions of Police Do you agree or disagree with the following statements about police officers? 52. I respect police officers.
Really Agree
Kind of Agree
Kind of Disagree
Really Disagree
Spring 2012 89% 6% 2% 2% Spring 2011 87% 8% 3% 3% Spring 2010 89% 7% 2% 2% Spring 2009 84% 12% 2% 2%
Fall 2008 86% 10% 2% 2% Spring 2008 76% 11% 6% 8%
Fall 2007 82% 8% 6% 5% Spring 2007 79% 8% 6% 7%
Fall 2006 80% 8% 4% 8% 53. I am comfortable approaching police officers.
Really Agree
Kind of Agree
Kind of Disagree
Really Disagree
Spring 2012 62% 24% 7% 8% Spring 2011 59% 26% 5% 10% Spring 2010 64% 23% 6% 7% Spring 2009 54% 23% 10% 13%
Fall 2008 64% 24% 4% 7% Spring 2008 55% 20% 10% 15%
Fall 2007 63% 21% 7% 9% Spring 2007 60% 20% 7% 13%
Fall 2006 61% 18% 11% 10%

School District of Lancaster, 2011-2012 Student Survey May 21-25, 2012 Marginal Frequency Report – LAFAYETTE ELEMENTARY N=189
Center for Opinion Research 18 Franklin & Marshall College
54. I would consider police work as a career.
Really Agree
Kind of Agree
Kind of Disagree
Really Disagree
Spring 2012 42% 20% 12% 26% Spring 2011 37% 20% 14% 29% Spring 2010 41% 20% 12% 27% Spring 2009 40% 16% 10% 34%
Fall 2008 45% 14% 15% 26% Spring 2008 36% 17% 8% 38%
Fall 2007 38% 12% 10% 41% Spring 2007 34% 15% 13% 38%
Fall 2006 40% 13% 12% 34% 55. In general, I do not trust the police.
Really Agree
Kind of Agree
Kind of Disagree
Really Disagree
Spring 2012 9% 11% 10% 70% Spring 2011 11% 6% 11% 72% Spring 2010 12% 10% 7% 71% Spring 2009 17% 9% 7% 67%
Fall 2008 17% 10% 7% 66% Spring 2008 13% 13% 12% 62%
Fall 2007 19% 7% 8% 65% Spring 2007 17% 11% 12% 60%
Fall 2006 13% 6% 10% 70% 56. Police do not belong in schools unless there has been a crime.
Really Agree
Kind of Agree
Kind of Disagree
Really Disagree
Spring 2012 28% 11% 12% 50% Spring 2011 26% 8% 14% 52% Spring 2010 20% 10% 14% 55% Spring 2009 22% 10% 8% 60%
Fall 2008 32% 7% 13% 48% Spring 2008 38% 16% 10% 36%
Fall 2007 47% 12% 11% 29% Spring 2007 43% 17% 10% 30%
Fall 2006 41% 10% 15% 34%

Report J
Marginal Frequency Report Martin Elementary School

School District of Lancaster, 2011-2012 Student Survey May 21-25, 2012 Marginal Frequency Report – MARTIN ELEMENTARY N=142
Center for Opinion Research 1 Franklin & Marshall College
School Climate Do you agree or disagree with the following statements? 1. I feel safe at this school.
Really Agree
Kind of Agree
Kind of Disagree
Really Disagree
Spring 2012 70% 21% 3% 6% Spring 2011 58% 33% 5% 3% Spring 2010 62% 28% 6% 4% Spring 2009 50% 39% 8% 4%
Fall 2008 59% 38% 2% 2% Spring 2008 51% 35% 9% 5%
Fall 2007 68% 25% 5% 2% Spring 2007 42% 41% 14% 3%
Fall 2006 64% 28% 4% 4% 2. I feel safe going to and from school.
Really Agree
Kind of Agree
Kind of Disagree
Really Disagree
Spring 2012 61% 25% 10% 4% Spring 2011 68% 20% 8% 4% Spring 2010 64% 26% 5% 5% Spring 2009 48% 40% 9% 3%
Fall 2008 54% 32% 10% 4% Spring 2008 51% 37% 9% 4%
Fall 2007 57% 29% 10% 4% Spring 2007 50% 36% 11% 4%
Fall 2006 59% 29% 4% 8% 3. Students get along well with each other.
Really Agree
Kind of Agree
Kind of Disagree
Really Disagree
Spring 2012 15% 47% 24% 14% Spring 2011 14% 38% 29% 19% Spring 2010 11% 41% 30% 18% Spring 2009 10% 36% 33% 22%
Fall 2008 11% 46% 33% 10% Spring 2008 5% 47% 22% 25%
Fall 2007 23% 41% 25% 11% Spring 2007 8% 32% 37% 23%
Fall 2006 18% 42% 27% 13%

School District of Lancaster, 2011-2012 Student Survey May 21-25, 2012 Marginal Frequency Report – MARTIN ELEMENTARY N=142
Center for Opinion Research 2 Franklin & Marshall College
4. Students get along well with teachers.
Really Agree
Kind of Agree
Kind of Disagree
Really Disagree
Spring 2012 22% 36% 24% 18% Spring 2011 27% 45% 22% 6% Spring 2010 23% 45% 27% 5% Spring 2009 23% 42% 20% 14%
Fall 2008 34% 40% 22% 3% Spring 2008 25% 46% 24% 4%
Fall 2007 47% 34% 15% 4% Spring 2007 25% 42% 25% 7%
Fall 2006 39% 41% 16% 3% 5. I like my school.
Really Agree
Kind of Agree
Kind of Disagree
Really Disagree
Spring 2012 55% 20% 9% 16% Spring 2011 47% 27% 9% 17% Spring 2010 39% 29% 19% 13% Spring 2009 43% 31% 15% 12%
Fall 2008 52% 32% 8% 7% Spring 2008 45% 32% 8% 15%
Fall 2007 66% 18% 6% 11% Spring 2007 42% 29% 17% 12%
Fall 2006 56% 25% 13% 6% 6. I like my teachers.
Really Agree
Kind of Agree
Kind of Disagree
Really Disagree
Spring 2012 61% 27% 7% 6% Spring 2011 67% 21% 8% 3% Spring 2010 64% 24% 8% 4% Spring 2009 58% 29% 8% 6%
Fall 2008 78% 20% 2% 1% Spring 2008 60% 25% 14% 1%
Fall 2007 80% 12% 5% 3% Spring 2007 56% 34% 6% 4%
Fall 2006 71% 24% 5% 0%

School District of Lancaster, 2011-2012 Student Survey May 21-25, 2012 Marginal Frequency Report – MARTIN ELEMENTARY N=142
Center for Opinion Research 3 Franklin & Marshall College
7. There is a teacher or some other adult at this school who really cares about me.
Really Agree
Kind of Agree
Kind of Disagree
Really Disagree
Spring 2012 66% 20% 6% 8% Spring 2011 69% 17% 5% 8% Spring 2010 66% 20% 8% 6% Spring 2009 63% 30% 4% 3%
Fall 2008 71% 20% 8% 2% Spring 2008 65% 20% 10% 5%
Fall 2007 68% 22% 6% 4% Spring 2007 54% 26% 12% 9%
Fall 2006 68% 16% 8% 8% 8. There is a teacher or some other adult at this school who cares when I am not here.
Really Agree
Kind of Agree
Kind of Disagree
Really Disagree
Spring 2012 38% 25% 14% 22% Spring 2011 53% 17% 10% 20% Spring 2010 39% 32% 14% 14% Spring 2009 51% 26% 12% 12%
Fall 2008 42% 28% 13% 17% Spring 2008 39% 23% 15% 22%
Fall 2007 41% 26% 12% 21% Spring 2007 35% 27% 12% 27%
Fall 2006 49% 25% 10% 15% 9. There is a teacher or some other adult at this school who listens to me when I have something to say.
Really Agree
Kind of Agree
Kind of Disagree
Really Disagree
Spring 2012 63% 21% 8% 7% Spring 2011 69% 22% 5% 3% Spring 2010 69% 20% 5% 7% Spring 2009 60% 26% 10% 5%
Fall 2008 64% 23% 8% 5% Spring 2008 65% 20% 5% 9%
Fall 2007 64% 19% 9% 7% Spring 2007 50% 32% 11% 8%
Fall 2006 57% 30% 8% 5%

School District of Lancaster, 2011-2012 Student Survey May 21-25, 2012 Marginal Frequency Report – MARTIN ELEMENTARY N=142
Center for Opinion Research 4 Franklin & Marshall College
10. There is a teacher or some other adult at this school who tells me when I do a good job.
Really Agree
Kind of Agree
Kind of Disagree
Really Disagree
Spring 2012 72% 19% 4% 5% Spring 2011 74% 21% 3% 2% Spring 2010 68% 23% 6% 2% Spring 2009 72% 22% 3% 3%
Fall 2008 68% 23% 3% 5% Spring 2008 71% 18% 5% 6%
Fall 2007 79% 14% 5% 2% Spring 2007 61% 22% 12% 5%
Fall 2006 72% 17% 6% 5% 11. There is a teacher or some other adult at this school who always wants me to do my best.
Really Agree
Kind of Agree
Kind of Disagree
Really Disagree
Spring 2012 83% 13% 1% 3% Spring 2011 84% 13% 2% 2% Spring 2010 84% 12% 2% 2% Spring 2009 88% 9% 1% 2%
Fall 2008 82% 14% 3% 2% Spring 2008 81% 14% 1% 4%
Fall 2007 81% 12% 4% 4% Spring 2007 79% 9% 8% 4%
Fall 2006 84% 11% 2% 2% 12. There is a teacher or some other adult at this school who believes that I will be a success.
Really Agree
Kind of Agree
Kind of Disagree
Really Disagree
Spring 2012 72% 21% 3% 4% Spring 2011 76% 19% 3% 2% Spring 2010 64% 29% 5% 3% Spring 2009 70% 23% 4% 3%
Fall 2008 67% 24% 5% 4% Spring 2008 66% 22% 4% 8%
Fall 2007 68% 24% 3% 5% Spring 2007 70% 21% 6% 3%
Fall 2006 66% 21% 7% 6%
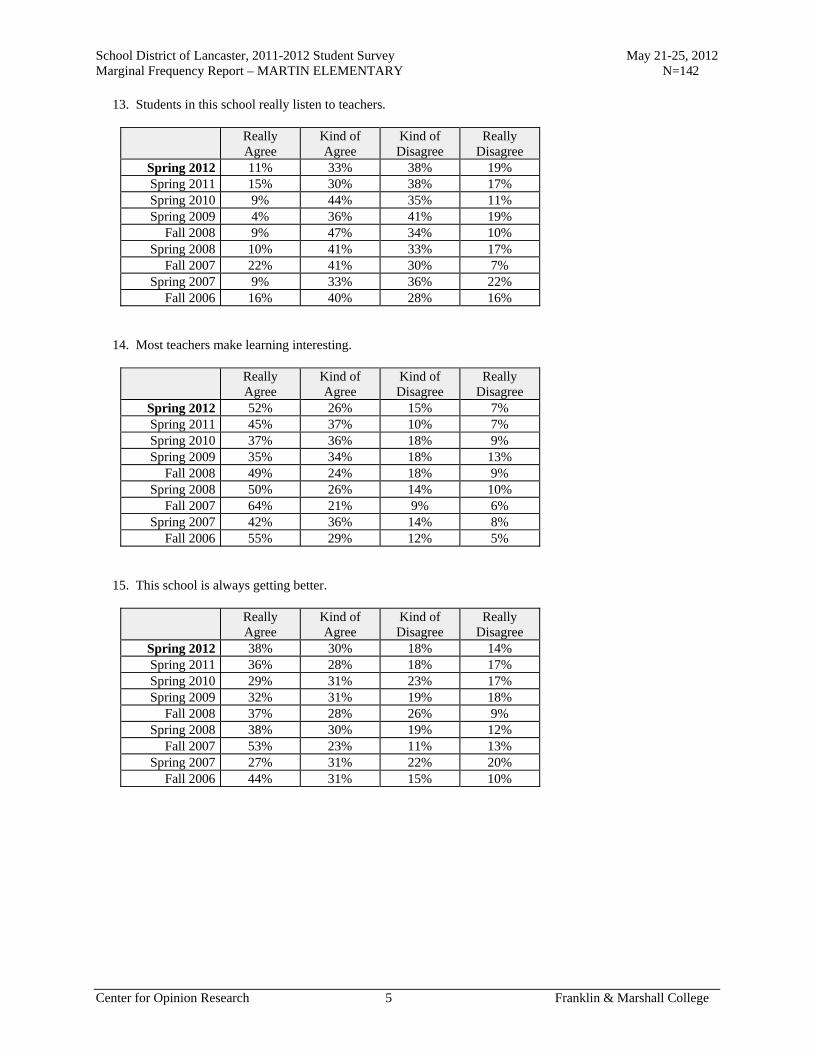
School District of Lancaster, 2011-2012 Student Survey May 21-25, 2012 Marginal Frequency Report – MARTIN ELEMENTARY N=142
Center for Opinion Research 5 Franklin & Marshall College
13. Students in this school really listen to teachers.
Really Agree
Kind of Agree
Kind of Disagree
Really Disagree
Spring 2012 11% 33% 38% 19% Spring 2011 15% 30% 38% 17% Spring 2010 9% 44% 35% 11% Spring 2009 4% 36% 41% 19%
Fall 2008 9% 47% 34% 10% Spring 2008 10% 41% 33% 17%
Fall 2007 22% 41% 30% 7% Spring 2007 9% 33% 36% 22%
Fall 2006 16% 40% 28% 16% 14. Most teachers make learning interesting.
Really Agree
Kind of Agree
Kind of Disagree
Really Disagree
Spring 2012 52% 26% 15% 7% Spring 2011 45% 37% 10% 7% Spring 2010 37% 36% 18% 9% Spring 2009 35% 34% 18% 13%
Fall 2008 49% 24% 18% 9% Spring 2008 50% 26% 14% 10%
Fall 2007 64% 21% 9% 6% Spring 2007 42% 36% 14% 8%
Fall 2006 55% 29% 12% 5% 15. This school is always getting better.
Really Agree
Kind of Agree
Kind of Disagree
Really Disagree
Spring 2012 38% 30% 18% 14% Spring 2011 36% 28% 18% 17% Spring 2010 29% 31% 23% 17% Spring 2009 32% 31% 19% 18%
Fall 2008 37% 28% 26% 9% Spring 2008 38% 30% 19% 12%
Fall 2007 53% 23% 11% 13% Spring 2007 27% 31% 22% 20%
Fall 2006 44% 31% 15% 10%

School District of Lancaster, 2011-2012 Student Survey May 21-25, 2012 Marginal Frequency Report – MARTIN ELEMENTARY N=142
Center for Opinion Research 6 Franklin & Marshall College
Readiness and Emergency Management 16. Has anyone from your school spoken with you about what to do in the event of a school emergency, or not?
Yes No Spring 2012 82% 18% Spring 2011 92% 8%
Do you agree or disagree with the following statement? 17. I know what to do if there is a school emergency.
Really Agree
Kind of Agree
Kind of Disagree
Really Disagree
Spring 2012 78% 15% 4% 4% Spring 2011 85% 12% 1% 3%
Academic Self-efficacy Do you agree or disagree with the following statements? 18. I am a good science student.
Really Agree
Kind of Agree
Kind of Disagree
Really Disagree
Spring 2012 35% 48% 8% 9% Spring 2011 50% 34% 8% 7% Spring 2010 38% 41% 14% 6% Spring 2009 45% 33% 14% 9%
Fall 2008 37% 41% 13% 9% Spring 2008 49% 35% 7% 9%
Fall 2007 52% 30% 8% 9% Spring 2007 51% 26% 8% 15%
Fall 2006 40% 43% 10% 6% 19. Sometimes I think an assignment is easy when the other students think it is hard.
Really Agree
Kind of Agree
Kind of Disagree
Really Disagree
Spring 2012 46% 31% 14% 9% Spring 2011 51% 32% 7% 10% Spring 2010 51% 33% 10% 5% Spring 2009 47% 34% 12% 7%
Fall 2008 39% 37% 13% 11% Spring 2008 46% 39% 6% 9%
Fall 2007 56% 30% 7% 8% Spring 2007 45% 34% 11% 10%
Fall 2006 48% 33% 10% 8%

School District of Lancaster, 2011-2012 Student Survey May 21-25, 2012 Marginal Frequency Report – MARTIN ELEMENTARY N=142
Center for Opinion Research 7 Franklin & Marshall College
20. I am good social studies student.
Really Agree
Kind of Agree
Kind of Disagree
Really Disagree
Spring 2012 38% 40% 12% 11% Spring 2011 55% 27% 10% 8% Spring 2010 39% 44% 10% 7% Spring 2009 39% 40% 11% 10%
Fall 2008 42% 34% 15% 10% Spring 2008 52% 33% 9% 6%
Fall 2007 55% 34% 4% 8% Spring 2007 46% 32% 14% 9%
Fall 2006 44% 36% 12% 8% 21. My teacher thinks I am smart.
Really Agree
Kind of Agree
Kind of Disagree
Really Disagree
Spring 2012 68% 23% 5% 4% Spring 2011 79% 18% 2% 2% Spring 2010 74% 21% 4% 2% Spring 2009 70% 19% 8% 3%
Fall 2008 67% 26% 6% 1% Spring 2008 63% 23% 4% 9%
Fall 2007 76% 18% 3% 3% Spring 2007 66% 22% 5% 6%
Fall 2006 68% 21% 6% 5% 22. I am a good math student.
Really Agree
Kind of Agree
Kind of Disagree
Really Disagree
Spring 2012 62% 23% 7% 8% Spring 2011 66% 27% 4% 3% Spring 2010 58% 32% 5% 5% Spring 2009 62% 20% 12% 7%
Fall 2008 63% 25% 4% 8% Spring 2008 58% 27% 7% 7%
Fall 2007 67% 22% 6% 6% Spring 2007 57% 26% 11% 6%
Fall 2006 57% 25% 8% 10%

School District of Lancaster, 2011-2012 Student Survey May 21-25, 2012 Marginal Frequency Report – MARTIN ELEMENTARY N=142
Center for Opinion Research 8 Franklin & Marshall College
23. My classmates usually get better grades than I do.
Really Agree
Kind of Agree
Kind of Disagree
Really Disagree
Spring 2012 23% 30% 22% 25% Spring 2011 19% 40% 18% 23% Spring 2010 12% 30% 30% 27% Spring 2009 21% 21% 30% 28%
Fall 2008 14% 25% 27% 33% Spring 2008 13% 24% 33% 30%
Fall 2007 17% 24% 29% 31% Spring 2007 15% 24% 28% 33%
Fall 2006 14% 31% 21% 33% 24. I usually understand my homework assignments.
Really Agree
Kind of Agree
Kind of Disagree
Really Disagree
Spring 2012 55% 32% 8% 6% Spring 2011 59% 27% 8% 5% Spring 2010 36% 43% 12% 9% Spring 2009 50% 34% 13% 3%
Fall 2008 44% 39% 13% 4% Spring 2008 52% 31% 14% 4%
Fall 2007 62% 25% 7% 6% Spring 2007 49% 28% 15% 8%
Fall 2006 53% 31% 8% 7% 25. I could get the best grades in class if I tried hard enough.
Really Agree
Kind of Agree
Kind of Disagree
Really Disagree
Spring 2012 80% 11% 4% 6% Spring 2011 83% 14% 1% 3% Spring 2010 68% 21% 3% 8% Spring 2009 71% 20% 5% 4%
Fall 2008 68% 18% 6% 8% Spring 2008 68% 25% 4% 4%
Fall 2007 75% 15% 5% 4% Spring 2007 62% 26% 8% 4%
Fall 2006 74% 18% 3% 5%
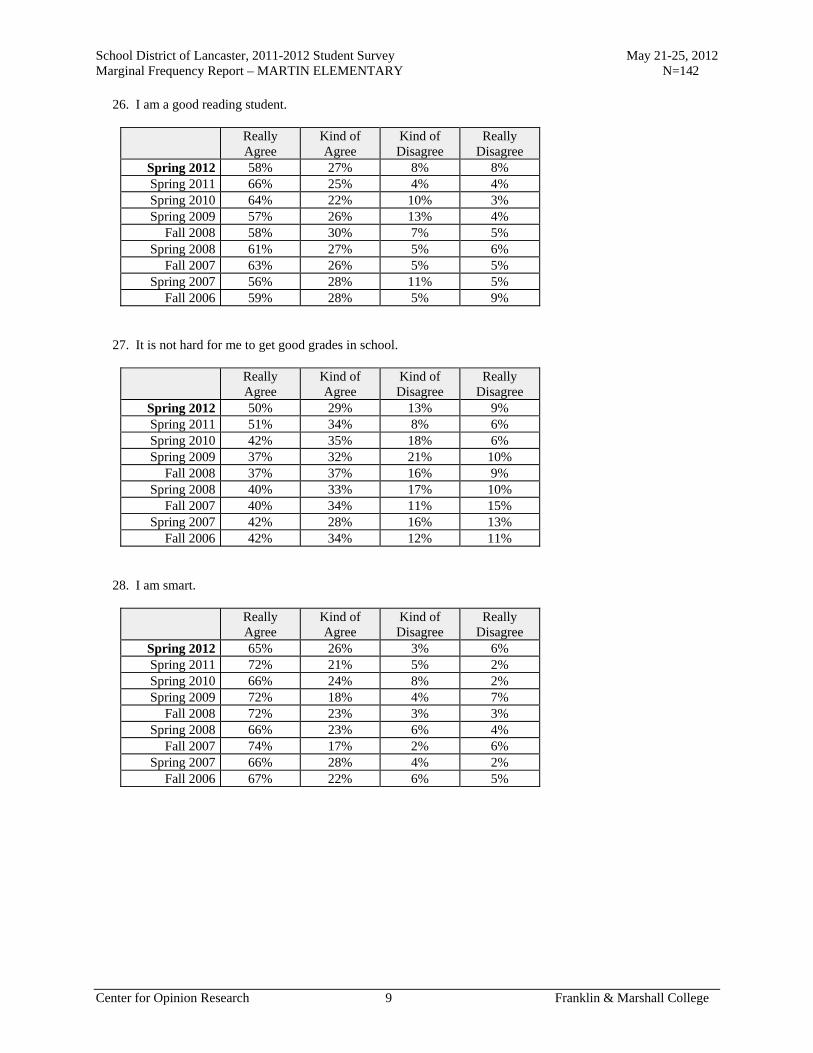
School District of Lancaster, 2011-2012 Student Survey May 21-25, 2012 Marginal Frequency Report – MARTIN ELEMENTARY N=142
Center for Opinion Research 9 Franklin & Marshall College
26. I am a good reading student.
Really Agree
Kind of Agree
Kind of Disagree
Really Disagree
Spring 2012 58% 27% 8% 8% Spring 2011 66% 25% 4% 4% Spring 2010 64% 22% 10% 3% Spring 2009 57% 26% 13% 4%
Fall 2008 58% 30% 7% 5% Spring 2008 61% 27% 5% 6%
Fall 2007 63% 26% 5% 5% Spring 2007 56% 28% 11% 5%
Fall 2006 59% 28% 5% 9% 27. It is not hard for me to get good grades in school.
Really Agree
Kind of Agree
Kind of Disagree
Really Disagree
Spring 2012 50% 29% 13% 9% Spring 2011 51% 34% 8% 6% Spring 2010 42% 35% 18% 6% Spring 2009 37% 32% 21% 10%
Fall 2008 37% 37% 16% 9% Spring 2008 40% 33% 17% 10%
Fall 2007 40% 34% 11% 15% Spring 2007 42% 28% 16% 13%
Fall 2006 42% 34% 12% 11% 28. I am smart.
Really Agree
Kind of Agree
Kind of Disagree
Really Disagree
Spring 2012 65% 26% 3% 6% Spring 2011 72% 21% 5% 2% Spring 2010 66% 24% 8% 2% Spring 2009 72% 18% 4% 7%
Fall 2008 72% 23% 3% 3% Spring 2008 66% 23% 6% 4%
Fall 2007 74% 17% 2% 6% Spring 2007 66% 28% 4% 2%
Fall 2006 67% 22% 6% 5%

School District of Lancaster, 2011-2012 Student Survey May 21-25, 2012 Marginal Frequency Report – MARTIN ELEMENTARY N=142
Center for Opinion Research 10 Franklin & Marshall College
29. When the teacher asks a question I usually know the answer even if the other students don't.
Really Agree
Kind of Agree
Kind of Disagree
Really Disagree
Spring 2012 36% 42% 12% 10% Spring 2011 42% 48% 6% 3% Spring 2010 35% 49% 13% 4% Spring 2009 38% 38% 18% 6%
Fall 2008 40% 42% 13% 5% Spring 2008 44% 36% 12% 7%
Fall 2007 44% 38% 13% 6% Spring 2007 33% 47% 14% 6%
Fall 2006 43% 35% 13% 10% 30. I work hard in school.
Really Agree
Kind of Agree
Kind of Disagree
Really Disagree
Spring 2012 62% 28% 5% 4% Spring 2011 71% 22% 4% 2% Spring 2010 74% 20% 5% 1% Spring 2009 74% 24% 1% 1%
Fall 2008 71% 20% 3% 6% Spring 2008 70% 27% 2% 1%
Fall 2007 77% 17% 3% 3% Spring 2007 74% 17% 4% 4%
Fall 2006 68% 22% 3% 6% 31. Most of my classmates work harder on their homework than I do.
Really Agree
Kind of Agree
Kind of Disagree
Really Disagree
Spring 2012 24% 27% 21% 28% Spring 2011 22% 30% 22% 25% Spring 2010 14% 30% 32% 24% Spring 2009 14% 29% 28% 30%
Fall 2008 17% 23% 27% 32% Spring 2008 17% 23% 32% 28%
Fall 2007 13% 24% 33% 31% Spring 2007 15% 27% 30% 29%
Fall 2006 19% 26% 28% 26%

School District of Lancaster, 2011-2012 Student Survey May 21-25, 2012 Marginal Frequency Report – MARTIN ELEMENTARY N=142
Center for Opinion Research 11 Franklin & Marshall College
32. I always get good grades when I try hard.
Really Agree
Kind of Agree
Kind of Disagree
Really Disagree
Spring 2012 71% 20% 5% 4% Spring 2011 78% 19% 2% 2% Spring 2010 71% 23% 4% 2% Spring 2009 76% 20% 1% 3%
Fall 2008 74% 20% 3% 3% Spring 2008 72% 23% 3% 3%
Fall 2007 84% 8% 5% 3% Spring 2007 76% 16% 4% 4%
Fall 2006 67% 22% 3% 8% 33. I usually do not get good grades in math because it is too hard.
Really Agree
Kind of Agree
Kind of Disagree
Really Disagree
Spring 2012 16% 20% 8% 56% Spring 2011 15% 20% 22% 44% Spring 2010 8% 20% 17% 56% Spring 2009 9% 14% 24% 54%
Fall 2008 11% 14% 22% 53% Spring 2008 12% 15% 21% 52%
Fall 2007 14% 13% 18% 54% Spring 2007 12% 13% 26% 49%
Fall 2006 15% 20% 14% 51% 34. Most of my classmates like to do math because it is easy.
Really Agree
Kind of Agree
Kind of Disagree
Really Disagree
Spring 2012 40% 29% 16% 15% Spring 2011 38% 31% 20% 11% Spring 2010 35% 27% 22% 16% Spring 2009 41% 28% 17% 14%
Fall 2008 42% 27% 22% 10% Spring 2008 34% 33% 20% 13%
Fall 2007 40% 35% 15% 10% Spring 2007 28% 37% 21% 14%
Fall 2006 33% 33% 16% 18%

School District of Lancaster, 2011-2012 Student Survey May 21-25, 2012 Marginal Frequency Report – MARTIN ELEMENTARY N=142
Center for Opinion Research 12 Franklin & Marshall College
35. I would get better grades if my teacher liked me more.
Really Agree
Kind of Agree
Kind of Disagree
Really Disagree
Spring 2012 19% 12% 12% 56% Spring 2011 16% 13% 17% 54% Spring 2010 8% 8% 22% 61% Spring 2009 16% 9% 16% 60%
Fall 2008 23% 14% 15% 49% Spring 2008 20% 12% 13% 54%
Fall 2007 16% 9% 17% 58% Spring 2007 12% 14% 14% 60%
Fall 2006 8% 16% 20% 56% 36. I will graduate from high school.
Really Agree
Kind of Agree
Kind of Disagree
Really Disagree
Spring 2012 86% 11% 1% 3% Spring 2011 89% 10% 0% 1% Spring 2010 91% 4% 2% 4% Spring 2009 84% 11% 1% 4%
Fall 2008 85% 10% 3% 2% Spring 2008 86% 9% 3% 3%
Fall 2007 92% 6% 1% 2% Spring 2007 88% 10% 0% 3%
Fall 2006 77% 11% 4% 8% 37. I go to a good school.
Really Agree
Kind of Agree
Kind of Disagree
Really Disagree
Spring 2012 72% 17% 4% 7% Spring 2011 59% 24% 12% 5% Spring 2010 57% 25% 6% 11% Spring 2009 58% 22% 8% 12%
Fall 2008 59% 27% 12% 2% Spring 2008 63% 22% 7% 7%
Fall 2007 75% 16% 3% 5% Spring 2007 58% 23% 10% 9%
Fall 2006 69% 11% 13% 7%
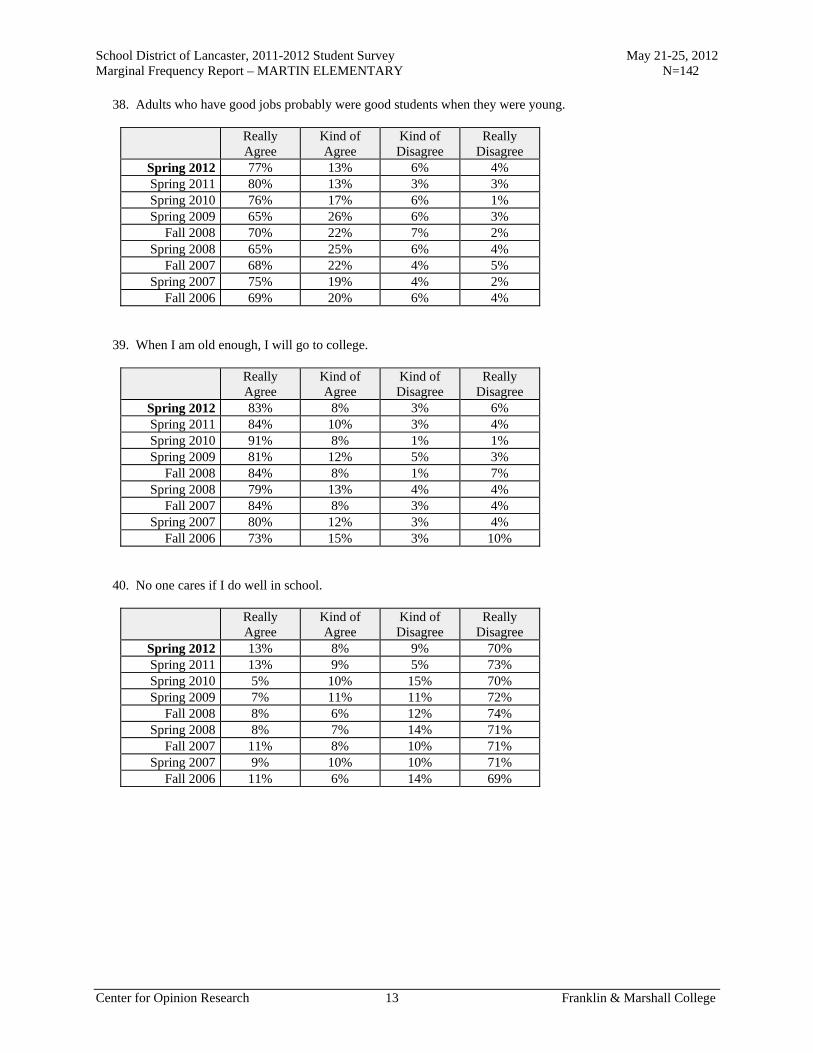
School District of Lancaster, 2011-2012 Student Survey May 21-25, 2012 Marginal Frequency Report – MARTIN ELEMENTARY N=142
Center for Opinion Research 13 Franklin & Marshall College
38. Adults who have good jobs probably were good students when they were young.
Really Agree
Kind of Agree
Kind of Disagree
Really Disagree
Spring 2012 77% 13% 6% 4% Spring 2011 80% 13% 3% 3% Spring 2010 76% 17% 6% 1% Spring 2009 65% 26% 6% 3%
Fall 2008 70% 22% 7% 2% Spring 2008 65% 25% 6% 4%
Fall 2007 68% 22% 4% 5% Spring 2007 75% 19% 4% 2%
Fall 2006 69% 20% 6% 4% 39. When I am old enough, I will go to college.
Really Agree
Kind of Agree
Kind of Disagree
Really Disagree
Spring 2012 83% 8% 3% 6% Spring 2011 84% 10% 3% 4% Spring 2010 91% 8% 1% 1% Spring 2009 81% 12% 5% 3%
Fall 2008 84% 8% 1% 7% Spring 2008 79% 13% 4% 4%
Fall 2007 84% 8% 3% 4% Spring 2007 80% 12% 3% 4%
Fall 2006 73% 15% 3% 10% 40. No one cares if I do well in school.
Really Agree
Kind of Agree
Kind of Disagree
Really Disagree
Spring 2012 13% 8% 9% 70% Spring 2011 13% 9% 5% 73% Spring 2010 5% 10% 15% 70% Spring 2009 7% 11% 11% 72%
Fall 2008 8% 6% 12% 74% Spring 2008 8% 7% 14% 71%
Fall 2007 11% 8% 10% 71% Spring 2007 9% 10% 10% 71%
Fall 2006 11% 6% 14% 69%

School District of Lancaster, 2011-2012 Student Survey May 21-25, 2012 Marginal Frequency Report – MARTIN ELEMENTARY N=142
Center for Opinion Research 14 Franklin & Marshall College
41. What I learn in school is not important.
Really Agree
Kind of Agree
Kind of Disagree
Really Disagree
Spring 2012 12% 4% 9% 75% Spring 2011 10% 9% 5% 77% Spring 2010 6% 9% 12% 73% Spring 2009 12% 1% 10% 78%
Fall 2008 15% 7% 10% 69% Spring 2008 7% 9% 14% 70%
Fall 2007 8% 8% 9% 75% Spring 2007 10% 4% 13% 72%
Fall 2006 11% 5% 2% 81% 42. It does not matter if I do well in school.
Really Agree
Kind of Agree
Kind of Disagree
Really Disagree
Spring 2012 12% 6% 8% 74% Spring 2011 13% 5% 9% 73% Spring 2010 8% 2% 8% 83% Spring 2009 9% 3% 4% 84%
Fall 2008 8% 7% 8% 76% Spring 2008 12% 5% 10% 73%
Fall 2007 14% 5% 12% 69% Spring 2007 5% 3% 15% 77%
Fall 2006 12% 4% 2% 82% 43. Students who get better grades than I do get more help from the teacher than I do.
Really Agree
Kind of Agree
Kind of Disagree
Really Disagree
Spring 2012 21% 13% 19% 46% Spring 2011 22% 15% 22% 42% Spring 2010 16% 13% 18% 53% Spring 2009 18% 14% 19% 50%
Fall 2008 19% 14% 24% 43% Spring 2008 21% 11% 24% 44%
Fall 2007 18% 8% 18% 55% Spring 2007 11% 12% 24% 54%
Fall 2006 16% 9% 17% 58%
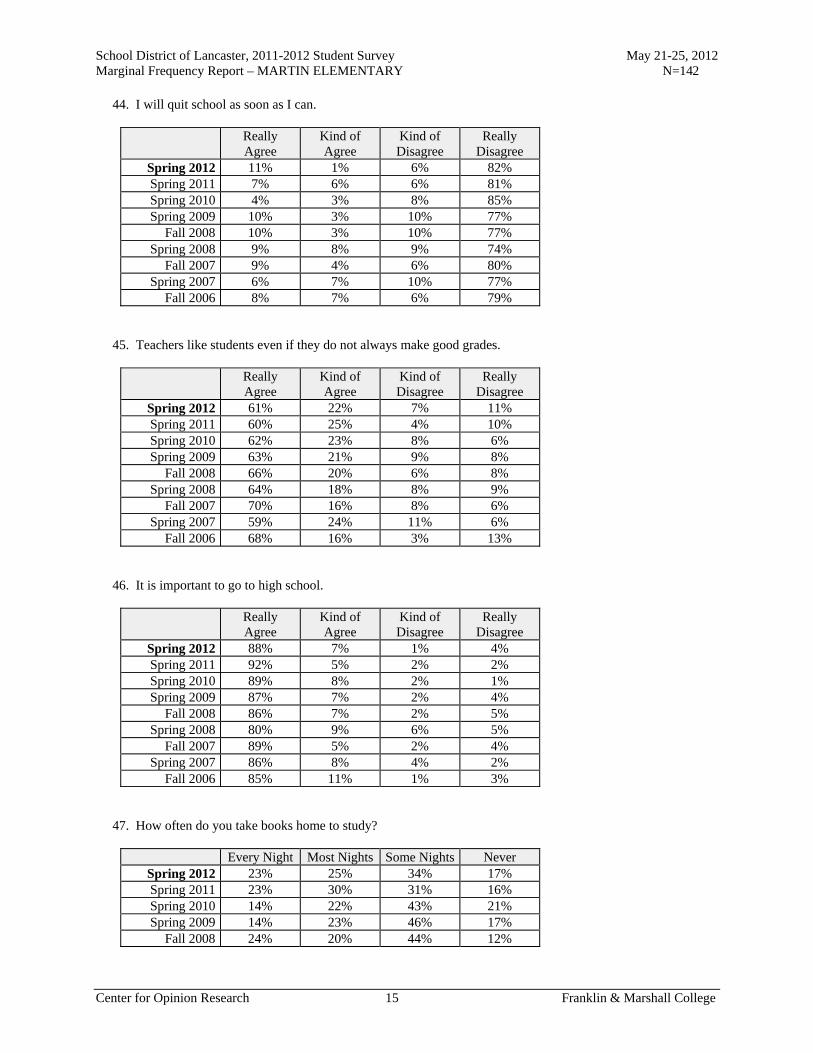
School District of Lancaster, 2011-2012 Student Survey May 21-25, 2012 Marginal Frequency Report – MARTIN ELEMENTARY N=142
Center for Opinion Research 15 Franklin & Marshall College
44. I will quit school as soon as I can.
Really Agree
Kind of Agree
Kind of Disagree
Really Disagree
Spring 2012 11% 1% 6% 82% Spring 2011 7% 6% 6% 81% Spring 2010 4% 3% 8% 85% Spring 2009 10% 3% 10% 77%
Fall 2008 10% 3% 10% 77% Spring 2008 9% 8% 9% 74%
Fall 2007 9% 4% 6% 80% Spring 2007 6% 7% 10% 77%
Fall 2006 8% 7% 6% 79% 45. Teachers like students even if they do not always make good grades.
Really Agree
Kind of Agree
Kind of Disagree
Really Disagree
Spring 2012 61% 22% 7% 11% Spring 2011 60% 25% 4% 10% Spring 2010 62% 23% 8% 6% Spring 2009 63% 21% 9% 8%
Fall 2008 66% 20% 6% 8% Spring 2008 64% 18% 8% 9%
Fall 2007 70% 16% 8% 6% Spring 2007 59% 24% 11% 6%
Fall 2006 68% 16% 3% 13% 46. It is important to go to high school.
Really Agree
Kind of Agree
Kind of Disagree
Really Disagree
Spring 2012 88% 7% 1% 4% Spring 2011 92% 5% 2% 2% Spring 2010 89% 8% 2% 1% Spring 2009 87% 7% 2% 4%
Fall 2008 86% 7% 2% 5% Spring 2008 80% 9% 6% 5%
Fall 2007 89% 5% 2% 4% Spring 2007 86% 8% 4% 2%
Fall 2006 85% 11% 1% 3% 47. How often do you take books home to study?
Every Night Most Nights Some Nights Never Spring 2012 23% 25% 34% 17% Spring 2011 23% 30% 31% 16% Spring 2010 14% 22% 43% 21% Spring 2009 14% 23% 46% 17%
Fall 2008 24% 20% 44% 12%

School District of Lancaster, 2011-2012 Student Survey May 21-25, 2012 Marginal Frequency Report – MARTIN ELEMENTARY N=142
Center for Opinion Research 16 Franklin & Marshall College
Academic Aspirations 48. How far in school do you want to go?
Complete
high school
Attend vocational/technical
school
Attend 2-year college
Attend 4-year college
Attend 4-year college plus go to
grad school Spring 2012 19% 5% 15% 24% 37% Spring 2011 23% 4% 8% 26% 40% Spring 2010 25% 3% 11% 26% 35% Spring 2009 18% 0% 15% 29% 38%
Fall 2008 17% 6% 16% 26% 34% Spring 2008 18% 6% 13% 28% 36%
Fall 2007 19% 7% 10% 30% 33% Spring 2007 17% 2% 13% 24% 44%
Fall 2006 20% 5% 16% 22% 37% 49. How important do you believe getting a college education is to your future success? Would you say it is...
Very
important Somewhat important
Not very important
Not important at
all Spring 2012 92% 4% 2% 1% Spring 2011 88% 8% 2% 2% Spring 2010 88% 7% 4% 2% Spring 2009 89% 8% 1% 2%
Fall 2008 83% 10% 3% 4% Spring 2008 80% 16% 2% 3%
Fall 2007 87% 6% 4% 3% Spring 2007 87% 10% 3% 1%
Fall 2006 86% 9% 2% 2% 50. How important would your parent/guardian say getting a college education is to your future success? Would your parents say it is...
Very
important Somewhat important
Not very important
Not important at
all Spring 2012 92% 5% 1% 2% Spring 2011 90% 6% 1% 3% Spring 2010 91% 8% 2% 0% Spring 2009 88% 6% 3% 3%
Fall 2008 92% 5% 1% 3% Spring 2008 91% 6% 2% 2%
Fall 2007 83% 12% 2% 3% Spring 2007 88% 10% 0% 3%
Fall 2006 87% 7% 5% 2%

School District of Lancaster, 2011-2012 Student Survey May 21-25, 2012 Marginal Frequency Report – MARTIN ELEMENTARY N=142
Center for Opinion Research 17 Franklin & Marshall College
51. How important would your teachers say getting a college education is to your future success? Would your teachers say it is...
Very
important Somewhat important
Not very important
Not important at
all Spring 2012 92% 5% 1% 2% Spring 2011 96% 3% 1% 1% Spring 2010 87% 11% 2% 0% Spring 2009 90% 6% 2% 2%
Fall 2008 85% 9% 3% 3% Spring 2008 84% 10% 4% 2%
Fall 2007 87% 11% 1% 2% Spring 2007 89% 8% 1% 2%
Fall 2006 91% 6% 1% 2% Perceptions of Police Do you agree or disagree with the following statements about police officers? 52. I respect police officers.
Really Agree
Kind of Agree
Kind of Disagree
Really Disagree
Spring 2012 88% 6% 2% 4% Spring 2011 86% 8% 3% 3% Spring 2010 79% 8% 8% 4% Spring 2009 80% 15% 1% 5%
Fall 2008 89% 6% 2% 3% Spring 2008 75% 11% 6% 8%
Fall 2007 81% 10% 6% 3% Spring 2007 80% 12% 4% 4%
Fall 2006 87% 9% 4% 0% 53. I am comfortable approaching police officers.
Really Agree
Kind of Agree
Kind of Disagree
Really Disagree
Spring 2012 62% 20% 9% 10% Spring 2011 64% 22% 4% 10% Spring 2010 53% 26% 9% 11% Spring 2009 55% 26% 4% 15%
Fall 2008 62% 26% 3% 9% Spring 2008 55% 27% 11% 7%
Fall 2007 55% 21% 10% 14% Spring 2007 51% 31% 4% 14%
Fall 2006 57% 23% 10% 10%

School District of Lancaster, 2011-2012 Student Survey May 21-25, 2012 Marginal Frequency Report – MARTIN ELEMENTARY N=142
Center for Opinion Research 18 Franklin & Marshall College
54. I would consider police work as a career.
Really Agree
Kind of Agree
Kind of Disagree
Really Disagree
Spring 2012 39% 19% 14% 29% Spring 2011 41% 13% 9% 37% Spring 2010 31% 14% 16% 39% Spring 2009 30% 23% 18% 30%
Fall 2008 42% 19% 14% 25% Spring 2008 31% 18% 12% 38%
Fall 2007 34% 24% 13% 29% Spring 2007 36% 24% 8% 32%
Fall 2006 33% 24% 15% 28% 55. In general, I do not trust the police.
Really Agree
Kind of Agree
Kind of Disagree
Really Disagree
Spring 2012 11% 5% 7% 76% Spring 2011 12% 7% 11% 70% Spring 2010 11% 7% 10% 72% Spring 2009 12% 13% 13% 62%
Fall 2008 16% 6% 15% 63% Spring 2008 13% 8% 14% 65%
Fall 2007 11% 11% 10% 68% Spring 2007 7% 7% 18% 68%
Fall 2006 12% 12% 12% 65% 56. Police do not belong in schools unless there has been a crime.
Really Agree
Kind of Agree
Kind of Disagree
Really Disagree
Spring 2012 30% 15% 14% 40% Spring 2011 26% 16% 12% 45% Spring 2010 33% 12% 18% 37% Spring 2009 24% 16% 15% 46%
Fall 2008 27% 10% 14% 50% Spring 2008 27% 10% 19% 44%
Fall 2007 29% 18% 10% 42% Spring 2007 22% 16% 21% 40%
Fall 2006 22% 14% 19% 46%

Report K
Marginal Frequency Report Price Elementary School

School District of Lancaster, 2011-2012 Student Survey May 21-25, 2012 Marginal Frequency Report – PRICE ELEMENTARY N=158
Center for Opinion Research 1 Franklin & Marshall College
School Climate Do you agree or disagree with the following statements? 1. I feel safe at this school.
Really Agree
Kind of Agree
Kind of Disagree
Really Disagree
Spring 2012 58% 28% 10% 4% Spring 2011 56% 30% 10% 4% Spring 2010 44% 37% 13% 6% Spring 2009 40% 33% 17% 10%
Fall 2008 50% 24% 10% 16% Spring 2008 28% 44% 17% 11%
Fall 2007 37% 44% 12% 6% Spring 2007 36% 34% 20% 10%
Fall 2006 57% 29% 10% 5% 2. I feel safe going to and from school.
Really Agree
Kind of Agree
Kind of Disagree
Really Disagree
Spring 2012 63% 24% 5% 8% Spring 2011 59% 30% 7% 4% Spring 2010 50% 34% 7% 9% Spring 2009 49% 29% 18% 5%
Fall 2008 53% 26% 14% 8% Spring 2008 56% 28% 12% 4%
Fall 2007 53% 30% 11% 5% Spring 2007 41% 36% 14% 10%
Fall 2006 52% 33% 10% 5% 3. Students get along well with each other.
Really Agree
Kind of Agree
Kind of Disagree
Really Disagree
Spring 2012 17% 31% 36% 16% Spring 2011 8% 42% 34% 16% Spring 2010 12% 28% 38% 22% Spring 2009 7% 26% 33% 33%
Fall 2008 20% 31% 24% 25% Spring 2008 2% 23% 38% 37%
Fall 2007 9% 24% 30% 38% Spring 2007 7% 28% 37% 28%
Fall 2006 5% 14% 62% 19%
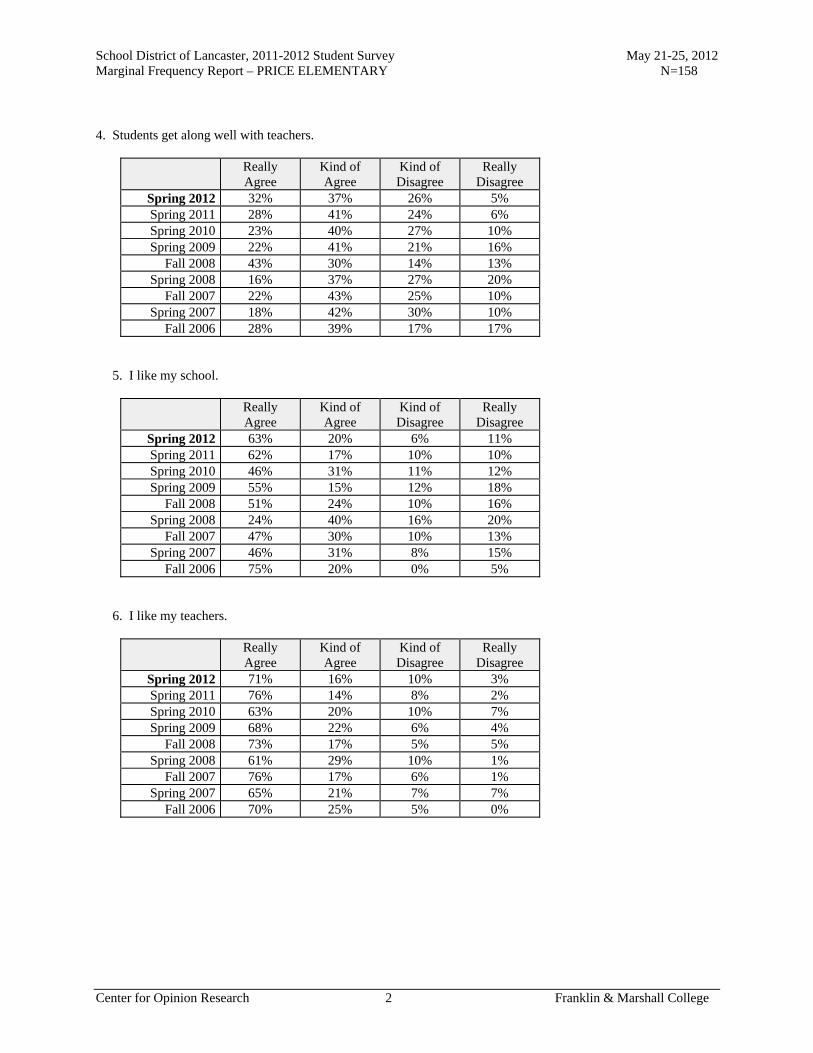
School District of Lancaster, 2011-2012 Student Survey May 21-25, 2012 Marginal Frequency Report – PRICE ELEMENTARY N=158
Center for Opinion Research 2 Franklin & Marshall College
4. Students get along well with teachers.
Really Agree
Kind of Agree
Kind of Disagree
Really Disagree
Spring 2012 32% 37% 26% 5% Spring 2011 28% 41% 24% 6% Spring 2010 23% 40% 27% 10% Spring 2009 22% 41% 21% 16%
Fall 2008 43% 30% 14% 13% Spring 2008 16% 37% 27% 20%
Fall 2007 22% 43% 25% 10% Spring 2007 18% 42% 30% 10%
Fall 2006 28% 39% 17% 17% 5. I like my school.
Really Agree
Kind of Agree
Kind of Disagree
Really Disagree
Spring 2012 63% 20% 6% 11% Spring 2011 62% 17% 10% 10% Spring 2010 46% 31% 11% 12% Spring 2009 55% 15% 12% 18%
Fall 2008 51% 24% 10% 16% Spring 2008 24% 40% 16% 20%
Fall 2007 47% 30% 10% 13% Spring 2007 46% 31% 8% 15%
Fall 2006 75% 20% 0% 5% 6. I like my teachers.
Really Agree
Kind of Agree
Kind of Disagree
Really Disagree
Spring 2012 71% 16% 10% 3% Spring 2011 76% 14% 8% 2% Spring 2010 63% 20% 10% 7% Spring 2009 68% 22% 6% 4%
Fall 2008 73% 17% 5% 5% Spring 2008 61% 29% 10% 1%
Fall 2007 76% 17% 6% 1% Spring 2007 65% 21% 7% 7%
Fall 2006 70% 25% 5% 0%

School District of Lancaster, 2011-2012 Student Survey May 21-25, 2012 Marginal Frequency Report – PRICE ELEMENTARY N=158
Center for Opinion Research 3 Franklin & Marshall College
7. There is a teacher or some other adult at this school who really cares about me.
Really Agree
Kind of Agree
Kind of Disagree
Really Disagree
Spring 2012 71% 21% 3% 5% Spring 2011 75% 15% 5% 5% Spring 2010 72% 17% 5% 6% Spring 2009 67% 22% 5% 6%
Fall 2008 66% 22% 6% 6% Spring 2008 64% 26% 5% 5%
Fall 2007 72% 16% 7% 5% Spring 2007 59% 21% 8% 12%
Fall 2006 76% 19% 5% 0% 8. There is a teacher or some other adult at this school who cares when I am not here.
Really Agree
Kind of Agree
Kind of Disagree
Really Disagree
Spring 2012 41% 26% 14% 19% Spring 2011 36% 35% 12% 17% Spring 2010 49% 23% 11% 17% Spring 2009 50% 25% 10% 16%
Fall 2008 49% 23% 15% 13% Spring 2008 31% 33% 12% 25%
Fall 2007 47% 21% 9% 23% Spring 2007 39% 25% 14% 22%
Fall 2006 40% 20% 0% 40% 9. There is a teacher or some other adult at this school who listens to me when I have something to say.
Really Agree
Kind of Agree
Kind of Disagree
Really Disagree
Spring 2012 78% 15% 4% 3% Spring 2011 68% 24% 5% 3% Spring 2010 63% 25% 8% 4% Spring 2009 58% 23% 10% 10%
Fall 2008 65% 24% 5% 6% Spring 2008 57% 30% 8% 5%
Fall 2007 64% 20% 9% 7% Spring 2007 58% 29% 7% 6%
Fall 2006 48% 14% 14% 24%
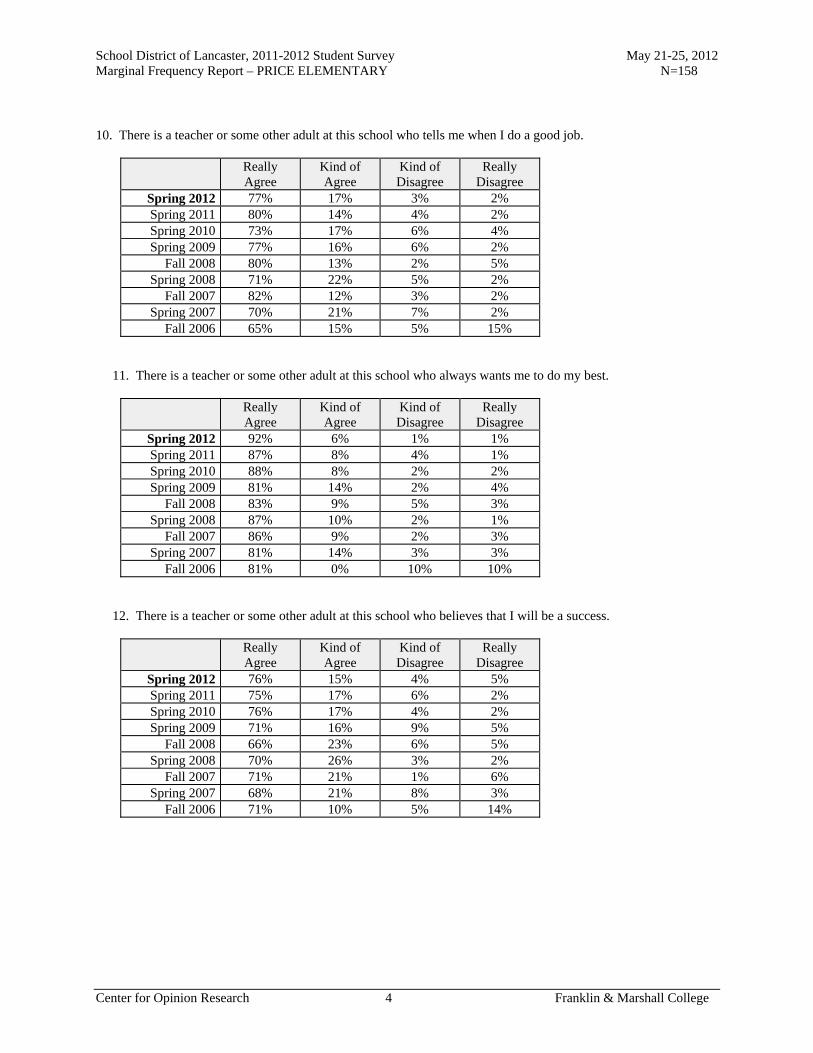
School District of Lancaster, 2011-2012 Student Survey May 21-25, 2012 Marginal Frequency Report – PRICE ELEMENTARY N=158
Center for Opinion Research 4 Franklin & Marshall College
10. There is a teacher or some other adult at this school who tells me when I do a good job.
Really Agree
Kind of Agree
Kind of Disagree
Really Disagree
Spring 2012 77% 17% 3% 2% Spring 2011 80% 14% 4% 2% Spring 2010 73% 17% 6% 4% Spring 2009 77% 16% 6% 2%
Fall 2008 80% 13% 2% 5% Spring 2008 71% 22% 5% 2%
Fall 2007 82% 12% 3% 2% Spring 2007 70% 21% 7% 2%
Fall 2006 65% 15% 5% 15% 11. There is a teacher or some other adult at this school who always wants me to do my best.
Really Agree
Kind of Agree
Kind of Disagree
Really Disagree
Spring 2012 92% 6% 1% 1% Spring 2011 87% 8% 4% 1% Spring 2010 88% 8% 2% 2% Spring 2009 81% 14% 2% 4%
Fall 2008 83% 9% 5% 3% Spring 2008 87% 10% 2% 1%
Fall 2007 86% 9% 2% 3% Spring 2007 81% 14% 3% 3%
Fall 2006 81% 0% 10% 10% 12. There is a teacher or some other adult at this school who believes that I will be a success.
Really Agree
Kind of Agree
Kind of Disagree
Really Disagree
Spring 2012 76% 15% 4% 5% Spring 2011 75% 17% 6% 2% Spring 2010 76% 17% 4% 2% Spring 2009 71% 16% 9% 5%
Fall 2008 66% 23% 6% 5% Spring 2008 70% 26% 3% 2%
Fall 2007 71% 21% 1% 6% Spring 2007 68% 21% 8% 3%
Fall 2006 71% 10% 5% 14%

School District of Lancaster, 2011-2012 Student Survey May 21-25, 2012 Marginal Frequency Report – PRICE ELEMENTARY N=158
Center for Opinion Research 5 Franklin & Marshall College
13. Students in this school really listen to teachers.
Really Agree
Kind of Agree
Kind of Disagree
Really Disagree
Spring 2012 17% 32% 37% 13% Spring 2011 6% 48% 29% 17% Spring 2010 8% 34% 38% 20% Spring 2009 13% 32% 32% 24%
Fall 2008 19% 32% 23% 25% Spring 2008 3% 22% 46% 28%
Fall 2007 15% 26% 29% 29% Spring 2007 8% 25% 41% 26%
Fall 2006 24% 24% 38% 14% 14. Most teachers make learning interesting.
Really Agree
Kind of Agree
Kind of Disagree
Really Disagree
Spring 2012 50% 36% 9% 5% Spring 2011 56% 29% 10% 5% Spring 2010 49% 30% 12% 9% Spring 2009 57% 29% 12% 2%
Fall 2008 61% 24% 8% 7% Spring 2008 46% 38% 12% 5%
Fall 2007 62% 27% 7% 5% Spring 2007 50% 33% 8% 8%
Fall 2006 71% 19% 10% 0% 15. This school is always getting better.
Really Agree
Kind of Agree
Kind of Disagree
Really Disagree
Spring 2012 36% 36% 14% 14% Spring 2011 36% 36% 12% 16% Spring 2010 31% 25% 26% 18% Spring 2009 27% 24% 23% 26%
Fall 2008 34% 26% 13% 28% Spring 2008 12% 35% 28% 25%
Fall 2007 28% 29% 18% 24% Spring 2007 26% 30% 27% 18%
Fall 2006 43% 43% 5% 10%
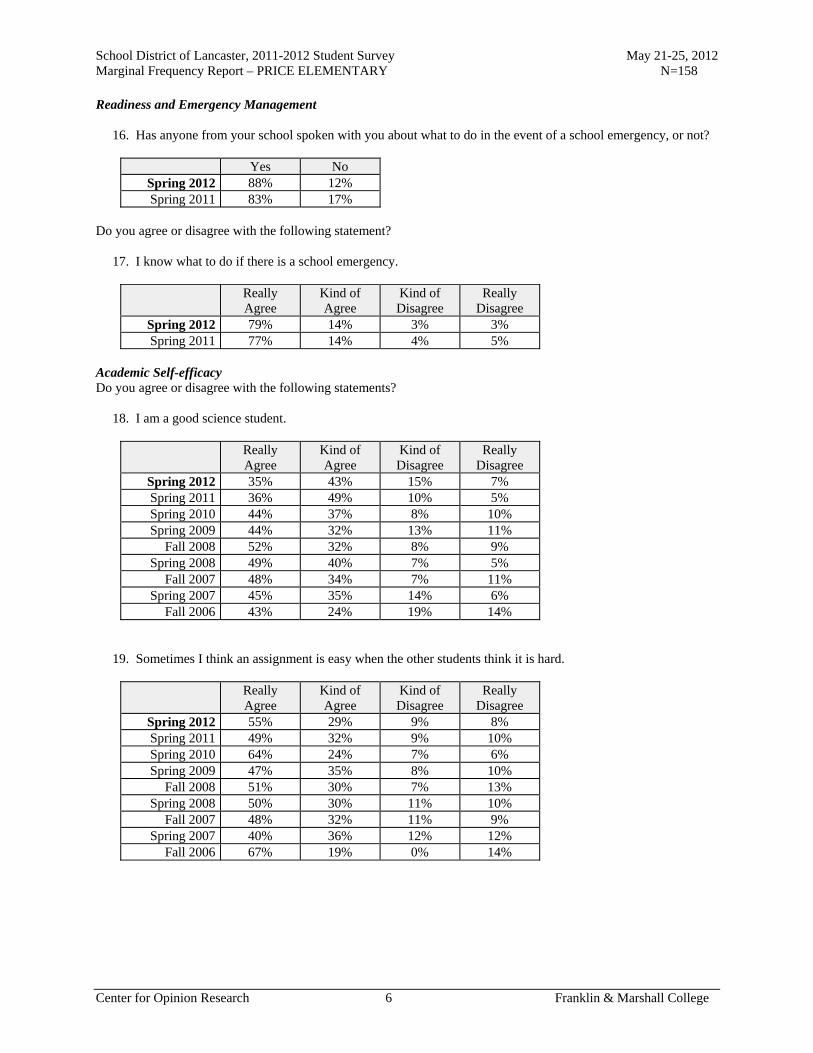
School District of Lancaster, 2011-2012 Student Survey May 21-25, 2012 Marginal Frequency Report – PRICE ELEMENTARY N=158
Center for Opinion Research 6 Franklin & Marshall College
Readiness and Emergency Management 16. Has anyone from your school spoken with you about what to do in the event of a school emergency, or not?
Yes No Spring 2012 88% 12% Spring 2011 83% 17%
Do you agree or disagree with the following statement? 17. I know what to do if there is a school emergency.
Really Agree
Kind of Agree
Kind of Disagree
Really Disagree
Spring 2012 79% 14% 3% 3% Spring 2011 77% 14% 4% 5%
Academic Self-efficacy Do you agree or disagree with the following statements? 18. I am a good science student.
Really Agree
Kind of Agree
Kind of Disagree
Really Disagree
Spring 2012 35% 43% 15% 7% Spring 2011 36% 49% 10% 5% Spring 2010 44% 37% 8% 10% Spring 2009 44% 32% 13% 11%
Fall 2008 52% 32% 8% 9% Spring 2008 49% 40% 7% 5%
Fall 2007 48% 34% 7% 11% Spring 2007 45% 35% 14% 6%
Fall 2006 43% 24% 19% 14% 19. Sometimes I think an assignment is easy when the other students think it is hard.
Really Agree
Kind of Agree
Kind of Disagree
Really Disagree
Spring 2012 55% 29% 9% 8% Spring 2011 49% 32% 9% 10% Spring 2010 64% 24% 7% 6% Spring 2009 47% 35% 8% 10%
Fall 2008 51% 30% 7% 13% Spring 2008 50% 30% 11% 10%
Fall 2007 48% 32% 11% 9% Spring 2007 40% 36% 12% 12%
Fall 2006 67% 19% 0% 14%

School District of Lancaster, 2011-2012 Student Survey May 21-25, 2012 Marginal Frequency Report – PRICE ELEMENTARY N=158
Center for Opinion Research 7 Franklin & Marshall College
20. I am good social studies student.
Really Agree
Kind of Agree
Kind of Disagree
Really Disagree
Spring 2012 34% 41% 21% 4% Spring 2011 41% 46% 8% 6% Spring 2010 43% 35% 12% 10% Spring 2009 48% 35% 8% 8%
Fall 2008 52% 28% 14% 6% Spring 2008 48% 37% 10% 6%
Fall 2007 42% 35% 12% 11% Spring 2007 42% 33% 16% 9%
Fall 2006 52% 19% 5% 24% 21. My teacher thinks I am smart.
Really Agree
Kind of Agree
Kind of Disagree
Really Disagree
Spring 2012 64% 28% 3% 4% Spring 2011 62% 28% 6% 4% Spring 2010 72% 18% 7% 3% Spring 2009 67% 22% 6% 6%
Fall 2008 69% 19% 5% 7% Spring 2008 62% 29% 6% 3%
Fall 2007 69% 24% 3% 4% Spring 2007 66% 20% 6% 9%
Fall 2006 62% 19% 19% 0% 22. I am a good math student.
Really Agree
Kind of Agree
Kind of Disagree
Really Disagree
Spring 2012 52% 24% 14% 10% Spring 2011 57% 24% 10% 9% Spring 2010 58% 24% 10% 8% Spring 2009 55% 28% 9% 8%
Fall 2008 58% 27% 7% 8% Spring 2008 60% 26% 9% 5%
Fall 2007 46% 30% 11% 12% Spring 2007 53% 30% 9% 8%
Fall 2006 57% 14% 5% 24%

School District of Lancaster, 2011-2012 Student Survey May 21-25, 2012 Marginal Frequency Report – PRICE ELEMENTARY N=158
Center for Opinion Research 8 Franklin & Marshall College
23. My classmates usually get better grades than I do.
Really Agree
Kind of Agree
Kind of Disagree
Really Disagree
Spring 2012 22% 30% 27% 21% Spring 2011 18% 38% 29% 16% Spring 2010 26% 29% 20% 25% Spring 2009 23% 30% 24% 23%
Fall 2008 25% 25% 27% 24% Spring 2008 13% 27% 40% 20%
Fall 2007 20% 31% 24% 25% Spring 2007 23% 27% 27% 24%
Fall 2006 14% 33% 43% 10% 24. I usually understand my homework assignments.
Really Agree
Kind of Agree
Kind of Disagree
Really Disagree
Spring 2012 53% 33% 7% 7% Spring 2011 49% 33% 14% 4% Spring 2010 44% 35% 16% 5% Spring 2009 47% 29% 14% 10%
Fall 2008 52% 33% 7% 8% Spring 2008 50% 37% 9% 5%
Fall 2007 53% 31% 9% 7% Spring 2007 50% 27% 15% 8%
Fall 2006 52% 29% 10% 10% 25. I could get the best grades in class if I tried hard enough.
Really Agree
Kind of Agree
Kind of Disagree
Really Disagree
Spring 2012 75% 20% 3% 2% Spring 2011 80% 11% 5% 4% Spring 2010 80% 13% 4% 3% Spring 2009 73% 17% 6% 5%
Fall 2008 77% 13% 4% 6% Spring 2008 74% 21% 4% 2%
Fall 2007 83% 13% 1% 3% Spring 2007 73% 14% 6% 7%
Fall 2006 65% 15% 15% 5%

School District of Lancaster, 2011-2012 Student Survey May 21-25, 2012 Marginal Frequency Report – PRICE ELEMENTARY N=158
Center for Opinion Research 9 Franklin & Marshall College
26. I am a good reading student.
Really Agree
Kind of Agree
Kind of Disagree
Really Disagree
Spring 2012 64% 29% 5% 1% Spring 2011 59% 29% 7% 6% Spring 2010 56% 30% 6% 7% Spring 2009 58% 27% 6% 9%
Fall 2008 66% 16% 9% 9% Spring 2008 54% 28% 10% 8%
Fall 2007 55% 32% 5% 7% Spring 2007 56% 26% 13% 6%
Fall 2006 60% 35% 0% 5% 27. It is not hard for me to get good grades in school.
Really Agree
Kind of Agree
Kind of Disagree
Really Disagree
Spring 2012 55% 30% 10% 6% Spring 2011 42% 36% 15% 7% Spring 2010 52% 26% 14% 8% Spring 2009 43% 34% 11% 12%
Fall 2008 47% 30% 11% 11% Spring 2008 46% 32% 12% 10%
Fall 2007 49% 32% 12% 7% Spring 2007 35% 35% 20% 10%
Fall 2006 43% 33% 14% 10% 28. I am smart.
Really Agree
Kind of Agree
Kind of Disagree
Really Disagree
Spring 2012 66% 27% 4% 4% Spring 2011 62% 30% 4% 3% Spring 2010 72% 20% 4% 4% Spring 2009 66% 18% 8% 7%
Fall 2008 66% 22% 7% 5% Spring 2008 67% 23% 8% 3%
Fall 2007 60% 31% 3% 6% Spring 2007 62% 26% 6% 6%
Fall 2006 48% 48% 0% 5%
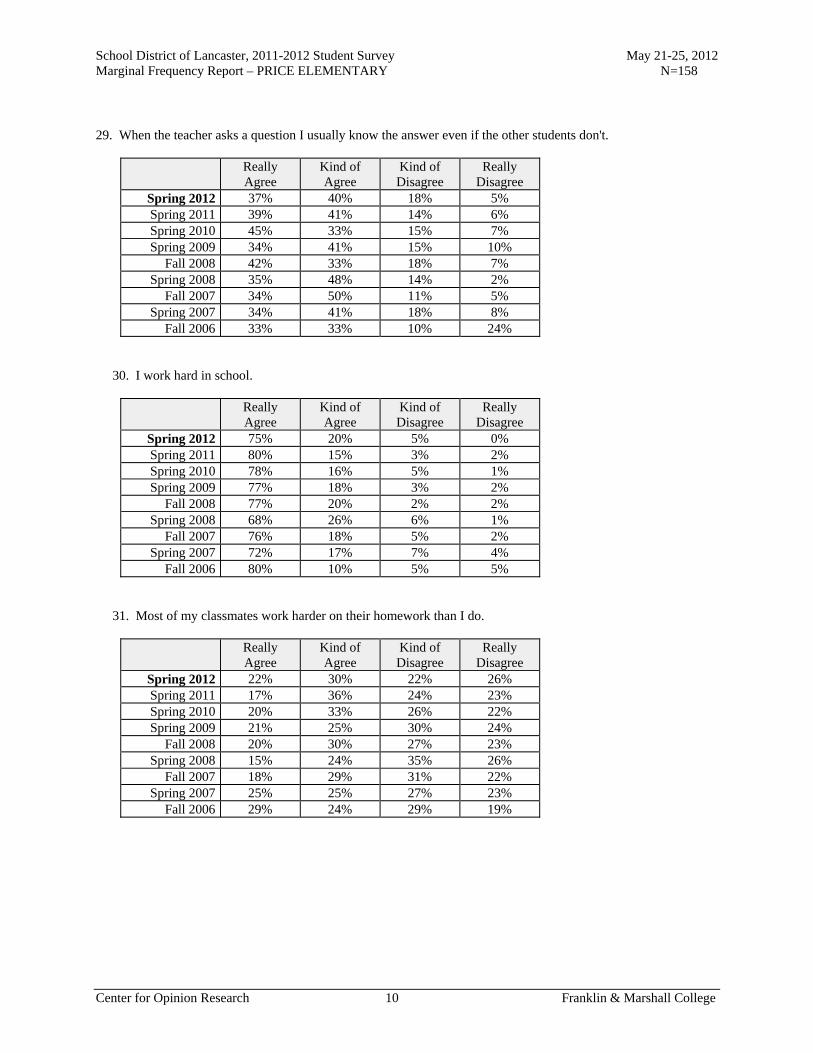
School District of Lancaster, 2011-2012 Student Survey May 21-25, 2012 Marginal Frequency Report – PRICE ELEMENTARY N=158
Center for Opinion Research 10 Franklin & Marshall College
29. When the teacher asks a question I usually know the answer even if the other students don't.
Really Agree
Kind of Agree
Kind of Disagree
Really Disagree
Spring 2012 37% 40% 18% 5% Spring 2011 39% 41% 14% 6% Spring 2010 45% 33% 15% 7% Spring 2009 34% 41% 15% 10%
Fall 2008 42% 33% 18% 7% Spring 2008 35% 48% 14% 2%
Fall 2007 34% 50% 11% 5% Spring 2007 34% 41% 18% 8%
Fall 2006 33% 33% 10% 24% 30. I work hard in school.
Really Agree
Kind of Agree
Kind of Disagree
Really Disagree
Spring 2012 75% 20% 5% 0% Spring 2011 80% 15% 3% 2% Spring 2010 78% 16% 5% 1% Spring 2009 77% 18% 3% 2%
Fall 2008 77% 20% 2% 2% Spring 2008 68% 26% 6% 1%
Fall 2007 76% 18% 5% 2% Spring 2007 72% 17% 7% 4%
Fall 2006 80% 10% 5% 5% 31. Most of my classmates work harder on their homework than I do.
Really Agree
Kind of Agree
Kind of Disagree
Really Disagree
Spring 2012 22% 30% 22% 26% Spring 2011 17% 36% 24% 23% Spring 2010 20% 33% 26% 22% Spring 2009 21% 25% 30% 24%
Fall 2008 20% 30% 27% 23% Spring 2008 15% 24% 35% 26%
Fall 2007 18% 29% 31% 22% Spring 2007 25% 25% 27% 23%
Fall 2006 29% 24% 29% 19%
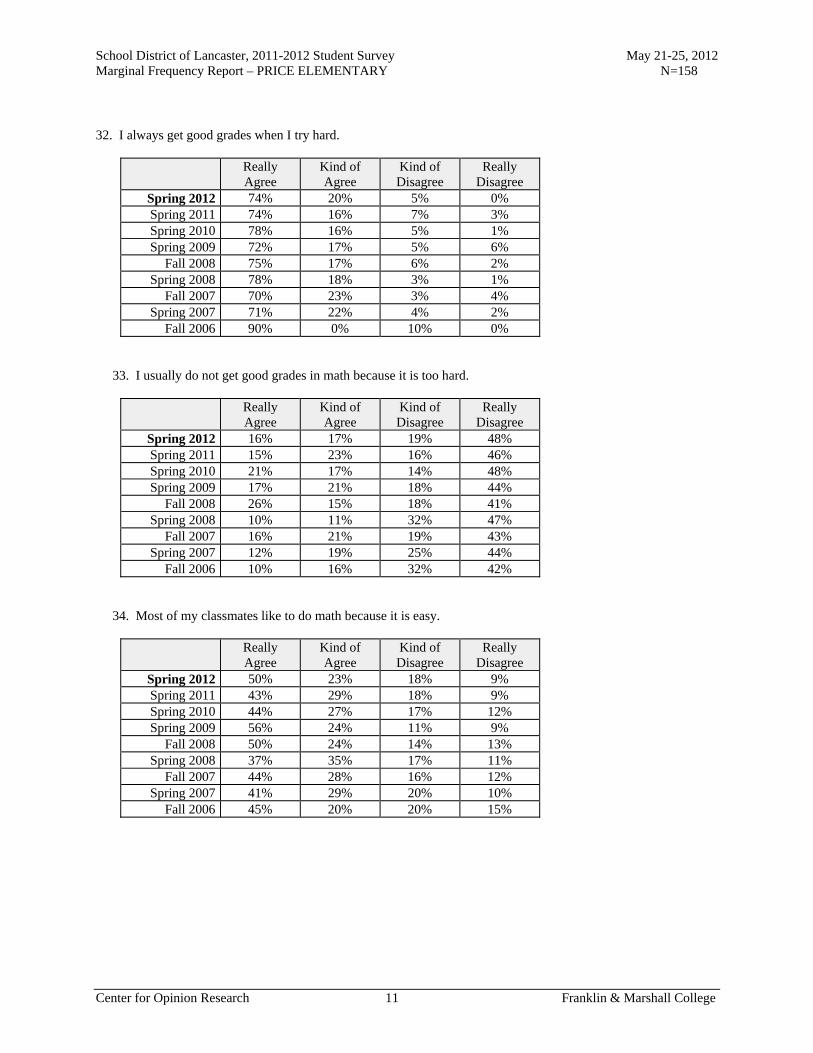
School District of Lancaster, 2011-2012 Student Survey May 21-25, 2012 Marginal Frequency Report – PRICE ELEMENTARY N=158
Center for Opinion Research 11 Franklin & Marshall College
32. I always get good grades when I try hard.
Really Agree
Kind of Agree
Kind of Disagree
Really Disagree
Spring 2012 74% 20% 5% 0% Spring 2011 74% 16% 7% 3% Spring 2010 78% 16% 5% 1% Spring 2009 72% 17% 5% 6%
Fall 2008 75% 17% 6% 2% Spring 2008 78% 18% 3% 1%
Fall 2007 70% 23% 3% 4% Spring 2007 71% 22% 4% 2%
Fall 2006 90% 0% 10% 0% 33. I usually do not get good grades in math because it is too hard.
Really Agree
Kind of Agree
Kind of Disagree
Really Disagree
Spring 2012 16% 17% 19% 48% Spring 2011 15% 23% 16% 46% Spring 2010 21% 17% 14% 48% Spring 2009 17% 21% 18% 44%
Fall 2008 26% 15% 18% 41% Spring 2008 10% 11% 32% 47%
Fall 2007 16% 21% 19% 43% Spring 2007 12% 19% 25% 44%
Fall 2006 10% 16% 32% 42% 34. Most of my classmates like to do math because it is easy.
Really Agree
Kind of Agree
Kind of Disagree
Really Disagree
Spring 2012 50% 23% 18% 9% Spring 2011 43% 29% 18% 9% Spring 2010 44% 27% 17% 12% Spring 2009 56% 24% 11% 9%
Fall 2008 50% 24% 14% 13% Spring 2008 37% 35% 17% 11%
Fall 2007 44% 28% 16% 12% Spring 2007 41% 29% 20% 10%
Fall 2006 45% 20% 20% 15%
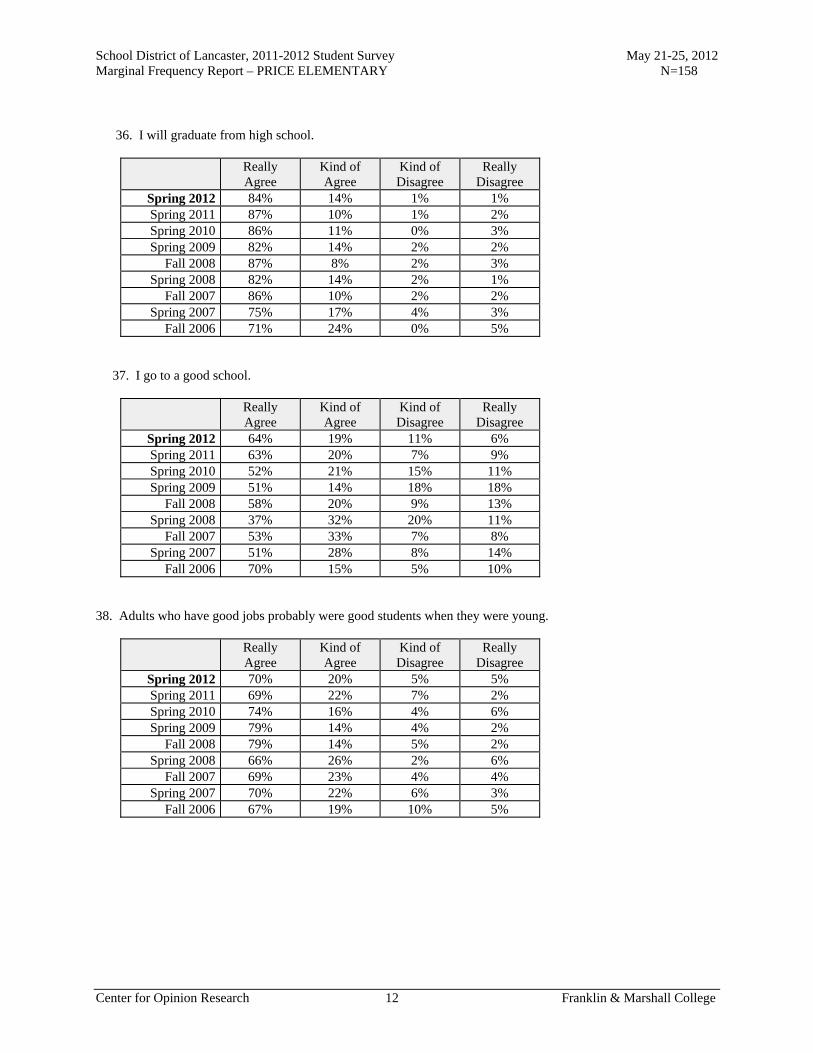
School District of Lancaster, 2011-2012 Student Survey May 21-25, 2012 Marginal Frequency Report – PRICE ELEMENTARY N=158
Center for Opinion Research 12 Franklin & Marshall College
36. I will graduate from high school.
Really Agree
Kind of Agree
Kind of Disagree
Really Disagree
Spring 2012 84% 14% 1% 1% Spring 2011 87% 10% 1% 2% Spring 2010 86% 11% 0% 3% Spring 2009 82% 14% 2% 2%
Fall 2008 87% 8% 2% 3% Spring 2008 82% 14% 2% 1%
Fall 2007 86% 10% 2% 2% Spring 2007 75% 17% 4% 3%
Fall 2006 71% 24% 0% 5% 37. I go to a good school.
Really Agree
Kind of Agree
Kind of Disagree
Really Disagree
Spring 2012 64% 19% 11% 6% Spring 2011 63% 20% 7% 9% Spring 2010 52% 21% 15% 11% Spring 2009 51% 14% 18% 18%
Fall 2008 58% 20% 9% 13% Spring 2008 37% 32% 20% 11%
Fall 2007 53% 33% 7% 8% Spring 2007 51% 28% 8% 14%
Fall 2006 70% 15% 5% 10% 38. Adults who have good jobs probably were good students when they were young.
Really Agree
Kind of Agree
Kind of Disagree
Really Disagree
Spring 2012 70% 20% 5% 5% Spring 2011 69% 22% 7% 2% Spring 2010 74% 16% 4% 6% Spring 2009 79% 14% 4% 2%
Fall 2008 79% 14% 5% 2% Spring 2008 66% 26% 2% 6%
Fall 2007 69% 23% 4% 4% Spring 2007 70% 22% 6% 3%
Fall 2006 67% 19% 10% 5%

School District of Lancaster, 2011-2012 Student Survey May 21-25, 2012 Marginal Frequency Report – PRICE ELEMENTARY N=158
Center for Opinion Research 13 Franklin & Marshall College
39. When I am old enough, I will go to college.
Really Agree
Kind of Agree
Kind of Disagree
Really Disagree
Spring 2012 84% 12% 1% 3% Spring 2011 84% 7% 2% 6% Spring 2010 83% 12% 4% 1% Spring 2009 74% 15% 6% 4%
Fall 2008 78% 11% 2% 9% Spring 2008 73% 18% 3% 5%
Fall 2007 82% 7% 6% 6% Spring 2007 78% 12% 6% 3%
Fall 2006 55% 35% 0% 10% 40. No one cares if I do well in school.
Really Agree
Kind of Agree
Kind of Disagree
Really Disagree
Spring 2012 11% 9% 6% 74% Spring 2011 9% 10% 17% 64% Spring 2010 18% 7% 10% 66% Spring 2009 18% 8% 13% 61%
Fall 2008 21% 8% 18% 53% Spring 2008 5% 6% 8% 82%
Fall 2007 12% 10% 6% 72% Spring 2007 8% 7% 14% 71%
Fall 2006 5% 24% 5% 67% 41. What I learn in school is not important.
Really Agree
Kind of Agree
Kind of Disagree
Really Disagree
Spring 2012 8% 4% 2% 86% Spring 2011 9% 4% 4% 83% Spring 2010 11% 4% 7% 78% Spring 2009 11% 2% 5% 82%
Fall 2008 17% 5% 5% 73% Spring 2008 3% 3% 8% 86%
Fall 2007 15% 3% 5% 77% Spring 2007 8% 4% 9% 79%
Fall 2006 5% 5% 14% 76%
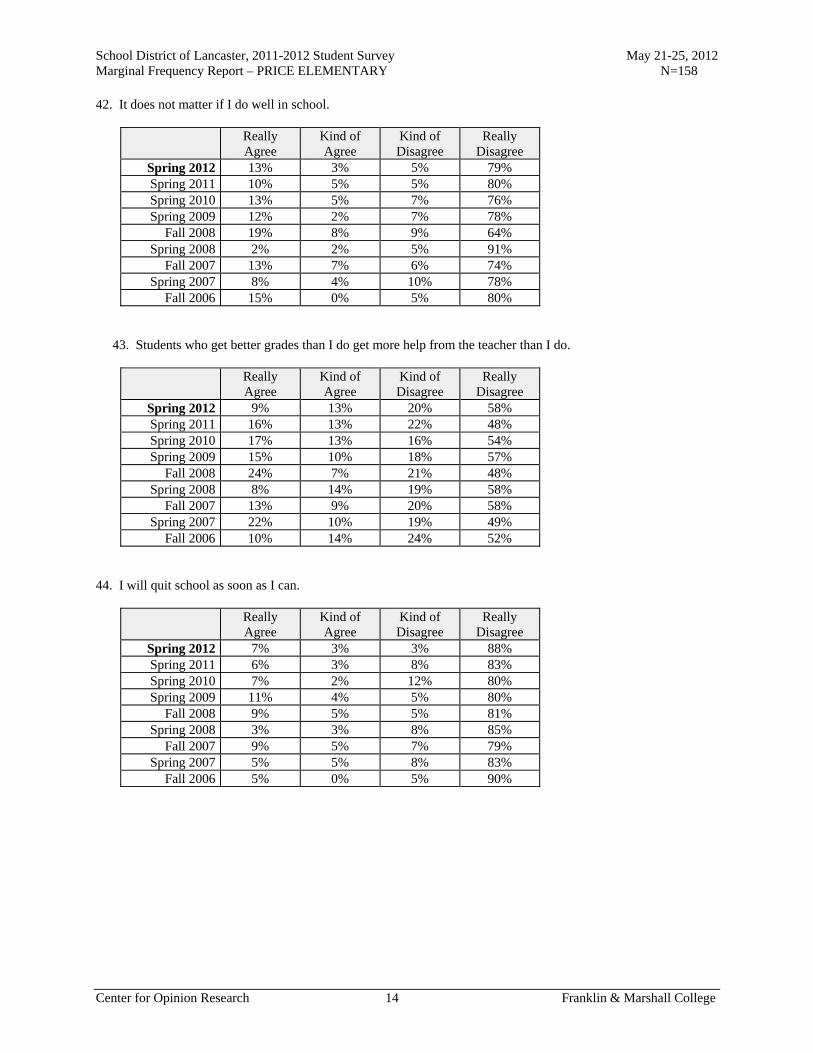
School District of Lancaster, 2011-2012 Student Survey May 21-25, 2012 Marginal Frequency Report – PRICE ELEMENTARY N=158
Center for Opinion Research 14 Franklin & Marshall College
42. It does not matter if I do well in school.
Really Agree
Kind of Agree
Kind of Disagree
Really Disagree
Spring 2012 13% 3% 5% 79% Spring 2011 10% 5% 5% 80% Spring 2010 13% 5% 7% 76% Spring 2009 12% 2% 7% 78%
Fall 2008 19% 8% 9% 64% Spring 2008 2% 2% 5% 91%
Fall 2007 13% 7% 6% 74% Spring 2007 8% 4% 10% 78%
Fall 2006 15% 0% 5% 80% 43. Students who get better grades than I do get more help from the teacher than I do.
Really Agree
Kind of Agree
Kind of Disagree
Really Disagree
Spring 2012 9% 13% 20% 58% Spring 2011 16% 13% 22% 48% Spring 2010 17% 13% 16% 54% Spring 2009 15% 10% 18% 57%
Fall 2008 24% 7% 21% 48% Spring 2008 8% 14% 19% 58%
Fall 2007 13% 9% 20% 58% Spring 2007 22% 10% 19% 49%
Fall 2006 10% 14% 24% 52% 44. I will quit school as soon as I can.
Really Agree
Kind of Agree
Kind of Disagree
Really Disagree
Spring 2012 7% 3% 3% 88% Spring 2011 6% 3% 8% 83% Spring 2010 7% 2% 12% 80% Spring 2009 11% 4% 5% 80%
Fall 2008 9% 5% 5% 81% Spring 2008 3% 3% 8% 85%
Fall 2007 9% 5% 7% 79% Spring 2007 5% 5% 8% 83%
Fall 2006 5% 0% 5% 90%

School District of Lancaster, 2011-2012 Student Survey May 21-25, 2012 Marginal Frequency Report – PRICE ELEMENTARY N=158
Center for Opinion Research 15 Franklin & Marshall College
45. Teachers like students even if they do not always make good grades.
Really Agree
Kind of Agree
Kind of Disagree
Really Disagree
Spring 2012 65% 15% 13% 8% Spring 2011 58% 21% 9% 11% Spring 2010 68% 16% 8% 9% Spring 2009 63% 18% 8% 11%
Fall 2008 68% 19% 5% 8% Spring 2008 65% 24% 8% 3%
Fall 2007 69% 19% 5% 7% Spring 2007 65% 17% 7% 10%
Fall 2006 90% 5% 5% 0% 46. It is important to go to high school.
Really Agree
Kind of Agree
Kind of Disagree
Really Disagree
Spring 2012 89% 8% 0% 3% Spring 2011 90% 4% 1% 4% Spring 2010 92% 6% 1% 2% Spring 2009 88% 6% 1% 5%
Fall 2008 88% 6% 3% 3% Spring 2008 92% 6% 1% 2%
Fall 2007 91% 5% 1% 3% Spring 2007 91% 4% 1% 3%
Fall 2006 90% 10% 0% 0% 47. How often do you take books home to study?
Every Night Most Nights Some Nights Never Spring 2012 15% 24% 41% 20% Spring 2011 20% 22% 39% 19% Spring 2010 23% 19% 42% 16% Spring 2009 30% 16% 39% 15%
Fall 2008 31% 21% 29% 19%

School District of Lancaster, 2011-2012 Student Survey May 21-25, 2012 Marginal Frequency Report – PRICE ELEMENTARY N=158
Center for Opinion Research 16 Franklin & Marshall College
Academic Aspirations 48. How far in school do you want to go?
Complete
high school
Attend vocational/technical
school
Attend 2-year college
Attend 4-year college
Attend 4-year college plus go to
grad school Spring 2012 20% 3% 19% 19% 39% Spring 2011 23% 4% 18% 24% 32% Spring 2010 23% 7% 16% 17% 36% Spring 2009 17% 1% 21% 17% 43%
Fall 2008 25% 4% 17% 16% 38% Spring 2008 20% 3% 18% 21% 38%
Fall 2007 30% 1% 15% 20% 34% Spring 2007 21% 3% 17% 18% 42%
Fall 2006 20% 0% 0% 35% 45% 49. How important do you believe getting a college education is to your future success? Would you say it is...
Very
important Somewhat important
Not very important
Not important at
all Spring 2012 96% 3% 1% 0% Spring 2011 91% 7% 1% 2% Spring 2010 89% 8% 2% 1% Spring 2009 84% 11% 3% 2%
Fall 2008 90% 7% 2% 1% Spring 2008 92% 6% 1% 1%
Fall 2007 89% 8% 3% 0% Spring 2007 92% 6% 1% 1%
Fall 2006 95% 5% 0% 0% 50. How important would your parent/guardian say getting a college education is to your future success? Would your parents say it is...
Very
important Somewhat important
Not very important
Not important at
all Spring 2012 97% 3% 0% 0% Spring 2011 92% 6% 1% 2% Spring 2010 96% 3% 1% 1% Spring 2009 92% 4% 2% 2%
Fall 2008 92% 6% 1% 1% Spring 2008 95% 3% 2% 0%
Fall 2007 88% 8% 2% 2% Spring 2007 90% 7% 0% 3%
Fall 2006 86% 10% 5% 0%
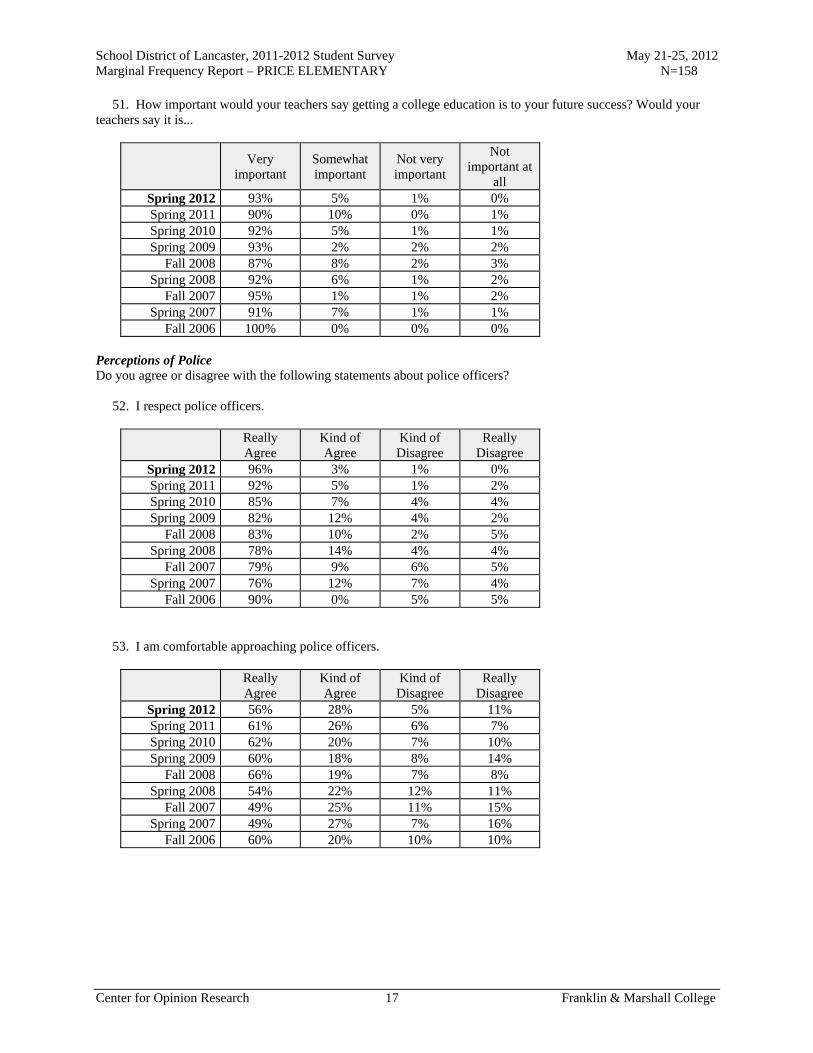
School District of Lancaster, 2011-2012 Student Survey May 21-25, 2012 Marginal Frequency Report – PRICE ELEMENTARY N=158
Center for Opinion Research 17 Franklin & Marshall College
51. How important would your teachers say getting a college education is to your future success? Would your teachers say it is...
Very
important Somewhat important
Not very important
Not important at
all Spring 2012 93% 5% 1% 0% Spring 2011 90% 10% 0% 1% Spring 2010 92% 5% 1% 1% Spring 2009 93% 2% 2% 2%
Fall 2008 87% 8% 2% 3% Spring 2008 92% 6% 1% 2%
Fall 2007 95% 1% 1% 2% Spring 2007 91% 7% 1% 1%
Fall 2006 100% 0% 0% 0% Perceptions of Police Do you agree or disagree with the following statements about police officers? 52. I respect police officers.
Really Agree
Kind of Agree
Kind of Disagree
Really Disagree
Spring 2012 96% 3% 1% 0% Spring 2011 92% 5% 1% 2% Spring 2010 85% 7% 4% 4% Spring 2009 82% 12% 4% 2%
Fall 2008 83% 10% 2% 5% Spring 2008 78% 14% 4% 4%
Fall 2007 79% 9% 6% 5% Spring 2007 76% 12% 7% 4%
Fall 2006 90% 0% 5% 5% 53. I am comfortable approaching police officers.
Really Agree
Kind of Agree
Kind of Disagree
Really Disagree
Spring 2012 56% 28% 5% 11% Spring 2011 61% 26% 6% 7% Spring 2010 62% 20% 7% 10% Spring 2009 60% 18% 8% 14%
Fall 2008 66% 19% 7% 8% Spring 2008 54% 22% 12% 11%
Fall 2007 49% 25% 11% 15% Spring 2007 49% 27% 7% 16%
Fall 2006 60% 20% 10% 10%

School District of Lancaster, 2011-2012 Student Survey May 21-25, 2012 Marginal Frequency Report – PRICE ELEMENTARY N=158
Center for Opinion Research 18 Franklin & Marshall College
54. I would consider police work as a career.
Really Agree
Kind of Agree
Kind of Disagree
Really Disagree
Spring 2012 47% 20% 9% 24% Spring 2011 42% 18% 12% 27% Spring 2010 40% 18% 10% 31% Spring 2009 43% 20% 9% 28%
Fall 2008 53% 22% 7% 18% Spring 2008 43% 21% 12% 24%
Fall 2007 50% 16% 8% 26% Spring 2007 41% 17% 15% 27%
Fall 2006 20% 10% 25% 45% 55. In general, I do not trust the police.
Really Agree
Kind of Agree
Kind of Disagree
Really Disagree
Spring 2012 12% 5% 7% 76% Spring 2011 10% 5% 12% 73% Spring 2010 14% 6% 14% 67% Spring 2009 18% 8% 8% 65%
Fall 2008 18% 9% 9% 64% Spring 2008 13% 13% 11% 63%
Fall 2007 13% 13% 8% 67% Spring 2007 16% 16% 12% 56%
Fall 2006 12% 6% 12% 71% 56. Police do not belong in schools unless there has been a crime.
Really Agree
Kind of Agree
Kind of Disagree
Really Disagree
Spring 2012 23% 11% 11% 54% Spring 2011 20% 6% 16% 58% Spring 2010 26% 8% 15% 51% Spring 2009 42% 12% 10% 35%
Fall 2008 48% 8% 9% 35% Spring 2008 46% 12% 15% 27%
Fall 2007 45% 14% 13% 28% Spring 2007 44% 15% 16% 25%
Fall 2006 21% 16% 32% 32%

Report L
Marginal Frequency Report Ross Elementary School

School District of Lancaster, 2011-2012 Student Survey May 21-25, 2012 Marginal Frequency Report – ROSS ELEMENTARY N=125
Center for Opinion Research 1 Franklin & Marshall College
School Climate Do you agree or disagree with the following statements? 1. I feel safe at this school.
Really Agree
Kind of Agree
Kind of Disagree
Really Disagree
Spring 2012 68% 26% 5% 2% Spring 2011 56% 30% 9% 5% Spring 2010 52% 36% 8% 5% Spring 2009 58% 24% 9% 9%
Fall 2008 55% 29% 10% 6% Spring 2008 45% 31% 12% 11%
Fall 2007 49% 28% 10% 13% Spring 2007 34% 38% 11% 17%
Fall 2006 56% 30% 10% 4% 2. I feel safe going to and from school.
Really Agree
Kind of Agree
Kind of Disagree
Really Disagree
Spring 2012 62% 26% 10% 3% Spring 2011 51% 32% 10% 6% Spring 2010 54% 28% 11% 6% Spring 2009 50% 31% 9% 10%
Fall 2008 55% 27% 10% 8% Spring 2008 53% 26% 12% 9%
Fall 2007 58% 22% 11% 9% Spring 2007 47% 26% 18% 9%
Fall 2006 52% 32% 6% 9% 3. Students get along well with each other.
Really Agree
Kind of Agree
Kind of Disagree
Really Disagree
Spring 2012 10% 45% 36% 10% Spring 2011 14% 35% 29% 21% Spring 2010 10% 37% 34% 20% Spring 2009 11% 32% 29% 28%
Fall 2008 22% 34% 23% 21% Spring 2008 11% 26% 31% 32%
Fall 2007 18% 24% 30% 29% Spring 2007 9% 20% 33% 38%
Fall 2006 15% 32% 25% 28%

School District of Lancaster, 2011-2012 Student Survey May 21-25, 2012 Marginal Frequency Report – ROSS ELEMENTARY N=125
Center for Opinion Research 2 Franklin & Marshall College
4. Students get along well with teachers.
Really Agree
Kind of Agree
Kind of Disagree
Really Disagree
Spring 2012 28% 50% 15% 6% Spring 2011 29% 43% 25% 4% Spring 2010 26% 45% 22% 7% Spring 2009 31% 34% 21% 14%
Fall 2008 40% 30% 18% 12% Spring 2008 21% 42% 19% 18%
Fall 2007 19% 42% 26% 12% Spring 2007 20% 40% 24% 16%
Fall 2006 33% 31% 18% 17% 5. I like my school.
Really Agree
Kind of Agree
Kind of Disagree
Really Disagree
Spring 2012 64% 26% 4% 6% Spring 2011 56% 29% 5% 11% Spring 2010 51% 27% 11% 11% Spring 2009 45% 29% 13% 13%
Fall 2008 60% 21% 8% 11% Spring 2008 44% 23% 13% 20%
Fall 2007 55% 21% 13% 12% Spring 2007 35% 24% 18% 23%
Fall 2006 54% 27% 8% 11% 6. I like my teachers.
Really Agree
Kind of Agree
Kind of Disagree
Really Disagree
Spring 2012 75% 18% 5% 2% Spring 2011 73% 20% 2% 5% Spring 2010 68% 26% 4% 3% Spring 2009 63% 24% 8% 5%
Fall 2008 75% 12% 7% 6% Spring 2008 50% 27% 12% 11%
Fall 2007 66% 20% 7% 7% Spring 2007 48% 26% 17% 9%
Fall 2006 66% 18% 10% 6%

School District of Lancaster, 2011-2012 Student Survey May 21-25, 2012 Marginal Frequency Report – ROSS ELEMENTARY N=125
Center for Opinion Research 3 Franklin & Marshall College
7. There is a teacher or some other adult at this school who really cares about me.
Really Agree
Kind of Agree
Kind of Disagree
Really Disagree
Spring 2012 82% 13% 2% 3% Spring 2011 72% 15% 7% 6% Spring 2010 68% 24% 4% 4% Spring 2009 66% 20% 8% 6%
Fall 2008 66% 22% 7% 5% Spring 2008 52% 28% 10% 10%
Fall 2007 60% 18% 12% 10% Spring 2007 53% 24% 11% 12%
Fall 2006 68% 16% 8% 8% 8. There is a teacher or some other adult at this school who cares when I am not here.
Really Agree
Kind of Agree
Kind of Disagree
Really Disagree
Spring 2012 50% 25% 10% 16% Spring 2011 35% 34% 12% 19% Spring 2010 49% 26% 12% 14% Spring 2009 40% 28% 13% 20%
Fall 2008 49% 23% 9% 20% Spring 2008 36% 30% 10% 23%
Fall 2007 42% 22% 11% 25% Spring 2007 31% 28% 17% 25%
Fall 2006 46% 24% 10% 19% 9. There is a teacher or some other adult at this school who listens to me when I have something to say.
Really Agree
Kind of Agree
Kind of Disagree
Really Disagree
Spring 2012 74% 18% 5% 2% Spring 2011 71% 20% 7% 3% Spring 2010 66% 24% 5% 5% Spring 2009 65% 21% 12% 2%
Fall 2008 74% 13% 5% 7% Spring 2008 52% 29% 10% 10%
Fall 2007 63% 14% 11% 12% Spring 2007 49% 20% 17% 14%
Fall 2006 59% 20% 8% 13%

School District of Lancaster, 2011-2012 Student Survey May 21-25, 2012 Marginal Frequency Report – ROSS ELEMENTARY N=125
Center for Opinion Research 4 Franklin & Marshall College
10. There is a teacher or some other adult at this school who tells me when I do a good job.
Really Agree
Kind of Agree
Kind of Disagree
Really Disagree
Spring 2012 78% 18% 4% 1% Spring 2011 74% 19% 3% 3% Spring 2010 75% 21% 3% 1% Spring 2009 65% 19% 10% 5%
Fall 2008 75% 16% 6% 3% Spring 2008 67% 22% 7% 4%
Fall 2007 68% 23% 4% 4% Spring 2007 62% 23% 10% 5%
Fall 2006 72% 17% 4% 6% 11. There is a teacher or some other adult at this school who always wants me to do my best.
Really Agree
Kind of Agree
Kind of Disagree
Really Disagree
Spring 2012 92% 6% 2% 0% Spring 2011 86% 9% 3% 3% Spring 2010 88% 11% 1% 0% Spring 2009 79% 14% 4% 3%
Fall 2008 83% 9% 5% 2% Spring 2008 77% 15% 3% 5%
Fall 2007 88% 6% 3% 3% Spring 2007 75% 15% 7% 3%
Fall 2006 77% 17% 2% 4% 12. There is a teacher or some other adult at this school who believes that I will be a success.
Really Agree
Kind of Agree
Kind of Disagree
Really Disagree
Spring 2012 81% 17% 2% 1% Spring 2011 73% 23% 1% 3% Spring 2010 71% 25% 2% 1% Spring 2009 64% 23% 8% 5%
Fall 2008 68% 21% 6% 5% Spring 2008 56% 26% 11% 7%
Fall 2007 69% 22% 2% 7% Spring 2007 55% 24% 14% 7%
Fall 2006 57% 26% 10% 7%

School District of Lancaster, 2011-2012 Student Survey May 21-25, 2012 Marginal Frequency Report – ROSS ELEMENTARY N=125
Center for Opinion Research 5 Franklin & Marshall College
13. Students in this school really listen to teachers.
Really Agree
Kind of Agree
Kind of Disagree
Really Disagree
Spring 2012 11% 50% 30% 9% Spring 2011 10% 46% 29% 15% Spring 2010 11% 42% 33% 15% Spring 2009 15% 36% 28% 21%
Fall 2008 23% 35% 28% 15% Spring 2008 12% 31% 30% 27%
Fall 2007 12% 35% 29% 24% Spring 2007 8% 31% 26% 35%
Fall 2006 19% 40% 26% 15% 14. Most teachers make learning interesting.
Really Agree
Kind of Agree
Kind of Disagree
Really Disagree
Spring 2012 58% 34% 5% 3% Spring 2011 47% 33% 12% 8% Spring 2010 50% 36% 12% 3% Spring 2009 53% 30% 8% 10%
Fall 2008 55% 27% 10% 8% Spring 2008 44% 34% 12% 9%
Fall 2007 55% 26% 13% 7% Spring 2007 44% 26% 22% 9%
Fall 2006 58% 18% 15% 8% 15. This school is always getting better.
Really Agree
Kind of Agree
Kind of Disagree
Really Disagree
Spring 2012 49% 34% 12% 5% Spring 2011 43% 28% 18% 10% Spring 2010 42% 28% 23% 8% Spring 2009 38% 25% 19% 17%
Fall 2008 42% 29% 14% 16% Spring 2008 26% 26% 22% 26%
Fall 2007 43% 28% 15% 13% Spring 2007 30% 20% 23% 28%
Fall 2006 48% 22% 9% 21%

School District of Lancaster, 2011-2012 Student Survey May 21-25, 2012 Marginal Frequency Report – ROSS ELEMENTARY N=125
Center for Opinion Research 6 Franklin & Marshall College
Readiness and Emergency Management 16. Has anyone from your school spoken with you about what to do in the event of a school emergency, or not?
Yes No Spring 2012 93% 7% Spring 2011 90% 10%
Do you agree or disagree with the following statement? 17. I know what to do if there is a school emergency.
Really Agree
Kind of Agree
Kind of Disagree
Really Disagree
Spring 2012 85% 12% 3% 0% Spring 2011 78% 16% 3% 3%
Academic Self-efficacy Do you agree or disagree with the following statements? 18. I am a good science student.
Really Agree
Kind of Agree
Kind of Disagree
Really Disagree
Spring 2012 35% 44% 13% 8% Spring 2011 35% 44% 13% 8% Spring 2010 39% 45% 11% 6% Spring 2009 57% 24% 9% 10%
Fall 2008 61% 25% 8% 6% Spring 2008 40% 37% 14% 9%
Fall 2007 41% 31% 17% 10% Spring 2007 37% 42% 10% 12%
Fall 2006 40% 36% 15% 10% 19. Sometimes I think an assignment is easy when the other students think it is hard.
Really Agree
Kind of Agree
Kind of Disagree
Really Disagree
Spring 2012 54% 29% 13% 4% Spring 2011 56% 22% 12% 10% Spring 2010 54% 34% 6% 6% Spring 2009 59% 30% 4% 8%
Fall 2008 56% 28% 10% 6% Spring 2008 51% 28% 12% 9%
Fall 2007 52% 30% 7% 11% Spring 2007 52% 24% 15% 10%
Fall 2006 48% 31% 8% 13%

School District of Lancaster, 2011-2012 Student Survey May 21-25, 2012 Marginal Frequency Report – ROSS ELEMENTARY N=125
Center for Opinion Research 7 Franklin & Marshall College
20. I am good social studies student.
Really Agree
Kind of Agree
Kind of Disagree
Really Disagree
Spring 2012 40% 34% 16% 10% Spring 2011 40% 39% 14% 7% Spring 2010 32% 44% 14% 10% Spring 2009 49% 26% 13% 11%
Fall 2008 42% 39% 10% 8% Spring 2008 35% 35% 18% 12%
Fall 2007 43% 30% 13% 13% Spring 2007 27% 42% 16% 16%
Fall 2006 36% 41% 12% 10% 21. My teacher thinks I am smart.
Really Agree
Kind of Agree
Kind of Disagree
Really Disagree
Spring 2012 77% 15% 5% 3% Spring 2011 75% 17% 3% 5% Spring 2010 70% 23% 4% 3% Spring 2009 69% 19% 7% 5%
Fall 2008 71% 21% 6% 2% Spring 2008 52% 34% 8% 6%
Fall 2007 69% 17% 7% 7% Spring 2007 51% 30% 13% 6%
Fall 2006 58% 26% 9% 7% 22. I am a good math student.
Really Agree
Kind of Agree
Kind of Disagree
Really Disagree
Spring 2012 61% 23% 11% 5% Spring 2011 63% 23% 7% 7% Spring 2010 60% 27% 5% 7% Spring 2009 58% 23% 9% 10%
Fall 2008 67% 20% 6% 7% Spring 2008 61% 29% 6% 5%
Fall 2007 61% 25% 7% 8% Spring 2007 57% 27% 7% 8%
Fall 2006 56% 26% 5% 13%

School District of Lancaster, 2011-2012 Student Survey May 21-25, 2012 Marginal Frequency Report – ROSS ELEMENTARY N=125
Center for Opinion Research 8 Franklin & Marshall College
23. My classmates usually get better grades than I do.
Really Agree
Kind of Agree
Kind of Disagree
Really Disagree
Spring 2012 25% 34% 25% 16% Spring 2011 20% 27% 34% 20% Spring 2010 19% 35% 30% 17% Spring 2009 22% 35% 28% 15%
Fall 2008 30% 25% 24% 20% Spring 2008 12% 29% 38% 21%
Fall 2007 22% 22% 30% 26% Spring 2007 17% 28% 29% 26%
Fall 2006 21% 29% 19% 31% 24. I usually understand my homework assignments.
Really Agree
Kind of Agree
Kind of Disagree
Really Disagree
Spring 2012 52% 32% 12% 4% Spring 2011 60% 31% 6% 3% Spring 2010 48% 38% 8% 5% Spring 2009 47% 33% 10% 10%
Fall 2008 60% 25% 7% 8% Spring 2008 56% 30% 9% 6%
Fall 2007 51% 30% 11% 8% Spring 2007 41% 32% 16% 10%
Fall 2006 50% 28% 15% 6% 25. I could get the best grades in class if I tried hard enough.
Really Agree
Kind of Agree
Kind of Disagree
Really Disagree
Spring 2012 69% 23% 5% 2% Spring 2011 74% 16% 7% 3% Spring 2010 69% 23% 5% 3% Spring 2009 74% 15% 3% 7%
Fall 2008 74% 16% 5% 5% Spring 2008 68% 22% 2% 7%
Fall 2007 72% 13% 5% 10% Spring 2007 70% 20% 7% 3%
Fall 2006 74% 16% 5% 5%
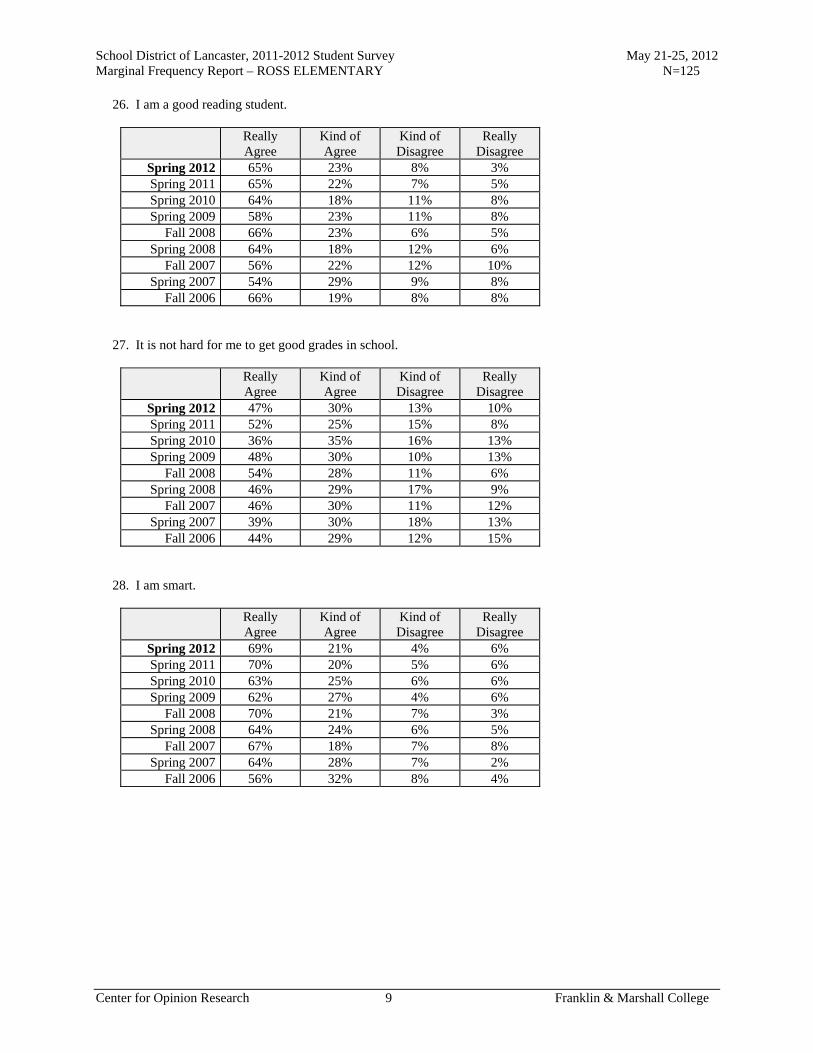
School District of Lancaster, 2011-2012 Student Survey May 21-25, 2012 Marginal Frequency Report – ROSS ELEMENTARY N=125
Center for Opinion Research 9 Franklin & Marshall College
26. I am a good reading student.
Really Agree
Kind of Agree
Kind of Disagree
Really Disagree
Spring 2012 65% 23% 8% 3% Spring 2011 65% 22% 7% 5% Spring 2010 64% 18% 11% 8% Spring 2009 58% 23% 11% 8%
Fall 2008 66% 23% 6% 5% Spring 2008 64% 18% 12% 6%
Fall 2007 56% 22% 12% 10% Spring 2007 54% 29% 9% 8%
Fall 2006 66% 19% 8% 8% 27. It is not hard for me to get good grades in school.
Really Agree
Kind of Agree
Kind of Disagree
Really Disagree
Spring 2012 47% 30% 13% 10% Spring 2011 52% 25% 15% 8% Spring 2010 36% 35% 16% 13% Spring 2009 48% 30% 10% 13%
Fall 2008 54% 28% 11% 6% Spring 2008 46% 29% 17% 9%
Fall 2007 46% 30% 11% 12% Spring 2007 39% 30% 18% 13%
Fall 2006 44% 29% 12% 15% 28. I am smart.
Really Agree
Kind of Agree
Kind of Disagree
Really Disagree
Spring 2012 69% 21% 4% 6% Spring 2011 70% 20% 5% 6% Spring 2010 63% 25% 6% 6% Spring 2009 62% 27% 4% 6%
Fall 2008 70% 21% 7% 3% Spring 2008 64% 24% 6% 5%
Fall 2007 67% 18% 7% 8% Spring 2007 64% 28% 7% 2%
Fall 2006 56% 32% 8% 4%

School District of Lancaster, 2011-2012 Student Survey May 21-25, 2012 Marginal Frequency Report – ROSS ELEMENTARY N=125
Center for Opinion Research 10 Franklin & Marshall College
29. When the teacher asks a question I usually know the answer even if the other students don't.
Really Agree
Kind of Agree
Kind of Disagree
Really Disagree
Spring 2012 30% 47% 18% 4% Spring 2011 42% 38% 15% 5% Spring 2010 30% 45% 16% 8% Spring 2009 36% 39% 14% 11%
Fall 2008 40% 42% 11% 7% Spring 2008 43% 37% 13% 7%
Fall 2007 38% 39% 14% 9% Spring 2007 32% 43% 17% 9%
Fall 2006 47% 37% 9% 6% 30. I work hard in school.
Really Agree
Kind of Agree
Kind of Disagree
Really Disagree
Spring 2012 72% 23% 2% 2% Spring 2011 75% 19% 3% 3% Spring 2010 73% 23% 3% 1% Spring 2009 73% 17% 5% 4%
Fall 2008 76% 20% 3% 1% Spring 2008 66% 24% 7% 4%
Fall 2007 70% 16% 8% 5% Spring 2007 64% 28% 4% 4%
Fall 2006 80% 14% 3% 3% 31. Most of my classmates work harder on their homework than I do.
Really Agree
Kind of Agree
Kind of Disagree
Really Disagree
Spring 2012 23% 28% 36% 13% Spring 2011 21% 23% 29% 26% Spring 2010 20% 31% 31% 18% Spring 2009 24% 26% 30% 20%
Fall 2008 19% 28% 22% 30% Spring 2008 12% 26% 27% 35%
Fall 2007 21% 19% 24% 36% Spring 2007 14% 23% 31% 32%
Fall 2006 18% 24% 26% 32%
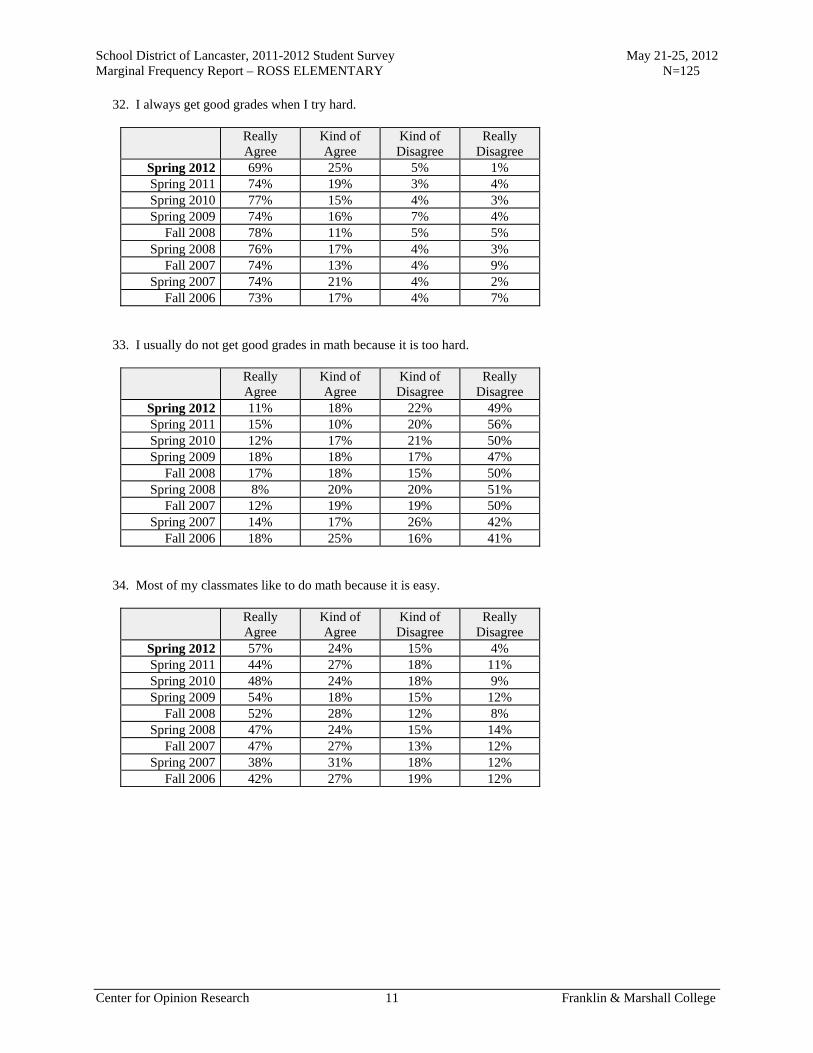
School District of Lancaster, 2011-2012 Student Survey May 21-25, 2012 Marginal Frequency Report – ROSS ELEMENTARY N=125
Center for Opinion Research 11 Franklin & Marshall College
32. I always get good grades when I try hard.
Really Agree
Kind of Agree
Kind of Disagree
Really Disagree
Spring 2012 69% 25% 5% 1% Spring 2011 74% 19% 3% 4% Spring 2010 77% 15% 4% 3% Spring 2009 74% 16% 7% 4%
Fall 2008 78% 11% 5% 5% Spring 2008 76% 17% 4% 3%
Fall 2007 74% 13% 4% 9% Spring 2007 74% 21% 4% 2%
Fall 2006 73% 17% 4% 7% 33. I usually do not get good grades in math because it is too hard.
Really Agree
Kind of Agree
Kind of Disagree
Really Disagree
Spring 2012 11% 18% 22% 49% Spring 2011 15% 10% 20% 56% Spring 2010 12% 17% 21% 50% Spring 2009 18% 18% 17% 47%
Fall 2008 17% 18% 15% 50% Spring 2008 8% 20% 20% 51%
Fall 2007 12% 19% 19% 50% Spring 2007 14% 17% 26% 42%
Fall 2006 18% 25% 16% 41% 34. Most of my classmates like to do math because it is easy.
Really Agree
Kind of Agree
Kind of Disagree
Really Disagree
Spring 2012 57% 24% 15% 4% Spring 2011 44% 27% 18% 11% Spring 2010 48% 24% 18% 9% Spring 2009 54% 18% 15% 12%
Fall 2008 52% 28% 12% 8% Spring 2008 47% 24% 15% 14%
Fall 2007 47% 27% 13% 12% Spring 2007 38% 31% 18% 12%
Fall 2006 42% 27% 19% 12%
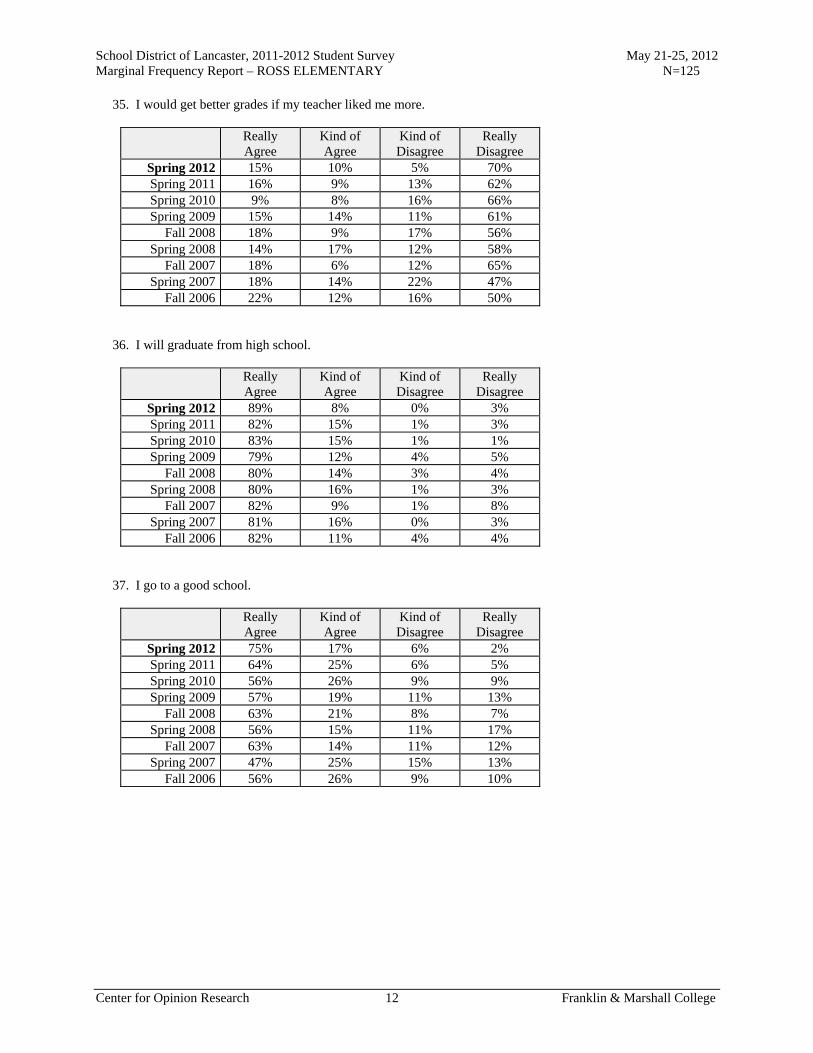
School District of Lancaster, 2011-2012 Student Survey May 21-25, 2012 Marginal Frequency Report – ROSS ELEMENTARY N=125
Center for Opinion Research 12 Franklin & Marshall College
35. I would get better grades if my teacher liked me more.
Really Agree
Kind of Agree
Kind of Disagree
Really Disagree
Spring 2012 15% 10% 5% 70% Spring 2011 16% 9% 13% 62% Spring 2010 9% 8% 16% 66% Spring 2009 15% 14% 11% 61%
Fall 2008 18% 9% 17% 56% Spring 2008 14% 17% 12% 58%
Fall 2007 18% 6% 12% 65% Spring 2007 18% 14% 22% 47%
Fall 2006 22% 12% 16% 50% 36. I will graduate from high school.
Really Agree
Kind of Agree
Kind of Disagree
Really Disagree
Spring 2012 89% 8% 0% 3% Spring 2011 82% 15% 1% 3% Spring 2010 83% 15% 1% 1% Spring 2009 79% 12% 4% 5%
Fall 2008 80% 14% 3% 4% Spring 2008 80% 16% 1% 3%
Fall 2007 82% 9% 1% 8% Spring 2007 81% 16% 0% 3%
Fall 2006 82% 11% 4% 4% 37. I go to a good school.
Really Agree
Kind of Agree
Kind of Disagree
Really Disagree
Spring 2012 75% 17% 6% 2% Spring 2011 64% 25% 6% 5% Spring 2010 56% 26% 9% 9% Spring 2009 57% 19% 11% 13%
Fall 2008 63% 21% 8% 7% Spring 2008 56% 15% 11% 17%
Fall 2007 63% 14% 11% 12% Spring 2007 47% 25% 15% 13%
Fall 2006 56% 26% 9% 10%

School District of Lancaster, 2011-2012 Student Survey May 21-25, 2012 Marginal Frequency Report – ROSS ELEMENTARY N=125
Center for Opinion Research 13 Franklin & Marshall College
38. Adults who have good jobs probably were good students when they were young.
Really Agree
Kind of Agree
Kind of Disagree
Really Disagree
Spring 2012 72% 18% 6% 4% Spring 2011 73% 19% 7% 2% Spring 2010 66% 19% 9% 6% Spring 2009 67% 17% 12% 5%
Fall 2008 76% 13% 9% 2% Spring 2008 61% 24% 6% 9%
Fall 2007 64% 29% 4% 3% Spring 2007 60% 22% 9% 8%
Fall 2006 76% 16% 4% 4% 39. When I am old enough, I will go to college.
Really Agree
Kind of Agree
Kind of Disagree
Really Disagree
Spring 2012 82% 11% 3% 4% Spring 2011 77% 15% 1% 7% Spring 2010 76% 17% 4% 2% Spring 2009 80% 10% 7% 3%
Fall 2008 76% 12% 6% 5% Spring 2008 76% 16% 0% 7%
Fall 2007 82% 11% 4% 3% Spring 2007 71% 18% 7% 4%
Fall 2006 76% 13% 5% 6% 40. No one cares if I do well in school.
Really Agree
Kind of Agree
Kind of Disagree
Really Disagree
Spring 2012 8% 5% 11% 76% Spring 2011 15% 10% 9% 67% Spring 2010 13% 12% 13% 62% Spring 2009 13% 12% 14% 61%
Fall 2008 14% 9% 14% 63% Spring 2008 10% 6% 18% 66%
Fall 2007 12% 5% 12% 71% Spring 2007 8% 15% 14% 63%
Fall 2006 18% 10% 13% 59%
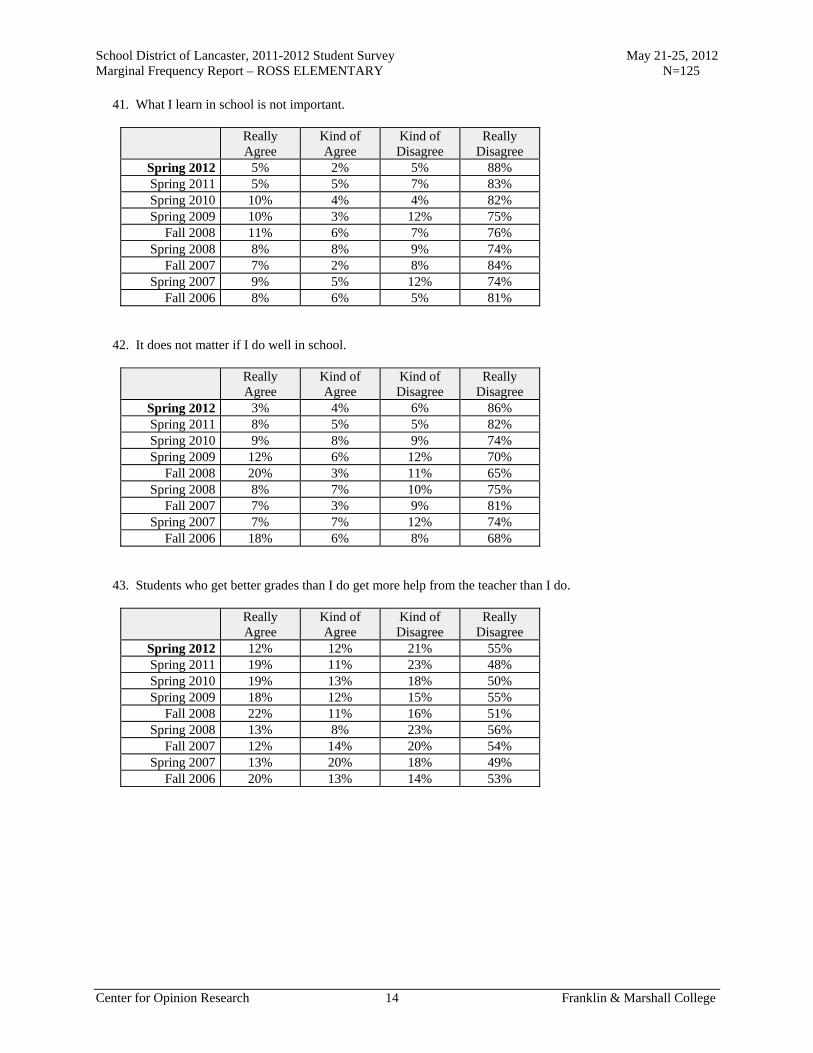
School District of Lancaster, 2011-2012 Student Survey May 21-25, 2012 Marginal Frequency Report – ROSS ELEMENTARY N=125
Center for Opinion Research 14 Franklin & Marshall College
41. What I learn in school is not important.
Really Agree
Kind of Agree
Kind of Disagree
Really Disagree
Spring 2012 5% 2% 5% 88% Spring 2011 5% 5% 7% 83% Spring 2010 10% 4% 4% 82% Spring 2009 10% 3% 12% 75%
Fall 2008 11% 6% 7% 76% Spring 2008 8% 8% 9% 74%
Fall 2007 7% 2% 8% 84% Spring 2007 9% 5% 12% 74%
Fall 2006 8% 6% 5% 81% 42. It does not matter if I do well in school.
Really Agree
Kind of Agree
Kind of Disagree
Really Disagree
Spring 2012 3% 4% 6% 86% Spring 2011 8% 5% 5% 82% Spring 2010 9% 8% 9% 74% Spring 2009 12% 6% 12% 70%
Fall 2008 20% 3% 11% 65% Spring 2008 8% 7% 10% 75%
Fall 2007 7% 3% 9% 81% Spring 2007 7% 7% 12% 74%
Fall 2006 18% 6% 8% 68% 43. Students who get better grades than I do get more help from the teacher than I do.
Really Agree
Kind of Agree
Kind of Disagree
Really Disagree
Spring 2012 12% 12% 21% 55% Spring 2011 19% 11% 23% 48% Spring 2010 19% 13% 18% 50% Spring 2009 18% 12% 15% 55%
Fall 2008 22% 11% 16% 51% Spring 2008 13% 8% 23% 56%
Fall 2007 12% 14% 20% 54% Spring 2007 13% 20% 18% 49%
Fall 2006 20% 13% 14% 53%

School District of Lancaster, 2011-2012 Student Survey May 21-25, 2012 Marginal Frequency Report – ROSS ELEMENTARY N=125
Center for Opinion Research 15 Franklin & Marshall College
44. I will quit school as soon as I can.
Really Agree
Kind of Agree
Kind of Disagree
Really Disagree
Spring 2012 4% 5% 3% 88% Spring 2011 8% 6% 6% 80% Spring 2010 6% 8% 4% 81% Spring 2009 10% 5% 10% 76%
Fall 2008 9% 7% 8% 76% Spring 2008 5% 7% 9% 79%
Fall 2007 8% 3% 5% 84% Spring 2007 15% 3% 9% 74%
Fall 2006 15% 4% 8% 73% 45. Teachers like students even if they do not always make good grades.
Really Agree
Kind of Agree
Kind of Disagree
Really Disagree
Spring 2012 76% 16% 4% 4% Spring 2011 66% 19% 7% 8% Spring 2010 64% 21% 6% 9% Spring 2009 64% 14% 8% 14%
Fall 2008 71% 15% 9% 5% Spring 2008 58% 25% 4% 13%
Fall 2007 66% 9% 10% 15% Spring 2007 56% 23% 11% 10%
Fall 2006 57% 19% 8% 16% 46. It is important to go to high school.
Really Agree
Kind of Agree
Kind of Disagree
Really Disagree
Spring 2012 93% 6% 1% 0% Spring 2011 89% 6% 2% 3% Spring 2010 90% 6% 1% 3% Spring 2009 85% 5% 3% 6%
Fall 2008 82% 11% 5% 3% Spring 2008 80% 11% 2% 6%
Fall 2007 88% 4% 4% 3% Spring 2007 83% 12% 3% 2%
Fall 2006 84% 9% 4% 4% 47. How often do you take books home to study?
Every Night Most Nights Some Nights Never Spring 2012 22% 28% 36% 14% Spring 2011 22% 21% 36% 21% Spring 2010 23% 20% 43% 15% Spring 2009 28% 21% 36% 15%
Fall 2008 34% 26% 32% 7%

School District of Lancaster, 2011-2012 Student Survey May 21-25, 2012 Marginal Frequency Report – ROSS ELEMENTARY N=125
Center for Opinion Research 16 Franklin & Marshall College
Academic Aspirations 48. How far in school do you want to go?
Complete
high school
Attend vocational/technical
school
Attend 2-year college
Attend 4-year college
Attend 4-year college plus go to
grad school Spring 2012 11% 2% 13% 27% 47% Spring 2011 18% 5% 14% 25% 39% Spring 2010 18% 4% 14% 30% 34% Spring 2009 24% 4% 17% 20% 34%
Fall 2008 25% 4% 19% 21% 32% Spring 2008 18% 4% 28% 16% 33%
Fall 2007 24% 6% 14% 21% 35% Spring 2007 24% 2% 19% 16% 39%
Fall 2006 29% 3% 13% 9% 46% 49. How important do you believe getting a college education is to your future success? Would you say it is...
Very
important Somewhat important
Not very important
Not important at
all Spring 2012 94% 4% 1% 1% Spring 2011 87% 8% 2% 3% Spring 2010 92% 6% 1% 1% Spring 2009 87% 8% 3% 3%
Fall 2008 93% 3% 2% 2% Spring 2008 88% 3% 7% 2%
Fall 2007 86% 8% 2% 4% Spring 2007 84% 10% 3% 3%
Fall 2006 84% 10% 2% 4% 50. How important would your parent/guardian say getting a college education is to your future success? Would your parents say it is...
Very
important Somewhat important
Not very important
Not important at
all Spring 2012 97% 3% 0% 0% Spring 2011 92% 5% 1% 1% Spring 2010 90% 5% 1% 3% Spring 2009 90% 6% 1% 3%
Fall 2008 85% 10% 3% 2% Spring 2008 94% 6% 0% 1%
Fall 2007 91% 7% 2% 1% Spring 2007 89% 7% 3% 1%
Fall 2006 89% 8% 2% 1%
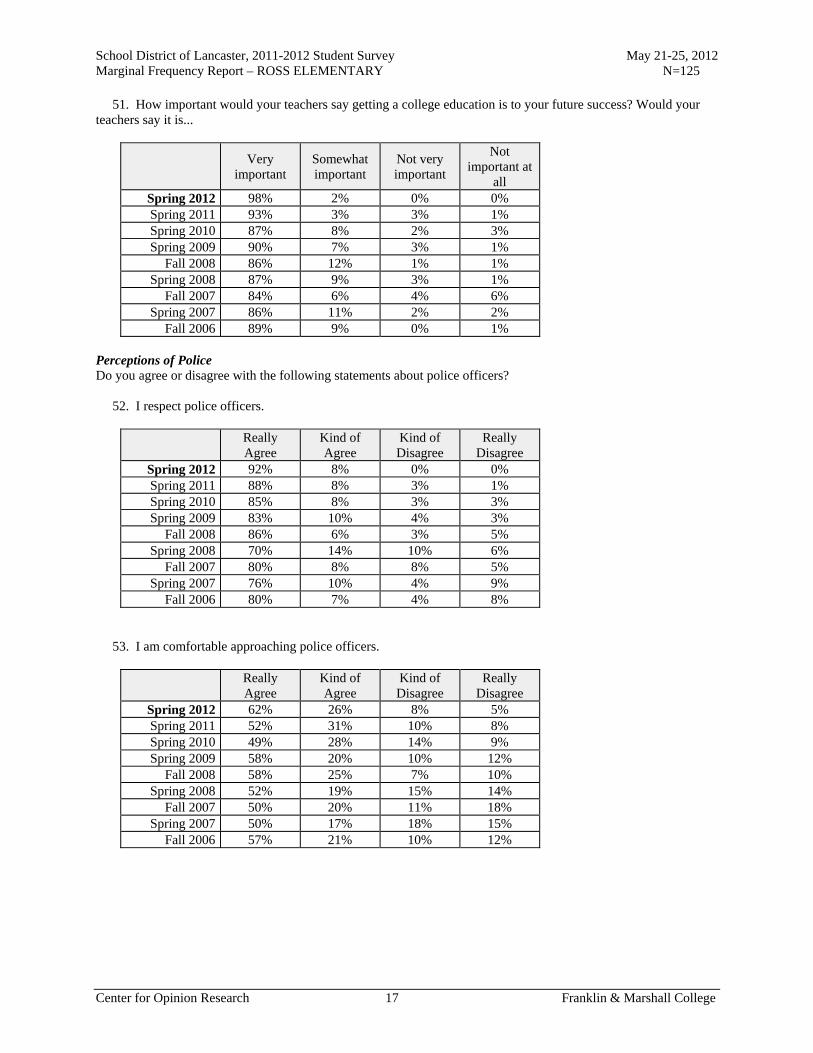
School District of Lancaster, 2011-2012 Student Survey May 21-25, 2012 Marginal Frequency Report – ROSS ELEMENTARY N=125
Center for Opinion Research 17 Franklin & Marshall College
51. How important would your teachers say getting a college education is to your future success? Would your teachers say it is...
Very
important Somewhat important
Not very important
Not important at
all Spring 2012 98% 2% 0% 0% Spring 2011 93% 3% 3% 1% Spring 2010 87% 8% 2% 3% Spring 2009 90% 7% 3% 1%
Fall 2008 86% 12% 1% 1% Spring 2008 87% 9% 3% 1%
Fall 2007 84% 6% 4% 6% Spring 2007 86% 11% 2% 2%
Fall 2006 89% 9% 0% 1% Perceptions of Police Do you agree or disagree with the following statements about police officers? 52. I respect police officers.
Really Agree
Kind of Agree
Kind of Disagree
Really Disagree
Spring 2012 92% 8% 0% 0% Spring 2011 88% 8% 3% 1% Spring 2010 85% 8% 3% 3% Spring 2009 83% 10% 4% 3%
Fall 2008 86% 6% 3% 5% Spring 2008 70% 14% 10% 6%
Fall 2007 80% 8% 8% 5% Spring 2007 76% 10% 4% 9%
Fall 2006 80% 7% 4% 8% 53. I am comfortable approaching police officers.
Really Agree
Kind of Agree
Kind of Disagree
Really Disagree
Spring 2012 62% 26% 8% 5% Spring 2011 52% 31% 10% 8% Spring 2010 49% 28% 14% 9% Spring 2009 58% 20% 10% 12%
Fall 2008 58% 25% 7% 10% Spring 2008 52% 19% 15% 14%
Fall 2007 50% 20% 11% 18% Spring 2007 50% 17% 18% 15%
Fall 2006 57% 21% 10% 12%
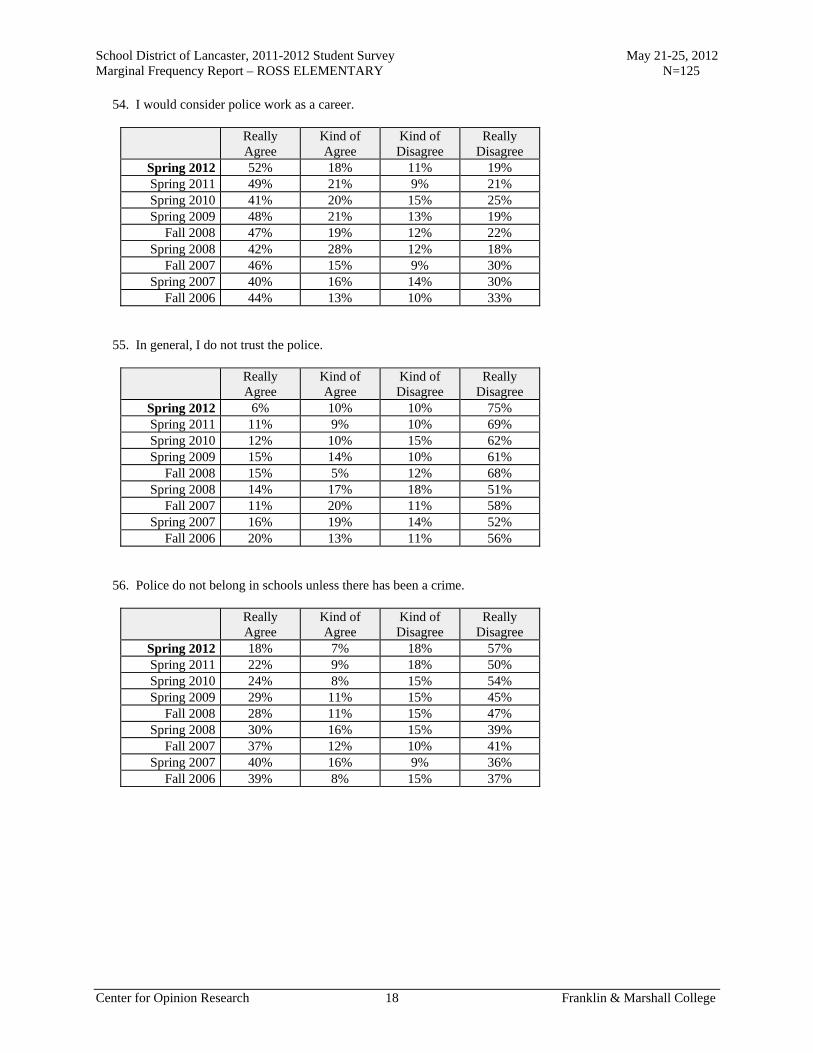
School District of Lancaster, 2011-2012 Student Survey May 21-25, 2012 Marginal Frequency Report – ROSS ELEMENTARY N=125
Center for Opinion Research 18 Franklin & Marshall College
54. I would consider police work as a career.
Really Agree
Kind of Agree
Kind of Disagree
Really Disagree
Spring 2012 52% 18% 11% 19% Spring 2011 49% 21% 9% 21% Spring 2010 41% 20% 15% 25% Spring 2009 48% 21% 13% 19%
Fall 2008 47% 19% 12% 22% Spring 2008 42% 28% 12% 18%
Fall 2007 46% 15% 9% 30% Spring 2007 40% 16% 14% 30%
Fall 2006 44% 13% 10% 33% 55. In general, I do not trust the police.
Really Agree
Kind of Agree
Kind of Disagree
Really Disagree
Spring 2012 6% 10% 10% 75% Spring 2011 11% 9% 10% 69% Spring 2010 12% 10% 15% 62% Spring 2009 15% 14% 10% 61%
Fall 2008 15% 5% 12% 68% Spring 2008 14% 17% 18% 51%
Fall 2007 11% 20% 11% 58% Spring 2007 16% 19% 14% 52%
Fall 2006 20% 13% 11% 56% 56. Police do not belong in schools unless there has been a crime.
Really Agree
Kind of Agree
Kind of Disagree
Really Disagree
Spring 2012 18% 7% 18% 57% Spring 2011 22% 9% 18% 50% Spring 2010 24% 8% 15% 54% Spring 2009 29% 11% 15% 45%
Fall 2008 28% 11% 15% 47% Spring 2008 30% 16% 15% 39%
Fall 2007 37% 12% 10% 41% Spring 2007 40% 16% 9% 36%
Fall 2006 39% 8% 15% 37%
Report M
Marginal Frequency Report Washington Elementary School

School District of Lancaster, 2011-2012 Student Survey May 21-25, 2012 Marginal Frequency Report – WASHINGTON ELEMENTARY N=258
Center for Opinion Research 1 Franklin & Marshall College
School Climate Do you agree or disagree with the following statements? 1. I feel safe at this school.
Really Agree
Kind of Agree
Kind of Disagree
Really Disagree
Spring 2012 66% 29% 2% 3% Spring 2011 64% 25% 6% 5% Spring 2010 69% 24% 5% 2% Spring 2009 54% 26% 12% 8%
Fall 2008 57% 24% 9% 9% Spring 2008 50% 34% 12% 5%
Fall 2007 69% 21% 7% 3% Spring 2007 60% 28% 7% 5%
Fall 2006 72% 22% 4% 2% 2. I feel safe going to and from school.
Really Agree
Kind of Agree
Kind of Disagree
Really Disagree
Spring 2012 64% 25% 6% 5% Spring 2011 67% 21% 6% 7% Spring 2010 67% 25% 5% 3% Spring 2009 54% 33% 8% 6%
Fall 2008 55% 28% 9% 8% Spring 2008 60% 27% 9% 4%
Fall 2007 67% 24% 5% 5% Spring 2007 56% 31% 8% 4%
Fall 2006 63% 27% 7% 3% 3. Students get along well with each other.
Really Agree
Kind of Agree
Kind of Disagree
Really Disagree
Spring 2012 16% 40% 28% 17% Spring 2011 17% 39% 28% 17% Spring 2010 12% 45% 28% 15% Spring 2009 10% 38% 34% 17%
Fall 2008 22% 37% 27% 15% Spring 2008 12% 35% 35% 18%
Fall 2007 24% 42% 24% 9% Spring 2007 14% 40% 27% 19%
Fall 2006 22% 41% 25% 12%

School District of Lancaster, 2011-2012 Student Survey May 21-25, 2012 Marginal Frequency Report – WASHINGTON ELEMENTARY N=258
Center for Opinion Research 2 Franklin & Marshall College
4. Students get along well with teachers.
Really Agree
Kind of Agree
Kind of Disagree
Really Disagree
Spring 2012 39% 34% 22% 5% Spring 2011 33% 40% 20% 8% Spring 2010 32% 41% 20% 7% Spring 2009 27% 35% 29% 9%
Fall 2008 34% 39% 19% 7% Spring 2008 24% 46% 22% 8%
Fall 2007 48% 36% 13% 3% Spring 2007 32% 45% 17% 6%
Fall 2006 46% 34% 14% 6% 5. I like my school.
Really Agree
Kind of Agree
Kind of Disagree
Really Disagree
Spring 2012 67% 18% 8% 7% Spring 2011 72% 14% 5% 8% Spring 2010 70% 17% 7% 6% Spring 2009 58% 25% 10% 7%
Fall 2008 60% 22% 12% 7% Spring 2008 56% 24% 12% 8%
Fall 2007 67% 22% 6% 6% Spring 2007 63% 22% 9% 6%
Fall 2006 70% 20% 7% 3% 6. I like my teachers.
Really Agree
Kind of Agree
Kind of Disagree
Really Disagree
Spring 2012 67% 21% 7% 5% Spring 2011 73% 20% 3% 4% Spring 2010 78% 16% 4% 3% Spring 2009 70% 19% 6% 6%
Fall 2008 75% 17% 6% 2% Spring 2008 70% 20% 7% 4%
Fall 2007 80% 17% 2% 2% Spring 2007 73% 20% 5% 2%
Fall 2006 83% 12% 4% 1%

School District of Lancaster, 2011-2012 Student Survey May 21-25, 2012 Marginal Frequency Report – WASHINGTON ELEMENTARY N=258
Center for Opinion Research 3 Franklin & Marshall College
7. There is a teacher or some other adult at this school who really cares about me.
Really Agree
Kind of Agree
Kind of Disagree
Really Disagree
Spring 2012 69% 20% 7% 4% Spring 2011 74% 18% 4% 4% Spring 2010 79% 15% 3% 3% Spring 2009 72% 19% 4% 4%
Fall 2008 71% 18% 3% 8% Spring 2008 71% 21% 4% 4%
Fall 2007 74% 16% 6% 4% Spring 2007 71% 18% 6% 4%
Fall 2006 67% 23% 5% 5% 8. There is a teacher or some other adult at this school who cares when I am not here.
Really Agree
Kind of Agree
Kind of Disagree
Really Disagree
Spring 2012 50% 23% 13% 14% Spring 2011 50% 23% 10% 17% Spring 2010 58% 23% 6% 13% Spring 2009 52% 27% 10% 11%
Fall 2008 45% 29% 9% 17% Spring 2008 52% 24% 11% 14%
Fall 2007 54% 17% 12% 16% Spring 2007 39% 29% 8% 24%
Fall 2006 46% 24% 12% 18% 9. There is a teacher or some other adult at this school who listens to me when I have something to say.
Really Agree
Kind of Agree
Kind of Disagree
Really Disagree
Spring 2012 69% 19% 6% 5% Spring 2011 71% 21% 5% 3% Spring 2010 74% 18% 4% 5% Spring 2009 69% 22% 7% 3%
Fall 2008 64% 26% 7% 3% Spring 2008 68% 23% 5% 4%
Fall 2007 67% 20% 10% 3% Spring 2007 65% 24% 6% 6%
Fall 2006 74% 20% 2% 4%

School District of Lancaster, 2011-2012 Student Survey May 21-25, 2012 Marginal Frequency Report – WASHINGTON ELEMENTARY N=258
Center for Opinion Research 4 Franklin & Marshall College
10. There is a teacher or some other adult at this school who tells me when I do a good job.
Really Agree
Kind of Agree
Kind of Disagree
Really Disagree
Spring 2012 77% 16% 4% 2% Spring 2011 81% 16% 2% 2% Spring 2010 86% 10% 4% 1% Spring 2009 74% 19% 4% 2%
Fall 2008 76% 17% 6% 2% Spring 2008 79% 16% 3% 2%
Fall 2007 80% 16% 2% 2% Spring 2007 76% 17% 4% 3%
Fall 2006 80% 18% 2% 1% 11. There is a teacher or some other adult at this school who always wants me to do my best.
Really Agree
Kind of Agree
Kind of Disagree
Really Disagree
Spring 2012 88% 10% 2% 1% Spring 2011 91% 7% 1% 1% Spring 2010 89% 8% 2% 0% Spring 2009 88% 9% 1% 2%
Fall 2008 81% 13% 3% 2% Spring 2008 85% 12% 2% 1%
Fall 2007 86% 11% 2% 1% Spring 2007 89% 8% 0% 2%
Fall 2006 91% 8% 2% 0% 12. There is a teacher or some other adult at this school who believes that I will be a success.
Really Agree
Kind of Agree
Kind of Disagree
Really Disagree
Spring 2012 67% 27% 4% 2% Spring 2011 73% 21% 3% 4% Spring 2010 77% 15% 5% 4% Spring 2009 71% 18% 8% 3%
Fall 2008 63% 26% 7% 3% Spring 2008 74% 20% 4% 2%
Fall 2007 73% 18% 5% 4% Spring 2007 72% 19% 5% 4%
Fall 2006 68% 23% 6% 4%

School District of Lancaster, 2011-2012 Student Survey May 21-25, 2012 Marginal Frequency Report – WASHINGTON ELEMENTARY N=258
Center for Opinion Research 5 Franklin & Marshall College
13. Students in this school really listen to teachers.
Really Agree
Kind of Agree
Kind of Disagree
Really Disagree
Spring 2012 14% 37% 33% 16% Spring 2011 16% 34% 38% 12% Spring 2010 14% 42% 34% 10% Spring 2009 10% 38% 33% 20%
Fall 2008 18% 40% 27% 16% Spring 2008 13% 33% 41% 13%
Fall 2007 24% 43% 25% 8% Spring 2007 14% 40% 29% 17%
Fall 2006 24% 39% 25% 13% 14. Most teachers make learning interesting.
Really Agree
Kind of Agree
Kind of Disagree
Really Disagree
Spring 2012 58% 26% 11% 5% Spring 2011 58% 28% 9% 4% Spring 2010 61% 28% 7% 4% Spring 2009 49% 33% 11% 7%
Fall 2008 64% 22% 10% 5% Spring 2008 56% 32% 9% 3%
Fall 2007 70% 21% 7% 2% Spring 2007 61% 25% 7% 7%
Fall 2006 73% 21% 5% 1% 15. This school is always getting better.
Really Agree
Kind of Agree
Kind of Disagree
Really Disagree
Spring 2012 43% 32% 12% 13% Spring 2011 47% 34% 11% 8% Spring 2010 59% 23% 11% 7% Spring 2009 37% 30% 22% 12%
Fall 2008 45% 30% 14% 11% Spring 2008 39% 33% 18% 10%
Fall 2007 54% 27% 10% 9% Spring 2007 42% 32% 13% 13%
Fall 2006 53% 31% 6% 10%

School District of Lancaster, 2011-2012 Student Survey May 21-25, 2012 Marginal Frequency Report – WASHINGTON ELEMENTARY N=258
Center for Opinion Research 6 Franklin & Marshall College
Readiness and Emergency Management 16. Has anyone from your school spoken with you about what to do in the event of a school emergency, or not?
Yes No Spring 2012 91% 9% Spring 2011 90% 10%
Do you agree or disagree with the following statement? 17. I know what to do if there is a school emergency.
Really Agree
Kind of Agree
Kind of Disagree
Really Disagree
Spring 2012 84% 13% 2% 1% Spring 2011 83% 12% 2% 2%
Academic Self-efficacy Do you agree or disagree with the following statements? 18. I am a good science student.
Really Agree
Kind of Agree
Kind of Disagree
Really Disagree
Spring 2012 47% 37% 10% 5% Spring 2011 44% 40% 8% 8% Spring 2010 47% 42% 6% 5% Spring 2009 50% 34% 10% 5%
Fall 2008 52% 32% 7% 8% Spring 2008 41% 35% 14% 10%
Fall 2007 48% 35% 11% 6% Spring 2007 35% 41% 13% 11%
Fall 2006 44% 38% 8% 9% 19. Sometimes I think an assignment is easy when the other students think it is hard.
Really Agree
Kind of Agree
Kind of Disagree
Really Disagree
Spring 2012 56% 26% 10% 9% Spring 2011 47% 32% 10% 11% Spring 2010 50% 34% 10% 6% Spring 2009 45% 34% 10% 11%
Fall 2008 51% 33% 10% 6% Spring 2008 52% 32% 8% 7%
Fall 2007 49% 34% 8% 8% Spring 2007 51% 29% 9% 12%
Fall 2006 53% 29% 8% 10%

School District of Lancaster, 2011-2012 Student Survey May 21-25, 2012 Marginal Frequency Report – WASHINGTON ELEMENTARY N=258
Center for Opinion Research 7 Franklin & Marshall College
20. I am good social studies student.
Really Agree
Kind of Agree
Kind of Disagree
Really Disagree
Spring 2012 39% 39% 14% 8% Spring 2011 36% 38% 16% 10% Spring 2010 44% 32% 15% 8% Spring 2009 42% 32% 16% 10%
Fall 2008 51% 32% 10% 7% Spring 2008 39% 36% 13% 12%
Fall 2007 48% 32% 11% 9% Spring 2007 36% 41% 12% 12%
Fall 2006 38% 41% 12% 10% 21. My teacher thinks I am smart.
Really Agree
Kind of Agree
Kind of Disagree
Really Disagree
Spring 2012 68% 22% 5% 4% Spring 2011 68% 21% 6% 4% Spring 2010 75% 18% 4% 3% Spring 2009 67% 22% 5% 6%
Fall 2008 70% 19% 4% 6% Spring 2008 73% 17% 7% 4%
Fall 2007 74% 20% 3% 3% Spring 2007 70% 22% 4% 4%
Fall 2006 77% 17% 4% 2% 22. I am a good math student.
Really Agree
Kind of Agree
Kind of Disagree
Really Disagree
Spring 2012 58% 28% 9% 5% Spring 2011 54% 29% 9% 8% Spring 2010 58% 30% 5% 7% Spring 2009 56% 28% 9% 7%
Fall 2008 62% 25% 8% 5% Spring 2008 57% 26% 10% 7%
Fall 2007 58% 30% 7% 5% Spring 2007 57% 28% 10% 4%
Fall 2006 55% 31% 6% 8%

School District of Lancaster, 2011-2012 Student Survey May 21-25, 2012 Marginal Frequency Report – WASHINGTON ELEMENTARY N=258
Center for Opinion Research 8 Franklin & Marshall College
23. My classmates usually get better grades than I do.
Really Agree
Kind of Agree
Kind of Disagree
Really Disagree
Spring 2012 26% 27% 28% 19% Spring 2011 18% 34% 26% 22% Spring 2010 20% 33% 25% 22% Spring 2009 16% 30% 30% 23%
Fall 2008 20% 30% 23% 27% Spring 2008 20% 28% 24% 28%
Fall 2007 19% 32% 25% 24% Spring 2007 19% 31% 29% 21%
Fall 2006 21% 30% 20% 29% 24. I usually understand my homework assignments.
Really Agree
Kind of Agree
Kind of Disagree
Really Disagree
Spring 2012 53% 31% 9% 6% Spring 2011 46% 35% 11% 8% Spring 2010 52% 34% 7% 7% Spring 2009 46% 32% 14% 7%
Fall 2008 52% 31% 12% 5% Spring 2008 46% 38% 11% 5%
Fall 2007 53% 31% 12% 3% Spring 2007 48% 29% 15% 8%
Fall 2006 48% 36% 10% 6% 25. I could get the best grades in class if I tried hard enough.
Really Agree
Kind of Agree
Kind of Disagree
Really Disagree
Spring 2012 80% 13% 2% 5% Spring 2011 78% 15% 4% 3% Spring 2010 78% 14% 5% 3% Spring 2009 78% 10% 8% 4%
Fall 2008 71% 19% 6% 3% Spring 2008 82% 13% 2% 3%
Fall 2007 81% 14% 3% 2% Spring 2007 78% 18% 0% 3%
Fall 2006 85% 10% 2% 2%

School District of Lancaster, 2011-2012 Student Survey May 21-25, 2012 Marginal Frequency Report – WASHINGTON ELEMENTARY N=258
Center for Opinion Research 9 Franklin & Marshall College
26. I am a good reading student.
Really Agree
Kind of Agree
Kind of Disagree
Really Disagree
Spring 2012 53% 28% 12% 7% Spring 2011 54% 30% 8% 8% Spring 2010 55% 33% 6% 6% Spring 2009 52% 32% 10% 7%
Fall 2008 60% 26% 11% 3% Spring 2008 59% 27% 7% 6%
Fall 2007 64% 26% 6% 3% Spring 2007 60% 29% 7% 4%
Fall 2006 57% 28% 8% 8% 27. It is not hard for me to get good grades in school.
Really Agree
Kind of Agree
Kind of Disagree
Really Disagree
Spring 2012 42% 32% 12% 13% Spring 2011 41% 35% 14% 11% Spring 2010 44% 36% 13% 8% Spring 2009 42% 32% 15% 11%
Fall 2008 45% 34% 12% 8% Spring 2008 43% 33% 14% 10%
Fall 2007 44% 38% 10% 8% Spring 2007 35% 43% 14% 8%
Fall 2006 41% 41% 11% 8% 28. I am smart.
Really Agree
Kind of Agree
Kind of Disagree
Really Disagree
Spring 2012 67% 22% 6% 6% Spring 2011 65% 23% 6% 6% Spring 2010 61% 33% 2% 4% Spring 2009 65% 23% 6% 6%
Fall 2008 66% 26% 3% 4% Spring 2008 70% 16% 8% 6%
Fall 2007 66% 25% 6% 3% Spring 2007 68% 23% 5% 4%
Fall 2006 65% 23% 6% 6%

School District of Lancaster, 2011-2012 Student Survey May 21-25, 2012 Marginal Frequency Report – WASHINGTON ELEMENTARY N=258
Center for Opinion Research 10 Franklin & Marshall College
29. When the teacher asks a question I usually know the answer even if the other students don't.
Really Agree
Kind of Agree
Kind of Disagree
Really Disagree
Spring 2012 37% 43% 12% 9% Spring 2011 34% 46% 14% 6% Spring 2010 33% 49% 12% 7% Spring 2009 38% 40% 15% 7%
Fall 2008 42% 40% 12% 5% Spring 2008 39% 38% 12% 11%
Fall 2007 45% 39% 13% 4% Spring 2007 36% 44% 13% 7%
Fall 2006 41% 38% 14% 7% 30. I work hard in school.
Really Agree
Kind of Agree
Kind of Disagree
Really Disagree
Spring 2012 71% 23% 3% 3% Spring 2011 72% 22% 2% 3% Spring 2010 69% 24% 4% 2% Spring 2009 67% 25% 6% 2%
Fall 2008 79% 16% 2% 3% Spring 2008 64% 28% 5% 3%
Fall 2007 75% 22% 2% 2% Spring 2007 71% 24% 3% 1%
Fall 2006 80% 15% 2% 3% 31. Most of my classmates work harder on their homework than I do.
Really Agree
Kind of Agree
Kind of Disagree
Really Disagree
Spring 2012 27% 28% 27% 18% Spring 2011 23% 29% 25% 23% Spring 2010 22% 35% 24% 20% Spring 2009 18% 26% 34% 22%
Fall 2008 22% 33% 21% 24% Spring 2008 20% 25% 26% 29%
Fall 2007 25% 27% 23% 25% Spring 2007 25% 28% 28% 18%
Fall 2006 21% 31% 19% 29%

School District of Lancaster, 2011-2012 Student Survey May 21-25, 2012 Marginal Frequency Report – WASHINGTON ELEMENTARY N=258
Center for Opinion Research 11 Franklin & Marshall College
32. I always get good grades when I try hard.
Really Agree
Kind of Agree
Kind of Disagree
Really Disagree
Spring 2012 76% 18% 4% 3% Spring 2011 76% 20% 2% 2% Spring 2010 74% 21% 2% 3% Spring 2009 72% 21% 5% 2%
Fall 2008 76% 18% 4% 2% Spring 2008 75% 17% 3% 4%
Fall 2007 78% 17% 3% 2% Spring 2007 85% 11% 2% 2%
Fall 2006 77% 17% 4% 2% 33. I usually do not get good grades in math because it is too hard.
Really Agree
Kind of Agree
Kind of Disagree
Really Disagree
Spring 2012 13% 21% 23% 43% Spring 2011 18% 21% 18% 43% Spring 2010 17% 23% 18% 42% Spring 2009 11% 19% 25% 46%
Fall 2008 16% 20% 19% 45% Spring 2008 14% 24% 17% 44%
Fall 2007 16% 20% 19% 45% Spring 2007 16% 23% 21% 40%
Fall 2006 21% 26% 19% 34% 34. Most of my classmates like to do math because it is easy.
Really Agree
Kind of Agree
Kind of Disagree
Really Disagree
Spring 2012 54% 24% 13% 8% Spring 2011 50% 26% 17% 7% Spring 2010 46% 34% 11% 10% Spring 2009 42% 29% 19% 10%
Fall 2008 46% 27% 15% 12% Spring 2008 43% 31% 14% 12%
Fall 2007 53% 24% 16% 8% Spring 2007 56% 23% 14% 6%
Fall 2006 43% 26% 13% 17%

School District of Lancaster, 2011-2012 Student Survey May 21-25, 2012 Marginal Frequency Report – WASHINGTON ELEMENTARY N=258
Center for Opinion Research 12 Franklin & Marshall College
35. I would get better grades if my teacher liked me more.
Really Agree
Kind of Agree
Kind of Disagree
Really Disagree
Spring 2012 21% 9% 16% 54% Spring 2011 19% 10% 12% 60% Spring 2010 18% 12% 16% 55% Spring 2009 19% 9% 14% 58%
Fall 2008 24% 13% 12% 52% Spring 2008 15% 11% 15% 59%
Fall 2007 18% 12% 14% 55% Spring 2007 17% 10% 14% 59%
Fall 2006 17% 16% 12% 55% 36. I will graduate from high school.
Really Agree
Kind of Agree
Kind of Disagree
Really Disagree
Spring 2012 86% 10% 2% 3% Spring 2011 79% 14% 1% 6% Spring 2010 81% 15% 2% 3% Spring 2009 80% 17% 1% 2%
Fall 2008 85% 10% 2% 3% Spring 2008 78% 16% 2% 3%
Fall 2007 84% 13% 1% 2% Spring 2007 82% 14% 2% 2%
Fall 2006 79% 14% 4% 2% 37. I go to a good school.
Really Agree
Kind of Agree
Kind of Disagree
Really Disagree
Spring 2012 72% 18% 5% 5% Spring 2011 74% 15% 5% 5% Spring 2010 67% 20% 6% 6% Spring 2009 63% 21% 8% 9%
Fall 2008 70% 16% 8% 6% Spring 2008 63% 25% 8% 4%
Fall 2007 74% 19% 5% 2% Spring 2007 71% 17% 8% 4%
Fall 2006 76% 12% 7% 4%

School District of Lancaster, 2011-2012 Student Survey May 21-25, 2012 Marginal Frequency Report – WASHINGTON ELEMENTARY N=258
Center for Opinion Research 13 Franklin & Marshall College
38. Adults who have good jobs probably were good students when they were young.
Really Agree
Kind of Agree
Kind of Disagree
Really Disagree
Spring 2012 71% 19% 6% 4% Spring 2011 71% 20% 4% 4% Spring 2010 72% 18% 6% 4% Spring 2009 67% 20% 8% 4%
Fall 2008 76% 17% 3% 4% Spring 2008 72% 20% 5% 3%
Fall 2007 71% 19% 7% 3% Spring 2007 69% 24% 5% 3%
Fall 2006 75% 19% 4% 2% 39. When I am old enough, I will go to college.
Really Agree
Kind of Agree
Kind of Disagree
Really Disagree
Spring 2012 83% 10% 3% 4% Spring 2011 81% 11% 2% 6% Spring 2010 78% 16% 3% 3% Spring 2009 76% 16% 5% 4%
Fall 2008 84% 9% 3% 4% Spring 2008 74% 19% 3% 3%
Fall 2007 76% 18% 2% 3% Spring 2007 76% 17% 3% 4%
Fall 2006 74% 16% 1% 9% 40. No one cares if I do well in school.
Really Agree
Kind of Agree
Kind of Disagree
Really Disagree
Spring 2012 15% 9% 10% 66% Spring 2011 11% 9% 12% 68% Spring 2010 12% 10% 15% 63% Spring 2009 10% 4% 16% 70%
Fall 2008 21% 10% 10% 59% Spring 2008 7% 7% 12% 73%
Fall 2007 11% 7% 11% 71% Spring 2007 10% 8% 10% 72%
Fall 2006 12% 10% 8% 70%

School District of Lancaster, 2011-2012 Student Survey May 21-25, 2012 Marginal Frequency Report – WASHINGTON ELEMENTARY N=258
Center for Opinion Research 14 Franklin & Marshall College
41. What I learn in school is not important.
Really Agree
Kind of Agree
Kind of Disagree
Really Disagree
Spring 2012 8% 6% 8% 79% Spring 2011 10% 4% 5% 82% Spring 2010 11% 4% 4% 81% Spring 2009 9% 5% 6% 80%
Fall 2008 13% 6% 7% 75% Spring 2008 10% 6% 8% 77%
Fall 2007 14% 4% 7% 75% Spring 2007 10% 2% 6% 82%
Fall 2006 13% 3% 8% 75% 42. It does not matter if I do well in school.
Really Agree
Kind of Agree
Kind of Disagree
Really Disagree
Spring 2012 12% 8% 8% 73% Spring 2011 13% 4% 10% 73% Spring 2010 13% 6% 5% 75% Spring 2009 10% 3% 9% 78%
Fall 2008 18% 6% 8% 68% Spring 2008 12% 5% 10% 73%
Fall 2007 15% 6% 9% 70% Spring 2007 10% 4% 10% 76%
Fall 2006 16% 6% 8% 70% 43. Students who get better grades than I do get more help from the teacher than I do.
Really Agree
Kind of Agree
Kind of Disagree
Really Disagree
Spring 2012 17% 17% 18% 49% Spring 2011 19% 9% 19% 53% Spring 2010 14% 11% 19% 56% Spring 2009 13% 7% 18% 62%
Fall 2008 21% 13% 13% 53% Spring 2008 14% 11% 21% 54%
Fall 2007 15% 12% 17% 56% Spring 2007 14% 13% 18% 55%
Fall 2006 15% 16% 12% 56%
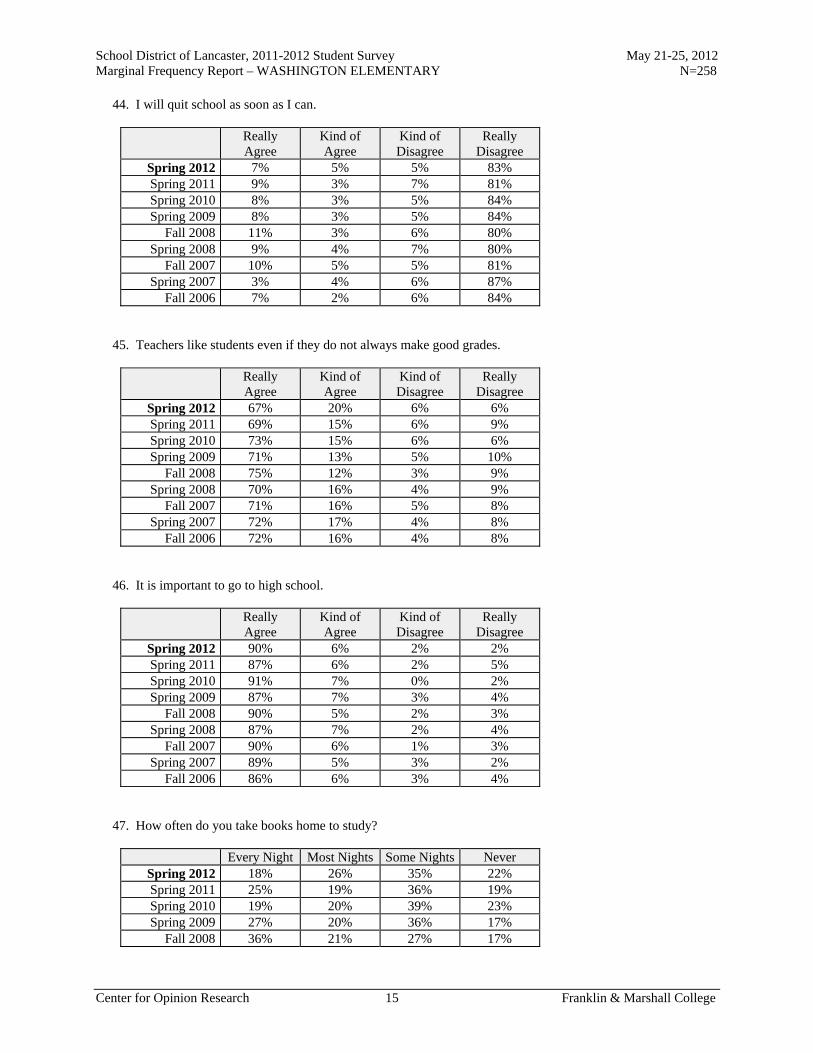
School District of Lancaster, 2011-2012 Student Survey May 21-25, 2012 Marginal Frequency Report – WASHINGTON ELEMENTARY N=258
Center for Opinion Research 15 Franklin & Marshall College
44. I will quit school as soon as I can.
Really Agree
Kind of Agree
Kind of Disagree
Really Disagree
Spring 2012 7% 5% 5% 83% Spring 2011 9% 3% 7% 81% Spring 2010 8% 3% 5% 84% Spring 2009 8% 3% 5% 84%
Fall 2008 11% 3% 6% 80% Spring 2008 9% 4% 7% 80%
Fall 2007 10% 5% 5% 81% Spring 2007 3% 4% 6% 87%
Fall 2006 7% 2% 6% 84% 45. Teachers like students even if they do not always make good grades.
Really Agree
Kind of Agree
Kind of Disagree
Really Disagree
Spring 2012 67% 20% 6% 6% Spring 2011 69% 15% 6% 9% Spring 2010 73% 15% 6% 6% Spring 2009 71% 13% 5% 10%
Fall 2008 75% 12% 3% 9% Spring 2008 70% 16% 4% 9%
Fall 2007 71% 16% 5% 8% Spring 2007 72% 17% 4% 8%
Fall 2006 72% 16% 4% 8% 46. It is important to go to high school.
Really Agree
Kind of Agree
Kind of Disagree
Really Disagree
Spring 2012 90% 6% 2% 2% Spring 2011 87% 6% 2% 5% Spring 2010 91% 7% 0% 2% Spring 2009 87% 7% 3% 4%
Fall 2008 90% 5% 2% 3% Spring 2008 87% 7% 2% 4%
Fall 2007 90% 6% 1% 3% Spring 2007 89% 5% 3% 2%
Fall 2006 86% 6% 3% 4% 47. How often do you take books home to study?
Every Night Most Nights Some Nights Never Spring 2012 18% 26% 35% 22% Spring 2011 25% 19% 36% 19% Spring 2010 19% 20% 39% 23% Spring 2009 27% 20% 36% 17%
Fall 2008 36% 21% 27% 17%

School District of Lancaster, 2011-2012 Student Survey May 21-25, 2012 Marginal Frequency Report – WASHINGTON ELEMENTARY N=258
Center for Opinion Research 16 Franklin & Marshall College
Academic Aspirations 48. How far in school do you want to go?
Complete
high school
Attend vocational/technical
school
Attend 2-year college
Attend 4-year college
Attend 4-year college plus go to
grad school Spring 2012 21% 5% 15% 21% 38% Spring 2011 16% 8% 11% 23% 42% Spring 2010 24% 6% 17% 20% 34% Spring 2009 21% 6% 13% 20% 41%
Fall 2008 24% 8% 10% 21% 37% Spring 2008 27% 6% 14% 21% 32%
Fall 2007 27% 8% 20% 19% 26% Spring 2007 16% 9% 18% 26% 31%
Fall 2006 18% 10% 12% 21% 38% 49. How important do you believe getting a college education is to your future success? Would you say it is...
Very
important Somewhat important
Not very important
Not important at
all Spring 2012 91% 6% 2% 1% Spring 2011 88% 4% 2% 5% Spring 2010 90% 7% 0% 2% Spring 2009 93% 5% 1% 0%
Fall 2008 93% 6% 1% 1% Spring 2008 90% 8% 1% 0%
Fall 2007 88% 9% 2% 1% Spring 2007 89% 9% 1% 2%
Fall 2006 88% 9% 2% 1% 50. How important would your parent/guardian say getting a college education is to your future success? Would your parents say it is...
Very
important Somewhat important
Not very important
Not important at
all Spring 2012 91% 8% 0% 1% Spring 2011 91% 6% 2% 2% Spring 2010 92% 6% 0% 1% Spring 2009 92% 7% 1% 0%
Fall 2008 91% 6% 1% 2% Spring 2008 91% 6% 2% 0%
Fall 2007 89% 8% 2% 1% Spring 2007 91% 7% 1% 1%
Fall 2006 93% 4% 2% 1%

School District of Lancaster, 2011-2012 Student Survey May 21-25, 2012 Marginal Frequency Report – WASHINGTON ELEMENTARY N=258
Center for Opinion Research 17 Franklin & Marshall College
51. How important would your teachers say getting a college education is to your future success? Would your teachers say it is...
Very
important Somewhat important
Not very important
Not important at
all Spring 2012 96% 4% 0% 0% Spring 2011 90% 8% 1% 2% Spring 2010 93% 4% 2% 1% Spring 2009 92% 6% 1% 0%
Fall 2008 92% 6% 0% 2% Spring 2008 93% 4% 1% 2%
Fall 2007 95% 3% 2% 0% Spring 2007 92% 6% 1% 1%
Fall 2006 93% 6% 1% 1% Perceptions of Police Do you agree or disagree with the following statements about police officers? 52. I respect police officers.
Really Agree
Kind of Agree
Kind of Disagree
Really Disagree
Spring 2012 87% 9% 2% 2% Spring 2011 84% 9% 3% 4% Spring 2010 89% 6% 3% 3% Spring 2009 83% 10% 4% 3%
Fall 2008 88% 7% 2% 3% Spring 2008 87% 6% 4% 3%
Fall 2007 81% 4% 7% 8% Spring 2007 82% 8% 4% 6%
Fall 2006 81% 9% 6% 4% 53. I am comfortable approaching police officers.
Really Agree
Kind of Agree
Kind of Disagree
Really Disagree
Spring 2012 56% 28% 10% 6% Spring 2011 54% 25% 8% 14% Spring 2010 52% 35% 5% 8% Spring 2009 57% 27% 9% 7%
Fall 2008 60% 23% 7% 10% Spring 2008 55% 25% 10% 9%
Fall 2007 58% 18% 11% 12% Spring 2007 56% 16% 11% 17%
Fall 2006 56% 25% 6% 12%

School District of Lancaster, 2011-2012 Student Survey May 21-25, 2012 Marginal Frequency Report – WASHINGTON ELEMENTARY N=258
Center for Opinion Research 18 Franklin & Marshall College
54. I would consider police work as a career.
Really Agree
Kind of Agree
Kind of Disagree
Really Disagree
Spring 2012 47% 18% 10% 25% Spring 2011 38% 22% 14% 26% Spring 2010 40% 17% 11% 33% Spring 2009 36% 18% 12% 34%
Fall 2008 40% 18% 9% 32% Spring 2008 44% 17% 14% 25%
Fall 2007 46% 16% 12% 25% Spring 2007 40% 16% 10% 35%
Fall 2006 38% 22% 8% 32% 55. In general, I do not trust the police.
Really Agree
Kind of Agree
Kind of Disagree
Really Disagree
Spring 2012 10% 11% 13% 66% Spring 2011 16% 10% 11% 64% Spring 2010 17% 10% 11% 62% Spring 2009 14% 10% 14% 62%
Fall 2008 22% 6% 8% 65% Spring 2008 13% 12% 16% 59%
Fall 2007 20% 12% 8% 60% Spring 2007 14% 13% 12% 61%
Fall 2006 21% 10% 12% 57% 56. Police do not belong in schools unless there has been a crime.
Really Agree
Kind of Agree
Kind of Disagree
Really Disagree
Spring 2012 32% 6% 17% 46% Spring 2011 32% 9% 12% 47% Spring 2010 34% 7% 14% 44% Spring 2009 38% 9% 14% 39%
Fall 2008 49% 12% 8% 31% Spring 2008 45% 15% 12% 28%
Fall 2007 55% 14% 9% 23% Spring 2007 49% 11% 11% 29%
Fall 2006 48% 11% 8% 33%

Report N
Marginal Frequency Report Wharton Elementary School

School District of Lancaster, 2011-2012 Student Survey May 21-25, 2012 Marginal Frequency Report – WHARTON ELEMENTARY N=105
Center for Opinion Research 1 Franklin & Marshall College
School Climate Do you agree or disagree with the following statements? 1. I feel safe at this school.
Really Agree
Kind of Agree
Kind of Disagree
Really Disagree
Spring 2012 43% 39% 13% 5% Spring 2011 46% 40% 13% 1% Spring 2010 58% 31% 8% 3% Spring 2009 58% 36% 5% 1%
Fall 2008 73% 21% 5% 1% Spring 2008 58% 30% 10% 2%
Fall 2007 64% 29% 6% 2% Spring 2007 51% 40% 7% 2%
Fall 2006 75% 22% 2% 1% 2. I feel safe going to and from school.
Really Agree
Kind of Agree
Kind of Disagree
Really Disagree
Spring 2012 58% 34% 4% 4% Spring 2011 63% 21% 9% 7% Spring 2010 56% 27% 15% 2% Spring 2009 50% 41% 8% 2%
Fall 2008 67% 21% 10% 2% Spring 2008 55% 30% 10% 5%
Fall 2007 58% 32% 6% 3% Spring 2007 51% 34% 11% 4%
Fall 2006 48% 42% 6% 4% 3. Students get along well with each other.
Really Agree
Kind of Agree
Kind of Disagree
Really Disagree
Spring 2012 12% 35% 40% 13% Spring 2011 8% 40% 32% 20% Spring 2010 10% 49% 27% 14% Spring 2009 12% 56% 21% 11%
Fall 2008 22% 56% 19% 3% Spring 2008 6% 34% 39% 22%
Fall 2007 21% 35% 32% 12% Spring 2007 3% 26% 47% 24%
Fall 2006 10% 48% 34% 8%

School District of Lancaster, 2011-2012 Student Survey May 21-25, 2012 Marginal Frequency Report – WHARTON ELEMENTARY N=105
Center for Opinion Research 2 Franklin & Marshall College
4. Students get along well with teachers.
Really Agree
Kind of Agree
Kind of Disagree
Really Disagree
Spring 2012 20% 30% 37% 14% Spring 2011 13% 34% 36% 17% Spring 2010 26% 44% 17% 13% Spring 2009 33% 49% 12% 6%
Fall 2008 48% 46% 6% 0% Spring 2008 24% 44% 26% 6%
Fall 2007 30% 44% 22% 5% Spring 2007 18% 46% 29% 7%
Fall 2006 31% 45% 15% 9% 5. I like my school.
Really Agree
Kind of Agree
Kind of Disagree
Really Disagree
Spring 2012 45% 33% 12% 10% Spring 2011 49% 27% 16% 8% Spring 2010 57% 34% 4% 4% Spring 2009 61% 20% 10% 9%
Fall 2008 70% 20% 8% 3% Spring 2008 47% 36% 6% 11%
Fall 2007 66% 23% 3% 7% Spring 2007 47% 33% 8% 12%
Fall 2006 71% 21% 7% 1% 6. I like my teachers.
Really Agree
Kind of Agree
Kind of Disagree
Really Disagree
Spring 2012 55% 28% 10% 7% Spring 2011 60% 20% 14% 7% Spring 2010 71% 26% 1% 2% Spring 2009 72% 20% 7% 2%
Fall 2008 86% 11% 3% 0% Spring 2008 62% 27% 6% 5%
Fall 2007 72% 21% 5% 2% Spring 2007 68% 24% 8% 1%
ll 2006 86% 11% 3% 0%

School District of Lancaster, 2011-2012 Student Survey May 21-25, 2012 Marginal Frequency Report – WHARTON ELEMENTARY N=105
Center for Opinion Research 3 Franklin & Marshall College
7. There is a teacher or some other adult at this school who really cares about me.
Really Agree
Kind of Agree
Kind of Disagree
Really Disagree
Spring 2012 66% 22% 8% 4% Spring 2011 70% 22% 4% 3% Spring 2010 68% 19% 4% 8% Spring 2009 64% 29% 5% 2%
Fall 2008 69% 27% 3% 1% Spring 2008 66% 21% 8% 4%
Fall 2007 66% 22% 7% 4% Spring 2007 63% 24% 9% 5%
Fall 2006 70% 21% 9% 1% 8. There is a teacher or some other adult at this school who cares when I am not here.
Really Agree
Kind of Agree
Kind of Disagree
Really Disagree
Spring 2012 32% 32% 17% 19% Spring 2011 40% 27% 9% 24% Spring 2010 56% 22% 7% 16% Spring 2009 51% 29% 11% 9%
Fall 2008 46% 37% 10% 7% Spring 2008 43% 26% 14% 18%
Fall 2007 48% 23% 15% 15% Spring 2007 38% 33% 15% 13%
Fall 2006 42% 26% 14% 17% 9. There is a teacher or some other adult at this school who listens to me when I have something to say.
Really Agree
Kind of Agree
Kind of Disagree
Really Disagree
Spring 2012 58% 31% 6% 5% Spring 2011 66% 18% 8% 8% Spring 2010 72% 16% 3% 9% Spring 2009 72% 22% 4% 3%
Fall 2008 80% 17% 2% 1% Spring 2008 64% 26% 7% 2%
Fall 2007 67% 25% 5% 4% Spring 2007 64% 30% 5% 1%
Fall 2006 72% 20% 8% 1%
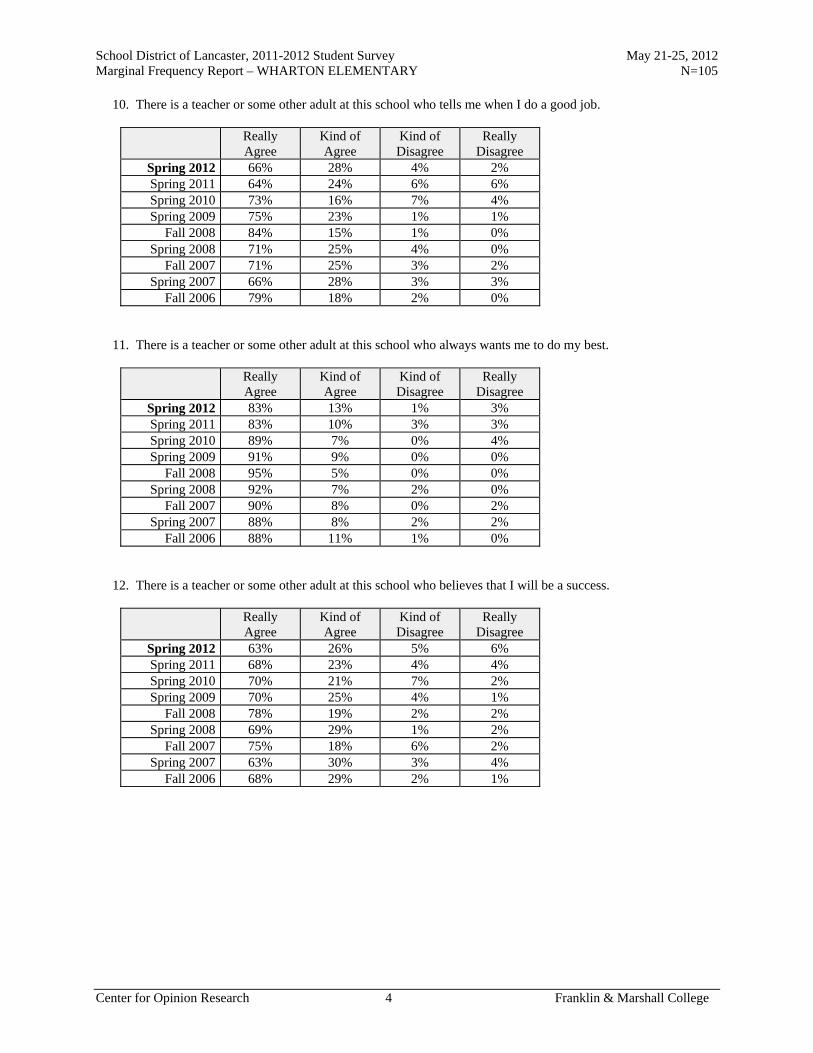
School District of Lancaster, 2011-2012 Student Survey May 21-25, 2012 Marginal Frequency Report – WHARTON ELEMENTARY N=105
Center for Opinion Research 4 Franklin & Marshall College
10. There is a teacher or some other adult at this school who tells me when I do a good job.
Really Agree
Kind of Agree
Kind of Disagree
Really Disagree
Spring 2012 66% 28% 4% 2% Spring 2011 64% 24% 6% 6% Spring 2010 73% 16% 7% 4% Spring 2009 75% 23% 1% 1%
Fall 2008 84% 15% 1% 0% Spring 2008 71% 25% 4% 0%
Fall 2007 71% 25% 3% 2% Spring 2007 66% 28% 3% 3%
Fall 2006 79% 18% 2% 0% 11. There is a teacher or some other adult at this school who always wants me to do my best.
Really Agree
Kind of Agree
Kind of Disagree
Really Disagree
Spring 2012 83% 13% 1% 3% Spring 2011 83% 10% 3% 3% Spring 2010 89% 7% 0% 4% Spring 2009 91% 9% 0% 0%
Fall 2008 95% 5% 0% 0% Spring 2008 92% 7% 2% 0%
Fall 2007 90% 8% 0% 2% Spring 2007 88% 8% 2% 2%
Fall 2006 88% 11% 1% 0% 12. There is a teacher or some other adult at this school who believes that I will be a success.
Really Agree
Kind of Agree
Kind of Disagree
Really Disagree
Spring 2012 63% 26% 5% 6% Spring 2011 68% 23% 4% 4% Spring 2010 70% 21% 7% 2% Spring 2009 70% 25% 4% 1%
Fall 2008 78% 19% 2% 2% Spring 2008 69% 29% 1% 2%
Fall 2007 75% 18% 6% 2% Spring 2007 63% 30% 3% 4%
Fall 2006 68% 29% 2% 1%

School District of Lancaster, 2011-2012 Student Survey May 21-25, 2012 Marginal Frequency Report – WHARTON ELEMENTARY N=105
Center for Opinion Research 5 Franklin & Marshall College
13. Students in this school really listen to teachers.
Really Agree
Kind of Agree
Kind of Disagree
Really Disagree
Spring 2012 10% 26% 44% 21% Spring 2011 5% 34% 37% 24% Spring 2010 12% 54% 21% 12% Spring 2009 9% 57% 24% 10%
Fall 2008 18% 65% 17% 1% Spring 2008 13% 32% 43% 12%
Fall 2007 17% 43% 25% 15% Spring 2007 10% 43% 37% 10%
Fall 2006 18% 52% 23% 6% 14. Most teachers make learning interesting.
Really Agree
Kind of Agree
Kind of Disagree
Really Disagree
Spring 2012 46% 35% 12% 8% Spring 2011 40% 34% 17% 9% Spring 2010 46% 33% 13% 8% Spring 2009 53% 37% 7% 3%
Fall 2008 71% 22% 6% 1% Spring 2008 53% 36% 8% 3%
Fall 2007 56% 30% 8% 6% Spring 2007 50% 35% 11% 4%
Fall 2006 63% 34% 1% 2% 15. This school is always getting better.
Really Agree
Kind of Agree
Kind of Disagree
Really Disagree
Spring 2012 34% 27% 23% 16% Spring 2011 32% 35% 18% 16% Spring 2010 43% 36% 12% 9% Spring 2009 40% 38% 12% 11%
Fall 2008 58% 28% 11% 3% Spring 2008 34% 42% 14% 9%
Fall 2007 46% 30% 15% 9% Spring 2007 28% 46% 19% 7%
Fall 2006 55% 28% 13% 4%
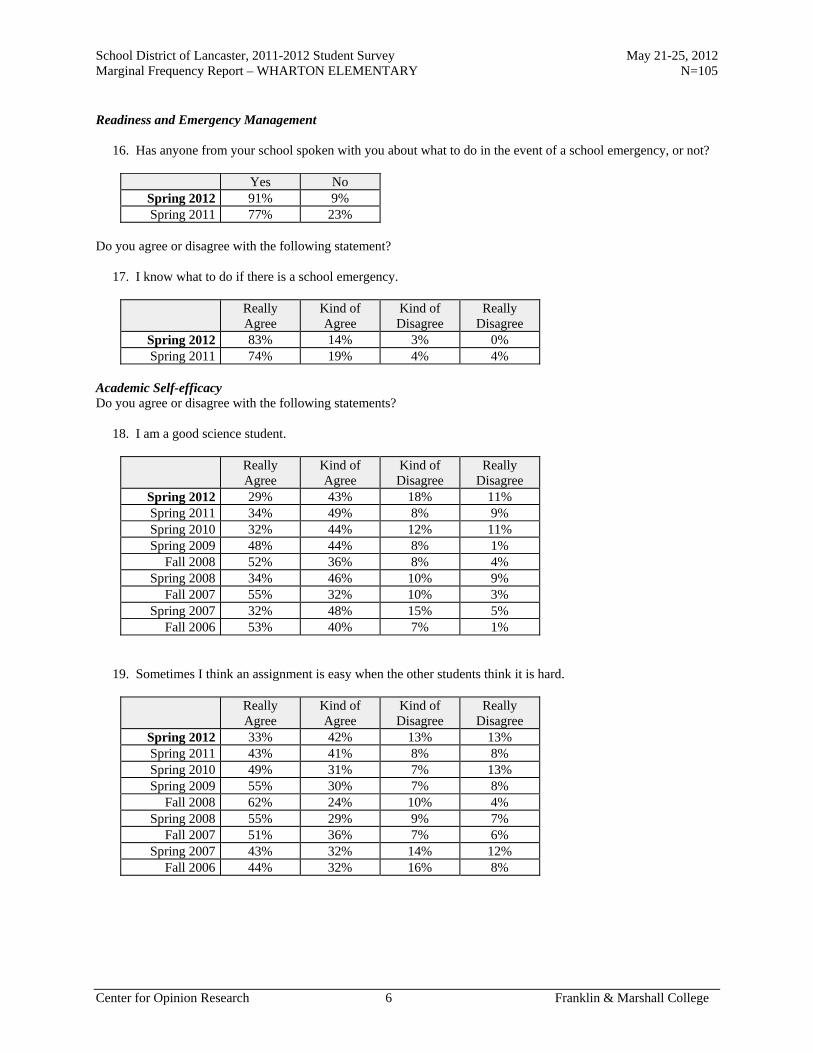
School District of Lancaster, 2011-2012 Student Survey May 21-25, 2012 Marginal Frequency Report – WHARTON ELEMENTARY N=105
Center for Opinion Research 6 Franklin & Marshall College
Readiness and Emergency Management 16. Has anyone from your school spoken with you about what to do in the event of a school emergency, or not?
Yes No Spring 2012 91% 9% Spring 2011 77% 23%
Do you agree or disagree with the following statement? 17. I know what to do if there is a school emergency.
Really Agree
Kind of Agree
Kind of Disagree
Really Disagree
Spring 2012 83% 14% 3% 0% Spring 2011 74% 19% 4% 4%
Academic Self-efficacy Do you agree or disagree with the following statements? 18. I am a good science student.
Really Agree
Kind of Agree
Kind of Disagree
Really Disagree
Spring 2012 29% 43% 18% 11% Spring 2011 34% 49% 8% 9% Spring 2010 32% 44% 12% 11% Spring 2009 48% 44% 8% 1%
Fall 2008 52% 36% 8% 4% Spring 2008 34% 46% 10% 9%
Fall 2007 55% 32% 10% 3% Spring 2007 32% 48% 15% 5%
Fall 2006 53% 40% 7% 1% 19. Sometimes I think an assignment is easy when the other students think it is hard.
Really Agree
Kind of Agree
Kind of Disagree
Really Disagree
Spring 2012 33% 42% 13% 13% Spring 2011 43% 41% 8% 8% Spring 2010 49% 31% 7% 13% Spring 2009 55% 30% 7% 8%
Fall 2008 62% 24% 10% 4% Spring 2008 55% 29% 9% 7%
Fall 2007 51% 36% 7% 6% Spring 2007 43% 32% 14% 12%
Fall 2006 44% 32% 16% 8%

School District of Lancaster, 2011-2012 Student Survey May 21-25, 2012 Marginal Frequency Report – WHARTON ELEMENTARY N=105
Center for Opinion Research 7 Franklin & Marshall College
20. I am good social studies student.
Really Agree
Kind of Agree
Kind of Disagree
Really Disagree
Spring 2012 28% 37% 26% 9% Spring 2011 31% 46% 13% 9% Spring 2010 35% 47% 8% 10% Spring 2009 46% 41% 6% 7%
Fall 2008 57% 33% 8% 2% Spring 2008 44% 43% 9% 4%
Fall 2007 56% 29% 11% 4% Spring 2007 39% 43% 10% 7%
Fall 2006 53% 33% 10% 4% 21. My teacher thinks I am smart.
Really Agree
Kind of Agree
Kind of Disagree
Really Disagree
Spring 2012 62% 29% 5% 4% Spring 2011 72% 21% 4% 4% Spring 2010 70% 21% 3% 6% Spring 2009 76% 17% 6% 1%
Fall 2008 78% 22% 1% 0% Spring 2008 69% 25% 4% 2%
Fall 2007 68% 25% 4% 3% Spring 2007 63% 31% 4% 2%
Fall 2006 75% 19% 3% 2% 22. I am a good math student.
Really Agree
Kind of Agree
Kind of Disagree
Really Disagree
Spring 2012 55% 31% 10% 4% Spring 2011 61% 26% 10% 2% Spring 2010 59% 33% 6% 2% Spring 2009 64% 29% 5% 2%
Fall 2008 69% 24% 1% 6% Spring 2008 61% 26% 6% 8%
Fall 2007 68% 20% 6% 6% Spring 2007 58% 26% 13% 3%
Fall 2006 65% 27% 4% 3%

School District of Lancaster, 2011-2012 Student Survey May 21-25, 2012 Marginal Frequency Report – WHARTON ELEMENTARY N=105
Center for Opinion Research 8 Franklin & Marshall College
23. My classmates usually get better grades than I do.
Really Agree
Kind of Agree
Kind of Disagree
Really Disagree
Spring 2012 17% 31% 26% 26% Spring 2011 12% 41% 19% 28% Spring 2010 23% 26% 34% 17% Spring 2009 16% 34% 30% 20%
Fall 2008 12% 23% 41% 25% Spring 2008 14% 28% 32% 27%
Fall 2007 18% 30% 28% 24% Spring 2007 16% 26% 33% 24%
Fall 2006 13% 30% 30% 27% 24. I usually understand my homework assignments.
Really Agree
Kind of Agree
Kind of Disagree
Really Disagree
Spring 2012 36% 50% 5% 9% Spring 2011 35% 36% 21% 7% Spring 2010 40% 43% 8% 9% Spring 2009 68% 19% 11% 2%
Fall 2008 64% 26% 8% 2% Spring 2008 59% 25% 11% 5%
Fall 2007 63% 22% 10% 5% Spring 2007 60% 24% 15% 1%
Fall 2006 67% 27% 3% 2% 25. I could get the best grades in class if I tried hard enough.
Really Agree
Kind of Agree
Kind of Disagree
Really Disagree
Spring 2012 67% 23% 6% 4% Spring 2011 64% 27% 4% 6% Spring 2010 74% 18% 4% 3% Spring 2009 79% 14% 7% 0%
Fall 2008 77% 15% 4% 4% Spring 2008 74% 21% 3% 2%
Fall 2007 73% 23% 2% 2% Spring 2007 68% 25% 5% 2%
Fall 2006 74% 21% 6% 0%

School District of Lancaster, 2011-2012 Student Survey May 21-25, 2012 Marginal Frequency Report – WHARTON ELEMENTARY N=105
Center for Opinion Research 9 Franklin & Marshall College
26. I am a good reading student.
Really Agree
Kind of Agree
Kind of Disagree
Really Disagree
Spring 2012 62% 25% 8% 5% Spring 2011 51% 37% 8% 4% Spring 2010 54% 33% 9% 4% Spring 2009 71% 24% 3% 2%
Fall 2008 79% 18% 2% 1% Spring 2008 63% 29% 6% 2%
Fall 2007 66% 28% 6% 0% Spring 2007 57% 31% 9% 3%
Fall 2006 58% 36% 5% 1% 27. It is not hard for me to get good grades in school.
Really Agree
Kind of Agree
Kind of Disagree
Really Disagree
Spring 2012 50% 33% 9% 9% Spring 2011 36% 39% 16% 10% Spring 2010 40% 34% 12% 14% Spring 2009 44% 42% 6% 8%
Fall 2008 54% 35% 9% 3% Spring 2008 42% 39% 13% 6%
Fall 2007 46% 28% 18% 8% Spring 2007 41% 36% 12% 11%
Fall 2006 39% 41% 12% 8% 28. I am smart.
Really Agree
Kind of Agree
Kind of Disagree
Really Disagree
Spring 2012 65% 26% 4% 6% Spring 2011 65% 23% 7% 5% Spring 2010 66% 28% 6% 1% Spring 2009 69% 24% 4% 3%
Fall 2008 74% 24% 1% 1% Spring 2008 70% 25% 2% 2%
Fall 2007 66% 23% 6% 4% Spring 2007 62% 26% 9% 3%
Fall 2006 69% 24% 7% 0%

School District of Lancaster, 2011-2012 Student Survey May 21-25, 2012 Marginal Frequency Report – WHARTON ELEMENTARY N=105
Center for Opinion Research 10 Franklin & Marshall College
29. When the teacher asks a question I usually know the answer even if the other students don't.
Really Agree
Kind of Agree
Kind of Disagree
Really Disagree
Spring 2012 30% 45% 15% 11% Spring 2011 33% 41% 14% 12% Spring 2010 32% 46% 18% 4% Spring 2009 36% 48% 11% 5%
Fall 2008 36% 42% 18% 4% Spring 2008 41% 37% 18% 4%
Fall 2007 38% 38% 18% 6% Spring 2007 24% 50% 20% 6%
Fall 2006 29% 51% 12% 8% 30. I work hard in school.
Really Agree
Kind of Agree
Kind of Disagree
Really Disagree
Spring 2012 66% 24% 7% 3% Spring 2011 63% 27% 7% 2% Spring 2010 72% 21% 3% 3% Spring 2009 74% 23% 2% 1%
Fall 2008 86% 13% 1% 0% Spring 2008 80% 15% 1% 4%
Fall 2007 78% 15% 6% 2% Spring 2007 71% 26% 2% 1%
Fall 2006 86% 9% 5% 0% 31. Most of my classmates work harder on their homework than I do.
Really Agree
Kind of Agree
Kind of Disagree
Really Disagree
Spring 2012 22% 32% 30% 16% Spring 2011 14% 35% 28% 22% Spring 2010 16% 27% 32% 26% Spring 2009 17% 22% 34% 27%
Fall 2008 16% 25% 32% 26% Spring 2008 20% 23% 26% 31%
Fall 2007 17% 19% 34% 30% Spring 2007 10% 27% 26% 36%
Fall 2006 12% 28% 31% 30%

School District of Lancaster, 2011-2012 Student Survey May 21-25, 2012 Marginal Frequency Report – WHARTON ELEMENTARY N=105
Center for Opinion Research 11 Franklin & Marshall College
32. I always get good grades when I try hard.
Really Agree
Kind of Agree
Kind of Disagree
Really Disagree
Spring 2012 68% 23% 3% 6% Spring 2011 66% 26% 7% 1% Spring 2010 73% 20% 4% 2% Spring 2009 69% 26% 5% 0%
Fall 2008 73% 22% 4% 1% Spring 2008 77% 20% 2% 1%
Fall 2007 72% 21% 3% 4% Spring 2007 71% 22% 4% 2%
Fall 2006 77% 15% 3% 5% 33. I usually do not get good grades in math because it is too hard.
Really Agree
Kind of Agree
Kind of Disagree
Really Disagree
Spring 2012 15% 18% 22% 44% Spring 2011 8% 18% 16% 58% Spring 2010 7% 14% 24% 55% Spring 2009 6% 13% 20% 61%
Fall 2008 9% 17% 19% 55% Spring 2008 7% 14% 20% 59%
Fall 2007 15% 15% 16% 54% Spring 2007 5% 20% 16% 59%
Fall 2006 12% 15% 26% 47% 34. Most of my classmates like to do math because it is easy.
Really Agree
Kind of Agree
Kind of Disagree
Really Disagree
Spring 2012 48% 26% 22% 5% Spring 2011 33% 26% 25% 16% Spring 2010 30% 33% 27% 10% Spring 2009 33% 31% 22% 15%
Fall 2008 42% 30% 20% 9% Spring 2008 41% 19% 30% 10%
Fall 2007 42% 24% 23% 12% Spring 2007 36% 33% 19% 11%
Fall 2006 36% 30% 27% 7%
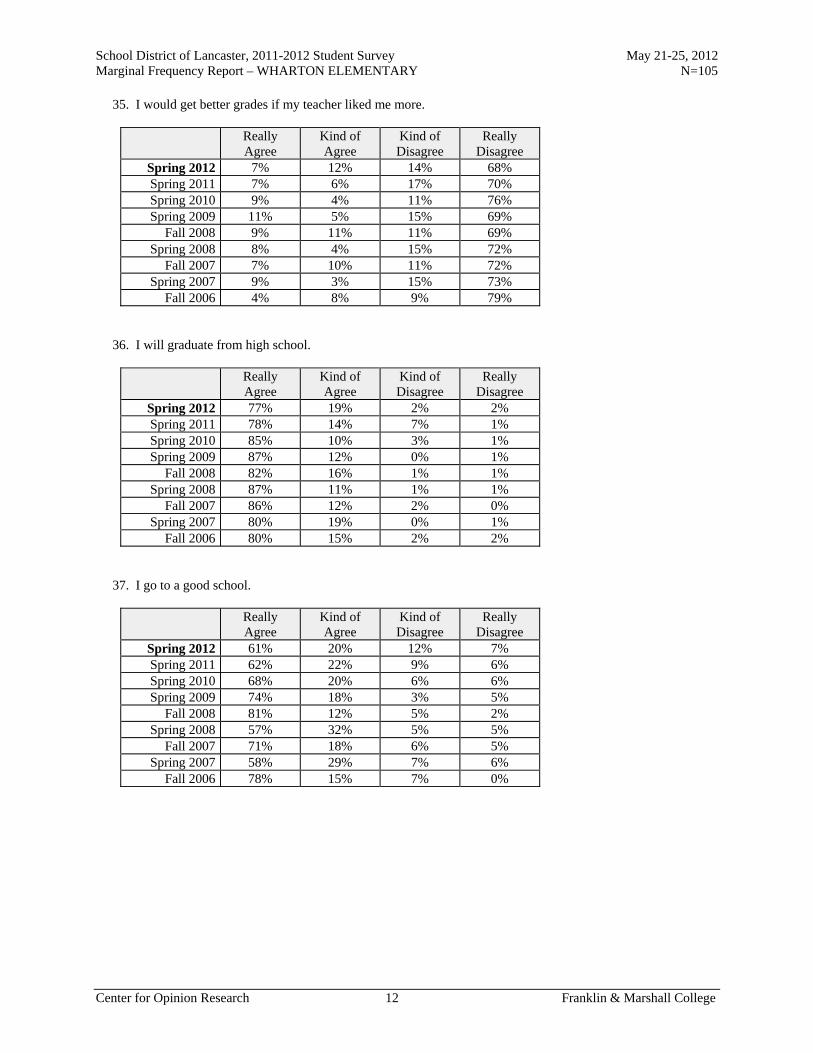
School District of Lancaster, 2011-2012 Student Survey May 21-25, 2012 Marginal Frequency Report – WHARTON ELEMENTARY N=105
Center for Opinion Research 12 Franklin & Marshall College
35. I would get better grades if my teacher liked me more.
Really Agree
Kind of Agree
Kind of Disagree
Really Disagree
Spring 2012 7% 12% 14% 68% Spring 2011 7% 6% 17% 70% Spring 2010 9% 4% 11% 76% Spring 2009 11% 5% 15% 69%
Fall 2008 9% 11% 11% 69% Spring 2008 8% 4% 15% 72%
Fall 2007 7% 10% 11% 72% Spring 2007 9% 3% 15% 73%
Fall 2006 4% 8% 9% 79% 36. I will graduate from high school.
Really Agree
Kind of Agree
Kind of Disagree
Really Disagree
Spring 2012 77% 19% 2% 2% Spring 2011 78% 14% 7% 1% Spring 2010 85% 10% 3% 1% Spring 2009 87% 12% 0% 1%
Fall 2008 82% 16% 1% 1% Spring 2008 87% 11% 1% 1%
Fall 2007 86% 12% 2% 0% Spring 2007 80% 19% 0% 1%
Fall 2006 80% 15% 2% 2% 37. I go to a good school.
Really Agree
Kind of Agree
Kind of Disagree
Really Disagree
Spring 2012 61% 20% 12% 7% Spring 2011 62% 22% 9% 6% Spring 2010 68% 20% 6% 6% Spring 2009 74% 18% 3% 5%
Fall 2008 81% 12% 5% 2% Spring 2008 57% 32% 5% 5%
Fall 2007 71% 18% 6% 5% Spring 2007 58% 29% 7% 6%
Fall 2006 78% 15% 7% 0%
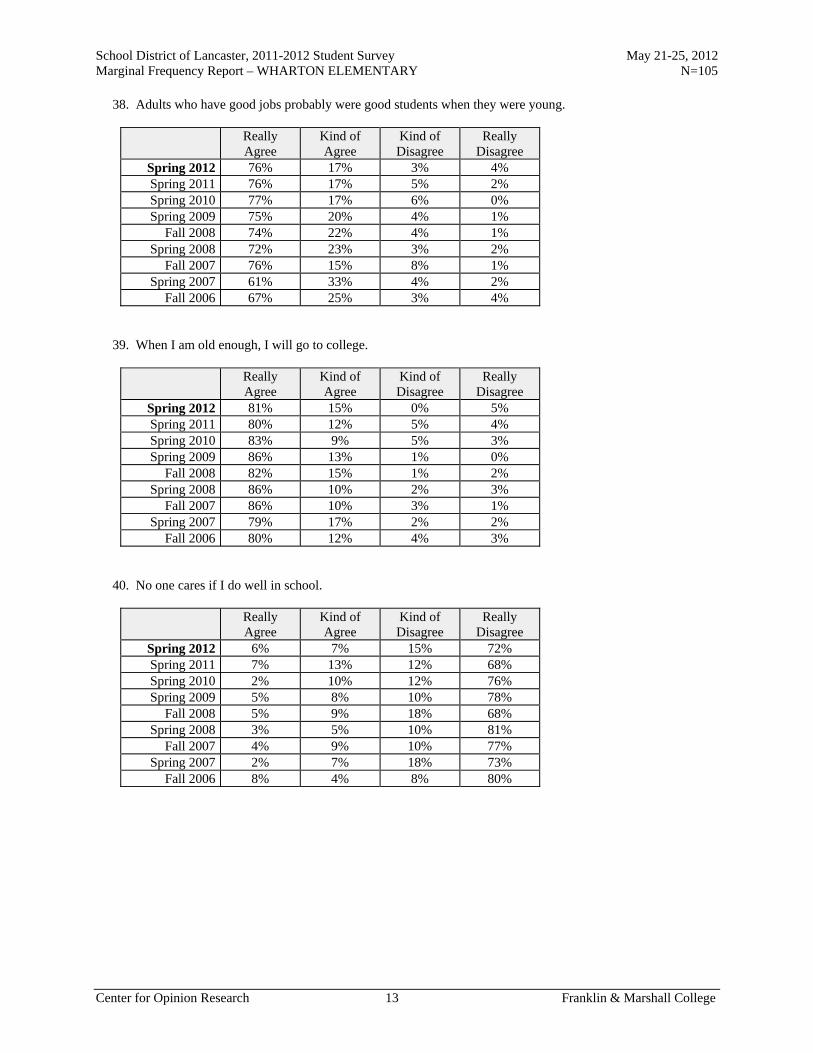
School District of Lancaster, 2011-2012 Student Survey May 21-25, 2012 Marginal Frequency Report – WHARTON ELEMENTARY N=105
Center for Opinion Research 13 Franklin & Marshall College
38. Adults who have good jobs probably were good students when they were young.
Really Agree
Kind of Agree
Kind of Disagree
Really Disagree
Spring 2012 76% 17% 3% 4% Spring 2011 76% 17% 5% 2% Spring 2010 77% 17% 6% 0% Spring 2009 75% 20% 4% 1%
Fall 2008 74% 22% 4% 1% Spring 2008 72% 23% 3% 2%
Fall 2007 76% 15% 8% 1% Spring 2007 61% 33% 4% 2%
Fall 2006 67% 25% 3% 4% 39. When I am old enough, I will go to college.
Really Agree
Kind of Agree
Kind of Disagree
Really Disagree
Spring 2012 81% 15% 0% 5% Spring 2011 80% 12% 5% 4% Spring 2010 83% 9% 5% 3% Spring 2009 86% 13% 1% 0%
Fall 2008 82% 15% 1% 2% Spring 2008 86% 10% 2% 3%
Fall 2007 86% 10% 3% 1% Spring 2007 79% 17% 2% 2%
Fall 2006 80% 12% 4% 3% 40. No one cares if I do well in school.
Really Agree
Kind of Agree
Kind of Disagree
Really Disagree
Spring 2012 6% 7% 15% 72% Spring 2011 7% 13% 12% 68% Spring 2010 2% 10% 12% 76% Spring 2009 5% 8% 10% 78%
Fall 2008 5% 9% 18% 68% Spring 2008 3% 5% 10% 81%
Fall 2007 4% 9% 10% 77% Spring 2007 2% 7% 18% 73%
Fall 2006 8% 4% 8% 80%

School District of Lancaster, 2011-2012 Student Survey May 21-25, 2012 Marginal Frequency Report – WHARTON ELEMENTARY N=105
Center for Opinion Research 14 Franklin & Marshall College
41. What I learn in school is not important.
Really Agree
Kind of Agree
Kind of Disagree
Really Disagree
Spring 2012 7% 3% 8% 82% Spring 2011 1% 4% 8% 87% Spring 2010 9% 1% 3% 86% Spring 2009 8% 2% 5% 85%
Fall 2008 8% 2% 9% 81% Spring 2008 3% 2% 7% 88%
Fall 2007 9% 4% 8% 79% Spring 2007 3% 3% 6% 88%
Fall 2006 6% 2% 6% 86% 42. It does not matter if I do well in school.
Really Agree
Kind of Agree
Kind of Disagree
Really Disagree
Spring 2012 4% 5% 9% 82% Spring 2011 6% 4% 10% 81% Spring 2010 10% 6% 7% 77% Spring 2009 6% 1% 9% 84%
Fall 2008 8% 2% 9% 81% Spring 2008 3% 3% 5% 90%
Fall 2007 7% 3% 7% 82% Spring 2007 4% 1% 7% 87%
Fall 2006 4% 4% 5% 88% 43. Students who get better grades than I do get more help from the teacher than I do.
Really Agree
Kind of Agree
Kind of Disagree
Really Disagree
Spring 2012 10% 17% 24% 50% Spring 2011 7% 10% 27% 56% Spring 2010 9% 9% 25% 57% Spring 2009 9% 10% 22% 59%
Fall 2008 6% 6% 20% 68% Spring 2008 7% 7% 22% 64%
Fall 2007 10% 10% 17% 63% Spring 2007 7% 10% 21% 62%
Fall 2006 9% 6% 16% 69%
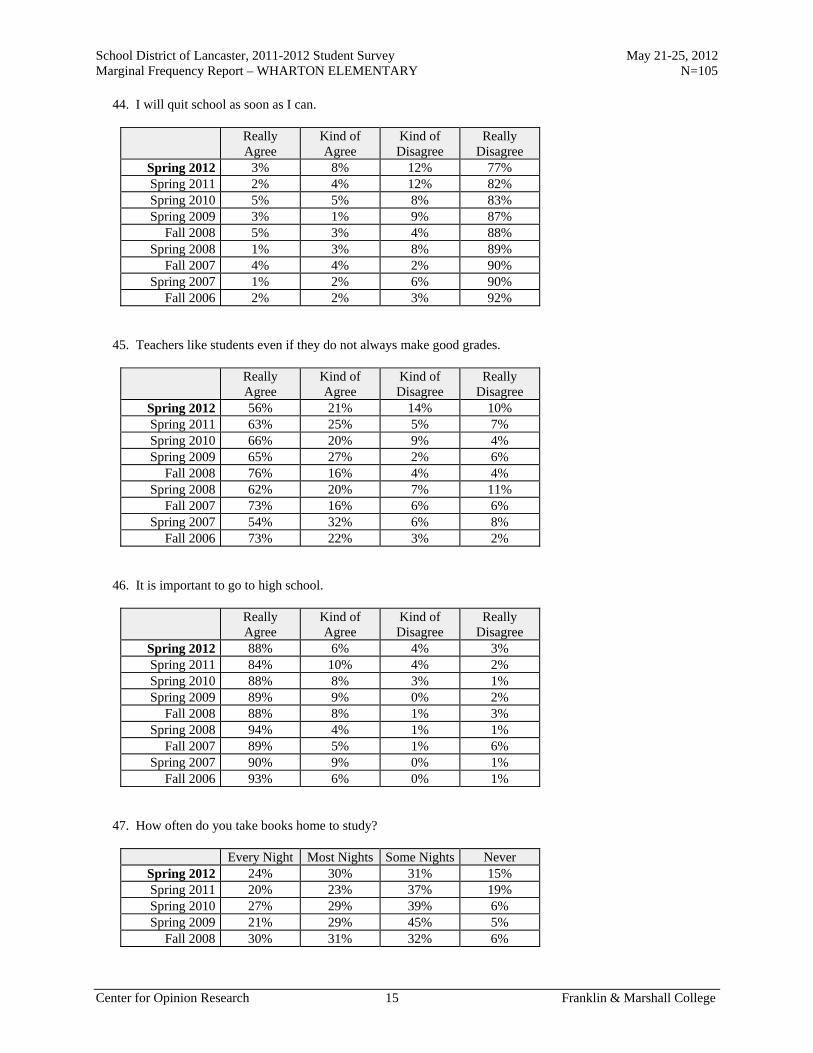
School District of Lancaster, 2011-2012 Student Survey May 21-25, 2012 Marginal Frequency Report – WHARTON ELEMENTARY N=105
Center for Opinion Research 15 Franklin & Marshall College
44. I will quit school as soon as I can.
Really Agree
Kind of Agree
Kind of Disagree
Really Disagree
Spring 2012 3% 8% 12% 77% Spring 2011 2% 4% 12% 82% Spring 2010 5% 5% 8% 83% Spring 2009 3% 1% 9% 87%
Fall 2008 5% 3% 4% 88% Spring 2008 1% 3% 8% 89%
Fall 2007 4% 4% 2% 90% Spring 2007 1% 2% 6% 90%
Fall 2006 2% 2% 3% 92% 45. Teachers like students even if they do not always make good grades.
Really Agree
Kind of Agree
Kind of Disagree
Really Disagree
Spring 2012 56% 21% 14% 10% Spring 2011 63% 25% 5% 7% Spring 2010 66% 20% 9% 4% Spring 2009 65% 27% 2% 6%
Fall 2008 76% 16% 4% 4% Spring 2008 62% 20% 7% 11%
Fall 2007 73% 16% 6% 6% Spring 2007 54% 32% 6% 8%
Fall 2006 73% 22% 3% 2% 46. It is important to go to high school.
Really Agree
Kind of Agree
Kind of Disagree
Really Disagree
Spring 2012 88% 6% 4% 3% Spring 2011 84% 10% 4% 2% Spring 2010 88% 8% 3% 1% Spring 2009 89% 9% 0% 2%
Fall 2008 88% 8% 1% 3% Spring 2008 94% 4% 1% 1%
Fall 2007 89% 5% 1% 6% Spring 2007 90% 9% 0% 1%
Fall 2006 93% 6% 0% 1% 47. How often do you take books home to study?
Every Night Most Nights Some Nights Never Spring 2012 24% 30% 31% 15% Spring 2011 20% 23% 37% 19% Spring 2010 27% 29% 39% 6% Spring 2009 21% 29% 45% 5%
Fall 2008 30% 31% 32% 6%

School District of Lancaster, 2011-2012 Student Survey May 21-25, 2012 Marginal Frequency Report – WHARTON ELEMENTARY N=105
Center for Opinion Research 16 Franklin & Marshall College
Academic Aspirations 48. How far in school do you want to go?
Complete
high school
Attend vocational/technical
school
Attend 2-year college
Attend 4-year college
Attend 4-year college plus go to
grad school Spring 2012 18% 7% 16% 20% 39% Spring 2011 19% 6% 19% 18% 38% Spring 2010 14% 0% 4% 31% 51% Spring 2009 9% 2% 18% 22% 48%
Fall 2008 11% 2% 11% 27% 49% Spring 2008 10% 4% 19% 31% 35%
Fall 2007 10% 2% 14% 28% 46% Spring 2007 12% 2% 13% 33% 39%
Fall 2006 21% 3% 10% 29% 37% 49. How important do you believe getting a college education is to your future success? Would you say it is...
Very
important Somewhat important
Not very important
Not important at
all Spring 2012 87% 10% 2% 1% Spring 2011 85% 9% 4% 2% Spring 2010 97% 3% 0% 0% Spring 2009 93% 7% 0% 0%
Fall 2008 94% 4% 2% 0% Spring 2008 96% 3% 0% 1%
Fall 2007 92% 7% 1% 0% Spring 2007 94% 4% 2% 0%
Fall 2006 91% 8% 1% 0% 50. How important would your parent/guardian say getting a college education is to your future success? Would your parents say it is...
Very
important Somewhat important
Not very important
Not important at
all Spring 2012 92% 6% 2% 0% Spring 2011 88% 11% 0% 1% Spring 2010 93% 6% 0% 1% Spring 2009 94% 6% 0% 0%
Fall 2008 96% 3% 1% 0% Spring 2008 93% 6% 1% 0%
Fall 2007 94% 5% 1% 1% Spring 2007 94% 4% 1% 1%
Fall 2006 91% 8% 1% 0%

School District of Lancaster, 2011-2012 Student Survey May 21-25, 2012 Marginal Frequency Report – WHARTON ELEMENTARY N=105
Center for Opinion Research 17 Franklin & Marshall College
51. How important would your teachers say getting a college education is to your future success? Would your teachers say it is...
Very
important Somewhat important
Not very important
Not important at
all Spring 2012 88% 9% 2% 1% Spring 2011 93% 6% 0% 1% Spring 2010 94% 2% 2% 1% Spring 2009 97% 3% 0% 0%
Fall 2008 99% 1% 0% 0% Spring 2008 97% 3% 0% 0%
Fall 2007 96% 4% 0% 0% Spring 2007 95% 5% 0% 0%
Fall 2006 96% 3% 1% 0% Perceptions of Police Do you agree or disagree with the following statements about police officers? 52. I respect police officers.
Really Agree
Kind of Agree
Kind of Disagree
Really Disagree
Spring 2012 86% 9% 1% 4% Spring 2011 90% 4% 5% 1% Spring 2010 90% 8% 1% 1% Spring 2009 88% 10% 1% 1%
Fall 2008 91% 8% 1% 0% Spring 2008 87% 8% 1% 3%
Fall 2007 88% 7% 2% 2% Spring 2007 84% 9% 4% 3%
Fall 2006 89% 7% 2% 2% 53. I am comfortable approaching police officers.
Really Agree
Kind of Agree
Kind of Disagree
Really Disagree
Spring 2012 60% 24% 7% 9% Spring 2011 68% 22% 5% 5% Spring 2010 69% 18% 7% 7% Spring 2009 53% 31% 6% 10%
Fall 2008 61% 30% 7% 2% Spring 2008 49% 28% 12% 10%
Fall 2007 52% 27% 9% 11% Spring 2007 49% 30% 10% 11%
Fall 2006 61% 24% 4% 11%

School District of Lancaster, 2011-2012 Student Survey May 21-25, 2012 Marginal Frequency Report – WHARTON ELEMENTARY N=105
Center for Opinion Research 18 Franklin & Marshall College
54. I would consider police work as a career.
Really Agree
Kind of Agree
Kind of Disagree
Really Disagree
Spring 2012 32% 20% 24% 24% Spring 2011 48% 18% 18% 15% Spring 2010 33% 21% 21% 25% Spring 2009 39% 16% 20% 24%
Fall 2008 40% 22% 20% 19% Spring 2008 39% 24% 14% 23%
Fall 2007 37% 20% 20% 23% Spring 2007 33% 23% 22% 23%
Fall 2006 41% 25% 15% 19% 55. In general, I do not trust the police.
Really Agree
Kind of Agree
Kind of Disagree
Really Disagree
Spring 2012 12% 7% 11% 70% Spring 2011 4% 10% 2% 84% Spring 2010 9% 11% 9% 71% Spring 2009 8% 4% 13% 75%
Fall 2008 4% 7% 9% 80% Spring 2008 8% 3% 18% 71%
Fall 2007 8% 4% 12% 76% Spring 2007 6% 9% 12% 73%
Fall 2006 12% 8% 8% 72% 56. Police do not belong in schools unless there has been a crime.
Really Agree
Kind of Agree
Kind of Disagree
Really Disagree
Spring 2012 15% 11% 19% 54% Spring 2011 13% 7% 11% 68% Spring 2010 10% 8% 11% 71% Spring 2009 16% 8% 16% 60%
Fall 2008 15% 12% 11% 62% Spring 2008 11% 13% 23% 53%
Fall 2007 23% 12% 18% 48% Spring 2007 18% 16% 19% 47%
Fall 2006 31% 8% 21% 39%

Report O
Marginal Frequency Report Wickersham Elementary School

School District of Lancaster, 2011-2012 Student Survey May 21-25, 2012 Marginal Frequency Report – WICKERSHAM ELEMENTARY N=189
Center for Opinion Research 1 Franklin & Marshall College
School Climate Do you agree or disagree with the following statements? 1. I feel safe at this school.
Really Agree
Kind of Agree
Kind of Disagree
Really Disagree
Spring 2012 64% 28% 6% 3% Spring 2011 58% 34% 6% 2% Spring 2010 50% 34% 10% 7% Spring 2009 53% 35% 9% 2%
Fall 2008 67% 24% 6% 4% Spring 2008 54% 31% 10% 6%
Fall 2007 62% 29% 5% 4% Spring 2007 48% 39% 7% 6%
Fall 2006 52% 34% 8% 6% 2. I feel safe going to and from school.
Really Agree
Kind of Agree
Kind of Disagree
Really Disagree
Spring 2012 62% 27% 7% 4% Spring 2011 58% 28% 10% 4% Spring 2010 50% 27% 12% 11% Spring 2009 61% 31% 6% 1%
Fall 2008 63% 26% 5% 6% Spring 2008 57% 27% 9% 8%
Fall 2007 57% 26% 7% 10% Spring 2007 50% 35% 7% 8%
Fall 2006 50% 34% 10% 6% 3. Students get along well with each other.
Really Agree
Kind of Agree
Kind of Disagree
Really Disagree
Spring 2012 13% 48% 30% 10% Spring 2011 10% 40% 28% 22% Spring 2010 7% 34% 37% 22% Spring 2009 9% 33% 38% 20%
Fall 2008 20% 39% 28% 13% Spring 2008 12% 40% 28% 20%
Fall 2007 15% 45% 22% 19% Spring 2007 6% 36% 32% 26%
Fall 2006 13% 32% 34% 20%

School District of Lancaster, 2011-2012 Student Survey May 21-25, 2012 Marginal Frequency Report – WICKERSHAM ELEMENTARY N=189
Center for Opinion Research 2 Franklin & Marshall College
4. Students get along well with teachers.
Really Agree
Kind of Agree
Kind of Disagree
Really Disagree
Spring 2012 40% 43% 13% 4% Spring 2011 30% 45% 18% 8% Spring 2010 25% 40% 24% 11% Spring 2009 21% 42% 29% 8%
Fall 2008 37% 40% 18% 6% Spring 2008 23% 38% 27% 12%
Fall 2007 35% 43% 15% 6% Spring 2007 18% 42% 27% 14%
Fall 2006 22% 40% 20% 18% 5. I like my school.
Really Agree
Kind of Agree
Kind of Disagree
Really Disagree
Spring 2012 59% 25% 8% 8% Spring 2011 53% 29% 10% 7% Spring 2010 44% 30% 13% 12% Spring 2009 56% 24% 13% 8%
Fall 2008 61% 28% 4% 7% Spring 2008 54% 24% 10% 12%
Fall 2007 60% 28% 8% 4% Spring 2007 41% 32% 12% 16%
Fall 2006 61% 21% 9% 9% 6. I like my teachers.
Really Agree
Kind of Agree
Kind of Disagree
Really Disagree
Spring 2012 78% 13% 5% 3% Spring 2011 68% 23% 6% 3% Spring 2010 57% 32% 7% 4% Spring 2009 61% 29% 6% 4%
Fall 2008 75% 14% 7% 4% Spring 2008 63% 21% 11% 6%
Fall 2007 76% 15% 6% 2% Spring 2007 54% 30% 10% 6%
Fall 2006 63% 22% 7% 8%

School District of Lancaster, 2011-2012 Student Survey May 21-25, 2012 Marginal Frequency Report – WICKERSHAM ELEMENTARY N=189
Center for Opinion Research 3 Franklin & Marshall College
7. There is a teacher or some other adult at this school who really cares about me.
Really Agree
Kind of Agree
Kind of Disagree
Really Disagree
Spring 2012 84% 11% 2% 3% Spring 2011 78% 14% 4% 5% Spring 2010 79% 14% 4% 4% Spring 2009 79% 15% 4% 2%
Fall 2008 76% 16% 4% 4% Spring 2008 73% 16% 6% 4%
Fall 2007 72% 15% 8% 6% Spring 2007 61% 23% 9% 8%
Fall 2006 68% 19% 5% 8% 8. There is a teacher or some other adult at this school who cares when I am not here.
Really Agree
Kind of Agree
Kind of Disagree
Really Disagree
Spring 2012 57% 25% 6% 12% Spring 2011 59% 20% 7% 14% Spring 2010 54% 25% 8% 14% Spring 2009 59% 25% 6% 10%
Fall 2008 62% 18% 8% 12% Spring 2008 52% 20% 9% 19%
Fall 2007 54% 22% 8% 16% Spring 2007 37% 29% 15% 19%
Fall 2006 45% 26% 12% 17% 9. There is a teacher or some other adult at this school who listens to me when I have something to say.
Really Agree
Kind of Agree
Kind of Disagree
Really Disagree
Spring 2012 69% 27% 3% 1% Spring 2011 69% 28% 2% 2% Spring 2010 71% 20% 4% 5% Spring 2009 66% 23% 7% 4%
Fall 2008 69% 22% 4% 5% Spring 2008 60% 28% 6% 6%
Fall 2007 74% 17% 5% 4% Spring 2007 59% 24% 9% 8%
Fall 2006 69% 18% 7% 6%

School District of Lancaster, 2011-2012 Student Survey May 21-25, 2012 Marginal Frequency Report – WICKERSHAM ELEMENTARY N=189
Center for Opinion Research 4 Franklin & Marshall College
10. There is a teacher or some other adult at this school who tells me when I do a good job.
Really Agree
Kind of Agree
Kind of Disagree
Really Disagree
Spring 2012 79% 18% 3% 0% Spring 2011 78% 18% 4% 0% Spring 2010 75% 18% 5% 3% Spring 2009 82% 15% 2% 1%
Fall 2008 82% 12% 4% 3% Spring 2008 78% 18% 2% 2%
Fall 2007 85% 10% 2% 2% Spring 2007 62% 26% 6% 5%
Fall 2006 76% 16% 4% 4% 11. There is a teacher or some other adult at this school who always wants me to do my best.
Really Agree
Kind of Agree
Kind of Disagree
Really Disagree
Spring 2012 93% 5% 2% 0% Spring 2011 93% 6% 0% 0% Spring 2010 87% 9% 1% 2% Spring 2009 92% 7% 0% 0%
Fall 2008 90% 7% 2% 2% Spring 2008 90% 8% 1% 1%
Fall 2007 92% 5% 2% 2% Spring 2007 79% 17% 0% 3%
Fall 2006 84% 10% 3% 4% 12. There is a teacher or some other adult at this school who believes that I will be a success.
Really Agree
Kind of Agree
Kind of Disagree
Really Disagree
Spring 2012 87% 10% 3% 1% Spring 2011 81% 15% 3% 2% Spring 2010 83% 12% 2% 4% Spring 2009 76% 21% 1% 2%
Fall 2008 75% 17% 4% 5% Spring 2008 80% 12% 6% 2%
Fall 2007 82% 15% 2% 0% Spring 2007 65% 28% 2% 6%
Fall 2006 68% 22% 5% 6%

School District of Lancaster, 2011-2012 Student Survey May 21-25, 2012 Marginal Frequency Report – WICKERSHAM ELEMENTARY N=189
Center for Opinion Research 5 Franklin & Marshall College
13. Students in this school really listen to teachers.
Really Agree
Kind of Agree
Kind of Disagree
Really Disagree
Spring 2012 12% 47% 32% 9% Spring 2011 11% 37% 38% 14% Spring 2010 13% 34% 30% 24% Spring 2009 9% 36% 39% 16%
Fall 2008 15% 39% 24% 22% Spring 2008 15% 36% 28% 21%
Fall 2007 16% 39% 23% 22% Spring 2007 8% 32% 39% 21%
Fall 2006 16% 38% 27% 18% 14. Most teachers make learning interesting.
Really Agree
Kind of Agree
Kind of Disagree
Really Disagree
Spring 2012 58% 32% 8% 2% Spring 2011 48% 35% 11% 6% Spring 2010 50% 29% 16% 4% Spring 2009 49% 38% 9% 4%
Fall 2008 65% 26% 4% 5% Spring 2008 51% 34% 7% 8%
Fall 2007 66% 24% 4% 6% Spring 2007 47% 32% 11% 10%
Fall 2006 54% 33% 8% 5% 15. This school is always getting better.
Really Agree
Kind of Agree
Kind of Disagree
Really Disagree
Spring 2012 43% 31% 15% 11% Spring 2011 31% 33% 21% 16% Spring 2010 32% 31% 18% 18% Spring 2009 36% 30% 22% 12%
Fall 2008 44% 26% 18% 12% Spring 2008 41% 32% 14% 12%
Fall 2007 42% 30% 16% 11% Spring 2007 38% 29% 16% 17%
Fall 2006 45% 29% 14% 12%
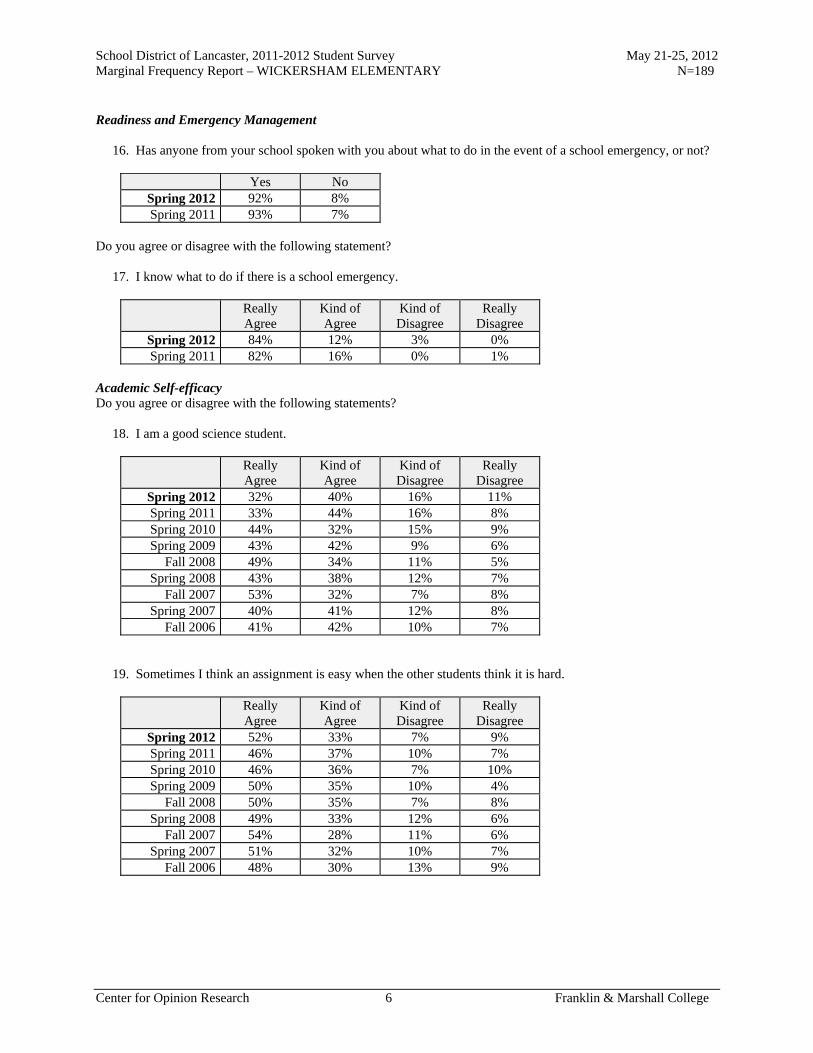
School District of Lancaster, 2011-2012 Student Survey May 21-25, 2012 Marginal Frequency Report – WICKERSHAM ELEMENTARY N=189
Center for Opinion Research 6 Franklin & Marshall College
Readiness and Emergency Management 16. Has anyone from your school spoken with you about what to do in the event of a school emergency, or not?
Yes No Spring 2012 92% 8% Spring 2011 93% 7%
Do you agree or disagree with the following statement? 17. I know what to do if there is a school emergency.
Really Agree
Kind of Agree
Kind of Disagree
Really Disagree
Spring 2012 84% 12% 3% 0% Spring 2011 82% 16% 0% 1%
Academic Self-efficacy Do you agree or disagree with the following statements? 18. I am a good science student.
Really Agree
Kind of Agree
Kind of Disagree
Really Disagree
Spring 2012 32% 40% 16% 11% Spring 2011 33% 44% 16% 8% Spring 2010 44% 32% 15% 9% Spring 2009 43% 42% 9% 6%
Fall 2008 49% 34% 11% 5% Spring 2008 43% 38% 12% 7%
Fall 2007 53% 32% 7% 8% Spring 2007 40% 41% 12% 8%
Fall 2006 41% 42% 10% 7% 19. Sometimes I think an assignment is easy when the other students think it is hard.
Really Agree
Kind of Agree
Kind of Disagree
Really Disagree
Spring 2012 52% 33% 7% 9% Spring 2011 46% 37% 10% 7% Spring 2010 46% 36% 7% 10% Spring 2009 50% 35% 10% 4%
Fall 2008 50% 35% 7% 8% Spring 2008 49% 33% 12% 6%
Fall 2007 54% 28% 11% 6% Spring 2007 51% 32% 10% 7%
Fall 2006 48% 30% 13% 9%

School District of Lancaster, 2011-2012 Student Survey May 21-25, 2012 Marginal Frequency Report – WICKERSHAM ELEMENTARY N=189
Center for Opinion Research 7 Franklin & Marshall College
20. I am good social studies student.
Really Agree
Kind of Agree
Kind of Disagree
Really Disagree
Spring 2012 35% 36% 18% 11% Spring 2011 39% 41% 14% 5% Spring 2010 42% 37% 14% 7% Spring 2009 42% 38% 10% 10%
Fall 2008 43% 38% 12% 8% Spring 2008 40% 40% 13% 7%
Fall 2007 43% 28% 13% 16% Spring 2007 39% 39% 16% 6%
Fall 2006 42% 31% 14% 13% 21. My teacher thinks I am smart.
Really Agree
Kind of Agree
Kind of Disagree
Really Disagree
Spring 2012 81% 14% 4% 1% Spring 2011 80% 15% 2% 3% Spring 2010 75% 17% 4% 5% Spring 2009 78% 16% 2% 4%
Fall 2008 76% 19% 2% 3% Spring 2008 73% 19% 6% 2%
Fall 2007 72% 22% 3% 4% Spring 2007 57% 31% 6% 5%
Fall 2006 57% 26% 7% 10% 22. I am a good math student.
Really Agree
Kind of Agree
Kind of Disagree
Really Disagree
Spring 2012 65% 23% 9% 3% Spring 2011 68% 23% 6% 3% Spring 2010 67% 23% 4% 5% Spring 2009 67% 21% 7% 5%
Fall 2008 60% 28% 6% 6% Spring 2008 66% 21% 8% 5%
Fall 2007 54% 28% 11% 6% Spring 2007 53% 27% 13% 7%
Fall 2006 52% 29% 9% 10%

School District of Lancaster, 2011-2012 Student Survey May 21-25, 2012 Marginal Frequency Report – WICKERSHAM ELEMENTARY N=189
Center for Opinion Research 8 Franklin & Marshall College
23. My classmates usually get better grades than I do.
Really Agree
Kind of Agree
Kind of Disagree
Really Disagree
Spring 2012 24% 30% 26% 20% Spring 2011 19% 23% 34% 24% Spring 2010 15% 34% 28% 22% Spring 2009 15% 30% 31% 23%
Fall 2008 17% 28% 28% 28% Spring 2008 16% 29% 28% 27%
Fall 2007 22% 29% 26% 22% Spring 2007 16% 32% 27% 25%
Fall 2006 25% 31% 23% 21% 24. I usually understand my homework assignments.
Really Agree
Kind of Agree
Kind of Disagree
Really Disagree
Spring 2012 54% 33% 10% 3% Spring 2011 50% 34% 13% 4% Spring 2010 51% 35% 11% 3% Spring 2009 49% 35% 13% 3%
Fall 2008 60% 31% 6% 3% Spring 2008 52% 33% 9% 5%
Fall 2007 58% 26% 7% 9% Spring 2007 41% 35% 15% 9%
Fall 2006 51% 33% 8% 8% 25. I could get the best grades in class if I tried hard enough.
Really Agree
Kind of Agree
Kind of Disagree
Really Disagree
Spring 2012 77% 16% 4% 3% Spring 2011 87% 9% 3% 1% Spring 2010 82% 12% 3% 3% Spring 2009 71% 22% 3% 3%
Fall 2008 79% 13% 5% 3% Spring 2008 79% 14% 4% 4%
Fall 2007 83% 12% 2% 2% Spring 2007 74% 16% 5% 5%
Fall 2006 74% 19% 5% 2%

School District of Lancaster, 2011-2012 Student Survey May 21-25, 2012 Marginal Frequency Report – WICKERSHAM ELEMENTARY N=189
Center for Opinion Research 9 Franklin & Marshall College
26. I am a good reading student.
Really Agree
Kind of Agree
Kind of Disagree
Really Disagree
Spring 2012 49% 32% 12% 7% Spring 2011 48% 33% 8% 10% Spring 2010 46% 32% 10% 11% Spring 2009 50% 33% 11% 5%
Fall 2008 56% 26% 7% 11% Spring 2008 49% 36% 7% 8%
Fall 2007 59% 23% 8% 10% Spring 2007 52% 31% 9% 8%
Fall 2006 52% 33% 8% 7% 27. It is not hard for me to get good grades in school.
Really Agree
Kind of Agree
Kind of Disagree
Really Disagree
Spring 2012 50% 35% 8% 8% Spring 2011 47% 29% 15% 9% Spring 2010 43% 37% 12% 8% Spring 2009 41% 36% 11% 12%
Fall 2008 45% 30% 14% 12% Spring 2008 41% 37% 15% 7%
Fall 2007 50% 32% 10% 8% Spring 2007 39% 35% 15% 11%
Fall 2006 42% 35% 14% 9% 28. I am smart.
Really Agree
Kind of Agree
Kind of Disagree
Really Disagree
Spring 2012 74% 20% 4% 2% Spring 2011 73% 19% 4% 4% Spring 2010 73% 18% 4% 5% Spring 2009 73% 21% 4% 3%
Fall 2008 64% 24% 6% 5% Spring 2008 72% 18% 7% 3%
Fall 2007 63% 25% 6% 6% Spring 2007 58% 30% 7% 5%
Fall 2006 61% 25% 9% 5%

School District of Lancaster, 2011-2012 Student Survey May 21-25, 2012 Marginal Frequency Report – WICKERSHAM ELEMENTARY N=189
Center for Opinion Research 10 Franklin & Marshall College
29. When the teacher asks a question I usually know the answer even if the other students don't.
Really Agree
Kind of Agree
Kind of Disagree
Really Disagree
Spring 2012 33% 49% 13% 5% Spring 2011 35% 43% 19% 4% Spring 2010 32% 48% 13% 7% Spring 2009 31% 52% 13% 4%
Fall 2008 41% 36% 18% 5% Spring 2008 36% 46% 12% 6%
Fall 2007 34% 48% 12% 6% Spring 2007 39% 37% 22% 3%
Fall 2006 40% 40% 14% 7% 30. I work hard in school.
Really Agree
Kind of Agree
Kind of Disagree
Really Disagree
Spring 2012 69% 25% 5% 0% Spring 2011 69% 25% 5% 0% Spring 2010 73% 22% 3% 3% Spring 2009 79% 16% 4% 1%
Fall 2008 79% 15% 2% 3% Spring 2008 67% 24% 5% 4%
Fall 2007 76% 20% 3% 2% Spring 2007 64% 27% 5% 3%
Fall 2006 75% 18% 4% 3% 31. Most of my classmates work harder on their homework than I do.
Really Agree
Kind of Agree
Kind of Disagree
Really Disagree
Spring 2012 19% 26% 28% 27% Spring 2011 18% 24% 29% 28% Spring 2010 16% 28% 30% 25% Spring 2009 11% 28% 32% 29%
Fall 2008 18% 22% 28% 31% Spring 2008 17% 30% 22% 31%
Fall 2007 20% 25% 25% 30% Spring 2007 17% 29% 31% 23%
Fall 2006 28% 28% 21% 22%
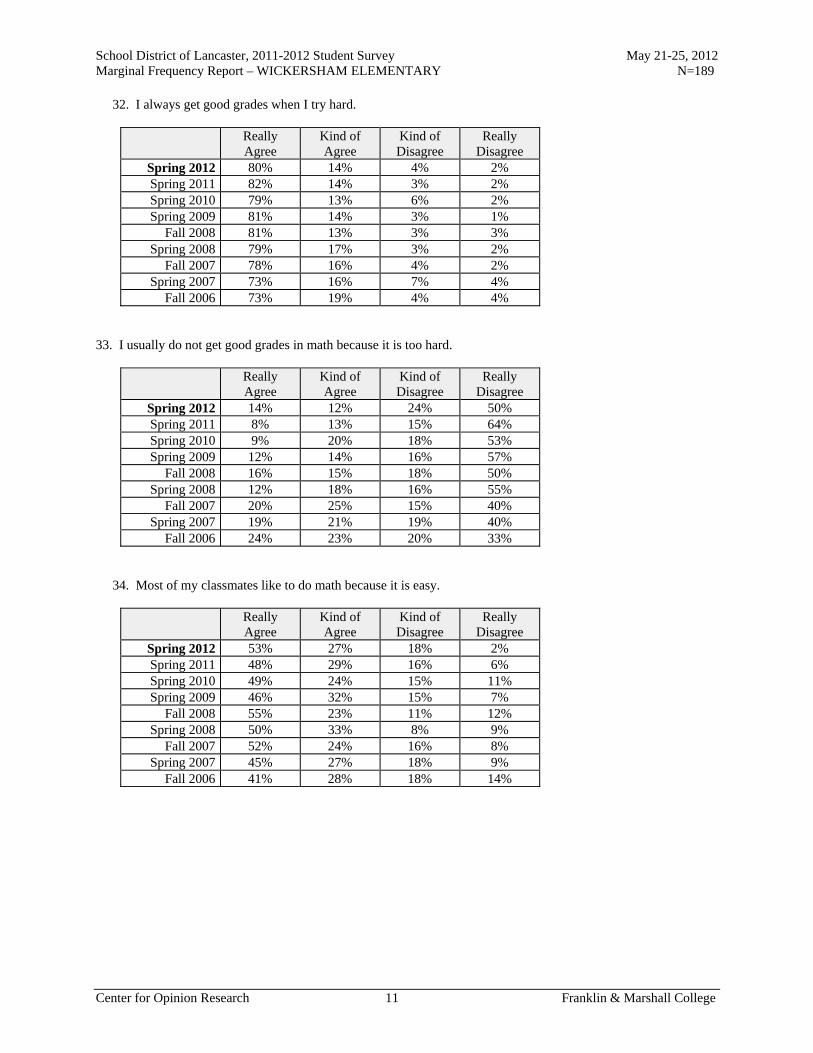
School District of Lancaster, 2011-2012 Student Survey May 21-25, 2012 Marginal Frequency Report – WICKERSHAM ELEMENTARY N=189
Center for Opinion Research 11 Franklin & Marshall College
32. I always get good grades when I try hard.
Really Agree
Kind of Agree
Kind of Disagree
Really Disagree
Spring 2012 80% 14% 4% 2% Spring 2011 82% 14% 3% 2% Spring 2010 79% 13% 6% 2% Spring 2009 81% 14% 3% 1%
Fall 2008 81% 13% 3% 3% Spring 2008 79% 17% 3% 2%
Fall 2007 78% 16% 4% 2% Spring 2007 73% 16% 7% 4%
Fall 2006 73% 19% 4% 4% 33. I usually do not get good grades in math because it is too hard.
Really Agree
Kind of Agree
Kind of Disagree
Really Disagree
Spring 2012 14% 12% 24% 50% Spring 2011 8% 13% 15% 64% Spring 2010 9% 20% 18% 53% Spring 2009 12% 14% 16% 57%
Fall 2008 16% 15% 18% 50% Spring 2008 12% 18% 16% 55%
Fall 2007 20% 25% 15% 40% Spring 2007 19% 21% 19% 40%
Fall 2006 24% 23% 20% 33% 34. Most of my classmates like to do math because it is easy.
Really Agree
Kind of Agree
Kind of Disagree
Really Disagree
Spring 2012 53% 27% 18% 2% Spring 2011 48% 29% 16% 6% Spring 2010 49% 24% 15% 11% Spring 2009 46% 32% 15% 7%
Fall 2008 55% 23% 11% 12% Spring 2008 50% 33% 8% 9%
Fall 2007 52% 24% 16% 8% Spring 2007 45% 27% 18% 9%
Fall 2006 41% 28% 18% 14%

School District of Lancaster, 2011-2012 Student Survey May 21-25, 2012 Marginal Frequency Report – WICKERSHAM ELEMENTARY N=189
Center for Opinion Research 12 Franklin & Marshall College
35. I would get better grades if my teacher liked me more.
Really Agree
Kind of Agree
Kind of Disagree
Really Disagree
Spring 2012 13% 9% 12% 66% Spring 2011 11% 10% 15% 64% Spring 2010 10% 9% 16% 66% Spring 2009 10% 8% 19% 63%
Fall 2008 18% 7% 12% 63% Spring 2008 16% 8% 14% 62%
Fall 2007 24% 7% 10% 59% Spring 2007 20% 16% 18% 47%
Fall 2006 24% 13% 13% 50% 36. I will graduate from high school.
Really Agree
Kind of Agree
Kind of Disagree
Really Disagree
Spring 2012 90% 7% 2% 1% Spring 2011 95% 5% 0% 0% Spring 2010 89% 7% 2% 2% Spring 2009 87% 10% 1% 1%
Fall 2008 89% 8% 2% 1% Spring 2008 84% 12% 2% 2%
Fall 2007 86% 11% 2% 2% Spring 2007 83% 12% 0% 4%
Fall 2006 79% 13% 3% 4% 37. I go to a good school.
Really Agree
Kind of Agree
Kind of Disagree
Really Disagree
Spring 2012 70% 22% 5% 3% Spring 2011 65% 24% 7% 4% Spring 2010 51% 28% 12% 10% Spring 2009 59% 27% 7% 7%
Fall 2008 67% 22% 6% 4% Spring 2008 65% 22% 8% 5%
Fall 2007 67% 22% 6% 6% Spring 2007 59% 27% 8% 6%
Fall 2006 64% 19% 9% 9%

School District of Lancaster, 2011-2012 Student Survey May 21-25, 2012 Marginal Frequency Report – WICKERSHAM ELEMENTARY N=189
Center for Opinion Research 13 Franklin & Marshall College
38. Adults who have good jobs probably were good students when they were young.
Really Agree
Kind of Agree
Kind of Disagree
Really Disagree
Spring 2012 75% 20% 3% 2% Spring 2011 74% 20% 3% 3% Spring 2010 70% 21% 7% 2% Spring 2009 73% 22% 2% 2%
Fall 2008 77% 16% 3% 3% Spring 2008 73% 21% 2% 4%
Fall 2007 75% 16% 4% 5% Spring 2007 71% 19% 7% 3%
Fall 2006 75% 18% 3% 4% 39. When I am old enough, I will go to college.
Really Agree
Kind of Agree
Kind of Disagree
Really Disagree
Spring 2012 83% 10% 3% 4% Spring 2011 84% 10% 3% 3% Spring 2010 84% 9% 4% 4% Spring 2009 87% 8% 3% 1%
Fall 2008 82% 10% 4% 3% Spring 2008 81% 14% 2% 3%
Fall 2007 83% 10% 3% 4% Spring 2007 76% 14% 4% 6%
Fall 2006 77% 13% 4% 6% 40. No one cares if I do well in school.
Really Agree
Kind of Agree
Kind of Disagree
Really Disagree
Spring 2012 7% 9% 8% 76% Spring 2011 7% 5% 11% 77% Spring 2010 8% 6% 10% 76% Spring 2009 5% 5% 11% 78%
Fall 2008 10% 11% 8% 71% Spring 2008 6% 8% 10% 76%
Fall 2007 12% 8% 10% 70% Spring 2007 12% 9% 16% 63%
Fall 2006 15% 11% 13% 61%

School District of Lancaster, 2011-2012 Student Survey May 21-25, 2012 Marginal Frequency Report – WICKERSHAM ELEMENTARY N=189
Center for Opinion Research 14 Franklin & Marshall College
41. What I learn in school is not important.
Really Agree
Kind of Agree
Kind of Disagree
Really Disagree
Spring 2012 5% 5% 4% 86% Spring 2011 6% 3% 5% 86% Spring 2010 6% 6% 7% 81% Spring 2009 5% 4% 6% 84%
Fall 2008 11% 4% 5% 81% Spring 2008 7% 3% 5% 85%
Fall 2007 10% 4% 4% 83% Spring 2007 11% 9% 9% 71%
Fall 2006 13% 5% 4% 78% 42. It does not matter if I do well in school.
Really Agree
Kind of Agree
Kind of Disagree
Really Disagree
Spring 2012 8% 8% 7% 78% Spring 2011 4% 3% 7% 86% Spring 2010 8% 4% 8% 81% Spring 2009 8% 1% 8% 84%
Fall 2008 10% 3% 5% 82% Spring 2008 9% 3% 7% 81%
Fall 2007 11% 3% 8% 79% Spring 2007 14% 8% 10% 69%
Fall 2006 17% 7% 6% 69% 43. Students who get better grades than I do get more help from the teacher than I do.
Really Agree
Kind of Agree
Kind of Disagree
Really Disagree
Spring 2012 19% 10% 19% 52% Spring 2011 11% 12% 18% 59% Spring 2010 12% 13% 23% 52% Spring 2009 14% 10% 25% 51%
Fall 2008 18% 7% 16% 60% Spring 2008 11% 10% 22% 57%
Fall 2007 17% 12% 17% 54% Spring 2007 19% 14% 23% 43%
Fall 2006 24% 13% 15% 48%
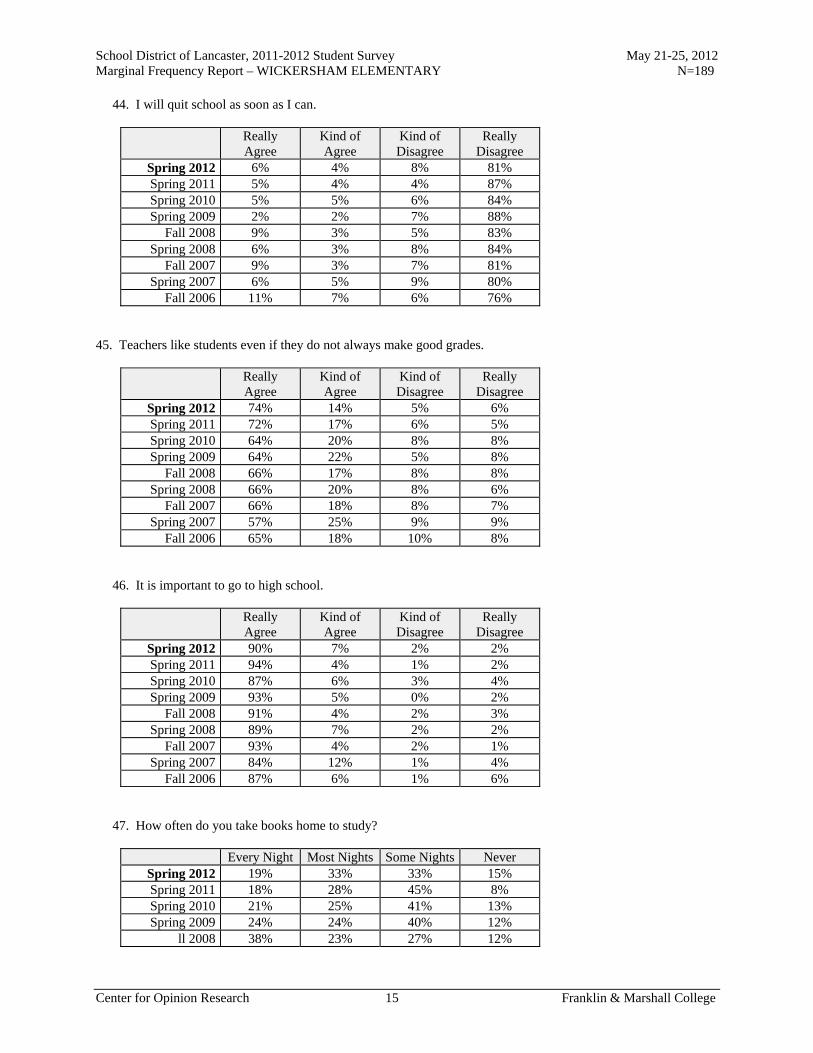
School District of Lancaster, 2011-2012 Student Survey May 21-25, 2012 Marginal Frequency Report – WICKERSHAM ELEMENTARY N=189
Center for Opinion Research 15 Franklin & Marshall College
44. I will quit school as soon as I can.
Really Agree
Kind of Agree
Kind of Disagree
Really Disagree
Spring 2012 6% 4% 8% 81% Spring 2011 5% 4% 4% 87% Spring 2010 5% 5% 6% 84% Spring 2009 2% 2% 7% 88%
Fall 2008 9% 3% 5% 83% Spring 2008 6% 3% 8% 84%
Fall 2007 9% 3% 7% 81% Spring 2007 6% 5% 9% 80%
Fall 2006 11% 7% 6% 76% 45. Teachers like students even if they do not always make good grades.
Really Agree
Kind of Agree
Kind of Disagree
Really Disagree
Spring 2012 74% 14% 5% 6% Spring 2011 72% 17% 6% 5% Spring 2010 64% 20% 8% 8% Spring 2009 64% 22% 5% 8%
Fall 2008 66% 17% 8% 8% Spring 2008 66% 20% 8% 6%
Fall 2007 66% 18% 8% 7% Spring 2007 57% 25% 9% 9%
Fall 2006 65% 18% 10% 8% 46. It is important to go to high school.
Really Agree
Kind of Agree
Kind of Disagree
Really Disagree
Spring 2012 90% 7% 2% 2% Spring 2011 94% 4% 1% 2% Spring 2010 87% 6% 3% 4% Spring 2009 93% 5% 0% 2%
Fall 2008 91% 4% 2% 3% Spring 2008 89% 7% 2% 2%
Fall 2007 93% 4% 2% 1% Spring 2007 84% 12% 1% 4%
Fall 2006 87% 6% 1% 6% 47. How often do you take books home to study?
Every Night Most Nights Some Nights Never Spring 2012 19% 33% 33% 15% Spring 2011 18% 28% 45% 8% Spring 2010 21% 25% 41% 13% Spring 2009 24% 24% 40% 12%
ll 2008 38% 23% 27% 12%

School District of Lancaster, 2011-2012 Student Survey May 21-25, 2012 Marginal Frequency Report – WICKERSHAM ELEMENTARY N=189
Center for Opinion Research 16 Franklin & Marshall College
Academic Aspirations 48. How far in school do you want to go?
Complete
high school
Attend vocational/technical
school
Attend 2-year college
Attend 4-year college
Attend 4-year college plus go to
grad school Spring 2012 14% 3% 19% 20% 44% Spring 2011 12% 5% 11% 22% 51% Spring 2010 13% 5% 11% 18% 53% Spring 2009 10% 2% 16% 21% 50%
Fall 2008 15% 2% 17% 23% 43% Spring 2008 14% 4% 16% 25% 40%
Fall 2007 22% 6% 8% 18% 46% Spring 2007 19% 5% 13% 23% 40%
Fall 2006 19% 4% 9% 24% 43% 49. How important do you believe getting a college education is to your future success? Would you say it is...
Very
important Somewhat important
Not very important
Not important at
all Spring 2012 94% 4% 0% 2% Spring 2011 94% 5% 0% 0% Spring 2010 92% 6% 2% 0% Spring 2009 96% 3% 0% 0%
Fall 2008 92% 6% 1% 2% Spring 2008 91% 6% 1% 2%
Fall 2007 93% 4% 1% 2% Spring 2007 89% 8% 2% 2%
Fall 2006 89% 6% 3% 2% 50. How important would your parent/guardian say getting a college education is to your future success? Would your parents say it is...
Very
important Somewhat important
Not very important
Not important at
all Spring 2012 93% 5% 2% 0% Spring 2011 94% 5% 0% 0% Spring 2010 92% 6% 1% 0% Spring 2009 93% 6% 0% 0%
Fall 2008 94% 3% 1% 3% Spring 2008 90% 6% 0% 3%
Fall 2007 92% 4% 2% 1% Spring 2007 91% 5% 1% 3%
Fall 2006 91% 6% 2% 1%

School District of Lancaster, 2011-2012 Student Survey May 21-25, 2012 Marginal Frequency Report – WICKERSHAM ELEMENTARY N=189
Center for Opinion Research 17 Franklin & Marshall College
51. How important would your teachers say getting a college education is to your future success? Would your teachers say it is...
Very
important Somewhat important
Not very important
Not important at
all Spring 2012 95% 3% 2% 0% Spring 2011 97% 1% 1% 0% Spring 2010 86% 8% 4% 1% Spring 2009 92% 6% 1% 1%
Fall 2008 92% 5% 2% 1% Spring 2008 93% 4% 2% 2%
Fall 2007 90% 4% 2% 3% Spring 2007 90% 6% 1% 3%
Fall 2006 92% 4% 0% 3% Perceptions of Police Do you agree or disagree with the following statements about police officers? 52. I respect police officers.
Really Agree
Kind of Agree
Kind of Disagree
Really Disagree
Spring 2012 92% 4% 3% 1% Spring 2011 89% 6% 2% 3% Spring 2010 83% 10% 4% 3% Spring 2009 82% 12% 3% 3%
Fall 2008 83% 12% 2% 3% Spring 2008 74% 17% 4% 5%
Fall 2007 82% 7% 4% 7% Spring 2007 76% 14% 4% 6%
Fall 2006 76% 11% 7% 6% 53. I am comfortable approaching police officers.
Really Agree
Kind of Agree
Kind of Disagree
Really Disagree
Spring 2012 62% 25% 6% 7% Spring 2011 51% 28% 9% 11% Spring 2010 47% 29% 12% 12% Spring 2009 53% 28% 7% 11%
Fall 2008 58% 22% 8% 12% Spring 2008 55% 22% 9% 14%
Fall 2007 56% 18% 8% 18% Spring 2007 57% 23% 13% 7%
Fall 2006 52% 26% 6% 16%

School District of Lancaster, 2011-2012 Student Survey May 21-25, 2012 Marginal Frequency Report – WICKERSHAM ELEMENTARY N=189
Center for Opinion Research 18 Franklin & Marshall College
54. I would consider police work as a career.
Really Agree
Kind of Agree
Kind of Disagree
Really Disagree
Spring 2012 35% 19% 18% 29% Spring 2011 34% 15% 18% 33% Spring 2010 33% 19% 16% 32% Spring 2009 35% 22% 14% 29%
Fall 2008 39% 16% 11% 34% Spring 2008 39% 24% 13% 24%
Fall 2007 37% 20% 11% 32% Spring 2007 39% 20% 11% 30%
Fall 2006 38% 14% 14% 33% 55. In general, I do not trust the police.
Really Agree
Kind of Agree
Kind of Disagree
Really Disagree
Spring 2012 12% 6% 5% 77% Spring 2011 16% 9% 15% 60% Spring 2010 14% 9% 18% 58% Spring 2009 9% 13% 18% 60%
Fall 2008 15% 11% 10% 65% Spring 2008 14% 14% 15% 57%
Fall 2007 15% 9% 11% 66% Spring 2007 15% 23% 14% 48%
Fall 2006 20% 11% 17% 52% 56. Police do not belong in schools unless there has been a crime.
Really Agree
Kind of Agree
Kind of Disagree
Really Disagree
Spring 2012 17% 10% 15% 58% Spring 2011 27% 13% 12% 47% Spring 2010 36% 14% 13% 38% Spring 2009 28% 16% 18% 38%
Fall 2008 42% 6% 14% 38% Spring 2008 36% 12% 15% 37%
Fall 2007 38% 14% 10% 38% Spring 2007 36% 18% 19% 27%
Fall 2006 49% 12% 11% 27%
Report P
Marginal Frequency Report Total Middle School Sample

School District of Lancaster, 2011-2012 Student Survey May 21-25, 2012 Marginal Frequency Report – Total Sample Middle School Students N=1899
Center for Opinion Research 1 Franklin & Marshall College
School Climate Do you agree or disagree with the following statements? 1. I feel safe at this school.
Really Agree
Kind of Agree
Kind of Disagree
Really Disagree
Spring 2012 33% 48% 12% 6% Spring 2011 32% 49% 13% 6% Spring 2010 31% 47% 14% 8% Spring 2009 24% 51% 16% 8%
Fall 2008 32% 48% 13% 8% Spring 2008 24% 47% 18% 10%
Fall 2007 33% 47% 13% 8% Spring 2007 27% 49% 16% 8%
Fall 2006 33% 49% 12% 6% 2. I feel safe going to and from school.
Really Agree
Kind of Agree
Kind of Disagree
Really Disagree
Spring 2012 47% 37% 11% 4% Spring 2011 48% 37% 12% 4% Spring 2010 40% 41% 12% 6% Spring 2009 37% 43% 13% 6%
Fall 2008 42% 39% 12% 7% Spring 2008 35% 42% 14% 8%
Fall 2007 45% 36% 12% 6% Spring 2007 36% 42% 16% 6%
Fall 2006 44% 39% 12% 5% 3. Students get along well with each other.
Really Agree
Kind of Agree
Kind of Disagree
Really Disagree
Spring 2012 7% 36% 39% 18% Spring 2011 5% 36% 40% 18% Spring 2010 6% 31% 43% 21% Spring 2009 5% 33% 40% 23%
Fall 2008 7% 40% 37% 16% Spring 2008 5% 32% 41% 23%
Fall 2007 7% 38% 36% 19% Spring 2007 5% 35% 38% 22%
Fall 2006 6% 38% 37% 19%

School District of Lancaster, 2011-2012 Student Survey May 21-25, 2012 Marginal Frequency Report – Total Sample Middle School Students N=1899
Center for Opinion Research 2 Franklin & Marshall College
4. Students get along well with teachers.
Really Agree
Kind of Agree
Kind of Disagree
Really Disagree
Spring 2012 8% 34% 40% 18% Spring 2011 6% 35% 41% 18% Spring 2010 4% 32% 43% 21% Spring 2009 6% 31% 41% 22%
Fall 2008 9% 38% 37% 16% Spring 2008 6% 32% 40% 21%
Fall 2007 10% 42% 33% 15% Spring 2007 8% 38% 37% 17%
Fall 2006 10% 43% 33% 13% 5. I like my school.
Really Agree
Kind of Agree
Kind of Disagree
Really Disagree
Spring 2012 31% 38% 17% 14% Spring 2011 29% 39% 17% 14% Spring 2010 24% 40% 19% 16% Spring 2009 24% 39% 21% 16%
Fall 2008 32% 38% 16% 14% Spring 2008 22% 40% 20% 18%
Fall 2007 33% 39% 16% 12% Spring 2007 27% 39% 19% 15%
Fall 2006 36% 38% 14% 13% 6. I like my teachers.
Really Agree
Kind of Agree
Kind of Disagree
Really Disagree
Spring 2012 33% 39% 19% 9% Spring 2011 30% 46% 16% 8% Spring 2010 26% 44% 21% 10% Spring 2009 23% 46% 22% 10%
Fall 2008 31% 44% 17% 7% Spring 2008 24% 44% 22% 11%
Fall 2007 32% 44% 16% 7% Spring 2007 31% 46% 16% 8%
Fall 2006 38% 43% 13% 6%

School District of Lancaster, 2011-2012 Student Survey May 21-25, 2012 Marginal Frequency Report – Total Sample Middle School Students N=1899
Center for Opinion Research 3 Franklin & Marshall College
7. There is a teacher or some other adult at this school who really cares about me.
Really Agree
Kind of Agree
Kind of Disagree
Really Disagree
Spring 2012 44% 35% 14% 7% Spring 2011 47% 34% 12% 7% Spring 2010 42% 36% 14% 8% Spring 2009 38% 38% 15% 9%
Fall 2008 39% 36% 16% 9% Spring 2008 36% 36% 16% 12%
Fall 2007 38% 36% 15% 10% Spring 2007 42% 35% 14% 9%
Fall 2006 41% 35% 14% 10% 8. There is a teacher or some other adult at this school who cares when I am not here.
Really Agree
Kind of Agree
Kind of Disagree
Really Disagree
Spring 2012 28% 32% 23% 16% Spring 2011 26% 34% 24% 16% Spring 2010 25% 34% 24% 16% Spring 2009 24% 33% 24% 18%
Fall 2008 26% 33% 24% 16% Spring 2008 21% 35% 24% 20%
Fall 2007 24% 34% 24% 18% Spring 2007 22% 35% 25% 18%
Fall 2006 22% 34% 24% 20% 9. There is a teacher or some other adult at this school who listens to me when I have something to say.
Really Agree
Kind of Agree
Kind of Disagree
Really Disagree
Spring 2012 45% 34% 14% 7% Spring 2011 44% 37% 12% 7% Spring 2010 39% 39% 14% 8% Spring 2009 37% 37% 16% 10%
Fall 2008 42% 36% 14% 8% Spring 2008 34% 38% 18% 10%
Fall 2007 41% 35% 16% 8% Spring 2007 42% 35% 15% 7%
Fall 2006 46% 34% 14% 7%

School District of Lancaster, 2011-2012 Student Survey May 21-25, 2012 Marginal Frequency Report – Total Sample Middle School Students N=1899
Center for Opinion Research 4 Franklin & Marshall College
10. There is a teacher or some other adult at this school who tells me when I do a good job.
Really Agree
Kind of Agree
Kind of Disagree
Really Disagree
Spring 2012 53% 33% 9% 5% Spring 2011 54% 34% 8% 4% Spring 2010 49% 35% 9% 6% Spring 2009 45% 38% 11% 7%
Fall 2008 51% 33% 10% 6% Spring 2008 38% 40% 14% 8%
Fall 2007 47% 36% 11% 7% Spring 2007 47% 38% 11% 5%
Fall 2006 53% 34% 9% 4% 11. There is a teacher or some other adult at this school who always wants me to do my best.
Really Agree
Kind of Agree
Kind of Disagree
Really Disagree
Spring 2012 62% 28% 6% 4% Spring 2011 63% 28% 6% 3% Spring 2010 59% 30% 7% 4% Spring 2009 55% 32% 8% 6%
Fall 2008 60% 29% 7% 4% Spring 2008 53% 33% 8% 6%
Fall 2007 61% 28% 7% 4% Spring 2007 64% 28% 5% 3%
Fall 2006 70% 24% 5% 2% 12. There is a teacher or some other adult at this school who believes that I will be a success.
Really Agree
Kind of Agree
Kind of Disagree
Really Disagree
Spring 2012 51% 36% 9% 5% Spring 2011 52% 35% 8% 5% Spring 2010 48% 36% 11% 5% Spring 2009 45% 37% 11% 7%
Fall 2008 50% 34% 11% 5% Spring 2008 44% 37% 12% 8%
Fall 2007 52% 33% 9% 6% Spring 2007 53% 33% 9% 5%
Fall 2006 53% 32% 11% 4%

School District of Lancaster, 2011-2012 Student Survey May 21-25, 2012 Marginal Frequency Report – Total Sample Middle School Students N=1899
Center for Opinion Research 5 Franklin & Marshall College
13. Students in this school really listen to teachers.
Really Agree
Kind of Agree
Kind of Disagree
Really Disagree
Spring 2012 5% 24% 44% 27% Spring 2011 5% 23% 44% 28% Spring 2010 4% 22% 46% 28% Spring 2009 3% 25% 44% 28%
Fall 2008 4% 29% 44% 22% Spring 2008 4% 21% 45% 30%
Fall 2007 5% 30% 41% 24% Spring 2007 2% 27% 43% 28%
Fall 2006 4% 28% 42% 26% 14. Most teachers make learning interesting.
Really Agree
Kind of Agree
Kind of Disagree
Really Disagree
Spring 2012 21% 39% 27% 13% Spring 2011 20% 41% 27% 12% Spring 2010 17% 45% 26% 13% Spring 2009 14% 44% 28% 14%
Fall 2008 21% 44% 23% 12% Spring 2008 15% 40% 29% 16%
Fall 2007 23% 43% 22% 12% Spring 2007 17% 46% 26% 11%
Fall 2006 26% 46% 20% 8% 15. This school is always getting better.
Really Agree
Kind of Agree
Kind of Disagree
Really Disagree
Spring 2012 14% 34% 29% 22% Spring 2011 10% 31% 33% 26% Spring 2010 10% 30% 35% 26% Spring 2009 8% 27% 37% 27%
Fall 2008 14% 32% 31% 23% Spring 2008 9% 25% 36% 30%
Fall 2007 15% 33% 31% 22% Spring 2007 9% 30% 34% 26%
Fall 2006 14% 39% 28% 19%
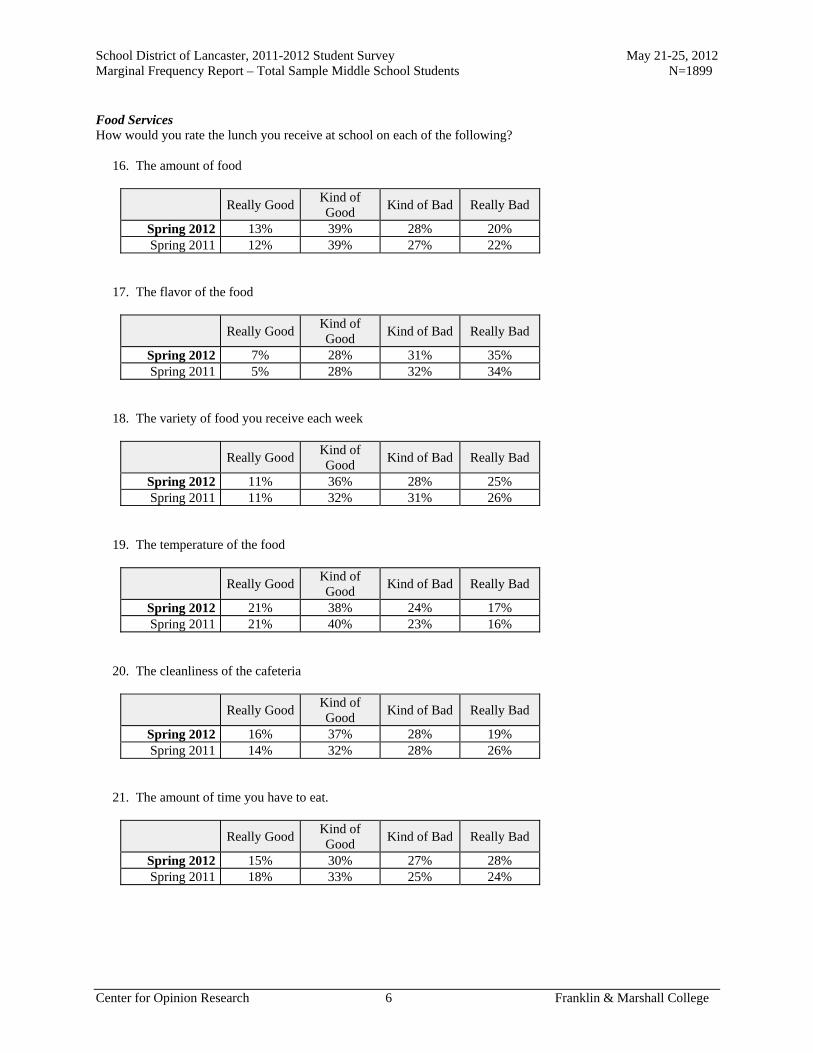
School District of Lancaster, 2011-2012 Student Survey May 21-25, 2012 Marginal Frequency Report – Total Sample Middle School Students N=1899
Center for Opinion Research 6 Franklin & Marshall College
Food Services How would you rate the lunch you receive at school on each of the following? 16. The amount of food
Really Good Kind of Good
Kind of Bad Really Bad
Spring 2012 13% 39% 28% 20% Spring 2011 12% 39% 27% 22%
17. The flavor of the food
Really Good Kind of Good
Kind of Bad Really Bad
Spring 2012 7% 28% 31% 35% Spring 2011 5% 28% 32% 34%
18. The variety of food you receive each week
Really Good Kind of Good
Kind of Bad Really Bad
Spring 2012 11% 36% 28% 25% Spring 2011 11% 32% 31% 26%
19. The temperature of the food
Really Good Kind of Good
Kind of Bad Really Bad
Spring 2012 21% 38% 24% 17% Spring 2011 21% 40% 23% 16%
20. The cleanliness of the cafeteria
Really Good Kind of Good
Kind of Bad Really Bad
Spring 2012 16% 37% 28% 19% Spring 2011 14% 32% 28% 26%
21. The amount of time you have to eat.
Really Good Kind of Good
Kind of Bad Really Bad
Spring 2012 15% 30% 27% 28% Spring 2011 18% 33% 25% 24%

School District of Lancaster, 2011-2012 Student Survey May 21-25, 2012 Marginal Frequency Report – Total Sample Middle School Students N=1899
Center for Opinion Research 7 Franklin & Marshall College
Readiness and Emergency Management 22. Has anyone from your school spoken with you about what to do in the event of a school emergency, or not?
Yes No Spring 2012 83% 17% Spring 2011 82% 18%
Do you agree or disagree with the following statement? 23. I know what to do if there is a school emergency.
Really Agree
Kind of Agree
Kind of Disagree
Really Disagree
Spring 2012 60% 33% 4% 3% Spring 2011 57% 35% 5% 3%
Peer Academic Climate Do you agree or disagree with the following statements? 24. Most of my friends want to do well at school.
Really Agree
Kind of Agree
Kind of Disagree
Really Disagree
Spring 2012 32% 50% 14% 4% Spring 2011 33% 49% 14% 4% Spring 2010 28% 48% 18% 6% Spring 2009 31% 48% 16% 6%
Fall 2008 37% 42% 15% 6% Spring 2008 36% 45% 14% 5%
Fall 2007 39% 46% 10% 5% Spring 2007 38% 45% 13% 4%
Fall 2006 41% 44% 11% 4% 25. Most of my friends want to go to college.
Really Agree
Kind of Agree
Kind of Disagree
Really Disagree
Spring 2012 38% 43% 14% 4% Spring 2011 38% 44% 14% 4% Spring 2010 37% 43% 15% 5% Spring 2009 39% 41% 13% 6%
Fall 2008 44% 39% 12% 5% Spring 2008 38% 44% 13% 5%
Fall 2007 46% 38% 12% 5% Spring 2007 44% 39% 13% 4%
Fall 2006 44% 39% 12% 5%

School District of Lancaster, 2011-2012 Student Survey May 21-25, 2012 Marginal Frequency Report – Total Sample Middle School Students N=1899
Center for Opinion Research 8 Franklin & Marshall College
26. Most of my friends think education is a waste of time.
Really Agree
Kind of Agree
Kind of Disagree
Really Disagree
Spring 2012 12% 28% 34% 26% Spring 2011 12% 29% 34% 25% Spring 2010 12% 26% 33% 29% Spring 2009 10% 22% 34% 34%
Fall 2008 10% 23% 32% 35% Spring 2008 12% 23% 34% 31%
Fall 2007 11% 23% 31% 35% Spring 2007 10% 25% 31% 34%
Fall 2006 13% 25% 29% 33% 27. Most of my friends want to leave school as soon as possible.
Really Agree
Kind of Agree
Kind of Disagree
Really Disagree
Spring 2012 24% 29% 24% 23% Spring 2011 25% 26% 26% 23% Spring 2010 20% 25% 27% 28% Spring 2009 15% 22% 29% 34%
Fall 2008 18% 22% 25% 34% Spring 2008 17% 26% 25% 32%
Fall 2007 20% 24% 24% 32% Spring 2007 22% 25% 23% 31%
Fall 2006 27% 24% 22% 26% 28. My friends tell me to leave school and get a job.
Really Agree
Kind of Agree
Kind of Disagree
Really Disagree
Spring 2012 4% 7% 17% 72% Spring 2011 4% 6% 16% 75% Spring 2010 4% 7% 15% 74% Spring 2009 4% 6% 15% 76%
Fall 2008 4% 6% 14% 75% Spring 2008 5% 6% 14% 74%
Fall 2007 4% 6% 14% 76% Spring 2007 4% 4% 11% 80%
Fall 2006 4% 7% 11% 78%
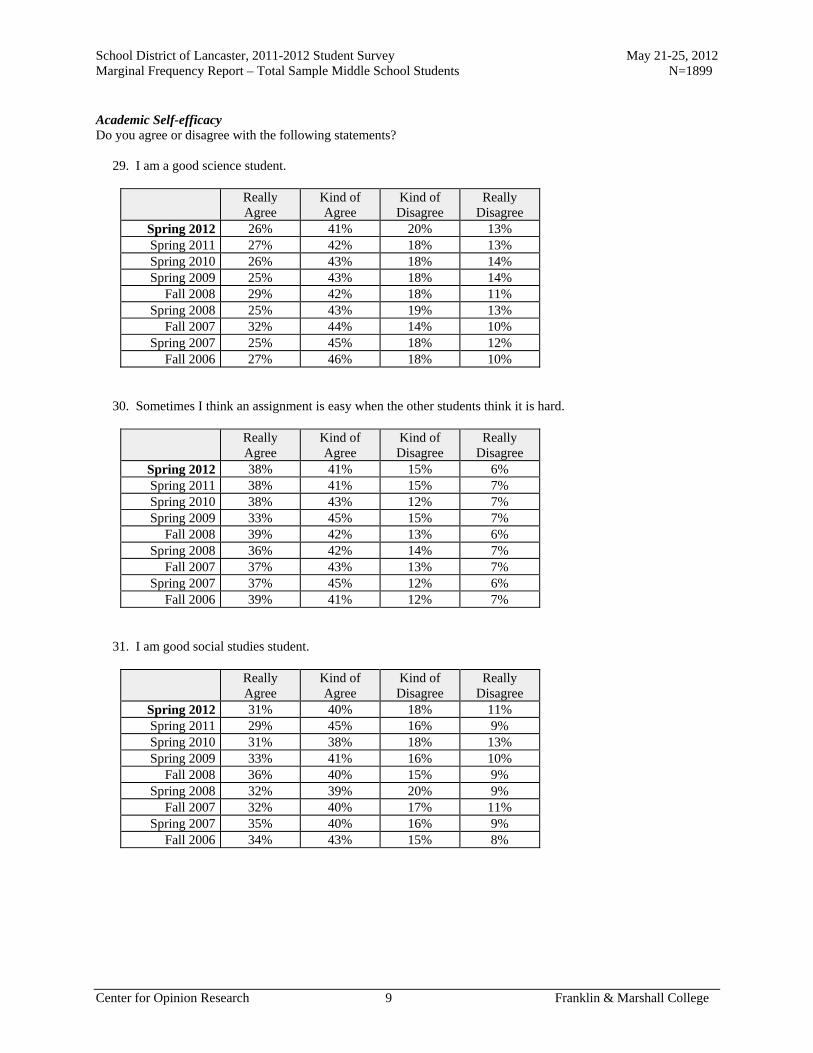
School District of Lancaster, 2011-2012 Student Survey May 21-25, 2012 Marginal Frequency Report – Total Sample Middle School Students N=1899
Center for Opinion Research 9 Franklin & Marshall College
Academic Self-efficacy Do you agree or disagree with the following statements? 29. I am a good science student.
Really Agree
Kind of Agree
Kind of Disagree
Really Disagree
Spring 2012 26% 41% 20% 13% Spring 2011 27% 42% 18% 13% Spring 2010 26% 43% 18% 14% Spring 2009 25% 43% 18% 14%
Fall 2008 29% 42% 18% 11% Spring 2008 25% 43% 19% 13%
Fall 2007 32% 44% 14% 10% Spring 2007 25% 45% 18% 12%
Fall 2006 27% 46% 18% 10% 30. Sometimes I think an assignment is easy when the other students think it is hard.
Really Agree
Kind of Agree
Kind of Disagree
Really Disagree
Spring 2012 38% 41% 15% 6% Spring 2011 38% 41% 15% 7% Spring 2010 38% 43% 12% 7% Spring 2009 33% 45% 15% 7%
Fall 2008 39% 42% 13% 6% Spring 2008 36% 42% 14% 7%
Fall 2007 37% 43% 13% 7% Spring 2007 37% 45% 12% 6%
Fall 2006 39% 41% 12% 7% 31. I am good social studies student.
Really Agree
Kind of Agree
Kind of Disagree
Really Disagree
Spring 2012 31% 40% 18% 11% Spring 2011 29% 45% 16% 9% Spring 2010 31% 38% 18% 13% Spring 2009 33% 41% 16% 10%
Fall 2008 36% 40% 15% 9% Spring 2008 32% 39% 20% 9%
Fall 2007 32% 40% 17% 11% Spring 2007 35% 40% 16% 9%
Fall 2006 34% 43% 15% 8%

School District of Lancaster, 2011-2012 Student Survey May 21-25, 2012 Marginal Frequency Report – Total Sample Middle School Students N=1899
Center for Opinion Research 10 Franklin & Marshall College
32. My teacher thinks I am smart.
Really Agree
Kind of Agree
Kind of Disagree
Really Disagree
Spring 2012 45% 39% 11% 5% Spring 2011 46% 41% 9% 4% Spring 2010 43% 38% 12% 6% Spring 2009 42% 40% 11% 7%
Fall 2008 47% 37% 10% 5% Spring 2008 41% 39% 13% 7%
Fall 2007 45% 37% 11% 6% Spring 2007 43% 39% 12% 6%
Fall 2006 41% 41% 13% 5% 33. I am a good math student.
Really Agree
Kind of Agree
Kind of Disagree
Really Disagree
Spring 2012 40% 37% 14% 10% Spring 2011 40% 35% 15% 9% Spring 2010 42% 39% 11% 7% Spring 2009 42% 38% 12% 7%
Fall 2008 46% 38% 9% 7% Spring 2008 42% 34% 14% 10%
Fall 2007 45% 33% 13% 9% Spring 2007 42% 36% 14% 9%
Fall 2006 43% 34% 14% 9% 34. My classmates usually get better grades than I do.
Really Agree
Kind of Agree
Kind of Disagree
Really Disagree
Spring 2012 14% 35% 37% 14% Spring 2011 15% 34% 37% 14% Spring 2010 11% 36% 38% 14% Spring 2009 12% 33% 40% 15%
Fall 2008 11% 33% 40% 16% Spring 2008 15% 33% 36% 16%
Fall 2007 15% 32% 37% 16% Spring 2007 15% 33% 37% 16%
Fall 2006 19% 34% 31% 15%

School District of Lancaster, 2011-2012 Student Survey May 21-25, 2012 Marginal Frequency Report – Total Sample Middle School Students N=1899
Center for Opinion Research 11 Franklin & Marshall College
35. I usually understand my homework assignments.
Really Agree
Kind of Agree
Kind of Disagree
Really Disagree
Spring 2012 32% 45% 18% 6% Spring 2011 32% 45% 18% 6% Spring 2010 30% 48% 16% 6% Spring 2009 30% 47% 17% 6%
Fall 2008 35% 45% 16% 4% Spring 2008 32% 44% 16% 7%
Fall 2007 35% 44% 15% 6% Spring 2007 34% 45% 16% 5%
Fall 2006 36% 43% 15% 6% 36. I could get the best grades in class if I tried hard enough.
Really Agree
Kind of Agree
Kind of Disagree
Really Disagree
Spring 2012 63% 27% 8% 3% Spring 2011 65% 25% 7% 3% Spring 2010 62% 28% 8% 4% Spring 2009 60% 29% 8% 4%
Fall 2008 63% 26% 7% 4% Spring 2008 64% 25% 7% 5%
Fall 2007 67% 24% 6% 4% Spring 2007 69% 23% 5% 3%
Fall 2006 67% 25% 6% 3% 37. I am a good reading student.
Really Agree
Kind of Agree
Kind of Disagree
Really Disagree
Spring 2012 42% 35% 16% 7% Spring 2011 41% 39% 13% 7% Spring 2010 41% 38% 13% 7% Spring 2009 42% 38% 13% 7%
Fall 2008 44% 37% 14% 6% Spring 2008 40% 41% 13% 6%
Fall 2007 43% 39% 11% 7% Spring 2007 41% 42% 12% 6%
Fall 2006 44% 35% 15% 6%

School District of Lancaster, 2011-2012 Student Survey May 21-25, 2012 Marginal Frequency Report – Total Sample Middle School Students N=1899
Center for Opinion Research 12 Franklin & Marshall College
38. It is not hard for me to get good grades in school.
Really Agree
Kind of Agree
Kind of Disagree
Really Disagree
Spring 2012 34% 38% 20% 8% Spring 2011 35% 36% 20% 8% Spring 2010 32% 38% 21% 9% Spring 2009 35% 37% 20% 8%
Fall 2008 37% 38% 18% 8% Spring 2008 32% 40% 20% 8%
Fall 2007 34% 40% 18% 8% Spring 2007 35% 40% 18% 7%
Fall 2006 34% 40% 17% 9% 39. I am smart.
Really Agree
Kind of Agree
Kind of Disagree
Really Disagree
Spring 2012 57% 30% 7% 5% Spring 2011 56% 33% 7% 4% Spring 2010 55% 32% 8% 4% Spring 2009 57% 31% 7% 5%
Fall 2008 58% 31% 6% 4% Spring 2008 54% 35% 7% 4%
Fall 2007 56% 31% 8% 4% Spring 2007 55% 33% 8% 4%
Fall 2006 50% 36% 10% 5% 40. When the teacher asks a question I usually know the answer even if the other students don't.
Really Agree
Kind of Agree
Kind of Disagree
Really Disagree
Spring 2012 26% 47% 22% 6% Spring 2011 25% 47% 22% 6% Spring 2010 25% 49% 20% 6% Spring 2009 25% 49% 20% 6%
Fall 2008 28% 47% 19% 5% Spring 2008 28% 45% 21% 6%
Fall 2007 27% 48% 19% 6% Spring 2007 24% 51% 20% 5%
Fall 2006 24% 51% 20% 5%

School District of Lancaster, 2011-2012 Student Survey May 21-25, 2012 Marginal Frequency Report – Total Sample Middle School Students N=1899
Center for Opinion Research 13 Franklin & Marshall College
41. I work hard in school.
Really Agree
Kind of Agree
Kind of Disagree
Really Disagree
Spring 2012 44% 41% 12% 3% Spring 2011 41% 43% 12% 3% Spring 2010 39% 44% 14% 4% Spring 2009 40% 40% 14% 5%
Fall 2008 48% 38% 11% 3% Spring 2008 40% 41% 14% 5%
Fall 2007 47% 39% 11% 3% Spring 2007 40% 43% 13% 4%
Fall 2006 47% 39% 11% 3% 42. Most of my classmates work harder on their homework than I do.
Really Agree
Kind of Agree
Kind of Disagree
Really Disagree
Spring 2012 17% 34% 35% 14% Spring 2011 19% 35% 33% 13% Spring 2010 18% 36% 32% 14% Spring 2009 17% 35% 33% 14%
Fall 2008 15% 34% 34% 17% Spring 2008 19% 34% 33% 14%
Fall 2007 18% 34% 33% 15% Spring 2007 18% 36% 32% 13%
Fall 2006 18% 36% 32% 14% 43. I always get good grades when I try hard.
Really Agree
Kind of Agree
Kind of Disagree
Really Disagree
Spring 2012 62% 29% 6% 3% Spring 2011 64% 28% 6% 2% Spring 2010 61% 31% 6% 3% Spring 2009 57% 34% 6% 3%
Fall 2008 64% 27% 5% 4% Spring 2008 59% 29% 8% 3%
Fall 2007 63% 28% 5% 4% Spring 2007 63% 29% 6% 3%
Fall 2006 61% 29% 6% 3%

School District of Lancaster, 2011-2012 Student Survey May 21-25, 2012 Marginal Frequency Report – Total Sample Middle School Students N=1899
Center for Opinion Research 14 Franklin & Marshall College
44. I usually do not get good grades in math because it is too hard.
Really Agree
Kind of Agree
Kind of Disagree
Really Disagree
Spring 2012 12% 24% 28% 36% Spring 2011 13% 22% 28% 36% Spring 2010 10% 18% 29% 42% Spring 2009 10% 18% 31% 41%
Fall 2008 11% 19% 27% 43% Spring 2008 12% 21% 27% 40%
Fall 2007 12% 21% 27% 40% Spring 2007 11% 20% 27% 42%
Fall 2006 15% 22% 26% 37% 45. Most of my classmates like to do math because it is easy.
Really Agree
Kind of Agree
Kind of Disagree
Really Disagree
Spring 2012 24% 36% 26% 13% Spring 2011 24% 36% 28% 12% Spring 2010 24% 37% 27% 12% Spring 2009 22% 36% 29% 13%
Fall 2008 26% 36% 25% 13% Spring 2008 23% 34% 28% 16%
Fall 2007 25% 35% 26% 14% Spring 2007 20% 35% 30% 15%
Fall 2006 23% 35% 28% 14% 46. I would get better grades if my teacher liked me more.
Really Agree
Kind of Agree
Kind of Disagree
Really Disagree
Spring 2012 13% 17% 26% 44% Spring 2011 11% 15% 27% 46% Spring 2010 13% 15% 28% 44% Spring 2009 10% 16% 28% 46%
Fall 2008 11% 15% 27% 47% Spring 2008 12% 18% 27% 44%
Fall 2007 12% 16% 27% 44% Spring 2007 11% 15% 28% 46%
Fall 2006 12% 16% 27% 45%

School District of Lancaster, 2011-2012 Student Survey May 21-25, 2012 Marginal Frequency Report – Total Sample Middle School Students N=1899
Center for Opinion Research 15 Franklin & Marshall College
47. I will graduate from high school.
Really Agree
Kind of Agree
Kind of Disagree
Really Disagree
Spring 2012 81% 15% 2% 2% Spring 2011 84% 13% 2% 1% Spring 2010 82% 14% 2% 2% Spring 2009 83% 13% 2% 2%
Fall 2008 83% 13% 2% 2% Spring 2008 76% 16% 5% 3%
Fall 2007 80% 13% 4% 3% Spring 2007 83% 13% 3% 2%
Fall 2006 81% 14% 4% 2% 48. I go to a good school.
Really Agree
Kind of Agree
Kind of Disagree
Really Disagree
Spring 2012 38% 35% 16% 10% Spring 2011 35% 36% 16% 12% Spring 2010 30% 38% 19% 13% Spring 2009 29% 36% 20% 14%
Fall 2008 37% 35% 17% 11% Spring 2008 29% 35% 20% 16%
Fall 2007 40% 35% 16% 10% Spring 2007 33% 37% 17% 12%
Fall 2006 41% 37% 14% 9% 49. Adults who have good jobs probably were good students when they were young.
Really Agree
Kind of Agree
Kind of Disagree
Really Disagree
Spring 2012 51% 32% 12% 4% Spring 2011 51% 32% 12% 4% Spring 2010 48% 32% 16% 4% Spring 2009 45% 34% 15% 6%
Fall 2008 52% 32% 11% 5% Spring 2008 45% 33% 15% 8%
Fall 2007 51% 32% 12% 5% Spring 2007 45% 34% 14% 6%
Fall 2006 50% 33% 11% 6%

School District of Lancaster, 2011-2012 Student Survey May 21-25, 2012 Marginal Frequency Report – Total Sample Middle School Students N=1899
Center for Opinion Research 16 Franklin & Marshall College
50. When I am old enough, I will go to college.
Really Agree
Kind of Agree
Kind of Disagree
Really Disagree
Spring 2012 72% 18% 6% 4% Spring 2011 72% 20% 5% 4% Spring 2010 70% 20% 5% 4% Spring 2009 72% 18% 6% 4%
Fall 2008 74% 18% 5% 3% Spring 2008 67% 21% 7% 5%
Fall 2007 72% 18% 6% 4% Spring 2007 72% 18% 6% 4%
Fall 2006 70% 19% 6% 5% 51. No one cares if I do well in school.
Really Agree
Kind of Agree
Kind of Disagree
Really Disagree
Spring 2012 7% 10% 25% 58% Spring 2011 5% 10% 23% 62% Spring 2010 5% 10% 25% 60% Spring 2009 5% 10% 22% 64%
Fall 2008 6% 8% 19% 67% Spring 2008 7% 11% 21% 61%
Fall 2007 6% 10% 19% 65% Spring 2007 5% 10% 21% 64%
Fall 2006 7% 10% 19% 63% 52. What I learn in school is not important.
Really Agree
Kind of Agree
Kind of Disagree
Really Disagree
Spring 2012 6% 10% 22% 62% Spring 2011 5% 8% 21% 66% Spring 2010 6% 7% 21% 66% Spring 2009 5% 8% 20% 67%
Fall 2008 6% 9% 17% 68% Spring 2008 8% 11% 20% 62%
Fall 2007 7% 8% 19% 66% Spring 2007 6% 8% 20% 66%
Fall 2006 7% 6% 18% 69%

School District of Lancaster, 2011-2012 Student Survey May 21-25, 2012 Marginal Frequency Report – Total Sample Middle School Students N=1899
Center for Opinion Research 17 Franklin & Marshall College
53. It does not matter if I do well in school.
Really Agree
Kind of Agree
Kind of Disagree
Really Disagree
Spring 2012 6% 7% 18% 68% Spring 2011 5% 6% 16% 72% Spring 2010 5% 7% 18% 71% Spring 2009 5% 6% 16% 72%
Fall 2008 6% 5% 14% 75% Spring 2008 7% 8% 16% 69%
Fall 2007 7% 7% 16% 71% Spring 2007 4% 6% 16% 74%
Fall 2006 6% 6% 13% 74% 54. Students who get better grades than I do get more help from the teacher than I do.
Really Agree
Kind of Agree
Kind of Disagree
Really Disagree
Spring 2012 14% 22% 32% 32% Spring 2011 12% 22% 33% 33% Spring 2010 14% 20% 32% 34% Spring 2009 11% 21% 32% 35%
Fall 2008 11% 19% 29% 40% Spring 2008 13% 23% 30% 34%
Fall 2007 14% 21% 29% 36% Spring 2007 12% 21% 32% 36%
Fall 2006 14% 22% 30% 35% 55. I will quit school as soon as I can.
Really Agree
Kind of Agree
Kind of Disagree
Really Disagree
Spring 2012 5% 5% 11% 78% Spring 2011 3% 5% 11% 80% Spring 2010 4% 5% 11% 80% Spring 2009 4% 5% 11% 81%
Fall 2008 4% 4% 9% 82% Spring 2008 5% 6% 12% 76%
Fall 2007 5% 5% 10% 80% Spring 2007 2% 4% 9% 84%
Fall 2006 4% 5% 9% 83%

School District of Lancaster, 2011-2012 Student Survey May 21-25, 2012 Marginal Frequency Report – Total Sample Middle School Students N=1899
Center for Opinion Research 18 Franklin & Marshall College
56. Teachers like students even if they do not always make good grades.
Really Agree
Kind of Agree
Kind of Disagree
Really Disagree
Spring 2012 37% 38% 16% 9% Spring 2011 37% 38% 16% 9% Spring 2010 35% 41% 15% 9% Spring 2009 32% 42% 16% 10%
Fall 2008 39% 37% 15% 9% Spring 2008 32% 39% 18% 11%
Fall 2007 38% 38% 14% 10% Spring 2007 35% 42% 14% 9%
Fall 2006 39% 39% 14% 8% 57. It is important to go to high school.
Really Agree
Kind of Agree
Kind of Disagree
Really Disagree
Spring 2012 82% 12% 2% 3% Spring 2011 84% 11% 2% 3% Spring 2010 80% 12% 4% 4% Spring 2009 81% 12% 3% 5%
Fall 2008 84% 10% 2% 3% Spring 2008 78% 13% 4% 5%
Fall 2007 81% 12% 3% 4% Spring 2007 85% 10% 2% 3%
Fall 2006 87% 9% 2% 2% 58. How often do you take books home to study?
Every Night Most Nights Some Nights Never Spring 2012 5% 15% 45% 35% Spring 2011 5% 15% 48% 32% Spring 2010 7% 17% 49% 27% Spring 2009 7% 18% 47% 27%
Fall 2008 12% 25% 45% 18%
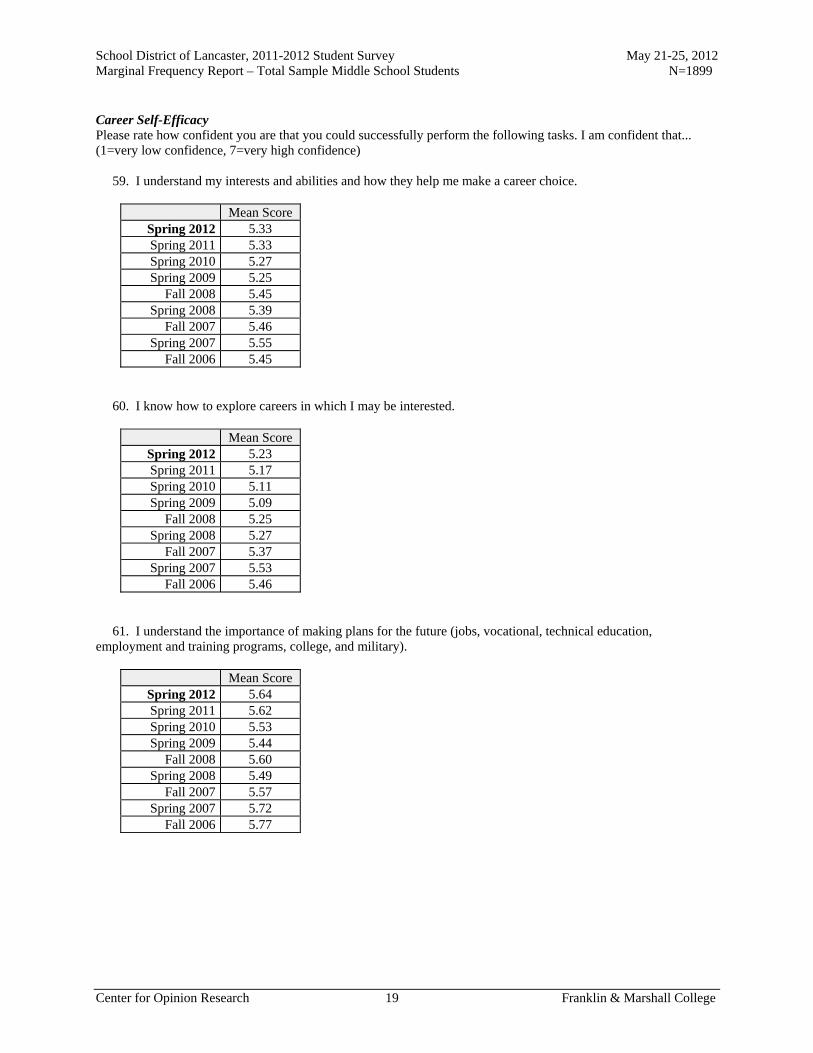
School District of Lancaster, 2011-2012 Student Survey May 21-25, 2012 Marginal Frequency Report – Total Sample Middle School Students N=1899
Center for Opinion Research 19 Franklin & Marshall College
Career Self-Efficacy Please rate how confident you are that you could successfully perform the following tasks. I am confident that... (1=very low confidence, 7=very high confidence) 59. I understand my interests and abilities and how they help me make a career choice.
Mean Score Spring 2012 5.33 Spring 2011 5.33 Spring 2010 5.27 Spring 2009 5.25
Fall 2008 5.45 Spring 2008 5.39
Fall 2007 5.46 Spring 2007 5.55
Fall 2006 5.45 60. I know how to explore careers in which I may be interested.
Mean Score Spring 2012 5.23 Spring 2011 5.17 Spring 2010 5.11 Spring 2009 5.09
Fall 2008 5.25 Spring 2008 5.27
Fall 2007 5.37 Spring 2007 5.53
Fall 2006 5.46 61. I understand the importance of making plans for the future (jobs, vocational, technical education, employment and training programs, college, and military).
Mean Score Spring 2012 5.64 Spring 2011 5.62 Spring 2010 5.53 Spring 2009 5.44
Fall 2008 5.60 Spring 2008 5.49
Fall 2007 5.57 Spring 2007 5.72
Fall 2006 5.77
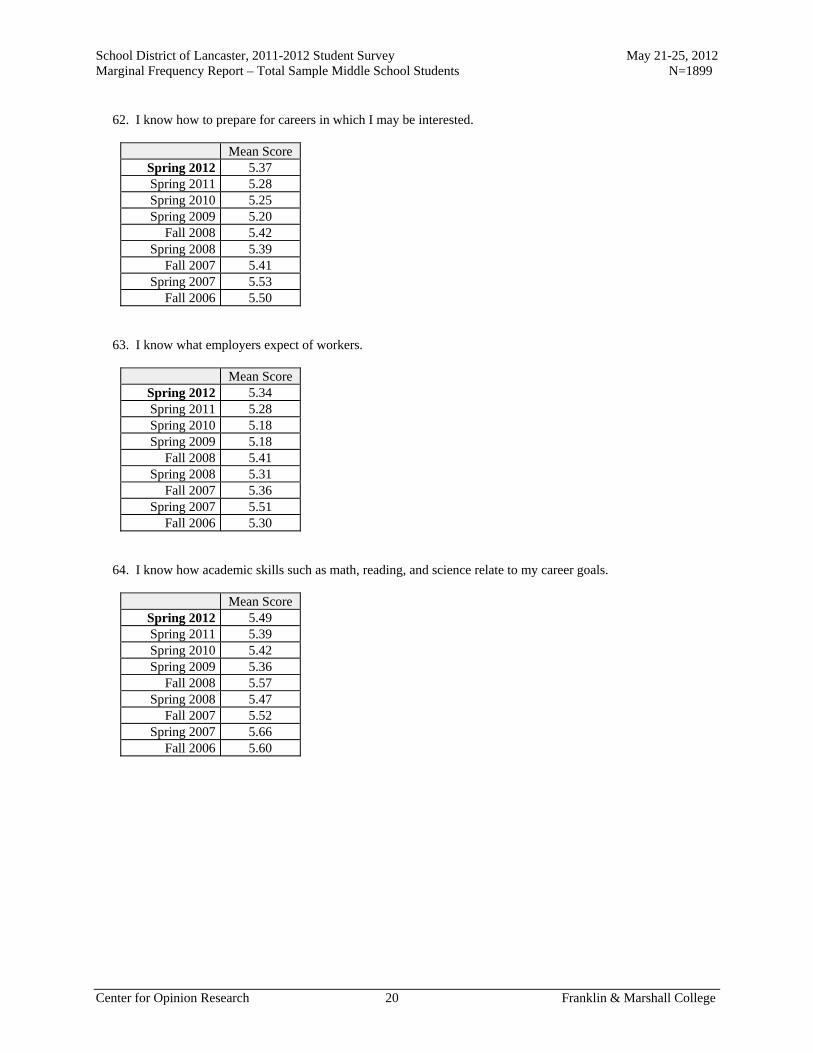
School District of Lancaster, 2011-2012 Student Survey May 21-25, 2012 Marginal Frequency Report – Total Sample Middle School Students N=1899
Center for Opinion Research 20 Franklin & Marshall College
62. I know how to prepare for careers in which I may be interested.
Mean Score Spring 2012 5.37 Spring 2011 5.28 Spring 2010 5.25 Spring 2009 5.20
Fall 2008 5.42 Spring 2008 5.39
Fall 2007 5.41 Spring 2007 5.53
Fall 2006 5.50 63. I know what employers expect of workers.
Mean Score Spring 2012 5.34 Spring 2011 5.28 Spring 2010 5.18 Spring 2009 5.18
Fall 2008 5.41 Spring 2008 5.31
Fall 2007 5.36 Spring 2007 5.51
Fall 2006 5.30 64. I know how academic skills such as math, reading, and science relate to my career goals.
Mean Score Spring 2012 5.49 Spring 2011 5.39 Spring 2010 5.42 Spring 2009 5.36
Fall 2008 5.57 Spring 2008 5.47
Fall 2007 5.52 Spring 2007 5.66
Fall 2006 5.60

School District of Lancaster, 2011-2012 Student Survey May 21-25, 2012 Marginal Frequency Report – Total Sample Middle School Students N=1899
Center for Opinion Research 21 Franklin & Marshall College
65. I know how to look for a part-time summer job.
Mean Score Spring 2012 4.96 Spring 2011 4.87 Spring 2010 4.89 Spring 2009 4.95
Fall 2008 5.18 Spring 2008 5.17
Fall 2007 5.14 Spring 2007 5.28
Fall 2006 5.20 66. I know what jobs are available locally.
Mean Score Spring 2012 4.64 Spring 2011 4.47 Spring 2010 4.50 Spring 2009 4.62
Fall 2008 4.84 Spring 2008 4.88
Fall 2007 4.90 Spring 2007 4.93
Fall 2006 4.79 67. I understand the challenges students have in high school.
Mean Score Spring 2012 5.30 Spring 2011 5.29 Spring 2010 5.18 Spring 2009 5.19
Fall 2008 5.35 Spring 2008 5.31
Fall 2007 5.35 Spring 2007 5.44
Fall 2006 5.39

School District of Lancaster, 2011-2012 Student Survey May 21-25, 2012 Marginal Frequency Report – Total Sample Middle School Students N=1899
Center for Opinion Research 22 Franklin & Marshall College
68. I know how to organize my class and homework materials.
Mean Score Spring 2012 5.40 Spring 2011 5.35 Spring 2010 5.31 Spring 2009 5.30
Fall 2008 5.49 Spring 2008 5.31
Fall 2007 5.46 Spring 2007 5.37
Fall 2006 5.36 69. I know how to select high school courses that help meet my needs, interests, and career goals.
Mean Score Spring 2012 5.20 Spring 2011 5.09 Spring 2010 5.06 Spring 2009 5.06
Fall 2008 5.17 Spring 2008 5.21
Fall 2007 5.31 Spring 2007 5.33
Fall 2006 5.23 70. I can take good notes.
Mean Score Spring 2012 5.15 Spring 2011 5.10 Spring 2010 5.12 Spring 2009 5.11
Fall 2008 5.23 Spring 2008 5.16
Fall 2007 5.31 Spring 2007 5.22
Fall 2006 5.16

School District of Lancaster, 2011-2012 Student Survey May 21-25, 2012 Marginal Frequency Report – Total Sample Middle School Students N=1899
Center for Opinion Research 23 Franklin & Marshall College
71. I understand how completing high school will better prepare me to continue my education (vocational technical education, military, and college.)
Mean Score Spring 2012 5.73 Spring 2011 5.67 Spring 2010 5.61 Spring 2009 5.61
Fall 2008 5.64 Spring 2008 5.57
Fall 2007 5.65 Spring 2007 5.81
Fall 2006 5.72 72. I understand high school credits and graduation requirements.
Mean Score Spring 2012 5.30 Spring 2011 5.15 Spring 2010 5.21 Spring 2009 5.17
Fall 2008 5.23 Spring 2008 5.26
Fall 2007 5.35 Spring 2007 5.34
Fall 2006 5.24 73. I know how to do well on tests.
Mean Score Spring 2012 5.40 Spring 2011 5.29 Spring 2010 5.35 Spring 2009 5.31
Fall 2008 5.48 Spring 2008 5.36
Fall 2007 5.45 Spring 2007 5.40
Fall 2006 5.36
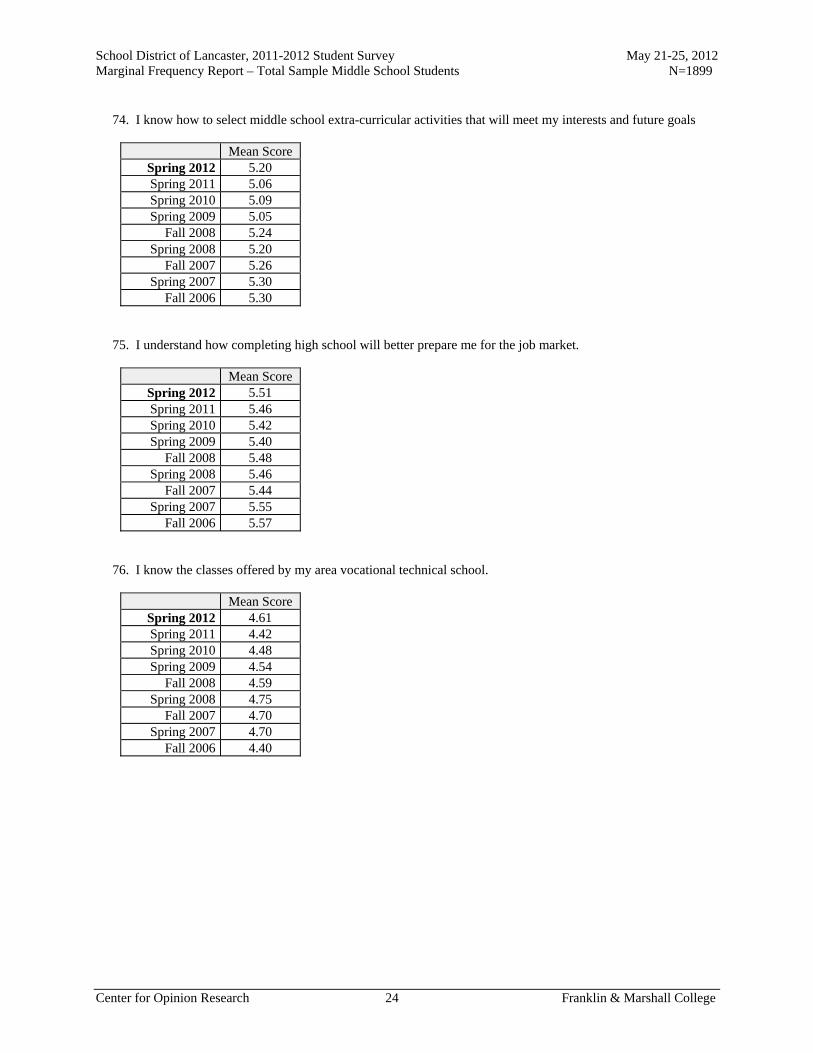
School District of Lancaster, 2011-2012 Student Survey May 21-25, 2012 Marginal Frequency Report – Total Sample Middle School Students N=1899
Center for Opinion Research 24 Franklin & Marshall College
74. I know how to select middle school extra-curricular activities that will meet my interests and future goals
Mean Score Spring 2012 5.20 Spring 2011 5.06 Spring 2010 5.09 Spring 2009 5.05
Fall 2008 5.24 Spring 2008 5.20
Fall 2007 5.26 Spring 2007 5.30
Fall 2006 5.30 75. I understand how completing high school will better prepare me for the job market.
Mean Score Spring 2012 5.51 Spring 2011 5.46 Spring 2010 5.42 Spring 2009 5.40
Fall 2008 5.48 Spring 2008 5.46
Fall 2007 5.44 Spring 2007 5.55
Fall 2006 5.57 76. I know the classes offered by my area vocational technical school.
Mean Score Spring 2012 4.61 Spring 2011 4.42 Spring 2010 4.48 Spring 2009 4.54
Fall 2008 4.59 Spring 2008 4.75
Fall 2007 4.70 Spring 2007 4.70
Fall 2006 4.40
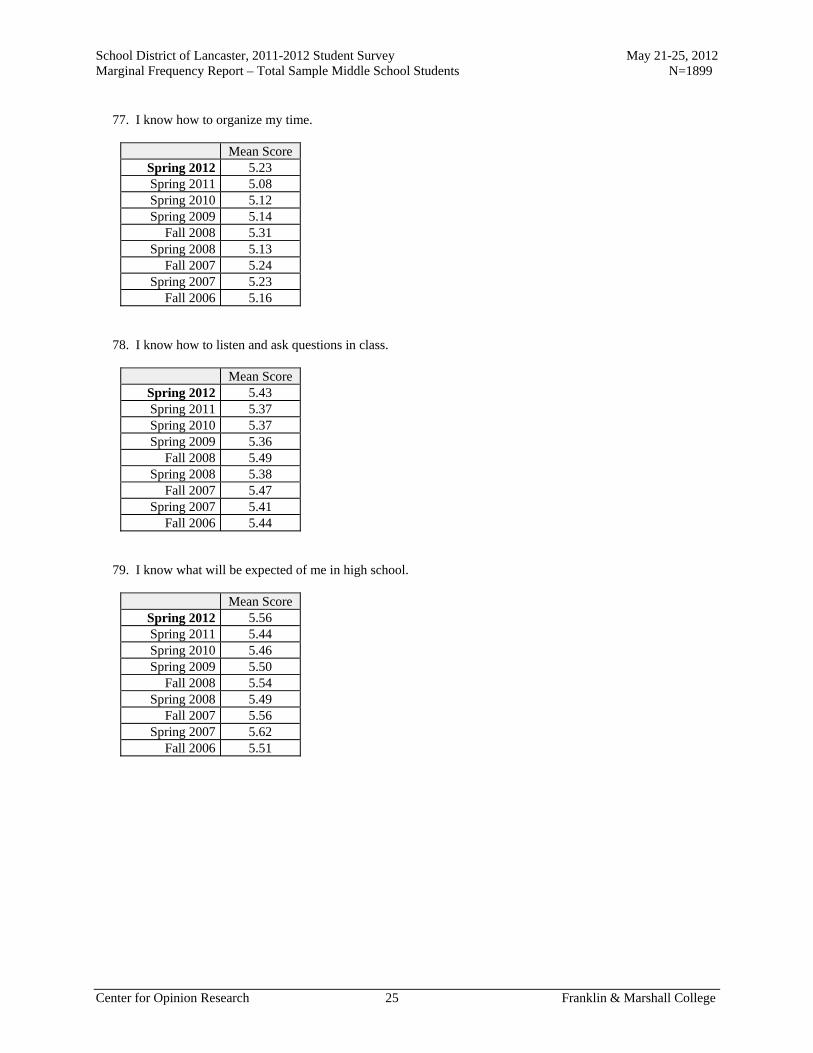
School District of Lancaster, 2011-2012 Student Survey May 21-25, 2012 Marginal Frequency Report – Total Sample Middle School Students N=1899
Center for Opinion Research 25 Franklin & Marshall College
77. I know how to organize my time.
Mean Score Spring 2012 5.23 Spring 2011 5.08 Spring 2010 5.12 Spring 2009 5.14
Fall 2008 5.31 Spring 2008 5.13
Fall 2007 5.24 Spring 2007 5.23
Fall 2006 5.16 78. I know how to listen and ask questions in class.
Mean Score Spring 2012 5.43 Spring 2011 5.37 Spring 2010 5.37 Spring 2009 5.36
Fall 2008 5.49 Spring 2008 5.38
Fall 2007 5.47 Spring 2007 5.41
Fall 2006 5.44 79. I know what will be expected of me in high school.
Mean Score Spring 2012 5.56 Spring 2011 5.44 Spring 2010 5.46 Spring 2009 5.50
Fall 2008 5.54 Spring 2008 5.49
Fall 2007 5.56 Spring 2007 5.62
Fall 2006 5.51
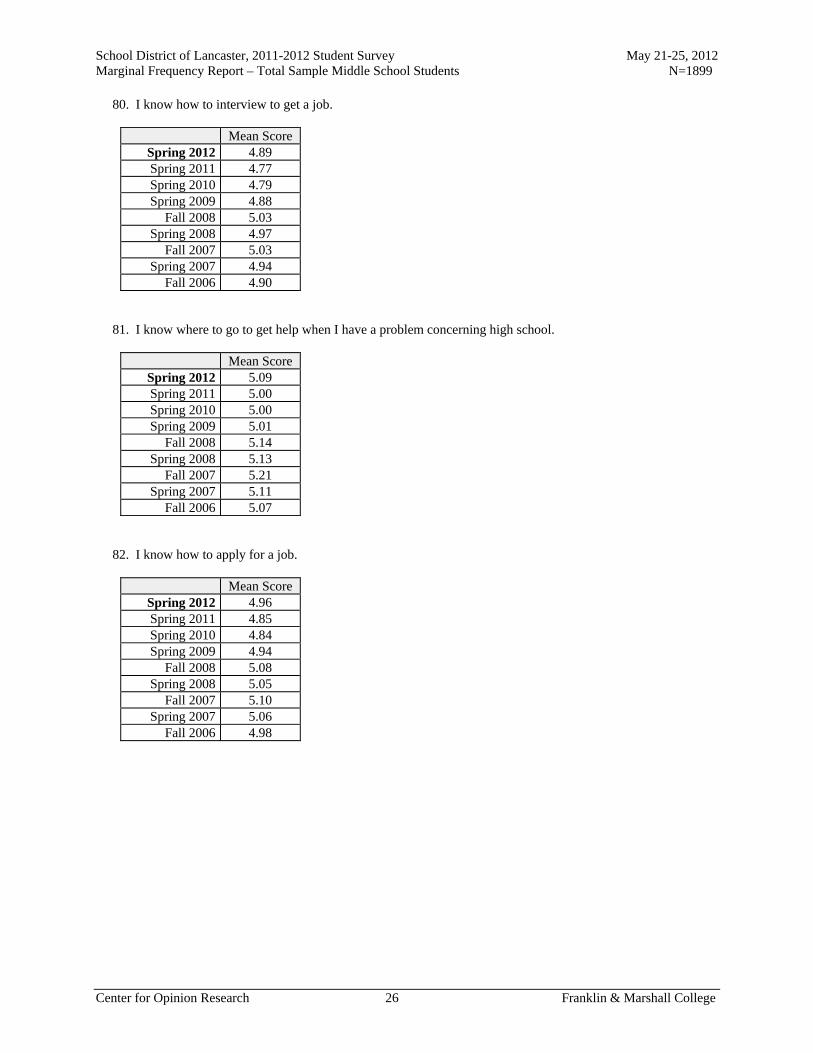
School District of Lancaster, 2011-2012 Student Survey May 21-25, 2012 Marginal Frequency Report – Total Sample Middle School Students N=1899
Center for Opinion Research 26 Franklin & Marshall College
80. I know how to interview to get a job.
Mean Score Spring 2012 4.89 Spring 2011 4.77 Spring 2010 4.79 Spring 2009 4.88
Fall 2008 5.03 Spring 2008 4.97
Fall 2007 5.03 Spring 2007 4.94
Fall 2006 4.90 81. I know where to go to get help when I have a problem concerning high school.
Mean Score Spring 2012 5.09 Spring 2011 5.00 Spring 2010 5.00 Spring 2009 5.01
Fall 2008 5.14 Spring 2008 5.13
Fall 2007 5.21 Spring 2007 5.11
Fall 2006 5.07 82. I know how to apply for a job.
Mean Score Spring 2012 4.96 Spring 2011 4.85 Spring 2010 4.84 Spring 2009 4.94
Fall 2008 5.08 Spring 2008 5.05
Fall 2007 5.10 Spring 2007 5.06
Fall 2006 4.98
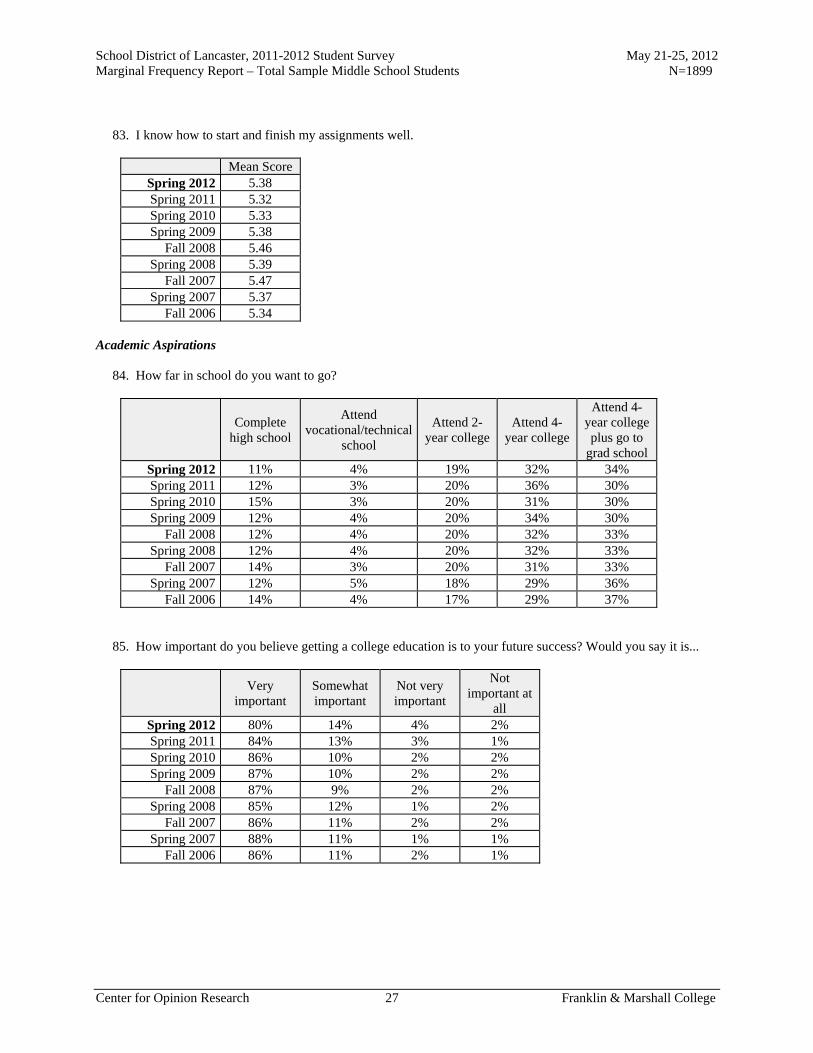
School District of Lancaster, 2011-2012 Student Survey May 21-25, 2012 Marginal Frequency Report – Total Sample Middle School Students N=1899
Center for Opinion Research 27 Franklin & Marshall College
83. I know how to start and finish my assignments well.
Mean Score Spring 2012 5.38 Spring 2011 5.32 Spring 2010 5.33 Spring 2009 5.38
Fall 2008 5.46 Spring 2008 5.39
Fall 2007 5.47 Spring 2007 5.37
Fall 2006 5.34 Academic Aspirations 84. How far in school do you want to go?
Complete
high school
Attend vocational/technical
school
Attend 2-year college
Attend 4-year college
Attend 4-year college plus go to
grad school Spring 2012 11% 4% 19% 32% 34% Spring 2011 12% 3% 20% 36% 30% Spring 2010 15% 3% 20% 31% 30% Spring 2009 12% 4% 20% 34% 30%
Fall 2008 12% 4% 20% 32% 33% Spring 2008 12% 4% 20% 32% 33%
Fall 2007 14% 3% 20% 31% 33% Spring 2007 12% 5% 18% 29% 36%
Fall 2006 14% 4% 17% 29% 37% 85. How important do you believe getting a college education is to your future success? Would you say it is...
Very
important Somewhat important
Not very important
Not important at
all Spring 2012 80% 14% 4% 2% Spring 2011 84% 13% 3% 1% Spring 2010 86% 10% 2% 2% Spring 2009 87% 10% 2% 2%
Fall 2008 87% 9% 2% 2% Spring 2008 85% 12% 1% 2%
Fall 2007 86% 11% 2% 2% Spring 2007 88% 11% 1% 1%
Fall 2006 86% 11% 2% 1%
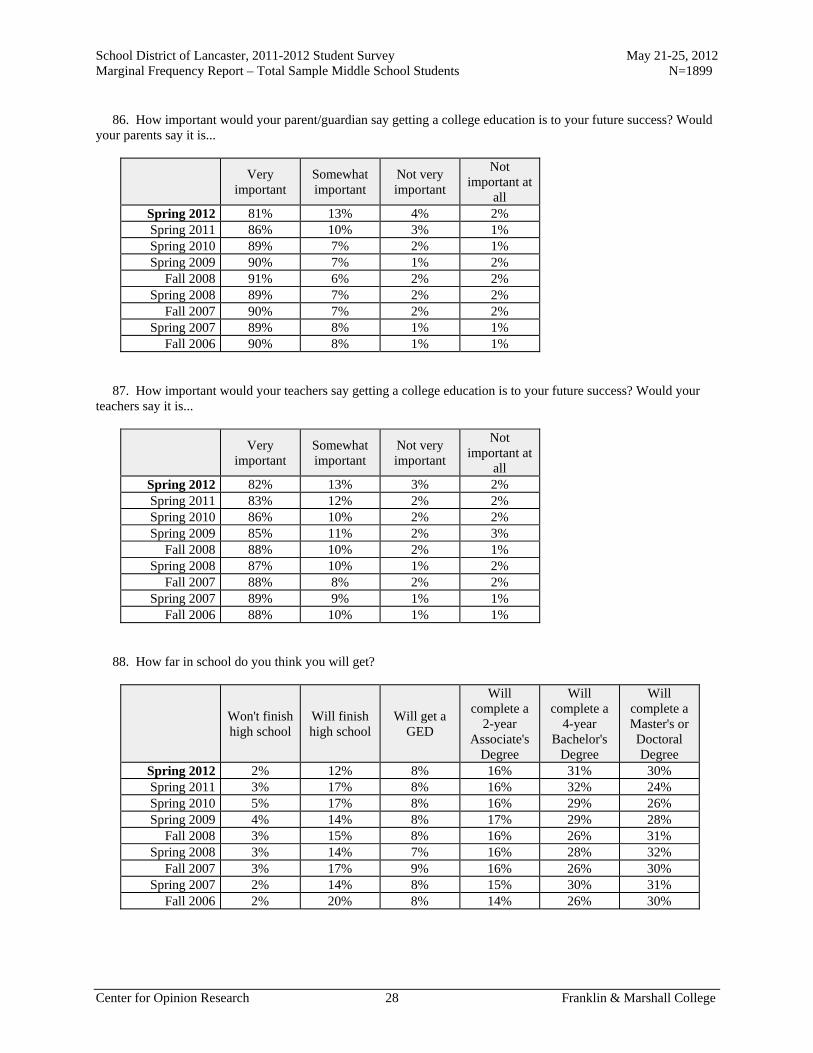
School District of Lancaster, 2011-2012 Student Survey May 21-25, 2012 Marginal Frequency Report – Total Sample Middle School Students N=1899
Center for Opinion Research 28 Franklin & Marshall College
86. How important would your parent/guardian say getting a college education is to your future success? Would your parents say it is...
Very
important Somewhat important
Not very important
Not important at
all Spring 2012 81% 13% 4% 2% Spring 2011 86% 10% 3% 1% Spring 2010 89% 7% 2% 1% Spring 2009 90% 7% 1% 2%
Fall 2008 91% 6% 2% 2% Spring 2008 89% 7% 2% 2%
Fall 2007 90% 7% 2% 2% Spring 2007 89% 8% 1% 1%
Fall 2006 90% 8% 1% 1% 87. How important would your teachers say getting a college education is to your future success? Would your teachers say it is...
Very
important Somewhat important
Not very important
Not important at
all Spring 2012 82% 13% 3% 2% Spring 2011 83% 12% 2% 2% Spring 2010 86% 10% 2% 2% Spring 2009 85% 11% 2% 3%
Fall 2008 88% 10% 2% 1% Spring 2008 87% 10% 1% 2%
Fall 2007 88% 8% 2% 2% Spring 2007 89% 9% 1% 1%
Fall 2006 88% 10% 1% 1% 88. How far in school do you think you will get?
Won't finish high school
Will finish high school
Will get a GED
Will complete a
2-year Associate's
Degree
Will complete a
4-year Bachelor's
Degree
Will complete a Master's or Doctoral Degree
Spring 2012 2% 12% 8% 16% 31% 30% Spring 2011 3% 17% 8% 16% 32% 24% Spring 2010 5% 17% 8% 16% 29% 26% Spring 2009 4% 14% 8% 17% 29% 28%
Fall 2008 3% 15% 8% 16% 26% 31% Spring 2008 3% 14% 7% 16% 28% 32%
Fall 2007 3% 17% 9% 16% 26% 30% Spring 2007 2% 14% 8% 15% 30% 31%
Fall 2006 2% 20% 8% 14% 26% 30%

School District of Lancaster, 2011-2012 Student Survey May 21-25, 2012 Marginal Frequency Report – Total Sample Middle School Students N=1899
Center for Opinion Research 29 Franklin & Marshall College
89. Has anyone from your school or GEAR UP ever spoken with you about college entrance requirements or the courses that you need to take in high school in order to prepare for college?
Yes No Spring 2012 67% 33% Spring 2011 60% 40% Spring 2010 59% 41% Spring 2009 58% 42%
Fall 2008 51% 49% Spring 2008 61% 39%
Fall 2007 56% 44% Spring 2007 69% 31%
Fall 2006 53% 47% 90. Has anyone from your school or GEAR UP ever spoken with you about the availability of financial aid to help you pay for college?
Yes No Spring 2012 57% 43% Spring 2011 41% 59% Spring 2010 41% 59% Spring 2009 44% 56%
Fall 2008 42% 58% Spring 2008 48% 52%
Fall 2007 47% 53% Spring 2007 64% 36%
Fall 2006 46% 54% 91. Do you think that you could afford to attend a public 4-year college (for example, Millersville University) using financial aid, scholarships, and your family's resources?
Definitely Probably Not Sure Probably
Not Definitely
Not Spring 2012 26% 38% 26% 5% 4% Spring 2011 26% 37% 28% 6% 3% Spring 2010 28% 35% 28% 5% 4% Spring 2009 27% 38% 26% 6% 4%
Fall 2008 29% 36% 25% 6% 4% Spring 2008 30% 36% 25% 5% 4%
Fall 2007 28% 37% 24% 6% 5% Spring 2007 28% 37% 26% 6% 3%
Fall 2006 27% 38% 27% 6% 3% 92. On a scale of 1 to 5, to what extent are you knowledgeable about financial aid and the cost and benefits to you in pursuing postsecondary education?
Mean Score Spring 2012 3.25
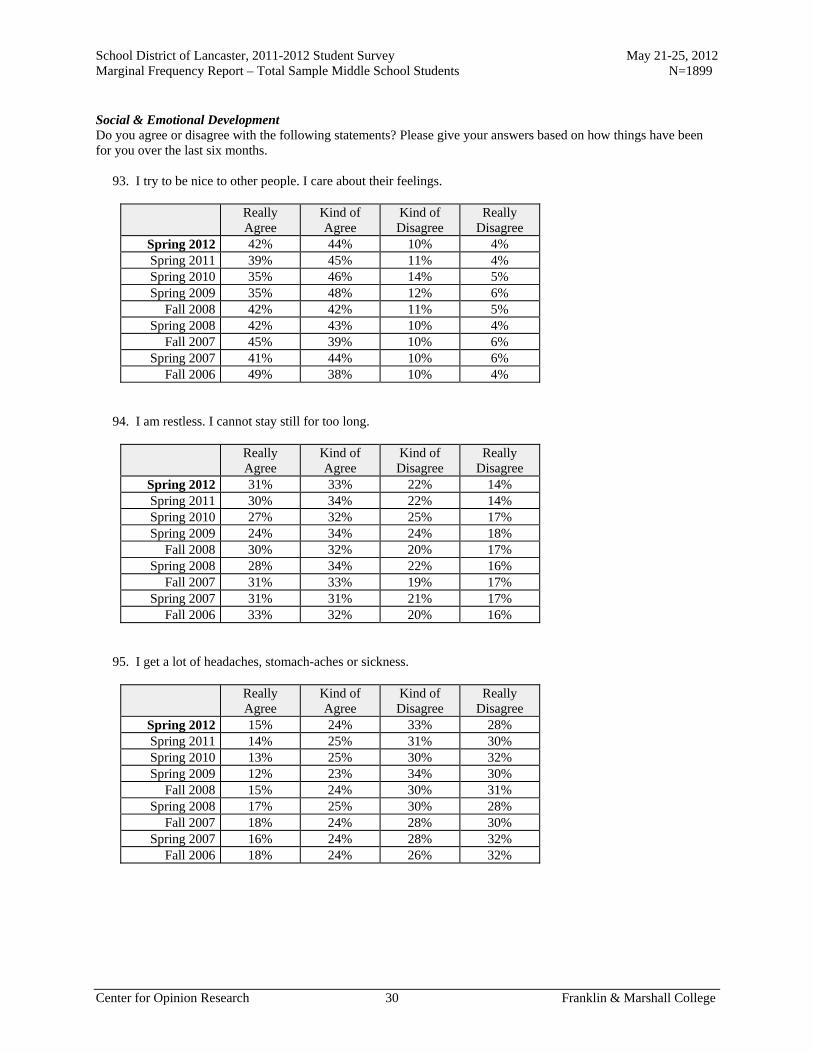
School District of Lancaster, 2011-2012 Student Survey May 21-25, 2012 Marginal Frequency Report – Total Sample Middle School Students N=1899
Center for Opinion Research 30 Franklin & Marshall College
Social & Emotional Development Do you agree or disagree with the following statements? Please give your answers based on how things have been for you over the last six months. 93. I try to be nice to other people. I care about their feelings.
Really Agree
Kind of Agree
Kind of Disagree
Really Disagree
Spring 2012 42% 44% 10% 4% Spring 2011 39% 45% 11% 4% Spring 2010 35% 46% 14% 5% Spring 2009 35% 48% 12% 6%
Fall 2008 42% 42% 11% 5% Spring 2008 42% 43% 10% 4%
Fall 2007 45% 39% 10% 6% Spring 2007 41% 44% 10% 6%
Fall 2006 49% 38% 10% 4% 94. I am restless. I cannot stay still for too long.
Really Agree
Kind of Agree
Kind of Disagree
Really Disagree
Spring 2012 31% 33% 22% 14% Spring 2011 30% 34% 22% 14% Spring 2010 27% 32% 25% 17% Spring 2009 24% 34% 24% 18%
Fall 2008 30% 32% 20% 17% Spring 2008 28% 34% 22% 16%
Fall 2007 31% 33% 19% 17% Spring 2007 31% 31% 21% 17%
Fall 2006 33% 32% 20% 16% 95. I get a lot of headaches, stomach-aches or sickness.
Really Agree
Kind of Agree
Kind of Disagree
Really Disagree
Spring 2012 15% 24% 33% 28% Spring 2011 14% 25% 31% 30% Spring 2010 13% 25% 30% 32% Spring 2009 12% 23% 34% 30%
Fall 2008 15% 24% 30% 31% Spring 2008 17% 25% 30% 28%
Fall 2007 18% 24% 28% 30% Spring 2007 16% 24% 28% 32%
Fall 2006 18% 24% 26% 32%

School District of Lancaster, 2011-2012 Student Survey May 21-25, 2012 Marginal Frequency Report – Total Sample Middle School Students N=1899
Center for Opinion Research 31 Franklin & Marshall College
96. I usually share with others, for example CD's, games, food.
Really Agree
Kind of Agree
Kind of Disagree
Really Disagree
Spring 2012 30% 40% 18% 12% Spring 2011 27% 44% 18% 11% Spring 2010 27% 40% 20% 13% Spring 2009 28% 42% 18% 12%
Fall 2008 32% 40% 18% 11% Spring 2008 36% 40% 15% 9%
Fall 2007 38% 37% 13% 12% Spring 2007 38% 41% 14% 7%
Fall 2006 39% 40% 13% 7% 97. I get very angry and often lose my temper.
Really Agree
Kind of Agree
Kind of Disagree
Really Disagree
Spring 2012 25% 30% 27% 19% Spring 2011 24% 28% 27% 20% Spring 2010 26% 27% 26% 20% Spring 2009 22% 28% 29% 22%
Fall 2008 24% 28% 26% 22% Spring 2008 26% 31% 25% 18%
Fall 2007 28% 29% 22% 21% Spring 2007 30% 30% 23% 18%
Fall 2006 32% 28% 22% 18% 98. I would rather be alone than with people of my age.
Really Agree
Kind of Agree
Kind of Disagree
Really Disagree
Spring 2012 13% 22% 30% 35% Spring 2011 13% 20% 29% 38% Spring 2010 14% 20% 29% 36% Spring 2009 11% 21% 30% 38%
Fall 2008 13% 20% 26% 40% Spring 2008 15% 24% 24% 37%
Fall 2007 15% 21% 24% 40% Spring 2007 13% 20% 26% 41%
Fall 2006 16% 20% 25% 39%

School District of Lancaster, 2011-2012 Student Survey May 21-25, 2012 Marginal Frequency Report – Total Sample Middle School Students N=1899
Center for Opinion Research 32 Franklin & Marshall College
99. I usually do as I am told.
Really Agree
Kind of Agree
Kind of Disagree
Really Disagree
Spring 2012 29% 44% 21% 6% Spring 2011 29% 45% 20% 6% Spring 2010 28% 43% 21% 8% Spring 2009 26% 45% 22% 8%
Fall 2008 30% 46% 18% 6% Spring 2008 31% 45% 18% 6%
Fall 2007 37% 41% 15% 6% Spring 2007 30% 45% 19% 6%
Fall 2006 34% 44% 16% 6% 100. I worry a lot.
Really Agree
Kind of Agree
Kind of Disagree
Really Disagree
Spring 2012 21% 31% 30% 19% Spring 2011 18% 28% 32% 23% Spring 2010 18% 27% 31% 24% Spring 2009 17% 28% 32% 24%
Fall 2008 20% 26% 30% 24% Spring 2008 20% 30% 29% 21%
Fall 2007 22% 28% 29% 21% Spring 2007 20% 29% 30% 20%
Fall 2006 24% 31% 27% 18% 101. I am helpful if someone is hurt, upset, or feeling ill.
Really Agree
Kind of Agree
Kind of Disagree
Really Disagree
Spring 2012 44% 38% 12% 6% Spring 2011 40% 42% 14% 4% Spring 2010 35% 45% 15% 6% Spring 2009 35% 44% 15% 6%
Fall 2008 41% 40% 13% 6% Spring 2008 38% 41% 14% 7%
Fall 2007 42% 38% 14% 6% Spring 2007 42% 42% 12% 4%
Fall 2006 45% 39% 12% 4%

School District of Lancaster, 2011-2012 Student Survey May 21-25, 2012 Marginal Frequency Report – Total Sample Middle School Students N=1899
Center for Opinion Research 33 Franklin & Marshall College
102. I am constantly moving or squirming.
Really Agree
Kind of Agree
Kind of Disagree
Really Disagree
Spring 2012 24% 33% 26% 17% Spring 2011 19% 31% 31% 20% Spring 2010 18% 28% 31% 23% Spring 2009 18% 29% 31% 22%
Fall 2008 21% 30% 28% 22% Spring 2008 23% 32% 27% 19%
Fall 2007 24% 29% 28% 20% Spring 2007 20% 30% 28% 21%
Fall 2006 24% 30% 27% 19% 103. I have one good friend or more.
Really Agree
Kind of Agree
Kind of Disagree
Really Disagree
Spring 2012 69% 22% 6% 4% Spring 2011 74% 19% 4% 4% Spring 2010 67% 21% 7% 5% Spring 2009 67% 23% 6% 4%
Fall 2008 70% 20% 5% 5% Spring 2008 65% 21% 8% 5%
Fall 2007 68% 21% 6% 4% Spring 2007 72% 19% 6% 4%
Fall 2006 72% 18% 6% 4% 104. I fight a lot. I can make other people do what I want.
Really Agree
Kind of Agree
Kind of Disagree
Really Disagree
Spring 2012 7% 17% 34% 43% Spring 2011 7% 14% 30% 49% Spring 2010 8% 17% 32% 43% Spring 2009 8% 16% 32% 44%
Fall 2008 8% 17% 31% 44% Spring 2008 10% 19% 31% 40%
Fall 2007 9% 18% 28% 45% Spring 2007 9% 18% 31% 42%
Fall 2006 10% 17% 29% 44%

School District of Lancaster, 2011-2012 Student Survey May 21-25, 2012 Marginal Frequency Report – Total Sample Middle School Students N=1899
Center for Opinion Research 34 Franklin & Marshall College
105. I am often unhappy, depressed, or tearful.
Really Agree
Kind of Agree
Kind of Disagree
Really Disagree
Spring 2012 12% 21% 28% 40% Spring 2011 10% 20% 30% 40% Spring 2010 12% 20% 29% 40% Spring 2009 11% 21% 28% 40%
Fall 2008 12% 20% 25% 43% Spring 2008 13% 23% 26% 38%
Fall 2007 15% 19% 26% 40% Spring 2007 13% 23% 25% 39%
Fall 2006 16% 21% 26% 38% 106. Other people my age generally like me.
Really Agree
Kind of Agree
Kind of Disagree
Really Disagree
Spring 2012 36% 43% 15% 6% Spring 2011 35% 45% 14% 6% Spring 2010 33% 43% 16% 7% Spring 2009 35% 44% 13% 8%
Fall 2008 40% 43% 11% 6% Spring 2008 40% 40% 15% 6%
Fall 2007 40% 41% 12% 7% Spring 2007 38% 42% 14% 6%
Fall 2006 38% 44% 12% 6% 107. I easily lose my focus. I find it difficult to concentrate.
Really Agree
Kind of Agree
Kind of Disagree
Really Disagree
Spring 2012 24% 32% 28% 16% Spring 2011 22% 31% 28% 19% Spring 2010 23% 31% 27% 19% Spring 2009 22% 31% 26% 21%
Fall 2008 23% 30% 25% 22% Spring 2008 23% 31% 27% 19%
Fall 2007 24% 32% 24% 20% Spring 2007 22% 33% 24% 20%
Fall 2006 25% 31% 25% 18%

School District of Lancaster, 2011-2012 Student Survey May 21-25, 2012 Marginal Frequency Report – Total Sample Middle School Students N=1899
Center for Opinion Research 35 Franklin & Marshall College
108. I am nervous in new situations. I easily lose confidence.
Really Agree
Kind of Agree
Kind of Disagree
Really Disagree
Spring 2012 20% 32% 29% 19% Spring 2011 17% 27% 34% 22% Spring 2010 18% 28% 29% 25% Spring 2009 15% 27% 32% 26%
Fall 2008 19% 28% 28% 25% Spring 2008 20% 29% 30% 21%
Fall 2007 22% 27% 28% 24% Spring 2007 18% 30% 30% 22%
Fall 2006 20% 30% 26% 23% 109. I am kind to younger children.
Really Agree
Kind of Agree
Kind of Disagree
Really Disagree
Spring 2012 53% 30% 12% 5% Spring 2011 52% 34% 9% 5% Spring 2010 55% 32% 8% 5% Spring 2009 58% 32% 6% 4%
Fall 2008 61% 29% 7% 4% Spring 2008 50% 32% 11% 6%
Fall 2007 55% 30% 10% 6% Spring 2007 53% 31% 10% 5%
Fall 2006 56% 29% 10% 5% 110. I am often accused of lying or cheating.
Really Agree
Kind of Agree
Kind of Disagree
Really Disagree
Spring 2012 14% 21% 27% 38% Spring 2011 13% 17% 28% 42% Spring 2010 13% 22% 26% 38% Spring 2009 12% 22% 28% 38%
Fall 2008 12% 21% 27% 40% Spring 2008 14% 22% 28% 36%
Fall 2007 15% 22% 23% 39% Spring 2007 15% 22% 26% 38%
Fall 2006 16% 21% 26% 37%

School District of Lancaster, 2011-2012 Student Survey May 21-25, 2012 Marginal Frequency Report – Total Sample Middle School Students N=1899
Center for Opinion Research 36 Franklin & Marshall College
111. Other children or young people pick on me or bully me.
Really Agree
Kind of Agree
Kind of Disagree
Really Disagree
Spring 2012 11% 15% 23% 51% Spring 2011 9% 14% 20% 56% Spring 2010 9% 13% 21% 57% Spring 2009 7% 14% 21% 57%
Fall 2008 10% 14% 21% 55% Spring 2008 11% 18% 21% 50%
Fall 2007 13% 16% 18% 53% Spring 2007 9% 16% 22% 53%
Fall 2006 11% 17% 20% 52% 112. I often offer to help others (parents, teachers, children).
Really Agree
Kind of Agree
Kind of Disagree
Really Disagree
Spring 2012 38% 41% 15% 6% Spring 2011 36% 43% 15% 6% Spring 2010 33% 45% 14% 7% Spring 2009 35% 44% 14% 7%
Fall 2008 39% 42% 13% 6% Spring 2008 37% 41% 15% 7%
Fall 2007 42% 38% 13% 6% Spring 2007 37% 43% 15% 6%
Fall 2006 41% 40% 13% 6% 113. I think before I do things.
Really Agree
Kind of Agree
Kind of Disagree
Really Disagree
Spring 2012 26% 42% 23% 9% Spring 2011 27% 40% 24% 9% Spring 2010 25% 42% 23% 9% Spring 2009 25% 43% 22% 10%
Fall 2008 29% 40% 23% 8% Spring 2008 28% 40% 24% 8%
Fall 2007 31% 41% 20% 8% Spring 2007 27% 42% 24% 8%
Fall 2006 30% 42% 19% 8%

School District of Lancaster, 2011-2012 Student Survey May 21-25, 2012 Marginal Frequency Report – Total Sample Middle School Students N=1899
Center for Opinion Research 37 Franklin & Marshall College
114. I take things that are not mine from home, school, or elsewhere.
Really Agree
Kind of Agree
Kind of Disagree
Really Disagree
Spring 2012 6% 13% 21% 60% Spring 2011 6% 10% 21% 64% Spring 2010 7% 12% 21% 60% Spring 2009 6% 12% 22% 61%
Fall 2008 6% 12% 19% 64% Spring 2008 6% 15% 22% 56%
Fall 2007 8% 13% 18% 60% Spring 2007 6% 12% 20% 62%
Fall 2006 7% 12% 20% 61% 115. I get along better with adults than with people my own age.
Really Agree
Kind of Agree
Kind of Disagree
Really Disagree
Spring 2012 16% 26% 34% 24% Spring 2011 16% 23% 35% 26% Spring 2010 16% 25% 31% 28% Spring 2009 14% 25% 35% 26%
Fall 2008 16% 25% 32% 27% Spring 2008 15% 27% 32% 26%
Fall 2007 18% 24% 30% 28% Spring 2007 14% 24% 33% 29%
Fall 2006 17% 23% 32% 28% 116. I have many fears. I am easily scared.
Really Agree
Kind of Agree
Kind of Disagree
Really Disagree
Spring 2012 11% 18% 33% 38% Spring 2011 9% 16% 31% 44% Spring 2010 8% 18% 27% 47% Spring 2009 10% 16% 30% 45%
Fall 2008 11% 18% 28% 43% Spring 2008 12% 20% 28% 39%
Fall 2007 14% 19% 28% 39% Spring 2007 10% 17% 31% 42%
Fall 2006 12% 19% 31% 38%

School District of Lancaster, 2011-2012 Student Survey May 21-25, 2012 Marginal Frequency Report – Total Sample Middle School Students N=1899
Center for Opinion Research 38 Franklin & Marshall College
117. I finish the work I'm doing. My attention is good.
Really Agree
Kind of Agree
Kind of Disagree
Really Disagree
Spring 2012 28% 41% 22% 8% Spring 2011 28% 42% 23% 7% Spring 2010 28% 40% 24% 8% Spring 2009 27% 43% 23% 8%
Fall 2008 32% 41% 21% 6% Spring 2008 30% 40% 21% 9%
Fall 2007 36% 40% 16% 7% Spring 2007 29% 43% 21% 8%
Fall 2006 34% 40% 19% 7% Perceptions of Police Do you agree or disagree with the following statements about police officers? 118. I respect police officers.
Really Agree
Kind of Agree
Kind of Disagree
Really Disagree
Spring 2012 61% 24% 9% 7% Spring 2011 60% 24% 10% 7% Spring 2010 58% 26% 9% 8% Spring 2009 55% 26% 11% 8%
Fall 2008 62% 23% 8% 7% Spring 2008 45% 32% 14% 9%
Fall 2007 55% 24% 12% 9% Spring 2007 48% 28% 14% 10%
Fall 2006 54% 26% 13% 8% 119. I am comfortable approaching police officers.
Really Agree
Kind of Agree
Kind of Disagree
Really Disagree
Spring 2012 44% 31% 16% 9% Spring 2011 42% 32% 16% 11% Spring 2010 41% 32% 15% 11% Spring 2009 39% 32% 18% 11%
Fall 2008 45% 30% 16% 9% Spring 2008 34% 33% 20% 13%
Fall 2007 40% 30% 17% 12% Spring 2007 35% 32% 20% 13%
Fall 2006 35% 35% 18% 12%

School District of Lancaster, 2011-2012 Student Survey May 21-25, 2012 Marginal Frequency Report – Total Sample Middle School Students N=1899
Center for Opinion Research 39 Franklin & Marshall College
120. I would consider police work as a career.
Really Agree
Kind of Agree
Kind of Disagree
Really Disagree
Spring 2012 25% 23% 20% 31% Spring 2011 23% 20% 19% 38% Spring 2010 23% 21% 18% 37% Spring 2009 19% 22% 21% 39%
Fall 2008 25% 20% 20% 35% Spring 2008 24% 21% 20% 35%
Fall 2007 24% 23% 19% 34% Spring 2007 21% 21% 17% 41%
Fall 2006 24% 22% 18% 36% 121. In general, I do not trust the police.
Really Agree
Kind of Agree
Kind of Disagree
Really Disagree
Spring 2012 15% 21% 25% 40% Spring 2011 14% 19% 26% 41% Spring 2010 14% 21% 25% 40% Spring 2009 15% 21% 27% 37%
Fall 2008 14% 20% 23% 43% Spring 2008 15% 24% 27% 34%
Fall 2007 14% 20% 26% 40% Spring 2007 14% 22% 26% 37%
Fall 2006 16% 20% 25% 39% 122. Police do not belong in schools unless there has been a crime.
Really Agree
Kind of Agree
Kind of Disagree
Really Disagree
Spring 2012 18% 19% 27% 35% Spring 2011 20% 17% 30% 34% Spring 2010 19% 19% 27% 35% Spring 2009 21% 19% 25% 35%
Fall 2008 18% 18% 25% 38% Spring 2008 20% 23% 26% 32%
Fall 2007 22% 20% 24% 34% Spring 2007 21% 21% 25% 32%
Fall 2006 29% 23% 22% 26%
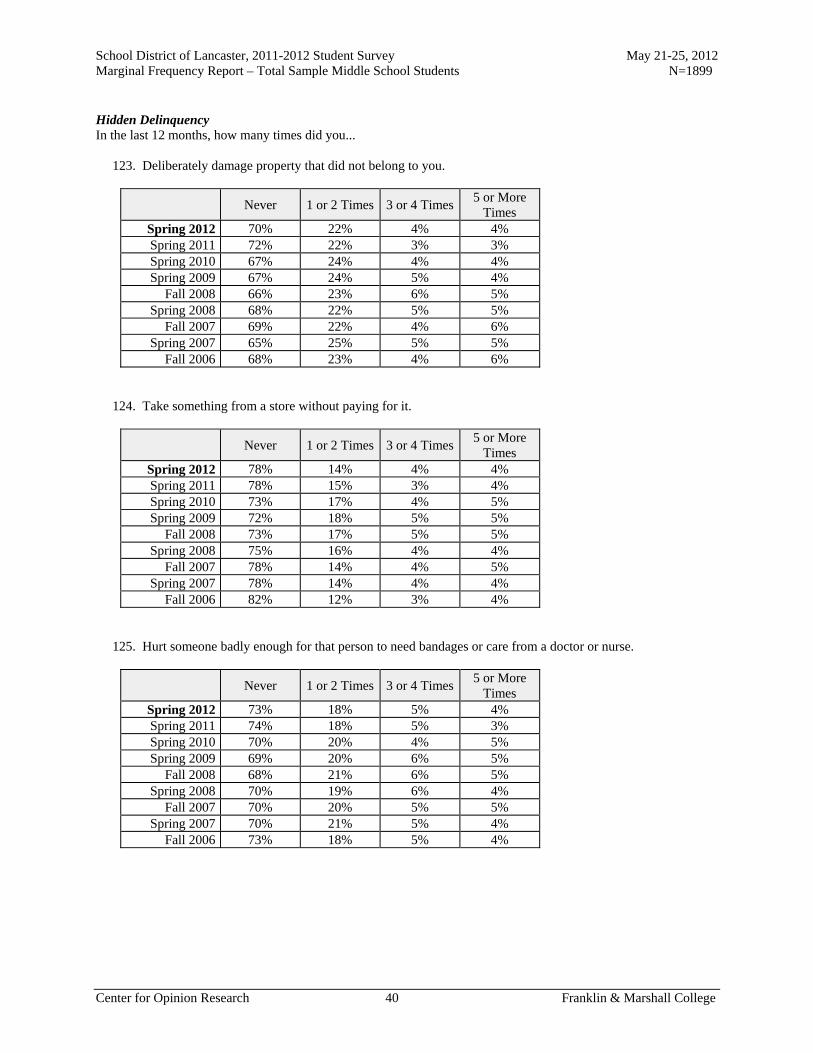
School District of Lancaster, 2011-2012 Student Survey May 21-25, 2012 Marginal Frequency Report – Total Sample Middle School Students N=1899
Center for Opinion Research 40 Franklin & Marshall College
Hidden Delinquency In the last 12 months, how many times did you... 123. Deliberately damage property that did not belong to you.
Never 1 or 2 Times 3 or 4 Times5 or More
Times Spring 2012 70% 22% 4% 4% Spring 2011 72% 22% 3% 3% Spring 2010 67% 24% 4% 4% Spring 2009 67% 24% 5% 4%
Fall 2008 66% 23% 6% 5% Spring 2008 68% 22% 5% 5%
Fall 2007 69% 22% 4% 6% Spring 2007 65% 25% 5% 5%
Fall 2006 68% 23% 4% 6% 124. Take something from a store without paying for it.
Never 1 or 2 Times 3 or 4 Times5 or More
Times Spring 2012 78% 14% 4% 4% Spring 2011 78% 15% 3% 4% Spring 2010 73% 17% 4% 5% Spring 2009 72% 18% 5% 5%
Fall 2008 73% 17% 5% 5% Spring 2008 75% 16% 4% 4%
Fall 2007 78% 14% 4% 5% Spring 2007 78% 14% 4% 4%
Fall 2006 82% 12% 3% 4% 125. Hurt someone badly enough for that person to need bandages or care from a doctor or nurse.
Never 1 or 2 Times 3 or 4 Times5 or More
Times Spring 2012 73% 18% 5% 4% Spring 2011 74% 18% 5% 3% Spring 2010 70% 20% 4% 5% Spring 2009 69% 20% 6% 5%
Fall 2008 68% 21% 6% 5% Spring 2008 70% 19% 6% 4%
Fall 2007 70% 20% 5% 5% Spring 2007 70% 21% 5% 4%
Fall 2006 73% 18% 5% 4%

School District of Lancaster, 2011-2012 Student Survey May 21-25, 2012 Marginal Frequency Report – Total Sample Middle School Students N=1899
Center for Opinion Research 41 Franklin & Marshall College
126. Drive a car without its owner's permission.
Never 1 or 2 Times 3 or 4 Times5 or More
Times Spring 2012 90% 4% 2% 3% Spring 2011 91% 6% 2% 2% Spring 2010 88% 6% 2% 3% Spring 2009 88% 7% 2% 3%
Fall 2008 87% 7% 2% 3% Spring 2008 87% 7% 3% 3%
Fall 2007 88% 5% 3% 4% Spring 2007 90% 6% 2% 2%
Fall 2006 90% 6% 2% 2% 127. Steal something worth more than $50.
Never 1 or 2 Times 3 or 4 Times5 or More
Times Spring 2012 89% 6% 3% 3% Spring 2011 90% 6% 1% 2% Spring 2010 88% 7% 2% 3% Spring 2009 88% 6% 2% 4%
Fall 2008 88% 6% 3% 3% Spring 2008 88% 6% 3% 4%
Fall 2007 88% 5% 2% 4% Spring 2007 91% 5% 2% 2%
Fall 2006 90% 4% 3% 2% 128. Go into a house or building to steal something.
Never 1 or 2 Times 3 or 4 Times5 or More
Times Spring 2012 90% 6% 3% 2% Spring 2011 91% 6% 2% 2% Spring 2010 88% 6% 2% 3% Spring 2009 88% 6% 2% 3%
Fall 2008 88% 6% 2% 3% Spring 2008 88% 6% 2% 4%
Fall 2007 88% 7% 2% 3% Spring 2007 91% 5% 2% 2%
Fall 2006 91% 5% 3% 2%

School District of Lancaster, 2011-2012 Student Survey May 21-25, 2012 Marginal Frequency Report – Total Sample Middle School Students N=1899
Center for Opinion Research 42 Franklin & Marshall College
129. Use or threaten to use a weapon to get something from someone.
Never 1 or 2 Times 3 or 4 Times5 or More
Times Spring 2012 88% 7% 2% 3% Spring 2011 89% 7% 2% 2% Spring 2010 86% 8% 2% 4% Spring 2009 87% 8% 2% 3%
Fall 2008 86% 8% 2% 4% Spring 2008 86% 7% 4% 3%
Fall 2007 86% 7% 3% 4% Spring 2007 87% 8% 3% 3%
Fall 2006 90% 5% 3% 2% 130. Steal something worth less than $50.
Never 1 or 2 Times 3 or 4 Times5 or More
Times Spring 2012 78% 15% 3% 4% Spring 2011 78% 16% 3% 4% Spring 2010 75% 16% 3% 6% Spring 2009 74% 17% 4% 5%
Fall 2008 74% 17% 4% 5% Spring 2008 76% 15% 4% 5%
Fall 2007 78% 13% 3% 6% Spring 2007 79% 15% 2% 4%
Fall 2006 80% 13% 3% 4% 131. Take part in a fight where a group of your friends is against another group.
Never 1 or 2 Times 3 or 4 Times5 or More
Times Spring 2012 73% 17% 6% 4% Spring 2011 73% 18% 5% 4% Spring 2010 69% 19% 5% 7% Spring 2009 68% 20% 6% 6%
Fall 2008 70% 19% 5% 5% Spring 2008 71% 17% 6% 5%
Fall 2007 70% 18% 6% 6% Spring 2007 68% 20% 6% 6%
Fall 2006 70% 19% 6% 5%
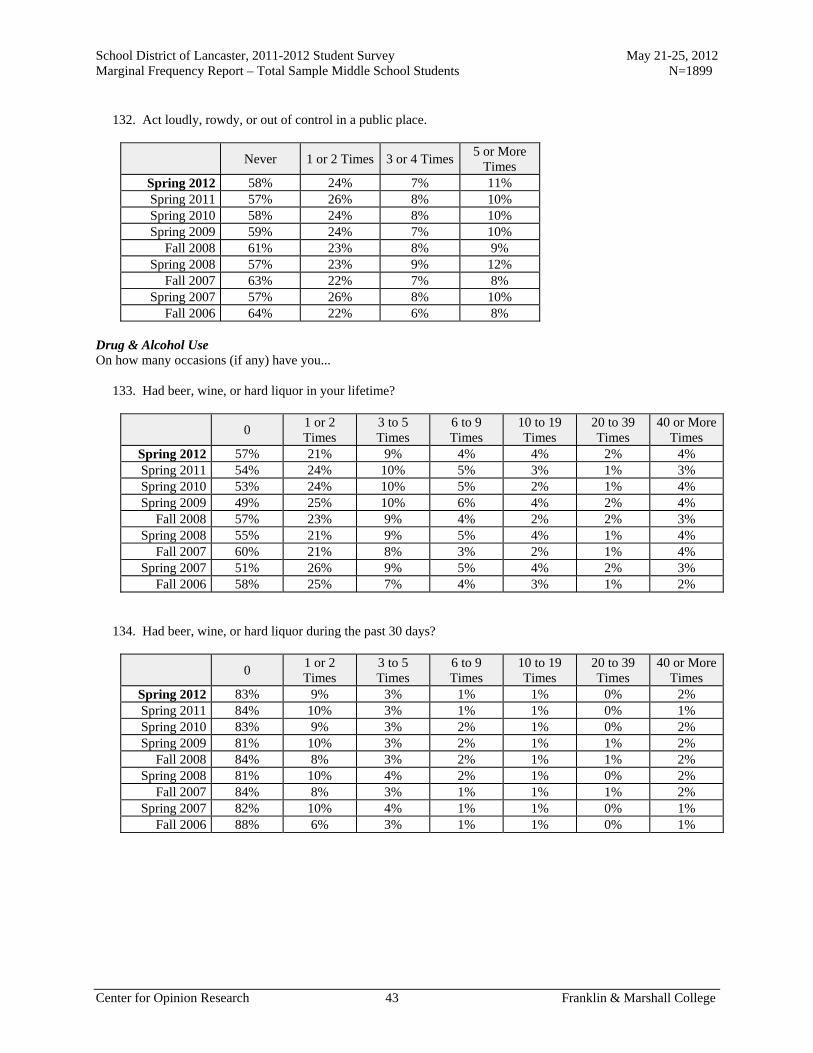
School District of Lancaster, 2011-2012 Student Survey May 21-25, 2012 Marginal Frequency Report – Total Sample Middle School Students N=1899
Center for Opinion Research 43 Franklin & Marshall College
132. Act loudly, rowdy, or out of control in a public place.
Never 1 or 2 Times 3 or 4 Times5 or More
Times Spring 2012 58% 24% 7% 11% Spring 2011 57% 26% 8% 10% Spring 2010 58% 24% 8% 10% Spring 2009 59% 24% 7% 10%
Fall 2008 61% 23% 8% 9% Spring 2008 57% 23% 9% 12%
Fall 2007 63% 22% 7% 8% Spring 2007 57% 26% 8% 10%
Fall 2006 64% 22% 6% 8% Drug & Alcohol Use On how many occasions (if any) have you... 133. Had beer, wine, or hard liquor in your lifetime?
0 1 or 2 Times
3 to 5 Times
6 to 9 Times
10 to 19 Times
20 to 39 Times
40 or More Times
Spring 2012 57% 21% 9% 4% 4% 2% 4% Spring 2011 54% 24% 10% 5% 3% 1% 3% Spring 2010 53% 24% 10% 5% 2% 1% 4% Spring 2009 49% 25% 10% 6% 4% 2% 4%
Fall 2008 57% 23% 9% 4% 2% 2% 3% Spring 2008 55% 21% 9% 5% 4% 1% 4%
Fall 2007 60% 21% 8% 3% 2% 1% 4% Spring 2007 51% 26% 9% 5% 4% 2% 3%
Fall 2006 58% 25% 7% 4% 3% 1% 2% 134. Had beer, wine, or hard liquor during the past 30 days?
0 1 or 2 Times
3 to 5 Times
6 to 9 Times
10 to 19 Times
20 to 39 Times
40 or More Times
Spring 2012 83% 9% 3% 1% 1% 0% 2% Spring 2011 84% 10% 3% 1% 1% 0% 1% Spring 2010 83% 9% 3% 2% 1% 0% 2% Spring 2009 81% 10% 3% 2% 1% 1% 2%
Fall 2008 84% 8% 3% 2% 1% 1% 2% Spring 2008 81% 10% 4% 2% 1% 0% 2%
Fall 2007 84% 8% 3% 1% 1% 1% 2% Spring 2007 82% 10% 4% 1% 1% 0% 1%
Fall 2006 88% 6% 3% 1% 1% 0% 1%

School District of Lancaster, 2011-2012 Student Survey May 21-25, 2012 Marginal Frequency Report – Total Sample Middle School Students N=1899
Center for Opinion Research 44 Franklin & Marshall College
135. Used marijuana in your lifetime?
0 1 or 2 Times
3 to 5 Times
6 to 9 Times
10 to 19 Times
20 to 39 Times
40 or More Times
Spring 2012 85% 5% 2% 2% 1% 1% 4% Spring 2011 85% 6% 3% 1% 1% 1% 3% Spring 2010 84% 6% 3% 2% 1% 1% 4% Spring 2009 87% 5% 2% 1% 1% 0% 4%
Fall 2008 88% 4% 2% 1% 1% 1% 3% Spring 2008 85% 4% 3% 2% 2% 1% 3%
Fall 2007 87% 4% 3% 1% 1% 1% 3% Spring 2007 88% 5% 2% 1% 1% 1% 2%
Fall 2006 90% 3% 2% 1% 1% 1% 2% 136. Used marijuana during the past 30 days?
0 1 or 2 Times
3 to 5 Times
6 to 9 Times
10 to 19 Times
20 to 39 Times
40 or More Times
Spring 2012 90% 3% 1% 1% 1% 1% 3% Spring 2011 91% 3% 2% 1% 1% 0% 1% Spring 2010 90% 2% 2% 2% 1% 1% 2% Spring 2009 92% 2% 1% 1% 0% 1% 3%
Fall 2008 92% 2% 1% 1% 1% 0% 2% Spring 2008 90% 3% 2% 2% 1% 0% 2%
Fall 2007 90% 3% 2% 1% 1% 1% 2% Spring 2007 93% 2% 1% 1% 0% 0% 1%
Fall 2006 94% 1% 1% 1% 1% 1% 1% How old were you when you first... 137. Had more than a sip or two of beer, wine, or hard liquor?
Never have
10 or younger
11 12 13 14 15 16 17 or older
Spring 2012
57% 16% 9% 8% 7% 2% 0% 0% 1%
Spring 2011 54% 16% 9% 9% 7% 4% 0% 0% 0% 138. Smoked marijuana?
Never have
10 or younger
11 12 13 14 15 16 17 or older
Spring 2012
87% 3% 2% 3% 3% 2% 0% 0% 1%
Spring 2011 85% 3% 2% 3% 4% 2% 0% 0% 0%

School District of Lancaster, 2011-2012 Student Survey May 21-25, 2012 Marginal Frequency Report – Total Sample Middle School Students N=1899
Center for Opinion Research 45 Franklin & Marshall College
139. Have you ever used smokeless tobacco (chew, snuff, plug, dipping tobacco, chewing tobacco)?
Never Once or
twice
Once in a while but
not regularly
Regularly in the past
Regularly now
Spring 2012 95% 3% 1% 0% 2% Spring 2011 95% 2% 1% 0% 1% Spring 2010 93% 3% 1% 1% 2% Spring 2009 93% 4% 1% 0% 2%
Fall 2008 93% 4% 1% 0% 2% 140. How frequently have you used smokeless tobacco during the past 30 days?
Never Once or
twice
Once or twice per
week
About once a day
More than once a day
Spring 2012 96% 1% 0% 0% 2% Spring 2011 96% 2% 1% 0% 1% Spring 2010 95% 2% 1% 1% 2% Spring 2009 95% 2% 1% 1% 2%
Fall 2008 96% 2% 1% 0% 2% 141. Have you ever smoked cigarettes?
Never Once or
twice
Once in a while but
not regularly
Regularly in the past
Regularly now
Spring 2012 84% 9% 3% 1% 2% Spring 2011 83% 11% 3% 1% 1% Spring 2010 80% 12% 3% 2% 2% Spring 2009 79% 13% 4% 2% 2%
Fall 2008 81% 12% 3% 2% 2% 142. How frequently have you smoked cigarettes during the past 30 days?
Not at all
Less than one
cigarette per day
One to five cigarettes per day
About one-half pack per day
About one pack per
day
About one and one-
half packs per day
Two packs or more per
day
Spring 2012 93% 3% 1% 1% 0% 0% 1% Spring 2011 94% 2% 2% 1% 0% 0% 1% Spring 2010 93% 2% 1% 1% 1% 0% 2% Spring 2009 92% 3% 1% 1% 0% 0% 2%
Fall 2008 92% 3% 2% 1% 0% 1% 1%
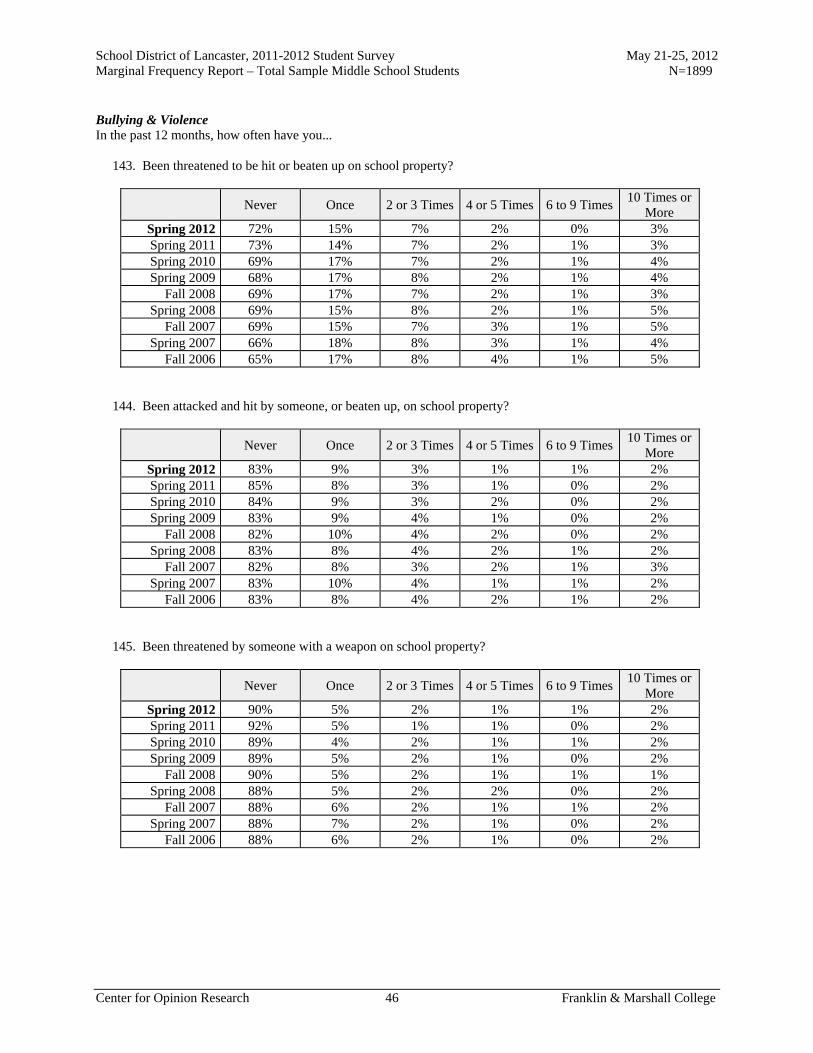
School District of Lancaster, 2011-2012 Student Survey May 21-25, 2012 Marginal Frequency Report – Total Sample Middle School Students N=1899
Center for Opinion Research 46 Franklin & Marshall College
Bullying & Violence In the past 12 months, how often have you... 143. Been threatened to be hit or beaten up on school property?
Never Once 2 or 3 Times 4 or 5 Times 6 to 9 Times 10 Times or
More Spring 2012 72% 15% 7% 2% 0% 3% Spring 2011 73% 14% 7% 2% 1% 3% Spring 2010 69% 17% 7% 2% 1% 4% Spring 2009 68% 17% 8% 2% 1% 4%
Fall 2008 69% 17% 7% 2% 1% 3% Spring 2008 69% 15% 8% 2% 1% 5%
Fall 2007 69% 15% 7% 3% 1% 5% Spring 2007 66% 18% 8% 3% 1% 4%
Fall 2006 65% 17% 8% 4% 1% 5% 144. Been attacked and hit by someone, or beaten up, on school property?
Never Once 2 or 3 Times 4 or 5 Times 6 to 9 Times 10 Times or
More Spring 2012 83% 9% 3% 1% 1% 2% Spring 2011 85% 8% 3% 1% 0% 2% Spring 2010 84% 9% 3% 2% 0% 2% Spring 2009 83% 9% 4% 1% 0% 2%
Fall 2008 82% 10% 4% 2% 0% 2% Spring 2008 83% 8% 4% 2% 1% 2%
Fall 2007 82% 8% 3% 2% 1% 3% Spring 2007 83% 10% 4% 1% 1% 2%
Fall 2006 83% 8% 4% 2% 1% 2% 145. Been threatened by someone with a weapon on school property?
Never Once 2 or 3 Times 4 or 5 Times 6 to 9 Times 10 Times or
More Spring 2012 90% 5% 2% 1% 1% 2% Spring 2011 92% 5% 1% 1% 0% 2% Spring 2010 89% 4% 2% 1% 1% 2% Spring 2009 89% 5% 2% 1% 0% 2%
Fall 2008 90% 5% 2% 1% 1% 1% Spring 2008 88% 5% 2% 2% 0% 2%
Fall 2007 88% 6% 2% 1% 1% 2% Spring 2007 88% 7% 2% 1% 0% 2%
Fall 2006 88% 6% 2% 1% 0% 2%

School District of Lancaster, 2011-2012 Student Survey May 21-25, 2012 Marginal Frequency Report – Total Sample Middle School Students N=1899
Center for Opinion Research 47 Franklin & Marshall College
146. Been attacked by someone with a weapon on school property?
Never Once 2 or 3 Times 4 or 5 Times 6 to 9 Times 10 Times or
More Spring 2012 92% 2% 1% 1% 0% 2% Spring 2011 95% 2% 1% 1% 0% 1% Spring 2010 92% 3% 1% 1% 1% 2% Spring 2009 93% 2% 1% 0% 0% 2%
Fall 2008 93% 3% 1% 1% 1% 2% Spring 2008 91% 3% 2% 1% 1% 1%
Fall 2007 90% 4% 1% 1% 1% 2% Spring 2007 93% 4% 2% 1% 0% 1%
Fall 2006 93% 3% 2% 1% 1% 1% Cyberbullying So far this school year, have you... 147. Received mean or nasty messages from someone?
No Yes, once or
twice Yes, every
so often Yes, all the
time Spring 2012 74% 20% 3% 3% Spring 2011 75% 19% 4% 3%
148. Received online messages that made you afraid for your safety?
No Yes, once or
twice Yes, every
so often Yes, all the
time Spring 2012 90% 6% 3% 2% Spring 2011 91% 6% 2% 2%
149. Had someone send or post gossip, rumors, or other hurtful material about you?
No Yes, once or
twice Yes, every
so often Yes, all the
time Spring 2012 76% 16% 4% 3% Spring 2011 76% 18% 4% 3%
150. Had someone share your personal secrets or pictures online without your permission?
No Yes, once or
twice Yes, every
so often Yes, all the
time Spring 2012 85% 10% 2% 3% Spring 2011 89% 8% 1% 2%

School District of Lancaster, 2011-2012 Student Survey May 21-25, 2012 Marginal Frequency Report – Total Sample Middle School Students N=1899
Center for Opinion Research 48 Franklin & Marshall College
151. Do you use the Internet at home, or not?
Yes No Spring 2012 89% 11% Spring 2011 90% 10%
152. How many hours do you normally spend online using the Internet each day?
Less than 1
hour 1 hour 2 hours 3 hours
4 or more hours
Spring 2012 27% 17% 19% 12% 26% Spring 2011 24% 20% 23% 11% 22%

Report Q
Marginal Frequency Report Hand Middle School
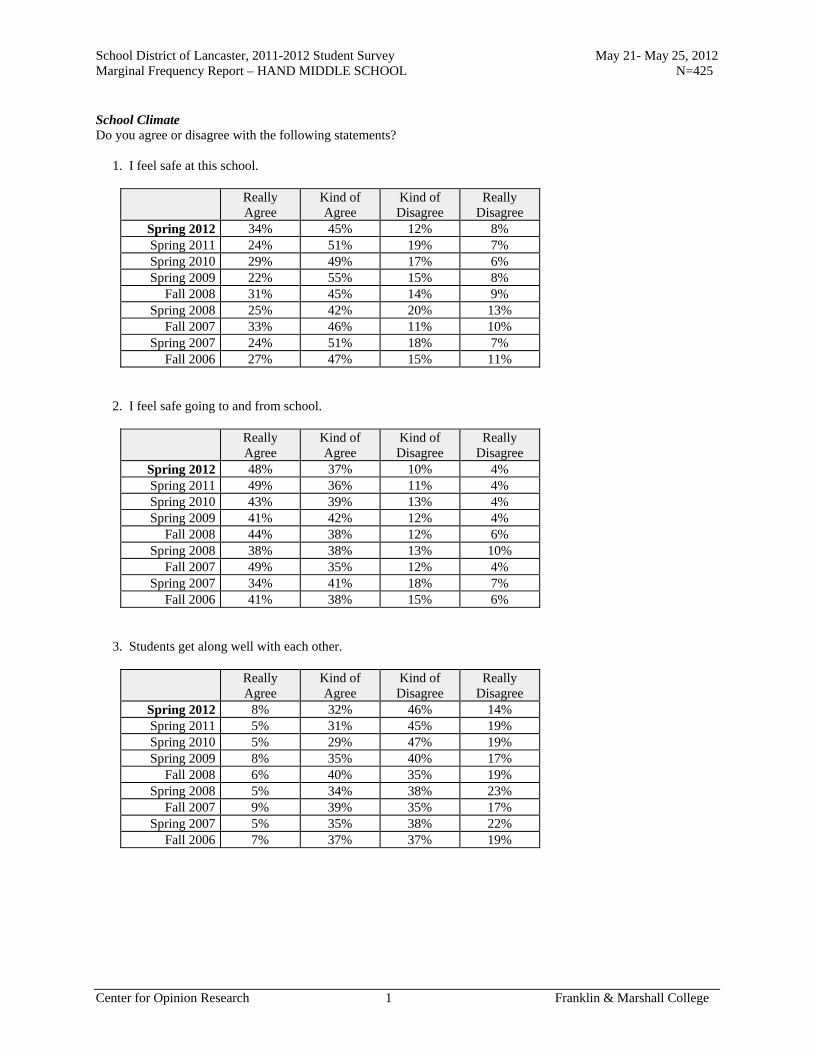
School District of Lancaster, 2011-2012 Student Survey May 21- May 25, 2012 Marginal Frequency Report – HAND MIDDLE SCHOOL N=425
Center for Opinion Research 1 Franklin & Marshall College
School Climate Do you agree or disagree with the following statements? 1. I feel safe at this school.
Really Agree
Kind of Agree
Kind of Disagree
Really Disagree
Spring 2012 34% 45% 12% 8% Spring 2011 24% 51% 19% 7% Spring 2010 29% 49% 17% 6% Spring 2009 22% 55% 15% 8%
Fall 2008 31% 45% 14% 9% Spring 2008 25% 42% 20% 13%
Fall 2007 33% 46% 11% 10% Spring 2007 24% 51% 18% 7%
Fall 2006 27% 47% 15% 11% 2. I feel safe going to and from school.
Really Agree
Kind of Agree
Kind of Disagree
Really Disagree
Spring 2012 48% 37% 10% 4% Spring 2011 49% 36% 11% 4% Spring 2010 43% 39% 13% 4% Spring 2009 41% 42% 12% 4%
Fall 2008 44% 38% 12% 6% Spring 2008 38% 38% 13% 10%
Fall 2007 49% 35% 12% 4% Spring 2007 34% 41% 18% 7%
Fall 2006 41% 38% 15% 6% 3. Students get along well with each other.
Really Agree
Kind of Agree
Kind of Disagree
Really Disagree
Spring 2012 8% 32% 46% 14% Spring 2011 5% 31% 45% 19% Spring 2010 5% 29% 47% 19% Spring 2009 8% 35% 40% 17%
Fall 2008 6% 40% 35% 19% Spring 2008 5% 34% 38% 23%
Fall 2007 9% 39% 35% 17% Spring 2007 5% 35% 38% 22%
Fall 2006 7% 37% 37% 19%

School District of Lancaster, 2011-2012 Student Survey May 21- May 25, 2012 Marginal Frequency Report – HAND MIDDLE SCHOOL N=425
Center for Opinion Research 2 Franklin & Marshall College
4. Students get along well with teachers.
Really Agree
Kind of Agree
Kind of Disagree
Really Disagree
Spring 2012 7% 36% 43% 14% Spring 2011 3% 30% 45% 21% Spring 2010 4% 26% 48% 22% Spring 2009 7% 30% 40% 22%
Fall 2008 9% 36% 35% 19% Spring 2008 7% 33% 40% 20%
Fall 2007 14% 41% 31% 15% Spring 2007 8% 39% 36% 17%
Fall 2006 9% 44% 30% 16% 5. I like my school.
Really Agree
Kind of Agree
Kind of Disagree
Really Disagree
Spring 2012 34% 42% 12% 12% Spring 2011 20% 43% 19% 18% Spring 2010 25% 44% 18% 12% Spring 2009 25% 44% 19% 12%
Fall 2008 30% 37% 16% 17% Spring 2008 25% 38% 18% 19%
Fall 2007 33% 36% 17% 14% Spring 2007 25% 39% 21% 15%
Fall 2006 30% 37% 17% 15% 6. I like my teachers.
Really Agree
Kind of Agree
Kind of Disagree
Really Disagree
Spring 2012 35% 41% 17% 6% Spring 2011 22% 47% 21% 10% Spring 2010 25% 44% 21% 10% Spring 2009 23% 46% 20% 11%
Fall 2008 30% 43% 16% 10% Spring 2008 24% 41% 20% 15%
Fall 2007 33% 41% 17% 8% Spring 2007 29% 49% 15% 6%
Fall 2006 31% 42% 19% 8%

School District of Lancaster, 2011-2012 Student Survey May 21- May 25, 2012 Marginal Frequency Report – HAND MIDDLE SCHOOL N=425
Center for Opinion Research 3 Franklin & Marshall College
7. There is a teacher or some other adult at this school who really cares about me.
Really Agree
Kind of Agree
Kind of Disagree
Really Disagree
Spring 2012 48% 33% 14% 6% Spring 2011 46% 35% 12% 7% Spring 2010 46% 36% 12% 7% Spring 2009 37% 38% 15% 10%
Fall 2008 36% 36% 18% 10% Spring 2008 31% 38% 18% 13%
Fall 2007 43% 37% 11% 8% Spring 2007 43% 33% 16% 8%
Fall 2006 42% 34% 14% 11% 8. There is a teacher or some other adult at this school who cares when I am not here.
Really Agree
Kind of Agree
Kind of Disagree
Really Disagree
Spring 2012 27% 33% 23% 17% Spring 2011 24% 34% 26% 16% Spring 2010 26% 35% 25% 14% Spring 2009 25% 32% 24% 19%
Fall 2008 27% 34% 22% 17% Spring 2008 21% 37% 21% 21%
Fall 2007 28% 36% 22% 15% Spring 2007 23% 40% 23% 14%
Fall 2006 23% 34% 23% 21% 9. There is a teacher or some other adult at this school who listens to me when I have something to say.
Really Agree
Kind of Agree
Kind of Disagree
Really Disagree
Spring 2012 42% 38% 15% 5% Spring 2011 39% 40% 13% 7% Spring 2010 40% 36% 17% 6% Spring 2009 34% 38% 17% 11%
Fall 2008 40% 34% 16% 10% Spring 2008 32% 36% 19% 13%
Fall 2007 41% 35% 14% 9% Spring 2007 41% 34% 17% 7%
Fall 2006 40% 30% 20% 9%

School District of Lancaster, 2011-2012 Student Survey May 21- May 25, 2012 Marginal Frequency Report – HAND MIDDLE SCHOOL N=425
Center for Opinion Research 4 Franklin & Marshall College
10. There is a teacher or some other adult at this school who tells me when I do a good job.
Really Agree
Kind of Agree
Kind of Disagree
Really Disagree
Spring 2012 54% 34% 6% 6% Spring 2011 54% 34% 9% 3% Spring 2010 51% 40% 6% 3% Spring 2009 48% 36% 10% 7%
Fall 2008 60% 27% 8% 6% Spring 2008 39% 41% 12% 8%
Fall 2007 55% 31% 10% 4% Spring 2007 51% 37% 10% 2%
Fall 2006 53% 36% 8% 3% 11. There is a teacher or some other adult at this school who always wants me to do my best.
Really Agree
Kind of Agree
Kind of Disagree
Really Disagree
Spring 2012 62% 30% 5% 3% Spring 2011 62% 28% 7% 2% Spring 2010 60% 33% 5% 1% Spring 2009 56% 30% 9% 6%
Fall 2008 61% 27% 8% 4% Spring 2008 53% 33% 5% 8%
Fall 2007 66% 27% 4% 3% Spring 2007 66% 25% 6% 2%
Fall 2006 67% 26% 5% 2% 12. There is a teacher or some other adult at this school who believes that I will be a success.
Really Agree
Kind of Agree
Kind of Disagree
Really Disagree
Spring 2012 53% 37% 7% 4% Spring 2011 52% 36% 9% 3% Spring 2010 52% 37% 8% 2% Spring 2009 47% 36% 10% 7%
Fall 2008 55% 31% 8% 5% Spring 2008 47% 35% 9% 9%
Fall 2007 62% 25% 7% 6% Spring 2007 56% 31% 9% 4%
Fall 2006 54% 29% 11% 5%

School District of Lancaster, 2011-2012 Student Survey May 21- May 25, 2012 Marginal Frequency Report – HAND MIDDLE SCHOOL N=425
Center for Opinion Research 5 Franklin & Marshall College
13. Students in this school really listen to teachers.
Really Agree
Kind of Agree
Kind of Disagree
Really Disagree
Spring 2012 5% 21% 50% 24% Spring 2011 4% 16% 45% 35% Spring 2010 3% 17% 55% 26% Spring 2009 5% 24% 44% 27%
Fall 2008 5% 24% 46% 26% Spring 2008 3% 23% 42% 32%
Fall 2007 8% 30% 38% 24% Spring 2007 1% 28% 39% 32%
Fall 2006 5% 26% 40% 29% 14. Most teachers make learning interesting.
Really Agree
Kind of Agree
Kind of Disagree
Really Disagree
Spring 2012 22% 41% 27% 10% Spring 2011 15% 40% 30% 15% Spring 2010 13% 46% 29% 11% Spring 2009 12% 46% 29% 12%
Fall 2008 26% 43% 21% 10% Spring 2008 19% 35% 28% 18%
Fall 2007 25% 42% 22% 12% Spring 2007 15% 53% 23% 9%
Fall 2006 25% 43% 23% 9% 15. This school is always getting better.
Really Agree
Kind of Agree
Kind of Disagree
Really Disagree
Spring 2012 18% 38% 27% 17% Spring 2011 8% 24% 34% 34% Spring 2010 9% 32% 36% 23% Spring 2009 11% 24% 40% 25%
Fall 2008 18% 27% 33% 21% Spring 2008 12% 26% 33% 29%
Fall 2007 16% 31% 32% 22% Spring 2007 9% 31% 35% 25%
Fall 2006 12% 37% 30% 22%

School District of Lancaster, 2011-2012 Student Survey May 21- May 25, 2012 Marginal Frequency Report – HAND MIDDLE SCHOOL N=425
Center for Opinion Research 6 Franklin & Marshall College
Food Services How would you rate the lunch you receive at school on each of the following? 16. The amount of food
Really Good Kind of Good
Kind of Bad Really Bad
Spring 2012 15% 42% 25% 18% Spring 2011 8% 36% 27% 29%
17. The flavor of the food
Really Good Kind of Good
Kind of Bad Really Bad
Spring 2012 9% 30% 36% 25% Spring 2011 5% 29% 34% 32%
18. The variety of food you receive each week
Really Good Kind of Good
Kind of Bad Really Bad
Spring 2012 14% 38% 28% 20% Spring 2011 10% 28% 35% 27%
19. The temperature of the food
Really Good Kind of Good
Kind of Bad Really Bad
Spring 2012 22% 39% 26% 13% Spring 2011 21% 38% 25% 16%
20. The cleanliness of the cafeteria
Really Good Kind of Good
Kind of Bad Really Bad
Spring 2012 15% 34% 30% 21% Spring 2011 7% 22% 32% 39%
21. The amount of time you have to eat.
Really Good Kind of Good
Kind of Bad Really Bad
Spring 2012 18% 32% 28% 22% Spring 2011 15% 28% 30% 27%

School District of Lancaster, 2011-2012 Student Survey May 21- May 25, 2012 Marginal Frequency Report – HAND MIDDLE SCHOOL N=425
Center for Opinion Research 7 Franklin & Marshall College
Readiness and Emergency Management 22. Has anyone from your school spoken with you about what to do in the event of a school emergency, or not?
Yes No Spring 2012 85% 15% Spring 2011 79% 21%
Do you agree or disagree with the following statement? 23. I know what to do if there is a school emergency.
Really Agree
Kind of Agree
Kind of Disagree
Really Disagree
Spring 2012 64% 29% 5% 2% Spring 2011 51% 40% 6% 3%
Peer Academic Climate Do you agree or disagree with the following statements? 24. Most of my friends want to do well at school.
Really Agree
Kind of Agree
Kind of Disagree
Really Disagree
Spring 2012 34% 49% 14% 3% Spring 2011 28% 49% 18% 5% Spring 2010 27% 47% 21% 5% Spring 2009 28% 46% 18% 7%
Fall 2008 35% 44% 15% 6% Spring 2008 34% 44% 16% 6%
Fall 2007 35% 46% 13% 6% Spring 2007 38% 43% 14% 4%
Fall 2006 44% 40% 12% 4% 25. Most of my friends want to go to college.
Really Agree
Kind of Agree
Kind of Disagree
Really Disagree
Spring 2012 35% 48% 13% 4% Spring 2011 33% 44% 19% 4% Spring 2010 31% 45% 20% 4% Spring 2009 36% 40% 18% 6%
Fall 2008 42% 39% 14% 5% Spring 2008 39% 42% 12% 7%
Fall 2007 44% 35% 16% 5% Spring 2007 46% 38% 12% 3%
Fall 2006 49% 36% 11% 4%
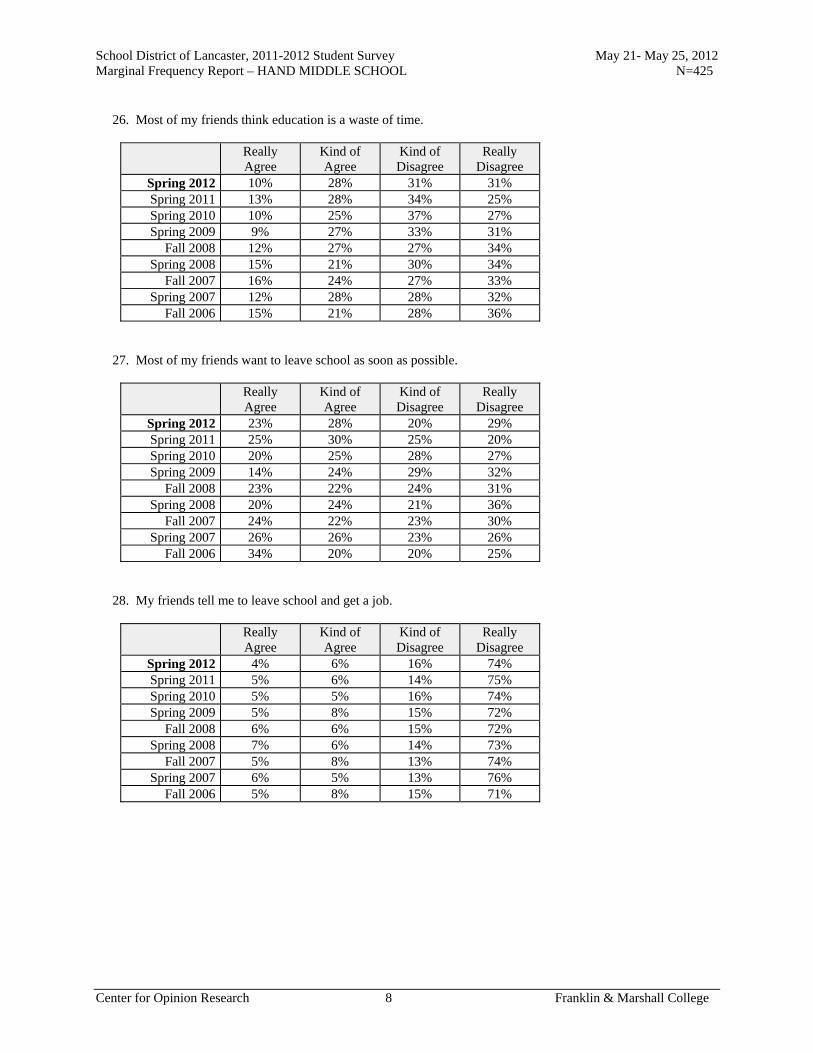
School District of Lancaster, 2011-2012 Student Survey May 21- May 25, 2012 Marginal Frequency Report – HAND MIDDLE SCHOOL N=425
Center for Opinion Research 8 Franklin & Marshall College
26. Most of my friends think education is a waste of time.
Really Agree
Kind of Agree
Kind of Disagree
Really Disagree
Spring 2012 10% 28% 31% 31% Spring 2011 13% 28% 34% 25% Spring 2010 10% 25% 37% 27% Spring 2009 9% 27% 33% 31%
Fall 2008 12% 27% 27% 34% Spring 2008 15% 21% 30% 34%
Fall 2007 16% 24% 27% 33% Spring 2007 12% 28% 28% 32%
Fall 2006 15% 21% 28% 36% 27. Most of my friends want to leave school as soon as possible.
Really Agree
Kind of Agree
Kind of Disagree
Really Disagree
Spring 2012 23% 28% 20% 29% Spring 2011 25% 30% 25% 20% Spring 2010 20% 25% 28% 27% Spring 2009 14% 24% 29% 32%
Fall 2008 23% 22% 24% 31% Spring 2008 20% 24% 21% 36%
Fall 2007 24% 22% 23% 30% Spring 2007 26% 26% 23% 26%
Fall 2006 34% 20% 20% 25% 28. My friends tell me to leave school and get a job.
Really Agree
Kind of Agree
Kind of Disagree
Really Disagree
Spring 2012 4% 6% 16% 74% Spring 2011 5% 6% 14% 75% Spring 2010 5% 5% 16% 74% Spring 2009 5% 8% 15% 72%
Fall 2008 6% 6% 15% 72% Spring 2008 7% 6% 14% 73%
Fall 2007 5% 8% 13% 74% Spring 2007 6% 5% 13% 76%
Fall 2006 5% 8% 15% 71%
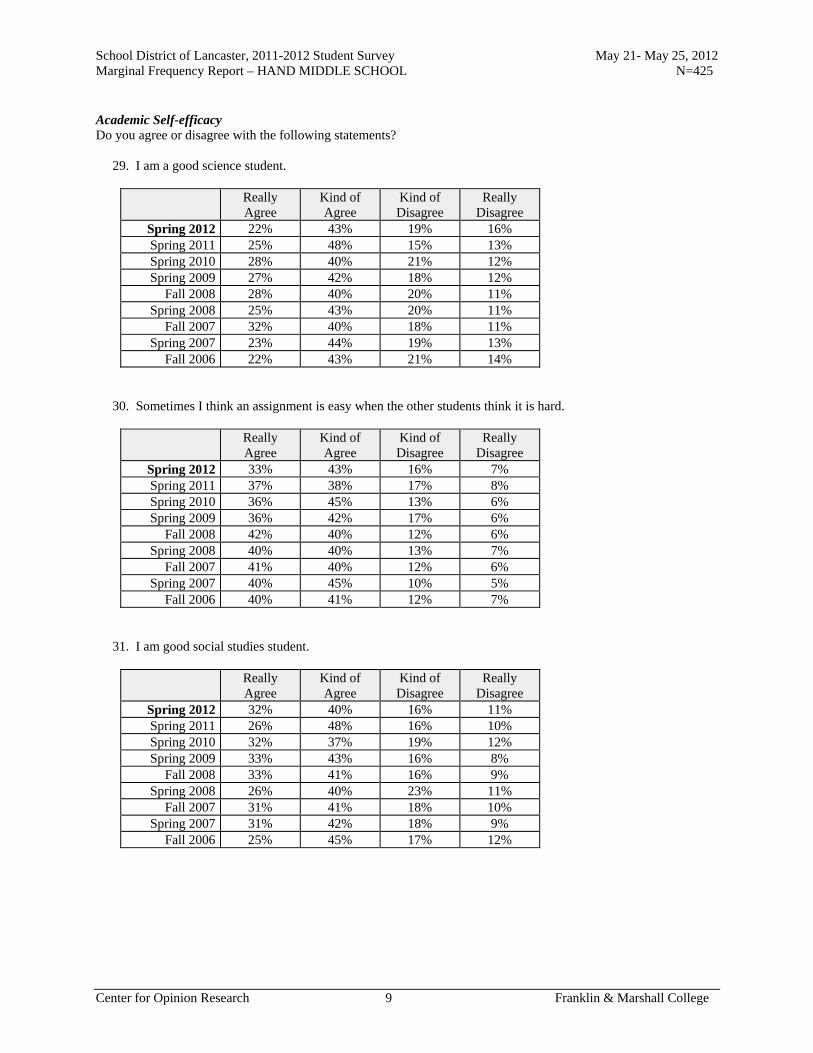
School District of Lancaster, 2011-2012 Student Survey May 21- May 25, 2012 Marginal Frequency Report – HAND MIDDLE SCHOOL N=425
Center for Opinion Research 9 Franklin & Marshall College
Academic Self-efficacy Do you agree or disagree with the following statements? 29. I am a good science student.
Really Agree
Kind of Agree
Kind of Disagree
Really Disagree
Spring 2012 22% 43% 19% 16% Spring 2011 25% 48% 15% 13% Spring 2010 28% 40% 21% 12% Spring 2009 27% 42% 18% 12%
Fall 2008 28% 40% 20% 11% Spring 2008 25% 43% 20% 11%
Fall 2007 32% 40% 18% 11% Spring 2007 23% 44% 19% 13%
Fall 2006 22% 43% 21% 14% 30. Sometimes I think an assignment is easy when the other students think it is hard.
Really Agree
Kind of Agree
Kind of Disagree
Really Disagree
Spring 2012 33% 43% 16% 7% Spring 2011 37% 38% 17% 8% Spring 2010 36% 45% 13% 6% Spring 2009 36% 42% 17% 6%
Fall 2008 42% 40% 12% 6% Spring 2008 40% 40% 13% 7%
Fall 2007 41% 40% 12% 6% Spring 2007 40% 45% 10% 5%
Fall 2006 40% 41% 12% 7% 31. I am good social studies student.
Really Agree
Kind of Agree
Kind of Disagree
Really Disagree
Spring 2012 32% 40% 16% 11% Spring 2011 26% 48% 16% 10% Spring 2010 32% 37% 19% 12% Spring 2009 33% 43% 16% 8%
Fall 2008 33% 41% 16% 9% Spring 2008 26% 40% 23% 11%
Fall 2007 31% 41% 18% 10% Spring 2007 31% 42% 18% 9%
Fall 2006 25% 45% 17% 12%

School District of Lancaster, 2011-2012 Student Survey May 21- May 25, 2012 Marginal Frequency Report – HAND MIDDLE SCHOOL N=425
Center for Opinion Research 10 Franklin & Marshall College
32. My teacher thinks I am smart.
Really Agree
Kind of Agree
Kind of Disagree
Really Disagree
Spring 2012 46% 41% 7% 5% Spring 2011 45% 42% 10% 3% Spring 2010 49% 38% 10% 3% Spring 2009 44% 39% 10% 7%
Fall 2008 50% 34% 11% 5% Spring 2008 44% 36% 11% 10%
Fall 2007 53% 28% 14% 6% Spring 2007 42% 40% 10% 7%
Fall 2006 36% 42% 16% 6% 33. I am a good math student.
Really Agree
Kind of Agree
Kind of Disagree
Really Disagree
Spring 2012 44% 34% 14% 8% Spring 2011 36% 38% 16% 10% Spring 2010 46% 36% 11% 7% Spring 2009 46% 36% 12% 7%
Fall 2008 50% 36% 9% 6% Spring 2008 46% 32% 13% 8%
Fall 2007 52% 31% 10% 6% Spring 2007 47% 33% 12% 9%
Fall 2006 43% 33% 14% 9% 34. My classmates usually get better grades than I do.
Really Agree
Kind of Agree
Kind of Disagree
Really Disagree
Spring 2012 14% 31% 40% 15% Spring 2011 14% 32% 40% 14% Spring 2010 10% 37% 41% 13% Spring 2009 10% 36% 37% 16%
Fall 2008 12% 34% 34% 20% Spring 2008 14% 32% 33% 21%
Fall 2007 13% 33% 34% 20% Spring 2007 15% 33% 37% 16%
Fall 2006 19% 35% 29% 17%
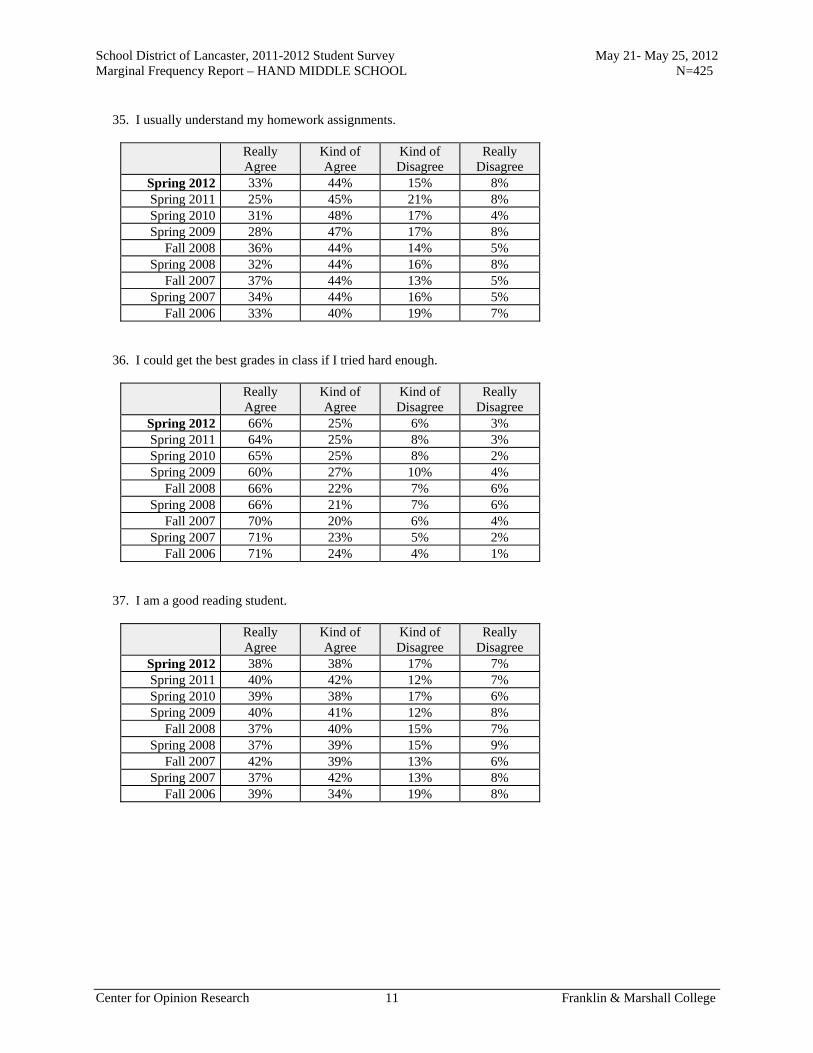
School District of Lancaster, 2011-2012 Student Survey May 21- May 25, 2012 Marginal Frequency Report – HAND MIDDLE SCHOOL N=425
Center for Opinion Research 11 Franklin & Marshall College
35. I usually understand my homework assignments.
Really Agree
Kind of Agree
Kind of Disagree
Really Disagree
Spring 2012 33% 44% 15% 8% Spring 2011 25% 45% 21% 8% Spring 2010 31% 48% 17% 4% Spring 2009 28% 47% 17% 8%
Fall 2008 36% 44% 14% 5% Spring 2008 32% 44% 16% 8%
Fall 2007 37% 44% 13% 5% Spring 2007 34% 44% 16% 5%
Fall 2006 33% 40% 19% 7% 36. I could get the best grades in class if I tried hard enough.
Really Agree
Kind of Agree
Kind of Disagree
Really Disagree
Spring 2012 66% 25% 6% 3% Spring 2011 64% 25% 8% 3% Spring 2010 65% 25% 8% 2% Spring 2009 60% 27% 10% 4%
Fall 2008 66% 22% 7% 6% Spring 2008 66% 21% 7% 6%
Fall 2007 70% 20% 6% 4% Spring 2007 71% 23% 5% 2%
Fall 2006 71% 24% 4% 1% 37. I am a good reading student.
Really Agree
Kind of Agree
Kind of Disagree
Really Disagree
Spring 2012 38% 38% 17% 7% Spring 2011 40% 42% 12% 7% Spring 2010 39% 38% 17% 6% Spring 2009 40% 41% 12% 8%
Fall 2008 37% 40% 15% 7% Spring 2008 37% 39% 15% 9%
Fall 2007 42% 39% 13% 6% Spring 2007 37% 42% 13% 8%
Fall 2006 39% 34% 19% 8%
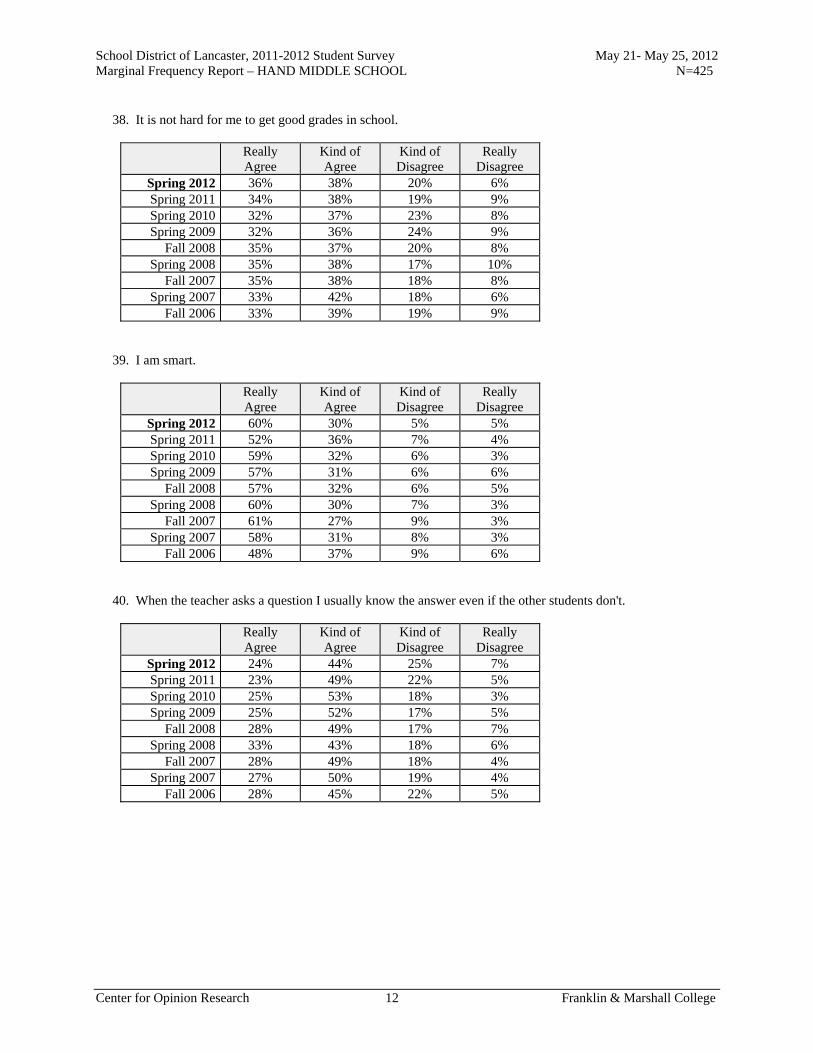
School District of Lancaster, 2011-2012 Student Survey May 21- May 25, 2012 Marginal Frequency Report – HAND MIDDLE SCHOOL N=425
Center for Opinion Research 12 Franklin & Marshall College
38. It is not hard for me to get good grades in school.
Really Agree
Kind of Agree
Kind of Disagree
Really Disagree
Spring 2012 36% 38% 20% 6% Spring 2011 34% 38% 19% 9% Spring 2010 32% 37% 23% 8% Spring 2009 32% 36% 24% 9%
Fall 2008 35% 37% 20% 8% Spring 2008 35% 38% 17% 10%
Fall 2007 35% 38% 18% 8% Spring 2007 33% 42% 18% 6%
Fall 2006 33% 39% 19% 9% 39. I am smart.
Really Agree
Kind of Agree
Kind of Disagree
Really Disagree
Spring 2012 60% 30% 5% 5% Spring 2011 52% 36% 7% 4% Spring 2010 59% 32% 6% 3% Spring 2009 57% 31% 6% 6%
Fall 2008 57% 32% 6% 5% Spring 2008 60% 30% 7% 3%
Fall 2007 61% 27% 9% 3% Spring 2007 58% 31% 8% 3%
Fall 2006 48% 37% 9% 6% 40. When the teacher asks a question I usually know the answer even if the other students don't.
Really Agree
Kind of Agree
Kind of Disagree
Really Disagree
Spring 2012 24% 44% 25% 7% Spring 2011 23% 49% 22% 5% Spring 2010 25% 53% 18% 3% Spring 2009 25% 52% 17% 5%
Fall 2008 28% 49% 17% 7% Spring 2008 33% 43% 18% 6%
Fall 2007 28% 49% 18% 4% Spring 2007 27% 50% 19% 4%
Fall 2006 28% 45% 22% 5%
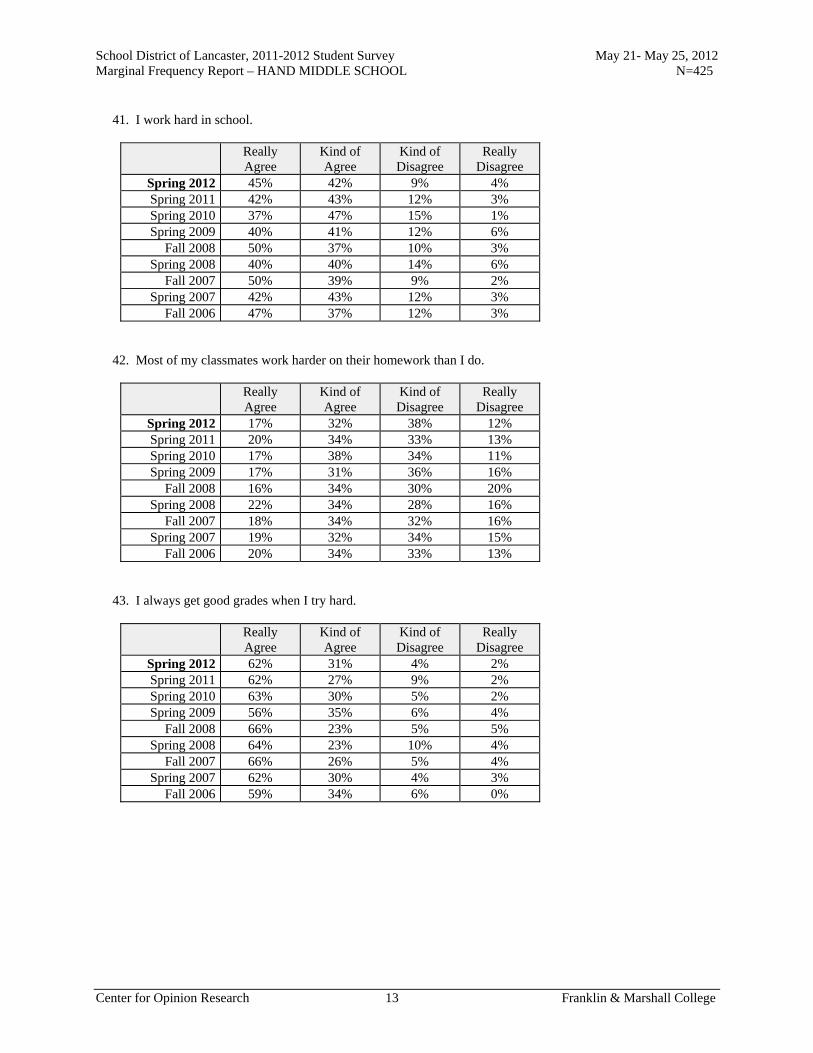
School District of Lancaster, 2011-2012 Student Survey May 21- May 25, 2012 Marginal Frequency Report – HAND MIDDLE SCHOOL N=425
Center for Opinion Research 13 Franklin & Marshall College
41. I work hard in school.
Really Agree
Kind of Agree
Kind of Disagree
Really Disagree
Spring 2012 45% 42% 9% 4% Spring 2011 42% 43% 12% 3% Spring 2010 37% 47% 15% 1% Spring 2009 40% 41% 12% 6%
Fall 2008 50% 37% 10% 3% Spring 2008 40% 40% 14% 6%
Fall 2007 50% 39% 9% 2% Spring 2007 42% 43% 12% 3%
Fall 2006 47% 37% 12% 3% 42. Most of my classmates work harder on their homework than I do.
Really Agree
Kind of Agree
Kind of Disagree
Really Disagree
Spring 2012 17% 32% 38% 12% Spring 2011 20% 34% 33% 13% Spring 2010 17% 38% 34% 11% Spring 2009 17% 31% 36% 16%
Fall 2008 16% 34% 30% 20% Spring 2008 22% 34% 28% 16%
Fall 2007 18% 34% 32% 16% Spring 2007 19% 32% 34% 15%
Fall 2006 20% 34% 33% 13% 43. I always get good grades when I try hard.
Really Agree
Kind of Agree
Kind of Disagree
Really Disagree
Spring 2012 62% 31% 4% 2% Spring 2011 62% 27% 9% 2% Spring 2010 63% 30% 5% 2% Spring 2009 56% 35% 6% 4%
Fall 2008 66% 23% 5% 5% Spring 2008 64% 23% 10% 4%
Fall 2007 66% 26% 5% 4% Spring 2007 62% 30% 4% 3%
Fall 2006 59% 34% 6% 0%

School District of Lancaster, 2011-2012 Student Survey May 21- May 25, 2012 Marginal Frequency Report – HAND MIDDLE SCHOOL N=425
Center for Opinion Research 14 Franklin & Marshall College
44. I usually do not get good grades in math because it is too hard.
Really Agree
Kind of Agree
Kind of Disagree
Really Disagree
Spring 2012 12% 20% 28% 39% Spring 2011 15% 27% 27% 31% Spring 2010 10% 19% 34% 37% Spring 2009 10% 19% 33% 38%
Fall 2008 10% 20% 26% 44% Spring 2008 13% 19% 26% 42%
Fall 2007 10% 20% 29% 42% Spring 2007 12% 21% 24% 44%
Fall 2006 12% 25% 28% 36% 45. Most of my classmates like to do math because it is easy.
Really Agree
Kind of Agree
Kind of Disagree
Really Disagree
Spring 2012 29% 39% 22% 11% Spring 2011 24% 38% 28% 10% Spring 2010 28% 37% 25% 11% Spring 2009 24% 35% 28% 13%
Fall 2008 34% 37% 17% 12% Spring 2008 28% 32% 24% 15%
Fall 2007 31% 34% 24% 12% Spring 2007 27% 37% 25% 11%
Fall 2006 29% 34% 28% 9% 46. I would get better grades if my teacher liked me more.
Really Agree
Kind of Agree
Kind of Disagree
Really Disagree
Spring 2012 11% 14% 25% 50% Spring 2011 10% 14% 30% 46% Spring 2010 9% 14% 31% 46% Spring 2009 8% 15% 32% 45%
Fall 2008 15% 14% 25% 46% Spring 2008 12% 17% 26% 45%
Fall 2007 14% 17% 24% 45% Spring 2007 12% 14% 26% 48%
Fall 2006 14% 19% 25% 42%
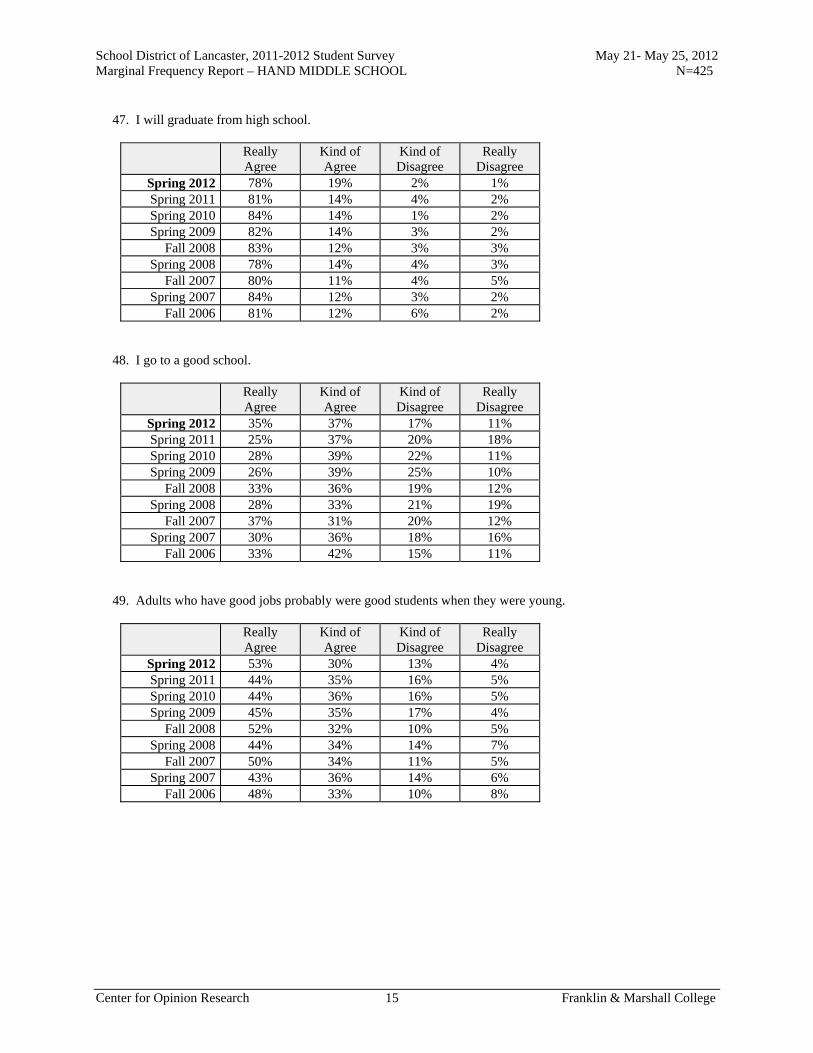
School District of Lancaster, 2011-2012 Student Survey May 21- May 25, 2012 Marginal Frequency Report – HAND MIDDLE SCHOOL N=425
Center for Opinion Research 15 Franklin & Marshall College
47. I will graduate from high school.
Really Agree
Kind of Agree
Kind of Disagree
Really Disagree
Spring 2012 78% 19% 2% 1% Spring 2011 81% 14% 4% 2% Spring 2010 84% 14% 1% 2% Spring 2009 82% 14% 3% 2%
Fall 2008 83% 12% 3% 3% Spring 2008 78% 14% 4% 3%
Fall 2007 80% 11% 4% 5% Spring 2007 84% 12% 3% 2%
Fall 2006 81% 12% 6% 2% 48. I go to a good school.
Really Agree
Kind of Agree
Kind of Disagree
Really Disagree
Spring 2012 35% 37% 17% 11% Spring 2011 25% 37% 20% 18% Spring 2010 28% 39% 22% 11% Spring 2009 26% 39% 25% 10%
Fall 2008 33% 36% 19% 12% Spring 2008 28% 33% 21% 19%
Fall 2007 37% 31% 20% 12% Spring 2007 30% 36% 18% 16%
Fall 2006 33% 42% 15% 11% 49. Adults who have good jobs probably were good students when they were young.
Really Agree
Kind of Agree
Kind of Disagree
Really Disagree
Spring 2012 53% 30% 13% 4% Spring 2011 44% 35% 16% 5% Spring 2010 44% 36% 16% 5% Spring 2009 45% 35% 17% 4%
Fall 2008 52% 32% 10% 5% Spring 2008 44% 34% 14% 7%
Fall 2007 50% 34% 11% 5% Spring 2007 43% 36% 14% 6%
Fall 2006 48% 33% 10% 8%

School District of Lancaster, 2011-2012 Student Survey May 21- May 25, 2012 Marginal Frequency Report – HAND MIDDLE SCHOOL N=425
Center for Opinion Research 16 Franklin & Marshall College
50. When I am old enough, I will go to college.
Really Agree
Kind of Agree
Kind of Disagree
Really Disagree
Spring 2012 70% 19% 6% 6% Spring 2011 69% 22% 5% 4% Spring 2010 70% 19% 6% 4% Spring 2009 69% 20% 6% 5%
Fall 2008 72% 19% 5% 4% Spring 2008 70% 20% 6% 4%
Fall 2007 77% 13% 7% 4% Spring 2007 73% 16% 7% 4%
Fall 2006 71% 19% 5% 5% 51. No one cares if I do well in school.
Really Agree
Kind of Agree
Kind of Disagree
Really Disagree
Spring 2012 8% 11% 20% 60% Spring 2011 7% 12% 19% 61% Spring 2010 4% 11% 25% 60% Spring 2009 5% 10% 25% 60%
Fall 2008 5% 10% 19% 65% Spring 2008 10% 12% 22% 55%
Fall 2007 9% 11% 18% 61% Spring 2007 6% 13% 19% 62%
Fall 2006 8% 11% 23% 59% 52. What I learn in school is not important.
Really Agree
Kind of Agree
Kind of Disagree
Really Disagree
Spring 2012 6% 8% 25% 62% Spring 2011 5% 8% 18% 69% Spring 2010 4% 6% 20% 70% Spring 2009 6% 9% 21% 64%
Fall 2008 6% 9% 13% 73% Spring 2008 11% 11% 18% 60%
Fall 2007 11% 8% 16% 65% Spring 2007 8% 7% 15% 70%
Fall 2006 7% 6% 17% 71%
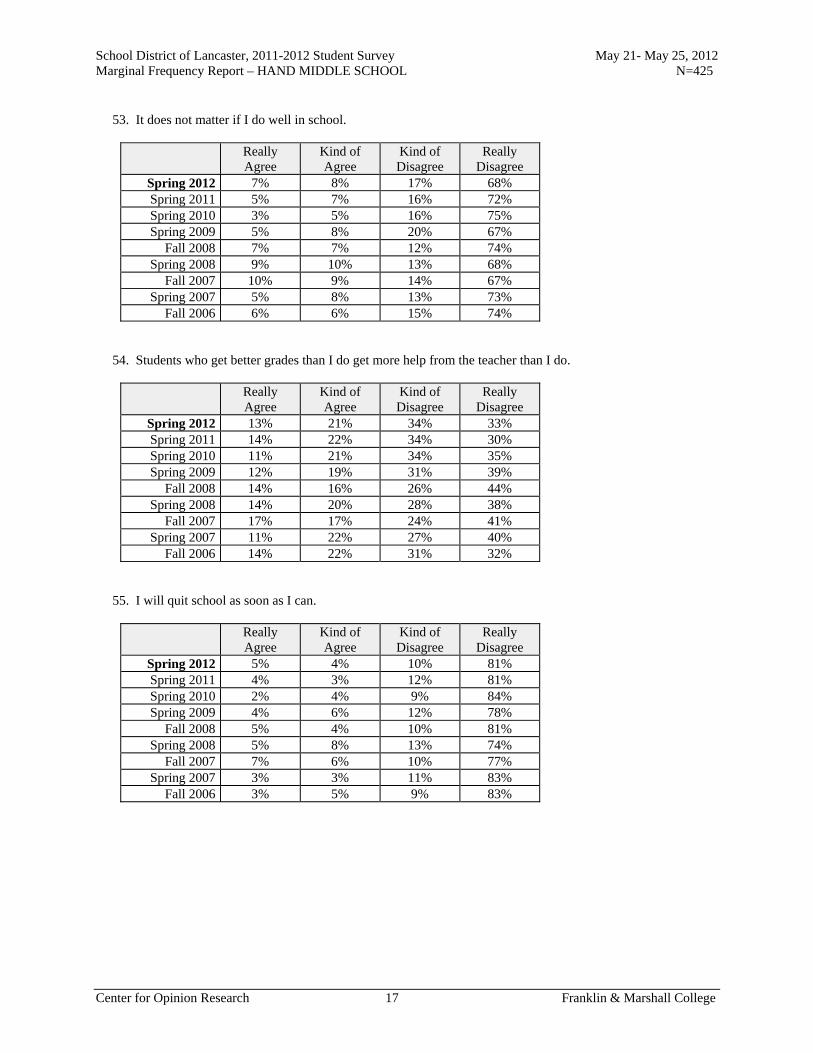
School District of Lancaster, 2011-2012 Student Survey May 21- May 25, 2012 Marginal Frequency Report – HAND MIDDLE SCHOOL N=425
Center for Opinion Research 17 Franklin & Marshall College
53. It does not matter if I do well in school.
Really Agree
Kind of Agree
Kind of Disagree
Really Disagree
Spring 2012 7% 8% 17% 68% Spring 2011 5% 7% 16% 72% Spring 2010 3% 5% 16% 75% Spring 2009 5% 8% 20% 67%
Fall 2008 7% 7% 12% 74% Spring 2008 9% 10% 13% 68%
Fall 2007 10% 9% 14% 67% Spring 2007 5% 8% 13% 73%
Fall 2006 6% 6% 15% 74% 54. Students who get better grades than I do get more help from the teacher than I do.
Really Agree
Kind of Agree
Kind of Disagree
Really Disagree
Spring 2012 13% 21% 34% 33% Spring 2011 14% 22% 34% 30% Spring 2010 11% 21% 34% 35% Spring 2009 12% 19% 31% 39%
Fall 2008 14% 16% 26% 44% Spring 2008 14% 20% 28% 38%
Fall 2007 17% 17% 24% 41% Spring 2007 11% 22% 27% 40%
Fall 2006 14% 22% 31% 32% 55. I will quit school as soon as I can.
Really Agree
Kind of Agree
Kind of Disagree
Really Disagree
Spring 2012 5% 4% 10% 81% Spring 2011 4% 3% 12% 81% Spring 2010 2% 4% 9% 84% Spring 2009 4% 6% 12% 78%
Fall 2008 5% 4% 10% 81% Spring 2008 5% 8% 13% 74%
Fall 2007 7% 6% 10% 77% Spring 2007 3% 3% 11% 83%
Fall 2006 3% 5% 9% 83%
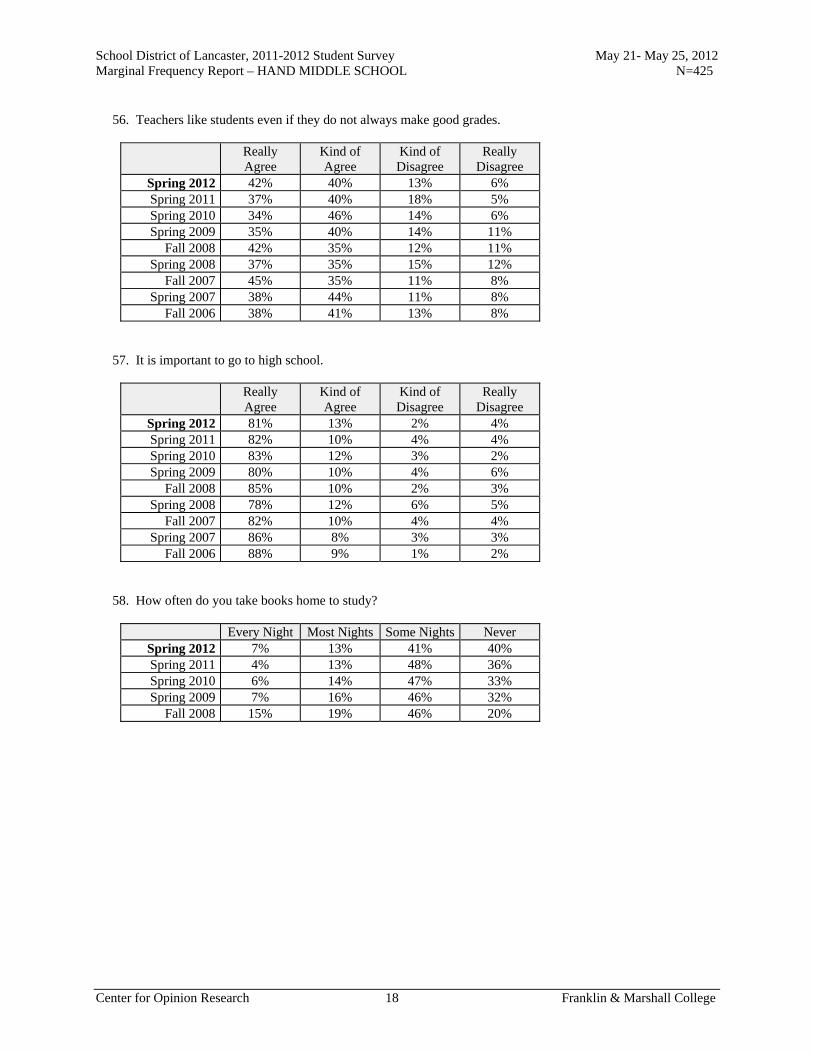
School District of Lancaster, 2011-2012 Student Survey May 21- May 25, 2012 Marginal Frequency Report – HAND MIDDLE SCHOOL N=425
Center for Opinion Research 18 Franklin & Marshall College
56. Teachers like students even if they do not always make good grades.
Really Agree
Kind of Agree
Kind of Disagree
Really Disagree
Spring 2012 42% 40% 13% 6% Spring 2011 37% 40% 18% 5% Spring 2010 34% 46% 14% 6% Spring 2009 35% 40% 14% 11%
Fall 2008 42% 35% 12% 11% Spring 2008 37% 35% 15% 12%
Fall 2007 45% 35% 11% 8% Spring 2007 38% 44% 11% 8%
Fall 2006 38% 41% 13% 8% 57. It is important to go to high school.
Really Agree
Kind of Agree
Kind of Disagree
Really Disagree
Spring 2012 81% 13% 2% 4% Spring 2011 82% 10% 4% 4% Spring 2010 83% 12% 3% 2% Spring 2009 80% 10% 4% 6%
Fall 2008 85% 10% 2% 3% Spring 2008 78% 12% 6% 5%
Fall 2007 82% 10% 4% 4% Spring 2007 86% 8% 3% 3%
Fall 2006 88% 9% 1% 2% 58. How often do you take books home to study?
Every Night Most Nights Some Nights Never Spring 2012 7% 13% 41% 40% Spring 2011 4% 13% 48% 36% Spring 2010 6% 14% 47% 33% Spring 2009 7% 16% 46% 32%
Fall 2008 15% 19% 46% 20%
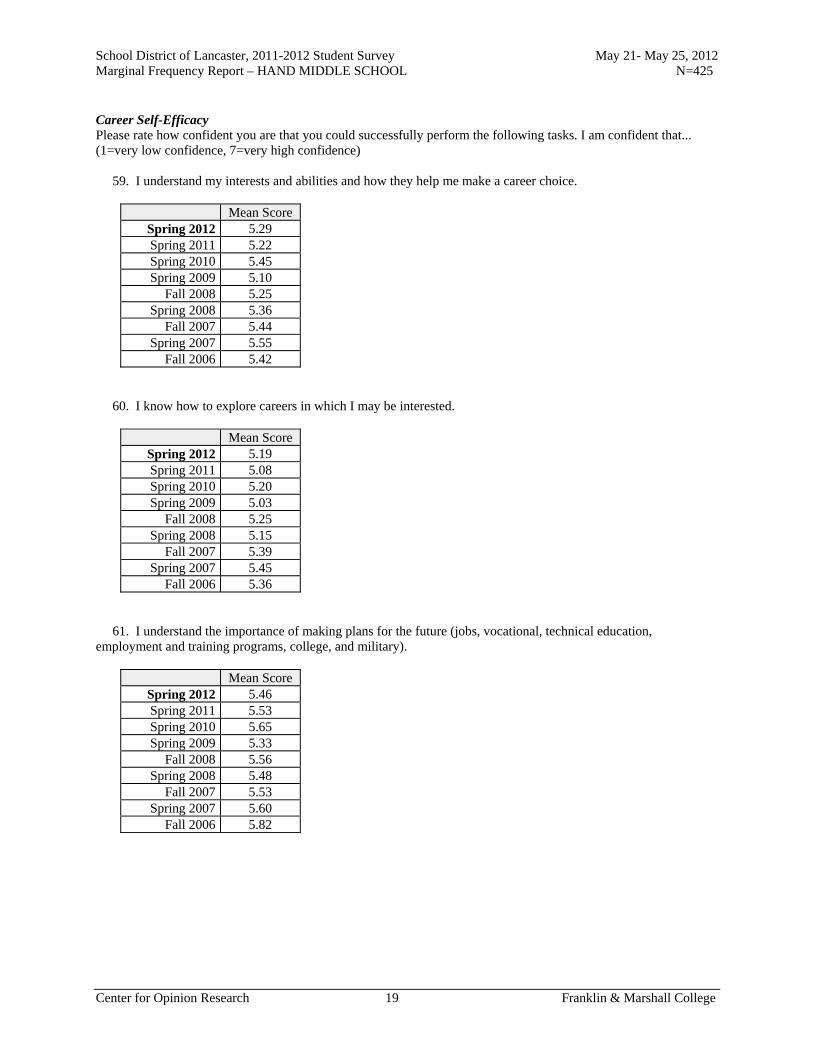
School District of Lancaster, 2011-2012 Student Survey May 21- May 25, 2012 Marginal Frequency Report – HAND MIDDLE SCHOOL N=425
Center for Opinion Research 19 Franklin & Marshall College
Career Self-Efficacy Please rate how confident you are that you could successfully perform the following tasks. I am confident that... (1=very low confidence, 7=very high confidence) 59. I understand my interests and abilities and how they help me make a career choice.
Mean Score Spring 2012 5.29 Spring 2011 5.22 Spring 2010 5.45 Spring 2009 5.10
Fall 2008 5.25 Spring 2008 5.36
Fall 2007 5.44 Spring 2007 5.55
Fall 2006 5.42 60. I know how to explore careers in which I may be interested.
Mean Score Spring 2012 5.19 Spring 2011 5.08 Spring 2010 5.20 Spring 2009 5.03
Fall 2008 5.25 Spring 2008 5.15
Fall 2007 5.39 Spring 2007 5.45
Fall 2006 5.36 61. I understand the importance of making plans for the future (jobs, vocational, technical education, employment and training programs, college, and military).
Mean Score Spring 2012 5.46 Spring 2011 5.53 Spring 2010 5.65 Spring 2009 5.33
Fall 2008 5.56 Spring 2008 5.48
Fall 2007 5.53 Spring 2007 5.60
Fall 2006 5.82

School District of Lancaster, 2011-2012 Student Survey May 21- May 25, 2012 Marginal Frequency Report – HAND MIDDLE SCHOOL N=425
Center for Opinion Research 20 Franklin & Marshall College
62. I know how to prepare for careers in which I may be interested.
Mean Score Spring 2012 5.26 Spring 2011 5.13 Spring 2010 5.35 Spring 2009 5.11
Fall 2008 5.30 Spring 2008 5.32
Fall 2007 5.39 Spring 2007 5.50
Fall 2006 5.56 63. I know what employers expect of workers.
Mean Score Spring 2012 5.16 Spring 2011 5.25 Spring 2010 5.23 Spring 2009 5.05
Fall 2008 5.32 Spring 2008 5.41
Fall 2007 5.34 Spring 2007 5.46
Fall 2006 5.26 64. I know how academic skills such as math, reading, and science relate to my career goals.
Mean Score Spring 2012 5.44 Spring 2011 5.27 Spring 2010 5.44 Spring 2009 5.37
Fall 2008 5.46 Spring 2008 5.50
Fall 2007 5.53 Spring 2007 5.66
Fall 2006 5.61

School District of Lancaster, 2011-2012 Student Survey May 21- May 25, 2012 Marginal Frequency Report – HAND MIDDLE SCHOOL N=425
Center for Opinion Research 21 Franklin & Marshall College
65. I know how to look for a part-time summer job.
Mean Score Spring 2012 4.86 Spring 2011 4.90 Spring 2010 5.02 Spring 2009 4.85
Fall 2008 5.26 Spring 2008 5.21
Fall 2007 5.20 Spring 2007 5.32
Fall 2006 5.26 66. I know what jobs are available locally.
Mean Score Spring 2012 4.67 Spring 2011 4.46 Spring 2010 4.68 Spring 2009 4.58
Fall 2008 4.91 Spring 2008 4.86
Fall 2007 5.06 Spring 2007 4.90
Fall 2006 4.74 67. I understand the challenges students have in high school.
Mean Score Spring 2012 5.15 Spring 2011 5.13 Spring 2010 5.35 Spring 2009 5.16
Fall 2008 5.26 Spring 2008 5.34
Fall 2007 5.36 Spring 2007 5.49
Fall 2006 5.47
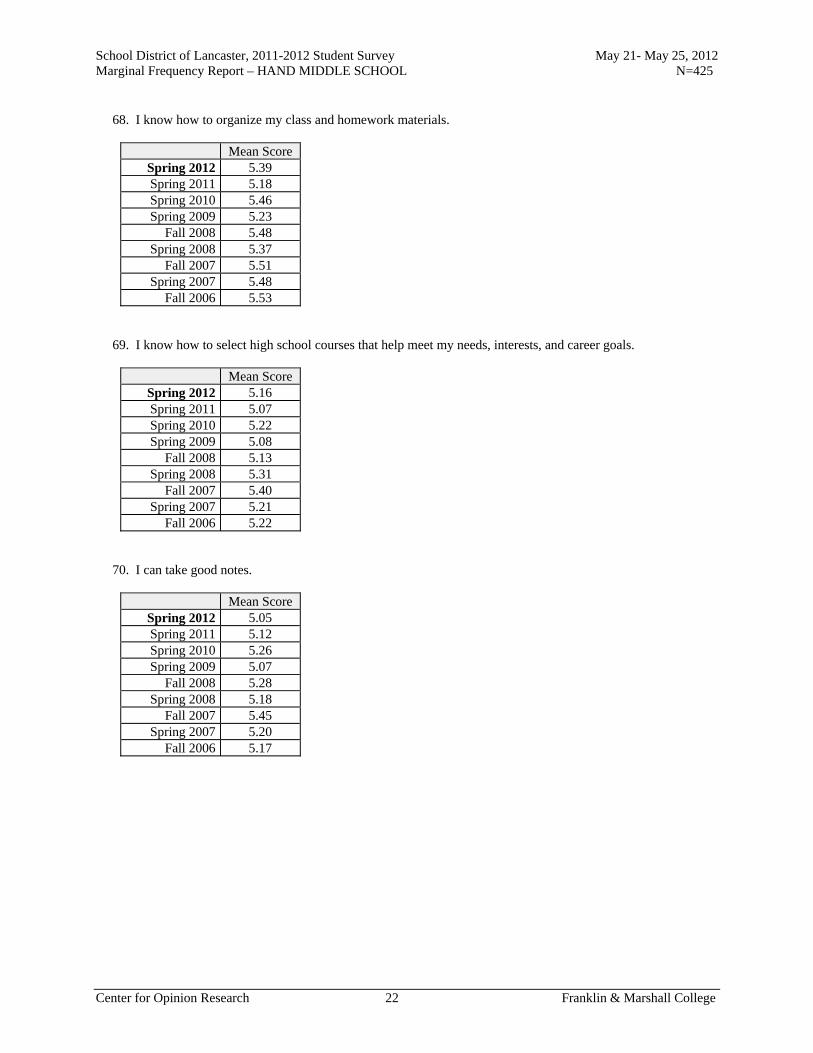
School District of Lancaster, 2011-2012 Student Survey May 21- May 25, 2012 Marginal Frequency Report – HAND MIDDLE SCHOOL N=425
Center for Opinion Research 22 Franklin & Marshall College
68. I know how to organize my class and homework materials.
Mean Score Spring 2012 5.39 Spring 2011 5.18 Spring 2010 5.46 Spring 2009 5.23
Fall 2008 5.48 Spring 2008 5.37
Fall 2007 5.51 Spring 2007 5.48
Fall 2006 5.53 69. I know how to select high school courses that help meet my needs, interests, and career goals.
Mean Score Spring 2012 5.16 Spring 2011 5.07 Spring 2010 5.22 Spring 2009 5.08
Fall 2008 5.13 Spring 2008 5.31
Fall 2007 5.40 Spring 2007 5.21
Fall 2006 5.22 70. I can take good notes.
Mean Score Spring 2012 5.05 Spring 2011 5.12 Spring 2010 5.26 Spring 2009 5.07
Fall 2008 5.28 Spring 2008 5.18
Fall 2007 5.45 Spring 2007 5.20
Fall 2006 5.17

School District of Lancaster, 2011-2012 Student Survey May 21- May 25, 2012 Marginal Frequency Report – HAND MIDDLE SCHOOL N=425
Center for Opinion Research 23 Franklin & Marshall College
71. I understand how completing high school will better prepare me to continue my education (vocational technical education, military, and college.)
Mean Score Spring 2012 5.61 Spring 2011 5.54 Spring 2010 5.69 Spring 2009 5.53
Fall 2008 5.56 Spring 2008 5.50
Fall 2007 5.63 Spring 2007 5.81
Fall 2006 5.73 72. I understand high school credits and graduation requirements.
Mean Score Spring 2012 5.25 Spring 2011 4.98 Spring 2010 5.33 Spring 2009 5.02
Fall 2008 5.30 Spring 2008 5.27
Fall 2007 5.39 Spring 2007 5.37
Fall 2006 5.18 73. I know how to do well on tests.
Mean Score Spring 2012 5.38 Spring 2011 5.14 Spring 2010 5.38 Spring 2009 5.13
Fall 2008 5.48 Spring 2008 5.44
Fall 2007 5.53 Spring 2007 5.30
Fall 2006 5.43

School District of Lancaster, 2011-2012 Student Survey May 21- May 25, 2012 Marginal Frequency Report – HAND MIDDLE SCHOOL N=425
Center for Opinion Research 24 Franklin & Marshall College
74. I know how to select middle school extra-curricular activities that will meet my interests and future goals
Mean Score Spring 2012 5.18 Spring 2011 5.12 Spring 2010 5.14 Spring 2009 4.94
Fall 2008 5.21 Spring 2008 5.20
Fall 2007 5.28 Spring 2007 5.21
Fall 2006 5.30 75. I understand how completing high school will better prepare me for the job market.
Mean Score Spring 2012 5.41 Spring 2011 5.30 Spring 2010 5.49 Spring 2009 5.32
Fall 2008 5.47 Spring 2008 5.50
Fall 2007 5.52 Spring 2007 5.51
Fall 2006 5.55 76. I know the classes offered by my area vocational technical school.
Mean Score Spring 2012 4.64 Spring 2011 4.61 Spring 2010 4.73 Spring 2009 4.64
Fall 2008 4.78 Spring 2008 4.95
Fall 2007 4.91 Spring 2007 4.89
Fall 2006 4.41
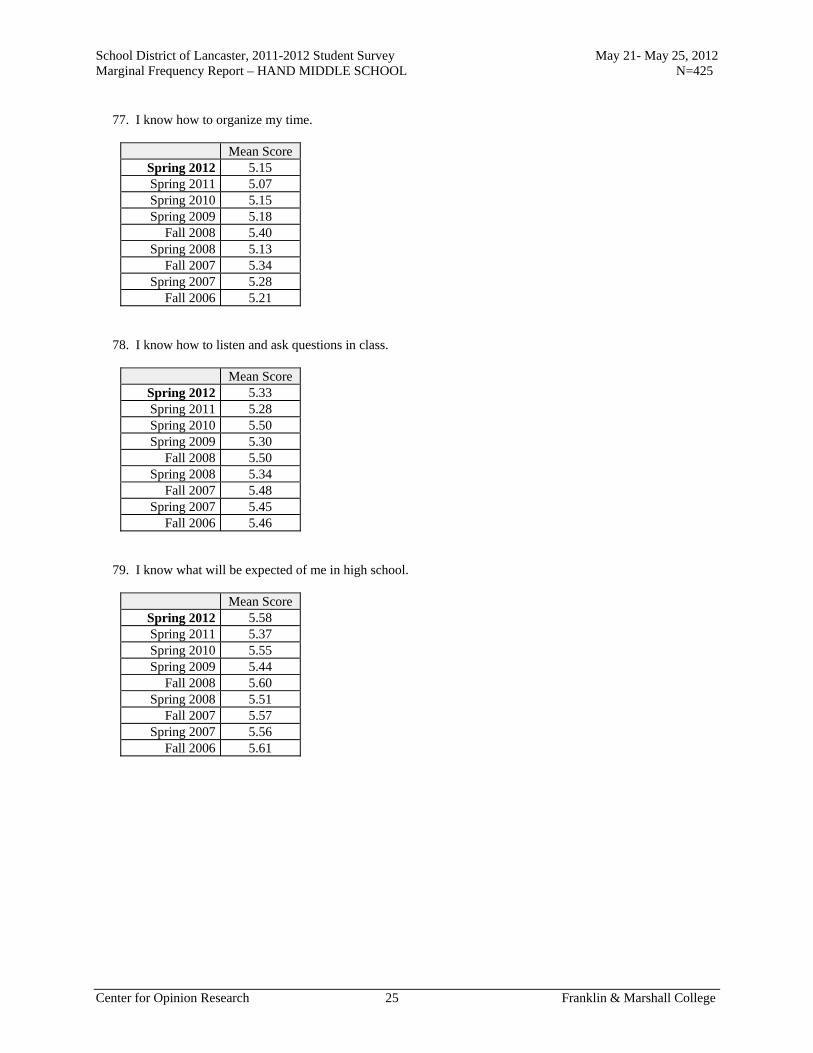
School District of Lancaster, 2011-2012 Student Survey May 21- May 25, 2012 Marginal Frequency Report – HAND MIDDLE SCHOOL N=425
Center for Opinion Research 25 Franklin & Marshall College
77. I know how to organize my time.
Mean Score Spring 2012 5.15 Spring 2011 5.07 Spring 2010 5.15 Spring 2009 5.18
Fall 2008 5.40 Spring 2008 5.13
Fall 2007 5.34 Spring 2007 5.28
Fall 2006 5.21 78. I know how to listen and ask questions in class.
Mean Score Spring 2012 5.33 Spring 2011 5.28 Spring 2010 5.50 Spring 2009 5.30
Fall 2008 5.50 Spring 2008 5.34
Fall 2007 5.48 Spring 2007 5.45
Fall 2006 5.46 79. I know what will be expected of me in high school.
Mean Score Spring 2012 5.58 Spring 2011 5.37 Spring 2010 5.55 Spring 2009 5.44
Fall 2008 5.60 Spring 2008 5.51
Fall 2007 5.57 Spring 2007 5.56
Fall 2006 5.61

School District of Lancaster, 2011-2012 Student Survey May 21- May 25, 2012 Marginal Frequency Report – HAND MIDDLE SCHOOL N=425
Center for Opinion Research 26 Franklin & Marshall College
80. I know how to interview to get a job.
Mean Score Spring 2012 4.99 Spring 2011 4.92 Spring 2010 4.90 Spring 2009 4.72
Fall 2008 5.03 Spring 2008 5.09
Fall 2007 5.17 Spring 2007 4.95
Fall 2006 4.87 81. I know where to go to get help when I have a problem concerning high school.
Mean Score Spring 2012 5.21 Spring 2011 4.94 Spring 2010 5.14 Spring 2009 4.88
Fall 2008 5.15 Spring 2008 5.20
Fall 2007 5.35 Spring 2007 5.12
Fall 2006 4.91 82. I know how to apply for a job.
Mean Score Spring 2012 5.03 Spring 2011 4.84 Spring 2010 5.05 Spring 2009 4.80
Fall 2008 5.06 Spring 2008 5.14
Fall 2007 5.22 Spring 2007 5.14
Fall 2006 5.04

School District of Lancaster, 2011-2012 Student Survey May 21- May 25, 2012 Marginal Frequency Report – HAND MIDDLE SCHOOL N=425
Center for Opinion Research 27 Franklin & Marshall College
83. I know how to start and finish my assignments well.
Mean Score Spring 2012 5.32 Spring 2011 5.17 Spring 2010 5.43 Spring 2009 5.32
Fall 2008 5.49 Spring 2008 5.45
Fall 2007 5.55 Spring 2007 5.38
Fall 2006 5.27 Academic Aspirations 84. How far in school do you want to go?
Complete
high school
Attend vocational/technical
school
Attend 2-year college
Attend 4-year college
Attend 4-year college plus go to
grad school Spring 2012 14% 4% 21% 28% 34% Spring 2011 16% 3% 24% 28% 29% Spring 2010 16% 4% 22% 32% 26% Spring 2009 15% 4% 21% 28% 32%
Fall 2008 15% 4% 19% 27% 35% Spring 2008 12% 3% 22% 27% 35%
Fall 2007 15% 3% 19% 27% 35% Spring 2007 14% 4% 20% 26% 36%
Fall 2006 18% 4% 16% 27% 35% 85. How important do you believe getting a college education is to your future success? Would you say it is...
Very
important Somewhat important
Not very important
Not important at
all Spring 2012 80% 14% 5% 2% Spring 2011 80% 15% 3% 1% Spring 2010 88% 10% 2% 1% Spring 2009 86% 10% 2% 1%
Fall 2008 86% 9% 3% 2% Spring 2008 87% 10% 1% 2%
Fall 2007 87% 10% 2% 0% Spring 2007 89% 10% 0% 0%
Fall 2006 88% 10% 2% 0%

School District of Lancaster, 2011-2012 Student Survey May 21- May 25, 2012 Marginal Frequency Report – HAND MIDDLE SCHOOL N=425
Center for Opinion Research 28 Franklin & Marshall College
86. How important would your parent/guardian say getting a college education is to your future success? Would your parents say it is...
Very
important Somewhat important
Not very important
Not important at
all Spring 2012 80% 15% 3% 2% Spring 2011 85% 8% 5% 1% Spring 2010 92% 6% 2% 0% Spring 2009 88% 8% 2% 2%
Fall 2008 86% 9% 3% 2% Spring 2008 89% 5% 2% 3%
Fall 2007 89% 7% 4% 0% Spring 2007 89% 8% 1% 2%
Fall 2006 90% 9% 1% 0% 87. How important would your teachers say getting a college education is to your future success? Would your teachers say it is...
Very
important Somewhat important
Not very important
Not important at
all Spring 2012 83% 12% 2% 2% Spring 2011 81% 15% 2% 2% Spring 2010 89% 8% 2% 0% Spring 2009 82% 12% 2% 4%
Fall 2008 80% 14% 4% 2% Spring 2008 86% 9% 2% 3%
Fall 2007 90% 8% 1% 1% Spring 2007 88% 8% 1% 2%
Fall 2006 92% 7% 1% 1% 88. How far in school do you think you will get?
Won't finish high school
Will finish high school
Will get a GED
Will complete a
2-year Associate's
Degree
Will complete a
4-year Bachelor's
Degree
Will complete a Master's or Doctoral Degree
Spring 2012 4% 15% 11% 17% 26% 27% Spring 2011 3% 22% 8% 16% 29% 22% Spring 2010 4% 18% 7% 18% 29% 24% Spring 2009 5% 16% 10% 16% 26% 28%
Fall 2008 6% 16% 7% 15% 25% 32% Spring 2008 4% 11% 7% 18% 26% 35%
Fall 2007 3% 16% 10% 17% 21% 32% Spring 2007 4% 16% 10% 14% 27% 30%
Fall 2006 2% 22% 10% 14% 23% 29%

School District of Lancaster, 2011-2012 Student Survey May 21- May 25, 2012 Marginal Frequency Report – HAND MIDDLE SCHOOL N=425
Center for Opinion Research 29 Franklin & Marshall College
89. Has anyone from your school or GEAR UP ever spoken with you about college entrance requirements or the courses that you need to take in high school in order to prepare for college?
Yes No Spring 2012 66% 34% Spring 2011 56% 44% Spring 2010 65% 35% Spring 2009 60% 40%
Fall 2008 59% 41% Spring 2008 70% 30%
Fall 2007 67% 33% Spring 2007 78% 22%
Fall 2006 61% 39% 90. Has anyone from your school or GEAR UP ever spoken with you about the availability of financial aid to help you pay for college?
Yes No Spring 2012 54% 46% Spring 2011 43% 57% Spring 2010 50% 50% Spring 2009 55% 45%
Fall 2008 51% 49% Spring 2008 61% 39%
Fall 2007 57% 43% Spring 2007 80% 20%
Fall 2006 61% 39% 91. Do you think that you could afford to attend a public 4-year college (for example, Millersville University) using financial aid, scholarships, and your family's resources?
Definitely Probably Not Sure Probably
Not Definitely
Not Spring 2012 24% 39% 27% 6% 4% Spring 2011 26% 34% 31% 6% 4% Spring 2010 32% 34% 28% 4% 2% Spring 2009 34% 39% 21% 3% 3%
Fall 2008 33% 33% 22% 6% 6% Spring 2008 32% 37% 22% 4% 5%
Fall 2007 33% 35% 22% 4% 6% Spring 2007 29% 37% 27% 4% 3%
Fall 2006 31% 32% 29% 5% 2% 92. On a scale of 1 to 5, to what extent are you knowledgeable about financial aid and the cost and benefits to you in pursuing postsecondary education?
Mean Score Spring 2012 3.15
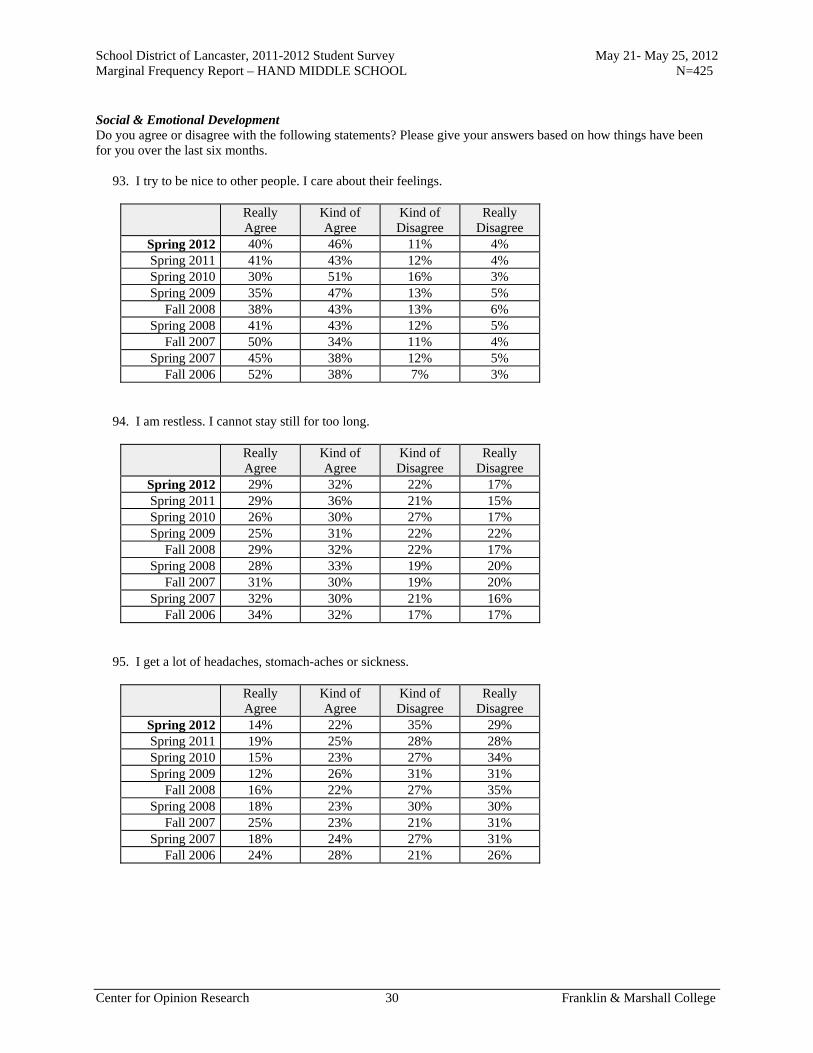
School District of Lancaster, 2011-2012 Student Survey May 21- May 25, 2012 Marginal Frequency Report – HAND MIDDLE SCHOOL N=425
Center for Opinion Research 30 Franklin & Marshall College
Social & Emotional Development Do you agree or disagree with the following statements? Please give your answers based on how things have been for you over the last six months. 93. I try to be nice to other people. I care about their feelings.
Really Agree
Kind of Agree
Kind of Disagree
Really Disagree
Spring 2012 40% 46% 11% 4% Spring 2011 41% 43% 12% 4% Spring 2010 30% 51% 16% 3% Spring 2009 35% 47% 13% 5%
Fall 2008 38% 43% 13% 6% Spring 2008 41% 43% 12% 5%
Fall 2007 50% 34% 11% 4% Spring 2007 45% 38% 12% 5%
Fall 2006 52% 38% 7% 3% 94. I am restless. I cannot stay still for too long.
Really Agree
Kind of Agree
Kind of Disagree
Really Disagree
Spring 2012 29% 32% 22% 17% Spring 2011 29% 36% 21% 15% Spring 2010 26% 30% 27% 17% Spring 2009 25% 31% 22% 22%
Fall 2008 29% 32% 22% 17% Spring 2008 28% 33% 19% 20%
Fall 2007 31% 30% 19% 20% Spring 2007 32% 30% 21% 16%
Fall 2006 34% 32% 17% 17% 95. I get a lot of headaches, stomach-aches or sickness.
Really Agree
Kind of Agree
Kind of Disagree
Really Disagree
Spring 2012 14% 22% 35% 29% Spring 2011 19% 25% 28% 28% Spring 2010 15% 23% 27% 34% Spring 2009 12% 26% 31% 31%
Fall 2008 16% 22% 27% 35% Spring 2008 18% 23% 30% 30%
Fall 2007 25% 23% 21% 31% Spring 2007 18% 24% 27% 31%
Fall 2006 24% 28% 21% 26%
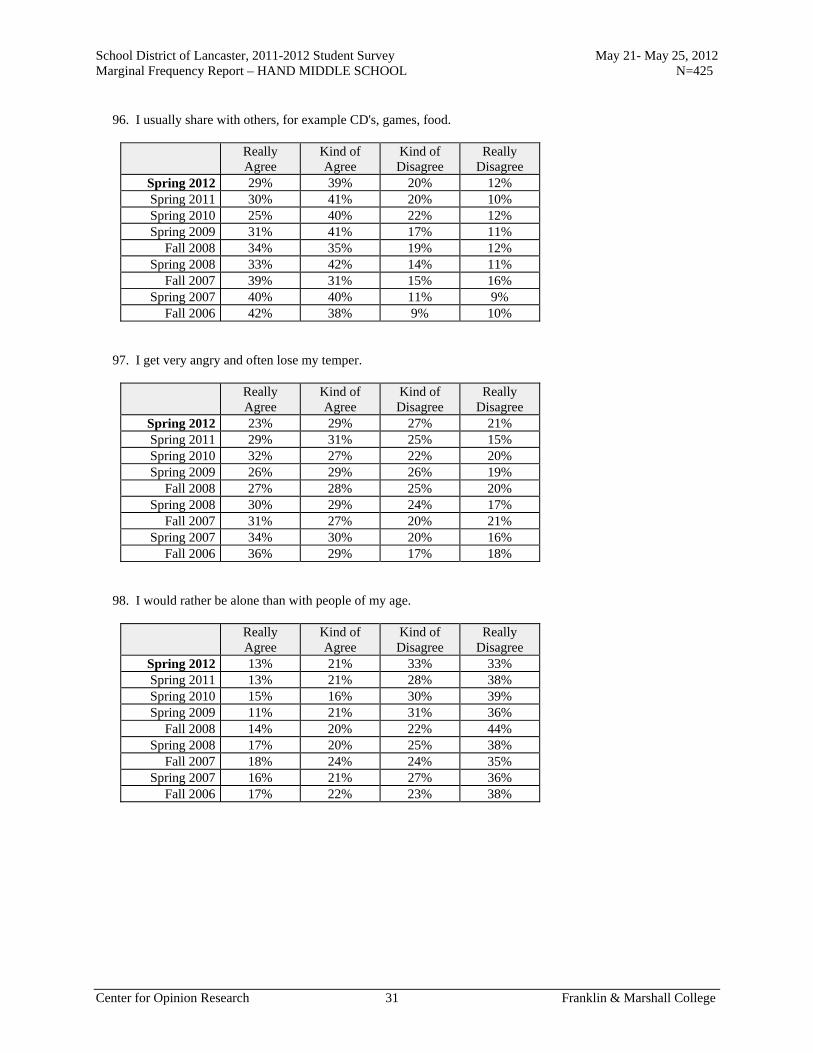
School District of Lancaster, 2011-2012 Student Survey May 21- May 25, 2012 Marginal Frequency Report – HAND MIDDLE SCHOOL N=425
Center for Opinion Research 31 Franklin & Marshall College
96. I usually share with others, for example CD's, games, food.
Really Agree
Kind of Agree
Kind of Disagree
Really Disagree
Spring 2012 29% 39% 20% 12% Spring 2011 30% 41% 20% 10% Spring 2010 25% 40% 22% 12% Spring 2009 31% 41% 17% 11%
Fall 2008 34% 35% 19% 12% Spring 2008 33% 42% 14% 11%
Fall 2007 39% 31% 15% 16% Spring 2007 40% 40% 11% 9%
Fall 2006 42% 38% 9% 10% 97. I get very angry and often lose my temper.
Really Agree
Kind of Agree
Kind of Disagree
Really Disagree
Spring 2012 23% 29% 27% 21% Spring 2011 29% 31% 25% 15% Spring 2010 32% 27% 22% 20% Spring 2009 26% 29% 26% 19%
Fall 2008 27% 28% 25% 20% Spring 2008 30% 29% 24% 17%
Fall 2007 31% 27% 20% 21% Spring 2007 34% 30% 20% 16%
Fall 2006 36% 29% 17% 18% 98. I would rather be alone than with people of my age.
Really Agree
Kind of Agree
Kind of Disagree
Really Disagree
Spring 2012 13% 21% 33% 33% Spring 2011 13% 21% 28% 38% Spring 2010 15% 16% 30% 39% Spring 2009 11% 21% 31% 36%
Fall 2008 14% 20% 22% 44% Spring 2008 17% 20% 25% 38%
Fall 2007 18% 24% 24% 35% Spring 2007 16% 21% 27% 36%
Fall 2006 17% 22% 23% 38%

School District of Lancaster, 2011-2012 Student Survey May 21- May 25, 2012 Marginal Frequency Report – HAND MIDDLE SCHOOL N=425
Center for Opinion Research 32 Franklin & Marshall College
99. I usually do as I am told.
Really Agree
Kind of Agree
Kind of Disagree
Really Disagree
Spring 2012 30% 49% 16% 5% Spring 2011 29% 44% 21% 6% Spring 2010 26% 45% 21% 8% Spring 2009 23% 43% 25% 9%
Fall 2008 30% 42% 20% 9% Spring 2008 32% 44% 18% 6%
Fall 2007 42% 38% 13% 7% Spring 2007 33% 45% 16% 6%
Fall 2006 36% 40% 14% 9% 100. I worry a lot.
Really Agree
Kind of Agree
Kind of Disagree
Really Disagree
Spring 2012 20% 30% 30% 20% Spring 2011 19% 30% 28% 23% Spring 2010 17% 26% 30% 27% Spring 2009 16% 31% 30% 24%
Fall 2008 19% 26% 29% 26% Spring 2008 22% 27% 28% 24%
Fall 2007 24% 28% 26% 22% Spring 2007 24% 28% 28% 20%
Fall 2006 29% 29% 26% 16% 101. I am helpful if someone is hurt, upset, or feeling ill.
Really Agree
Kind of Agree
Kind of Disagree
Really Disagree
Spring 2012 43% 36% 15% 6% Spring 2011 41% 40% 13% 5% Spring 2010 34% 44% 18% 4% Spring 2009 33% 44% 17% 6%
Fall 2008 44% 38% 11% 7% Spring 2008 43% 39% 12% 6%
Fall 2007 45% 35% 13% 8% Spring 2007 42% 42% 12% 4%
Fall 2006 47% 39% 11% 3%

School District of Lancaster, 2011-2012 Student Survey May 21- May 25, 2012 Marginal Frequency Report – HAND MIDDLE SCHOOL N=425
Center for Opinion Research 33 Franklin & Marshall College
102. I am constantly moving or squirming.
Really Agree
Kind of Agree
Kind of Disagree
Really Disagree
Spring 2012 20% 30% 28% 22% Spring 2011 17% 34% 30% 18% Spring 2010 16% 27% 30% 27% Spring 2009 18% 26% 33% 23%
Fall 2008 18% 29% 27% 26% Spring 2008 22% 30% 29% 20%
Fall 2007 24% 26% 31% 19% Spring 2007 22% 30% 25% 23%
Fall 2006 27% 28% 26% 19% 103. I have one good friend or more.
Really Agree
Kind of Agree
Kind of Disagree
Really Disagree
Spring 2012 65% 23% 9% 3% Spring 2011 69% 21% 5% 5% Spring 2010 70% 21% 5% 4% Spring 2009 64% 22% 8% 6%
Fall 2008 69% 19% 6% 6% Spring 2008 65% 21% 9% 6%
Fall 2007 64% 24% 9% 4% Spring 2007 71% 19% 7% 3%
Fall 2006 68% 21% 6% 4% 104. I fight a lot. I can make other people do what I want.
Really Agree
Kind of Agree
Kind of Disagree
Really Disagree
Spring 2012 6% 16% 32% 46% Spring 2011 10% 16% 26% 48% Spring 2010 7% 14% 31% 48% Spring 2009 8% 17% 31% 44%
Fall 2008 8% 18% 29% 45% Spring 2008 11% 21% 28% 40%
Fall 2007 12% 19% 24% 45% Spring 2007 12% 18% 30% 40%
Fall 2006 8% 16% 29% 47%

School District of Lancaster, 2011-2012 Student Survey May 21- May 25, 2012 Marginal Frequency Report – HAND MIDDLE SCHOOL N=425
Center for Opinion Research 34 Franklin & Marshall College
105. I am often unhappy, depressed, or tearful.
Really Agree
Kind of Agree
Kind of Disagree
Really Disagree
Spring 2012 13% 22% 24% 40% Spring 2011 12% 24% 28% 35% Spring 2010 11% 20% 29% 40% Spring 2009 12% 21% 28% 39%
Fall 2008 13% 22% 22% 43% Spring 2008 14% 26% 23% 37%
Fall 2007 14% 18% 28% 40% Spring 2007 13% 25% 26% 36%
Fall 2006 16% 22% 24% 38% 106. Other people my age generally like me.
Really Agree
Kind of Agree
Kind of Disagree
Really Disagree
Spring 2012 32% 46% 14% 8% Spring 2011 26% 53% 14% 7% Spring 2010 34% 42% 18% 6% Spring 2009 38% 42% 14% 6%
Fall 2008 36% 45% 11% 8% Spring 2008 40% 40% 12% 8%
Fall 2007 40% 40% 13% 6% Spring 2007 38% 44% 14% 4%
Fall 2006 33% 47% 11% 9% 107. I easily lose my focus. I find it difficult to concentrate.
Really Agree
Kind of Agree
Kind of Disagree
Really Disagree
Spring 2012 22% 32% 29% 17% Spring 2011 23% 33% 28% 16% Spring 2010 25% 32% 27% 16% Spring 2009 21% 32% 25% 21%
Fall 2008 23% 28% 24% 25% Spring 2008 20% 33% 26% 21%
Fall 2007 25% 30% 24% 21% Spring 2007 24% 34% 25% 18%
Fall 2006 28% 32% 24% 17%
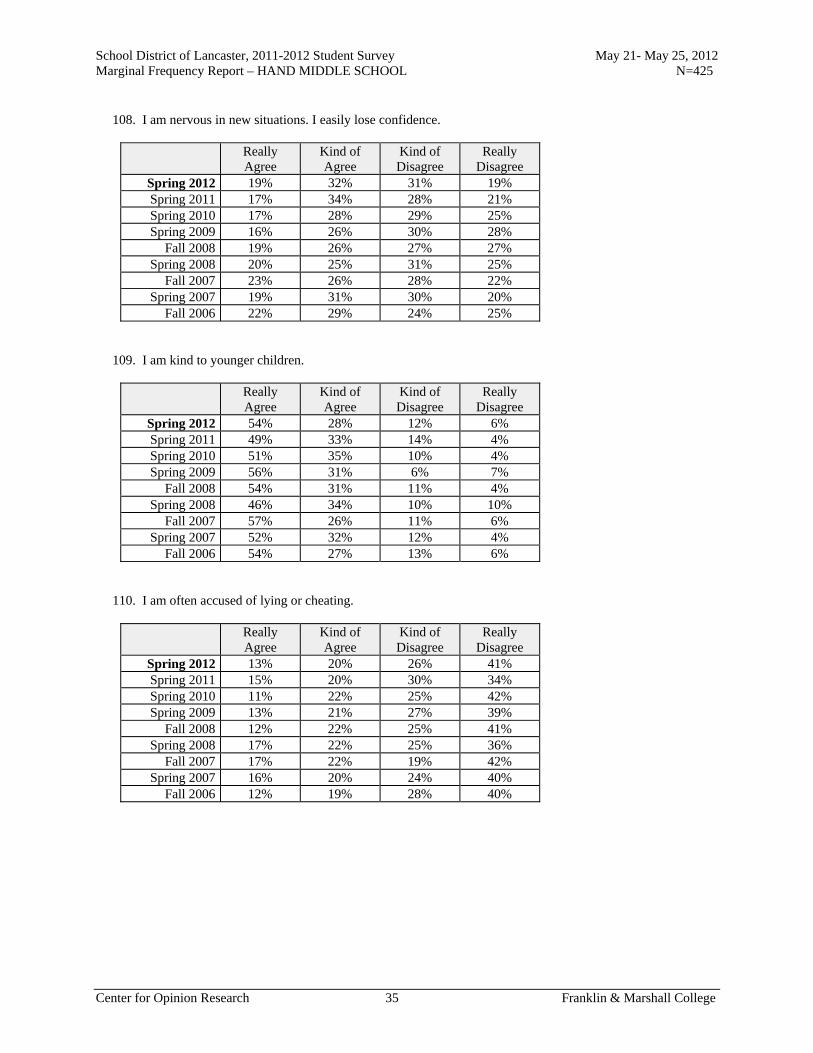
School District of Lancaster, 2011-2012 Student Survey May 21- May 25, 2012 Marginal Frequency Report – HAND MIDDLE SCHOOL N=425
Center for Opinion Research 35 Franklin & Marshall College
108. I am nervous in new situations. I easily lose confidence.
Really Agree
Kind of Agree
Kind of Disagree
Really Disagree
Spring 2012 19% 32% 31% 19% Spring 2011 17% 34% 28% 21% Spring 2010 17% 28% 29% 25% Spring 2009 16% 26% 30% 28%
Fall 2008 19% 26% 27% 27% Spring 2008 20% 25% 31% 25%
Fall 2007 23% 26% 28% 22% Spring 2007 19% 31% 30% 20%
Fall 2006 22% 29% 24% 25% 109. I am kind to younger children.
Really Agree
Kind of Agree
Kind of Disagree
Really Disagree
Spring 2012 54% 28% 12% 6% Spring 2011 49% 33% 14% 4% Spring 2010 51% 35% 10% 4% Spring 2009 56% 31% 6% 7%
Fall 2008 54% 31% 11% 4% Spring 2008 46% 34% 10% 10%
Fall 2007 57% 26% 11% 6% Spring 2007 52% 32% 12% 4%
Fall 2006 54% 27% 13% 6% 110. I am often accused of lying or cheating.
Really Agree
Kind of Agree
Kind of Disagree
Really Disagree
Spring 2012 13% 20% 26% 41% Spring 2011 15% 20% 30% 34% Spring 2010 11% 22% 25% 42% Spring 2009 13% 21% 27% 39%
Fall 2008 12% 22% 25% 41% Spring 2008 17% 22% 25% 36%
Fall 2007 17% 22% 19% 42% Spring 2007 16% 20% 24% 40%
Fall 2006 12% 19% 28% 40%
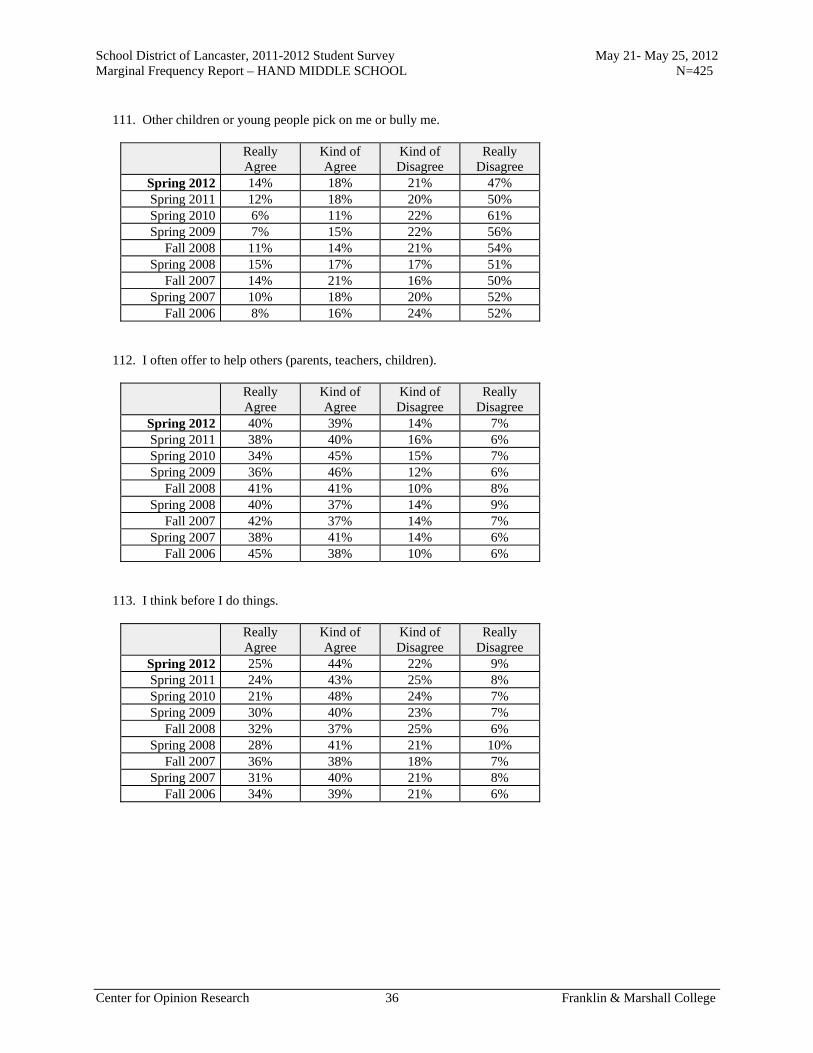
School District of Lancaster, 2011-2012 Student Survey May 21- May 25, 2012 Marginal Frequency Report – HAND MIDDLE SCHOOL N=425
Center for Opinion Research 36 Franklin & Marshall College
111. Other children or young people pick on me or bully me.
Really Agree
Kind of Agree
Kind of Disagree
Really Disagree
Spring 2012 14% 18% 21% 47% Spring 2011 12% 18% 20% 50% Spring 2010 6% 11% 22% 61% Spring 2009 7% 15% 22% 56%
Fall 2008 11% 14% 21% 54% Spring 2008 15% 17% 17% 51%
Fall 2007 14% 21% 16% 50% Spring 2007 10% 18% 20% 52%
Fall 2006 8% 16% 24% 52% 112. I often offer to help others (parents, teachers, children).
Really Agree
Kind of Agree
Kind of Disagree
Really Disagree
Spring 2012 40% 39% 14% 7% Spring 2011 38% 40% 16% 6% Spring 2010 34% 45% 15% 7% Spring 2009 36% 46% 12% 6%
Fall 2008 41% 41% 10% 8% Spring 2008 40% 37% 14% 9%
Fall 2007 42% 37% 14% 7% Spring 2007 38% 41% 14% 6%
Fall 2006 45% 38% 10% 6% 113. I think before I do things.
Really Agree
Kind of Agree
Kind of Disagree
Really Disagree
Spring 2012 25% 44% 22% 9% Spring 2011 24% 43% 25% 8% Spring 2010 21% 48% 24% 7% Spring 2009 30% 40% 23% 7%
Fall 2008 32% 37% 25% 6% Spring 2008 28% 41% 21% 10%
Fall 2007 36% 38% 18% 7% Spring 2007 31% 40% 21% 8%
Fall 2006 34% 39% 21% 6%

School District of Lancaster, 2011-2012 Student Survey May 21- May 25, 2012 Marginal Frequency Report – HAND MIDDLE SCHOOL N=425
Center for Opinion Research 37 Franklin & Marshall College
114. I take things that are not mine from home, school, or elsewhere.
Really Agree
Kind of Agree
Kind of Disagree
Really Disagree
Spring 2012 7% 13% 18% 62% Spring 2011 6% 12% 22% 60% Spring 2010 5% 11% 20% 63% Spring 2009 7% 12% 23% 58%
Fall 2008 6% 12% 19% 63% Spring 2008 5% 14% 19% 62%
Fall 2007 10% 13% 18% 59% Spring 2007 10% 13% 18% 59%
Fall 2006 5% 10% 16% 69% 115. I get along better with adults than with people my own age.
Really Agree
Kind of Agree
Kind of Disagree
Really Disagree
Spring 2012 19% 26% 30% 25% Spring 2011 20% 24% 32% 25% Spring 2010 16% 25% 33% 25% Spring 2009 16% 29% 33% 22%
Fall 2008 16% 24% 29% 31% Spring 2008 16% 29% 30% 25%
Fall 2007 21% 30% 28% 22% Spring 2007 18% 25% 31% 26%
Fall 2006 20% 25% 32% 23% 116. I have many fears. I am easily scared.
Really Agree
Kind of Agree
Kind of Disagree
Really Disagree
Spring 2012 12% 15% 33% 40% Spring 2011 12% 17% 30% 41% Spring 2010 5% 18% 26% 50% Spring 2009 9% 16% 29% 45%
Fall 2008 10% 17% 24% 48% Spring 2008 12% 21% 26% 41%
Fall 2007 15% 19% 29% 38% Spring 2007 11% 20% 30% 38%
Fall 2006 12% 23% 32% 32%
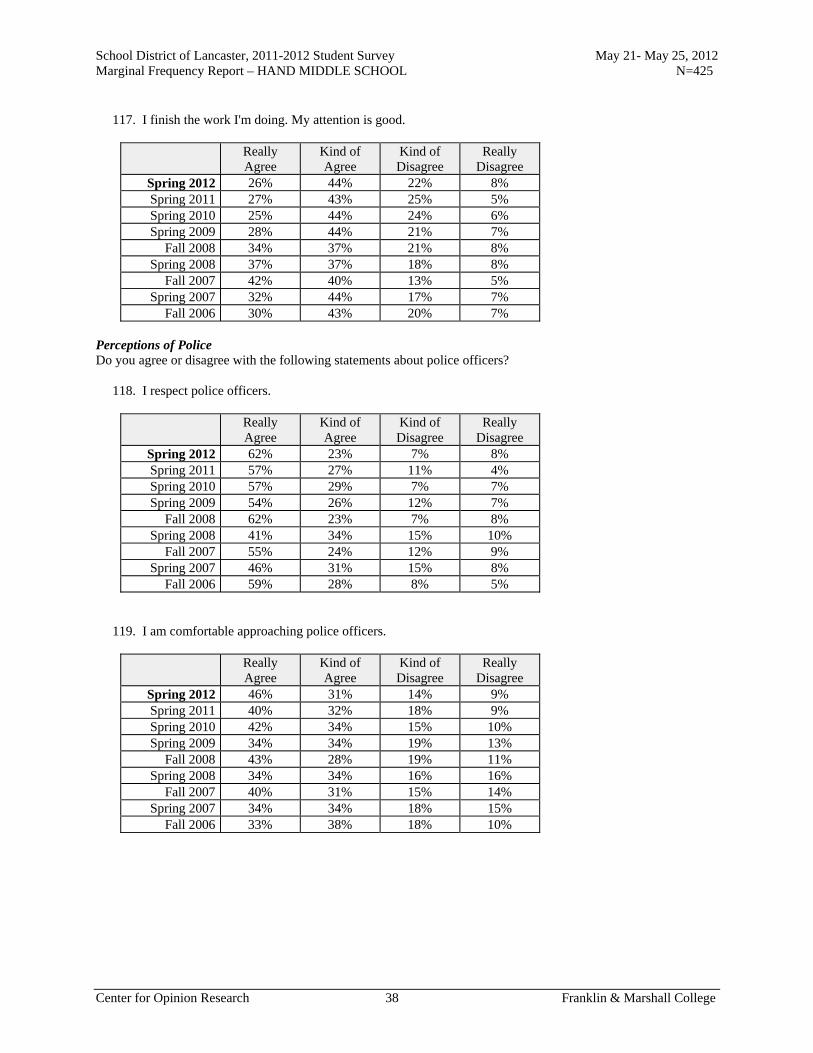
School District of Lancaster, 2011-2012 Student Survey May 21- May 25, 2012 Marginal Frequency Report – HAND MIDDLE SCHOOL N=425
Center for Opinion Research 38 Franklin & Marshall College
117. I finish the work I'm doing. My attention is good.
Really Agree
Kind of Agree
Kind of Disagree
Really Disagree
Spring 2012 26% 44% 22% 8% Spring 2011 27% 43% 25% 5% Spring 2010 25% 44% 24% 6% Spring 2009 28% 44% 21% 7%
Fall 2008 34% 37% 21% 8% Spring 2008 37% 37% 18% 8%
Fall 2007 42% 40% 13% 5% Spring 2007 32% 44% 17% 7%
Fall 2006 30% 43% 20% 7% Perceptions of Police Do you agree or disagree with the following statements about police officers? 118. I respect police officers.
Really Agree
Kind of Agree
Kind of Disagree
Really Disagree
Spring 2012 62% 23% 7% 8% Spring 2011 57% 27% 11% 4% Spring 2010 57% 29% 7% 7% Spring 2009 54% 26% 12% 7%
Fall 2008 62% 23% 7% 8% Spring 2008 41% 34% 15% 10%
Fall 2007 55% 24% 12% 9% Spring 2007 46% 31% 15% 8%
Fall 2006 59% 28% 8% 5% 119. I am comfortable approaching police officers.
Really Agree
Kind of Agree
Kind of Disagree
Really Disagree
Spring 2012 46% 31% 14% 9% Spring 2011 40% 32% 18% 9% Spring 2010 42% 34% 15% 10% Spring 2009 34% 34% 19% 13%
Fall 2008 43% 28% 19% 11% Spring 2008 34% 34% 16% 16%
Fall 2007 40% 31% 15% 14% Spring 2007 34% 34% 18% 15%
Fall 2006 33% 38% 18% 10%
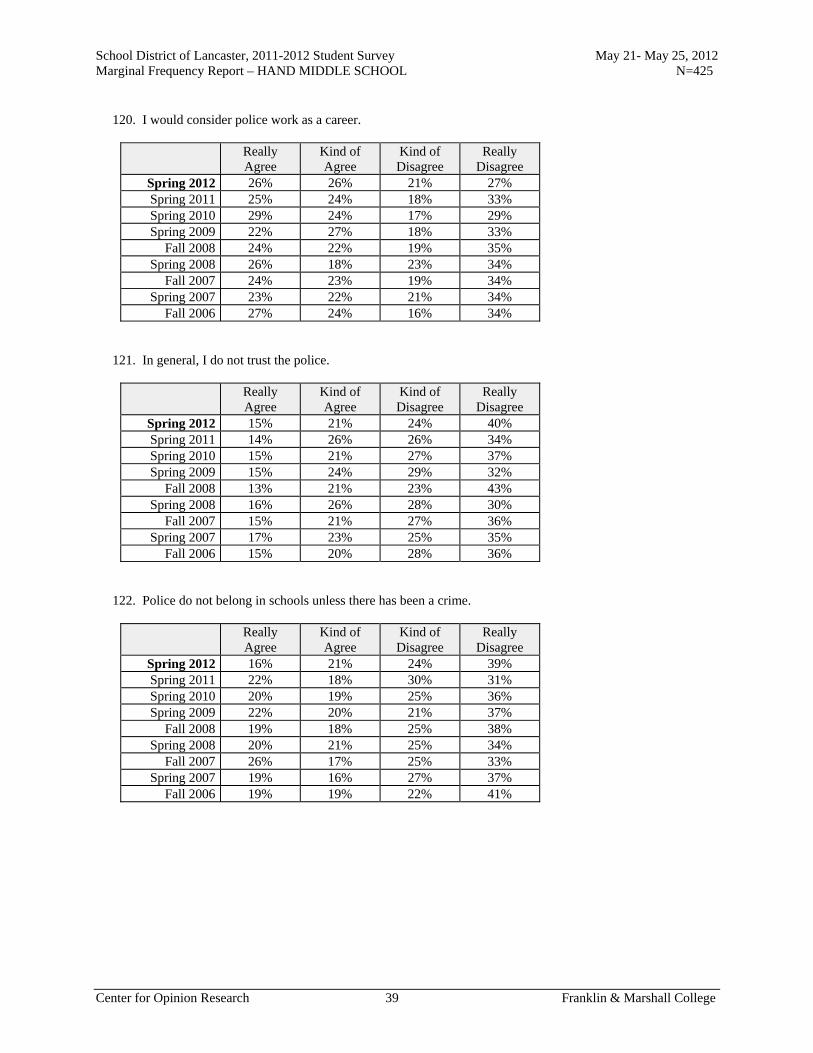
School District of Lancaster, 2011-2012 Student Survey May 21- May 25, 2012 Marginal Frequency Report – HAND MIDDLE SCHOOL N=425
Center for Opinion Research 39 Franklin & Marshall College
120. I would consider police work as a career.
Really Agree
Kind of Agree
Kind of Disagree
Really Disagree
Spring 2012 26% 26% 21% 27% Spring 2011 25% 24% 18% 33% Spring 2010 29% 24% 17% 29% Spring 2009 22% 27% 18% 33%
Fall 2008 24% 22% 19% 35% Spring 2008 26% 18% 23% 34%
Fall 2007 24% 23% 19% 34% Spring 2007 23% 22% 21% 34%
Fall 2006 27% 24% 16% 34% 121. In general, I do not trust the police.
Really Agree
Kind of Agree
Kind of Disagree
Really Disagree
Spring 2012 15% 21% 24% 40% Spring 2011 14% 26% 26% 34% Spring 2010 15% 21% 27% 37% Spring 2009 15% 24% 29% 32%
Fall 2008 13% 21% 23% 43% Spring 2008 16% 26% 28% 30%
Fall 2007 15% 21% 27% 36% Spring 2007 17% 23% 25% 35%
Fall 2006 15% 20% 28% 36% 122. Police do not belong in schools unless there has been a crime.
Really Agree
Kind of Agree
Kind of Disagree
Really Disagree
Spring 2012 16% 21% 24% 39% Spring 2011 22% 18% 30% 31% Spring 2010 20% 19% 25% 36% Spring 2009 22% 20% 21% 37%
Fall 2008 19% 18% 25% 38% Spring 2008 20% 21% 25% 34%
Fall 2007 26% 17% 25% 33% Spring 2007 19% 16% 27% 37%
Fall 2006 19% 19% 22% 41%
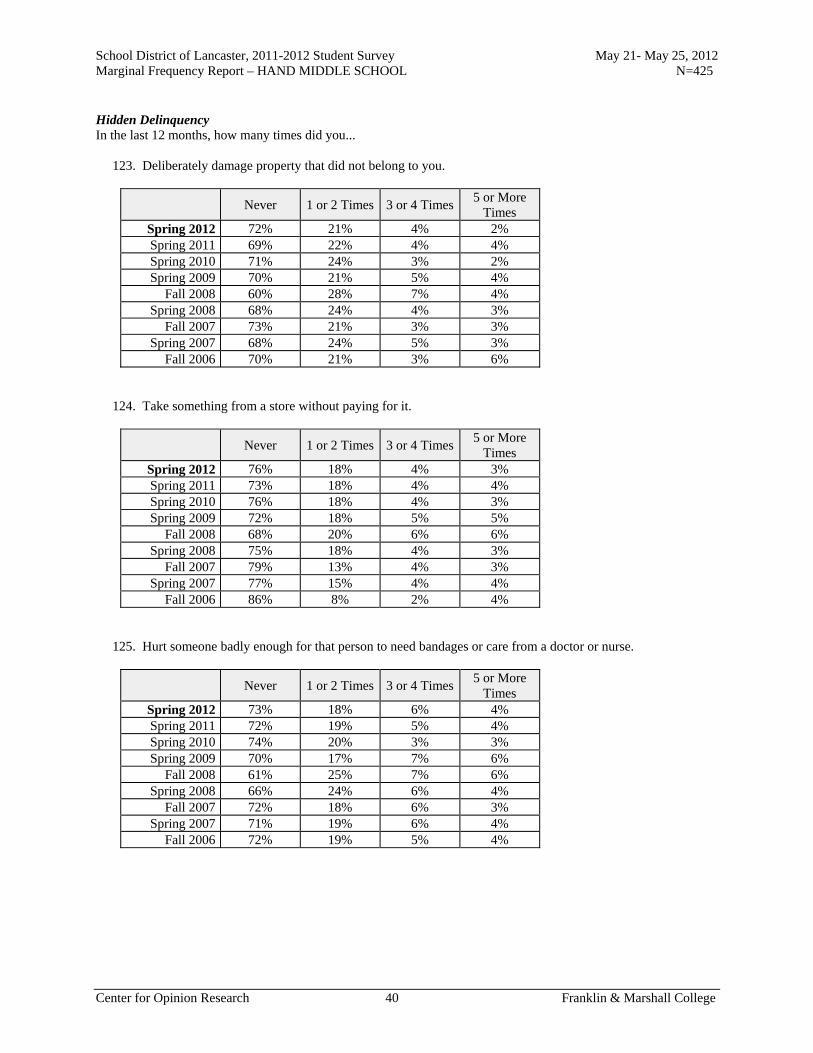
School District of Lancaster, 2011-2012 Student Survey May 21- May 25, 2012 Marginal Frequency Report – HAND MIDDLE SCHOOL N=425
Center for Opinion Research 40 Franklin & Marshall College
Hidden Delinquency In the last 12 months, how many times did you... 123. Deliberately damage property that did not belong to you.
Never 1 or 2 Times 3 or 4 Times5 or More
Times Spring 2012 72% 21% 4% 2% Spring 2011 69% 22% 4% 4% Spring 2010 71% 24% 3% 2% Spring 2009 70% 21% 5% 4%
Fall 2008 60% 28% 7% 4% Spring 2008 68% 24% 4% 3%
Fall 2007 73% 21% 3% 3% Spring 2007 68% 24% 5% 3%
Fall 2006 70% 21% 3% 6% 124. Take something from a store without paying for it.
Never 1 or 2 Times 3 or 4 Times5 or More
Times Spring 2012 76% 18% 4% 3% Spring 2011 73% 18% 4% 4% Spring 2010 76% 18% 4% 3% Spring 2009 72% 18% 5% 5%
Fall 2008 68% 20% 6% 6% Spring 2008 75% 18% 4% 3%
Fall 2007 79% 13% 4% 3% Spring 2007 77% 15% 4% 4%
Fall 2006 86% 8% 2% 4% 125. Hurt someone badly enough for that person to need bandages or care from a doctor or nurse.
Never 1 or 2 Times 3 or 4 Times5 or More
Times Spring 2012 73% 18% 6% 4% Spring 2011 72% 19% 5% 4% Spring 2010 74% 20% 3% 3% Spring 2009 70% 17% 7% 6%
Fall 2008 61% 25% 7% 6% Spring 2008 66% 24% 6% 4%
Fall 2007 72% 18% 6% 3% Spring 2007 71% 19% 6% 4%
Fall 2006 72% 19% 5% 4%
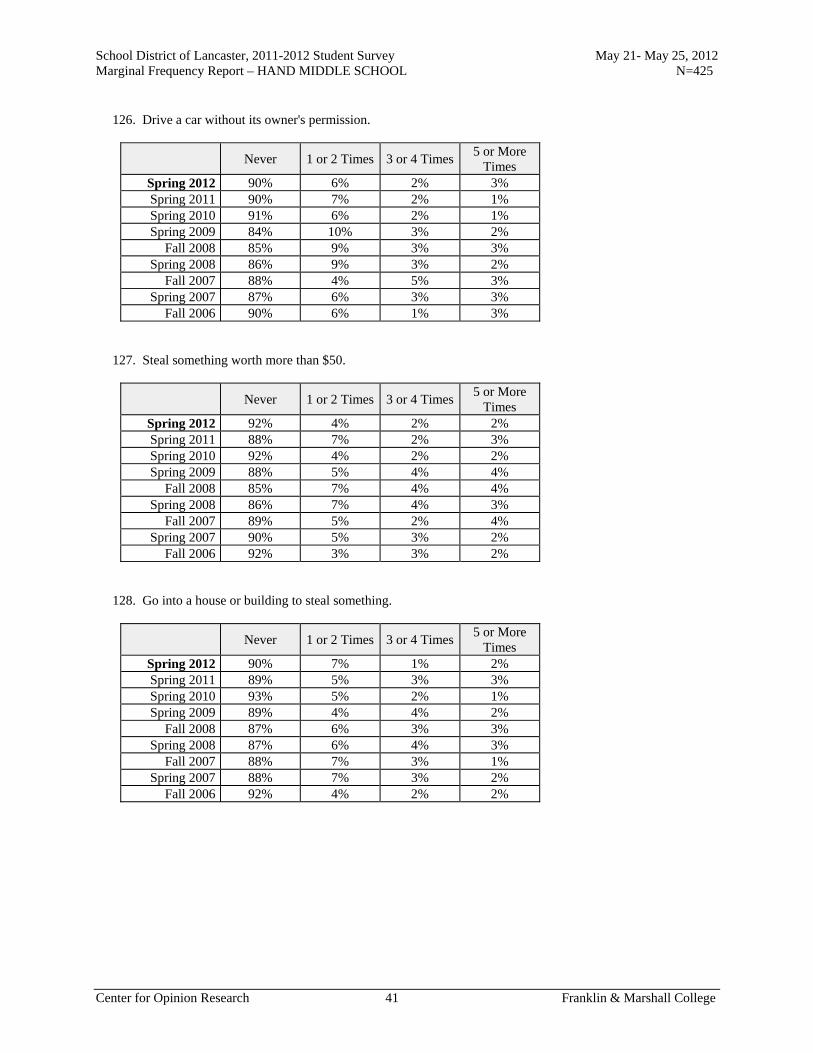
School District of Lancaster, 2011-2012 Student Survey May 21- May 25, 2012 Marginal Frequency Report – HAND MIDDLE SCHOOL N=425
Center for Opinion Research 41 Franklin & Marshall College
126. Drive a car without its owner's permission.
Never 1 or 2 Times 3 or 4 Times5 or More
Times Spring 2012 90% 6% 2% 3% Spring 2011 90% 7% 2% 1% Spring 2010 91% 6% 2% 1% Spring 2009 84% 10% 3% 2%
Fall 2008 85% 9% 3% 3% Spring 2008 86% 9% 3% 2%
Fall 2007 88% 4% 5% 3% Spring 2007 87% 6% 3% 3%
Fall 2006 90% 6% 1% 3% 127. Steal something worth more than $50.
Never 1 or 2 Times 3 or 4 Times5 or More
Times Spring 2012 92% 4% 2% 2% Spring 2011 88% 7% 2% 3% Spring 2010 92% 4% 2% 2% Spring 2009 88% 5% 4% 4%
Fall 2008 85% 7% 4% 4% Spring 2008 86% 7% 4% 3%
Fall 2007 89% 5% 2% 4% Spring 2007 90% 5% 3% 2%
Fall 2006 92% 3% 3% 2% 128. Go into a house or building to steal something.
Never 1 or 2 Times 3 or 4 Times5 or More
Times Spring 2012 90% 7% 1% 2% Spring 2011 89% 5% 3% 3% Spring 2010 93% 5% 2% 1% Spring 2009 89% 4% 4% 2%
Fall 2008 87% 6% 3% 3% Spring 2008 87% 6% 4% 3%
Fall 2007 88% 7% 3% 1% Spring 2007 88% 7% 3% 2%
Fall 2006 92% 4% 2% 2%
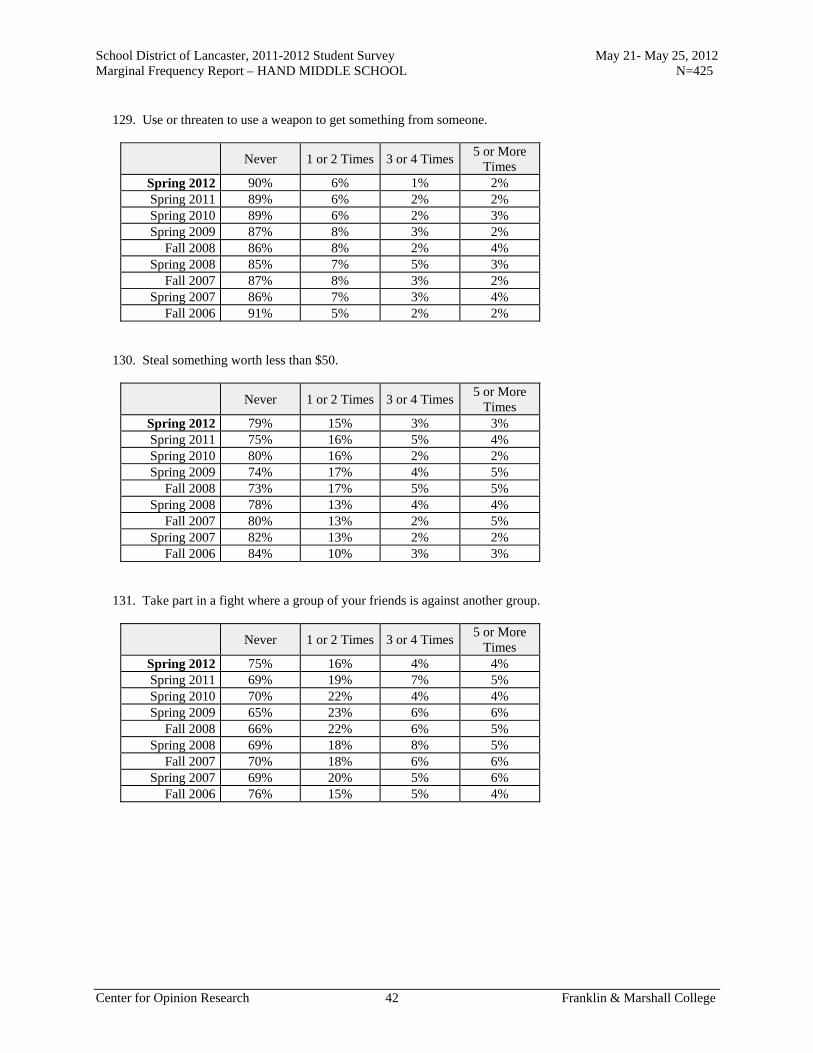
School District of Lancaster, 2011-2012 Student Survey May 21- May 25, 2012 Marginal Frequency Report – HAND MIDDLE SCHOOL N=425
Center for Opinion Research 42 Franklin & Marshall College
129. Use or threaten to use a weapon to get something from someone.
Never 1 or 2 Times 3 or 4 Times5 or More
Times Spring 2012 90% 6% 1% 2% Spring 2011 89% 6% 2% 2% Spring 2010 89% 6% 2% 3% Spring 2009 87% 8% 3% 2%
Fall 2008 86% 8% 2% 4% Spring 2008 85% 7% 5% 3%
Fall 2007 87% 8% 3% 2% Spring 2007 86% 7% 3% 4%
Fall 2006 91% 5% 2% 2% 130. Steal something worth less than $50.
Never 1 or 2 Times 3 or 4 Times5 or More
Times Spring 2012 79% 15% 3% 3% Spring 2011 75% 16% 5% 4% Spring 2010 80% 16% 2% 2% Spring 2009 74% 17% 4% 5%
Fall 2008 73% 17% 5% 5% Spring 2008 78% 13% 4% 4%
Fall 2007 80% 13% 2% 5% Spring 2007 82% 13% 2% 2%
Fall 2006 84% 10% 3% 3% 131. Take part in a fight where a group of your friends is against another group.
Never 1 or 2 Times 3 or 4 Times5 or More
Times Spring 2012 75% 16% 4% 4% Spring 2011 69% 19% 7% 5% Spring 2010 70% 22% 4% 4% Spring 2009 65% 23% 6% 6%
Fall 2008 66% 22% 6% 5% Spring 2008 69% 18% 8% 5%
Fall 2007 70% 18% 6% 6% Spring 2007 69% 20% 5% 6%
Fall 2006 76% 15% 5% 4%
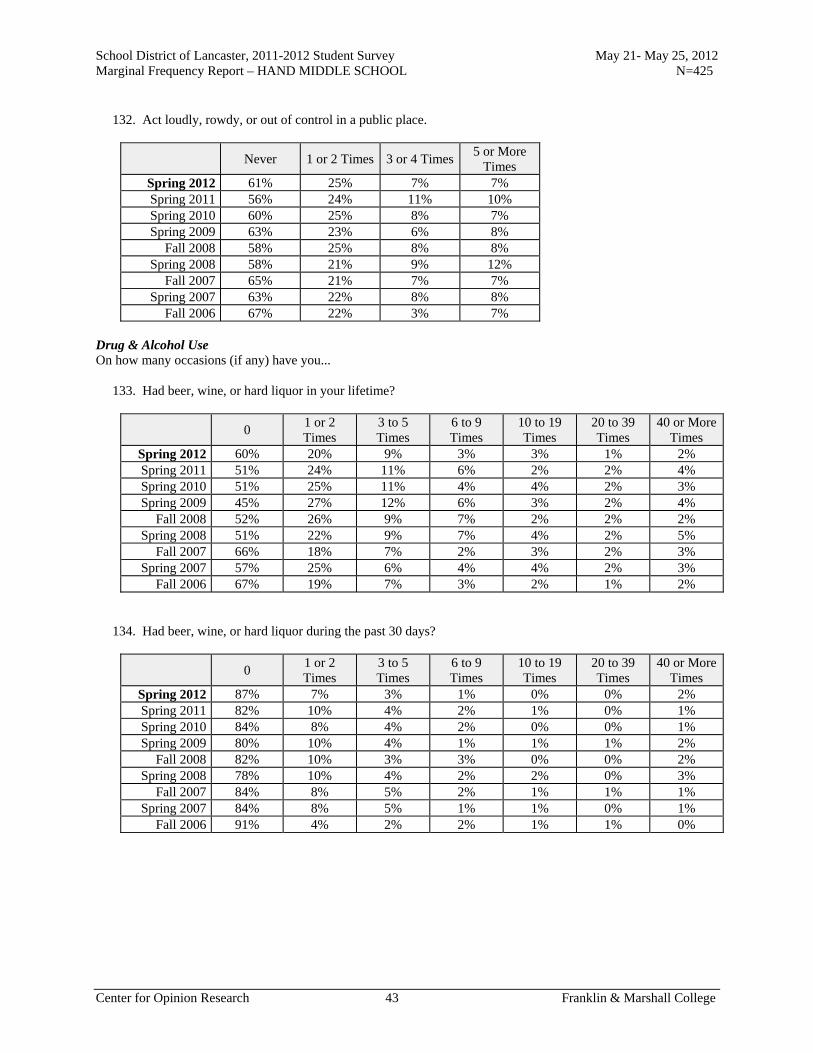
School District of Lancaster, 2011-2012 Student Survey May 21- May 25, 2012 Marginal Frequency Report – HAND MIDDLE SCHOOL N=425
Center for Opinion Research 43 Franklin & Marshall College
132. Act loudly, rowdy, or out of control in a public place.
Never 1 or 2 Times 3 or 4 Times5 or More
Times Spring 2012 61% 25% 7% 7% Spring 2011 56% 24% 11% 10% Spring 2010 60% 25% 8% 7% Spring 2009 63% 23% 6% 8%
Fall 2008 58% 25% 8% 8% Spring 2008 58% 21% 9% 12%
Fall 2007 65% 21% 7% 7% Spring 2007 63% 22% 8% 8%
Fall 2006 67% 22% 3% 7% Drug & Alcohol Use On how many occasions (if any) have you... 133. Had beer, wine, or hard liquor in your lifetime?
0 1 or 2 Times
3 to 5 Times
6 to 9 Times
10 to 19 Times
20 to 39 Times
40 or More Times
Spring 2012 60% 20% 9% 3% 3% 1% 2% Spring 2011 51% 24% 11% 6% 2% 2% 4% Spring 2010 51% 25% 11% 4% 4% 2% 3% Spring 2009 45% 27% 12% 6% 3% 2% 4%
Fall 2008 52% 26% 9% 7% 2% 2% 2% Spring 2008 51% 22% 9% 7% 4% 2% 5%
Fall 2007 66% 18% 7% 2% 3% 2% 3% Spring 2007 57% 25% 6% 4% 4% 2% 3%
Fall 2006 67% 19% 7% 3% 2% 1% 2% 134. Had beer, wine, or hard liquor during the past 30 days?
0 1 or 2 Times
3 to 5 Times
6 to 9 Times
10 to 19 Times
20 to 39 Times
40 or More Times
Spring 2012 87% 7% 3% 1% 0% 0% 2% Spring 2011 82% 10% 4% 2% 1% 0% 1% Spring 2010 84% 8% 4% 2% 0% 0% 1% Spring 2009 80% 10% 4% 1% 1% 1% 2%
Fall 2008 82% 10% 3% 3% 0% 0% 2% Spring 2008 78% 10% 4% 2% 2% 0% 3%
Fall 2007 84% 8% 5% 2% 1% 1% 1% Spring 2007 84% 8% 5% 1% 1% 0% 1%
Fall 2006 91% 4% 2% 2% 1% 1% 0%
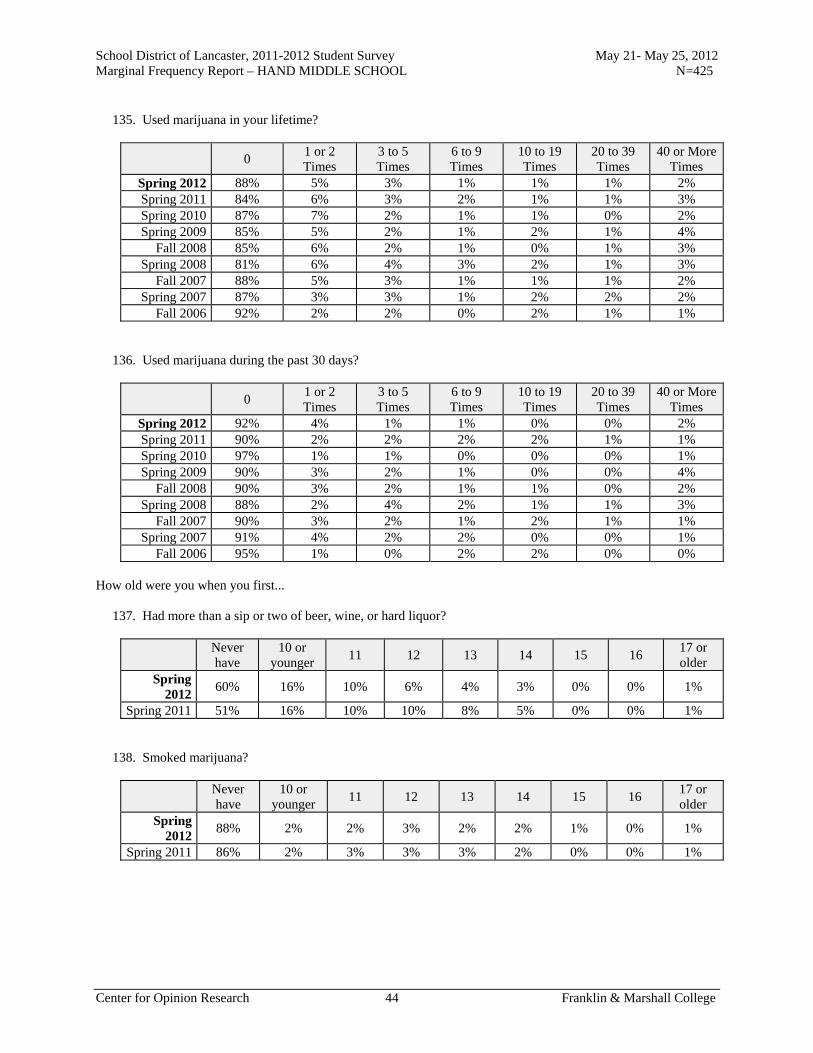
School District of Lancaster, 2011-2012 Student Survey May 21- May 25, 2012 Marginal Frequency Report – HAND MIDDLE SCHOOL N=425
Center for Opinion Research 44 Franklin & Marshall College
135. Used marijuana in your lifetime?
0 1 or 2 Times
3 to 5 Times
6 to 9 Times
10 to 19 Times
20 to 39 Times
40 or More Times
Spring 2012 88% 5% 3% 1% 1% 1% 2% Spring 2011 84% 6% 3% 2% 1% 1% 3% Spring 2010 87% 7% 2% 1% 1% 0% 2% Spring 2009 85% 5% 2% 1% 2% 1% 4%
Fall 2008 85% 6% 2% 1% 0% 1% 3% Spring 2008 81% 6% 4% 3% 2% 1% 3%
Fall 2007 88% 5% 3% 1% 1% 1% 2% Spring 2007 87% 3% 3% 1% 2% 2% 2%
Fall 2006 92% 2% 2% 0% 2% 1% 1% 136. Used marijuana during the past 30 days?
0 1 or 2 Times
3 to 5 Times
6 to 9 Times
10 to 19 Times
20 to 39 Times
40 or More Times
Spring 2012 92% 4% 1% 1% 0% 0% 2% Spring 2011 90% 2% 2% 2% 2% 1% 1% Spring 2010 97% 1% 1% 0% 0% 0% 1% Spring 2009 90% 3% 2% 1% 0% 0% 4%
Fall 2008 90% 3% 2% 1% 1% 0% 2% Spring 2008 88% 2% 4% 2% 1% 1% 3%
Fall 2007 90% 3% 2% 1% 2% 1% 1% Spring 2007 91% 4% 2% 2% 0% 0% 1%
Fall 2006 95% 1% 0% 2% 2% 0% 0% How old were you when you first... 137. Had more than a sip or two of beer, wine, or hard liquor?
Never have
10 or younger
11 12 13 14 15 16 17 or older
Spring 2012
60% 16% 10% 6% 4% 3% 0% 0% 1%
Spring 2011 51% 16% 10% 10% 8% 5% 0% 0% 1% 138. Smoked marijuana?
Never have
10 or younger
11 12 13 14 15 16 17 or older
Spring 2012
88% 2% 2% 3% 2% 2% 1% 0% 1%
Spring 2011 86% 2% 3% 3% 3% 2% 0% 0% 1%
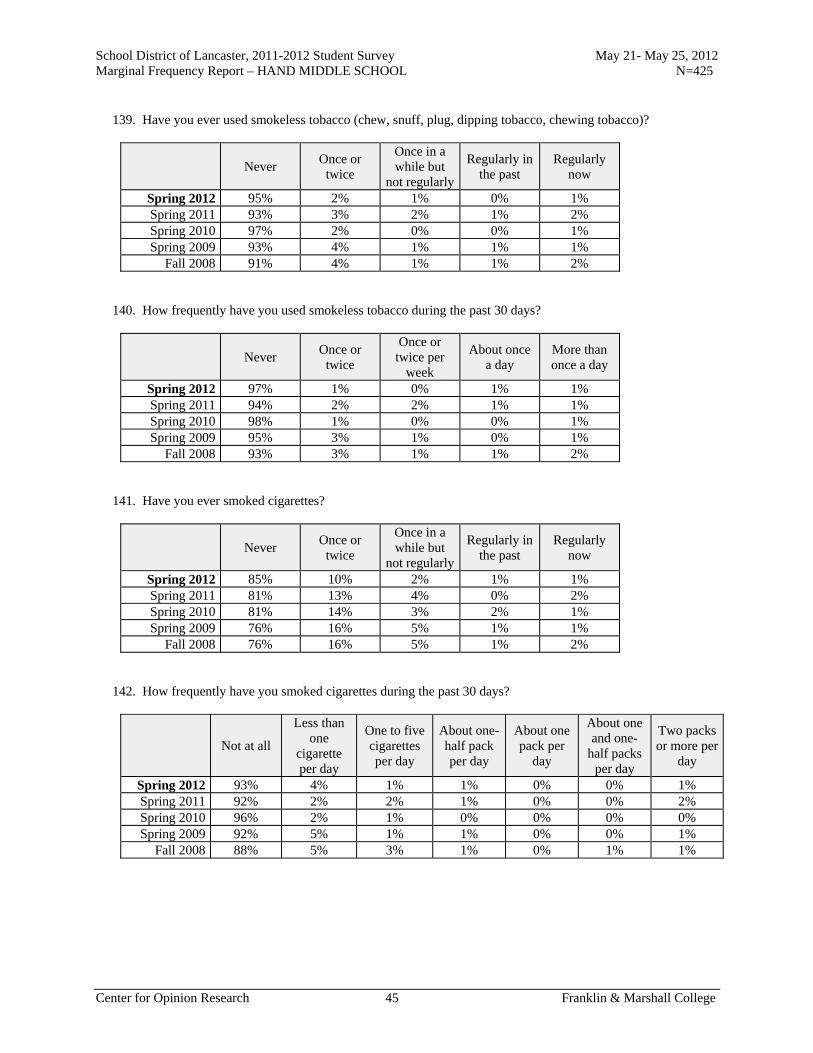
School District of Lancaster, 2011-2012 Student Survey May 21- May 25, 2012 Marginal Frequency Report – HAND MIDDLE SCHOOL N=425
Center for Opinion Research 45 Franklin & Marshall College
139. Have you ever used smokeless tobacco (chew, snuff, plug, dipping tobacco, chewing tobacco)?
Never Once or
twice
Once in a while but
not regularly
Regularly in the past
Regularly now
Spring 2012 95% 2% 1% 0% 1% Spring 2011 93% 3% 2% 1% 2% Spring 2010 97% 2% 0% 0% 1% Spring 2009 93% 4% 1% 1% 1%
Fall 2008 91% 4% 1% 1% 2% 140. How frequently have you used smokeless tobacco during the past 30 days?
Never Once or
twice
Once or twice per
week
About once a day
More than once a day
Spring 2012 97% 1% 0% 1% 1% Spring 2011 94% 2% 2% 1% 1% Spring 2010 98% 1% 0% 0% 1% Spring 2009 95% 3% 1% 0% 1%
Fall 2008 93% 3% 1% 1% 2% 141. Have you ever smoked cigarettes?
Never Once or
twice
Once in a while but
not regularly
Regularly in the past
Regularly now
Spring 2012 85% 10% 2% 1% 1% Spring 2011 81% 13% 4% 0% 2% Spring 2010 81% 14% 3% 2% 1% Spring 2009 76% 16% 5% 1% 1%
Fall 2008 76% 16% 5% 1% 2% 142. How frequently have you smoked cigarettes during the past 30 days?
Not at all
Less than one
cigarette per day
One to five cigarettes per day
About one-half pack per day
About one pack per
day
About one and one-
half packs per day
Two packs or more per
day
Spring 2012 93% 4% 1% 1% 0% 0% 1% Spring 2011 92% 2% 2% 1% 0% 0% 2% Spring 2010 96% 2% 1% 0% 0% 0% 0% Spring 2009 92% 5% 1% 1% 0% 0% 1%
Fall 2008 88% 5% 3% 1% 0% 1% 1%
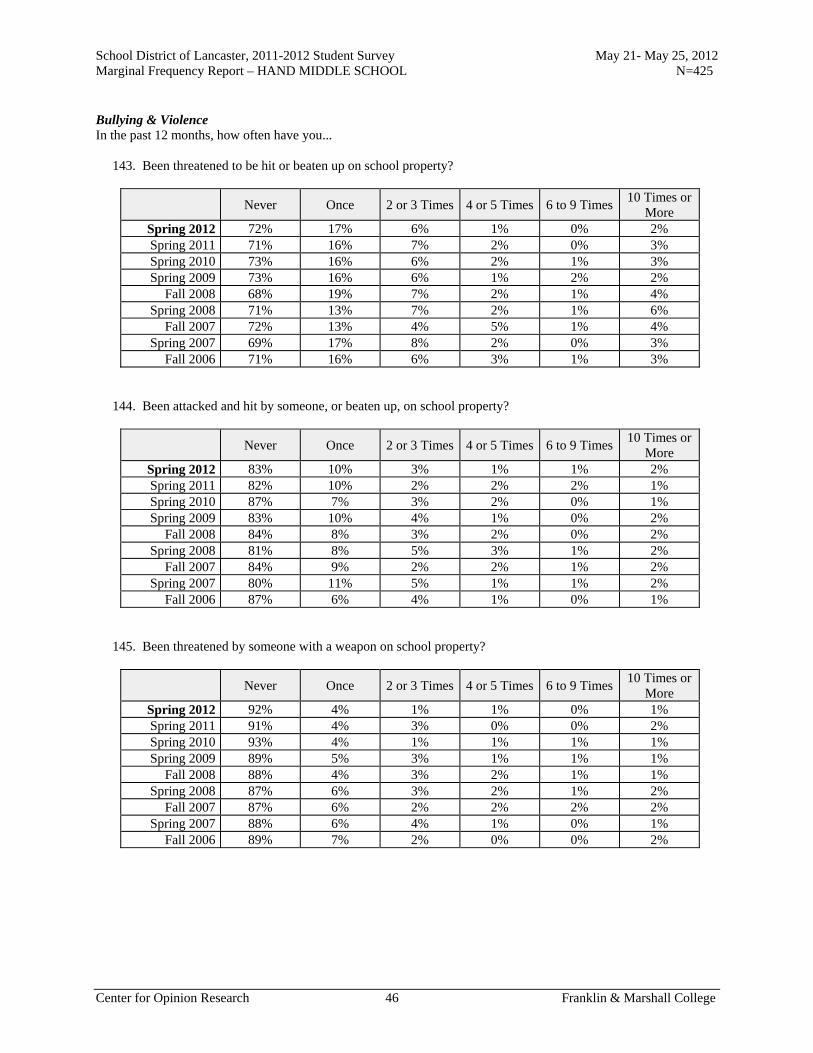
School District of Lancaster, 2011-2012 Student Survey May 21- May 25, 2012 Marginal Frequency Report – HAND MIDDLE SCHOOL N=425
Center for Opinion Research 46 Franklin & Marshall College
Bullying & Violence In the past 12 months, how often have you... 143. Been threatened to be hit or beaten up on school property?
Never Once 2 or 3 Times 4 or 5 Times 6 to 9 Times 10 Times or
More Spring 2012 72% 17% 6% 1% 0% 2% Spring 2011 71% 16% 7% 2% 0% 3% Spring 2010 73% 16% 6% 2% 1% 3% Spring 2009 73% 16% 6% 1% 2% 2%
Fall 2008 68% 19% 7% 2% 1% 4% Spring 2008 71% 13% 7% 2% 1% 6%
Fall 2007 72% 13% 4% 5% 1% 4% Spring 2007 69% 17% 8% 2% 0% 3%
Fall 2006 71% 16% 6% 3% 1% 3% 144. Been attacked and hit by someone, or beaten up, on school property?
Never Once 2 or 3 Times 4 or 5 Times 6 to 9 Times 10 Times or
More Spring 2012 83% 10% 3% 1% 1% 2% Spring 2011 82% 10% 2% 2% 2% 1% Spring 2010 87% 7% 3% 2% 0% 1% Spring 2009 83% 10% 4% 1% 0% 2%
Fall 2008 84% 8% 3% 2% 0% 2% Spring 2008 81% 8% 5% 3% 1% 2%
Fall 2007 84% 9% 2% 2% 1% 2% Spring 2007 80% 11% 5% 1% 1% 2%
Fall 2006 87% 6% 4% 1% 0% 1% 145. Been threatened by someone with a weapon on school property?
Never Once 2 or 3 Times 4 or 5 Times 6 to 9 Times 10 Times or
More Spring 2012 92% 4% 1% 1% 0% 1% Spring 2011 91% 4% 3% 0% 0% 2% Spring 2010 93% 4% 1% 1% 1% 1% Spring 2009 89% 5% 3% 1% 1% 1%
Fall 2008 88% 4% 3% 2% 1% 1% Spring 2008 87% 6% 3% 2% 1% 2%
Fall 2007 87% 6% 2% 2% 2% 2% Spring 2007 88% 6% 4% 1% 0% 1%
Fall 2006 89% 7% 2% 0% 0% 2%

School District of Lancaster, 2011-2012 Student Survey May 21- May 25, 2012 Marginal Frequency Report – HAND MIDDLE SCHOOL N=425
Center for Opinion Research 47 Franklin & Marshall College
146. Been attacked by someone with a weapon on school property?
Never Once 2 or 3 Times 4 or 5 Times 6 to 9 Times 10 Times or
More Spring 2012 95% 2% 1% 1% 0% 1% Spring 2011 92% 3% 1% 2% 1% 2% Spring 2010 96% 2% 1% 0% 1% 1% Spring 2009 92% 3% 3% 0% 1% 1%
Fall 2008 91% 3% 1% 2% 1% 2% Spring 2008 90% 3% 3% 2% 1% 1%
Fall 2007 90% 4% 2% 2% 1% 2% Spring 2007 91% 4% 2% 2% 0% 1%
Fall 2006 93% 3% 2% 0% 1% 1% Cyberbullying So far this school year, have you... 147. Received mean or nasty messages from someone?
No Yes, once or
twice Yes, every
so often Yes, all the
time Spring 2012 73% 20% 4% 3% Spring 2011 71% 23% 3% 3%
148. Received online messages that made you afraid for your safety?
No Yes, once or
twice Yes, every
so often Yes, all the
time Spring 2012 91% 6% 2% 1% Spring 2011 87% 8% 3% 2%
149. Had someone send or post gossip, rumors, or other hurtful material about you?
No Yes, once or
twice Yes, every
so often Yes, all the
time Spring 2012 77% 18% 3% 3% Spring 2011 75% 18% 3% 4%
150. Had someone share your personal secrets or pictures online without your permission?
No Yes, once or
twice Yes, every
so often Yes, all the
time Spring 2012 87% 10% 1% 2% Spring 2011 86% 9% 2% 3%

School District of Lancaster, 2011-2012 Student Survey May 21- May 25, 2012 Marginal Frequency Report – HAND MIDDLE SCHOOL N=425
Center for Opinion Research 48 Franklin & Marshall College
151. Do you use the Internet at home, or not?
Yes No Spring 2012 86% 14% Spring 2011 90% 10%
152. How many hours do you normally spend online using the Internet each day?
Less than 1
hour 1 hour 2 hours 3 hours
4 or more hours
Spring 2012 26% 17% 20% 9% 28% Spring 2011 25% 17% 22% 11% 24%

Report R
Marginal Frequency Report Lincoln Middle School

School District of Lancaster, 2011-2012 Student Survey May 21-May 25, 2012 Marginal Frequency Report – LINCOLN MIDDLE SCHOOL N=455
Center for Opinion Research 1 Franklin & Marshall College
School Climate Do you agree or disagree with the following statements? 1. I feel safe at this school.
Really Agree
Kind of Agree
Kind of Disagree
Really Disagree
Spring 2012 30% 53% 12% 5% Spring 2011 33% 53% 10% 4% Spring 2010 33% 52% 9% 6% Spring 2009 24% 54% 15% 6%
Fall 2008 35% 49% 11% 5% Spring 2008 28% 50% 15% 8%
Fall 2007 33% 51% 11% 5% Spring 2007 28% 50% 14% 7%
Fall 2006 30% 57% 9% 4% 2. I feel safe going to and from school.
Really Agree
Kind of Agree
Kind of Disagree
Really Disagree
Spring 2012 43% 40% 12% 6% Spring 2011 42% 41% 13% 4% Spring 2010 39% 44% 11% 6% Spring 2009 34% 48% 13% 5%
Fall 2008 45% 37% 13% 6% Spring 2008 37% 44% 12% 6%
Fall 2007 44% 39% 11% 6% Spring 2007 40% 43% 13% 4%
Fall 2006 39% 44% 12% 5% 3. Students get along well with each other.
Really Agree
Kind of Agree
Kind of Disagree
Really Disagree
Spring 2012 6% 39% 34% 21% Spring 2011 6% 42% 38% 15% Spring 2010 7% 35% 39% 19% Spring 2009 4% 35% 40% 21%
Fall 2008 10% 38% 38% 14% Spring 2008 5% 35% 41% 20%
Fall 2007 7% 38% 37% 19% Spring 2007 6% 39% 38% 17%
Fall 2006 8% 41% 35% 17%

School District of Lancaster, 2011-2012 Student Survey May 21-May 25, 2012 Marginal Frequency Report – LINCOLN MIDDLE SCHOOL N=455
Center for Opinion Research 2 Franklin & Marshall College
4. Students get along well with teachers.
Really Agree
Kind of Agree
Kind of Disagree
Really Disagree
Spring 2012 8% 37% 36% 20% Spring 2011 7% 41% 38% 14% Spring 2010 7% 37% 40% 16% Spring 2009 6% 38% 40% 17%
Fall 2008 11% 38% 38% 13% Spring 2008 6% 42% 37% 15%
Fall 2007 11% 45% 28% 16% Spring 2007 10% 46% 33% 12%
Fall 2006 13% 45% 31% 11% 5. I like my school.
Really Agree
Kind of Agree
Kind of Disagree
Really Disagree
Spring 2012 32% 39% 16% 14% Spring 2011 29% 43% 16% 12% Spring 2010 26% 42% 20% 12% Spring 2009 22% 38% 24% 15%
Fall 2008 36% 37% 14% 13% Spring 2008 23% 45% 20% 12%
Fall 2007 37% 40% 14% 10% Spring 2007 31% 43% 15% 11%
Fall 2006 37% 42% 12% 8% 6. I like my teachers.
Really Agree
Kind of Agree
Kind of Disagree
Really Disagree
Spring 2012 33% 38% 19% 10% Spring 2011 30% 47% 16% 6% Spring 2010 25% 44% 22% 9% Spring 2009 23% 48% 21% 8%
Fall 2008 32% 46% 16% 7% Spring 2008 26% 45% 21% 8%
Fall 2007 35% 44% 14% 6% Spring 2007 35% 45% 14% 6%
Fall 2006 42% 46% 8% 5%

School District of Lancaster, 2011-2012 Student Survey May 21-May 25, 2012 Marginal Frequency Report – LINCOLN MIDDLE SCHOOL N=455
Center for Opinion Research 3 Franklin & Marshall College
7. There is a teacher or some other adult at this school who really cares about me.
Really Agree
Kind of Agree
Kind of Disagree
Really Disagree
Spring 2012 48% 32% 13% 7% Spring 2011 48% 37% 10% 5% Spring 2010 43% 36% 15% 5% Spring 2009 38% 39% 15% 8%
Fall 2008 45% 34% 13% 8% Spring 2008 36% 40% 16% 8%
Fall 2007 38% 34% 17% 10% Spring 2007 45% 34% 13% 8%
Fall 2006 39% 41% 13% 7% 8. There is a teacher or some other adult at this school who cares when I am not here.
Really Agree
Kind of Agree
Kind of Disagree
Really Disagree
Spring 2012 30% 33% 22% 14% Spring 2011 31% 36% 22% 12% Spring 2010 29% 35% 24% 12% Spring 2009 25% 31% 26% 17%
Fall 2008 29% 32% 24% 16% Spring 2008 20% 38% 25% 17%
Fall 2007 22% 36% 23% 19% Spring 2007 24% 38% 22% 16%
Fall 2006 24% 34% 25% 17% 9. There is a teacher or some other adult at this school who listens to me when I have something to say.
Really Agree
Kind of Agree
Kind of Disagree
Really Disagree
Spring 2012 46% 34% 14% 6% Spring 2011 47% 38% 9% 6% Spring 2010 39% 42% 13% 6% Spring 2009 39% 38% 15% 8%
Fall 2008 48% 36% 10% 7% Spring 2008 32% 45% 15% 8%
Fall 2007 40% 40% 13% 7% Spring 2007 47% 36% 12% 5%
Fall 2006 46% 36% 12% 7%

School District of Lancaster, 2011-2012 Student Survey May 21-May 25, 2012 Marginal Frequency Report – LINCOLN MIDDLE SCHOOL N=455
Center for Opinion Research 4 Franklin & Marshall College
10. There is a teacher or some other adult at this school who tells me when I do a good job.
Really Agree
Kind of Agree
Kind of Disagree
Really Disagree
Spring 2012 56% 32% 7% 5% Spring 2011 54% 36% 6% 4% Spring 2010 52% 34% 9% 5% Spring 2009 43% 41% 11% 6%
Fall 2008 52% 32% 11% 4% Spring 2008 36% 44% 14% 7%
Fall 2007 43% 40% 10% 7% Spring 2007 48% 38% 10% 4%
Fall 2006 57% 32% 8% 3% 11. There is a teacher or some other adult at this school who always wants me to do my best.
Really Agree
Kind of Agree
Kind of Disagree
Really Disagree
Spring 2012 66% 25% 6% 4% Spring 2011 65% 28% 4% 2% Spring 2010 60% 30% 7% 3% Spring 2009 54% 33% 8% 6%
Fall 2008 60% 28% 7% 4% Spring 2008 50% 35% 10% 4%
Fall 2007 58% 30% 9% 4% Spring 2007 67% 26% 5% 2%
Fall 2006 70% 24% 5% 1% 12. There is a teacher or some other adult at this school who believes that I will be a success.
Really Agree
Kind of Agree
Kind of Disagree
Really Disagree
Spring 2012 54% 32% 9% 4% Spring 2011 55% 34% 7% 5% Spring 2010 50% 36% 10% 4% Spring 2009 45% 38% 11% 6%
Fall 2008 52% 33% 10% 5% Spring 2008 39% 42% 13% 6%
Fall 2007 50% 33% 11% 6% Spring 2007 52% 36% 7% 4%
Fall 2006 50% 35% 11% 3%

School District of Lancaster, 2011-2012 Student Survey May 21-May 25, 2012 Marginal Frequency Report – LINCOLN MIDDLE SCHOOL N=455
Center for Opinion Research 5 Franklin & Marshall College
13. Students in this school really listen to teachers.
Really Agree
Kind of Agree
Kind of Disagree
Really Disagree
Spring 2012 3% 25% 43% 29% Spring 2011 6% 30% 44% 20% Spring 2010 7% 27% 44% 22% Spring 2009 3% 28% 47% 22%
Fall 2008 4% 31% 45% 19% Spring 2008 5% 26% 44% 25%
Fall 2007 5% 34% 39% 22% Spring 2007 1% 32% 46% 21%
Fall 2006 5% 34% 40% 21% 14. Most teachers make learning interesting.
Really Agree
Kind of Agree
Kind of Disagree
Really Disagree
Spring 2012 21% 41% 23% 15% Spring 2011 20% 43% 28% 9% Spring 2010 18% 43% 26% 12% Spring 2009 16% 42% 29% 13%
Fall 2008 23% 43% 22% 12% Spring 2008 16% 41% 28% 15%
Fall 2007 23% 48% 18% 11% Spring 2007 20% 46% 25% 9%
Fall 2006 30% 47% 17% 6% 15. This school is always getting better.
Really Agree
Kind of Agree
Kind of Disagree
Really Disagree
Spring 2012 10% 35% 34% 21% Spring 2011 11% 38% 33% 19% Spring 2010 12% 33% 36% 19% Spring 2009 9% 29% 37% 25%
Fall 2008 13% 32% 33% 22% Spring 2008 9% 29% 38% 25%
Fall 2007 13% 37% 32% 18% Spring 2007 10% 32% 36% 22%
Fall 2006 15% 46% 25% 14%
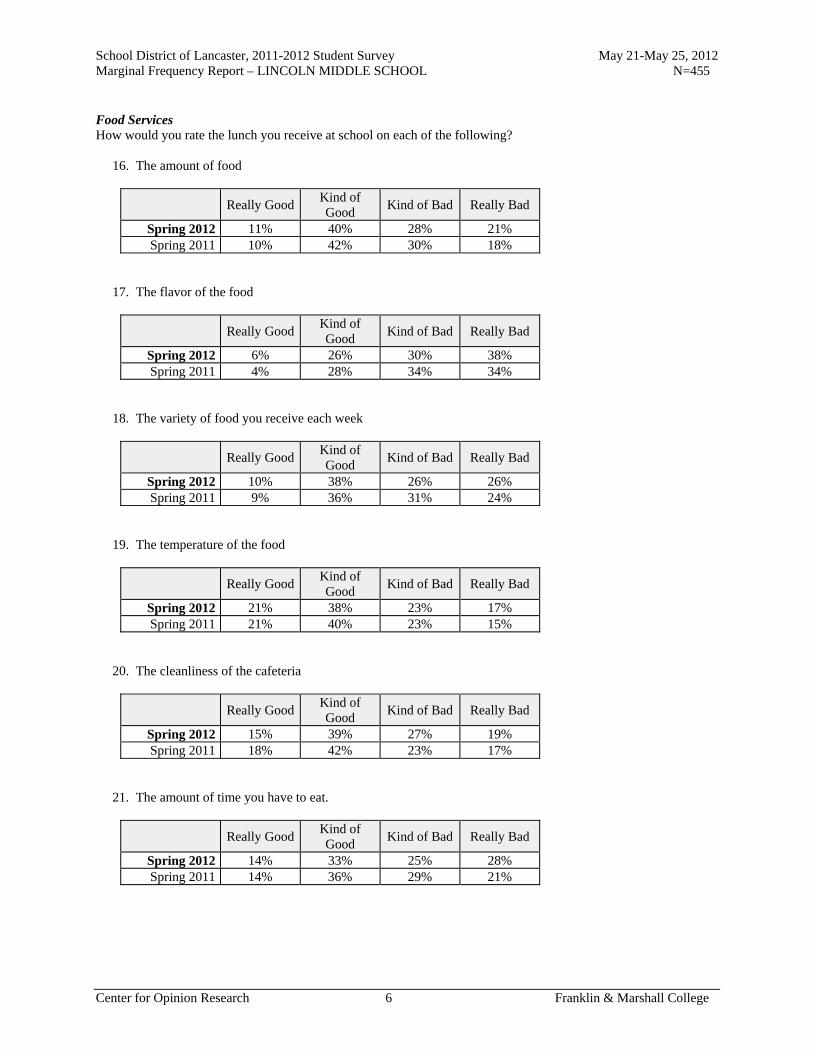
School District of Lancaster, 2011-2012 Student Survey May 21-May 25, 2012 Marginal Frequency Report – LINCOLN MIDDLE SCHOOL N=455
Center for Opinion Research 6 Franklin & Marshall College
Food Services How would you rate the lunch you receive at school on each of the following? 16. The amount of food
Really Good Kind of Good
Kind of Bad Really Bad
Spring 2012 11% 40% 28% 21% Spring 2011 10% 42% 30% 18%
17. The flavor of the food
Really Good Kind of Good
Kind of Bad Really Bad
Spring 2012 6% 26% 30% 38% Spring 2011 4% 28% 34% 34%
18. The variety of food you receive each week
Really Good Kind of Good
Kind of Bad Really Bad
Spring 2012 10% 38% 26% 26% Spring 2011 9% 36% 31% 24%
19. The temperature of the food
Really Good Kind of Good
Kind of Bad Really Bad
Spring 2012 21% 38% 23% 17% Spring 2011 21% 40% 23% 15%
20. The cleanliness of the cafeteria
Really Good Kind of Good
Kind of Bad Really Bad
Spring 2012 15% 39% 27% 19% Spring 2011 18% 42% 23% 17%
21. The amount of time you have to eat.
Really Good Kind of Good
Kind of Bad Really Bad
Spring 2012 14% 33% 25% 28% Spring 2011 14% 36% 29% 21%

School District of Lancaster, 2011-2012 Student Survey May 21-May 25, 2012 Marginal Frequency Report – LINCOLN MIDDLE SCHOOL N=455
Center for Opinion Research 7 Franklin & Marshall College
Readiness and Emergency Management 22. Has anyone from your school spoken with you about what to do in the event of a school emergency, or not?
Yes No Spring 2012 88% 12% Spring 2011 84% 16%
Do you agree or disagree with the following statement? 23. I know what to do if there is a school emergency.
Really Agree
Kind of Agree
Kind of Disagree
Really Disagree
Spring 2012 56% 37% 3% 3% Spring 2011 59% 35% 5% 2%
Peer Academic Climate Do you agree or disagree with the following statements? 24. Most of my friends want to do well at school.
Really Agree
Kind of Agree
Kind of Disagree
Really Disagree
Spring 2012 34% 47% 15% 4% Spring 2011 37% 50% 10% 4% Spring 2010 31% 47% 18% 5% Spring 2009 31% 48% 16% 4%
Fall 2008 38% 43% 14% 5% Spring 2008 36% 47% 13% 4%
Fall 2007 40% 47% 8% 4% Spring 2007 40% 44% 12% 4%
Fall 2006 41% 45% 11% 4% 25. Most of my friends want to go to college.
Really Agree
Kind of Agree
Kind of Disagree
Really Disagree
Spring 2012 41% 41% 15% 3% Spring 2011 42% 43% 11% 3% Spring 2010 42% 41% 13% 4% Spring 2009 40% 42% 13% 6%
Fall 2008 43% 40% 12% 4% Spring 2008 36% 47% 14% 3%
Fall 2007 43% 41% 12% 4% Spring 2007 44% 40% 11% 4%
Fall 2006 44% 41% 10% 5%

School District of Lancaster, 2011-2012 Student Survey May 21-May 25, 2012 Marginal Frequency Report – LINCOLN MIDDLE SCHOOL N=455
Center for Opinion Research 8 Franklin & Marshall College
26. Most of my friends think education is a waste of time.
Really Agree
Kind of Agree
Kind of Disagree
Really Disagree
Spring 2012 12% 28% 31% 29% Spring 2011 10% 25% 38% 27% Spring 2010 12% 22% 35% 30% Spring 2009 10% 23% 38% 29%
Fall 2008 13% 22% 32% 33% Spring 2008 11% 24% 36% 29%
Fall 2007 11% 24% 36% 29% Spring 2007 8% 25% 32% 35%
Fall 2006 13% 28% 26% 32% 27. Most of my friends want to leave school as soon as possible.
Really Agree
Kind of Agree
Kind of Disagree
Really Disagree
Spring 2012 22% 30% 23% 24% Spring 2011 20% 24% 30% 26% Spring 2010 20% 22% 30% 28% Spring 2009 15% 23% 29% 34%
Fall 2008 20% 23% 25% 32% Spring 2008 14% 26% 30% 30%
Fall 2007 21% 26% 25% 28% Spring 2007 20% 26% 23% 30%
Fall 2006 26% 26% 23% 24% 28. My friends tell me to leave school and get a job.
Really Agree
Kind of Agree
Kind of Disagree
Really Disagree
Spring 2012 2% 6% 21% 72% Spring 2011 2% 6% 16% 75% Spring 2010 5% 9% 16% 71% Spring 2009 3% 4% 16% 77%
Fall 2008 4% 7% 14% 75% Spring 2008 4% 6% 15% 75%
Fall 2007 2% 5% 13% 80% Spring 2007 3% 4% 11% 83%
Fall 2006 3% 6% 14% 77%

School District of Lancaster, 2011-2012 Student Survey May 21-May 25, 2012 Marginal Frequency Report – LINCOLN MIDDLE SCHOOL N=455
Center for Opinion Research 9 Franklin & Marshall College
Academic Self-efficacy Do you agree or disagree with the following statements? 29. I am a good science student.
Really Agree
Kind of Agree
Kind of Disagree
Really Disagree
Spring 2012 22% 43% 23% 12% Spring 2011 22% 44% 19% 15% Spring 2010 19% 46% 20% 15% Spring 2009 19% 41% 24% 16%
Fall 2008 30% 42% 18% 10% Spring 2008 21% 47% 21% 12%
Fall 2007 33% 47% 11% 10% Spring 2007 25% 50% 16% 9%
Fall 2006 26% 51% 15% 7% 30. Sometimes I think an assignment is easy when the other students think it is hard.
Really Agree
Kind of Agree
Kind of Disagree
Really Disagree
Spring 2012 39% 39% 16% 6% Spring 2011 38% 42% 14% 7% Spring 2010 38% 40% 14% 8% Spring 2009 32% 49% 14% 5%
Fall 2008 43% 39% 13% 5% Spring 2008 35% 45% 14% 6%
Fall 2007 36% 45% 12% 7% Spring 2007 38% 46% 12% 4%
Fall 2006 40% 43% 11% 6% 31. I am good social studies student.
Really Agree
Kind of Agree
Kind of Disagree
Really Disagree
Spring 2012 32% 43% 16% 9% Spring 2011 36% 44% 13% 7% Spring 2010 37% 41% 13% 9% Spring 2009 35% 44% 12% 9%
Fall 2008 38% 42% 14% 6% Spring 2008 33% 39% 20% 8%
Fall 2007 37% 42% 14% 7% Spring 2007 38% 42% 14% 6%
Fall 2006 36% 44% 14% 5%

School District of Lancaster, 2011-2012 Student Survey May 21-May 25, 2012 Marginal Frequency Report – LINCOLN MIDDLE SCHOOL N=455
Center for Opinion Research 10 Franklin & Marshall College
32. My teacher thinks I am smart.
Really Agree
Kind of Agree
Kind of Disagree
Really Disagree
Spring 2012 47% 35% 14% 4% Spring 2011 50% 42% 6% 3% Spring 2010 45% 38% 12% 5% Spring 2009 39% 43% 12% 6%
Fall 2008 44% 40% 12% 5% Spring 2008 42% 39% 12% 6%
Fall 2007 44% 41% 10% 4% Spring 2007 45% 39% 12% 4%
Fall 2006 41% 43% 13% 4% 33. I am a good math student.
Really Agree
Kind of Agree
Kind of Disagree
Really Disagree
Spring 2012 43% 38% 12% 7% Spring 2011 45% 36% 14% 6% Spring 2010 45% 40% 9% 7% Spring 2009 45% 38% 12% 5%
Fall 2008 48% 39% 7% 5% Spring 2008 42% 35% 13% 10%
Fall 2007 44% 33% 14% 8% Spring 2007 41% 40% 12% 7%
Fall 2006 40% 37% 14% 9% 34. My classmates usually get better grades than I do.
Really Agree
Kind of Agree
Kind of Disagree
Really Disagree
Spring 2012 14% 36% 36% 14% Spring 2011 14% 36% 35% 15% Spring 2010 12% 35% 39% 14% Spring 2009 11% 32% 43% 15%
Fall 2008 12% 33% 41% 14% Spring 2008 15% 37% 34% 14%
Fall 2007 17% 38% 35% 10% Spring 2007 13% 34% 40% 13%
Fall 2006 19% 39% 29% 13%

School District of Lancaster, 2011-2012 Student Survey May 21-May 25, 2012 Marginal Frequency Report – LINCOLN MIDDLE SCHOOL N=455
Center for Opinion Research 11 Franklin & Marshall College
35. I usually understand my homework assignments.
Really Agree
Kind of Agree
Kind of Disagree
Really Disagree
Spring 2012 31% 47% 17% 4% Spring 2011 33% 48% 16% 4% Spring 2010 32% 48% 14% 6% Spring 2009 32% 47% 17% 4%
Fall 2008 35% 50% 13% 3% Spring 2008 33% 47% 14% 6%
Fall 2007 37% 46% 12% 6% Spring 2007 33% 49% 14% 4%
Fall 2006 34% 48% 12% 5% 36. I could get the best grades in class if I tried hard enough.
Really Agree
Kind of Agree
Kind of Disagree
Really Disagree
Spring 2012 67% 25% 6% 3% Spring 2011 66% 25% 8% 2% Spring 2010 60% 27% 8% 4% Spring 2009 59% 30% 8% 3%
Fall 2008 63% 28% 6% 3% Spring 2008 59% 29% 9% 4%
Fall 2007 68% 23% 6% 4% Spring 2007 73% 22% 4% 2%
Fall 2006 65% 27% 5% 3% 37. I am a good reading student.
Really Agree
Kind of Agree
Kind of Disagree
Really Disagree
Spring 2012 38% 36% 18% 8% Spring 2011 41% 38% 15% 6% Spring 2010 42% 40% 11% 7% Spring 2009 42% 36% 14% 8%
Fall 2008 45% 37% 13% 5% Spring 2008 39% 44% 12% 4%
Fall 2007 44% 42% 9% 5% Spring 2007 42% 40% 13% 5%
Fall 2006 44% 38% 14% 4%

School District of Lancaster, 2011-2012 Student Survey May 21-May 25, 2012 Marginal Frequency Report – LINCOLN MIDDLE SCHOOL N=455
Center for Opinion Research 12 Franklin & Marshall College
38. It is not hard for me to get good grades in school.
Really Agree
Kind of Agree
Kind of Disagree
Really Disagree
Spring 2012 31% 40% 21% 8% Spring 2011 34% 37% 22% 8% Spring 2010 33% 39% 20% 8% Spring 2009 38% 37% 20% 5%
Fall 2008 35% 40% 17% 7% Spring 2008 33% 40% 20% 6%
Fall 2007 37% 39% 16% 8% Spring 2007 36% 43% 14% 6%
Fall 2006 36% 40% 15% 10% 39. I am smart.
Really Agree
Kind of Agree
Kind of Disagree
Really Disagree
Spring 2012 56% 31% 8% 5% Spring 2011 57% 32% 7% 4% Spring 2010 57% 32% 8% 3% Spring 2009 56% 32% 7% 4%
Fall 2008 56% 34% 6% 4% Spring 2008 54% 37% 6% 3%
Fall 2007 57% 32% 8% 3% Spring 2007 56% 35% 6% 4%
Fall 2006 50% 37% 9% 4% 40. When the teacher asks a question I usually know the answer even if the other students don't.
Really Agree
Kind of Agree
Kind of Disagree
Really Disagree
Spring 2012 24% 50% 22% 3% Spring 2011 24% 50% 20% 6% Spring 2010 27% 49% 18% 6% Spring 2009 24% 50% 21% 4%
Fall 2008 30% 49% 17% 4% Spring 2008 26% 51% 19% 4%
Fall 2007 30% 47% 17% 6% Spring 2007 23% 54% 18% 5%
Fall 2006 21% 58% 16% 6%
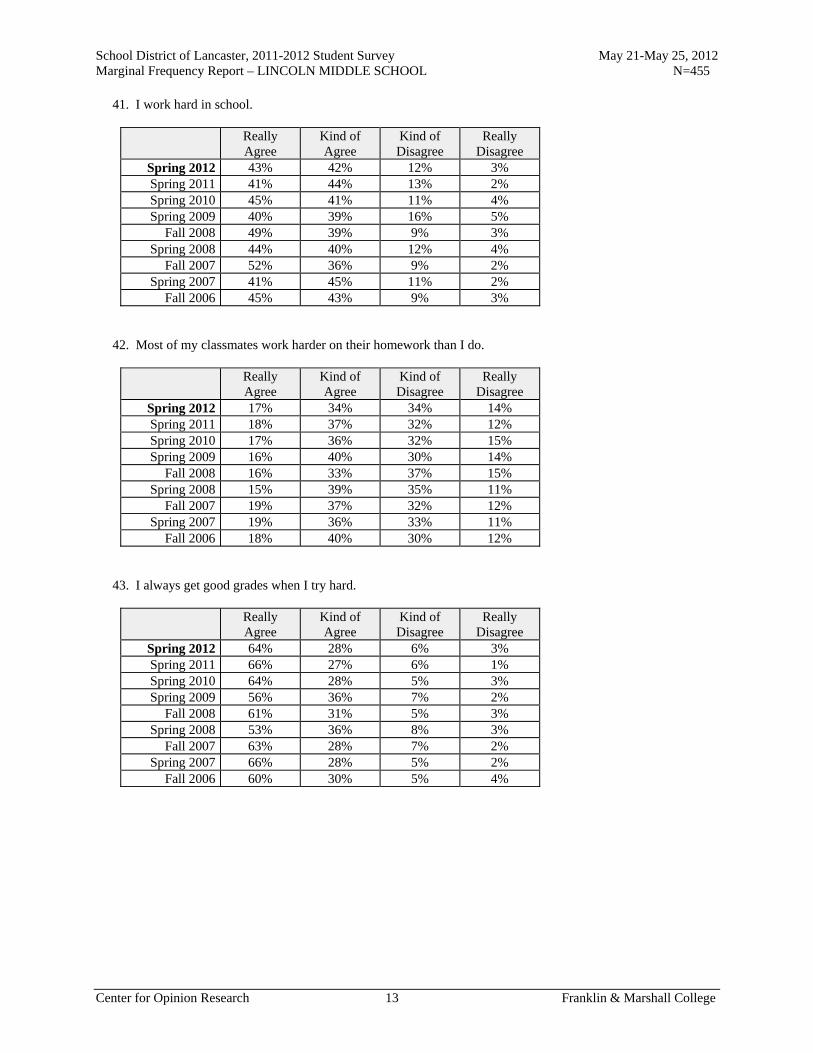
School District of Lancaster, 2011-2012 Student Survey May 21-May 25, 2012 Marginal Frequency Report – LINCOLN MIDDLE SCHOOL N=455
Center for Opinion Research 13 Franklin & Marshall College
41. I work hard in school.
Really Agree
Kind of Agree
Kind of Disagree
Really Disagree
Spring 2012 43% 42% 12% 3% Spring 2011 41% 44% 13% 2% Spring 2010 45% 41% 11% 4% Spring 2009 40% 39% 16% 5%
Fall 2008 49% 39% 9% 3% Spring 2008 44% 40% 12% 4%
Fall 2007 52% 36% 9% 2% Spring 2007 41% 45% 11% 2%
Fall 2006 45% 43% 9% 3% 42. Most of my classmates work harder on their homework than I do.
Really Agree
Kind of Agree
Kind of Disagree
Really Disagree
Spring 2012 17% 34% 34% 14% Spring 2011 18% 37% 32% 12% Spring 2010 17% 36% 32% 15% Spring 2009 16% 40% 30% 14%
Fall 2008 16% 33% 37% 15% Spring 2008 15% 39% 35% 11%
Fall 2007 19% 37% 32% 12% Spring 2007 19% 36% 33% 11%
Fall 2006 18% 40% 30% 12% 43. I always get good grades when I try hard.
Really Agree
Kind of Agree
Kind of Disagree
Really Disagree
Spring 2012 64% 28% 6% 3% Spring 2011 66% 27% 6% 1% Spring 2010 64% 28% 5% 3% Spring 2009 56% 36% 7% 2%
Fall 2008 61% 31% 5% 3% Spring 2008 53% 36% 8% 3%
Fall 2007 63% 28% 7% 2% Spring 2007 66% 28% 5% 2%
Fall 2006 60% 30% 5% 4%

School District of Lancaster, 2011-2012 Student Survey May 21-May 25, 2012 Marginal Frequency Report – LINCOLN MIDDLE SCHOOL N=455
Center for Opinion Research 14 Franklin & Marshall College
44. I usually do not get good grades in math because it is too hard.
Really Agree
Kind of Agree
Kind of Disagree
Really Disagree
Spring 2012 11% 21% 29% 38% Spring 2011 8% 21% 30% 42% Spring 2010 8% 16% 30% 46% Spring 2009 8% 16% 31% 46%
Fall 2008 10% 16% 29% 45% Spring 2008 10% 22% 29% 38%
Fall 2007 13% 25% 25% 38% Spring 2007 10% 22% 29% 39%
Fall 2006 16% 24% 26% 34% 45. Most of my classmates like to do math because it is easy.
Really Agree
Kind of Agree
Kind of Disagree
Really Disagree
Spring 2012 22% 38% 26% 14% Spring 2011 23% 39% 27% 10% Spring 2010 28% 38% 23% 11% Spring 2009 20% 42% 30% 8%
Fall 2008 26% 39% 24% 11% Spring 2008 23% 34% 31% 12%
Fall 2007 25% 36% 26% 13% Spring 2007 17% 38% 32% 14%
Fall 2006 21% 38% 30% 12% 46. I would get better grades if my teacher liked me more.
Really Agree
Kind of Agree
Kind of Disagree
Really Disagree
Spring 2012 12% 15% 28% 45% Spring 2011 9% 14% 28% 49% Spring 2010 14% 13% 28% 45% Spring 2009 10% 16% 27% 47%
Fall 2008 8% 16% 29% 47% Spring 2008 10% 17% 28% 44%
Fall 2007 13% 16% 27% 45% Spring 2007 8% 13% 32% 48%
Fall 2006 12% 13% 29% 46%
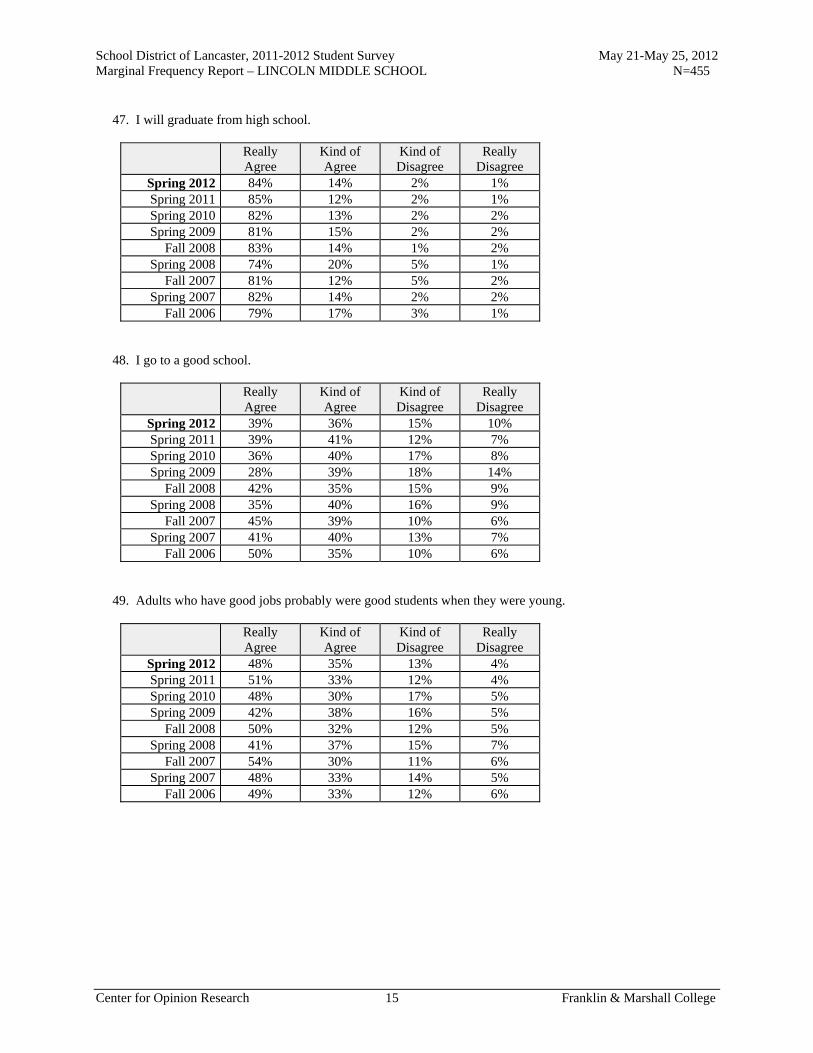
School District of Lancaster, 2011-2012 Student Survey May 21-May 25, 2012 Marginal Frequency Report – LINCOLN MIDDLE SCHOOL N=455
Center for Opinion Research 15 Franklin & Marshall College
47. I will graduate from high school.
Really Agree
Kind of Agree
Kind of Disagree
Really Disagree
Spring 2012 84% 14% 2% 1% Spring 2011 85% 12% 2% 1% Spring 2010 82% 13% 2% 2% Spring 2009 81% 15% 2% 2%
Fall 2008 83% 14% 1% 2% Spring 2008 74% 20% 5% 1%
Fall 2007 81% 12% 5% 2% Spring 2007 82% 14% 2% 2%
Fall 2006 79% 17% 3% 1% 48. I go to a good school.
Really Agree
Kind of Agree
Kind of Disagree
Really Disagree
Spring 2012 39% 36% 15% 10% Spring 2011 39% 41% 12% 7% Spring 2010 36% 40% 17% 8% Spring 2009 28% 39% 18% 14%
Fall 2008 42% 35% 15% 9% Spring 2008 35% 40% 16% 9%
Fall 2007 45% 39% 10% 6% Spring 2007 41% 40% 13% 7%
Fall 2006 50% 35% 10% 6% 49. Adults who have good jobs probably were good students when they were young.
Really Agree
Kind of Agree
Kind of Disagree
Really Disagree
Spring 2012 48% 35% 13% 4% Spring 2011 51% 33% 12% 4% Spring 2010 48% 30% 17% 5% Spring 2009 42% 38% 16% 5%
Fall 2008 50% 32% 12% 5% Spring 2008 41% 37% 15% 7%
Fall 2007 54% 30% 11% 6% Spring 2007 48% 33% 14% 5%
Fall 2006 49% 33% 12% 6%

School District of Lancaster, 2011-2012 Student Survey May 21-May 25, 2012 Marginal Frequency Report – LINCOLN MIDDLE SCHOOL N=455
Center for Opinion Research 16 Franklin & Marshall College
50. When I am old enough, I will go to college.
Really Agree
Kind of Agree
Kind of Disagree
Really Disagree
Spring 2012 77% 16% 5% 3% Spring 2011 74% 18% 4% 3% Spring 2010 74% 18% 4% 4% Spring 2009 71% 19% 7% 4%
Fall 2008 75% 18% 4% 3% Spring 2008 65% 24% 8% 3%
Fall 2007 73% 18% 5% 4% Spring 2007 72% 21% 5% 2%
Fall 2006 70% 18% 7% 4% 51. No one cares if I do well in school.
Really Agree
Kind of Agree
Kind of Disagree
Really Disagree
Spring 2012 5% 9% 28% 58% Spring 2011 4% 8% 27% 61% Spring 2010 7% 10% 22% 62% Spring 2009 4% 10% 22% 64%
Fall 2008 7% 8% 20% 66% Spring 2008 6% 10% 25% 59%
Fall 2007 6% 11% 22% 61% Spring 2007 4% 7% 22% 67%
Fall 2006 6% 12% 18% 64% 52. What I learn in school is not important.
Really Agree
Kind of Agree
Kind of Disagree
Really Disagree
Spring 2012 5% 11% 19% 66% Spring 2011 5% 10% 20% 66% Spring 2010 7% 8% 19% 66% Spring 2009 5% 10% 19% 66%
Fall 2008 6% 8% 17% 69% Spring 2008 6% 10% 22% 62%
Fall 2007 6% 8% 21% 65% Spring 2007 5% 9% 20% 67%
Fall 2006 7% 7% 19% 67%
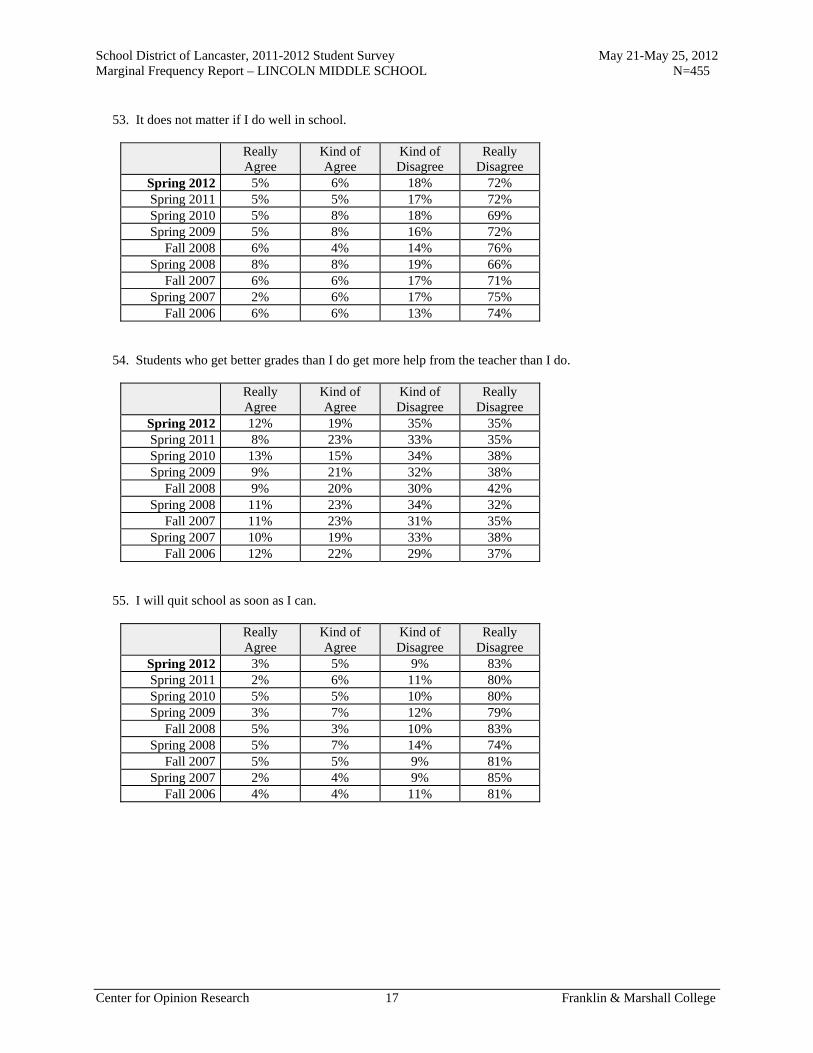
School District of Lancaster, 2011-2012 Student Survey May 21-May 25, 2012 Marginal Frequency Report – LINCOLN MIDDLE SCHOOL N=455
Center for Opinion Research 17 Franklin & Marshall College
53. It does not matter if I do well in school.
Really Agree
Kind of Agree
Kind of Disagree
Really Disagree
Spring 2012 5% 6% 18% 72% Spring 2011 5% 5% 17% 72% Spring 2010 5% 8% 18% 69% Spring 2009 5% 8% 16% 72%
Fall 2008 6% 4% 14% 76% Spring 2008 8% 8% 19% 66%
Fall 2007 6% 6% 17% 71% Spring 2007 2% 6% 17% 75%
Fall 2006 6% 6% 13% 74% 54. Students who get better grades than I do get more help from the teacher than I do.
Really Agree
Kind of Agree
Kind of Disagree
Really Disagree
Spring 2012 12% 19% 35% 35% Spring 2011 8% 23% 33% 35% Spring 2010 13% 15% 34% 38% Spring 2009 9% 21% 32% 38%
Fall 2008 9% 20% 30% 42% Spring 2008 11% 23% 34% 32%
Fall 2007 11% 23% 31% 35% Spring 2007 10% 19% 33% 38%
Fall 2006 12% 22% 29% 37% 55. I will quit school as soon as I can.
Really Agree
Kind of Agree
Kind of Disagree
Really Disagree
Spring 2012 3% 5% 9% 83% Spring 2011 2% 6% 11% 80% Spring 2010 5% 5% 10% 80% Spring 2009 3% 7% 12% 79%
Fall 2008 5% 3% 10% 83% Spring 2008 5% 7% 14% 74%
Fall 2007 5% 5% 9% 81% Spring 2007 2% 4% 9% 85%
Fall 2006 4% 4% 11% 81%

School District of Lancaster, 2011-2012 Student Survey May 21-May 25, 2012 Marginal Frequency Report – LINCOLN MIDDLE SCHOOL N=455
Center for Opinion Research 18 Franklin & Marshall College
56. Teachers like students even if they do not always make good grades.
Really Agree
Kind of Agree
Kind of Disagree
Really Disagree
Spring 2012 34% 39% 17% 10% Spring 2011 38% 39% 16% 7% Spring 2010 39% 38% 14% 9% Spring 2009 32% 45% 15% 7%
Fall 2008 40% 40% 13% 7% Spring 2008 34% 43% 15% 8%
Fall 2007 40% 36% 15% 10% Spring 2007 40% 42% 11% 8%
Fall 2006 44% 42% 9% 5% 57. It is important to go to high school.
Really Agree
Kind of Agree
Kind of Disagree
Really Disagree
Spring 2012 84% 12% 2% 2% Spring 2011 83% 12% 2% 3% Spring 2010 80% 13% 2% 4% Spring 2009 81% 13% 2% 4%
Fall 2008 88% 8% 2% 2% Spring 2008 76% 15% 5% 4%
Fall 2007 81% 12% 3% 4% Spring 2007 88% 9% 2% 2%
Fall 2006 86% 11% 1% 1% 58. How often do you take books home to study?
Every Night Most Nights Some Nights Never Spring 2012 2% 14% 51% 33% Spring 2011 3% 18% 49% 30% Spring 2010 8% 21% 47% 24% Spring 2009 5% 16% 50% 29%
Fall 2008 10% 28% 46% 17%

School District of Lancaster, 2011-2012 Student Survey May 21-May 25, 2012 Marginal Frequency Report – LINCOLN MIDDLE SCHOOL N=455
Center for Opinion Research 19 Franklin & Marshall College
Career Self-Efficacy Please rate how confident you are that you could successfully perform the following tasks. I am confident that... (1=very low confidence, 7=very high confidence) 59. I understand my interests and abilities and how they help me make a career choice.
Mean Score Spring 2012 5.33 Spring 2011 5.38 Spring 2010 5.26 Spring 2009 5.25
Fall 2008 5.54 Spring 2008 5.38
Fall 2007 5.54 Spring 2007 5.76
Fall 2006 5.42 60. I know how to explore careers in which I may be interested.
Mean Score Spring 2012 5.20 Spring 2011 5.30 Spring 2010 5.15 Spring 2009 5.06
Fall 2008 5.32 Spring 2008 5.36
Fall 2007 5.49 Spring 2007 5.69
Fall 2006 5.53 61. I understand the importance of making plans for the future (jobs, vocational, technical education, employment and training programs, college, and military).
Mean Score Spring 2012 5.75 Spring 2011 5.67 Spring 2010 5.59 Spring 2009 5.46
Fall 2008 5.73 Spring 2008 5.54
Fall 2007 5.61 Spring 2007 5.85
Fall 2006 5.72
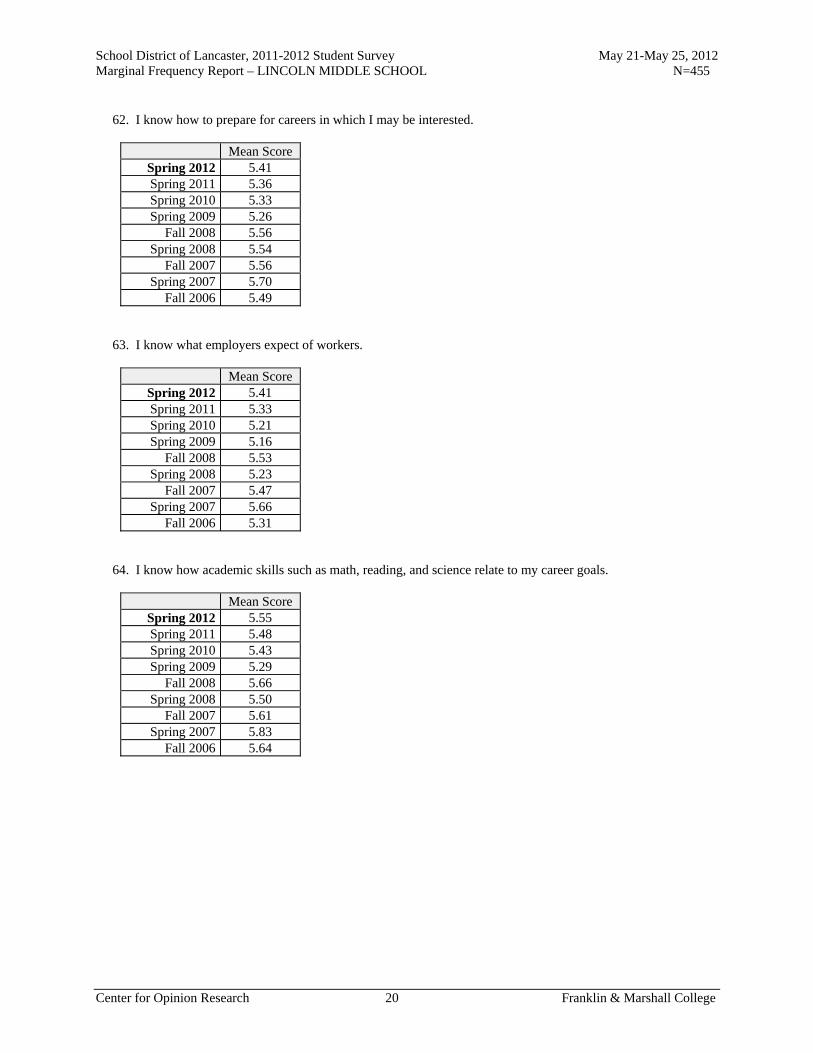
School District of Lancaster, 2011-2012 Student Survey May 21-May 25, 2012 Marginal Frequency Report – LINCOLN MIDDLE SCHOOL N=455
Center for Opinion Research 20 Franklin & Marshall College
62. I know how to prepare for careers in which I may be interested.
Mean Score Spring 2012 5.41 Spring 2011 5.36 Spring 2010 5.33 Spring 2009 5.26
Fall 2008 5.56 Spring 2008 5.54
Fall 2007 5.56 Spring 2007 5.70
Fall 2006 5.49 63. I know what employers expect of workers.
Mean Score Spring 2012 5.41 Spring 2011 5.33 Spring 2010 5.21 Spring 2009 5.16
Fall 2008 5.53 Spring 2008 5.23
Fall 2007 5.47 Spring 2007 5.66
Fall 2006 5.31 64. I know how academic skills such as math, reading, and science relate to my career goals.
Mean Score Spring 2012 5.55 Spring 2011 5.48 Spring 2010 5.43 Spring 2009 5.29
Fall 2008 5.66 Spring 2008 5.50
Fall 2007 5.61 Spring 2007 5.83
Fall 2006 5.64

School District of Lancaster, 2011-2012 Student Survey May 21-May 25, 2012 Marginal Frequency Report – LINCOLN MIDDLE SCHOOL N=455
Center for Opinion Research 21 Franklin & Marshall College
65. I know how to look for a part-time summer job.
Mean Score Spring 2012 4.90 Spring 2011 4.86 Spring 2010 4.89 Spring 2009 4.97
Fall 2008 5.19 Spring 2008 5.25
Fall 2007 5.27 Spring 2007 5.41
Fall 2006 5.30 66. I know what jobs are available locally.
Mean Score Spring 2012 4.50 Spring 2011 4.39 Spring 2010 4.50 Spring 2009 4.60
Fall 2008 4.88 Spring 2008 5.00
Fall 2007 4.98 Spring 2007 5.14
Fall 2006 4.97 67. I understand the challenges students have in high school.
Mean Score Spring 2012 5.30 Spring 2011 5.29 Spring 2010 5.16 Spring 2009 5.13
Fall 2008 5.45 Spring 2008 5.23
Fall 2007 5.42 Spring 2007 5.58
Fall 2006 5.36

School District of Lancaster, 2011-2012 Student Survey May 21-May 25, 2012 Marginal Frequency Report – LINCOLN MIDDLE SCHOOL N=455
Center for Opinion Research 22 Franklin & Marshall College
68. I know how to organize my class and homework materials.
Mean Score Spring 2012 5.46 Spring 2011 5.38 Spring 2010 5.38 Spring 2009 5.34
Fall 2008 5.58 Spring 2008 5.26
Fall 2007 5.62 Spring 2007 5.42
Fall 2006 5.31 69. I know how to select high school courses that help meet my needs, interests, and career goals.
Mean Score Spring 2012 5.23 Spring 2011 5.02 Spring 2010 5.03 Spring 2009 4.98
Fall 2008 5.29 Spring 2008 5.26
Fall 2007 5.42 Spring 2007 5.50
Fall 2006 5.30 70. I can take good notes.
Mean Score Spring 2012 5.16 Spring 2011 5.14 Spring 2010 5.08 Spring 2009 5.02
Fall 2008 5.35 Spring 2008 5.22
Fall 2007 5.44 Spring 2007 5.40
Fall 2006 5.27
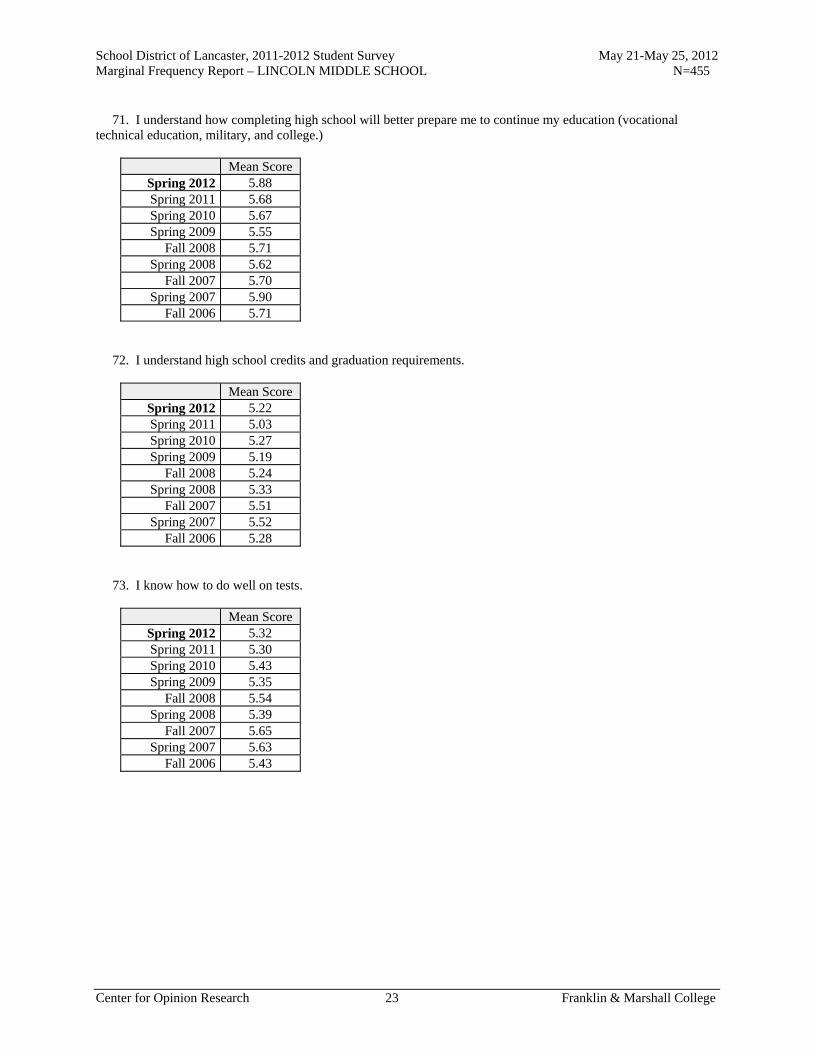
School District of Lancaster, 2011-2012 Student Survey May 21-May 25, 2012 Marginal Frequency Report – LINCOLN MIDDLE SCHOOL N=455
Center for Opinion Research 23 Franklin & Marshall College
71. I understand how completing high school will better prepare me to continue my education (vocational technical education, military, and college.)
Mean Score Spring 2012 5.88 Spring 2011 5.68 Spring 2010 5.67 Spring 2009 5.55
Fall 2008 5.71 Spring 2008 5.62
Fall 2007 5.70 Spring 2007 5.90
Fall 2006 5.71 72. I understand high school credits and graduation requirements.
Mean Score Spring 2012 5.22 Spring 2011 5.03 Spring 2010 5.27 Spring 2009 5.19
Fall 2008 5.24 Spring 2008 5.33
Fall 2007 5.51 Spring 2007 5.52
Fall 2006 5.28 73. I know how to do well on tests.
Mean Score Spring 2012 5.32 Spring 2011 5.30 Spring 2010 5.43 Spring 2009 5.35
Fall 2008 5.54 Spring 2008 5.39
Fall 2007 5.65 Spring 2007 5.63
Fall 2006 5.43

School District of Lancaster, 2011-2012 Student Survey May 21-May 25, 2012 Marginal Frequency Report – LINCOLN MIDDLE SCHOOL N=455
Center for Opinion Research 24 Franklin & Marshall College
74. I know how to select middle school extra-curricular activities that will meet my interests and future goals
Mean Score Spring 2012 5.15 Spring 2011 5.01 Spring 2010 5.17 Spring 2009 5.03
Fall 2008 5.28 Spring 2008 5.25
Fall 2007 5.42 Spring 2007 5.51
Fall 2006 5.38 75. I understand how completing high school will better prepare me for the job market.
Mean Score Spring 2012 5.57 Spring 2011 5.47 Spring 2010 5.46 Spring 2009 5.37
Fall 2008 5.61 Spring 2008 5.40
Fall 2007 5.48 Spring 2007 5.67
Fall 2006 5.58 76. I know the classes offered by my area vocational technical school.
Mean Score Spring 2012 4.49 Spring 2011 4.38 Spring 2010 4.69 Spring 2009 4.55
Fall 2008 4.73 Spring 2008 4.79
Fall 2007 4.83 Spring 2007 4.89
Fall 2006 4.62

School District of Lancaster, 2011-2012 Student Survey May 21-May 25, 2012 Marginal Frequency Report – LINCOLN MIDDLE SCHOOL N=455
Center for Opinion Research 25 Franklin & Marshall College
77. I know how to organize my time.
Mean Score Spring 2012 5.23 Spring 2011 5.09 Spring 2010 5.18 Spring 2009 5.14
Fall 2008 5.41 Spring 2008 5.21
Fall 2007 5.31 Spring 2007 5.44
Fall 2006 5.18 78. I know how to listen and ask questions in class.
Mean Score Spring 2012 5.50 Spring 2011 5.39 Spring 2010 5.44 Spring 2009 5.34
Fall 2008 5.54 Spring 2008 5.47
Fall 2007 5.66 Spring 2007 5.60
Fall 2006 5.50 79. I know what will be expected of me in high school.
Mean Score Spring 2012 5.54 Spring 2011 5.42 Spring 2010 5.51 Spring 2009 5.44
Fall 2008 5.42 Spring 2008 5.47
Fall 2007 5.62 Spring 2007 5.80
Fall 2006 5.46

School District of Lancaster, 2011-2012 Student Survey May 21-May 25, 2012 Marginal Frequency Report – LINCOLN MIDDLE SCHOOL N=455
Center for Opinion Research 26 Franklin & Marshall College
80. I know how to interview to get a job.
Mean Score Spring 2012 4.78 Spring 2011 4.65 Spring 2010 4.88 Spring 2009 4.94
Fall 2008 4.97 Spring 2008 5.00
Fall 2007 5.14 Spring 2007 5.21
Fall 2006 4.98 81. I know where to go to get help when I have a problem concerning high school.
Mean Score Spring 2012 4.97 Spring 2011 4.96 Spring 2010 5.10 Spring 2009 4.98
Fall 2008 5.09 Spring 2008 5.23
Fall 2007 5.33 Spring 2007 5.39
Fall 2006 5.14 82. I know how to apply for a job.
Mean Score Spring 2012 4.79 Spring 2011 4.76 Spring 2010 4.81 Spring 2009 5.01
Fall 2008 5.09 Spring 2008 5.14
Fall 2007 5.25 Spring 2007 5.25
Fall 2006 5.05

School District of Lancaster, 2011-2012 Student Survey May 21-May 25, 2012 Marginal Frequency Report – LINCOLN MIDDLE SCHOOL N=455
Center for Opinion Research 27 Franklin & Marshall College
83. I know how to start and finish my assignments well.
Mean Score Spring 2012 5.47 Spring 2011 5.32 Spring 2010 5.42 Spring 2009 5.42
Fall 2008 5.45 Spring 2008 5.46
Fall 2007 5.61 Spring 2007 5.57
Fall 2006 5.37 Academic Aspirations 84. How far in school do you want to go?
Complete
high school
Attend vocational/technical
school
Attend 2-year college
Attend 4-year college
Attend 4-year college plus go to
grad school Spring 2012 8% 4% 19% 33% 35% Spring 2011 12% 5% 19% 35% 30% Spring 2010 12% 3% 21% 32% 32% Spring 2009 12% 3% 21% 34% 30%
Fall 2008 11% 5% 19% 31% 34% Spring 2008 13% 5% 18% 32% 32%
Fall 2007 15% 4% 16% 32% 33% Spring 2007 11% 4% 18% 28% 39%
Fall 2006 14% 4% 17% 28% 37% 85. How important do you believe getting a college education is to your future success? Would you say it is...
Very
important Somewhat important
Not very important
Not important at
all Spring 2012 83% 12% 4% 1% Spring 2011 86% 11% 2% 1% Spring 2010 87% 9% 2% 2% Spring 2009 84% 13% 2% 1%
Fall 2008 88% 10% 0% 2% Spring 2008 86% 11% 2% 2%
Fall 2007 87% 10% 1% 2% Spring 2007 89% 9% 2% 0%
Fall 2006 87% 10% 2% 0%

School District of Lancaster, 2011-2012 Student Survey May 21-May 25, 2012 Marginal Frequency Report – LINCOLN MIDDLE SCHOOL N=455
Center for Opinion Research 28 Franklin & Marshall College
86. How important would your parent/guardian say getting a college education is to your future success? Would your parents say it is...
Very
important Somewhat important
Not very important
Not important at
all Spring 2012 82% 12% 4% 1% Spring 2011 89% 8% 2% 1% Spring 2010 90% 6% 2% 2% Spring 2009 91% 7% 1% 1%
Fall 2008 93% 5% 1% 1% Spring 2008 89% 7% 2% 2%
Fall 2007 90% 7% 1% 2% Spring 2007 90% 9% 0% 1%
Fall 2006 89% 10% 1% 1% 87. How important would your teachers say getting a college education is to your future success? Would your teachers say it is...
Very
important Somewhat important
Not very important
Not important at
all Spring 2012 84% 11% 3% 2% Spring 2011 84% 11% 2% 2% Spring 2010 86% 9% 2% 3% Spring 2009 87% 10% 1% 2%
Fall 2008 87% 10% 1% 1% Spring 2008 86% 10% 2% 2%
Fall 2007 89% 7% 3% 1% Spring 2007 88% 10% 1% 1%
Fall 2006 87% 11% 0% 1% 88. How far in school do you think you will get?
Won't finish high school
Will finish high school
Will get a GED
Will complete a
2-year Associate's
Degree
Will complete a
4-year Bachelor's
Degree
Will complete a Master's or Doctoral Degree
Spring 2012 1% 12% 7% 17% 35% 28% Spring 2011 4% 17% 8% 14% 35% 22% Spring 2010 6% 15% 6% 14% 28% 31% Spring 2009 3% 15% 7% 19% 28% 27%
Fall 2008 3% 16% 7% 16% 27% 31% Spring 2008 2% 17% 7% 15% 26% 32%
Fall 2007 5% 19% 10% 13% 27% 28% Spring 2007 2% 14% 7% 15% 30% 32%
Fall 2006 2% 21% 8% 15% 23% 30%

School District of Lancaster, 2011-2012 Student Survey May 21-May 25, 2012 Marginal Frequency Report – LINCOLN MIDDLE SCHOOL N=455
Center for Opinion Research 29 Franklin & Marshall College
89. Has anyone from your school or GEAR UP ever spoken with you about college entrance requirements or the courses that you need to take in high school in order to prepare for college?
Yes No Spring 2012 64% 36% Spring 2011 55% 45% Spring 2010 66% 34% Spring 2009 59% 41%
Fall 2008 50% 50% Spring 2008 57% 43%
Fall 2007 49% 51% Spring 2007 59% 41%
Fall 2006 52% 48% 90. Has anyone from your school or GEAR UP ever spoken with you about the availability of financial aid to help you pay for college?
Yes No Spring 2012 53% 47% Spring 2011 36% 64% Spring 2010 44% 56% Spring 2009 38% 62%
Fall 2008 38% 62% Spring 2008 44% 56%
Fall 2007 38% 62% Spring 2007 47% 53%
Fall 2006 44% 56% 91. Do you think that you could afford to attend a public 4-year college (for example, Millersville University) using financial aid, scholarships, and your family's resources?
Definitely Probably Not Sure Probably
Not Definitely
Not Spring 2012 30% 38% 25% 5% 3% Spring 2011 27% 34% 30% 6% 3% Spring 2010 29% 35% 25% 7% 3% Spring 2009 24% 38% 28% 6% 3%
Fall 2008 28% 35% 26% 6% 4% Spring 2008 30% 37% 26% 5% 2%
Fall 2007 28% 38% 25% 5% 4% Spring 2007 26% 40% 27% 5% 2%
Fall 2006 25% 40% 28% 5% 1% 92. On a scale of 1 to 5, to what extent are you knowledgeable about financial aid and the cost and benefits to you in pursuing postsecondary education?
Mean Score Spring 2012 3.24
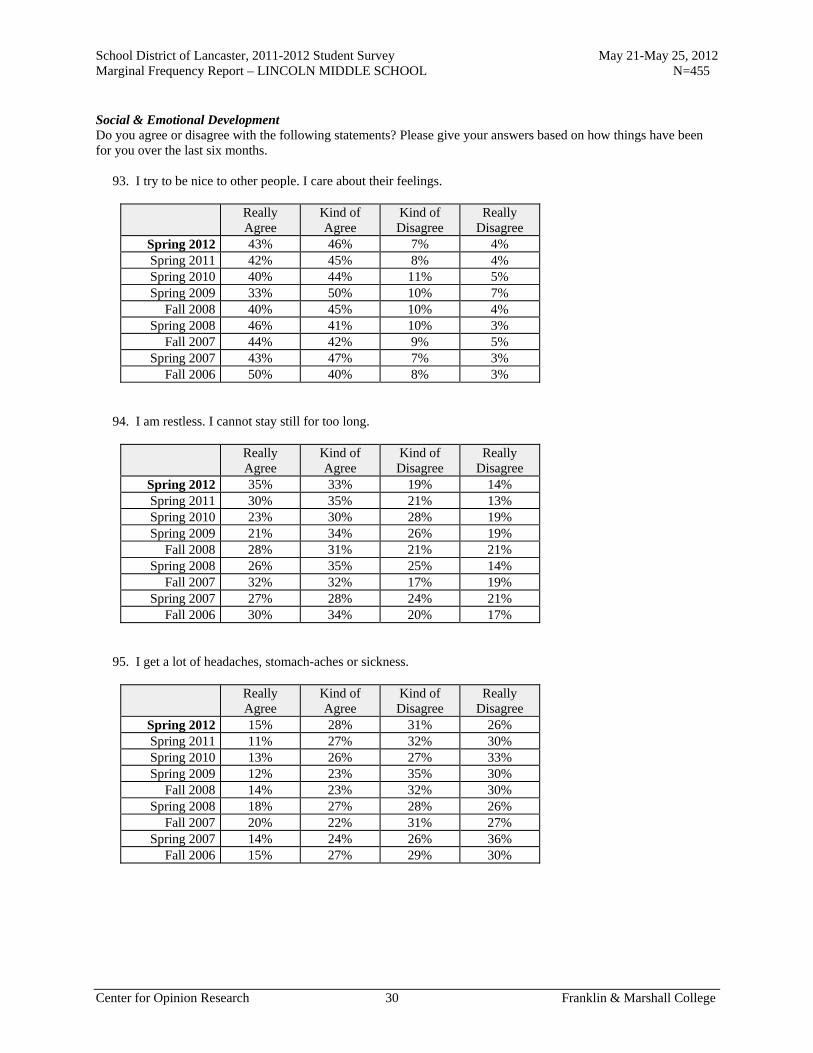
School District of Lancaster, 2011-2012 Student Survey May 21-May 25, 2012 Marginal Frequency Report – LINCOLN MIDDLE SCHOOL N=455
Center for Opinion Research 30 Franklin & Marshall College
Social & Emotional Development Do you agree or disagree with the following statements? Please give your answers based on how things have been for you over the last six months. 93. I try to be nice to other people. I care about their feelings.
Really Agree
Kind of Agree
Kind of Disagree
Really Disagree
Spring 2012 43% 46% 7% 4% Spring 2011 42% 45% 8% 4% Spring 2010 40% 44% 11% 5% Spring 2009 33% 50% 10% 7%
Fall 2008 40% 45% 10% 4% Spring 2008 46% 41% 10% 3%
Fall 2007 44% 42% 9% 5% Spring 2007 43% 47% 7% 3%
Fall 2006 50% 40% 8% 3% 94. I am restless. I cannot stay still for too long.
Really Agree
Kind of Agree
Kind of Disagree
Really Disagree
Spring 2012 35% 33% 19% 14% Spring 2011 30% 35% 21% 13% Spring 2010 23% 30% 28% 19% Spring 2009 21% 34% 26% 19%
Fall 2008 28% 31% 21% 21% Spring 2008 26% 35% 25% 14%
Fall 2007 32% 32% 17% 19% Spring 2007 27% 28% 24% 21%
Fall 2006 30% 34% 20% 17% 95. I get a lot of headaches, stomach-aches or sickness.
Really Agree
Kind of Agree
Kind of Disagree
Really Disagree
Spring 2012 15% 28% 31% 26% Spring 2011 11% 27% 32% 30% Spring 2010 13% 26% 27% 33% Spring 2009 12% 23% 35% 30%
Fall 2008 14% 23% 32% 30% Spring 2008 18% 27% 28% 26%
Fall 2007 20% 22% 31% 27% Spring 2007 14% 24% 26% 36%
Fall 2006 15% 27% 29% 30%

School District of Lancaster, 2011-2012 Student Survey May 21-May 25, 2012 Marginal Frequency Report – LINCOLN MIDDLE SCHOOL N=455
Center for Opinion Research 31 Franklin & Marshall College
96. I usually share with others, for example CD's, games, food.
Really Agree
Kind of Agree
Kind of Disagree
Really Disagree
Spring 2012 32% 41% 17% 11% Spring 2011 29% 41% 20% 11% Spring 2010 32% 38% 20% 10% Spring 2009 27% 45% 18% 10%
Fall 2008 28% 43% 20% 10% Spring 2008 37% 41% 14% 8%
Fall 2007 38% 40% 12% 10% Spring 2007 37% 44% 14% 5%
Fall 2006 38% 44% 11% 6% 97. I get very angry and often lose my temper.
Really Agree
Kind of Agree
Kind of Disagree
Really Disagree
Spring 2012 24% 32% 23% 21% Spring 2011 24% 30% 26% 20% Spring 2010 21% 31% 24% 23% Spring 2009 19% 28% 31% 23%
Fall 2008 22% 31% 26% 22% Spring 2008 22% 33% 26% 19%
Fall 2007 31% 30% 21% 18% Spring 2007 25% 29% 25% 21%
Fall 2006 29% 31% 21% 18% 98. I would rather be alone than with people of my age.
Really Agree
Kind of Agree
Kind of Disagree
Really Disagree
Spring 2012 15% 20% 29% 36% Spring 2011 12% 21% 30% 37% Spring 2010 13% 21% 29% 38% Spring 2009 12% 22% 28% 39%
Fall 2008 11% 24% 26% 39% Spring 2008 16% 27% 26% 32%
Fall 2007 13% 19% 24% 44% Spring 2007 11% 20% 30% 40%
Fall 2006 16% 24% 25% 35%
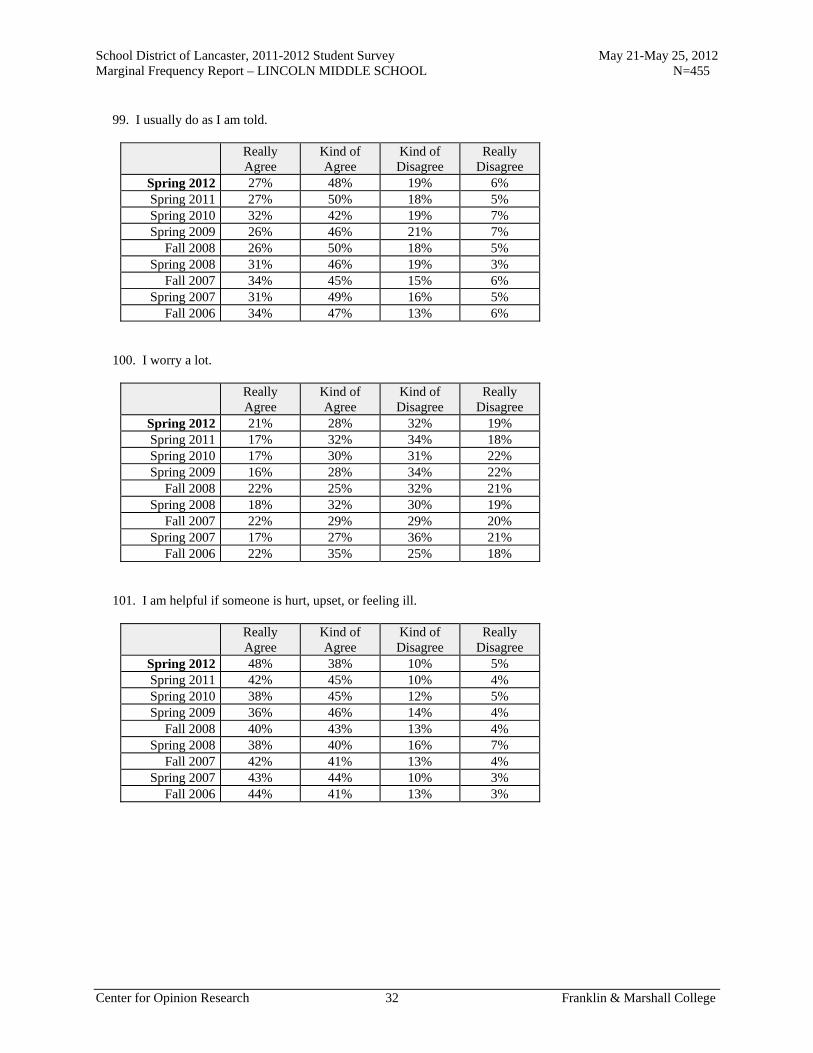
School District of Lancaster, 2011-2012 Student Survey May 21-May 25, 2012 Marginal Frequency Report – LINCOLN MIDDLE SCHOOL N=455
Center for Opinion Research 32 Franklin & Marshall College
99. I usually do as I am told.
Really Agree
Kind of Agree
Kind of Disagree
Really Disagree
Spring 2012 27% 48% 19% 6% Spring 2011 27% 50% 18% 5% Spring 2010 32% 42% 19% 7% Spring 2009 26% 46% 21% 7%
Fall 2008 26% 50% 18% 5% Spring 2008 31% 46% 19% 3%
Fall 2007 34% 45% 15% 6% Spring 2007 31% 49% 16% 5%
Fall 2006 34% 47% 13% 6% 100. I worry a lot.
Really Agree
Kind of Agree
Kind of Disagree
Really Disagree
Spring 2012 21% 28% 32% 19% Spring 2011 17% 32% 34% 18% Spring 2010 17% 30% 31% 22% Spring 2009 16% 28% 34% 22%
Fall 2008 22% 25% 32% 21% Spring 2008 18% 32% 30% 19%
Fall 2007 22% 29% 29% 20% Spring 2007 17% 27% 36% 21%
Fall 2006 22% 35% 25% 18% 101. I am helpful if someone is hurt, upset, or feeling ill.
Really Agree
Kind of Agree
Kind of Disagree
Really Disagree
Spring 2012 48% 38% 10% 5% Spring 2011 42% 45% 10% 4% Spring 2010 38% 45% 12% 5% Spring 2009 36% 46% 14% 4%
Fall 2008 40% 43% 13% 4% Spring 2008 38% 40% 16% 7%
Fall 2007 42% 41% 13% 4% Spring 2007 43% 44% 10% 3%
Fall 2006 44% 41% 13% 3%

School District of Lancaster, 2011-2012 Student Survey May 21-May 25, 2012 Marginal Frequency Report – LINCOLN MIDDLE SCHOOL N=455
Center for Opinion Research 33 Franklin & Marshall College
102. I am constantly moving or squirming.
Really Agree
Kind of Agree
Kind of Disagree
Really Disagree
Spring 2012 24% 35% 25% 16% Spring 2011 16% 32% 33% 19% Spring 2010 19% 30% 28% 24% Spring 2009 17% 26% 31% 26%
Fall 2008 21% 32% 27% 21% Spring 2008 23% 31% 27% 20%
Fall 2007 22% 30% 25% 23% Spring 2007 18% 28% 32% 23%
Fall 2006 19% 33% 28% 19% 103. I have one good friend or more.
Really Agree
Kind of Agree
Kind of Disagree
Really Disagree
Spring 2012 73% 21% 4% 2% Spring 2011 74% 19% 3% 4% Spring 2010 69% 19% 8% 4% Spring 2009 65% 25% 6% 4%
Fall 2008 66% 24% 5% 5% Spring 2008 61% 24% 10% 6%
Fall 2007 68% 21% 6% 5% Spring 2007 73% 16% 6% 4%
Fall 2006 68% 21% 7% 4% 104. I fight a lot. I can make other people do what I want.
Really Agree
Kind of Agree
Kind of Disagree
Really Disagree
Spring 2012 6% 15% 33% 46% Spring 2011 7% 12% 33% 48% Spring 2010 7% 21% 34% 38% Spring 2009 8% 15% 34% 44%
Fall 2008 7% 16% 32% 45% Spring 2008 11% 19% 30% 40%
Fall 2007 9% 19% 30% 41% Spring 2007 6% 16% 30% 48%
Fall 2006 10% 17% 30% 44%

School District of Lancaster, 2011-2012 Student Survey May 21-May 25, 2012 Marginal Frequency Report – LINCOLN MIDDLE SCHOOL N=455
Center for Opinion Research 34 Franklin & Marshall College
105. I am often unhappy, depressed, or tearful.
Really Agree
Kind of Agree
Kind of Disagree
Really Disagree
Spring 2012 11% 22% 27% 40% Spring 2011 10% 21% 30% 38% Spring 2010 12% 17% 28% 43% Spring 2009 10% 21% 29% 39%
Fall 2008 12% 23% 25% 40% Spring 2008 14% 21% 30% 34%
Fall 2007 17% 21% 24% 38% Spring 2007 12% 22% 24% 43%
Fall 2006 15% 20% 29% 35% 106. Other people my age generally like me.
Really Agree
Kind of Agree
Kind of Disagree
Really Disagree
Spring 2012 36% 43% 15% 6% Spring 2011 38% 43% 13% 6% Spring 2010 37% 44% 13% 5% Spring 2009 31% 47% 14% 8%
Fall 2008 41% 44% 12% 4% Spring 2008 38% 43% 14% 4%
Fall 2007 41% 40% 12% 7% Spring 2007 39% 42% 13% 6%
Fall 2006 35% 48% 12% 6% 107. I easily lose my focus. I find it difficult to concentrate.
Really Agree
Kind of Agree
Kind of Disagree
Really Disagree
Spring 2012 28% 30% 27% 15% Spring 2011 21% 33% 28% 18% Spring 2010 18% 31% 27% 23% Spring 2009 19% 28% 30% 22%
Fall 2008 22% 30% 27% 21% Spring 2008 23% 28% 29% 21%
Fall 2007 21% 36% 24% 20% Spring 2007 19% 35% 24% 22%
Fall 2006 23% 37% 20% 20%

School District of Lancaster, 2011-2012 Student Survey May 21-May 25, 2012 Marginal Frequency Report – LINCOLN MIDDLE SCHOOL N=455
Center for Opinion Research 35 Franklin & Marshall College
108. I am nervous in new situations. I easily lose confidence.
Really Agree
Kind of Agree
Kind of Disagree
Really Disagree
Spring 2012 21% 31% 26% 22% Spring 2011 17% 28% 34% 21% Spring 2010 17% 28% 30% 25% Spring 2009 14% 26% 34% 26%
Fall 2008 20% 29% 29% 22% Spring 2008 20% 28% 31% 21%
Fall 2007 20% 26% 31% 24% Spring 2007 15% 33% 29% 23%
Fall 2006 18% 35% 25% 22% 109. I am kind to younger children.
Really Agree
Kind of Agree
Kind of Disagree
Really Disagree
Spring 2012 54% 28% 13% 4% Spring 2011 52% 36% 6% 6% Spring 2010 55% 32% 8% 6% Spring 2009 55% 34% 7% 4%
Fall 2008 58% 32% 6% 4% Spring 2008 50% 34% 11% 5%
Fall 2007 53% 33% 7% 6% Spring 2007 55% 32% 8% 4%
Fall 2006 58% 28% 10% 4% 110. I am often accused of lying or cheating.
Really Agree
Kind of Agree
Kind of Disagree
Really Disagree
Spring 2012 14% 17% 28% 41% Spring 2011 12% 15% 29% 44% Spring 2010 13% 21% 29% 37% Spring 2009 11% 25% 27% 36%
Fall 2008 10% 22% 33% 35% Spring 2008 12% 22% 29% 37%
Fall 2007 15% 24% 24% 37% Spring 2007 14% 18% 28% 40%
Fall 2006 16% 22% 27% 34%

School District of Lancaster, 2011-2012 Student Survey May 21-May 25, 2012 Marginal Frequency Report – LINCOLN MIDDLE SCHOOL N=455
Center for Opinion Research 36 Franklin & Marshall College
111. Other children or young people pick on me or bully me.
Really Agree
Kind of Agree
Kind of Disagree
Really Disagree
Spring 2012 10% 11% 22% 57% Spring 2011 8% 15% 20% 57% Spring 2010 10% 14% 20% 56% Spring 2009 5% 13% 24% 58%
Fall 2008 8% 14% 24% 54% Spring 2008 10% 17% 24% 49%
Fall 2007 12% 17% 21% 49% Spring 2007 8% 15% 23% 54%
Fall 2006 10% 19% 23% 47% 112. I often offer to help others (parents, teachers, children).
Really Agree
Kind of Agree
Kind of Disagree
Really Disagree
Spring 2012 37% 43% 13% 6% Spring 2011 39% 43% 12% 6% Spring 2010 35% 46% 12% 8% Spring 2009 32% 46% 16% 6%
Fall 2008 34% 47% 15% 4% Spring 2008 42% 37% 15% 6%
Fall 2007 42% 40% 12% 6% Spring 2007 38% 46% 13% 4%
Fall 2006 43% 39% 15% 4% 113. I think before I do things.
Really Agree
Kind of Agree
Kind of Disagree
Really Disagree
Spring 2012 26% 44% 22% 9% Spring 2011 25% 40% 24% 11% Spring 2010 27% 40% 24% 9% Spring 2009 22% 45% 21% 11%
Fall 2008 26% 42% 25% 7% Spring 2008 32% 37% 25% 6%
Fall 2007 34% 43% 16% 6% Spring 2007 30% 42% 24% 5%
Fall 2006 34% 43% 17% 6%

School District of Lancaster, 2011-2012 Student Survey May 21-May 25, 2012 Marginal Frequency Report – LINCOLN MIDDLE SCHOOL N=455
Center for Opinion Research 37 Franklin & Marshall College
114. I take things that are not mine from home, school, or elsewhere.
Really Agree
Kind of Agree
Kind of Disagree
Really Disagree
Spring 2012 4% 10% 22% 64% Spring 2011 7% 8% 20% 66% Spring 2010 7% 10% 22% 61% Spring 2009 5% 13% 22% 61%
Fall 2008 4% 12% 21% 63% Spring 2008 8% 16% 20% 57%
Fall 2007 6% 12% 18% 64% Spring 2007 4% 11% 21% 64%
Fall 2006 7% 14% 19% 60% 115. I get along better with adults than with people my own age.
Really Agree
Kind of Agree
Kind of Disagree
Really Disagree
Spring 2012 15% 22% 36% 27% Spring 2011 17% 24% 33% 26% Spring 2010 16% 24% 32% 29% Spring 2009 11% 24% 37% 28%
Fall 2008 12% 27% 32% 28% Spring 2008 17% 26% 33% 24%
Fall 2007 16% 25% 27% 32% Spring 2007 14% 23% 36% 27%
Fall 2006 17% 25% 30% 29% 116. I have many fears. I am easily scared.
Really Agree
Kind of Agree
Kind of Disagree
Really Disagree
Spring 2012 11% 16% 32% 41% Spring 2011 10% 18% 32% 40% Spring 2010 9% 17% 29% 45% Spring 2009 10% 18% 29% 43%
Fall 2008 11% 20% 31% 38% Spring 2008 14% 20% 28% 37%
Fall 2007 17% 19% 26% 38% Spring 2007 9% 14% 32% 44%
Fall 2006 11% 23% 31% 35%

School District of Lancaster, 2011-2012 Student Survey May 21-May 25, 2012 Marginal Frequency Report – LINCOLN MIDDLE SCHOOL N=455
Center for Opinion Research 38 Franklin & Marshall College
117. I finish the work I'm doing. My attention is good.
Really Agree
Kind of Agree
Kind of Disagree
Really Disagree
Spring 2012 29% 40% 23% 9% Spring 2011 27% 42% 22% 9% Spring 2010 33% 38% 21% 9% Spring 2009 28% 42% 24% 6%
Fall 2008 29% 45% 21% 5% Spring 2008 32% 39% 21% 8%
Fall 2007 37% 43% 14% 6% Spring 2007 29% 46% 19% 6%
Fall 2006 33% 45% 16% 6% Perceptions of Police Do you agree or disagree with the following statements about police officers? 118. I respect police officers.
Really Agree
Kind of Agree
Kind of Disagree
Really Disagree
Spring 2012 64% 22% 8% 5% Spring 2011 62% 23% 10% 6% Spring 2010 58% 26% 9% 7% Spring 2009 51% 30% 11% 8%
Fall 2008 61% 25% 10% 4% Spring 2008 44% 34% 15% 7%
Fall 2007 50% 26% 12% 12% Spring 2007 54% 26% 14% 7%
Fall 2006 52% 28% 15% 6% 119. I am comfortable approaching police officers.
Really Agree
Kind of Agree
Kind of Disagree
Really Disagree
Spring 2012 48% 30% 15% 8% Spring 2011 37% 38% 14% 11% Spring 2010 42% 34% 14% 10% Spring 2009 36% 34% 19% 12%
Fall 2008 42% 30% 19% 9% Spring 2008 30% 35% 24% 11%
Fall 2007 39% 30% 16% 15% Spring 2007 37% 34% 21% 9%
Fall 2006 35% 35% 17% 13%

School District of Lancaster, 2011-2012 Student Survey May 21-May 25, 2012 Marginal Frequency Report – LINCOLN MIDDLE SCHOOL N=455
Center for Opinion Research 39 Franklin & Marshall College
120. I would consider police work as a career.
Really Agree
Kind of Agree
Kind of Disagree
Really Disagree
Spring 2012 25% 21% 20% 35% Spring 2011 22% 20% 20% 38% Spring 2010 24% 19% 19% 38% Spring 2009 17% 20% 23% 40%
Fall 2008 24% 19% 23% 34% Spring 2008 21% 25% 20% 34%
Fall 2007 23% 21% 21% 35% Spring 2007 22% 23% 14% 41%
Fall 2006 23% 27% 19% 32% 121. In general, I do not trust the police.
Really Agree
Kind of Agree
Kind of Disagree
Really Disagree
Spring 2012 12% 17% 27% 44% Spring 2011 12% 20% 25% 44% Spring 2010 13% 23% 26% 38% Spring 2009 14% 20% 28% 38%
Fall 2008 14% 22% 26% 38% Spring 2008 13% 24% 29% 33%
Fall 2007 16% 21% 25% 38% Spring 2007 11% 22% 27% 41%
Fall 2006 16% 22% 25% 38% 122. Police do not belong in schools unless there has been a crime.
Really Agree
Kind of Agree
Kind of Disagree
Really Disagree
Spring 2012 16% 17% 29% 38% Spring 2011 15% 18% 30% 37% Spring 2010 16% 18% 28% 37% Spring 2009 22% 22% 25% 32%
Fall 2008 19% 16% 29% 36% Spring 2008 19% 23% 27% 31%
Fall 2007 23% 21% 20% 36% Spring 2007 24% 27% 24% 26%
Fall 2006 32% 26% 22% 20%

School District of Lancaster, 2011-2012 Student Survey May 21-May 25, 2012 Marginal Frequency Report – LINCOLN MIDDLE SCHOOL N=455
Center for Opinion Research 40 Franklin & Marshall College
Hidden Delinquency In the last 12 months, how many times did you... 123. Deliberately damage property that did not belong to you.
Never 1 or 2 Times 3 or 4 Times5 or More
Times Spring 2012 71% 21% 5% 3% Spring 2011 74% 22% 1% 3% Spring 2010 71% 21% 4% 5% Spring 2009 64% 27% 5% 5%
Fall 2008 67% 22% 5% 6% Spring 2008 72% 18% 4% 5%
Fall 2007 72% 21% 2% 5% Spring 2007 66% 24% 4% 5%
Fall 2006 70% 22% 4% 5% 124. Take something from a store without paying for it.
Never 1 or 2 Times 3 or 4 Times5 or More
Times Spring 2012 82% 12% 4% 3% Spring 2011 81% 14% 2% 3% Spring 2010 76% 17% 4% 3% Spring 2009 71% 18% 4% 7%
Fall 2008 75% 15% 5% 5% Spring 2008 74% 16% 6% 5%
Fall 2007 81% 13% 0% 5% Spring 2007 82% 11% 4% 3%
Fall 2006 81% 11% 4% 4% 125. Hurt someone badly enough for that person to need bandages or care from a doctor or nurse.
Never 1 or 2 Times 3 or 4 Times5 or More
Times Spring 2012 78% 17% 4% 2% Spring 2011 78% 17% 4% 2% Spring 2010 74% 18% 4% 4% Spring 2009 72% 18% 5% 5%
Fall 2008 71% 21% 5% 4% Spring 2008 74% 16% 6% 3%
Fall 2007 73% 20% 3% 4% Spring 2007 70% 20% 5% 4%
Fall 2006 74% 15% 5% 5%

School District of Lancaster, 2011-2012 Student Survey May 21-May 25, 2012 Marginal Frequency Report – LINCOLN MIDDLE SCHOOL N=455
Center for Opinion Research 41 Franklin & Marshall College
126. Drive a car without its owner's permission.
Never 1 or 2 Times 3 or 4 Times5 or More
Times Spring 2012 93% 5% 1% 2% Spring 2011 92% 5% 2% 2% Spring 2010 89% 7% 2% 2% Spring 2009 89% 7% 2% 3%
Fall 2008 89% 6% 2% 3% Spring 2008 86% 7% 2% 4%
Fall 2007 90% 6% 1% 3% Spring 2007 90% 7% 1% 2%
Fall 2006 91% 4% 3% 2% 127. Steal something worth more than $50.
Never 1 or 2 Times 3 or 4 Times5 or More
Times Spring 2012 91% 4% 2% 2% Spring 2011 93% 4% 1% 2% Spring 2010 89% 6% 3% 2% Spring 2009 89% 5% 1% 5%
Fall 2008 90% 5% 2% 2% Spring 2008 87% 7% 3% 3%
Fall 2007 92% 5% 0% 3% Spring 2007 93% 4% 1% 2%
Fall 2006 90% 4% 3% 2% 128. Go into a house or building to steal something.
Never 1 or 2 Times 3 or 4 Times5 or More
Times Spring 2012 93% 6% 2% 0% Spring 2011 92% 5% 1% 2% Spring 2010 89% 7% 2% 3% Spring 2009 87% 8% 1% 4%
Fall 2008 89% 6% 2% 2% Spring 2008 88% 6% 3% 3%
Fall 2007 91% 5% 1% 3% Spring 2007 93% 5% 1% 1%
Fall 2006 90% 6% 3% 1%

School District of Lancaster, 2011-2012 Student Survey May 21-May 25, 2012 Marginal Frequency Report – LINCOLN MIDDLE SCHOOL N=455
Center for Opinion Research 42 Franklin & Marshall College
129. Use or threaten to use a weapon to get something from someone.
Never 1 or 2 Times 3 or 4 Times5 or More
Times Spring 2012 90% 7% 2% 1% Spring 2011 90% 8% 0% 2% Spring 2010 85% 10% 2% 3% Spring 2009 88% 8% 1% 4%
Fall 2008 87% 8% 2% 3% Spring 2008 86% 7% 4% 3%
Fall 2007 90% 5% 2% 3% Spring 2007 89% 6% 3% 2%
Fall 2006 91% 4% 3% 2% 130. Steal something worth less than $50.
Never 1 or 2 Times 3 or 4 Times5 or More
Times Spring 2012 80% 15% 2% 3% Spring 2011 80% 15% 2% 3% Spring 2010 79% 14% 2% 5% Spring 2009 73% 18% 3% 7%
Fall 2008 76% 16% 3% 5% Spring 2008 75% 15% 4% 6%
Fall 2007 81% 11% 2% 6% Spring 2007 82% 13% 2% 3%
Fall 2006 79% 13% 4% 4% 131. Take part in a fight where a group of your friends is against another group.
Never 1 or 2 Times 3 or 4 Times5 or More
Times Spring 2012 76% 17% 6% 2% Spring 2011 73% 18% 6% 4% Spring 2010 73% 17% 4% 5% Spring 2009 67% 21% 6% 6%
Fall 2008 71% 20% 4% 5% Spring 2008 73% 17% 6% 4%
Fall 2007 71% 19% 5% 4% Spring 2007 71% 17% 7% 5%
Fall 2006 68% 20% 7% 6%

School District of Lancaster, 2011-2012 Student Survey May 21-May 25, 2012 Marginal Frequency Report – LINCOLN MIDDLE SCHOOL N=455
Center for Opinion Research 43 Franklin & Marshall College
132. Act loudly, rowdy, or out of control in a public place.
Never 1 or 2 Times 3 or 4 Times5 or More
Times Spring 2012 59% 25% 9% 7% Spring 2011 58% 26% 6% 10% Spring 2010 60% 24% 8% 8% Spring 2009 57% 24% 7% 12%
Fall 2008 56% 25% 7% 11% Spring 2008 58% 24% 10% 8%
Fall 2007 65% 21% 8% 7% Spring 2007 61% 25% 7% 7%
Fall 2006 66% 21% 7% 6% Drug & Alcohol Use On how many occasions (if any) have you... 133. Had beer, wine, or hard liquor in your lifetime?
0 1 or 2 Times
3 to 5 Times
6 to 9 Times
10 to 19 Times
20 to 39 Times
40 or More Times
Spring 2012 60% 21% 7% 5% 3% 1% 3% Spring 2011 58% 24% 9% 3% 3% 1% 2% Spring 2010 59% 22% 8% 5% 2% 1% 3% Spring 2009 52% 22% 9% 6% 5% 2% 5%
Fall 2008 57% 23% 9% 4% 3% 1% 3% Spring 2008 59% 19% 8% 5% 4% 2% 2%
Fall 2007 62% 21% 8% 2% 2% 2% 2% Spring 2007 53% 26% 9% 5% 5% 1% 1%
Fall 2006 55% 28% 7% 4% 2% 0% 2% 134. Had beer, wine, or hard liquor during the past 30 days?
0 1 or 2 Times
3 to 5 Times
6 to 9 Times
10 to 19 Times
20 to 39 Times
40 or More Times
Spring 2012 86% 9% 2% 2% 2% 0% 0% Spring 2011 86% 9% 3% 1% 0% 0% 0% Spring 2010 85% 8% 3% 1% 1% 0% 2% Spring 2009 82% 10% 2% 1% 3% 0% 2%
Fall 2008 85% 8% 2% 1% 1% 1% 1% Spring 2008 81% 10% 5% 2% 1% 0% 1%
Fall 2007 90% 6% 1% 1% 1% 1% 1% Spring 2007 84% 11% 3% 1% 0% 0% 0%
Fall 2006 88% 7% 4% 1% 0% 0% 1%

School District of Lancaster, 2011-2012 Student Survey May 21-May 25, 2012 Marginal Frequency Report – LINCOLN MIDDLE SCHOOL N=455
Center for Opinion Research 44 Franklin & Marshall College
135. Used marijuana in your lifetime?
0 1 or 2 Times
3 to 5 Times
6 to 9 Times
10 to 19 Times
20 to 39 Times
40 or More Times
Spring 2012 89% 4% 2% 2% 0% 0% 2% Spring 2011 89% 5% 2% 0% 1% 1% 2% Spring 2010 88% 4% 3% 2% 1% 0% 2% Spring 2009 88% 3% 2% 2% 1% 0% 4%
Fall 2008 91% 3% 3% 1% 0% 0% 2% Spring 2008 84% 4% 4% 3% 1% 0% 2%
Fall 2007 90% 4% 2% 1% 1% 0% 2% Spring 2007 91% 5% 1% 2% 1% 0% 0%
Fall 2006 91% 3% 2% 0% 0% 0% 2% 136. Used marijuana during the past 30 days?
0 1 or 2 Times
3 to 5 Times
6 to 9 Times
10 to 19 Times
20 to 39 Times
40 or More Times
Spring 2012 94% 2% 0% 1% 1% 0% 1% Spring 2011 94% 3% 1% 1% 0% 0% 1% Spring 2010 91% 2% 2% 2% 0% 1% 2% Spring 2009 93% 1% 2% 0% 1% 1% 3%
Fall 2008 95% 1% 1% 1% 0% 0% 1% Spring 2008 89% 4% 2% 2% 1% 1% 1%
Fall 2007 93% 4% 2% 0% 0% 0% 1% Spring 2007 96% 2% 0% 1% 0% 0% 0%
Fall 2006 94% 1% 1% 2% 0% 1% 0% How old were you when you first... 137. Had more than a sip or two of beer, wine, or hard liquor?
Never have
10 or younger
11 12 13 14 15 16 17 or older
Spring 2012
60% 15% 8% 8% 7% 2% 0% 0% 0%
Spring 2011 57% 14% 10% 8% 8% 3% 0% 0% 0% 138. Smoked marijuana?
Never have
10 or younger
11 12 13 14 15 16 17 or older
Spring 2012
90% 2% 2% 2% 3% 1% 0% 0% 0%
Spring 2011 89% 3% 1% 2% 3% 2% 0% 0% 0%
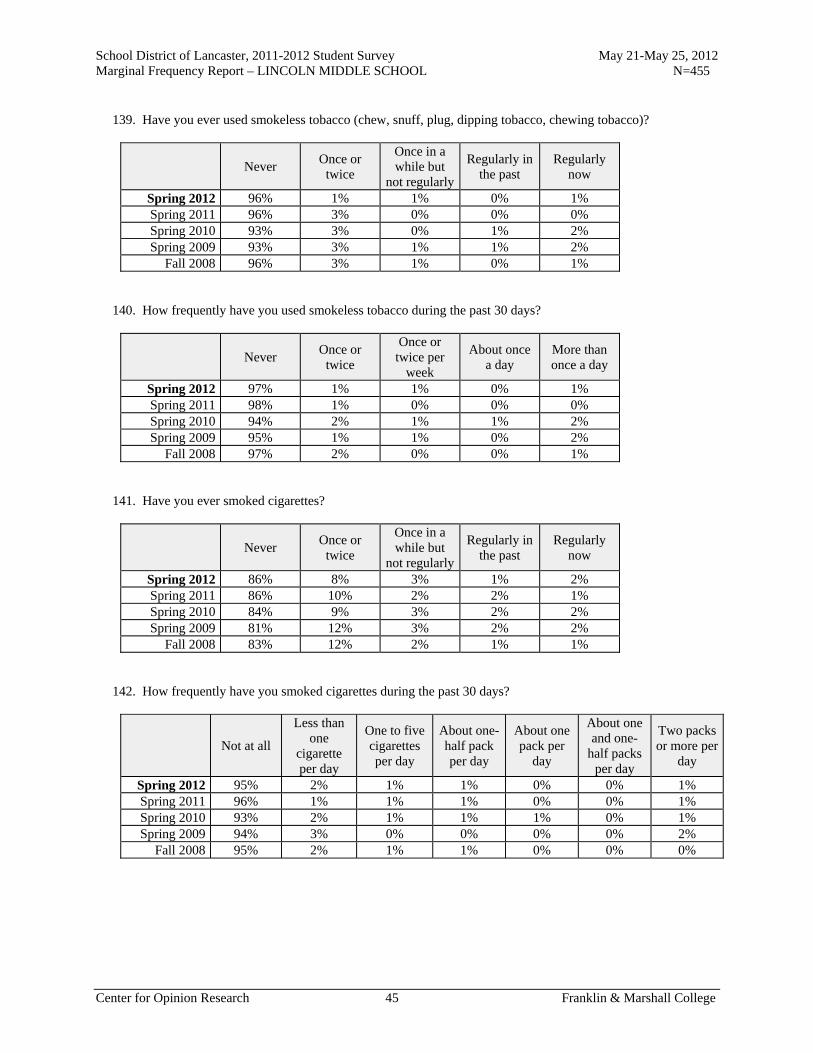
School District of Lancaster, 2011-2012 Student Survey May 21-May 25, 2012 Marginal Frequency Report – LINCOLN MIDDLE SCHOOL N=455
Center for Opinion Research 45 Franklin & Marshall College
139. Have you ever used smokeless tobacco (chew, snuff, plug, dipping tobacco, chewing tobacco)?
Never Once or
twice
Once in a while but
not regularly
Regularly in the past
Regularly now
Spring 2012 96% 1% 1% 0% 1% Spring 2011 96% 3% 0% 0% 0% Spring 2010 93% 3% 0% 1% 2% Spring 2009 93% 3% 1% 1% 2%
Fall 2008 96% 3% 1% 0% 1% 140. How frequently have you used smokeless tobacco during the past 30 days?
Never Once or
twice
Once or twice per
week
About once a day
More than once a day
Spring 2012 97% 1% 1% 0% 1% Spring 2011 98% 1% 0% 0% 0% Spring 2010 94% 2% 1% 1% 2% Spring 2009 95% 1% 1% 0% 2%
Fall 2008 97% 2% 0% 0% 1% 141. Have you ever smoked cigarettes?
Never Once or
twice
Once in a while but
not regularly
Regularly in the past
Regularly now
Spring 2012 86% 8% 3% 1% 2% Spring 2011 86% 10% 2% 2% 1% Spring 2010 84% 9% 3% 2% 2% Spring 2009 81% 12% 3% 2% 2%
Fall 2008 83% 12% 2% 1% 1% 142. How frequently have you smoked cigarettes during the past 30 days?
Not at all
Less than one
cigarette per day
One to five cigarettes per day
About one-half pack per day
About one pack per
day
About one and one-
half packs per day
Two packs or more per
day
Spring 2012 95% 2% 1% 1% 0% 0% 1% Spring 2011 96% 1% 1% 1% 0% 0% 1% Spring 2010 93% 2% 1% 1% 1% 0% 1% Spring 2009 94% 3% 0% 0% 0% 0% 2%
Fall 2008 95% 2% 1% 1% 0% 0% 0%
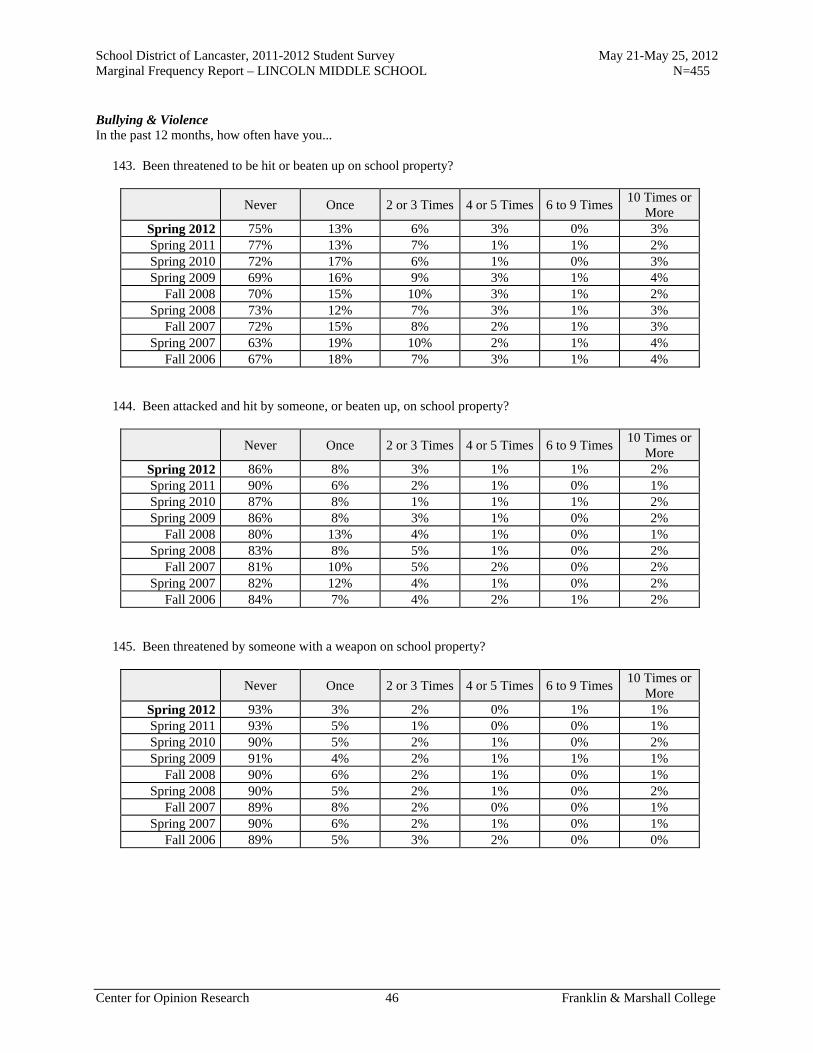
School District of Lancaster, 2011-2012 Student Survey May 21-May 25, 2012 Marginal Frequency Report – LINCOLN MIDDLE SCHOOL N=455
Center for Opinion Research 46 Franklin & Marshall College
Bullying & Violence In the past 12 months, how often have you... 143. Been threatened to be hit or beaten up on school property?
Never Once 2 or 3 Times 4 or 5 Times 6 to 9 Times 10 Times or
More Spring 2012 75% 13% 6% 3% 0% 3% Spring 2011 77% 13% 7% 1% 1% 2% Spring 2010 72% 17% 6% 1% 0% 3% Spring 2009 69% 16% 9% 3% 1% 4%
Fall 2008 70% 15% 10% 3% 1% 2% Spring 2008 73% 12% 7% 3% 1% 3%
Fall 2007 72% 15% 8% 2% 1% 3% Spring 2007 63% 19% 10% 2% 1% 4%
Fall 2006 67% 18% 7% 3% 1% 4% 144. Been attacked and hit by someone, or beaten up, on school property?
Never Once 2 or 3 Times 4 or 5 Times 6 to 9 Times 10 Times or
More Spring 2012 86% 8% 3% 1% 1% 2% Spring 2011 90% 6% 2% 1% 0% 1% Spring 2010 87% 8% 1% 1% 1% 2% Spring 2009 86% 8% 3% 1% 0% 2%
Fall 2008 80% 13% 4% 1% 0% 1% Spring 2008 83% 8% 5% 1% 0% 2%
Fall 2007 81% 10% 5% 2% 0% 2% Spring 2007 82% 12% 4% 1% 0% 2%
Fall 2006 84% 7% 4% 2% 1% 2% 145. Been threatened by someone with a weapon on school property?
Never Once 2 or 3 Times 4 or 5 Times 6 to 9 Times 10 Times or
More Spring 2012 93% 3% 2% 0% 1% 1% Spring 2011 93% 5% 1% 0% 0% 1% Spring 2010 90% 5% 2% 1% 0% 2% Spring 2009 91% 4% 2% 1% 1% 1%
Fall 2008 90% 6% 2% 1% 0% 1% Spring 2008 90% 5% 2% 1% 0% 2%
Fall 2007 89% 8% 2% 0% 0% 1% Spring 2007 90% 6% 2% 1% 0% 1%
Fall 2006 89% 5% 3% 2% 0% 0%

School District of Lancaster, 2011-2012 Student Survey May 21-May 25, 2012 Marginal Frequency Report – LINCOLN MIDDLE SCHOOL N=455
Center for Opinion Research 47 Franklin & Marshall College
146. Been attacked by someone with a weapon on school property?
Never Once 2 or 3 Times 4 or 5 Times 6 to 9 Times 10 Times or
More Spring 2012 94% 2% 1% 2% 0% 1% Spring 2011 94% 2% 1% 1% 0% 1% Spring 2010 94% 2% 1% 0% 0% 2% Spring 2009 95% 3% 0% 0% 0% 1%
Fall 2008 94% 4% 0% 1% 0% 1% Spring 2008 92% 4% 1% 2% 1% 1%
Fall 2007 92% 5% 1% 0% 1% 1% Spring 2007 92% 5% 2% 0% 0% 0%
Fall 2006 93% 3% 1% 1% 1% 1% Cyberbullying So far this school year, have you... 147. Received mean or nasty messages from someone?
No Yes, once or
twice Yes, every
so often Yes, all the
time Spring 2012 76% 19% 2% 2% Spring 2011 80% 15% 2% 2%
148. Received online messages that made you afraid for your safety?
No Yes, once or
twice Yes, every
so often Yes, all the
time Spring 2012 93% 4% 2% 2% Spring 2011 93% 6% 1% 0%
149. Had someone send or post gossip, rumors, or other hurtful material about you?
No Yes, once or
twice Yes, every
so often Yes, all the
time Spring 2012 76% 17% 4% 4% Spring 2011 76% 18% 4% 1%
150. Had someone share your personal secrets or pictures online without your permission?
No Yes, once or
twice Yes, every
so often Yes, all the
time Spring 2012 85% 10% 2% 2% Spring 2011 91% 7% 1% 1%
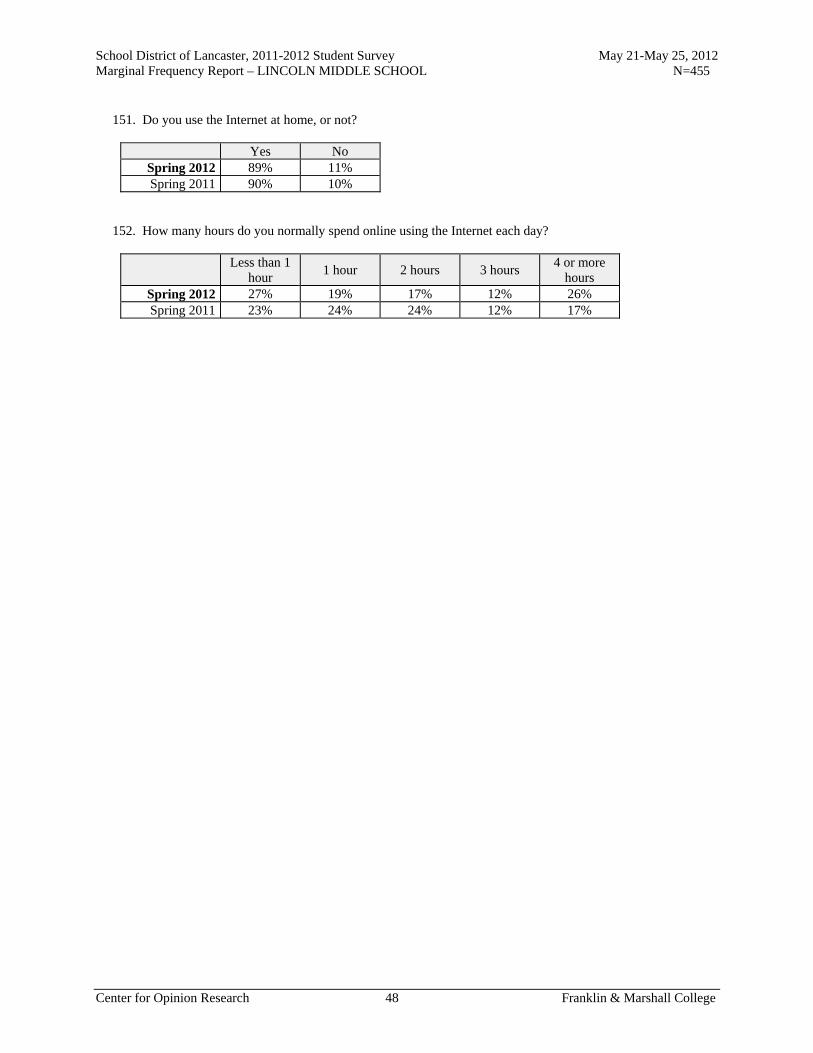
School District of Lancaster, 2011-2012 Student Survey May 21-May 25, 2012 Marginal Frequency Report – LINCOLN MIDDLE SCHOOL N=455
Center for Opinion Research 48 Franklin & Marshall College
151. Do you use the Internet at home, or not?
Yes No Spring 2012 89% 11% Spring 2011 90% 10%
152. How many hours do you normally spend online using the Internet each day?
Less than 1
hour 1 hour 2 hours 3 hours
4 or more hours
Spring 2012 27% 19% 17% 12% 26% Spring 2011 23% 24% 24% 12% 17%

Report S
Marginal Frequency Report Reynolds Middle School

School District of Lancaster, 2011-2012 Student Survey May 21-25, 2012 Marginal Frequency Report – REYNOLDS MIDDLE SCHOOL N=411
Center for Opinion Research 1 Franklin & Marshall College
School Climate Do you agree or disagree with the following statements? 1. I feel safe at this school.
Really Agree
Kind of Agree
Kind of Disagree
Really Disagree
Spring 2012 38% 46% 13% 4% Spring 2011 46% 41% 8% 5% Spring 2010 39% 42% 12% 6% Spring 2009 24% 47% 19% 10%
Fall 2008 34% 46% 12% 8% Spring 2008 26% 47% 17% 9%
Fall 2007 35% 46% 11% 8% Spring 2007 36% 44% 13% 7%
Fall 2006 39% 46% 9% 5% 2. I feel safe going to and from school.
Really Agree
Kind of Agree
Kind of Disagree
Really Disagree
Spring 2012 48% 38% 11% 4% Spring 2011 54% 35% 8% 3% Spring 2010 47% 36% 12% 6% Spring 2009 34% 40% 18% 8%
Fall 2008 44% 39% 9% 7% Spring 2008 31% 40% 18% 11%
Fall 2007 42% 35% 15% 8% Spring 2007 36% 38% 18% 9%
Fall 2006 48% 37% 10% 5% 3. Students get along well with each other.
Really Agree
Kind of Agree
Kind of Disagree
Really Disagree
Spring 2012 8% 34% 37% 21% Spring 2011 6% 39% 37% 18% Spring 2010 5% 38% 36% 21% Spring 2009 4% 30% 38% 28%
Fall 2008 8% 39% 39% 13% Spring 2008 6% 32% 41% 21%
Fall 2007 5% 38% 36% 20% Spring 2007 5% 35% 37% 23%
Fall 2006 7% 39% 36% 19%

School District of Lancaster, 2011-2012 Student Survey May 21-25, 2012 Marginal Frequency Report – REYNOLDS MIDDLE SCHOOL N=411
Center for Opinion Research 2 Franklin & Marshall College
4. Students get along well with teachers.
Really Agree
Kind of Agree
Kind of Disagree
Really Disagree
Spring 2012 11% 30% 39% 20% Spring 2011 8% 39% 37% 16% Spring 2010 4% 36% 42% 18% Spring 2009 4% 25% 43% 28%
Fall 2008 8% 38% 38% 16% Spring 2008 6% 24% 46% 24%
Fall 2007 7% 40% 38% 14% Spring 2007 6% 36% 38% 20%
Fall 2006 13% 40% 37% 11% 5. I like my school.
Really Agree
Kind of Agree
Kind of Disagree
Really Disagree
Spring 2012 35% 37% 17% 11% Spring 2011 42% 36% 13% 9% Spring 2010 33% 39% 15% 14% Spring 2009 27% 39% 18% 16%
Fall 2008 38% 39% 14% 9% Spring 2008 25% 38% 20% 18%
Fall 2007 38% 36% 16% 10% Spring 2007 33% 35% 20% 12%
Fall 2006 42% 34% 12% 12% 6. I like my teachers.
Really Agree
Kind of Agree
Kind of Disagree
Really Disagree
Spring 2012 33% 36% 20% 11% Spring 2011 38% 46% 11% 5% Spring 2010 31% 43% 18% 8% Spring 2009 20% 43% 24% 13%
Fall 2008 32% 43% 19% 6% Spring 2008 22% 43% 21% 14%
Fall 2007 33% 41% 19% 7% Spring 2007 28% 46% 20% 7%
Fall 2006 36% 41% 16% 8%

School District of Lancaster, 2011-2012 Student Survey May 21-25, 2012 Marginal Frequency Report – REYNOLDS MIDDLE SCHOOL N=411
Center for Opinion Research 3 Franklin & Marshall College
7. There is a teacher or some other adult at this school who really cares about me.
Really Agree
Kind of Agree
Kind of Disagree
Really Disagree
Spring 2012 45% 35% 13% 7% Spring 2011 53% 32% 8% 7% Spring 2010 45% 36% 11% 8% Spring 2009 39% 37% 16% 8%
Fall 2008 40% 38% 14% 8% Spring 2008 38% 36% 15% 12%
Fall 2007 39% 40% 12% 10% Spring 2007 43% 38% 12% 7%
Fall 2006 46% 31% 13% 11% 8. There is a teacher or some other adult at this school who cares when I am not here.
Really Agree
Kind of Agree
Kind of Disagree
Really Disagree
Spring 2012 29% 31% 23% 17% Spring 2011 28% 36% 21% 15% Spring 2010 29% 31% 22% 18% Spring 2009 21% 36% 22% 21%
Fall 2008 28% 33% 25% 15% Spring 2008 22% 36% 24% 18%
Fall 2007 25% 34% 25% 15% Spring 2007 23% 34% 25% 18%
Fall 2006 23% 35% 21% 21% 9. There is a teacher or some other adult at this school who listens to me when I have something to say.
Really Agree
Kind of Agree
Kind of Disagree
Really Disagree
Spring 2012 47% 33% 13% 7% Spring 2011 51% 32% 11% 7% Spring 2010 43% 38% 11% 8% Spring 2009 34% 34% 20% 12%
Fall 2008 43% 35% 15% 7% Spring 2008 36% 36% 19% 10%
Fall 2007 44% 31% 17% 8% Spring 2007 43% 33% 16% 8%
Fall 2006 50% 32% 10% 8%

School District of Lancaster, 2011-2012 Student Survey May 21-25, 2012 Marginal Frequency Report – REYNOLDS MIDDLE SCHOOL N=411
Center for Opinion Research 4 Franklin & Marshall College
10. There is a teacher or some other adult at this school who tells me when I do a good job.
Really Agree
Kind of Agree
Kind of Disagree
Really Disagree
Spring 2012 51% 33% 10% 5% Spring 2011 60% 30% 6% 4% Spring 2010 52% 34% 8% 6% Spring 2009 43% 37% 12% 8%
Fall 2008 50% 36% 10% 5% Spring 2008 38% 39% 12% 10%
Fall 2007 47% 39% 8% 6% Spring 2007 47% 38% 10% 5%
Fall 2006 59% 28% 7% 5% 11. There is a teacher or some other adult at this school who always wants me to do my best.
Really Agree
Kind of Agree
Kind of Disagree
Really Disagree
Spring 2012 61% 28% 7% 4% Spring 2011 66% 27% 4% 3% Spring 2010 61% 30% 6% 4% Spring 2009 54% 34% 6% 6%
Fall 2008 62% 30% 5% 4% Spring 2008 52% 35% 8% 6%
Fall 2007 66% 26% 5% 3% Spring 2007 67% 27% 4% 2%
Fall 2006 72% 22% 3% 2% 12. There is a teacher or some other adult at this school who believes that I will be a success.
Really Agree
Kind of Agree
Kind of Disagree
Really Disagree
Spring 2012 50% 38% 9% 3% Spring 2011 56% 34% 7% 4% Spring 2010 50% 35% 11% 4% Spring 2009 42% 41% 12% 6%
Fall 2008 49% 34% 10% 6% Spring 2008 46% 34% 12% 7%
Fall 2007 49% 39% 8% 4% Spring 2007 55% 33% 9% 4%
Fall 2006 58% 30% 9% 3%

School District of Lancaster, 2011-2012 Student Survey May 21-25, 2012 Marginal Frequency Report – REYNOLDS MIDDLE SCHOOL N=411
Center for Opinion Research 5 Franklin & Marshall College
13. Students in this school really listen to teachers.
Really Agree
Kind of Agree
Kind of Disagree
Really Disagree
Spring 2012 7% 25% 39% 29% Spring 2011 7% 25% 42% 26% Spring 2010 5% 26% 45% 24% Spring 2009 3% 23% 43% 31%
Fall 2008 4% 30% 48% 19% Spring 2008 4% 22% 46% 28%
Fall 2007 3% 25% 45% 26% Spring 2007 3% 26% 44% 26%
Fall 2006 6% 28% 41% 25% 14. Most teachers make learning interesting.
Really Agree
Kind of Agree
Kind of Disagree
Really Disagree
Spring 2012 22% 36% 27% 15% Spring 2011 28% 42% 21% 8% Spring 2010 22% 46% 20% 12% Spring 2009 13% 43% 28% 16%
Fall 2008 20% 45% 25% 10% Spring 2008 16% 40% 27% 17%
Fall 2007 23% 40% 24% 13% Spring 2007 21% 41% 26% 12%
Fall 2006 30% 41% 20% 9% 15. This school is always getting better.
Really Agree
Kind of Agree
Kind of Disagree
Really Disagree
Spring 2012 17% 33% 27% 22% Spring 2011 17% 37% 30% 17% Spring 2010 14% 32% 32% 21% Spring 2009 8% 30% 36% 26%
Fall 2008 17% 35% 28% 20% Spring 2008 10% 30% 33% 27%
Fall 2007 18% 32% 33% 17% Spring 2007 12% 37% 30% 21%
Fall 2006 20% 40% 23% 17%
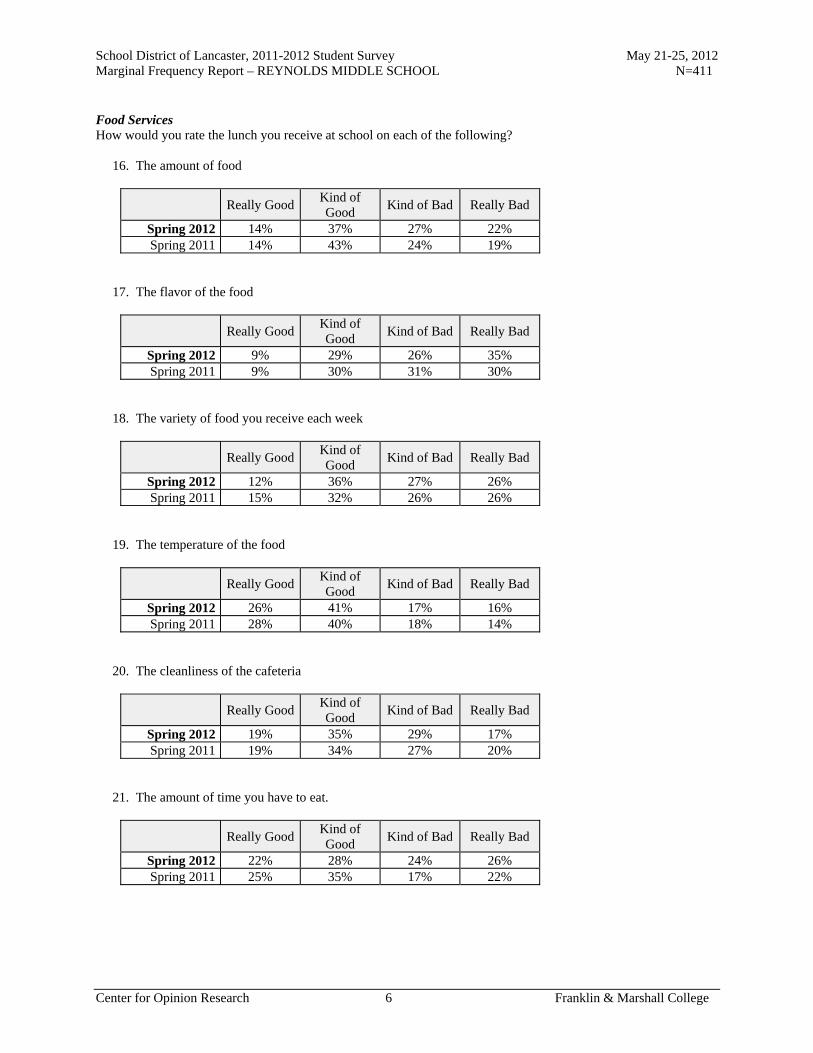
School District of Lancaster, 2011-2012 Student Survey May 21-25, 2012 Marginal Frequency Report – REYNOLDS MIDDLE SCHOOL N=411
Center for Opinion Research 6 Franklin & Marshall College
Food Services How would you rate the lunch you receive at school on each of the following? 16. The amount of food
Really Good Kind of Good
Kind of Bad Really Bad
Spring 2012 14% 37% 27% 22% Spring 2011 14% 43% 24% 19%
17. The flavor of the food
Really Good Kind of Good
Kind of Bad Really Bad
Spring 2012 9% 29% 26% 35% Spring 2011 9% 30% 31% 30%
18. The variety of food you receive each week
Really Good Kind of Good
Kind of Bad Really Bad
Spring 2012 12% 36% 27% 26% Spring 2011 15% 32% 26% 26%
19. The temperature of the food
Really Good Kind of Good
Kind of Bad Really Bad
Spring 2012 26% 41% 17% 16% Spring 2011 28% 40% 18% 14%
20. The cleanliness of the cafeteria
Really Good Kind of Good
Kind of Bad Really Bad
Spring 2012 19% 35% 29% 17% Spring 2011 19% 34% 27% 20%
21. The amount of time you have to eat.
Really Good Kind of Good
Kind of Bad Really Bad
Spring 2012 22% 28% 24% 26% Spring 2011 25% 35% 17% 22%

School District of Lancaster, 2011-2012 Student Survey May 21-25, 2012 Marginal Frequency Report – REYNOLDS MIDDLE SCHOOL N=411
Center for Opinion Research 7 Franklin & Marshall College
Readiness and Emergency Management 22. Has anyone from your school spoken with you about what to do in the event of a school emergency, or not?
Yes No Spring 2012 80% 20% Spring 2011 84% 16%
Do you agree or disagree with the following statement? 23. I know what to do if there is a school emergency.
Really Agree
Kind of Agree
Kind of Disagree
Really Disagree
Spring 2012 63% 29% 4% 4% Spring 2011 63% 32% 4% 1%
Peer Academic Climate Do you agree or disagree with the following statements? 24. Most of my friends want to do well at school.
Really Agree
Kind of Agree
Kind of Disagree
Really Disagree
Spring 2012 30% 51% 16% 3% Spring 2011 36% 50% 11% 3% Spring 2010 32% 48% 13% 7% Spring 2009 27% 49% 16% 8%
Fall 2008 41% 42% 12% 5% Spring 2008 34% 46% 14% 6%
Fall 2007 35% 47% 13% 5% Spring 2007 35% 49% 11% 5%
Fall 2006 42% 42% 13% 4% 25. Most of my friends want to go to college.
Really Agree
Kind of Agree
Kind of Disagree
Really Disagree
Spring 2012 40% 43% 13% 4% Spring 2011 42% 45% 9% 4% Spring 2010 40% 37% 17% 5% Spring 2009 37% 44% 12% 7%
Fall 2008 46% 40% 12% 3% Spring 2008 37% 44% 12% 6%
Fall 2007 49% 36% 11% 4% Spring 2007 43% 39% 13% 5%
Fall 2006 49% 35% 12% 4%
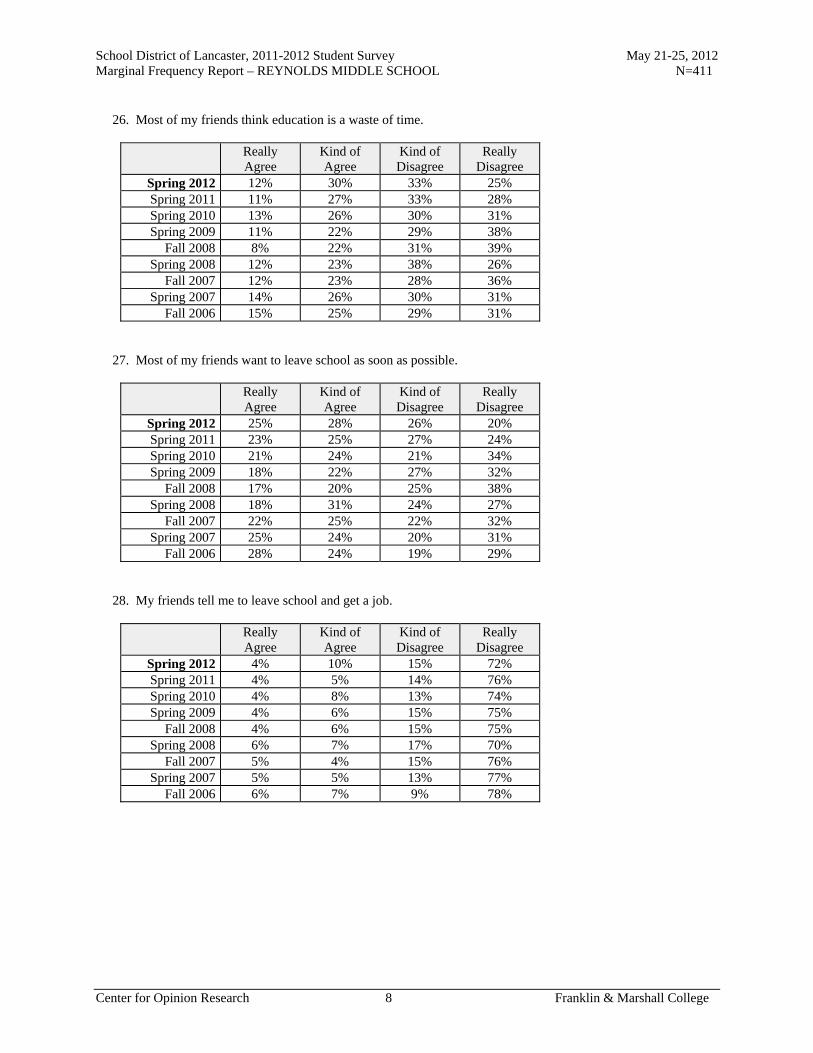
School District of Lancaster, 2011-2012 Student Survey May 21-25, 2012 Marginal Frequency Report – REYNOLDS MIDDLE SCHOOL N=411
Center for Opinion Research 8 Franklin & Marshall College
26. Most of my friends think education is a waste of time.
Really Agree
Kind of Agree
Kind of Disagree
Really Disagree
Spring 2012 12% 30% 33% 25% Spring 2011 11% 27% 33% 28% Spring 2010 13% 26% 30% 31% Spring 2009 11% 22% 29% 38%
Fall 2008 8% 22% 31% 39% Spring 2008 12% 23% 38% 26%
Fall 2007 12% 23% 28% 36% Spring 2007 14% 26% 30% 31%
Fall 2006 15% 25% 29% 31% 27. Most of my friends want to leave school as soon as possible.
Really Agree
Kind of Agree
Kind of Disagree
Really Disagree
Spring 2012 25% 28% 26% 20% Spring 2011 23% 25% 27% 24% Spring 2010 21% 24% 21% 34% Spring 2009 18% 22% 27% 32%
Fall 2008 17% 20% 25% 38% Spring 2008 18% 31% 24% 27%
Fall 2007 22% 25% 22% 32% Spring 2007 25% 24% 20% 31%
Fall 2006 28% 24% 19% 29% 28. My friends tell me to leave school and get a job.
Really Agree
Kind of Agree
Kind of Disagree
Really Disagree
Spring 2012 4% 10% 15% 72% Spring 2011 4% 5% 14% 76% Spring 2010 4% 8% 13% 74% Spring 2009 4% 6% 15% 75%
Fall 2008 4% 6% 15% 75% Spring 2008 6% 7% 17% 70%
Fall 2007 5% 4% 15% 76% Spring 2007 5% 5% 13% 77%
Fall 2006 6% 7% 9% 78%
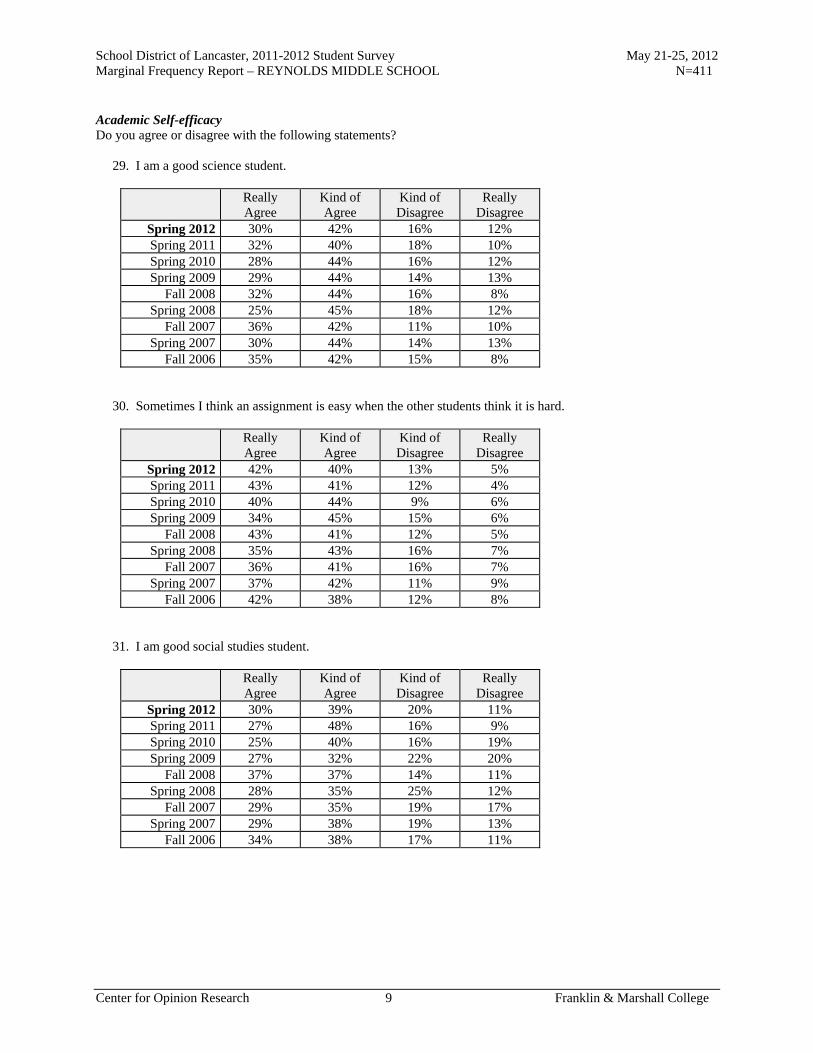
School District of Lancaster, 2011-2012 Student Survey May 21-25, 2012 Marginal Frequency Report – REYNOLDS MIDDLE SCHOOL N=411
Center for Opinion Research 9 Franklin & Marshall College
Academic Self-efficacy Do you agree or disagree with the following statements? 29. I am a good science student.
Really Agree
Kind of Agree
Kind of Disagree
Really Disagree
Spring 2012 30% 42% 16% 12% Spring 2011 32% 40% 18% 10% Spring 2010 28% 44% 16% 12% Spring 2009 29% 44% 14% 13%
Fall 2008 32% 44% 16% 8% Spring 2008 25% 45% 18% 12%
Fall 2007 36% 42% 11% 10% Spring 2007 30% 44% 14% 13%
Fall 2006 35% 42% 15% 8% 30. Sometimes I think an assignment is easy when the other students think it is hard.
Really Agree
Kind of Agree
Kind of Disagree
Really Disagree
Spring 2012 42% 40% 13% 5% Spring 2011 43% 41% 12% 4% Spring 2010 40% 44% 9% 6% Spring 2009 34% 45% 15% 6%
Fall 2008 43% 41% 12% 5% Spring 2008 35% 43% 16% 7%
Fall 2007 36% 41% 16% 7% Spring 2007 37% 42% 11% 9%
Fall 2006 42% 38% 12% 8% 31. I am good social studies student.
Really Agree
Kind of Agree
Kind of Disagree
Really Disagree
Spring 2012 30% 39% 20% 11% Spring 2011 27% 48% 16% 9% Spring 2010 25% 40% 16% 19% Spring 2009 27% 32% 22% 20%
Fall 2008 37% 37% 14% 11% Spring 2008 28% 35% 25% 12%
Fall 2007 29% 35% 19% 17% Spring 2007 29% 38% 19% 13%
Fall 2006 34% 38% 17% 11%
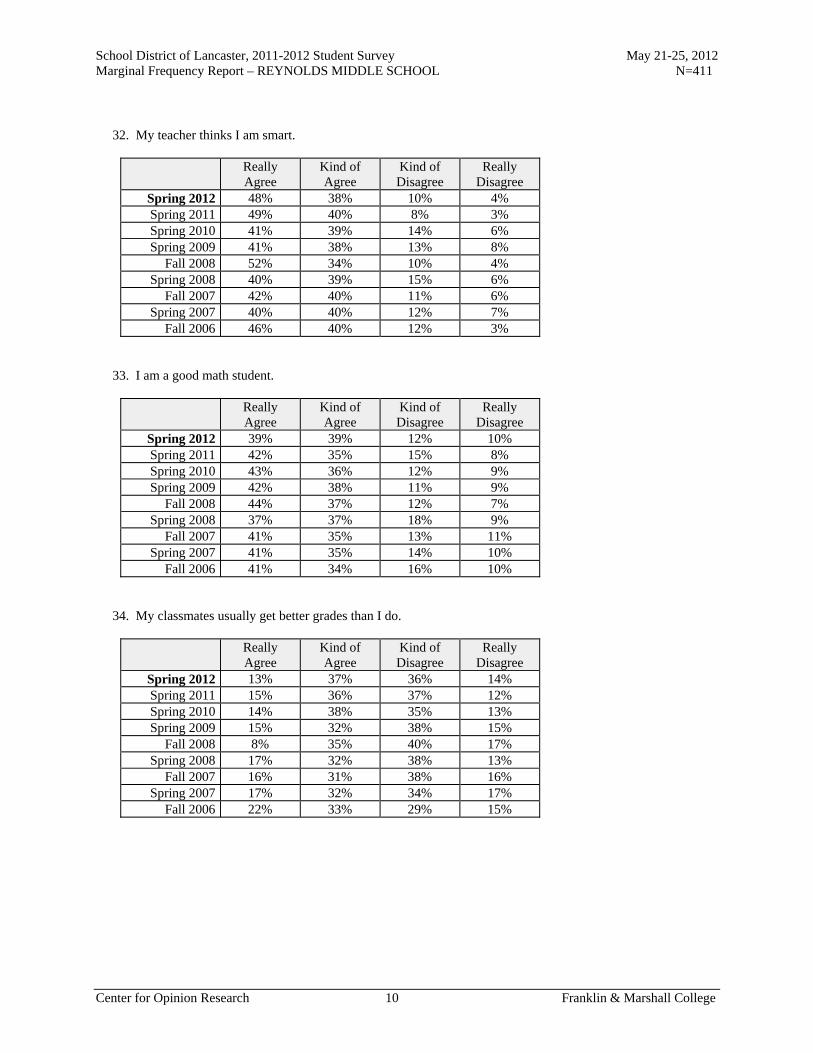
School District of Lancaster, 2011-2012 Student Survey May 21-25, 2012 Marginal Frequency Report – REYNOLDS MIDDLE SCHOOL N=411
Center for Opinion Research 10 Franklin & Marshall College
32. My teacher thinks I am smart.
Really Agree
Kind of Agree
Kind of Disagree
Really Disagree
Spring 2012 48% 38% 10% 4% Spring 2011 49% 40% 8% 3% Spring 2010 41% 39% 14% 6% Spring 2009 41% 38% 13% 8%
Fall 2008 52% 34% 10% 4% Spring 2008 40% 39% 15% 6%
Fall 2007 42% 40% 11% 6% Spring 2007 40% 40% 12% 7%
Fall 2006 46% 40% 12% 3% 33. I am a good math student.
Really Agree
Kind of Agree
Kind of Disagree
Really Disagree
Spring 2012 39% 39% 12% 10% Spring 2011 42% 35% 15% 8% Spring 2010 43% 36% 12% 9% Spring 2009 42% 38% 11% 9%
Fall 2008 44% 37% 12% 7% Spring 2008 37% 37% 18% 9%
Fall 2007 41% 35% 13% 11% Spring 2007 41% 35% 14% 10%
Fall 2006 41% 34% 16% 10% 34. My classmates usually get better grades than I do.
Really Agree
Kind of Agree
Kind of Disagree
Really Disagree
Spring 2012 13% 37% 36% 14% Spring 2011 15% 36% 37% 12% Spring 2010 14% 38% 35% 13% Spring 2009 15% 32% 38% 15%
Fall 2008 8% 35% 40% 17% Spring 2008 17% 32% 38% 13%
Fall 2007 16% 31% 38% 16% Spring 2007 17% 32% 34% 17%
Fall 2006 22% 33% 29% 15%

School District of Lancaster, 2011-2012 Student Survey May 21-25, 2012 Marginal Frequency Report – REYNOLDS MIDDLE SCHOOL N=411
Center for Opinion Research 11 Franklin & Marshall College
35. I usually understand my homework assignments.
Really Agree
Kind of Agree
Kind of Disagree
Really Disagree
Spring 2012 30% 44% 19% 6% Spring 2011 33% 47% 15% 5% Spring 2010 28% 48% 16% 8% Spring 2009 28% 47% 18% 7%
Fall 2008 35% 41% 18% 6% Spring 2008 30% 43% 20% 7%
Fall 2007 30% 47% 16% 7% Spring 2007 30% 46% 17% 8%
Fall 2006 35% 43% 15% 7% 36. I could get the best grades in class if I tried hard enough.
Really Agree
Kind of Agree
Kind of Disagree
Really Disagree
Spring 2012 62% 28% 8% 3% Spring 2011 65% 25% 6% 4% Spring 2010 61% 28% 7% 5% Spring 2009 60% 28% 9% 3%
Fall 2008 65% 26% 7% 3% Spring 2008 64% 26% 6% 4%
Fall 2007 67% 24% 6% 3% Spring 2007 67% 22% 6% 4%
Fall 2006 68% 21% 7% 4% 37. I am a good reading student.
Really Agree
Kind of Agree
Kind of Disagree
Really Disagree
Spring 2012 50% 33% 12% 4% Spring 2011 44% 37% 14% 6% Spring 2010 42% 40% 10% 8% Spring 2009 43% 36% 15% 6%
Fall 2008 47% 37% 12% 4% Spring 2008 43% 39% 12% 7%
Fall 2007 45% 37% 11% 8% Spring 2007 37% 46% 12% 5%
Fall 2006 49% 33% 13% 5%
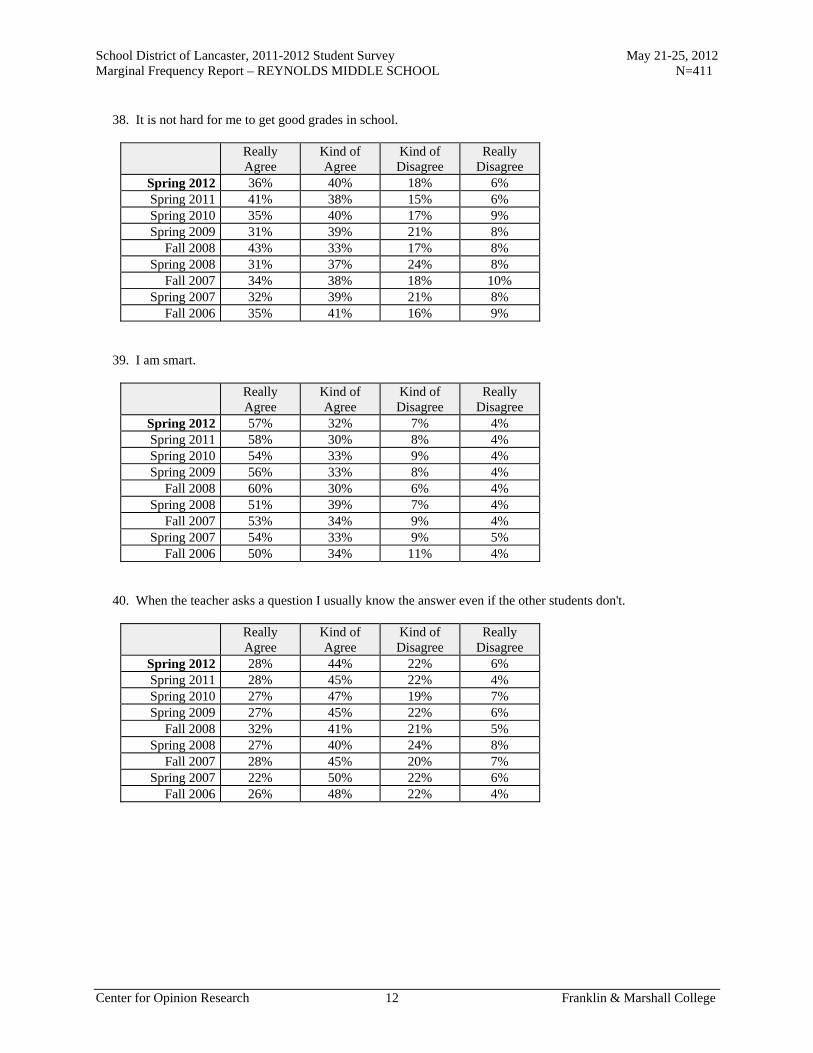
School District of Lancaster, 2011-2012 Student Survey May 21-25, 2012 Marginal Frequency Report – REYNOLDS MIDDLE SCHOOL N=411
Center for Opinion Research 12 Franklin & Marshall College
38. It is not hard for me to get good grades in school.
Really Agree
Kind of Agree
Kind of Disagree
Really Disagree
Spring 2012 36% 40% 18% 6% Spring 2011 41% 38% 15% 6% Spring 2010 35% 40% 17% 9% Spring 2009 31% 39% 21% 8%
Fall 2008 43% 33% 17% 8% Spring 2008 31% 37% 24% 8%
Fall 2007 34% 38% 18% 10% Spring 2007 32% 39% 21% 8%
Fall 2006 35% 41% 16% 9% 39. I am smart.
Really Agree
Kind of Agree
Kind of Disagree
Really Disagree
Spring 2012 57% 32% 7% 4% Spring 2011 58% 30% 8% 4% Spring 2010 54% 33% 9% 4% Spring 2009 56% 33% 8% 4%
Fall 2008 60% 30% 6% 4% Spring 2008 51% 39% 7% 4%
Fall 2007 53% 34% 9% 4% Spring 2007 54% 33% 9% 5%
Fall 2006 50% 34% 11% 4% 40. When the teacher asks a question I usually know the answer even if the other students don't.
Really Agree
Kind of Agree
Kind of Disagree
Really Disagree
Spring 2012 28% 44% 22% 6% Spring 2011 28% 45% 22% 4% Spring 2010 27% 47% 19% 7% Spring 2009 27% 45% 22% 6%
Fall 2008 32% 41% 21% 5% Spring 2008 27% 40% 24% 8%
Fall 2007 28% 45% 20% 7% Spring 2007 22% 50% 22% 6%
Fall 2006 26% 48% 22% 4%
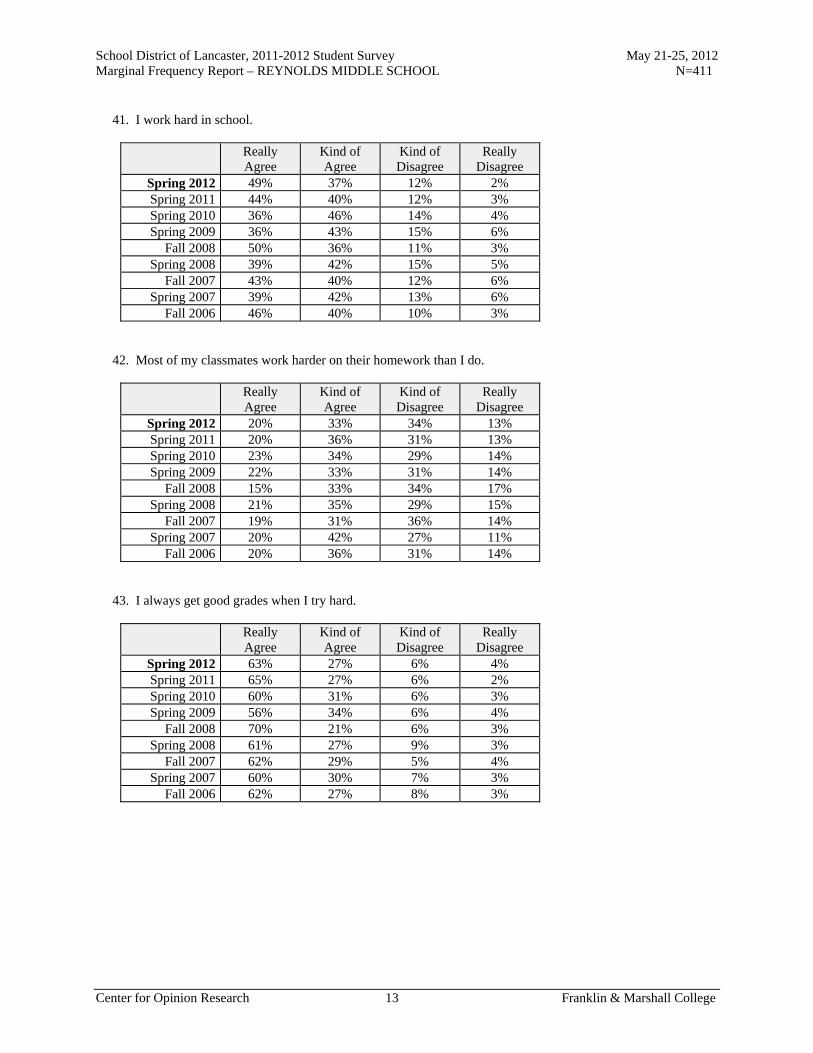
School District of Lancaster, 2011-2012 Student Survey May 21-25, 2012 Marginal Frequency Report – REYNOLDS MIDDLE SCHOOL N=411
Center for Opinion Research 13 Franklin & Marshall College
41. I work hard in school.
Really Agree
Kind of Agree
Kind of Disagree
Really Disagree
Spring 2012 49% 37% 12% 2% Spring 2011 44% 40% 12% 3% Spring 2010 36% 46% 14% 4% Spring 2009 36% 43% 15% 6%
Fall 2008 50% 36% 11% 3% Spring 2008 39% 42% 15% 5%
Fall 2007 43% 40% 12% 6% Spring 2007 39% 42% 13% 6%
Fall 2006 46% 40% 10% 3% 42. Most of my classmates work harder on their homework than I do.
Really Agree
Kind of Agree
Kind of Disagree
Really Disagree
Spring 2012 20% 33% 34% 13% Spring 2011 20% 36% 31% 13% Spring 2010 23% 34% 29% 14% Spring 2009 22% 33% 31% 14%
Fall 2008 15% 33% 34% 17% Spring 2008 21% 35% 29% 15%
Fall 2007 19% 31% 36% 14% Spring 2007 20% 42% 27% 11%
Fall 2006 20% 36% 31% 14% 43. I always get good grades when I try hard.
Really Agree
Kind of Agree
Kind of Disagree
Really Disagree
Spring 2012 63% 27% 6% 4% Spring 2011 65% 27% 6% 2% Spring 2010 60% 31% 6% 3% Spring 2009 56% 34% 6% 4%
Fall 2008 70% 21% 6% 3% Spring 2008 61% 27% 9% 3%
Fall 2007 62% 29% 5% 4% Spring 2007 60% 30% 7% 3%
Fall 2006 62% 27% 8% 3%

School District of Lancaster, 2011-2012 Student Survey May 21-25, 2012 Marginal Frequency Report – REYNOLDS MIDDLE SCHOOL N=411
Center for Opinion Research 14 Franklin & Marshall College
44. I usually do not get good grades in math because it is too hard.
Really Agree
Kind of Agree
Kind of Disagree
Really Disagree
Spring 2012 13% 26% 29% 33% Spring 2011 13% 23% 27% 38% Spring 2010 13% 17% 25% 45% Spring 2009 14% 17% 29% 41%
Fall 2008 15% 18% 24% 43% Spring 2008 14% 25% 26% 34%
Fall 2007 15% 20% 26% 39% Spring 2007 14% 20% 27% 39%
Fall 2006 20% 24% 22% 35% 45. Most of my classmates like to do math because it is easy.
Really Agree
Kind of Agree
Kind of Disagree
Really Disagree
Spring 2012 26% 34% 28% 13% Spring 2011 29% 33% 25% 13% Spring 2010 25% 35% 28% 12% Spring 2009 23% 38% 25% 15%
Fall 2008 26% 30% 29% 15% Spring 2008 22% 35% 24% 19%
Fall 2007 25% 32% 26% 17% Spring 2007 21% 34% 28% 17%
Fall 2006 24% 33% 23% 20% 46. I would get better grades if my teacher liked me more.
Really Agree
Kind of Agree
Kind of Disagree
Really Disagree
Spring 2012 15% 20% 25% 41% Spring 2011 13% 15% 25% 47% Spring 2010 15% 18% 25% 43% Spring 2009 17% 16% 21% 46%
Fall 2008 13% 16% 27% 44% Spring 2008 15% 19% 25% 41%
Fall 2007 12% 17% 28% 43% Spring 2007 11% 19% 26% 44%
Fall 2006 14% 21% 23% 42%

School District of Lancaster, 2011-2012 Student Survey May 21-25, 2012 Marginal Frequency Report – REYNOLDS MIDDLE SCHOOL N=411
Center for Opinion Research 15 Franklin & Marshall College
47. I will graduate from high school.
Really Agree
Kind of Agree
Kind of Disagree
Really Disagree
Spring 2012 82% 14% 2% 1% Spring 2011 87% 11% 2% 0% Spring 2010 80% 16% 3% 1% Spring 2009 86% 10% 1% 3%
Fall 2008 87% 10% 1% 2% Spring 2008 75% 17% 6% 3%
Fall 2007 81% 14% 3% 2% Spring 2007 79% 15% 4% 2%
Fall 2006 81% 14% 3% 2% 48. I go to a good school.
Really Agree
Kind of Agree
Kind of Disagree
Really Disagree
Spring 2012 43% 34% 13% 10% Spring 2011 48% 36% 11% 6% Spring 2010 38% 37% 15% 11% Spring 2009 33% 34% 17% 16%
Fall 2008 44% 34% 14% 7% Spring 2008 35% 37% 15% 12%
Fall 2007 45% 32% 15% 8% Spring 2007 40% 38% 13% 9%
Fall 2006 50% 32% 11% 7% 49. Adults who have good jobs probably were good students when they were young.
Really Agree
Kind of Agree
Kind of Disagree
Really Disagree
Spring 2012 52% 31% 12% 4% Spring 2011 54% 30% 11% 4% Spring 2010 53% 32% 12% 4% Spring 2009 43% 33% 15% 10%
Fall 2008 60% 26% 10% 4% Spring 2008 49% 33% 15% 4%
Fall 2007 56% 27% 12% 5% Spring 2007 45% 35% 13% 7%
Fall 2006 55% 31% 8% 6%
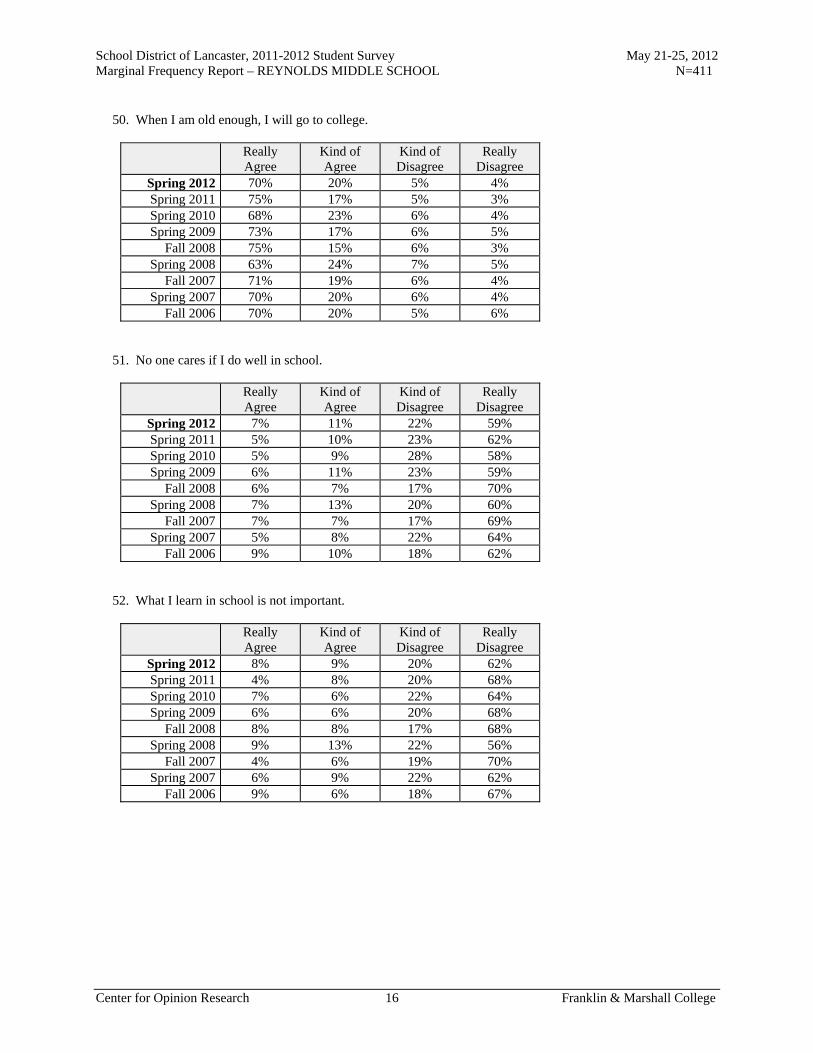
School District of Lancaster, 2011-2012 Student Survey May 21-25, 2012 Marginal Frequency Report – REYNOLDS MIDDLE SCHOOL N=411
Center for Opinion Research 16 Franklin & Marshall College
50. When I am old enough, I will go to college.
Really Agree
Kind of Agree
Kind of Disagree
Really Disagree
Spring 2012 70% 20% 5% 4% Spring 2011 75% 17% 5% 3% Spring 2010 68% 23% 6% 4% Spring 2009 73% 17% 6% 5%
Fall 2008 75% 15% 6% 3% Spring 2008 63% 24% 7% 5%
Fall 2007 71% 19% 6% 4% Spring 2007 70% 20% 6% 4%
Fall 2006 70% 20% 5% 6% 51. No one cares if I do well in school.
Really Agree
Kind of Agree
Kind of Disagree
Really Disagree
Spring 2012 7% 11% 22% 59% Spring 2011 5% 10% 23% 62% Spring 2010 5% 9% 28% 58% Spring 2009 6% 11% 23% 59%
Fall 2008 6% 7% 17% 70% Spring 2008 7% 13% 20% 60%
Fall 2007 7% 7% 17% 69% Spring 2007 5% 8% 22% 64%
Fall 2006 9% 10% 18% 62% 52. What I learn in school is not important.
Really Agree
Kind of Agree
Kind of Disagree
Really Disagree
Spring 2012 8% 9% 20% 62% Spring 2011 4% 8% 20% 68% Spring 2010 7% 6% 22% 64% Spring 2009 6% 6% 20% 68%
Fall 2008 8% 8% 17% 68% Spring 2008 9% 13% 22% 56%
Fall 2007 4% 6% 19% 70% Spring 2007 6% 9% 22% 62%
Fall 2006 9% 6% 18% 67%
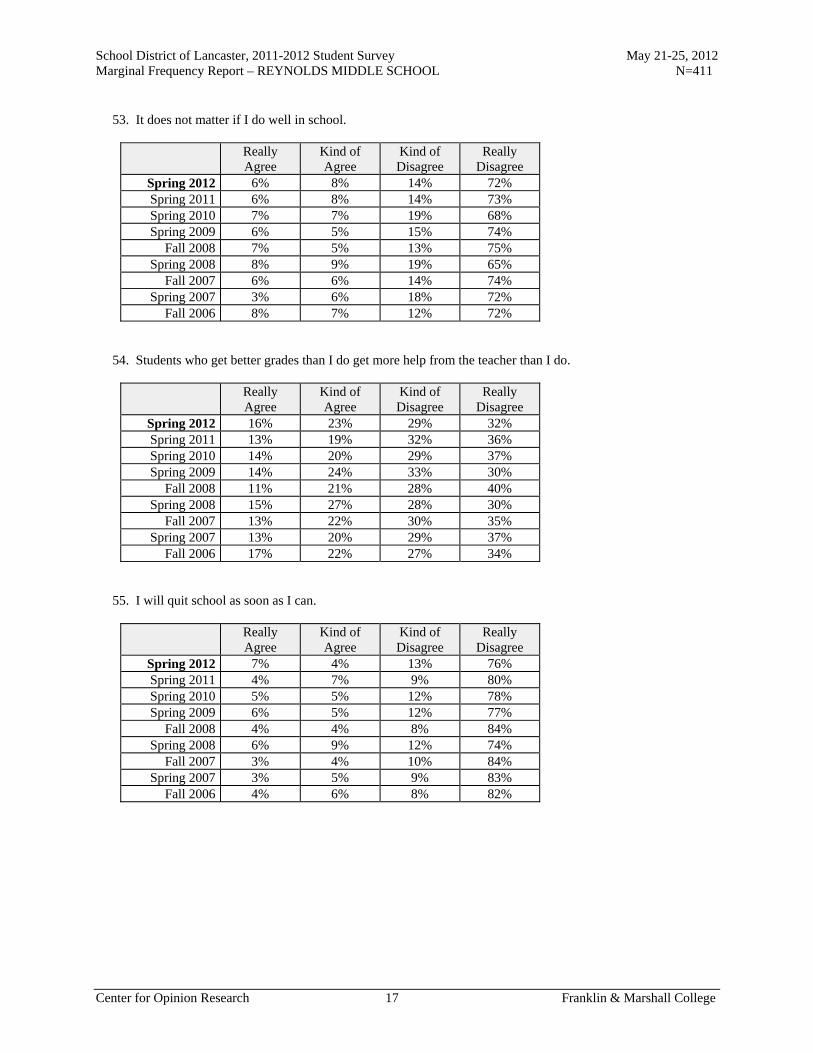
School District of Lancaster, 2011-2012 Student Survey May 21-25, 2012 Marginal Frequency Report – REYNOLDS MIDDLE SCHOOL N=411
Center for Opinion Research 17 Franklin & Marshall College
53. It does not matter if I do well in school.
Really Agree
Kind of Agree
Kind of Disagree
Really Disagree
Spring 2012 6% 8% 14% 72% Spring 2011 6% 8% 14% 73% Spring 2010 7% 7% 19% 68% Spring 2009 6% 5% 15% 74%
Fall 2008 7% 5% 13% 75% Spring 2008 8% 9% 19% 65%
Fall 2007 6% 6% 14% 74% Spring 2007 3% 6% 18% 72%
Fall 2006 8% 7% 12% 72% 54. Students who get better grades than I do get more help from the teacher than I do.
Really Agree
Kind of Agree
Kind of Disagree
Really Disagree
Spring 2012 16% 23% 29% 32% Spring 2011 13% 19% 32% 36% Spring 2010 14% 20% 29% 37% Spring 2009 14% 24% 33% 30%
Fall 2008 11% 21% 28% 40% Spring 2008 15% 27% 28% 30%
Fall 2007 13% 22% 30% 35% Spring 2007 13% 20% 29% 37%
Fall 2006 17% 22% 27% 34% 55. I will quit school as soon as I can.
Really Agree
Kind of Agree
Kind of Disagree
Really Disagree
Spring 2012 7% 4% 13% 76% Spring 2011 4% 7% 9% 80% Spring 2010 5% 5% 12% 78% Spring 2009 6% 5% 12% 77%
Fall 2008 4% 4% 8% 84% Spring 2008 6% 9% 12% 74%
Fall 2007 3% 4% 10% 84% Spring 2007 3% 5% 9% 83%
Fall 2006 4% 6% 8% 82%
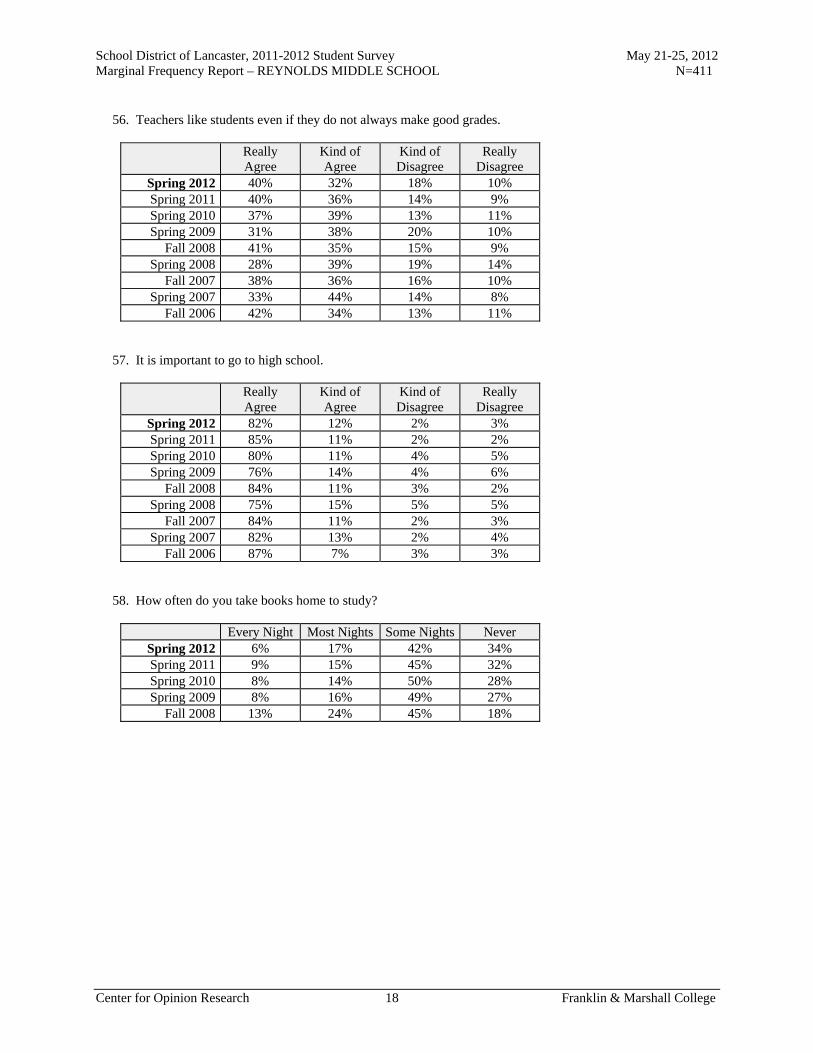
School District of Lancaster, 2011-2012 Student Survey May 21-25, 2012 Marginal Frequency Report – REYNOLDS MIDDLE SCHOOL N=411
Center for Opinion Research 18 Franklin & Marshall College
56. Teachers like students even if they do not always make good grades.
Really Agree
Kind of Agree
Kind of Disagree
Really Disagree
Spring 2012 40% 32% 18% 10% Spring 2011 40% 36% 14% 9% Spring 2010 37% 39% 13% 11% Spring 2009 31% 38% 20% 10%
Fall 2008 41% 35% 15% 9% Spring 2008 28% 39% 19% 14%
Fall 2007 38% 36% 16% 10% Spring 2007 33% 44% 14% 8%
Fall 2006 42% 34% 13% 11% 57. It is important to go to high school.
Really Agree
Kind of Agree
Kind of Disagree
Really Disagree
Spring 2012 82% 12% 2% 3% Spring 2011 85% 11% 2% 2% Spring 2010 80% 11% 4% 5% Spring 2009 76% 14% 4% 6%
Fall 2008 84% 11% 3% 2% Spring 2008 75% 15% 5% 5%
Fall 2007 84% 11% 2% 3% Spring 2007 82% 13% 2% 4%
Fall 2006 87% 7% 3% 3% 58. How often do you take books home to study?
Every Night Most Nights Some Nights Never Spring 2012 6% 17% 42% 34% Spring 2011 9% 15% 45% 32% Spring 2010 8% 14% 50% 28% Spring 2009 8% 16% 49% 27%
Fall 2008 13% 24% 45% 18%
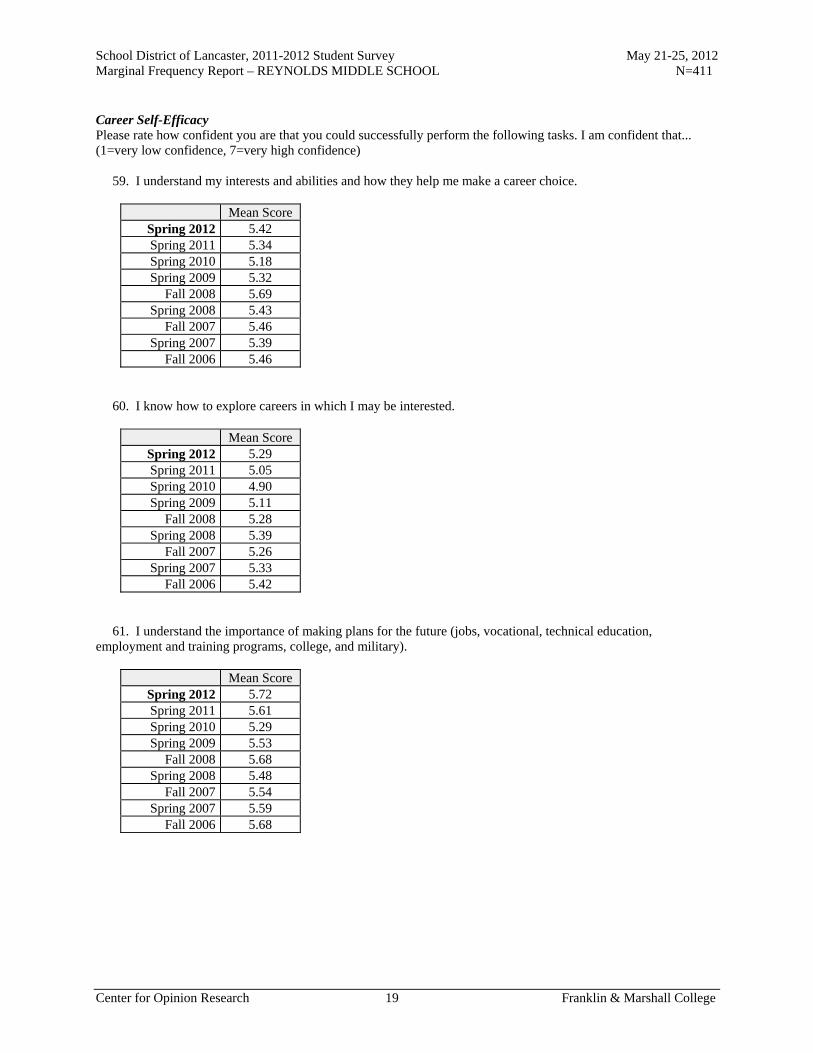
School District of Lancaster, 2011-2012 Student Survey May 21-25, 2012 Marginal Frequency Report – REYNOLDS MIDDLE SCHOOL N=411
Center for Opinion Research 19 Franklin & Marshall College
Career Self-Efficacy Please rate how confident you are that you could successfully perform the following tasks. I am confident that... (1=very low confidence, 7=very high confidence) 59. I understand my interests and abilities and how they help me make a career choice.
Mean Score Spring 2012 5.42 Spring 2011 5.34 Spring 2010 5.18 Spring 2009 5.32
Fall 2008 5.69 Spring 2008 5.43
Fall 2007 5.46 Spring 2007 5.39
Fall 2006 5.46 60. I know how to explore careers in which I may be interested.
Mean Score Spring 2012 5.29 Spring 2011 5.05 Spring 2010 4.90 Spring 2009 5.11
Fall 2008 5.28 Spring 2008 5.39
Fall 2007 5.26 Spring 2007 5.33
Fall 2006 5.42 61. I understand the importance of making plans for the future (jobs, vocational, technical education, employment and training programs, college, and military).
Mean Score Spring 2012 5.72 Spring 2011 5.61 Spring 2010 5.29 Spring 2009 5.53
Fall 2008 5.68 Spring 2008 5.48
Fall 2007 5.54 Spring 2007 5.59
Fall 2006 5.68

School District of Lancaster, 2011-2012 Student Survey May 21-25, 2012 Marginal Frequency Report – REYNOLDS MIDDLE SCHOOL N=411
Center for Opinion Research 20 Franklin & Marshall College
62. I know how to prepare for careers in which I may be interested.
Mean Score Spring 2012 5.47 Spring 2011 5.31 Spring 2010 5.10 Spring 2009 5.20
Fall 2008 5.48 Spring 2008 5.43
Fall 2007 5.32 Spring 2007 5.38
Fall 2006 5.42 63. I know what employers expect of workers.
Mean Score Spring 2012 5.45 Spring 2011 5.29 Spring 2010 5.14 Spring 2009 5.21
Fall 2008 5.54 Spring 2008 5.37
Fall 2007 5.36 Spring 2007 5.40
Fall 2006 5.20 64. I know how academic skills such as math, reading, and science relate to my career goals.
Mean Score Spring 2012 5.57 Spring 2011 5.43 Spring 2010 5.29 Spring 2009 5.44
Fall 2008 5.70 Spring 2008 5.44
Fall 2007 5.48 Spring 2007 5.46
Fall 2006 5.41

School District of Lancaster, 2011-2012 Student Survey May 21-25, 2012 Marginal Frequency Report – REYNOLDS MIDDLE SCHOOL N=411
Center for Opinion Research 21 Franklin & Marshall College
65. I know how to look for a part-time summer job.
Mean Score Spring 2012 5.02 Spring 2011 4.77 Spring 2010 4.88 Spring 2009 5.06
Fall 2008 5.25 Spring 2008 5.22
Fall 2007 5.08 Spring 2007 5.15
Fall 2006 5.03 66. I know what jobs are available locally.
Mean Score Spring 2012 4.74 Spring 2011 4.46 Spring 2010 4.48 Spring 2009 4.73
Fall 2008 4.91 Spring 2008 4.99
Fall 2007 4.81 Spring 2007 4.82
Fall 2006 4.59 67. I understand the challenges students have in high school.
Mean Score Spring 2012 5.49 Spring 2011 5.29 Spring 2010 5.04 Spring 2009 5.27
Fall 2008 5.47 Spring 2008 5.40
Fall 2007 5.29 Spring 2007 5.21
Fall 2006 5.27
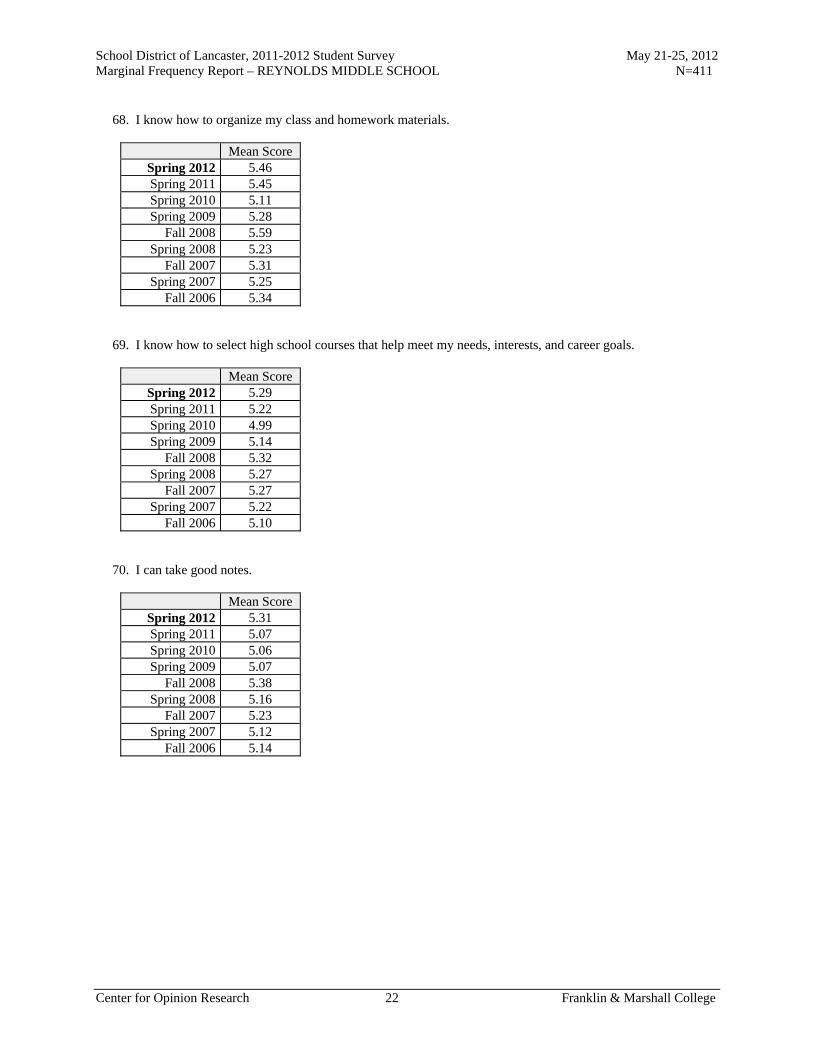
School District of Lancaster, 2011-2012 Student Survey May 21-25, 2012 Marginal Frequency Report – REYNOLDS MIDDLE SCHOOL N=411
Center for Opinion Research 22 Franklin & Marshall College
68. I know how to organize my class and homework materials.
Mean Score Spring 2012 5.46 Spring 2011 5.45 Spring 2010 5.11 Spring 2009 5.28
Fall 2008 5.59 Spring 2008 5.23
Fall 2007 5.31 Spring 2007 5.25
Fall 2006 5.34 69. I know how to select high school courses that help meet my needs, interests, and career goals.
Mean Score Spring 2012 5.29 Spring 2011 5.22 Spring 2010 4.99 Spring 2009 5.14
Fall 2008 5.32 Spring 2008 5.27
Fall 2007 5.27 Spring 2007 5.22
Fall 2006 5.10 70. I can take good notes.
Mean Score Spring 2012 5.31 Spring 2011 5.07 Spring 2010 5.06 Spring 2009 5.07
Fall 2008 5.38 Spring 2008 5.16
Fall 2007 5.23 Spring 2007 5.12
Fall 2006 5.14

School District of Lancaster, 2011-2012 Student Survey May 21-25, 2012 Marginal Frequency Report – REYNOLDS MIDDLE SCHOOL N=411
Center for Opinion Research 23 Franklin & Marshall College
71. I understand how completing high school will better prepare me to continue my education (vocational technical education, military, and college.)
Mean Score Spring 2012 5.75 Spring 2011 5.61 Spring 2010 5.45 Spring 2009 5.62
Fall 2008 5.75 Spring 2008 5.49
Fall 2007 5.63 Spring 2007 5.56
Fall 2006 5.57 72. I understand high school credits and graduation requirements.
Mean Score Spring 2012 5.47 Spring 2011 5.29 Spring 2010 5.06 Spring 2009 5.21
Fall 2008 5.35 Spring 2008 5.36
Fall 2007 5.34 Spring 2007 5.14
Fall 2006 5.26 73. I know how to do well on tests.
Mean Score Spring 2012 5.59 Spring 2011 5.36 Spring 2010 5.23 Spring 2009 5.34
Fall 2008 5.62 Spring 2008 5.42
Fall 2007 5.24 Spring 2007 5.27
Fall 2006 5.22
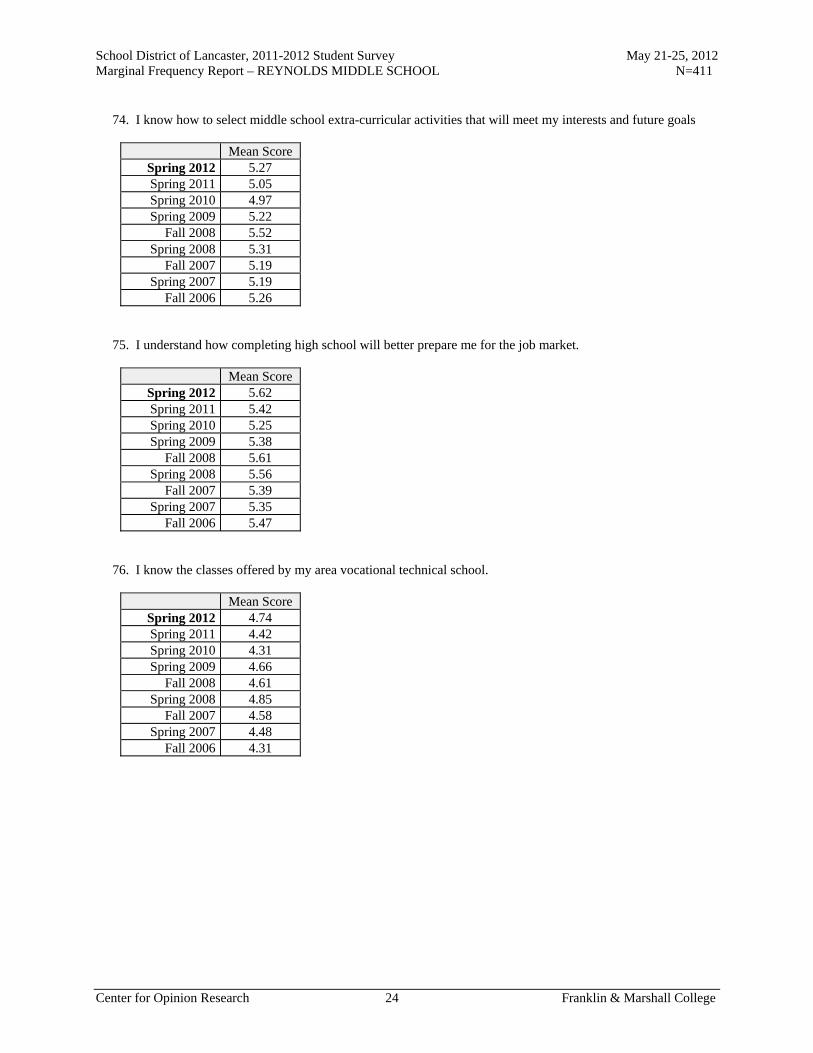
School District of Lancaster, 2011-2012 Student Survey May 21-25, 2012 Marginal Frequency Report – REYNOLDS MIDDLE SCHOOL N=411
Center for Opinion Research 24 Franklin & Marshall College
74. I know how to select middle school extra-curricular activities that will meet my interests and future goals
Mean Score Spring 2012 5.27 Spring 2011 5.05 Spring 2010 4.97 Spring 2009 5.22
Fall 2008 5.52 Spring 2008 5.31
Fall 2007 5.19 Spring 2007 5.19
Fall 2006 5.26 75. I understand how completing high school will better prepare me for the job market.
Mean Score Spring 2012 5.62 Spring 2011 5.42 Spring 2010 5.25 Spring 2009 5.38
Fall 2008 5.61 Spring 2008 5.56
Fall 2007 5.39 Spring 2007 5.35
Fall 2006 5.47 76. I know the classes offered by my area vocational technical school.
Mean Score Spring 2012 4.74 Spring 2011 4.42 Spring 2010 4.31 Spring 2009 4.66
Fall 2008 4.61 Spring 2008 4.85
Fall 2007 4.58 Spring 2007 4.48
Fall 2006 4.31
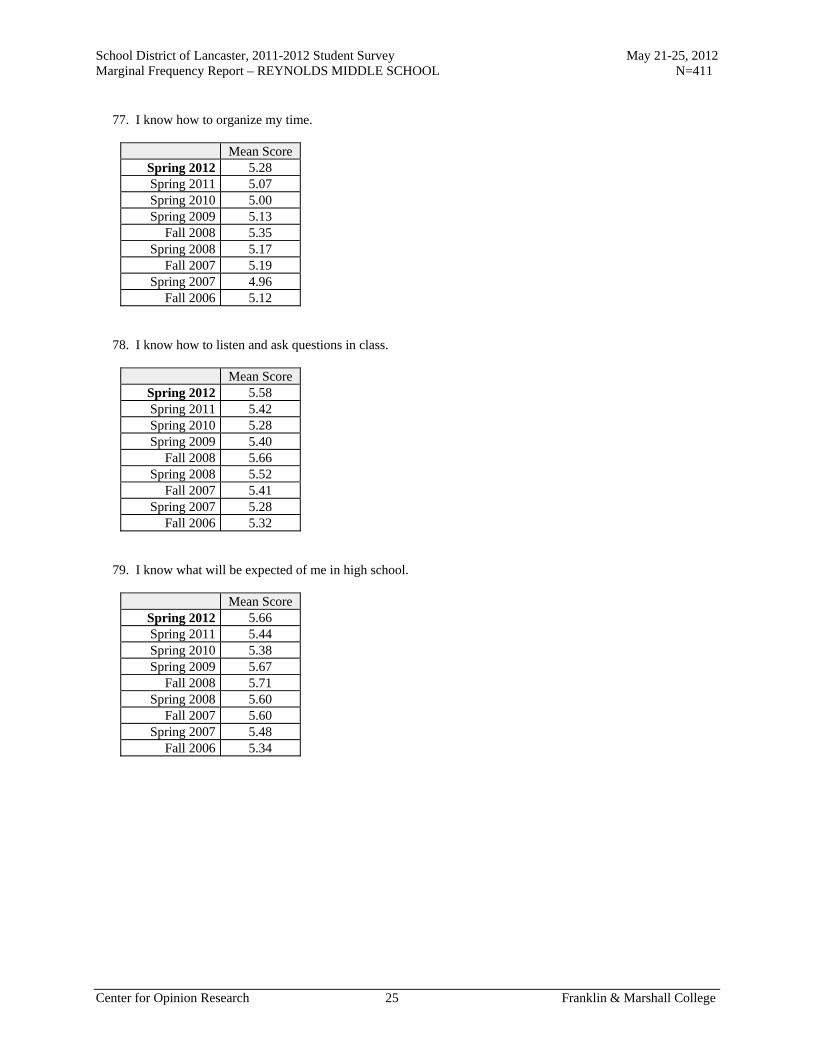
School District of Lancaster, 2011-2012 Student Survey May 21-25, 2012 Marginal Frequency Report – REYNOLDS MIDDLE SCHOOL N=411
Center for Opinion Research 25 Franklin & Marshall College
77. I know how to organize my time.
Mean Score Spring 2012 5.28 Spring 2011 5.07 Spring 2010 5.00 Spring 2009 5.13
Fall 2008 5.35 Spring 2008 5.17
Fall 2007 5.19 Spring 2007 4.96
Fall 2006 5.12 78. I know how to listen and ask questions in class.
Mean Score Spring 2012 5.58 Spring 2011 5.42 Spring 2010 5.28 Spring 2009 5.40
Fall 2008 5.66 Spring 2008 5.52
Fall 2007 5.41 Spring 2007 5.28
Fall 2006 5.32 79. I know what will be expected of me in high school.
Mean Score Spring 2012 5.66 Spring 2011 5.44 Spring 2010 5.38 Spring 2009 5.67
Fall 2008 5.71 Spring 2008 5.60
Fall 2007 5.60 Spring 2007 5.48
Fall 2006 5.34
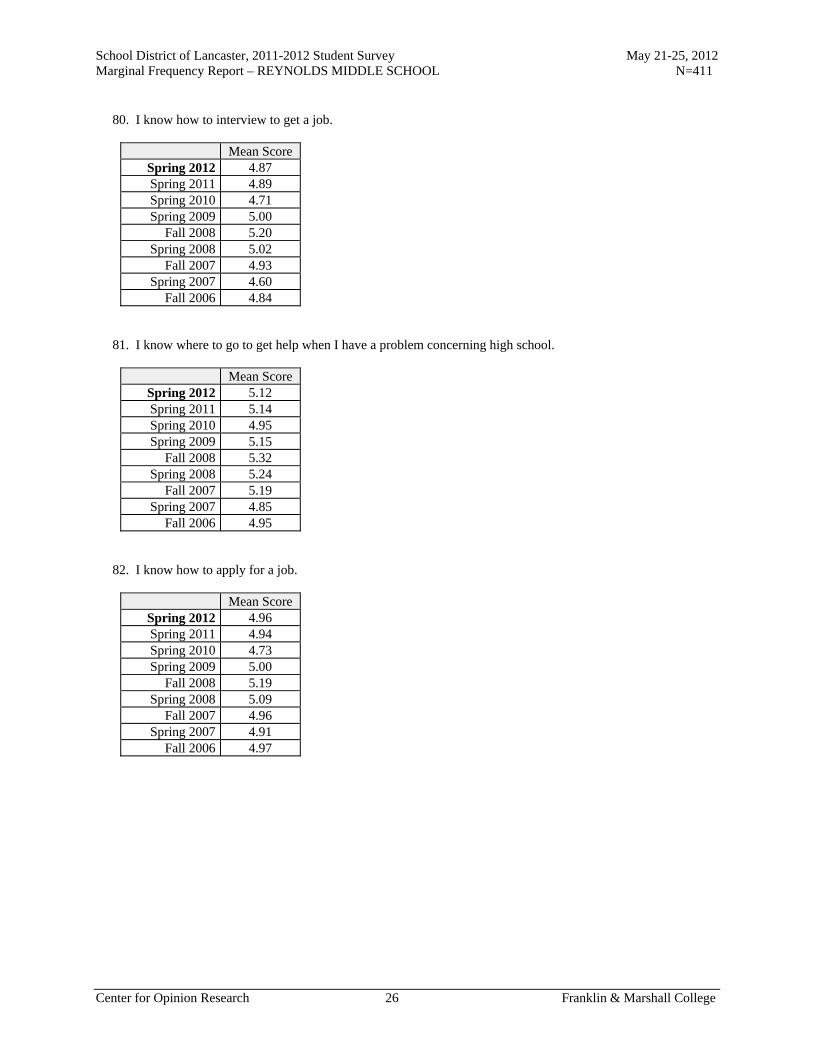
School District of Lancaster, 2011-2012 Student Survey May 21-25, 2012 Marginal Frequency Report – REYNOLDS MIDDLE SCHOOL N=411
Center for Opinion Research 26 Franklin & Marshall College
80. I know how to interview to get a job.
Mean Score Spring 2012 4.87 Spring 2011 4.89 Spring 2010 4.71 Spring 2009 5.00
Fall 2008 5.20 Spring 2008 5.02
Fall 2007 4.93 Spring 2007 4.60
Fall 2006 4.84 81. I know where to go to get help when I have a problem concerning high school.
Mean Score Spring 2012 5.12 Spring 2011 5.14 Spring 2010 4.95 Spring 2009 5.15
Fall 2008 5.32 Spring 2008 5.24
Fall 2007 5.19 Spring 2007 4.85
Fall 2006 4.95 82. I know how to apply for a job.
Mean Score Spring 2012 4.96 Spring 2011 4.94 Spring 2010 4.73 Spring 2009 5.00
Fall 2008 5.19 Spring 2008 5.09
Fall 2007 4.96 Spring 2007 4.91
Fall 2006 4.97
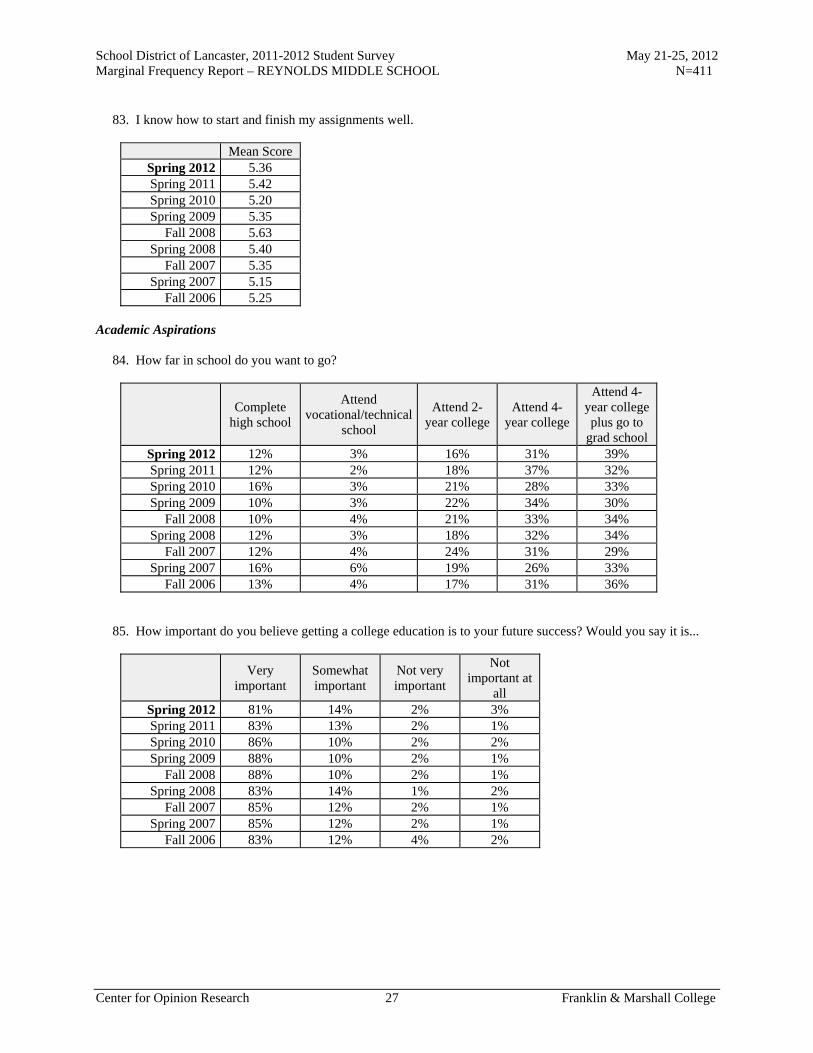
School District of Lancaster, 2011-2012 Student Survey May 21-25, 2012 Marginal Frequency Report – REYNOLDS MIDDLE SCHOOL N=411
Center for Opinion Research 27 Franklin & Marshall College
83. I know how to start and finish my assignments well.
Mean Score Spring 2012 5.36 Spring 2011 5.42 Spring 2010 5.20 Spring 2009 5.35
Fall 2008 5.63 Spring 2008 5.40
Fall 2007 5.35 Spring 2007 5.15
Fall 2006 5.25 Academic Aspirations 84. How far in school do you want to go?
Complete
high school
Attend vocational/technical
school
Attend 2-year college
Attend 4-year college
Attend 4-year college plus go to
grad school Spring 2012 12% 3% 16% 31% 39% Spring 2011 12% 2% 18% 37% 32% Spring 2010 16% 3% 21% 28% 33% Spring 2009 10% 3% 22% 34% 30%
Fall 2008 10% 4% 21% 33% 34% Spring 2008 12% 3% 18% 32% 34%
Fall 2007 12% 4% 24% 31% 29% Spring 2007 16% 6% 19% 26% 33%
Fall 2006 13% 4% 17% 31% 36% 85. How important do you believe getting a college education is to your future success? Would you say it is...
Very
important Somewhat important
Not very important
Not important at
all Spring 2012 81% 14% 2% 3% Spring 2011 83% 13% 2% 1% Spring 2010 86% 10% 2% 2% Spring 2009 88% 10% 2% 1%
Fall 2008 88% 10% 2% 1% Spring 2008 83% 14% 1% 2%
Fall 2007 85% 12% 2% 1% Spring 2007 85% 12% 2% 1%
Fall 2006 83% 12% 4% 2%

School District of Lancaster, 2011-2012 Student Survey May 21-25, 2012 Marginal Frequency Report – REYNOLDS MIDDLE SCHOOL N=411
Center for Opinion Research 28 Franklin & Marshall College
86. How important would your parent/guardian say getting a college education is to your future success? Would your parents say it is...
Very
important Somewhat important
Not very important
Not important at
all Spring 2012 84% 11% 4% 2% Spring 2011 85% 11% 2% 2% Spring 2010 88% 8% 2% 1% Spring 2009 89% 9% 1% 2%
Fall 2008 92% 6% 1% 2% Spring 2008 90% 6% 2% 2%
Fall 2007 90% 8% 1% 2% Spring 2007 88% 8% 2% 2%
Fall 2006 88% 7% 3% 2% 87. How important would your teachers say getting a college education is to your future success? Would your teachers say it is...
Very
important Somewhat important
Not very important
Not important at
all Spring 2012 83% 13% 2% 1% Spring 2011 86% 10% 2% 2% Spring 2010 84% 13% 2% 2% Spring 2009 86% 9% 2% 2%
Fall 2008 92% 6% 1% 1% Spring 2008 88% 10% 1% 2%
Fall 2007 88% 10% 1% 2% Spring 2007 90% 7% 1% 1%
Fall 2006 87% 10% 2% 1% 88. How far in school do you think you will get?
Won't finish high school
Will finish high school
Will get a GED
Will complete a
2-year Associate's
Degree
Will complete a
4-year Bachelor's
Degree
Will complete a Master's or Doctoral Degree
Spring 2012 3% 12% 6% 15% 29% 35% Spring 2011 3% 18% 8% 11% 31% 29% Spring 2010 5% 18% 9% 17% 26% 25% Spring 2009 4% 12% 8% 19% 28% 29%
Fall 2008 2% 15% 11% 16% 26% 31% Spring 2008 4% 13% 8% 14% 28% 32%
Fall 2007 1% 20% 8% 16% 27% 28% Spring 2007 3% 16% 9% 16% 29% 27%
Fall 2006 3% 18% 7% 16% 26% 31%
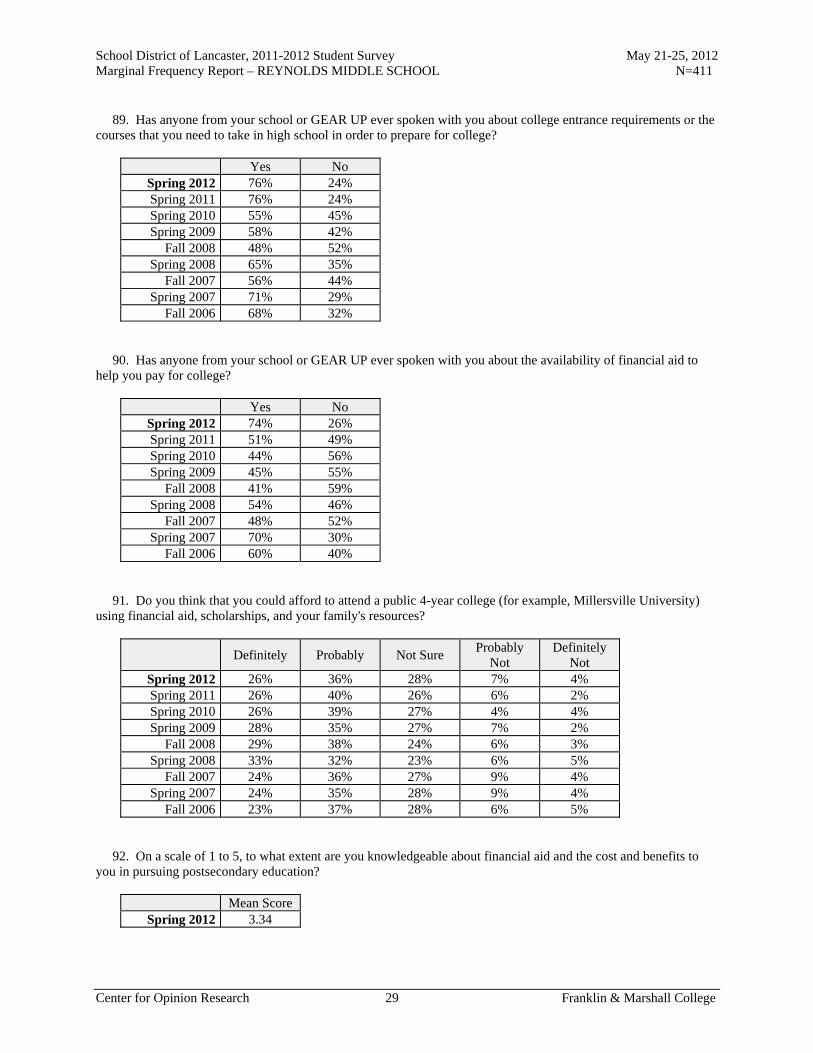
School District of Lancaster, 2011-2012 Student Survey May 21-25, 2012 Marginal Frequency Report – REYNOLDS MIDDLE SCHOOL N=411
Center for Opinion Research 29 Franklin & Marshall College
89. Has anyone from your school or GEAR UP ever spoken with you about college entrance requirements or the courses that you need to take in high school in order to prepare for college?
Yes No Spring 2012 76% 24% Spring 2011 76% 24% Spring 2010 55% 45% Spring 2009 58% 42%
Fall 2008 48% 52% Spring 2008 65% 35%
Fall 2007 56% 44% Spring 2007 71% 29%
Fall 2006 68% 32% 90. Has anyone from your school or GEAR UP ever spoken with you about the availability of financial aid to help you pay for college?
Yes No Spring 2012 74% 26% Spring 2011 51% 49% Spring 2010 44% 56% Spring 2009 45% 55%
Fall 2008 41% 59% Spring 2008 54% 46%
Fall 2007 48% 52% Spring 2007 70% 30%
Fall 2006 60% 40% 91. Do you think that you could afford to attend a public 4-year college (for example, Millersville University) using financial aid, scholarships, and your family's resources?
Definitely Probably Not Sure Probably
Not Definitely
Not Spring 2012 26% 36% 28% 7% 4% Spring 2011 26% 40% 26% 6% 2% Spring 2010 26% 39% 27% 4% 4% Spring 2009 28% 35% 27% 7% 2%
Fall 2008 29% 38% 24% 6% 3% Spring 2008 33% 32% 23% 6% 5%
Fall 2007 24% 36% 27% 9% 4% Spring 2007 24% 35% 28% 9% 4%
Fall 2006 23% 37% 28% 6% 5% 92. On a scale of 1 to 5, to what extent are you knowledgeable about financial aid and the cost and benefits to you in pursuing postsecondary education?
Mean Score Spring 2012 3.34

School District of Lancaster, 2011-2012 Student Survey May 21-25, 2012 Marginal Frequency Report – REYNOLDS MIDDLE SCHOOL N=411
Center for Opinion Research 30 Franklin & Marshall College
Social & Emotional Development Do you agree or disagree with the following statements? Please give your answers based on how things have been for you over the last six months. 93. I try to be nice to other people. I care about their feelings.
Really Agree
Kind of Agree
Kind of Disagree
Really Disagree
Spring 2012 44% 38% 13% 4% Spring 2011 39% 44% 13% 4% Spring 2010 38% 43% 13% 7% Spring 2009 32% 50% 11% 7%
Fall 2008 47% 37% 11% 5% Spring 2008 43% 39% 12% 6%
Fall 2007 42% 40% 12% 6% Spring 2007 40% 42% 10% 8%
Fall 2006 48% 38% 10% 5% 94. I am restless. I cannot stay still for too long.
Really Agree
Kind of Agree
Kind of Disagree
Really Disagree
Spring 2012 34% 32% 19% 14% Spring 2011 28% 33% 23% 17% Spring 2010 28% 29% 23% 19% Spring 2009 24% 36% 23% 17%
Fall 2008 33% 32% 19% 15% Spring 2008 28% 34% 21% 17%
Fall 2007 29% 36% 18% 18% Spring 2007 32% 32% 18% 17%
Fall 2006 34% 28% 22% 16% 95. I get a lot of headaches, stomach-aches or sickness.
Really Agree
Kind of Agree
Kind of Disagree
Really Disagree
Spring 2012 15% 24% 31% 30% Spring 2011 16% 25% 29% 29% Spring 2010 13% 24% 32% 30% Spring 2009 14% 23% 37% 26%
Fall 2008 15% 26% 30% 30% Spring 2008 18% 24% 29% 29%
Fall 2007 14% 24% 29% 33% Spring 2007 18% 22% 30% 31%
Fall 2006 18% 24% 22% 36%

School District of Lancaster, 2011-2012 Student Survey May 21-25, 2012 Marginal Frequency Report – REYNOLDS MIDDLE SCHOOL N=411
Center for Opinion Research 31 Franklin & Marshall College
96. I usually share with others, for example CD's, games, food.
Really Agree
Kind of Agree
Kind of Disagree
Really Disagree
Spring 2012 33% 36% 16% 14% Spring 2011 28% 44% 17% 11% Spring 2010 29% 40% 17% 14% Spring 2009 27% 41% 18% 14%
Fall 2008 37% 38% 15% 10% Spring 2008 39% 37% 16% 8%
Fall 2007 38% 40% 12% 10% Spring 2007 36% 39% 16% 9%
Fall 2006 41% 35% 16% 7% 97. I get very angry and often lose my temper.
Really Agree
Kind of Agree
Kind of Disagree
Really Disagree
Spring 2012 27% 29% 26% 17% Spring 2011 23% 29% 26% 21% Spring 2010 29% 26% 27% 18% Spring 2009 27% 28% 28% 18%
Fall 2008 26% 28% 24% 22% Spring 2008 25% 33% 22% 20%
Fall 2007 31% 28% 21% 20% Spring 2007 35% 31% 18% 16%
Fall 2006 34% 25% 23% 19% 98. I would rather be alone than with people of my age.
Really Agree
Kind of Agree
Kind of Disagree
Really Disagree
Spring 2012 14% 21% 27% 37% Spring 2011 12% 22% 29% 37% Spring 2010 18% 20% 28% 34% Spring 2009 13% 26% 30% 31%
Fall 2008 16% 19% 28% 37% Spring 2008 14% 27% 26% 33%
Fall 2007 15% 20% 24% 40% Spring 2007 14% 24% 22% 41%
Fall 2006 20% 18% 28% 34%

School District of Lancaster, 2011-2012 Student Survey May 21-25, 2012 Marginal Frequency Report – REYNOLDS MIDDLE SCHOOL N=411
Center for Opinion Research 32 Franklin & Marshall College
99. I usually do as I am told.
Really Agree
Kind of Agree
Kind of Disagree
Really Disagree
Spring 2012 27% 40% 26% 7% Spring 2011 30% 44% 20% 6% Spring 2010 28% 40% 22% 9% Spring 2009 25% 45% 22% 8%
Fall 2008 33% 42% 16% 8% Spring 2008 31% 42% 18% 8%
Fall 2007 37% 42% 16% 6% Spring 2007 28% 40% 22% 9%
Fall 2006 38% 39% 16% 8% 100. I worry a lot.
Really Agree
Kind of Agree
Kind of Disagree
Really Disagree
Spring 2012 25% 30% 27% 18% Spring 2011 16% 25% 30% 29% Spring 2010 20% 24% 32% 25% Spring 2009 17% 30% 29% 24%
Fall 2008 20% 27% 32% 22% Spring 2008 24% 32% 26% 18%
Fall 2007 21% 26% 30% 23% Spring 2007 20% 30% 30% 21%
Fall 2006 24% 30% 23% 23% 101. I am helpful if someone is hurt, upset, or feeling ill.
Really Agree
Kind of Agree
Kind of Disagree
Really Disagree
Spring 2012 43% 40% 11% 5% Spring 2011 37% 43% 16% 4% Spring 2010 33% 44% 16% 7% Spring 2009 34% 42% 15% 9%
Fall 2008 46% 37% 12% 5% Spring 2008 36% 43% 13% 7%
Fall 2007 44% 36% 14% 6% Spring 2007 39% 41% 14% 6%
Fall 2006 46% 38% 11% 4%

School District of Lancaster, 2011-2012 Student Survey May 21-25, 2012 Marginal Frequency Report – REYNOLDS MIDDLE SCHOOL N=411
Center for Opinion Research 33 Franklin & Marshall College
102. I am constantly moving or squirming.
Really Agree
Kind of Agree
Kind of Disagree
Really Disagree
Spring 2012 25% 34% 22% 19% Spring 2011 21% 27% 32% 20% Spring 2010 20% 27% 31% 22% Spring 2009 19% 30% 34% 17%
Fall 2008 20% 28% 29% 22% Spring 2008 22% 32% 27% 19%
Fall 2007 22% 31% 27% 21% Spring 2007 21% 31% 25% 22%
Fall 2006 26% 25% 28% 21% 103. I have one good friend or more.
Really Agree
Kind of Agree
Kind of Disagree
Really Disagree
Spring 2012 72% 17% 7% 5% Spring 2011 74% 19% 4% 3% Spring 2010 66% 22% 8% 4% Spring 2009 66% 24% 7% 4%
Fall 2008 74% 18% 4% 4% Spring 2008 66% 23% 7% 4%
Fall 2007 69% 21% 4% 6% Spring 2007 70% 21% 4% 5%
Fall 2006 73% 18% 4% 4% 104. I fight a lot. I can make other people do what I want.
Really Agree
Kind of Agree
Kind of Disagree
Really Disagree
Spring 2012 9% 16% 32% 43% Spring 2011 7% 13% 32% 48% Spring 2010 9% 15% 34% 42% Spring 2009 11% 17% 32% 41%
Fall 2008 10% 19% 29% 43% Spring 2008 9% 22% 30% 39%
Fall 2007 8% 17% 30% 46% Spring 2007 10% 22% 31% 37%
Fall 2006 14% 16% 27% 44%

School District of Lancaster, 2011-2012 Student Survey May 21-25, 2012 Marginal Frequency Report – REYNOLDS MIDDLE SCHOOL N=411
Center for Opinion Research 34 Franklin & Marshall College
105. I am often unhappy, depressed, or tearful.
Really Agree
Kind of Agree
Kind of Disagree
Really Disagree
Spring 2012 11% 20% 27% 42% Spring 2011 12% 16% 30% 42% Spring 2010 13% 20% 30% 36% Spring 2009 15% 25% 28% 32%
Fall 2008 15% 19% 25% 42% Spring 2008 14% 27% 22% 37%
Fall 2007 14% 17% 28% 41% Spring 2007 14% 25% 27% 34%
Fall 2006 19% 21% 23% 37% 106. Other people my age generally like me.
Really Agree
Kind of Agree
Kind of Disagree
Really Disagree
Spring 2012 37% 43% 14% 6% Spring 2011 36% 41% 18% 5% Spring 2010 34% 40% 18% 8% Spring 2009 34% 43% 13% 10%
Fall 2008 44% 42% 9% 5% Spring 2008 41% 37% 16% 6%
Fall 2007 39% 44% 11% 6% Spring 2007 35% 44% 15% 7%
Fall 2006 39% 44% 10% 7% 107. I easily lose my focus. I find it difficult to concentrate.
Really Agree
Kind of Agree
Kind of Disagree
Really Disagree
Spring 2012 24% 32% 26% 18% Spring 2011 20% 26% 31% 23% Spring 2010 25% 26% 29% 20% Spring 2009 27% 35% 23% 15%
Fall 2008 24% 28% 23% 24% Spring 2008 24% 34% 23% 19%
Fall 2007 29% 30% 20% 21% Spring 2007 26% 32% 22% 20%
Fall 2006 31% 30% 21% 18%

School District of Lancaster, 2011-2012 Student Survey May 21-25, 2012 Marginal Frequency Report – REYNOLDS MIDDLE SCHOOL N=411
Center for Opinion Research 35 Franklin & Marshall College
108. I am nervous in new situations. I easily lose confidence.
Really Agree
Kind of Agree
Kind of Disagree
Really Disagree
Spring 2012 19% 32% 27% 21% Spring 2011 14% 26% 36% 25% Spring 2010 18% 22% 32% 28% Spring 2009 16% 32% 32% 20%
Fall 2008 19% 28% 26% 27% Spring 2008 21% 31% 27% 21%
Fall 2007 24% 27% 25% 24% Spring 2007 21% 28% 28% 22%
Fall 2006 25% 30% 22% 22% 109. I am kind to younger children.
Really Agree
Kind of Agree
Kind of Disagree
Really Disagree
Spring 2012 50% 32% 12% 5% Spring 2011 50% 33% 11% 6% Spring 2010 58% 30% 7% 5% Spring 2009 53% 35% 7% 4%
Fall 2008 68% 24% 4% 4% Spring 2008 51% 29% 12% 7%
Fall 2007 52% 32% 9% 7% Spring 2007 50% 30% 11% 8%
Fall 2006 57% 27% 11% 5% 110. I am often accused of lying or cheating.
Really Agree
Kind of Agree
Kind of Disagree
Really Disagree
Spring 2012 13% 23% 27% 38% Spring 2011 14% 16% 25% 46% Spring 2010 17% 21% 25% 37% Spring 2009 16% 27% 28% 30%
Fall 2008 15% 22% 23% 40% Spring 2008 16% 25% 24% 35%
Fall 2007 16% 20% 24% 40% Spring 2007 15% 25% 24% 36%
Fall 2006 20% 23% 22% 36%

School District of Lancaster, 2011-2012 Student Survey May 21-25, 2012 Marginal Frequency Report – REYNOLDS MIDDLE SCHOOL N=411
Center for Opinion Research 36 Franklin & Marshall College
111. Other children or young people pick on me or bully me.
Really Agree
Kind of Agree
Kind of Disagree
Really Disagree
Spring 2012 11% 14% 23% 52% Spring 2011 10% 13% 21% 57% Spring 2010 8% 14% 20% 58% Spring 2009 10% 18% 21% 52%
Fall 2008 13% 15% 19% 53% Spring 2008 13% 20% 20% 47%
Fall 2007 12% 16% 20% 53% Spring 2007 9% 14% 22% 55%
Fall 2006 16% 16% 18% 50% 112. I often offer to help others (parents, teachers, children).
Really Agree
Kind of Agree
Kind of Disagree
Really Disagree
Spring 2012 37% 42% 17% 4% Spring 2011 37% 41% 18% 4% Spring 2010 32% 45% 13% 10% Spring 2009 33% 43% 15% 9%
Fall 2008 43% 38% 14% 5% Spring 2008 32% 46% 14% 8%
Fall 2007 39% 41% 13% 7% Spring 2007 36% 40% 16% 8%
Fall 2006 43% 38% 11% 8% 113. I think before I do things.
Really Agree
Kind of Agree
Kind of Disagree
Really Disagree
Spring 2012 27% 39% 24% 10% Spring 2011 32% 39% 22% 8% Spring 2010 29% 40% 22% 9% Spring 2009 22% 44% 23% 11%
Fall 2008 33% 38% 20% 9% Spring 2008 30% 41% 22% 8%
Fall 2007 27% 41% 24% 9% Spring 2007 23% 44% 24% 9%
Fall 2006 33% 40% 16% 11%

School District of Lancaster, 2011-2012 Student Survey May 21-25, 2012 Marginal Frequency Report – REYNOLDS MIDDLE SCHOOL N=411
Center for Opinion Research 37 Franklin & Marshall College
114. I take things that are not mine from home, school, or elsewhere.
Really Agree
Kind of Agree
Kind of Disagree
Really Disagree
Spring 2012 6% 16% 20% 59% Spring 2011 7% 9% 20% 65% Spring 2010 8% 13% 21% 59% Spring 2009 10% 12% 24% 55%
Fall 2008 8% 12% 18% 63% Spring 2008 7% 17% 24% 52%
Fall 2007 8% 14% 18% 60% Spring 2007 7% 13% 22% 58%
Fall 2006 10% 15% 20% 54% 115. I get along better with adults than with people my own age.
Really Agree
Kind of Agree
Kind of Disagree
Really Disagree
Spring 2012 15% 23% 37% 25% Spring 2011 15% 23% 39% 23% Spring 2010 15% 25% 29% 30% Spring 2009 15% 27% 34% 24%
Fall 2008 20% 24% 33% 23% Spring 2008 18% 26% 31% 25%
Fall 2007 16% 24% 30% 30% Spring 2007 14% 25% 29% 32%
Fall 2006 20% 25% 32% 23% 116. I have many fears. I am easily scared.
Really Agree
Kind of Agree
Kind of Disagree
Really Disagree
Spring 2012 9% 22% 31% 38% Spring 2011 8% 14% 30% 47% Spring 2010 9% 16% 28% 47% Spring 2009 11% 17% 30% 42%
Fall 2008 13% 18% 25% 45% Spring 2008 16% 16% 33% 36%
Fall 2007 12% 18% 24% 46% Spring 2007 10% 18% 30% 42%
Fall 2006 16% 19% 28% 36%

School District of Lancaster, 2011-2012 Student Survey May 21-25, 2012 Marginal Frequency Report – REYNOLDS MIDDLE SCHOOL N=411
Center for Opinion Research 38 Franklin & Marshall College
117. I finish the work I'm doing. My attention is good.
Really Agree
Kind of Agree
Kind of Disagree
Really Disagree
Spring 2012 28% 40% 23% 8% Spring 2011 33% 41% 20% 6% Spring 2010 29% 41% 22% 9% Spring 2009 24% 42% 22% 12%
Fall 2008 38% 35% 21% 6% Spring 2008 25% 44% 21% 10%
Fall 2007 32% 40% 20% 9% Spring 2007 26% 40% 24% 10%
Fall 2006 37% 33% 22% 8% Perceptions of Police Do you agree or disagree with the following statements about police officers? 118. I respect police officers.
Really Agree
Kind of Agree
Kind of Disagree
Really Disagree
Spring 2012 58% 27% 9% 6% Spring 2011 61% 23% 10% 6% Spring 2010 56% 26% 10% 8% Spring 2009 53% 25% 10% 12%
Fall 2008 63% 21% 9% 7% Spring 2008 39% 35% 14% 12%
Fall 2007 55% 24% 12% 9% Spring 2007 41% 27% 18% 14%
Fall 2006 51% 20% 18% 12% 119. I am comfortable approaching police officers.
Really Agree
Kind of Agree
Kind of Disagree
Really Disagree
Spring 2012 41% 31% 20% 8% Spring 2011 42% 35% 12% 11% Spring 2010 38% 32% 19% 12% Spring 2009 42% 28% 18% 12%
Fall 2008 48% 29% 15% 9% Spring 2008 33% 34% 22% 12%
Fall 2007 40% 30% 19% 11% Spring 2007 33% 28% 22% 17%
Fall 2006 38% 31% 21% 10%

School District of Lancaster, 2011-2012 Student Survey May 21-25, 2012 Marginal Frequency Report – REYNOLDS MIDDLE SCHOOL N=411
Center for Opinion Research 39 Franklin & Marshall College
120. I would consider police work as a career.
Really Agree
Kind of Agree
Kind of Disagree
Really Disagree
Spring 2012 26% 24% 20% 30% Spring 2011 25% 20% 19% 37% Spring 2010 22% 20% 20% 39% Spring 2009 20% 22% 20% 38%
Fall 2008 28% 21% 18% 33% Spring 2008 23% 25% 19% 33%
Fall 2007 21% 24% 18% 37% Spring 2007 19% 19% 18% 44%
Fall 2006 27% 21% 16% 36% 121. In general, I do not trust the police.
Really Agree
Kind of Agree
Kind of Disagree
Really Disagree
Spring 2012 17% 21% 25% 36% Spring 2011 16% 17% 24% 43% Spring 2010 14% 19% 22% 45% Spring 2009 20% 22% 24% 34%
Fall 2008 18% 20% 21% 41% Spring 2008 17% 26% 25% 32%
Fall 2007 14% 18% 28% 39% Spring 2007 17% 22% 28% 32%
Fall 2006 20% 21% 21% 38% 122. Police do not belong in schools unless there has been a crime.
Really Agree
Kind of Agree
Kind of Disagree
Really Disagree
Spring 2012 21% 21% 25% 33% Spring 2011 18% 16% 32% 34% Spring 2010 23% 17% 30% 31% Spring 2009 24% 19% 28% 29%
Fall 2008 20% 18% 24% 37% Spring 2008 19% 25% 26% 30%
Fall 2007 20% 26% 23% 32% Spring 2007 20% 22% 24% 33%
Fall 2006 33% 24% 17% 25%
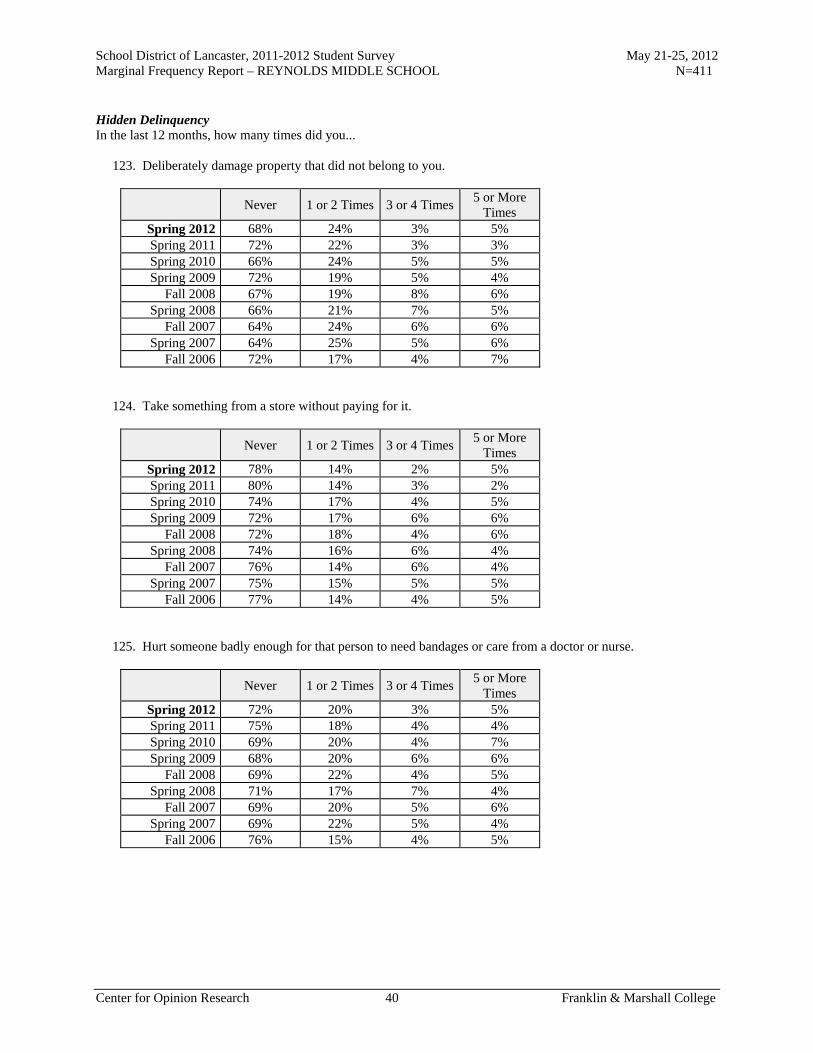
School District of Lancaster, 2011-2012 Student Survey May 21-25, 2012 Marginal Frequency Report – REYNOLDS MIDDLE SCHOOL N=411
Center for Opinion Research 40 Franklin & Marshall College
Hidden Delinquency In the last 12 months, how many times did you... 123. Deliberately damage property that did not belong to you.
Never 1 or 2 Times 3 or 4 Times5 or More
Times Spring 2012 68% 24% 3% 5% Spring 2011 72% 22% 3% 3% Spring 2010 66% 24% 5% 5% Spring 2009 72% 19% 5% 4%
Fall 2008 67% 19% 8% 6% Spring 2008 66% 21% 7% 5%
Fall 2007 64% 24% 6% 6% Spring 2007 64% 25% 5% 6%
Fall 2006 72% 17% 4% 7% 124. Take something from a store without paying for it.
Never 1 or 2 Times 3 or 4 Times5 or More
Times Spring 2012 78% 14% 2% 5% Spring 2011 80% 14% 3% 2% Spring 2010 74% 17% 4% 5% Spring 2009 72% 17% 6% 6%
Fall 2008 72% 18% 4% 6% Spring 2008 74% 16% 6% 4%
Fall 2007 76% 14% 6% 4% Spring 2007 75% 15% 5% 5%
Fall 2006 77% 14% 4% 5% 125. Hurt someone badly enough for that person to need bandages or care from a doctor or nurse.
Never 1 or 2 Times 3 or 4 Times5 or More
Times Spring 2012 72% 20% 3% 5% Spring 2011 75% 18% 4% 4% Spring 2010 69% 20% 4% 7% Spring 2009 68% 20% 6% 6%
Fall 2008 69% 22% 4% 5% Spring 2008 71% 17% 7% 4%
Fall 2007 69% 20% 5% 6% Spring 2007 69% 22% 5% 4%
Fall 2006 76% 15% 4% 5%

School District of Lancaster, 2011-2012 Student Survey May 21-25, 2012 Marginal Frequency Report – REYNOLDS MIDDLE SCHOOL N=411
Center for Opinion Research 41 Franklin & Marshall College
126. Drive a car without its owner's permission.
Never 1 or 2 Times 3 or 4 Times5 or More
Times Spring 2012 92% 3% 1% 3% Spring 2011 92% 4% 2% 2% Spring 2010 87% 6% 3% 4% Spring 2009 88% 6% 2% 4%
Fall 2008 89% 6% 2% 3% Spring 2008 85% 8% 3% 4%
Fall 2007 89% 5% 3% 3% Spring 2007 90% 5% 2% 3%
Fall 2006 87% 8% 3% 3% 127. Steal something worth more than $50.
Never 1 or 2 Times 3 or 4 Times5 or More
Times Spring 2012 89% 6% 2% 3% Spring 2011 90% 7% 1% 2% Spring 2010 86% 8% 2% 4% Spring 2009 89% 7% 1% 3%
Fall 2008 88% 6% 2% 4% Spring 2008 86% 9% 3% 3%
Fall 2007 89% 5% 1% 4% Spring 2007 88% 5% 3% 4%
Fall 2006 88% 5% 4% 3% 128. Go into a house or building to steal something.
Never 1 or 2 Times 3 or 4 Times5 or More
Times Spring 2012 92% 3% 2% 2% Spring 2011 90% 6% 2% 2% Spring 2010 85% 8% 2% 5% Spring 2009 89% 8% 2% 1%
Fall 2008 89% 6% 3% 3% Spring 2008 86% 8% 2% 4%
Fall 2007 89% 7% 2% 2% Spring 2007 91% 4% 2% 3%
Fall 2006 88% 4% 5% 3%

School District of Lancaster, 2011-2012 Student Survey May 21-25, 2012 Marginal Frequency Report – REYNOLDS MIDDLE SCHOOL N=411
Center for Opinion Research 42 Franklin & Marshall College
129. Use or threaten to use a weapon to get something from someone.
Never 1 or 2 Times 3 or 4 Times5 or More
Times Spring 2012 87% 8% 1% 4% Spring 2011 89% 7% 2% 2% Spring 2010 86% 8% 2% 4% Spring 2009 87% 8% 2% 3%
Fall 2008 83% 10% 2% 4% Spring 2008 83% 10% 3% 5%
Fall 2007 86% 7% 3% 3% Spring 2007 86% 8% 2% 4%
Fall 2006 86% 7% 4% 3% 130. Steal something worth less than $50.
Never 1 or 2 Times 3 or 4 Times5 or More
Times Spring 2012 79% 12% 4% 4% Spring 2011 80% 16% 1% 3% Spring 2010 73% 17% 3% 7% Spring 2009 77% 14% 5% 4%
Fall 2008 73% 16% 4% 6% Spring 2008 71% 17% 6% 6%
Fall 2007 76% 16% 4% 4% Spring 2007 78% 14% 3% 5%
Fall 2006 76% 13% 6% 6% 131. Take part in a fight where a group of your friends is against another group.
Never 1 or 2 Times 3 or 4 Times5 or More
Times Spring 2012 72% 18% 5% 5% Spring 2011 76% 17% 3% 4% Spring 2010 68% 20% 4% 8% Spring 2009 70% 18% 7% 6%
Fall 2008 74% 15% 7% 5% Spring 2008 72% 17% 6% 4%
Fall 2007 67% 20% 6% 6% Spring 2007 66% 20% 6% 9%
Fall 2006 69% 17% 7% 7%
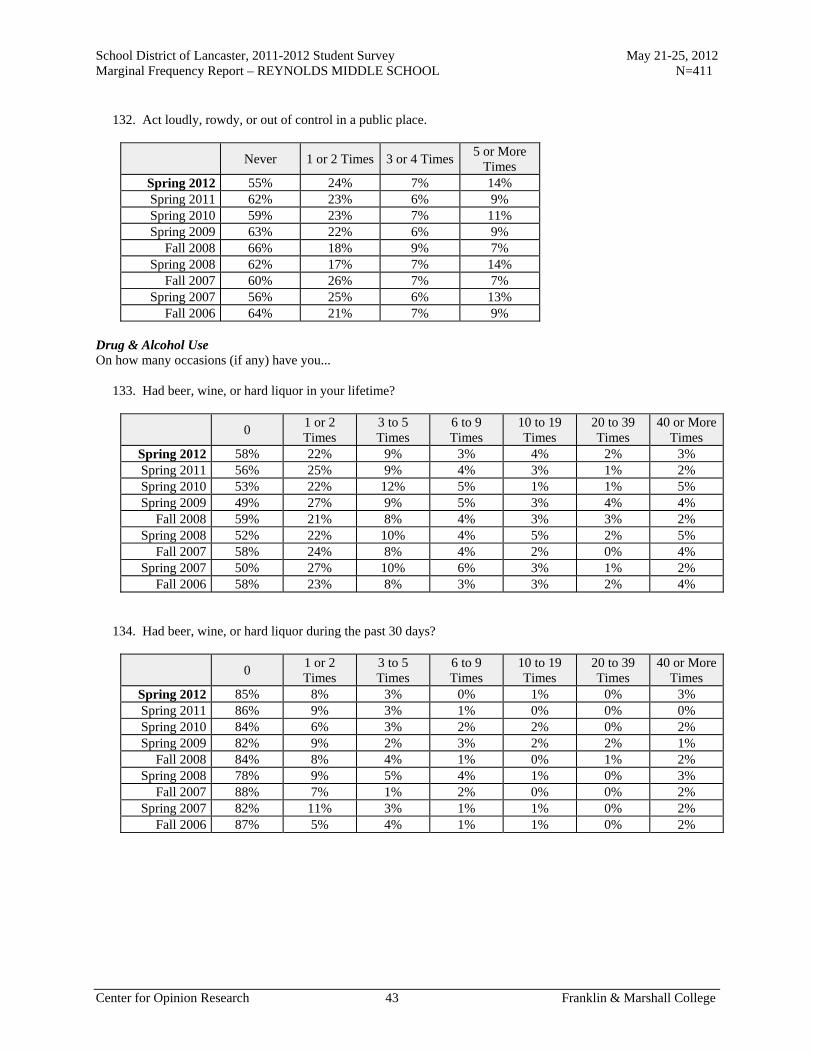
School District of Lancaster, 2011-2012 Student Survey May 21-25, 2012 Marginal Frequency Report – REYNOLDS MIDDLE SCHOOL N=411
Center for Opinion Research 43 Franklin & Marshall College
132. Act loudly, rowdy, or out of control in a public place.
Never 1 or 2 Times 3 or 4 Times5 or More
Times Spring 2012 55% 24% 7% 14% Spring 2011 62% 23% 6% 9% Spring 2010 59% 23% 7% 11% Spring 2009 63% 22% 6% 9%
Fall 2008 66% 18% 9% 7% Spring 2008 62% 17% 7% 14%
Fall 2007 60% 26% 7% 7% Spring 2007 56% 25% 6% 13%
Fall 2006 64% 21% 7% 9% Drug & Alcohol Use On how many occasions (if any) have you... 133. Had beer, wine, or hard liquor in your lifetime?
0 1 or 2 Times
3 to 5 Times
6 to 9 Times
10 to 19 Times
20 to 39 Times
40 or More Times
Spring 2012 58% 22% 9% 3% 4% 2% 3% Spring 2011 56% 25% 9% 4% 3% 1% 2% Spring 2010 53% 22% 12% 5% 1% 1% 5% Spring 2009 49% 27% 9% 5% 3% 4% 4%
Fall 2008 59% 21% 8% 4% 3% 3% 2% Spring 2008 52% 22% 10% 4% 5% 2% 5%
Fall 2007 58% 24% 8% 4% 2% 0% 4% Spring 2007 50% 27% 10% 6% 3% 1% 2%
Fall 2006 58% 23% 8% 3% 3% 2% 4% 134. Had beer, wine, or hard liquor during the past 30 days?
0 1 or 2 Times
3 to 5 Times
6 to 9 Times
10 to 19 Times
20 to 39 Times
40 or More Times
Spring 2012 85% 8% 3% 0% 1% 0% 3% Spring 2011 86% 9% 3% 1% 0% 0% 0% Spring 2010 84% 6% 3% 2% 2% 0% 2% Spring 2009 82% 9% 2% 3% 2% 2% 1%
Fall 2008 84% 8% 4% 1% 0% 1% 2% Spring 2008 78% 9% 5% 4% 1% 0% 3%
Fall 2007 88% 7% 1% 2% 0% 0% 2% Spring 2007 82% 11% 3% 1% 1% 0% 2%
Fall 2006 87% 5% 4% 1% 1% 0% 2%
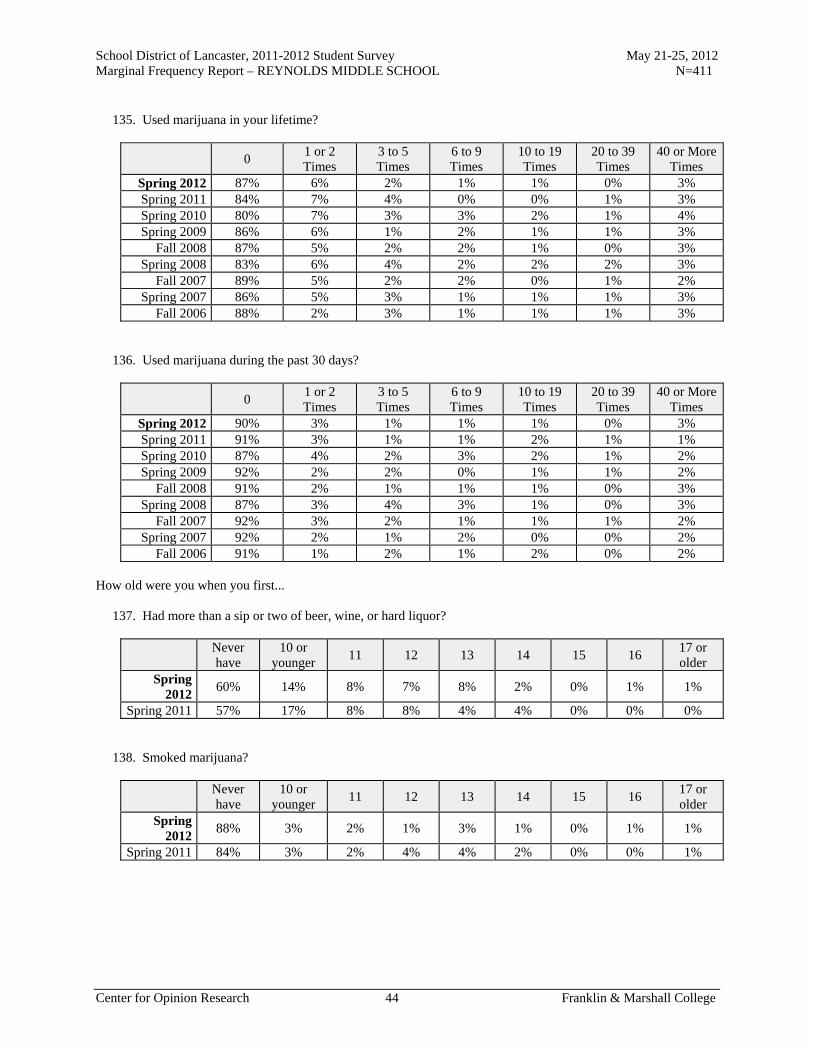
School District of Lancaster, 2011-2012 Student Survey May 21-25, 2012 Marginal Frequency Report – REYNOLDS MIDDLE SCHOOL N=411
Center for Opinion Research 44 Franklin & Marshall College
135. Used marijuana in your lifetime?
0 1 or 2 Times
3 to 5 Times
6 to 9 Times
10 to 19 Times
20 to 39 Times
40 or More Times
Spring 2012 87% 6% 2% 1% 1% 0% 3% Spring 2011 84% 7% 4% 0% 0% 1% 3% Spring 2010 80% 7% 3% 3% 2% 1% 4% Spring 2009 86% 6% 1% 2% 1% 1% 3%
Fall 2008 87% 5% 2% 2% 1% 0% 3% Spring 2008 83% 6% 4% 2% 2% 2% 3%
Fall 2007 89% 5% 2% 2% 0% 1% 2% Spring 2007 86% 5% 3% 1% 1% 1% 3%
Fall 2006 88% 2% 3% 1% 1% 1% 3% 136. Used marijuana during the past 30 days?
0 1 or 2 Times
3 to 5 Times
6 to 9 Times
10 to 19 Times
20 to 39 Times
40 or More Times
Spring 2012 90% 3% 1% 1% 1% 0% 3% Spring 2011 91% 3% 1% 1% 2% 1% 1% Spring 2010 87% 4% 2% 3% 2% 1% 2% Spring 2009 92% 2% 2% 0% 1% 1% 2%
Fall 2008 91% 2% 1% 1% 1% 0% 3% Spring 2008 87% 3% 4% 3% 1% 0% 3%
Fall 2007 92% 3% 2% 1% 1% 1% 2% Spring 2007 92% 2% 1% 2% 0% 0% 2%
Fall 2006 91% 1% 2% 1% 2% 0% 2% How old were you when you first... 137. Had more than a sip or two of beer, wine, or hard liquor?
Never have
10 or younger
11 12 13 14 15 16 17 or older
Spring 2012
60% 14% 8% 7% 8% 2% 0% 1% 1%
Spring 2011 57% 17% 8% 8% 4% 4% 0% 0% 0% 138. Smoked marijuana?
Never have
10 or younger
11 12 13 14 15 16 17 or older
Spring 2012
88% 3% 2% 1% 3% 1% 0% 1% 1%
Spring 2011 84% 3% 2% 4% 4% 2% 0% 0% 1%

School District of Lancaster, 2011-2012 Student Survey May 21-25, 2012 Marginal Frequency Report – REYNOLDS MIDDLE SCHOOL N=411
Center for Opinion Research 45 Franklin & Marshall College
139. Have you ever used smokeless tobacco (chew, snuff, plug, dipping tobacco, chewing tobacco)?
Never Once or
twice
Once in a while but
not regularly
Regularly in the past
Regularly now
Spring 2012 96% 3% 1% 0% 1% Spring 2011 96% 2% 2% 0% 0% Spring 2010 91% 4% 1% 2% 2% Spring 2009 92% 4% 2% 1% 1%
Fall 2008 92% 4% 2% 0% 1% 140. How frequently have you used smokeless tobacco during the past 30 days?
Never Once or
twice
Once or twice per
week
About once a day
More than once a day
Spring 2012 97% 1% 1% 0% 1% Spring 2011 97% 1% 1% 0% 0% Spring 2010 93% 2% 2% 1% 2% Spring 2009 94% 2% 2% 0% 2%
Fall 2008 95% 2% 0% 0% 2% 141. Have you ever smoked cigarettes?
Never Once or
twice
Once in a while but
not regularly
Regularly in the past
Regularly now
Spring 2012 85% 8% 4% 1% 3% Spring 2011 84% 9% 4% 2% 1% Spring 2010 75% 14% 3% 4% 3% Spring 2009 78% 11% 5% 2% 3%
Fall 2008 77% 14% 3% 4% 2% 142. How frequently have you smoked cigarettes during the past 30 days?
Not at all
Less than one
cigarette per day
One to five cigarettes per day
About one-half pack per day
About one pack per
day
About one and one-
half packs per day
Two packs or more per
day
Spring 2012 94% 2% 2% 0% 0% 0% 1% Spring 2011 95% 2% 2% 0% 0% 0% 0% Spring 2010 90% 3% 2% 2% 0% 0% 2% Spring 2009 91% 2% 3% 2% 0% 0% 2%
Fall 2008 92% 3% 2% 1% 0% 0% 1%
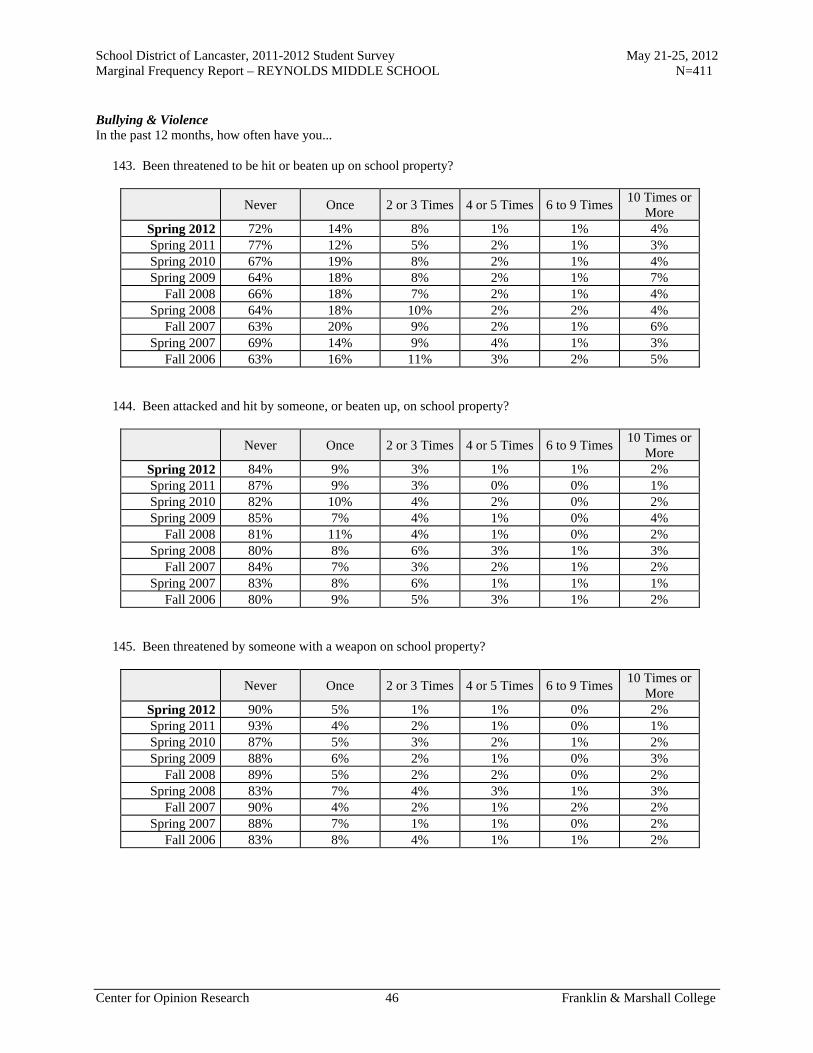
School District of Lancaster, 2011-2012 Student Survey May 21-25, 2012 Marginal Frequency Report – REYNOLDS MIDDLE SCHOOL N=411
Center for Opinion Research 46 Franklin & Marshall College
Bullying & Violence In the past 12 months, how often have you... 143. Been threatened to be hit or beaten up on school property?
Never Once 2 or 3 Times 4 or 5 Times 6 to 9 Times 10 Times or
More Spring 2012 72% 14% 8% 1% 1% 4% Spring 2011 77% 12% 5% 2% 1% 3% Spring 2010 67% 19% 8% 2% 1% 4% Spring 2009 64% 18% 8% 2% 1% 7%
Fall 2008 66% 18% 7% 2% 1% 4% Spring 2008 64% 18% 10% 2% 2% 4%
Fall 2007 63% 20% 9% 2% 1% 6% Spring 2007 69% 14% 9% 4% 1% 3%
Fall 2006 63% 16% 11% 3% 2% 5% 144. Been attacked and hit by someone, or beaten up, on school property?
Never Once 2 or 3 Times 4 or 5 Times 6 to 9 Times 10 Times or
More Spring 2012 84% 9% 3% 1% 1% 2% Spring 2011 87% 9% 3% 0% 0% 1% Spring 2010 82% 10% 4% 2% 0% 2% Spring 2009 85% 7% 4% 1% 0% 4%
Fall 2008 81% 11% 4% 1% 0% 2% Spring 2008 80% 8% 6% 3% 1% 3%
Fall 2007 84% 7% 3% 2% 1% 2% Spring 2007 83% 8% 6% 1% 1% 1%
Fall 2006 80% 9% 5% 3% 1% 2% 145. Been threatened by someone with a weapon on school property?
Never Once 2 or 3 Times 4 or 5 Times 6 to 9 Times 10 Times or
More Spring 2012 90% 5% 1% 1% 0% 2% Spring 2011 93% 4% 2% 1% 0% 1% Spring 2010 87% 5% 3% 2% 1% 2% Spring 2009 88% 6% 2% 1% 0% 3%
Fall 2008 89% 5% 2% 2% 0% 2% Spring 2008 83% 7% 4% 3% 1% 3%
Fall 2007 90% 4% 2% 1% 2% 2% Spring 2007 88% 7% 1% 1% 0% 2%
Fall 2006 83% 8% 4% 1% 1% 2%

School District of Lancaster, 2011-2012 Student Survey May 21-25, 2012 Marginal Frequency Report – REYNOLDS MIDDLE SCHOOL N=411
Center for Opinion Research 47 Franklin & Marshall College
146. Been attacked by someone with a weapon on school property?
Never Once 2 or 3 Times 4 or 5 Times 6 to 9 Times 10 Times or
More Spring 2012 92% 3% 2% 0% 0% 2% Spring 2011 96% 2% 0% 0% 0% 1% Spring 2010 90% 3% 2% 2% 1% 2% Spring 2009 93% 3% 0% 0% 1% 3%
Fall 2008 94% 3% 1% 0% 0% 1% Spring 2008 89% 3% 4% 2% 0% 2%
Fall 2007 92% 3% 1% 2% 1% 1% Spring 2007 94% 3% 1% 1% 0% 1%
Fall 2006 88% 4% 3% 0% 2% 2% Cyberbullying So far this school year, have you... 147. Received mean or nasty messages from someone?
No Yes, once or
twice Yes, every
so often Yes, all the
time Spring 2012 73% 19% 5% 3% Spring 2011 77% 18% 3% 2%
148. Received online messages that made you afraid for your safety?
No Yes, once or
twice Yes, every
so often Yes, all the
time Spring 2012 88% 6% 4% 1% Spring 2011 92% 6% 2% 1%
149. Had someone send or post gossip, rumors, or other hurtful material about you?
No Yes, once or
twice Yes, every
so often Yes, all the
time Spring 2012 77% 15% 5% 3% Spring 2011 81% 14% 3% 2%
150. Had someone share your personal secrets or pictures online without your permission?
No Yes, once or
twice Yes, every
so often Yes, all the
time Spring 2012 86% 9% 2% 3% Spring 2011 90% 8% 0% 1%

School District of Lancaster, 2011-2012 Student Survey May 21-25, 2012 Marginal Frequency Report – REYNOLDS MIDDLE SCHOOL N=411
Center for Opinion Research 48 Franklin & Marshall College
151. Do you use the Internet at home, or not?
Yes No Spring 2012 90% 10% Spring 2011 88% 12%
152. How many hours do you normally spend online using the Internet each day?
Less than 1
hour 1 hour 2 hours 3 hours
4 or more hours
Spring 2012 24% 21% 20% 10% 25% Spring 2011 26% 21% 21% 10% 22%

Report T
Marginal Frequency Report Wheatland Middle School
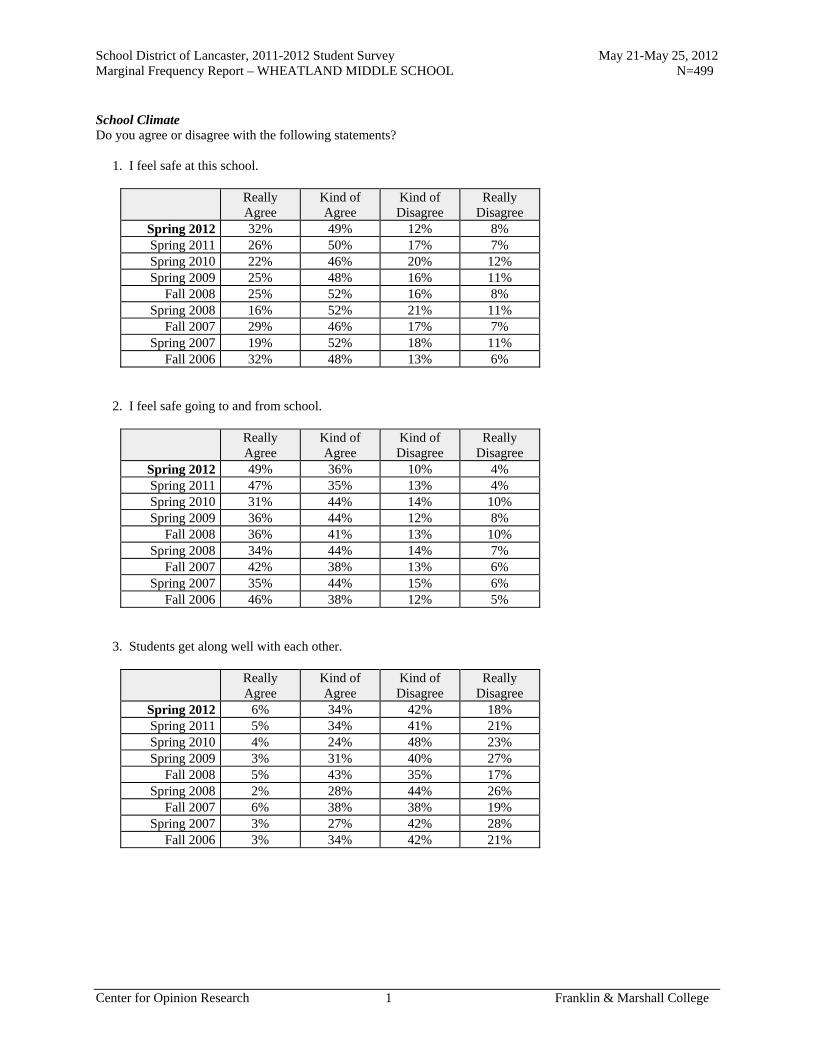
School District of Lancaster, 2011-2012 Student Survey May 21-May 25, 2012 Marginal Frequency Report – WHEATLAND MIDDLE SCHOOL N=499
Center for Opinion Research 1 Franklin & Marshall College
School Climate Do you agree or disagree with the following statements? 1. I feel safe at this school.
Really Agree
Kind of Agree
Kind of Disagree
Really Disagree
Spring 2012 32% 49% 12% 8% Spring 2011 26% 50% 17% 7% Spring 2010 22% 46% 20% 12% Spring 2009 25% 48% 16% 11%
Fall 2008 25% 52% 16% 8% Spring 2008 16% 52% 21% 11%
Fall 2007 29% 46% 17% 7% Spring 2007 19% 52% 18% 11%
Fall 2006 32% 48% 13% 6% 2. I feel safe going to and from school.
Really Agree
Kind of Agree
Kind of Disagree
Really Disagree
Spring 2012 49% 36% 10% 4% Spring 2011 47% 35% 13% 4% Spring 2010 31% 44% 14% 10% Spring 2009 36% 44% 12% 8%
Fall 2008 36% 41% 13% 10% Spring 2008 34% 44% 14% 7%
Fall 2007 42% 38% 13% 6% Spring 2007 35% 44% 15% 6%
Fall 2006 46% 38% 12% 5% 3. Students get along well with each other.
Really Agree
Kind of Agree
Kind of Disagree
Really Disagree
Spring 2012 6% 34% 42% 18% Spring 2011 5% 34% 41% 21% Spring 2010 4% 24% 48% 23% Spring 2009 3% 31% 40% 27%
Fall 2008 5% 43% 35% 17% Spring 2008 2% 28% 44% 26%
Fall 2007 6% 38% 38% 19% Spring 2007 3% 27% 42% 28%
Fall 2006 3% 34% 42% 21%

School District of Lancaster, 2011-2012 Student Survey May 21-May 25, 2012 Marginal Frequency Report – WHEATLAND MIDDLE SCHOOL N=499
Center for Opinion Research 2 Franklin & Marshall College
4. Students get along well with teachers.
Really Agree
Kind of Agree
Kind of Disagree
Really Disagree
Spring 2012 7% 32% 43% 17% Spring 2011 5% 30% 44% 21% Spring 2010 2% 29% 44% 25% Spring 2009 3% 31% 42% 25%
Fall 2008 8% 37% 38% 17% Spring 2008 4% 30% 39% 27%
Fall 2007 8% 42% 36% 15% Spring 2007 6% 32% 42% 20%
Fall 2006 7% 43% 35% 15% 5. I like my school.
Really Agree
Kind of Agree
Kind of Disagree
Really Disagree
Spring 2012 23% 36% 21% 19% Spring 2011 23% 36% 21% 20% Spring 2010 15% 39% 23% 23% Spring 2009 19% 36% 22% 23%
Fall 2008 25% 38% 18% 18% Spring 2008 15% 39% 23% 22%
Fall 2007 25% 42% 18% 15% Spring 2007 17% 38% 22% 23%
Fall 2006 33% 36% 15% 16% 6. I like my teachers.
Really Agree
Kind of Agree
Kind of Disagree
Really Disagree
Spring 2012 31% 42% 20% 8% Spring 2011 28% 44% 18% 10% Spring 2010 22% 43% 24% 11% Spring 2009 24% 45% 23% 8%
Fall 2008 30% 45% 18% 7% Spring 2008 21% 46% 24% 9%
Fall 2007 28% 49% 16% 7% Spring 2007 30% 45% 14% 11%
Fall 2006 42% 41% 13% 4%

School District of Lancaster, 2011-2012 Student Survey May 21-May 25, 2012 Marginal Frequency Report – WHEATLAND MIDDLE SCHOOL N=499
Center for Opinion Research 3 Franklin & Marshall College
7. There is a teacher or some other adult at this school who really cares about me.
Really Agree
Kind of Agree
Kind of Disagree
Really Disagree
Spring 2012 37% 39% 15% 9% Spring 2011 44% 32% 17% 8% Spring 2010 36% 36% 16% 12% Spring 2009 38% 38% 14% 9%
Fall 2008 35% 37% 19% 9% Spring 2008 37% 34% 16% 12%
Fall 2007 33% 35% 19% 13% Spring 2007 36% 36% 16% 12%
Fall 2006 37% 35% 16% 12% 8. There is a teacher or some other adult at this school who cares when I am not here.
Really Agree
Kind of Agree
Kind of Disagree
Really Disagree
Spring 2012 27% 32% 25% 17% Spring 2011 22% 30% 27% 20% Spring 2010 18% 36% 26% 20% Spring 2009 24% 35% 25% 17%
Fall 2008 22% 33% 27% 19% Spring 2008 21% 29% 26% 24%
Fall 2007 20% 30% 29% 22% Spring 2007 18% 30% 30% 22%
Fall 2006 19% 32% 28% 22% 9. There is a teacher or some other adult at this school who listens to me when I have something to say.
Really Agree
Kind of Agree
Kind of Disagree
Really Disagree
Spring 2012 46% 32% 14% 8% Spring 2011 40% 38% 14% 7% Spring 2010 35% 39% 15% 11% Spring 2009 39% 36% 15% 10%
Fall 2008 37% 39% 16% 8% Spring 2008 36% 37% 17% 10%
Fall 2007 40% 33% 18% 9% Spring 2007 37% 37% 17% 9%
Fall 2006 46% 35% 14% 6%

School District of Lancaster, 2011-2012 Student Survey May 21-May 25, 2012 Marginal Frequency Report – WHEATLAND MIDDLE SCHOOL N=499
Center for Opinion Research 4 Franklin & Marshall College
10. There is a teacher or some other adult at this school who tells me when I do a good job.
Really Agree
Kind of Agree
Kind of Disagree
Really Disagree
Spring 2012 50% 34% 10% 5% Spring 2011 49% 35% 10% 6% Spring 2010 42% 36% 14% 8% Spring 2009 44% 37% 11% 7%
Fall 2008 45% 36% 13% 7% Spring 2008 38% 38% 15% 9%
Fall 2007 42% 35% 14% 9% Spring 2007 42% 38% 14% 6%
Fall 2006 44% 39% 11% 6% 11. There is a teacher or some other adult at this school who always wants me to do my best.
Really Agree
Kind of Agree
Kind of Disagree
Really Disagree
Spring 2012 61% 28% 7% 4% Spring 2011 62% 28% 6% 4% Spring 2010 54% 30% 11% 5% Spring 2009 55% 32% 8% 6%
Fall 2008 56% 31% 8% 5% Spring 2008 56% 30% 8% 5%
Fall 2007 55% 30% 9% 6% Spring 2007 57% 32% 7% 4%
Fall 2006 69% 23% 6% 2% 12. There is a teacher or some other adult at this school who believes that I will be a success.
Really Agree
Kind of Agree
Kind of Disagree
Really Disagree
Spring 2012 48% 36% 10% 6% Spring 2011 48% 33% 10% 8% Spring 2010 42% 36% 13% 9% Spring 2009 45% 37% 11% 8%
Fall 2008 45% 37% 12% 6% Spring 2008 44% 37% 11% 8%
Fall 2007 47% 36% 10% 8% Spring 2007 48% 35% 10% 8%
Fall 2006 51% 33% 12% 4%

School District of Lancaster, 2011-2012 Student Survey May 21-May 25, 2012 Marginal Frequency Report – WHEATLAND MIDDLE SCHOOL N=499
Center for Opinion Research 5 Franklin & Marshall College
13. Students in this school really listen to teachers.
Really Agree
Kind of Agree
Kind of Disagree
Really Disagree
Spring 2012 4% 22% 47% 27% Spring 2011 2% 22% 44% 32% Spring 2010 2% 19% 43% 36% Spring 2009 2% 23% 43% 32%
Fall 2008 3% 30% 41% 25% Spring 2008 2% 14% 48% 36%
Fall 2007 4% 30% 42% 24% Spring 2007 1% 19% 45% 35%
Fall 2006 3% 23% 45% 29% 14. Most teachers make learning interesting.
Really Agree
Kind of Agree
Kind of Disagree
Really Disagree
Spring 2012 18% 38% 30% 14% Spring 2011 15% 38% 32% 15% Spring 2010 12% 44% 28% 15% Spring 2009 14% 42% 27% 17%
Fall 2008 17% 44% 25% 14% Spring 2008 8% 44% 32% 16%
Fall 2007 20% 44% 23% 14% Spring 2007 15% 44% 29% 12%
Fall 2006 21% 50% 21% 9% 15. This school is always getting better.
Really Agree
Kind of Agree
Kind of Disagree
Really Disagree
Spring 2012 12% 32% 30% 27% Spring 2011 5% 25% 34% 36% Spring 2010 5% 22% 37% 36% Spring 2009 5% 25% 38% 32%
Fall 2008 8% 33% 30% 29% Spring 2008 4% 17% 41% 38%
Fall 2007 10% 32% 28% 29% Spring 2007 5% 23% 36% 36%
Fall 2006 11% 33% 33% 23%

School District of Lancaster, 2011-2012 Student Survey May 21-May 25, 2012 Marginal Frequency Report – WHEATLAND MIDDLE SCHOOL N=499
Center for Opinion Research 6 Franklin & Marshall College
Food Services How would you rate the lunch you receive at school on each of the following? 16. The amount of food
Really Good Kind of Good
Kind of Bad Really Bad
Spring 2012 9% 39% 30% 22% Spring 2011 12% 37% 27% 24%
17. The flavor of the food
Really Good Kind of Good
Kind of Bad Really Bad
Spring 2012 2% 26% 31% 41% Spring 2011 2% 26% 30% 41%
18. The variety of food you receive each week
Really Good Kind of Good
Kind of Bad Really Bad
Spring 2012 7% 31% 31% 30% Spring 2011 9% 31% 32% 28%
19. The temperature of the food
Really Good Kind of Good
Kind of Bad Really Bad
Spring 2012 16% 34% 29% 21% Spring 2011 14% 40% 26% 20%
20. The cleanliness of the cafeteria
Really Good Kind of Good
Kind of Bad Really Bad
Spring 2012 14% 41% 26% 20% Spring 2011 10% 27% 32% 31%
21. The amount of time you have to eat.
Really Good Kind of Good
Kind of Bad Really Bad
Spring 2012 8% 25% 31% 35% Spring 2011 18% 34% 21% 27%

School District of Lancaster, 2011-2012 Student Survey May 21-May 25, 2012 Marginal Frequency Report – WHEATLAND MIDDLE SCHOOL N=499
Center for Opinion Research 7 Franklin & Marshall College
Readiness and Emergency Management 22. Has anyone from your school spoken with you about what to do in the event of a school emergency, or not?
Yes No Spring 2012 82% 18% Spring 2011 81% 19%
Do you agree or disagree with the following statement? 23. I know what to do if there is a school emergency.
Really Agree
Kind of Agree
Kind of Disagree
Really Disagree
Spring 2012 56% 35% 5% 4% Spring 2011 55% 36% 6% 3%
Peer Academic Climate Do you agree or disagree with the following statements? 24. Most of my friends want to do well at school.
Really Agree
Kind of Agree
Kind of Disagree
Really Disagree
Spring 2012 32% 53% 11% 4% Spring 2011 32% 48% 16% 3% Spring 2010 25% 48% 21% 6% Spring 2009 35% 47% 13% 5%
Fall 2008 36% 41% 16% 7% Spring 2008 37% 46% 11% 6%
Fall 2007 43% 44% 8% 5% Spring 2007 37% 43% 16% 5%
Fall 2006 42% 46% 10% 3% 25. Most of my friends want to go to college.
Really Agree
Kind of Agree
Kind of Disagree
Really Disagree
Spring 2012 40% 41% 14% 5% Spring 2011 38% 44% 15% 3% Spring 2010 34% 47% 12% 7% Spring 2009 45% 39% 10% 6%
Fall 2008 44% 38% 12% 6% Spring 2008 44% 42% 11% 4%
Fall 2007 47% 39% 9% 5% Spring 2007 44% 40% 13% 3%
Fall 2006 40% 41% 14% 5%

School District of Lancaster, 2011-2012 Student Survey May 21-May 25, 2012 Marginal Frequency Report – WHEATLAND MIDDLE SCHOOL N=499
Center for Opinion Research 8 Franklin & Marshall College
26. Most of my friends think education is a waste of time.
Really Agree
Kind of Agree
Kind of Disagree
Really Disagree
Spring 2012 11% 27% 39% 23% Spring 2011 13% 34% 32% 22% Spring 2010 10% 26% 34% 29% Spring 2009 8% 17% 36% 40%
Fall 2008 10% 19% 37% 34% Spring 2008 7% 21% 36% 36%
Fall 2007 7% 19% 33% 41% Spring 2007 8% 20% 35% 38%
Fall 2006 9% 25% 31% 35% 27. Most of my friends want to leave school as soon as possible.
Really Agree
Kind of Agree
Kind of Disagree
Really Disagree
Spring 2012 26% 28% 26% 19% Spring 2011 29% 27% 24% 21% Spring 2010 19% 26% 29% 26% Spring 2009 14% 19% 30% 38%
Fall 2008 15% 22% 26% 38% Spring 2008 13% 25% 26% 36%
Fall 2007 15% 22% 27% 36% Spring 2007 18% 22% 25% 35%
Fall 2006 21% 26% 25% 28% 28. My friends tell me to leave school and get a job.
Really Agree
Kind of Agree
Kind of Disagree
Really Disagree
Spring 2012 4% 4% 15% 77% Spring 2011 3% 5% 17% 76% Spring 2010 4% 5% 14% 77% Spring 2009 3% 5% 14% 78%
Fall 2008 3% 5% 13% 79% Spring 2008 3% 5% 13% 79%
Fall 2007 4% 6% 14% 77% Spring 2007 3% 4% 8% 85%
Fall 2006 2% 5% 8% 85%
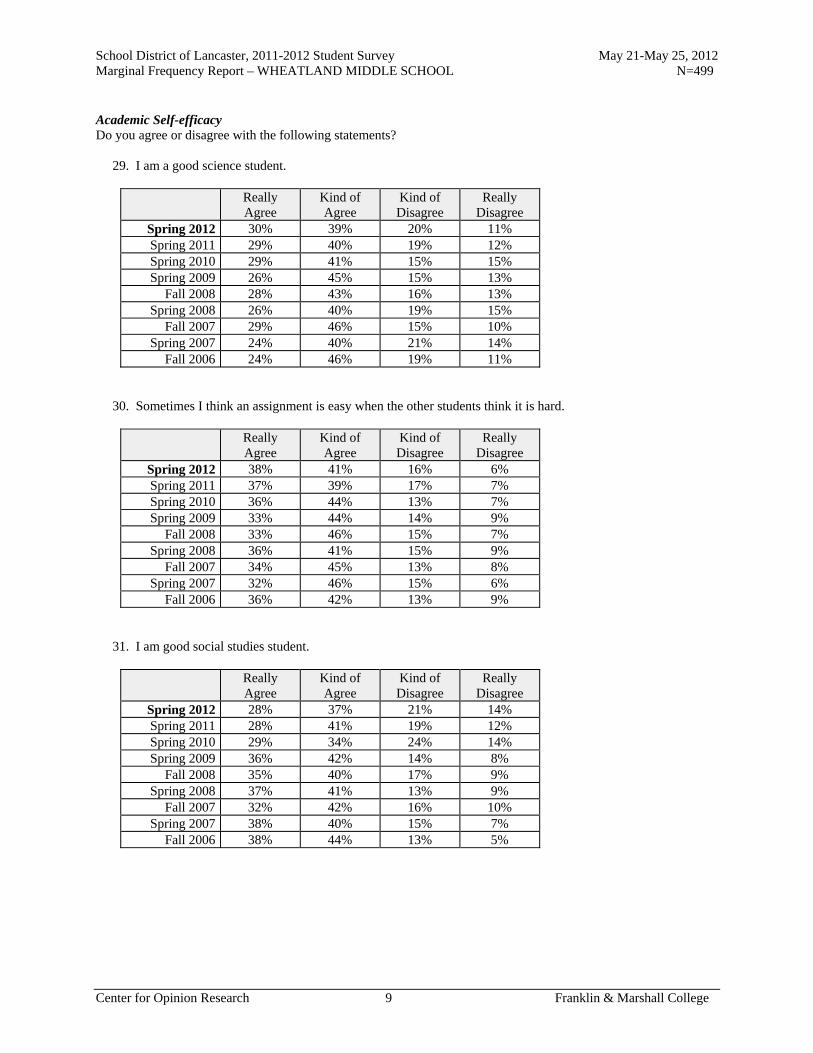
School District of Lancaster, 2011-2012 Student Survey May 21-May 25, 2012 Marginal Frequency Report – WHEATLAND MIDDLE SCHOOL N=499
Center for Opinion Research 9 Franklin & Marshall College
Academic Self-efficacy Do you agree or disagree with the following statements? 29. I am a good science student.
Really Agree
Kind of Agree
Kind of Disagree
Really Disagree
Spring 2012 30% 39% 20% 11% Spring 2011 29% 40% 19% 12% Spring 2010 29% 41% 15% 15% Spring 2009 26% 45% 15% 13%
Fall 2008 28% 43% 16% 13% Spring 2008 26% 40% 19% 15%
Fall 2007 29% 46% 15% 10% Spring 2007 24% 40% 21% 14%
Fall 2006 24% 46% 19% 11% 30. Sometimes I think an assignment is easy when the other students think it is hard.
Really Agree
Kind of Agree
Kind of Disagree
Really Disagree
Spring 2012 38% 41% 16% 6% Spring 2011 37% 39% 17% 7% Spring 2010 36% 44% 13% 7% Spring 2009 33% 44% 14% 9%
Fall 2008 33% 46% 15% 7% Spring 2008 36% 41% 15% 9%
Fall 2007 34% 45% 13% 8% Spring 2007 32% 46% 15% 6%
Fall 2006 36% 42% 13% 9% 31. I am good social studies student.
Really Agree
Kind of Agree
Kind of Disagree
Really Disagree
Spring 2012 28% 37% 21% 14% Spring 2011 28% 41% 19% 12% Spring 2010 29% 34% 24% 14% Spring 2009 36% 42% 14% 8%
Fall 2008 35% 40% 17% 9% Spring 2008 37% 41% 13% 9%
Fall 2007 32% 42% 16% 10% Spring 2007 38% 40% 15% 7%
Fall 2006 38% 44% 13% 5%

School District of Lancaster, 2011-2012 Student Survey May 21-May 25, 2012 Marginal Frequency Report – WHEATLAND MIDDLE SCHOOL N=499
Center for Opinion Research 10 Franklin & Marshall College
32. My teacher thinks I am smart.
Really Agree
Kind of Agree
Kind of Disagree
Really Disagree
Spring 2012 42% 39% 12% 7% Spring 2011 41% 42% 11% 6% Spring 2010 38% 39% 13% 9% Spring 2009 41% 41% 10% 8%
Fall 2008 43% 41% 9% 7% Spring 2008 39% 43% 12% 6%
Fall 2007 40% 41% 10% 8% Spring 2007 44% 38% 13% 6%
Fall 2006 39% 42% 13% 6% 33. I am a good math student.
Really Agree
Kind of Agree
Kind of Disagree
Really Disagree
Spring 2012 35% 37% 16% 12% Spring 2011 37% 34% 16% 13% Spring 2010 36% 43% 15% 7% Spring 2009 36% 40% 15% 9%
Fall 2008 42% 40% 8% 10% Spring 2008 42% 33% 13% 12%
Fall 2007 44% 33% 14% 9% Spring 2007 40% 34% 16% 10%
Fall 2006 47% 32% 12% 9% 34. My classmates usually get better grades than I do.
Really Agree
Kind of Agree
Kind of Disagree
Really Disagree
Spring 2012 15% 33% 39% 14% Spring 2011 17% 32% 37% 14% Spring 2010 11% 35% 38% 16% Spring 2009 13% 33% 42% 12%
Fall 2008 10% 31% 46% 14% Spring 2008 16% 30% 39% 15%
Fall 2007 14% 29% 39% 18% Spring 2007 15% 32% 36% 17%
Fall 2006 17% 31% 37% 15%

School District of Lancaster, 2011-2012 Student Survey May 21-May 25, 2012 Marginal Frequency Report – WHEATLAND MIDDLE SCHOOL N=499
Center for Opinion Research 11 Franklin & Marshall College
35. I usually understand my homework assignments.
Really Agree
Kind of Agree
Kind of Disagree
Really Disagree
Spring 2012 32% 44% 19% 5% Spring 2011 35% 39% 19% 7% Spring 2010 29% 47% 18% 6% Spring 2009 32% 48% 15% 6%
Fall 2008 33% 46% 17% 4% Spring 2008 34% 43% 16% 7%
Fall 2007 37% 42% 16% 5% Spring 2007 36% 42% 18% 5%
Fall 2006 38% 42% 15% 5% 36. I could get the best grades in class if I tried hard enough.
Really Agree
Kind of Agree
Kind of Disagree
Really Disagree
Spring 2012 59% 28% 10% 3% Spring 2011 65% 24% 7% 4% Spring 2010 59% 30% 8% 3% Spring 2009 58% 30% 7% 4%
Fall 2008 58% 29% 9% 4% Spring 2008 68% 22% 5% 5%
Fall 2007 63% 27% 5% 4% Spring 2007 66% 24% 7% 3%
Fall 2006 65% 25% 8% 3% 37. I am a good reading student.
Really Agree
Kind of Agree
Kind of Disagree
Really Disagree
Spring 2012 41% 34% 17% 8% Spring 2011 42% 37% 12% 8% Spring 2010 41% 36% 14% 8% Spring 2009 42% 40% 12% 6%
Fall 2008 44% 33% 15% 8% Spring 2008 37% 42% 13% 8%
Fall 2007 40% 39% 13% 8% Spring 2007 44% 39% 12% 5%
Fall 2006 44% 33% 15% 8%

School District of Lancaster, 2011-2012 Student Survey May 21-May 25, 2012 Marginal Frequency Report – WHEATLAND MIDDLE SCHOOL N=499
Center for Opinion Research 12 Franklin & Marshall College
38. It is not hard for me to get good grades in school.
Really Agree
Kind of Agree
Kind of Disagree
Really Disagree
Spring 2012 33% 36% 23% 8% Spring 2011 32% 34% 23% 11% Spring 2010 30% 35% 24% 10% Spring 2009 36% 38% 16% 10%
Fall 2008 35% 41% 16% 7% Spring 2008 28% 42% 20% 10%
Fall 2007 32% 43% 18% 7% Spring 2007 37% 36% 20% 7%
Fall 2006 31% 42% 18% 9% 39. I am smart.
Really Agree
Kind of Agree
Kind of Disagree
Really Disagree
Spring 2012 57% 29% 7% 7% Spring 2011 56% 32% 7% 4% Spring 2010 52% 33% 8% 7% Spring 2009 58% 31% 7% 5%
Fall 2008 62% 29% 6% 3% Spring 2008 52% 35% 7% 6%
Fall 2007 55% 32% 7% 5% Spring 2007 53% 33% 9% 5%
Fall 2006 52% 34% 10% 4% 40. When the teacher asks a question I usually know the answer even if the other students don't.
Really Agree
Kind of Agree
Kind of Disagree
Really Disagree
Spring 2012 27% 46% 20% 7% Spring 2011 23% 46% 25% 6% Spring 2010 20% 46% 28% 6% Spring 2009 25% 48% 21% 7%
Fall 2008 25% 49% 20% 6% Spring 2008 22% 46% 25% 7%
Fall 2007 24% 48% 20% 7% Spring 2007 24% 50% 20% 6%
Fall 2006 22% 50% 22% 6%

School District of Lancaster, 2011-2012 Student Survey May 21-May 25, 2012 Marginal Frequency Report – WHEATLAND MIDDLE SCHOOL N=499
Center for Opinion Research 13 Franklin & Marshall College
41. I work hard in school.
Really Agree
Kind of Agree
Kind of Disagree
Really Disagree
Spring 2012 39% 44% 13% 4% Spring 2011 39% 43% 13% 4% Spring 2010 36% 43% 17% 5% Spring 2009 43% 40% 12% 4%
Fall 2008 46% 38% 12% 4% Spring 2008 38% 42% 15% 5%
Fall 2007 45% 41% 12% 3% Spring 2007 38% 42% 17% 4%
Fall 2006 49% 36% 12% 3% 42. Most of my classmates work harder on their homework than I do.
Really Agree
Kind of Agree
Kind of Disagree
Really Disagree
Spring 2012 16% 34% 35% 15% Spring 2011 16% 35% 35% 14% Spring 2010 17% 34% 33% 16% Spring 2009 15% 36% 37% 13%
Fall 2008 12% 35% 36% 17% Spring 2008 19% 29% 37% 15%
Fall 2007 16% 34% 33% 17% Spring 2007 16% 35% 34% 15%
Fall 2006 16% 33% 35% 15% 43. I always get good grades when I try hard.
Really Agree
Kind of Agree
Kind of Disagree
Really Disagree
Spring 2012 59% 30% 8% 4% Spring 2011 62% 28% 7% 3% Spring 2010 56% 34% 8% 3% Spring 2009 58% 33% 6% 4%
Fall 2008 61% 30% 5% 4% Spring 2008 59% 31% 6% 4%
Fall 2007 61% 30% 5% 4% Spring 2007 63% 28% 6% 3%
Fall 2006 62% 27% 6% 4%

School District of Lancaster, 2011-2012 Student Survey May 21-May 25, 2012 Marginal Frequency Report – WHEATLAND MIDDLE SCHOOL N=499
Center for Opinion Research 14 Franklin & Marshall College
44. I usually do not get good grades in math because it is too hard.
Really Agree
Kind of Agree
Kind of Disagree
Really Disagree
Spring 2012 12% 27% 26% 34% Spring 2011 16% 22% 28% 34% Spring 2010 10% 20% 27% 43% Spring 2009 9% 21% 31% 39%
Fall 2008 9% 21% 29% 41% Spring 2008 12% 16% 28% 44%
Fall 2007 10% 21% 30% 40% Spring 2007 11% 19% 27% 44%
Fall 2006 14% 16% 27% 42% 45. Most of my classmates like to do math because it is easy.
Really Agree
Kind of Agree
Kind of Disagree
Really Disagree
Spring 2012 21% 34% 29% 16% Spring 2011 22% 34% 29% 15% Spring 2010 16% 36% 32% 15% Spring 2009 21% 30% 32% 18%
Fall 2008 20% 37% 27% 15% Spring 2008 17% 35% 30% 18%
Fall 2007 21% 38% 28% 13% Spring 2007 16% 32% 32% 20%
Fall 2006 19% 34% 31% 16% 46. I would get better grades if my teacher liked me more.
Really Agree
Kind of Agree
Kind of Disagree
Really Disagree
Spring 2012 14% 17% 27% 42% Spring 2011 14% 16% 26% 45% Spring 2010 16% 15% 29% 40% Spring 2009 8% 17% 29% 45%
Fall 2008 10% 14% 27% 50% Spring 2008 9% 16% 27% 48%
Fall 2007 10% 14% 29% 46% Spring 2007 14% 15% 30% 42%
Fall 2006 11% 14% 27% 48%

School District of Lancaster, 2011-2012 Student Survey May 21-May 25, 2012 Marginal Frequency Report – WHEATLAND MIDDLE SCHOOL N=499
Center for Opinion Research 15 Franklin & Marshall College
47. I will graduate from high school.
Really Agree
Kind of Agree
Kind of Disagree
Really Disagree
Spring 2012 82% 14% 2% 2% Spring 2011 84% 14% 2% 1% Spring 2010 82% 13% 3% 2% Spring 2009 84% 12% 2% 2%
Fall 2008 82% 14% 1% 3% Spring 2008 79% 14% 3% 4%
Fall 2007 80% 14% 4% 3% Spring 2007 85% 11% 2% 2%
Fall 2006 82% 14% 2% 2% 48. I go to a good school.
Really Agree
Kind of Agree
Kind of Disagree
Really Disagree
Spring 2012 34% 34% 20% 12% Spring 2011 29% 31% 22% 18% Spring 2010 19% 37% 22% 22% Spring 2009 27% 34% 22% 17%
Fall 2008 30% 35% 20% 16% Spring 2008 18% 32% 27% 23%
Fall 2007 32% 37% 18% 12% Spring 2007 21% 36% 26% 18%
Fall 2006 33% 39% 18% 10% 49. Adults who have good jobs probably were good students when they were young.
Really Agree
Kind of Agree
Kind of Disagree
Really Disagree
Spring 2012 53% 32% 10% 5% Spring 2011 54% 32% 10% 4% Spring 2010 48% 31% 17% 4% Spring 2009 48% 31% 14% 7%
Fall 2008 48% 36% 11% 5% Spring 2008 44% 29% 16% 11%
Fall 2007 45% 36% 13% 6% Spring 2007 43% 34% 17% 6%
Fall 2006 48% 34% 12% 6%

School District of Lancaster, 2011-2012 Student Survey May 21-May 25, 2012 Marginal Frequency Report – WHEATLAND MIDDLE SCHOOL N=499
Center for Opinion Research 16 Franklin & Marshall College
50. When I am old enough, I will go to college.
Really Agree
Kind of Agree
Kind of Disagree
Really Disagree
Spring 2012 74% 17% 6% 3% Spring 2011 72% 19% 5% 4% Spring 2010 72% 19% 6% 4% Spring 2009 74% 16% 5% 5%
Fall 2008 76% 17% 4% 4% Spring 2008 72% 16% 6% 6%
Fall 2007 71% 20% 4% 6% Spring 2007 76% 16% 4% 4%
Fall 2006 72% 19% 5% 4% 51. No one cares if I do well in school.
Really Agree
Kind of Agree
Kind of Disagree
Really Disagree
Spring 2012 8% 9% 26% 57% Spring 2011 4% 9% 24% 63% Spring 2010 5% 8% 26% 61% Spring 2009 4% 7% 19% 69%
Fall 2008 7% 7% 18% 68% Spring 2008 4% 9% 15% 72%
Fall 2007 5% 11% 18% 66% Spring 2007 4% 10% 21% 64%
Fall 2006 6% 8% 18% 67% 52. What I learn in school is not important.
Really Agree
Kind of Agree
Kind of Disagree
Really Disagree
Spring 2012 6% 9% 24% 61% Spring 2011 5% 8% 26% 61% Spring 2010 7% 8% 23% 62% Spring 2009 5% 7% 21% 67%
Fall 2008 4% 10% 21% 65% Spring 2008 5% 8% 17% 70%
Fall 2007 5% 9% 21% 65% Spring 2007 4% 6% 24% 66%
Fall 2006 4% 6% 17% 72%
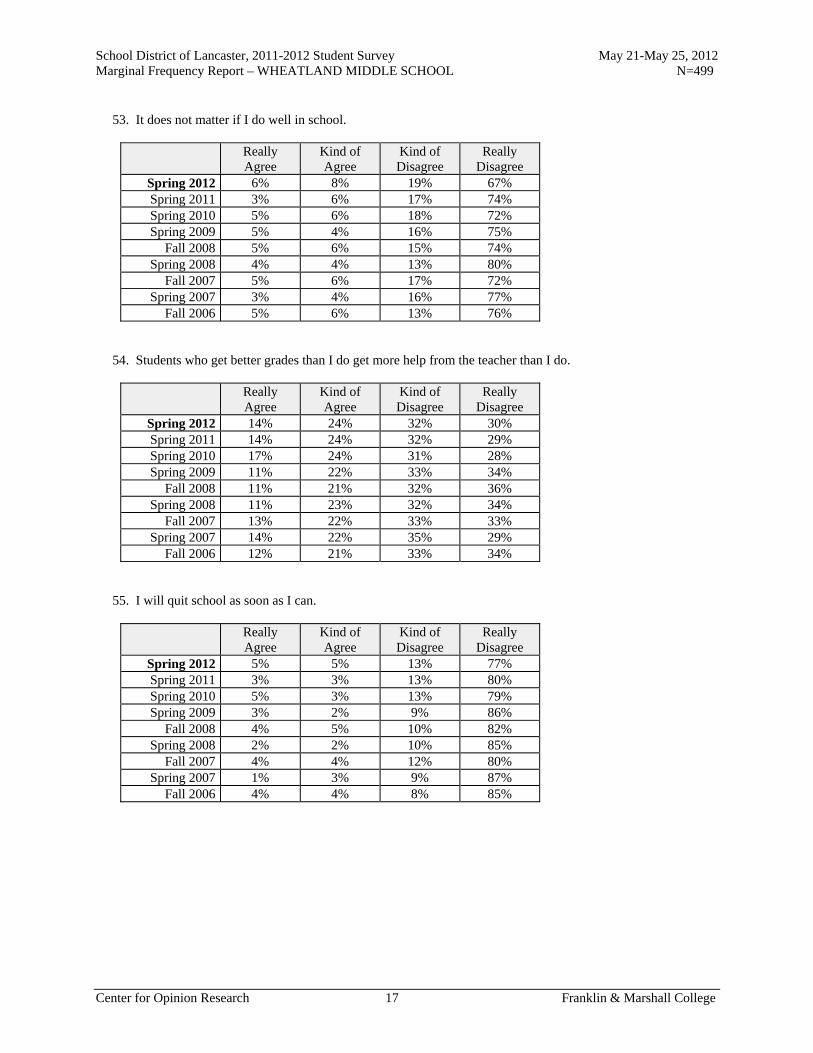
School District of Lancaster, 2011-2012 Student Survey May 21-May 25, 2012 Marginal Frequency Report – WHEATLAND MIDDLE SCHOOL N=499
Center for Opinion Research 17 Franklin & Marshall College
53. It does not matter if I do well in school.
Really Agree
Kind of Agree
Kind of Disagree
Really Disagree
Spring 2012 6% 8% 19% 67% Spring 2011 3% 6% 17% 74% Spring 2010 5% 6% 18% 72% Spring 2009 5% 4% 16% 75%
Fall 2008 5% 6% 15% 74% Spring 2008 4% 4% 13% 80%
Fall 2007 5% 6% 17% 72% Spring 2007 3% 4% 16% 77%
Fall 2006 5% 6% 13% 76% 54. Students who get better grades than I do get more help from the teacher than I do.
Really Agree
Kind of Agree
Kind of Disagree
Really Disagree
Spring 2012 14% 24% 32% 30% Spring 2011 14% 24% 32% 29% Spring 2010 17% 24% 31% 28% Spring 2009 11% 22% 33% 34%
Fall 2008 11% 21% 32% 36% Spring 2008 11% 23% 32% 34%
Fall 2007 13% 22% 33% 33% Spring 2007 14% 22% 35% 29%
Fall 2006 12% 21% 33% 34% 55. I will quit school as soon as I can.
Really Agree
Kind of Agree
Kind of Disagree
Really Disagree
Spring 2012 5% 5% 13% 77% Spring 2011 3% 3% 13% 80% Spring 2010 5% 3% 13% 79% Spring 2009 3% 2% 9% 86%
Fall 2008 4% 5% 10% 82% Spring 2008 2% 2% 10% 85%
Fall 2007 4% 4% 12% 80% Spring 2007 1% 3% 9% 87%
Fall 2006 4% 4% 8% 85%
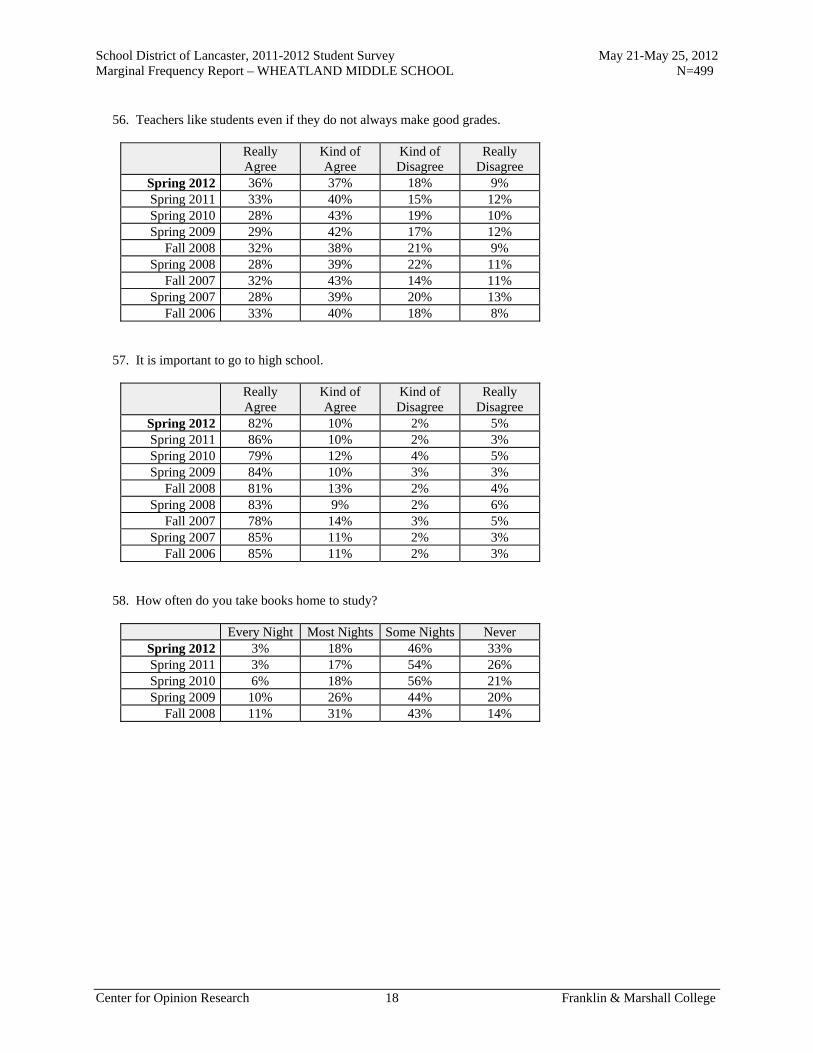
School District of Lancaster, 2011-2012 Student Survey May 21-May 25, 2012 Marginal Frequency Report – WHEATLAND MIDDLE SCHOOL N=499
Center for Opinion Research 18 Franklin & Marshall College
56. Teachers like students even if they do not always make good grades.
Really Agree
Kind of Agree
Kind of Disagree
Really Disagree
Spring 2012 36% 37% 18% 9% Spring 2011 33% 40% 15% 12% Spring 2010 28% 43% 19% 10% Spring 2009 29% 42% 17% 12%
Fall 2008 32% 38% 21% 9% Spring 2008 28% 39% 22% 11%
Fall 2007 32% 43% 14% 11% Spring 2007 28% 39% 20% 13%
Fall 2006 33% 40% 18% 8% 57. It is important to go to high school.
Really Agree
Kind of Agree
Kind of Disagree
Really Disagree
Spring 2012 82% 10% 2% 5% Spring 2011 86% 10% 2% 3% Spring 2010 79% 12% 4% 5% Spring 2009 84% 10% 3% 3%
Fall 2008 81% 13% 2% 4% Spring 2008 83% 9% 2% 6%
Fall 2007 78% 14% 3% 5% Spring 2007 85% 11% 2% 3%
Fall 2006 85% 11% 2% 3% 58. How often do you take books home to study?
Every Night Most Nights Some Nights Never Spring 2012 3% 18% 46% 33% Spring 2011 3% 17% 54% 26% Spring 2010 6% 18% 56% 21% Spring 2009 10% 26% 44% 20%
Fall 2008 11% 31% 43% 14%
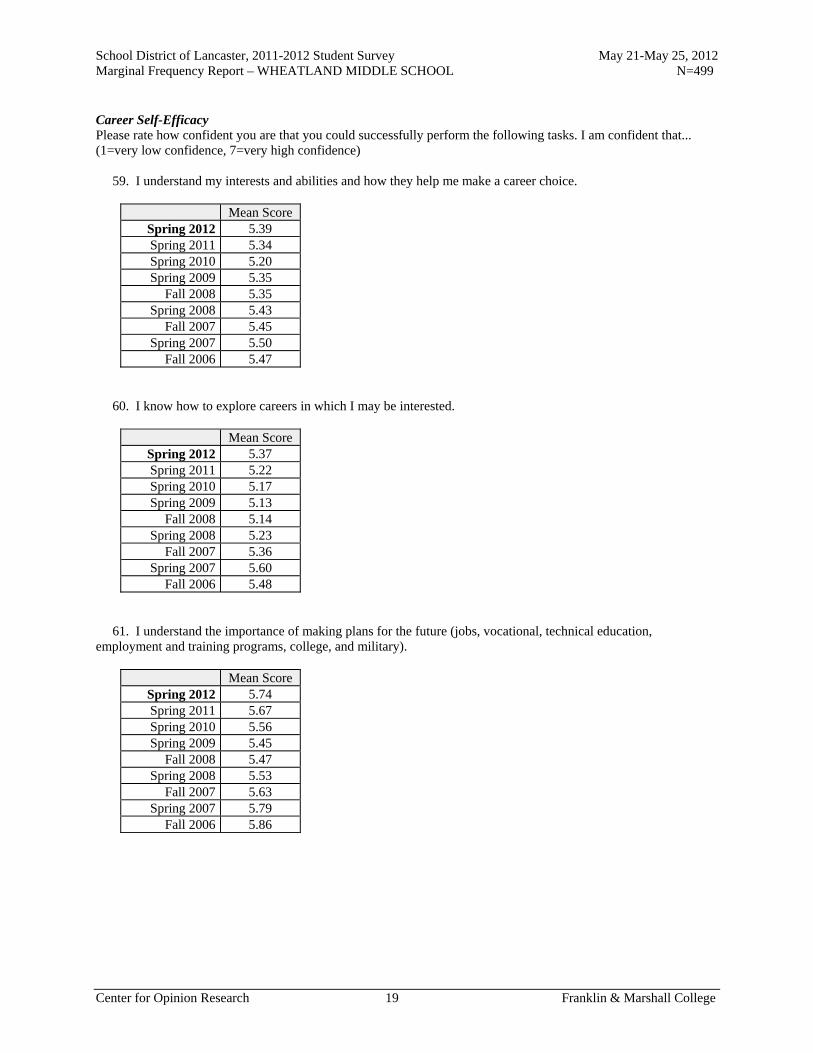
School District of Lancaster, 2011-2012 Student Survey May 21-May 25, 2012 Marginal Frequency Report – WHEATLAND MIDDLE SCHOOL N=499
Center for Opinion Research 19 Franklin & Marshall College
Career Self-Efficacy Please rate how confident you are that you could successfully perform the following tasks. I am confident that... (1=very low confidence, 7=very high confidence) 59. I understand my interests and abilities and how they help me make a career choice.
Mean Score Spring 2012 5.39 Spring 2011 5.34 Spring 2010 5.20 Spring 2009 5.35
Fall 2008 5.35 Spring 2008 5.43
Fall 2007 5.45 Spring 2007 5.50
Fall 2006 5.47 60. I know how to explore careers in which I may be interested.
Mean Score Spring 2012 5.37 Spring 2011 5.22 Spring 2010 5.17 Spring 2009 5.13
Fall 2008 5.14 Spring 2008 5.23
Fall 2007 5.36 Spring 2007 5.60
Fall 2006 5.48 61. I understand the importance of making plans for the future (jobs, vocational, technical education, employment and training programs, college, and military).
Mean Score Spring 2012 5.74 Spring 2011 5.67 Spring 2010 5.56 Spring 2009 5.45
Fall 2008 5.47 Spring 2008 5.53
Fall 2007 5.63 Spring 2007 5.79
Fall 2006 5.86

School District of Lancaster, 2011-2012 Student Survey May 21-May 25, 2012 Marginal Frequency Report – WHEATLAND MIDDLE SCHOOL N=499
Center for Opinion Research 20 Franklin & Marshall College
62. I know how to prepare for careers in which I may be interested.
Mean Score Spring 2012 5.44 Spring 2011 5.30 Spring 2010 5.20 Spring 2009 5.19
Fall 2008 5.36 Spring 2008 5.29
Fall 2007 5.42 Spring 2007 5.51
Fall 2006 5.51 63. I know what employers expect of workers.
Mean Score Spring 2012 5.41 Spring 2011 5.26 Spring 2010 5.19 Spring 2009 5.27
Fall 2008 5.31 Spring 2008 5.30
Fall 2007 5.35 Spring 2007 5.51
Fall 2006 5.34 64. I know how academic skills such as math, reading, and science relate to my career goals.
Mean Score Spring 2012 5.49 Spring 2011 5.41 Spring 2010 5.51 Spring 2009 5.35
Fall 2008 5.46 Spring 2008 5.50
Fall 2007 5.51 Spring 2007 5.66
Fall 2006 5.69

School District of Lancaster, 2011-2012 Student Survey May 21-May 25, 2012 Marginal Frequency Report – WHEATLAND MIDDLE SCHOOL N=499
Center for Opinion Research 21 Franklin & Marshall College
65. I know how to look for a part-time summer job.
Mean Score Spring 2012 5.09 Spring 2011 4.95 Spring 2010 4.75 Spring 2009 4.88
Fall 2008 5.04 Spring 2008 5.07
Fall 2007 5.04 Spring 2007 5.21
Fall 2006 5.12 66. I know what jobs are available locally.
Mean Score Spring 2012 4.69 Spring 2011 4.56 Spring 2010 4.35 Spring 2009 4.56
Fall 2008 4.71 Spring 2008 4.73
Fall 2007 4.81 Spring 2007 4.81
Fall 2006 4.76 67. I understand the challenges students have in high school.
Mean Score Spring 2012 5.38 Spring 2011 5.45 Spring 2010 5.14 Spring 2009 5.20
Fall 2008 5.28 Spring 2008 5.32
Fall 2007 5.34 Spring 2007 5.43
Fall 2006 5.42
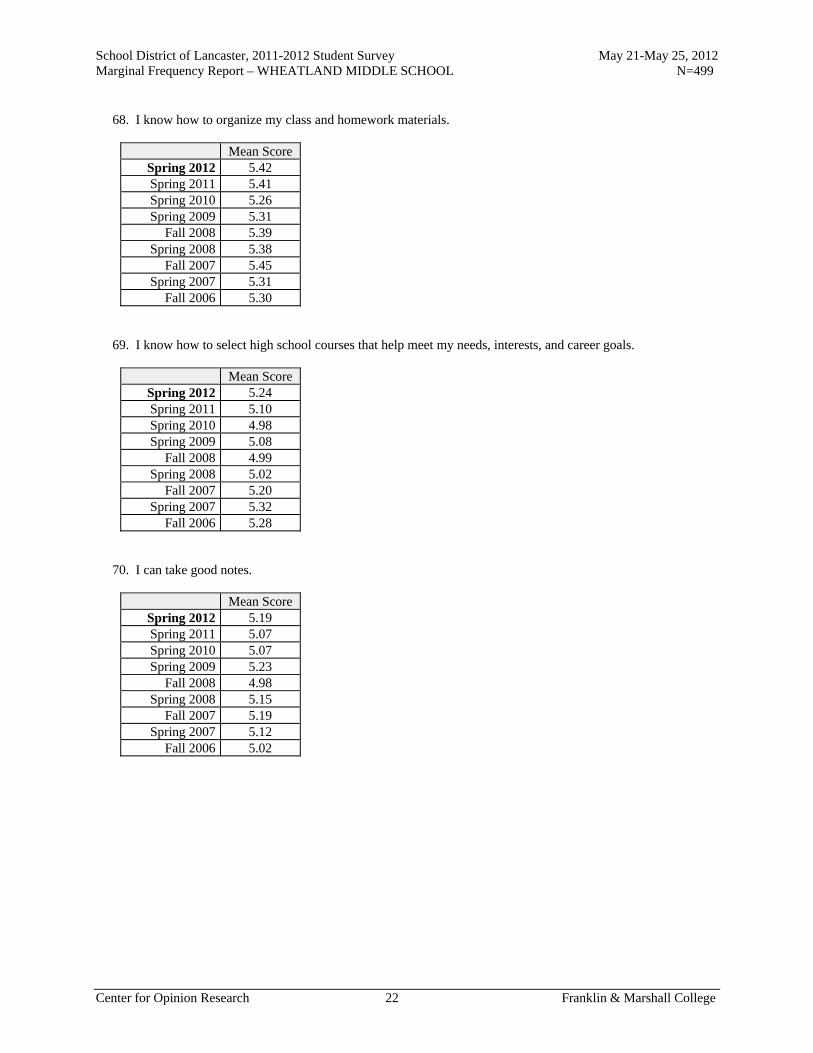
School District of Lancaster, 2011-2012 Student Survey May 21-May 25, 2012 Marginal Frequency Report – WHEATLAND MIDDLE SCHOOL N=499
Center for Opinion Research 22 Franklin & Marshall College
68. I know how to organize my class and homework materials.
Mean Score Spring 2012 5.42 Spring 2011 5.41 Spring 2010 5.26 Spring 2009 5.31
Fall 2008 5.39 Spring 2008 5.38
Fall 2007 5.45 Spring 2007 5.31
Fall 2006 5.30 69. I know how to select high school courses that help meet my needs, interests, and career goals.
Mean Score Spring 2012 5.24 Spring 2011 5.10 Spring 2010 4.98 Spring 2009 5.08
Fall 2008 4.99 Spring 2008 5.02
Fall 2007 5.20 Spring 2007 5.32
Fall 2006 5.28 70. I can take good notes.
Mean Score Spring 2012 5.19 Spring 2011 5.07 Spring 2010 5.07 Spring 2009 5.23
Fall 2008 4.98 Spring 2008 5.15
Fall 2007 5.19 Spring 2007 5.12
Fall 2006 5.02
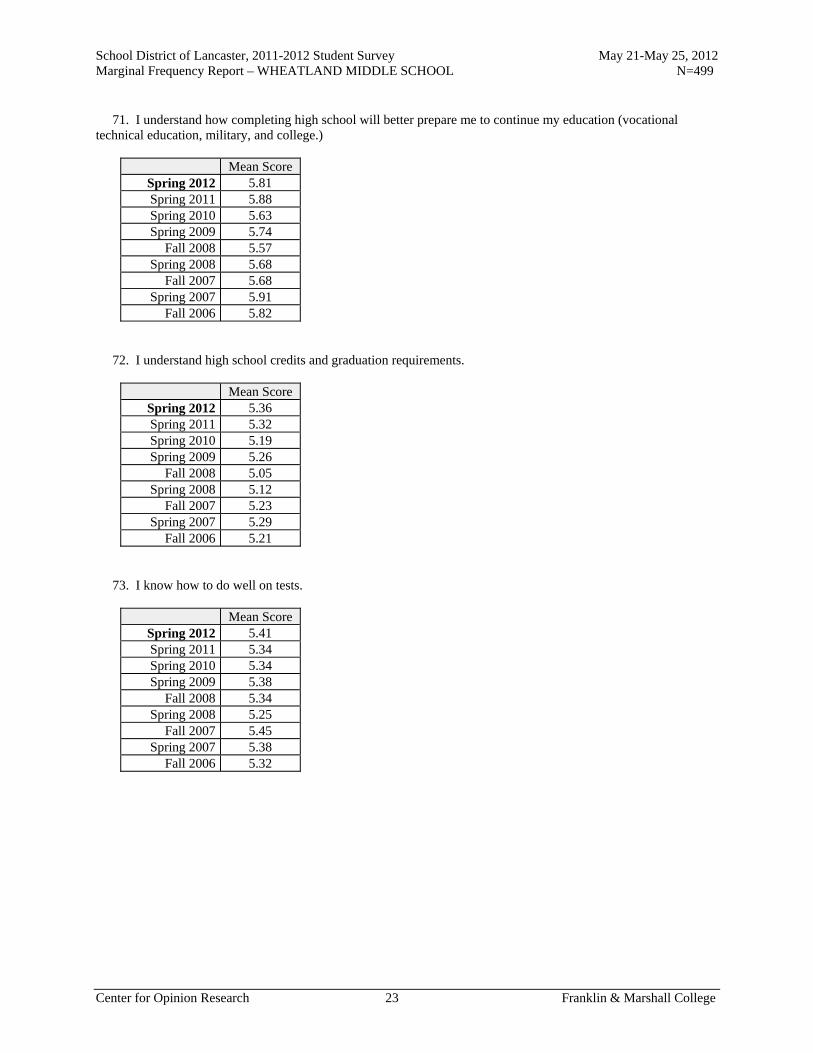
School District of Lancaster, 2011-2012 Student Survey May 21-May 25, 2012 Marginal Frequency Report – WHEATLAND MIDDLE SCHOOL N=499
Center for Opinion Research 23 Franklin & Marshall College
71. I understand how completing high school will better prepare me to continue my education (vocational technical education, military, and college.)
Mean Score Spring 2012 5.81 Spring 2011 5.88 Spring 2010 5.63 Spring 2009 5.74
Fall 2008 5.57 Spring 2008 5.68
Fall 2007 5.68 Spring 2007 5.91
Fall 2006 5.82 72. I understand high school credits and graduation requirements.
Mean Score Spring 2012 5.36 Spring 2011 5.32 Spring 2010 5.19 Spring 2009 5.26
Fall 2008 5.05 Spring 2008 5.12
Fall 2007 5.23 Spring 2007 5.29
Fall 2006 5.21 73. I know how to do well on tests.
Mean Score Spring 2012 5.41 Spring 2011 5.34 Spring 2010 5.34 Spring 2009 5.38
Fall 2008 5.34 Spring 2008 5.25
Fall 2007 5.45 Spring 2007 5.38
Fall 2006 5.32

School District of Lancaster, 2011-2012 Student Survey May 21-May 25, 2012 Marginal Frequency Report – WHEATLAND MIDDLE SCHOOL N=499
Center for Opinion Research 24 Franklin & Marshall College
74. I know how to select middle school extra-curricular activities that will meet my interests and future goals
Mean Score Spring 2012 5.26 Spring 2011 5.11 Spring 2010 5.03 Spring 2009 5.02
Fall 2008 5.04 Spring 2008 5.12
Fall 2007 5.21 Spring 2007 5.25
Fall 2006 5.25 75. I understand how completing high school will better prepare me for the job market.
Mean Score Spring 2012 5.57 Spring 2011 5.62 Spring 2010 5.47 Spring 2009 5.49
Fall 2008 5.32 Spring 2008 5.47
Fall 2007 5.44 Spring 2007 5.63
Fall 2006 5.66 76. I know the classes offered by my area vocational technical school.
Mean Score Spring 2012 4.61 Spring 2011 4.27 Spring 2010 4.16 Spring 2009 4.35
Fall 2008 4.32 Spring 2008 4.48
Fall 2007 4.57 Spring 2007 4.50
Fall 2006 4.26

School District of Lancaster, 2011-2012 Student Survey May 21-May 25, 2012 Marginal Frequency Report – WHEATLAND MIDDLE SCHOOL N=499
Center for Opinion Research 25 Franklin & Marshall College
77. I know how to organize my time.
Mean Score Spring 2012 5.33 Spring 2011 5.10 Spring 2010 5.09 Spring 2009 5.08
Fall 2008 5.13 Spring 2008 5.07
Fall 2007 5.19 Spring 2007 5.20
Fall 2006 5.11 78. I know how to listen and ask questions in class.
Mean Score Spring 2012 5.45 Spring 2011 5.37 Spring 2010 5.27 Spring 2009 5.43
Fall 2008 5.32 Spring 2008 5.29
Fall 2007 5.42 Spring 2007 5.31
Fall 2006 5.43 79. I know what will be expected of me in high school.
Mean Score Spring 2012 5.57 Spring 2011 5.51 Spring 2010 5.45 Spring 2009 5.48
Fall 2008 5.49 Spring 2008 5.43
Fall 2007 5.52 Spring 2007 5.59
Fall 2006 5.57
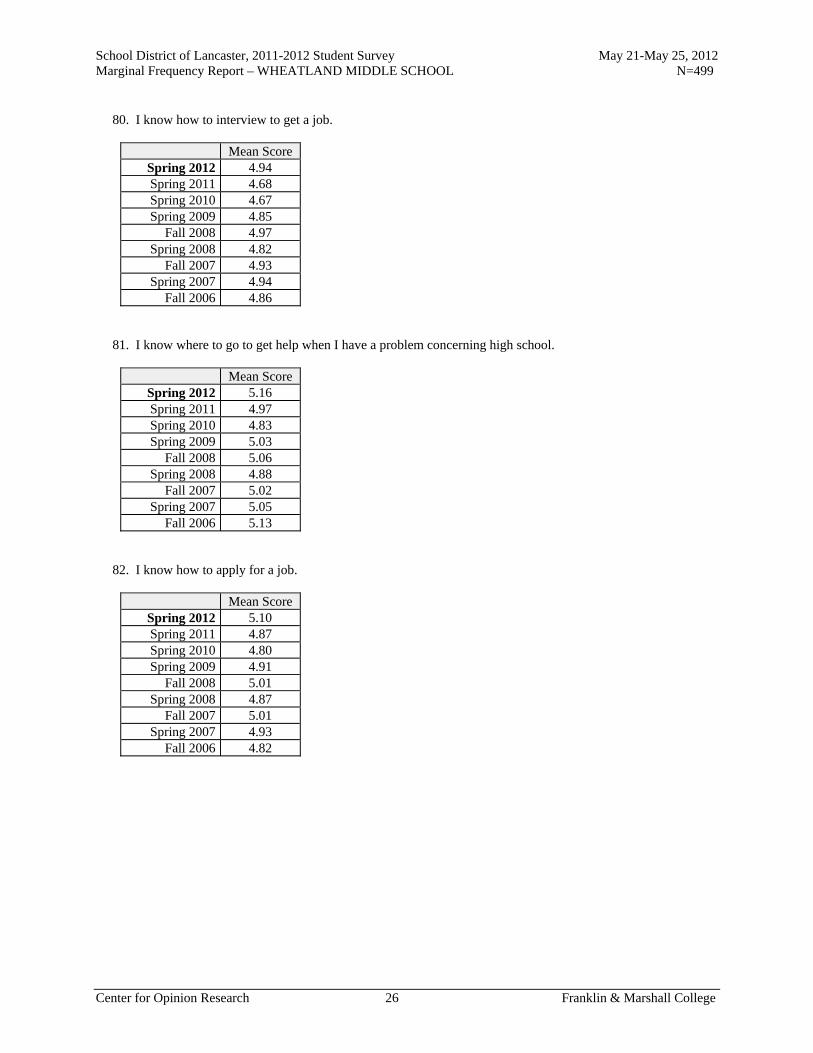
School District of Lancaster, 2011-2012 Student Survey May 21-May 25, 2012 Marginal Frequency Report – WHEATLAND MIDDLE SCHOOL N=499
Center for Opinion Research 26 Franklin & Marshall College
80. I know how to interview to get a job.
Mean Score Spring 2012 4.94 Spring 2011 4.68 Spring 2010 4.67 Spring 2009 4.85
Fall 2008 4.97 Spring 2008 4.82
Fall 2007 4.93 Spring 2007 4.94
Fall 2006 4.86 81. I know where to go to get help when I have a problem concerning high school.
Mean Score Spring 2012 5.16 Spring 2011 4.97 Spring 2010 4.83 Spring 2009 5.03
Fall 2008 5.06 Spring 2008 4.88
Fall 2007 5.02 Spring 2007 5.05
Fall 2006 5.13 82. I know how to apply for a job.
Mean Score Spring 2012 5.10 Spring 2011 4.87 Spring 2010 4.80 Spring 2009 4.91
Fall 2008 5.01 Spring 2008 4.87
Fall 2007 5.01 Spring 2007 4.93
Fall 2006 4.82

School District of Lancaster, 2011-2012 Student Survey May 21-May 25, 2012 Marginal Frequency Report – WHEATLAND MIDDLE SCHOOL N=499
Center for Opinion Research 27 Franklin & Marshall College
83. I know how to start and finish my assignments well.
Mean Score Spring 2012 5.42 Spring 2011 5.38 Spring 2010 5.26 Spring 2009 5.41
Fall 2008 5.35 Spring 2008 5.29
Fall 2007 5.44 Spring 2007 5.35
Fall 2006 5.36 Academic Aspirations 84. How far in school do you want to go?
Complete
high school
Attend vocational/technical
school
Attend 2-year college
Attend 4-year college
Attend 4-year college plus go to
grad school Spring 2012 9% 3% 17% 39% 32% Spring 2011 8% 2% 18% 42% 30% Spring 2010 13% 3% 17% 37% 30% Spring 2009 10% 4% 16% 41% 29%
Fall 2008 10% 5% 19% 36% 31% Spring 2008 9% 4% 18% 37% 32%
Fall 2007 11% 3% 18% 34% 34% Spring 2007 8% 5% 14% 35% 38%
Fall 2006 10% 3% 16% 31% 40% 85. How important do you believe getting a college education is to your future success? Would you say it is...
Very
important Somewhat important
Not very important
Not important at
all Spring 2012 79% 14% 3% 4% Spring 2011 84% 12% 3% 1% Spring 2010 85% 10% 2% 3% Spring 2009 87% 8% 3% 2%
Fall 2008 88% 9% 2% 2% Spring 2008 86% 11% 1% 2%
Fall 2007 86% 10% 2% 2% Spring 2007 88% 10% 1% 1%
Fall 2006 86% 12% 1% 1%

School District of Lancaster, 2011-2012 Student Survey May 21-May 25, 2012 Marginal Frequency Report – WHEATLAND MIDDLE SCHOOL N=499
Center for Opinion Research 28 Franklin & Marshall College
86. How important would your parent/guardian say getting a college education is to your future success? Would your parents say it is...
Very
important Somewhat important
Not very important
Not important at
all Spring 2012 82% 11% 3% 4% Spring 2011 86% 10% 2% 1% Spring 2010 87% 8% 3% 2% Spring 2009 91% 5% 1% 2%
Fall 2008 92% 5% 1% 2% Spring 2008 90% 7% 2% 2%
Fall 2007 90% 8% 1% 2% Spring 2007 91% 7% 2% 1%
Fall 2006 91% 7% 1% 1% 87. How important would your teachers say getting a college education is to your future success? Would your teachers say it is...
Very
important Somewhat important
Not very important
Not important at
all Spring 2012 80% 13% 4% 3% Spring 2011 82% 13% 2% 2% Spring 2010 86% 10% 2% 2% Spring 2009 84% 12% 2% 2%
Fall 2008 90% 8% 1% 1% Spring 2008 88% 8% 1% 2%
Fall 2007 87% 8% 2% 3% Spring 2007 87% 10% 1% 1%
Fall 2006 88% 10% 1% 1% 88. How far in school do you think you will get?
Won't finish high school
Will finish high school
Will get a GED
Will complete a
2-year Associate's
Degree
Will complete a
4-year Bachelor's
Degree
Will complete a Master's or Doctoral Degree
Spring 2012 2% 10% 7% 16% 35% 29% Spring 2011 2% 13% 7% 19% 35% 24% Spring 2010 3% 15% 8% 14% 34% 26% Spring 2009 3% 11% 7% 14% 34% 31%
Fall 2008 3% 13% 8% 17% 28% 31% Spring 2008 2% 13% 5% 16% 34% 30%
Fall 2007 4% 13% 8% 17% 27% 31% Spring 2007 1% 10% 5% 15% 33% 35%
Fall 2006 3% 17% 8% 12% 29% 31%

School District of Lancaster, 2011-2012 Student Survey May 21-May 25, 2012 Marginal Frequency Report – WHEATLAND MIDDLE SCHOOL N=499
Center for Opinion Research 29 Franklin & Marshall College
89. Has anyone from your school or GEAR UP ever spoken with you about college entrance requirements or the courses that you need to take in high school in order to prepare for college?
Yes No Spring 2012 67% 33% Spring 2011 54% 46% Spring 2010 54% 46% Spring 2009 54% 46%
Fall 2008 45% 55% Spring 2008 54% 46%
Fall 2007 54% 46% Spring 2007 69% 31%
Fall 2006 37% 63% 90. Has anyone from your school or GEAR UP ever spoken with you about the availability of financial aid to help you pay for college?
Yes No Spring 2012 52% 48% Spring 2011 36% 64% Spring 2010 30% 70% Spring 2009 41% 59%
Fall 2008 40% 60% Spring 2008 38% 62%
Fall 2007 45% 55% Spring 2007 61% 39%
Fall 2006 28% 72% 91. Do you think that you could afford to attend a public 4-year college (for example, Millersville University) using financial aid, scholarships, and your family's resources?
Definitely Probably Not Sure Probably
Not Definitely
Not Spring 2012 26% 37% 26% 4% 6% Spring 2011 25% 38% 27% 6% 4% Spring 2010 26% 34% 29% 6% 5% Spring 2009 26% 39% 25% 6% 4%
Fall 2008 28% 38% 26% 4% 4% Spring 2008 25% 38% 29% 6% 3%
Fall 2007 30% 37% 24% 4% 5% Spring 2007 33% 36% 24% 5% 2%
Fall 2006 29% 40% 24% 5% 2% 92. On a scale of 1 to 5, to what extent are you knowledgeable about financial aid and the cost and benefits to you in pursuing postsecondary education?
Mean Score Spring 2012 3.30

School District of Lancaster, 2011-2012 Student Survey May 21-May 25, 2012 Marginal Frequency Report – WHEATLAND MIDDLE SCHOOL N=499
Center for Opinion Research 30 Franklin & Marshall College
Social & Emotional Development Do you agree or disagree with the following statements? Please give your answers based on how things have been for you over the last six months. 93. I try to be nice to other people. I care about their feelings.
Really Agree
Kind of Agree
Kind of Disagree
Really Disagree
Spring 2012 40% 46% 10% 4% Spring 2011 37% 48% 10% 4% Spring 2010 32% 47% 15% 6% Spring 2009 39% 43% 12% 6%
Fall 2008 43% 42% 10% 5% Spring 2008 39% 48% 8% 5%
Fall 2007 46% 40% 9% 6% Spring 2007 39% 46% 9% 6%
Fall 2006 47% 38% 12% 3% 94. I am restless. I cannot stay still for too long.
Really Agree
Kind of Agree
Kind of Disagree
Really Disagree
Spring 2012 28% 34% 26% 12% Spring 2011 33% 32% 22% 14% Spring 2010 28% 36% 23% 13% Spring 2009 26% 35% 24% 15%
Fall 2008 31% 33% 20% 15% Spring 2008 28% 34% 23% 14%
Fall 2007 34% 32% 20% 15% Spring 2007 32% 33% 22% 13%
Fall 2006 34% 32% 20% 14% 95. I get a lot of headaches, stomach-aches or sickness.
Really Agree
Kind of Agree
Kind of Disagree
Really Disagree
Spring 2012 14% 22% 34% 30% Spring 2011 12% 23% 34% 31% Spring 2010 11% 25% 32% 33% Spring 2009 12% 20% 36% 32%
Fall 2008 15% 22% 31% 32% Spring 2008 12% 24% 33% 31%
Fall 2007 16% 28% 29% 28% Spring 2007 14% 25% 29% 32%
Fall 2006 17% 21% 28% 34%

School District of Lancaster, 2011-2012 Student Survey May 21-May 25, 2012 Marginal Frequency Report – WHEATLAND MIDDLE SCHOOL N=499
Center for Opinion Research 31 Franklin & Marshall College
96. I usually share with others, for example CD's, games, food.
Really Agree
Kind of Agree
Kind of Disagree
Really Disagree
Spring 2012 26% 44% 18% 13% Spring 2011 22% 48% 18% 12% Spring 2010 19% 44% 22% 14% Spring 2009 28% 41% 20% 11%
Fall 2008 30% 42% 18% 10% Spring 2008 34% 40% 16% 10%
Fall 2007 37% 38% 14% 11% Spring 2007 38% 41% 15% 6%
Fall 2006 37% 43% 14% 6% 97. I get very angry and often lose my temper.
Really Agree
Kind of Agree
Kind of Disagree
Really Disagree
Spring 2012 25% 28% 31% 16% Spring 2011 23% 23% 30% 25% Spring 2010 23% 25% 29% 22% Spring 2009 18% 26% 31% 25%
Fall 2008 21% 26% 30% 24% Spring 2008 25% 29% 28% 17%
Fall 2007 22% 29% 26% 23% Spring 2007 26% 29% 28% 17%
Fall 2006 29% 25% 25% 20% 98. I would rather be alone than with people of my age.
Really Agree
Kind of Agree
Kind of Disagree
Really Disagree
Spring 2012 10% 23% 31% 36% Spring 2011 13% 16% 30% 41% Spring 2010 11% 21% 32% 36% Spring 2009 9% 17% 30% 44%
Fall 2008 12% 19% 26% 43% Spring 2008 12% 20% 23% 45%
Fall 2007 13% 18% 25% 44% Spring 2007 11% 16% 26% 46%
Fall 2006 12% 18% 24% 46%

School District of Lancaster, 2011-2012 Student Survey May 21-May 25, 2012 Marginal Frequency Report – WHEATLAND MIDDLE SCHOOL N=499
Center for Opinion Research 32 Franklin & Marshall College
99. I usually do as I am told.
Really Agree
Kind of Agree
Kind of Disagree
Really Disagree
Spring 2012 30% 41% 22% 8% Spring 2011 30% 43% 20% 7% Spring 2010 27% 43% 23% 7% Spring 2009 29% 45% 18% 8%
Fall 2008 30% 48% 17% 5% Spring 2008 31% 45% 18% 6%
Fall 2007 36% 42% 16% 6% Spring 2007 28% 46% 21% 4%
Fall 2006 30% 49% 18% 3% 100. I worry a lot.
Really Agree
Kind of Agree
Kind of Disagree
Really Disagree
Spring 2012 17% 35% 30% 18% Spring 2011 19% 24% 35% 22% Spring 2010 18% 27% 31% 24% Spring 2009 20% 22% 33% 25%
Fall 2008 18% 26% 29% 27% Spring 2008 16% 28% 33% 24%
Fall 2007 23% 28% 29% 20% Spring 2007 20% 31% 29% 20%
Fall 2006 21% 30% 30% 18% 101. I am helpful if someone is hurt, upset, or feeling ill.
Really Agree
Kind of Agree
Kind of Disagree
Really Disagree
Spring 2012 44% 38% 12% 7% Spring 2011 40% 39% 16% 5% Spring 2010 34% 45% 14% 6% Spring 2009 38% 43% 13% 6%
Fall 2008 37% 43% 14% 6% Spring 2008 35% 45% 14% 6%
Fall 2007 41% 38% 16% 5% Spring 2007 43% 43% 10% 4%
Fall 2006 45% 38% 12% 5%

School District of Lancaster, 2011-2012 Student Survey May 21-May 25, 2012 Marginal Frequency Report – WHEATLAND MIDDLE SCHOOL N=499
Center for Opinion Research 33 Franklin & Marshall College
102. I am constantly moving or squirming.
Really Agree
Kind of Agree
Kind of Disagree
Really Disagree
Spring 2012 24% 34% 30% 12% Spring 2011 21% 32% 28% 19% Spring 2010 18% 27% 34% 21% Spring 2009 19% 34% 28% 20%
Fall 2008 23% 30% 26% 21% Spring 2008 22% 34% 27% 17%
Fall 2007 26% 28% 28% 19% Spring 2007 21% 30% 32% 18%
Fall 2006 23% 33% 26% 18% 103. I have one good friend or more.
Really Agree
Kind of Agree
Kind of Disagree
Really Disagree
Spring 2012 70% 22% 4% 4% Spring 2011 79% 14% 3% 3% Spring 2010 66% 21% 7% 6% Spring 2009 71% 19% 5% 5%
Fall 2008 73% 18% 4% 5% Spring 2008 70% 17% 7% 5%
Fall 2007 72% 18% 6% 4% Spring 2007 74% 18% 4% 4%
Fall 2006 76% 15% 5% 4% 104. I fight a lot. I can make other people do what I want.
Really Agree
Kind of Agree
Kind of Disagree
Really Disagree
Spring 2012 5% 20% 38% 38% Spring 2011 5% 15% 28% 52% Spring 2010 8% 16% 29% 48% Spring 2009 5% 16% 31% 48%
Fall 2008 7% 14% 33% 46% Spring 2008 6% 14% 36% 44%
Fall 2007 7% 16% 29% 48% Spring 2007 7% 17% 31% 44%
Fall 2006 8% 18% 30% 44%

School District of Lancaster, 2011-2012 Student Survey May 21-May 25, 2012 Marginal Frequency Report – WHEATLAND MIDDLE SCHOOL N=499
Center for Opinion Research 34 Franklin & Marshall College
105. I am often unhappy, depressed, or tearful.
Really Agree
Kind of Agree
Kind of Disagree
Really Disagree
Spring 2012 10% 21% 31% 38% Spring 2011 8% 18% 30% 44% Spring 2010 11% 20% 26% 43% Spring 2009 7% 18% 29% 46%
Fall 2008 9% 15% 26% 49% Spring 2008 11% 18% 26% 45%
Fall 2007 14% 19% 25% 42% Spring 2007 14% 20% 23% 43%
Fall 2006 14% 20% 26% 40% 106. Other people my age generally like me.
Really Agree
Kind of Agree
Kind of Disagree
Really Disagree
Spring 2012 37% 40% 17% 6% Spring 2011 38% 42% 13% 6% Spring 2010 30% 45% 16% 9% Spring 2009 38% 42% 13% 7%
Fall 2008 39% 44% 11% 6% Spring 2008 42% 39% 15% 4%
Fall 2007 40% 40% 11% 9% Spring 2007 39% 41% 15% 6%
Fall 2006 40% 40% 15% 5% 107. I easily lose my focus. I find it difficult to concentrate.
Really Agree
Kind of Agree
Kind of Disagree
Really Disagree
Spring 2012 23% 33% 29% 15% Spring 2011 21% 32% 28% 18% Spring 2010 22% 34% 26% 17% Spring 2009 21% 29% 27% 24%
Fall 2008 22% 31% 26% 21% Spring 2008 24% 29% 29% 19%
Fall 2007 23% 31% 27% 19% Spring 2007 20% 31% 27% 22%
Fall 2006 22% 27% 34% 18%

School District of Lancaster, 2011-2012 Student Survey May 21-May 25, 2012 Marginal Frequency Report – WHEATLAND MIDDLE SCHOOL N=499
Center for Opinion Research 35 Franklin & Marshall College
108. I am nervous in new situations. I easily lose confidence.
Really Agree
Kind of Agree
Kind of Disagree
Really Disagree
Spring 2012 19% 34% 29% 17% Spring 2011 19% 21% 37% 23% Spring 2010 19% 30% 26% 24% Spring 2009 16% 26% 31% 27%
Fall 2008 19% 27% 28% 26% Spring 2008 18% 34% 28% 20%
Fall 2007 21% 28% 28% 24% Spring 2007 16% 30% 32% 22%
Fall 2006 19% 28% 31% 22% 109. I am kind to younger children.
Really Agree
Kind of Agree
Kind of Disagree
Really Disagree
Spring 2012 53% 30% 11% 6% Spring 2011 56% 33% 7% 5% Spring 2010 56% 31% 9% 5% Spring 2009 64% 28% 4% 4%
Fall 2008 62% 28% 6% 4% Spring 2008 56% 30% 9% 5%
Fall 2007 57% 28% 10% 5% Spring 2007 54% 30% 10% 5%
Fall 2006 54% 31% 9% 6% 110. I am often accused of lying or cheating.
Really Agree
Kind of Agree
Kind of Disagree
Really Disagree
Spring 2012 13% 23% 28% 36% Spring 2011 11% 17% 28% 45% Spring 2010 13% 22% 27% 37% Spring 2009 10% 17% 28% 45%
Fall 2008 11% 18% 28% 43% Spring 2008 11% 19% 32% 38%
Fall 2007 14% 20% 26% 40% Spring 2007 14% 22% 26% 38%
Fall 2006 16% 19% 27% 38%

School District of Lancaster, 2011-2012 Student Survey May 21-May 25, 2012 Marginal Frequency Report – WHEATLAND MIDDLE SCHOOL N=499
Center for Opinion Research 36 Franklin & Marshall College
111. Other children or young people pick on me or bully me.
Really Agree
Kind of Agree
Kind of Disagree
Really Disagree
Spring 2012 10% 16% 24% 50% Spring 2011 8% 11% 20% 60% Spring 2010 8% 13% 20% 58% Spring 2009 8% 12% 19% 61%
Fall 2008 8% 13% 20% 58% Spring 2008 6% 16% 21% 57%
Fall 2007 13% 12% 18% 57% Spring 2007 10% 15% 23% 51%
Fall 2006 10% 16% 19% 56% 112. I often offer to help others (parents, teachers, children).
Really Agree
Kind of Agree
Kind of Disagree
Really Disagree
Spring 2012 40% 39% 15% 6% Spring 2011 34% 44% 14% 8% Spring 2010 31% 47% 16% 6% Spring 2009 39% 42% 14% 6%
Fall 2008 38% 41% 14% 8% Spring 2008 34% 45% 16% 6%
Fall 2007 45% 34% 15% 6% Spring 2007 36% 44% 16% 5%
Fall 2006 37% 42% 14% 6% 113. I think before I do things.
Really Agree
Kind of Agree
Kind of Disagree
Really Disagree
Spring 2012 25% 40% 25% 10% Spring 2011 28% 40% 26% 7% Spring 2010 24% 42% 25% 9% Spring 2009 25% 43% 22% 10%
Fall 2008 28% 41% 22% 9% Spring 2008 22% 40% 28% 10%
Fall 2007 28% 40% 23% 9% Spring 2007 23% 42% 25% 10%
Fall 2006 25% 46% 19% 10%

School District of Lancaster, 2011-2012 Student Survey May 21-May 25, 2012 Marginal Frequency Report – WHEATLAND MIDDLE SCHOOL N=499
Center for Opinion Research 37 Franklin & Marshall College
114. I take things that are not mine from home, school, or elsewhere.
Really Agree
Kind of Agree
Kind of Disagree
Really Disagree
Spring 2012 4% 15% 23% 58% Spring 2011 4% 10% 23% 62% Spring 2010 6% 14% 21% 58% Spring 2009 5% 10% 19% 66%
Fall 2008 5% 12% 17% 66% Spring 2008 5% 13% 24% 58%
Fall 2007 8% 13% 17% 62% Spring 2007 5% 9% 21% 64%
Fall 2006 7% 10% 23% 61% 115. I get along better with adults than with people my own age.
Really Agree
Kind of Agree
Kind of Disagree
Really Disagree
Spring 2012 14% 30% 33% 23% Spring 2011 14% 21% 37% 29% Spring 2010 15% 24% 32% 30% Spring 2009 13% 22% 36% 29%
Fall 2008 14% 23% 34% 28% Spring 2008 10% 24% 34% 32%
Fall 2007 17% 19% 35% 30% Spring 2007 10% 22% 35% 33%
Fall 2006 12% 20% 35% 33% 116. I have many fears. I am easily scared.
Really Agree
Kind of Agree
Kind of Disagree
Really Disagree
Spring 2012 10% 19% 35% 37% Spring 2011 9% 15% 31% 45% Spring 2010 9% 18% 26% 47% Spring 2009 9% 14% 31% 47%
Fall 2008 11% 17% 30% 43% Spring 2008 8% 20% 27% 44%
Fall 2007 12% 20% 32% 36% Spring 2007 10% 16% 32% 43%
Fall 2006 10% 16% 32% 42%

School District of Lancaster, 2011-2012 Student Survey May 21-May 25, 2012 Marginal Frequency Report – WHEATLAND MIDDLE SCHOOL N=499
Center for Opinion Research 38 Franklin & Marshall College
117. I finish the work I'm doing. My attention is good.
Really Agree
Kind of Agree
Kind of Disagree
Really Disagree
Spring 2012 29% 41% 21% 8% Spring 2011 26% 41% 25% 8% Spring 2010 25% 37% 29% 8% Spring 2009 26% 41% 25% 8%
Fall 2008 30% 43% 20% 8% Spring 2008 25% 42% 24% 9%
Fall 2007 35% 39% 18% 8% Spring 2007 29% 40% 23% 8%
Fall 2006 35% 39% 20% 6% Perceptions of Police Do you agree or disagree with the following statements about police officers? 118. I respect police officers.
Really Agree
Kind of Agree
Kind of Disagree
Really Disagree
Spring 2012 62% 22% 10% 6% Spring 2011 62% 23% 7% 8% Spring 2010 61% 23% 7% 9% Spring 2009 61% 21% 11% 7%
Fall 2008 64% 23% 5% 7% Spring 2008 55% 27% 11% 7%
Fall 2007 60% 23% 10% 6% Spring 2007 53% 26% 12% 9%
Fall 2006 56% 28% 10% 6% 119. I am comfortable approaching police officers.
Really Agree
Kind of Agree
Kind of Disagree
Really Disagree
Spring 2012 44% 32% 15% 10% Spring 2011 48% 25% 18% 10% Spring 2010 46% 30% 13% 11% Spring 2009 45% 32% 15% 8%
Fall 2008 48% 30% 13% 8% Spring 2008 37% 32% 18% 13%
Fall 2007 43% 31% 17% 9% Spring 2007 38% 31% 19% 12%
Fall 2006 36% 35% 17% 11%

School District of Lancaster, 2011-2012 Student Survey May 21-May 25, 2012 Marginal Frequency Report – WHEATLAND MIDDLE SCHOOL N=499
Center for Opinion Research 39 Franklin & Marshall College
120. I would consider police work as a career.
Really Agree
Kind of Agree
Kind of Disagree
Really Disagree
Spring 2012 25% 22% 20% 33% Spring 2011 21% 20% 19% 40% Spring 2010 20% 21% 18% 41% Spring 2009 18% 18% 21% 42%
Fall 2008 25% 19% 18% 38% Spring 2008 25% 18% 20% 37%
Fall 2007 28% 23% 20% 29% Spring 2007 20% 19% 16% 45%
Fall 2006 22% 20% 18% 40% 121. In general, I do not trust the police.
Really Agree
Kind of Agree
Kind of Disagree
Really Disagree
Spring 2012 13% 22% 23% 42% Spring 2011 13% 16% 28% 43% Spring 2010 12% 19% 26% 43% Spring 2009 12% 18% 24% 46%
Fall 2008 12% 17% 21% 50% Spring 2008 14% 20% 25% 40%
Fall 2007 11% 20% 24% 45% Spring 2007 12% 21% 26% 41%
Fall 2006 12% 18% 26% 44% 122. Police do not belong in schools unless there has been a crime.
Really Agree
Kind of Agree
Kind of Disagree
Really Disagree
Spring 2012 19% 17% 31% 33% Spring 2011 22% 16% 28% 34% Spring 2010 17% 19% 26% 38% Spring 2009 17% 15% 28% 40%
Fall 2008 16% 18% 24% 42% Spring 2008 22% 22% 25% 30%
Fall 2007 18% 19% 26% 36% Spring 2007 22% 18% 27% 34%
Fall 2006 28% 23% 25% 24%
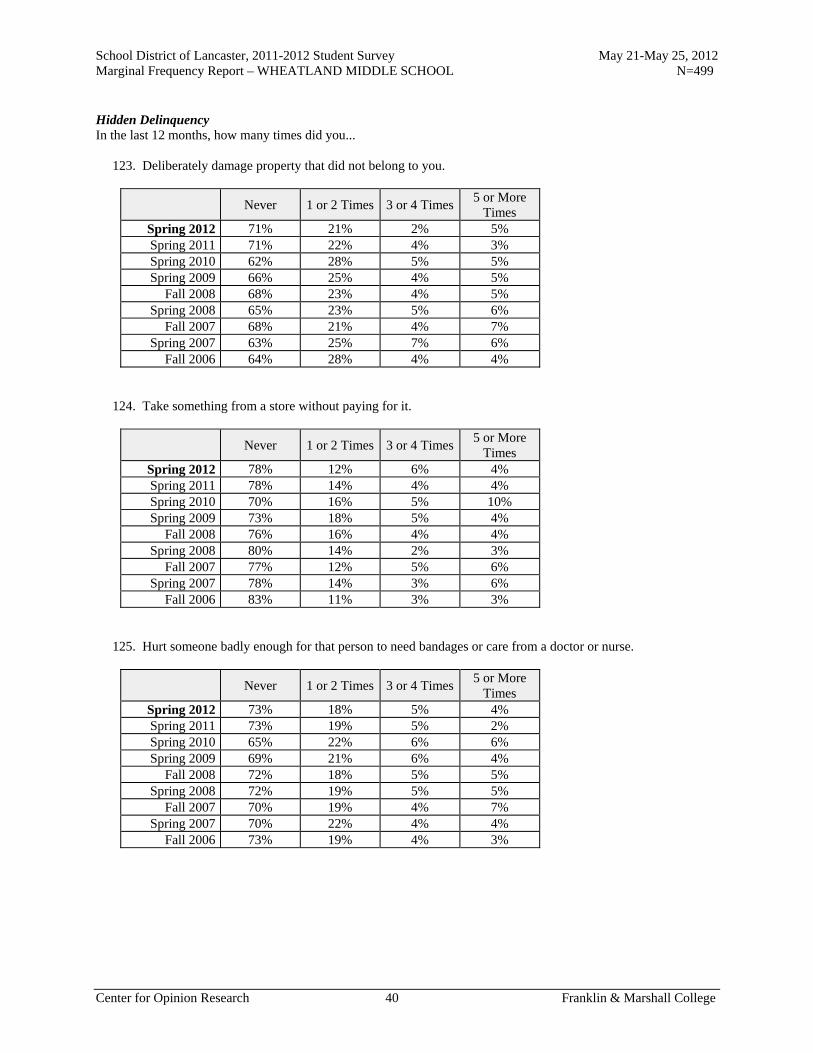
School District of Lancaster, 2011-2012 Student Survey May 21-May 25, 2012 Marginal Frequency Report – WHEATLAND MIDDLE SCHOOL N=499
Center for Opinion Research 40 Franklin & Marshall College
Hidden Delinquency In the last 12 months, how many times did you... 123. Deliberately damage property that did not belong to you.
Never 1 or 2 Times 3 or 4 Times5 or More
Times Spring 2012 71% 21% 2% 5% Spring 2011 71% 22% 4% 3% Spring 2010 62% 28% 5% 5% Spring 2009 66% 25% 4% 5%
Fall 2008 68% 23% 4% 5% Spring 2008 65% 23% 5% 6%
Fall 2007 68% 21% 4% 7% Spring 2007 63% 25% 7% 6%
Fall 2006 64% 28% 4% 4% 124. Take something from a store without paying for it.
Never 1 or 2 Times 3 or 4 Times5 or More
Times Spring 2012 78% 12% 6% 4% Spring 2011 78% 14% 4% 4% Spring 2010 70% 16% 5% 10% Spring 2009 73% 18% 5% 4%
Fall 2008 76% 16% 4% 4% Spring 2008 80% 14% 2% 3%
Fall 2007 77% 12% 5% 6% Spring 2007 78% 14% 3% 6%
Fall 2006 83% 11% 3% 3% 125. Hurt someone badly enough for that person to need bandages or care from a doctor or nurse.
Never 1 or 2 Times 3 or 4 Times5 or More
Times Spring 2012 73% 18% 5% 4% Spring 2011 73% 19% 5% 2% Spring 2010 65% 22% 6% 6% Spring 2009 69% 21% 6% 4%
Fall 2008 72% 18% 5% 5% Spring 2008 72% 19% 5% 5%
Fall 2007 70% 19% 4% 7% Spring 2007 70% 22% 4% 4%
Fall 2006 73% 19% 4% 3%
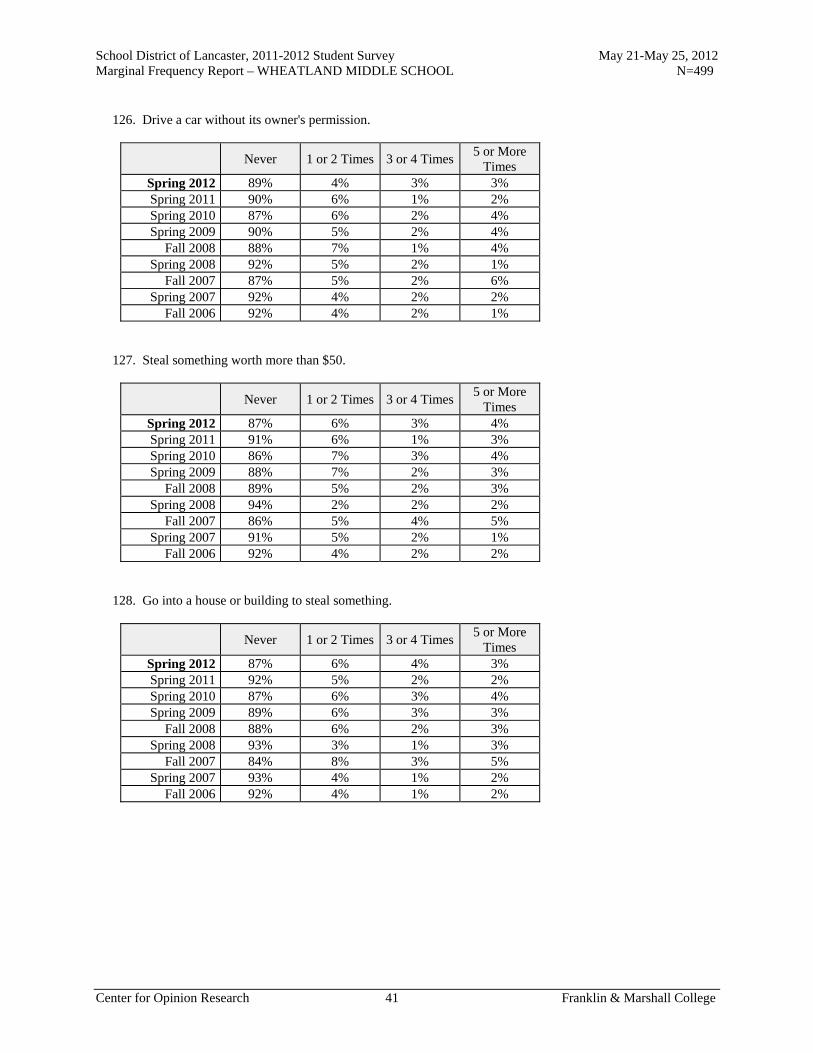
School District of Lancaster, 2011-2012 Student Survey May 21-May 25, 2012 Marginal Frequency Report – WHEATLAND MIDDLE SCHOOL N=499
Center for Opinion Research 41 Franklin & Marshall College
126. Drive a car without its owner's permission.
Never 1 or 2 Times 3 or 4 Times5 or More
Times Spring 2012 89% 4% 3% 3% Spring 2011 90% 6% 1% 2% Spring 2010 87% 6% 2% 4% Spring 2009 90% 5% 2% 4%
Fall 2008 88% 7% 1% 4% Spring 2008 92% 5% 2% 1%
Fall 2007 87% 5% 2% 6% Spring 2007 92% 4% 2% 2%
Fall 2006 92% 4% 2% 1% 127. Steal something worth more than $50.
Never 1 or 2 Times 3 or 4 Times5 or More
Times Spring 2012 87% 6% 3% 4% Spring 2011 91% 6% 1% 3% Spring 2010 86% 7% 3% 4% Spring 2009 88% 7% 2% 3%
Fall 2008 89% 5% 2% 3% Spring 2008 94% 2% 2% 2%
Fall 2007 86% 5% 4% 5% Spring 2007 91% 5% 2% 1%
Fall 2006 92% 4% 2% 2% 128. Go into a house or building to steal something.
Never 1 or 2 Times 3 or 4 Times5 or More
Times Spring 2012 87% 6% 4% 3% Spring 2011 92% 5% 2% 2% Spring 2010 87% 6% 3% 4% Spring 2009 89% 6% 3% 3%
Fall 2008 88% 6% 2% 3% Spring 2008 93% 3% 1% 3%
Fall 2007 84% 8% 3% 5% Spring 2007 93% 4% 1% 2%
Fall 2006 92% 4% 1% 2%

School District of Lancaster, 2011-2012 Student Survey May 21-May 25, 2012 Marginal Frequency Report – WHEATLAND MIDDLE SCHOOL N=499
Center for Opinion Research 42 Franklin & Marshall College
129. Use or threaten to use a weapon to get something from someone.
Never 1 or 2 Times 3 or 4 Times5 or More
Times Spring 2012 85% 6% 4% 4% Spring 2011 90% 6% 1% 2% Spring 2010 83% 9% 3% 5% Spring 2009 86% 8% 2% 4%
Fall 2008 88% 6% 2% 4% Spring 2008 90% 6% 2% 2%
Fall 2007 84% 8% 3% 5% Spring 2007 89% 7% 2% 2%
Fall 2006 92% 5% 2% 2% 130. Steal something worth less than $50.
Never 1 or 2 Times 3 or 4 Times5 or More
Times Spring 2012 76% 16% 3% 4% Spring 2011 76% 18% 3% 4% Spring 2010 70% 17% 4% 9% Spring 2009 74% 18% 4% 4%
Fall 2008 75% 18% 2% 4% Spring 2008 79% 15% 2% 4%
Fall 2007 78% 12% 4% 6% Spring 2007 76% 18% 2% 4%
Fall 2006 81% 15% 1% 2% 131. Take part in a fight where a group of your friends is against another group.
Never 1 or 2 Times 3 or 4 Times5 or More
Times Spring 2012 70% 18% 7% 5% Spring 2011 75% 16% 4% 5% Spring 2010 68% 18% 6% 8% Spring 2009 70% 17% 5% 8%
Fall 2008 71% 20% 4% 5% Spring 2008 73% 18% 4% 5%
Fall 2007 74% 13% 7% 6% Spring 2007 70% 21% 4% 5%
Fall 2006 70% 20% 5% 5%

School District of Lancaster, 2011-2012 Student Survey May 21-May 25, 2012 Marginal Frequency Report – WHEATLAND MIDDLE SCHOOL N=499
Center for Opinion Research 43 Franklin & Marshall College
132. Act loudly, rowdy, or out of control in a public place.
Never 1 or 2 Times 3 or 4 Times5 or More
Times Spring 2012 55% 24% 7% 14% Spring 2011 54% 27% 8% 11% Spring 2010 52% 27% 8% 14% Spring 2009 56% 27% 8% 9%
Fall 2008 63% 22% 6% 8% Spring 2008 55% 26% 8% 11%
Fall 2007 62% 22% 6% 10% Spring 2007 51% 30% 9% 11%
Fall 2006 62% 22% 7% 10% Drug & Alcohol Use On how many occasions (if any) have you... 133. Had beer, wine, or hard liquor in your lifetime?
0 1 or 2 Times
3 to 5 Times
6 to 9 Times
10 to 19 Times
20 to 39 Times
40 or More Times
Spring 2012 53% 21% 12% 3% 4% 2% 5% Spring 2011 54% 22% 9% 8% 3% 2% 2% Spring 2010 49% 26% 10% 6% 2% 1% 6% Spring 2009 49% 26% 10% 5% 3% 2% 5%
Fall 2008 60% 22% 9% 2% 2% 1% 4% Spring 2008 56% 23% 10% 4% 4% 1% 2%
Fall 2007 57% 19% 9% 4% 3% 1% 7% Spring 2007 47% 28% 11% 5% 4% 2% 4%
Fall 2006 56% 26% 7% 4% 4% 1% 2% 134. Had beer, wine, or hard liquor during the past 30 days?
0 1 or 2 Times
3 to 5 Times
6 to 9 Times
10 to 19 Times
20 to 39 Times
40 or More Times
Spring 2012 79% 10% 4% 2% 1% 1% 3% Spring 2011 86% 9% 3% 1% 1% 0% 0% Spring 2010 78% 12% 3% 1% 1% 0% 4% Spring 2009 82% 10% 2% 2% 0% 0% 3%
Fall 2008 85% 8% 2% 1% 1% 0% 2% Spring 2008 86% 9% 3% 1% 0% 0% 1%
Fall 2007 80% 9% 4% 2% 2% 1% 3% Spring 2007 83% 10% 3% 1% 1% 0% 2%
Fall 2006 89% 7% 2% 1% 1% 0% 1%
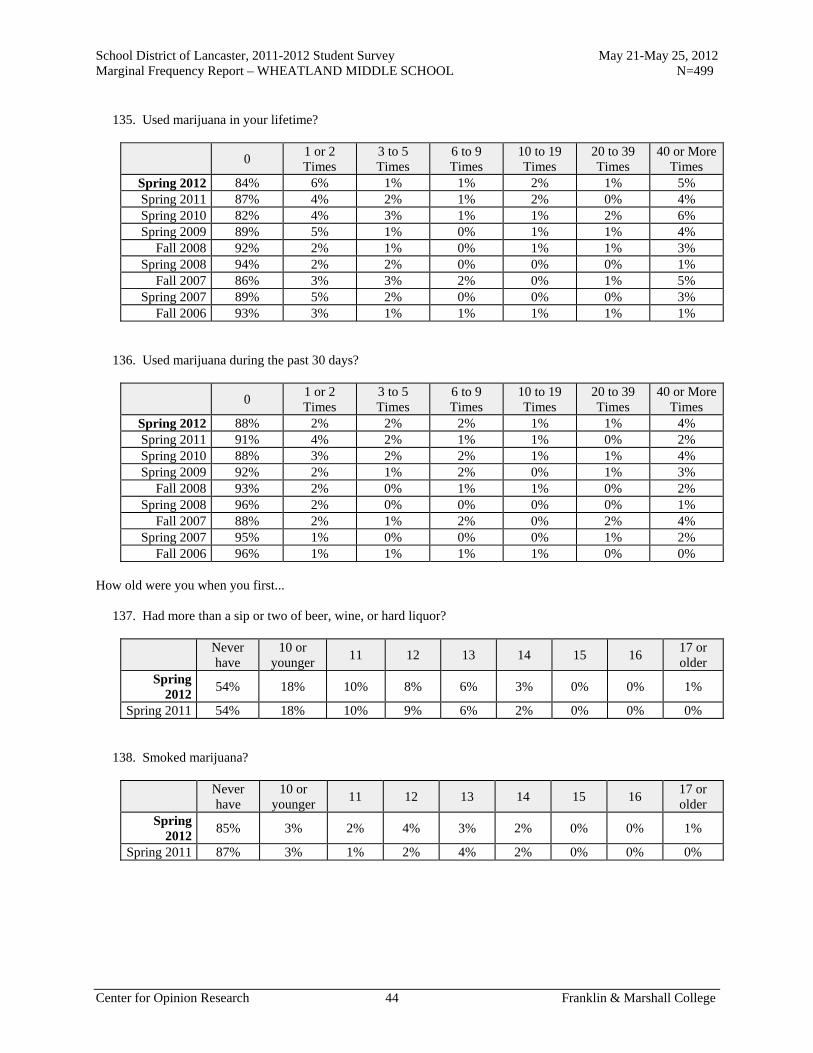
School District of Lancaster, 2011-2012 Student Survey May 21-May 25, 2012 Marginal Frequency Report – WHEATLAND MIDDLE SCHOOL N=499
Center for Opinion Research 44 Franklin & Marshall College
135. Used marijuana in your lifetime?
0 1 or 2 Times
3 to 5 Times
6 to 9 Times
10 to 19 Times
20 to 39 Times
40 or More Times
Spring 2012 84% 6% 1% 1% 2% 1% 5% Spring 2011 87% 4% 2% 1% 2% 0% 4% Spring 2010 82% 4% 3% 1% 1% 2% 6% Spring 2009 89% 5% 1% 0% 1% 1% 4%
Fall 2008 92% 2% 1% 0% 1% 1% 3% Spring 2008 94% 2% 2% 0% 0% 0% 1%
Fall 2007 86% 3% 3% 2% 0% 1% 5% Spring 2007 89% 5% 2% 0% 0% 0% 3%
Fall 2006 93% 3% 1% 1% 1% 1% 1% 136. Used marijuana during the past 30 days?
0 1 or 2 Times
3 to 5 Times
6 to 9 Times
10 to 19 Times
20 to 39 Times
40 or More Times
Spring 2012 88% 2% 2% 2% 1% 1% 4% Spring 2011 91% 4% 2% 1% 1% 0% 2% Spring 2010 88% 3% 2% 2% 1% 1% 4% Spring 2009 92% 2% 1% 2% 0% 1% 3%
Fall 2008 93% 2% 0% 1% 1% 0% 2% Spring 2008 96% 2% 0% 0% 0% 0% 1%
Fall 2007 88% 2% 1% 2% 0% 2% 4% Spring 2007 95% 1% 0% 0% 0% 1% 2%
Fall 2006 96% 1% 1% 1% 1% 0% 0% How old were you when you first... 137. Had more than a sip or two of beer, wine, or hard liquor?
Never have
10 or younger
11 12 13 14 15 16 17 or older
Spring 2012
54% 18% 10% 8% 6% 3% 0% 0% 1%
Spring 2011 54% 18% 10% 9% 6% 2% 0% 0% 0% 138. Smoked marijuana?
Never have
10 or younger
11 12 13 14 15 16 17 or older
Spring 2012
85% 3% 2% 4% 3% 2% 0% 0% 1%
Spring 2011 87% 3% 1% 2% 4% 2% 0% 0% 0%

School District of Lancaster, 2011-2012 Student Survey May 21-May 25, 2012 Marginal Frequency Report – WHEATLAND MIDDLE SCHOOL N=499
Center for Opinion Research 45 Franklin & Marshall College
139. Have you ever used smokeless tobacco (chew, snuff, plug, dipping tobacco, chewing tobacco)?
Never Once or
twice
Once in a while but
not regularly
Regularly in the past
Regularly now
Spring 2012 93% 3% 0% 0% 3% Spring 2011 96% 2% 1% 0% 1% Spring 2010 91% 3% 2% 1% 2% Spring 2009 93% 4% 1% 0% 2%
Fall 2008 94% 3% 1% 0% 2% 140. How frequently have you used smokeless tobacco during the past 30 days?
Never Once or
twice
Once or twice per
week
About once a day
More than once a day
Spring 2012 94% 1% 0% 0% 3% Spring 2011 98% 1% 0% 0% 1% Spring 2010 94% 2% 2% 0% 3% Spring 2009 95% 1% 0% 1% 2%
Fall 2008 96% 1% 0% 0% 2% 141. Have you ever smoked cigarettes?
Never Once or
twice
Once in a while but
not regularly
Regularly in the past
Regularly now
Spring 2012 84% 9% 3% 1% 3% Spring 2011 85% 10% 3% 1% 1% Spring 2010 81% 11% 3% 2% 4% Spring 2009 82% 10% 2% 2% 3%
Fall 2008 88% 6% 2% 1% 3% 142. How frequently have you smoked cigarettes during the past 30 days?
Not at all
Less than one
cigarette per day
One to five cigarettes per day
About one-half pack per day
About one pack per
day
About one and one-
half packs per day
Two packs or more per
day
Spring 2012 92% 3% 1% 1% 0% 1% 2% Spring 2011 96% 2% 0% 0% 0% 0% 1% Spring 2010 92% 3% 1% 1% 1% 1% 2% Spring 2009 93% 3% 1% 1% 0% 0% 2%
Fall 2008 94% 2% 1% 0% 0% 0% 2%

School District of Lancaster, 2011-2012 Student Survey May 21-May 25, 2012 Marginal Frequency Report – WHEATLAND MIDDLE SCHOOL N=499
Center for Opinion Research 46 Franklin & Marshall College
Bullying & Violence In the past 12 months, how often have you... 143. Been threatened to be hit or beaten up on school property?
Never Once 2 or 3 Times 4 or 5 Times 6 to 9 Times 10 Times or
More Spring 2012 71% 15% 8% 3% 1% 3% Spring 2011 67% 15% 10% 3% 1% 4% Spring 2010 66% 17% 7% 3% 2% 5% Spring 2009 69% 17% 7% 2% 1% 4%
Fall 2008 73% 17% 5% 1% 1% 3% Spring 2008 70% 16% 6% 2% 1% 5%
Fall 2007 72% 14% 5% 2% 2% 6% Spring 2007 62% 21% 7% 3% 2% 6%
Fall 2006 63% 17% 9% 4% 1% 7% 144. Been attacked and hit by someone, or beaten up, on school property?
Never Once 2 or 3 Times 4 or 5 Times 6 to 9 Times 10 Times or
More Spring 2012 82% 8% 4% 2% 1% 3% Spring 2011 82% 8% 5% 1% 0% 3% Spring 2010 80% 10% 4% 2% 0% 3% Spring 2009 80% 11% 4% 1% 1% 3%
Fall 2008 85% 8% 3% 2% 1% 2% Spring 2008 87% 5% 3% 1% 1% 2%
Fall 2007 81% 8% 4% 2% 2% 4% Spring 2007 85% 8% 4% 1% 0% 3%
Fall 2006 82% 11% 3% 1% 1% 2% 145. Been threatened by someone with a weapon on school property?
Never Once 2 or 3 Times 4 or 5 Times 6 to 9 Times 10 Times or
More Spring 2012 86% 7% 1% 2% 1% 3% Spring 2011 90% 6% 1% 1% 0% 2% Spring 2010 88% 4% 3% 2% 1% 2% Spring 2009 89% 6% 2% 1% 0% 2%
Fall 2008 92% 5% 1% 0% 0% 1% Spring 2008 91% 4% 1% 2% 0% 2%
Fall 2007 86% 4% 3% 2% 1% 4% Spring 2007 86% 7% 2% 2% 0% 2%
Fall 2006 90% 5% 1% 1% 0% 2%
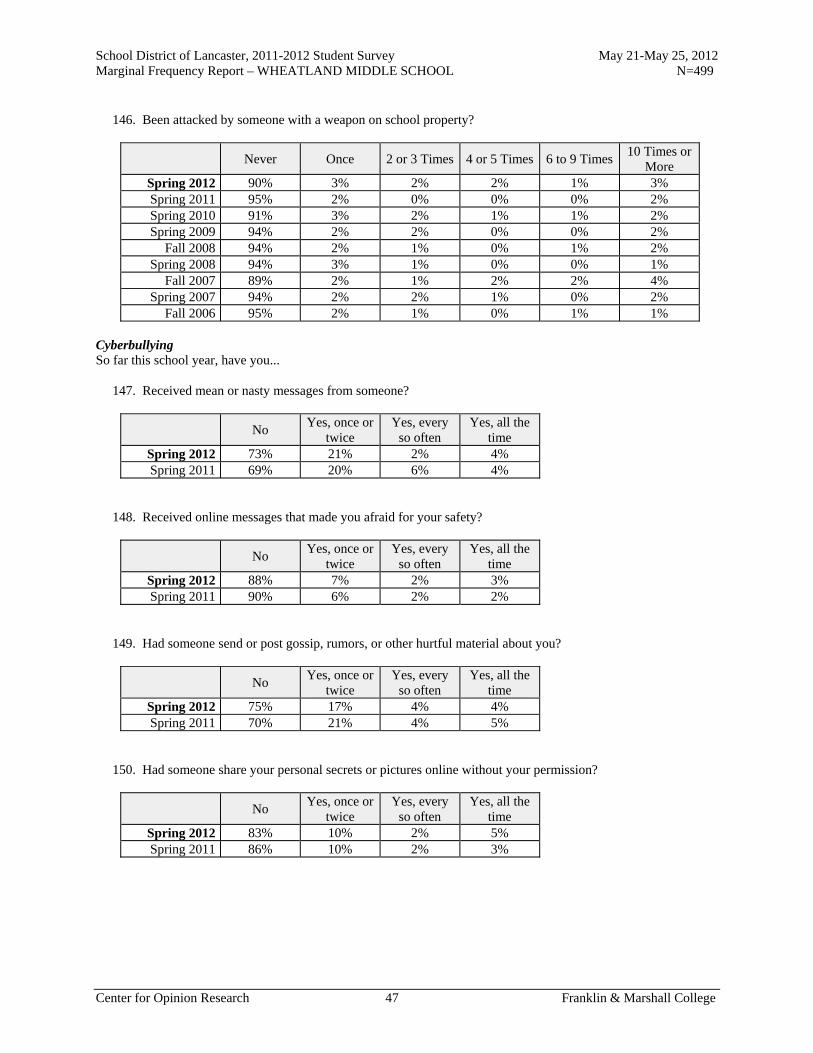
School District of Lancaster, 2011-2012 Student Survey May 21-May 25, 2012 Marginal Frequency Report – WHEATLAND MIDDLE SCHOOL N=499
Center for Opinion Research 47 Franklin & Marshall College
146. Been attacked by someone with a weapon on school property?
Never Once 2 or 3 Times 4 or 5 Times 6 to 9 Times 10 Times or
More Spring 2012 90% 3% 2% 2% 1% 3% Spring 2011 95% 2% 0% 0% 0% 2% Spring 2010 91% 3% 2% 1% 1% 2% Spring 2009 94% 2% 2% 0% 0% 2%
Fall 2008 94% 2% 1% 0% 1% 2% Spring 2008 94% 3% 1% 0% 0% 1%
Fall 2007 89% 2% 1% 2% 2% 4% Spring 2007 94% 2% 2% 1% 0% 2%
Fall 2006 95% 2% 1% 0% 1% 1% Cyberbullying So far this school year, have you... 147. Received mean or nasty messages from someone?
No Yes, once or
twice Yes, every
so often Yes, all the
time Spring 2012 73% 21% 2% 4% Spring 2011 69% 20% 6% 4%
148. Received online messages that made you afraid for your safety?
No Yes, once or
twice Yes, every
so often Yes, all the
time Spring 2012 88% 7% 2% 3% Spring 2011 90% 6% 2% 2%
149. Had someone send or post gossip, rumors, or other hurtful material about you?
No Yes, once or
twice Yes, every
so often Yes, all the
time Spring 2012 75% 17% 4% 4% Spring 2011 70% 21% 4% 5%
150. Had someone share your personal secrets or pictures online without your permission?
No Yes, once or
twice Yes, every
so often Yes, all the
time Spring 2012 83% 10% 2% 5% Spring 2011 86% 10% 2% 3%

School District of Lancaster, 2011-2012 Student Survey May 21-May 25, 2012 Marginal Frequency Report – WHEATLAND MIDDLE SCHOOL N=499
Center for Opinion Research 48 Franklin & Marshall College
151. Do you use the Internet at home, or not?
Yes No Spring 2012 93% 7% Spring 2011 93% 7%
152. How many hours do you normally spend online using the Internet each day?
Less than 1
hour 1 hour 2 hours 3 hours
4 or more hours
Spring 2012 27% 14% 19% 15% 25% Spring 2011 21% 17% 25% 12% 25%
Report U
Marginal Frequency Report Total High School Sample

School District of Lancaster, 2011-2012 Student Survey May 21-25, 2012 Marginal Frequency Report – Total Sample High School Students N=1808
Center for Opinion Research 1 Franklin & Marshall College
School Climate Do you agree or disagree with the following statements? 1. I feel safe at this school.
Really Agree
Kind of Agree
Kind of Disagree
Really Disagree
Spring 2012 37% 47% 9% 7% Spring 2011 28% 46% 15% 11% Spring 2010 30% 46% 14% 10% Spring 2009 26% 48% 15% 10%
Fall 2008 28% 52% 13% 6% Spring 2008 28% 53% 14% 5%
Fall 2007 29% 50% 14% 7% Spring 2007 18% 53% 19% 9%
Fall 2006 34% 50% 13% 4% 2. I feel safe going to and from school.
Really Agree
Kind of Agree
Kind of Disagree
Really Disagree
Spring 2012 42% 39% 12% 6% Spring 2011 36% 43% 12% 10% Spring 2010 37% 40% 14% 9% Spring 2009 35% 43% 13% 8%
Fall 2008 39% 42% 13% 6% Spring 2008 38% 45% 12% 4%
Fall 2007 42% 41% 12% 6% Spring 2007 34% 44% 16% 6%
Fall 2006 43% 42% 11% 4% 3. Students get along well with each other.
Really Agree
Kind of Agree
Kind of Disagree
Really Disagree
Spring 2012 12% 43% 32% 13% Spring 2011 9% 40% 33% 18% Spring 2010 9% 39% 34% 18% Spring 2009 8% 41% 31% 20%
Fall 2008 11% 44% 33% 12% Spring 2008 9% 46% 33% 13%
Fall 2007 9% 45% 33% 13% Spring 2007 5% 42% 37% 16%
Fall 2006 8% 45% 33% 13%

School District of Lancaster, 2011-2012 Student Survey May 21-25, 2012 Marginal Frequency Report – Total Sample High School Students N=1808
Center for Opinion Research 2 Franklin & Marshall College
4. Students get along well with teachers.
Really Agree
Kind of Agree
Kind of Disagree
Really Disagree
Spring 2012 15% 43% 30% 13% Spring 2011 10% 42% 31% 16% Spring 2010 8% 40% 36% 16% Spring 2009 10% 40% 33% 18%
Fall 2008 11% 46% 33% 11% Spring 2008 9% 45% 35% 11%
Fall 2007 10% 46% 34% 10% Spring 2007 6% 43% 38% 12%
Fall 2006 9% 48% 31% 12% 5. I like my school.
Really Agree
Kind of Agree
Kind of Disagree
Really Disagree
Spring 2012 34% 40% 15% 10% Spring 2011 28% 39% 18% 14% Spring 2010 28% 41% 17% 14% Spring 2009 26% 42% 17% 15%
Fall 2008 33% 44% 14% 9% Spring 2008 29% 47% 14% 9%
Fall 2007 31% 44% 16% 9% Spring 2007 26% 48% 16% 10%
Fall 2006 31% 43% 16% 10% 6. I like my teachers.
Really Agree
Kind of Agree
Kind of Disagree
Really Disagree
Spring 2012 36% 47% 12% 5% Spring 2011 31% 47% 14% 8% Spring 2010 30% 47% 15% 8% Spring 2009 25% 49% 18% 8%
Fall 2008 28% 51% 16% 5% Spring 2008 28% 52% 15% 6%
Fall 2007 29% 52% 14% 5% Spring 2007 24% 56% 15% 5%
Fall 2006 28% 49% 17% 6%

School District of Lancaster, 2011-2012 Student Survey May 21-25, 2012 Marginal Frequency Report – Total Sample High School Students N=1808
Center for Opinion Research 3 Franklin & Marshall College
7. There is a teacher or some other adult at this school who really cares about me.
Really Agree
Kind of Agree
Kind of Disagree
Really Disagree
Spring 2012 43% 38% 12% 6% Spring 2011 39% 38% 14% 9% Spring 2010 41% 36% 13% 10% Spring 2009 33% 42% 14% 11%
Fall 2008 32% 40% 19% 8% Spring 2008 34% 41% 16% 9%
Fall 2007 32% 40% 19% 10% Spring 2007 34% 41% 17% 9%
Fall 2006 33% 34% 23% 11% 8. There is a teacher or some other adult at this school who cares when I am not here.
Really Agree
Kind of Agree
Kind of Disagree
Really Disagree
Spring 2012 33% 38% 19% 10% Spring 2011 28% 40% 19% 13% Spring 2010 30% 36% 18% 15% Spring 2009 27% 40% 19% 14%
Fall 2008 25% 37% 25% 13% Spring 2008 24% 43% 21% 12%
Fall 2007 25% 36% 24% 15% Spring 2007 25% 38% 24% 13%
Fall 2006 23% 33% 28% 16% 9. There is a teacher or some other adult at this school who listens to me when I have something to say.
Really Agree
Kind of Agree
Kind of Disagree
Really Disagree
Spring 2012 43% 38% 13% 6% Spring 2011 39% 39% 14% 8% Spring 2010 38% 40% 13% 9% Spring 2009 33% 42% 15% 9%
Fall 2008 33% 44% 17% 6% Spring 2008 35% 44% 15% 6%
Fall 2007 36% 42% 15% 7% Spring 2007 34% 42% 16% 7%
Fall 2006 36% 41% 17% 7%

School District of Lancaster, 2011-2012 Student Survey May 21-25, 2012 Marginal Frequency Report – Total Sample High School Students N=1808
Center for Opinion Research 4 Franklin & Marshall College
10. There is a teacher or some other adult at this school who tells me when I do a good job.
Really Agree
Kind of Agree
Kind of Disagree
Really Disagree
Spring 2012 48% 38% 8% 6% Spring 2011 44% 40% 10% 7% Spring 2010 40% 41% 12% 7% Spring 2009 35% 45% 12% 8%
Fall 2008 38% 45% 12% 5% Spring 2008 36% 46% 12% 5%
Fall 2007 39% 42% 13% 6% Spring 2007 38% 44% 12% 6%
Fall 2006 40% 43% 12% 6% 11. There is a teacher or some other adult at this school who always wants me to do my best.
Really Agree
Kind of Agree
Kind of Disagree
Really Disagree
Spring 2012 52% 36% 7% 4% Spring 2011 49% 36% 9% 6% Spring 2010 49% 36% 8% 6% Spring 2009 42% 41% 9% 7%
Fall 2008 44% 42% 9% 4% Spring 2008 46% 40% 10% 4%
Fall 2007 49% 39% 10% 3% Spring 2007 50% 38% 8% 4%
Fall 2006 52% 37% 8% 3% 12. There is a teacher or some other adult at this school who believes that I will be a success.
Really Agree
Kind of Agree
Kind of Disagree
Really Disagree
Spring 2012 47% 38% 10% 4% Spring 2011 42% 40% 10% 7% Spring 2010 44% 38% 12% 6% Spring 2009 38% 44% 10% 8%
Fall 2008 40% 43% 12% 6% Spring 2008 41% 42% 12% 6%
Fall 2007 44% 39% 13% 5% Spring 2007 44% 39% 12% 5%
Fall 2006 44% 40% 13% 4%
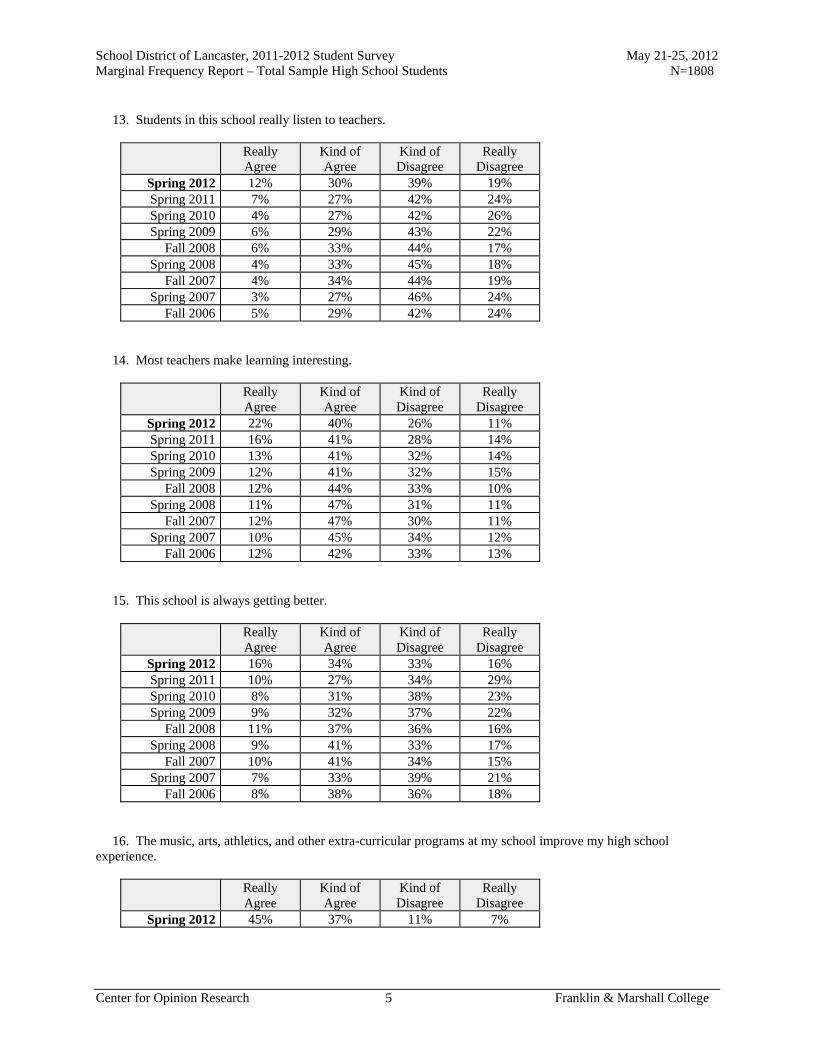
School District of Lancaster, 2011-2012 Student Survey May 21-25, 2012 Marginal Frequency Report – Total Sample High School Students N=1808
Center for Opinion Research 5 Franklin & Marshall College
13. Students in this school really listen to teachers.
Really Agree
Kind of Agree
Kind of Disagree
Really Disagree
Spring 2012 12% 30% 39% 19% Spring 2011 7% 27% 42% 24% Spring 2010 4% 27% 42% 26% Spring 2009 6% 29% 43% 22%
Fall 2008 6% 33% 44% 17% Spring 2008 4% 33% 45% 18%
Fall 2007 4% 34% 44% 19% Spring 2007 3% 27% 46% 24%
Fall 2006 5% 29% 42% 24% 14. Most teachers make learning interesting.
Really Agree
Kind of Agree
Kind of Disagree
Really Disagree
Spring 2012 22% 40% 26% 11% Spring 2011 16% 41% 28% 14% Spring 2010 13% 41% 32% 14% Spring 2009 12% 41% 32% 15%
Fall 2008 12% 44% 33% 10% Spring 2008 11% 47% 31% 11%
Fall 2007 12% 47% 30% 11% Spring 2007 10% 45% 34% 12%
Fall 2006 12% 42% 33% 13% 15. This school is always getting better.
Really Agree
Kind of Agree
Kind of Disagree
Really Disagree
Spring 2012 16% 34% 33% 16% Spring 2011 10% 27% 34% 29% Spring 2010 8% 31% 38% 23% Spring 2009 9% 32% 37% 22%
Fall 2008 11% 37% 36% 16% Spring 2008 9% 41% 33% 17%
Fall 2007 10% 41% 34% 15% Spring 2007 7% 33% 39% 21%
Fall 2006 8% 38% 36% 18% 16. The music, arts, athletics, and other extra-curricular programs at my school improve my high school experience.
Really Agree
Kind of Agree
Kind of Disagree
Really Disagree
Spring 2012 45% 37% 11% 7%

School District of Lancaster, 2011-2012 Student Survey May 21-25, 2012 Marginal Frequency Report – Total Sample High School Students N=1808
Center for Opinion Research 6 Franklin & Marshall College
17. The music, arts, athletics, and other extra-curricular programs at my school contribute to my education.
Really Agree
Kind of Agree
Kind of Disagree
Really Disagree
Spring 2012 39% 39% 14% 8% 18. The music, arts, athletics, and other extra-curricular programs at my school better prepare me for life after high school.
Really Agree
Kind of Agree
Kind of Disagree
Really Disagree
Spring 2012 40% 36% 17% 7% Food Services How would you rate the lunch you receive at school on each of the following? 19. The amount of food
Really Good Kind of Good
Kind of Bad Really Bad
Spring 2012 11% 37% 27% 25% Spring 2011 8% 34% 29% 28%
20. The flavor of the food
Really Good Kind of Good
Kind of Bad Really Bad
Spring 2012 8% 34% 35% 23% Spring 2011 5% 34% 34% 27%
21. The variety of food you receive each week
Really Good Kind of Good
Kind of Bad Really Bad
Spring 2012 12% 33% 33% 23% Spring 2011 9% 33% 33% 24%
22. The temperature of the food
Really Good Kind of Good
Kind of Bad Really Bad
Spring 2012 16% 42% 26% 16% Spring 2011 14% 43% 26% 18%
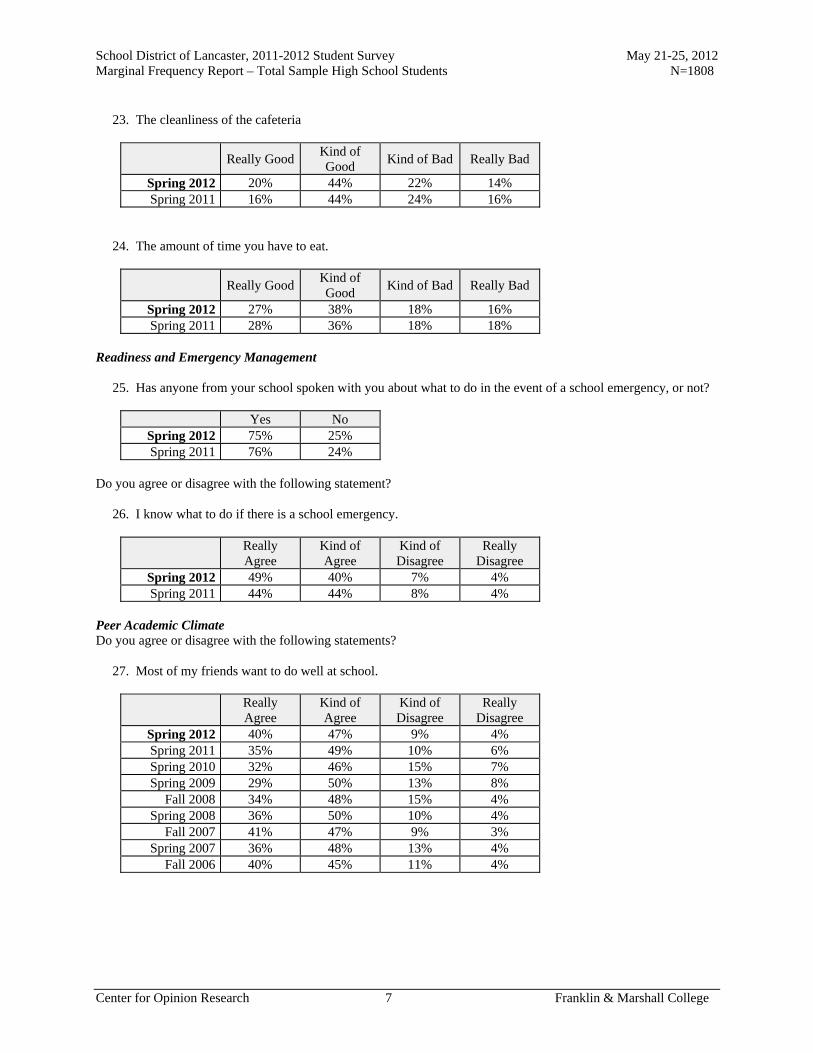
School District of Lancaster, 2011-2012 Student Survey May 21-25, 2012 Marginal Frequency Report – Total Sample High School Students N=1808
Center for Opinion Research 7 Franklin & Marshall College
23. The cleanliness of the cafeteria
Really Good Kind of Good
Kind of Bad Really Bad
Spring 2012 20% 44% 22% 14% Spring 2011 16% 44% 24% 16%
24. The amount of time you have to eat.
Really Good Kind of Good
Kind of Bad Really Bad
Spring 2012 27% 38% 18% 16% Spring 2011 28% 36% 18% 18%
Readiness and Emergency Management 25. Has anyone from your school spoken with you about what to do in the event of a school emergency, or not?
Yes No Spring 2012 75% 25% Spring 2011 76% 24%
Do you agree or disagree with the following statement? 26. I know what to do if there is a school emergency.
Really Agree
Kind of Agree
Kind of Disagree
Really Disagree
Spring 2012 49% 40% 7% 4% Spring 2011 44% 44% 8% 4%
Peer Academic Climate Do you agree or disagree with the following statements? 27. Most of my friends want to do well at school.
Really Agree
Kind of Agree
Kind of Disagree
Really Disagree
Spring 2012 40% 47% 9% 4% Spring 2011 35% 49% 10% 6% Spring 2010 32% 46% 15% 7% Spring 2009 29% 50% 13% 8%
Fall 2008 34% 48% 15% 4% Spring 2008 36% 50% 10% 4%
Fall 2007 41% 47% 9% 3% Spring 2007 36% 48% 13% 4%
Fall 2006 40% 45% 11% 4%
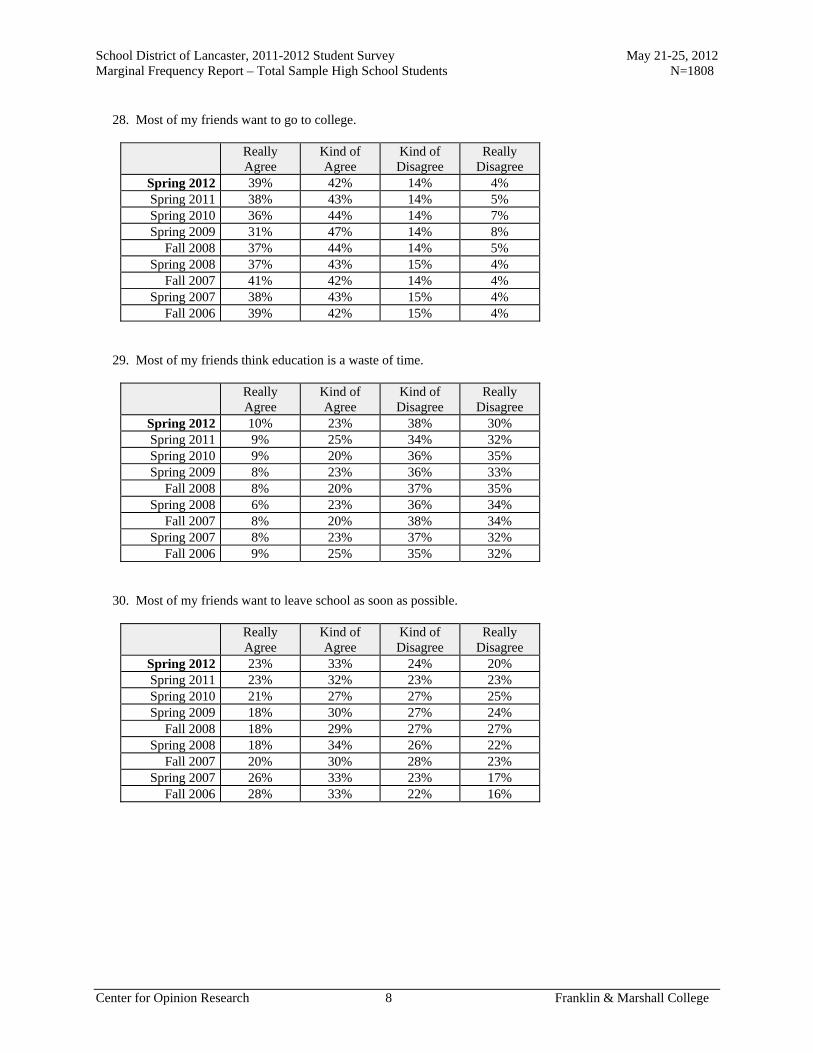
School District of Lancaster, 2011-2012 Student Survey May 21-25, 2012 Marginal Frequency Report – Total Sample High School Students N=1808
Center for Opinion Research 8 Franklin & Marshall College
28. Most of my friends want to go to college.
Really Agree
Kind of Agree
Kind of Disagree
Really Disagree
Spring 2012 39% 42% 14% 4% Spring 2011 38% 43% 14% 5% Spring 2010 36% 44% 14% 7% Spring 2009 31% 47% 14% 8%
Fall 2008 37% 44% 14% 5% Spring 2008 37% 43% 15% 4%
Fall 2007 41% 42% 14% 4% Spring 2007 38% 43% 15% 4%
Fall 2006 39% 42% 15% 4% 29. Most of my friends think education is a waste of time.
Really Agree
Kind of Agree
Kind of Disagree
Really Disagree
Spring 2012 10% 23% 38% 30% Spring 2011 9% 25% 34% 32% Spring 2010 9% 20% 36% 35% Spring 2009 8% 23% 36% 33%
Fall 2008 8% 20% 37% 35% Spring 2008 6% 23% 36% 34%
Fall 2007 8% 20% 38% 34% Spring 2007 8% 23% 37% 32%
Fall 2006 9% 25% 35% 32% 30. Most of my friends want to leave school as soon as possible.
Really Agree
Kind of Agree
Kind of Disagree
Really Disagree
Spring 2012 23% 33% 24% 20% Spring 2011 23% 32% 23% 23% Spring 2010 21% 27% 27% 25% Spring 2009 18% 30% 27% 24%
Fall 2008 18% 29% 27% 27% Spring 2008 18% 34% 26% 22%
Fall 2007 20% 30% 28% 23% Spring 2007 26% 33% 23% 17%
Fall 2006 28% 33% 22% 16%

School District of Lancaster, 2011-2012 Student Survey May 21-25, 2012 Marginal Frequency Report – Total Sample High School Students N=1808
Center for Opinion Research 9 Franklin & Marshall College
31. My friends tell me to leave school and get a job.
Really Agree
Kind of Agree
Kind of Disagree
Really Disagree
Spring 2012 9% 12% 18% 62% Spring 2011 6% 11% 18% 65% Spring 2010 4% 10% 21% 64% Spring 2009 7% 12% 19% 62%
Fall 2008 5% 11% 18% 66% Spring 2008 4% 11% 18% 67%
Fall 2007 4% 7% 16% 73% Spring 2007 4% 9% 16% 71%
Fall 2006 4% 7% 18% 71% Academic Self-efficacy Do you agree or disagree with the following statements? 32. I am a good science student.
Really Agree
Kind of Agree
Kind of Disagree
Really Disagree
Spring 2012 27% 44% 18% 12% Spring 2011 23% 43% 20% 15% Spring 2010 21% 40% 22% 16% Spring 2009 19% 42% 21% 18%
Fall 2008 20% 44% 23% 13% Spring 2008 21% 46% 21% 13%
Fall 2007 21% 43% 22% 13% Spring 2007 21% 44% 20% 15%
Fall 2006 22% 44% 20% 14% 33. Sometimes I think an assignment is easy when the other students think it is hard.
Really Agree
Kind of Agree
Kind of Disagree
Really Disagree
Spring 2012 29% 52% 14% 5% Spring 2011 31% 49% 14% 7% Spring 2010 31% 45% 16% 8% Spring 2009 26% 48% 18% 8%
Fall 2008 26% 50% 18% 6% Spring 2008 27% 53% 15% 5%
Fall 2007 29% 49% 17% 6% Spring 2007 30% 49% 16% 5%
Fall 2006 30% 47% 16% 7%

School District of Lancaster, 2011-2012 Student Survey May 21-25, 2012 Marginal Frequency Report – Total Sample High School Students N=1808
Center for Opinion Research 10 Franklin & Marshall College
34. I am good social studies student.
Really Agree
Kind of Agree
Kind of Disagree
Really Disagree
Spring 2012 28% 43% 21% 9% Spring 2011 25% 42% 21% 12% Spring 2010 24% 42% 20% 14% Spring 2009 21% 42% 23% 14%
Fall 2008 24% 44% 21% 11% Spring 2008 24% 45% 23% 8%
Fall 2007 26% 44% 21% 10% Spring 2007 23% 43% 22% 12%
Fall 2006 25% 48% 20% 8% 35. My teacher thinks I am smart.
Really Agree
Kind of Agree
Kind of Disagree
Really Disagree
Spring 2012 36% 47% 11% 5% Spring 2011 36% 44% 13% 7% Spring 2010 35% 42% 14% 9% Spring 2009 30% 46% 16% 8%
Fall 2008 31% 48% 15% 6% Spring 2008 30% 49% 15% 5%
Fall 2007 33% 47% 14% 6% Spring 2007 32% 46% 15% 7%
Fall 2006 31% 45% 16% 7% 36. I am a good math student.
Really Agree
Kind of Agree
Kind of Disagree
Really Disagree
Spring 2012 30% 38% 18% 15% Spring 2011 30% 39% 16% 15% Spring 2010 30% 37% 18% 14% Spring 2009 31% 39% 16% 14%
Fall 2008 33% 40% 16% 11% Spring 2008 30% 38% 20% 11%
Fall 2007 33% 37% 17% 13% Spring 2007 30% 36% 18% 16%
Fall 2006 27% 37% 20% 15%

School District of Lancaster, 2011-2012 Student Survey May 21-25, 2012 Marginal Frequency Report – Total Sample High School Students N=1808
Center for Opinion Research 11 Franklin & Marshall College
37. My classmates usually get better grades than I do.
Really Agree
Kind of Agree
Kind of Disagree
Really Disagree
Spring 2012 15% 34% 39% 12% Spring 2011 11% 37% 38% 13% Spring 2010 10% 34% 41% 14% Spring 2009 11% 36% 38% 15%
Fall 2008 10% 36% 42% 12% Spring 2008 11% 35% 40% 14%
Fall 2007 11% 33% 44% 12% Spring 2007 13% 34% 40% 14%
Fall 2006 11% 40% 36% 13% 38. I usually understand my homework assignments.
Really Agree
Kind of Agree
Kind of Disagree
Really Disagree
Spring 2012 27% 48% 19% 6% Spring 2011 23% 52% 17% 8% Spring 2010 23% 50% 19% 7% Spring 2009 21% 54% 18% 8%
Fall 2008 24% 55% 16% 5% Spring 2008 26% 53% 16% 5%
Fall 2007 25% 54% 16% 5% Spring 2007 27% 50% 18% 5%
Fall 2006 27% 52% 17% 4% 39. I could get the best grades in class if I tried hard enough.
Really Agree
Kind of Agree
Kind of Disagree
Really Disagree
Spring 2012 56% 32% 9% 3% Spring 2011 56% 30% 9% 5% Spring 2010 56% 30% 9% 5% Spring 2009 49% 34% 11% 6%
Fall 2008 52% 34% 10% 3% Spring 2008 54% 34% 9% 3%
Fall 2007 58% 31% 8% 3% Spring 2007 58% 31% 8% 3%
Fall 2006 59% 29% 9% 3%
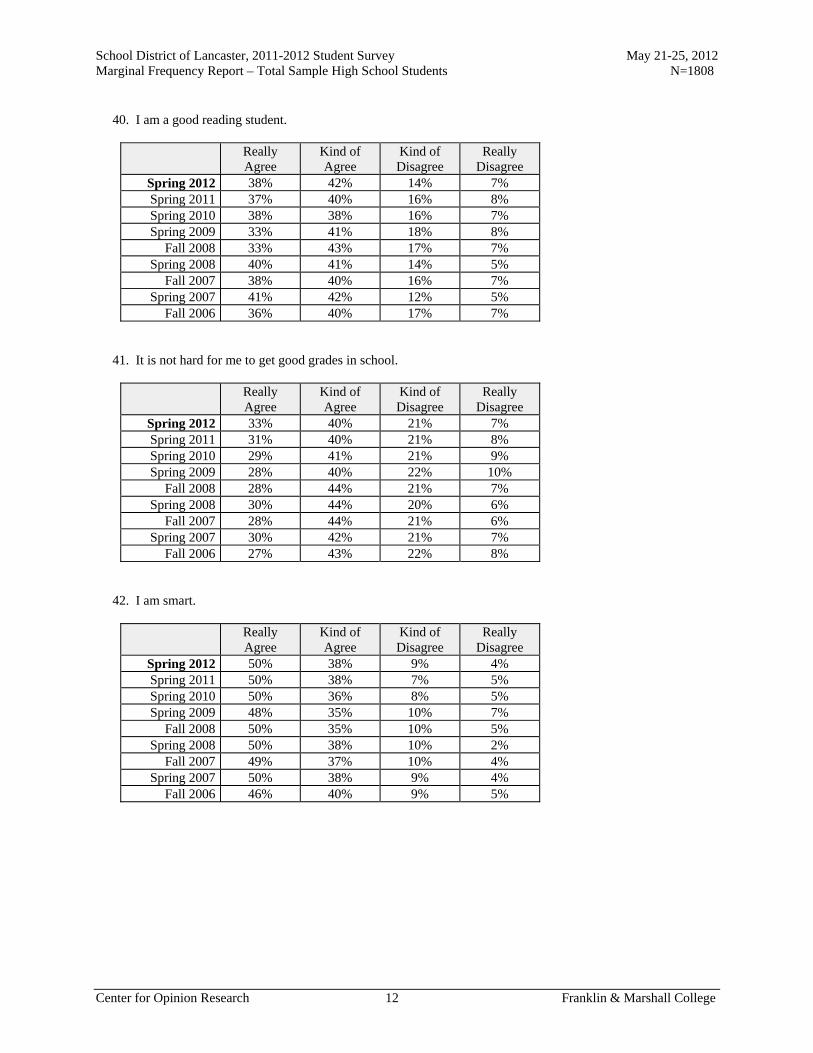
School District of Lancaster, 2011-2012 Student Survey May 21-25, 2012 Marginal Frequency Report – Total Sample High School Students N=1808
Center for Opinion Research 12 Franklin & Marshall College
40. I am a good reading student.
Really Agree
Kind of Agree
Kind of Disagree
Really Disagree
Spring 2012 38% 42% 14% 7% Spring 2011 37% 40% 16% 8% Spring 2010 38% 38% 16% 7% Spring 2009 33% 41% 18% 8%
Fall 2008 33% 43% 17% 7% Spring 2008 40% 41% 14% 5%
Fall 2007 38% 40% 16% 7% Spring 2007 41% 42% 12% 5%
Fall 2006 36% 40% 17% 7% 41. It is not hard for me to get good grades in school.
Really Agree
Kind of Agree
Kind of Disagree
Really Disagree
Spring 2012 33% 40% 21% 7% Spring 2011 31% 40% 21% 8% Spring 2010 29% 41% 21% 9% Spring 2009 28% 40% 22% 10%
Fall 2008 28% 44% 21% 7% Spring 2008 30% 44% 20% 6%
Fall 2007 28% 44% 21% 6% Spring 2007 30% 42% 21% 7%
Fall 2006 27% 43% 22% 8% 42. I am smart.
Really Agree
Kind of Agree
Kind of Disagree
Really Disagree
Spring 2012 50% 38% 9% 4% Spring 2011 50% 38% 7% 5% Spring 2010 50% 36% 8% 5% Spring 2009 48% 35% 10% 7%
Fall 2008 50% 35% 10% 5% Spring 2008 50% 38% 10% 2%
Fall 2007 49% 37% 10% 4% Spring 2007 50% 38% 9% 4%
Fall 2006 46% 40% 9% 5%

School District of Lancaster, 2011-2012 Student Survey May 21-25, 2012 Marginal Frequency Report – Total Sample High School Students N=1808
Center for Opinion Research 13 Franklin & Marshall College
43. When the teacher asks a question I usually know the answer even if the other students don't.
Really Agree
Kind of Agree
Kind of Disagree
Really Disagree
Spring 2012 23% 48% 24% 5% Spring 2011 23% 49% 22% 7% Spring 2010 22% 49% 23% 6% Spring 2009 20% 48% 23% 8%
Fall 2008 18% 52% 25% 5% Spring 2008 20% 53% 22% 4%
Fall 2007 18% 52% 25% 5% Spring 2007 18% 52% 25% 5%
Fall 2006 17% 52% 26% 5% 44. I work hard in school.
Really Agree
Kind of Agree
Kind of Disagree
Really Disagree
Spring 2012 37% 44% 14% 5% Spring 2011 33% 43% 17% 7% Spring 2010 32% 43% 19% 7% Spring 2009 33% 42% 18% 7%
Fall 2008 34% 47% 15% 4% Spring 2008 30% 47% 18% 6%
Fall 2007 34% 47% 16% 4% Spring 2007 29% 48% 18% 5%
Fall 2006 30% 50% 17% 3% 45. Most of my classmates work harder on their homework than I do.
Really Agree
Kind of Agree
Kind of Disagree
Really Disagree
Spring 2012 21% 36% 32% 11% Spring 2011 18% 38% 31% 13% Spring 2010 15% 37% 34% 13% Spring 2009 14% 39% 32% 15%
Fall 2008 15% 38% 35% 12% Spring 2008 16% 40% 33% 11%
Fall 2007 16% 38% 34% 11% Spring 2007 18% 40% 33% 9%
Fall 2006 15% 40% 35% 10%
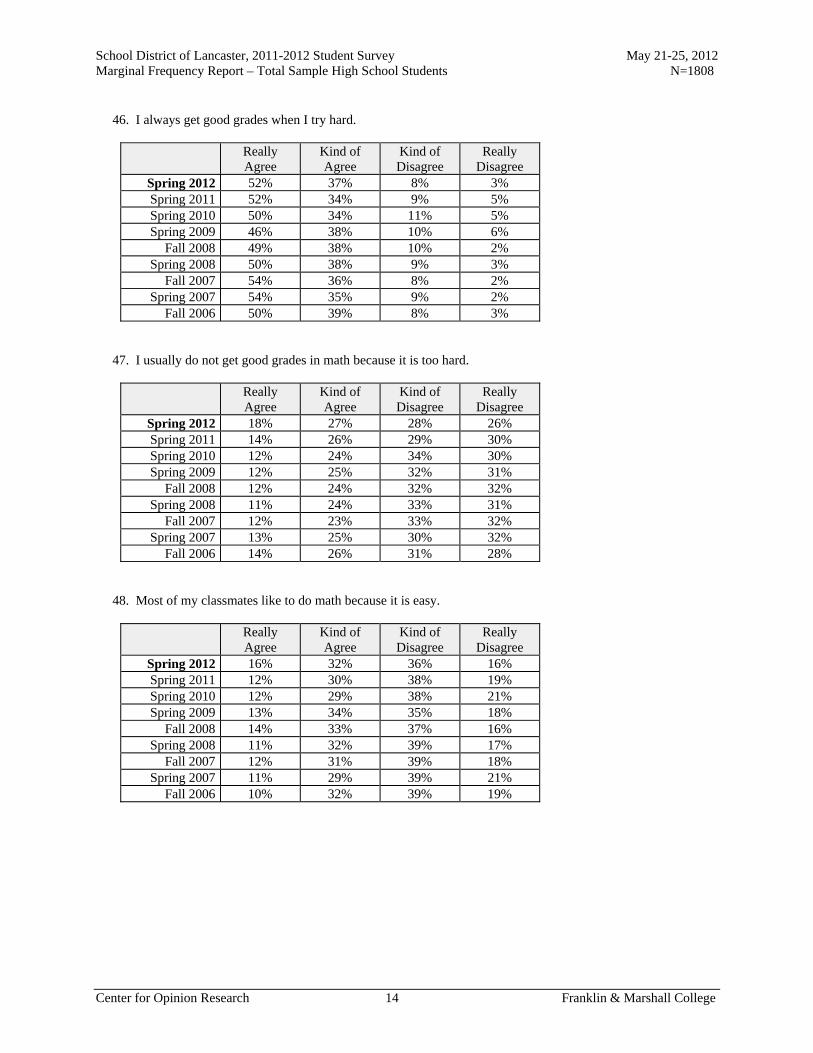
School District of Lancaster, 2011-2012 Student Survey May 21-25, 2012 Marginal Frequency Report – Total Sample High School Students N=1808
Center for Opinion Research 14 Franklin & Marshall College
46. I always get good grades when I try hard.
Really Agree
Kind of Agree
Kind of Disagree
Really Disagree
Spring 2012 52% 37% 8% 3% Spring 2011 52% 34% 9% 5% Spring 2010 50% 34% 11% 5% Spring 2009 46% 38% 10% 6%
Fall 2008 49% 38% 10% 2% Spring 2008 50% 38% 9% 3%
Fall 2007 54% 36% 8% 2% Spring 2007 54% 35% 9% 2%
Fall 2006 50% 39% 8% 3% 47. I usually do not get good grades in math because it is too hard.
Really Agree
Kind of Agree
Kind of Disagree
Really Disagree
Spring 2012 18% 27% 28% 26% Spring 2011 14% 26% 29% 30% Spring 2010 12% 24% 34% 30% Spring 2009 12% 25% 32% 31%
Fall 2008 12% 24% 32% 32% Spring 2008 11% 24% 33% 31%
Fall 2007 12% 23% 33% 32% Spring 2007 13% 25% 30% 32%
Fall 2006 14% 26% 31% 28% 48. Most of my classmates like to do math because it is easy.
Really Agree
Kind of Agree
Kind of Disagree
Really Disagree
Spring 2012 16% 32% 36% 16% Spring 2011 12% 30% 38% 19% Spring 2010 12% 29% 38% 21% Spring 2009 13% 34% 35% 18%
Fall 2008 14% 33% 37% 16% Spring 2008 11% 32% 39% 17%
Fall 2007 12% 31% 39% 18% Spring 2007 11% 29% 39% 21%
Fall 2006 10% 32% 39% 19%

School District of Lancaster, 2011-2012 Student Survey May 21-25, 2012 Marginal Frequency Report – Total Sample High School Students N=1808
Center for Opinion Research 15 Franklin & Marshall College
49. I would get better grades if my teacher liked me more.
Really Agree
Kind of Agree
Kind of Disagree
Really Disagree
Spring 2012 13% 22% 31% 35% Spring 2011 12% 21% 32% 35% Spring 2010 11% 20% 31% 38% Spring 2009 10% 22% 33% 36%
Fall 2008 10% 20% 33% 38% Spring 2008 8% 22% 33% 36%
Fall 2007 8% 16% 35% 41% Spring 2007 8% 18% 35% 38%
Fall 2006 10% 17% 33% 40% 50. I will graduate from high school.
Really Agree
Kind of Agree
Kind of Disagree
Really Disagree
Spring 2012 84% 11% 3% 2% Spring 2011 82% 12% 3% 3% Spring 2010 84% 10% 3% 3% Spring 2009 79% 13% 3% 5%
Fall 2008 86% 10% 2% 2% Spring 2008 76% 15% 6% 3%
Fall 2007 86% 10% 3% 2% Spring 2007 84% 12% 3% 2%
Fall 2006 84% 11% 4% 2% 51. I go to a good school.
Really Agree
Kind of Agree
Kind of Disagree
Really Disagree
Spring 2012 38% 40% 15% 7% Spring 2011 26% 40% 21% 14% Spring 2010 28% 40% 18% 14% Spring 2009 28% 39% 20% 13%
Fall 2008 33% 43% 16% 8% Spring 2008 32% 45% 17% 6%
Fall 2007 36% 43% 15% 6% Spring 2007 29% 46% 18% 7%
Fall 2006 35% 44% 13% 8%
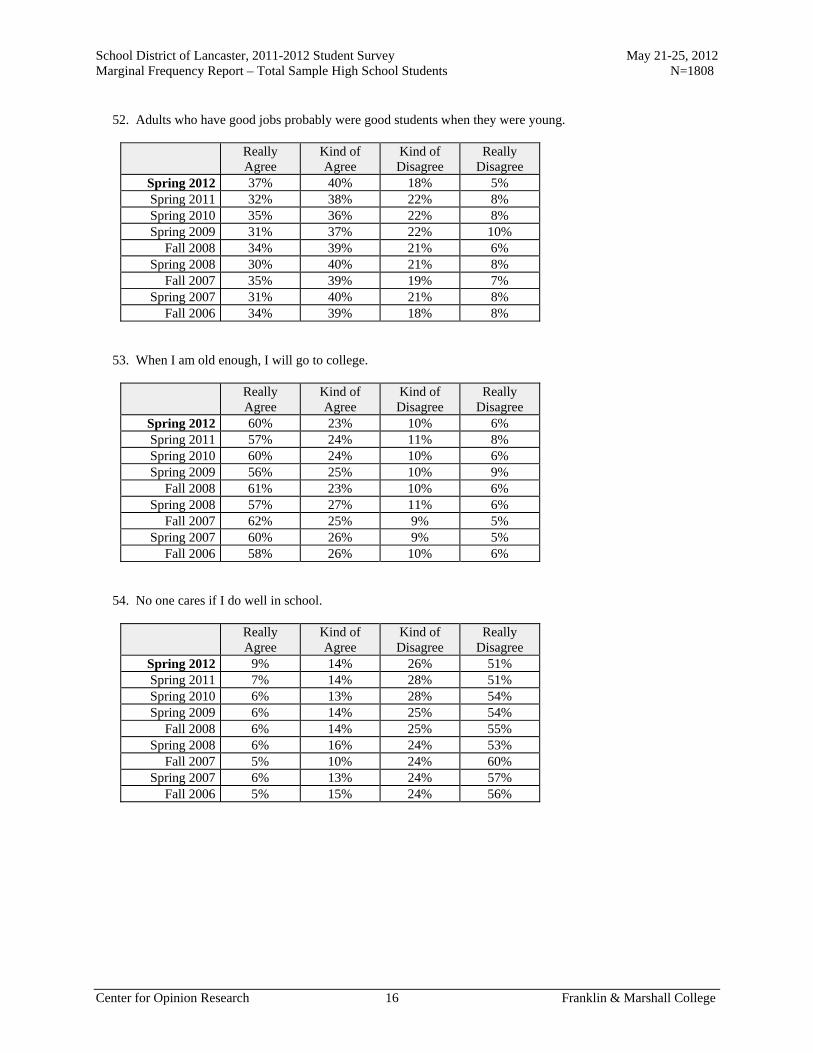
School District of Lancaster, 2011-2012 Student Survey May 21-25, 2012 Marginal Frequency Report – Total Sample High School Students N=1808
Center for Opinion Research 16 Franklin & Marshall College
52. Adults who have good jobs probably were good students when they were young.
Really Agree
Kind of Agree
Kind of Disagree
Really Disagree
Spring 2012 37% 40% 18% 5% Spring 2011 32% 38% 22% 8% Spring 2010 35% 36% 22% 8% Spring 2009 31% 37% 22% 10%
Fall 2008 34% 39% 21% 6% Spring 2008 30% 40% 21% 8%
Fall 2007 35% 39% 19% 7% Spring 2007 31% 40% 21% 8%
Fall 2006 34% 39% 18% 8% 53. When I am old enough, I will go to college.
Really Agree
Kind of Agree
Kind of Disagree
Really Disagree
Spring 2012 60% 23% 10% 6% Spring 2011 57% 24% 11% 8% Spring 2010 60% 24% 10% 6% Spring 2009 56% 25% 10% 9%
Fall 2008 61% 23% 10% 6% Spring 2008 57% 27% 11% 6%
Fall 2007 62% 25% 9% 5% Spring 2007 60% 26% 9% 5%
Fall 2006 58% 26% 10% 6% 54. No one cares if I do well in school.
Really Agree
Kind of Agree
Kind of Disagree
Really Disagree
Spring 2012 9% 14% 26% 51% Spring 2011 7% 14% 28% 51% Spring 2010 6% 13% 28% 54% Spring 2009 6% 14% 25% 54%
Fall 2008 6% 14% 25% 55% Spring 2008 6% 16% 24% 53%
Fall 2007 5% 10% 24% 60% Spring 2007 6% 13% 24% 57%
Fall 2006 5% 15% 24% 56%

School District of Lancaster, 2011-2012 Student Survey May 21-25, 2012 Marginal Frequency Report – Total Sample High School Students N=1808
Center for Opinion Research 17 Franklin & Marshall College
55. What I learn in school is not important.
Really Agree
Kind of Agree
Kind of Disagree
Really Disagree
Spring 2012 9% 17% 27% 48% Spring 2011 7% 15% 29% 49% Spring 2010 6% 15% 28% 51% Spring 2009 7% 16% 27% 50%
Fall 2008 6% 14% 29% 51% Spring 2008 6% 18% 28% 47%
Fall 2007 6% 12% 27% 56% Spring 2007 5% 15% 28% 51%
Fall 2006 7% 12% 26% 56% 56. It does not matter if I do well in school.
Really Agree
Kind of Agree
Kind of Disagree
Really Disagree
Spring 2012 10% 11% 20% 59% Spring 2011 7% 11% 21% 61% Spring 2010 6% 10% 21% 63% Spring 2009 7% 12% 21% 60%
Fall 2008 6% 10% 20% 63% Spring 2008 6% 12% 23% 60%
Fall 2007 5% 8% 21% 66% Spring 2007 4% 11% 20% 65%
Fall 2006 5% 9% 20% 66% 57. Students who get better grades than I do get more help from the teacher than I do.
Really Agree
Kind of Agree
Kind of Disagree
Really Disagree
Spring 2012 14% 26% 35% 24% Spring 2011 13% 25% 37% 25% Spring 2010 12% 27% 34% 27% Spring 2009 12% 28% 32% 27%
Fall 2008 11% 26% 37% 26% Spring 2008 10% 28% 35% 27%
Fall 2007 9% 25% 38% 28% Spring 2007 12% 26% 35% 26%
Fall 2006 12% 25% 35% 28%
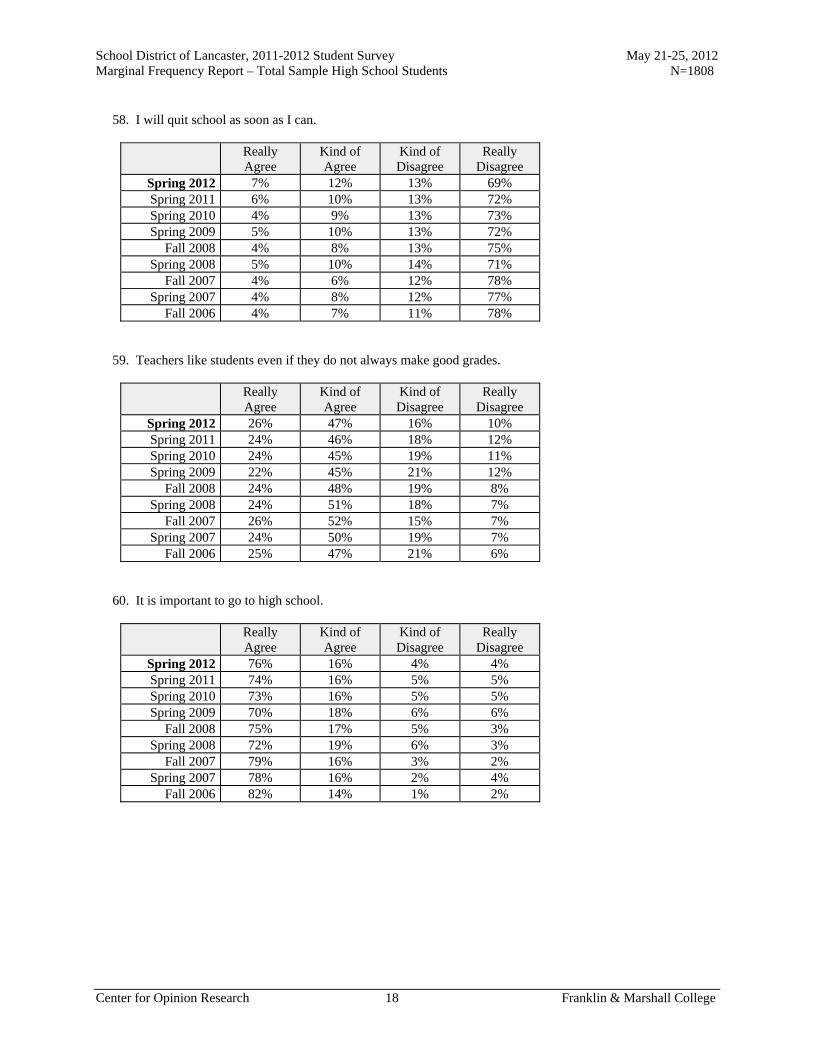
School District of Lancaster, 2011-2012 Student Survey May 21-25, 2012 Marginal Frequency Report – Total Sample High School Students N=1808
Center for Opinion Research 18 Franklin & Marshall College
58. I will quit school as soon as I can.
Really Agree
Kind of Agree
Kind of Disagree
Really Disagree
Spring 2012 7% 12% 13% 69% Spring 2011 6% 10% 13% 72% Spring 2010 4% 9% 13% 73% Spring 2009 5% 10% 13% 72%
Fall 2008 4% 8% 13% 75% Spring 2008 5% 10% 14% 71%
Fall 2007 4% 6% 12% 78% Spring 2007 4% 8% 12% 77%
Fall 2006 4% 7% 11% 78% 59. Teachers like students even if they do not always make good grades.
Really Agree
Kind of Agree
Kind of Disagree
Really Disagree
Spring 2012 26% 47% 16% 10% Spring 2011 24% 46% 18% 12% Spring 2010 24% 45% 19% 11% Spring 2009 22% 45% 21% 12%
Fall 2008 24% 48% 19% 8% Spring 2008 24% 51% 18% 7%
Fall 2007 26% 52% 15% 7% Spring 2007 24% 50% 19% 7%
Fall 2006 25% 47% 21% 6% 60. It is important to go to high school.
Really Agree
Kind of Agree
Kind of Disagree
Really Disagree
Spring 2012 76% 16% 4% 4% Spring 2011 74% 16% 5% 5% Spring 2010 73% 16% 5% 5% Spring 2009 70% 18% 6% 6%
Fall 2008 75% 17% 5% 3% Spring 2008 72% 19% 6% 3%
Fall 2007 79% 16% 3% 2% Spring 2007 78% 16% 2% 4%
Fall 2006 82% 14% 1% 2%
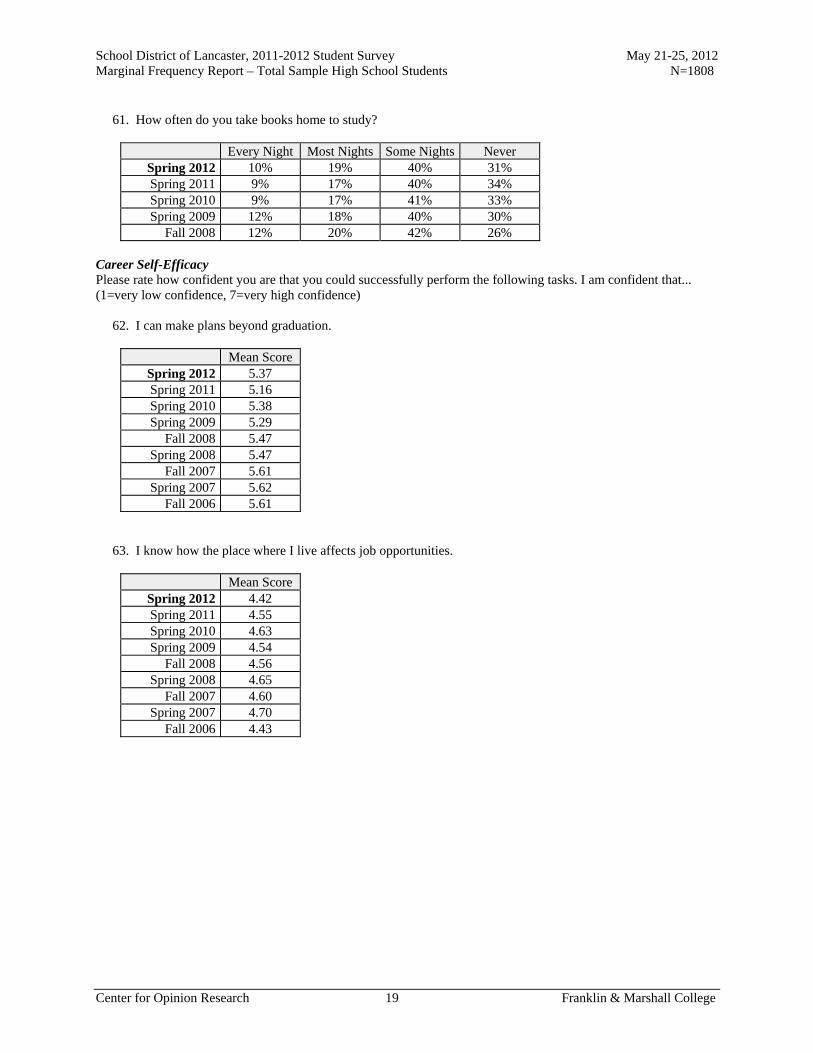
School District of Lancaster, 2011-2012 Student Survey May 21-25, 2012 Marginal Frequency Report – Total Sample High School Students N=1808
Center for Opinion Research 19 Franklin & Marshall College
61. How often do you take books home to study?
Every Night Most Nights Some Nights Never Spring 2012 10% 19% 40% 31% Spring 2011 9% 17% 40% 34% Spring 2010 9% 17% 41% 33% Spring 2009 12% 18% 40% 30%
Fall 2008 12% 20% 42% 26% Career Self-Efficacy Please rate how confident you are that you could successfully perform the following tasks. I am confident that... (1=very low confidence, 7=very high confidence) 62. I can make plans beyond graduation.
Mean Score Spring 2012 5.37 Spring 2011 5.16 Spring 2010 5.38 Spring 2009 5.29
Fall 2008 5.47 Spring 2008 5.47
Fall 2007 5.61 Spring 2007 5.62
Fall 2006 5.61 63. I know how the place where I live affects job opportunities.
Mean Score Spring 2012 4.42 Spring 2011 4.55 Spring 2010 4.63 Spring 2009 4.54
Fall 2008 4.56 Spring 2008 4.65
Fall 2007 4.60 Spring 2007 4.70
Fall 2006 4.43
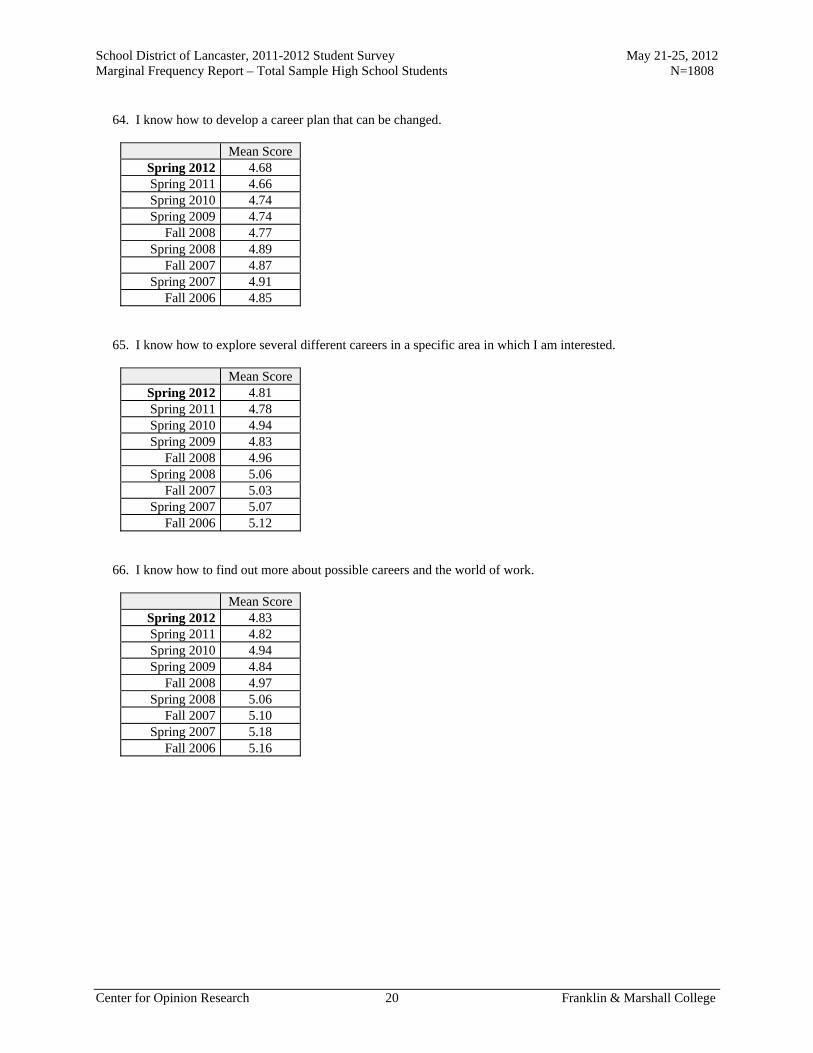
School District of Lancaster, 2011-2012 Student Survey May 21-25, 2012 Marginal Frequency Report – Total Sample High School Students N=1808
Center for Opinion Research 20 Franklin & Marshall College
64. I know how to develop a career plan that can be changed.
Mean Score Spring 2012 4.68 Spring 2011 4.66 Spring 2010 4.74 Spring 2009 4.74
Fall 2008 4.77 Spring 2008 4.89
Fall 2007 4.87 Spring 2007 4.91
Fall 2006 4.85 65. I know how to explore several different careers in a specific area in which I am interested.
Mean Score Spring 2012 4.81 Spring 2011 4.78 Spring 2010 4.94 Spring 2009 4.83
Fall 2008 4.96 Spring 2008 5.06
Fall 2007 5.03 Spring 2007 5.07
Fall 2006 5.12 66. I know how to find out more about possible careers and the world of work.
Mean Score Spring 2012 4.83 Spring 2011 4.82 Spring 2010 4.94 Spring 2009 4.84
Fall 2008 4.97 Spring 2008 5.06
Fall 2007 5.10 Spring 2007 5.18
Fall 2006 5.16
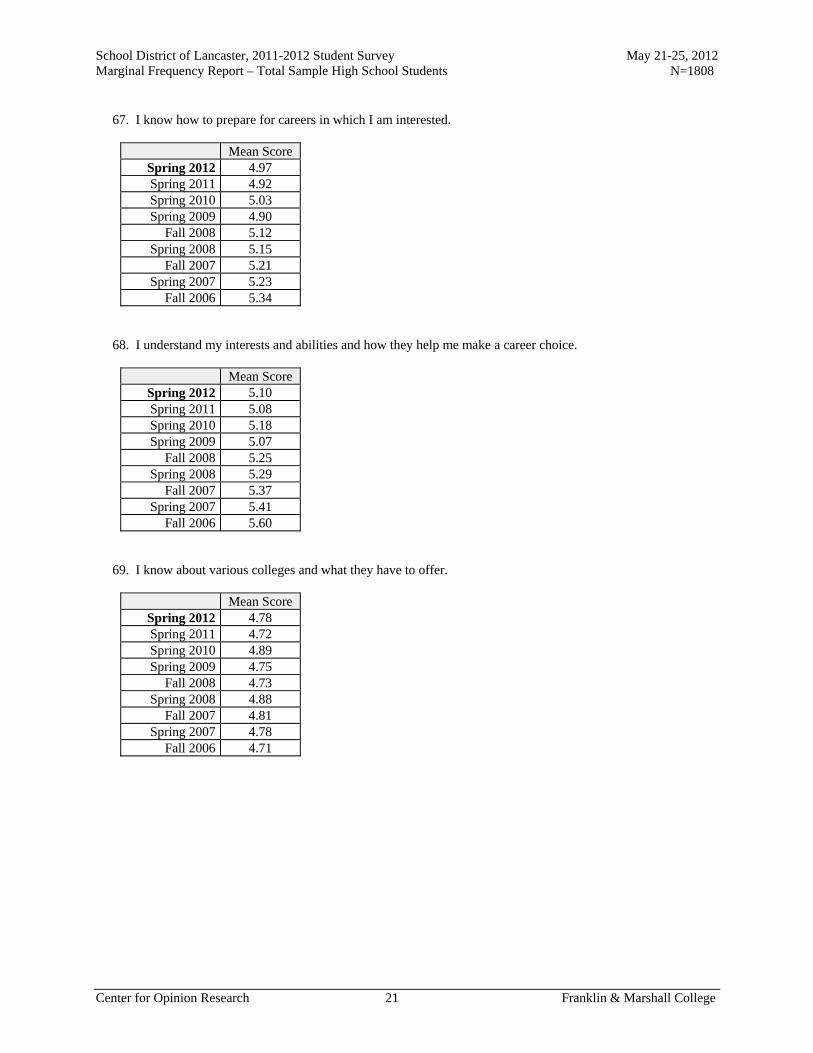
School District of Lancaster, 2011-2012 Student Survey May 21-25, 2012 Marginal Frequency Report – Total Sample High School Students N=1808
Center for Opinion Research 21 Franklin & Marshall College
67. I know how to prepare for careers in which I am interested.
Mean Score Spring 2012 4.97 Spring 2011 4.92 Spring 2010 5.03 Spring 2009 4.90
Fall 2008 5.12 Spring 2008 5.15
Fall 2007 5.21 Spring 2007 5.23
Fall 2006 5.34 68. I understand my interests and abilities and how they help me make a career choice.
Mean Score Spring 2012 5.10 Spring 2011 5.08 Spring 2010 5.18 Spring 2009 5.07
Fall 2008 5.25 Spring 2008 5.29
Fall 2007 5.37 Spring 2007 5.41
Fall 2006 5.60 69. I know about various colleges and what they have to offer.
Mean Score Spring 2012 4.78 Spring 2011 4.72 Spring 2010 4.89 Spring 2009 4.75
Fall 2008 4.73 Spring 2008 4.88
Fall 2007 4.81 Spring 2007 4.78
Fall 2006 4.71
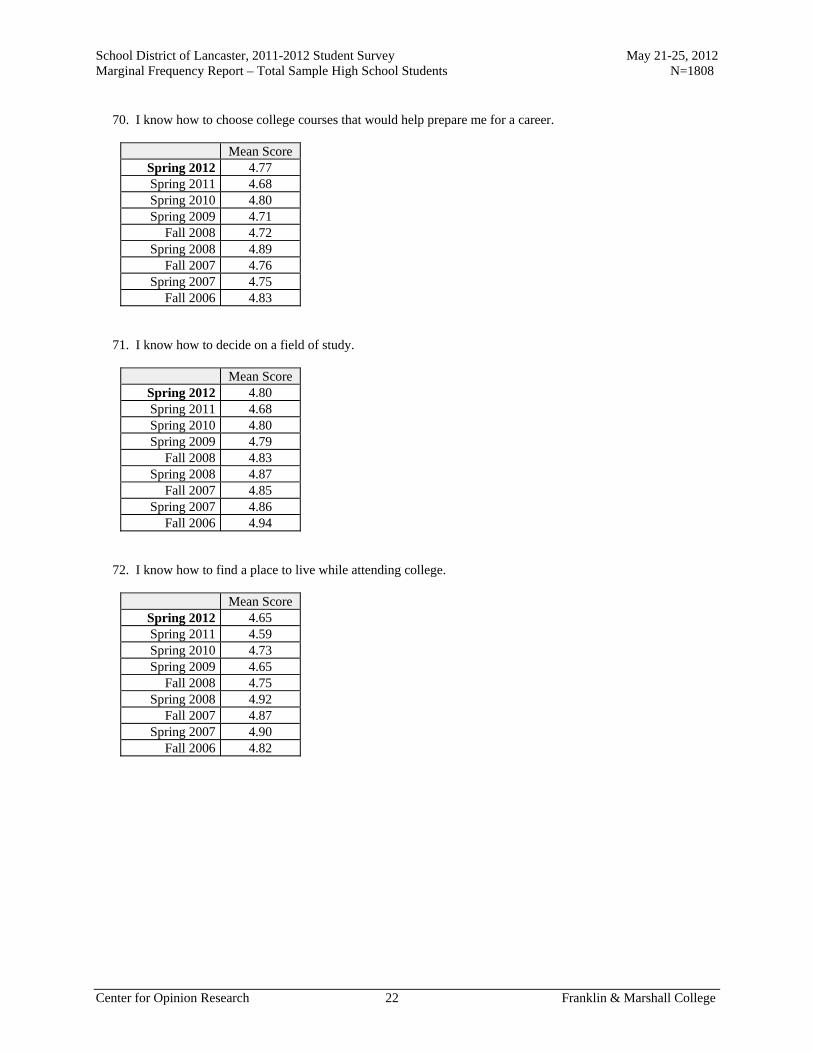
School District of Lancaster, 2011-2012 Student Survey May 21-25, 2012 Marginal Frequency Report – Total Sample High School Students N=1808
Center for Opinion Research 22 Franklin & Marshall College
70. I know how to choose college courses that would help prepare me for a career.
Mean Score Spring 2012 4.77 Spring 2011 4.68 Spring 2010 4.80 Spring 2009 4.71
Fall 2008 4.72 Spring 2008 4.89
Fall 2007 4.76 Spring 2007 4.75
Fall 2006 4.83 71. I know how to decide on a field of study.
Mean Score Spring 2012 4.80 Spring 2011 4.68 Spring 2010 4.80 Spring 2009 4.79
Fall 2008 4.83 Spring 2008 4.87
Fall 2007 4.85 Spring 2007 4.86
Fall 2006 4.94 72. I know how to find a place to live while attending college.
Mean Score Spring 2012 4.65 Spring 2011 4.59 Spring 2010 4.73 Spring 2009 4.65
Fall 2008 4.75 Spring 2008 4.92
Fall 2007 4.87 Spring 2007 4.90
Fall 2006 4.82
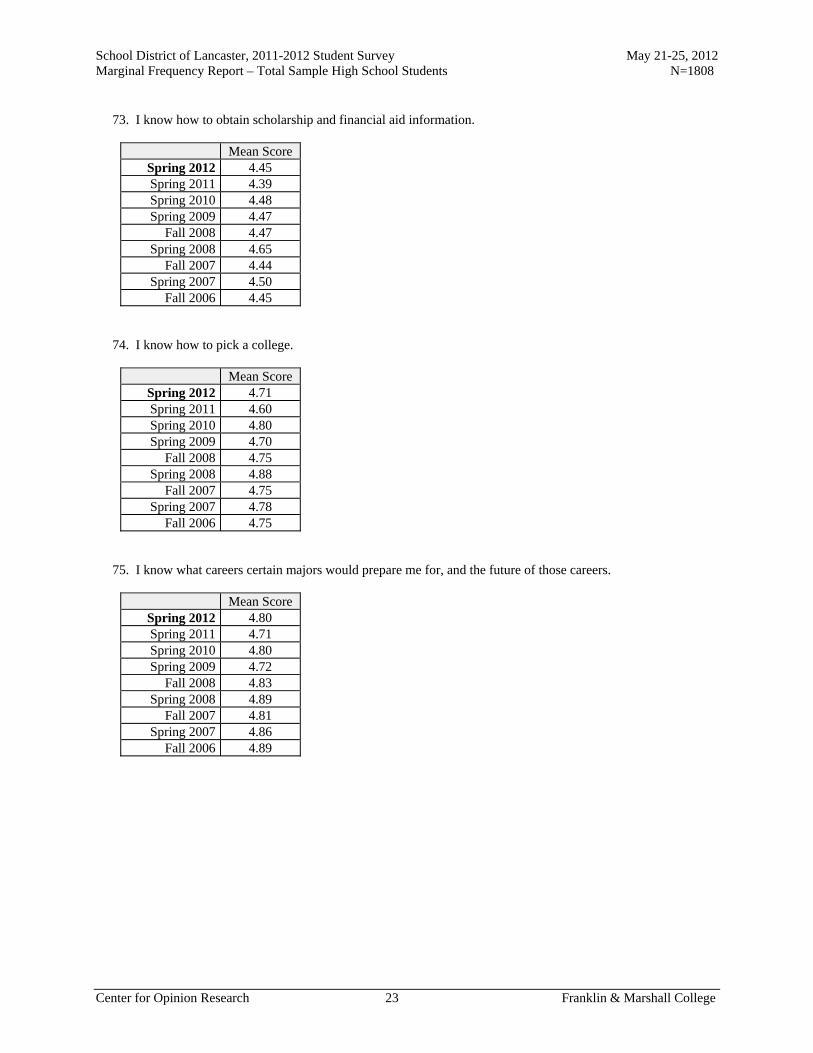
School District of Lancaster, 2011-2012 Student Survey May 21-25, 2012 Marginal Frequency Report – Total Sample High School Students N=1808
Center for Opinion Research 23 Franklin & Marshall College
73. I know how to obtain scholarship and financial aid information.
Mean Score Spring 2012 4.45 Spring 2011 4.39 Spring 2010 4.48 Spring 2009 4.47
Fall 2008 4.47 Spring 2008 4.65
Fall 2007 4.44 Spring 2007 4.50
Fall 2006 4.45 74. I know how to pick a college.
Mean Score Spring 2012 4.71 Spring 2011 4.60 Spring 2010 4.80 Spring 2009 4.70
Fall 2008 4.75 Spring 2008 4.88
Fall 2007 4.75 Spring 2007 4.78
Fall 2006 4.75 75. I know what careers certain majors would prepare me for, and the future of those careers.
Mean Score Spring 2012 4.80 Spring 2011 4.71 Spring 2010 4.80 Spring 2009 4.72
Fall 2008 4.83 Spring 2008 4.89
Fall 2007 4.81 Spring 2007 4.86
Fall 2006 4.89
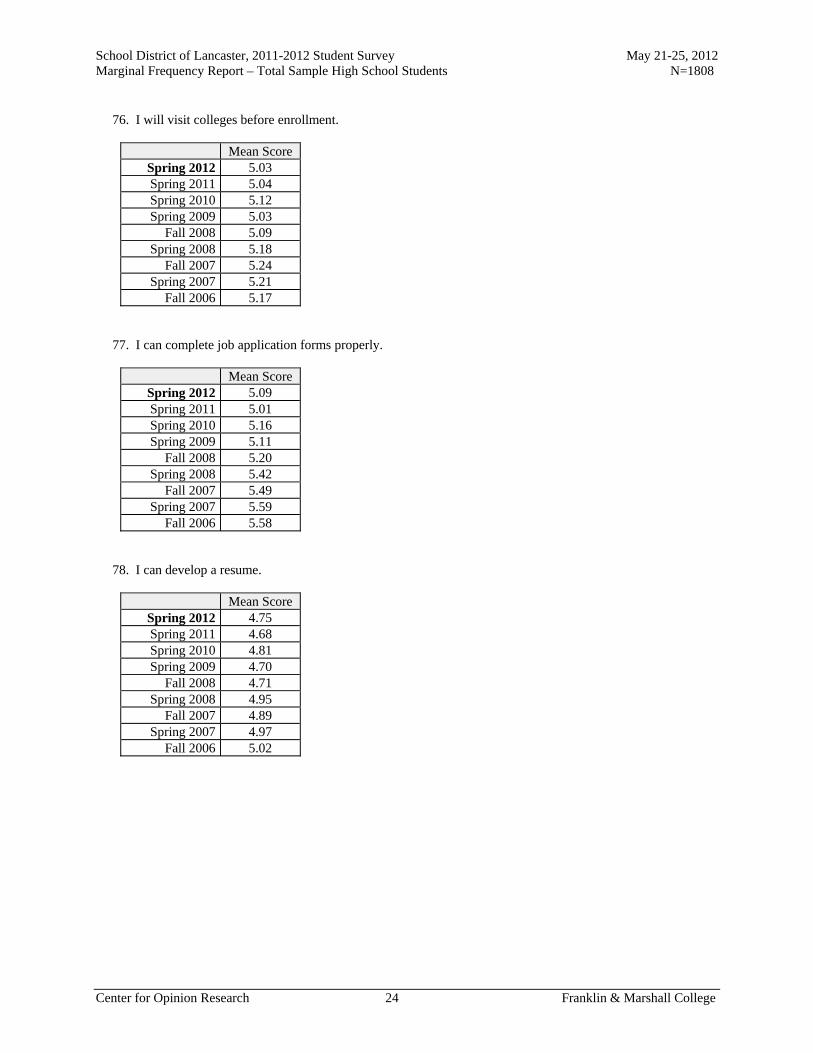
School District of Lancaster, 2011-2012 Student Survey May 21-25, 2012 Marginal Frequency Report – Total Sample High School Students N=1808
Center for Opinion Research 24 Franklin & Marshall College
76. I will visit colleges before enrollment.
Mean Score Spring 2012 5.03 Spring 2011 5.04 Spring 2010 5.12 Spring 2009 5.03
Fall 2008 5.09 Spring 2008 5.18
Fall 2007 5.24 Spring 2007 5.21
Fall 2006 5.17 77. I can complete job application forms properly.
Mean Score Spring 2012 5.09 Spring 2011 5.01 Spring 2010 5.16 Spring 2009 5.11
Fall 2008 5.20 Spring 2008 5.42
Fall 2007 5.49 Spring 2007 5.59
Fall 2006 5.58 78. I can develop a resume.
Mean Score Spring 2012 4.75 Spring 2011 4.68 Spring 2010 4.81 Spring 2009 4.70
Fall 2008 4.71 Spring 2008 4.95
Fall 2007 4.89 Spring 2007 4.97
Fall 2006 5.02
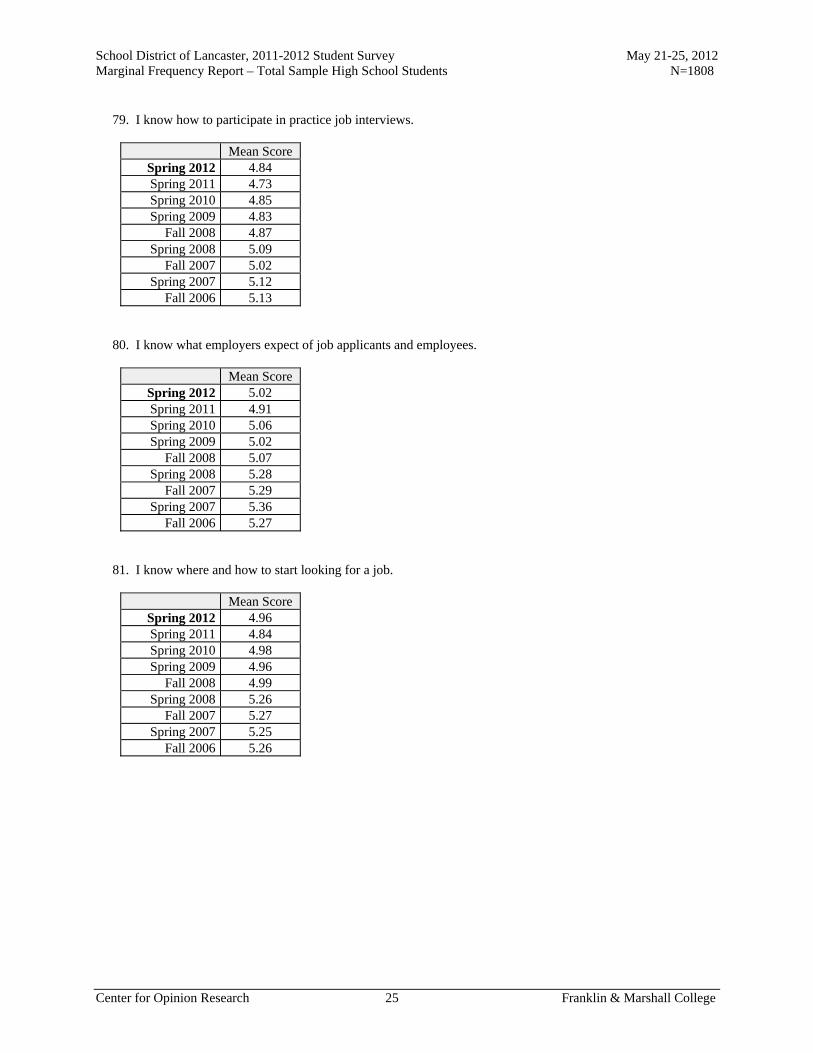
School District of Lancaster, 2011-2012 Student Survey May 21-25, 2012 Marginal Frequency Report – Total Sample High School Students N=1808
Center for Opinion Research 25 Franklin & Marshall College
79. I know how to participate in practice job interviews.
Mean Score Spring 2012 4.84 Spring 2011 4.73 Spring 2010 4.85 Spring 2009 4.83
Fall 2008 4.87 Spring 2008 5.09
Fall 2007 5.02 Spring 2007 5.12
Fall 2006 5.13 80. I know what employers expect of job applicants and employees.
Mean Score Spring 2012 5.02 Spring 2011 4.91 Spring 2010 5.06 Spring 2009 5.02
Fall 2008 5.07 Spring 2008 5.28
Fall 2007 5.29 Spring 2007 5.36
Fall 2006 5.27 81. I know where and how to start looking for a job.
Mean Score Spring 2012 4.96 Spring 2011 4.84 Spring 2010 4.98 Spring 2009 4.96
Fall 2008 4.99 Spring 2008 5.26
Fall 2007 5.27 Spring 2007 5.25
Fall 2006 5.26

School District of Lancaster, 2011-2012 Student Survey May 21-25, 2012 Marginal Frequency Report – Total Sample High School Students N=1808
Center for Opinion Research 26 Franklin & Marshall College
82. I can find a full-time job after graduation.
Mean Score Spring 2012 4.89 Spring 2011 4.73 Spring 2010 4.88 Spring 2009 4.86
Fall 2008 5.06 Spring 2008 5.25
Fall 2007 5.26 Spring 2007 5.28
Fall 2006 5.31 83. I can find part-time or summer work.
Mean Score Spring 2012 5.18 Spring 2011 5.00 Spring 2010 5.17 Spring 2009 5.15
Fall 2008 5.36 Spring 2008 5.52
Fall 2007 5.65 Spring 2007 5.66
Fall 2006 5.68 84. I know the benefits, working conditions, and opportunities for advancement in jobs.
Mean Score Spring 2012 4.87 Spring 2011 4.75 Spring 2010 4.87 Spring 2009 4.85
Fall 2008 4.92 Spring 2008 5.18
Fall 2007 5.13 Spring 2007 5.14
Fall 2006 5.23
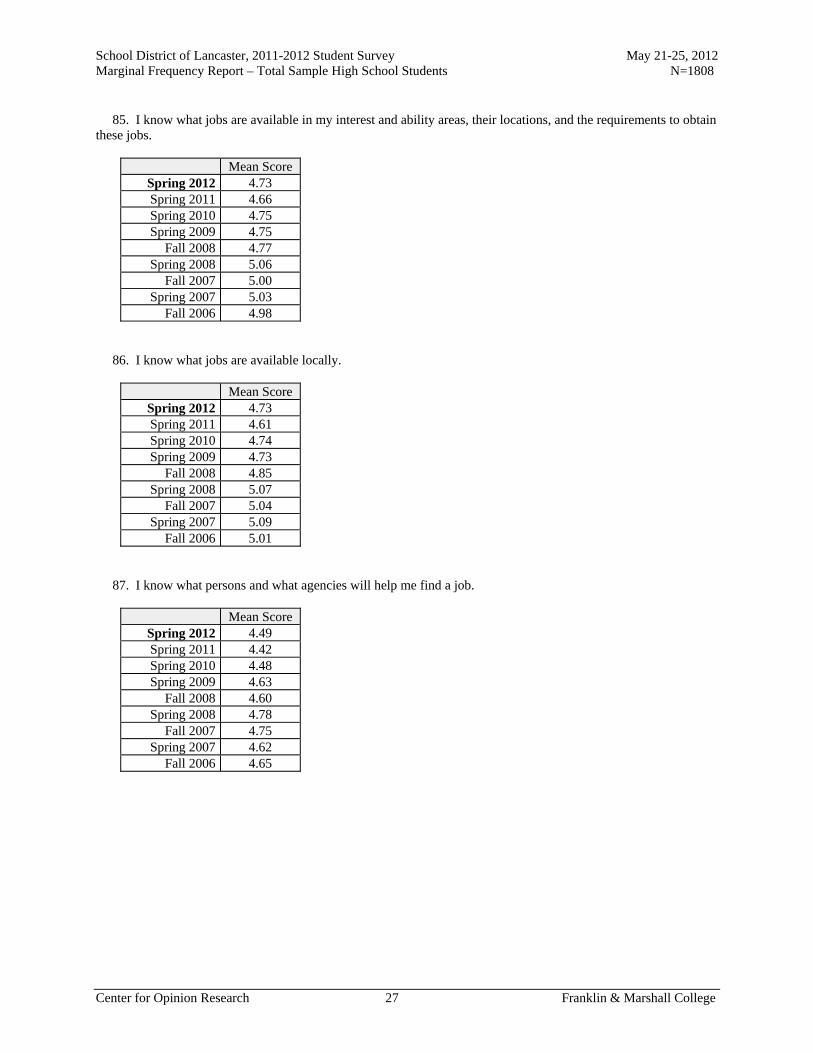
School District of Lancaster, 2011-2012 Student Survey May 21-25, 2012 Marginal Frequency Report – Total Sample High School Students N=1808
Center for Opinion Research 27 Franklin & Marshall College
85. I know what jobs are available in my interest and ability areas, their locations, and the requirements to obtain these jobs.
Mean Score Spring 2012 4.73 Spring 2011 4.66 Spring 2010 4.75 Spring 2009 4.75
Fall 2008 4.77 Spring 2008 5.06
Fall 2007 5.00 Spring 2007 5.03
Fall 2006 4.98 86. I know what jobs are available locally.
Mean Score Spring 2012 4.73 Spring 2011 4.61 Spring 2010 4.74 Spring 2009 4.73
Fall 2008 4.85 Spring 2008 5.07
Fall 2007 5.04 Spring 2007 5.09
Fall 2006 5.01 87. I know what persons and what agencies will help me find a job.
Mean Score Spring 2012 4.49 Spring 2011 4.42 Spring 2010 4.48 Spring 2009 4.63
Fall 2008 4.60 Spring 2008 4.78
Fall 2007 4.75 Spring 2007 4.62
Fall 2006 4.65
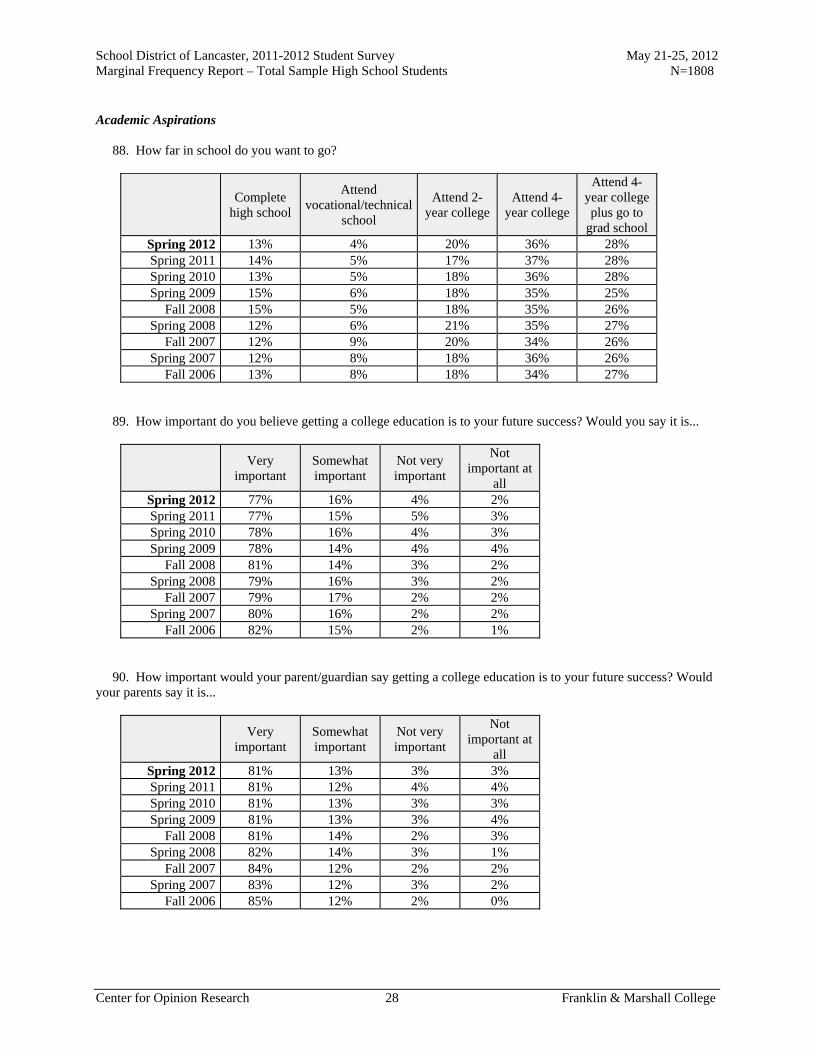
School District of Lancaster, 2011-2012 Student Survey May 21-25, 2012 Marginal Frequency Report – Total Sample High School Students N=1808
Center for Opinion Research 28 Franklin & Marshall College
Academic Aspirations 88. How far in school do you want to go?
Complete
high school
Attend vocational/technical
school
Attend 2-year college
Attend 4-year college
Attend 4-year college plus go to
grad school Spring 2012 13% 4% 20% 36% 28% Spring 2011 14% 5% 17% 37% 28% Spring 2010 13% 5% 18% 36% 28% Spring 2009 15% 6% 18% 35% 25%
Fall 2008 15% 5% 18% 35% 26% Spring 2008 12% 6% 21% 35% 27%
Fall 2007 12% 9% 20% 34% 26% Spring 2007 12% 8% 18% 36% 26%
Fall 2006 13% 8% 18% 34% 27% 89. How important do you believe getting a college education is to your future success? Would you say it is...
Very
important Somewhat important
Not very important
Not important at
all Spring 2012 77% 16% 4% 2% Spring 2011 77% 15% 5% 3% Spring 2010 78% 16% 4% 3% Spring 2009 78% 14% 4% 4%
Fall 2008 81% 14% 3% 2% Spring 2008 79% 16% 3% 2%
Fall 2007 79% 17% 2% 2% Spring 2007 80% 16% 2% 2%
Fall 2006 82% 15% 2% 1% 90. How important would your parent/guardian say getting a college education is to your future success? Would your parents say it is...
Very
important Somewhat important
Not very important
Not important at
all Spring 2012 81% 13% 3% 3% Spring 2011 81% 12% 4% 4% Spring 2010 81% 13% 3% 3% Spring 2009 81% 13% 3% 4%
Fall 2008 81% 14% 2% 3% Spring 2008 82% 14% 3% 1%
Fall 2007 84% 12% 2% 2% Spring 2007 83% 12% 3% 2%
Fall 2006 85% 12% 2% 0%
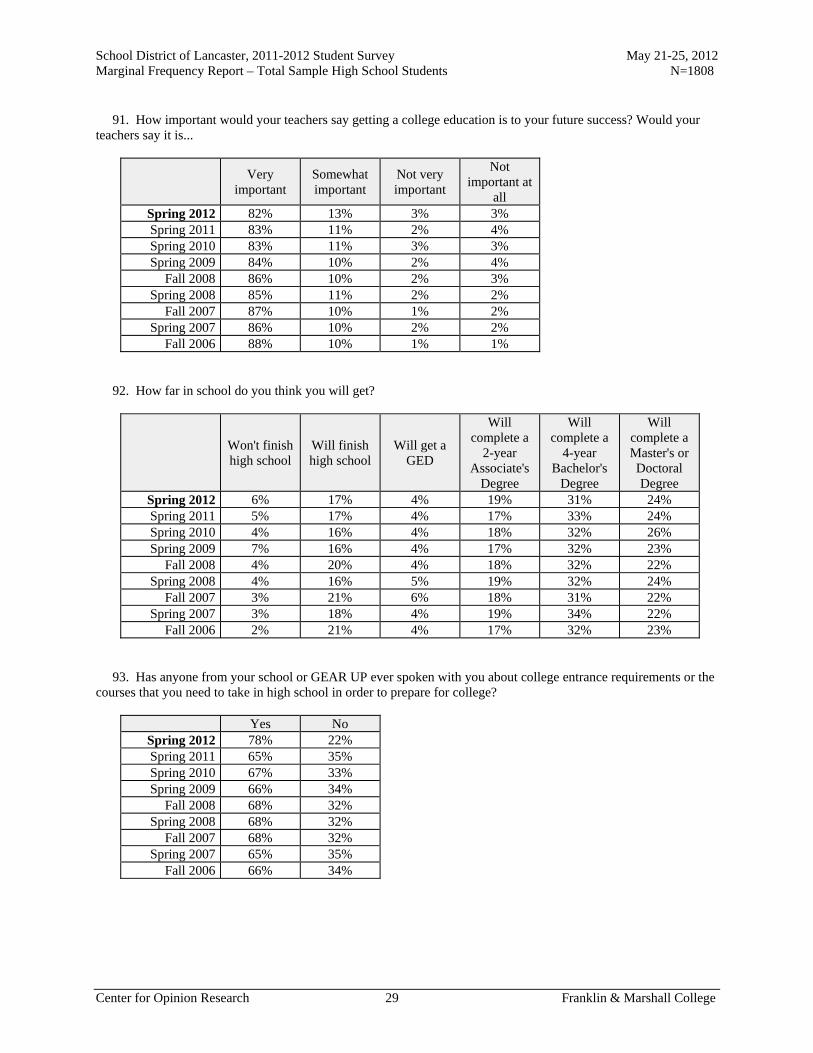
School District of Lancaster, 2011-2012 Student Survey May 21-25, 2012 Marginal Frequency Report – Total Sample High School Students N=1808
Center for Opinion Research 29 Franklin & Marshall College
91. How important would your teachers say getting a college education is to your future success? Would your teachers say it is...
Very
important Somewhat important
Not very important
Not important at
all Spring 2012 82% 13% 3% 3% Spring 2011 83% 11% 2% 4% Spring 2010 83% 11% 3% 3% Spring 2009 84% 10% 2% 4%
Fall 2008 86% 10% 2% 3% Spring 2008 85% 11% 2% 2%
Fall 2007 87% 10% 1% 2% Spring 2007 86% 10% 2% 2%
Fall 2006 88% 10% 1% 1% 92. How far in school do you think you will get?
Won't finish high school
Will finish high school
Will get a GED
Will complete a
2-year Associate's
Degree
Will complete a
4-year Bachelor's
Degree
Will complete a Master's or Doctoral Degree
Spring 2012 6% 17% 4% 19% 31% 24% Spring 2011 5% 17% 4% 17% 33% 24% Spring 2010 4% 16% 4% 18% 32% 26% Spring 2009 7% 16% 4% 17% 32% 23%
Fall 2008 4% 20% 4% 18% 32% 22% Spring 2008 4% 16% 5% 19% 32% 24%
Fall 2007 3% 21% 6% 18% 31% 22% Spring 2007 3% 18% 4% 19% 34% 22%
Fall 2006 2% 21% 4% 17% 32% 23% 93. Has anyone from your school or GEAR UP ever spoken with you about college entrance requirements or the courses that you need to take in high school in order to prepare for college?
Yes No Spring 2012 78% 22% Spring 2011 65% 35% Spring 2010 67% 33% Spring 2009 66% 34%
Fall 2008 68% 32% Spring 2008 68% 32%
Fall 2007 68% 32% Spring 2007 65% 35%
Fall 2006 66% 34%
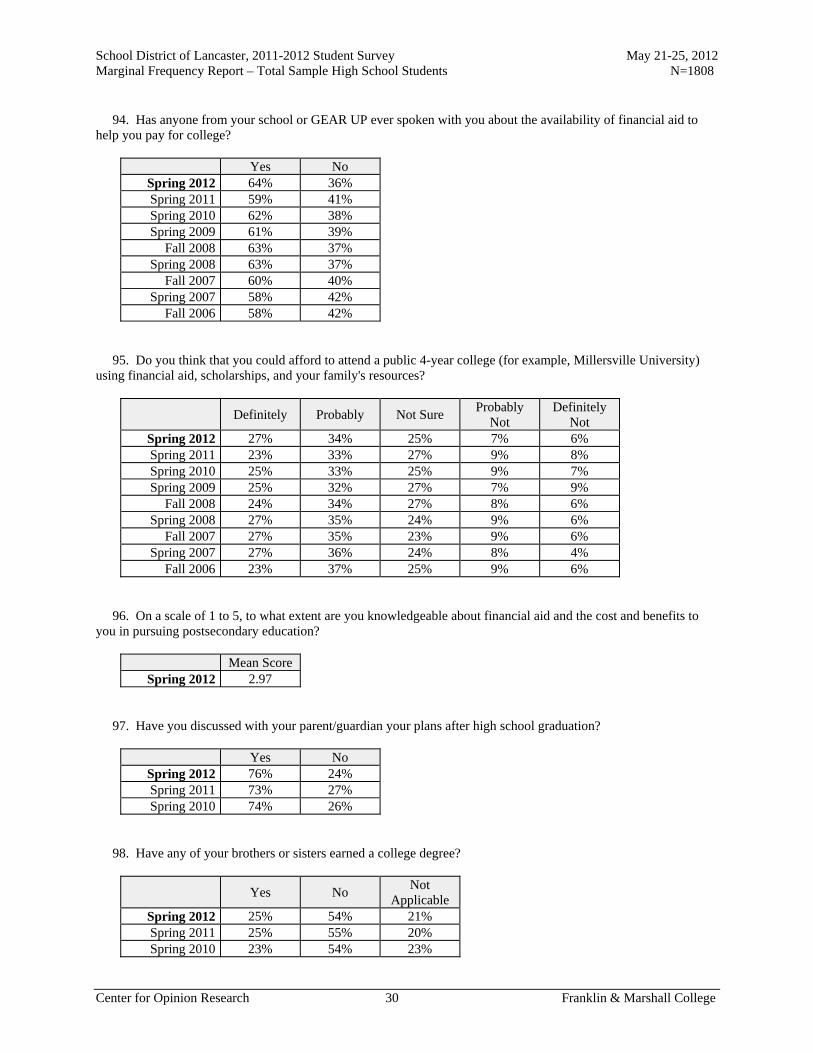
School District of Lancaster, 2011-2012 Student Survey May 21-25, 2012 Marginal Frequency Report – Total Sample High School Students N=1808
Center for Opinion Research 30 Franklin & Marshall College
94. Has anyone from your school or GEAR UP ever spoken with you about the availability of financial aid to help you pay for college?
Yes No Spring 2012 64% 36% Spring 2011 59% 41% Spring 2010 62% 38% Spring 2009 61% 39%
Fall 2008 63% 37% Spring 2008 63% 37%
Fall 2007 60% 40% Spring 2007 58% 42%
Fall 2006 58% 42% 95. Do you think that you could afford to attend a public 4-year college (for example, Millersville University) using financial aid, scholarships, and your family's resources?
Definitely Probably Not Sure Probably
Not Definitely
Not Spring 2012 27% 34% 25% 7% 6% Spring 2011 23% 33% 27% 9% 8% Spring 2010 25% 33% 25% 9% 7% Spring 2009 25% 32% 27% 7% 9%
Fall 2008 24% 34% 27% 8% 6% Spring 2008 27% 35% 24% 9% 6%
Fall 2007 27% 35% 23% 9% 6% Spring 2007 27% 36% 24% 8% 4%
Fall 2006 23% 37% 25% 9% 6% 96. On a scale of 1 to 5, to what extent are you knowledgeable about financial aid and the cost and benefits to you in pursuing postsecondary education?
Mean Score Spring 2012 2.97
97. Have you discussed with your parent/guardian your plans after high school graduation?
Yes No Spring 2012 76% 24% Spring 2011 73% 27% Spring 2010 74% 26%
98. Have any of your brothers or sisters earned a college degree?
Yes No Not
Applicable Spring 2012 25% 54% 21% Spring 2011 25% 55% 20% Spring 2010 23% 54% 23%
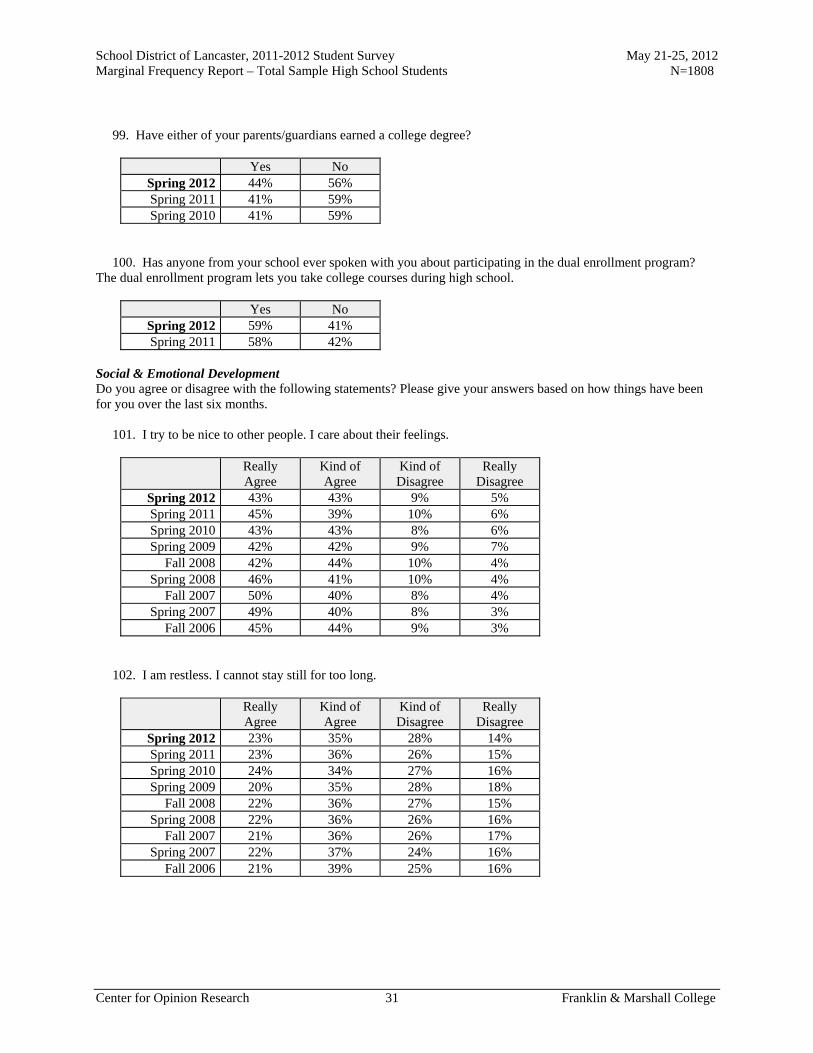
School District of Lancaster, 2011-2012 Student Survey May 21-25, 2012 Marginal Frequency Report – Total Sample High School Students N=1808
Center for Opinion Research 31 Franklin & Marshall College
99. Have either of your parents/guardians earned a college degree?
Yes No Spring 2012 44% 56% Spring 2011 41% 59% Spring 2010 41% 59%
100. Has anyone from your school ever spoken with you about participating in the dual enrollment program? The dual enrollment program lets you take college courses during high school.
Yes No Spring 2012 59% 41% Spring 2011 58% 42%
Social & Emotional Development Do you agree or disagree with the following statements? Please give your answers based on how things have been for you over the last six months. 101. I try to be nice to other people. I care about their feelings.
Really Agree
Kind of Agree
Kind of Disagree
Really Disagree
Spring 2012 43% 43% 9% 5% Spring 2011 45% 39% 10% 6% Spring 2010 43% 43% 8% 6% Spring 2009 42% 42% 9% 7%
Fall 2008 42% 44% 10% 4% Spring 2008 46% 41% 10% 4%
Fall 2007 50% 40% 8% 4% Spring 2007 49% 40% 8% 3%
Fall 2006 45% 44% 9% 3% 102. I am restless. I cannot stay still for too long.
Really Agree
Kind of Agree
Kind of Disagree
Really Disagree
Spring 2012 23% 35% 28% 14% Spring 2011 23% 36% 26% 15% Spring 2010 24% 34% 27% 16% Spring 2009 20% 35% 28% 18%
Fall 2008 22% 36% 27% 15% Spring 2008 22% 36% 26% 16%
Fall 2007 21% 36% 26% 17% Spring 2007 22% 37% 24% 16%
Fall 2006 21% 39% 25% 16%

School District of Lancaster, 2011-2012 Student Survey May 21-25, 2012 Marginal Frequency Report – Total Sample High School Students N=1808
Center for Opinion Research 32 Franklin & Marshall College
103. I get a lot of headaches, stomach-aches or sickness.
Really Agree
Kind of Agree
Kind of Disagree
Really Disagree
Spring 2012 13% 25% 35% 28% Spring 2011 15% 24% 32% 29% Spring 2010 14% 24% 34% 28% Spring 2009 14% 24% 30% 31%
Fall 2008 16% 24% 30% 29% Spring 2008 15% 28% 28% 29%
Fall 2007 13% 24% 31% 32% Spring 2007 14% 24% 31% 31%
Fall 2006 12% 24% 32% 32% 104. I usually share with others, for example CD's, games, food.
Really Agree
Kind of Agree
Kind of Disagree
Really Disagree
Spring 2012 27% 42% 21% 10% Spring 2011 29% 42% 18% 11% Spring 2010 29% 42% 18% 11% Spring 2009 28% 43% 17% 12%
Fall 2008 30% 43% 18% 10% Spring 2008 33% 44% 15% 8%
Fall 2007 38% 42% 13% 7% Spring 2007 39% 44% 11% 6%
Fall 2006 38% 46% 11% 6% 105. I get very angry and often lose my temper.
Really Agree
Kind of Agree
Kind of Disagree
Really Disagree
Spring 2012 15% 25% 34% 27% Spring 2011 16% 25% 33% 27% Spring 2010 15% 25% 31% 29% Spring 2009 15% 26% 31% 28%
Fall 2008 17% 25% 33% 25% Spring 2008 17% 32% 30% 22%
Fall 2007 17% 30% 28% 25% Spring 2007 16% 28% 30% 26%
Fall 2006 20% 30% 28% 23%

School District of Lancaster, 2011-2012 Student Survey May 21-25, 2012 Marginal Frequency Report – Total Sample High School Students N=1808
Center for Opinion Research 33 Franklin & Marshall College
106. I would rather be alone than with people of my age.
Really Agree
Kind of Agree
Kind of Disagree
Really Disagree
Spring 2012 13% 27% 32% 27% Spring 2011 14% 26% 30% 30% Spring 2010 13% 23% 32% 32% Spring 2009 11% 25% 33% 30%
Fall 2008 12% 24% 33% 32% Spring 2008 13% 24% 33% 30%
Fall 2007 11% 22% 32% 34% Spring 2007 11% 24% 30% 36%
Fall 2006 10% 25% 33% 33% 107. I usually do as I am told.
Really Agree
Kind of Agree
Kind of Disagree
Really Disagree
Spring 2012 26% 49% 19% 6% Spring 2011 25% 47% 19% 8% Spring 2010 24% 48% 20% 8% Spring 2009 22% 50% 20% 8%
Fall 2008 25% 49% 20% 6% Spring 2008 24% 51% 18% 7%
Fall 2007 28% 49% 18% 5% Spring 2007 25% 51% 18% 6%
Fall 2006 26% 53% 16% 5% 108. I worry a lot.
Really Agree
Kind of Agree
Kind of Disagree
Really Disagree
Spring 2012 22% 32% 29% 16% Spring 2011 22% 30% 30% 18% Spring 2010 22% 30% 28% 20% Spring 2009 21% 32% 28% 19%
Fall 2008 22% 30% 28% 19% Spring 2008 21% 33% 27% 19%
Fall 2007 21% 30% 28% 21% Spring 2007 22% 29% 29% 20%
Fall 2006 22% 32% 28% 18%

School District of Lancaster, 2011-2012 Student Survey May 21-25, 2012 Marginal Frequency Report – Total Sample High School Students N=1808
Center for Opinion Research 34 Franklin & Marshall College
109. I am helpful if someone is hurt, upset, or feeling ill.
Really Agree
Kind of Agree
Kind of Disagree
Really Disagree
Spring 2012 45% 43% 9% 3% Spring 2011 43% 43% 9% 5% Spring 2010 43% 42% 10% 5% Spring 2009 42% 42% 9% 6%
Fall 2008 44% 44% 9% 4% Spring 2008 46% 44% 7% 3%
Fall 2007 51% 40% 6% 3% Spring 2007 51% 40% 7% 2%
Fall 2006 42% 45% 9% 3% 110. I am constantly moving or squirming.
Really Agree
Kind of Agree
Kind of Disagree
Really Disagree
Spring 2012 18% 36% 30% 16% Spring 2011 18% 34% 31% 16% Spring 2010 16% 32% 34% 17% Spring 2009 15% 33% 33% 18%
Fall 2008 16% 33% 32% 18% Spring 2008 19% 31% 32% 17%
Fall 2007 16% 33% 32% 19% Spring 2007 18% 33% 32% 18%
Fall 2006 15% 32% 30% 23% 111. I have one good friend or more.
Really Agree
Kind of Agree
Kind of Disagree
Really Disagree
Spring 2012 58% 31% 7% 4% Spring 2011 59% 28% 8% 5% Spring 2010 61% 28% 7% 5% Spring 2009 56% 30% 8% 7%
Fall 2008 62% 27% 7% 4% Spring 2008 60% 30% 7% 3%
Fall 2007 67% 24% 7% 3% Spring 2007 69% 22% 6% 3%
Fall 2006 66% 25% 5% 5%

School District of Lancaster, 2011-2012 Student Survey May 21-25, 2012 Marginal Frequency Report – Total Sample High School Students N=1808
Center for Opinion Research 35 Franklin & Marshall College
112. I fight a lot. I can make other people do what I want.
Really Agree
Kind of Agree
Kind of Disagree
Really Disagree
Spring 2012 7% 13% 33% 47% Spring 2011 7% 13% 29% 50% Spring 2010 6% 13% 32% 48% Spring 2009 6% 16% 30% 48%
Fall 2008 6% 16% 32% 46% Spring 2008 8% 18% 33% 41%
Fall 2007 5% 15% 33% 47% Spring 2007 5% 16% 30% 48%
Fall 2006 4% 17% 31% 49% 113. I am often unhappy, depressed, or tearful.
Really Agree
Kind of Agree
Kind of Disagree
Really Disagree
Spring 2012 11% 21% 32% 36% Spring 2011 11% 20% 31% 38% Spring 2010 11% 21% 29% 39% Spring 2009 11% 23% 29% 37%
Fall 2008 11% 22% 29% 37% Spring 2008 13% 23% 29% 35%
Fall 2007 11% 20% 28% 42% Spring 2007 10% 20% 28% 43%
Fall 2006 9% 25% 26% 40% 114. Other people my age generally like me.
Really Agree
Kind of Agree
Kind of Disagree
Really Disagree
Spring 2012 35% 46% 14% 5% Spring 2011 36% 46% 12% 6% Spring 2010 36% 47% 12% 5% Spring 2009 34% 47% 12% 8%
Fall 2008 38% 45% 12% 4% Spring 2008 39% 45% 11% 5%
Fall 2007 43% 44% 9% 4% Spring 2007 42% 44% 10% 3%
Fall 2006 39% 47% 11% 3%

School District of Lancaster, 2011-2012 Student Survey May 21-25, 2012 Marginal Frequency Report – Total Sample High School Students N=1808
Center for Opinion Research 36 Franklin & Marshall College
115. I easily lose my focus. I find it difficult to concentrate.
Really Agree
Kind of Agree
Kind of Disagree
Really Disagree
Spring 2012 20% 31% 32% 17% Spring 2011 20% 32% 29% 18% Spring 2010 21% 31% 29% 18% Spring 2009 20% 31% 29% 20%
Fall 2008 20% 33% 30% 18% Spring 2008 20% 34% 29% 18%
Fall 2007 19% 33% 28% 20% Spring 2007 19% 34% 30% 17%
Fall 2006 19% 36% 27% 19% 116. I am nervous in new situations. I easily lose confidence.
Really Agree
Kind of Agree
Kind of Disagree
Really Disagree
Spring 2012 19% 32% 31% 18% Spring 2011 19% 34% 29% 18% Spring 2010 18% 32% 30% 20% Spring 2009 17% 30% 30% 23%
Fall 2008 17% 32% 31% 21% Spring 2008 16% 34% 29% 21%
Fall 2007 16% 30% 31% 23% Spring 2007 15% 30% 32% 23%
Fall 2006 17% 28% 32% 23% 117. I am kind to younger children.
Really Agree
Kind of Agree
Kind of Disagree
Really Disagree
Spring 2012 49% 34% 11% 6% Spring 2011 49% 33% 12% 6% Spring 2010 50% 33% 11% 6% Spring 2009 50% 31% 12% 7%
Fall 2008 51% 33% 10% 6% Spring 2008 50% 35% 10% 6%
Fall 2007 54% 34% 8% 5% Spring 2007 56% 31% 9% 4%
Fall 2006 57% 32% 7% 4%

School District of Lancaster, 2011-2012 Student Survey May 21-25, 2012 Marginal Frequency Report – Total Sample High School Students N=1808
Center for Opinion Research 37 Franklin & Marshall College
118. I am often accused of lying or cheating.
Really Agree
Kind of Agree
Kind of Disagree
Really Disagree
Spring 2012 9% 16% 27% 48% Spring 2011 10% 16% 26% 49% Spring 2010 8% 15% 25% 51% Spring 2009 10% 15% 24% 52%
Fall 2008 10% 16% 25% 49% Spring 2008 10% 18% 25% 47%
Fall 2007 7% 17% 25% 51% Spring 2007 8% 16% 26% 50%
Fall 2006 8% 18% 26% 49% 119. Other children or young people pick on me or bully me.
Really Agree
Kind of Agree
Kind of Disagree
Really Disagree
Spring 2012 8% 14% 19% 59% Spring 2011 7% 13% 19% 61% Spring 2010 6% 12% 19% 63% Spring 2009 5% 15% 18% 61%
Fall 2008 7% 11% 18% 64% Spring 2008 7% 14% 17% 61%
Fall 2007 4% 12% 16% 68% Spring 2007 5% 11% 17% 68%
Fall 2006 5% 11% 16% 69% 120. I often offer to help others (parents, teachers, children).
Really Agree
Kind of Agree
Kind of Disagree
Really Disagree
Spring 2012 36% 46% 13% 5% Spring 2011 36% 41% 15% 8% Spring 2010 34% 44% 17% 6% Spring 2009 32% 45% 16% 8%
Fall 2008 32% 46% 17% 6% Spring 2008 33% 45% 17% 5%
Fall 2007 35% 45% 15% 4% Spring 2007 37% 44% 15% 4%
Fall 2006 35% 45% 14% 6%
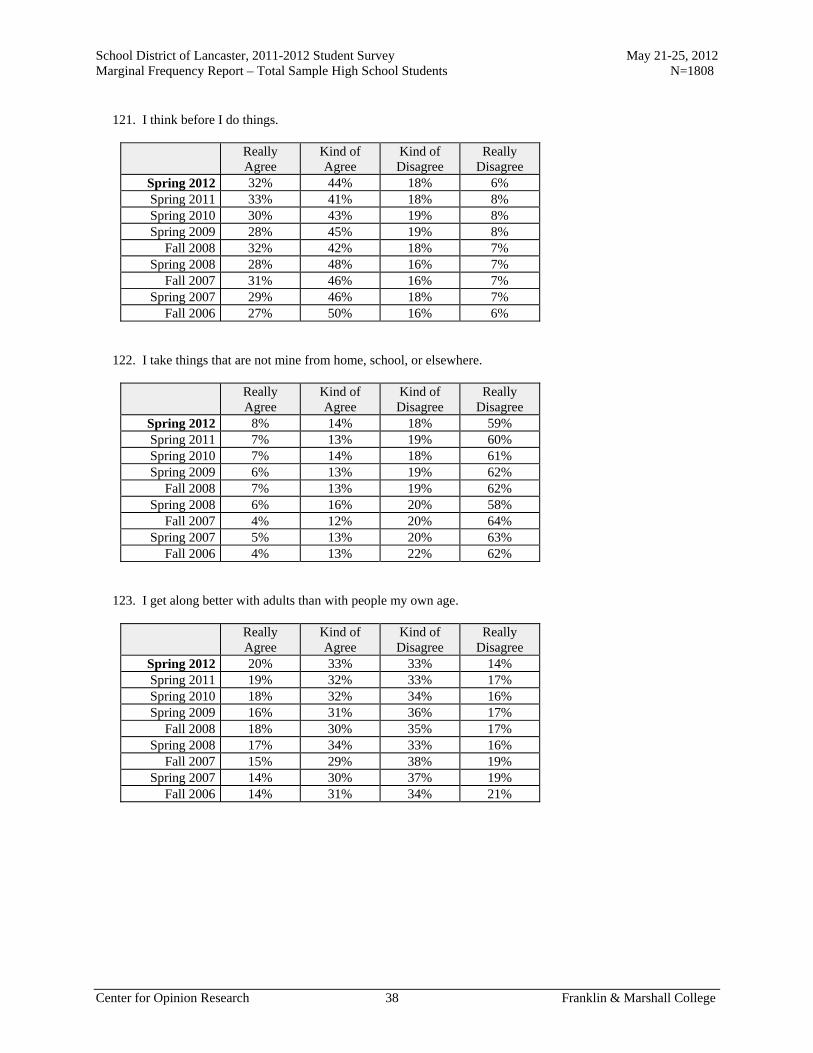
School District of Lancaster, 2011-2012 Student Survey May 21-25, 2012 Marginal Frequency Report – Total Sample High School Students N=1808
Center for Opinion Research 38 Franklin & Marshall College
121. I think before I do things.
Really Agree
Kind of Agree
Kind of Disagree
Really Disagree
Spring 2012 32% 44% 18% 6% Spring 2011 33% 41% 18% 8% Spring 2010 30% 43% 19% 8% Spring 2009 28% 45% 19% 8%
Fall 2008 32% 42% 18% 7% Spring 2008 28% 48% 16% 7%
Fall 2007 31% 46% 16% 7% Spring 2007 29% 46% 18% 7%
Fall 2006 27% 50% 16% 6% 122. I take things that are not mine from home, school, or elsewhere.
Really Agree
Kind of Agree
Kind of Disagree
Really Disagree
Spring 2012 8% 14% 18% 59% Spring 2011 7% 13% 19% 60% Spring 2010 7% 14% 18% 61% Spring 2009 6% 13% 19% 62%
Fall 2008 7% 13% 19% 62% Spring 2008 6% 16% 20% 58%
Fall 2007 4% 12% 20% 64% Spring 2007 5% 13% 20% 63%
Fall 2006 4% 13% 22% 62% 123. I get along better with adults than with people my own age.
Really Agree
Kind of Agree
Kind of Disagree
Really Disagree
Spring 2012 20% 33% 33% 14% Spring 2011 19% 32% 33% 17% Spring 2010 18% 32% 34% 16% Spring 2009 16% 31% 36% 17%
Fall 2008 18% 30% 35% 17% Spring 2008 17% 34% 33% 16%
Fall 2007 15% 29% 38% 19% Spring 2007 14% 30% 37% 19%
Fall 2006 14% 31% 34% 21%
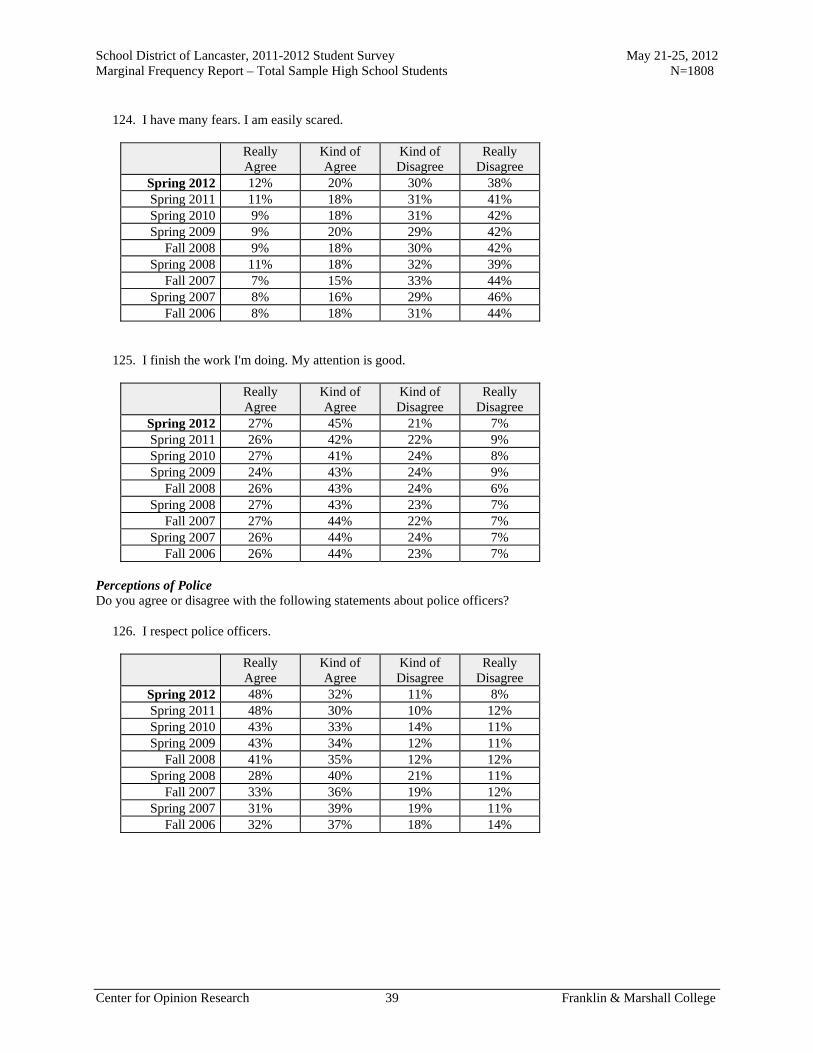
School District of Lancaster, 2011-2012 Student Survey May 21-25, 2012 Marginal Frequency Report – Total Sample High School Students N=1808
Center for Opinion Research 39 Franklin & Marshall College
124. I have many fears. I am easily scared.
Really Agree
Kind of Agree
Kind of Disagree
Really Disagree
Spring 2012 12% 20% 30% 38% Spring 2011 11% 18% 31% 41% Spring 2010 9% 18% 31% 42% Spring 2009 9% 20% 29% 42%
Fall 2008 9% 18% 30% 42% Spring 2008 11% 18% 32% 39%
Fall 2007 7% 15% 33% 44% Spring 2007 8% 16% 29% 46%
Fall 2006 8% 18% 31% 44% 125. I finish the work I'm doing. My attention is good.
Really Agree
Kind of Agree
Kind of Disagree
Really Disagree
Spring 2012 27% 45% 21% 7% Spring 2011 26% 42% 22% 9% Spring 2010 27% 41% 24% 8% Spring 2009 24% 43% 24% 9%
Fall 2008 26% 43% 24% 6% Spring 2008 27% 43% 23% 7%
Fall 2007 27% 44% 22% 7% Spring 2007 26% 44% 24% 7%
Fall 2006 26% 44% 23% 7% Perceptions of Police Do you agree or disagree with the following statements about police officers? 126. I respect police officers.
Really Agree
Kind of Agree
Kind of Disagree
Really Disagree
Spring 2012 48% 32% 11% 8% Spring 2011 48% 30% 10% 12% Spring 2010 43% 33% 14% 11% Spring 2009 43% 34% 12% 11%
Fall 2008 41% 35% 12% 12% Spring 2008 28% 40% 21% 11%
Fall 2007 33% 36% 19% 12% Spring 2007 31% 39% 19% 11%
Fall 2006 32% 37% 18% 14%

School District of Lancaster, 2011-2012 Student Survey May 21-25, 2012 Marginal Frequency Report – Total Sample High School Students N=1808
Center for Opinion Research 40 Franklin & Marshall College
127. I am comfortable approaching police officers.
Really Agree
Kind of Agree
Kind of Disagree
Really Disagree
Spring 2012 35% 38% 17% 10% Spring 2011 37% 33% 16% 14% Spring 2010 35% 34% 18% 12% Spring 2009 33% 35% 18% 14%
Fall 2008 32% 36% 18% 14% Spring 2008 26% 39% 22% 13%
Fall 2007 27% 36% 22% 16% Spring 2007 27% 38% 20% 14%
Fall 2006 28% 37% 22% 13% 128. I would consider police work as a career.
Really Agree
Kind of Agree
Kind of Disagree
Really Disagree
Spring 2012 18% 24% 19% 38% Spring 2011 20% 19% 18% 44% Spring 2010 15% 19% 20% 46% Spring 2009 17% 19% 17% 47%
Fall 2008 15% 19% 18% 48% Spring 2008 12% 23% 20% 45%
Fall 2007 14% 18% 18% 50% Spring 2007 12% 20% 16% 52%
Fall 2006 15% 21% 17% 47% 129. In general, I do not trust the police.
Really Agree
Kind of Agree
Kind of Disagree
Really Disagree
Spring 2012 17% 27% 27% 29% Spring 2011 17% 25% 26% 32% Spring 2010 16% 25% 28% 30% Spring 2009 16% 26% 30% 27%
Fall 2008 18% 27% 28% 28% Spring 2008 17% 29% 33% 21%
Fall 2007 17% 25% 32% 26% Spring 2007 16% 27% 32% 24%
Fall 2006 17% 30% 29% 23%

School District of Lancaster, 2011-2012 Student Survey May 21-25, 2012 Marginal Frequency Report – Total Sample High School Students N=1808
Center for Opinion Research 41 Franklin & Marshall College
130. Police do not belong in schools unless there has been a crime.
Really Agree
Kind of Agree
Kind of Disagree
Really Disagree
Spring 2012 18% 24% 32% 26% Spring 2011 17% 21% 29% 33% Spring 2010 19% 21% 30% 31% Spring 2009 16% 23% 31% 30%
Fall 2008 18% 21% 30% 31% Spring 2008 18% 26% 32% 24%
Fall 2007 18% 25% 30% 27% Spring 2007 16% 23% 30% 31%
Fall 2006 21% 23% 29% 28% Hidden Delinquency In the last 12 months, how many times did you... 131. Deliberately damage property that did not belong to you.
Never 1 or 2 Times 3 or 4 Times5 or More
Times Spring 2012 73% 18% 4% 4% Spring 2011 72% 17% 4% 7% Spring 2010 72% 18% 4% 6% Spring 2009 73% 16% 5% 6%
Fall 2008 73% 18% 4% 5% Spring 2008 72% 18% 5% 5%
Fall 2007 70% 22% 3% 4% Spring 2007 74% 18% 5% 4%
Fall 2006 72% 21% 3% 4% 132. Take something from a store without paying for it.
Never 1 or 2 Times 3 or 4 Times5 or More
Times Spring 2012 76% 15% 5% 5% Spring 2011 73% 14% 5% 7% Spring 2010 74% 14% 6% 6% Spring 2009 76% 13% 5% 6%
Fall 2008 77% 14% 4% 4% Spring 2008 75% 15% 5% 5%
Fall 2007 77% 15% 4% 5% Spring 2007 77% 14% 4% 5%
Fall 2006 81% 11% 3% 5%

School District of Lancaster, 2011-2012 Student Survey May 21-25, 2012 Marginal Frequency Report – Total Sample High School Students N=1808
Center for Opinion Research 42 Franklin & Marshall College
133. Hurt someone badly enough for that person to need bandages or care from a doctor or nurse.
Never 1 or 2 Times 3 or 4 Times5 or More
Times Spring 2012 76% 15% 4% 4% Spring 2011 75% 14% 4% 6% Spring 2010 76% 15% 5% 4% Spring 2009 77% 13% 4% 5%
Fall 2008 76% 14% 6% 4% Spring 2008 75% 14% 6% 5%
Fall 2007 74% 18% 5% 3% Spring 2007 79% 13% 4% 4%
Fall 2006 77% 16% 5% 2% 134. Drive a car without its owner's permission.
Never 1 or 2 Times 3 or 4 Times5 or More
Times Spring 2012 85% 7% 3% 5% Spring 2011 81% 9% 4% 6% Spring 2010 83% 9% 3% 5% Spring 2009 82% 9% 4% 6%
Fall 2008 83% 9% 4% 5% Spring 2008 81% 10% 4% 5%
Fall 2007 85% 8% 3% 4% Spring 2007 85% 9% 2% 4%
Fall 2006 87% 6% 3% 4% 135. Steal something worth more than $50.
Never 1 or 2 Times 3 or 4 Times5 or More
Times Spring 2012 85% 8% 4% 3% Spring 2011 84% 6% 4% 6% Spring 2010 85% 6% 4% 5% Spring 2009 85% 6% 3% 6%
Fall 2008 87% 6% 3% 4% Spring 2008 86% 6% 4% 5%
Fall 2007 88% 6% 3% 3% Spring 2007 88% 6% 3% 3%
Fall 2006 89% 6% 2% 3%
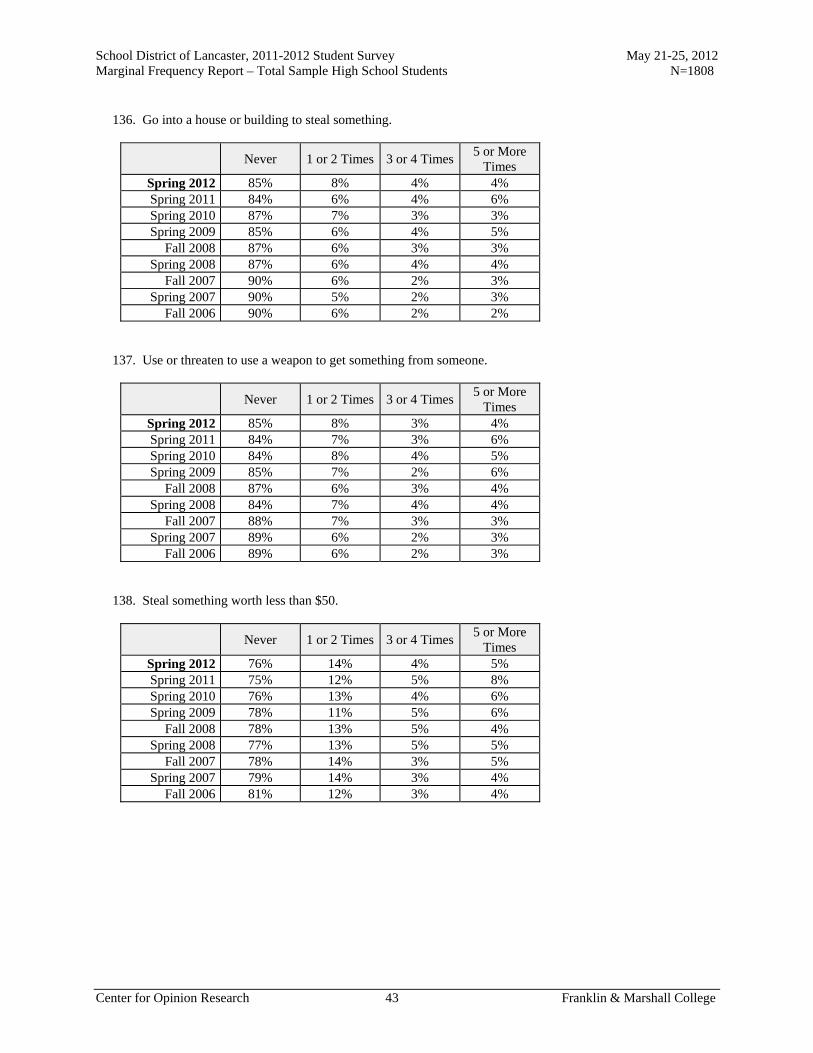
School District of Lancaster, 2011-2012 Student Survey May 21-25, 2012 Marginal Frequency Report – Total Sample High School Students N=1808
Center for Opinion Research 43 Franklin & Marshall College
136. Go into a house or building to steal something.
Never 1 or 2 Times 3 or 4 Times5 or More
Times Spring 2012 85% 8% 4% 4% Spring 2011 84% 6% 4% 6% Spring 2010 87% 7% 3% 3% Spring 2009 85% 6% 4% 5%
Fall 2008 87% 6% 3% 3% Spring 2008 87% 6% 4% 4%
Fall 2007 90% 6% 2% 3% Spring 2007 90% 5% 2% 3%
Fall 2006 90% 6% 2% 2% 137. Use or threaten to use a weapon to get something from someone.
Never 1 or 2 Times 3 or 4 Times5 or More
Times Spring 2012 85% 8% 3% 4% Spring 2011 84% 7% 3% 6% Spring 2010 84% 8% 4% 5% Spring 2009 85% 7% 2% 6%
Fall 2008 87% 6% 3% 4% Spring 2008 84% 7% 4% 4%
Fall 2007 88% 7% 3% 3% Spring 2007 89% 6% 2% 3%
Fall 2006 89% 6% 2% 3% 138. Steal something worth less than $50.
Never 1 or 2 Times 3 or 4 Times5 or More
Times Spring 2012 76% 14% 4% 5% Spring 2011 75% 12% 5% 8% Spring 2010 76% 13% 4% 6% Spring 2009 78% 11% 5% 6%
Fall 2008 78% 13% 5% 4% Spring 2008 77% 13% 5% 5%
Fall 2007 78% 14% 3% 5% Spring 2007 79% 14% 3% 4%
Fall 2006 81% 12% 3% 4%
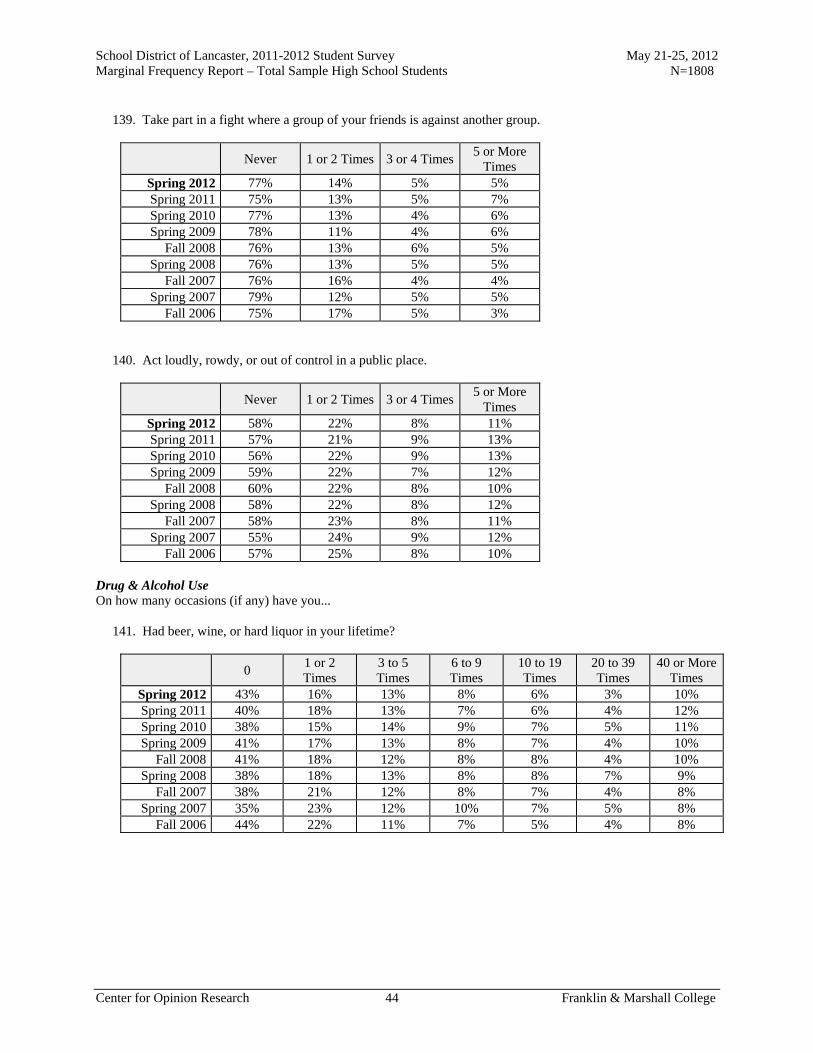
School District of Lancaster, 2011-2012 Student Survey May 21-25, 2012 Marginal Frequency Report – Total Sample High School Students N=1808
Center for Opinion Research 44 Franklin & Marshall College
139. Take part in a fight where a group of your friends is against another group.
Never 1 or 2 Times 3 or 4 Times5 or More
Times Spring 2012 77% 14% 5% 5% Spring 2011 75% 13% 5% 7% Spring 2010 77% 13% 4% 6% Spring 2009 78% 11% 4% 6%
Fall 2008 76% 13% 6% 5% Spring 2008 76% 13% 5% 5%
Fall 2007 76% 16% 4% 4% Spring 2007 79% 12% 5% 5%
Fall 2006 75% 17% 5% 3% 140. Act loudly, rowdy, or out of control in a public place.
Never 1 or 2 Times 3 or 4 Times5 or More
Times Spring 2012 58% 22% 8% 11% Spring 2011 57% 21% 9% 13% Spring 2010 56% 22% 9% 13% Spring 2009 59% 22% 7% 12%
Fall 2008 60% 22% 8% 10% Spring 2008 58% 22% 8% 12%
Fall 2007 58% 23% 8% 11% Spring 2007 55% 24% 9% 12%
Fall 2006 57% 25% 8% 10% Drug & Alcohol Use On how many occasions (if any) have you... 141. Had beer, wine, or hard liquor in your lifetime?
0 1 or 2 Times
3 to 5 Times
6 to 9 Times
10 to 19 Times
20 to 39 Times
40 or More Times
Spring 2012 43% 16% 13% 8% 6% 3% 10% Spring 2011 40% 18% 13% 7% 6% 4% 12% Spring 2010 38% 15% 14% 9% 7% 5% 11% Spring 2009 41% 17% 13% 8% 7% 4% 10%
Fall 2008 41% 18% 12% 8% 8% 4% 10% Spring 2008 38% 18% 13% 8% 8% 7% 9%
Fall 2007 38% 21% 12% 8% 7% 4% 8% Spring 2007 35% 23% 12% 10% 7% 5% 8%
Fall 2006 44% 22% 11% 7% 5% 4% 8%
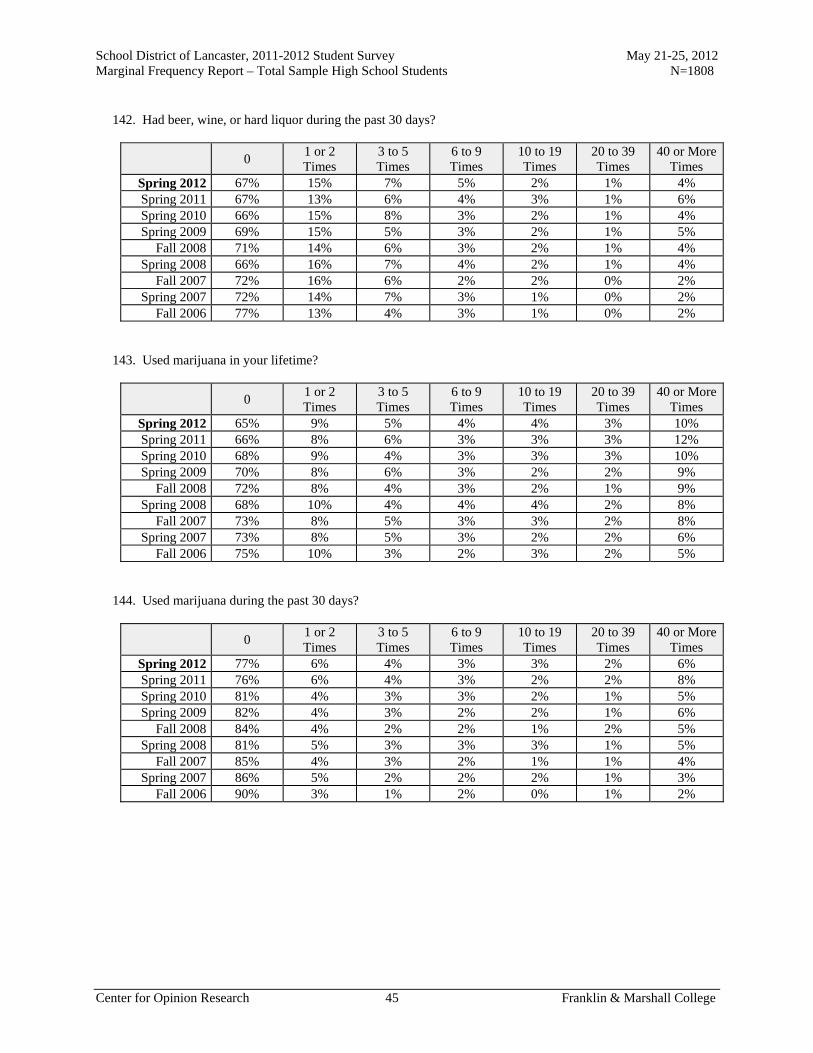
School District of Lancaster, 2011-2012 Student Survey May 21-25, 2012 Marginal Frequency Report – Total Sample High School Students N=1808
Center for Opinion Research 45 Franklin & Marshall College
142. Had beer, wine, or hard liquor during the past 30 days?
0 1 or 2 Times
3 to 5 Times
6 to 9 Times
10 to 19 Times
20 to 39 Times
40 or More Times
Spring 2012 67% 15% 7% 5% 2% 1% 4% Spring 2011 67% 13% 6% 4% 3% 1% 6% Spring 2010 66% 15% 8% 3% 2% 1% 4% Spring 2009 69% 15% 5% 3% 2% 1% 5%
Fall 2008 71% 14% 6% 3% 2% 1% 4% Spring 2008 66% 16% 7% 4% 2% 1% 4%
Fall 2007 72% 16% 6% 2% 2% 0% 2% Spring 2007 72% 14% 7% 3% 1% 0% 2%
Fall 2006 77% 13% 4% 3% 1% 0% 2% 143. Used marijuana in your lifetime?
0 1 or 2 Times
3 to 5 Times
6 to 9 Times
10 to 19 Times
20 to 39 Times
40 or More Times
Spring 2012 65% 9% 5% 4% 4% 3% 10% Spring 2011 66% 8% 6% 3% 3% 3% 12% Spring 2010 68% 9% 4% 3% 3% 3% 10% Spring 2009 70% 8% 6% 3% 2% 2% 9%
Fall 2008 72% 8% 4% 3% 2% 1% 9% Spring 2008 68% 10% 4% 4% 4% 2% 8%
Fall 2007 73% 8% 5% 3% 3% 2% 8% Spring 2007 73% 8% 5% 3% 2% 2% 6%
Fall 2006 75% 10% 3% 2% 3% 2% 5% 144. Used marijuana during the past 30 days?
0 1 or 2 Times
3 to 5 Times
6 to 9 Times
10 to 19 Times
20 to 39 Times
40 or More Times
Spring 2012 77% 6% 4% 3% 3% 2% 6% Spring 2011 76% 6% 4% 3% 2% 2% 8% Spring 2010 81% 4% 3% 3% 2% 1% 5% Spring 2009 82% 4% 3% 2% 2% 1% 6%
Fall 2008 84% 4% 2% 2% 1% 2% 5% Spring 2008 81% 5% 3% 3% 3% 1% 5%
Fall 2007 85% 4% 3% 2% 1% 1% 4% Spring 2007 86% 5% 2% 2% 2% 1% 3%
Fall 2006 90% 3% 1% 2% 0% 1% 2%
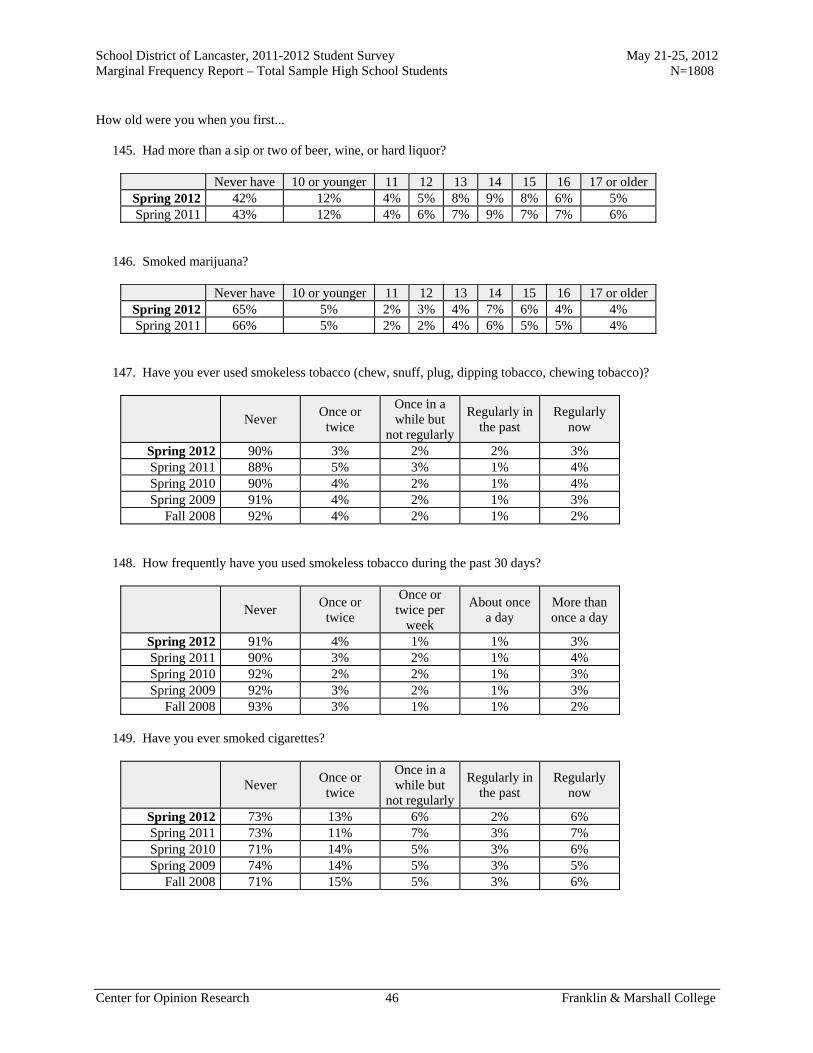
School District of Lancaster, 2011-2012 Student Survey May 21-25, 2012 Marginal Frequency Report – Total Sample High School Students N=1808
Center for Opinion Research 46 Franklin & Marshall College
How old were you when you first... 145. Had more than a sip or two of beer, wine, or hard liquor?
Never have 10 or younger 11 12 13 14 15 16 17 or older Spring 2012 42% 12% 4% 5% 8% 9% 8% 6% 5% Spring 2011 43% 12% 4% 6% 7% 9% 7% 7% 6%
146. Smoked marijuana?
Never have 10 or younger 11 12 13 14 15 16 17 or older Spring 2012 65% 5% 2% 3% 4% 7% 6% 4% 4% Spring 2011 66% 5% 2% 2% 4% 6% 5% 5% 4%
147. Have you ever used smokeless tobacco (chew, snuff, plug, dipping tobacco, chewing tobacco)?
Never Once or
twice
Once in a while but
not regularly
Regularly in the past
Regularly now
Spring 2012 90% 3% 2% 2% 3% Spring 2011 88% 5% 3% 1% 4% Spring 2010 90% 4% 2% 1% 4% Spring 2009 91% 4% 2% 1% 3%
Fall 2008 92% 4% 2% 1% 2% 148. How frequently have you used smokeless tobacco during the past 30 days?
Never Once or
twice
Once or twice per
week
About once a day
More than once a day
Spring 2012 91% 4% 1% 1% 3% Spring 2011 90% 3% 2% 1% 4% Spring 2010 92% 2% 2% 1% 3% Spring 2009 92% 3% 2% 1% 3%
Fall 2008 93% 3% 1% 1% 2% 149. Have you ever smoked cigarettes?
Never Once or
twice
Once in a while but
not regularly
Regularly in the past
Regularly now
Spring 2012 73% 13% 6% 2% 6% Spring 2011 73% 11% 7% 3% 7% Spring 2010 71% 14% 5% 3% 6% Spring 2009 74% 14% 5% 3% 5%
Fall 2008 71% 15% 5% 3% 6%
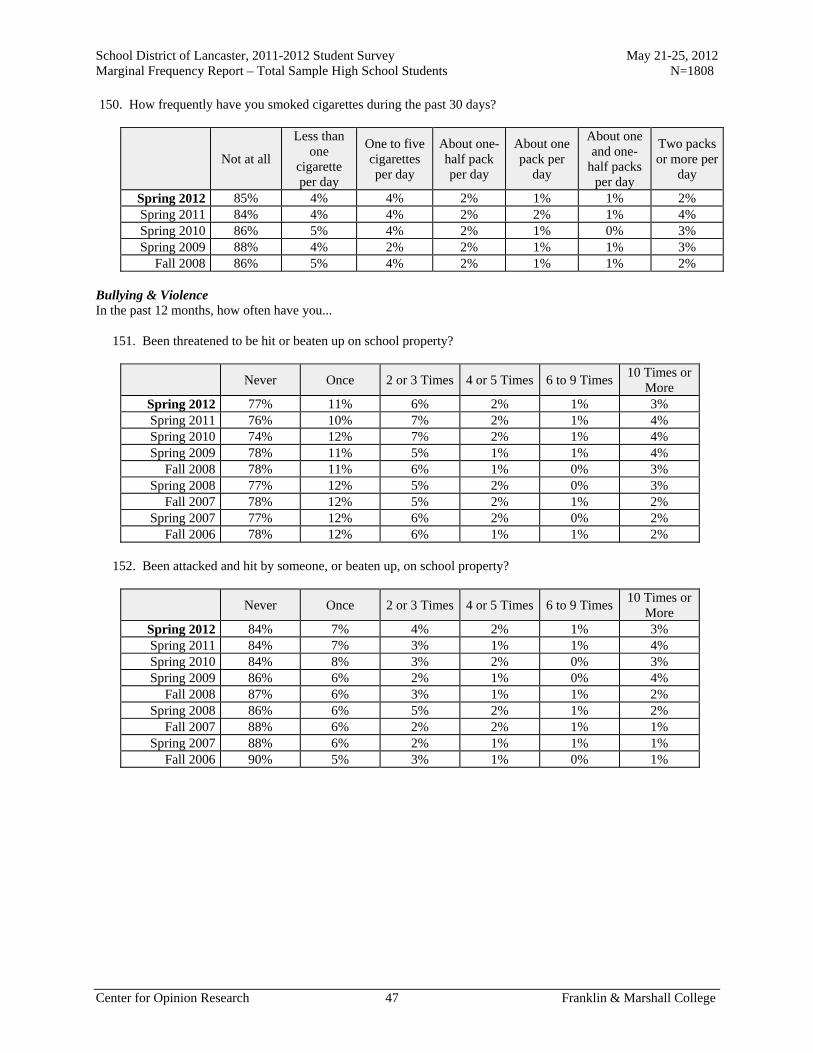
School District of Lancaster, 2011-2012 Student Survey May 21-25, 2012 Marginal Frequency Report – Total Sample High School Students N=1808
Center for Opinion Research 47 Franklin & Marshall College
150. How frequently have you smoked cigarettes during the past 30 days?
Not at all
Less than one
cigarette per day
One to five cigarettes per day
About one-half pack per day
About one pack per
day
About one and one-
half packs per day
Two packs or more per
day
Spring 2012 85% 4% 4% 2% 1% 1% 2% Spring 2011 84% 4% 4% 2% 2% 1% 4% Spring 2010 86% 5% 4% 2% 1% 0% 3% Spring 2009 88% 4% 2% 2% 1% 1% 3%
Fall 2008 86% 5% 4% 2% 1% 1% 2% Bullying & Violence In the past 12 months, how often have you... 151. Been threatened to be hit or beaten up on school property?
Never Once 2 or 3 Times 4 or 5 Times 6 to 9 Times 10 Times or
More Spring 2012 77% 11% 6% 2% 1% 3% Spring 2011 76% 10% 7% 2% 1% 4% Spring 2010 74% 12% 7% 2% 1% 4% Spring 2009 78% 11% 5% 1% 1% 4%
Fall 2008 78% 11% 6% 1% 0% 3% Spring 2008 77% 12% 5% 2% 0% 3%
Fall 2007 78% 12% 5% 2% 1% 2% Spring 2007 77% 12% 6% 2% 0% 2%
Fall 2006 78% 12% 6% 1% 1% 2% 152. Been attacked and hit by someone, or beaten up, on school property?
Never Once 2 or 3 Times 4 or 5 Times 6 to 9 Times 10 Times or
More Spring 2012 84% 7% 4% 2% 1% 3% Spring 2011 84% 7% 3% 1% 1% 4% Spring 2010 84% 8% 3% 2% 0% 3% Spring 2009 86% 6% 2% 1% 0% 4%
Fall 2008 87% 6% 3% 1% 1% 2% Spring 2008 86% 6% 5% 2% 1% 2%
Fall 2007 88% 6% 2% 2% 1% 1% Spring 2007 88% 6% 2% 1% 1% 1%
Fall 2006 90% 5% 3% 1% 0% 1%
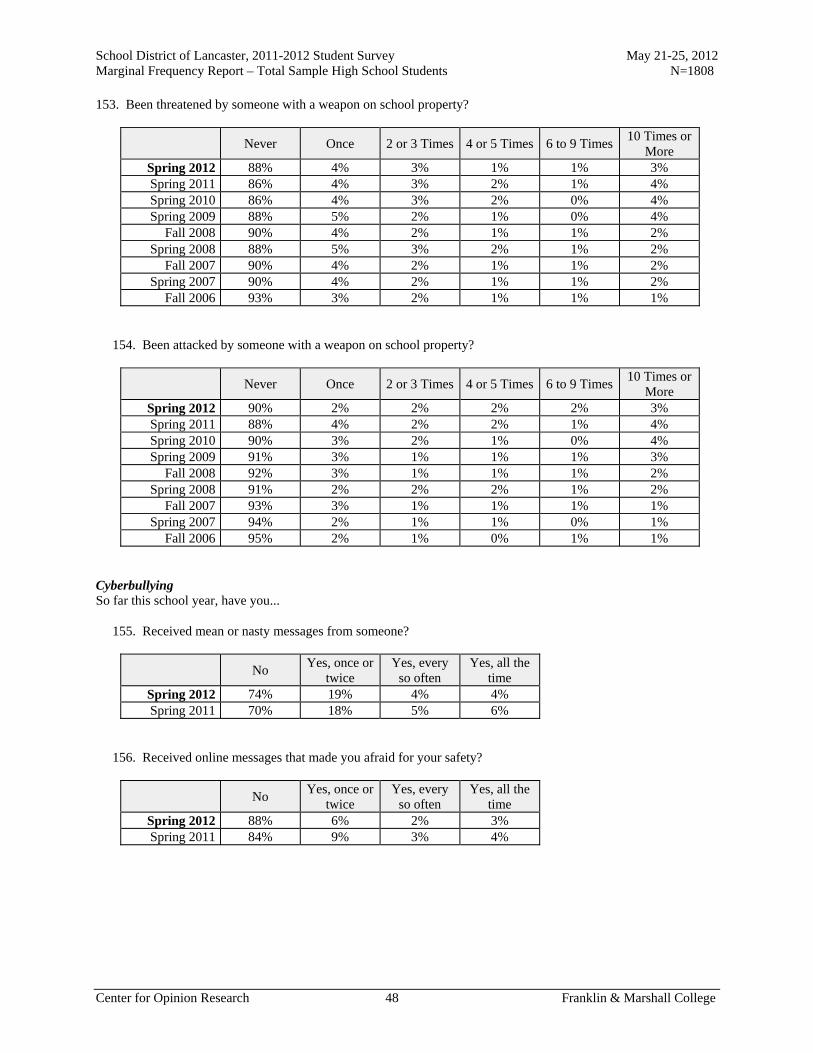
School District of Lancaster, 2011-2012 Student Survey May 21-25, 2012 Marginal Frequency Report – Total Sample High School Students N=1808
Center for Opinion Research 48 Franklin & Marshall College
153. Been threatened by someone with a weapon on school property?
Never Once 2 or 3 Times 4 or 5 Times 6 to 9 Times 10 Times or
More Spring 2012 88% 4% 3% 1% 1% 3% Spring 2011 86% 4% 3% 2% 1% 4% Spring 2010 86% 4% 3% 2% 0% 4% Spring 2009 88% 5% 2% 1% 0% 4%
Fall 2008 90% 4% 2% 1% 1% 2% Spring 2008 88% 5% 3% 2% 1% 2%
Fall 2007 90% 4% 2% 1% 1% 2% Spring 2007 90% 4% 2% 1% 1% 2%
Fall 2006 93% 3% 2% 1% 1% 1% 154. Been attacked by someone with a weapon on school property?
Never Once 2 or 3 Times 4 or 5 Times 6 to 9 Times 10 Times or
More Spring 2012 90% 2% 2% 2% 2% 3% Spring 2011 88% 4% 2% 2% 1% 4% Spring 2010 90% 3% 2% 1% 0% 4% Spring 2009 91% 3% 1% 1% 1% 3%
Fall 2008 92% 3% 1% 1% 1% 2% Spring 2008 91% 2% 2% 2% 1% 2%
Fall 2007 93% 3% 1% 1% 1% 1% Spring 2007 94% 2% 1% 1% 0% 1%
Fall 2006 95% 2% 1% 0% 1% 1% Cyberbullying So far this school year, have you... 155. Received mean or nasty messages from someone?
No Yes, once or
twice Yes, every
so often Yes, all the
time Spring 2012 74% 19% 4% 4% Spring 2011 70% 18% 5% 6%
156. Received online messages that made you afraid for your safety?
No Yes, once or
twice Yes, every
so often Yes, all the
time Spring 2012 88% 6% 2% 3% Spring 2011 84% 9% 3% 4%

School District of Lancaster, 2011-2012 Student Survey May 21-25, 2012 Marginal Frequency Report – Total Sample High School Students N=1808
Center for Opinion Research 49 Franklin & Marshall College
157. Had someone send or post gossip, rumors, or other hurtful material about you?
No Yes, once or
twice Yes, every
so often Yes, all the
time Spring 2012 75% 16% 4% 4% Spring 2011 70% 18% 5% 7%
158. Had someone share your personal secrets or pictures online without your permission?
No Yes, once or
twice Yes, every
so often Yes, all the
time Spring 2012 84% 8% 3% 4% Spring 2011 81% 11% 3% 5%
159. Do you use the Internet at home, or not?
Yes No Spring 2012 89% 11% Spring 2011 87% 13%
160. How many hours do you normally spend online using the Internet each day?
Less than 1
hour 1 hour 2 hours 3 hours
4 or more hours
Spring 2012 25% 19% 21% 12% 23% Spring 2011 28% 16% 25% 11% 20%
Report V
Marginal Frequency Report J.P. McCaskey High School
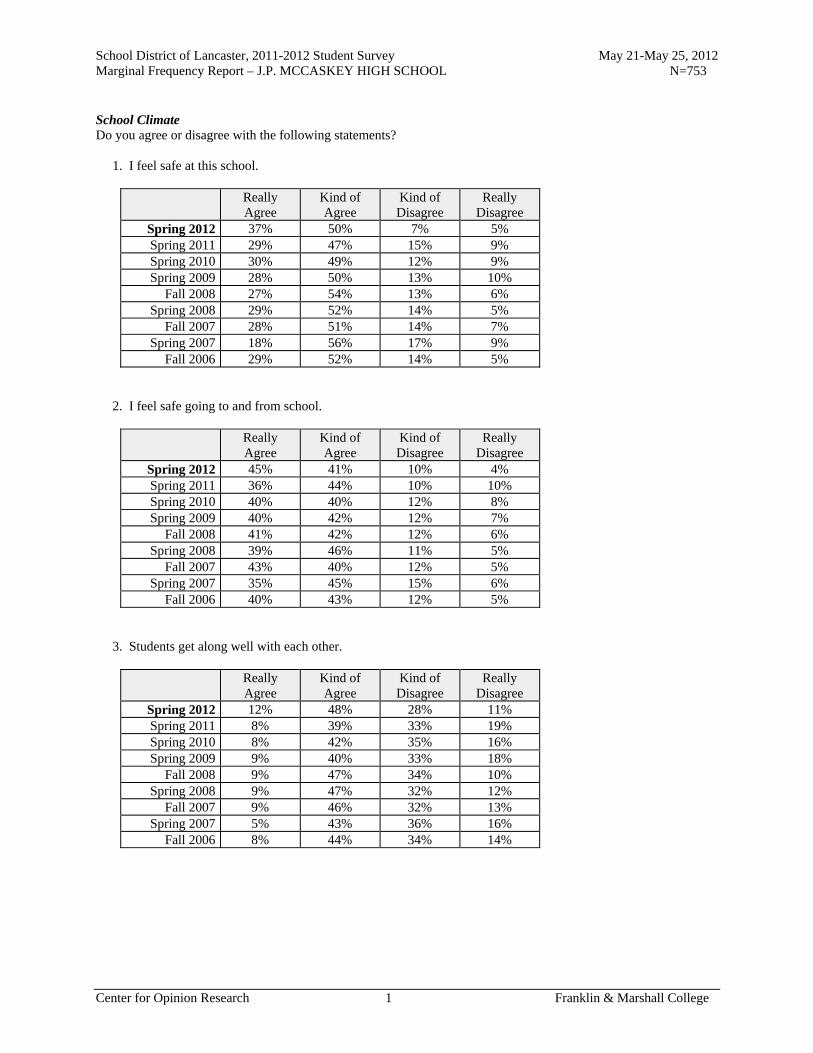
School District of Lancaster, 2011-2012 Student Survey May 21-May 25, 2012 Marginal Frequency Report – J.P. MCCASKEY HIGH SCHOOL N=753
Center for Opinion Research 1 Franklin & Marshall College
School Climate Do you agree or disagree with the following statements? 1. I feel safe at this school.
Really Agree
Kind of Agree
Kind of Disagree
Really Disagree
Spring 2012 37% 50% 7% 5% Spring 2011 29% 47% 15% 9% Spring 2010 30% 49% 12% 9% Spring 2009 28% 50% 13% 10%
Fall 2008 27% 54% 13% 6% Spring 2008 29% 52% 14% 5%
Fall 2007 28% 51% 14% 7% Spring 2007 18% 56% 17% 9%
Fall 2006 29% 52% 14% 5% 2. I feel safe going to and from school.
Really Agree
Kind of Agree
Kind of Disagree
Really Disagree
Spring 2012 45% 41% 10% 4% Spring 2011 36% 44% 10% 10% Spring 2010 40% 40% 12% 8% Spring 2009 40% 42% 12% 7%
Fall 2008 41% 42% 12% 6% Spring 2008 39% 46% 11% 5%
Fall 2007 43% 40% 12% 5% Spring 2007 35% 45% 15% 6%
Fall 2006 40% 43% 12% 5% 3. Students get along well with each other.
Really Agree
Kind of Agree
Kind of Disagree
Really Disagree
Spring 2012 12% 48% 28% 11% Spring 2011 8% 39% 33% 19% Spring 2010 8% 42% 35% 16% Spring 2009 9% 40% 33% 18%
Fall 2008 9% 47% 34% 10% Spring 2008 9% 47% 32% 12%
Fall 2007 9% 46% 32% 13% Spring 2007 5% 43% 36% 16%
Fall 2006 8% 44% 34% 14%

School District of Lancaster, 2011-2012 Student Survey May 21-May 25, 2012 Marginal Frequency Report – J.P. MCCASKEY HIGH SCHOOL N=753
Center for Opinion Research 2 Franklin & Marshall College
4. Students get along well with teachers.
Really Agree
Kind of Agree
Kind of Disagree
Really Disagree
Spring 2012 13% 47% 29% 10% Spring 2011 9% 42% 33% 16% Spring 2010 7% 41% 37% 16% Spring 2009 9% 41% 34% 17%
Fall 2008 9% 48% 33% 10% Spring 2008 8% 48% 34% 10%
Fall 2007 9% 49% 33% 10% Spring 2007 6% 46% 35% 13%
Fall 2006 7% 49% 33% 10% 5. I like my school.
Really Agree
Kind of Agree
Kind of Disagree
Really Disagree
Spring 2012 37% 42% 13% 9% Spring 2011 27% 41% 18% 13% Spring 2010 28% 44% 16% 12% Spring 2009 27% 43% 15% 15%
Fall 2008 35% 44% 13% 8% Spring 2008 30% 47% 14% 8%
Fall 2007 32% 44% 14% 10% Spring 2007 28% 47% 15% 10%
Fall 2006 34% 40% 17% 10% 6. I like my teachers.
Really Agree
Kind of Agree
Kind of Disagree
Really Disagree
Spring 2012 33% 49% 12% 5% Spring 2011 28% 50% 13% 9% Spring 2010 28% 48% 16% 8% Spring 2009 23% 51% 18% 7%
Fall 2008 25% 54% 16% 5% Spring 2008 27% 54% 14% 5%
Fall 2007 29% 54% 13% 4% Spring 2007 25% 56% 13% 5%
Fall 2006 28% 48% 14% 8%

School District of Lancaster, 2011-2012 Student Survey May 21-May 25, 2012 Marginal Frequency Report – J.P. MCCASKEY HIGH SCHOOL N=753
Center for Opinion Research 3 Franklin & Marshall College
7. There is a teacher or some other adult at this school who really cares about me.
Really Agree
Kind of Agree
Kind of Disagree
Really Disagree
Spring 2012 45% 39% 10% 6% Spring 2011 38% 40% 13% 9% Spring 2010 40% 38% 12% 10% Spring 2009 32% 42% 16% 10%
Fall 2008 32% 42% 19% 8% Spring 2008 34% 41% 16% 9%
Fall 2007 35% 39% 18% 8% Spring 2007 36% 40% 15% 9%
Fall 2006 38% 30% 20% 12% 8. There is a teacher or some other adult at this school who cares when I am not here.
Really Agree
Kind of Agree
Kind of Disagree
Really Disagree
Spring 2012 35% 37% 18% 10% Spring 2011 28% 40% 19% 12% Spring 2010 31% 38% 18% 13% Spring 2009 26% 42% 18% 15%
Fall 2008 25% 37% 26% 13% Spring 2008 25% 42% 21% 12%
Fall 2007 26% 37% 24% 12% Spring 2007 27% 39% 21% 13%
Fall 2006 25% 29% 27% 19% 9. There is a teacher or some other adult at this school who listens to me when I have something to say.
Really Agree
Kind of Agree
Kind of Disagree
Really Disagree
Spring 2012 45% 38% 11% 5% Spring 2011 36% 40% 15% 9% Spring 2010 38% 43% 12% 8% Spring 2009 33% 43% 13% 10%
Fall 2008 34% 44% 17% 5% Spring 2008 34% 45% 14% 6%
Fall 2007 40% 41% 13% 6% Spring 2007 37% 41% 16% 7%
Fall 2006 42% 35% 17% 6%

School District of Lancaster, 2011-2012 Student Survey May 21-May 25, 2012 Marginal Frequency Report – J.P. MCCASKEY HIGH SCHOOL N=753
Center for Opinion Research 4 Franklin & Marshall College
10. There is a teacher or some other adult at this school who tells me when I do a good job.
Really Agree
Kind of Agree
Kind of Disagree
Really Disagree
Spring 2012 49% 39% 6% 6% Spring 2011 41% 41% 10% 8% Spring 2010 39% 42% 12% 7% Spring 2009 34% 46% 12% 8%
Fall 2008 36% 46% 14% 4% Spring 2008 35% 46% 13% 6%
Fall 2007 40% 44% 11% 6% Spring 2007 40% 42% 12% 6%
Fall 2006 44% 37% 12% 7% 11. There is a teacher or some other adult at this school who always wants me to do my best.
Really Agree
Kind of Agree
Kind of Disagree
Really Disagree
Spring 2012 55% 35% 6% 4% Spring 2011 48% 36% 10% 7% Spring 2010 48% 38% 9% 5% Spring 2009 42% 41% 10% 7%
Fall 2008 44% 44% 9% 3% Spring 2008 46% 40% 9% 5%
Fall 2007 52% 37% 8% 3% Spring 2007 52% 36% 8% 4%
Fall 2006 56% 36% 6% 3% 12. There is a teacher or some other adult at this school who believes that I will be a success.
Really Agree
Kind of Agree
Kind of Disagree
Really Disagree
Spring 2012 48% 39% 9% 4% Spring 2011 41% 41% 10% 8% Spring 2010 44% 38% 12% 6% Spring 2009 37% 46% 9% 8%
Fall 2008 40% 45% 11% 5% Spring 2008 41% 43% 11% 6%
Fall 2007 45% 39% 11% 5% Spring 2007 46% 38% 11% 5%
Fall 2006 48% 38% 12% 2%
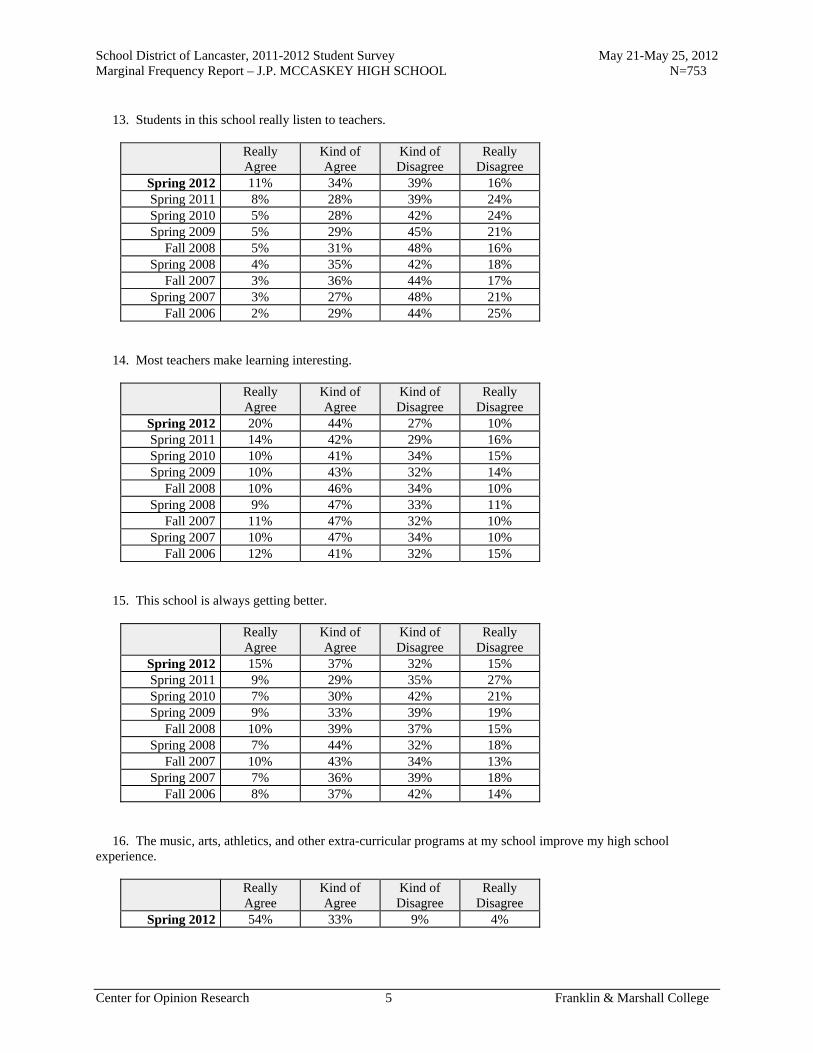
School District of Lancaster, 2011-2012 Student Survey May 21-May 25, 2012 Marginal Frequency Report – J.P. MCCASKEY HIGH SCHOOL N=753
Center for Opinion Research 5 Franklin & Marshall College
13. Students in this school really listen to teachers.
Really Agree
Kind of Agree
Kind of Disagree
Really Disagree
Spring 2012 11% 34% 39% 16% Spring 2011 8% 28% 39% 24% Spring 2010 5% 28% 42% 24% Spring 2009 5% 29% 45% 21%
Fall 2008 5% 31% 48% 16% Spring 2008 4% 35% 42% 18%
Fall 2007 3% 36% 44% 17% Spring 2007 3% 27% 48% 21%
Fall 2006 2% 29% 44% 25% 14. Most teachers make learning interesting.
Really Agree
Kind of Agree
Kind of Disagree
Really Disagree
Spring 2012 20% 44% 27% 10% Spring 2011 14% 42% 29% 16% Spring 2010 10% 41% 34% 15% Spring 2009 10% 43% 32% 14%
Fall 2008 10% 46% 34% 10% Spring 2008 9% 47% 33% 11%
Fall 2007 11% 47% 32% 10% Spring 2007 10% 47% 34% 10%
Fall 2006 12% 41% 32% 15% 15. This school is always getting better.
Really Agree
Kind of Agree
Kind of Disagree
Really Disagree
Spring 2012 15% 37% 32% 15% Spring 2011 9% 29% 35% 27% Spring 2010 7% 30% 42% 21% Spring 2009 9% 33% 39% 19%
Fall 2008 10% 39% 37% 15% Spring 2008 7% 44% 32% 18%
Fall 2007 10% 43% 34% 13% Spring 2007 7% 36% 39% 18%
Fall 2006 8% 37% 42% 14% 16. The music, arts, athletics, and other extra-curricular programs at my school improve my high school experience.
Really Agree
Kind of Agree
Kind of Disagree
Really Disagree
Spring 2012 54% 33% 9% 4%
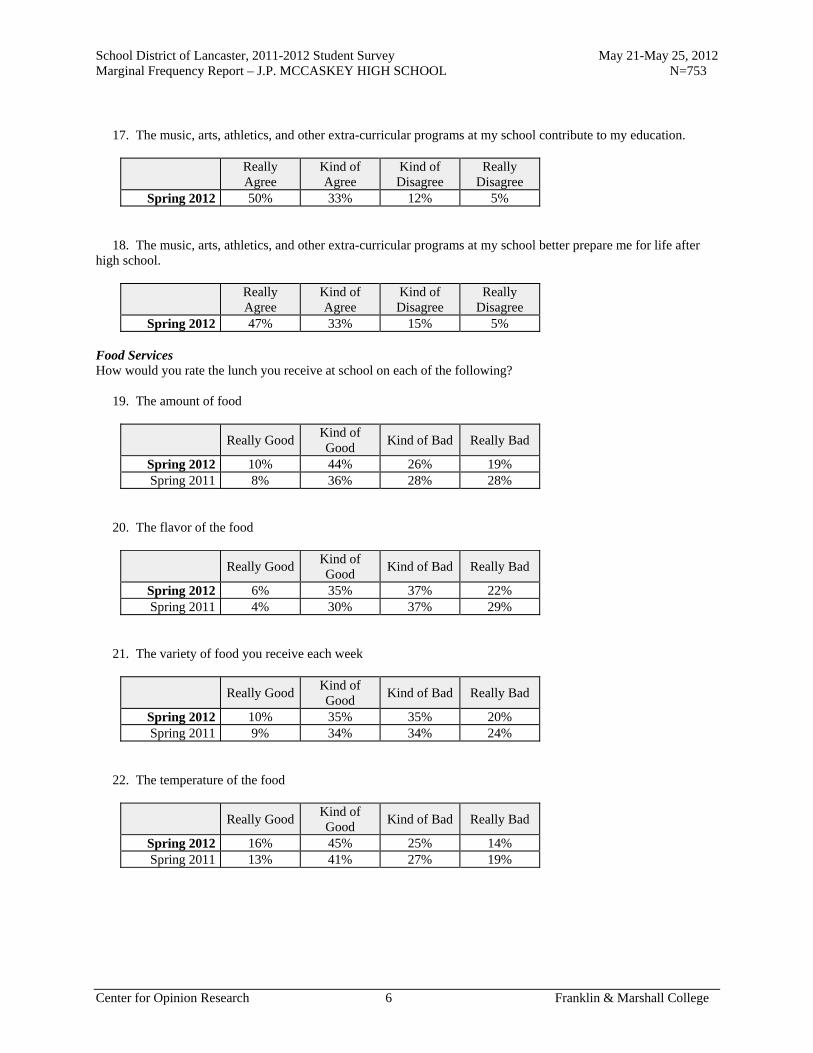
School District of Lancaster, 2011-2012 Student Survey May 21-May 25, 2012 Marginal Frequency Report – J.P. MCCASKEY HIGH SCHOOL N=753
Center for Opinion Research 6 Franklin & Marshall College
17. The music, arts, athletics, and other extra-curricular programs at my school contribute to my education.
Really Agree
Kind of Agree
Kind of Disagree
Really Disagree
Spring 2012 50% 33% 12% 5% 18. The music, arts, athletics, and other extra-curricular programs at my school better prepare me for life after high school.
Really Agree
Kind of Agree
Kind of Disagree
Really Disagree
Spring 2012 47% 33% 15% 5% Food Services How would you rate the lunch you receive at school on each of the following? 19. The amount of food
Really Good Kind of Good
Kind of Bad Really Bad
Spring 2012 10% 44% 26% 19% Spring 2011 8% 36% 28% 28%
20. The flavor of the food
Really Good Kind of Good
Kind of Bad Really Bad
Spring 2012 6% 35% 37% 22% Spring 2011 4% 30% 37% 29%
21. The variety of food you receive each week
Really Good Kind of Good
Kind of Bad Really Bad
Spring 2012 10% 35% 35% 20% Spring 2011 9% 34% 34% 24%
22. The temperature of the food
Really Good Kind of Good
Kind of Bad Really Bad
Spring 2012 16% 45% 25% 14% Spring 2011 13% 41% 27% 19%

School District of Lancaster, 2011-2012 Student Survey May 21-May 25, 2012 Marginal Frequency Report – J.P. MCCASKEY HIGH SCHOOL N=753
Center for Opinion Research 7 Franklin & Marshall College
23. The cleanliness of the cafeteria
Really Good Kind of Good
Kind of Bad Really Bad
Spring 2012 14% 45% 26% 15% Spring 2011 10% 43% 28% 19%
24. The amount of time you have to eat.
Really Good Kind of Good
Kind of Bad Really Bad
Spring 2012 30% 41% 15% 14% Spring 2011 30% 40% 14% 16%
Readiness and Emergency Management 25. Has anyone from your school spoken with you about what to do in the event of a school emergency, or not?
Yes No Spring 2012 75% 25% Spring 2011 74% 26%
Do you agree or disagree with the following statement? 26. I know what to do if there is a school emergency.
Really Agree
Kind of Agree
Kind of Disagree
Really Disagree
Spring 2012 48% 40% 8% 4% Spring 2011 38% 47% 9% 6%
Peer Academic Climate Do you agree or disagree with the following statements? 27. Most of my friends want to do well at school.
Really Agree
Kind of Agree
Kind of Disagree
Really Disagree
Spring 2012 43% 46% 9% 2% Spring 2011 34% 50% 9% 7% Spring 2010 33% 46% 14% 7% Spring 2009 31% 50% 12% 8%
Fall 2008 38% 45% 14% 3% Spring 2008 38% 50% 9% 3%
Fall 2007 41% 49% 7% 3% Spring 2007 39% 47% 11% 4%
Fall 2006 38% 44% 13% 4%
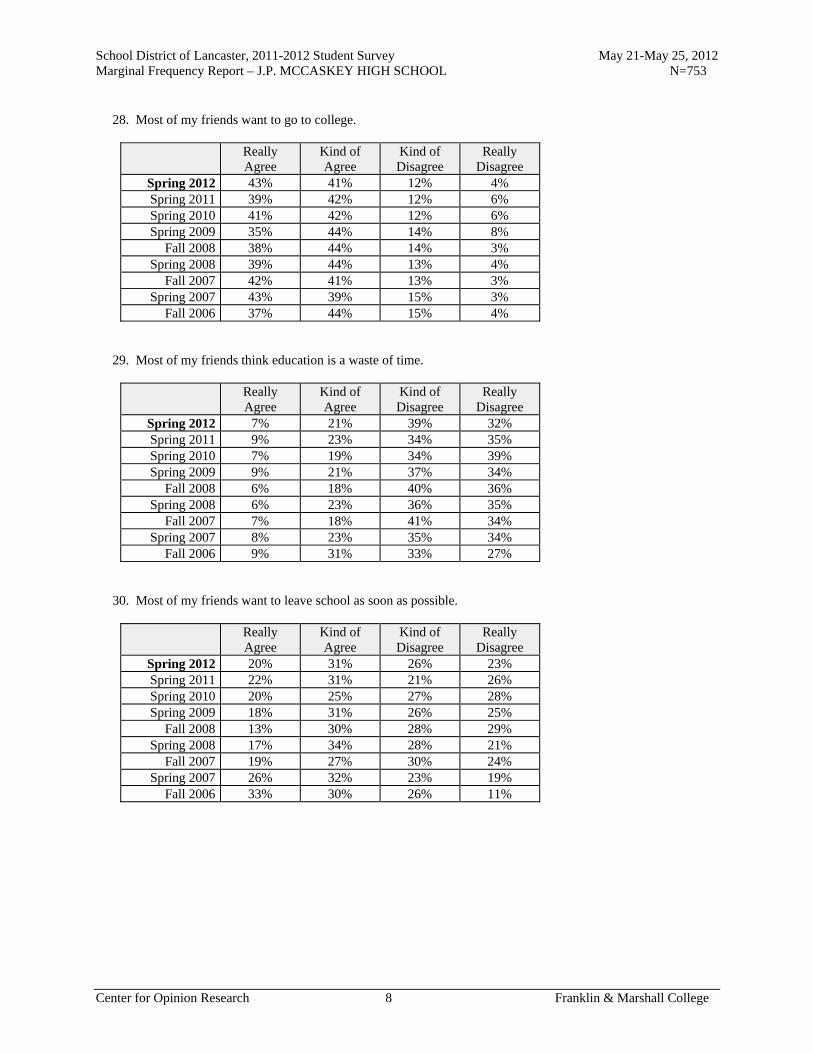
School District of Lancaster, 2011-2012 Student Survey May 21-May 25, 2012 Marginal Frequency Report – J.P. MCCASKEY HIGH SCHOOL N=753
Center for Opinion Research 8 Franklin & Marshall College
28. Most of my friends want to go to college.
Really Agree
Kind of Agree
Kind of Disagree
Really Disagree
Spring 2012 43% 41% 12% 4% Spring 2011 39% 42% 12% 6% Spring 2010 41% 42% 12% 6% Spring 2009 35% 44% 14% 8%
Fall 2008 38% 44% 14% 3% Spring 2008 39% 44% 13% 4%
Fall 2007 42% 41% 13% 3% Spring 2007 43% 39% 15% 3%
Fall 2006 37% 44% 15% 4% 29. Most of my friends think education is a waste of time.
Really Agree
Kind of Agree
Kind of Disagree
Really Disagree
Spring 2012 7% 21% 39% 32% Spring 2011 9% 23% 34% 35% Spring 2010 7% 19% 34% 39% Spring 2009 9% 21% 37% 34%
Fall 2008 6% 18% 40% 36% Spring 2008 6% 23% 36% 35%
Fall 2007 7% 18% 41% 34% Spring 2007 8% 23% 35% 34%
Fall 2006 9% 31% 33% 27% 30. Most of my friends want to leave school as soon as possible.
Really Agree
Kind of Agree
Kind of Disagree
Really Disagree
Spring 2012 20% 31% 26% 23% Spring 2011 22% 31% 21% 26% Spring 2010 20% 25% 27% 28% Spring 2009 18% 31% 26% 25%
Fall 2008 13% 30% 28% 29% Spring 2008 17% 34% 28% 21%
Fall 2007 19% 27% 30% 24% Spring 2007 26% 32% 23% 19%
Fall 2006 33% 30% 26% 11%

School District of Lancaster, 2011-2012 Student Survey May 21-May 25, 2012 Marginal Frequency Report – J.P. MCCASKEY HIGH SCHOOL N=753
Center for Opinion Research 9 Franklin & Marshall College
31. My friends tell me to leave school and get a job.
Really Agree
Kind of Agree
Kind of Disagree
Really Disagree
Spring 2012 8% 10% 15% 67% Spring 2011 6% 10% 18% 66% Spring 2010 3% 10% 19% 68% Spring 2009 5% 12% 18% 65%
Fall 2008 5% 10% 17% 68% Spring 2008 4% 12% 17% 67%
Fall 2007 4% 6% 15% 75% Spring 2007 3% 8% 15% 74%
Fall 2006 4% 6% 17% 74% Academic Self-efficacy Do you agree or disagree with the following statements? 32. I am a good science student.
Really Agree
Kind of Agree
Kind of Disagree
Really Disagree
Spring 2012 27% 47% 18% 8% Spring 2011 23% 45% 17% 15% Spring 2010 23% 40% 20% 16% Spring 2009 19% 43% 21% 16%
Fall 2008 20% 46% 21% 13% Spring 2008 23% 47% 20% 11%
Fall 2007 23% 42% 24% 11% Spring 2007 23% 46% 18% 13%
Fall 2006 26% 44% 19% 10% 33. Sometimes I think an assignment is easy when the other students think it is hard.
Really Agree
Kind of Agree
Kind of Disagree
Really Disagree
Spring 2012 29% 54% 14% 4% Spring 2011 30% 50% 13% 8% Spring 2010 31% 47% 16% 6% Spring 2009 25% 50% 17% 8%
Fall 2008 24% 50% 20% 6% Spring 2008 27% 55% 14% 4%
Fall 2007 28% 50% 18% 5% Spring 2007 32% 48% 15% 4%
Fall 2006 31% 45% 17% 7%

School District of Lancaster, 2011-2012 Student Survey May 21-May 25, 2012 Marginal Frequency Report – J.P. MCCASKEY HIGH SCHOOL N=753
Center for Opinion Research 10 Franklin & Marshall College
34. I am good social studies student.
Really Agree
Kind of Agree
Kind of Disagree
Really Disagree
Spring 2012 31% 41% 20% 8% Spring 2011 25% 41% 20% 14% Spring 2010 24% 40% 20% 16% Spring 2009 20% 42% 25% 13%
Fall 2008 22% 44% 22% 12% Spring 2008 24% 46% 22% 8%
Fall 2007 26% 43% 21% 10% Spring 2007 22% 43% 22% 13%
Fall 2006 26% 44% 24% 8% 35. My teacher thinks I am smart.
Really Agree
Kind of Agree
Kind of Disagree
Really Disagree
Spring 2012 39% 47% 9% 5% Spring 2011 36% 43% 12% 9% Spring 2010 34% 44% 14% 8% Spring 2009 28% 48% 16% 8%
Fall 2008 29% 49% 16% 6% Spring 2008 30% 51% 14% 5%
Fall 2007 33% 46% 16% 5% Spring 2007 32% 48% 13% 7%
Fall 2006 33% 44% 18% 5% 36. I am a good math student.
Really Agree
Kind of Agree
Kind of Disagree
Really Disagree
Spring 2012 32% 37% 18% 14% Spring 2011 29% 38% 16% 17% Spring 2010 31% 37% 18% 14% Spring 2009 29% 42% 16% 13%
Fall 2008 31% 42% 16% 11% Spring 2008 27% 40% 22% 11%
Fall 2007 31% 39% 18% 13% Spring 2007 28% 38% 19% 14%
Fall 2006 31% 32% 20% 17%

School District of Lancaster, 2011-2012 Student Survey May 21-May 25, 2012 Marginal Frequency Report – J.P. MCCASKEY HIGH SCHOOL N=753
Center for Opinion Research 11 Franklin & Marshall College
37. My classmates usually get better grades than I do.
Really Agree
Kind of Agree
Kind of Disagree
Really Disagree
Spring 2012 16% 34% 39% 11% Spring 2011 10% 36% 40% 15% Spring 2010 12% 34% 41% 14% Spring 2009 12% 35% 38% 14%
Fall 2008 9% 37% 42% 12% Spring 2008 10% 37% 40% 13%
Fall 2007 11% 34% 44% 12% Spring 2007 13% 33% 40% 14%
Fall 2006 14% 36% 42% 8% 38. I usually understand my homework assignments.
Really Agree
Kind of Agree
Kind of Disagree
Really Disagree
Spring 2012 28% 50% 17% 5% Spring 2011 24% 52% 15% 9% Spring 2010 26% 50% 18% 7% Spring 2009 20% 56% 17% 7%
Fall 2008 24% 56% 15% 4% Spring 2008 26% 55% 14% 5%
Fall 2007 26% 54% 17% 4% Spring 2007 29% 49% 16% 5%
Fall 2006 30% 48% 20% 2% 39. I could get the best grades in class if I tried hard enough.
Really Agree
Kind of Agree
Kind of Disagree
Really Disagree
Spring 2012 56% 33% 8% 2% Spring 2011 54% 32% 10% 5% Spring 2010 53% 33% 9% 5% Spring 2009 49% 32% 12% 6%
Fall 2008 52% 33% 11% 3% Spring 2008 52% 36% 9% 4%
Fall 2007 57% 32% 7% 4% Spring 2007 56% 32% 8% 4%
Fall 2006 60% 26% 11% 3%

School District of Lancaster, 2011-2012 Student Survey May 21-May 25, 2012 Marginal Frequency Report – J.P. MCCASKEY HIGH SCHOOL N=753
Center for Opinion Research 12 Franklin & Marshall College
40. I am a good reading student.
Really Agree
Kind of Agree
Kind of Disagree
Really Disagree
Spring 2012 39% 43% 12% 6% Spring 2011 39% 38% 15% 9% Spring 2010 40% 37% 16% 8% Spring 2009 36% 38% 18% 8%
Fall 2008 35% 41% 18% 7% Spring 2008 43% 40% 13% 5%
Fall 2007 40% 40% 14% 6% Spring 2007 46% 39% 11% 4%
Fall 2006 42% 34% 18% 6% 41. It is not hard for me to get good grades in school.
Really Agree
Kind of Agree
Kind of Disagree
Really Disagree
Spring 2012 34% 40% 19% 7% Spring 2011 31% 39% 21% 9% Spring 2010 30% 41% 21% 8% Spring 2009 30% 40% 21% 9%
Fall 2008 28% 43% 22% 6% Spring 2008 29% 48% 18% 5%
Fall 2007 28% 45% 21% 6% Spring 2007 30% 41% 22% 7%
Fall 2006 26% 45% 19% 10% 42. I am smart.
Really Agree
Kind of Agree
Kind of Disagree
Really Disagree
Spring 2012 53% 36% 8% 3% Spring 2011 51% 37% 6% 6% Spring 2010 50% 38% 8% 4% Spring 2009 47% 37% 10% 6%
Fall 2008 49% 36% 10% 5% Spring 2008 50% 39% 9% 2%
Fall 2007 50% 37% 10% 3% Spring 2007 50% 39% 8% 4%
Fall 2006 46% 40% 10% 4%

School District of Lancaster, 2011-2012 Student Survey May 21-May 25, 2012 Marginal Frequency Report – J.P. MCCASKEY HIGH SCHOOL N=753
Center for Opinion Research 13 Franklin & Marshall College
43. When the teacher asks a question I usually know the answer even if the other students don't.
Really Agree
Kind of Agree
Kind of Disagree
Really Disagree
Spring 2012 23% 49% 24% 4% Spring 2011 24% 49% 20% 8% Spring 2010 23% 47% 24% 6% Spring 2009 21% 48% 24% 7%
Fall 2008 17% 52% 26% 5% Spring 2008 23% 53% 21% 3%
Fall 2007 18% 52% 24% 5% Spring 2007 20% 52% 24% 5%
Fall 2006 19% 53% 24% 4% 44. I work hard in school.
Really Agree
Kind of Agree
Kind of Disagree
Really Disagree
Spring 2012 33% 45% 16% 6% Spring 2011 30% 43% 16% 10% Spring 2010 30% 41% 21% 8% Spring 2009 33% 41% 20% 6%
Fall 2008 32% 48% 16% 4% Spring 2008 28% 49% 16% 6%
Fall 2007 33% 47% 15% 4% Spring 2007 30% 46% 19% 6%
Fall 2006 29% 46% 21% 4% 45. Most of my classmates work harder on their homework than I do.
Really Agree
Kind of Agree
Kind of Disagree
Really Disagree
Spring 2012 21% 36% 33% 11% Spring 2011 20% 37% 31% 12% Spring 2010 17% 38% 34% 12% Spring 2009 14% 40% 32% 14%
Fall 2008 16% 38% 35% 11% Spring 2008 17% 42% 31% 10%
Fall 2007 17% 39% 35% 10% Spring 2007 18% 41% 34% 7%
Fall 2006 18% 37% 35% 10%

School District of Lancaster, 2011-2012 Student Survey May 21-May 25, 2012 Marginal Frequency Report – J.P. MCCASKEY HIGH SCHOOL N=753
Center for Opinion Research 14 Franklin & Marshall College
46. I always get good grades when I try hard.
Really Agree
Kind of Agree
Kind of Disagree
Really Disagree
Spring 2012 50% 39% 9% 2% Spring 2011 48% 35% 9% 7% Spring 2010 49% 35% 12% 5% Spring 2009 44% 40% 10% 6%
Fall 2008 47% 38% 12% 2% Spring 2008 49% 40% 9% 3%
Fall 2007 52% 37% 8% 2% Spring 2007 52% 36% 10% 2%
Fall 2006 51% 36% 10% 3% 47. I usually do not get good grades in math because it is too hard.
Really Agree
Kind of Agree
Kind of Disagree
Really Disagree
Spring 2012 18% 25% 28% 29% Spring 2011 14% 26% 28% 33% Spring 2010 11% 24% 34% 31% Spring 2009 10% 25% 32% 32%
Fall 2008 10% 26% 33% 32% Spring 2008 10% 24% 36% 30%
Fall 2007 10% 24% 34% 32% Spring 2007 12% 24% 32% 32%
Fall 2006 14% 21% 33% 32% 48. Most of my classmates like to do math because it is easy.
Really Agree
Kind of Agree
Kind of Disagree
Really Disagree
Spring 2012 14% 32% 39% 15% Spring 2011 9% 29% 39% 24% Spring 2010 10% 28% 40% 22% Spring 2009 12% 33% 39% 16%
Fall 2008 12% 33% 40% 15% Spring 2008 10% 33% 40% 17%
Fall 2007 10% 28% 42% 19% Spring 2007 11% 27% 40% 22%
Fall 2006 7% 32% 44% 17%

School District of Lancaster, 2011-2012 Student Survey May 21-May 25, 2012 Marginal Frequency Report – J.P. MCCASKEY HIGH SCHOOL N=753
Center for Opinion Research 15 Franklin & Marshall College
49. I would get better grades if my teacher liked me more.
Really Agree
Kind of Agree
Kind of Disagree
Really Disagree
Spring 2012 11% 22% 33% 34% Spring 2011 11% 23% 32% 34% Spring 2010 11% 21% 30% 38% Spring 2009 9% 23% 35% 34%
Fall 2008 8% 20% 37% 36% Spring 2008 8% 25% 32% 35%
Fall 2007 7% 15% 37% 42% Spring 2007 8% 18% 34% 40%
Fall 2006 10% 17% 37% 36% 50. I will graduate from high school.
Really Agree
Kind of Agree
Kind of Disagree
Really Disagree
Spring 2012 85% 10% 3% 2% Spring 2011 82% 11% 4% 3% Spring 2010 85% 9% 3% 4% Spring 2009 81% 11% 4% 4%
Fall 2008 86% 10% 2% 2% Spring 2008 76% 17% 5% 2%
Fall 2007 86% 9% 3% 2% Spring 2007 84% 10% 3% 2%
Fall 2006 89% 8% 3% 1% 51. I go to a good school.
Really Agree
Kind of Agree
Kind of Disagree
Really Disagree
Spring 2012 40% 40% 14% 6% Spring 2011 26% 42% 19% 12% Spring 2010 29% 41% 18% 12% Spring 2009 28% 42% 18% 12%
Fall 2008 34% 44% 16% 6% Spring 2008 33% 45% 18% 5%
Fall 2007 36% 43% 15% 7% Spring 2007 31% 46% 16% 7%
Fall 2006 39% 44% 10% 7%
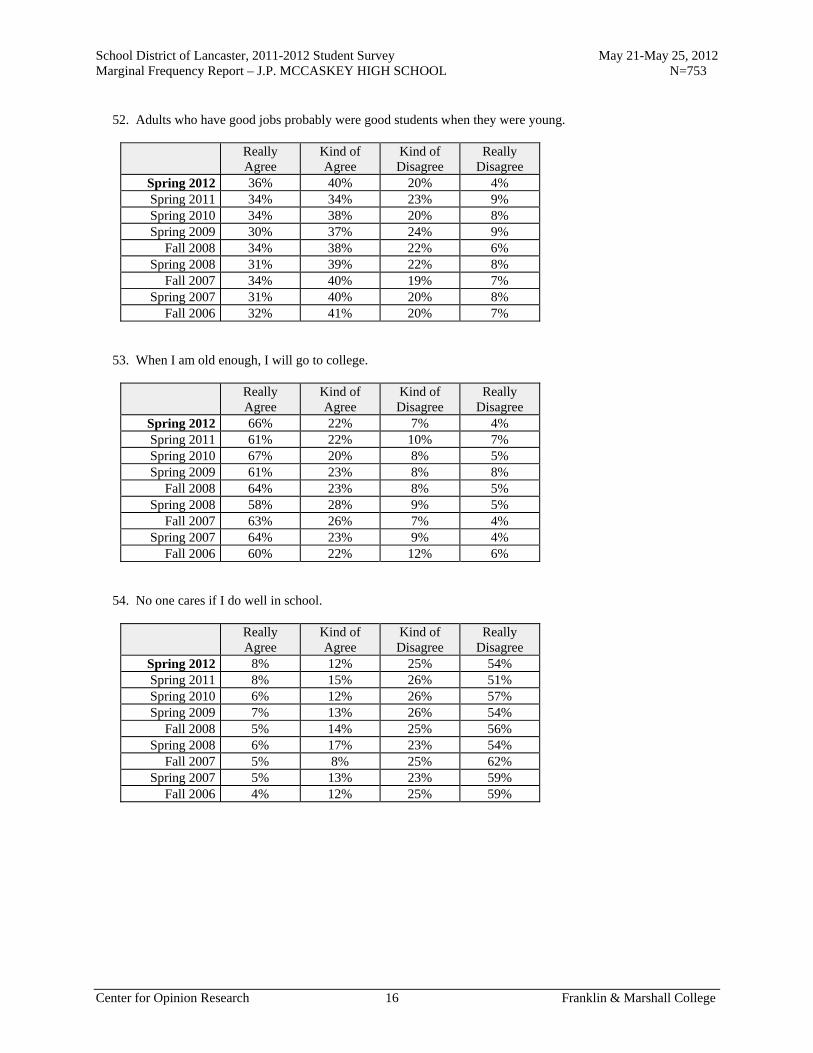
School District of Lancaster, 2011-2012 Student Survey May 21-May 25, 2012 Marginal Frequency Report – J.P. MCCASKEY HIGH SCHOOL N=753
Center for Opinion Research 16 Franklin & Marshall College
52. Adults who have good jobs probably were good students when they were young.
Really Agree
Kind of Agree
Kind of Disagree
Really Disagree
Spring 2012 36% 40% 20% 4% Spring 2011 34% 34% 23% 9% Spring 2010 34% 38% 20% 8% Spring 2009 30% 37% 24% 9%
Fall 2008 34% 38% 22% 6% Spring 2008 31% 39% 22% 8%
Fall 2007 34% 40% 19% 7% Spring 2007 31% 40% 20% 8%
Fall 2006 32% 41% 20% 7% 53. When I am old enough, I will go to college.
Really Agree
Kind of Agree
Kind of Disagree
Really Disagree
Spring 2012 66% 22% 7% 4% Spring 2011 61% 22% 10% 7% Spring 2010 67% 20% 8% 5% Spring 2009 61% 23% 8% 8%
Fall 2008 64% 23% 8% 5% Spring 2008 58% 28% 9% 5%
Fall 2007 63% 26% 7% 4% Spring 2007 64% 23% 9% 4%
Fall 2006 60% 22% 12% 6% 54. No one cares if I do well in school.
Really Agree
Kind of Agree
Kind of Disagree
Really Disagree
Spring 2012 8% 12% 25% 54% Spring 2011 8% 15% 26% 51% Spring 2010 6% 12% 26% 57% Spring 2009 7% 13% 26% 54%
Fall 2008 5% 14% 25% 56% Spring 2008 6% 17% 23% 54%
Fall 2007 5% 8% 25% 62% Spring 2007 5% 13% 23% 59%
Fall 2006 4% 12% 25% 59%
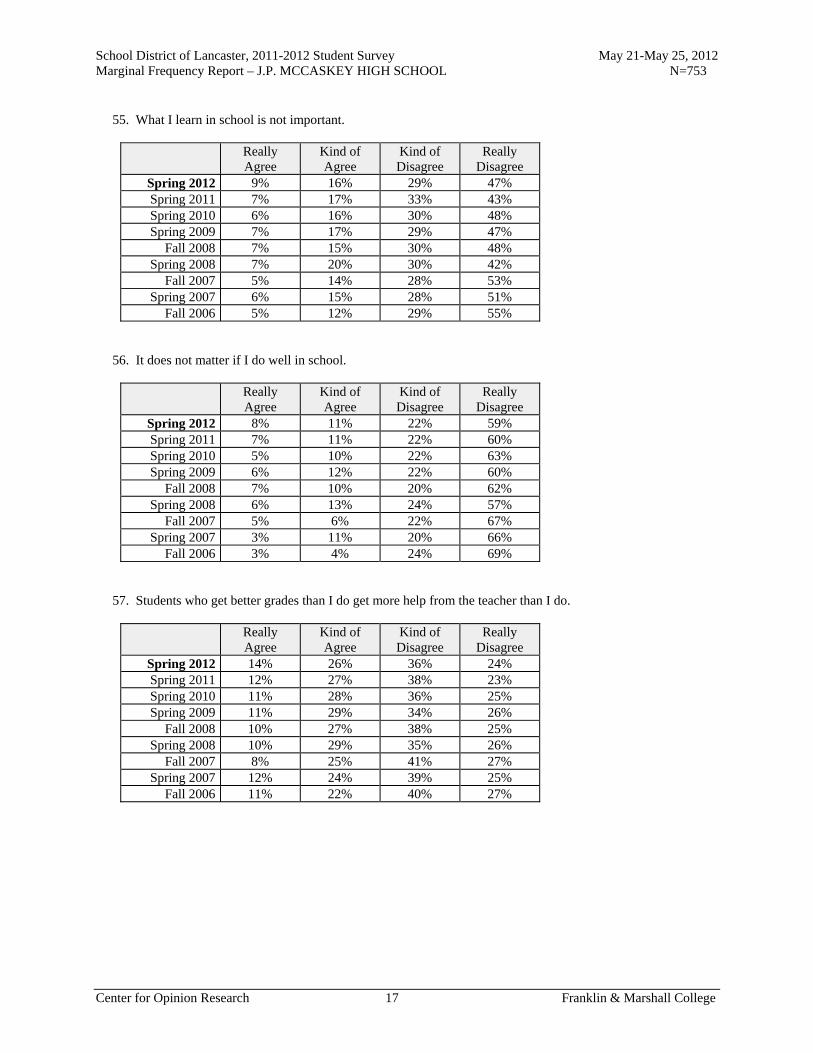
School District of Lancaster, 2011-2012 Student Survey May 21-May 25, 2012 Marginal Frequency Report – J.P. MCCASKEY HIGH SCHOOL N=753
Center for Opinion Research 17 Franklin & Marshall College
55. What I learn in school is not important.
Really Agree
Kind of Agree
Kind of Disagree
Really Disagree
Spring 2012 9% 16% 29% 47% Spring 2011 7% 17% 33% 43% Spring 2010 6% 16% 30% 48% Spring 2009 7% 17% 29% 47%
Fall 2008 7% 15% 30% 48% Spring 2008 7% 20% 30% 42%
Fall 2007 5% 14% 28% 53% Spring 2007 6% 15% 28% 51%
Fall 2006 5% 12% 29% 55% 56. It does not matter if I do well in school.
Really Agree
Kind of Agree
Kind of Disagree
Really Disagree
Spring 2012 8% 11% 22% 59% Spring 2011 7% 11% 22% 60% Spring 2010 5% 10% 22% 63% Spring 2009 6% 12% 22% 60%
Fall 2008 7% 10% 20% 62% Spring 2008 6% 13% 24% 57%
Fall 2007 5% 6% 22% 67% Spring 2007 3% 11% 20% 66%
Fall 2006 3% 4% 24% 69% 57. Students who get better grades than I do get more help from the teacher than I do.
Really Agree
Kind of Agree
Kind of Disagree
Really Disagree
Spring 2012 14% 26% 36% 24% Spring 2011 12% 27% 38% 23% Spring 2010 11% 28% 36% 25% Spring 2009 11% 29% 34% 26%
Fall 2008 10% 27% 38% 25% Spring 2008 10% 29% 35% 26%
Fall 2007 8% 25% 41% 27% Spring 2007 12% 24% 39% 25%
Fall 2006 11% 22% 40% 27%

School District of Lancaster, 2011-2012 Student Survey May 21-May 25, 2012 Marginal Frequency Report – J.P. MCCASKEY HIGH SCHOOL N=753
Center for Opinion Research 18 Franklin & Marshall College
58. I will quit school as soon as I can.
Really Agree
Kind of Agree
Kind of Disagree
Really Disagree
Spring 2012 5% 10% 12% 72% Spring 2011 5% 9% 12% 75% Spring 2010 4% 8% 13% 75% Spring 2009 4% 9% 15% 71%
Fall 2008 5% 7% 13% 75% Spring 2008 5% 11% 14% 70%
Fall 2007 4% 5% 12% 79% Spring 2007 4% 8% 10% 79%
Fall 2006 3% 3% 12% 82% 59. Teachers like students even if they do not always make good grades.
Really Agree
Kind of Agree
Kind of Disagree
Really Disagree
Spring 2012 27% 48% 16% 9% Spring 2011 24% 46% 19% 12% Spring 2010 24% 49% 16% 11% Spring 2009 22% 45% 22% 12%
Fall 2008 23% 51% 19% 7% Spring 2008 24% 52% 18% 6%
Fall 2007 24% 54% 15% 6% Spring 2007 25% 52% 16% 7%
Fall 2006 25% 53% 16% 6% 60. It is important to go to high school.
Really Agree
Kind of Agree
Kind of Disagree
Really Disagree
Spring 2012 75% 18% 3% 3% Spring 2011 72% 16% 7% 5% Spring 2010 72% 18% 5% 5% Spring 2009 70% 17% 7% 6%
Fall 2008 74% 18% 5% 3% Spring 2008 70% 22% 5% 2%
Fall 2007 79% 16% 3% 2% Spring 2007 78% 16% 3% 3%
Fall 2006 80% 18% 1% 1%

School District of Lancaster, 2011-2012 Student Survey May 21-May 25, 2012 Marginal Frequency Report – J.P. MCCASKEY HIGH SCHOOL N=753
Center for Opinion Research 19 Franklin & Marshall College
61. How often do you take books home to study?
Every Night Most Nights Some Nights Never Spring 2012 11% 19% 42% 28% Spring 2011 7% 18% 42% 33% Spring 2010 12% 19% 40% 29% Spring 2009 14% 18% 42% 25%
Fall 2008 16% 24% 39% 21% Career Self-Efficacy Please rate how confident you are that you could successfully perform the following tasks. I am confident that... (1=very low confidence, 7=very high confidence) 62. I can make plans beyond graduation.
Mean Score Spring 2012 5.46 Spring 2011 5.18 Spring 2010 5.46 Spring 2009 5.35
Fall 2008 5.46 Spring 2008 5.48
Fall 2007 5.74 Spring 2007 5.69
Fall 2006 5.63 63. I know how the place where I live affects job opportunities.
Mean Score Spring 2012 4.57 Spring 2011 4.64 Spring 2010 4.80 Spring 2009 4.69
Fall 2008 4.69 Spring 2008 4.73
Fall 2007 4.71 Spring 2007 4.78
Fall 2006 4.41
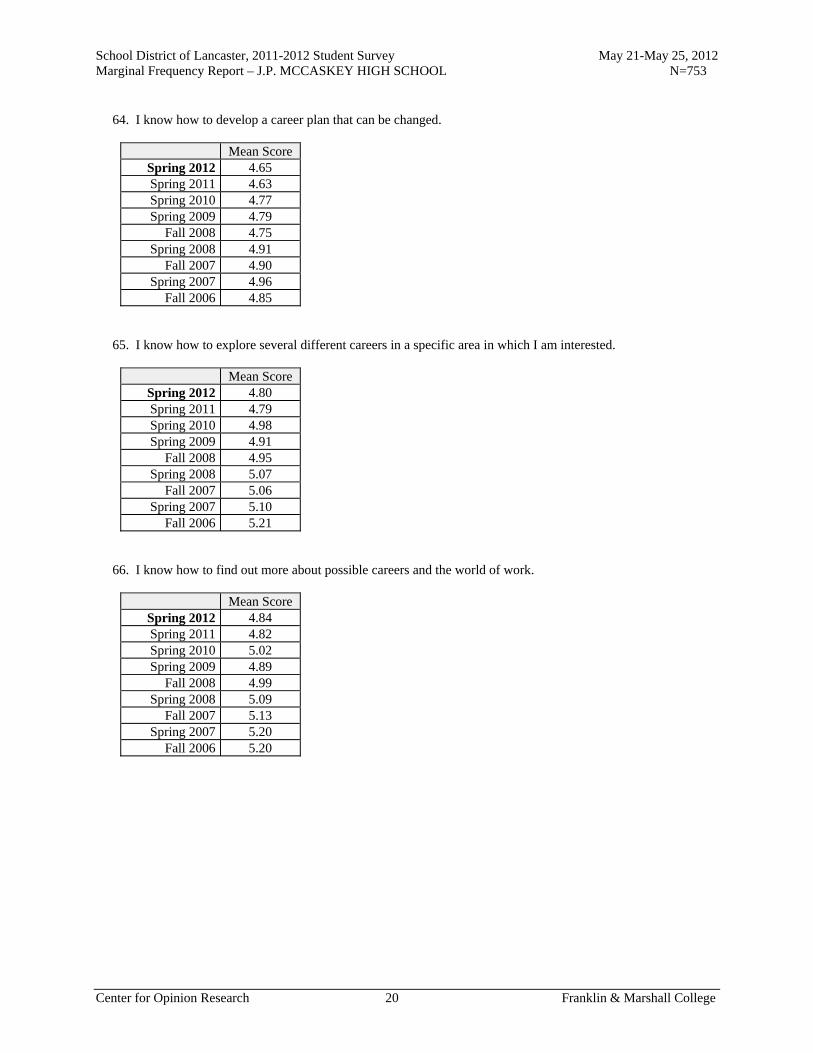
School District of Lancaster, 2011-2012 Student Survey May 21-May 25, 2012 Marginal Frequency Report – J.P. MCCASKEY HIGH SCHOOL N=753
Center for Opinion Research 20 Franklin & Marshall College
64. I know how to develop a career plan that can be changed.
Mean Score Spring 2012 4.65 Spring 2011 4.63 Spring 2010 4.77 Spring 2009 4.79
Fall 2008 4.75 Spring 2008 4.91
Fall 2007 4.90 Spring 2007 4.96
Fall 2006 4.85 65. I know how to explore several different careers in a specific area in which I am interested.
Mean Score Spring 2012 4.80 Spring 2011 4.79 Spring 2010 4.98 Spring 2009 4.91
Fall 2008 4.95 Spring 2008 5.07
Fall 2007 5.06 Spring 2007 5.10
Fall 2006 5.21 66. I know how to find out more about possible careers and the world of work.
Mean Score Spring 2012 4.84 Spring 2011 4.82 Spring 2010 5.02 Spring 2009 4.89
Fall 2008 4.99 Spring 2008 5.09
Fall 2007 5.13 Spring 2007 5.20
Fall 2006 5.20
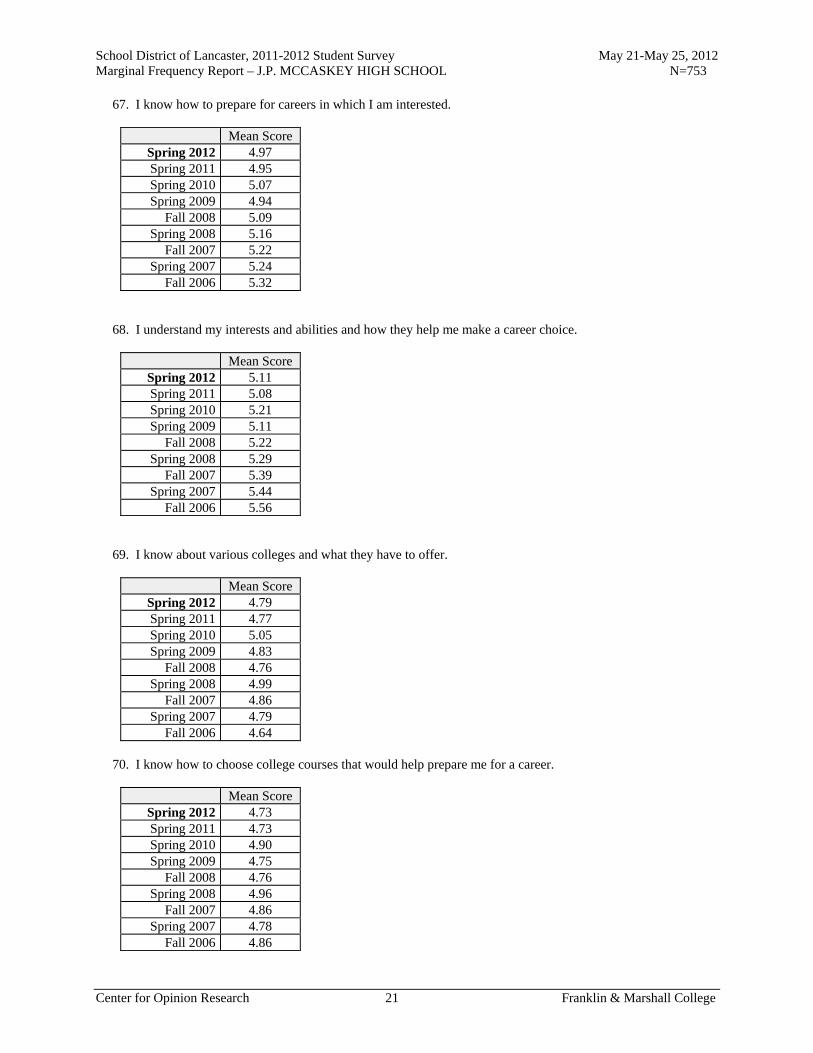
School District of Lancaster, 2011-2012 Student Survey May 21-May 25, 2012 Marginal Frequency Report – J.P. MCCASKEY HIGH SCHOOL N=753
Center for Opinion Research 21 Franklin & Marshall College
67. I know how to prepare for careers in which I am interested.
Mean Score Spring 2012 4.97 Spring 2011 4.95 Spring 2010 5.07 Spring 2009 4.94
Fall 2008 5.09 Spring 2008 5.16
Fall 2007 5.22 Spring 2007 5.24
Fall 2006 5.32 68. I understand my interests and abilities and how they help me make a career choice.
Mean Score Spring 2012 5.11 Spring 2011 5.08 Spring 2010 5.21 Spring 2009 5.11
Fall 2008 5.22 Spring 2008 5.29
Fall 2007 5.39 Spring 2007 5.44
Fall 2006 5.56 69. I know about various colleges and what they have to offer.
Mean Score Spring 2012 4.79 Spring 2011 4.77 Spring 2010 5.05 Spring 2009 4.83
Fall 2008 4.76 Spring 2008 4.99
Fall 2007 4.86 Spring 2007 4.79
Fall 2006 4.64 70. I know how to choose college courses that would help prepare me for a career.
Mean Score Spring 2012 4.73 Spring 2011 4.73 Spring 2010 4.90 Spring 2009 4.75
Fall 2008 4.76 Spring 2008 4.96
Fall 2007 4.86 Spring 2007 4.78
Fall 2006 4.86
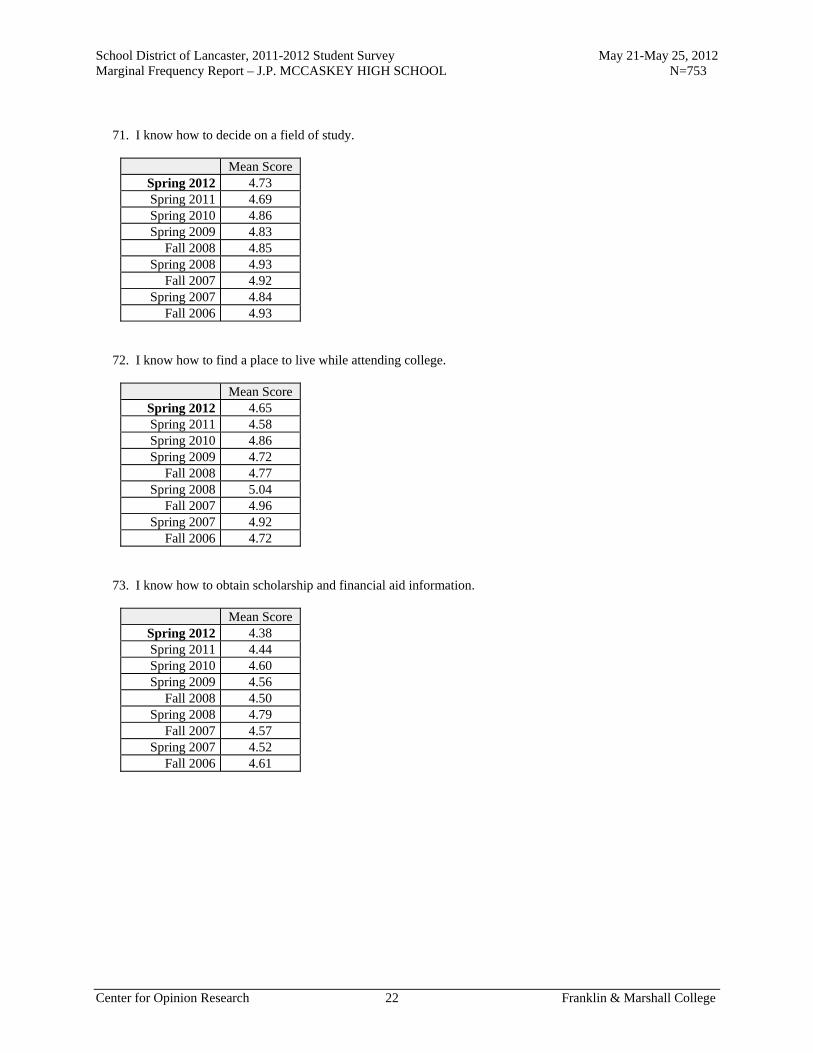
School District of Lancaster, 2011-2012 Student Survey May 21-May 25, 2012 Marginal Frequency Report – J.P. MCCASKEY HIGH SCHOOL N=753
Center for Opinion Research 22 Franklin & Marshall College
71. I know how to decide on a field of study.
Mean Score Spring 2012 4.73 Spring 2011 4.69 Spring 2010 4.86 Spring 2009 4.83
Fall 2008 4.85 Spring 2008 4.93
Fall 2007 4.92 Spring 2007 4.84
Fall 2006 4.93 72. I know how to find a place to live while attending college.
Mean Score Spring 2012 4.65 Spring 2011 4.58 Spring 2010 4.86 Spring 2009 4.72
Fall 2008 4.77 Spring 2008 5.04
Fall 2007 4.96 Spring 2007 4.92
Fall 2006 4.72 73. I know how to obtain scholarship and financial aid information.
Mean Score Spring 2012 4.38 Spring 2011 4.44 Spring 2010 4.60 Spring 2009 4.56
Fall 2008 4.50 Spring 2008 4.79
Fall 2007 4.57 Spring 2007 4.52
Fall 2006 4.61
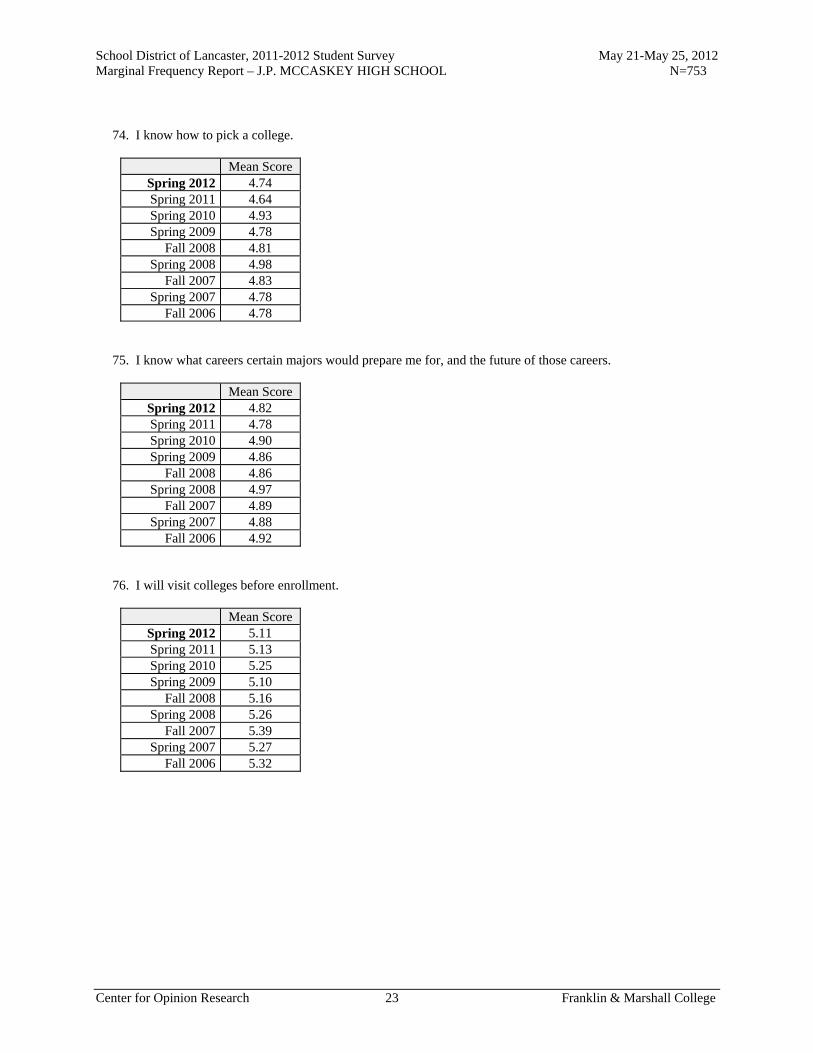
School District of Lancaster, 2011-2012 Student Survey May 21-May 25, 2012 Marginal Frequency Report – J.P. MCCASKEY HIGH SCHOOL N=753
Center for Opinion Research 23 Franklin & Marshall College
74. I know how to pick a college.
Mean Score Spring 2012 4.74 Spring 2011 4.64 Spring 2010 4.93 Spring 2009 4.78
Fall 2008 4.81 Spring 2008 4.98
Fall 2007 4.83 Spring 2007 4.78
Fall 2006 4.78 75. I know what careers certain majors would prepare me for, and the future of those careers.
Mean Score Spring 2012 4.82 Spring 2011 4.78 Spring 2010 4.90 Spring 2009 4.86
Fall 2008 4.86 Spring 2008 4.97
Fall 2007 4.89 Spring 2007 4.88
Fall 2006 4.92 76. I will visit colleges before enrollment.
Mean Score Spring 2012 5.11 Spring 2011 5.13 Spring 2010 5.25 Spring 2009 5.10
Fall 2008 5.16 Spring 2008 5.26
Fall 2007 5.39 Spring 2007 5.27
Fall 2006 5.32
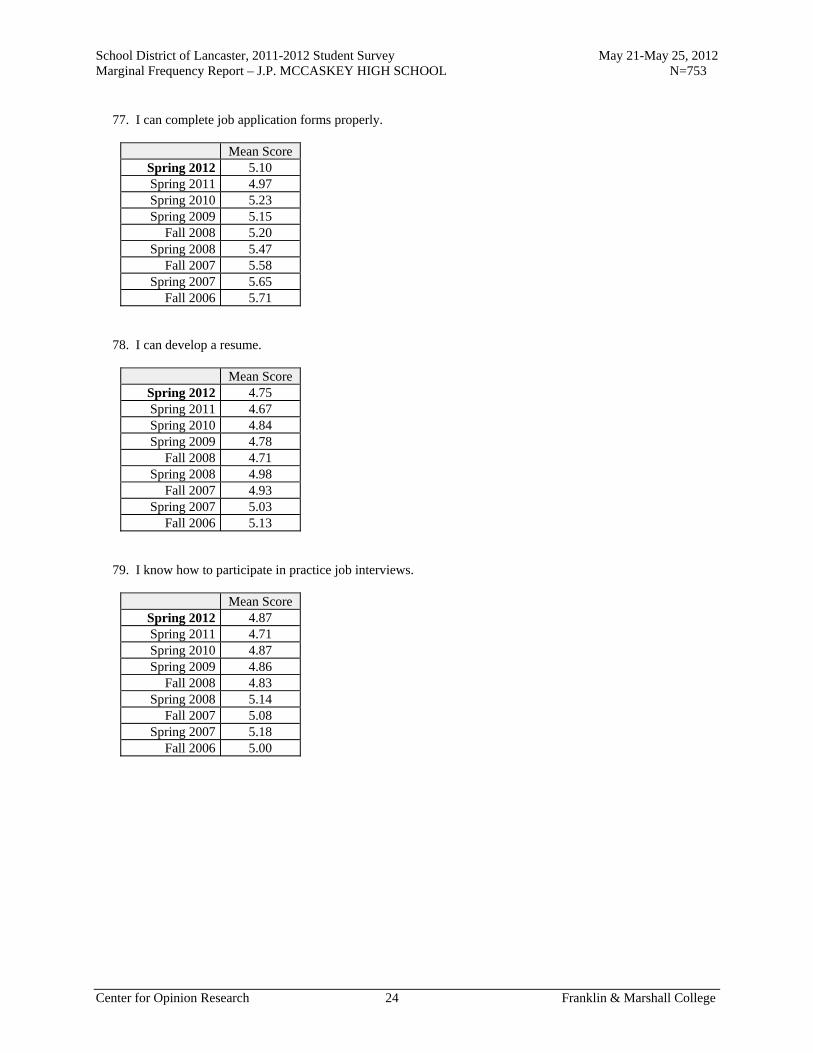
School District of Lancaster, 2011-2012 Student Survey May 21-May 25, 2012 Marginal Frequency Report – J.P. MCCASKEY HIGH SCHOOL N=753
Center for Opinion Research 24 Franklin & Marshall College
77. I can complete job application forms properly.
Mean Score Spring 2012 5.10 Spring 2011 4.97 Spring 2010 5.23 Spring 2009 5.15
Fall 2008 5.20 Spring 2008 5.47
Fall 2007 5.58 Spring 2007 5.65
Fall 2006 5.71 78. I can develop a resume.
Mean Score Spring 2012 4.75 Spring 2011 4.67 Spring 2010 4.84 Spring 2009 4.78
Fall 2008 4.71 Spring 2008 4.98
Fall 2007 4.93 Spring 2007 5.03
Fall 2006 5.13 79. I know how to participate in practice job interviews.
Mean Score Spring 2012 4.87 Spring 2011 4.71 Spring 2010 4.87 Spring 2009 4.86
Fall 2008 4.83 Spring 2008 5.14
Fall 2007 5.08 Spring 2007 5.18
Fall 2006 5.00
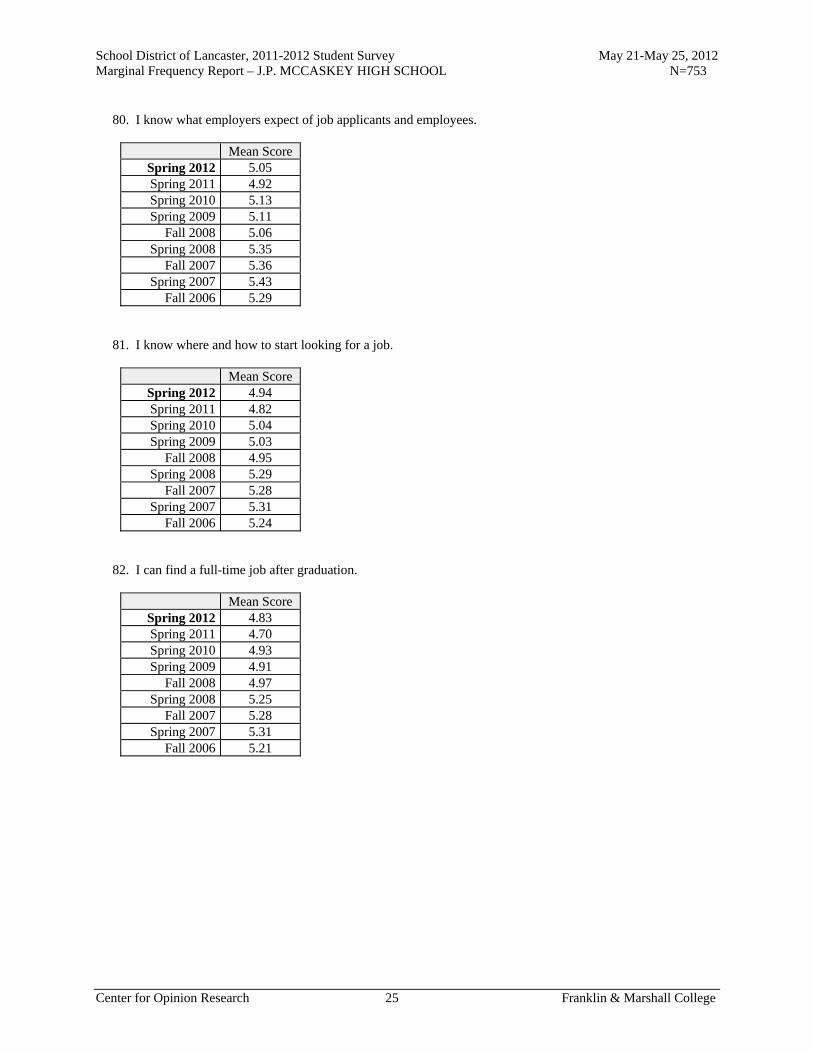
School District of Lancaster, 2011-2012 Student Survey May 21-May 25, 2012 Marginal Frequency Report – J.P. MCCASKEY HIGH SCHOOL N=753
Center for Opinion Research 25 Franklin & Marshall College
80. I know what employers expect of job applicants and employees.
Mean Score Spring 2012 5.05 Spring 2011 4.92 Spring 2010 5.13 Spring 2009 5.11
Fall 2008 5.06 Spring 2008 5.35
Fall 2007 5.36 Spring 2007 5.43
Fall 2006 5.29 81. I know where and how to start looking for a job.
Mean Score Spring 2012 4.94 Spring 2011 4.82 Spring 2010 5.04 Spring 2009 5.03
Fall 2008 4.95 Spring 2008 5.29
Fall 2007 5.28 Spring 2007 5.31
Fall 2006 5.24 82. I can find a full-time job after graduation.
Mean Score Spring 2012 4.83 Spring 2011 4.70 Spring 2010 4.93 Spring 2009 4.91
Fall 2008 4.97 Spring 2008 5.25
Fall 2007 5.28 Spring 2007 5.31
Fall 2006 5.21

School District of Lancaster, 2011-2012 Student Survey May 21-May 25, 2012 Marginal Frequency Report – J.P. MCCASKEY HIGH SCHOOL N=753
Center for Opinion Research 26 Franklin & Marshall College
83. I can find part-time or summer work.
Mean Score Spring 2012 5.20 Spring 2011 5.03 Spring 2010 5.23 Spring 2009 5.23
Fall 2008 5.33 Spring 2008 5.56
Fall 2007 5.75 Spring 2007 5.75
Fall 2006 5.63 84. I know the benefits, working conditions, and opportunities for advancement in jobs.
Mean Score Spring 2012 4.89 Spring 2011 4.75 Spring 2010 4.92 Spring 2009 4.91
Fall 2008 4.93 Spring 2008 5.20
Fall 2007 5.19 Spring 2007 5.19
Fall 2006 5.14 85. I know what jobs are available in my interest and ability areas, their locations, and the requirements to obtain these jobs.
Mean Score Spring 2012 4.71 Spring 2011 4.60 Spring 2010 4.82 Spring 2009 4.77
Fall 2008 4.76 Spring 2008 5.08
Fall 2007 5.06 Spring 2007 5.06
Fall 2006 5.02

School District of Lancaster, 2011-2012 Student Survey May 21-May 25, 2012 Marginal Frequency Report – J.P. MCCASKEY HIGH SCHOOL N=753
Center for Opinion Research 27 Franklin & Marshall College
86. I know what jobs are available locally.
Mean Score Spring 2012 4.71 Spring 2011 4.59 Spring 2010 4.78 Spring 2009 4.80
Fall 2008 4.85 Spring 2008 5.09
Fall 2007 5.08 Spring 2007 5.16
Fall 2006 5.04 87. I know what persons and what agencies will help me find a job.
Mean Score Spring 2012 4.39 Spring 2011 4.34 Spring 2010 4.46 Spring 2009 4.68
Fall 2008 4.52 Spring 2008 4.81
Fall 2007 4.77 Spring 2007 4.67
Fall 2006 4.40 Academic Aspirations 88. How far in school do you want to go?
Complete
high school
Attend vocational/technical
school
Attend 2-year college
Attend 4-year college
Attend 4-year college plus go to
grad school Spring 2012 11% 5% 16% 35% 33% Spring 2011 14% 4% 13% 37% 32% Spring 2010 9% 5% 16% 39% 30% Spring 2009 14% 6% 18% 36% 26%
Fall 2008 12% 6% 17% 36% 29% Spring 2008 11% 7% 18% 34% 30%
Fall 2007 10% 10% 17% 34% 29% Spring 2007 11% 8% 16% 36% 29%
Fall 2006 14% 10% 14% 33% 28%
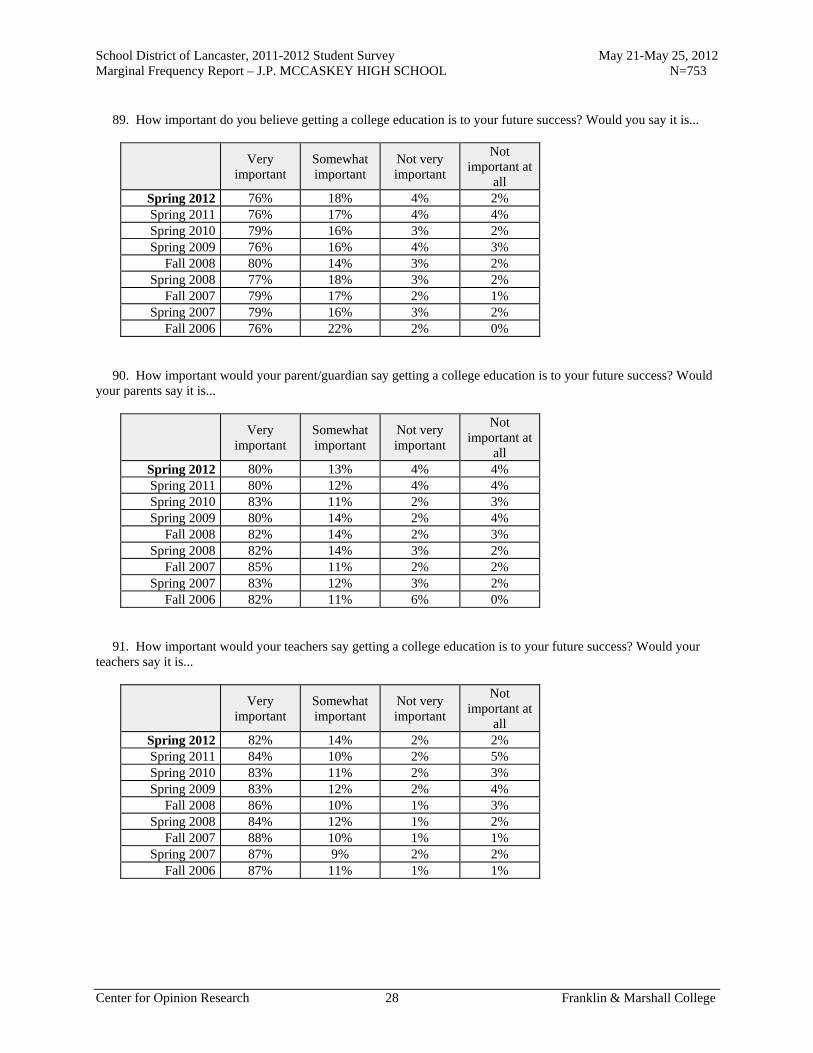
School District of Lancaster, 2011-2012 Student Survey May 21-May 25, 2012 Marginal Frequency Report – J.P. MCCASKEY HIGH SCHOOL N=753
Center for Opinion Research 28 Franklin & Marshall College
89. How important do you believe getting a college education is to your future success? Would you say it is...
Very
important Somewhat important
Not very important
Not important at
all Spring 2012 76% 18% 4% 2% Spring 2011 76% 17% 4% 4% Spring 2010 79% 16% 3% 2% Spring 2009 76% 16% 4% 3%
Fall 2008 80% 14% 3% 2% Spring 2008 77% 18% 3% 2%
Fall 2007 79% 17% 2% 1% Spring 2007 79% 16% 3% 2%
Fall 2006 76% 22% 2% 0% 90. How important would your parent/guardian say getting a college education is to your future success? Would your parents say it is...
Very
important Somewhat important
Not very important
Not important at
all Spring 2012 80% 13% 4% 4% Spring 2011 80% 12% 4% 4% Spring 2010 83% 11% 2% 3% Spring 2009 80% 14% 2% 4%
Fall 2008 82% 14% 2% 3% Spring 2008 82% 14% 3% 2%
Fall 2007 85% 11% 2% 2% Spring 2007 83% 12% 3% 2%
Fall 2006 82% 11% 6% 0% 91. How important would your teachers say getting a college education is to your future success? Would your teachers say it is...
Very
important Somewhat important
Not very important
Not important at
all Spring 2012 82% 14% 2% 2% Spring 2011 84% 10% 2% 5% Spring 2010 83% 11% 2% 3% Spring 2009 83% 12% 2% 4%
Fall 2008 86% 10% 1% 3% Spring 2008 84% 12% 1% 2%
Fall 2007 88% 10% 1% 1% Spring 2007 87% 9% 2% 2%
Fall 2006 87% 11% 1% 1%

School District of Lancaster, 2011-2012 Student Survey May 21-May 25, 2012 Marginal Frequency Report – J.P. MCCASKEY HIGH SCHOOL N=753
Center for Opinion Research 29 Franklin & Marshall College
92. How far in school do you think you will get?
Won't finish high school
Will finish high school
Will get a GED
Will complete a
2-year Associate's
Degree
Will complete a
4-year Bachelor's
Degree
Will complete a Master's or Doctoral Degree
Spring 2012 4% 16% 3% 14% 34% 28% Spring 2011 6% 14% 2% 16% 36% 26% Spring 2010 4% 13% 3% 17% 33% 29% Spring 2009 6% 15% 4% 18% 34% 23%
Fall 2008 3% 17% 4% 18% 34% 24% Spring 2008 4% 15% 6% 18% 32% 26%
Fall 2007 2% 20% 6% 16% 31% 24% Spring 2007 3% 17% 3% 18% 35% 24%
Fall 2006 2% 21% 4% 20% 28% 24% 93. Has anyone from your school or GEAR UP ever spoken with you about college entrance requirements or the courses that you need to take in high school in order to prepare for college?
Yes No Spring 2012 79% 21% Spring 2011 64% 36% Spring 2010 69% 31% Spring 2009 64% 36%
Fall 2008 67% 33% Spring 2008 64% 36%
Fall 2007 65% 35% Spring 2007 62% 38%
Fall 2006 67% 33% 94. Has anyone from your school or GEAR UP ever spoken with you about the availability of financial aid to help you pay for college?
Yes No Spring 2012 64% 36% Spring 2011 58% 42% Spring 2010 65% 35% Spring 2009 59% 41%
Fall 2008 64% 36% Spring 2008 62% 38%
Fall 2007 59% 41% Spring 2007 56% 44%
Fall 2006 69% 31%
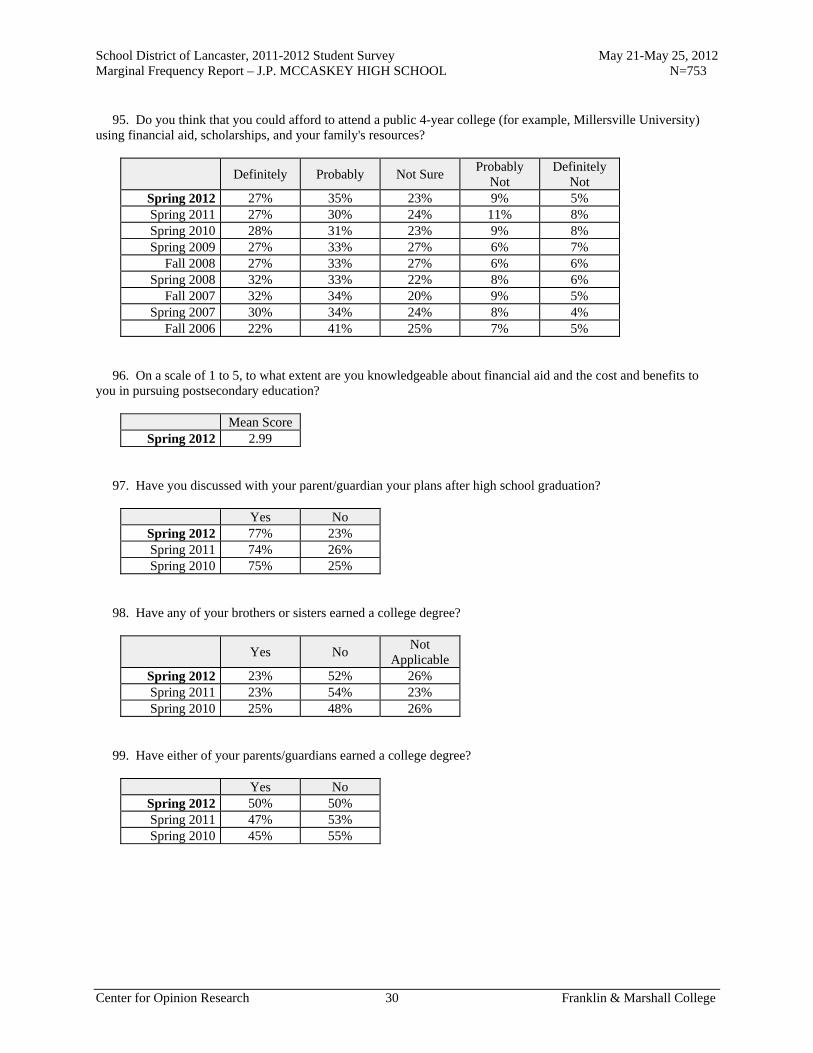
School District of Lancaster, 2011-2012 Student Survey May 21-May 25, 2012 Marginal Frequency Report – J.P. MCCASKEY HIGH SCHOOL N=753
Center for Opinion Research 30 Franklin & Marshall College
95. Do you think that you could afford to attend a public 4-year college (for example, Millersville University) using financial aid, scholarships, and your family's resources?
Definitely Probably Not Sure Probably
Not Definitely
Not Spring 2012 27% 35% 23% 9% 5% Spring 2011 27% 30% 24% 11% 8% Spring 2010 28% 31% 23% 9% 8% Spring 2009 27% 33% 27% 6% 7%
Fall 2008 27% 33% 27% 6% 6% Spring 2008 32% 33% 22% 8% 6%
Fall 2007 32% 34% 20% 9% 5% Spring 2007 30% 34% 24% 8% 4%
Fall 2006 22% 41% 25% 7% 5% 96. On a scale of 1 to 5, to what extent are you knowledgeable about financial aid and the cost and benefits to you in pursuing postsecondary education?
Mean Score Spring 2012 2.99
97. Have you discussed with your parent/guardian your plans after high school graduation?
Yes No Spring 2012 77% 23% Spring 2011 74% 26% Spring 2010 75% 25%
98. Have any of your brothers or sisters earned a college degree?
Yes No Not
Applicable Spring 2012 23% 52% 26% Spring 2011 23% 54% 23% Spring 2010 25% 48% 26%
99. Have either of your parents/guardians earned a college degree?
Yes No Spring 2012 50% 50% Spring 2011 47% 53% Spring 2010 45% 55%
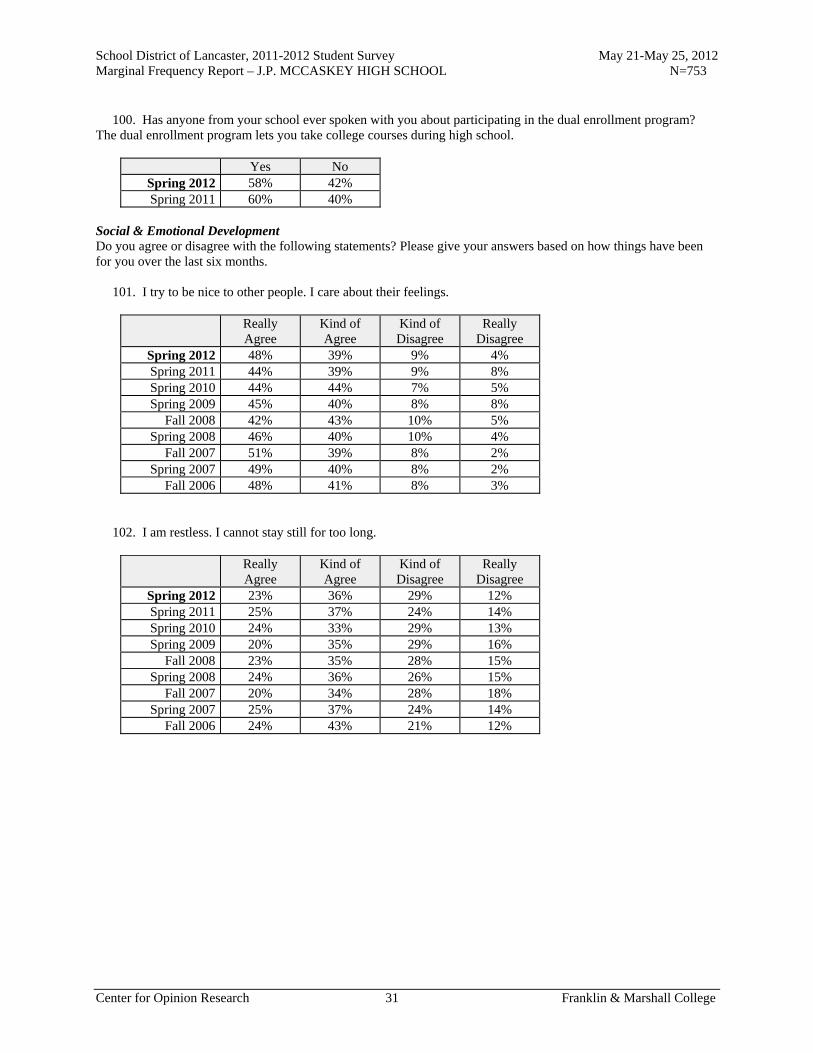
School District of Lancaster, 2011-2012 Student Survey May 21-May 25, 2012 Marginal Frequency Report – J.P. MCCASKEY HIGH SCHOOL N=753
Center for Opinion Research 31 Franklin & Marshall College
100. Has anyone from your school ever spoken with you about participating in the dual enrollment program? The dual enrollment program lets you take college courses during high school.
Yes No Spring 2012 58% 42% Spring 2011 60% 40%
Social & Emotional Development Do you agree or disagree with the following statements? Please give your answers based on how things have been for you over the last six months. 101. I try to be nice to other people. I care about their feelings.
Really Agree
Kind of Agree
Kind of Disagree
Really Disagree
Spring 2012 48% 39% 9% 4% Spring 2011 44% 39% 9% 8% Spring 2010 44% 44% 7% 5% Spring 2009 45% 40% 8% 8%
Fall 2008 42% 43% 10% 5% Spring 2008 46% 40% 10% 4%
Fall 2007 51% 39% 8% 2% Spring 2007 49% 40% 8% 2%
Fall 2006 48% 41% 8% 3% 102. I am restless. I cannot stay still for too long.
Really Agree
Kind of Agree
Kind of Disagree
Really Disagree
Spring 2012 23% 36% 29% 12% Spring 2011 25% 37% 24% 14% Spring 2010 24% 33% 29% 13% Spring 2009 20% 35% 29% 16%
Fall 2008 23% 35% 28% 15% Spring 2008 24% 36% 26% 15%
Fall 2007 20% 34% 28% 18% Spring 2007 25% 37% 24% 14%
Fall 2006 24% 43% 21% 12%

School District of Lancaster, 2011-2012 Student Survey May 21-May 25, 2012 Marginal Frequency Report – J.P. MCCASKEY HIGH SCHOOL N=753
Center for Opinion Research 32 Franklin & Marshall College
103. I get a lot of headaches, stomach-aches or sickness.
Really Agree
Kind of Agree
Kind of Disagree
Really Disagree
Spring 2012 13% 24% 35% 28% Spring 2011 15% 23% 31% 31% Spring 2010 16% 22% 33% 28% Spring 2009 15% 25% 30% 29%
Fall 2008 16% 24% 33% 26% Spring 2008 14% 30% 27% 29%
Fall 2007 13% 24% 31% 31% Spring 2007 16% 24% 30% 30%
Fall 2006 14% 25% 33% 27% 104. I usually share with others, for example CD's, games, food.
Really Agree
Kind of Agree
Kind of Disagree
Really Disagree
Spring 2012 31% 44% 16% 9% Spring 2011 29% 42% 19% 10% Spring 2010 29% 43% 17% 10% Spring 2009 30% 44% 16% 10%
Fall 2008 29% 45% 18% 8% Spring 2008 33% 46% 14% 7%
Fall 2007 38% 42% 13% 7% Spring 2007 39% 46% 10% 6%
Fall 2006 46% 41% 10% 3% 105. I get very angry and often lose my temper.
Really Agree
Kind of Agree
Kind of Disagree
Really Disagree
Spring 2012 13% 25% 34% 28% Spring 2011 14% 22% 35% 29% Spring 2010 13% 24% 32% 31% Spring 2009 15% 26% 31% 28%
Fall 2008 17% 22% 35% 26% Spring 2008 16% 32% 30% 22%
Fall 2007 15% 29% 31% 26% Spring 2007 16% 26% 32% 26%
Fall 2006 24% 24% 35% 18%

School District of Lancaster, 2011-2012 Student Survey May 21-May 25, 2012 Marginal Frequency Report – J.P. MCCASKEY HIGH SCHOOL N=753
Center for Opinion Research 33 Franklin & Marshall College
106. I would rather be alone than with people of my age.
Really Agree
Kind of Agree
Kind of Disagree
Really Disagree
Spring 2012 13% 25% 34% 28% Spring 2011 13% 25% 32% 30% Spring 2010 12% 23% 35% 31% Spring 2009 9% 26% 34% 31%
Fall 2008 11% 24% 35% 30% Spring 2008 13% 23% 33% 31%
Fall 2007 10% 22% 36% 33% Spring 2007 11% 24% 31% 35%
Fall 2006 10% 21% 36% 33% 107. I usually do as I am told.
Really Agree
Kind of Agree
Kind of Disagree
Really Disagree
Spring 2012 28% 51% 17% 5% Spring 2011 25% 49% 16% 9% Spring 2010 25% 50% 17% 8% Spring 2009 22% 53% 18% 7%
Fall 2008 25% 51% 18% 6% Spring 2008 25% 51% 17% 7%
Fall 2007 27% 52% 17% 4% Spring 2007 28% 48% 19% 5%
Fall 2006 31% 48% 16% 5% 108. I worry a lot.
Really Agree
Kind of Agree
Kind of Disagree
Really Disagree
Spring 2012 23% 33% 29% 15% Spring 2011 24% 30% 29% 17% Spring 2010 25% 29% 27% 19% Spring 2009 23% 32% 26% 19%
Fall 2008 23% 28% 30% 18% Spring 2008 23% 33% 25% 19%
Fall 2007 21% 31% 28% 20% Spring 2007 22% 31% 28% 18%
Fall 2006 32% 29% 24% 15%
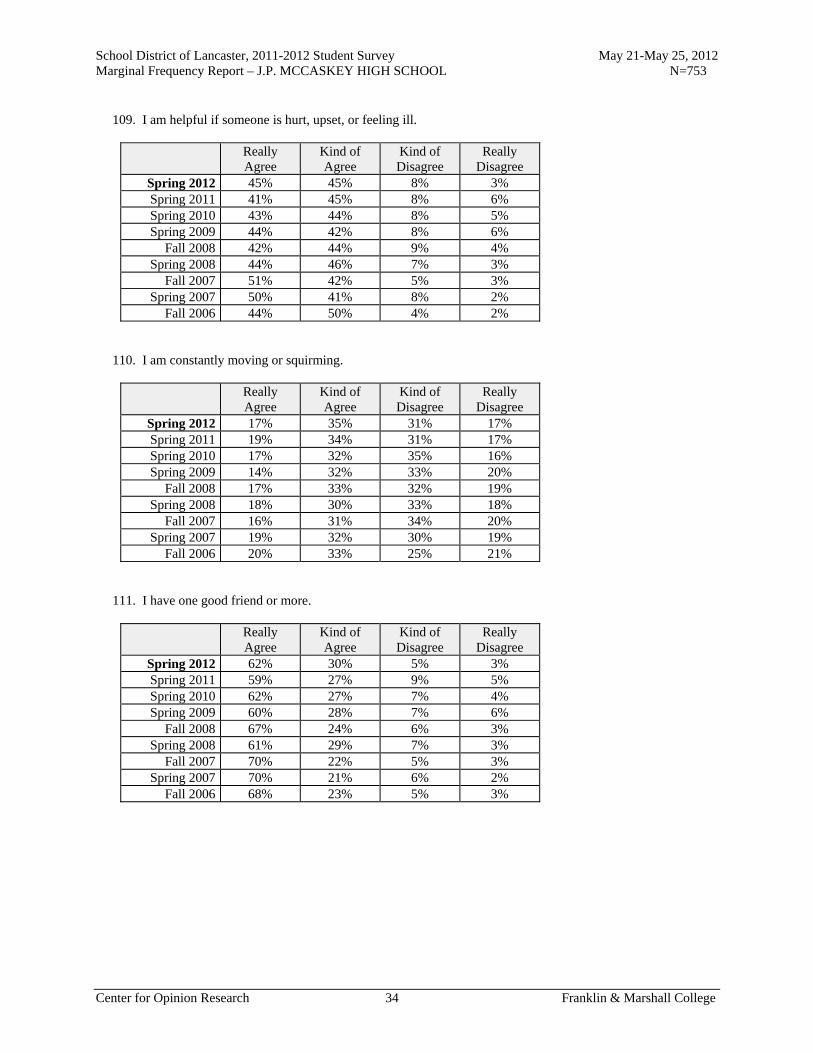
School District of Lancaster, 2011-2012 Student Survey May 21-May 25, 2012 Marginal Frequency Report – J.P. MCCASKEY HIGH SCHOOL N=753
Center for Opinion Research 34 Franklin & Marshall College
109. I am helpful if someone is hurt, upset, or feeling ill.
Really Agree
Kind of Agree
Kind of Disagree
Really Disagree
Spring 2012 45% 45% 8% 3% Spring 2011 41% 45% 8% 6% Spring 2010 43% 44% 8% 5% Spring 2009 44% 42% 8% 6%
Fall 2008 42% 44% 9% 4% Spring 2008 44% 46% 7% 3%
Fall 2007 51% 42% 5% 3% Spring 2007 50% 41% 8% 2%
Fall 2006 44% 50% 4% 2% 110. I am constantly moving or squirming.
Really Agree
Kind of Agree
Kind of Disagree
Really Disagree
Spring 2012 17% 35% 31% 17% Spring 2011 19% 34% 31% 17% Spring 2010 17% 32% 35% 16% Spring 2009 14% 32% 33% 20%
Fall 2008 17% 33% 32% 19% Spring 2008 18% 30% 33% 18%
Fall 2007 16% 31% 34% 20% Spring 2007 19% 32% 30% 19%
Fall 2006 20% 33% 25% 21% 111. I have one good friend or more.
Really Agree
Kind of Agree
Kind of Disagree
Really Disagree
Spring 2012 62% 30% 5% 3% Spring 2011 59% 27% 9% 5% Spring 2010 62% 27% 7% 4% Spring 2009 60% 28% 7% 6%
Fall 2008 67% 24% 6% 3% Spring 2008 61% 29% 7% 3%
Fall 2007 70% 22% 5% 3% Spring 2007 70% 21% 6% 2%
Fall 2006 68% 23% 5% 3%

School District of Lancaster, 2011-2012 Student Survey May 21-May 25, 2012 Marginal Frequency Report – J.P. MCCASKEY HIGH SCHOOL N=753
Center for Opinion Research 35 Franklin & Marshall College
112. I fight a lot. I can make other people do what I want.
Really Agree
Kind of Agree
Kind of Disagree
Really Disagree
Spring 2012 6% 12% 32% 50% Spring 2011 7% 13% 30% 51% Spring 2010 8% 13% 31% 48% Spring 2009 6% 17% 29% 48%
Fall 2008 5% 15% 32% 47% Spring 2008 8% 19% 33% 40%
Fall 2007 6% 15% 33% 46% Spring 2007 6% 17% 30% 48%
Fall 2006 4% 16% 35% 46% 113. I am often unhappy, depressed, or tearful.
Really Agree
Kind of Agree
Kind of Disagree
Really Disagree
Spring 2012 11% 22% 32% 34% Spring 2011 10% 18% 34% 38% Spring 2010 12% 20% 30% 39% Spring 2009 11% 24% 28% 37%
Fall 2008 10% 24% 28% 38% Spring 2008 12% 23% 29% 36%
Fall 2007 10% 20% 29% 40% Spring 2007 9% 20% 28% 42%
Fall 2006 8% 29% 26% 38% 114. Other people my age generally like me.
Really Agree
Kind of Agree
Kind of Disagree
Really Disagree
Spring 2012 38% 46% 12% 4% Spring 2011 36% 46% 11% 7% Spring 2010 38% 47% 10% 5% Spring 2009 34% 47% 11% 7%
Fall 2008 39% 45% 12% 4% Spring 2008 41% 44% 11% 4%
Fall 2007 42% 46% 8% 3% Spring 2007 42% 45% 9% 3%
Fall 2006 36% 50% 12% 2%
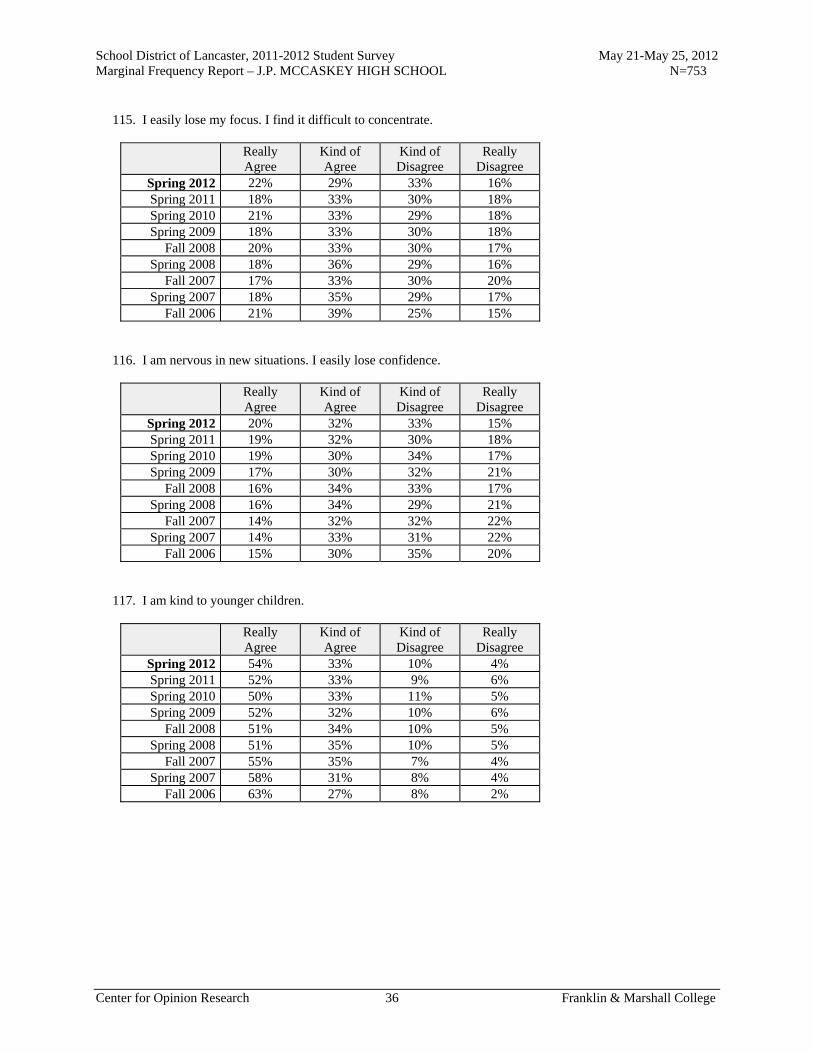
School District of Lancaster, 2011-2012 Student Survey May 21-May 25, 2012 Marginal Frequency Report – J.P. MCCASKEY HIGH SCHOOL N=753
Center for Opinion Research 36 Franklin & Marshall College
115. I easily lose my focus. I find it difficult to concentrate.
Really Agree
Kind of Agree
Kind of Disagree
Really Disagree
Spring 2012 22% 29% 33% 16% Spring 2011 18% 33% 30% 18% Spring 2010 21% 33% 29% 18% Spring 2009 18% 33% 30% 18%
Fall 2008 20% 33% 30% 17% Spring 2008 18% 36% 29% 16%
Fall 2007 17% 33% 30% 20% Spring 2007 18% 35% 29% 17%
Fall 2006 21% 39% 25% 15% 116. I am nervous in new situations. I easily lose confidence.
Really Agree
Kind of Agree
Kind of Disagree
Really Disagree
Spring 2012 20% 32% 33% 15% Spring 2011 19% 32% 30% 18% Spring 2010 19% 30% 34% 17% Spring 2009 17% 30% 32% 21%
Fall 2008 16% 34% 33% 17% Spring 2008 16% 34% 29% 21%
Fall 2007 14% 32% 32% 22% Spring 2007 14% 33% 31% 22%
Fall 2006 15% 30% 35% 20% 117. I am kind to younger children.
Really Agree
Kind of Agree
Kind of Disagree
Really Disagree
Spring 2012 54% 33% 10% 4% Spring 2011 52% 33% 9% 6% Spring 2010 50% 33% 11% 5% Spring 2009 52% 32% 10% 6%
Fall 2008 51% 34% 10% 5% Spring 2008 51% 35% 10% 5%
Fall 2007 55% 35% 7% 4% Spring 2007 58% 31% 8% 4%
Fall 2006 63% 27% 8% 2%
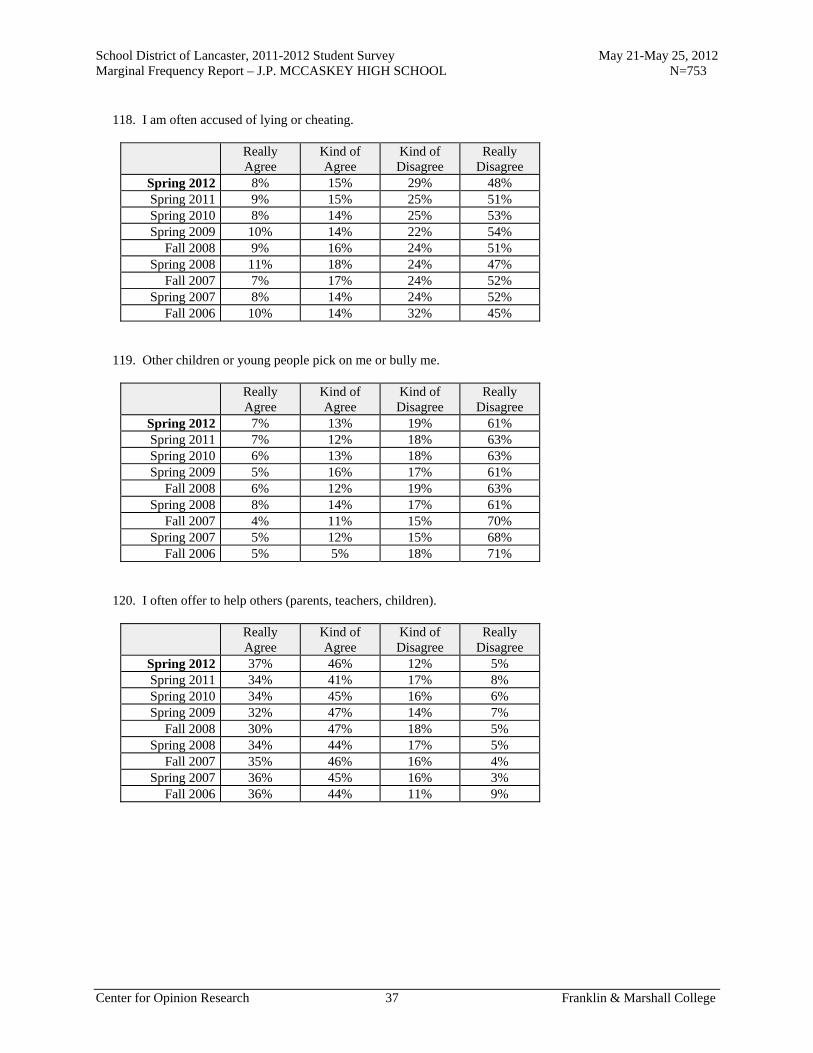
School District of Lancaster, 2011-2012 Student Survey May 21-May 25, 2012 Marginal Frequency Report – J.P. MCCASKEY HIGH SCHOOL N=753
Center for Opinion Research 37 Franklin & Marshall College
118. I am often accused of lying or cheating.
Really Agree
Kind of Agree
Kind of Disagree
Really Disagree
Spring 2012 8% 15% 29% 48% Spring 2011 9% 15% 25% 51% Spring 2010 8% 14% 25% 53% Spring 2009 10% 14% 22% 54%
Fall 2008 9% 16% 24% 51% Spring 2008 11% 18% 24% 47%
Fall 2007 7% 17% 24% 52% Spring 2007 8% 14% 24% 52%
Fall 2006 10% 14% 32% 45% 119. Other children or young people pick on me or bully me.
Really Agree
Kind of Agree
Kind of Disagree
Really Disagree
Spring 2012 7% 13% 19% 61% Spring 2011 7% 12% 18% 63% Spring 2010 6% 13% 18% 63% Spring 2009 5% 16% 17% 61%
Fall 2008 6% 12% 19% 63% Spring 2008 8% 14% 17% 61%
Fall 2007 4% 11% 15% 70% Spring 2007 5% 12% 15% 68%
Fall 2006 5% 5% 18% 71% 120. I often offer to help others (parents, teachers, children).
Really Agree
Kind of Agree
Kind of Disagree
Really Disagree
Spring 2012 37% 46% 12% 5% Spring 2011 34% 41% 17% 8% Spring 2010 34% 45% 16% 6% Spring 2009 32% 47% 14% 7%
Fall 2008 30% 47% 18% 5% Spring 2008 34% 44% 17% 5%
Fall 2007 35% 46% 16% 4% Spring 2007 36% 45% 16% 3%
Fall 2006 36% 44% 11% 9%

School District of Lancaster, 2011-2012 Student Survey May 21-May 25, 2012 Marginal Frequency Report – J.P. MCCASKEY HIGH SCHOOL N=753
Center for Opinion Research 38 Franklin & Marshall College
121. I think before I do things.
Really Agree
Kind of Agree
Kind of Disagree
Really Disagree
Spring 2012 30% 47% 18% 5% Spring 2011 30% 44% 18% 8% Spring 2010 29% 44% 20% 7% Spring 2009 26% 49% 17% 7%
Fall 2008 29% 45% 18% 8% Spring 2008 29% 46% 18% 7%
Fall 2007 30% 49% 16% 6% Spring 2007 29% 47% 17% 7%
Fall 2006 23% 51% 19% 7% 122. I take things that are not mine from home, school, or elsewhere.
Really Agree
Kind of Agree
Kind of Disagree
Really Disagree
Spring 2012 7% 15% 19% 59% Spring 2011 6% 12% 18% 64% Spring 2010 7% 14% 19% 60% Spring 2009 6% 13% 17% 64%
Fall 2008 6% 14% 20% 60% Spring 2008 6% 15% 21% 58%
Fall 2007 4% 12% 19% 65% Spring 2007 5% 12% 19% 64%
Fall 2006 7% 12% 23% 58% 123. I get along better with adults than with people my own age.
Really Agree
Kind of Agree
Kind of Disagree
Really Disagree
Spring 2012 19% 32% 35% 14% Spring 2011 18% 31% 34% 18% Spring 2010 14% 34% 37% 15% Spring 2009 16% 32% 36% 16%
Fall 2008 16% 29% 39% 17% Spring 2008 17% 34% 34% 14%
Fall 2007 15% 28% 38% 19% Spring 2007 13% 30% 39% 18%
Fall 2006 16% 25% 39% 20%
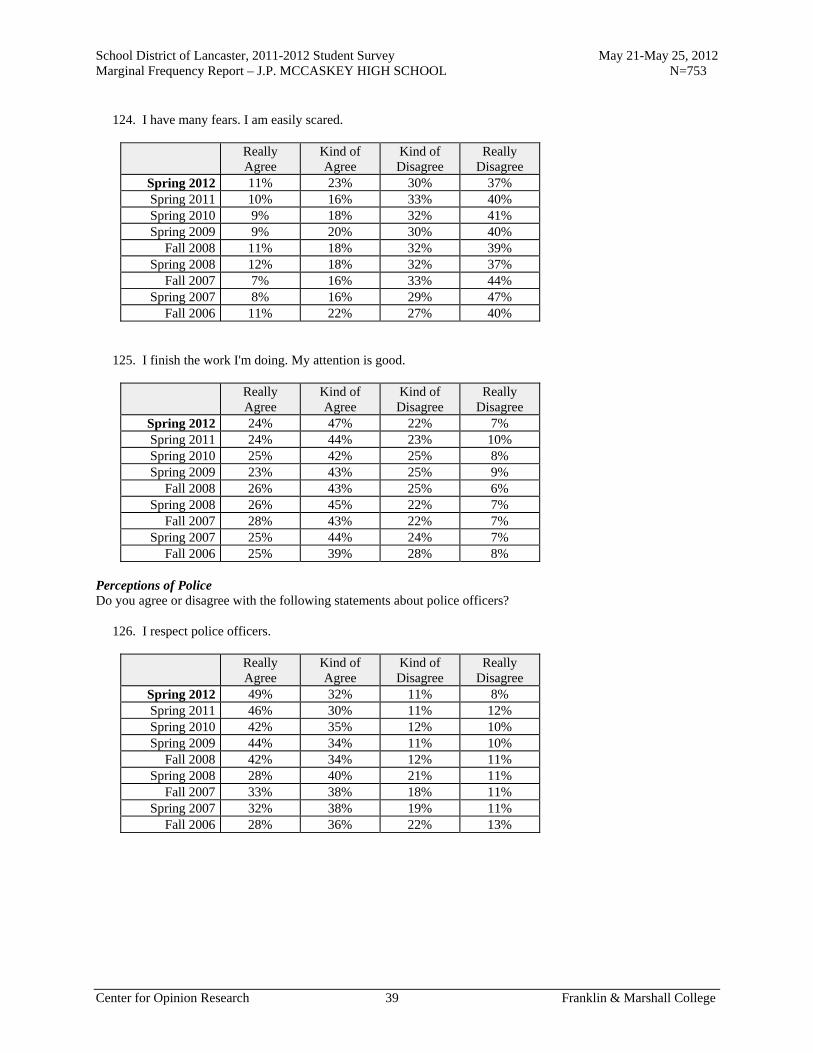
School District of Lancaster, 2011-2012 Student Survey May 21-May 25, 2012 Marginal Frequency Report – J.P. MCCASKEY HIGH SCHOOL N=753
Center for Opinion Research 39 Franklin & Marshall College
124. I have many fears. I am easily scared.
Really Agree
Kind of Agree
Kind of Disagree
Really Disagree
Spring 2012 11% 23% 30% 37% Spring 2011 10% 16% 33% 40% Spring 2010 9% 18% 32% 41% Spring 2009 9% 20% 30% 40%
Fall 2008 11% 18% 32% 39% Spring 2008 12% 18% 32% 37%
Fall 2007 7% 16% 33% 44% Spring 2007 8% 16% 29% 47%
Fall 2006 11% 22% 27% 40% 125. I finish the work I'm doing. My attention is good.
Really Agree
Kind of Agree
Kind of Disagree
Really Disagree
Spring 2012 24% 47% 22% 7% Spring 2011 24% 44% 23% 10% Spring 2010 25% 42% 25% 8% Spring 2009 23% 43% 25% 9%
Fall 2008 26% 43% 25% 6% Spring 2008 26% 45% 22% 7%
Fall 2007 28% 43% 22% 7% Spring 2007 25% 44% 24% 7%
Fall 2006 25% 39% 28% 8% Perceptions of Police Do you agree or disagree with the following statements about police officers? 126. I respect police officers.
Really Agree
Kind of Agree
Kind of Disagree
Really Disagree
Spring 2012 49% 32% 11% 8% Spring 2011 46% 30% 11% 12% Spring 2010 42% 35% 12% 10% Spring 2009 44% 34% 11% 10%
Fall 2008 42% 34% 12% 11% Spring 2008 28% 40% 21% 11%
Fall 2007 33% 38% 18% 11% Spring 2007 32% 38% 19% 11%
Fall 2006 28% 36% 22% 13%

School District of Lancaster, 2011-2012 Student Survey May 21-May 25, 2012 Marginal Frequency Report – J.P. MCCASKEY HIGH SCHOOL N=753
Center for Opinion Research 40 Franklin & Marshall College
127. I am comfortable approaching police officers.
Really Agree
Kind of Agree
Kind of Disagree
Really Disagree
Spring 2012 36% 37% 18% 8% Spring 2011 37% 32% 16% 15% Spring 2010 35% 37% 17% 11% Spring 2009 33% 37% 19% 12%
Fall 2008 31% 37% 19% 12% Spring 2008 27% 39% 22% 12%
Fall 2007 27% 37% 20% 15% Spring 2007 28% 39% 18% 15%
Fall 2006 29% 38% 27% 7% 128. I would consider police work as a career.
Really Agree
Kind of Agree
Kind of Disagree
Really Disagree
Spring 2012 13% 21% 22% 44% Spring 2011 14% 16% 18% 52% Spring 2010 13% 16% 19% 51% Spring 2009 16% 16% 19% 49%
Fall 2008 12% 17% 18% 53% Spring 2008 12% 20% 21% 47%
Fall 2007 12% 18% 16% 54% Spring 2007 12% 21% 16% 51%
Fall 2006 17% 22% 16% 44% 129. In general, I do not trust the police.
Really Agree
Kind of Agree
Kind of Disagree
Really Disagree
Spring 2012 16% 26% 28% 30% Spring 2011 17% 23% 27% 34% Spring 2010 16% 25% 30% 30% Spring 2009 16% 27% 32% 26%
Fall 2008 17% 25% 30% 28% Spring 2008 18% 28% 34% 21%
Fall 2007 16% 24% 32% 27% Spring 2007 16% 27% 32% 26%
Fall 2006 17% 30% 30% 23%

School District of Lancaster, 2011-2012 Student Survey May 21-May 25, 2012 Marginal Frequency Report – J.P. MCCASKEY HIGH SCHOOL N=753
Center for Opinion Research 41 Franklin & Marshall College
130. Police do not belong in schools unless there has been a crime.
Really Agree
Kind of Agree
Kind of Disagree
Really Disagree
Spring 2012 16% 27% 34% 23% Spring 2011 16% 18% 30% 35% Spring 2010 16% 22% 33% 30% Spring 2009 16% 24% 32% 28%
Fall 2008 19% 20% 32% 29% Spring 2008 19% 26% 33% 22%
Fall 2007 18% 27% 29% 26% Spring 2007 20% 25% 29% 27%
Fall 2006 16% 28% 29% 27% Hidden Delinquency In the last 12 months, how many times did you... 131. Deliberately damage property that did not belong to you.
Never 1 or 2 Times 3 or 4 Times5 or More
Times Spring 2012 74% 18% 4% 4% Spring 2011 73% 15% 4% 8% Spring 2010 75% 16% 4% 6% Spring 2009 74% 16% 4% 6%
Fall 2008 74% 17% 4% 5% Spring 2008 70% 19% 4% 6%
Fall 2007 71% 22% 3% 4% Spring 2007 74% 18% 5% 3%
Fall 2006 73% 21% 2% 4% 132. Take something from a store without paying for it.
Never 1 or 2 Times 3 or 4 Times5 or More
Times Spring 2012 76% 15% 4% 5% Spring 2011 74% 12% 4% 9% Spring 2010 76% 13% 5% 6% Spring 2009 77% 12% 4% 6%
Fall 2008 78% 14% 3% 5% Spring 2008 75% 14% 5% 6%
Fall 2007 78% 15% 3% 4% Spring 2007 78% 14% 3% 4%
Fall 2006 81% 15% 2% 2%

School District of Lancaster, 2011-2012 Student Survey May 21-May 25, 2012 Marginal Frequency Report – J.P. MCCASKEY HIGH SCHOOL N=753
Center for Opinion Research 42 Franklin & Marshall College
133. Hurt someone badly enough for that person to need bandages or care from a doctor or nurse.
Never 1 or 2 Times 3 or 4 Times5 or More
Times Spring 2012 79% 14% 4% 3% Spring 2011 77% 12% 3% 7% Spring 2010 79% 13% 4% 4% Spring 2009 79% 13% 3% 5%
Fall 2008 79% 12% 5% 4% Spring 2008 76% 14% 6% 5%
Fall 2007 77% 16% 4% 3% Spring 2007 80% 12% 5% 3%
Fall 2006 80% 14% 4% 2% 134. Drive a car without its owner's permission.
Never 1 or 2 Times 3 or 4 Times5 or More
Times Spring 2012 86% 7% 3% 4% Spring 2011 82% 8% 2% 8% Spring 2010 86% 7% 2% 5% Spring 2009 84% 7% 3% 5%
Fall 2008 84% 8% 3% 4% Spring 2008 82% 10% 3% 5%
Fall 2007 86% 8% 3% 4% Spring 2007 84% 9% 2% 4%
Fall 2006 91% 4% 5% 1% 135. Steal something worth more than $50.
Never 1 or 2 Times 3 or 4 Times5 or More
Times Spring 2012 86% 7% 4% 3% Spring 2011 84% 6% 3% 7% Spring 2010 87% 5% 4% 5% Spring 2009 88% 5% 2% 5%
Fall 2008 88% 5% 3% 4% Spring 2008 86% 6% 4% 5%
Fall 2007 89% 6% 2% 3% Spring 2007 89% 5% 3% 3%
Fall 2006 93% 6% 1% 0%

School District of Lancaster, 2011-2012 Student Survey May 21-May 25, 2012 Marginal Frequency Report – J.P. MCCASKEY HIGH SCHOOL N=753
Center for Opinion Research 43 Franklin & Marshall College
136. Go into a house or building to steal something.
Never 1 or 2 Times 3 or 4 Times5 or More
Times Spring 2012 86% 8% 3% 3% Spring 2011 85% 4% 3% 7% Spring 2010 88% 5% 3% 3% Spring 2009 87% 6% 2% 4%
Fall 2008 88% 6% 3% 4% Spring 2008 87% 5% 4% 4%
Fall 2007 90% 6% 2% 2% Spring 2007 91% 5% 2% 2%
Fall 2006 97% 2% 1% 1% 137. Use or threaten to use a weapon to get something from someone.
Never 1 or 2 Times 3 or 4 Times5 or More
Times Spring 2012 87% 7% 3% 4% Spring 2011 83% 6% 2% 8% Spring 2010 86% 7% 3% 5% Spring 2009 87% 6% 2% 5%
Fall 2008 88% 6% 4% 3% Spring 2008 85% 6% 4% 5%
Fall 2007 90% 6% 2% 2% Spring 2007 90% 5% 2% 3%
Fall 2006 91% 7% 2% 1% 138. Steal something worth less than $50.
Never 1 or 2 Times 3 or 4 Times5 or More
Times Spring 2012 76% 14% 5% 4% Spring 2011 76% 10% 4% 10% Spring 2010 78% 13% 3% 6% Spring 2009 79% 10% 5% 6%
Fall 2008 78% 13% 4% 5% Spring 2008 76% 14% 4% 6%
Fall 2007 79% 13% 3% 5% Spring 2007 80% 13% 3% 4%
Fall 2006 82% 11% 4% 3%

School District of Lancaster, 2011-2012 Student Survey May 21-May 25, 2012 Marginal Frequency Report – J.P. MCCASKEY HIGH SCHOOL N=753
Center for Opinion Research 44 Franklin & Marshall College
139. Take part in a fight where a group of your friends is against another group.
Never 1 or 2 Times 3 or 4 Times5 or More
Times Spring 2012 81% 12% 5% 3% Spring 2011 77% 12% 4% 8% Spring 2010 81% 10% 4% 5% Spring 2009 82% 9% 3% 5%
Fall 2008 80% 11% 5% 4% Spring 2008 78% 12% 5% 5%
Fall 2007 77% 15% 4% 4% Spring 2007 80% 12% 4% 4%
Fall 2006 80% 11% 6% 3% 140. Act loudly, rowdy, or out of control in a public place.
Never 1 or 2 Times 3 or 4 Times5 or More
Times Spring 2012 54% 25% 9% 12% Spring 2011 56% 19% 9% 16% Spring 2010 58% 21% 10% 12% Spring 2009 60% 23% 6% 12%
Fall 2008 59% 22% 8% 11% Spring 2008 58% 21% 8% 13%
Fall 2007 57% 24% 8% 12% Spring 2007 53% 26% 9% 12%
Fall 2006 55% 24% 12% 8% Drug & Alcohol Use On how many occasions (if any) have you... 141. Had beer, wine, or hard liquor in your lifetime?
0 1 or 2 Times
3 to 5 Times
6 to 9 Times
10 to 19 Times
20 to 39 Times
40 or More Times
Spring 2012 42% 17% 14% 8% 7% 2% 10% Spring 2011 40% 16% 13% 8% 6% 4% 14% Spring 2010 38% 16% 14% 9% 7% 5% 11% Spring 2009 40% 17% 14% 7% 8% 5% 9%
Fall 2008 40% 17% 13% 8% 8% 4% 10% Spring 2008 36% 18% 12% 8% 9% 8% 9%
Fall 2007 35% 22% 14% 10% 7% 5% 7% Spring 2007 32% 23% 13% 11% 8% 6% 8%
Fall 2006 40% 18% 15% 6% 9% 2% 8%

School District of Lancaster, 2011-2012 Student Survey May 21-May 25, 2012 Marginal Frequency Report – J.P. MCCASKEY HIGH SCHOOL N=753
Center for Opinion Research 45 Franklin & Marshall College
142. Had beer, wine, or hard liquor during the past 30 days?
0 1 or 2 Times
3 to 5 Times
6 to 9 Times
10 to 19 Times
20 to 39 Times
40 or More Times
Spring 2012 67% 15% 7% 4% 2% 1% 4% Spring 2011 66% 13% 6% 3% 2% 2% 8% Spring 2010 67% 16% 7% 3% 2% 1% 4% Spring 2009 69% 15% 5% 3% 2% 1% 5%
Fall 2008 69% 15% 6% 3% 1% 1% 4% Spring 2008 63% 16% 9% 4% 3% 0% 5%
Fall 2007 72% 17% 6% 1% 1% 0% 2% Spring 2007 71% 16% 7% 3% 1% 0% 2%
Fall 2006 74% 19% 4% 2% 2% 0% 0% 143. Used marijuana in your lifetime?
0 1 or 2 Times
3 to 5 Times
6 to 9 Times
10 to 19 Times
20 to 39 Times
40 or More Times
Spring 2012 66% 8% 5% 3% 4% 2% 11% Spring 2011 67% 7% 5% 2% 3% 3% 12% Spring 2010 72% 8% 5% 2% 3% 2% 8% Spring 2009 73% 7% 4% 3% 2% 2% 9%
Fall 2008 74% 7% 3% 3% 3% 1% 8% Spring 2008 66% 9% 5% 4% 4% 3% 9%
Fall 2007 74% 8% 3% 3% 3% 2% 6% Spring 2007 72% 8% 5% 2% 3% 3% 6%
Fall 2006 75% 12% 6% 1% 1% 2% 4% 144. Used marijuana during the past 30 days?
0 1 or 2 Times
3 to 5 Times
6 to 9 Times
10 to 19 Times
20 to 39 Times
40 or More Times
Spring 2012 77% 7% 4% 2% 2% 2% 6% Spring 2011 76% 6% 3% 2% 3% 1% 8% Spring 2010 84% 4% 2% 3% 2% 1% 5% Spring 2009 82% 4% 3% 1% 2% 1% 6%
Fall 2008 85% 4% 1% 1% 1% 2% 5% Spring 2008 80% 4% 4% 3% 3% 1% 6%
Fall 2007 85% 4% 3% 2% 1% 1% 4% Spring 2007 86% 5% 2% 2% 1% 1% 3%
Fall 2006 91% 3% 2% 1% 1% 1% 2%
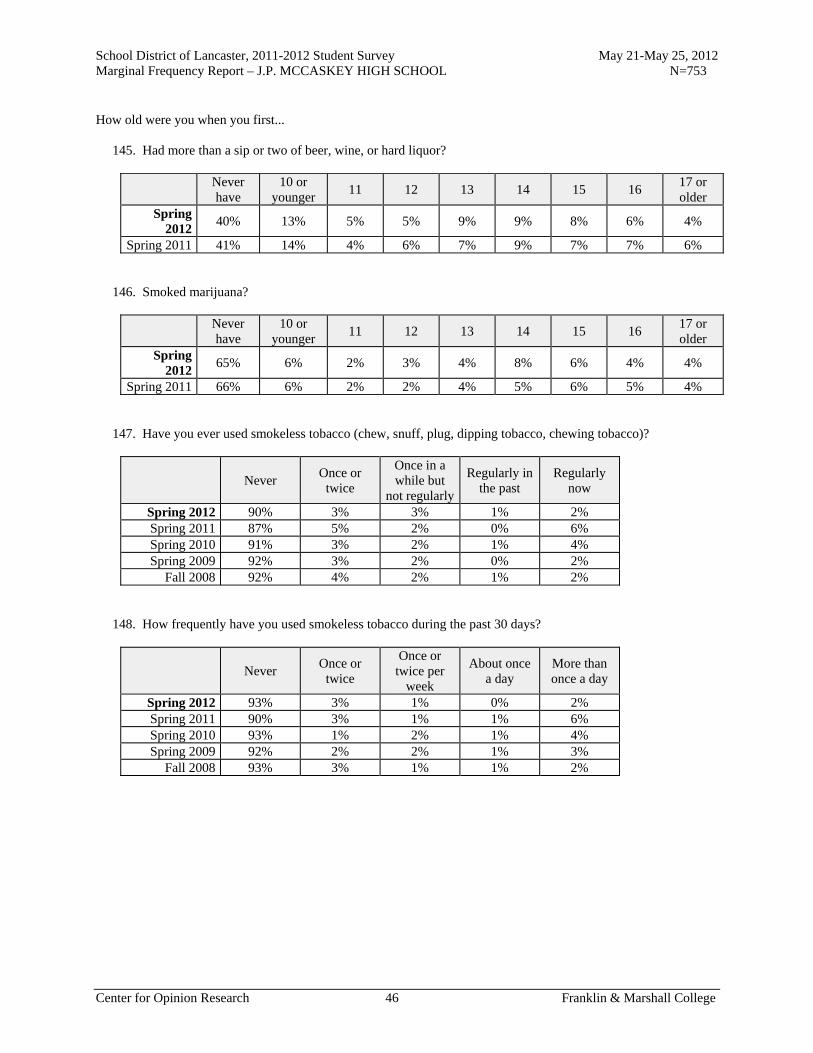
School District of Lancaster, 2011-2012 Student Survey May 21-May 25, 2012 Marginal Frequency Report – J.P. MCCASKEY HIGH SCHOOL N=753
Center for Opinion Research 46 Franklin & Marshall College
How old were you when you first... 145. Had more than a sip or two of beer, wine, or hard liquor?
Never have
10 or younger
11 12 13 14 15 16 17 or older
Spring 2012
40% 13% 5% 5% 9% 9% 8% 6% 4%
Spring 2011 41% 14% 4% 6% 7% 9% 7% 7% 6% 146. Smoked marijuana?
Never have
10 or younger
11 12 13 14 15 16 17 or older
Spring 2012
65% 6% 2% 3% 4% 8% 6% 4% 4%
Spring 2011 66% 6% 2% 2% 4% 5% 6% 5% 4% 147. Have you ever used smokeless tobacco (chew, snuff, plug, dipping tobacco, chewing tobacco)?
Never Once or
twice
Once in a while but
not regularly
Regularly in the past
Regularly now
Spring 2012 90% 3% 3% 1% 2% Spring 2011 87% 5% 2% 0% 6% Spring 2010 91% 3% 2% 1% 4% Spring 2009 92% 3% 2% 0% 2%
Fall 2008 92% 4% 2% 1% 2% 148. How frequently have you used smokeless tobacco during the past 30 days?
Never Once or
twice
Once or twice per
week
About once a day
More than once a day
Spring 2012 93% 3% 1% 0% 2% Spring 2011 90% 3% 1% 1% 6% Spring 2010 93% 1% 2% 1% 4% Spring 2009 92% 2% 2% 1% 3%
Fall 2008 93% 3% 1% 1% 2%

School District of Lancaster, 2011-2012 Student Survey May 21-May 25, 2012 Marginal Frequency Report – J.P. MCCASKEY HIGH SCHOOL N=753
Center for Opinion Research 47 Franklin & Marshall College
149. Have you ever smoked cigarettes?
Never Once or
twice
Once in a while but
not regularly
Regularly in the past
Regularly now
Spring 2012 74% 13% 6% 2% 5% Spring 2011 73% 11% 6% 2% 7% Spring 2010 74% 13% 4% 2% 6% Spring 2009 74% 15% 4% 2% 5%
Fall 2008 72% 14% 6% 3% 5% 150. How frequently have you smoked cigarettes during the past 30 days?
Not at all
Less than one
cigarette per day
One to five cigarettes per day
About one-half pack per day
About one pack per
day
About one and one-
half packs per day
Two packs or more per
day
Spring 2012 86% 5% 3% 2% 2% 0% 2% Spring 2011 84% 4% 3% 2% 1% 0% 6% Spring 2010 87% 4% 3% 1% 0% 1% 4% Spring 2009 88% 3% 3% 2% 1% 0% 2%
Fall 2008 86% 5% 3% 2% 1% 1% 2% Bullying & Violence In the past 12 months, how often have you... 151. Been threatened to be hit or beaten up on school property?
Never Once 2 or 3 Times 4 or 5 Times 6 to 9 Times 10 Times or
More Spring 2012 74% 12% 7% 3% 1% 3% Spring 2011 74% 10% 7% 2% 1% 6% Spring 2010 76% 12% 6% 2% 1% 4% Spring 2009 77% 12% 5% 1% 1% 4%
Fall 2008 78% 11% 6% 1% 1% 3% Spring 2008 79% 11% 4% 2% 0% 3%
Fall 2007 77% 12% 6% 2% 1% 2% Spring 2007 75% 13% 7% 2% 0% 2%
Fall 2006 76% 17% 4% 2% 0% 1%
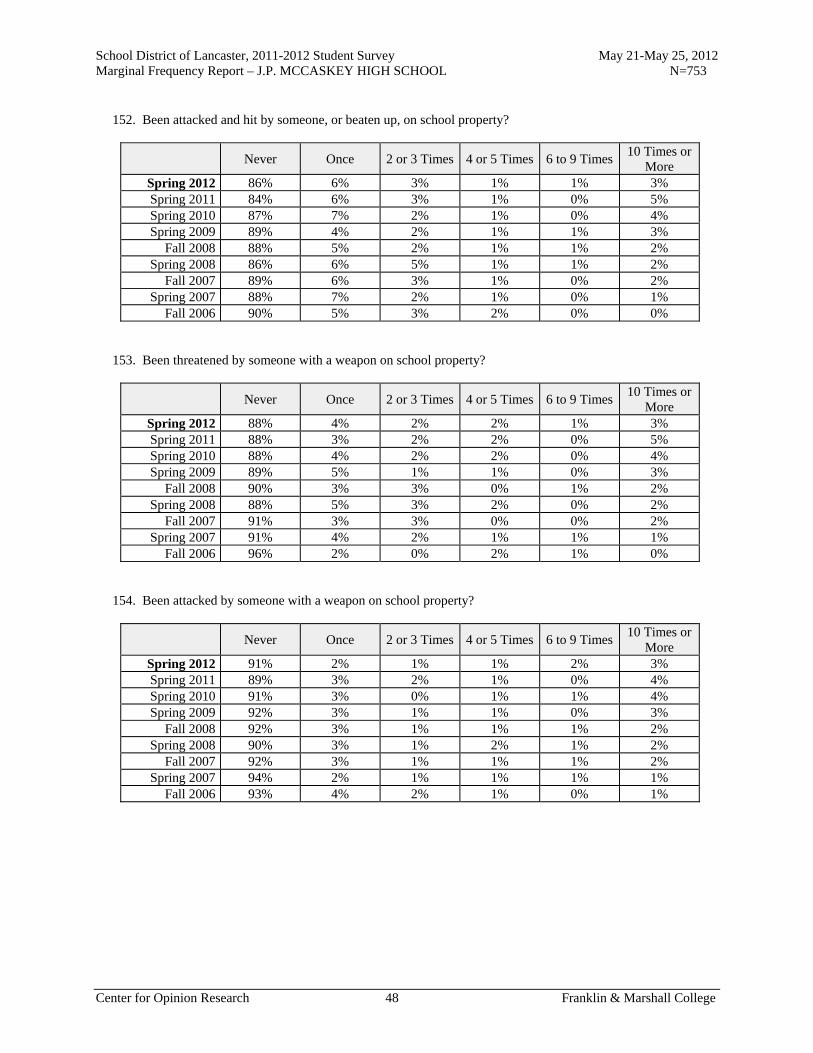
School District of Lancaster, 2011-2012 Student Survey May 21-May 25, 2012 Marginal Frequency Report – J.P. MCCASKEY HIGH SCHOOL N=753
Center for Opinion Research 48 Franklin & Marshall College
152. Been attacked and hit by someone, or beaten up, on school property?
Never Once 2 or 3 Times 4 or 5 Times 6 to 9 Times 10 Times or
More Spring 2012 86% 6% 3% 1% 1% 3% Spring 2011 84% 6% 3% 1% 0% 5% Spring 2010 87% 7% 2% 1% 0% 4% Spring 2009 89% 4% 2% 1% 1% 3%
Fall 2008 88% 5% 2% 1% 1% 2% Spring 2008 86% 6% 5% 1% 1% 2%
Fall 2007 89% 6% 3% 1% 0% 2% Spring 2007 88% 7% 2% 1% 0% 1%
Fall 2006 90% 5% 3% 2% 0% 0% 153. Been threatened by someone with a weapon on school property?
Never Once 2 or 3 Times 4 or 5 Times 6 to 9 Times 10 Times or
More Spring 2012 88% 4% 2% 2% 1% 3% Spring 2011 88% 3% 2% 2% 0% 5% Spring 2010 88% 4% 2% 2% 0% 4% Spring 2009 89% 5% 1% 1% 0% 3%
Fall 2008 90% 3% 3% 0% 1% 2% Spring 2008 88% 5% 3% 2% 0% 2%
Fall 2007 91% 3% 3% 0% 0% 2% Spring 2007 91% 4% 2% 1% 1% 1%
Fall 2006 96% 2% 0% 2% 1% 0% 154. Been attacked by someone with a weapon on school property?
Never Once 2 or 3 Times 4 or 5 Times 6 to 9 Times 10 Times or
More Spring 2012 91% 2% 1% 1% 2% 3% Spring 2011 89% 3% 2% 1% 0% 4% Spring 2010 91% 3% 0% 1% 1% 4% Spring 2009 92% 3% 1% 1% 0% 3%
Fall 2008 92% 3% 1% 1% 1% 2% Spring 2008 90% 3% 1% 2% 1% 2%
Fall 2007 92% 3% 1% 1% 1% 2% Spring 2007 94% 2% 1% 1% 1% 1%
Fall 2006 93% 4% 2% 1% 0% 1%

School District of Lancaster, 2011-2012 Student Survey May 21-May 25, 2012 Marginal Frequency Report – J.P. MCCASKEY HIGH SCHOOL N=753
Center for Opinion Research 49 Franklin & Marshall College
Cyberbullying So far this school year, have you... 155. Received mean or nasty messages from someone?
No Yes, once or
twice Yes, every
so often Yes, all the
time Spring 2012 71% 21% 5% 3% Spring 2011 66% 21% 5% 8%
156. Received online messages that made you afraid for your safety?
No Yes, once or
twice Yes, every
so often Yes, all the
time Spring 2012 88% 7% 2% 2% Spring 2011 84% 9% 2% 5%
157. Had someone send or post gossip, rumors, or other hurtful material about you?
No Yes, once or
twice Yes, every
so often Yes, all the
time Spring 2012 73% 17% 6% 4% Spring 2011 67% 19% 5% 9%
158. Had someone share your personal secrets or pictures online without your permission?
No Yes, once or
twice Yes, every
so often Yes, all the
time Spring 2012 83% 9% 4% 4% Spring 2011 79% 12% 3% 6%
159. Do you use the Internet at home, or not?
Yes No Spring 2012 90% 10% Spring 2011 89% 11%
160. How many hours do you normally spend online using the Internet each day?
Less than 1
hour 1 hour 2 hours 3 hours
4 or more hours
Spring 2012 23% 19% 21% 13% 23% Spring 2011 26% 17% 27% 10% 21%

Report W
Marginal Frequency Report McCaskey East High School

School District of Lancaster, 2011-2012 Student Survey May 21-May 25, 2012 Marginal Frequency Report – MCCASKEY EAST HIGH SCHOOL N=872
Center for Opinion Research 1 Franklin & Marshall College
School Climate Do you agree or disagree with the following statements? 1. I feel safe at this school.
Really Agree
Kind of Agree
Kind of Disagree
Really Disagree
Spring 2012 34% 48% 10% 8% Spring 2011 24% 47% 16% 13% Spring 2010 27% 44% 16% 13% Spring 2009 23% 49% 17% 11%
Fall 2008 25% 53% 15% 7% Spring 2008 22% 58% 15% 4%
Fall 2007 26% 48% 18% 8% Spring 2007 18% 50% 22% 10%
Fall 2006 34% 50% 12% 4% 2. I feel safe going to and from school.
Really Agree
Kind of Agree
Kind of Disagree
Really Disagree
Spring 2012 37% 40% 15% 7% Spring 2011 33% 43% 14% 10% Spring 2010 30% 42% 18% 10% Spring 2009 31% 45% 15% 9%
Fall 2008 36% 44% 13% 7% Spring 2008 36% 45% 16% 3%
Fall 2007 38% 42% 12% 7% Spring 2007 32% 43% 19% 6%
Fall 2006 43% 42% 11% 4% 3. Students get along well with each other.
Really Agree
Kind of Agree
Kind of Disagree
Really Disagree
Spring 2012 10% 40% 36% 13% Spring 2011 9% 39% 33% 20% Spring 2010 8% 35% 34% 23% Spring 2009 8% 40% 31% 22%
Fall 2008 9% 40% 36% 15% Spring 2008 6% 41% 38% 14%
Fall 2007 7% 41% 35% 17% Spring 2007 4% 41% 39% 16%
Fall 2006 6% 44% 35% 14%
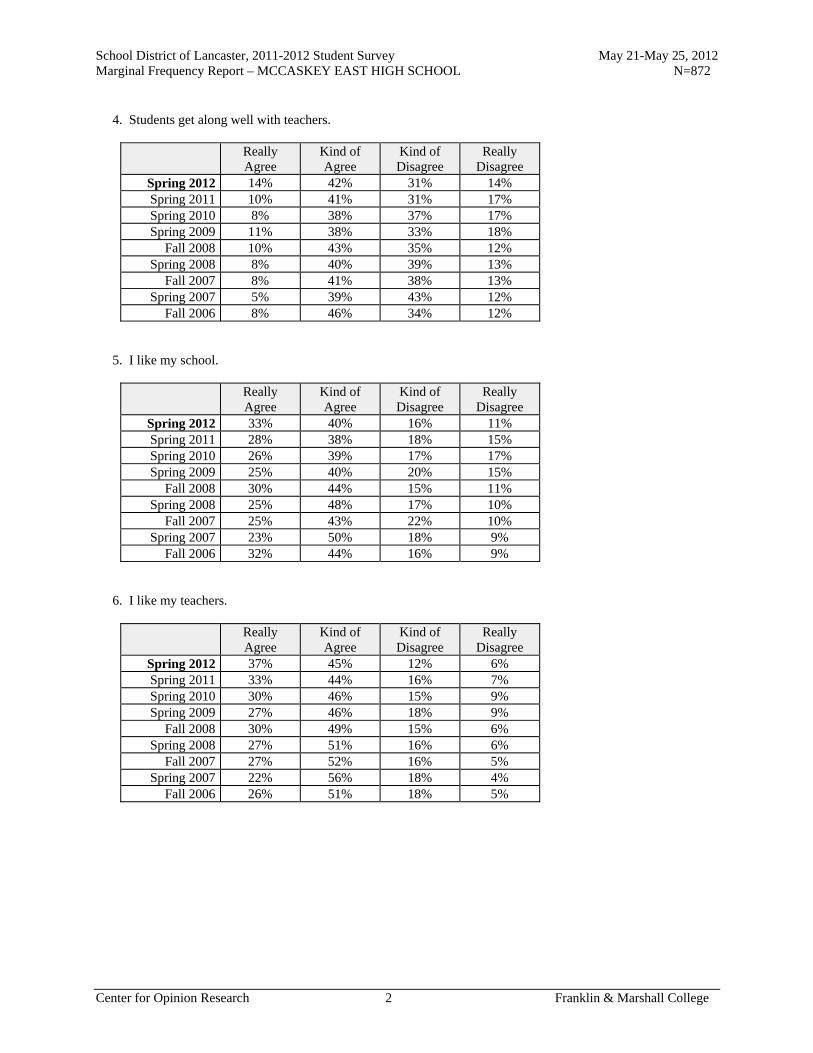
School District of Lancaster, 2011-2012 Student Survey May 21-May 25, 2012 Marginal Frequency Report – MCCASKEY EAST HIGH SCHOOL N=872
Center for Opinion Research 2 Franklin & Marshall College
4. Students get along well with teachers.
Really Agree
Kind of Agree
Kind of Disagree
Really Disagree
Spring 2012 14% 42% 31% 14% Spring 2011 10% 41% 31% 17% Spring 2010 8% 38% 37% 17% Spring 2009 11% 38% 33% 18%
Fall 2008 10% 43% 35% 12% Spring 2008 8% 40% 39% 13%
Fall 2007 8% 41% 38% 13% Spring 2007 5% 39% 43% 12%
Fall 2006 8% 46% 34% 12% 5. I like my school.
Really Agree
Kind of Agree
Kind of Disagree
Really Disagree
Spring 2012 33% 40% 16% 11% Spring 2011 28% 38% 18% 15% Spring 2010 26% 39% 17% 17% Spring 2009 25% 40% 20% 15%
Fall 2008 30% 44% 15% 11% Spring 2008 25% 48% 17% 10%
Fall 2007 25% 43% 22% 10% Spring 2007 23% 50% 18% 9%
Fall 2006 32% 44% 16% 9% 6. I like my teachers.
Really Agree
Kind of Agree
Kind of Disagree
Really Disagree
Spring 2012 37% 45% 12% 6% Spring 2011 33% 44% 16% 7% Spring 2010 30% 46% 15% 9% Spring 2009 27% 46% 18% 9%
Fall 2008 30% 49% 15% 6% Spring 2008 27% 51% 16% 6%
Fall 2007 27% 52% 16% 5% Spring 2007 22% 56% 18% 4%
Fall 2006 26% 51% 18% 5%

School District of Lancaster, 2011-2012 Student Survey May 21-May 25, 2012 Marginal Frequency Report – MCCASKEY EAST HIGH SCHOOL N=872
Center for Opinion Research 3 Franklin & Marshall College
7. There is a teacher or some other adult at this school who really cares about me.
Really Agree
Kind of Agree
Kind of Disagree
Really Disagree
Spring 2012 41% 38% 13% 7% Spring 2011 40% 37% 15% 8% Spring 2010 41% 34% 14% 11% Spring 2009 32% 42% 14% 12%
Fall 2008 33% 38% 20% 10% Spring 2008 33% 40% 19% 9%
Fall 2007 30% 39% 20% 11% Spring 2007 32% 40% 19% 8%
Fall 2006 31% 36% 23% 11% 8. There is a teacher or some other adult at this school who cares when I am not here.
Really Agree
Kind of Agree
Kind of Disagree
Really Disagree
Spring 2012 31% 40% 19% 11% Spring 2011 28% 40% 20% 13% Spring 2010 28% 35% 20% 16% Spring 2009 26% 39% 20% 14%
Fall 2008 24% 36% 26% 14% Spring 2008 24% 42% 23% 12%
Fall 2007 24% 34% 24% 18% Spring 2007 23% 37% 26% 14%
Fall 2006 23% 34% 28% 15% 9. There is a teacher or some other adult at this school who listens to me when I have something to say.
Really Agree
Kind of Agree
Kind of Disagree
Really Disagree
Spring 2012 41% 38% 14% 8% Spring 2011 39% 40% 14% 8% Spring 2010 37% 38% 15% 10% Spring 2009 32% 41% 17% 9%
Fall 2008 30% 44% 18% 8% Spring 2008 33% 44% 18% 5%
Fall 2007 32% 42% 19% 8% Spring 2007 30% 44% 17% 8%
Fall 2006 34% 43% 16% 7%

School District of Lancaster, 2011-2012 Student Survey May 21-May 25, 2012 Marginal Frequency Report – MCCASKEY EAST HIGH SCHOOL N=872
Center for Opinion Research 4 Franklin & Marshall College
10. There is a teacher or some other adult at this school who tells me when I do a good job.
Really Agree
Kind of Agree
Kind of Disagree
Really Disagree
Spring 2012 47% 37% 10% 5% Spring 2011 44% 40% 10% 6% Spring 2010 40% 41% 12% 8% Spring 2009 37% 44% 12% 8%
Fall 2008 39% 43% 11% 6% Spring 2008 35% 49% 12% 4%
Fall 2007 39% 40% 16% 6% Spring 2007 35% 46% 13% 6%
Fall 2006 39% 44% 11% 6% 11. There is a teacher or some other adult at this school who always wants me to do my best.
Really Agree
Kind of Agree
Kind of Disagree
Really Disagree
Spring 2012 51% 38% 8% 4% Spring 2011 50% 37% 9% 5% Spring 2010 49% 36% 8% 8% Spring 2009 43% 41% 9% 7%
Fall 2008 43% 42% 10% 5% Spring 2008 44% 40% 12% 3%
Fall 2007 44% 40% 13% 4% Spring 2007 46% 42% 8% 4%
Fall 2006 50% 38% 8% 3% 12. There is a teacher or some other adult at this school who believes that I will be a success.
Really Agree
Kind of Agree
Kind of Disagree
Really Disagree
Spring 2012 45% 40% 11% 4% Spring 2011 43% 40% 12% 6% Spring 2010 42% 39% 11% 7% Spring 2009 38% 41% 12% 9%
Fall 2008 38% 43% 12% 7% Spring 2008 38% 44% 12% 6%
Fall 2007 41% 38% 16% 5% Spring 2007 41% 41% 13% 5%
Fall 2006 42% 41% 13% 4%
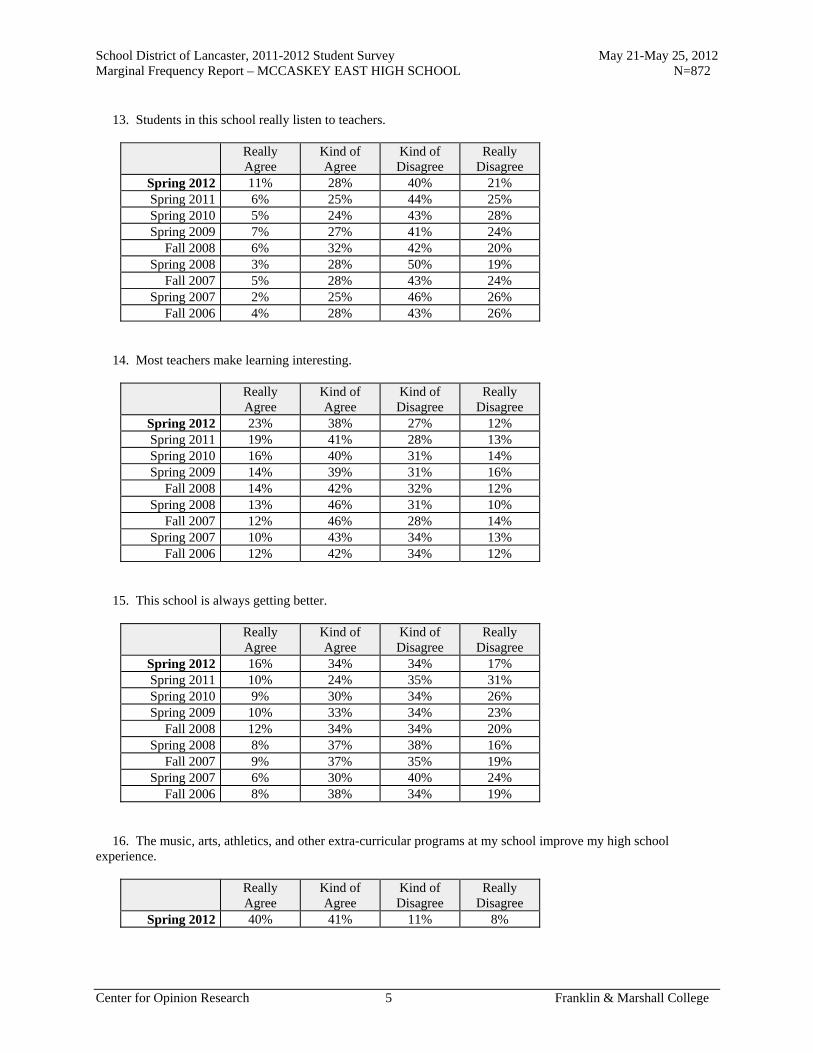
School District of Lancaster, 2011-2012 Student Survey May 21-May 25, 2012 Marginal Frequency Report – MCCASKEY EAST HIGH SCHOOL N=872
Center for Opinion Research 5 Franklin & Marshall College
13. Students in this school really listen to teachers.
Really Agree
Kind of Agree
Kind of Disagree
Really Disagree
Spring 2012 11% 28% 40% 21% Spring 2011 6% 25% 44% 25% Spring 2010 5% 24% 43% 28% Spring 2009 7% 27% 41% 24%
Fall 2008 6% 32% 42% 20% Spring 2008 3% 28% 50% 19%
Fall 2007 5% 28% 43% 24% Spring 2007 2% 25% 46% 26%
Fall 2006 4% 28% 43% 26% 14. Most teachers make learning interesting.
Really Agree
Kind of Agree
Kind of Disagree
Really Disagree
Spring 2012 23% 38% 27% 12% Spring 2011 19% 41% 28% 13% Spring 2010 16% 40% 31% 14% Spring 2009 14% 39% 31% 16%
Fall 2008 14% 42% 32% 12% Spring 2008 13% 46% 31% 10%
Fall 2007 12% 46% 28% 14% Spring 2007 10% 43% 34% 13%
Fall 2006 12% 42% 34% 12% 15. This school is always getting better.
Really Agree
Kind of Agree
Kind of Disagree
Really Disagree
Spring 2012 16% 34% 34% 17% Spring 2011 10% 24% 35% 31% Spring 2010 9% 30% 34% 26% Spring 2009 10% 33% 34% 23%
Fall 2008 12% 34% 34% 20% Spring 2008 8% 37% 38% 16%
Fall 2007 9% 37% 35% 19% Spring 2007 6% 30% 40% 24%
Fall 2006 8% 38% 34% 19% 16. The music, arts, athletics, and other extra-curricular programs at my school improve my high school experience.
Really Agree
Kind of Agree
Kind of Disagree
Really Disagree
Spring 2012 40% 41% 11% 8%

School District of Lancaster, 2011-2012 Student Survey May 21-May 25, 2012 Marginal Frequency Report – MCCASKEY EAST HIGH SCHOOL N=872
Center for Opinion Research 6 Franklin & Marshall College
17. The music, arts, athletics, and other extra-curricular programs at my school contribute to my education.
Really Agree
Kind of Agree
Kind of Disagree
Really Disagree
Spring 2012 33% 45% 15% 8% 18. The music, arts, athletics, and other extra-curricular programs at my school better prepare me for life after high school.
Really Agree
Kind of Agree
Kind of Disagree
Really Disagree
Spring 2012 36% 39% 18% 8% Food Services How would you rate the lunch you receive at school on each of the following? 19. The amount of food
Really Good Kind of Good
Kind of Bad Really Bad
Spring 2012 11% 35% 29% 25% Spring 2011 9% 34% 30% 26%
20. The flavor of the food
Really Good Kind of Good
Kind of Bad Really Bad
Spring 2012 10% 35% 35% 20% Spring 2011 6% 38% 33% 23%
21. The variety of food you receive each week
Really Good Kind of Good
Kind of Bad Really Bad
Spring 2012 13% 33% 32% 22% Spring 2011 10% 35% 33% 22%
22. The temperature of the food
Really Good Kind of Good
Kind of Bad Really Bad
Spring 2012 17% 42% 26% 14% Spring 2011 14% 45% 25% 15%
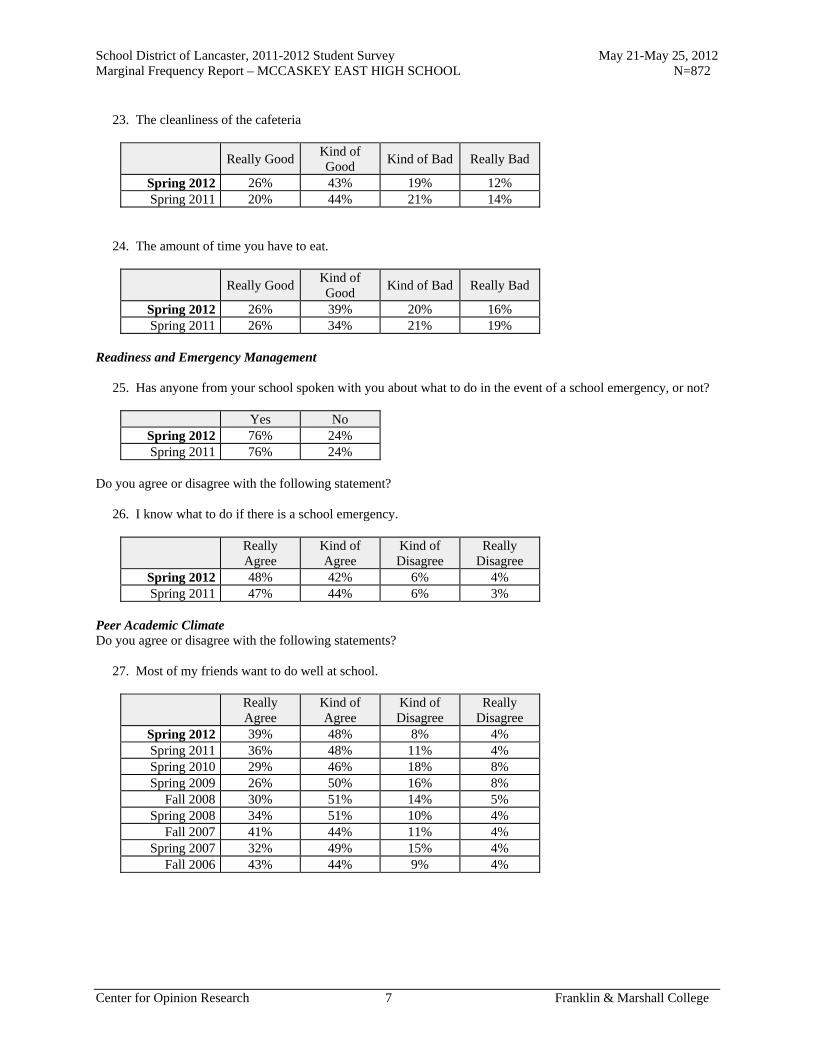
School District of Lancaster, 2011-2012 Student Survey May 21-May 25, 2012 Marginal Frequency Report – MCCASKEY EAST HIGH SCHOOL N=872
Center for Opinion Research 7 Franklin & Marshall College
23. The cleanliness of the cafeteria
Really Good Kind of Good
Kind of Bad Really Bad
Spring 2012 26% 43% 19% 12% Spring 2011 20% 44% 21% 14%
24. The amount of time you have to eat.
Really Good Kind of Good
Kind of Bad Really Bad
Spring 2012 26% 39% 20% 16% Spring 2011 26% 34% 21% 19%
Readiness and Emergency Management 25. Has anyone from your school spoken with you about what to do in the event of a school emergency, or not?
Yes No Spring 2012 76% 24% Spring 2011 76% 24%
Do you agree or disagree with the following statement? 26. I know what to do if there is a school emergency.
Really Agree
Kind of Agree
Kind of Disagree
Really Disagree
Spring 2012 48% 42% 6% 4% Spring 2011 47% 44% 6% 3%
Peer Academic Climate Do you agree or disagree with the following statements? 27. Most of my friends want to do well at school.
Really Agree
Kind of Agree
Kind of Disagree
Really Disagree
Spring 2012 39% 48% 8% 4% Spring 2011 36% 48% 11% 4% Spring 2010 29% 46% 18% 8% Spring 2009 26% 50% 16% 8%
Fall 2008 30% 51% 14% 5% Spring 2008 34% 51% 10% 4%
Fall 2007 41% 44% 11% 4% Spring 2007 32% 49% 15% 4%
Fall 2006 43% 44% 9% 4%

School District of Lancaster, 2011-2012 Student Survey May 21-May 25, 2012 Marginal Frequency Report – MCCASKEY EAST HIGH SCHOOL N=872
Center for Opinion Research 8 Franklin & Marshall College
28. Most of my friends want to go to college.
Really Agree
Kind of Agree
Kind of Disagree
Really Disagree
Spring 2012 38% 43% 14% 4% Spring 2011 37% 44% 15% 4% Spring 2010 31% 47% 15% 7% Spring 2009 28% 51% 13% 8%
Fall 2008 39% 41% 14% 7% Spring 2008 36% 43% 17% 4%
Fall 2007 38% 43% 15% 3% Spring 2007 35% 47% 14% 4%
Fall 2006 42% 43% 12% 4% 29. Most of my friends think education is a waste of time.
Really Agree
Kind of Agree
Kind of Disagree
Really Disagree
Spring 2012 11% 23% 38% 28% Spring 2011 9% 27% 33% 30% Spring 2010 10% 20% 39% 31% Spring 2009 8% 27% 34% 31%
Fall 2008 9% 20% 35% 36% Spring 2008 6% 21% 37% 36%
Fall 2007 10% 21% 35% 35% Spring 2007 8% 23% 39% 30%
Fall 2006 8% 23% 35% 35% 30. Most of my friends want to leave school as soon as possible.
Really Agree
Kind of Agree
Kind of Disagree
Really Disagree
Spring 2012 22% 34% 25% 19% Spring 2011 24% 32% 23% 20% Spring 2010 21% 28% 27% 24% Spring 2009 20% 30% 28% 22%
Fall 2008 21% 25% 27% 27% Spring 2008 18% 33% 26% 23%
Fall 2007 21% 34% 24% 21% Spring 2007 26% 34% 23% 16%
Fall 2006 26% 34% 21% 19%

School District of Lancaster, 2011-2012 Student Survey May 21-May 25, 2012 Marginal Frequency Report – MCCASKEY EAST HIGH SCHOOL N=872
Center for Opinion Research 9 Franklin & Marshall College
31. My friends tell me to leave school and get a job.
Really Agree
Kind of Agree
Kind of Disagree
Really Disagree
Spring 2012 9% 11% 20% 61% Spring 2011 7% 12% 18% 64% Spring 2010 6% 11% 23% 61% Spring 2009 8% 12% 22% 58%
Fall 2008 6% 11% 18% 65% Spring 2008 5% 9% 18% 68%
Fall 2007 5% 9% 18% 68% Spring 2007 4% 9% 18% 68%
Fall 2006 4% 7% 16% 73% Academic Self-efficacy Do you agree or disagree with the following statements? 32. I am a good science student.
Really Agree
Kind of Agree
Kind of Disagree
Really Disagree
Spring 2012 26% 43% 18% 13% Spring 2011 24% 41% 21% 14% Spring 2010 20% 40% 24% 17% Spring 2009 20% 42% 20% 18%
Fall 2008 20% 43% 23% 13% Spring 2008 19% 42% 24% 15%
Fall 2007 22% 43% 20% 16% Spring 2007 19% 42% 22% 17%
Fall 2006 22% 42% 20% 16% 33. Sometimes I think an assignment is easy when the other students think it is hard.
Really Agree
Kind of Agree
Kind of Disagree
Really Disagree
Spring 2012 28% 52% 15% 6% Spring 2011 32% 47% 14% 6% Spring 2010 31% 43% 17% 9% Spring 2009 28% 46% 18% 8%
Fall 2008 28% 49% 17% 6% Spring 2008 26% 52% 17% 5%
Fall 2007 30% 48% 16% 6% Spring 2007 28% 49% 17% 6%
Fall 2006 30% 48% 15% 7%

School District of Lancaster, 2011-2012 Student Survey May 21-May 25, 2012 Marginal Frequency Report – MCCASKEY EAST HIGH SCHOOL N=872
Center for Opinion Research 10 Franklin & Marshall College
34. I am good social studies student.
Really Agree
Kind of Agree
Kind of Disagree
Really Disagree
Spring 2012 24% 44% 22% 9% Spring 2011 24% 43% 22% 11% Spring 2010 23% 44% 20% 13% Spring 2009 22% 44% 20% 14%
Fall 2008 24% 44% 21% 11% Spring 2008 23% 44% 24% 9%
Fall 2007 26% 44% 22% 9% Spring 2007 24% 43% 23% 10%
Fall 2006 25% 49% 18% 8% 35. My teacher thinks I am smart.
Really Agree
Kind of Agree
Kind of Disagree
Really Disagree
Spring 2012 33% 50% 12% 5% Spring 2011 37% 44% 14% 5% Spring 2010 35% 40% 15% 10% Spring 2009 31% 43% 17% 9%
Fall 2008 32% 47% 14% 7% Spring 2008 30% 46% 19% 5%
Fall 2007 33% 49% 12% 6% Spring 2007 31% 44% 17% 8%
Fall 2006 32% 46% 15% 7% 36. I am a good math student.
Really Agree
Kind of Agree
Kind of Disagree
Really Disagree
Spring 2012 28% 38% 18% 16% Spring 2011 32% 40% 15% 14% Spring 2010 31% 38% 17% 14% Spring 2009 33% 37% 15% 15%
Fall 2008 36% 38% 15% 12% Spring 2008 32% 37% 20% 12%
Fall 2007 36% 32% 18% 14% Spring 2007 30% 33% 18% 18%
Fall 2006 26% 38% 21% 15%

School District of Lancaster, 2011-2012 Student Survey May 21-May 25, 2012 Marginal Frequency Report – MCCASKEY EAST HIGH SCHOOL N=872
Center for Opinion Research 11 Franklin & Marshall College
37. My classmates usually get better grades than I do.
Really Agree
Kind of Agree
Kind of Disagree
Really Disagree
Spring 2012 14% 35% 40% 11% Spring 2011 14% 39% 36% 12% Spring 2010 9% 35% 41% 15% Spring 2009 10% 38% 37% 15%
Fall 2008 11% 35% 42% 12% Spring 2008 13% 33% 39% 15%
Fall 2007 11% 34% 44% 12% Spring 2007 13% 32% 41% 14%
Fall 2006 10% 42% 34% 14% 38. I usually understand my homework assignments.
Really Agree
Kind of Agree
Kind of Disagree
Really Disagree
Spring 2012 25% 48% 21% 6% Spring 2011 22% 52% 20% 7% Spring 2010 20% 51% 22% 7% Spring 2009 21% 52% 19% 8%
Fall 2008 24% 53% 18% 5% Spring 2008 24% 50% 20% 5%
Fall 2007 23% 54% 17% 6% Spring 2007 24% 51% 19% 6%
Fall 2006 27% 52% 16% 6% 39. I could get the best grades in class if I tried hard enough.
Really Agree
Kind of Agree
Kind of Disagree
Really Disagree
Spring 2012 54% 32% 10% 4% Spring 2011 59% 27% 9% 4% Spring 2010 58% 27% 9% 5% Spring 2009 50% 35% 9% 6%
Fall 2008 53% 35% 9% 4% Spring 2008 56% 32% 10% 3%
Fall 2007 59% 30% 8% 2% Spring 2007 60% 30% 7% 3%
Fall 2006 60% 29% 8% 3%

School District of Lancaster, 2011-2012 Student Survey May 21-May 25, 2012 Marginal Frequency Report – MCCASKEY EAST HIGH SCHOOL N=872
Center for Opinion Research 12 Franklin & Marshall College
40. I am a good reading student.
Really Agree
Kind of Agree
Kind of Disagree
Really Disagree
Spring 2012 35% 43% 15% 7% Spring 2011 34% 41% 18% 7% Spring 2010 35% 40% 18% 7% Spring 2009 30% 45% 15% 9%
Fall 2008 30% 46% 17% 7% Spring 2008 33% 43% 18% 6%
Fall 2007 36% 39% 17% 8% Spring 2007 36% 45% 14% 4%
Fall 2006 35% 41% 17% 7% 41. It is not hard for me to get good grades in school.
Really Agree
Kind of Agree
Kind of Disagree
Really Disagree
Spring 2012 29% 42% 23% 7% Spring 2011 30% 40% 23% 8% Spring 2010 28% 40% 21% 11% Spring 2009 27% 41% 21% 11%
Fall 2008 27% 44% 21% 7% Spring 2008 28% 40% 24% 8%
Fall 2007 29% 43% 22% 6% Spring 2007 31% 44% 20% 6%
Fall 2006 28% 41% 24% 8% 42. I am smart.
Really Agree
Kind of Agree
Kind of Disagree
Really Disagree
Spring 2012 47% 40% 9% 4% Spring 2011 50% 37% 9% 5% Spring 2010 50% 34% 9% 7% Spring 2009 48% 35% 10% 7%
Fall 2008 52% 34% 9% 5% Spring 2008 48% 38% 12% 3%
Fall 2007 48% 38% 10% 4% Spring 2007 50% 36% 11% 3%
Fall 2006 46% 41% 8% 5%

School District of Lancaster, 2011-2012 Student Survey May 21-May 25, 2012 Marginal Frequency Report – MCCASKEY EAST HIGH SCHOOL N=872
Center for Opinion Research 13 Franklin & Marshall College
43. When the teacher asks a question I usually know the answer even if the other students don't.
Really Agree
Kind of Agree
Kind of Disagree
Really Disagree
Spring 2012 22% 48% 25% 5% Spring 2011 22% 49% 22% 6% Spring 2010 21% 50% 22% 7% Spring 2009 20% 48% 22% 10%
Fall 2008 20% 50% 24% 6% Spring 2008 15% 53% 26% 6%
Fall 2007 18% 51% 25% 5% Spring 2007 15% 52% 27% 5%
Fall 2006 16% 50% 27% 6% 44. I work hard in school.
Really Agree
Kind of Agree
Kind of Disagree
Really Disagree
Spring 2012 39% 44% 13% 4% Spring 2011 36% 43% 18% 4% Spring 2010 34% 44% 16% 6% Spring 2009 35% 41% 17% 7%
Fall 2008 38% 46% 13% 4% Spring 2008 31% 42% 21% 6%
Fall 2007 32% 46% 18% 4% Spring 2007 30% 48% 17% 5%
Fall 2006 31% 50% 15% 4% 45. Most of my classmates work harder on their homework than I do.
Really Agree
Kind of Agree
Kind of Disagree
Really Disagree
Spring 2012 20% 38% 32% 10% Spring 2011 16% 40% 31% 13% Spring 2010 13% 37% 36% 14% Spring 2009 15% 37% 32% 17%
Fall 2008 15% 36% 35% 14% Spring 2008 13% 39% 36% 12%
Fall 2007 16% 40% 32% 12% Spring 2007 19% 37% 32% 12%
Fall 2006 15% 42% 34% 10%
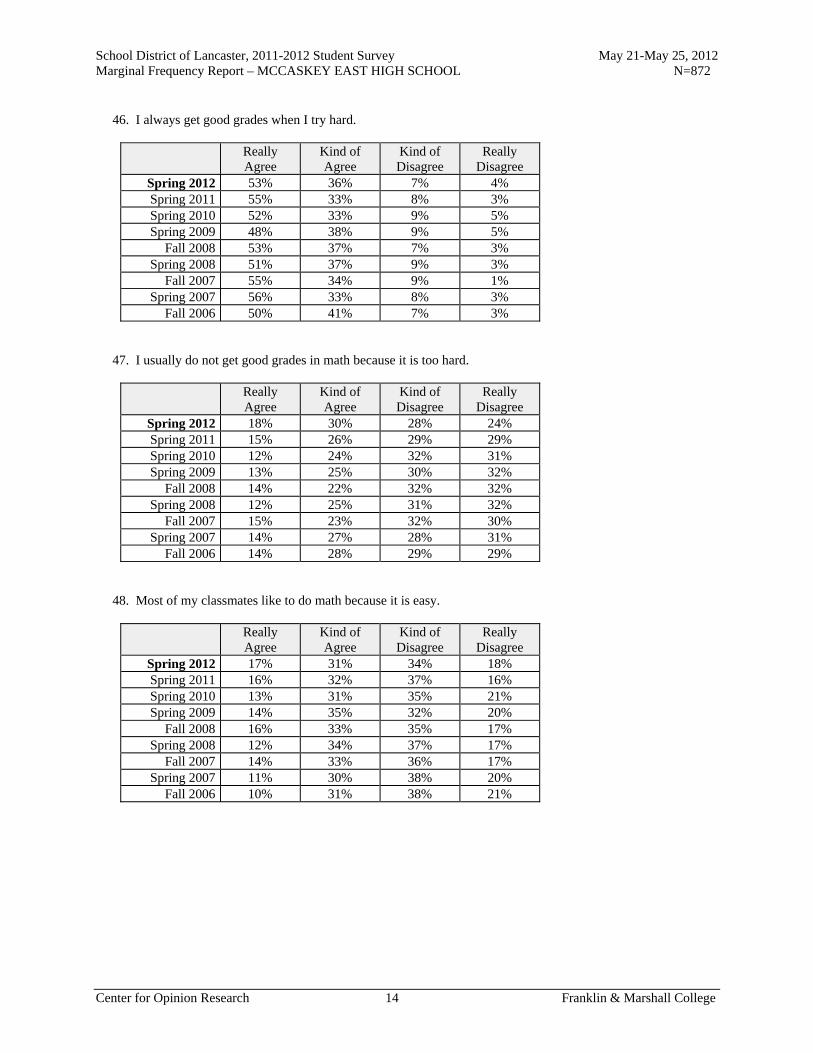
School District of Lancaster, 2011-2012 Student Survey May 21-May 25, 2012 Marginal Frequency Report – MCCASKEY EAST HIGH SCHOOL N=872
Center for Opinion Research 14 Franklin & Marshall College
46. I always get good grades when I try hard.
Really Agree
Kind of Agree
Kind of Disagree
Really Disagree
Spring 2012 53% 36% 7% 4% Spring 2011 55% 33% 8% 3% Spring 2010 52% 33% 9% 5% Spring 2009 48% 38% 9% 5%
Fall 2008 53% 37% 7% 3% Spring 2008 51% 37% 9% 3%
Fall 2007 55% 34% 9% 1% Spring 2007 56% 33% 8% 3%
Fall 2006 50% 41% 7% 3% 47. I usually do not get good grades in math because it is too hard.
Really Agree
Kind of Agree
Kind of Disagree
Really Disagree
Spring 2012 18% 30% 28% 24% Spring 2011 15% 26% 29% 29% Spring 2010 12% 24% 32% 31% Spring 2009 13% 25% 30% 32%
Fall 2008 14% 22% 32% 32% Spring 2008 12% 25% 31% 32%
Fall 2007 15% 23% 32% 30% Spring 2007 14% 27% 28% 31%
Fall 2006 14% 28% 29% 29% 48. Most of my classmates like to do math because it is easy.
Really Agree
Kind of Agree
Kind of Disagree
Really Disagree
Spring 2012 17% 31% 34% 18% Spring 2011 16% 32% 37% 16% Spring 2010 13% 31% 35% 21% Spring 2009 14% 35% 32% 20%
Fall 2008 16% 33% 35% 17% Spring 2008 12% 34% 37% 17%
Fall 2007 14% 33% 36% 17% Spring 2007 11% 30% 38% 20%
Fall 2006 10% 31% 38% 21%

School District of Lancaster, 2011-2012 Student Survey May 21-May 25, 2012 Marginal Frequency Report – MCCASKEY EAST HIGH SCHOOL N=872
Center for Opinion Research 15 Franklin & Marshall College
49. I would get better grades if my teacher liked me more.
Really Agree
Kind of Agree
Kind of Disagree
Really Disagree
Spring 2012 13% 22% 30% 35% Spring 2011 14% 22% 31% 34% Spring 2010 12% 19% 30% 39% Spring 2009 13% 21% 29% 37%
Fall 2008 12% 20% 30% 38% Spring 2008 9% 20% 35% 36%
Fall 2007 10% 19% 34% 37% Spring 2007 9% 20% 37% 34%
Fall 2006 11% 18% 32% 39% 50. I will graduate from high school.
Really Agree
Kind of Agree
Kind of Disagree
Really Disagree
Spring 2012 85% 10% 3% 2% Spring 2011 84% 11% 3% 3% Spring 2010 83% 10% 4% 3% Spring 2009 78% 15% 2% 5%
Fall 2008 86% 9% 2% 2% Spring 2008 75% 14% 8% 3%
Fall 2007 85% 11% 2% 2% Spring 2007 82% 13% 3% 2%
Fall 2006 82% 13% 3% 2% 51. I go to a good school.
Really Agree
Kind of Agree
Kind of Disagree
Really Disagree
Spring 2012 37% 40% 16% 7% Spring 2011 24% 39% 21% 15% Spring 2010 26% 39% 18% 16% Spring 2009 29% 35% 22% 14%
Fall 2008 32% 41% 17% 10% Spring 2008 28% 47% 17% 8%
Fall 2007 34% 42% 18% 6% Spring 2007 26% 46% 21% 7%
Fall 2006 34% 46% 12% 8%

School District of Lancaster, 2011-2012 Student Survey May 21-May 25, 2012 Marginal Frequency Report – MCCASKEY EAST HIGH SCHOOL N=872
Center for Opinion Research 16 Franklin & Marshall College
52. Adults who have good jobs probably were good students when they were young.
Really Agree
Kind of Agree
Kind of Disagree
Really Disagree
Spring 2012 37% 40% 17% 5% Spring 2011 31% 42% 20% 7% Spring 2010 36% 34% 22% 8% Spring 2009 33% 38% 19% 9%
Fall 2008 36% 39% 19% 6% Spring 2008 30% 42% 21% 7%
Fall 2007 35% 40% 19% 5% Spring 2007 32% 39% 23% 6%
Fall 2006 35% 39% 18% 7% 53. When I am old enough, I will go to college.
Really Agree
Kind of Agree
Kind of Disagree
Really Disagree
Spring 2012 56% 24% 11% 8% Spring 2011 56% 24% 12% 8% Spring 2010 55% 25% 10% 9% Spring 2009 54% 24% 12% 9%
Fall 2008 61% 21% 9% 8% Spring 2008 55% 25% 14% 6%
Fall 2007 60% 24% 10% 6% Spring 2007 55% 30% 9% 6%
Fall 2006 61% 24% 9% 6% 54. No one cares if I do well in school.
Really Agree
Kind of Agree
Kind of Disagree
Really Disagree
Spring 2012 7% 16% 26% 52% Spring 2011 6% 14% 29% 51% Spring 2010 6% 14% 29% 51% Spring 2009 7% 17% 24% 52%
Fall 2008 6% 14% 25% 55% Spring 2008 6% 15% 26% 53%
Fall 2007 6% 14% 25% 55% Spring 2007 7% 12% 26% 54%
Fall 2006 5% 16% 23% 56%

School District of Lancaster, 2011-2012 Student Survey May 21-May 25, 2012 Marginal Frequency Report – MCCASKEY EAST HIGH SCHOOL N=872
Center for Opinion Research 17 Franklin & Marshall College
55. What I learn in school is not important.
Really Agree
Kind of Agree
Kind of Disagree
Really Disagree
Spring 2012 8% 17% 25% 50% Spring 2011 7% 13% 27% 54% Spring 2010 6% 14% 24% 56% Spring 2009 8% 15% 25% 52%
Fall 2008 6% 11% 29% 54% Spring 2008 5% 16% 26% 54%
Fall 2007 6% 10% 27% 56% Spring 2007 5% 15% 28% 52%
Fall 2006 7% 13% 24% 55% 56. It does not matter if I do well in school.
Really Agree
Kind of Agree
Kind of Disagree
Really Disagree
Spring 2012 10% 10% 19% 61% Spring 2011 7% 11% 19% 62% Spring 2010 7% 10% 20% 63% Spring 2009 9% 12% 20% 58%
Fall 2008 6% 9% 19% 66% Spring 2008 5% 12% 21% 63%
Fall 2007 6% 10% 21% 62% Spring 2007 4% 12% 20% 64%
Fall 2006 6% 10% 18% 66% 57. Students who get better grades than I do get more help from the teacher than I do.
Really Agree
Kind of Agree
Kind of Disagree
Really Disagree
Spring 2012 15% 26% 35% 24% Spring 2011 13% 24% 36% 27% Spring 2010 12% 26% 34% 28% Spring 2009 14% 28% 30% 28%
Fall 2008 13% 23% 36% 27% Spring 2008 10% 27% 38% 26%
Fall 2007 11% 27% 34% 28% Spring 2007 13% 29% 32% 26%
Fall 2006 13% 27% 34% 27%

School District of Lancaster, 2011-2012 Student Survey May 21-May 25, 2012 Marginal Frequency Report – MCCASKEY EAST HIGH SCHOOL N=872
Center for Opinion Research 18 Franklin & Marshall College
58. I will quit school as soon as I can.
Really Agree
Kind of Agree
Kind of Disagree
Really Disagree
Spring 2012 7% 13% 12% 69% Spring 2011 7% 10% 14% 69% Spring 2010 5% 11% 13% 71% Spring 2009 7% 11% 12% 70%
Fall 2008 3% 8% 11% 78% Spring 2008 4% 10% 15% 71%
Fall 2007 6% 8% 12% 74% Spring 2007 4% 8% 14% 74%
Fall 2006 4% 8% 10% 77% 59. Teachers like students even if they do not always make good grades.
Really Agree
Kind of Agree
Kind of Disagree
Really Disagree
Spring 2012 25% 47% 16% 12% Spring 2011 23% 45% 19% 13% Spring 2010 24% 41% 23% 13% Spring 2009 23% 42% 22% 12%
Fall 2008 25% 44% 20% 10% Spring 2008 20% 50% 20% 9%
Fall 2007 25% 49% 17% 8% Spring 2007 21% 48% 23% 8%
Fall 2006 25% 46% 23% 7% 60. It is important to go to high school.
Really Agree
Kind of Agree
Kind of Disagree
Really Disagree
Spring 2012 77% 14% 4% 5% Spring 2011 76% 15% 5% 4% Spring 2010 75% 15% 5% 6% Spring 2009 70% 18% 6% 7%
Fall 2008 77% 14% 4% 4% Spring 2008 72% 18% 7% 3%
Fall 2007 78% 16% 3% 3% Spring 2007 76% 17% 3% 4%
Fall 2006 83% 13% 2% 2%
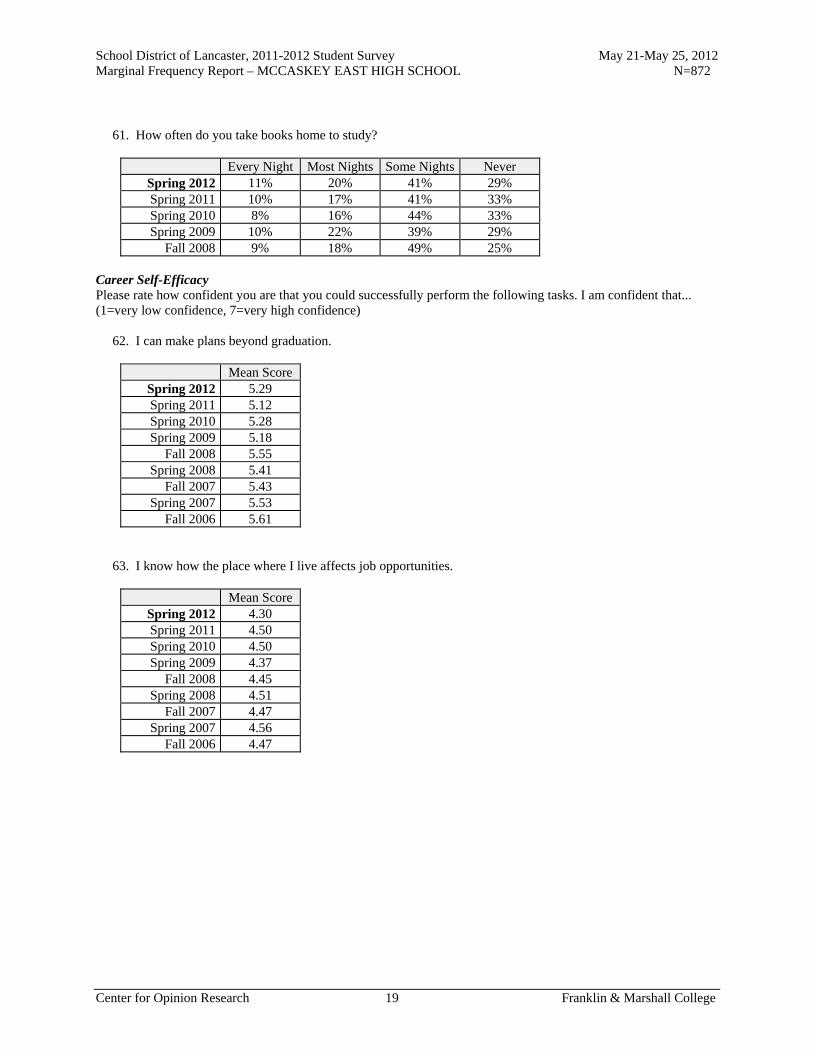
School District of Lancaster, 2011-2012 Student Survey May 21-May 25, 2012 Marginal Frequency Report – MCCASKEY EAST HIGH SCHOOL N=872
Center for Opinion Research 19 Franklin & Marshall College
61. How often do you take books home to study?
Every Night Most Nights Some Nights Never Spring 2012 11% 20% 41% 29% Spring 2011 10% 17% 41% 33% Spring 2010 8% 16% 44% 33% Spring 2009 10% 22% 39% 29%
Fall 2008 9% 18% 49% 25% Career Self-Efficacy Please rate how confident you are that you could successfully perform the following tasks. I am confident that... (1=very low confidence, 7=very high confidence) 62. I can make plans beyond graduation.
Mean Score Spring 2012 5.29 Spring 2011 5.12 Spring 2010 5.28 Spring 2009 5.18
Fall 2008 5.55 Spring 2008 5.41
Fall 2007 5.43 Spring 2007 5.53
Fall 2006 5.61 63. I know how the place where I live affects job opportunities.
Mean Score Spring 2012 4.30 Spring 2011 4.50 Spring 2010 4.50 Spring 2009 4.37
Fall 2008 4.45 Spring 2008 4.51
Fall 2007 4.47 Spring 2007 4.56
Fall 2006 4.47
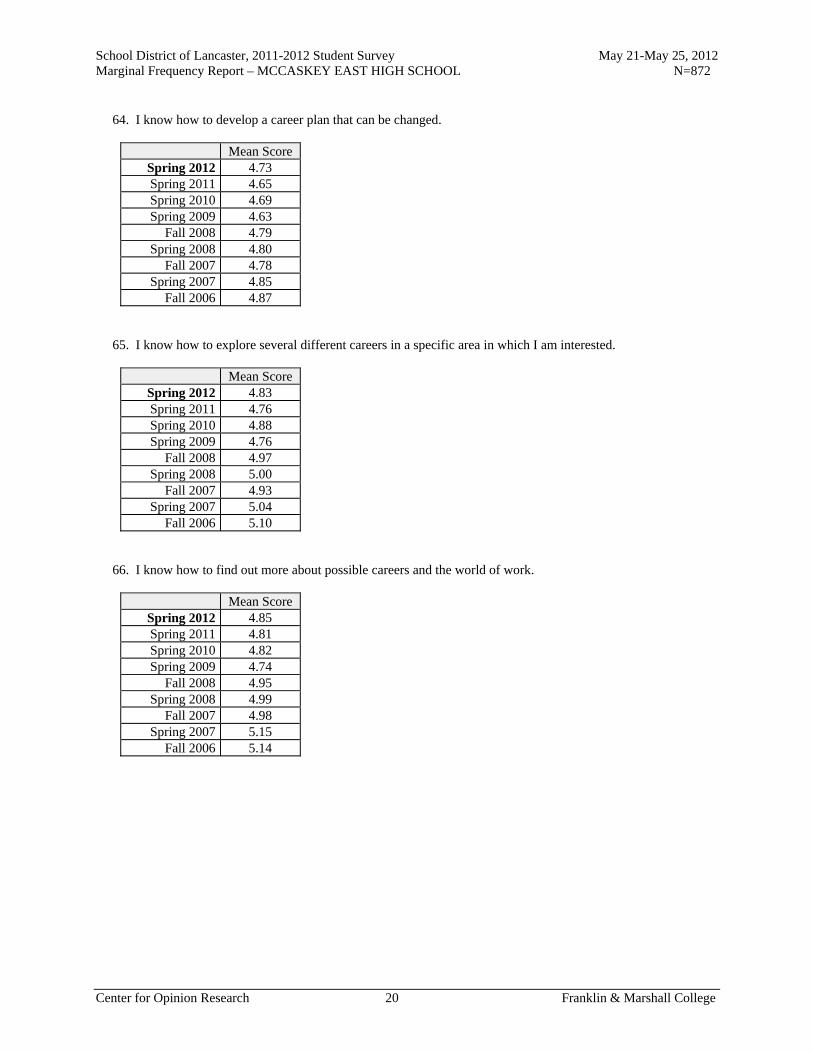
School District of Lancaster, 2011-2012 Student Survey May 21-May 25, 2012 Marginal Frequency Report – MCCASKEY EAST HIGH SCHOOL N=872
Center for Opinion Research 20 Franklin & Marshall College
64. I know how to develop a career plan that can be changed.
Mean Score Spring 2012 4.73 Spring 2011 4.65 Spring 2010 4.69 Spring 2009 4.63
Fall 2008 4.79 Spring 2008 4.80
Fall 2007 4.78 Spring 2007 4.85
Fall 2006 4.87 65. I know how to explore several different careers in a specific area in which I am interested.
Mean Score Spring 2012 4.83 Spring 2011 4.76 Spring 2010 4.88 Spring 2009 4.76
Fall 2008 4.97 Spring 2008 5.00
Fall 2007 4.93 Spring 2007 5.04
Fall 2006 5.10 66. I know how to find out more about possible careers and the world of work.
Mean Score Spring 2012 4.85 Spring 2011 4.81 Spring 2010 4.82 Spring 2009 4.74
Fall 2008 4.95 Spring 2008 4.99
Fall 2007 4.98 Spring 2007 5.15
Fall 2006 5.14
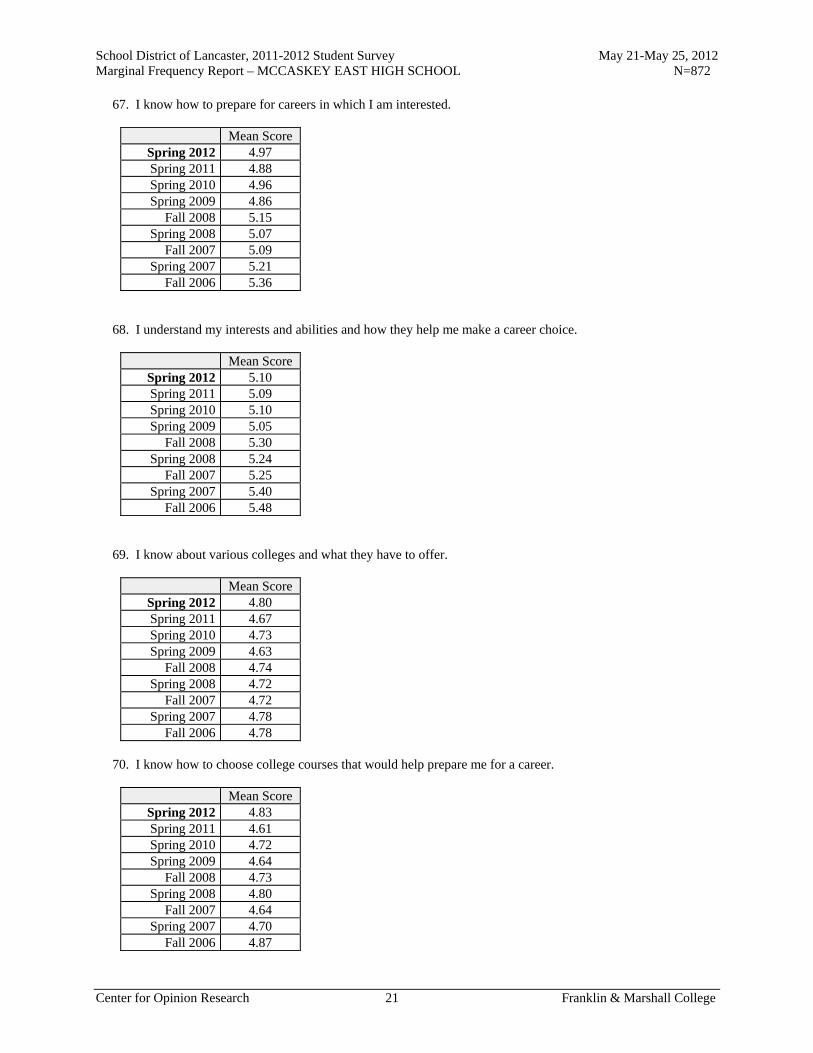
School District of Lancaster, 2011-2012 Student Survey May 21-May 25, 2012 Marginal Frequency Report – MCCASKEY EAST HIGH SCHOOL N=872
Center for Opinion Research 21 Franklin & Marshall College
67. I know how to prepare for careers in which I am interested.
Mean Score Spring 2012 4.97 Spring 2011 4.88 Spring 2010 4.96 Spring 2009 4.86
Fall 2008 5.15 Spring 2008 5.07
Fall 2007 5.09 Spring 2007 5.21
Fall 2006 5.36 68. I understand my interests and abilities and how they help me make a career choice.
Mean Score Spring 2012 5.10 Spring 2011 5.09 Spring 2010 5.10 Spring 2009 5.05
Fall 2008 5.30 Spring 2008 5.24
Fall 2007 5.25 Spring 2007 5.40
Fall 2006 5.48 69. I know about various colleges and what they have to offer.
Mean Score Spring 2012 4.80 Spring 2011 4.67 Spring 2010 4.73 Spring 2009 4.63
Fall 2008 4.74 Spring 2008 4.72
Fall 2007 4.72 Spring 2007 4.78
Fall 2006 4.78 70. I know how to choose college courses that would help prepare me for a career.
Mean Score Spring 2012 4.83 Spring 2011 4.61 Spring 2010 4.72 Spring 2009 4.64
Fall 2008 4.73 Spring 2008 4.80
Fall 2007 4.64 Spring 2007 4.70
Fall 2006 4.87
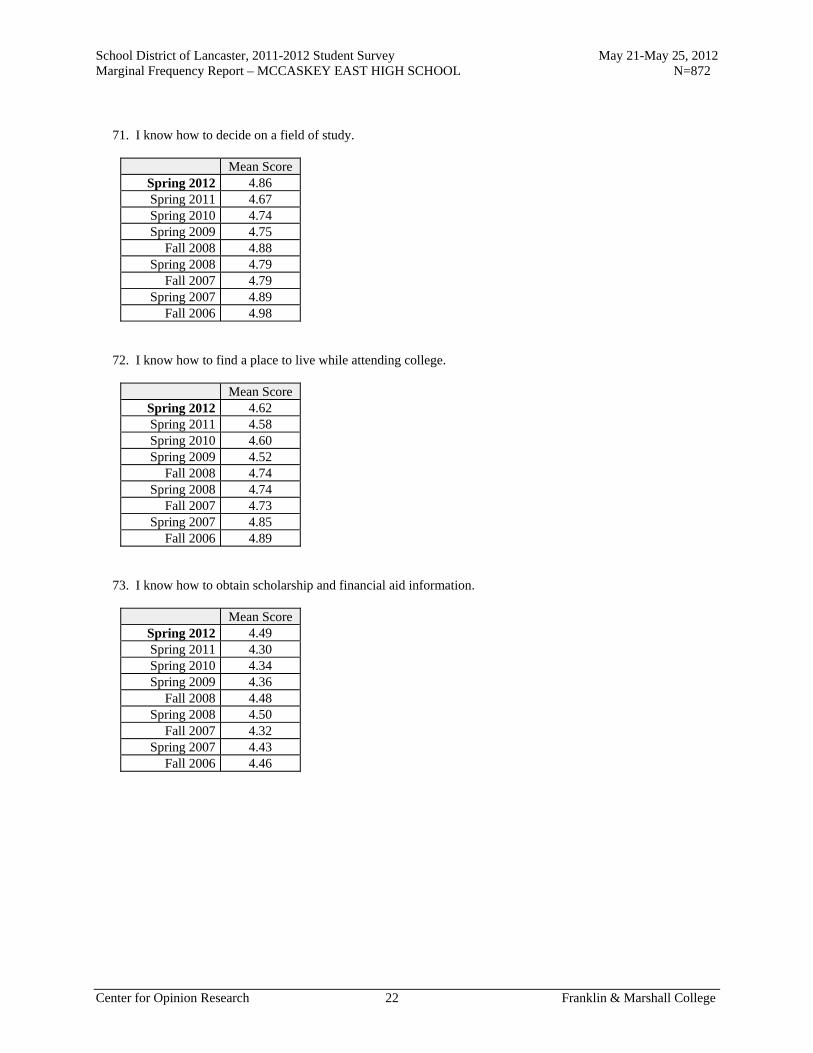
School District of Lancaster, 2011-2012 Student Survey May 21-May 25, 2012 Marginal Frequency Report – MCCASKEY EAST HIGH SCHOOL N=872
Center for Opinion Research 22 Franklin & Marshall College
71. I know how to decide on a field of study.
Mean Score Spring 2012 4.86 Spring 2011 4.67 Spring 2010 4.74 Spring 2009 4.75
Fall 2008 4.88 Spring 2008 4.79
Fall 2007 4.79 Spring 2007 4.89
Fall 2006 4.98 72. I know how to find a place to live while attending college.
Mean Score Spring 2012 4.62 Spring 2011 4.58 Spring 2010 4.60 Spring 2009 4.52
Fall 2008 4.74 Spring 2008 4.74
Fall 2007 4.73 Spring 2007 4.85
Fall 2006 4.89 73. I know how to obtain scholarship and financial aid information.
Mean Score Spring 2012 4.49 Spring 2011 4.30 Spring 2010 4.34 Spring 2009 4.36
Fall 2008 4.48 Spring 2008 4.50
Fall 2007 4.32 Spring 2007 4.43
Fall 2006 4.46
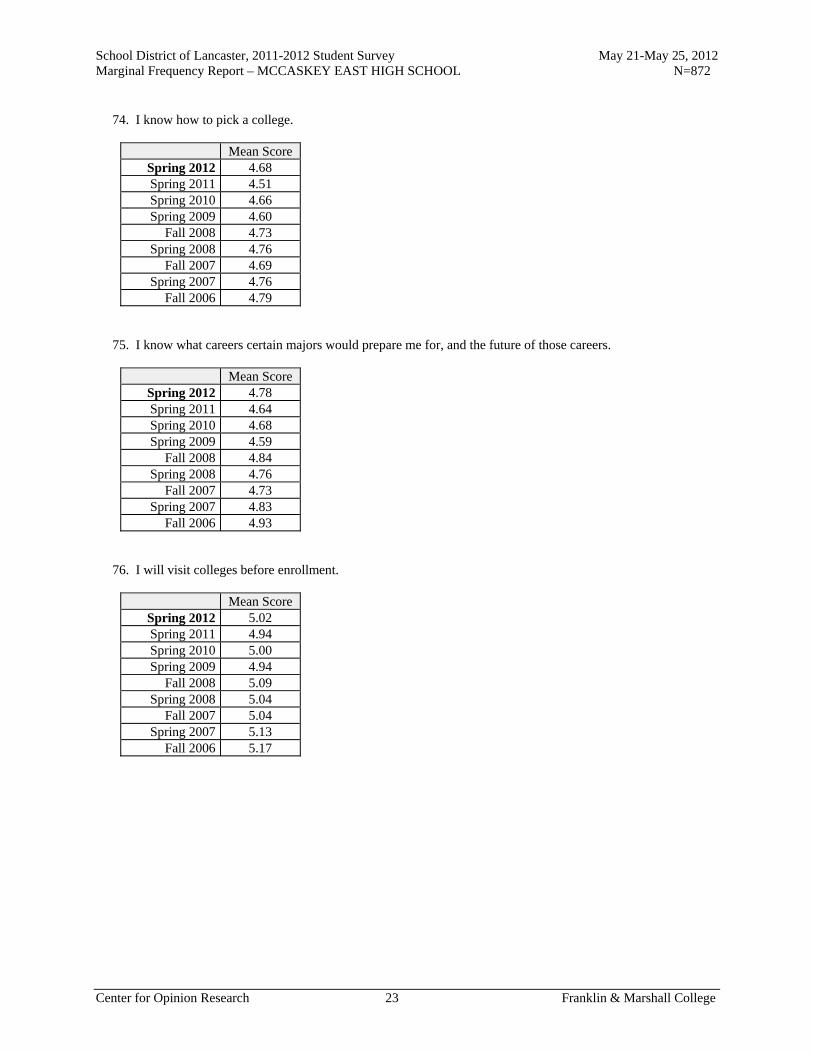
School District of Lancaster, 2011-2012 Student Survey May 21-May 25, 2012 Marginal Frequency Report – MCCASKEY EAST HIGH SCHOOL N=872
Center for Opinion Research 23 Franklin & Marshall College
74. I know how to pick a college.
Mean Score Spring 2012 4.68 Spring 2011 4.51 Spring 2010 4.66 Spring 2009 4.60
Fall 2008 4.73 Spring 2008 4.76
Fall 2007 4.69 Spring 2007 4.76
Fall 2006 4.79 75. I know what careers certain majors would prepare me for, and the future of those careers.
Mean Score Spring 2012 4.78 Spring 2011 4.64 Spring 2010 4.68 Spring 2009 4.59
Fall 2008 4.84 Spring 2008 4.76
Fall 2007 4.73 Spring 2007 4.83
Fall 2006 4.93 76. I will visit colleges before enrollment.
Mean Score Spring 2012 5.02 Spring 2011 4.94 Spring 2010 5.00 Spring 2009 4.94
Fall 2008 5.09 Spring 2008 5.04
Fall 2007 5.04 Spring 2007 5.13
Fall 2006 5.17

School District of Lancaster, 2011-2012 Student Survey May 21-May 25, 2012 Marginal Frequency Report – MCCASKEY EAST HIGH SCHOOL N=872
Center for Opinion Research 24 Franklin & Marshall College
77. I can complete job application forms properly.
Mean Score Spring 2012 5.10 Spring 2011 4.99 Spring 2010 5.04 Spring 2009 5.04
Fall 2008 5.20 Spring 2008 5.26
Fall 2007 5.34 Spring 2007 5.47
Fall 2006 5.53 78. I can develop a resume.
Mean Score Spring 2012 4.77 Spring 2011 4.62 Spring 2010 4.77 Spring 2009 4.61
Fall 2008 4.73 Spring 2008 4.82
Fall 2007 4.80 Spring 2007 4.88
Fall 2006 5.02 79. I know how to participate in practice job interviews.
Mean Score Spring 2012 4.82 Spring 2011 4.68 Spring 2010 4.80 Spring 2009 4.74
Fall 2008 4.91 Spring 2008 4.93
Fall 2007 4.85 Spring 2007 5.02
Fall 2006 5.14
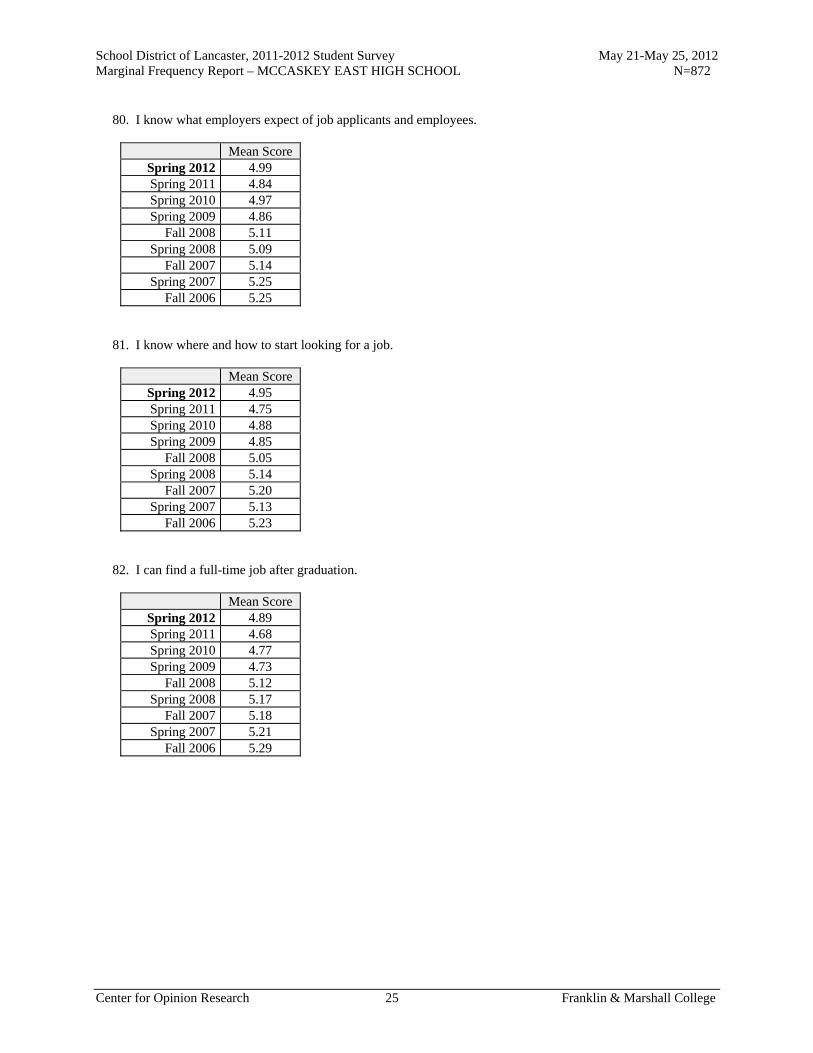
School District of Lancaster, 2011-2012 Student Survey May 21-May 25, 2012 Marginal Frequency Report – MCCASKEY EAST HIGH SCHOOL N=872
Center for Opinion Research 25 Franklin & Marshall College
80. I know what employers expect of job applicants and employees.
Mean Score Spring 2012 4.99 Spring 2011 4.84 Spring 2010 4.97 Spring 2009 4.86
Fall 2008 5.11 Spring 2008 5.09
Fall 2007 5.14 Spring 2007 5.25
Fall 2006 5.25 81. I know where and how to start looking for a job.
Mean Score Spring 2012 4.95 Spring 2011 4.75 Spring 2010 4.88 Spring 2009 4.85
Fall 2008 5.05 Spring 2008 5.14
Fall 2007 5.20 Spring 2007 5.13
Fall 2006 5.23 82. I can find a full-time job after graduation.
Mean Score Spring 2012 4.89 Spring 2011 4.68 Spring 2010 4.77 Spring 2009 4.73
Fall 2008 5.12 Spring 2008 5.17
Fall 2007 5.18 Spring 2007 5.21
Fall 2006 5.29
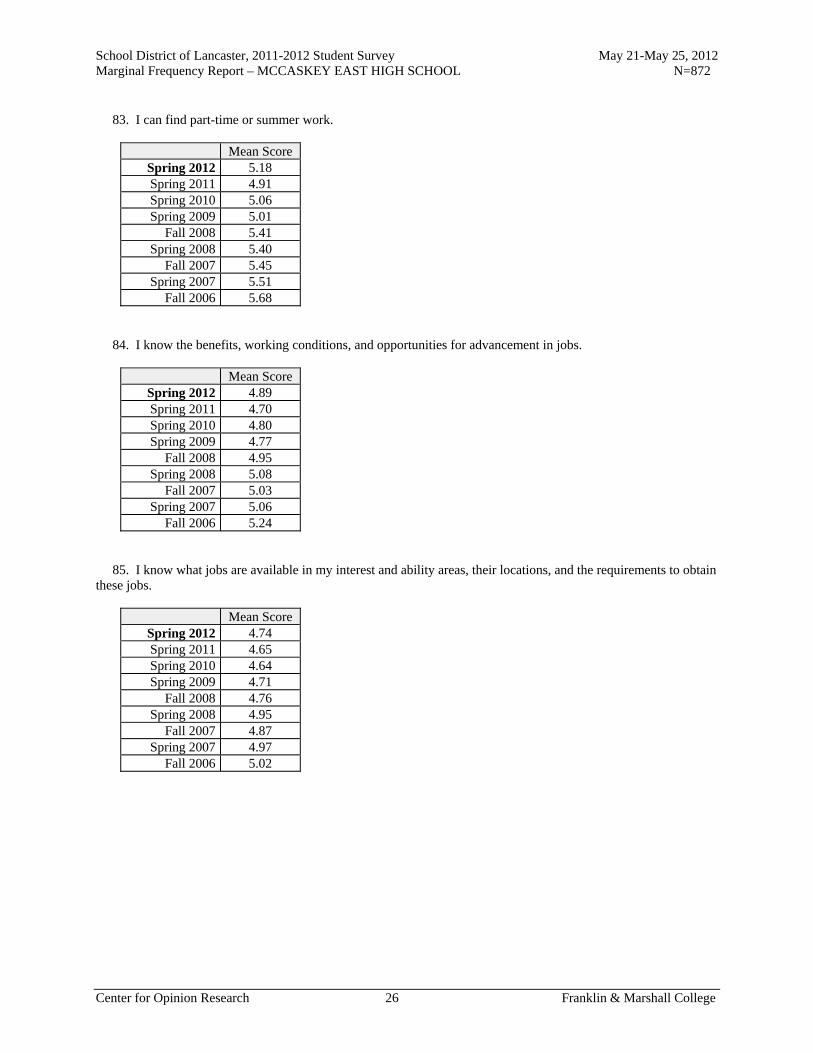
School District of Lancaster, 2011-2012 Student Survey May 21-May 25, 2012 Marginal Frequency Report – MCCASKEY EAST HIGH SCHOOL N=872
Center for Opinion Research 26 Franklin & Marshall College
83. I can find part-time or summer work.
Mean Score Spring 2012 5.18 Spring 2011 4.91 Spring 2010 5.06 Spring 2009 5.01
Fall 2008 5.41 Spring 2008 5.40
Fall 2007 5.45 Spring 2007 5.51
Fall 2006 5.68 84. I know the benefits, working conditions, and opportunities for advancement in jobs.
Mean Score Spring 2012 4.89 Spring 2011 4.70 Spring 2010 4.80 Spring 2009 4.77
Fall 2008 4.95 Spring 2008 5.08
Fall 2007 5.03 Spring 2007 5.06
Fall 2006 5.24 85. I know what jobs are available in my interest and ability areas, their locations, and the requirements to obtain these jobs.
Mean Score Spring 2012 4.74 Spring 2011 4.65 Spring 2010 4.64 Spring 2009 4.71
Fall 2008 4.76 Spring 2008 4.95
Fall 2007 4.87 Spring 2007 4.97
Fall 2006 5.02
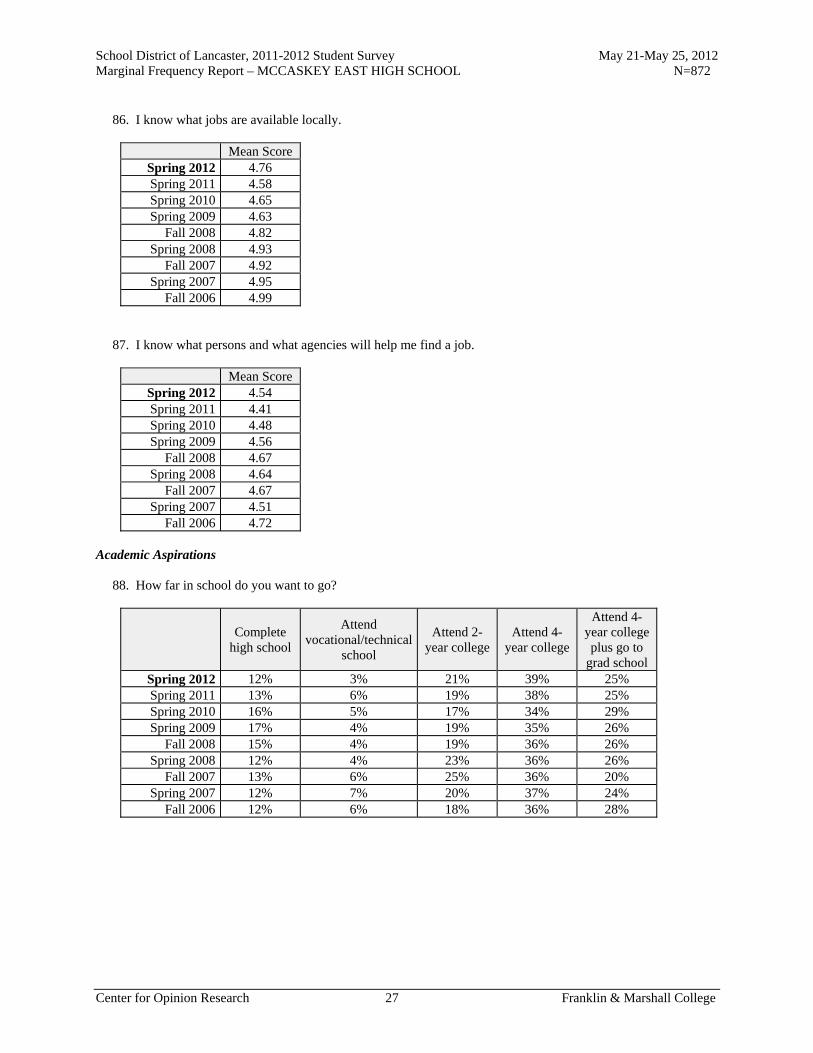
School District of Lancaster, 2011-2012 Student Survey May 21-May 25, 2012 Marginal Frequency Report – MCCASKEY EAST HIGH SCHOOL N=872
Center for Opinion Research 27 Franklin & Marshall College
86. I know what jobs are available locally.
Mean Score Spring 2012 4.76 Spring 2011 4.58 Spring 2010 4.65 Spring 2009 4.63
Fall 2008 4.82 Spring 2008 4.93
Fall 2007 4.92 Spring 2007 4.95
Fall 2006 4.99 87. I know what persons and what agencies will help me find a job.
Mean Score Spring 2012 4.54 Spring 2011 4.41 Spring 2010 4.48 Spring 2009 4.56
Fall 2008 4.67 Spring 2008 4.64
Fall 2007 4.67 Spring 2007 4.51
Fall 2006 4.72 Academic Aspirations 88. How far in school do you want to go?
Complete
high school
Attend vocational/technical
school
Attend 2-year college
Attend 4-year college
Attend 4-year college plus go to
grad school Spring 2012 12% 3% 21% 39% 25% Spring 2011 13% 6% 19% 38% 25% Spring 2010 16% 5% 17% 34% 29% Spring 2009 17% 4% 19% 35% 26%
Fall 2008 15% 4% 19% 36% 26% Spring 2008 12% 4% 23% 36% 26%
Fall 2007 13% 6% 25% 36% 20% Spring 2007 12% 7% 20% 37% 24%
Fall 2006 12% 6% 18% 36% 28%

School District of Lancaster, 2011-2012 Student Survey May 21-May 25, 2012 Marginal Frequency Report – MCCASKEY EAST HIGH SCHOOL N=872
Center for Opinion Research 28 Franklin & Marshall College
89. How important do you believe getting a college education is to your future success? Would you say it is...
Very
important Somewhat important
Not very important
Not important at
all Spring 2012 81% 13% 4% 2% Spring 2011 80% 13% 4% 3% Spring 2010 78% 14% 4% 3% Spring 2009 81% 11% 4% 5%
Fall 2008 84% 12% 2% 2% Spring 2008 84% 13% 2% 1%
Fall 2007 79% 16% 2% 3% Spring 2007 80% 16% 2% 1%
Fall 2006 85% 12% 1% 2% 90. How important would your parent/guardian say getting a college education is to your future success? Would your parents say it is...
Very
important Somewhat important
Not very important
Not important at
all Spring 2012 84% 12% 2% 2% Spring 2011 81% 12% 4% 3% Spring 2010 81% 13% 3% 3% Spring 2009 83% 10% 3% 4%
Fall 2008 83% 12% 2% 3% Spring 2008 84% 14% 2% 1%
Fall 2007 83% 12% 2% 2% Spring 2007 84% 13% 2% 1%
Fall 2006 87% 11% 1% 1% 91. How important would your teachers say getting a college education is to your future success? Would your teachers say it is...
Very
important Somewhat important
Not very important
Not important at
all Spring 2012 83% 12% 2% 3% Spring 2011 83% 11% 3% 3% Spring 2010 82% 11% 3% 3% Spring 2009 84% 10% 3% 3%
Fall 2008 86% 9% 2% 3% Spring 2008 86% 10% 2% 2%
Fall 2007 84% 12% 2% 2% Spring 2007 85% 12% 2% 1%
Fall 2006 89% 9% 0% 1%

School District of Lancaster, 2011-2012 Student Survey May 21-May 25, 2012 Marginal Frequency Report – MCCASKEY EAST HIGH SCHOOL N=872
Center for Opinion Research 29 Franklin & Marshall College
92. How far in school do you think you will get?
Won't finish high school
Will finish high school
Will get a GED
Will complete a
2-year Associate's
Degree
Will complete a
4-year Bachelor's
Degree
Will complete a Master's or Doctoral Degree
Spring 2012 7% 16% 3% 21% 31% 22% Spring 2011 4% 18% 5% 18% 32% 22% Spring 2010 5% 17% 4% 16% 33% 25% Spring 2009 7% 17% 4% 16% 32% 24%
Fall 2008 4% 21% 4% 17% 32% 23% Spring 2008 4% 16% 4% 20% 33% 23%
Fall 2007 3% 23% 4% 20% 32% 17% Spring 2007 3% 20% 4% 21% 31% 21%
Fall 2006 2% 20% 3% 15% 34% 25% 93. Has anyone from your school or GEAR UP ever spoken with you about college entrance requirements or the courses that you need to take in high school in order to prepare for college?
Yes No Spring 2012 80% 20% Spring 2011 66% 34% Spring 2010 66% 34% Spring 2009 68% 32%
Fall 2008 71% 29% Spring 2008 75% 25%
Fall 2007 74% 26% Spring 2007 68% 32%
Fall 2006 68% 32% 94. Has anyone from your school or GEAR UP ever spoken with you about the availability of financial aid to help you pay for college?
Yes No Spring 2012 65% 35% Spring 2011 60% 40% Spring 2010 61% 39% Spring 2009 63% 37%
Fall 2008 65% 35% Spring 2008 68% 32%
Fall 2007 62% 38% Spring 2007 60% 40%
Fall 2006 58% 42%

School District of Lancaster, 2011-2012 Student Survey May 21-May 25, 2012 Marginal Frequency Report – MCCASKEY EAST HIGH SCHOOL N=872
Center for Opinion Research 30 Franklin & Marshall College
95. Do you think that you could afford to attend a public 4-year college (for example, Millersville University) using financial aid, scholarships, and your family's resources?
Definitely Probably Not Sure Probably
Not Definitely
Not Spring 2012 26% 35% 27% 6% 7% Spring 2011 20% 35% 30% 8% 8% Spring 2010 22% 36% 26% 9% 6% Spring 2009 24% 32% 27% 8% 10%
Fall 2008 23% 36% 27% 8% 6% Spring 2008 22% 38% 27% 9% 4%
Fall 2007 20% 38% 27% 8% 7% Spring 2007 24% 39% 24% 8% 4%
Fall 2006 26% 36% 24% 9% 6% 96. On a scale of 1 to 5, to what extent are you knowledgeable about financial aid and the cost and benefits to you in pursuing postsecondary education?
Mean Score Spring 2012 2.91
97. Have you discussed with your parent/guardian your plans after high school graduation?
Yes No Spring 2012 76% 24% Spring 2011 72% 28% Spring 2010 73% 27%
98. Have any of your brothers or sisters earned a college degree?
Yes No Not
Applicable Spring 2012 27% 56% 17% Spring 2011 26% 55% 18% Spring 2010 22% 58% 20%
99. Have either of your parents/guardians earned a college degree?
Yes No Spring 2012 38% 62% Spring 2011 35% 65% Spring 2010 38% 62%

School District of Lancaster, 2011-2012 Student Survey May 21-May 25, 2012 Marginal Frequency Report – MCCASKEY EAST HIGH SCHOOL N=872
Center for Opinion Research 31 Franklin & Marshall College
100. Has anyone from your school ever spoken with you about participating in the dual enrollment program? The dual enrollment program lets you take college courses during high school.
Yes No Spring 2012 61% 39% Spring 2011 59% 41%
Social & Emotional Development Do you agree or disagree with the following statements? Please give your answers based on how things have been for you over the last six months. 101. I try to be nice to other people. I care about their feelings.
Really Agree
Kind of Agree
Kind of Disagree
Really Disagree
Spring 2012 43% 45% 8% 4% Spring 2011 47% 39% 10% 4% Spring 2010 43% 41% 9% 7% Spring 2009 41% 42% 10% 7%
Fall 2008 43% 45% 8% 4% Spring 2008 47% 42% 9% 3%
Fall 2007 46% 42% 6% 5% Spring 2007 49% 39% 8% 4%
Fall 2006 47% 42% 8% 2% 102. I am restless. I cannot stay still for too long.
Really Agree
Kind of Agree
Kind of Disagree
Really Disagree
Spring 2012 22% 34% 28% 16% Spring 2011 21% 35% 27% 16% Spring 2010 23% 34% 24% 19% Spring 2009 19% 36% 25% 20%
Fall 2008 18% 37% 28% 16% Spring 2008 20% 38% 25% 16%
Fall 2007 20% 38% 26% 15% Spring 2007 19% 38% 25% 18%
Fall 2006 19% 37% 27% 17%
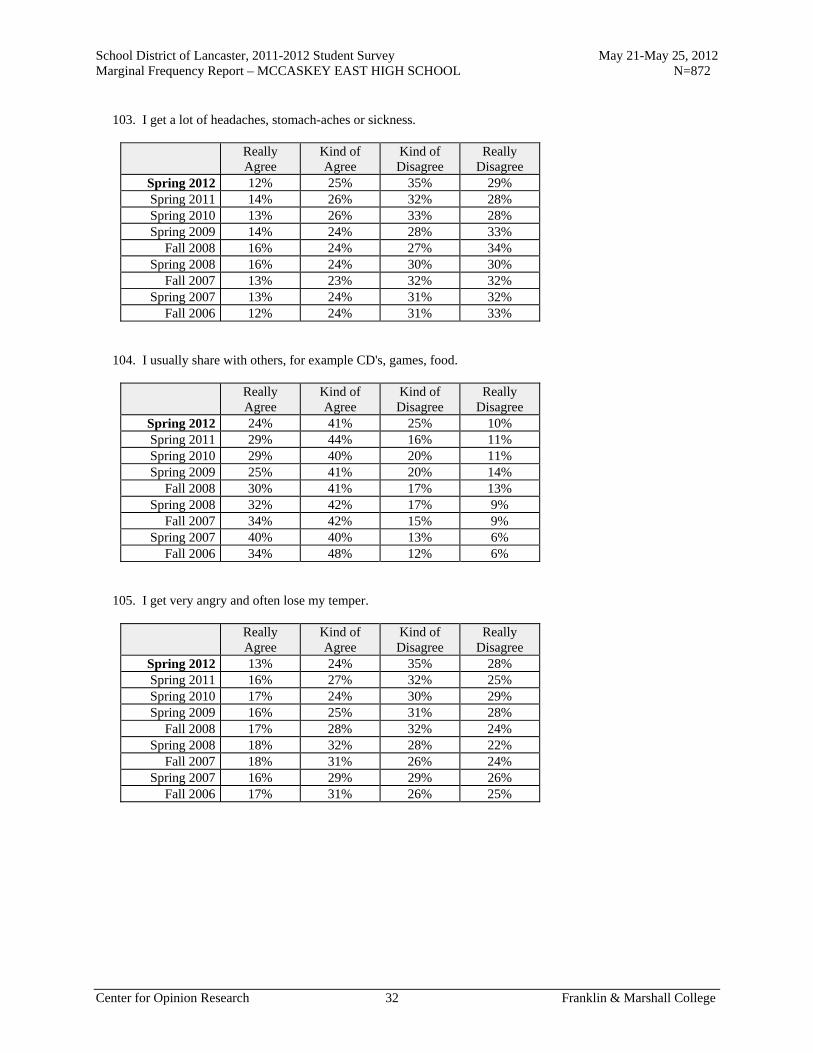
School District of Lancaster, 2011-2012 Student Survey May 21-May 25, 2012 Marginal Frequency Report – MCCASKEY EAST HIGH SCHOOL N=872
Center for Opinion Research 32 Franklin & Marshall College
103. I get a lot of headaches, stomach-aches or sickness.
Really Agree
Kind of Agree
Kind of Disagree
Really Disagree
Spring 2012 12% 25% 35% 29% Spring 2011 14% 26% 32% 28% Spring 2010 13% 26% 33% 28% Spring 2009 14% 24% 28% 33%
Fall 2008 16% 24% 27% 34% Spring 2008 16% 24% 30% 30%
Fall 2007 13% 23% 32% 32% Spring 2007 13% 24% 31% 32%
Fall 2006 12% 24% 31% 33% 104. I usually share with others, for example CD's, games, food.
Really Agree
Kind of Agree
Kind of Disagree
Really Disagree
Spring 2012 24% 41% 25% 10% Spring 2011 29% 44% 16% 11% Spring 2010 29% 40% 20% 11% Spring 2009 25% 41% 20% 14%
Fall 2008 30% 41% 17% 13% Spring 2008 32% 42% 17% 9%
Fall 2007 34% 42% 15% 9% Spring 2007 40% 40% 13% 6%
Fall 2006 34% 48% 12% 6% 105. I get very angry and often lose my temper.
Really Agree
Kind of Agree
Kind of Disagree
Really Disagree
Spring 2012 13% 24% 35% 28% Spring 2011 16% 27% 32% 25% Spring 2010 17% 24% 30% 29% Spring 2009 16% 25% 31% 28%
Fall 2008 17% 28% 32% 24% Spring 2008 18% 32% 28% 22%
Fall 2007 18% 31% 26% 24% Spring 2007 16% 29% 29% 26%
Fall 2006 17% 31% 26% 25%

School District of Lancaster, 2011-2012 Student Survey May 21-May 25, 2012 Marginal Frequency Report – MCCASKEY EAST HIGH SCHOOL N=872
Center for Opinion Research 33 Franklin & Marshall College
106. I would rather be alone than with people of my age.
Really Agree
Kind of Agree
Kind of Disagree
Really Disagree
Spring 2012 11% 28% 32% 29% Spring 2011 13% 27% 30% 30% Spring 2010 14% 23% 29% 34% Spring 2009 13% 25% 32% 29%
Fall 2008 11% 24% 30% 34% Spring 2008 12% 24% 32% 32%
Fall 2007 13% 22% 30% 36% Spring 2007 10% 24% 29% 37%
Fall 2006 10% 26% 31% 34% 107. I usually do as I am told.
Really Agree
Kind of Agree
Kind of Disagree
Really Disagree
Spring 2012 25% 49% 19% 7% Spring 2011 27% 45% 21% 7% Spring 2010 25% 44% 23% 9% Spring 2009 23% 46% 22% 9%
Fall 2008 25% 47% 21% 8% Spring 2008 22% 49% 21% 7%
Fall 2007 27% 46% 20% 7% Spring 2007 23% 54% 17% 6%
Fall 2006 25% 53% 16% 5% 108. I worry a lot.
Really Agree
Kind of Agree
Kind of Disagree
Really Disagree
Spring 2012 21% 32% 29% 17% Spring 2011 22% 29% 30% 19% Spring 2010 20% 30% 30% 21% Spring 2009 21% 31% 30% 18%
Fall 2008 21% 33% 27% 20% Spring 2008 19% 33% 30% 18%
Fall 2007 22% 29% 26% 22% Spring 2007 22% 27% 29% 22%
Fall 2006 20% 33% 30% 17%

School District of Lancaster, 2011-2012 Student Survey May 21-May 25, 2012 Marginal Frequency Report – MCCASKEY EAST HIGH SCHOOL N=872
Center for Opinion Research 34 Franklin & Marshall College
109. I am helpful if someone is hurt, upset, or feeling ill.
Really Agree
Kind of Agree
Kind of Disagree
Really Disagree
Spring 2012 46% 41% 9% 4% Spring 2011 44% 42% 10% 4% Spring 2010 45% 40% 11% 4% Spring 2009 41% 43% 9% 6%
Fall 2008 45% 44% 9% 3% Spring 2008 48% 42% 6% 3%
Fall 2007 50% 39% 8% 4% Spring 2007 52% 38% 7% 2%
Fall 2006 42% 44% 11% 3% 110. I am constantly moving or squirming.
Really Agree
Kind of Agree
Kind of Disagree
Really Disagree
Spring 2012 18% 36% 30% 16% Spring 2011 19% 32% 33% 16% Spring 2010 16% 33% 33% 18% Spring 2009 14% 35% 33% 18%
Fall 2008 14% 34% 33% 19% Spring 2008 20% 31% 32% 17%
Fall 2007 15% 35% 33% 17% Spring 2007 16% 33% 34% 17%
Fall 2006 13% 32% 32% 23% 111. I have one good friend or more.
Really Agree
Kind of Agree
Kind of Disagree
Really Disagree
Spring 2012 57% 31% 8% 5% Spring 2011 60% 28% 8% 4% Spring 2010 60% 28% 7% 5% Spring 2009 52% 31% 10% 7%
Fall 2008 58% 29% 9% 4% Spring 2008 59% 33% 7% 2%
Fall 2007 60% 29% 9% 2% Spring 2007 67% 25% 6% 3%
Fall 2006 65% 25% 5% 5%

School District of Lancaster, 2011-2012 Student Survey May 21-May 25, 2012 Marginal Frequency Report – MCCASKEY EAST HIGH SCHOOL N=872
Center for Opinion Research 35 Franklin & Marshall College
112. I fight a lot. I can make other people do what I want.
Really Agree
Kind of Agree
Kind of Disagree
Really Disagree
Spring 2012 7% 13% 31% 49% Spring 2011 8% 12% 28% 52% Spring 2010 5% 14% 31% 50% Spring 2009 7% 15% 29% 49%
Fall 2008 6% 16% 31% 47% Spring 2008 9% 17% 31% 43%
Fall 2007 6% 15% 32% 47% Spring 2007 4% 15% 32% 49%
Fall 2006 3% 17% 30% 50% 113. I am often unhappy, depressed, or tearful.
Really Agree
Kind of Agree
Kind of Disagree
Really Disagree
Spring 2012 10% 20% 30% 40% Spring 2011 12% 20% 30% 39% Spring 2010 11% 22% 29% 37% Spring 2009 11% 22% 31% 37%
Fall 2008 13% 18% 31% 38% Spring 2008 13% 24% 30% 33%
Fall 2007 11% 21% 27% 41% Spring 2007 10% 19% 27% 45%
Fall 2006 9% 25% 25% 41% 114. Other people my age generally like me.
Really Agree
Kind of Agree
Kind of Disagree
Really Disagree
Spring 2012 33% 46% 14% 6% Spring 2011 36% 46% 12% 6% Spring 2010 33% 48% 14% 6% Spring 2009 32% 47% 12% 9%
Fall 2008 38% 44% 13% 4% Spring 2008 35% 48% 11% 6%
Fall 2007 41% 44% 12% 3% Spring 2007 41% 44% 12% 4%
Fall 2006 40% 45% 12% 2%

School District of Lancaster, 2011-2012 Student Survey May 21-May 25, 2012 Marginal Frequency Report – MCCASKEY EAST HIGH SCHOOL N=872
Center for Opinion Research 36 Franklin & Marshall College
115. I easily lose my focus. I find it difficult to concentrate.
Really Agree
Kind of Agree
Kind of Disagree
Really Disagree
Spring 2012 18% 32% 32% 18% Spring 2011 21% 31% 28% 20% Spring 2010 22% 27% 30% 20% Spring 2009 21% 28% 29% 22%
Fall 2008 20% 31% 30% 18% Spring 2008 21% 32% 29% 18%
Fall 2007 23% 32% 26% 19% Spring 2007 19% 33% 30% 18%
Fall 2006 18% 34% 28% 20% 116. I am nervous in new situations. I easily lose confidence.
Really Agree
Kind of Agree
Kind of Disagree
Really Disagree
Spring 2012 18% 32% 29% 20% Spring 2011 19% 34% 29% 19% Spring 2010 18% 33% 26% 22% Spring 2009 18% 30% 26% 26%
Fall 2008 18% 29% 28% 24% Spring 2008 16% 33% 30% 21%
Fall 2007 19% 30% 29% 22% Spring 2007 16% 27% 32% 24%
Fall 2006 17% 29% 31% 23% 117. I am kind to younger children.
Really Agree
Kind of Agree
Kind of Disagree
Really Disagree
Spring 2012 46% 34% 12% 8% Spring 2011 46% 35% 13% 6% Spring 2010 50% 32% 11% 7% Spring 2009 46% 30% 16% 9%
Fall 2008 50% 32% 11% 7% Spring 2008 45% 36% 12% 8%
Fall 2007 48% 35% 10% 6% Spring 2007 55% 30% 10% 6%
Fall 2006 55% 35% 6% 5%

School District of Lancaster, 2011-2012 Student Survey May 21-May 25, 2012 Marginal Frequency Report – MCCASKEY EAST HIGH SCHOOL N=872
Center for Opinion Research 37 Franklin & Marshall College
118. I am often accused of lying or cheating.
Really Agree
Kind of Agree
Kind of Disagree
Really Disagree
Spring 2012 8% 16% 25% 51% Spring 2011 10% 16% 26% 48% Spring 2010 9% 18% 25% 48% Spring 2009 11% 17% 22% 50%
Fall 2008 10% 16% 26% 47% Spring 2008 9% 18% 26% 47%
Fall 2007 6% 19% 26% 48% Spring 2007 6% 17% 28% 49%
Fall 2006 7% 19% 24% 50% 119. Other children or young people pick on me or bully me.
Really Agree
Kind of Agree
Kind of Disagree
Really Disagree
Spring 2012 7% 15% 19% 59% Spring 2011 7% 13% 20% 60% Spring 2010 7% 12% 20% 61% Spring 2009 5% 15% 21% 59%
Fall 2008 7% 10% 18% 64% Spring 2008 6% 15% 18% 60%
Fall 2007 6% 13% 16% 64% Spring 2007 5% 9% 20% 66%
Fall 2006 5% 14% 15% 67% 120. I often offer to help others (parents, teachers, children).
Really Agree
Kind of Agree
Kind of Disagree
Really Disagree
Spring 2012 35% 46% 14% 5% Spring 2011 38% 41% 14% 7% Spring 2010 35% 42% 17% 6% Spring 2009 33% 43% 17% 8%
Fall 2008 34% 45% 15% 7% Spring 2008 33% 45% 17% 5%
Fall 2007 34% 45% 16% 4% Spring 2007 38% 41% 15% 5%
Fall 2006 34% 45% 16% 5%

School District of Lancaster, 2011-2012 Student Survey May 21-May 25, 2012 Marginal Frequency Report – MCCASKEY EAST HIGH SCHOOL N=872
Center for Opinion Research 38 Franklin & Marshall College
121. I think before I do things.
Really Agree
Kind of Agree
Kind of Disagree
Really Disagree
Spring 2012 35% 42% 16% 7% Spring 2011 36% 40% 17% 7% Spring 2010 32% 42% 17% 9% Spring 2009 30% 40% 19% 10%
Fall 2008 35% 39% 18% 7% Spring 2008 25% 53% 15% 8%
Fall 2007 32% 42% 18% 9% Spring 2007 28% 45% 20% 6%
Fall 2006 30% 49% 16% 6% 122. I take things that are not mine from home, school, or elsewhere.
Really Agree
Kind of Agree
Kind of Disagree
Really Disagree
Spring 2012 8% 15% 17% 60% Spring 2011 9% 13% 20% 58% Spring 2010 7% 16% 16% 62% Spring 2009 6% 14% 21% 59%
Fall 2008 7% 11% 18% 64% Spring 2008 7% 18% 19% 56%
Fall 2007 6% 13% 21% 60% Spring 2007 4% 13% 20% 63%
Fall 2006 3% 15% 21% 62% 123. I get along better with adults than with people my own age.
Really Agree
Kind of Agree
Kind of Disagree
Really Disagree
Spring 2012 19% 34% 33% 14% Spring 2011 19% 31% 34% 17% Spring 2010 21% 30% 33% 16% Spring 2009 18% 30% 36% 17%
Fall 2008 19% 31% 32% 19% Spring 2008 15% 33% 33% 19%
Fall 2007 16% 28% 40% 16% Spring 2007 13% 30% 36% 21%
Fall 2006 12% 31% 35% 22%

School District of Lancaster, 2011-2012 Student Survey May 21-May 25, 2012 Marginal Frequency Report – MCCASKEY EAST HIGH SCHOOL N=872
Center for Opinion Research 39 Franklin & Marshall College
124. I have many fears. I am easily scared.
Really Agree
Kind of Agree
Kind of Disagree
Really Disagree
Spring 2012 12% 18% 30% 39% Spring 2011 11% 17% 28% 43% Spring 2010 9% 18% 32% 41% Spring 2009 8% 22% 29% 42%
Fall 2008 7% 20% 28% 45% Spring 2008 9% 20% 33% 38%
Fall 2007 8% 15% 33% 43% Spring 2007 8% 16% 32% 44%
Fall 2006 8% 18% 32% 42% 125. I finish the work I'm doing. My attention is good.
Really Agree
Kind of Agree
Kind of Disagree
Really Disagree
Spring 2012 28% 45% 19% 8% Spring 2011 29% 41% 22% 8% Spring 2010 30% 40% 23% 7% Spring 2009 25% 44% 22% 8%
Fall 2008 27% 43% 23% 7% Spring 2008 26% 42% 24% 7%
Fall 2007 28% 42% 22% 7% Spring 2007 26% 43% 24% 6%
Fall 2006 25% 45% 24% 6% Perceptions of Police Do you agree or disagree with the following statements about police officers? 126. I respect police officers.
Really Agree
Kind of Agree
Kind of Disagree
Really Disagree
Spring 2012 51% 33% 9% 7% Spring 2011 52% 30% 9% 9% Spring 2010 46% 30% 14% 10% Spring 2009 45% 33% 12% 10%
Fall 2008 44% 35% 11% 11% Spring 2008 29% 41% 21% 8%
Fall 2007 33% 36% 20% 11% Spring 2007 31% 39% 20% 10%
Fall 2006 35% 37% 17% 11%

School District of Lancaster, 2011-2012 Student Survey May 21-May 25, 2012 Marginal Frequency Report – MCCASKEY EAST HIGH SCHOOL N=872
Center for Opinion Research 40 Franklin & Marshall College
127. I am comfortable approaching police officers.
Really Agree
Kind of Agree
Kind of Disagree
Really Disagree
Spring 2012 34% 39% 16% 10% Spring 2011 39% 34% 17% 10% Spring 2010 38% 33% 18% 11% Spring 2009 33% 35% 16% 15%
Fall 2008 34% 37% 17% 12% Spring 2008 24% 40% 23% 14%
Fall 2007 28% 35% 21% 16% Spring 2007 25% 37% 24% 14%
Fall 2006 30% 38% 21% 12% 128. I would consider police work as a career.
Really Agree
Kind of Agree
Kind of Disagree
Really Disagree
Spring 2012 23% 28% 17% 33% Spring 2011 26% 22% 18% 34% Spring 2010 17% 23% 20% 40% Spring 2009 19% 22% 16% 43%
Fall 2008 20% 22% 17% 41% Spring 2008 13% 29% 19% 39%
Fall 2007 17% 21% 20% 41% Spring 2007 14% 19% 17% 50%
Fall 2006 15% 21% 18% 45% 129. In general, I do not trust the police.
Really Agree
Kind of Agree
Kind of Disagree
Really Disagree
Spring 2012 16% 25% 29% 30% Spring 2011 17% 27% 26% 30% Spring 2010 16% 27% 27% 30% Spring 2009 15% 27% 28% 30%
Fall 2008 17% 29% 25% 28% Spring 2008 14% 31% 32% 24%
Fall 2007 17% 26% 32% 25% Spring 2007 18% 27% 33% 22%
Fall 2006 16% 30% 29% 24%

School District of Lancaster, 2011-2012 Student Survey May 21-May 25, 2012 Marginal Frequency Report – MCCASKEY EAST HIGH SCHOOL N=872
Center for Opinion Research 41 Franklin & Marshall College
130. Police do not belong in schools unless there has been a crime.
Really Agree
Kind of Agree
Kind of Disagree
Really Disagree
Spring 2012 16% 21% 31% 32% Spring 2011 14% 24% 28% 34% Spring 2010 19% 19% 27% 34% Spring 2009 14% 21% 31% 34%
Fall 2008 15% 21% 28% 36% Spring 2008 14% 25% 32% 29%
Fall 2007 17% 22% 31% 30% Spring 2007 11% 20% 32% 36%
Fall 2006 19% 22% 30% 29% Hidden Delinquency In the last 12 months, how many times did you... 131. Deliberately damage property that did not belong to you.
Never 1 or 2 Times 3 or 4 Times5 or More
Times Spring 2012 76% 16% 4% 4% Spring 2011 74% 17% 3% 6% Spring 2010 69% 20% 3% 7% Spring 2009 72% 16% 5% 7%
Fall 2008 72% 18% 4% 6% Spring 2008 73% 18% 5% 4%
Fall 2007 70% 22% 3% 4% Spring 2007 73% 18% 5% 4%
Fall 2006 75% 18% 4% 4% 132. Take something from a store without paying for it.
Never 1 or 2 Times 3 or 4 Times5 or More
Times Spring 2012 79% 13% 4% 4% Spring 2011 75% 14% 6% 5% Spring 2010 72% 14% 7% 6% Spring 2009 74% 14% 5% 7%
Fall 2008 77% 14% 5% 4% Spring 2008 76% 14% 6% 4%
Fall 2007 73% 16% 5% 6% Spring 2007 76% 15% 4% 6%
Fall 2006 82% 10% 3% 5%

School District of Lancaster, 2011-2012 Student Survey May 21-May 25, 2012 Marginal Frequency Report – MCCASKEY EAST HIGH SCHOOL N=872
Center for Opinion Research 42 Franklin & Marshall College
133. Hurt someone badly enough for that person to need bandages or care from a doctor or nurse.
Never 1 or 2 Times 3 or 4 Times5 or More
Times Spring 2012 78% 15% 4% 4% Spring 2011 76% 14% 5% 5% Spring 2010 72% 18% 6% 5% Spring 2009 75% 14% 6% 6%
Fall 2008 73% 16% 6% 5% Spring 2008 75% 14% 6% 5%
Fall 2007 73% 18% 6% 3% Spring 2007 78% 13% 4% 4%
Fall 2006 78% 14% 5% 2% 134. Drive a car without its owner's permission.
Never 1 or 2 Times 3 or 4 Times5 or More
Times Spring 2012 87% 6% 3% 4% Spring 2011 82% 9% 4% 5% Spring 2010 81% 10% 4% 6% Spring 2009 80% 9% 4% 8%
Fall 2008 83% 8% 4% 5% Spring 2008 80% 10% 5% 5%
Fall 2007 82% 8% 5% 5% Spring 2007 85% 8% 2% 5%
Fall 2006 87% 6% 3% 5% 135. Steal something worth more than $50.
Never 1 or 2 Times 3 or 4 Times5 or More
Times Spring 2012 86% 8% 3% 3% Spring 2011 85% 7% 4% 4% Spring 2010 82% 8% 5% 5% Spring 2009 82% 7% 4% 7%
Fall 2008 87% 6% 3% 4% Spring 2008 84% 8% 4% 4%
Fall 2007 86% 7% 5% 3% Spring 2007 86% 6% 3% 4%
Fall 2006 89% 5% 3% 2%

School District of Lancaster, 2011-2012 Student Survey May 21-May 25, 2012 Marginal Frequency Report – MCCASKEY EAST HIGH SCHOOL N=872
Center for Opinion Research 43 Franklin & Marshall College
136. Go into a house or building to steal something.
Never 1 or 2 Times 3 or 4 Times5 or More
Times Spring 2012 88% 6% 3% 3% Spring 2011 83% 8% 5% 4% Spring 2010 84% 8% 4% 4% Spring 2009 84% 6% 5% 5%
Fall 2008 86% 7% 4% 4% Spring 2008 85% 8% 3% 4%
Fall 2007 88% 6% 2% 3% Spring 2007 89% 6% 3% 3%
Fall 2006 90% 5% 2% 2% 137. Use or threaten to use a weapon to get something from someone.
Never 1 or 2 Times 3 or 4 Times5 or More
Times Spring 2012 88% 7% 2% 3% Spring 2011 86% 7% 4% 3% Spring 2010 82% 9% 4% 5% Spring 2009 83% 8% 2% 6%
Fall 2008 86% 7% 3% 4% Spring 2008 83% 10% 4% 4%
Fall 2007 84% 9% 3% 3% Spring 2007 88% 6% 2% 4%
Fall 2006 90% 6% 2% 3% 138. Steal something worth less than $50.
Never 1 or 2 Times 3 or 4 Times5 or More
Times Spring 2012 80% 13% 3% 4% Spring 2011 75% 14% 5% 6% Spring 2010 74% 14% 4% 7% Spring 2009 77% 11% 6% 7%
Fall 2008 77% 14% 5% 4% Spring 2008 78% 12% 5% 5%
Fall 2007 77% 15% 3% 5% Spring 2007 77% 15% 2% 5%
Fall 2006 81% 12% 3% 4%

School District of Lancaster, 2011-2012 Student Survey May 21-May 25, 2012 Marginal Frequency Report – MCCASKEY EAST HIGH SCHOOL N=872
Center for Opinion Research 44 Franklin & Marshall College
139. Take part in a fight where a group of your friends is against another group.
Never 1 or 2 Times 3 or 4 Times5 or More
Times Spring 2012 78% 13% 4% 4% Spring 2011 76% 12% 6% 6% Spring 2010 73% 16% 4% 7% Spring 2009 74% 12% 6% 8%
Fall 2008 72% 16% 6% 6% Spring 2008 73% 16% 6% 5%
Fall 2007 75% 16% 4% 4% Spring 2007 78% 12% 5% 6%
Fall 2006 76% 17% 4% 3% 140. Act loudly, rowdy, or out of control in a public place.
Never 1 or 2 Times 3 or 4 Times5 or More
Times Spring 2012 66% 19% 6% 9% Spring 2011 59% 23% 8% 10% Spring 2010 54% 22% 9% 15% Spring 2009 59% 20% 9% 13%
Fall 2008 61% 22% 7% 10% Spring 2008 60% 22% 8% 9%
Fall 2007 62% 20% 7% 11% Spring 2007 58% 22% 8% 12%
Fall 2006 59% 24% 7% 10% Drug & Alcohol Use On how many occasions (if any) have you... 141. Had beer, wine, or hard liquor in your lifetime?
0 1 or 2 Times
3 to 5 Times
6 to 9 Times
10 to 19 Times
20 to 39 Times
40 or More Times
Spring 2012 48% 15% 12% 8% 5% 3% 9% Spring 2011 43% 21% 13% 7% 7% 3% 6% Spring 2010 41% 15% 14% 9% 6% 5% 11% Spring 2009 44% 16% 11% 8% 6% 3% 11%
Fall 2008 44% 20% 12% 7% 7% 2% 8% Spring 2008 41% 17% 14% 8% 6% 5% 8%
Fall 2007 44% 18% 12% 6% 7% 4% 9% Spring 2007 40% 24% 10% 9% 7% 3% 6%
Fall 2006 46% 23% 9% 7% 4% 4% 6%
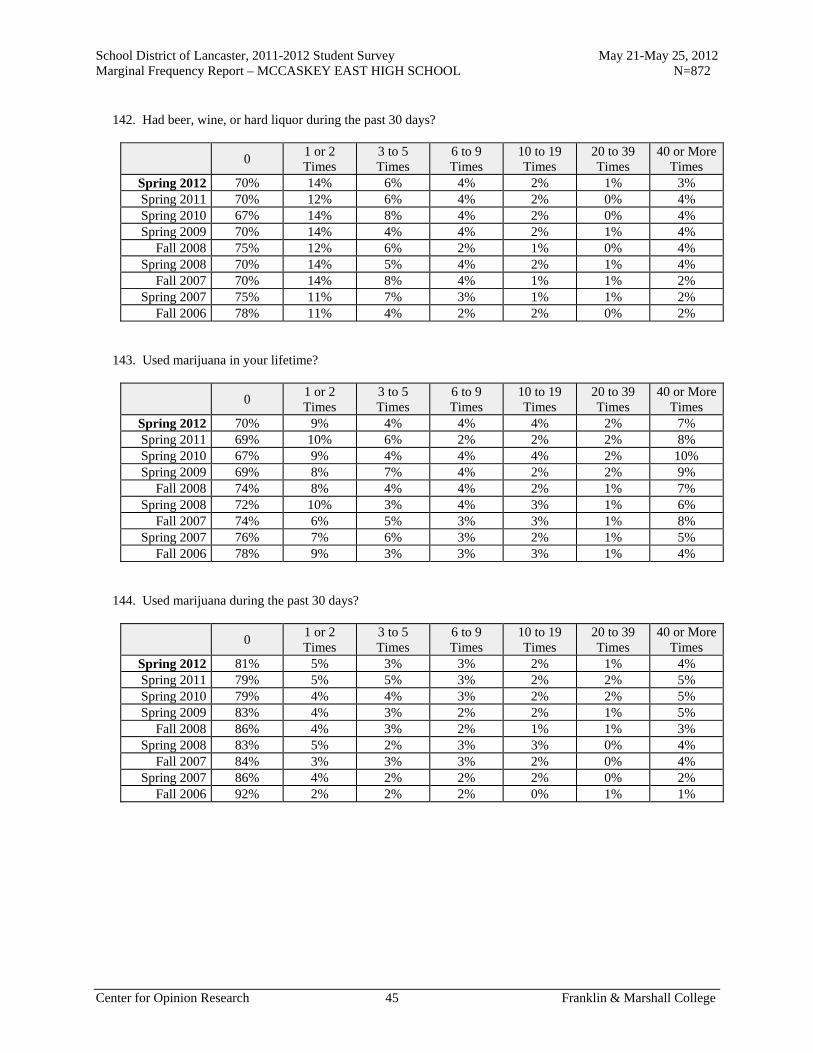
School District of Lancaster, 2011-2012 Student Survey May 21-May 25, 2012 Marginal Frequency Report – MCCASKEY EAST HIGH SCHOOL N=872
Center for Opinion Research 45 Franklin & Marshall College
142. Had beer, wine, or hard liquor during the past 30 days?
0 1 or 2 Times
3 to 5 Times
6 to 9 Times
10 to 19 Times
20 to 39 Times
40 or More Times
Spring 2012 70% 14% 6% 4% 2% 1% 3% Spring 2011 70% 12% 6% 4% 2% 0% 4% Spring 2010 67% 14% 8% 4% 2% 0% 4% Spring 2009 70% 14% 4% 4% 2% 1% 4%
Fall 2008 75% 12% 6% 2% 1% 0% 4% Spring 2008 70% 14% 5% 4% 2% 1% 4%
Fall 2007 70% 14% 8% 4% 1% 1% 2% Spring 2007 75% 11% 7% 3% 1% 1% 2%
Fall 2006 78% 11% 4% 2% 2% 0% 2% 143. Used marijuana in your lifetime?
0 1 or 2 Times
3 to 5 Times
6 to 9 Times
10 to 19 Times
20 to 39 Times
40 or More Times
Spring 2012 70% 9% 4% 4% 4% 2% 7% Spring 2011 69% 10% 6% 2% 2% 2% 8% Spring 2010 67% 9% 4% 4% 4% 2% 10% Spring 2009 69% 8% 7% 4% 2% 2% 9%
Fall 2008 74% 8% 4% 4% 2% 1% 7% Spring 2008 72% 10% 3% 4% 3% 1% 6%
Fall 2007 74% 6% 5% 3% 3% 1% 8% Spring 2007 76% 7% 6% 3% 2% 1% 5%
Fall 2006 78% 9% 3% 3% 3% 1% 4% 144. Used marijuana during the past 30 days?
0 1 or 2 Times
3 to 5 Times
6 to 9 Times
10 to 19 Times
20 to 39 Times
40 or More Times
Spring 2012 81% 5% 3% 3% 2% 1% 4% Spring 2011 79% 5% 5% 3% 2% 2% 5% Spring 2010 79% 4% 4% 3% 2% 2% 5% Spring 2009 83% 4% 3% 2% 2% 1% 5%
Fall 2008 86% 4% 3% 2% 1% 1% 3% Spring 2008 83% 5% 2% 3% 3% 0% 4%
Fall 2007 84% 3% 3% 3% 2% 0% 4% Spring 2007 86% 4% 2% 2% 2% 0% 2%
Fall 2006 92% 2% 2% 2% 0% 1% 1%
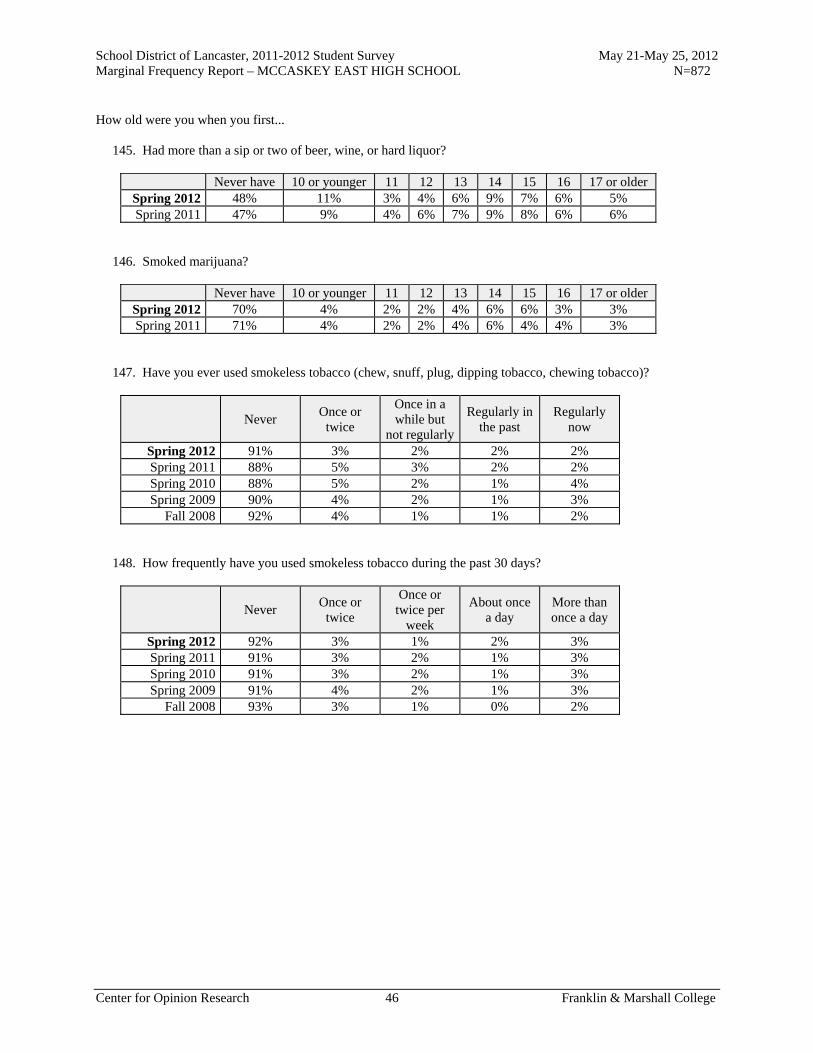
School District of Lancaster, 2011-2012 Student Survey May 21-May 25, 2012 Marginal Frequency Report – MCCASKEY EAST HIGH SCHOOL N=872
Center for Opinion Research 46 Franklin & Marshall College
How old were you when you first... 145. Had more than a sip or two of beer, wine, or hard liquor?
Never have 10 or younger 11 12 13 14 15 16 17 or older Spring 2012 48% 11% 3% 4% 6% 9% 7% 6% 5% Spring 2011 47% 9% 4% 6% 7% 9% 8% 6% 6%
146. Smoked marijuana?
Never have 10 or younger 11 12 13 14 15 16 17 or older Spring 2012 70% 4% 2% 2% 4% 6% 6% 3% 3% Spring 2011 71% 4% 2% 2% 4% 6% 4% 4% 3%
147. Have you ever used smokeless tobacco (chew, snuff, plug, dipping tobacco, chewing tobacco)?
Never Once or
twice
Once in a while but
not regularly
Regularly in the past
Regularly now
Spring 2012 91% 3% 2% 2% 2% Spring 2011 88% 5% 3% 2% 2% Spring 2010 88% 5% 2% 1% 4% Spring 2009 90% 4% 2% 1% 3%
Fall 2008 92% 4% 1% 1% 2% 148. How frequently have you used smokeless tobacco during the past 30 days?
Never Once or
twice
Once or twice per
week
About once a day
More than once a day
Spring 2012 92% 3% 1% 2% 3% Spring 2011 91% 3% 2% 1% 3% Spring 2010 91% 3% 2% 1% 3% Spring 2009 91% 4% 2% 1% 3%
Fall 2008 93% 3% 1% 0% 2%
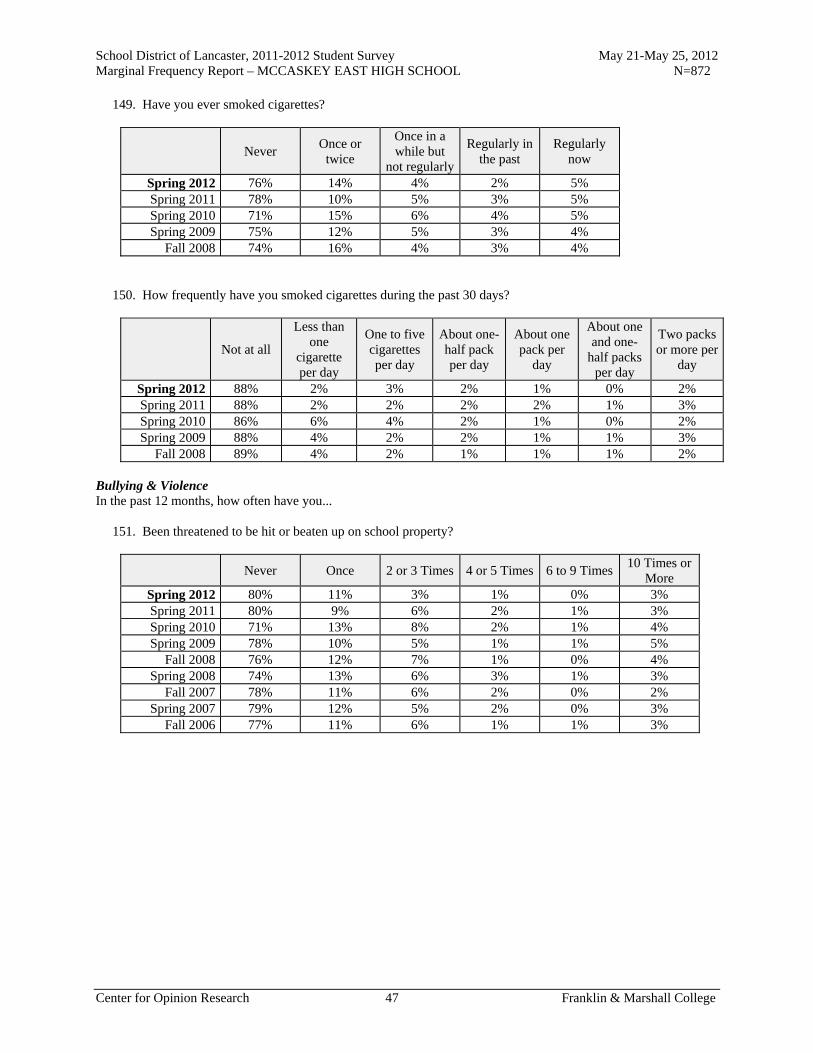
School District of Lancaster, 2011-2012 Student Survey May 21-May 25, 2012 Marginal Frequency Report – MCCASKEY EAST HIGH SCHOOL N=872
Center for Opinion Research 47 Franklin & Marshall College
149. Have you ever smoked cigarettes?
Never Once or
twice
Once in a while but
not regularly
Regularly in the past
Regularly now
Spring 2012 76% 14% 4% 2% 5% Spring 2011 78% 10% 5% 3% 5% Spring 2010 71% 15% 6% 4% 5% Spring 2009 75% 12% 5% 3% 4%
Fall 2008 74% 16% 4% 3% 4% 150. How frequently have you smoked cigarettes during the past 30 days?
Not at all
Less than one
cigarette per day
One to five cigarettes per day
About one-half pack per day
About one pack per
day
About one and one-
half packs per day
Two packs or more per
day
Spring 2012 88% 2% 3% 2% 1% 0% 2% Spring 2011 88% 2% 2% 2% 2% 1% 3% Spring 2010 86% 6% 4% 2% 1% 0% 2% Spring 2009 88% 4% 2% 2% 1% 1% 3%
Fall 2008 89% 4% 2% 1% 1% 1% 2% Bullying & Violence In the past 12 months, how often have you... 151. Been threatened to be hit or beaten up on school property?
Never Once 2 or 3 Times 4 or 5 Times 6 to 9 Times 10 Times or
More Spring 2012 80% 11% 3% 1% 0% 3% Spring 2011 80% 9% 6% 2% 1% 3% Spring 2010 71% 13% 8% 2% 1% 4% Spring 2009 78% 10% 5% 1% 1% 5%
Fall 2008 76% 12% 7% 1% 0% 4% Spring 2008 74% 13% 6% 3% 1% 3%
Fall 2007 78% 11% 6% 2% 0% 2% Spring 2007 79% 12% 5% 2% 0% 3%
Fall 2006 77% 11% 6% 1% 1% 3%
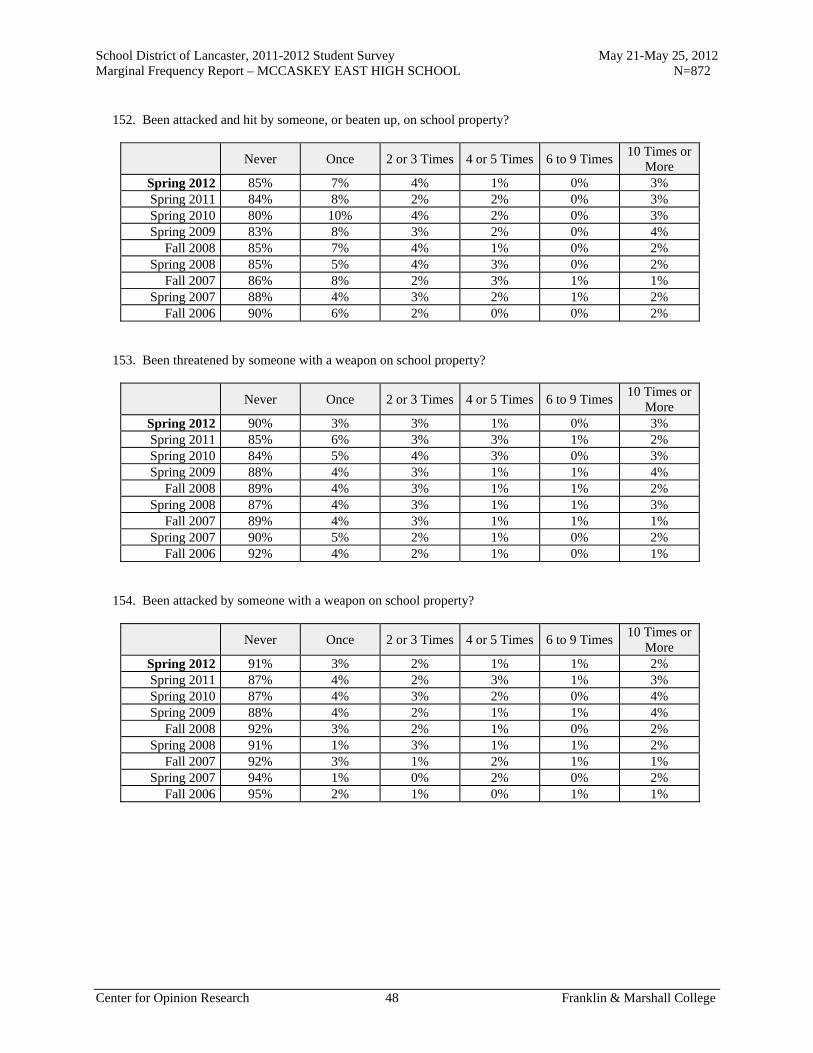
School District of Lancaster, 2011-2012 Student Survey May 21-May 25, 2012 Marginal Frequency Report – MCCASKEY EAST HIGH SCHOOL N=872
Center for Opinion Research 48 Franklin & Marshall College
152. Been attacked and hit by someone, or beaten up, on school property?
Never Once 2 or 3 Times 4 or 5 Times 6 to 9 Times 10 Times or
More Spring 2012 85% 7% 4% 1% 0% 3% Spring 2011 84% 8% 2% 2% 0% 3% Spring 2010 80% 10% 4% 2% 0% 3% Spring 2009 83% 8% 3% 2% 0% 4%
Fall 2008 85% 7% 4% 1% 0% 2% Spring 2008 85% 5% 4% 3% 0% 2%
Fall 2007 86% 8% 2% 3% 1% 1% Spring 2007 88% 4% 3% 2% 1% 2%
Fall 2006 90% 6% 2% 0% 0% 2% 153. Been threatened by someone with a weapon on school property?
Never Once 2 or 3 Times 4 or 5 Times 6 to 9 Times 10 Times or
More Spring 2012 90% 3% 3% 1% 0% 3% Spring 2011 85% 6% 3% 3% 1% 2% Spring 2010 84% 5% 4% 3% 0% 3% Spring 2009 88% 4% 3% 1% 1% 4%
Fall 2008 89% 4% 3% 1% 1% 2% Spring 2008 87% 4% 3% 1% 1% 3%
Fall 2007 89% 4% 3% 1% 1% 1% Spring 2007 90% 5% 2% 1% 0% 2%
Fall 2006 92% 4% 2% 1% 0% 1% 154. Been attacked by someone with a weapon on school property?
Never Once 2 or 3 Times 4 or 5 Times 6 to 9 Times 10 Times or
More Spring 2012 91% 3% 2% 1% 1% 2% Spring 2011 87% 4% 2% 3% 1% 3% Spring 2010 87% 4% 3% 2% 0% 4% Spring 2009 88% 4% 2% 1% 1% 4%
Fall 2008 92% 3% 2% 1% 0% 2% Spring 2008 91% 1% 3% 1% 1% 2%
Fall 2007 92% 3% 1% 2% 1% 1% Spring 2007 94% 1% 0% 2% 0% 2%
Fall 2006 95% 2% 1% 0% 1% 1%
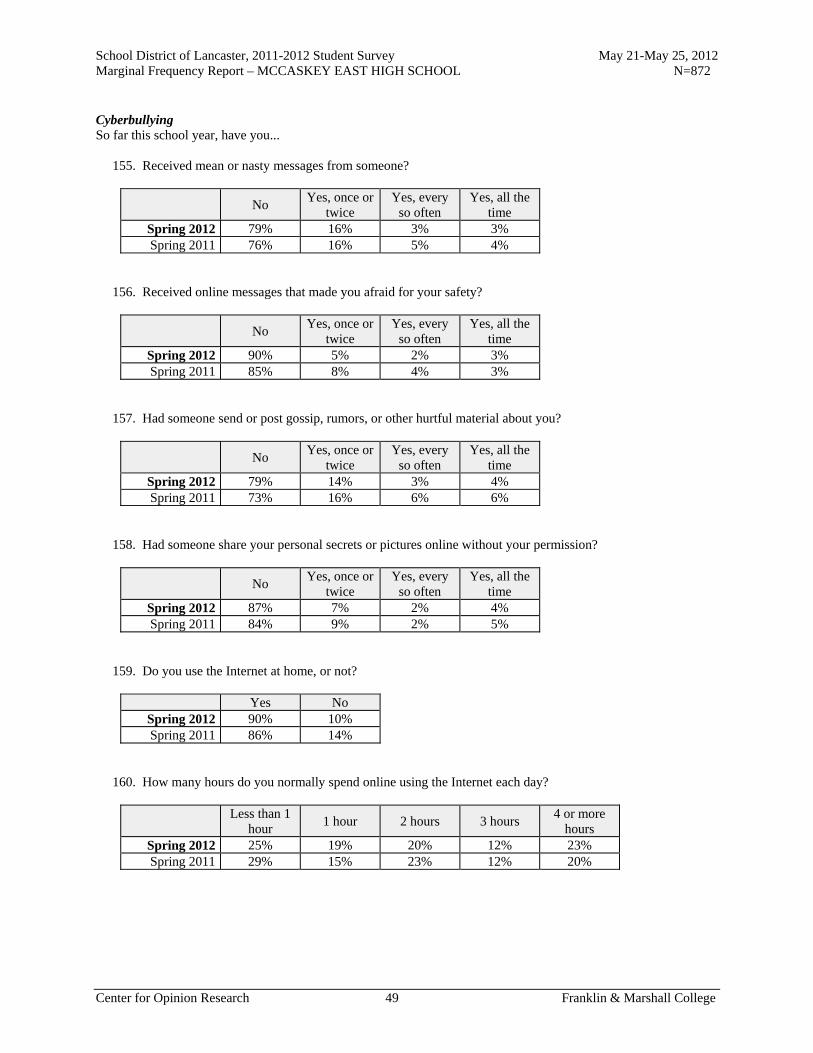
School District of Lancaster, 2011-2012 Student Survey May 21-May 25, 2012 Marginal Frequency Report – MCCASKEY EAST HIGH SCHOOL N=872
Center for Opinion Research 49 Franklin & Marshall College
Cyberbullying So far this school year, have you... 155. Received mean or nasty messages from someone?
No Yes, once or
twice Yes, every
so often Yes, all the
time Spring 2012 79% 16% 3% 3% Spring 2011 76% 16% 5% 4%
156. Received online messages that made you afraid for your safety?
No Yes, once or
twice Yes, every
so often Yes, all the
time Spring 2012 90% 5% 2% 3% Spring 2011 85% 8% 4% 3%
157. Had someone send or post gossip, rumors, or other hurtful material about you?
No Yes, once or
twice Yes, every
so often Yes, all the
time Spring 2012 79% 14% 3% 4% Spring 2011 73% 16% 6% 6%
158. Had someone share your personal secrets or pictures online without your permission?
No Yes, once or
twice Yes, every
so often Yes, all the
time Spring 2012 87% 7% 2% 4% Spring 2011 84% 9% 2% 5%
159. Do you use the Internet at home, or not?
Yes No Spring 2012 90% 10% Spring 2011 86% 14%
160. How many hours do you normally spend online using the Internet each day?
Less than 1
hour 1 hour 2 hours 3 hours
4 or more hours
Spring 2012 25% 19% 20% 12% 23% Spring 2011 29% 15% 23% 12% 20%
Report X
Marginal Frequency Report Buehrle Alternative High School
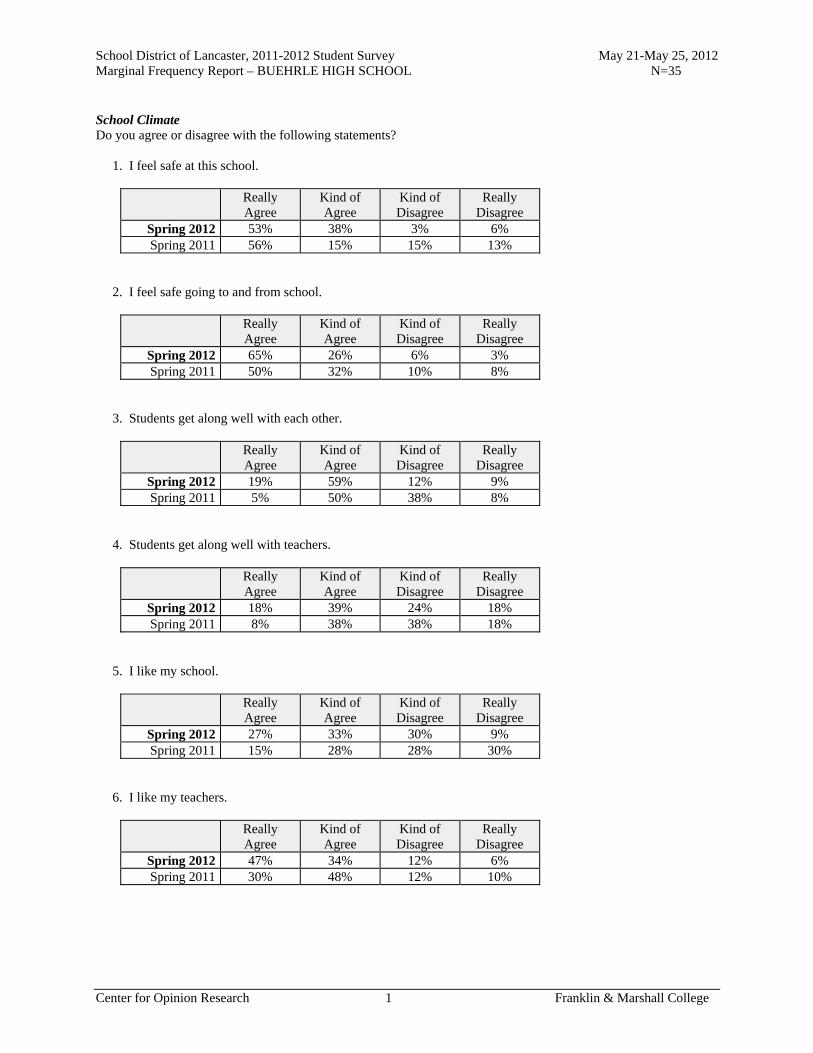
School District of Lancaster, 2011-2012 Student Survey May 21-May 25, 2012 Marginal Frequency Report – BUEHRLE HIGH SCHOOL N=35
Center for Opinion Research 1 Franklin & Marshall College
School Climate Do you agree or disagree with the following statements? 1. I feel safe at this school.
Really Agree
Kind of Agree
Kind of Disagree
Really Disagree
Spring 2012 53% 38% 3% 6% Spring 2011 56% 15% 15% 13%
2. I feel safe going to and from school.
Really Agree
Kind of Agree
Kind of Disagree
Really Disagree
Spring 2012 65% 26% 6% 3% Spring 2011 50% 32% 10% 8%
3. Students get along well with each other.
Really Agree
Kind of Agree
Kind of Disagree
Really Disagree
Spring 2012 19% 59% 12% 9% Spring 2011 5% 50% 38% 8%
4. Students get along well with teachers.
Really Agree
Kind of Agree
Kind of Disagree
Really Disagree
Spring 2012 18% 39% 24% 18% Spring 2011 8% 38% 38% 18%
5. I like my school.
Really Agree
Kind of Agree
Kind of Disagree
Really Disagree
Spring 2012 27% 33% 30% 9% Spring 2011 15% 28% 28% 30%
6. I like my teachers.
Really Agree
Kind of Agree
Kind of Disagree
Really Disagree
Spring 2012 47% 34% 12% 6% Spring 2011 30% 48% 12% 10%
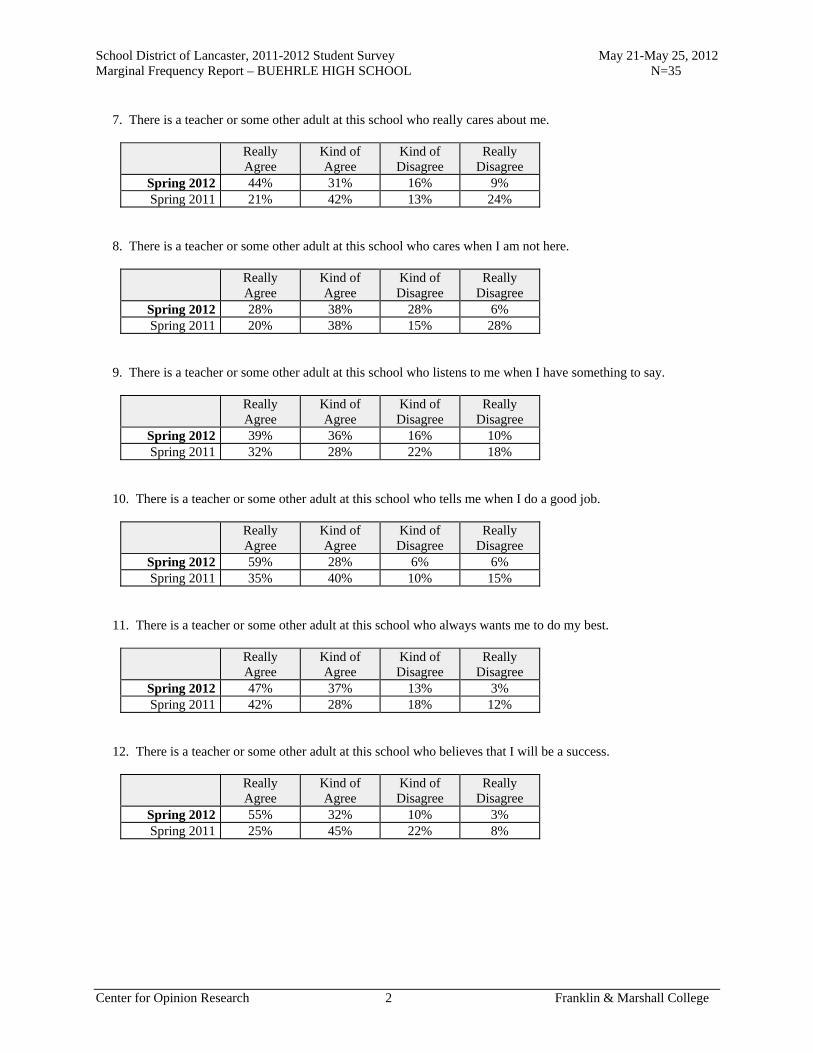
School District of Lancaster, 2011-2012 Student Survey May 21-May 25, 2012 Marginal Frequency Report – BUEHRLE HIGH SCHOOL N=35
Center for Opinion Research 2 Franklin & Marshall College
7. There is a teacher or some other adult at this school who really cares about me.
Really Agree
Kind of Agree
Kind of Disagree
Really Disagree
Spring 2012 44% 31% 16% 9% Spring 2011 21% 42% 13% 24%
8. There is a teacher or some other adult at this school who cares when I am not here.
Really Agree
Kind of Agree
Kind of Disagree
Really Disagree
Spring 2012 28% 38% 28% 6% Spring 2011 20% 38% 15% 28%
9. There is a teacher or some other adult at this school who listens to me when I have something to say.
Really Agree
Kind of Agree
Kind of Disagree
Really Disagree
Spring 2012 39% 36% 16% 10% Spring 2011 32% 28% 22% 18%
10. There is a teacher or some other adult at this school who tells me when I do a good job.
Really Agree
Kind of Agree
Kind of Disagree
Really Disagree
Spring 2012 59% 28% 6% 6% Spring 2011 35% 40% 10% 15%
11. There is a teacher or some other adult at this school who always wants me to do my best.
Really Agree
Kind of Agree
Kind of Disagree
Really Disagree
Spring 2012 47% 37% 13% 3% Spring 2011 42% 28% 18% 12%
12. There is a teacher or some other adult at this school who believes that I will be a success.
Really Agree
Kind of Agree
Kind of Disagree
Really Disagree
Spring 2012 55% 32% 10% 3% Spring 2011 25% 45% 22% 8%
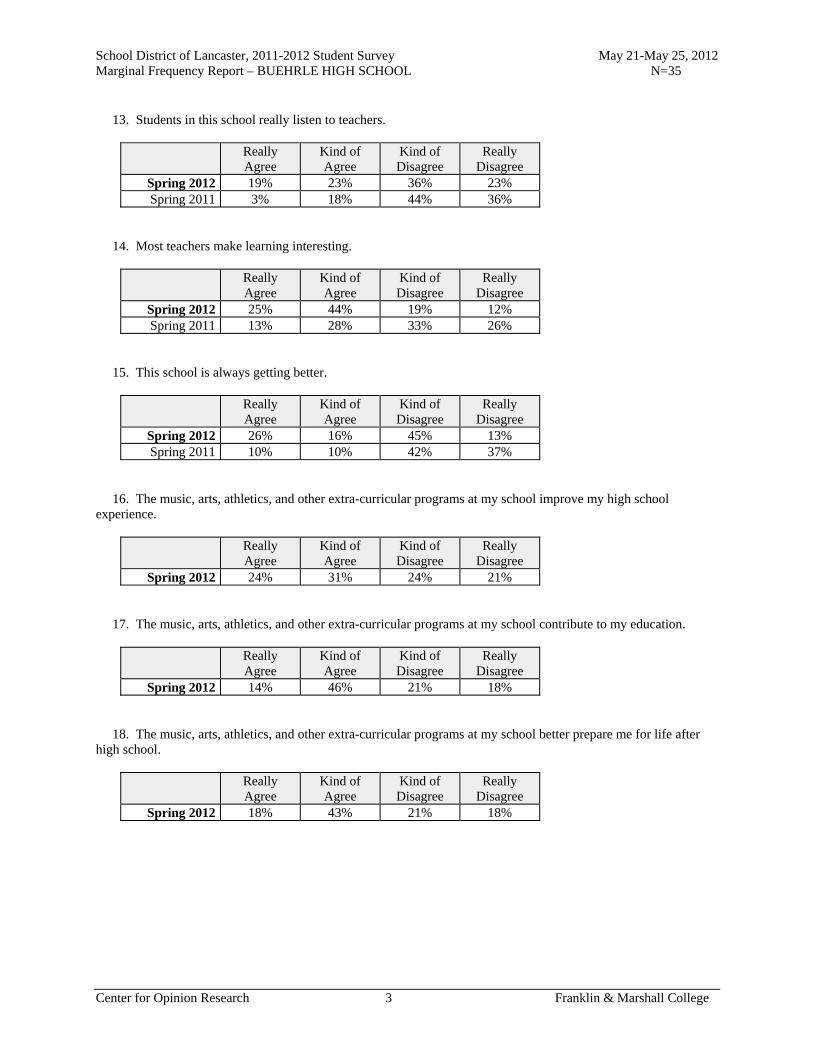
School District of Lancaster, 2011-2012 Student Survey May 21-May 25, 2012 Marginal Frequency Report – BUEHRLE HIGH SCHOOL N=35
Center for Opinion Research 3 Franklin & Marshall College
13. Students in this school really listen to teachers.
Really Agree
Kind of Agree
Kind of Disagree
Really Disagree
Spring 2012 19% 23% 36% 23% Spring 2011 3% 18% 44% 36%
14. Most teachers make learning interesting.
Really Agree
Kind of Agree
Kind of Disagree
Really Disagree
Spring 2012 25% 44% 19% 12% Spring 2011 13% 28% 33% 26%
15. This school is always getting better.
Really Agree
Kind of Agree
Kind of Disagree
Really Disagree
Spring 2012 26% 16% 45% 13% Spring 2011 10% 10% 42% 37%
16. The music, arts, athletics, and other extra-curricular programs at my school improve my high school experience.
Really Agree
Kind of Agree
Kind of Disagree
Really Disagree
Spring 2012 24% 31% 24% 21% 17. The music, arts, athletics, and other extra-curricular programs at my school contribute to my education.
Really Agree
Kind of Agree
Kind of Disagree
Really Disagree
Spring 2012 14% 46% 21% 18% 18. The music, arts, athletics, and other extra-curricular programs at my school better prepare me for life after high school.
Really Agree
Kind of Agree
Kind of Disagree
Really Disagree
Spring 2012 18% 43% 21% 18%
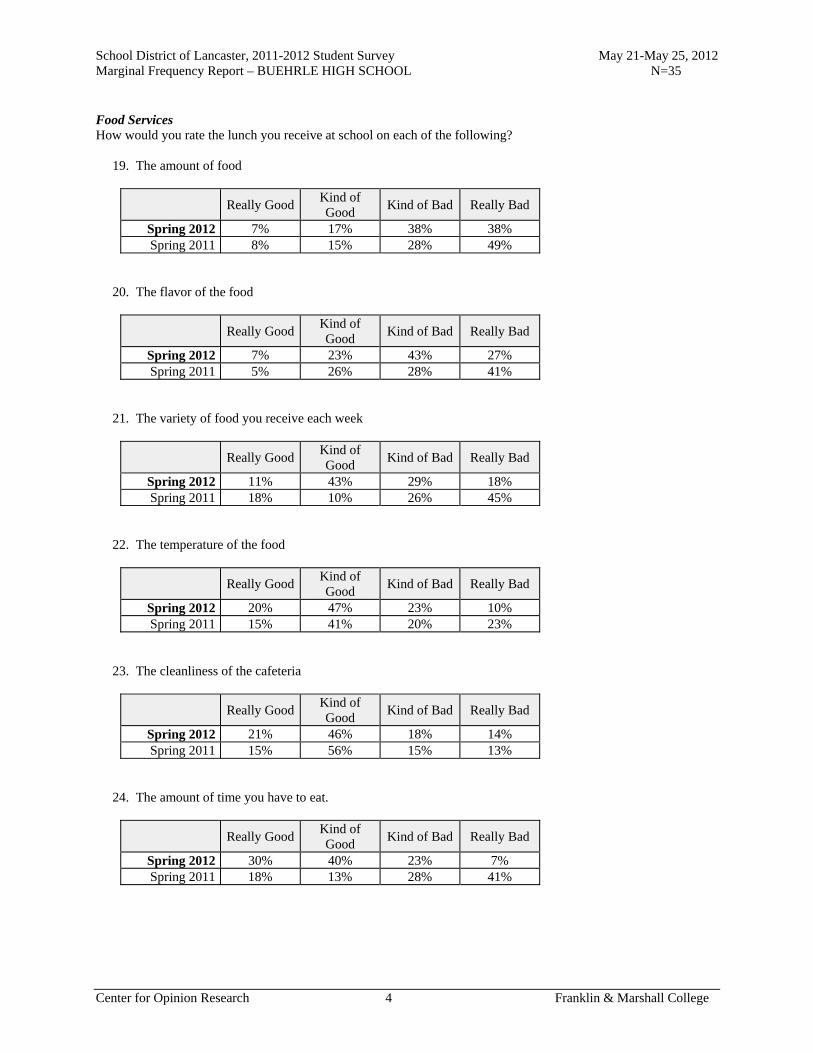
School District of Lancaster, 2011-2012 Student Survey May 21-May 25, 2012 Marginal Frequency Report – BUEHRLE HIGH SCHOOL N=35
Center for Opinion Research 4 Franklin & Marshall College
Food Services How would you rate the lunch you receive at school on each of the following? 19. The amount of food
Really Good Kind of Good
Kind of Bad Really Bad
Spring 2012 7% 17% 38% 38% Spring 2011 8% 15% 28% 49%
20. The flavor of the food
Really Good Kind of Good
Kind of Bad Really Bad
Spring 2012 7% 23% 43% 27% Spring 2011 5% 26% 28% 41%
21. The variety of food you receive each week
Really Good Kind of Good
Kind of Bad Really Bad
Spring 2012 11% 43% 29% 18% Spring 2011 18% 10% 26% 45%
22. The temperature of the food
Really Good Kind of Good
Kind of Bad Really Bad
Spring 2012 20% 47% 23% 10% Spring 2011 15% 41% 20% 23%
23. The cleanliness of the cafeteria
Really Good Kind of Good
Kind of Bad Really Bad
Spring 2012 21% 46% 18% 14% Spring 2011 15% 56% 15% 13%
24. The amount of time you have to eat.
Really Good Kind of Good
Kind of Bad Really Bad
Spring 2012 30% 40% 23% 7% Spring 2011 18% 13% 28% 41%
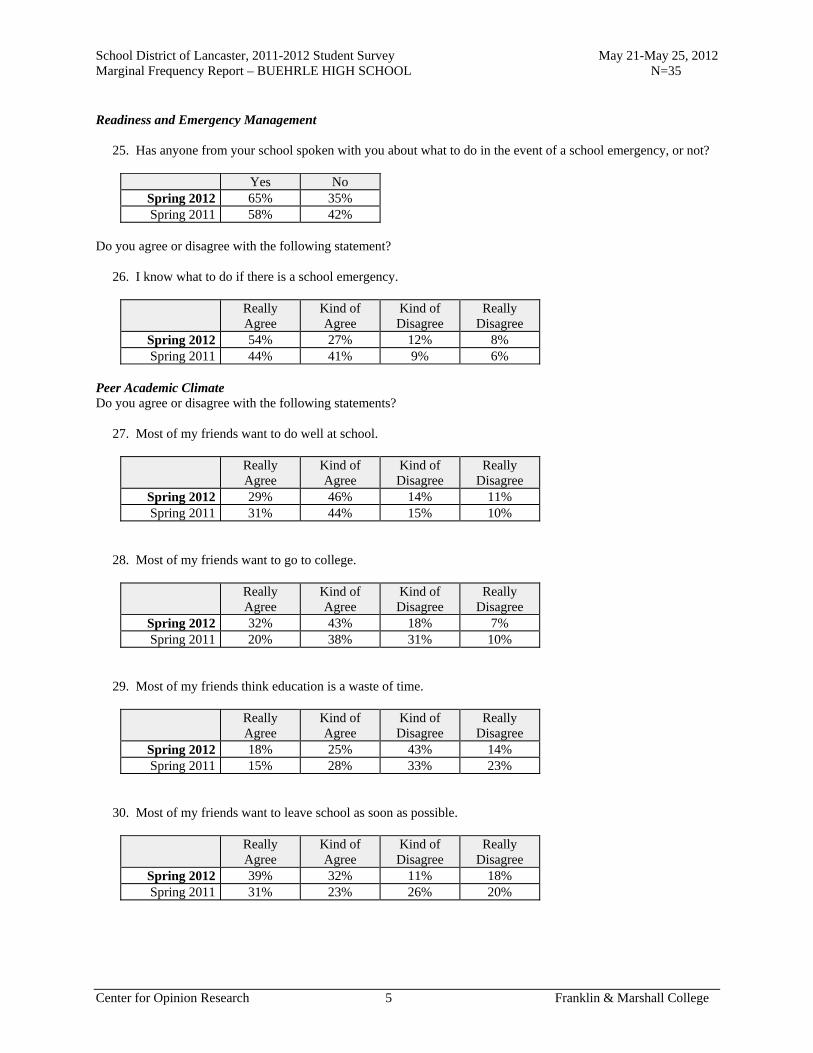
School District of Lancaster, 2011-2012 Student Survey May 21-May 25, 2012 Marginal Frequency Report – BUEHRLE HIGH SCHOOL N=35
Center for Opinion Research 5 Franklin & Marshall College
Readiness and Emergency Management 25. Has anyone from your school spoken with you about what to do in the event of a school emergency, or not?
Yes No Spring 2012 65% 35% Spring 2011 58% 42%
Do you agree or disagree with the following statement? 26. I know what to do if there is a school emergency.
Really Agree
Kind of Agree
Kind of Disagree
Really Disagree
Spring 2012 54% 27% 12% 8% Spring 2011 44% 41% 9% 6%
Peer Academic Climate Do you agree or disagree with the following statements? 27. Most of my friends want to do well at school.
Really Agree
Kind of Agree
Kind of Disagree
Really Disagree
Spring 2012 29% 46% 14% 11% Spring 2011 31% 44% 15% 10%
28. Most of my friends want to go to college.
Really Agree
Kind of Agree
Kind of Disagree
Really Disagree
Spring 2012 32% 43% 18% 7% Spring 2011 20% 38% 31% 10%
29. Most of my friends think education is a waste of time.
Really Agree
Kind of Agree
Kind of Disagree
Really Disagree
Spring 2012 18% 25% 43% 14% Spring 2011 15% 28% 33% 23%
30. Most of my friends want to leave school as soon as possible.
Really Agree
Kind of Agree
Kind of Disagree
Really Disagree
Spring 2012 39% 32% 11% 18% Spring 2011 31% 23% 26% 20%
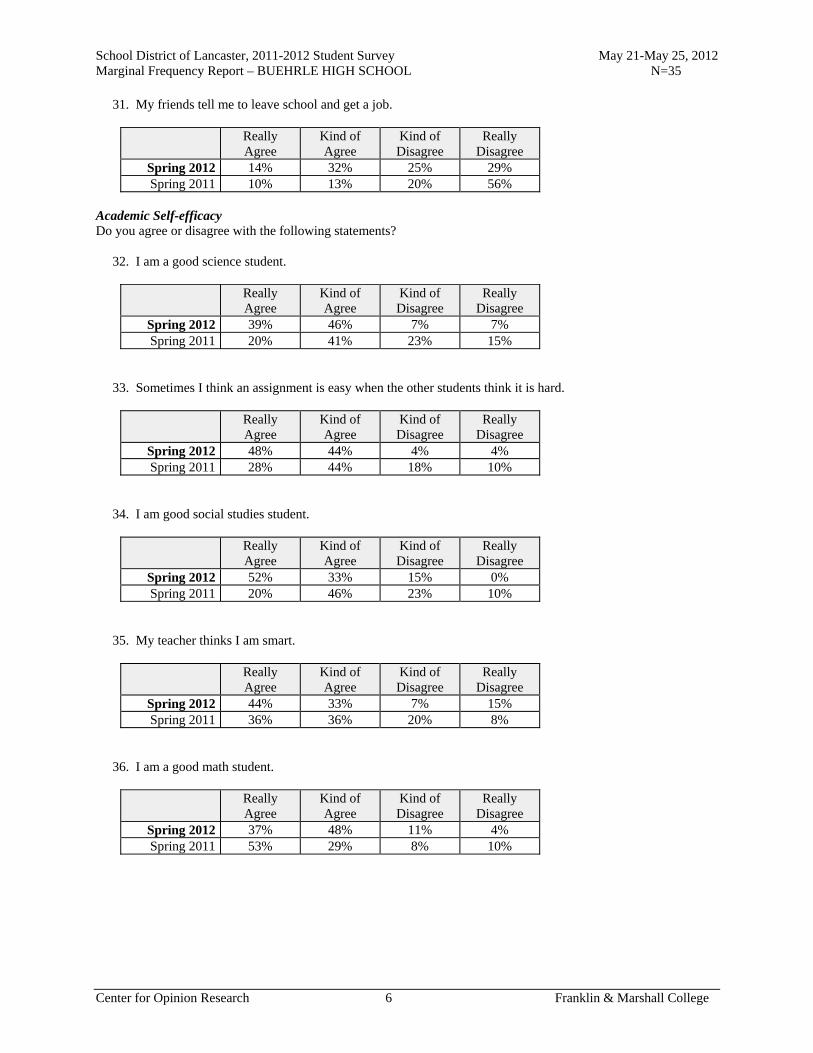
School District of Lancaster, 2011-2012 Student Survey May 21-May 25, 2012 Marginal Frequency Report – BUEHRLE HIGH SCHOOL N=35
Center for Opinion Research 6 Franklin & Marshall College
31. My friends tell me to leave school and get a job.
Really Agree
Kind of Agree
Kind of Disagree
Really Disagree
Spring 2012 14% 32% 25% 29% Spring 2011 10% 13% 20% 56%
Academic Self-efficacy Do you agree or disagree with the following statements? 32. I am a good science student.
Really Agree
Kind of Agree
Kind of Disagree
Really Disagree
Spring 2012 39% 46% 7% 7% Spring 2011 20% 41% 23% 15%
33. Sometimes I think an assignment is easy when the other students think it is hard.
Really Agree
Kind of Agree
Kind of Disagree
Really Disagree
Spring 2012 48% 44% 4% 4% Spring 2011 28% 44% 18% 10%
34. I am good social studies student.
Really Agree
Kind of Agree
Kind of Disagree
Really Disagree
Spring 2012 52% 33% 15% 0% Spring 2011 20% 46% 23% 10%
35. My teacher thinks I am smart.
Really Agree
Kind of Agree
Kind of Disagree
Really Disagree
Spring 2012 44% 33% 7% 15% Spring 2011 36% 36% 20% 8%
36. I am a good math student.
Really Agree
Kind of Agree
Kind of Disagree
Really Disagree
Spring 2012 37% 48% 11% 4% Spring 2011 53% 29% 8% 10%
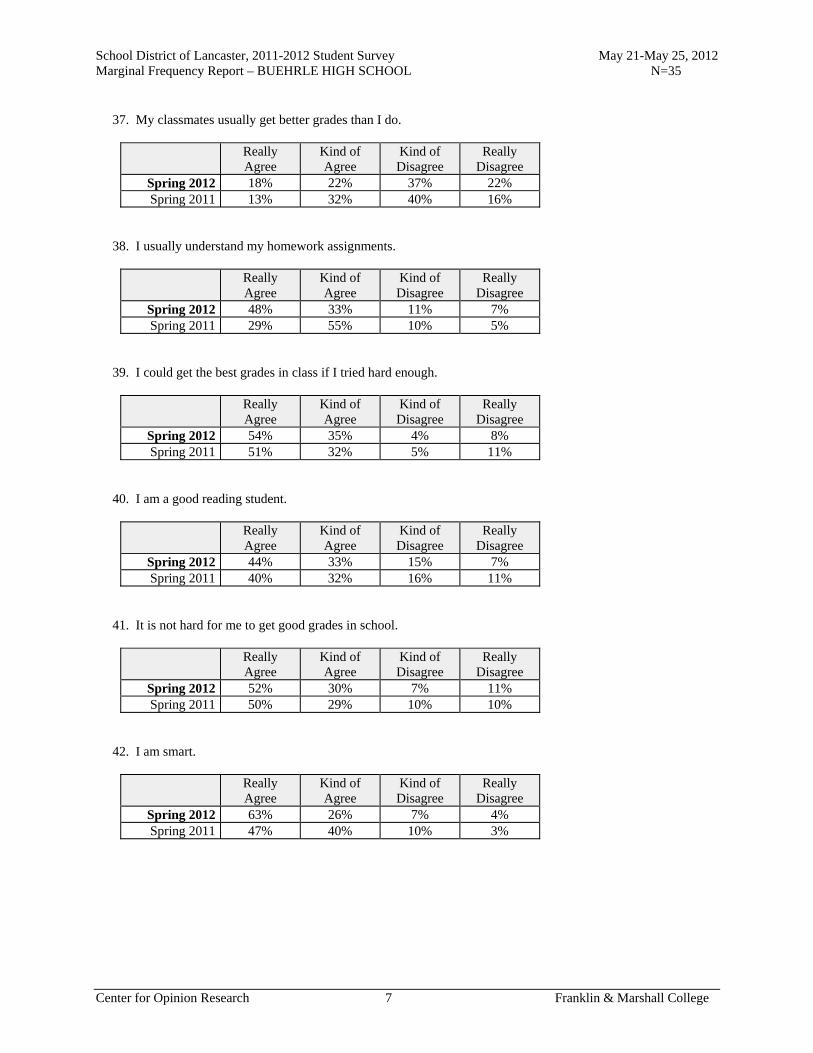
School District of Lancaster, 2011-2012 Student Survey May 21-May 25, 2012 Marginal Frequency Report – BUEHRLE HIGH SCHOOL N=35
Center for Opinion Research 7 Franklin & Marshall College
37. My classmates usually get better grades than I do.
Really Agree
Kind of Agree
Kind of Disagree
Really Disagree
Spring 2012 18% 22% 37% 22% Spring 2011 13% 32% 40% 16%
38. I usually understand my homework assignments.
Really Agree
Kind of Agree
Kind of Disagree
Really Disagree
Spring 2012 48% 33% 11% 7% Spring 2011 29% 55% 10% 5%
39. I could get the best grades in class if I tried hard enough.
Really Agree
Kind of Agree
Kind of Disagree
Really Disagree
Spring 2012 54% 35% 4% 8% Spring 2011 51% 32% 5% 11%
40. I am a good reading student.
Really Agree
Kind of Agree
Kind of Disagree
Really Disagree
Spring 2012 44% 33% 15% 7% Spring 2011 40% 32% 16% 11%
41. It is not hard for me to get good grades in school.
Really Agree
Kind of Agree
Kind of Disagree
Really Disagree
Spring 2012 52% 30% 7% 11% Spring 2011 50% 29% 10% 10%
42. I am smart.
Really Agree
Kind of Agree
Kind of Disagree
Really Disagree
Spring 2012 63% 26% 7% 4% Spring 2011 47% 40% 10% 3%
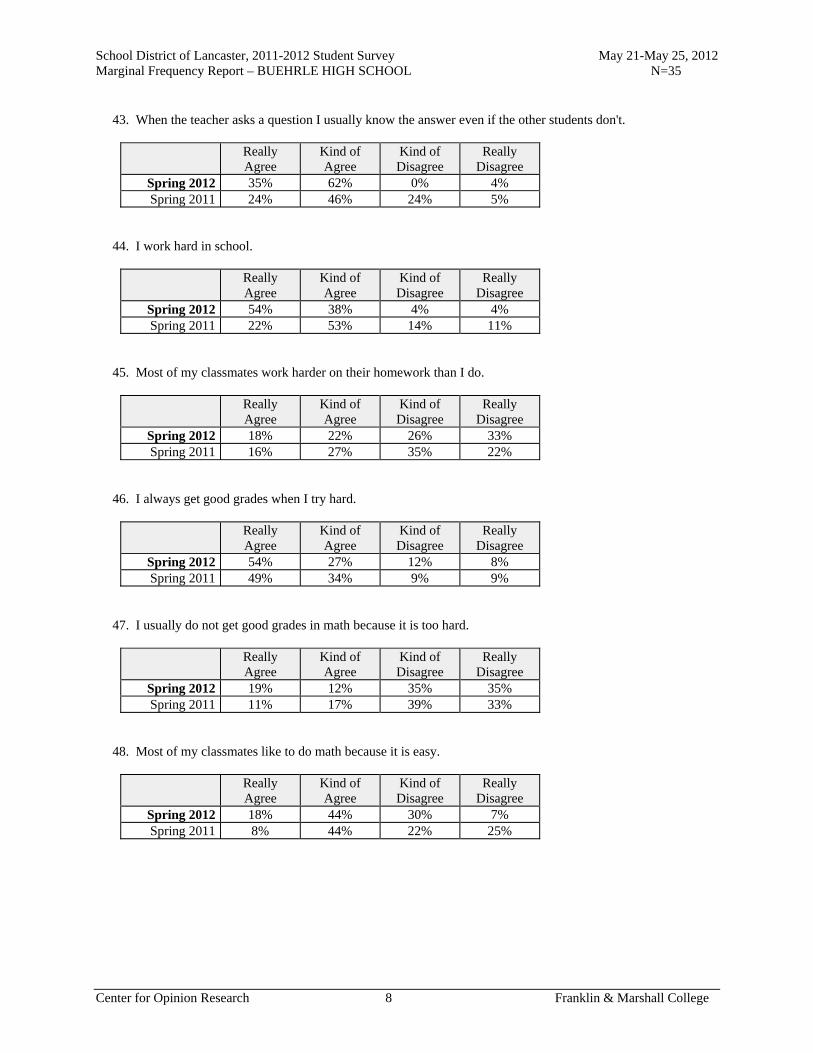
School District of Lancaster, 2011-2012 Student Survey May 21-May 25, 2012 Marginal Frequency Report – BUEHRLE HIGH SCHOOL N=35
Center for Opinion Research 8 Franklin & Marshall College
43. When the teacher asks a question I usually know the answer even if the other students don't.
Really Agree
Kind of Agree
Kind of Disagree
Really Disagree
Spring 2012 35% 62% 0% 4% Spring 2011 24% 46% 24% 5%
44. I work hard in school.
Really Agree
Kind of Agree
Kind of Disagree
Really Disagree
Spring 2012 54% 38% 4% 4% Spring 2011 22% 53% 14% 11%
45. Most of my classmates work harder on their homework than I do.
Really Agree
Kind of Agree
Kind of Disagree
Really Disagree
Spring 2012 18% 22% 26% 33% Spring 2011 16% 27% 35% 22%
46. I always get good grades when I try hard.
Really Agree
Kind of Agree
Kind of Disagree
Really Disagree
Spring 2012 54% 27% 12% 8% Spring 2011 49% 34% 9% 9%
47. I usually do not get good grades in math because it is too hard.
Really Agree
Kind of Agree
Kind of Disagree
Really Disagree
Spring 2012 19% 12% 35% 35% Spring 2011 11% 17% 39% 33%
48. Most of my classmates like to do math because it is easy.
Really Agree
Kind of Agree
Kind of Disagree
Really Disagree
Spring 2012 18% 44% 30% 7% Spring 2011 8% 44% 22% 25%
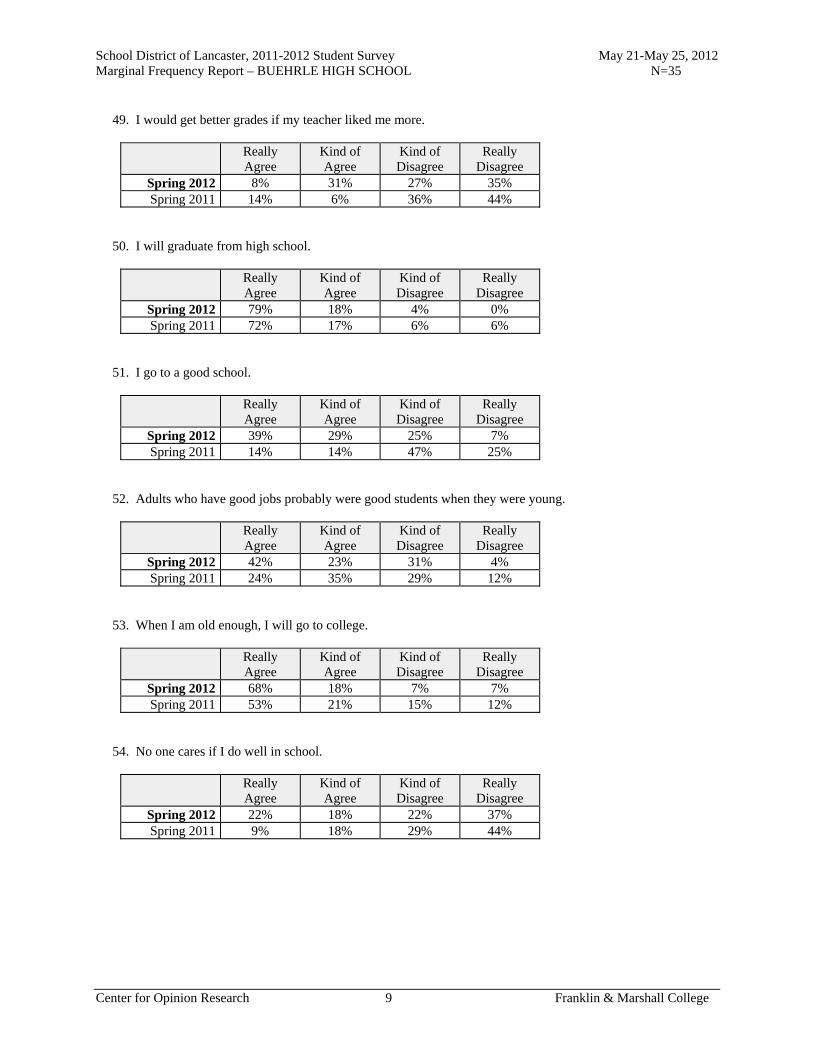
School District of Lancaster, 2011-2012 Student Survey May 21-May 25, 2012 Marginal Frequency Report – BUEHRLE HIGH SCHOOL N=35
Center for Opinion Research 9 Franklin & Marshall College
49. I would get better grades if my teacher liked me more.
Really Agree
Kind of Agree
Kind of Disagree
Really Disagree
Spring 2012 8% 31% 27% 35% Spring 2011 14% 6% 36% 44%
50. I will graduate from high school.
Really Agree
Kind of Agree
Kind of Disagree
Really Disagree
Spring 2012 79% 18% 4% 0% Spring 2011 72% 17% 6% 6%
51. I go to a good school.
Really Agree
Kind of Agree
Kind of Disagree
Really Disagree
Spring 2012 39% 29% 25% 7% Spring 2011 14% 14% 47% 25%
52. Adults who have good jobs probably were good students when they were young.
Really Agree
Kind of Agree
Kind of Disagree
Really Disagree
Spring 2012 42% 23% 31% 4% Spring 2011 24% 35% 29% 12%
53. When I am old enough, I will go to college.
Really Agree
Kind of Agree
Kind of Disagree
Really Disagree
Spring 2012 68% 18% 7% 7% Spring 2011 53% 21% 15% 12%
54. No one cares if I do well in school.
Really Agree
Kind of Agree
Kind of Disagree
Really Disagree
Spring 2012 22% 18% 22% 37% Spring 2011 9% 18% 29% 44%
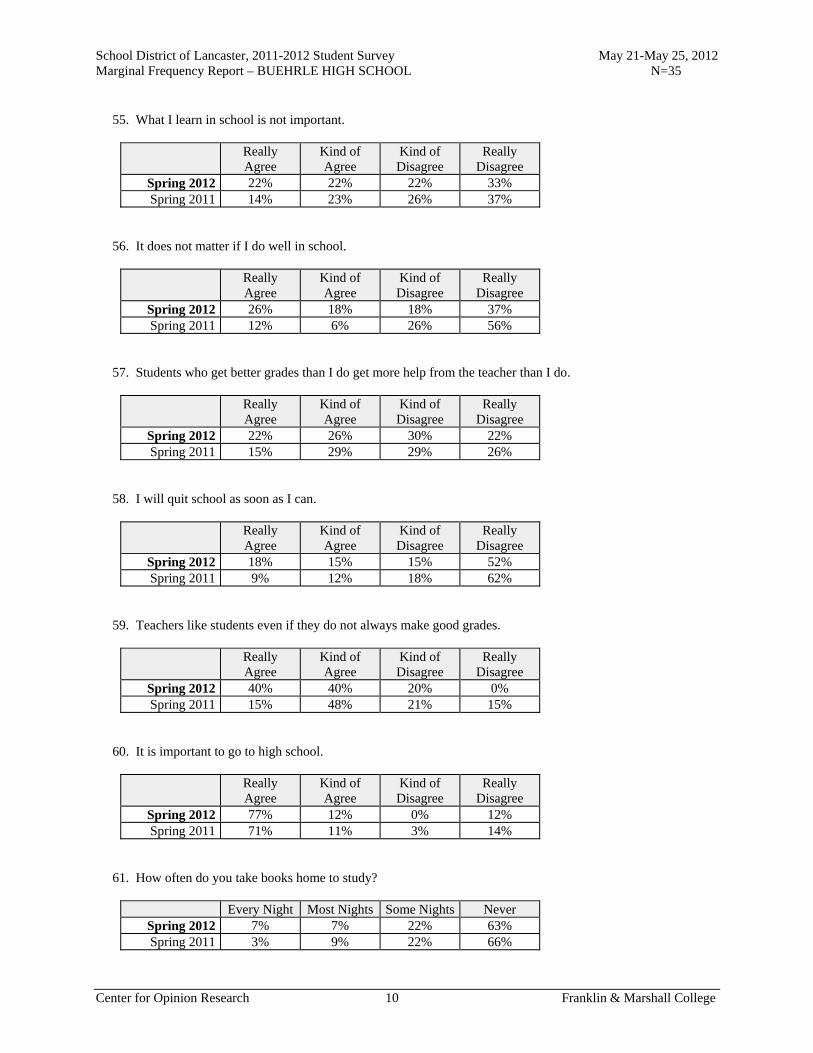
School District of Lancaster, 2011-2012 Student Survey May 21-May 25, 2012 Marginal Frequency Report – BUEHRLE HIGH SCHOOL N=35
Center for Opinion Research 10 Franklin & Marshall College
55. What I learn in school is not important.
Really Agree
Kind of Agree
Kind of Disagree
Really Disagree
Spring 2012 22% 22% 22% 33% Spring 2011 14% 23% 26% 37%
56. It does not matter if I do well in school.
Really Agree
Kind of Agree
Kind of Disagree
Really Disagree
Spring 2012 26% 18% 18% 37% Spring 2011 12% 6% 26% 56%
57. Students who get better grades than I do get more help from the teacher than I do.
Really Agree
Kind of Agree
Kind of Disagree
Really Disagree
Spring 2012 22% 26% 30% 22% Spring 2011 15% 29% 29% 26%
58. I will quit school as soon as I can.
Really Agree
Kind of Agree
Kind of Disagree
Really Disagree
Spring 2012 18% 15% 15% 52% Spring 2011 9% 12% 18% 62%
59. Teachers like students even if they do not always make good grades.
Really Agree
Kind of Agree
Kind of Disagree
Really Disagree
Spring 2012 40% 40% 20% 0% Spring 2011 15% 48% 21% 15%
60. It is important to go to high school.
Really Agree
Kind of Agree
Kind of Disagree
Really Disagree
Spring 2012 77% 12% 0% 12% Spring 2011 71% 11% 3% 14%
61. How often do you take books home to study?
Every Night Most Nights Some Nights Never Spring 2012 7% 7% 22% 63% Spring 2011 3% 9% 22% 66%
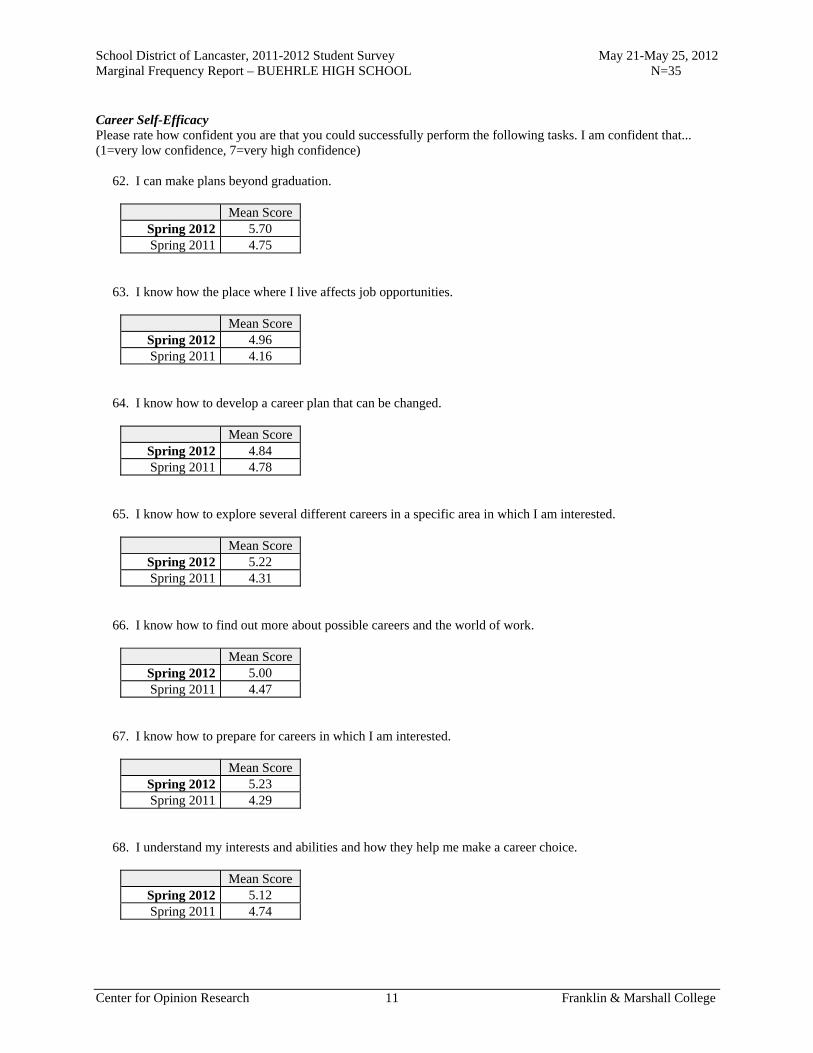
School District of Lancaster, 2011-2012 Student Survey May 21-May 25, 2012 Marginal Frequency Report – BUEHRLE HIGH SCHOOL N=35
Center for Opinion Research 11 Franklin & Marshall College
Career Self-Efficacy Please rate how confident you are that you could successfully perform the following tasks. I am confident that... (1=very low confidence, 7=very high confidence) 62. I can make plans beyond graduation.
Mean Score Spring 2012 5.70 Spring 2011 4.75
63. I know how the place where I live affects job opportunities.
Mean Score Spring 2012 4.96 Spring 2011 4.16
64. I know how to develop a career plan that can be changed.
Mean Score Spring 2012 4.84 Spring 2011 4.78
65. I know how to explore several different careers in a specific area in which I am interested.
Mean Score Spring 2012 5.22 Spring 2011 4.31
66. I know how to find out more about possible careers and the world of work.
Mean Score Spring 2012 5.00 Spring 2011 4.47
67. I know how to prepare for careers in which I am interested.
Mean Score Spring 2012 5.23 Spring 2011 4.29
68. I understand my interests and abilities and how they help me make a career choice.
Mean Score Spring 2012 5.12 Spring 2011 4.74
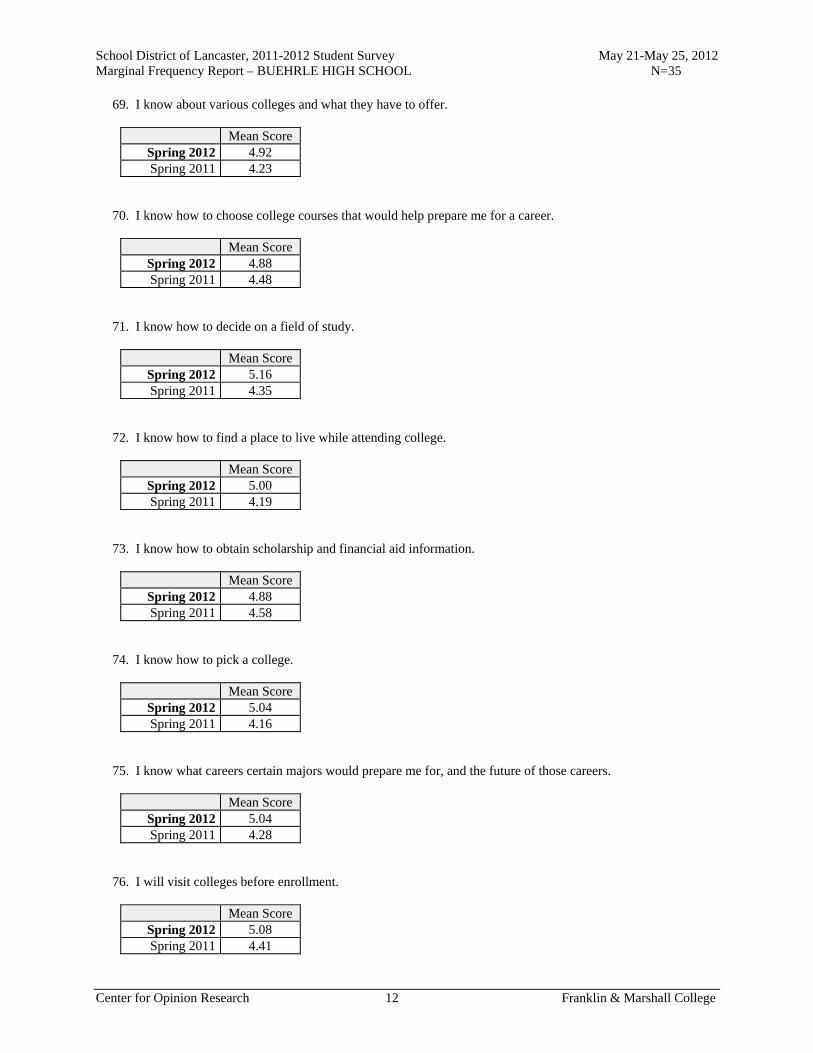
School District of Lancaster, 2011-2012 Student Survey May 21-May 25, 2012 Marginal Frequency Report – BUEHRLE HIGH SCHOOL N=35
Center for Opinion Research 12 Franklin & Marshall College
69. I know about various colleges and what they have to offer.
Mean Score Spring 2012 4.92 Spring 2011 4.23
70. I know how to choose college courses that would help prepare me for a career.
Mean Score Spring 2012 4.88 Spring 2011 4.48
71. I know how to decide on a field of study.
Mean Score Spring 2012 5.16 Spring 2011 4.35
72. I know how to find a place to live while attending college.
Mean Score Spring 2012 5.00 Spring 2011 4.19
73. I know how to obtain scholarship and financial aid information.
Mean Score Spring 2012 4.88 Spring 2011 4.58
74. I know how to pick a college.
Mean Score Spring 2012 5.04 Spring 2011 4.16
75. I know what careers certain majors would prepare me for, and the future of those careers.
Mean Score Spring 2012 5.04 Spring 2011 4.28
76. I will visit colleges before enrollment.
Mean Score Spring 2012 5.08 Spring 2011 4.41
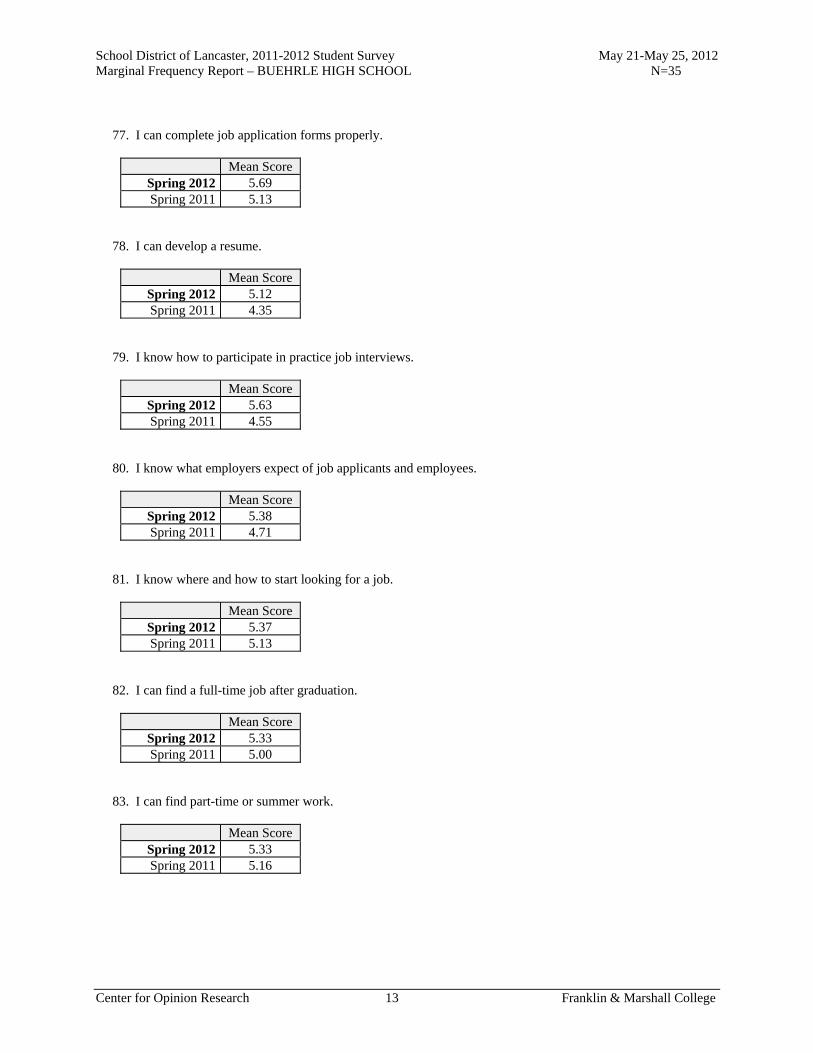
School District of Lancaster, 2011-2012 Student Survey May 21-May 25, 2012 Marginal Frequency Report – BUEHRLE HIGH SCHOOL N=35
Center for Opinion Research 13 Franklin & Marshall College
77. I can complete job application forms properly.
Mean Score Spring 2012 5.69 Spring 2011 5.13
78. I can develop a resume.
Mean Score Spring 2012 5.12 Spring 2011 4.35
79. I know how to participate in practice job interviews.
Mean Score Spring 2012 5.63 Spring 2011 4.55
80. I know what employers expect of job applicants and employees.
Mean Score Spring 2012 5.38 Spring 2011 4.71
81. I know where and how to start looking for a job.
Mean Score Spring 2012 5.37 Spring 2011 5.13
82. I can find a full-time job after graduation.
Mean Score Spring 2012 5.33 Spring 2011 5.00
83. I can find part-time or summer work.
Mean Score Spring 2012 5.33 Spring 2011 5.16
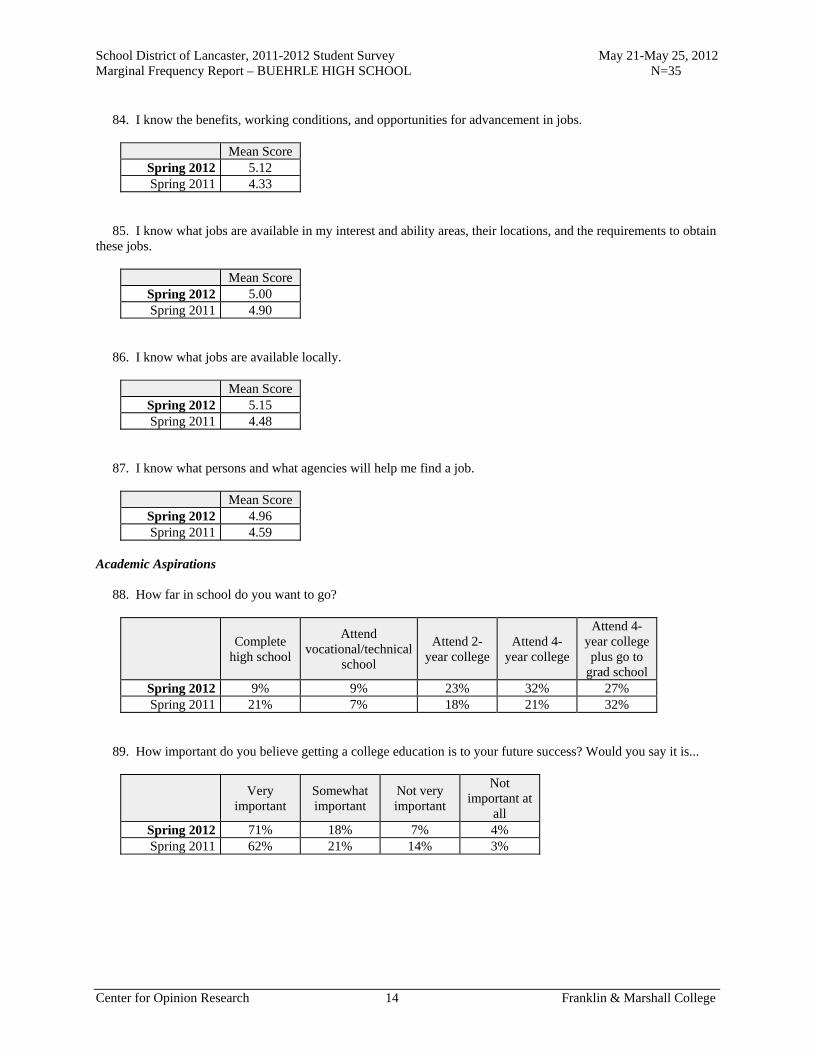
School District of Lancaster, 2011-2012 Student Survey May 21-May 25, 2012 Marginal Frequency Report – BUEHRLE HIGH SCHOOL N=35
Center for Opinion Research 14 Franklin & Marshall College
84. I know the benefits, working conditions, and opportunities for advancement in jobs.
Mean Score Spring 2012 5.12 Spring 2011 4.33
85. I know what jobs are available in my interest and ability areas, their locations, and the requirements to obtain these jobs.
Mean Score Spring 2012 5.00 Spring 2011 4.90
86. I know what jobs are available locally.
Mean Score Spring 2012 5.15 Spring 2011 4.48
87. I know what persons and what agencies will help me find a job.
Mean Score Spring 2012 4.96 Spring 2011 4.59
Academic Aspirations 88. How far in school do you want to go?
Complete
high school
Attend vocational/technical
school
Attend 2-year college
Attend 4-year college
Attend 4-year college plus go to
grad school Spring 2012 9% 9% 23% 32% 27% Spring 2011 21% 7% 18% 21% 32%
89. How important do you believe getting a college education is to your future success? Would you say it is...
Very
important Somewhat important
Not very important
Not important at
all Spring 2012 71% 18% 7% 4% Spring 2011 62% 21% 14% 3%
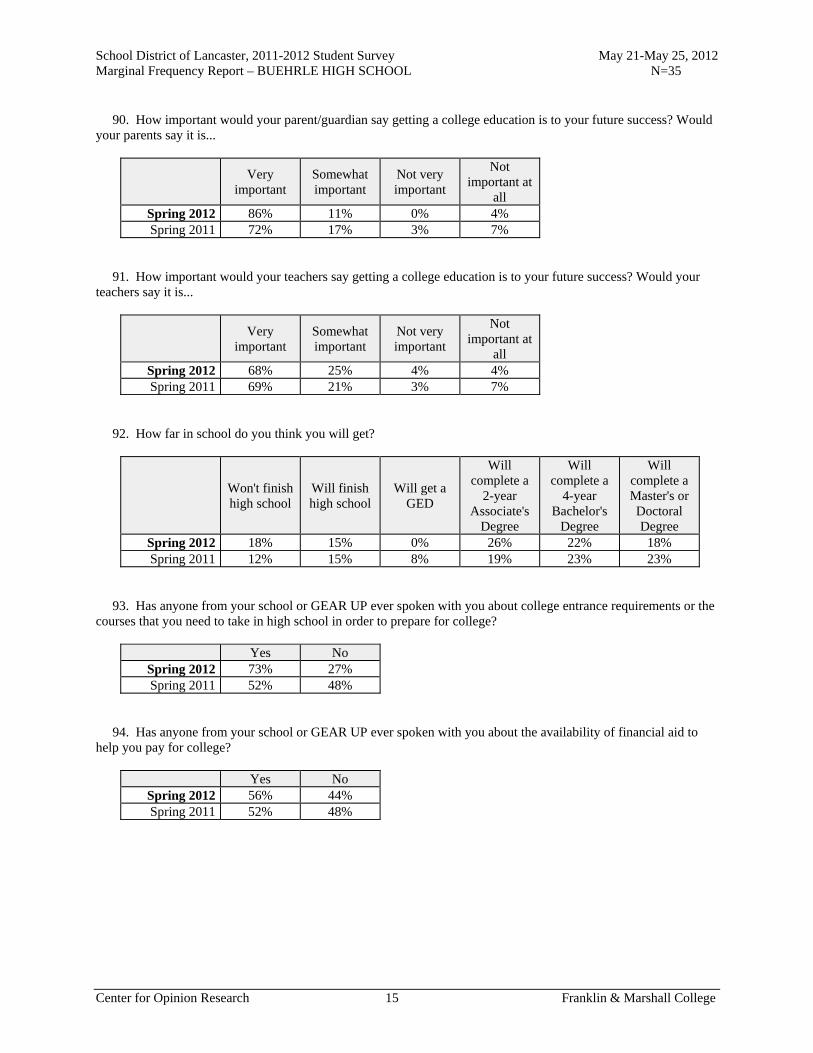
School District of Lancaster, 2011-2012 Student Survey May 21-May 25, 2012 Marginal Frequency Report – BUEHRLE HIGH SCHOOL N=35
Center for Opinion Research 15 Franklin & Marshall College
90. How important would your parent/guardian say getting a college education is to your future success? Would your parents say it is...
Very
important Somewhat important
Not very important
Not important at
all Spring 2012 86% 11% 0% 4% Spring 2011 72% 17% 3% 7%
91. How important would your teachers say getting a college education is to your future success? Would your teachers say it is...
Very
important Somewhat important
Not very important
Not important at
all Spring 2012 68% 25% 4% 4% Spring 2011 69% 21% 3% 7%
92. How far in school do you think you will get?
Won't finish high school
Will finish high school
Will get a GED
Will complete a
2-year Associate's
Degree
Will complete a
4-year Bachelor's
Degree
Will complete a Master's or Doctoral Degree
Spring 2012 18% 15% 0% 26% 22% 18% Spring 2011 12% 15% 8% 19% 23% 23%
93. Has anyone from your school or GEAR UP ever spoken with you about college entrance requirements or the courses that you need to take in high school in order to prepare for college?
Yes No Spring 2012 73% 27% Spring 2011 52% 48%
94. Has anyone from your school or GEAR UP ever spoken with you about the availability of financial aid to help you pay for college?
Yes No Spring 2012 56% 44% Spring 2011 52% 48%
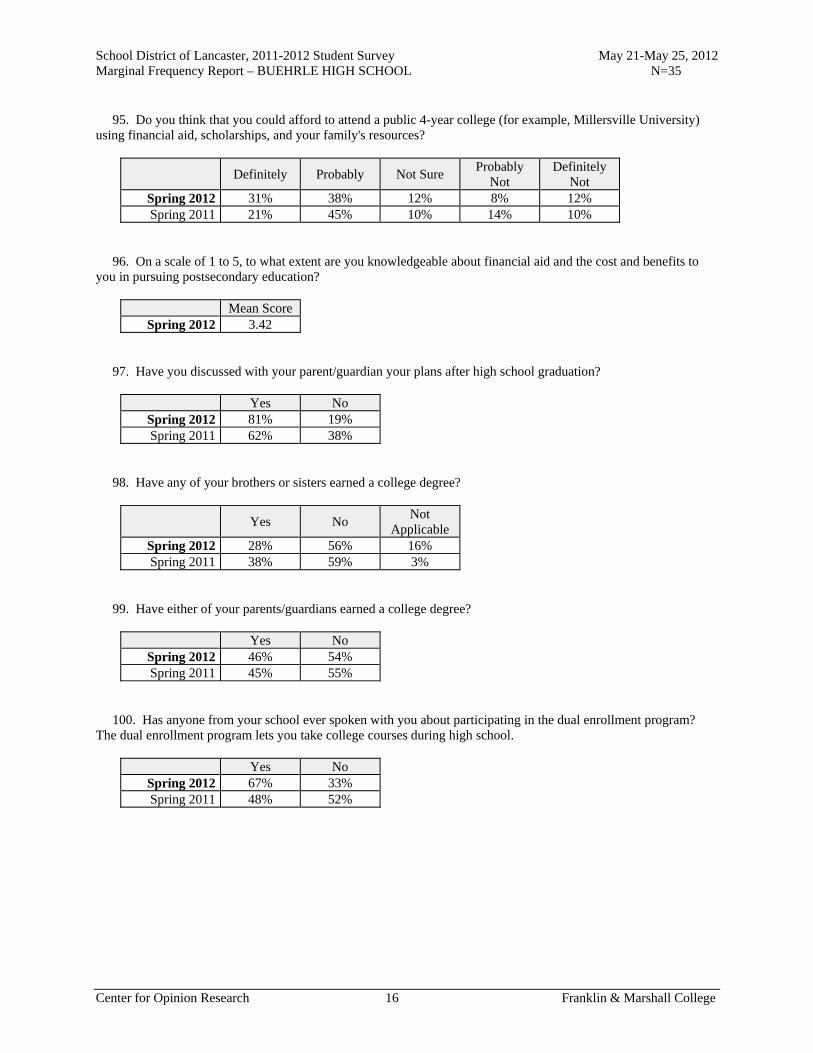
School District of Lancaster, 2011-2012 Student Survey May 21-May 25, 2012 Marginal Frequency Report – BUEHRLE HIGH SCHOOL N=35
Center for Opinion Research 16 Franklin & Marshall College
95. Do you think that you could afford to attend a public 4-year college (for example, Millersville University) using financial aid, scholarships, and your family's resources?
Definitely Probably Not Sure Probably
Not Definitely
Not Spring 2012 31% 38% 12% 8% 12% Spring 2011 21% 45% 10% 14% 10%
96. On a scale of 1 to 5, to what extent are you knowledgeable about financial aid and the cost and benefits to you in pursuing postsecondary education?
Mean Score Spring 2012 3.42
97. Have you discussed with your parent/guardian your plans after high school graduation?
Yes No Spring 2012 81% 19% Spring 2011 62% 38%
98. Have any of your brothers or sisters earned a college degree?
Yes No Not
Applicable Spring 2012 28% 56% 16% Spring 2011 38% 59% 3%
99. Have either of your parents/guardians earned a college degree?
Yes No Spring 2012 46% 54% Spring 2011 45% 55%
100. Has anyone from your school ever spoken with you about participating in the dual enrollment program? The dual enrollment program lets you take college courses during high school.
Yes No Spring 2012 67% 33% Spring 2011 48% 52%
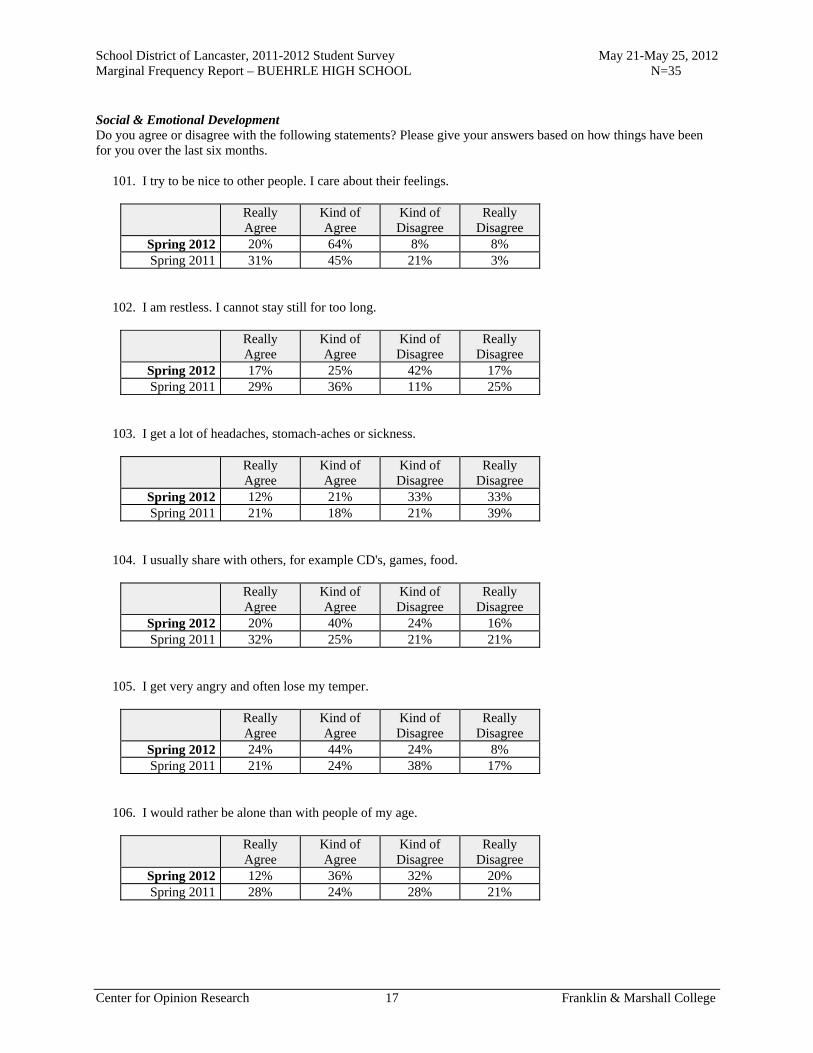
School District of Lancaster, 2011-2012 Student Survey May 21-May 25, 2012 Marginal Frequency Report – BUEHRLE HIGH SCHOOL N=35
Center for Opinion Research 17 Franklin & Marshall College
Social & Emotional Development Do you agree or disagree with the following statements? Please give your answers based on how things have been for you over the last six months. 101. I try to be nice to other people. I care about their feelings.
Really Agree
Kind of Agree
Kind of Disagree
Really Disagree
Spring 2012 20% 64% 8% 8% Spring 2011 31% 45% 21% 3%
102. I am restless. I cannot stay still for too long.
Really Agree
Kind of Agree
Kind of Disagree
Really Disagree
Spring 2012 17% 25% 42% 17% Spring 2011 29% 36% 11% 25%
103. I get a lot of headaches, stomach-aches or sickness.
Really Agree
Kind of Agree
Kind of Disagree
Really Disagree
Spring 2012 12% 21% 33% 33% Spring 2011 21% 18% 21% 39%
104. I usually share with others, for example CD's, games, food.
Really Agree
Kind of Agree
Kind of Disagree
Really Disagree
Spring 2012 20% 40% 24% 16% Spring 2011 32% 25% 21% 21%
105. I get very angry and often lose my temper.
Really Agree
Kind of Agree
Kind of Disagree
Really Disagree
Spring 2012 24% 44% 24% 8% Spring 2011 21% 24% 38% 17%
106. I would rather be alone than with people of my age.
Really Agree
Kind of Agree
Kind of Disagree
Really Disagree
Spring 2012 12% 36% 32% 20% Spring 2011 28% 24% 28% 21%
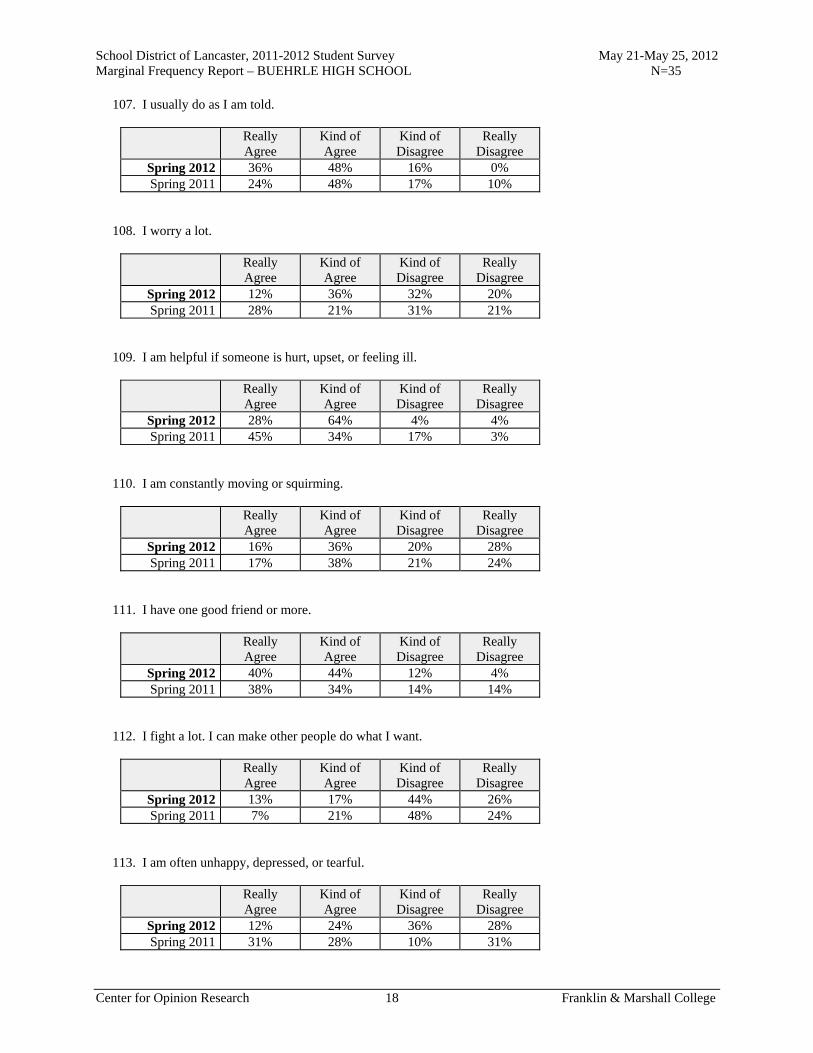
School District of Lancaster, 2011-2012 Student Survey May 21-May 25, 2012 Marginal Frequency Report – BUEHRLE HIGH SCHOOL N=35
Center for Opinion Research 18 Franklin & Marshall College
107. I usually do as I am told.
Really Agree
Kind of Agree
Kind of Disagree
Really Disagree
Spring 2012 36% 48% 16% 0% Spring 2011 24% 48% 17% 10%
108. I worry a lot.
Really Agree
Kind of Agree
Kind of Disagree
Really Disagree
Spring 2012 12% 36% 32% 20% Spring 2011 28% 21% 31% 21%
109. I am helpful if someone is hurt, upset, or feeling ill.
Really Agree
Kind of Agree
Kind of Disagree
Really Disagree
Spring 2012 28% 64% 4% 4% Spring 2011 45% 34% 17% 3%
110. I am constantly moving or squirming.
Really Agree
Kind of Agree
Kind of Disagree
Really Disagree
Spring 2012 16% 36% 20% 28% Spring 2011 17% 38% 21% 24%
111. I have one good friend or more.
Really Agree
Kind of Agree
Kind of Disagree
Really Disagree
Spring 2012 40% 44% 12% 4% Spring 2011 38% 34% 14% 14%
112. I fight a lot. I can make other people do what I want.
Really Agree
Kind of Agree
Kind of Disagree
Really Disagree
Spring 2012 13% 17% 44% 26% Spring 2011 7% 21% 48% 24%
113. I am often unhappy, depressed, or tearful.
Really Agree
Kind of Agree
Kind of Disagree
Really Disagree
Spring 2012 12% 24% 36% 28% Spring 2011 31% 28% 10% 31%
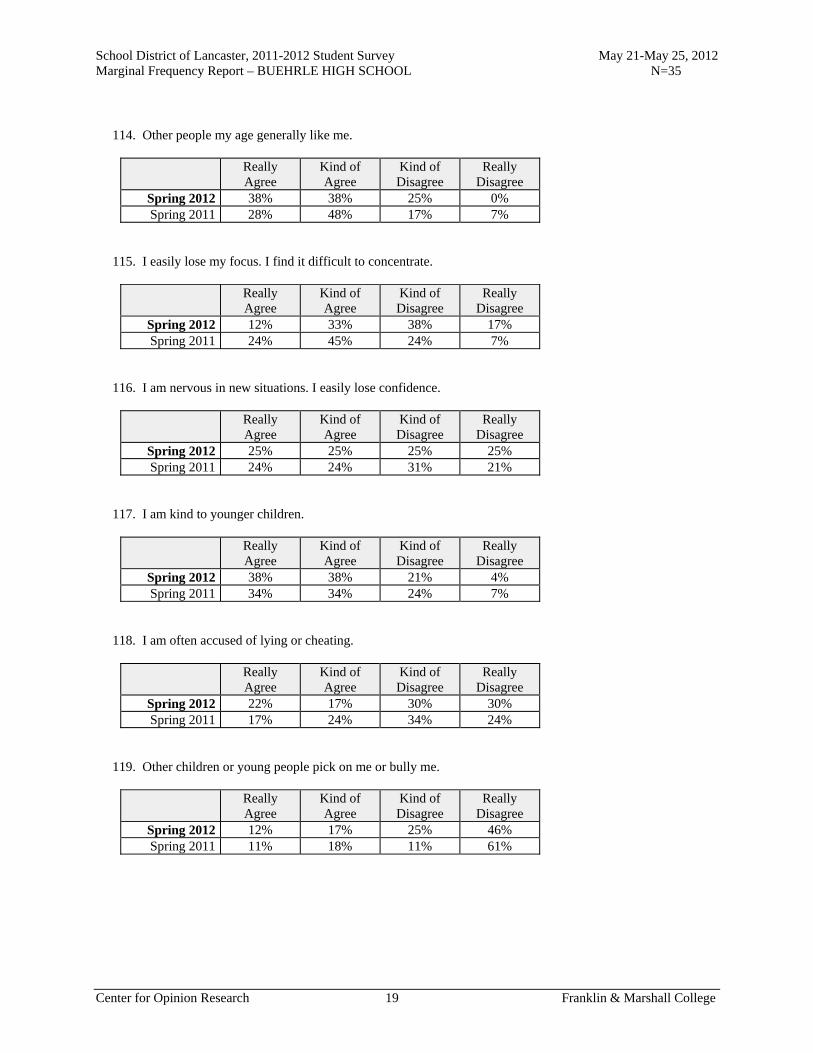
School District of Lancaster, 2011-2012 Student Survey May 21-May 25, 2012 Marginal Frequency Report – BUEHRLE HIGH SCHOOL N=35
Center for Opinion Research 19 Franklin & Marshall College
114. Other people my age generally like me.
Really Agree
Kind of Agree
Kind of Disagree
Really Disagree
Spring 2012 38% 38% 25% 0% Spring 2011 28% 48% 17% 7%
115. I easily lose my focus. I find it difficult to concentrate.
Really Agree
Kind of Agree
Kind of Disagree
Really Disagree
Spring 2012 12% 33% 38% 17% Spring 2011 24% 45% 24% 7%
116. I am nervous in new situations. I easily lose confidence.
Really Agree
Kind of Agree
Kind of Disagree
Really Disagree
Spring 2012 25% 25% 25% 25% Spring 2011 24% 24% 31% 21%
117. I am kind to younger children.
Really Agree
Kind of Agree
Kind of Disagree
Really Disagree
Spring 2012 38% 38% 21% 4% Spring 2011 34% 34% 24% 7%
118. I am often accused of lying or cheating.
Really Agree
Kind of Agree
Kind of Disagree
Really Disagree
Spring 2012 22% 17% 30% 30% Spring 2011 17% 24% 34% 24%
119. Other children or young people pick on me or bully me.
Really Agree
Kind of Agree
Kind of Disagree
Really Disagree
Spring 2012 12% 17% 25% 46% Spring 2011 11% 18% 11% 61%
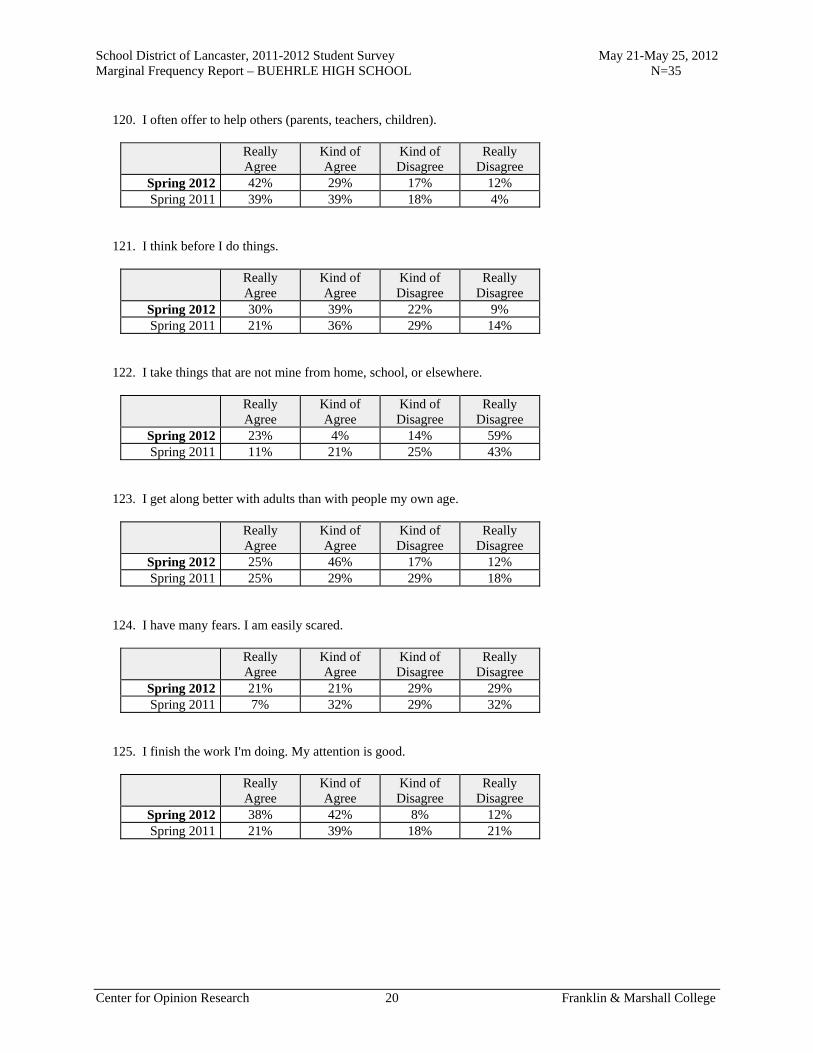
School District of Lancaster, 2011-2012 Student Survey May 21-May 25, 2012 Marginal Frequency Report – BUEHRLE HIGH SCHOOL N=35
Center for Opinion Research 20 Franklin & Marshall College
120. I often offer to help others (parents, teachers, children).
Really Agree
Kind of Agree
Kind of Disagree
Really Disagree
Spring 2012 42% 29% 17% 12% Spring 2011 39% 39% 18% 4%
121. I think before I do things.
Really Agree
Kind of Agree
Kind of Disagree
Really Disagree
Spring 2012 30% 39% 22% 9% Spring 2011 21% 36% 29% 14%
122. I take things that are not mine from home, school, or elsewhere.
Really Agree
Kind of Agree
Kind of Disagree
Really Disagree
Spring 2012 23% 4% 14% 59% Spring 2011 11% 21% 25% 43%
123. I get along better with adults than with people my own age.
Really Agree
Kind of Agree
Kind of Disagree
Really Disagree
Spring 2012 25% 46% 17% 12% Spring 2011 25% 29% 29% 18%
124. I have many fears. I am easily scared.
Really Agree
Kind of Agree
Kind of Disagree
Really Disagree
Spring 2012 21% 21% 29% 29% Spring 2011 7% 32% 29% 32%
125. I finish the work I'm doing. My attention is good.
Really Agree
Kind of Agree
Kind of Disagree
Really Disagree
Spring 2012 38% 42% 8% 12% Spring 2011 21% 39% 18% 21%
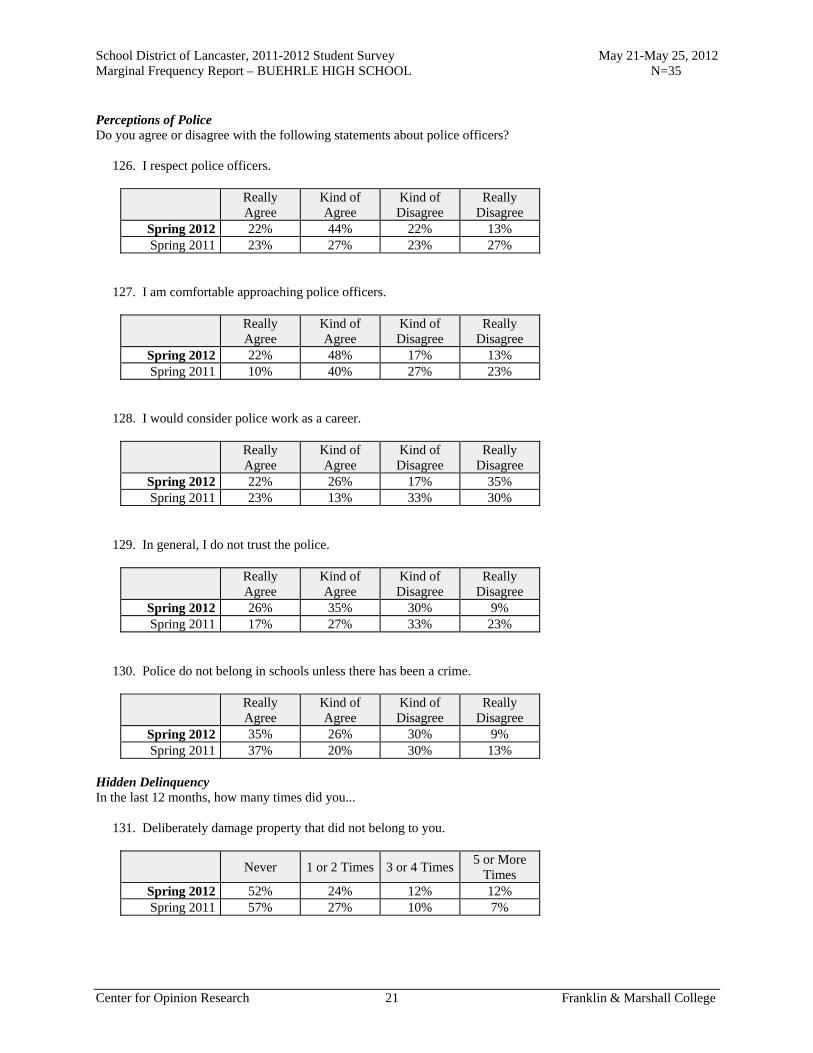
School District of Lancaster, 2011-2012 Student Survey May 21-May 25, 2012 Marginal Frequency Report – BUEHRLE HIGH SCHOOL N=35
Center for Opinion Research 21 Franklin & Marshall College
Perceptions of Police Do you agree or disagree with the following statements about police officers? 126. I respect police officers.
Really Agree
Kind of Agree
Kind of Disagree
Really Disagree
Spring 2012 22% 44% 22% 13% Spring 2011 23% 27% 23% 27%
127. I am comfortable approaching police officers.
Really Agree
Kind of Agree
Kind of Disagree
Really Disagree
Spring 2012 22% 48% 17% 13% Spring 2011 10% 40% 27% 23%
128. I would consider police work as a career.
Really Agree
Kind of Agree
Kind of Disagree
Really Disagree
Spring 2012 22% 26% 17% 35% Spring 2011 23% 13% 33% 30%
129. In general, I do not trust the police.
Really Agree
Kind of Agree
Kind of Disagree
Really Disagree
Spring 2012 26% 35% 30% 9% Spring 2011 17% 27% 33% 23%
130. Police do not belong in schools unless there has been a crime.
Really Agree
Kind of Agree
Kind of Disagree
Really Disagree
Spring 2012 35% 26% 30% 9% Spring 2011 37% 20% 30% 13%
Hidden Delinquency In the last 12 months, how many times did you... 131. Deliberately damage property that did not belong to you.
Never 1 or 2 Times 3 or 4 Times5 or More
Times Spring 2012 52% 24% 12% 12% Spring 2011 57% 27% 10% 7%
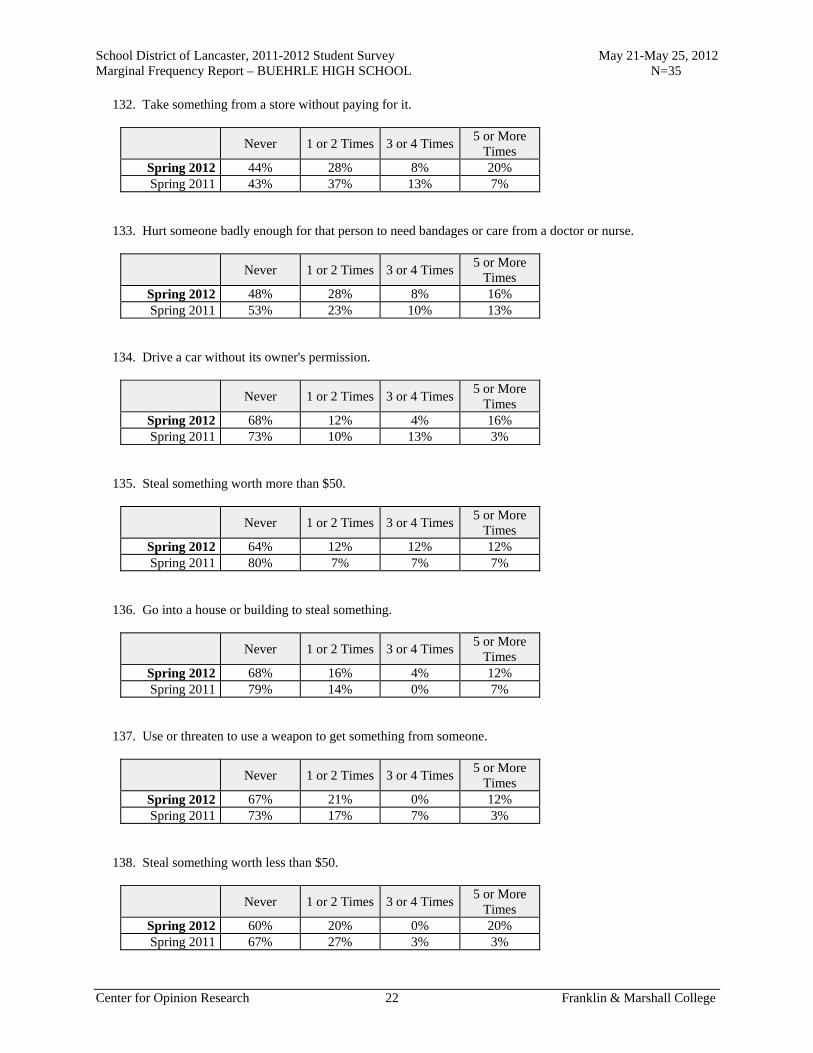
School District of Lancaster, 2011-2012 Student Survey May 21-May 25, 2012 Marginal Frequency Report – BUEHRLE HIGH SCHOOL N=35
Center for Opinion Research 22 Franklin & Marshall College
132. Take something from a store without paying for it.
Never 1 or 2 Times 3 or 4 Times5 or More
Times Spring 2012 44% 28% 8% 20% Spring 2011 43% 37% 13% 7%
133. Hurt someone badly enough for that person to need bandages or care from a doctor or nurse.
Never 1 or 2 Times 3 or 4 Times5 or More
Times Spring 2012 48% 28% 8% 16% Spring 2011 53% 23% 10% 13%
134. Drive a car without its owner's permission.
Never 1 or 2 Times 3 or 4 Times5 or More
Times Spring 2012 68% 12% 4% 16% Spring 2011 73% 10% 13% 3%
135. Steal something worth more than $50.
Never 1 or 2 Times 3 or 4 Times5 or More
Times Spring 2012 64% 12% 12% 12% Spring 2011 80% 7% 7% 7%
136. Go into a house or building to steal something.
Never 1 or 2 Times 3 or 4 Times5 or More
Times Spring 2012 68% 16% 4% 12% Spring 2011 79% 14% 0% 7%
137. Use or threaten to use a weapon to get something from someone.
Never 1 or 2 Times 3 or 4 Times5 or More
Times Spring 2012 67% 21% 0% 12% Spring 2011 73% 17% 7% 3%
138. Steal something worth less than $50.
Never 1 or 2 Times 3 or 4 Times5 or More
Times Spring 2012 60% 20% 0% 20% Spring 2011 67% 27% 3% 3%
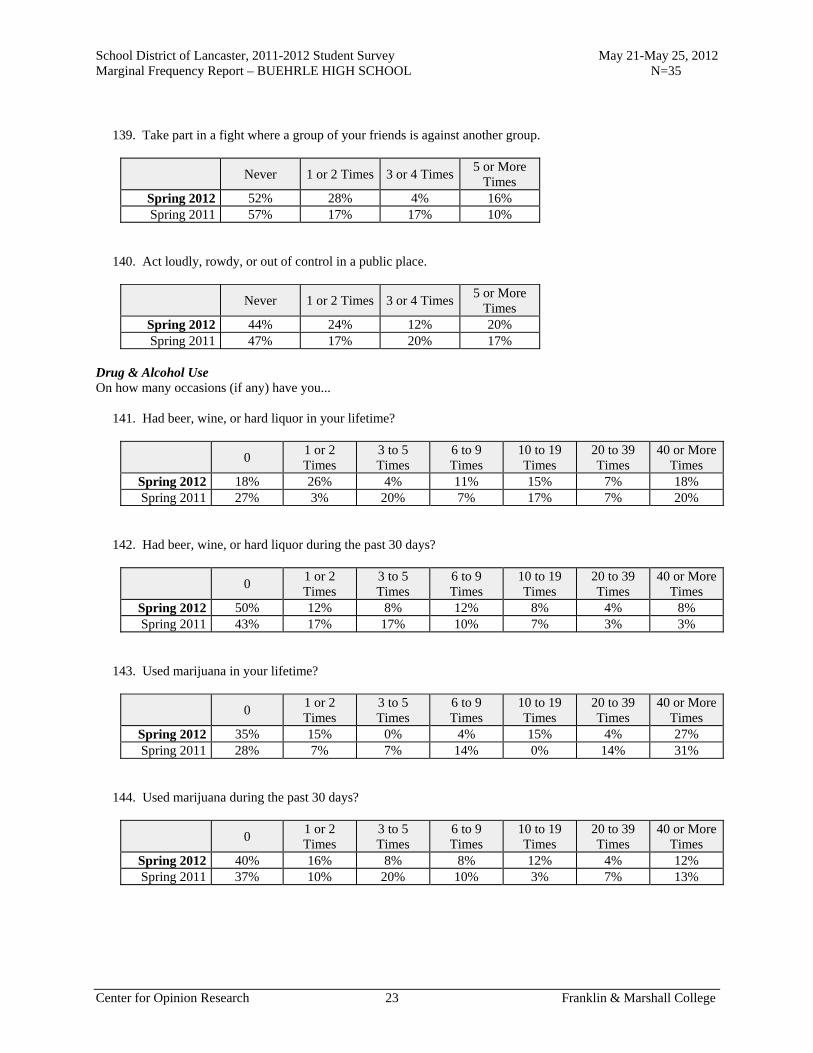
School District of Lancaster, 2011-2012 Student Survey May 21-May 25, 2012 Marginal Frequency Report – BUEHRLE HIGH SCHOOL N=35
Center for Opinion Research 23 Franklin & Marshall College
139. Take part in a fight where a group of your friends is against another group.
Never 1 or 2 Times 3 or 4 Times5 or More
Times Spring 2012 52% 28% 4% 16% Spring 2011 57% 17% 17% 10%
140. Act loudly, rowdy, or out of control in a public place.
Never 1 or 2 Times 3 or 4 Times5 or More
Times Spring 2012 44% 24% 12% 20% Spring 2011 47% 17% 20% 17%
Drug & Alcohol Use On how many occasions (if any) have you... 141. Had beer, wine, or hard liquor in your lifetime?
0 1 or 2 Times
3 to 5 Times
6 to 9 Times
10 to 19 Times
20 to 39 Times
40 or More Times
Spring 2012 18% 26% 4% 11% 15% 7% 18% Spring 2011 27% 3% 20% 7% 17% 7% 20%
142. Had beer, wine, or hard liquor during the past 30 days?
0 1 or 2 Times
3 to 5 Times
6 to 9 Times
10 to 19 Times
20 to 39 Times
40 or More Times
Spring 2012 50% 12% 8% 12% 8% 4% 8% Spring 2011 43% 17% 17% 10% 7% 3% 3%
143. Used marijuana in your lifetime?
0 1 or 2 Times
3 to 5 Times
6 to 9 Times
10 to 19 Times
20 to 39 Times
40 or More Times
Spring 2012 35% 15% 0% 4% 15% 4% 27% Spring 2011 28% 7% 7% 14% 0% 14% 31%
144. Used marijuana during the past 30 days?
0 1 or 2 Times
3 to 5 Times
6 to 9 Times
10 to 19 Times
20 to 39 Times
40 or More Times
Spring 2012 40% 16% 8% 8% 12% 4% 12% Spring 2011 37% 10% 20% 10% 3% 7% 13%
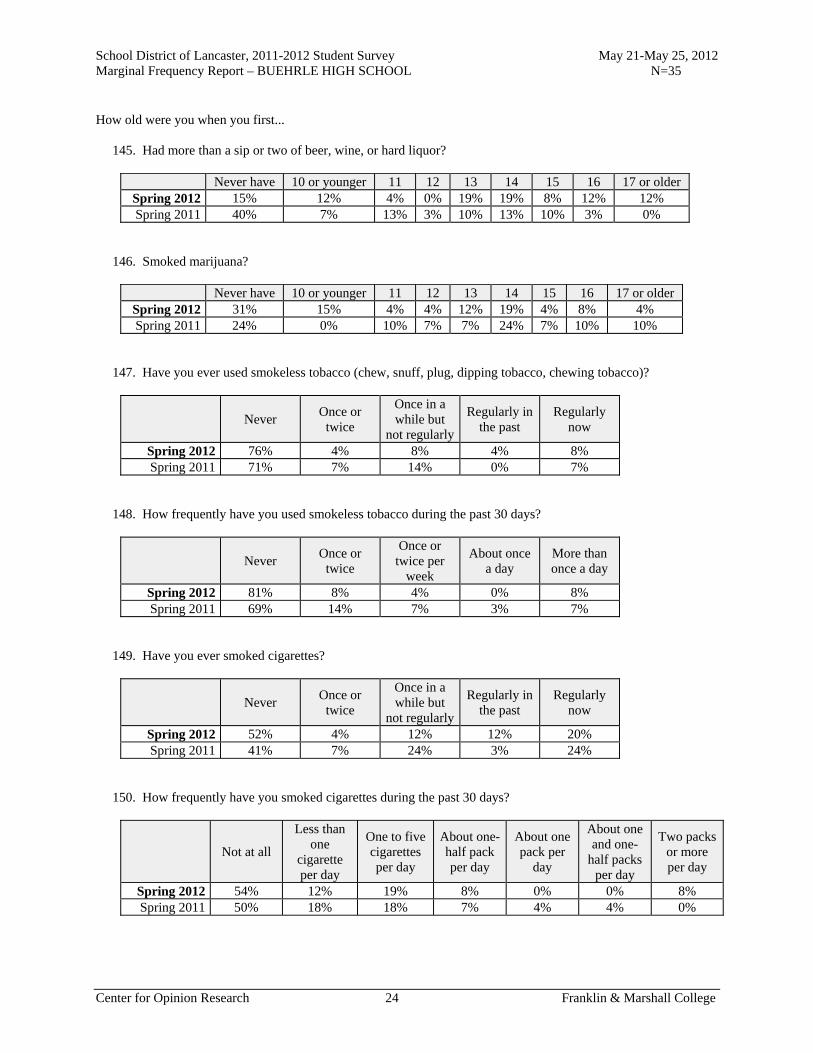
School District of Lancaster, 2011-2012 Student Survey May 21-May 25, 2012 Marginal Frequency Report – BUEHRLE HIGH SCHOOL N=35
Center for Opinion Research 24 Franklin & Marshall College
How old were you when you first... 145. Had more than a sip or two of beer, wine, or hard liquor?
Never have 10 or younger 11 12 13 14 15 16 17 or older Spring 2012 15% 12% 4% 0% 19% 19% 8% 12% 12% Spring 2011 40% 7% 13% 3% 10% 13% 10% 3% 0%
146. Smoked marijuana?
Never have 10 or younger 11 12 13 14 15 16 17 or older Spring 2012 31% 15% 4% 4% 12% 19% 4% 8% 4% Spring 2011 24% 0% 10% 7% 7% 24% 7% 10% 10%
147. Have you ever used smokeless tobacco (chew, snuff, plug, dipping tobacco, chewing tobacco)?
Never Once or
twice
Once in a while but
not regularly
Regularly in the past
Regularly now
Spring 2012 76% 4% 8% 4% 8% Spring 2011 71% 7% 14% 0% 7%
148. How frequently have you used smokeless tobacco during the past 30 days?
Never Once or
twice
Once or twice per
week
About once a day
More than once a day
Spring 2012 81% 8% 4% 0% 8% Spring 2011 69% 14% 7% 3% 7%
149. Have you ever smoked cigarettes?
Never Once or
twice
Once in a while but
not regularly
Regularly in the past
Regularly now
Spring 2012 52% 4% 12% 12% 20% Spring 2011 41% 7% 24% 3% 24%
150. How frequently have you smoked cigarettes during the past 30 days?
Not at all
Less than one
cigarette per day
One to five cigarettes per day
About one-half pack per day
About one pack per
day
About one and one-
half packs per day
Two packs or more per day
Spring 2012 54% 12% 19% 8% 0% 0% 8% Spring 2011 50% 18% 18% 7% 4% 4% 0%
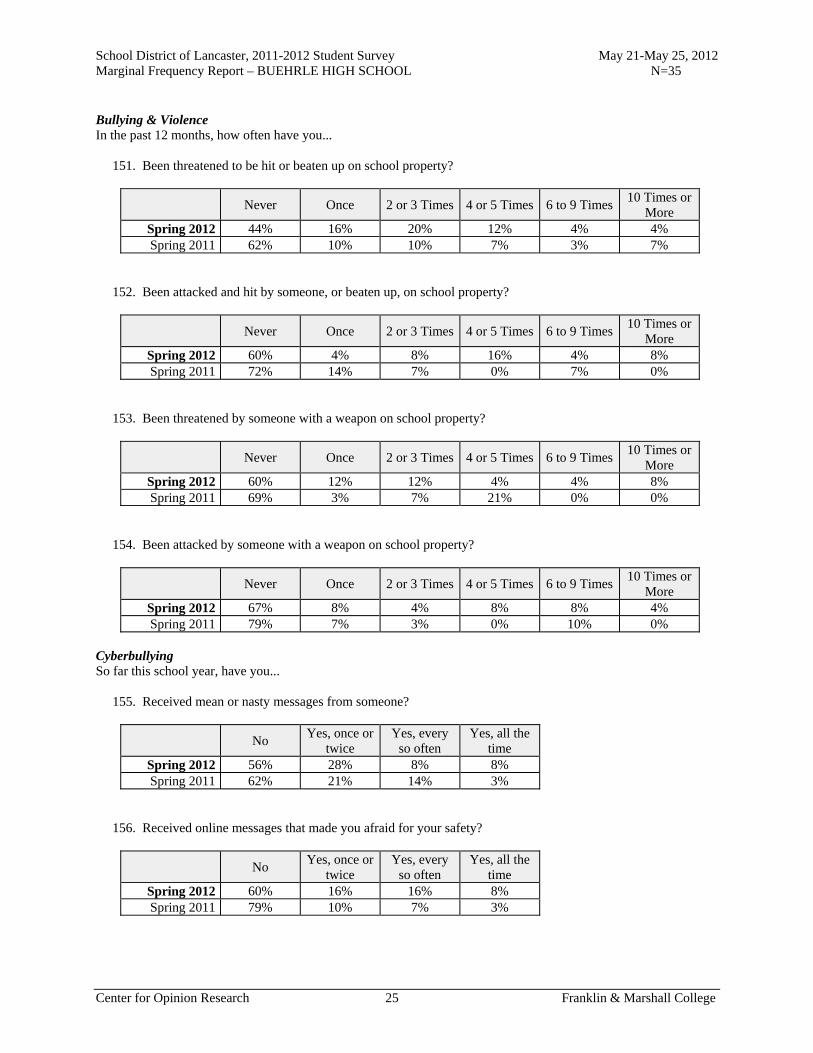
School District of Lancaster, 2011-2012 Student Survey May 21-May 25, 2012 Marginal Frequency Report – BUEHRLE HIGH SCHOOL N=35
Center for Opinion Research 25 Franklin & Marshall College
Bullying & Violence In the past 12 months, how often have you... 151. Been threatened to be hit or beaten up on school property?
Never Once 2 or 3 Times 4 or 5 Times 6 to 9 Times 10 Times or
More Spring 2012 44% 16% 20% 12% 4% 4% Spring 2011 62% 10% 10% 7% 3% 7%
152. Been attacked and hit by someone, or beaten up, on school property?
Never Once 2 or 3 Times 4 or 5 Times 6 to 9 Times 10 Times or
More Spring 2012 60% 4% 8% 16% 4% 8% Spring 2011 72% 14% 7% 0% 7% 0%
153. Been threatened by someone with a weapon on school property?
Never Once 2 or 3 Times 4 or 5 Times 6 to 9 Times 10 Times or
More Spring 2012 60% 12% 12% 4% 4% 8% Spring 2011 69% 3% 7% 21% 0% 0%
154. Been attacked by someone with a weapon on school property?
Never Once 2 or 3 Times 4 or 5 Times 6 to 9 Times 10 Times or
More Spring 2012 67% 8% 4% 8% 8% 4% Spring 2011 79% 7% 3% 0% 10% 0%
Cyberbullying So far this school year, have you... 155. Received mean or nasty messages from someone?
No Yes, once or
twice Yes, every
so often Yes, all the
time Spring 2012 56% 28% 8% 8% Spring 2011 62% 21% 14% 3%
156. Received online messages that made you afraid for your safety?
No Yes, once or
twice Yes, every
so often Yes, all the
time Spring 2012 60% 16% 16% 8% Spring 2011 79% 10% 7% 3%
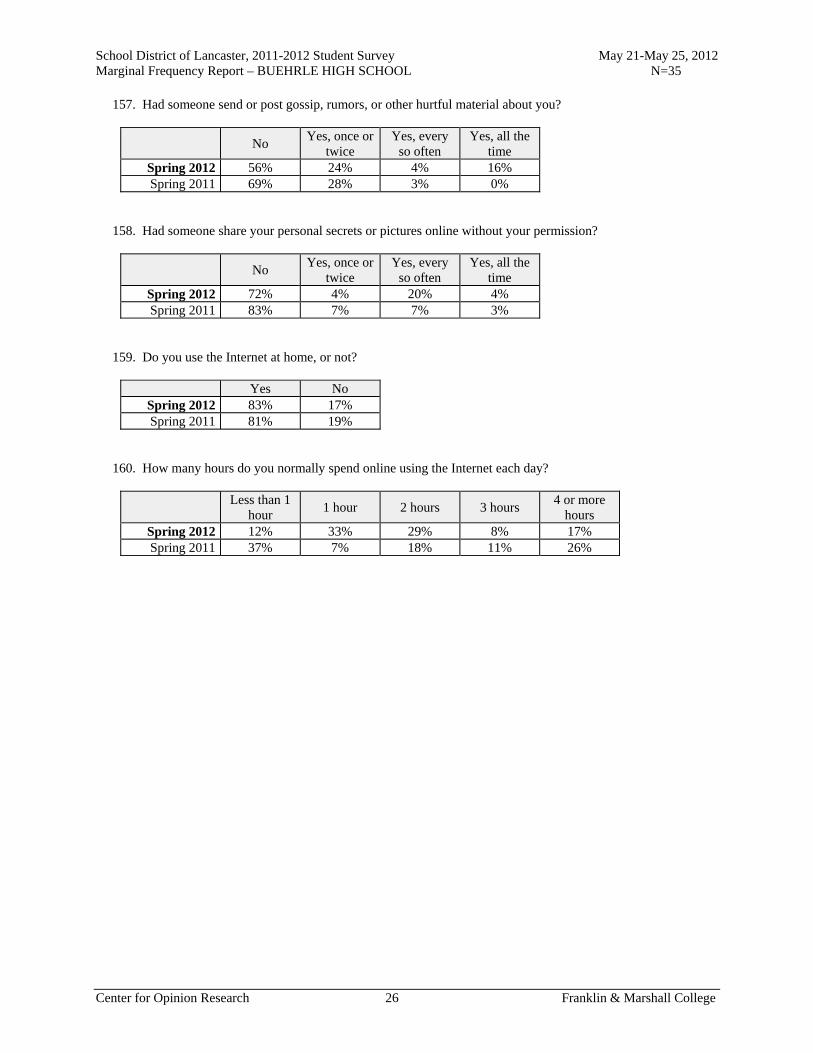
School District of Lancaster, 2011-2012 Student Survey May 21-May 25, 2012 Marginal Frequency Report – BUEHRLE HIGH SCHOOL N=35
Center for Opinion Research 26 Franklin & Marshall College
157. Had someone send or post gossip, rumors, or other hurtful material about you?
No Yes, once or
twice Yes, every
so often Yes, all the
time Spring 2012 56% 24% 4% 16% Spring 2011 69% 28% 3% 0%
158. Had someone share your personal secrets or pictures online without your permission?
No Yes, once or
twice Yes, every
so often Yes, all the
time Spring 2012 72% 4% 20% 4% Spring 2011 83% 7% 7% 3%
159. Do you use the Internet at home, or not?
Yes No Spring 2012 83% 17% Spring 2011 81% 19%
160. How many hours do you normally spend online using the Internet each day?
Less than 1
hour 1 hour 2 hours 3 hours
4 or more hours
Spring 2012 12% 33% 29% 8% 17% Spring 2011 37% 7% 18% 11% 26%

Report Y
Marginal Frequency Report Phoenix High School

School District of Lancaster, 2011-2012 Student Survey May 21-May 25, 2012 Marginal Frequency Report – PHOENIX HIGH SCHOOL N=123
Center for Opinion Research 1 Franklin & Marshall College
School Climate Do you agree or disagree with the following statements? 1. I feel safe at this school.
Really Agree
Kind of Agree
Kind of Disagree
Really Disagree
Spring 2012 49% 30% 12% 9% Spring 2011 43% 45% 8% 4% Spring 2010 54% 32% 7% 7% Spring 2009 51% 37% 10% 2%
Fall 2008 50% 37% 10% 2% Spring 2008 49% 40% 9% 2%
Fall 2007 50% 40% 5% 5% Spring 2007 26% 63% 11% 0%
Fall 2006 42% 44% 14% 0% 2. I feel safe going to and from school.
Really Agree
Kind of Agree
Kind of Disagree
Really Disagree
Spring 2012 52% 28% 15% 5% Spring 2011 49% 42% 6% 4% Spring 2010 52% 27% 12% 9% Spring 2009 39% 51% 5% 5%
Fall 2008 41% 41% 15% 2% Spring 2008 58% 32% 4% 6%
Fall 2007 51% 41% 6% 2% Spring 2007 33% 52% 15% 0%
Fall 2006 37% 49% 14% 0% 3. Students get along well with each other.
Really Agree
Kind of Agree
Kind of Disagree
Really Disagree
Spring 2012 21% 31% 33% 15% Spring 2011 7% 49% 34% 10% Spring 2010 23% 45% 29% 4% Spring 2009 20% 63% 17% 0%
Fall 2008 30% 47% 18% 4% Spring 2008 28% 53% 15% 4%
Fall 2007 24% 53% 21% 2% Spring 2007 15% 63% 22% 0%
Fall 2006 26% 60% 9% 5%
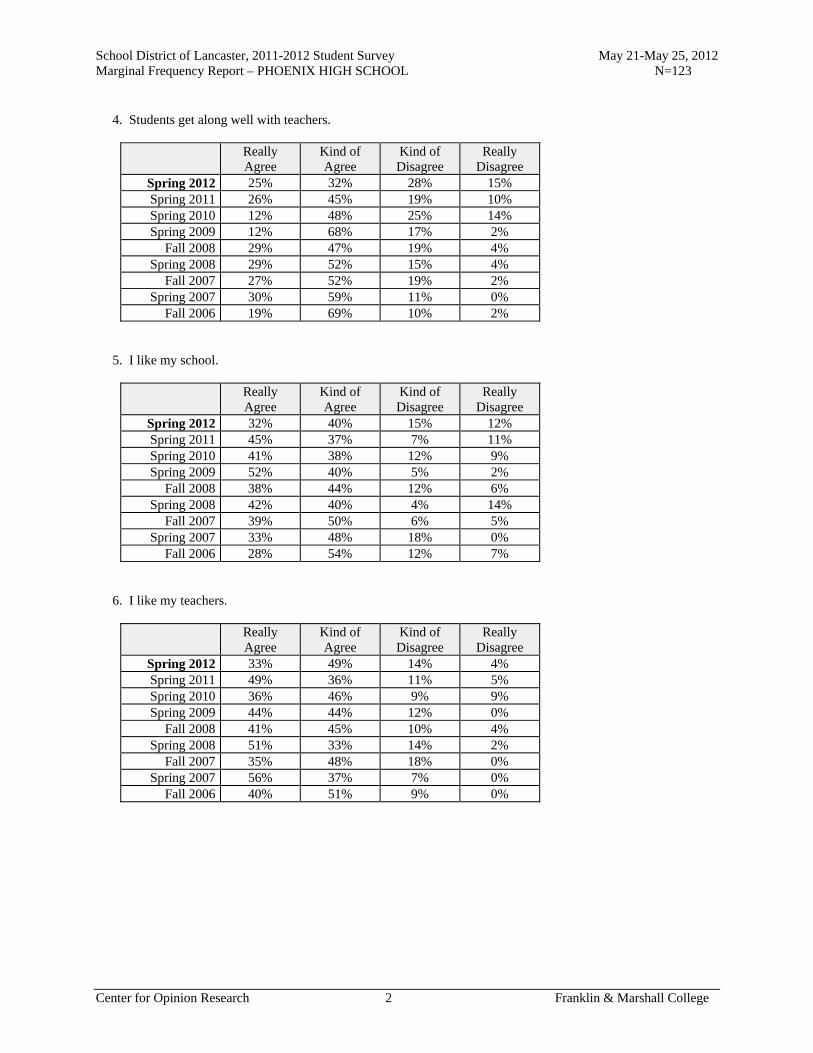
School District of Lancaster, 2011-2012 Student Survey May 21-May 25, 2012 Marginal Frequency Report – PHOENIX HIGH SCHOOL N=123
Center for Opinion Research 2 Franklin & Marshall College
4. Students get along well with teachers.
Really Agree
Kind of Agree
Kind of Disagree
Really Disagree
Spring 2012 25% 32% 28% 15% Spring 2011 26% 45% 19% 10% Spring 2010 12% 48% 25% 14% Spring 2009 12% 68% 17% 2%
Fall 2008 29% 47% 19% 4% Spring 2008 29% 52% 15% 4%
Fall 2007 27% 52% 19% 2% Spring 2007 30% 59% 11% 0%
Fall 2006 19% 69% 10% 2% 5. I like my school.
Really Agree
Kind of Agree
Kind of Disagree
Really Disagree
Spring 2012 32% 40% 15% 12% Spring 2011 45% 37% 7% 11% Spring 2010 41% 38% 12% 9% Spring 2009 52% 40% 5% 2%
Fall 2008 38% 44% 12% 6% Spring 2008 42% 40% 4% 14%
Fall 2007 39% 50% 6% 5% Spring 2007 33% 48% 18% 0%
Fall 2006 28% 54% 12% 7% 6. I like my teachers.
Really Agree
Kind of Agree
Kind of Disagree
Really Disagree
Spring 2012 33% 49% 14% 4% Spring 2011 49% 36% 11% 5% Spring 2010 36% 46% 9% 9% Spring 2009 44% 44% 12% 0%
Fall 2008 41% 45% 10% 4% Spring 2008 51% 33% 14% 2%
Fall 2007 35% 48% 18% 0% Spring 2007 56% 37% 7% 0%
Fall 2006 40% 51% 9% 0%

School District of Lancaster, 2011-2012 Student Survey May 21-May 25, 2012 Marginal Frequency Report – PHOENIX HIGH SCHOOL N=123
Center for Opinion Research 3 Franklin & Marshall College
7. There is a teacher or some other adult at this school who really cares about me.
Really Agree
Kind of Agree
Kind of Disagree
Really Disagree
Spring 2012 43% 40% 12% 4% Spring 2011 52% 32% 10% 6% Spring 2010 50% 30% 9% 11% Spring 2009 40% 50% 8% 2%
Fall 2008 31% 46% 15% 8% Spring 2008 36% 44% 14% 6%
Fall 2007 34% 39% 21% 6% Spring 2007 33% 52% 11% 4%
Fall 2006 37% 23% 30% 9% 8. There is a teacher or some other adult at this school who cares when I am not here.
Really Agree
Kind of Agree
Kind of Disagree
Really Disagree
Spring 2012 38% 34% 20% 8% Spring 2011 38% 39% 11% 12% Spring 2010 31% 40% 13% 16% Spring 2009 32% 48% 12% 8%
Fall 2008 30% 42% 20% 8% Spring 2008 27% 52% 15% 6%
Fall 2007 36% 40% 21% 3% Spring 2007 30% 44% 18% 7%
Fall 2006 21% 35% 35% 9% 9. There is a teacher or some other adult at this school who listens to me when I have something to say.
Really Agree
Kind of Agree
Kind of Disagree
Really Disagree
Spring 2012 43% 35% 16% 6% Spring 2011 58% 26% 5% 11% Spring 2010 43% 39% 14% 4% Spring 2009 37% 54% 7% 2%
Fall 2008 36% 45% 14% 4% Spring 2008 46% 40% 10% 4%
Fall 2007 37% 42% 18% 3% Spring 2007 54% 31% 15% 0%
Fall 2006 33% 33% 26% 7%

School District of Lancaster, 2011-2012 Student Survey May 21-May 25, 2012 Marginal Frequency Report – PHOENIX HIGH SCHOOL N=123
Center for Opinion Research 4 Franklin & Marshall College
10. There is a teacher or some other adult at this school who tells me when I do a good job.
Really Agree
Kind of Agree
Kind of Disagree
Really Disagree
Spring 2012 46% 37% 12% 5% Spring 2011 60% 36% 2% 2% Spring 2010 41% 43% 7% 9% Spring 2009 48% 40% 8% 5%
Fall 2008 41% 47% 8% 4% Spring 2008 56% 29% 10% 6%
Fall 2007 45% 42% 13% 0% Spring 2007 56% 33% 11% 0%
Fall 2006 29% 57% 12% 2% 11. There is a teacher or some other adult at this school who always wants me to do my best.
Really Agree
Kind of Agree
Kind of Disagree
Really Disagree
Spring 2012 52% 32% 12% 3% Spring 2011 66% 25% 7% 2% Spring 2010 59% 27% 11% 4% Spring 2009 48% 48% 2% 2%
Fall 2008 52% 36% 8% 4% Spring 2008 56% 35% 8% 2%
Fall 2007 46% 44% 10% 0% Spring 2007 56% 41% 4% 0%
Fall 2006 56% 29% 10% 5% 12. There is a teacher or some other adult at this school who believes that I will be a success.
Really Agree
Kind of Agree
Kind of Disagree
Really Disagree
Spring 2012 44% 32% 17% 7% Spring 2011 46% 43% 6% 5% Spring 2010 56% 29% 13% 2% Spring 2009 42% 52% 2% 2%
Fall 2008 46% 38% 14% 2% Spring 2008 58% 31% 6% 6%
Fall 2007 48% 40% 13% 0% Spring 2007 52% 33% 11% 4%
Fall 2006 44% 44% 10% 2%

School District of Lancaster, 2011-2012 Student Survey May 21-May 25, 2012 Marginal Frequency Report – PHOENIX HIGH SCHOOL N=123
Center for Opinion Research 5 Franklin & Marshall College
13. Students in this school really listen to teachers.
Really Agree
Kind of Agree
Kind of Disagree
Really Disagree
Spring 2012 15% 28% 34% 23% Spring 2011 12% 40% 38% 10% Spring 2010 0% 46% 34% 20% Spring 2009 8% 62% 23% 8%
Fall 2008 7% 55% 29% 9% Spring 2008 15% 40% 32% 13%
Fall 2007 8% 52% 32% 8% Spring 2007 7% 67% 18% 7%
Fall 2006 18% 33% 44% 5% 14. Most teachers make learning interesting.
Really Agree
Kind of Agree
Kind of Disagree
Really Disagree
Spring 2012 26% 36% 22% 16% Spring 2011 25% 44% 18% 13% Spring 2010 20% 45% 29% 7% Spring 2009 20% 45% 25% 10%
Fall 2008 13% 45% 34% 8% Spring 2008 21% 38% 25% 15%
Fall 2007 16% 43% 30% 11% Spring 2007 33% 44% 15% 7%
Fall 2006 25% 48% 18% 10% 15. This school is always getting better.
Really Agree
Kind of Agree
Kind of Disagree
Really Disagree
Spring 2012 24% 30% 29% 18% Spring 2011 23% 37% 23% 18% Spring 2010 13% 49% 26% 13% Spring 2009 18% 54% 23% 5%
Fall 2008 16% 43% 35% 7% Spring 2008 31% 29% 24% 16%
Fall 2007 26% 38% 31% 5% Spring 2007 41% 41% 11% 7%
Fall 2006 10% 50% 32% 8% 16. The music, arts, athletics, and other extra-curricular programs at my school improve my high school experience.
Really Agree
Kind of Agree
Kind of Disagree
Really Disagree
Spring 2012 32% 28% 20% 20%
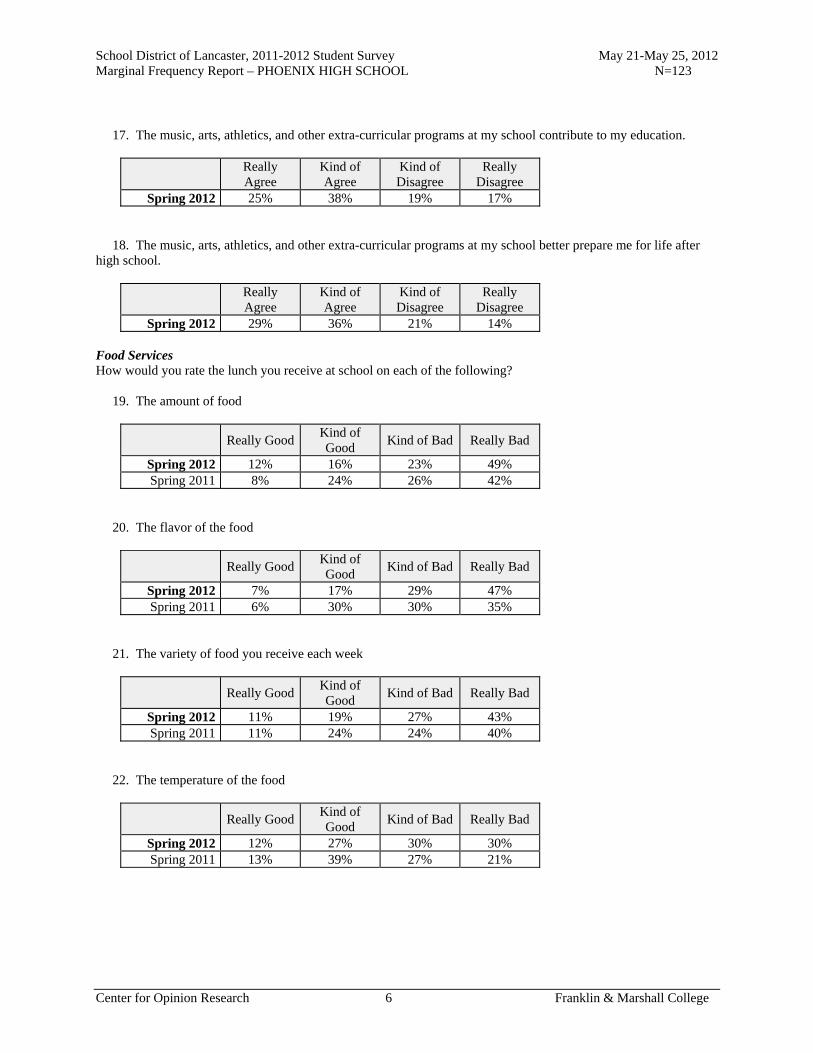
School District of Lancaster, 2011-2012 Student Survey May 21-May 25, 2012 Marginal Frequency Report – PHOENIX HIGH SCHOOL N=123
Center for Opinion Research 6 Franklin & Marshall College
17. The music, arts, athletics, and other extra-curricular programs at my school contribute to my education.
Really Agree
Kind of Agree
Kind of Disagree
Really Disagree
Spring 2012 25% 38% 19% 17% 18. The music, arts, athletics, and other extra-curricular programs at my school better prepare me for life after high school.
Really Agree
Kind of Agree
Kind of Disagree
Really Disagree
Spring 2012 29% 36% 21% 14% Food Services How would you rate the lunch you receive at school on each of the following? 19. The amount of food
Really Good Kind of Good
Kind of Bad Really Bad
Spring 2012 12% 16% 23% 49% Spring 2011 8% 24% 26% 42%
20. The flavor of the food
Really Good Kind of Good
Kind of Bad Really Bad
Spring 2012 7% 17% 29% 47% Spring 2011 6% 30% 30% 35%
21. The variety of food you receive each week
Really Good Kind of Good
Kind of Bad Really Bad
Spring 2012 11% 19% 27% 43% Spring 2011 11% 24% 24% 40%
22. The temperature of the food
Really Good Kind of Good
Kind of Bad Really Bad
Spring 2012 12% 27% 30% 30% Spring 2011 13% 39% 27% 21%
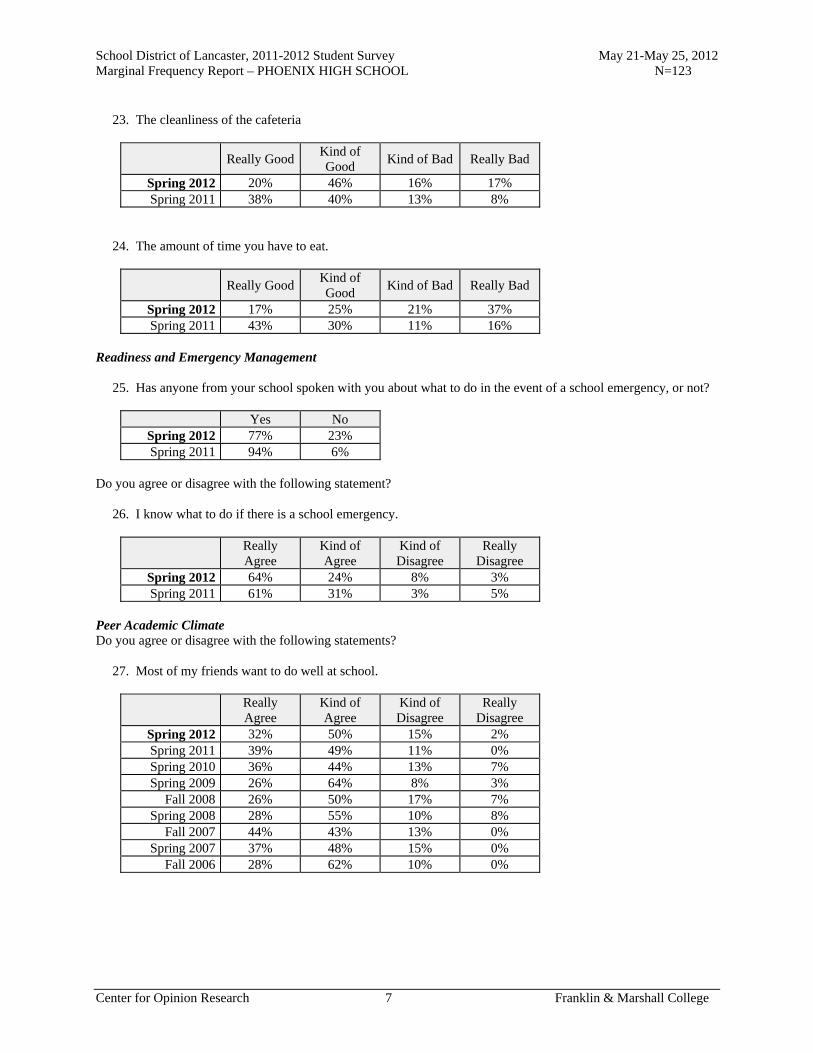
School District of Lancaster, 2011-2012 Student Survey May 21-May 25, 2012 Marginal Frequency Report – PHOENIX HIGH SCHOOL N=123
Center for Opinion Research 7 Franklin & Marshall College
23. The cleanliness of the cafeteria
Really Good Kind of Good
Kind of Bad Really Bad
Spring 2012 20% 46% 16% 17% Spring 2011 38% 40% 13% 8%
24. The amount of time you have to eat.
Really Good Kind of Good
Kind of Bad Really Bad
Spring 2012 17% 25% 21% 37% Spring 2011 43% 30% 11% 16%
Readiness and Emergency Management 25. Has anyone from your school spoken with you about what to do in the event of a school emergency, or not?
Yes No Spring 2012 77% 23% Spring 2011 94% 6%
Do you agree or disagree with the following statement? 26. I know what to do if there is a school emergency.
Really Agree
Kind of Agree
Kind of Disagree
Really Disagree
Spring 2012 64% 24% 8% 3% Spring 2011 61% 31% 3% 5%
Peer Academic Climate Do you agree or disagree with the following statements? 27. Most of my friends want to do well at school.
Really Agree
Kind of Agree
Kind of Disagree
Really Disagree
Spring 2012 32% 50% 15% 2% Spring 2011 39% 49% 11% 0% Spring 2010 36% 44% 13% 7% Spring 2009 26% 64% 8% 3%
Fall 2008 26% 50% 17% 7% Spring 2008 28% 55% 10% 8%
Fall 2007 44% 43% 13% 0% Spring 2007 37% 48% 15% 0%
Fall 2006 28% 62% 10% 0%

School District of Lancaster, 2011-2012 Student Survey May 21-May 25, 2012 Marginal Frequency Report – PHOENIX HIGH SCHOOL N=123
Center for Opinion Research 8 Franklin & Marshall College
28. Most of my friends want to go to college.
Really Agree
Kind of Agree
Kind of Disagree
Really Disagree
Spring 2012 25% 44% 25% 6% Spring 2011 36% 39% 20% 5% Spring 2010 29% 32% 27% 12% Spring 2009 18% 52% 28% 2%
Fall 2008 17% 50% 21% 12% Spring 2008 26% 39% 20% 16%
Fall 2007 29% 40% 21% 10% Spring 2007 18% 52% 26% 4%
Fall 2006 22% 42% 32% 2% 29. Most of my friends think education is a waste of time.
Really Agree
Kind of Agree
Kind of Disagree
Really Disagree
Spring 2012 17% 30% 36% 17% Spring 2011 14% 23% 39% 24% Spring 2010 12% 27% 34% 27% Spring 2009 10% 12% 50% 28%
Fall 2008 11% 31% 32% 26% Spring 2008 12% 26% 41% 22%
Fall 2007 10% 27% 41% 22% Spring 2007 7% 37% 33% 22%
Fall 2006 12% 25% 42% 20% 30. Most of my friends want to leave school as soon as possible.
Really Agree
Kind of Agree
Kind of Disagree
Really Disagree
Spring 2012 37% 37% 16% 10% Spring 2011 18% 36% 28% 19% Spring 2010 38% 22% 26% 14% Spring 2009 20% 40% 25% 15%
Fall 2008 30% 40% 18% 12% Spring 2008 36% 40% 12% 12%
Fall 2007 32% 38% 19% 11% Spring 2007 30% 56% 11% 4%
Fall 2006 26% 36% 28% 10%
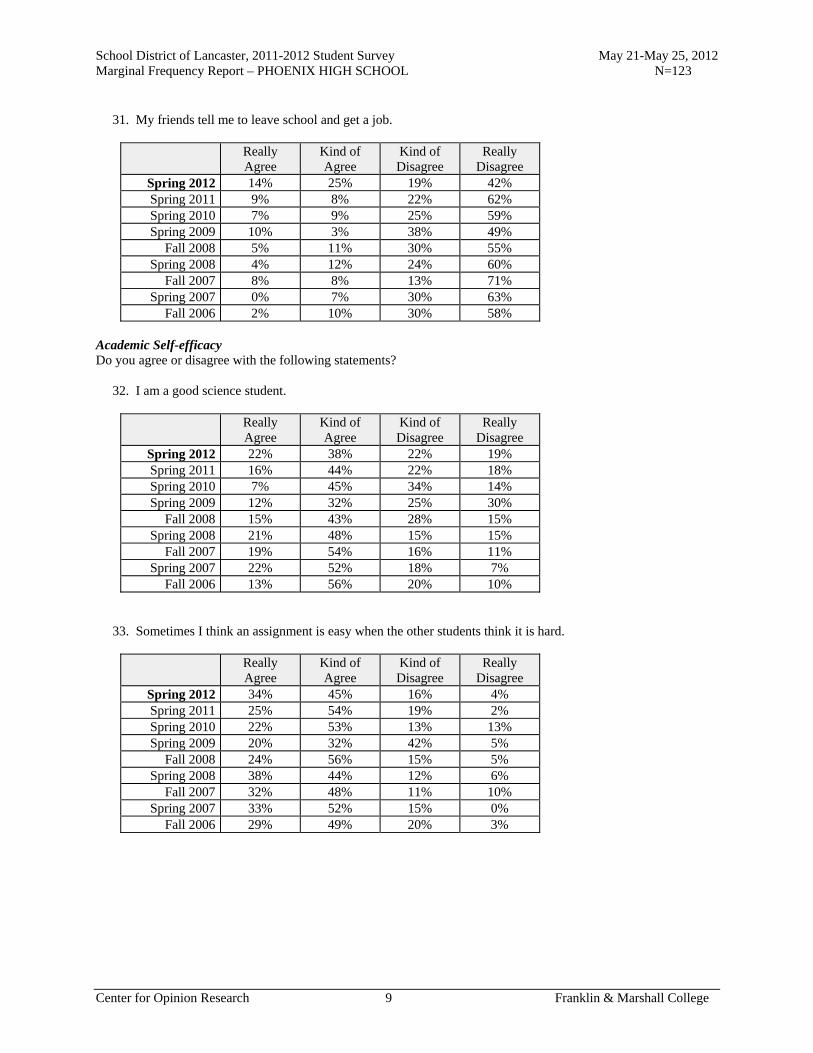
School District of Lancaster, 2011-2012 Student Survey May 21-May 25, 2012 Marginal Frequency Report – PHOENIX HIGH SCHOOL N=123
Center for Opinion Research 9 Franklin & Marshall College
31. My friends tell me to leave school and get a job.
Really Agree
Kind of Agree
Kind of Disagree
Really Disagree
Spring 2012 14% 25% 19% 42% Spring 2011 9% 8% 22% 62% Spring 2010 7% 9% 25% 59% Spring 2009 10% 3% 38% 49%
Fall 2008 5% 11% 30% 55% Spring 2008 4% 12% 24% 60%
Fall 2007 8% 8% 13% 71% Spring 2007 0% 7% 30% 63%
Fall 2006 2% 10% 30% 58% Academic Self-efficacy Do you agree or disagree with the following statements? 32. I am a good science student.
Really Agree
Kind of Agree
Kind of Disagree
Really Disagree
Spring 2012 22% 38% 22% 19% Spring 2011 16% 44% 22% 18% Spring 2010 7% 45% 34% 14% Spring 2009 12% 32% 25% 30%
Fall 2008 15% 43% 28% 15% Spring 2008 21% 48% 15% 15%
Fall 2007 19% 54% 16% 11% Spring 2007 22% 52% 18% 7%
Fall 2006 13% 56% 20% 10% 33. Sometimes I think an assignment is easy when the other students think it is hard.
Really Agree
Kind of Agree
Kind of Disagree
Really Disagree
Spring 2012 34% 45% 16% 4% Spring 2011 25% 54% 19% 2% Spring 2010 22% 53% 13% 13% Spring 2009 20% 32% 42% 5%
Fall 2008 24% 56% 15% 5% Spring 2008 38% 44% 12% 6%
Fall 2007 32% 48% 11% 10% Spring 2007 33% 52% 15% 0%
Fall 2006 29% 49% 20% 3%

School District of Lancaster, 2011-2012 Student Survey May 21-May 25, 2012 Marginal Frequency Report – PHOENIX HIGH SCHOOL N=123
Center for Opinion Research 10 Franklin & Marshall College
34. I am good social studies student.
Really Agree
Kind of Agree
Kind of Disagree
Really Disagree
Spring 2012 29% 44% 17% 10% Spring 2011 30% 40% 19% 11% Spring 2010 34% 45% 14% 7% Spring 2009 33% 46% 15% 5%
Fall 2008 30% 46% 17% 7% Spring 2008 39% 37% 18% 6%
Fall 2007 22% 44% 27% 6% Spring 2007 18% 56% 18% 7%
Fall 2006 23% 57% 17% 3% 35. My teacher thinks I am smart.
Really Agree
Kind of Agree
Kind of Disagree
Really Disagree
Spring 2012 43% 41% 13% 4% Spring 2011 31% 51% 11% 6% Spring 2010 36% 46% 12% 5% Spring 2009 38% 41% 18% 3%
Fall 2008 35% 47% 17% 2% Spring 2008 46% 44% 8% 2%
Fall 2007 32% 48% 16% 5% Spring 2007 38% 46% 15% 0%
Fall 2006 28% 42% 22% 8% 36. I am a good math student.
Really Agree
Kind of Agree
Kind of Disagree
Really Disagree
Spring 2012 29% 38% 20% 13% Spring 2011 18% 47% 27% 8% Spring 2010 23% 34% 32% 11% Spring 2009 25% 32% 22% 20%
Fall 2008 27% 40% 21% 13% Spring 2008 49% 29% 4% 18%
Fall 2007 29% 27% 22% 22% Spring 2007 33% 56% 11% 0%
Fall 2006 23% 43% 23% 11%

School District of Lancaster, 2011-2012 Student Survey May 21-May 25, 2012 Marginal Frequency Report – PHOENIX HIGH SCHOOL N=123
Center for Opinion Research 11 Franklin & Marshall College
37. My classmates usually get better grades than I do.
Really Agree
Kind of Agree
Kind of Disagree
Really Disagree
Spring 2012 13% 30% 36% 21% Spring 2011 8% 37% 49% 6% Spring 2010 11% 34% 52% 4% Spring 2009 8% 45% 42% 5%
Fall 2008 9% 38% 41% 12% Spring 2008 10% 31% 41% 18%
Fall 2007 16% 30% 38% 16% Spring 2007 18% 26% 48% 7%
Fall 2006 14% 34% 37% 14% 38. I usually understand my homework assignments.
Really Agree
Kind of Agree
Kind of Disagree
Really Disagree
Spring 2012 32% 42% 18% 7% Spring 2011 22% 54% 20% 4% Spring 2010 21% 52% 18% 9% Spring 2009 24% 45% 21% 10%
Fall 2008 20% 56% 15% 9% Spring 2008 43% 45% 6% 6%
Fall 2007 29% 56% 3% 11% Spring 2007 26% 63% 7% 4%
Fall 2006 29% 57% 14% 0% 39. I could get the best grades in class if I tried hard enough.
Really Agree
Kind of Agree
Kind of Disagree
Really Disagree
Spring 2012 62% 25% 8% 5% Spring 2011 54% 35% 8% 4% Spring 2010 62% 29% 7% 2% Spring 2009 52% 30% 15% 2%
Fall 2008 50% 38% 9% 3% Spring 2008 64% 32% 4% 0%
Fall 2007 57% 36% 5% 2% Spring 2007 56% 26% 18% 0%
Fall 2006 43% 37% 17% 3%
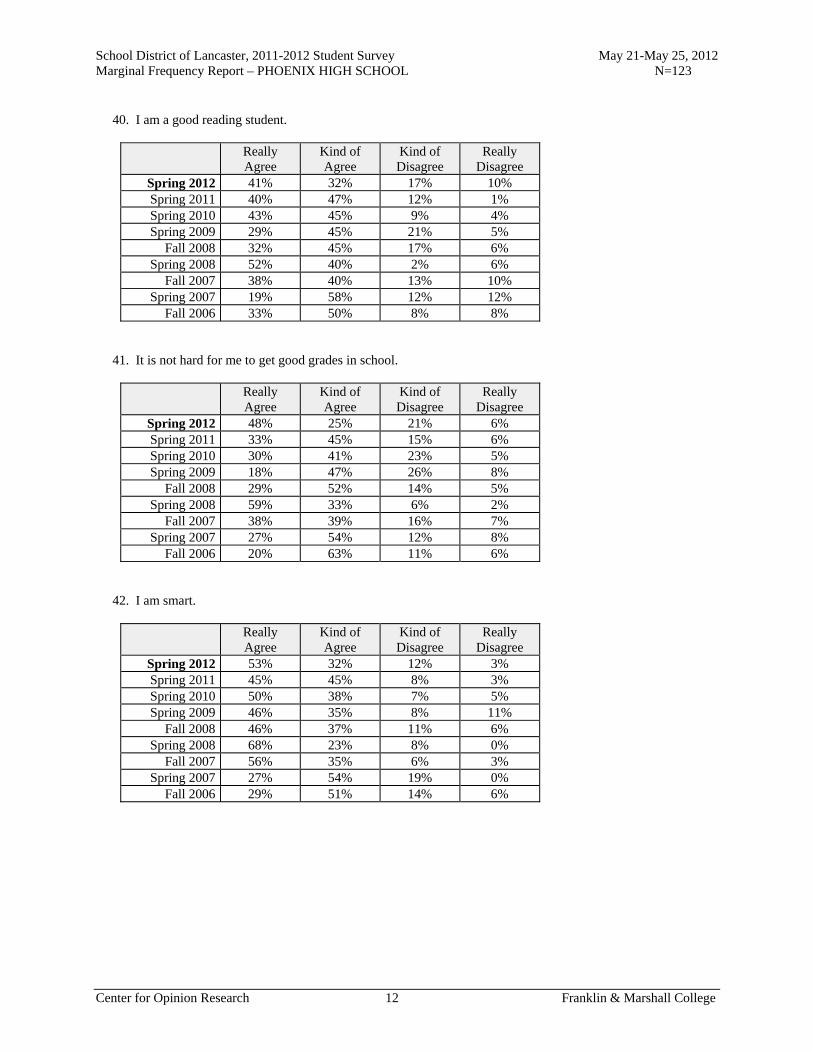
School District of Lancaster, 2011-2012 Student Survey May 21-May 25, 2012 Marginal Frequency Report – PHOENIX HIGH SCHOOL N=123
Center for Opinion Research 12 Franklin & Marshall College
40. I am a good reading student.
Really Agree
Kind of Agree
Kind of Disagree
Really Disagree
Spring 2012 41% 32% 17% 10% Spring 2011 40% 47% 12% 1% Spring 2010 43% 45% 9% 4% Spring 2009 29% 45% 21% 5%
Fall 2008 32% 45% 17% 6% Spring 2008 52% 40% 2% 6%
Fall 2007 38% 40% 13% 10% Spring 2007 19% 58% 12% 12%
Fall 2006 33% 50% 8% 8% 41. It is not hard for me to get good grades in school.
Really Agree
Kind of Agree
Kind of Disagree
Really Disagree
Spring 2012 48% 25% 21% 6% Spring 2011 33% 45% 15% 6% Spring 2010 30% 41% 23% 5% Spring 2009 18% 47% 26% 8%
Fall 2008 29% 52% 14% 5% Spring 2008 59% 33% 6% 2%
Fall 2007 38% 39% 16% 7% Spring 2007 27% 54% 12% 8%
Fall 2006 20% 63% 11% 6% 42. I am smart.
Really Agree
Kind of Agree
Kind of Disagree
Really Disagree
Spring 2012 53% 32% 12% 3% Spring 2011 45% 45% 8% 3% Spring 2010 50% 38% 7% 5% Spring 2009 46% 35% 8% 11%
Fall 2008 46% 37% 11% 6% Spring 2008 68% 23% 8% 0%
Fall 2007 56% 35% 6% 3% Spring 2007 27% 54% 19% 0%
Fall 2006 29% 51% 14% 6%
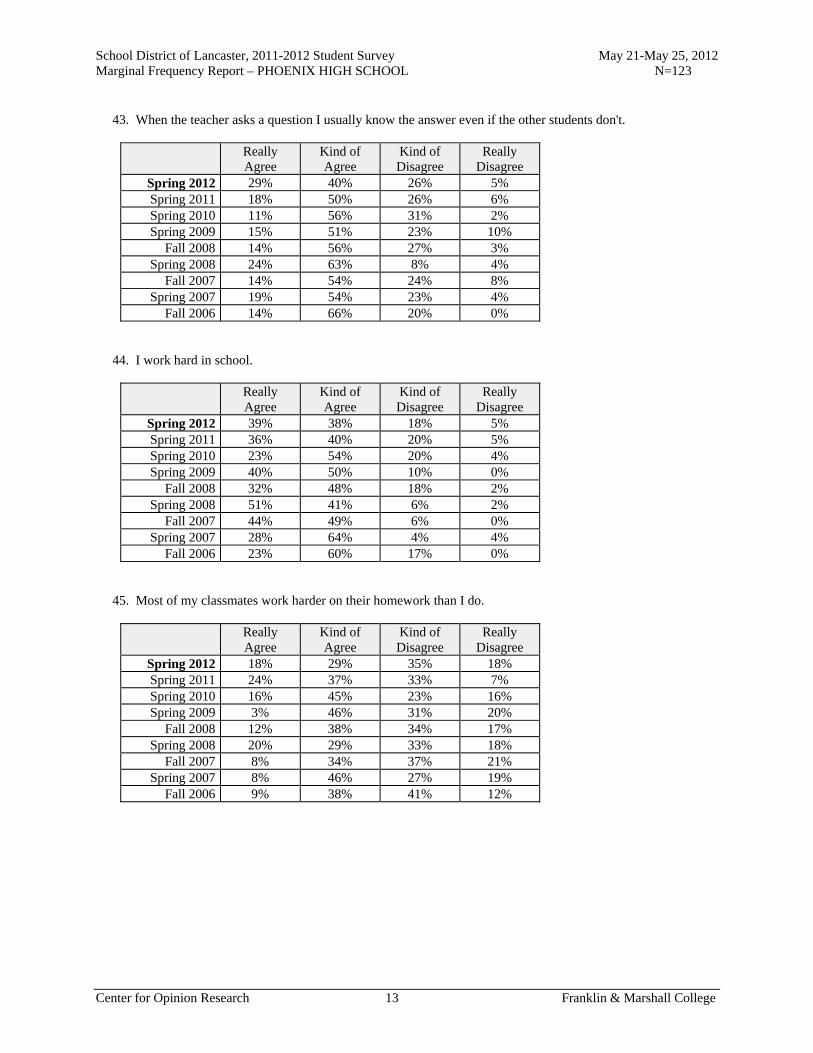
School District of Lancaster, 2011-2012 Student Survey May 21-May 25, 2012 Marginal Frequency Report – PHOENIX HIGH SCHOOL N=123
Center for Opinion Research 13 Franklin & Marshall College
43. When the teacher asks a question I usually know the answer even if the other students don't.
Really Agree
Kind of Agree
Kind of Disagree
Really Disagree
Spring 2012 29% 40% 26% 5% Spring 2011 18% 50% 26% 6% Spring 2010 11% 56% 31% 2% Spring 2009 15% 51% 23% 10%
Fall 2008 14% 56% 27% 3% Spring 2008 24% 63% 8% 4%
Fall 2007 14% 54% 24% 8% Spring 2007 19% 54% 23% 4%
Fall 2006 14% 66% 20% 0% 44. I work hard in school.
Really Agree
Kind of Agree
Kind of Disagree
Really Disagree
Spring 2012 39% 38% 18% 5% Spring 2011 36% 40% 20% 5% Spring 2010 23% 54% 20% 4% Spring 2009 40% 50% 10% 0%
Fall 2008 32% 48% 18% 2% Spring 2008 51% 41% 6% 2%
Fall 2007 44% 49% 6% 0% Spring 2007 28% 64% 4% 4%
Fall 2006 23% 60% 17% 0% 45. Most of my classmates work harder on their homework than I do.
Really Agree
Kind of Agree
Kind of Disagree
Really Disagree
Spring 2012 18% 29% 35% 18% Spring 2011 24% 37% 33% 7% Spring 2010 16% 45% 23% 16% Spring 2009 3% 46% 31% 20%
Fall 2008 12% 38% 34% 17% Spring 2008 20% 29% 33% 18%
Fall 2007 8% 34% 37% 21% Spring 2007 8% 46% 27% 19%
Fall 2006 9% 38% 41% 12%

School District of Lancaster, 2011-2012 Student Survey May 21-May 25, 2012 Marginal Frequency Report – PHOENIX HIGH SCHOOL N=123
Center for Opinion Research 14 Franklin & Marshall College
46. I always get good grades when I try hard.
Really Agree
Kind of Agree
Kind of Disagree
Really Disagree
Spring 2012 50% 35% 11% 4% Spring 2011 56% 34% 6% 4% Spring 2010 48% 39% 12% 0% Spring 2009 50% 37% 10% 3%
Fall 2008 46% 42% 11% 1% Spring 2008 66% 28% 6% 0%
Fall 2007 55% 39% 6% 0% Spring 2007 56% 36% 8% 0%
Fall 2006 43% 51% 6% 0% 47. I usually do not get good grades in math because it is too hard.
Really Agree
Kind of Agree
Kind of Disagree
Really Disagree
Spring 2012 21% 27% 29% 23% Spring 2011 19% 31% 33% 17% Spring 2010 16% 24% 40% 20% Spring 2009 16% 21% 29% 34%
Fall 2008 13% 29% 28% 29% Spring 2008 14% 20% 20% 45%
Fall 2007 14% 32% 19% 34% Spring 2007 4% 23% 38% 35%
Fall 2006 20% 23% 43% 14% 48. Most of my classmates like to do math because it is easy.
Really Agree
Kind of Agree
Kind of Disagree
Really Disagree
Spring 2012 18% 34% 35% 13% Spring 2011 20% 25% 39% 16% Spring 2010 6% 30% 50% 15% Spring 2009 13% 31% 33% 23%
Fall 2008 14% 36% 38% 11% Spring 2008 20% 14% 49% 16%
Fall 2007 15% 39% 31% 15% Spring 2007 12% 40% 24% 24%
Fall 2006 18% 35% 38% 9%

School District of Lancaster, 2011-2012 Student Survey May 21-May 25, 2012 Marginal Frequency Report – PHOENIX HIGH SCHOOL N=123
Center for Opinion Research 15 Franklin & Marshall College
49. I would get better grades if my teacher liked me more.
Really Agree
Kind of Agree
Kind of Disagree
Really Disagree
Spring 2012 17% 18% 29% 36% Spring 2011 9% 8% 37% 46% Spring 2010 11% 27% 38% 25% Spring 2009 5% 16% 32% 47%
Fall 2008 10% 16% 27% 46% Spring 2008 10% 12% 29% 49%
Fall 2007 7% 10% 31% 52% Spring 2007 8% 12% 20% 60%
Fall 2006 6% 18% 41% 35% 50. I will graduate from high school.
Really Agree
Kind of Agree
Kind of Disagree
Really Disagree
Spring 2012 79% 14% 4% 3% Spring 2011 72% 22% 5% 1% Spring 2010 93% 4% 4% 0% Spring 2009 92% 3% 3% 3%
Fall 2008 80% 16% 4% 0% Spring 2008 88% 10% 2% 0%
Fall 2007 88% 8% 3% 0% Spring 2007 96% 4% 0% 0%
Fall 2006 86% 6% 9% 0% 51. I go to a good school.
Really Agree
Kind of Agree
Kind of Disagree
Really Disagree
Spring 2012 34% 37% 16% 13% Spring 2011 46% 33% 17% 4% Spring 2010 36% 44% 13% 7% Spring 2009 53% 42% 6% 0%
Fall 2008 36% 51% 10% 3% Spring 2008 56% 29% 10% 4%
Fall 2007 53% 42% 2% 3% Spring 2007 56% 24% 20% 0%
Fall 2006 43% 34% 20% 3%
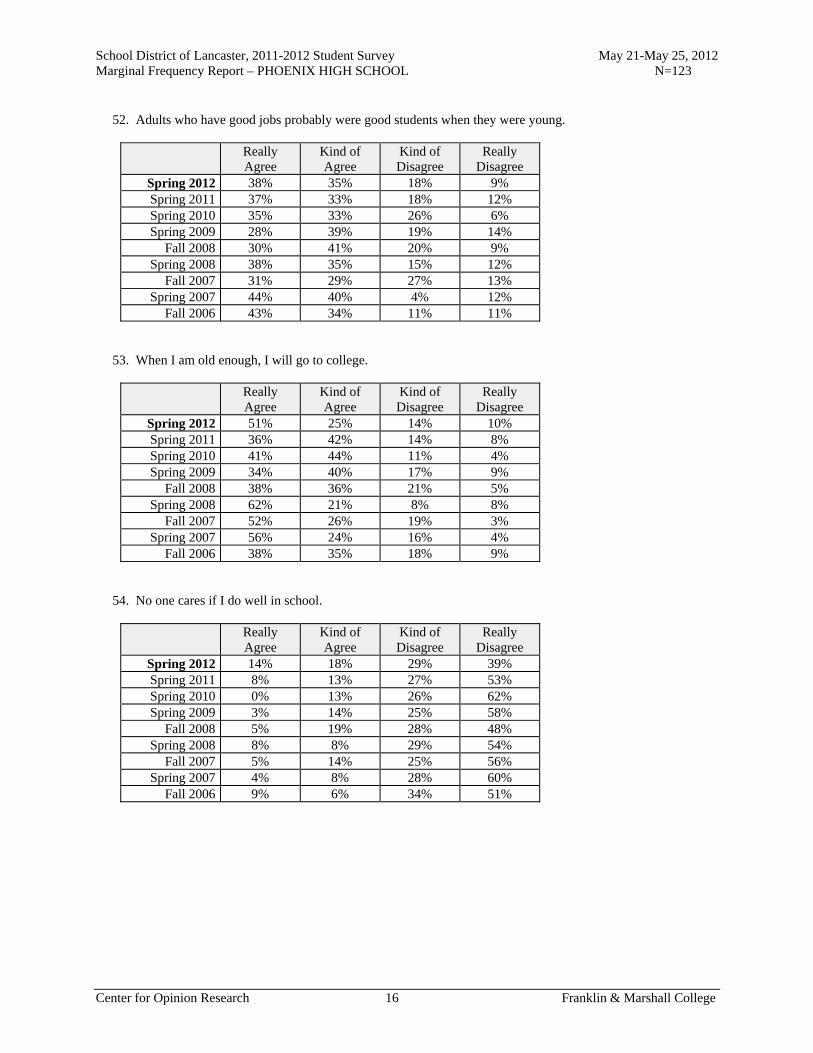
School District of Lancaster, 2011-2012 Student Survey May 21-May 25, 2012 Marginal Frequency Report – PHOENIX HIGH SCHOOL N=123
Center for Opinion Research 16 Franklin & Marshall College
52. Adults who have good jobs probably were good students when they were young.
Really Agree
Kind of Agree
Kind of Disagree
Really Disagree
Spring 2012 38% 35% 18% 9% Spring 2011 37% 33% 18% 12% Spring 2010 35% 33% 26% 6% Spring 2009 28% 39% 19% 14%
Fall 2008 30% 41% 20% 9% Spring 2008 38% 35% 15% 12%
Fall 2007 31% 29% 27% 13% Spring 2007 44% 40% 4% 12%
Fall 2006 43% 34% 11% 11% 53. When I am old enough, I will go to college.
Really Agree
Kind of Agree
Kind of Disagree
Really Disagree
Spring 2012 51% 25% 14% 10% Spring 2011 36% 42% 14% 8% Spring 2010 41% 44% 11% 4% Spring 2009 34% 40% 17% 9%
Fall 2008 38% 36% 21% 5% Spring 2008 62% 21% 8% 8%
Fall 2007 52% 26% 19% 3% Spring 2007 56% 24% 16% 4%
Fall 2006 38% 35% 18% 9% 54. No one cares if I do well in school.
Really Agree
Kind of Agree
Kind of Disagree
Really Disagree
Spring 2012 14% 18% 29% 39% Spring 2011 8% 13% 27% 53% Spring 2010 0% 13% 26% 62% Spring 2009 3% 14% 25% 58%
Fall 2008 5% 19% 28% 48% Spring 2008 8% 8% 29% 54%
Fall 2007 5% 14% 25% 56% Spring 2007 4% 8% 28% 60%
Fall 2006 9% 6% 34% 51%

School District of Lancaster, 2011-2012 Student Survey May 21-May 25, 2012 Marginal Frequency Report – PHOENIX HIGH SCHOOL N=123
Center for Opinion Research 17 Franklin & Marshall College
55. What I learn in school is not important.
Really Agree
Kind of Agree
Kind of Disagree
Really Disagree
Spring 2012 9% 22% 26% 43% Spring 2011 6% 14% 19% 60% Spring 2010 6% 13% 26% 56% Spring 2009 3% 11% 24% 62%
Fall 2008 6% 17% 26% 51% Spring 2008 10% 10% 25% 54%
Fall 2007 8% 11% 24% 56% Spring 2007 4% 4% 28% 64%
Fall 2006 11% 6% 34% 49% 56. It does not matter if I do well in school.
Really Agree
Kind of Agree
Kind of Disagree
Really Disagree
Spring 2012 14% 16% 22% 48% Spring 2011 8% 13% 23% 56% Spring 2010 2% 6% 22% 71% Spring 2009 8% 5% 19% 68%
Fall 2008 6% 15% 22% 57% Spring 2008 4% 6% 23% 67%
Fall 2007 3% 10% 19% 68% Spring 2007 0% 0% 25% 75%
Fall 2006 9% 9% 31% 51% 57. Students who get better grades than I do get more help from the teacher than I do.
Really Agree
Kind of Agree
Kind of Disagree
Really Disagree
Spring 2012 11% 25% 35% 28% Spring 2011 15% 20% 41% 23% Spring 2010 16% 24% 31% 29% Spring 2009 11% 14% 36% 39%
Fall 2008 8% 31% 32% 29% Spring 2008 8% 22% 24% 45%
Fall 2007 8% 20% 37% 35% Spring 2007 4% 24% 24% 48%
Fall 2006 3% 29% 40% 29%

School District of Lancaster, 2011-2012 Student Survey May 21-May 25, 2012 Marginal Frequency Report – PHOENIX HIGH SCHOOL N=123
Center for Opinion Research 18 Franklin & Marshall College
58. I will quit school as soon as I can.
Really Agree
Kind of Agree
Kind of Disagree
Really Disagree
Spring 2012 13% 13% 20% 54% Spring 2011 6% 13% 14% 67% Spring 2010 2% 4% 16% 79% Spring 2009 0% 3% 8% 89%
Fall 2008 6% 10% 18% 68% Spring 2008 4% 6% 8% 82%
Fall 2007 0% 7% 10% 84% Spring 2007 0% 0% 20% 80%
Fall 2006 6% 6% 21% 68% 59. Teachers like students even if they do not always make good grades.
Really Agree
Kind of Agree
Kind of Disagree
Really Disagree
Spring 2012 26% 47% 17% 10% Spring 2011 30% 54% 10% 6% Spring 2010 21% 55% 23% 0% Spring 2009 19% 72% 6% 3%
Fall 2008 29% 52% 14% 4% Spring 2008 41% 39% 9% 11%
Fall 2007 39% 52% 5% 5% Spring 2007 56% 20% 16% 8%
Fall 2006 26% 50% 18% 6% 60. It is important to go to high school.
Really Agree
Kind of Agree
Kind of Disagree
Really Disagree
Spring 2012 68% 14% 13% 4% Spring 2011 71% 21% 3% 5% Spring 2010 80% 13% 6% 2% Spring 2009 86% 14% 0% 0%
Fall 2008 69% 24% 5% 2% Spring 2008 90% 10% 0% 0%
Fall 2007 81% 18% 2% 0% Spring 2007 76% 24% 0% 0%
Fall 2006 82% 18% 0% 0%

School District of Lancaster, 2011-2012 Student Survey May 21-May 25, 2012 Marginal Frequency Report – PHOENIX HIGH SCHOOL N=123
Center for Opinion Research 19 Franklin & Marshall College
61. How often do you take books home to study?
Every Night Most Nights Some Nights Never Spring 2012 8% 10% 29% 53% Spring 2011 14% 10% 37% 38% Spring 2010 0% 7% 31% 62% Spring 2009 3% 0% 19% 78%
Fall 2008 6% 5% 27% 62% Career Self-Efficacy Please rate how confident you are that you could successfully perform the following tasks. I am confident that... (1=very low confidence, 7=very high confidence) 62. I can make plans beyond graduation.
Mean Score Spring 2012 5.35 Spring 2011 5.35 Spring 2010 5.41 Spring 2009 5.44
Fall 2008 5.14 Spring 2008 5.85
Fall 2007 5.55 Spring 2007 5.46
Fall 2006 5.50 63. I know how the place where I live affects job opportunities.
Mean Score Spring 2012 4.15 Spring 2011 4.29 Spring 2010 4.18 Spring 2009 3.94
Fall 2008 4.27 Spring 2008 4.72
Fall 2007 3.97 Spring 2007 4.33
Fall 2006 4.34
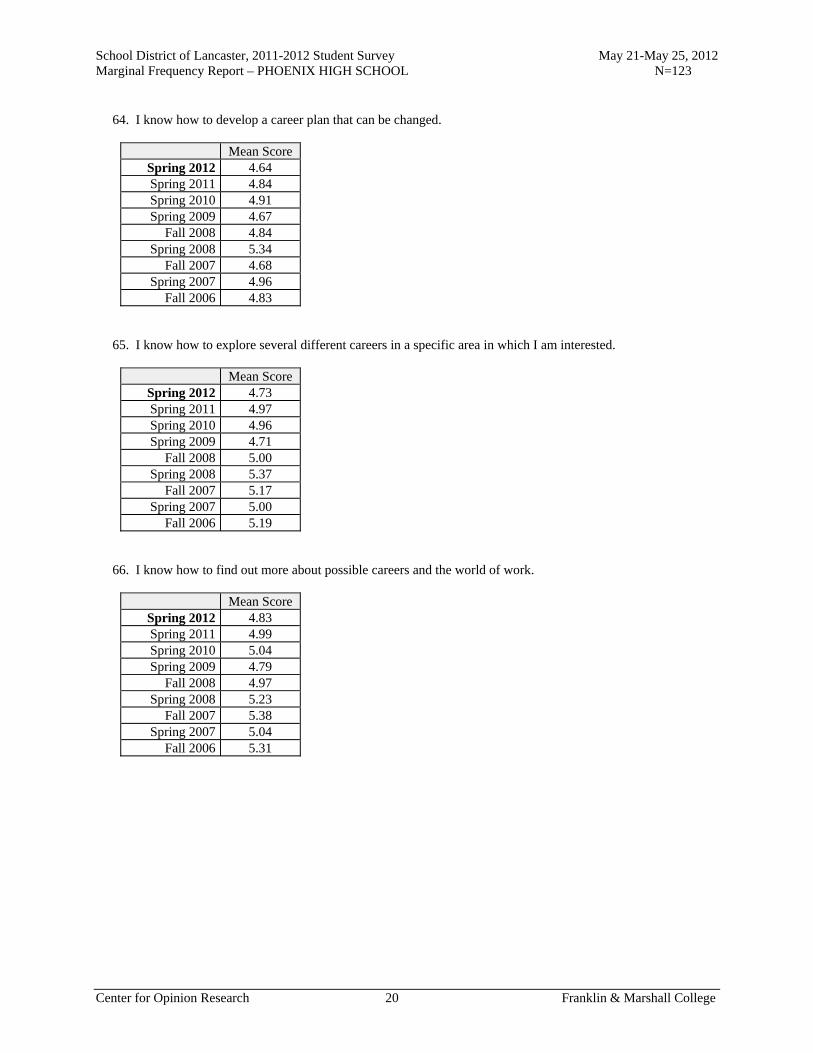
School District of Lancaster, 2011-2012 Student Survey May 21-May 25, 2012 Marginal Frequency Report – PHOENIX HIGH SCHOOL N=123
Center for Opinion Research 20 Franklin & Marshall College
64. I know how to develop a career plan that can be changed.
Mean Score Spring 2012 4.64 Spring 2011 4.84 Spring 2010 4.91 Spring 2009 4.67
Fall 2008 4.84 Spring 2008 5.34
Fall 2007 4.68 Spring 2007 4.96
Fall 2006 4.83 65. I know how to explore several different careers in a specific area in which I am interested.
Mean Score Spring 2012 4.73 Spring 2011 4.97 Spring 2010 4.96 Spring 2009 4.71
Fall 2008 5.00 Spring 2008 5.37
Fall 2007 5.17 Spring 2007 5.00
Fall 2006 5.19 66. I know how to find out more about possible careers and the world of work.
Mean Score Spring 2012 4.83 Spring 2011 4.99 Spring 2010 5.04 Spring 2009 4.79
Fall 2008 4.97 Spring 2008 5.23
Fall 2007 5.38 Spring 2007 5.04
Fall 2006 5.31

School District of Lancaster, 2011-2012 Student Survey May 21-May 25, 2012 Marginal Frequency Report – PHOENIX HIGH SCHOOL N=123
Center for Opinion Research 21 Franklin & Marshall College
67. I know how to prepare for careers in which I am interested.
Mean Score Spring 2012 4.82 Spring 2011 5.19 Spring 2010 5.05 Spring 2009 4.94
Fall 2008 5.13 Spring 2008 5.39
Fall 2007 5.37 Spring 2007 5.40
Fall 2006 5.44 68. I understand my interests and abilities and how they help me make a career choice.
Mean Score Spring 2012 4.99 Spring 2011 5.17 Spring 2010 5.50 Spring 2009 5.15
Fall 2008 5.14 Spring 2008 5.53
Fall 2007 5.59 Spring 2007 5.40
Fall 2006 5.37 69. I know about various colleges and what they have to offer.
Mean Score Spring 2012 4.66 Spring 2011 4.62 Spring 2010 4.61 Spring 2009 4.50
Fall 2008 4.49 Spring 2008 4.96
Fall 2007 4.66 Spring 2007 4.72
Fall 2006 4.83 70. I know how to choose college courses that would help prepare me for a career.
Mean Score Spring 2012 4.66 Spring 2011 4.73 Spring 2010 4.51 Spring 2009 4.76
Fall 2008 4.37 Spring 2008 4.77
Fall 2007 4.69 Spring 2007 4.80
Fall 2006 4.74
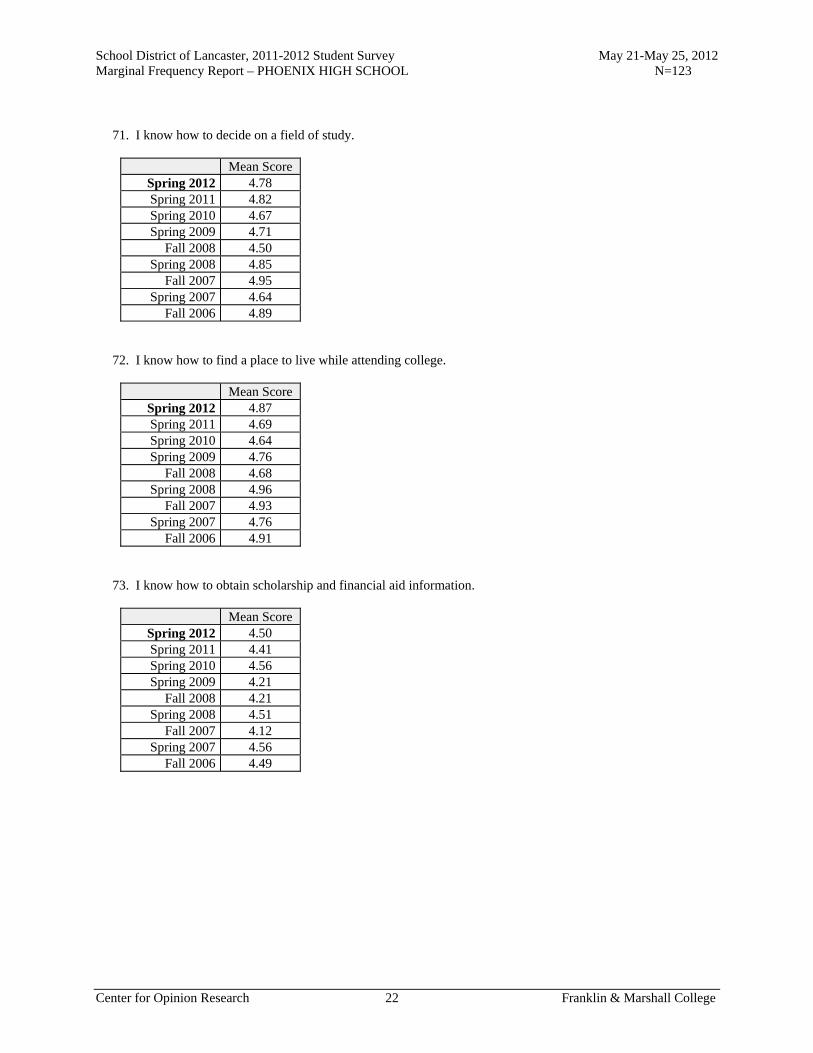
School District of Lancaster, 2011-2012 Student Survey May 21-May 25, 2012 Marginal Frequency Report – PHOENIX HIGH SCHOOL N=123
Center for Opinion Research 22 Franklin & Marshall College
71. I know how to decide on a field of study.
Mean Score Spring 2012 4.78 Spring 2011 4.82 Spring 2010 4.67 Spring 2009 4.71
Fall 2008 4.50 Spring 2008 4.85
Fall 2007 4.95 Spring 2007 4.64
Fall 2006 4.89 72. I know how to find a place to live while attending college.
Mean Score Spring 2012 4.87 Spring 2011 4.69 Spring 2010 4.64 Spring 2009 4.76
Fall 2008 4.68 Spring 2008 4.96
Fall 2007 4.93 Spring 2007 4.76
Fall 2006 4.91 73. I know how to obtain scholarship and financial aid information.
Mean Score Spring 2012 4.50 Spring 2011 4.41 Spring 2010 4.56 Spring 2009 4.21
Fall 2008 4.21 Spring 2008 4.51
Fall 2007 4.12 Spring 2007 4.56
Fall 2006 4.49
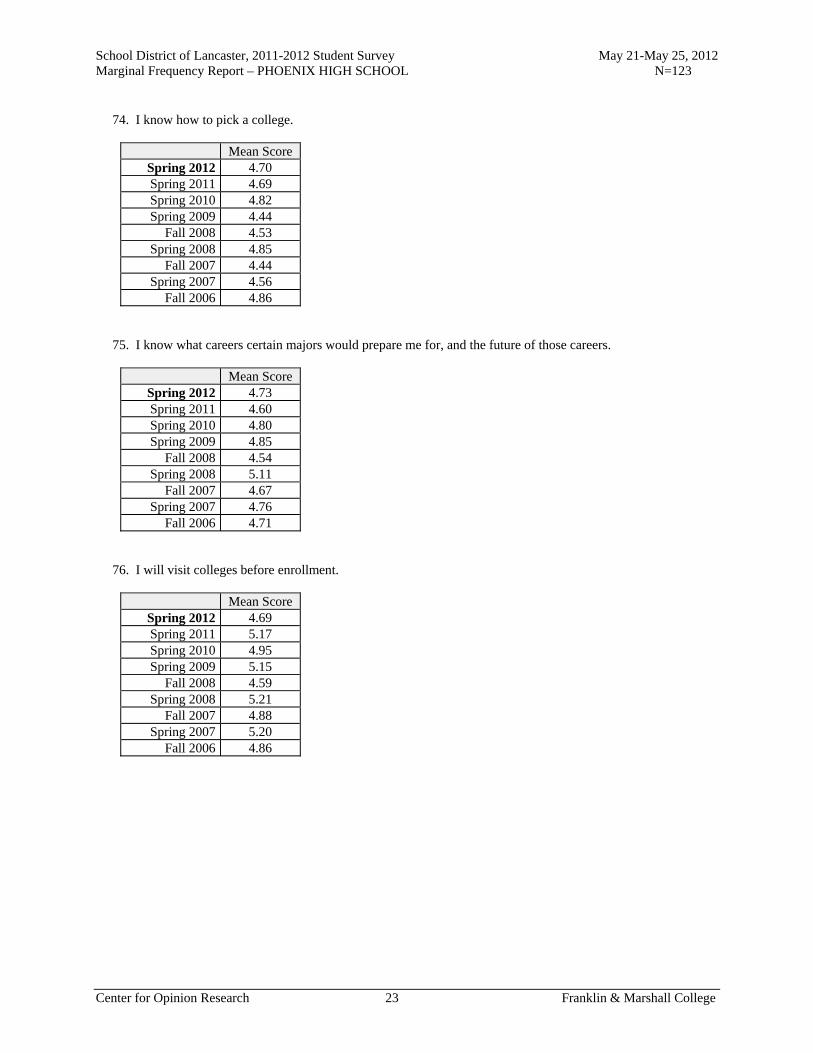
School District of Lancaster, 2011-2012 Student Survey May 21-May 25, 2012 Marginal Frequency Report – PHOENIX HIGH SCHOOL N=123
Center for Opinion Research 23 Franklin & Marshall College
74. I know how to pick a college.
Mean Score Spring 2012 4.70 Spring 2011 4.69 Spring 2010 4.82 Spring 2009 4.44
Fall 2008 4.53 Spring 2008 4.85
Fall 2007 4.44 Spring 2007 4.56
Fall 2006 4.86 75. I know what careers certain majors would prepare me for, and the future of those careers.
Mean Score Spring 2012 4.73 Spring 2011 4.60 Spring 2010 4.80 Spring 2009 4.85
Fall 2008 4.54 Spring 2008 5.11
Fall 2007 4.67 Spring 2007 4.76
Fall 2006 4.71 76. I will visit colleges before enrollment.
Mean Score Spring 2012 4.69 Spring 2011 5.17 Spring 2010 4.95 Spring 2009 5.15
Fall 2008 4.59 Spring 2008 5.21
Fall 2007 4.88 Spring 2007 5.20
Fall 2006 4.86

School District of Lancaster, 2011-2012 Student Survey May 21-May 25, 2012 Marginal Frequency Report – PHOENIX HIGH SCHOOL N=123
Center for Opinion Research 24 Franklin & Marshall College
77. I can complete job application forms properly.
Mean Score Spring 2012 4.96 Spring 2011 5.29 Spring 2010 5.22 Spring 2009 5.52
Fall 2008 5.23 Spring 2008 5.68
Fall 2007 6.12 Spring 2007 5.65
Fall 2006 5.51 78. I can develop a resume.
Mean Score Spring 2012 4.59 Spring 2011 5.19 Spring 2010 5.07 Spring 2009 5.06
Fall 2008 4.69 Spring 2008 5.28
Fall 2007 5.16 Spring 2007 5.19
Fall 2006 4.71 79. I know how to participate in practice job interviews.
Mean Score Spring 2012 4.69 Spring 2011 5.17 Spring 2010 5.18 Spring 2009 5.13
Fall 2008 4.86 Spring 2008 5.49
Fall 2007 5.58 Spring 2007 5.23
Fall 2006 4.94
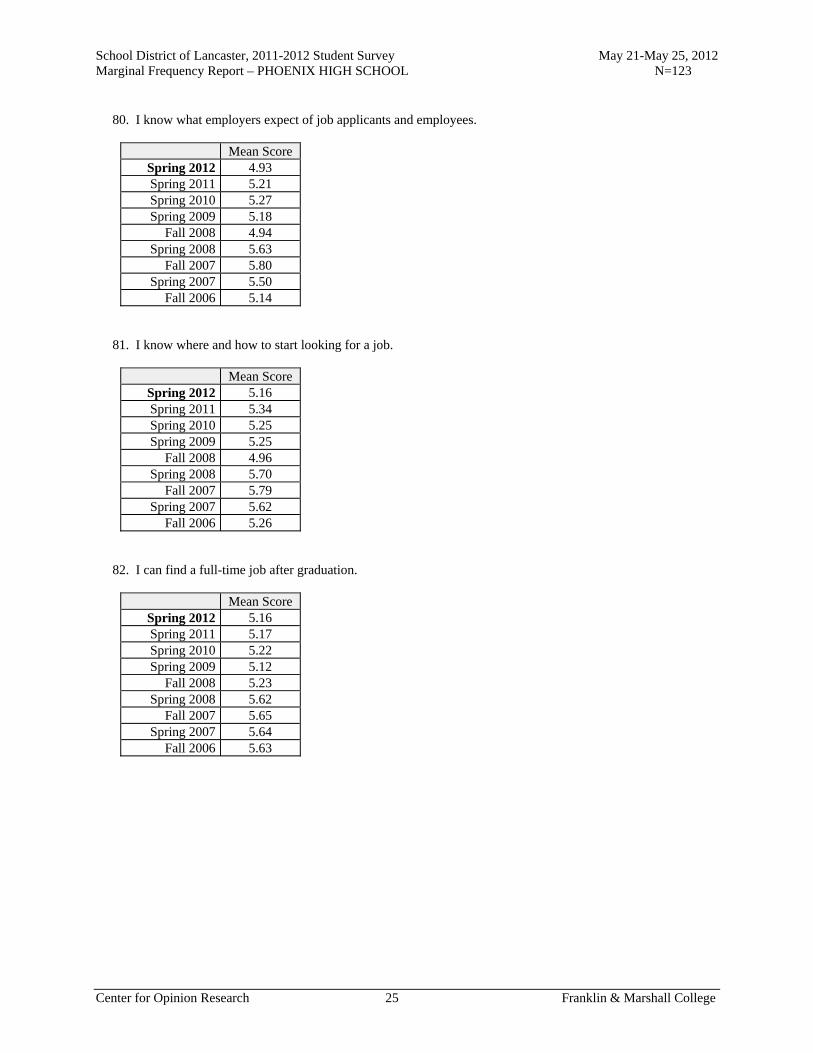
School District of Lancaster, 2011-2012 Student Survey May 21-May 25, 2012 Marginal Frequency Report – PHOENIX HIGH SCHOOL N=123
Center for Opinion Research 25 Franklin & Marshall College
80. I know what employers expect of job applicants and employees.
Mean Score Spring 2012 4.93 Spring 2011 5.21 Spring 2010 5.27 Spring 2009 5.18
Fall 2008 4.94 Spring 2008 5.63
Fall 2007 5.80 Spring 2007 5.50
Fall 2006 5.14 81. I know where and how to start looking for a job.
Mean Score Spring 2012 5.16 Spring 2011 5.34 Spring 2010 5.25 Spring 2009 5.25
Fall 2008 4.96 Spring 2008 5.70
Fall 2007 5.79 Spring 2007 5.62
Fall 2006 5.26 82. I can find a full-time job after graduation.
Mean Score Spring 2012 5.16 Spring 2011 5.17 Spring 2010 5.22 Spring 2009 5.12
Fall 2008 5.23 Spring 2008 5.62
Fall 2007 5.65 Spring 2007 5.64
Fall 2006 5.63
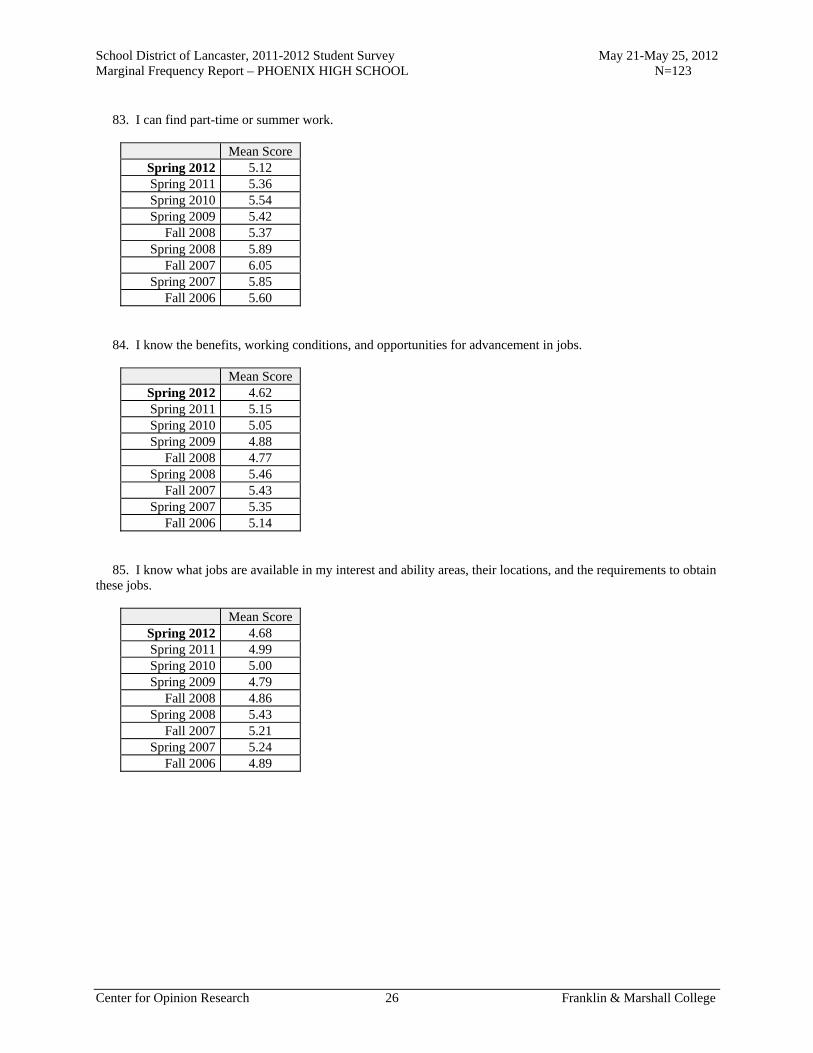
School District of Lancaster, 2011-2012 Student Survey May 21-May 25, 2012 Marginal Frequency Report – PHOENIX HIGH SCHOOL N=123
Center for Opinion Research 26 Franklin & Marshall College
83. I can find part-time or summer work.
Mean Score Spring 2012 5.12 Spring 2011 5.36 Spring 2010 5.54 Spring 2009 5.42
Fall 2008 5.37 Spring 2008 5.89
Fall 2007 6.05 Spring 2007 5.85
Fall 2006 5.60 84. I know the benefits, working conditions, and opportunities for advancement in jobs.
Mean Score Spring 2012 4.62 Spring 2011 5.15 Spring 2010 5.05 Spring 2009 4.88
Fall 2008 4.77 Spring 2008 5.46
Fall 2007 5.43 Spring 2007 5.35
Fall 2006 5.14 85. I know what jobs are available in my interest and ability areas, their locations, and the requirements to obtain these jobs.
Mean Score Spring 2012 4.68 Spring 2011 4.99 Spring 2010 5.00 Spring 2009 4.79
Fall 2008 4.86 Spring 2008 5.43
Fall 2007 5.21 Spring 2007 5.24
Fall 2006 4.89
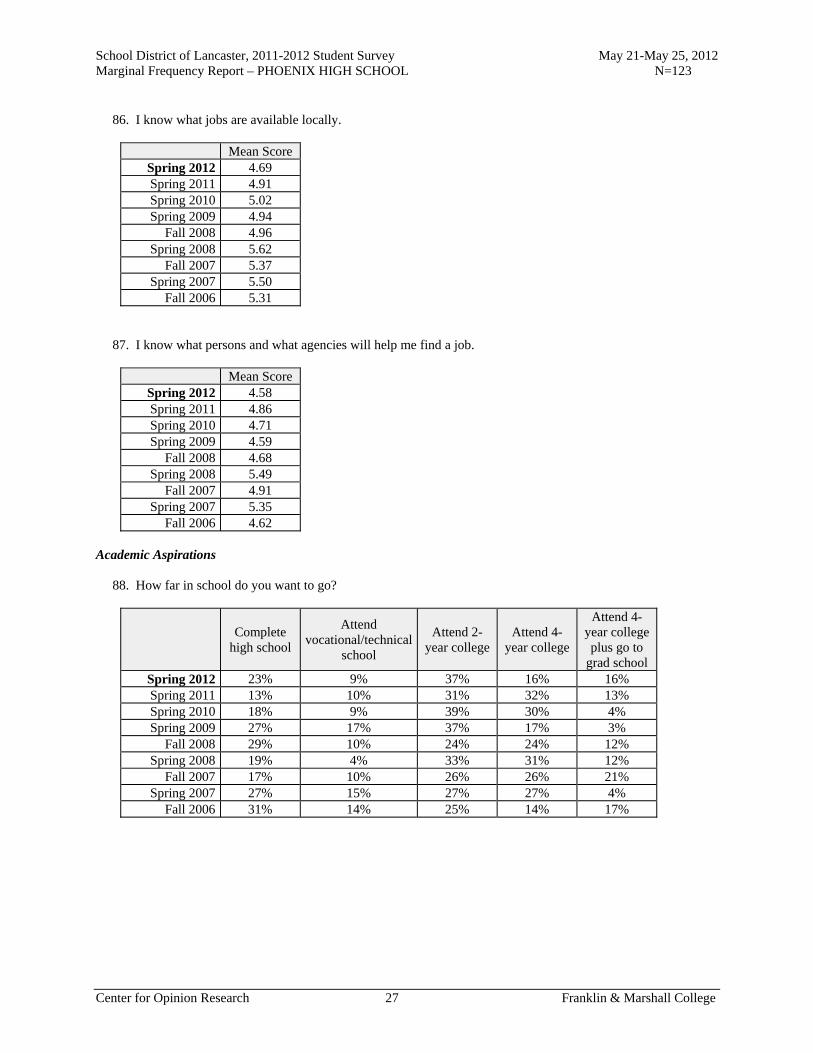
School District of Lancaster, 2011-2012 Student Survey May 21-May 25, 2012 Marginal Frequency Report – PHOENIX HIGH SCHOOL N=123
Center for Opinion Research 27 Franklin & Marshall College
86. I know what jobs are available locally.
Mean Score Spring 2012 4.69 Spring 2011 4.91 Spring 2010 5.02 Spring 2009 4.94
Fall 2008 4.96 Spring 2008 5.62
Fall 2007 5.37 Spring 2007 5.50
Fall 2006 5.31 87. I know what persons and what agencies will help me find a job.
Mean Score Spring 2012 4.58 Spring 2011 4.86 Spring 2010 4.71 Spring 2009 4.59
Fall 2008 4.68 Spring 2008 5.49
Fall 2007 4.91 Spring 2007 5.35
Fall 2006 4.62 Academic Aspirations 88. How far in school do you want to go?
Complete
high school
Attend vocational/technical
school
Attend 2-year college
Attend 4-year college
Attend 4-year college plus go to
grad school Spring 2012 23% 9% 37% 16% 16% Spring 2011 13% 10% 31% 32% 13% Spring 2010 18% 9% 39% 30% 4% Spring 2009 27% 17% 37% 17% 3%
Fall 2008 29% 10% 24% 24% 12% Spring 2008 19% 4% 33% 31% 12%
Fall 2007 17% 10% 26% 26% 21% Spring 2007 27% 15% 27% 27% 4%
Fall 2006 31% 14% 25% 14% 17%

School District of Lancaster, 2011-2012 Student Survey May 21-May 25, 2012 Marginal Frequency Report – PHOENIX HIGH SCHOOL N=123
Center for Opinion Research 28 Franklin & Marshall College
89. How important do you believe getting a college education is to your future success? Would you say it is...
Very
important Somewhat important
Not very important
Not important at
all Spring 2012 65% 22% 9% 4% Spring 2011 71% 17% 9% 3% Spring 2010 74% 20% 2% 4% Spring 2009 69% 25% 6% 0%
Fall 2008 68% 24% 5% 3% Spring 2008 71% 19% 8% 2%
Fall 2007 66% 29% 3% 2% Spring 2007 81% 15% 4% 0%
Fall 2006 69% 23% 6% 3% 90. How important would your parent/guardian say getting a college education is to your future success? Would your parents say it is...
Very
important Somewhat important
Not very important
Not important at
all Spring 2012 69% 17% 10% 4% Spring 2011 80% 13% 3% 4% Spring 2010 76% 22% 2% 0% Spring 2009 69% 28% 3% 0%
Fall 2008 71% 22% 6% 2% Spring 2008 83% 15% 2% 0%
Fall 2007 78% 21% 2% 0% Spring 2007 77% 19% 4% 0%
Fall 2006 71% 29% 0% 0% 91. How important would your teachers say getting a college education is to your future success? Would your teachers say it is...
Very
important Somewhat important
Not very important
Not important at
all Spring 2012 79% 9% 8% 4% Spring 2011 83% 13% 1% 3% Spring 2010 87% 9% 4% 0% Spring 2009 94% 6% 0% 0%
Fall 2008 82% 14% 2% 2% Spring 2008 83% 17% 0% 0%
Fall 2007 89% 11% 0% 0% Spring 2007 92% 8% 0% 0%
Fall 2006 83% 14% 0% 3%
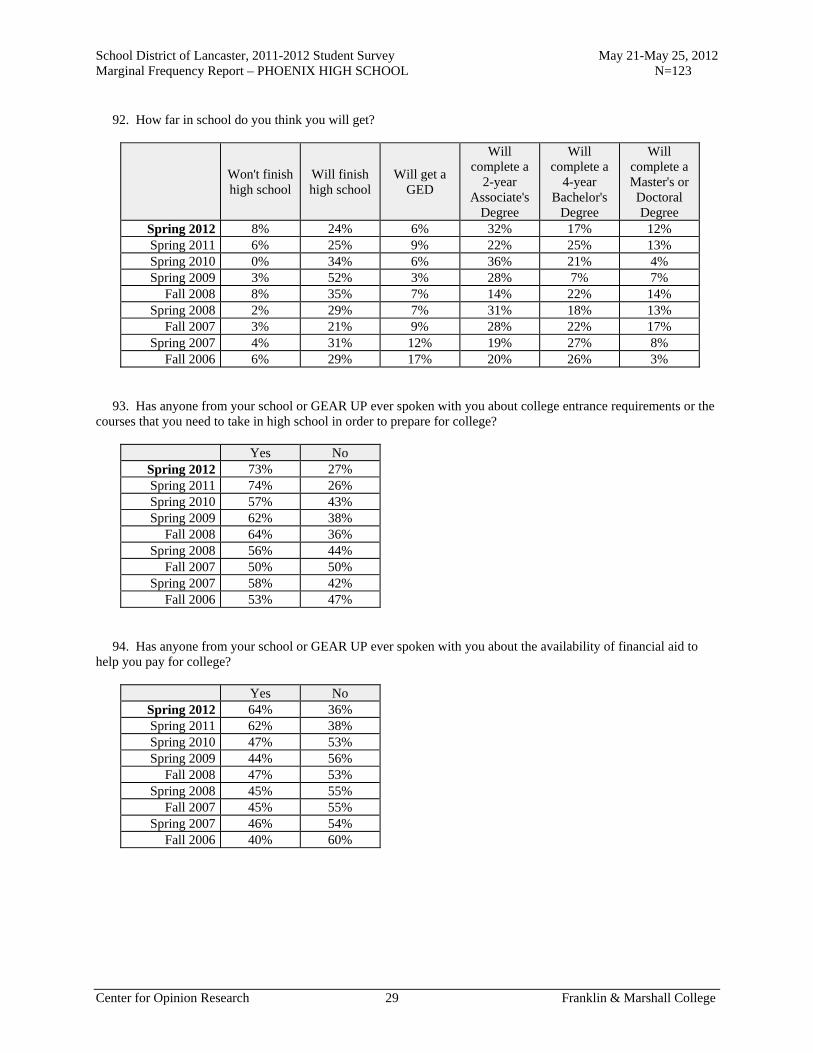
School District of Lancaster, 2011-2012 Student Survey May 21-May 25, 2012 Marginal Frequency Report – PHOENIX HIGH SCHOOL N=123
Center for Opinion Research 29 Franklin & Marshall College
92. How far in school do you think you will get?
Won't finish high school
Will finish high school
Will get a GED
Will complete a
2-year Associate's
Degree
Will complete a
4-year Bachelor's
Degree
Will complete a Master's or Doctoral Degree
Spring 2012 8% 24% 6% 32% 17% 12% Spring 2011 6% 25% 9% 22% 25% 13% Spring 2010 0% 34% 6% 36% 21% 4% Spring 2009 3% 52% 3% 28% 7% 7%
Fall 2008 8% 35% 7% 14% 22% 14% Spring 2008 2% 29% 7% 31% 18% 13%
Fall 2007 3% 21% 9% 28% 22% 17% Spring 2007 4% 31% 12% 19% 27% 8%
Fall 2006 6% 29% 17% 20% 26% 3% 93. Has anyone from your school or GEAR UP ever spoken with you about college entrance requirements or the courses that you need to take in high school in order to prepare for college?
Yes No Spring 2012 73% 27% Spring 2011 74% 26% Spring 2010 57% 43% Spring 2009 62% 38%
Fall 2008 64% 36% Spring 2008 56% 44%
Fall 2007 50% 50% Spring 2007 58% 42%
Fall 2006 53% 47% 94. Has anyone from your school or GEAR UP ever spoken with you about the availability of financial aid to help you pay for college?
Yes No Spring 2012 64% 36% Spring 2011 62% 38% Spring 2010 47% 53% Spring 2009 44% 56%
Fall 2008 47% 53% Spring 2008 45% 55%
Fall 2007 45% 55% Spring 2007 46% 54%
Fall 2006 40% 60%

School District of Lancaster, 2011-2012 Student Survey May 21-May 25, 2012 Marginal Frequency Report – PHOENIX HIGH SCHOOL N=123
Center for Opinion Research 30 Franklin & Marshall College
95. Do you think that you could afford to attend a public 4-year college (for example, Millersville University) using financial aid, scholarships, and your family's resources?
Definitely Probably Not Sure Probably
Not Definitely
Not Spring 2012 35% 30% 23% 6% 6% Spring 2011 13% 38% 28% 6% 14% Spring 2010 13% 34% 30% 15% 8% Spring 2009 12% 28% 28% 19% 12%
Fall 2008 16% 36% 28% 12% 9% Spring 2008 17% 35% 20% 17% 11%
Fall 2007 12% 43% 24% 7% 14% Spring 2007 31% 35% 19% 12% 4%
Fall 2006 17% 29% 37% 11% 6% 96. On a scale of 1 to 5, to what extent are you knowledgeable about financial aid and the cost and benefits to you in pursuing postsecondary education?
Mean Score Spring 2012 3.07
97. Have you discussed with your parent/guardian your plans after high school graduation?
Yes No Spring 2012 73% 27% Spring 2011 74% 26% Spring 2010 71% 29%
98. Have any of your brothers or sisters earned a college degree?
Yes No Not
Applicable Spring 2012 29% 57% 14% Spring 2011 27% 62% 12% Spring 2010 15% 73% 12%
99. Have either of your parents/guardians earned a college degree?
Yes No Spring 2012 44% 56% Spring 2011 26% 74% Spring 2010 24% 76%

School District of Lancaster, 2011-2012 Student Survey May 21-May 25, 2012 Marginal Frequency Report – PHOENIX HIGH SCHOOL N=123
Center for Opinion Research 31 Franklin & Marshall College
100. Has anyone from your school ever spoken with you about participating in the dual enrollment program? The dual enrollment program lets you take college courses during high school.
Yes No Spring 2012 52% 48% Spring 2011 35% 65%
Social & Emotional Development Do you agree or disagree with the following statements? Please give your answers based on how things have been for you over the last six months. 101. I try to be nice to other people. I care about their feelings.
Really Agree
Kind of Agree
Kind of Disagree
Really Disagree
Spring 2012 26% 50% 16% 9% Spring 2011 45% 35% 10% 10% Spring 2010 32% 54% 9% 6% Spring 2009 31% 56% 12% 0%
Fall 2008 34% 48% 15% 3% Spring 2008 40% 45% 10% 5%
Fall 2007 43% 45% 9% 3% Spring 2007 35% 58% 4% 4%
Fall 2006 31% 51% 17% 0% 102. I am restless. I cannot stay still for too long.
Really Agree
Kind of Agree
Kind of Disagree
Really Disagree
Spring 2012 27% 34% 30% 10% Spring 2011 23% 32% 36% 9% Spring 2010 20% 37% 28% 15% Spring 2009 19% 53% 28% 0%
Fall 2008 32% 34% 22% 12% Spring 2008 31% 31% 17% 21%
Fall 2007 27% 38% 20% 16% Spring 2007 15% 42% 27% 15%
Fall 2006 26% 43% 23% 9%

School District of Lancaster, 2011-2012 Student Survey May 21-May 25, 2012 Marginal Frequency Report – PHOENIX HIGH SCHOOL N=123
Center for Opinion Research 32 Franklin & Marshall College
103. I get a lot of headaches, stomach-aches or sickness.
Really Agree
Kind of Agree
Kind of Disagree
Really Disagree
Spring 2012 17% 32% 33% 18% Spring 2011 19% 23% 38% 19% Spring 2010 9% 17% 48% 26% Spring 2009 9% 22% 41% 28%
Fall 2008 20% 28% 26% 26% Spring 2008 17% 38% 19% 26%
Fall 2007 10% 35% 32% 23% Spring 2007 15% 27% 35% 23%
Fall 2006 14% 14% 43% 29% 104. I usually share with others, for example CD's, games, food.
Really Agree
Kind of Agree
Kind of Disagree
Really Disagree
Spring 2012 25% 39% 26% 11% Spring 2011 28% 44% 17% 12% Spring 2010 26% 46% 17% 11% Spring 2009 34% 50% 16% 0%
Fall 2008 36% 37% 18% 8% Spring 2008 38% 40% 12% 10%
Fall 2007 51% 37% 9% 4% Spring 2007 38% 46% 12% 4%
Fall 2006 41% 44% 6% 9% 105. I get very angry and often lose my temper.
Really Agree
Kind of Agree
Kind of Disagree
Really Disagree
Spring 2012 29% 33% 29% 8% Spring 2011 22% 29% 26% 22% Spring 2010 17% 26% 33% 24% Spring 2009 16% 25% 47% 12%
Fall 2008 22% 26% 25% 27% Spring 2008 24% 33% 26% 17%
Fall 2007 16% 39% 21% 25% Spring 2007 23% 42% 23% 12%
Fall 2006 24% 38% 29% 9%

School District of Lancaster, 2011-2012 Student Survey May 21-May 25, 2012 Marginal Frequency Report – PHOENIX HIGH SCHOOL N=123
Center for Opinion Research 33 Franklin & Marshall College
106. I would rather be alone than with people of my age.
Really Agree
Kind of Agree
Kind of Disagree
Really Disagree
Spring 2012 21% 35% 26% 18% Spring 2011 18% 25% 30% 27% Spring 2010 13% 22% 37% 28% Spring 2009 9% 25% 38% 28%
Fall 2008 17% 29% 30% 25% Spring 2008 20% 38% 20% 22%
Fall 2007 11% 34% 23% 32% Spring 2007 23% 23% 35% 19%
Fall 2006 11% 29% 40% 20% 107. I usually do as I am told.
Really Agree
Kind of Agree
Kind of Disagree
Really Disagree
Spring 2012 20% 48% 25% 7% Spring 2011 17% 45% 26% 12% Spring 2010 19% 57% 19% 6% Spring 2009 12% 69% 16% 3%
Fall 2008 21% 48% 26% 4% Spring 2008 22% 65% 8% 5%
Fall 2007 25% 45% 23% 7% Spring 2007 8% 72% 16% 4%
Fall 2006 17% 60% 20% 3% 108. I worry a lot.
Really Agree
Kind of Agree
Kind of Disagree
Really Disagree
Spring 2012 21% 33% 30% 17% Spring 2011 18% 29% 38% 16% Spring 2010 20% 33% 22% 24% Spring 2009 16% 41% 31% 12%
Fall 2008 22% 30% 26% 22% Spring 2008 17% 32% 22% 29%
Fall 2007 25% 33% 33% 9% Spring 2007 23% 19% 38% 19%
Fall 2006 21% 29% 24% 26%

School District of Lancaster, 2011-2012 Student Survey May 21-May 25, 2012 Marginal Frequency Report – PHOENIX HIGH SCHOOL N=123
Center for Opinion Research 34 Franklin & Marshall College
109. I am helpful if someone is hurt, upset, or feeling ill.
Really Agree
Kind of Agree
Kind of Disagree
Really Disagree
Spring 2012 36% 41% 19% 4% Spring 2011 45% 43% 5% 7% Spring 2010 31% 53% 13% 4% Spring 2009 34% 50% 12% 3%
Fall 2008 44% 44% 10% 4% Spring 2008 55% 38% 5% 2%
Fall 2007 58% 37% 4% 2% Spring 2007 46% 46% 4% 4%
Fall 2006 38% 47% 15% 0% 110. I am constantly moving or squirming.
Really Agree
Kind of Agree
Kind of Disagree
Really Disagree
Spring 2012 22% 33% 31% 15% Spring 2011 16% 40% 32% 13% Spring 2010 11% 31% 38% 20% Spring 2009 22% 34% 38% 6%
Fall 2008 21% 33% 34% 11% Spring 2008 24% 34% 27% 15%
Fall 2007 21% 40% 26% 12% Spring 2007 8% 52% 40% 0%
Fall 2006 17% 37% 29% 17% 111. I have one good friend or more.
Really Agree
Kind of Agree
Kind of Disagree
Really Disagree
Spring 2012 44% 31% 18% 6% Spring 2011 58% 33% 7% 3% Spring 2010 56% 29% 7% 7% Spring 2009 50% 41% 9% 0%
Fall 2008 51% 35% 9% 4% Spring 2008 62% 25% 10% 2%
Fall 2007 60% 21% 14% 5% Spring 2007 68% 20% 4% 8%
Fall 2006 66% 29% 3% 3%

School District of Lancaster, 2011-2012 Student Survey May 21-May 25, 2012 Marginal Frequency Report – PHOENIX HIGH SCHOOL N=123
Center for Opinion Research 35 Franklin & Marshall College
112. I fight a lot. I can make other people do what I want.
Really Agree
Kind of Agree
Kind of Disagree
Really Disagree
Spring 2012 10% 18% 46% 26% Spring 2011 12% 18% 25% 45% Spring 2010 0% 9% 40% 51% Spring 2009 3% 9% 38% 50%
Fall 2008 9% 18% 39% 34% Spring 2008 7% 24% 36% 33%
Fall 2007 4% 16% 37% 44% Spring 2007 4% 19% 38% 38%
Fall 2006 6% 17% 43% 34% 113. I am often unhappy, depressed, or tearful.
Really Agree
Kind of Agree
Kind of Disagree
Really Disagree
Spring 2012 18% 18% 42% 21% Spring 2011 10% 28% 29% 33% Spring 2010 11% 15% 22% 52% Spring 2009 9% 22% 34% 34%
Fall 2008 10% 29% 30% 30% Spring 2008 15% 27% 20% 39%
Fall 2007 19% 26% 25% 30% Spring 2007 19% 27% 23% 31%
Fall 2006 9% 15% 35% 41% 114. Other people my age generally like me.
Really Agree
Kind of Agree
Kind of Disagree
Really Disagree
Spring 2012 33% 46% 16% 4% Spring 2011 34% 50% 9% 7% Spring 2010 34% 56% 6% 4% Spring 2009 38% 47% 16% 0%
Fall 2008 34% 50% 12% 4% Spring 2008 52% 31% 17% 0%
Fall 2007 45% 48% 7% 0% Spring 2007 38% 54% 4% 4%
Fall 2006 40% 51% 3% 6%

School District of Lancaster, 2011-2012 Student Survey May 21-May 25, 2012 Marginal Frequency Report – PHOENIX HIGH SCHOOL N=123
Center for Opinion Research 36 Franklin & Marshall College
115. I easily lose my focus. I find it difficult to concentrate.
Really Agree
Kind of Agree
Kind of Disagree
Really Disagree
Spring 2012 25% 33% 30% 12% Spring 2011 24% 32% 32% 12% Spring 2010 23% 40% 25% 12% Spring 2009 22% 41% 31% 6%
Fall 2008 15% 42% 23% 20% Spring 2008 24% 36% 17% 24%
Fall 2007 14% 40% 25% 21% Spring 2007 31% 35% 31% 4%
Fall 2006 20% 43% 29% 9% 116. I am nervous in new situations. I easily lose confidence.
Really Agree
Kind of Agree
Kind of Disagree
Really Disagree
Spring 2012 20% 31% 31% 17% Spring 2011 17% 38% 26% 18% Spring 2010 13% 32% 30% 24% Spring 2009 10% 42% 29% 19%
Fall 2008 12% 32% 34% 23% Spring 2008 15% 32% 17% 37%
Fall 2007 12% 28% 33% 26% Spring 2007 19% 31% 31% 19%
Fall 2006 27% 21% 33% 18% 117. I am kind to younger children.
Really Agree
Kind of Agree
Kind of Disagree
Really Disagree
Spring 2012 39% 33% 18% 9% Spring 2011 53% 24% 18% 5% Spring 2010 54% 35% 6% 6% Spring 2009 53% 41% 6% 0%
Fall 2008 50% 37% 7% 6% Spring 2008 68% 29% 2% 0%
Fall 2007 67% 32% 2% 0% Spring 2007 58% 35% 4% 4%
Fall 2006 53% 29% 15% 3%
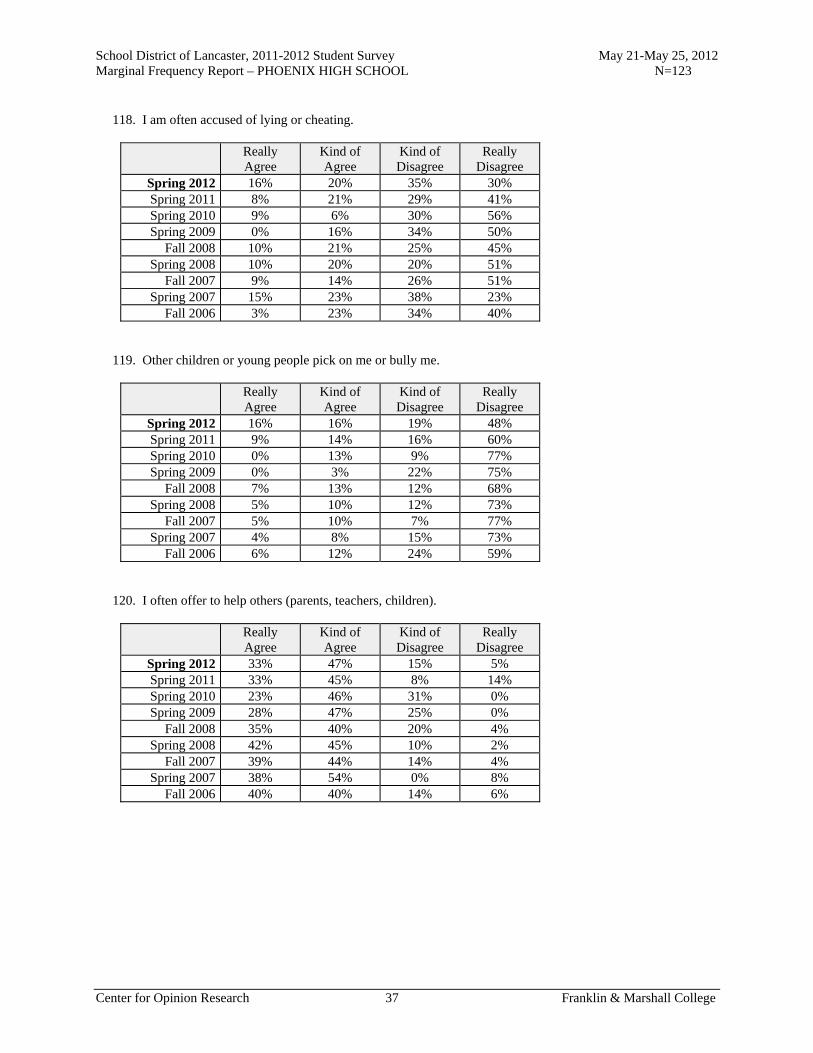
School District of Lancaster, 2011-2012 Student Survey May 21-May 25, 2012 Marginal Frequency Report – PHOENIX HIGH SCHOOL N=123
Center for Opinion Research 37 Franklin & Marshall College
118. I am often accused of lying or cheating.
Really Agree
Kind of Agree
Kind of Disagree
Really Disagree
Spring 2012 16% 20% 35% 30% Spring 2011 8% 21% 29% 41% Spring 2010 9% 6% 30% 56% Spring 2009 0% 16% 34% 50%
Fall 2008 10% 21% 25% 45% Spring 2008 10% 20% 20% 51%
Fall 2007 9% 14% 26% 51% Spring 2007 15% 23% 38% 23%
Fall 2006 3% 23% 34% 40% 119. Other children or young people pick on me or bully me.
Really Agree
Kind of Agree
Kind of Disagree
Really Disagree
Spring 2012 16% 16% 19% 48% Spring 2011 9% 14% 16% 60% Spring 2010 0% 13% 9% 77% Spring 2009 0% 3% 22% 75%
Fall 2008 7% 13% 12% 68% Spring 2008 5% 10% 12% 73%
Fall 2007 5% 10% 7% 77% Spring 2007 4% 8% 15% 73%
Fall 2006 6% 12% 24% 59% 120. I often offer to help others (parents, teachers, children).
Really Agree
Kind of Agree
Kind of Disagree
Really Disagree
Spring 2012 33% 47% 15% 5% Spring 2011 33% 45% 8% 14% Spring 2010 23% 46% 31% 0% Spring 2009 28% 47% 25% 0%
Fall 2008 35% 40% 20% 4% Spring 2008 42% 45% 10% 2%
Fall 2007 39% 44% 14% 4% Spring 2007 38% 54% 0% 8%
Fall 2006 40% 40% 14% 6%

School District of Lancaster, 2011-2012 Student Survey May 21-May 25, 2012 Marginal Frequency Report – PHOENIX HIGH SCHOOL N=123
Center for Opinion Research 38 Franklin & Marshall College
121. I think before I do things.
Really Agree
Kind of Agree
Kind of Disagree
Really Disagree
Spring 2012 30% 38% 22% 10% Spring 2011 45% 32% 18% 5% Spring 2010 26% 39% 33% 2% Spring 2009 22% 50% 25% 3%
Fall 2008 39% 34% 20% 7% Spring 2008 48% 45% 5% 2%
Fall 2007 37% 49% 10% 4% Spring 2007 23% 54% 12% 12%
Fall 2006 21% 59% 18% 3% 122. I take things that are not mine from home, school, or elsewhere.
Really Agree
Kind of Agree
Kind of Disagree
Really Disagree
Spring 2012 12% 16% 22% 49% Spring 2011 10% 22% 12% 55% Spring 2010 6% 10% 15% 69% Spring 2009 0% 12% 9% 78%
Fall 2008 6% 14% 23% 57% Spring 2008 8% 12% 12% 68%
Fall 2007 4% 5% 19% 72% Spring 2007 4% 12% 35% 50%
Fall 2006 6% 6% 34% 54% 123. I get along better with adults than with people my own age.
Really Agree
Kind of Agree
Kind of Disagree
Really Disagree
Spring 2012 33% 30% 27% 10% Spring 2011 24% 36% 25% 16% Spring 2010 35% 35% 17% 14% Spring 2009 16% 34% 41% 9%
Fall 2008 31% 33% 24% 12% Spring 2008 38% 28% 15% 18%
Fall 2007 26% 42% 21% 10% Spring 2007 35% 27% 19% 19%
Fall 2006 20% 40% 29% 11%
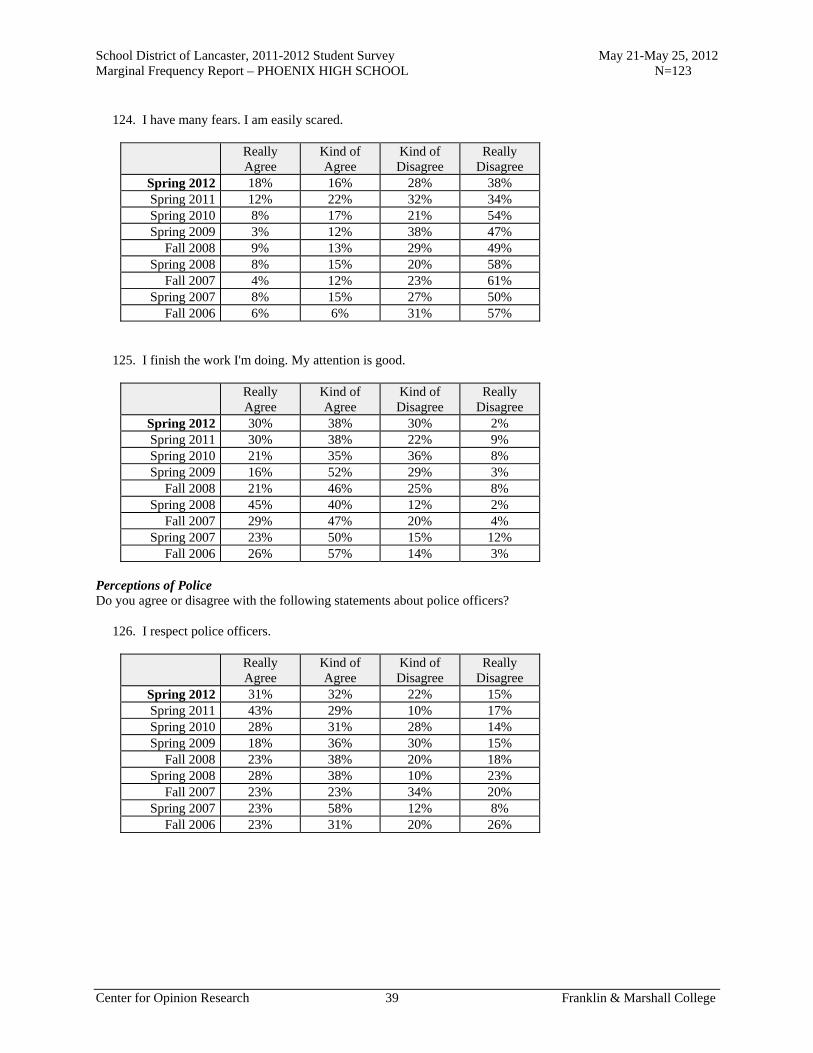
School District of Lancaster, 2011-2012 Student Survey May 21-May 25, 2012 Marginal Frequency Report – PHOENIX HIGH SCHOOL N=123
Center for Opinion Research 39 Franklin & Marshall College
124. I have many fears. I am easily scared.
Really Agree
Kind of Agree
Kind of Disagree
Really Disagree
Spring 2012 18% 16% 28% 38% Spring 2011 12% 22% 32% 34% Spring 2010 8% 17% 21% 54% Spring 2009 3% 12% 38% 47%
Fall 2008 9% 13% 29% 49% Spring 2008 8% 15% 20% 58%
Fall 2007 4% 12% 23% 61% Spring 2007 8% 15% 27% 50%
Fall 2006 6% 6% 31% 57% 125. I finish the work I'm doing. My attention is good.
Really Agree
Kind of Agree
Kind of Disagree
Really Disagree
Spring 2012 30% 38% 30% 2% Spring 2011 30% 38% 22% 9% Spring 2010 21% 35% 36% 8% Spring 2009 16% 52% 29% 3%
Fall 2008 21% 46% 25% 8% Spring 2008 45% 40% 12% 2%
Fall 2007 29% 47% 20% 4% Spring 2007 23% 50% 15% 12%
Fall 2006 26% 57% 14% 3% Perceptions of Police Do you agree or disagree with the following statements about police officers? 126. I respect police officers.
Really Agree
Kind of Agree
Kind of Disagree
Really Disagree
Spring 2012 31% 32% 22% 15% Spring 2011 43% 29% 10% 17% Spring 2010 28% 31% 28% 14% Spring 2009 18% 36% 30% 15%
Fall 2008 23% 38% 20% 18% Spring 2008 28% 38% 10% 23%
Fall 2007 23% 23% 34% 20% Spring 2007 23% 58% 12% 8%
Fall 2006 23% 31% 20% 26%
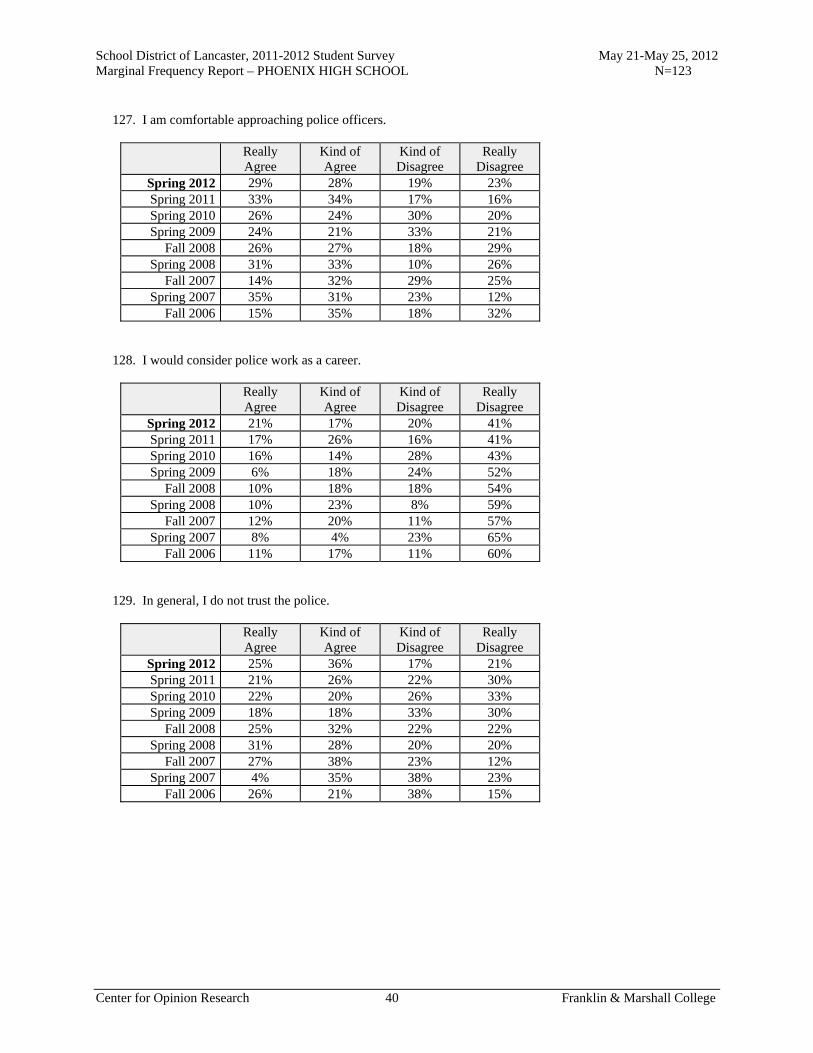
School District of Lancaster, 2011-2012 Student Survey May 21-May 25, 2012 Marginal Frequency Report – PHOENIX HIGH SCHOOL N=123
Center for Opinion Research 40 Franklin & Marshall College
127. I am comfortable approaching police officers.
Really Agree
Kind of Agree
Kind of Disagree
Really Disagree
Spring 2012 29% 28% 19% 23% Spring 2011 33% 34% 17% 16% Spring 2010 26% 24% 30% 20% Spring 2009 24% 21% 33% 21%
Fall 2008 26% 27% 18% 29% Spring 2008 31% 33% 10% 26%
Fall 2007 14% 32% 29% 25% Spring 2007 35% 31% 23% 12%
Fall 2006 15% 35% 18% 32% 128. I would consider police work as a career.
Really Agree
Kind of Agree
Kind of Disagree
Really Disagree
Spring 2012 21% 17% 20% 41% Spring 2011 17% 26% 16% 41% Spring 2010 16% 14% 28% 43% Spring 2009 6% 18% 24% 52%
Fall 2008 10% 18% 18% 54% Spring 2008 10% 23% 8% 59%
Fall 2007 12% 20% 11% 57% Spring 2007 8% 4% 23% 65%
Fall 2006 11% 17% 11% 60% 129. In general, I do not trust the police.
Really Agree
Kind of Agree
Kind of Disagree
Really Disagree
Spring 2012 25% 36% 17% 21% Spring 2011 21% 26% 22% 30% Spring 2010 22% 20% 26% 33% Spring 2009 18% 18% 33% 30%
Fall 2008 25% 32% 22% 22% Spring 2008 31% 28% 20% 20%
Fall 2007 27% 38% 23% 12% Spring 2007 4% 35% 38% 23%
Fall 2006 26% 21% 38% 15%

School District of Lancaster, 2011-2012 Student Survey May 21-May 25, 2012 Marginal Frequency Report – PHOENIX HIGH SCHOOL N=123
Center for Opinion Research 41 Franklin & Marshall College
130. Police do not belong in schools unless there has been a crime.
Really Agree
Kind of Agree
Kind of Disagree
Really Disagree
Spring 2012 38% 23% 23% 15% Spring 2011 33% 25% 26% 16% Spring 2010 38% 30% 18% 14% Spring 2009 39% 24% 12% 24%
Fall 2008 28% 27% 28% 16% Spring 2008 33% 28% 20% 18%
Fall 2007 34% 30% 21% 14% Spring 2007 12% 27% 27% 35%
Fall 2006 34% 17% 29% 20% Hidden Delinquency In the last 12 months, how many times did you... 131. Deliberately damage property that did not belong to you.
Never 1 or 2 Times 3 or 4 Times5 or More
Times Spring 2012 62% 22% 9% 7% Spring 2011 71% 20% 3% 7% Spring 2010 79% 15% 4% 2% Spring 2009 58% 39% 3% 0%
Fall 2008 70% 25% 4% 1% Spring 2008 74% 20% 5% 0%
Fall 2007 77% 18% 4% 2% Spring 2007 73% 19% 8% 0%
Fall 2006 54% 43% 0% 3% 132. Take something from a store without paying for it.
Never 1 or 2 Times 3 or 4 Times5 or More
Times Spring 2012 62% 21% 14% 3% Spring 2011 69% 17% 5% 8% Spring 2010 81% 14% 6% 0% Spring 2009 88% 12% 0% 0%
Fall 2008 75% 14% 9% 2% Spring 2008 71% 18% 8% 3%
Fall 2007 82% 11% 5% 2% Spring 2007 77% 19% 4% 0%
Fall 2006 80% 11% 3% 6%

School District of Lancaster, 2011-2012 Student Survey May 21-May 25, 2012 Marginal Frequency Report – PHOENIX HIGH SCHOOL N=123
Center for Opinion Research 42 Franklin & Marshall College
133. Hurt someone badly enough for that person to need bandages or care from a doctor or nurse.
Never 1 or 2 Times 3 or 4 Times5 or More
Times Spring 2012 61% 23% 12% 4% Spring 2011 70% 20% 4% 7% Spring 2010 79% 15% 6% 0% Spring 2009 76% 24% 0% 0%
Fall 2008 73% 17% 9% 1% Spring 2008 67% 26% 3% 5%
Fall 2007 77% 21% 0% 2% Spring 2007 77% 19% 0% 4%
Fall 2006 71% 23% 3% 3% 134. Drive a car without its owner's permission.
Never 1 or 2 Times 3 or 4 Times5 or More
Times Spring 2012 72% 15% 7% 6% Spring 2011 82% 8% 5% 5% Spring 2010 83% 12% 4% 2% Spring 2009 82% 15% 3% 0%
Fall 2008 74% 13% 8% 5% Spring 2008 87% 8% 3% 3%
Fall 2007 91% 4% 4% 2% Spring 2007 96% 0% 4% 0%
Fall 2006 82% 15% 0% 3% 135. Steal something worth more than $50.
Never 1 or 2 Times 3 or 4 Times5 or More
Times Spring 2012 78% 12% 7% 3% Spring 2011 82% 7% 5% 7% Spring 2010 90% 4% 4% 2% Spring 2009 91% 9% 0% 0%
Fall 2008 81% 13% 3% 3% Spring 2008 92% 3% 0% 5%
Fall 2007 93% 4% 4% 0% Spring 2007 85% 12% 4% 0%
Fall 2006 83% 11% 0% 6%
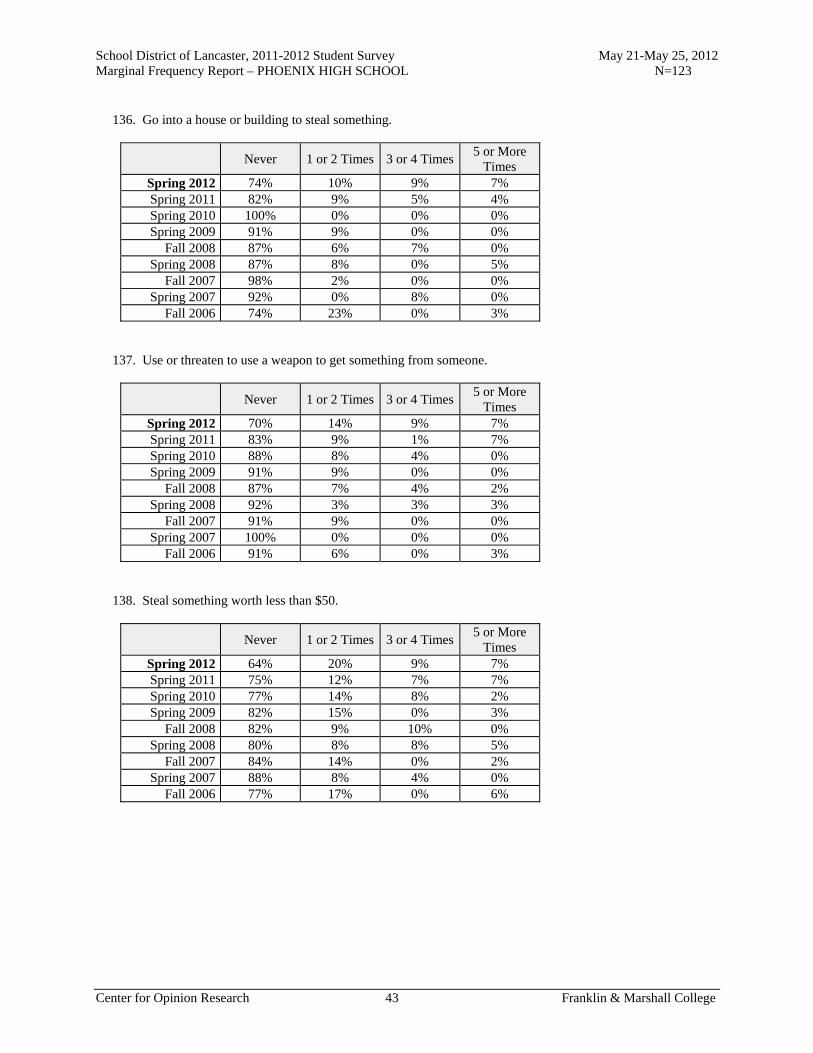
School District of Lancaster, 2011-2012 Student Survey May 21-May 25, 2012 Marginal Frequency Report – PHOENIX HIGH SCHOOL N=123
Center for Opinion Research 43 Franklin & Marshall College
136. Go into a house or building to steal something.
Never 1 or 2 Times 3 or 4 Times5 or More
Times Spring 2012 74% 10% 9% 7% Spring 2011 82% 9% 5% 4% Spring 2010 100% 0% 0% 0% Spring 2009 91% 9% 0% 0%
Fall 2008 87% 6% 7% 0% Spring 2008 87% 8% 0% 5%
Fall 2007 98% 2% 0% 0% Spring 2007 92% 0% 8% 0%
Fall 2006 74% 23% 0% 3% 137. Use or threaten to use a weapon to get something from someone.
Never 1 or 2 Times 3 or 4 Times5 or More
Times Spring 2012 70% 14% 9% 7% Spring 2011 83% 9% 1% 7% Spring 2010 88% 8% 4% 0% Spring 2009 91% 9% 0% 0%
Fall 2008 87% 7% 4% 2% Spring 2008 92% 3% 3% 3%
Fall 2007 91% 9% 0% 0% Spring 2007 100% 0% 0% 0%
Fall 2006 91% 6% 0% 3% 138. Steal something worth less than $50.
Never 1 or 2 Times 3 or 4 Times5 or More
Times Spring 2012 64% 20% 9% 7% Spring 2011 75% 12% 7% 7% Spring 2010 77% 14% 8% 2% Spring 2009 82% 15% 0% 3%
Fall 2008 82% 9% 10% 0% Spring 2008 80% 8% 8% 5%
Fall 2007 84% 14% 0% 2% Spring 2007 88% 8% 4% 0%
Fall 2006 77% 17% 0% 6%
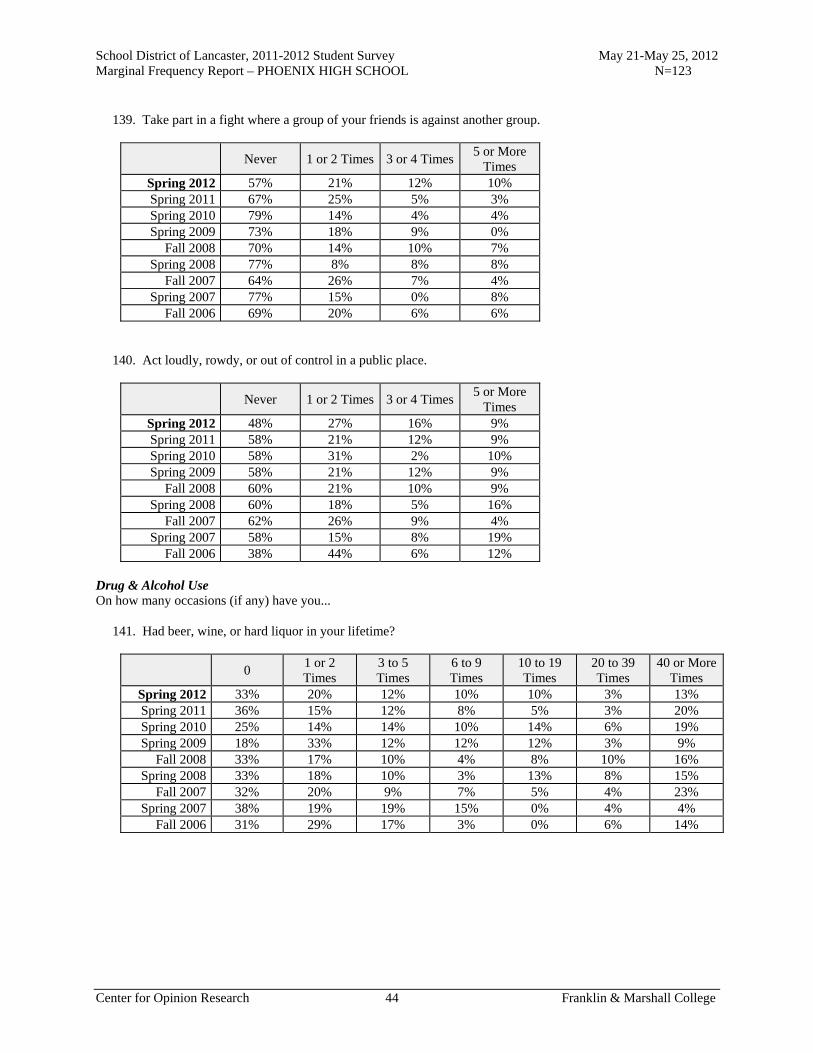
School District of Lancaster, 2011-2012 Student Survey May 21-May 25, 2012 Marginal Frequency Report – PHOENIX HIGH SCHOOL N=123
Center for Opinion Research 44 Franklin & Marshall College
139. Take part in a fight where a group of your friends is against another group.
Never 1 or 2 Times 3 or 4 Times5 or More
Times Spring 2012 57% 21% 12% 10% Spring 2011 67% 25% 5% 3% Spring 2010 79% 14% 4% 4% Spring 2009 73% 18% 9% 0%
Fall 2008 70% 14% 10% 7% Spring 2008 77% 8% 8% 8%
Fall 2007 64% 26% 7% 4% Spring 2007 77% 15% 0% 8%
Fall 2006 69% 20% 6% 6% 140. Act loudly, rowdy, or out of control in a public place.
Never 1 or 2 Times 3 or 4 Times5 or More
Times Spring 2012 48% 27% 16% 9% Spring 2011 58% 21% 12% 9% Spring 2010 58% 31% 2% 10% Spring 2009 58% 21% 12% 9%
Fall 2008 60% 21% 10% 9% Spring 2008 60% 18% 5% 16%
Fall 2007 62% 26% 9% 4% Spring 2007 58% 15% 8% 19%
Fall 2006 38% 44% 6% 12% Drug & Alcohol Use On how many occasions (if any) have you... 141. Had beer, wine, or hard liquor in your lifetime?
0 1 or 2 Times
3 to 5 Times
6 to 9 Times
10 to 19 Times
20 to 39 Times
40 or More Times
Spring 2012 33% 20% 12% 10% 10% 3% 13% Spring 2011 36% 15% 12% 8% 5% 3% 20% Spring 2010 25% 14% 14% 10% 14% 6% 19% Spring 2009 18% 33% 12% 12% 12% 3% 9%
Fall 2008 33% 17% 10% 4% 8% 10% 16% Spring 2008 33% 18% 10% 3% 13% 8% 15%
Fall 2007 32% 20% 9% 7% 5% 4% 23% Spring 2007 38% 19% 19% 15% 0% 4% 4%
Fall 2006 31% 29% 17% 3% 0% 6% 14%

School District of Lancaster, 2011-2012 Student Survey May 21-May 25, 2012 Marginal Frequency Report – PHOENIX HIGH SCHOOL N=123
Center for Opinion Research 45 Franklin & Marshall College
142. Had beer, wine, or hard liquor during the past 30 days?
0 1 or 2 Times
3 to 5 Times
6 to 9 Times
10 to 19 Times
20 to 39 Times
40 or More Times
Spring 2012 55% 16% 11% 8% 6% 0% 3% Spring 2011 64% 16% 5% 3% 5% 0% 7% Spring 2010 56% 21% 19% 4% 0% 0% 0% Spring 2009 67% 21% 9% 0% 3% 0% 0%
Fall 2008 62% 15% 8% 4% 4% 1% 6% Spring 2008 74% 16% 5% 0% 3% 0% 3%
Fall 2007 70% 14% 4% 5% 5% 0% 2% Spring 2007 77% 15% 8% 0% 0% 0% 0%
Fall 2006 77% 9% 6% 6% 0% 3% 0% 143. Used marijuana in your lifetime?
0 1 or 2 Times
3 to 5 Times
6 to 9 Times
10 to 19 Times
20 to 39 Times
40 or More Times
Spring 2012 42% 7% 7% 10% 4% 3% 26% Spring 2011 57% 8% 7% 7% 3% 3% 16% Spring 2010 58% 15% 2% 6% 4% 2% 14% Spring 2009 42% 21% 6% 0% 9% 6% 15%
Fall 2008 55% 7% 5% 6% 2% 2% 24% Spring 2008 47% 18% 3% 8% 0% 3% 21%
Fall 2007 46% 16% 9% 2% 4% 2% 21% Spring 2007 62% 8% 4% 19% 4% 0% 4%
Fall 2006 63% 20% 0% 0% 6% 3% 9% 144. Used marijuana during the past 30 days?
0 1 or 2 Times
3 to 5 Times
6 to 9 Times
10 to 19 Times
20 to 39 Times
40 or More Times
Spring 2012 58% 4% 5% 6% 7% 4% 14% Spring 2011 69% 8% 4% 4% 3% 1% 11% Spring 2010 79% 6% 2% 0% 4% 2% 8% Spring 2009 70% 18% 3% 0% 0% 0% 9%
Fall 2008 71% 6% 3% 5% 4% 3% 8% Spring 2008 82% 3% 3% 0% 10% 0% 3%
Fall 2007 80% 7% 0% 4% 2% 2% 5% pring 2007 85% 0% 12% 0% 4% 0% 0%
Fall 2006 86% 9% 0% 3% 0% 0% 3%

School District of Lancaster, 2011-2012 Student Survey May 21-May 25, 2012 Marginal Frequency Report – PHOENIX HIGH SCHOOL N=123
Center for Opinion Research 46 Franklin & Marshall College
How old were you when you first... 145. Had more than a sip or two of beer, wine, or hard liquor?
Never have
10 or younger
11 12 13 14 15 16 17 or older
Spring 2012
28% 11% 5% 7% 7% 8% 7% 8% 17%
Spring 2011 40% 8% 3% 10% 7% 7% 12% 7% 6% 146. Smoked marijuana?
Never have
10 or younger
11 12 13 14 15 16 17 or older
Spring 2012
39% 2% 6% 7% 8% 10% 7% 6% 13%
Spring 2011 58% 6% 0% 4% 4% 8% 10% 6% 4% 147. Have you ever used smokeless tobacco (chew, snuff, plug, dipping tobacco, chewing tobacco)?
Never Once or
twice
Once in a while but
not regularly
Regularly in the past
Regularly now
Spring 2012 87% 5% 2% 2% 3% Spring 2011 91% 4% 3% 0% 3% Spring 2010 92% 8% 0% 0% 0% Spring 2009 94% 3% 3% 0% 0%
Fall 2008 95% 4% 0% 2% 0% 148. How frequently have you used smokeless tobacco during the past 30 days?
Never Once or
twice
Once or twice per
week
About once a day
More than once a day
Spring 2012 85% 10% 3% 1% 1% Spring 2011 90% 4% 1% 1% 3% Spring 2010 96% 4% 0% 0% 0% Spring 2009 97% 3% 0% 0% 0%
Fall 2008 92% 3% 2% 1% 3%
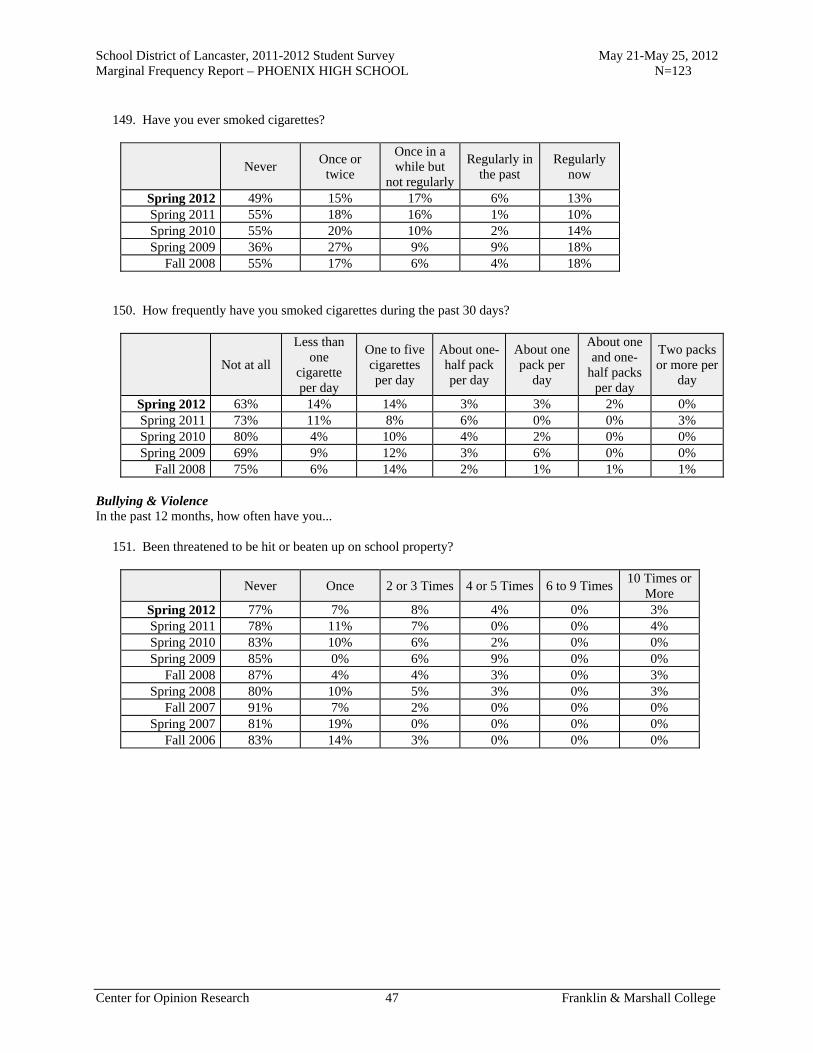
School District of Lancaster, 2011-2012 Student Survey May 21-May 25, 2012 Marginal Frequency Report – PHOENIX HIGH SCHOOL N=123
Center for Opinion Research 47 Franklin & Marshall College
149. Have you ever smoked cigarettes?
Never Once or
twice
Once in a while but
not regularly
Regularly in the past
Regularly now
Spring 2012 49% 15% 17% 6% 13% Spring 2011 55% 18% 16% 1% 10% Spring 2010 55% 20% 10% 2% 14% Spring 2009 36% 27% 9% 9% 18%
Fall 2008 55% 17% 6% 4% 18% 150. How frequently have you smoked cigarettes during the past 30 days?
Not at all
Less than one
cigarette per day
One to five cigarettes per day
About one-half pack per day
About one pack per
day
About one and one-
half packs per day
Two packs or more per
day
Spring 2012 63% 14% 14% 3% 3% 2% 0% Spring 2011 73% 11% 8% 6% 0% 0% 3% Spring 2010 80% 4% 10% 4% 2% 0% 0% Spring 2009 69% 9% 12% 3% 6% 0% 0%
Fall 2008 75% 6% 14% 2% 1% 1% 1% Bullying & Violence In the past 12 months, how often have you... 151. Been threatened to be hit or beaten up on school property?
Never Once 2 or 3 Times 4 or 5 Times 6 to 9 Times 10 Times or
More Spring 2012 77% 7% 8% 4% 0% 3% Spring 2011 78% 11% 7% 0% 0% 4% Spring 2010 83% 10% 6% 2% 0% 0% Spring 2009 85% 0% 6% 9% 0% 0%
Fall 2008 87% 4% 4% 3% 0% 3% Spring 2008 80% 10% 5% 3% 0% 3%
Fall 2007 91% 7% 2% 0% 0% 0% Spring 2007 81% 19% 0% 0% 0% 0%
Fall 2006 83% 14% 3% 0% 0% 0%
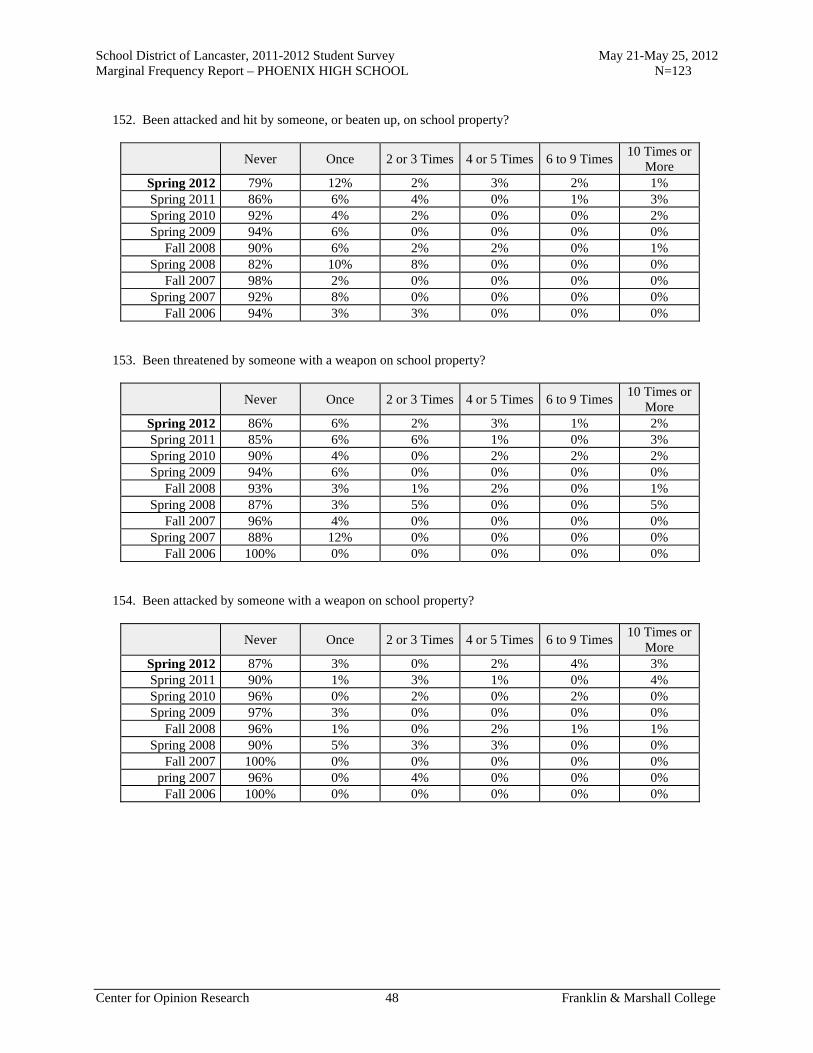
School District of Lancaster, 2011-2012 Student Survey May 21-May 25, 2012 Marginal Frequency Report – PHOENIX HIGH SCHOOL N=123
Center for Opinion Research 48 Franklin & Marshall College
152. Been attacked and hit by someone, or beaten up, on school property?
Never Once 2 or 3 Times 4 or 5 Times 6 to 9 Times 10 Times or
More Spring 2012 79% 12% 2% 3% 2% 1% Spring 2011 86% 6% 4% 0% 1% 3% Spring 2010 92% 4% 2% 0% 0% 2% Spring 2009 94% 6% 0% 0% 0% 0%
Fall 2008 90% 6% 2% 2% 0% 1% Spring 2008 82% 10% 8% 0% 0% 0%
Fall 2007 98% 2% 0% 0% 0% 0% Spring 2007 92% 8% 0% 0% 0% 0%
Fall 2006 94% 3% 3% 0% 0% 0% 153. Been threatened by someone with a weapon on school property?
Never Once 2 or 3 Times 4 or 5 Times 6 to 9 Times 10 Times or
More Spring 2012 86% 6% 2% 3% 1% 2% Spring 2011 85% 6% 6% 1% 0% 3% Spring 2010 90% 4% 0% 2% 2% 2% Spring 2009 94% 6% 0% 0% 0% 0%
Fall 2008 93% 3% 1% 2% 0% 1% Spring 2008 87% 3% 5% 0% 0% 5%
Fall 2007 96% 4% 0% 0% 0% 0% Spring 2007 88% 12% 0% 0% 0% 0%
Fall 2006 100% 0% 0% 0% 0% 0% 154. Been attacked by someone with a weapon on school property?
Never Once 2 or 3 Times 4 or 5 Times 6 to 9 Times 10 Times or
More Spring 2012 87% 3% 0% 2% 4% 3% Spring 2011 90% 1% 3% 1% 0% 4% Spring 2010 96% 0% 2% 0% 2% 0% Spring 2009 97% 3% 0% 0% 0% 0%
Fall 2008 96% 1% 0% 2% 1% 1% Spring 2008 90% 5% 3% 3% 0% 0%
Fall 2007 100% 0% 0% 0% 0% 0% pring 2007 96% 0% 4% 0% 0% 0%
Fall 2006 100% 0% 0% 0% 0% 0%
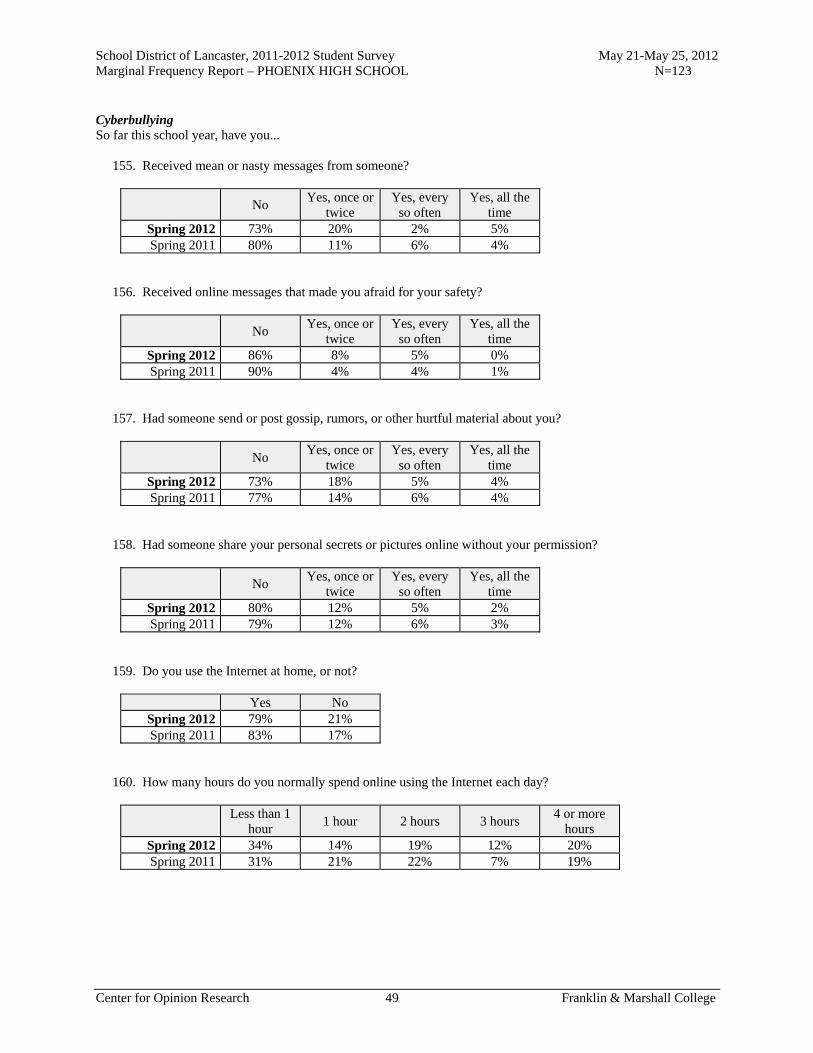
School District of Lancaster, 2011-2012 Student Survey May 21-May 25, 2012 Marginal Frequency Report – PHOENIX HIGH SCHOOL N=123
Center for Opinion Research 49 Franklin & Marshall College
Cyberbullying So far this school year, have you... 155. Received mean or nasty messages from someone?
No Yes, once or
twice Yes, every
so often Yes, all the
time Spring 2012 73% 20% 2% 5% Spring 2011 80% 11% 6% 4%
156. Received online messages that made you afraid for your safety?
No Yes, once or
twice Yes, every
so often Yes, all the
time Spring 2012 86% 8% 5% 0% Spring 2011 90% 4% 4% 1%
157. Had someone send or post gossip, rumors, or other hurtful material about you?
No Yes, once or
twice Yes, every
so often Yes, all the
time Spring 2012 73% 18% 5% 4% Spring 2011 77% 14% 6% 4%
158. Had someone share your personal secrets or pictures online without your permission?
No Yes, once or
twice Yes, every
so often Yes, all the
time Spring 2012 80% 12% 5% 2% Spring 2011 79% 12% 6% 3%
159. Do you use the Internet at home, or not?
Yes No Spring 2012 79% 21% Spring 2011 83% 17%
160. How many hours do you normally spend online using the Internet each day?
Less than 1
hour 1 hour 2 hours 3 hours
4 or more hours
Spring 2012 34% 14% 19% 12% 20% Spring 2011 31% 21% 22% 7% 19%
Related Documents


