COVER STORY BOTTLED WATER INDUSTRY 2012 STATISTICS REVEAL BOTTLED WATER’S U.S. AND INTERNATIONAL GROWTH By John G. Rodwan, Jr.

Welcome message from author
This document is posted to help you gain knowledge. Please leave a comment to let me know what you think about it! Share it to your friends and learn new things together.
Transcript
COVER STORY
BOTTLED WATER INDUSTRY
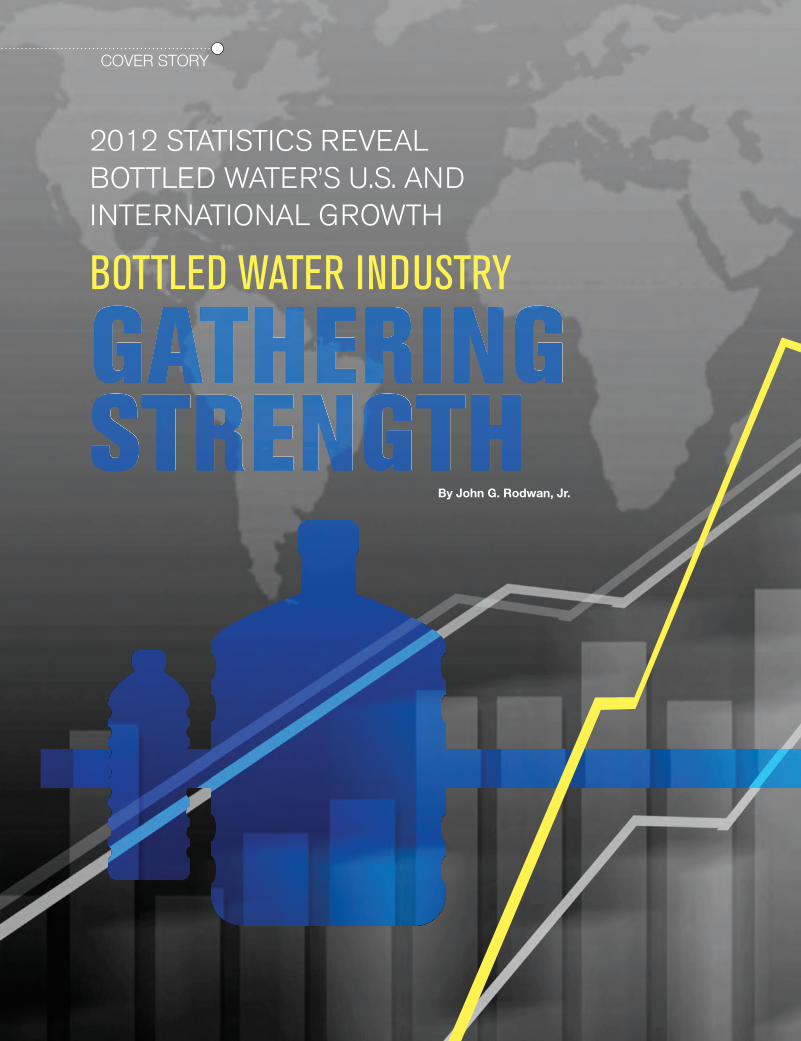
2012 STATISTICS REVEAL BOTTLED WATER’S U.S. AND INTERNATIONAL GROWTH
By John G. Rodwan, Jr.

As with many other beverage categories in the United States during the depths of the economic recession, bottled water suffered reversals in 2008 and 2009. In 2010, bottled water volume and sales returned to growth, and the category showed renewed strength by both measures in 2011. Growth in 2012 was the strongest it had been in five years. Moreover, preliminary data indicates that the category could cross another notewor-thy threshold by exceeding 10 billion gallons for the first time in 2013. Further still, ongoing enlargement should continue going forward as economic conditions grow increasingly favorable and the characteristics that made bottled water the second-largest beverage category by volume unambiguously reassert themselves.
Bottled water enjoyed a unique position within the overall liquid refreshment beverage marketplace, as the performance of other categories makes vividly evident. Though carbonated soft drinks remain by far the largest beverage type in the United States, their volume shrank again in 2012, as it has done every year since the mid-2000s. Fruit beverages
JUNE/JULY 2013 BWR 13
BOTTLED WATER ATTAINED A PROMINENT POSITION IN THE U.S. BEVERAGE MARKETPLACE AS A RESULT OF MANY YEARS OF VIGOROUS GROWTH, AND, WITH ANOTHER FORCEFUL ASCENT IN 2012, IT ONCE AGAIN FLASHED ITS PENCHANT FOR UPWARD MOVEMENT.
have similarly been beset with long-term erosion, withering from having volume comparable to bottled water in the late 1990s to having volume only slightly more than one-third the size by 2012. Like bottled water, other, friskier liquid refreshment beverages—such as ready-to-drink tea and sports beverages—rebounded from back-to-back off years to grow in 2010, 2011, and 2012, but they remained much, much smaller than bottled water. Although sports bever-ages (like Gatorade) may actively compete for consumers seeking hydration, their volume was about one-sixth that of bottled water in 2012.
Before the economic challenges at the end of the century’s first decade, bottled water experienced a remarkable streak of speedy volume growth, as documented in the latest edition of Bottled Water in the U.S., Beverage Marketing Corporation’s

annual analysis of the market. During the 2000s, bottled water volume achieved double-digit percentage growth rates in two years and advanced at rates close to that level in several others. Bottled water volume grew by close to 12 percent in 2002, and after growing by 10.8 percent in 2005, it enlarged by 9.5 percent in 2006. Departing from the pattern of preceding years, bottled water volume declined by 1.0 percent in 2008 and then by 2.5 percent in 2009.
Unlike carbonated soft drinks, which followed several years of slow growth with multiple volume reductions, bottled water demonstrated that two consecutive declines were aberrations, mere blips, not the start of a protracted losing streak. When bottled water growth resumed in 2010, it restored volume to where it had been prior to the declines. Growth accelerated in each of the two following years. By 2012, volume achieved an unprecedented high—more than 920 million gallons above where it had been in 2007. In contrast, the soft drink category suffered its eighth consecutive year of volume reduction in 2012.
Bottled water producers’ revenues also declined in both 2008 and 2009 as well, and did so more precipitously than volume, but enjoyed revitalization thereafter. Bottled water wholesale dollar sales first exceeded $6 billion in 2000. By 2007, they topped $11.5 billion. Category sales declined by more than 3 percent to $11.2 billion the following year and
then by more than 5 percent to $10.6 billion in 2009. They inched upward in 2010 and climbed back above $11 billion in 2011. Wholesale dollars scaled new heights in 2012, when they topped $11.8 billion.
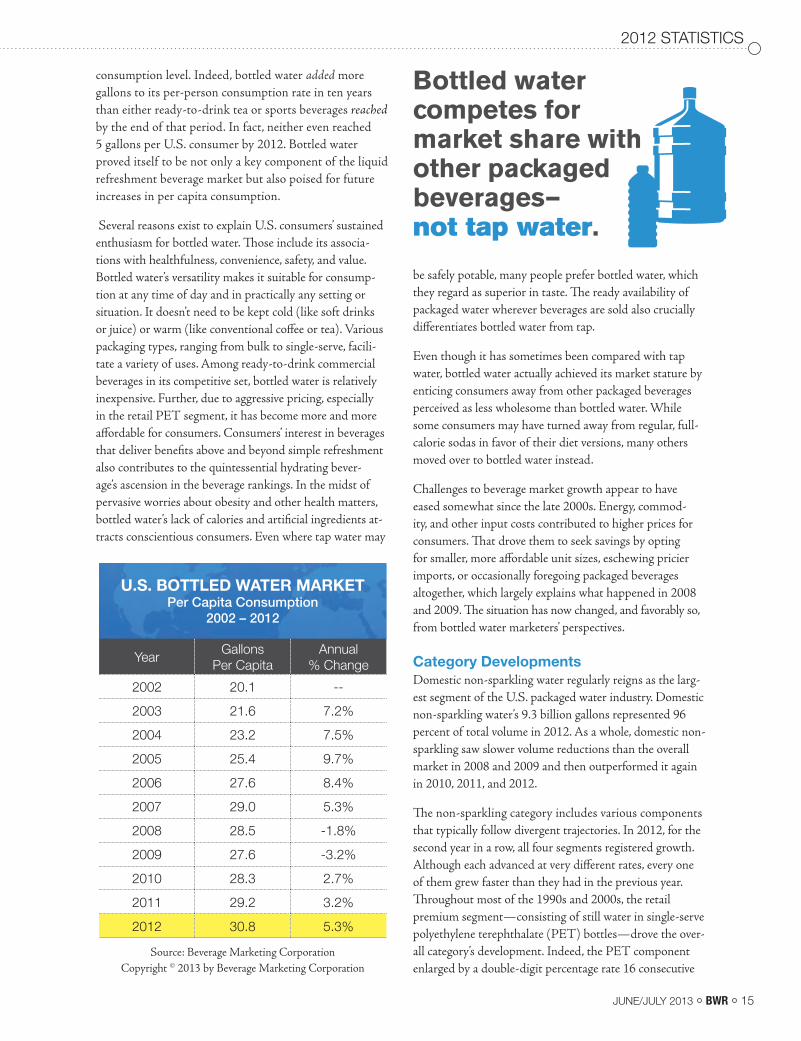
All signs point to U.S. consumers’ already displayed thirst for bottled water continuing in the years ahead. Changes in per capita consumption indicate persistent interest in a product that consumers embrace as a healthful alterna-tive to other beverages. Americans upped their annual consumption by almost 11 gallons from 20.1 gallons per person in 2002 to 30.8 gallons ten years later. During the same period, per capita consumption of carbonated soft drinks dropped by more than 10 gallons. Per capita consumption of other major beverage categories, like milk and fruit beverages, also declined. Other types, including coffee and tea, were characterized by stability, though the ready-to-drink versions of both categories made gains. Indeed, those beverages associated with beneficial prop-erties and functional benefits—a subset that includes packaged water as well as energy drinks, sports beverages, and ready-to-drink tea—were the most resilient elements of the beverage market in 2010, 2011, and 2012. Even so, average intake of beverages within bottled water’s competitive set, such as ready-to-drink tea and sports beverages, remained fractions of bottled water’s per capita
14 BWR WWW.BOTTLEDWATER.ORG
U.S. BOTTLED WATER MARKETVolume and Producer Revenues
2010 – 2012
YearMillions ofGallons
Annual% Change
Millions ofDollars
Annual% Change
2010 8,756.3 -- $10,686.4 --
2011 9,107.4 4.0% $11,072.4 3.6%
2012 9,674.3 6.2% $11,815.9 6.7%
Source: Beverage Marketing CorporationCopyright © 2013 by Beverage Marketing Corporation
In 2012, the bottled water industry experienced its
strongest growth in five years.
2012 STATISTICS
consumption level. Indeed, bottled water added more gallons to its per-person consumption rate in ten years than either ready-to-drink tea or sports beverages reached by the end of that period. In fact, neither even reached 5 gallons per U.S. consumer by 2012. Bottled water proved itself to be not only a key component of the liquid refreshment beverage market but also poised for future increases in per capita consumption.
Several reasons exist to explain U.S. consumers’ sustained enthusiasm for bottled water. Those include its associa-tions with healthfulness, convenience, safety, and value. Bottled water’s versatility makes it suitable for consump-tion at any time of day and in practically any setting or situation. It doesn’t need to be kept cold (like soft drinks or juice) or warm (like conventional coffee or tea). Various packaging types, ranging from bulk to single-serve, facili-tate a variety of uses. Among ready-to-drink commercial beverages in its competitive set, bottled water is relatively inexpensive. Further, due to aggressive pricing, especially in the retail PET segment, it has become more and more affordable for consumers. Consumers’ interest in beverages that deliver benefits above and beyond simple refreshment also contributes to the quintessential hydrating bever-age’s ascension in the beverage rankings. In the midst of pervasive worries about obesity and other health matters, bottled water’s lack of calories and artificial ingredients at-tracts conscientious consumers. Even where tap water may
be safely potable, many people prefer bottled water, which they regard as superior in taste. The ready availability of packaged water wherever beverages are sold also crucially differentiates bottled water from tap.
Even though it has sometimes been compared with tap water, bottled water actually achieved its market stature by enticing consumers away from other packaged beverages perceived as less wholesome than bottled water. While some consumers may have turned away from regular, full-calorie sodas in favor of their diet versions, many others moved over to bottled water instead.
Challenges to beverage market growth appear to have eased somewhat since the late 2000s. Energy, commod-ity, and other input costs contributed to higher prices for consumers. That drove them to seek savings by opting for smaller, more affordable unit sizes, eschewing pricier imports, or occasionally foregoing packaged beverages altogether, which largely explains what happened in 2008 and 2009. The situation has now changed, and favorably so, from bottled water marketers’ perspectives.
Category DevelopmentsDomestic non-sparkling water regularly reigns as the larg-est segment of the U.S. packaged water industry. Domestic non-sparkling water’s 9.3 billion gallons represented 96 percent of total volume in 2012. As a whole, domestic non-sparkling saw slower volume reductions than the overall market in 2008 and 2009 and then outperformed it again in 2010, 2011, and 2012.
The non-sparkling category includes various components that typically follow divergent trajectories. In 2012, for the second year in a row, all four segments registered growth. Although each advanced at very different rates, every one of them grew faster than they had in the previous year. Throughout most of the 1990s and 2000s, the retail premium segment—consisting of still water in single-serve polyethylene terephthalate (PET) bottles—drove the over-all category’s development. Indeed, the PET component enlarged by a double-digit percentage rate 16 consecutive
JUNE/JULY 2013 BWR 15
Bottled water competes for market share with other packaged beverages— not tap water.
U.S. BOTTLED WATER MARKETPer Capita Consumption
2002 – 2012
YearGallons
Per CapitaAnnual
% Change
2002 20.1 --
2003 21.6 7.2%
2004 23.2 7.5%
2005 25.4 9.7%
2006 27.6 8.4%
2007 29.0 5.3%
2008 28.5 -1.8%
2009 27.6 -3.2%
2010 28.3 2.7%
2011 29.2 3.2%
2012 30.8 5.3%
Source: Beverage Marketing CorporationCopyright © 2013 by Beverage Marketing Corporation

times through 2007. Growth slowed markedly in 2008 before it disappeared in 2009. Yet, PET’s 0.9 percent reduc-tion was far less than the 2.5 percent loss measured for bottled water in general. Besides, PET volume in 2009 of almost 5.2 billion gallons stood more than 4.1 billion gallons higher than it had in 1999, and its share of total bottled water swelled from 24 percent to more than 61 percent during that ten-year period. In 2010, PET experienced the strongest growth of any bottled water segment, advancing by 6.8 percent to 5.5 billion gallons, which boosted its share above 63 percent. Growth slowed in 2011 but remained well in advance of the total market: volume greater than 5.8 billion gallons flowed from growth of 5.4 percent, which pushed PET’s share to 64 percent. In 2012, the segment saw its strongest showing since 2007, increasing by more than 8 percent to 6.3 billion gallons, which represented 65 percent of the overall market.
Retail bulk volume experienced some setbacks as more and more consumers selected convenient PET multipacks in large format retail channels instead of larger (1 to 2.5 gallon) sizes. Its share eroded from nearly one-quarter of the category volume at the beginning of the century to slightly more than 10 percent by 2012, largely as a result
of competition from PET. After multiple declines, the segment did grow in 2011 and 2012. Even so, retail bulk’s 1.8 percent uptick was the slightest of any domestic still water segment in 2012. Direct delivery also confronted intramural competition from handy, portable PET bottles. The segment, which comprised the largest of them all as recently as the mid-1990s, accounted for 12.4 percent of total volume by 2012. U.S. home and office delivery (HOD) volume slipped from close to 1.4 billion gallons in the early 2000s to 1.2 billion gallons in 2012, when volume moved up by 2.5 percent.
The relatively small, essentially regional vending segment in-volving refillable jug containers achieved growth even in the years when total bottled water volume declined. Its low cost during economic hard times undoubtedly had something to do with vending’s positive results. It continued to grow in 2012, albeit at a far slower rate than either the domestic still water market or the bottled water market as a whole.
One of the two segments outside the domestic non-sparkling realm showed renewed vigor in 2012; the other, to put it mildly, did not. The imported water segment, the smallest of them all, is prone to fluctuations. In the 2000s, it registered double-digit percentage growth in some years, and equally sizeable contractions in others. After one of those up years in 2007, imported water’s volume fell sharply in 2008 and then plummeted precipitously in 2009. It continued to shrink in 2010 before inching up by a modest clip in 2011. Volume dropped dramatically again in 2012. Sparkling water held a small share of bottled water volume but grew at a rate faster than any other type, including retail PET, in 2012.
As usual, domestic non-sparkling water accounted for almost all per capita bottled water consumption in 2012. Sparkling water and imports each represented less than one gallon per person. (With imports, the figure actually worked
16 BWR WWW.BOTTLEDWATER.ORG
U.S. BOTTLED WATER MARKETVolume and Growth by Segment
2010 – 2012
Non-sparkling Domestic Sparkling Imports Total
Year Volume* Change Volume* Change Volume* Change Volume* Change
2010 8,423.8 -- 213.5 -- 118.9 -- 8,750.6 --
2011 8,754.8 3.9% 232.0 8.6% 120.6 1.4% 9,107.3 4.1%
2012 9,307.5 6.3% 262.9 13.3% 104.0 -13.8% 9,674.3 6.2%
*Millions of gallonsSource: Beverage Marketing Corporation
Copyright © 2013 by Beverage Marketing Corporation
Domestic non-sparkling water accounted for almost all per capita bottled water consumption in 2012.

Bottled water is now a truly global beverage,
found even in some of the more remote corners of the globe.
out to about one-third of a gallon per U.S. resident.) In the key PET portion, average intake moved from less than 8 gal-lons in 2002 to more than 20 gallons ten years later.
International Developments Bottled water emerged as a beverage industry phenom-enon not only in the United States—the current No. 1 market in terms of volume—but also in virtually every major geographical region of the world. Bottled water first became a large, mainstream commercial beverage category in Western Europe, where, consumption of it has long been part of many residents’ daily routine. It is now a truly global beverage, found even in some of the more remote corners of the globe. Several Asian markets achieved strong growth to become major bottled water markets during the 2000s. In fact, Asia itself became the largest regional market in 2011, edging out North America and easily besting Europe; China claimed the No. 2 position, ahead of Mexico, which long held the spot. While China remained in second place in 2012, it looked poised to take the lead, which it in all likeli-hood will do during 2013.
Global bottled water consumption is estimated to have neared 65.8 billion gallons in 2012, according to data from the latest edition of Beverage Marketing’s The Global Bottled Water Market. Total consumption swelled by almost 7 percent in 2012. Per capita consumption of 9.2 gallons rep-resented a gain of 1.6 gallons over the course of five years.
Clearly, per capita consumption by individual region or country can diverge significantly from the global average. For instance, several Western European countries have per capita consumption levels far above 25 gallons, and the No. 1 market exceeded 68 gallons per person in 2012. At the same time, however, much of the developing world, where the bulk of the world’s population resides, finds its per capita consumption figures still in the single-digit range.
Although the global per capita consumption figure obscures pronounced regional disparities, bottled water’s global growth points to demand for it in diverse markets. Consumers have demonstrated a thirst for it in highly developed markets, in less developed ones, and in economies in transition. Bottled water tapped into some different consumer trends around the globe. In developed countries such as the United States and Canada, bottled water became a particularly dynamic major commercial beverage category by registering as an appealing option for health-conscious consumers. Marketers positioned bottled water as a virtuous alternative to carbonated soft drinks and fruit juice drinks (some of which comprise sizeable portions of their own product portfolios). The developed world came to see bottled water as not only a way of
achieving hydration but also as a functional beverage. At the same time, bottled water serves at least a partial solution to the problem of often-unsafe water found in many economically developing countries.
Much of the world’s bottled water market is still highly fragmented and controlled by local brands, but consolidation is definitely taking place, as four companies have come to dominate much of the market. Swiss food and beverage giant Nestlé and France’s Danone are the traditional leaders of the bottled water pack. Both companies initially centered their operations around the core markets of Western Europe and the United States. However, as water growth is increasingly coming from the developing world, Nestlé and Danone have expanded their initiatives to the competitive fields of Asia, Latin America, and other areas. In fact, Danone stepped back from the U.S. market to concentrate on some of those other markets. Soft drink industry leaders Coca-Cola and PepsiCo also entered the bottled water arena. After achieving solid positions in the United States, both companies increasingly devoted resources and energy to developing their global bottled water businesses.
North America boasts two of the three largest individual bottled water markets—the United States and Mexico—which together accounted for 26.6 percent of the world’s packaged water market in 2012. Although the U.S. bottled water market had been a catalyst for much of the global expansion up until the mid-2000s, its compound annual growth rate (CAGR) of 2.0 percent for the five-year period ending with 2012 was noticeably slower than the 5.7 per-cent CAGR achieved by the growth of the global market during the same period. Mexico alone accounted for 11.9 percent of the global volume with 7.8 billion gallons in 2012 and a market-beating CAGR of 5.9 percent.
China was the only other country that could claim a double-digit share of global volume with 9.6 billion gallons, or 14.6 percent of the total (or just one-tenth of a share point
JUNE/JULY 2013 BWR 17
2012 STATISTICS

behind the United States). Chinese bottled water volume enjoyed double-digit percentage growth rates for several consecutive years, registering a 14.9 percent CAGR for the period from 2007 to 2012—the highest rate among the five biggest bottled water markets and sufficiently muscular to vault it over Mexico and put it on the path to surpassing the United States in stature. Fourth-place Brazil’s CAGR lagged the international market, but fifth-place Indonesia moved well ahead of it. Sixth-place Thailand, the No. 3 Asian market, grew faster still.
Europe may not boast any of the biggest bottled water markets, but it does have several major ones, including three of the ten biggest. Because those markets are firmly established, however, their growth tends to be slower than those where bottled water has a less deeply
entrenched tradition. Some of the most prominent continental countries experienced contraction or only very slight growth. For instance, during the five-year period ending with 2012, Italy’s volume declined by 1.4 percent. Germany, the eighth-largest bottled water market in the world, had a CAGR of just 0.6 percent, and ninth-place France moved even slower. As a group, the trio of leading European bottled water markets accounted for 12.3 percent of the world’s total volume in 2012. (A fourth European market, Spain, ranked among the top ten until 2012, when rapidly rising India supplanted it.)
Still water accounts for the majority of bottled water sales in much of the world. Sparkling water sales are strong in a
18 BWR WWW.BOTTLEDWATER.ORG
GLOBAL BOTTLED WATER MARKETLeading Countries’ Consumption and Compound Annual Growth Rates
2007 – 2012
2012 Millions of Gallons CAGR*
Rank Countries 2007 2012 2007/12
1 United States 8,753.8 9,674.3 2.0%
2 China 4,787.8 9,577.3 14.9%
3 Mexico 5,885.2 7,821.5 5.9%
4 Brazil 3,621.1 4,608.9 4.9%
5 Indonesia 2,400.6 4,192.1 11.8%
6 Thailand 1,533.1 3,555.7 18.3%
7 Italy 3,100.9 2,893.4 -1.4%
8 Germany 2,743.2 2,826.2 0.6%
9 France 2,283.2 2,346.0 0.5%
10 India 899.4 1,703.0 13.6%
Top 10 Subtotal 36,008.4 49,198.5 6.4%
All Others 13,861.2 16,567.4 3.6%
WORLD TOTAL 49,869.6 65,766.0 5.7%*Compound annual growth rate
Source: Beverage Marketing CorporationCopyright © 2013 by Beverage Marketing Corporation

minority of countries—such as Argentina, Chile, Uruguay, the Netherlands, and Germany—where sparkling water is often tied to meal-consumption practices. On a global level, sparkling water accounts for an estimated 10 percent of the total volume, with still water accounting for the remaining 90 percent.
Plastic packaging is preferred over glass in almost every country, with the exception of Germany where recycling laws make a determinative impact on packaging trends. Even in Germany and other countries where glass has a strong presence, such as the United Kingdom, PET is the most dynamic and rapidly growing segment. At about one-third of global volume, HOD still accounts for a minority of
JUNE/JULY 2013 BWR 19
GLOBAL BOTTLED WATER MARKETPer Capita Consumption by Leading Countries
2007 – 20122012 Gallons Per Capita
Rank Countries 2007 2012
1 Mexico 54.1 68.4
2 Thailand 23.6 50.0
3 Italy 53.3 47.4
4 Belgium-Luxembourg 39.5 37.8
5 United Arab Emirates 33.5 35.2
6 France 35.8 35.0
7 Germany 33.3 34.3
8 Spain 31.7 31.2
9 Lebanon 20.1 29.3
10 United States 29.0 30.6
11 Hungary 28.5 29.2
12 Slovenia 25.2 28.3
13 Croatia 24.3 28.1
14 China, Hong Kong SAR 20.2 27.9
15 Switzerland 28.2 27.3
16 Saudi Arabia 24.1 26.4
17 Pacific Islands* 21.5 24.8
18 Austria 23.6 24.7
19 Poland 17.8 23.0
20 Brazil 19.1 22.9
GLOBAL AVERAGE 7.6 9.2
*Includes the Caroline Islands (Micronesia excluding Palau), the Marshall Islands and the Northern Marianas (excluding Guam).Source: Beverage Marketing Corporation
Copyright © 2013 by Beverage Marketing Corporationn
The United States and Mexico accounted for 26.6 percent of the world’s packaged water market in 2012.
2012 STATISTICS

global bottled water sales. Yet it is a vital segment in many countries, such as Mexico, where it accounts for more than two-thirds of the volume.
Year after year, Mexico leads the world in bottled water per capita consumption, and that didn’t change even after China surpassed it in absolute volume. Average intake in Mexico jumped from 54.1 gallons in 2007 to 68.4 gallons five years later. Per capita consumption in China stood almost ten times lower, at approximately 7 gallons, in 2012. The not-long-ago leader in average intake, Italy, consumed the equivalent of 47.4 gallons per person in 2012.
Several Middle Eastern markets rank very highly in per capita bottled water consumption. With the equivalent of more than 35 gallons for each resident in 2012, the United Arab Emirates (UAE) had the fifth-highest level of bottled water consumption in the world. In addition to the UAE, the Middle East region has Lebanon and Saudi Arabia in the top 20 in per capita bottled water consumption. At 20.9 gallons per resident, Israel also consumes bottled wa-ter at a rate greater than the global average, though it didn’t make it onto the top-20 list.
Although Europe no longer held the top spot in volume per capita, 11 of the top 20 bottled water consumers on a per person basis were European countries as of 2012. The consumers of the combined market of Belgium-Luxembourg imbibed almost 38 gallons each, a rate that declined very slightly over the years. France, Germany, Spain, and Italy were the other European countries with per capita consumption greater than 30 gallons. French consumers quaffed 0.8 gallons less of bottled water in 2012 than they had five years earlier. In 2012, Germany and Spain had per capita consumption rates of 34.3 and 31.2 gallons respectively, putting them in seventh and ninth place in terms of average bottled water intake. Unlike France and Spain, Germany consumed more bottled water per person in 2012 than it had five years
before. Hungary, which ranked eleventh, also increased its bottled water consumption. While markets in the West hold the highest numbers, Eastern Europe can claim several spots among the top 20 in per capita bottled water consumption, although Bulgaria fell off the bottom of the list in 2009, when China’s special ad-ministrative region of Hong Kong displaced it. Croatia and Slovenia both consumed the equivalent of about 28 gallons per resident. Austria held the No. 18 spot in 2012, just ahead of Poland.
While Asian nations attained prominence among the world’s bottled water markets when measured in total volume, the most populous countries generally do not have high per-person intake levels. Thailand stood among the top 20 in terms of per capita bottled water consumption with 50 gallons in 2012. Hong Kong made the list for the first time as its average intake approached 22 gallons in 2009 and continued to increase per capita consumption subsequently, hitting 27.9 gallons in 2012. Despite its status as the second-largest market, mainland China had a per capita consumption number well below the global norm even though intake swelled by more than 3 gallons per person—nearly doubling from 2007 to 2012.
Americans’ 2012 per capita bottled water consumption put the United States in the No. 10 position among the coun-tries of the world, between Lebanon and Hungary.
Into the FutureBeverage Marketing expects bottled water, having put the weaknesses of the late 2000s behind it, to continue enlivening the U.S. multiple beverage marketplace dur-ing the second decade of the 21st century much as it did previously. The total amount of liquid Americans annually consume will remain stable, resulting in overall volume growth in line with population increases. Bottled water is likely to grow noticeably faster, unlike carbonated soft drinks, which will stay stagnant. Most other major bever-age categories, including coffee, milk, and tea, are likely to grow much more slowly than bottled water, which is poised to achieve still another high in per capita consump-tion in the years ahead.
20 BWR WWW.BOTTLEDWATER.ORG
John G. Rodwan, Jr., is editorial director at Beverage Marketing Corporation, a New York-based research, consulting, and financial services firm dedicated to the global beverage industry. Beverage Marketing publishes numerous market reports on bottled water and other beverages. For more information, visit www.beveragemarketing.com and www.beverageforum.com.
HOD is a vital segment in Mexico, where it accounts for more than two-thirds of the volume.
Related Documents