2012 Review of Water Prices Assessment of expenditure forecasts for Southern Rural Water 3603/64.006 Prepared for Essential Services Commission February 2013 2012 Review of Water Prices Assessment of expenditure forecasts for Southern Rural Water 3603/64.006

Welcome message from author
This document is posted to help you gain knowledge. Please leave a comment to let me know what you think about it! Share it to your friends and learn new things together.
Transcript

2012 Review of Water Prices
Assessment of expenditure forecasts for Southern Rural Water 3603/64.006
Prepared for Essential Services Commission
February 2013
2012 Review of Water Prices
Assessment of expenditure forecasts for Southern Rural Water 3603/64.006

2012 Review of Water Prices Assessment of expenditure forecasts for Southern Rural Water
February 2013 Cardno ii R:\3603-64 - ESC - Price Review 2012\006 - Southern Rural Water\Report\ESC - Assessment Of Expenditure Forecasts For SRW - FINAL For Issue.Docx
Document Information
Prepared for Essential Services Commission
Project Name Assessment of expenditure forecasts for Southern Rural Water
File Reference Draft Report
Job Reference 3603/64.006
Date February 2013
Contact Information
Cardno (QLD) Pty Ltd
ABN 57 051 074 992
Level 11, North Tower Green Square
515 St Paul’s Terrace
Locked Bag 4006
Fortitude Valley Qld 4006
Telephone: 07 3369 9822
Facsimile: 07 3369 9722
International: +61 7 3369 9822
www.cardno.com.au
Document Control
Version Date Author Author Initials
Reviewer Reviewer Initials
Draft December 2012 Sean Ackaert
Aneurin Hughes
Final February 2013 Sean Ackaert
Aneurin Hughes
© Cardno 2013. Copyright in the whole and every part of this document belongs to Cardno and may not be used, sold, transferred, copied or reproduced in whole or in part in any manner or form or in or on any media to any person other than by agreement with Cardno.
This document is produced by Cardno solely for the benefit and use by the client in accordance with the terms of the engagement. Cardno does not and shall not assume any responsibility or liability whatsoever to any third party arising out of any use or reliance by any third party on the content of this document.

2012 Review of Water Prices Assessment of expenditure forecasts for Southern Rural Water
February 2013 Cardno iii R:\3603-64 - ESC - Price Review 2012\006 - Southern Rural Water\Report\ESC - Assessment Of Expenditure Forecasts For SRW - FINAL For Issue.Docx
Term Definition
ANCOLD Australian National Committee on Large Dams
BAU Business As Usual
BMID Bacchus Marsh Irrigation District
Capex Capital Expenditure
CPI Consumer Price Index
CRC Current Replacement Cost
DHS Department of Human Services
EPA Environmental Protection Authority
ESC Essential Services Commission
FTE Full Time Equivalent
GIS Geographical Information System
G-MW Goulburn-Murray Water
GWM Water Grampians Wimmera Mallee Water
IT Information Technology
KPI Key Performance Indicator
LMW Lower Murray Water
MCA Multi-Criteria Analysis
MID Macalister Irrigation District
NPR National Performance Report
NPV Net Present Value
NWC National Water Commission
O&M Operations & Maintenance
OH&S Occupational Health & Safety
OM&A Operation, Maintenance and Administration
Opex Operating Expenditure
RAV Regulated Asset Value
SCADA System Control and Data Acquisition
SRW Southern Rural Water
WDV Written Down Value
WID Werribee Irrigation District
WIRO Water Industry Regulatory Order 2003
WP Water Plan

2012 Review of Water Prices Assessment of expenditure forecasts for Southern Rural Water
February 2013 Cardno iv R:\3603-64 - ESC - Price Review 2012\006 - Southern Rural Water\Report\ESC - Assessment Of Expenditure Forecasts For SRW - FINAL For Issue.Docx
Executive summary
Cardno has been engaged by the essential Services Commission (ESC) to undertake an independent review
of the expenditure forecasts provided by Southern Rural Water (SRW) as part of its Water Plan submission
for the period 2013/14 to 2017/18.
Operating expenditure forecasts – determination of baseline operational expenditure
SRW has developed its forecast opex by adjusting its 2011/12 actual expenditure to formulate a baseline
figure that is representative of business-as-usual. ES Table 1 below reconciles the 2011/12 actual opex to its
2011/12 baseline opex.
ES Table 1 Reconciliation of 2011-12 actual opex to baseline opex
Adjustment Amount
Actual 2011-12 BAU opex 19,356
Wet year savings 134
Intensive Management Fee (IMF) costs not incurred 243
Strategy position filled, deferral of communication activity due to flood work and increase in software cost that has been delayed by 12 months
124
Isolated legal and flood cost expenditure (188)
Other minor adjustments (18)
2011-12 Baseline BAU opex 19,651
Indexed to 2012/13 (1.58%) 19,962
Operation expenditure forecast – escalators
CPI
SRW has assumed the following escalation factors as listed in ES Table 2. These factors are consistent with
the CPI factors recommended by the ESC.
ES Table 2 Assumed CPI
13/14 14/15 15/16 16/17 17/18
CPI (per annum) 2.75% 2.75% 2.75% 2.75% 2.75%

2012 Review of Water Prices Assessment of expenditure forecasts for Southern Rural Water
February 2013 Cardno v R:\3603-64 - ESC - Price Review 2012\006 - Southern Rural Water\Report\ESC - Assessment Of Expenditure Forecasts For SRW - FINAL For Issue.Docx
Labour
SRW has forecast its number of FTEs to remain constant in WP3 as demonstrated in ES Figure 1
ES Figure 1 SRW forecast FTEs for WP3
The Southern Rural Water Enterprise Agreement was finalised in 2010 and was approved by the
Commissioner to come into effect on 25 November 2010 with a nominal expiry date of 30 September 2014.
This agreement specifies that salary rates payable include a 4% increase on the previous base rate and that
there will be a further 4% increase on 1 October 2011, 1 October 2012 and 1 October 2013 to cover a four
year agreement.
SRW has adopted an initial increase to labour of 4.45% in 2013-14, and have assumed a 1% real increase in its labour components for the remaining periods of WP3. This increase is offset with productivity savings to forecast a relatively fixed labour cost from 2014-2018 as detailed in ES Figure 2 and ES Table 3.
ES Figure 2 Percentage annual growth in total labour costs and labour cost per FTE
162
162
162
162
162
-
20
40
60
80
100
120
140
160
180
13-14 14-15 15-16 16-17 17-18
-1%
0%
1%
2%
3%
4%
5%
13-14 14-15 15-16 16-17 17-18
SRW Annual growth intotal labour costs
SRW Annual growth intotal labour costs perFTE

2012 Review of Water Prices Assessment of expenditure forecasts for Southern Rural Water
February 2013 Cardno vi R:\3603-64 - ESC - Price Review 2012\006 - Southern Rural Water\Report\ESC - Assessment Of Expenditure Forecasts For SRW - FINAL For Issue.Docx
ES Table 3 SRW Labour growth assumptions
13/14 14/15 15/16 16/17 17/18
Actual and forecast labour costs for current FTEs ($M)
13.56 13.52 13.52 13.52 13.52
Cost per FTE ($M) 0.08 0.08 0.08 0.08 0.08
Annual growth in labour costs for current FTEs 4.45% (0.27%) 0% 0% 0%
Electricity
Because most of SRW’s water supply is gravity fed, its electricity costs are mostly for office use and is a
minor cost in its business as usual estimates. SRW expects to manage electricity price increases within its
general basket of external costs and has therefore assumed a zero real electricity increase in this price path.
Chemicals
SRW provides raw water to its customers and hence the cost of chemicals forms an insignificant percentage
of its business as usual activities in the form of weed spraying. As a result, SRW has not escalated its
chemical costs.
Productivity
In accordance with the ESC requirements, SRW is seeking to achieve a 1% per annum productivity gain until
2018 by actively generating efficiencies through improved work processes and targeted capital works. The
implementation of the asset management system in 2013/14 will assist SRW to identify opportunities to
achieve these efficiencies.
Operation expenditure forecast – WP3 submission
Our findings indicate that changes in operating expenditure forecast by SRW for WP3 are consistent with the timing of major capital projects and for fulfilling its obligations and customer service expectations as cost efficiently as possible. Any divergences from historical trends in operating expenditure have been explained by management and are detailed in Section 4 of this report.
The final recommendations for SRW’s operating and capital expenditure for the third regulatory period are outlined in ES Table 4.

2012 Review of Water Prices Assessment of expenditure forecasts for Southern Rural Water
February 2013 Cardno vii R:\3603-64 - ESC - Price Review 2012\006 - Southern Rural Water\Report\ESC - Assessment Of Expenditure Forecasts For SRW - FINAL For Issue.Docx
ES Table 4 Recommendations for SRW’s operating expenditure forecast
Current Price Path Future Price Path
11/12 12/13 13/14 14/15 15/16 16/17 17/18
Irrigation 10.56 10.51 10.44 10.37 10.3 10.23 10.16
Drainage - - - - - - -
Domestic and stock - - - - - - -
Surface water diversions 2.64 2.67 2.64 2.62 2.60 2.58 2.57
Groundwater diversions 2.63 2.66 2.66 2.65 2.63 2.61 2.59
Bulk water services 2.82 2.90 2.88 2.86 2.84 2.82 2.80
Licence Applications 1.32 1.20 1.21 1.20 1.19 1.18 1.17
Total BAU 19.97 19.94 19.83 19.7 19.56 19.43 19.29
New initiatives and obligations - - 0.60 0.44 0.39 0.39 0.38
External bulk water charges (excl. temporary purchases)
0.47 0.47 0.48 0.48 0.48 0.48 0.48
External temporary water purchases - - - - - - -
Licence fees 0.03 0.03 0.03 0.03 0.03 0.03 0.03
Environment contribution 0.29 0.28 0.42 0.41 0.40 0.39 0.38
Total prescribed opex 20.76 20.72 21.36 21.06 20.86 20.71 20.56
Cardno recommended 21.36 21.06 20.86 20.71 20.56
Net Change - - - - -
Capital expenditure forecasts
The final recommendations for SRW’s capital expenditure forecasts for the third regulatory period are
outlined in ES Table 5.
ES Table 5 Recommendations for SRW’s capital expenditure forecast
08/09 09/10 10/11 11/12 12/13 13/14 14/15 15/16 16/17 17/18
Irrigation 6.82 3.60 4.55 6.73 10.74 10.40 10.06 9.15 8.40 7.88
Surface water diversions
0.64 0.60 0.49 0.26 0.54 0.55 0.50 0.55 0.45 0.51
Groundwater diversions
0.54 0.75 0.35 0.27 0.91 0.53 0.40 0.46 0.42 0.32
Bulk water 8.20 3.32 1.91 0.85 1.63 3.31 4.08 1.77 1.56 1.09
Licence applications
0.25 0.18 0.22 0.12 0.20 0.17 0.18 0.19 0.19 0.18
Total prescribed BAU capex
16.46 8.44 7.52 8.23 14.01 14.97 15.22 12.13 11.02 9.97
Cardno recommended
14.97 15.22 12.13 11.02 9.97
Net Change - - - - -
Major projects comprising a significant proportion of the total capital expenditure forecast have been
assessed as part of this review and have been deemed appropriate in relation to SRW’s key drivers and

2012 Review of Water Prices Assessment of expenditure forecasts for Southern Rural Water
February 2013 Cardno viii R:\3603-64 - ESC - Price Review 2012\006 - Southern Rural Water\Report\ESC - Assessment Of Expenditure Forecasts For SRW - FINAL For Issue.Docx
obligations. Robust justifications and reasonable cost estimates of works required have been provided by
SRW for all projects reviewed as detailed in ES Table 6.
ES Table 6 Capital projects reviewed
Project Driver Estimated Cost
MID2030: Southern Cowwarr Balancing Storage Improved Service $6.4M
MID2030: Eastern Regulator Retrofit Improved service $2.7M
Werribee irrigation future program: Piping or lining of 4/1 channel
Renewal $4.0M
Replacement of conduit at Melton Reservoir Renewal $2.0M
Heyfield regulator retrofit Improved service $1.6M
Divergences from proposed capital expenditure for Water Plan 3 to SRW’s historical capital expenditure
trends have been investigated and are fully explained in Section 5 of this report.

2012 Review of Water Prices Assessment of expenditure forecasts for Southern Rural Water
February 2013 Cardno ix R:\3603-64 - ESC - Price Review 2012\006 - Southern Rural Water\Report\ESC - Assessment Of Expenditure Forecasts For SRW - FINAL For Issue.Docx
Table of Contents
Executive summary iv
1 Introduction 1
1.1 Background 1
1.2 Scope 2
1.3 Review methodology 4
2 Profile of SRW 5
2.1 Overview of SRW 5
2.2 Governance and organisational structure 5
2.3 Changes in service standards 7
2.4 Asset base 7
2.5 Benchmarking 8
2.6 Issues and challenges 14
2.7 Key outcomes identified in Water Plan 3 14
3 Asset management and project delivery 16
3.1 Asset management information systems 16
3.2 Progress in addressing recommendations of asset management audit 17
3.3 Capital delivery processes 18
3.4 Cost estimating processes 19
4 Operating expenditure 20
4.1 Methodology 20
4.2 Operating expenditure in current price path 20
4.3 Forecast vs. actual operating expenditure in current price path 21
4.4 Determination of baseline operational expenditure 21
4.5 Operating expenditure in the future price path 22
4.6 Operating expenditure escalators 24
4.7 Conclusions and Recommendations 26
5 Capital expenditure 27
5.1 Methodology 27
5.2 Overview 27
5.3 Capital expenditure in current price path 27
5.4 Capital expenditure in the future price path 29
5.5 Detailed review of sample capital projects 31
5.6 Recommendations and conclusions 34
6 Recommended opex and capex expenditure 35

2012 Review of Water Prices Assessment of expenditure forecasts for Southern Rural Water
February 2013 Cardno x R:\3603-64 - ESC - Price Review 2012\006 - Southern Rural Water\Report\ESC - Assessment Of Expenditure Forecasts For SRW - FINAL For Issue.Docx
Tables
Table 2-1 Benchmarking gravity irrigation operation and maintenance ........................................................ 9
Table 2-2 Operations, maintenance and administration cost per ML ......................................................... 10
Table 2-3 Operations, maintenance and administration charge per customer ........................................... 10
Table 2-4 Operations, maintenance and administration charge per km of assets ...................................... 10
Table 2-5 Operational costs per ML ............................................................................................................ 11
Table 2-6 Maintenance costs per customer ................................................................................................ 11
Table 2-7 Maintenance cost per km of assets ............................................................................................ 11
Table 2-8 Network delivery efficiency .......................................................................................................... 12
Table 2-9 Benchmarking gravity irrigation maintenance and capital expenditure 2009/10 ........................ 13
Table 2-10 Benchmarking headworks management ..................................................................................... 13
Table 3-1 Status of asset management information systems ..................................................................... 16
Table 4-1 Operating expenditure in current price path ($12/13) ................................................................. 20
Table 4-2 Reconciliation of 2011-12 actual opex to baseline opex ............................................................. 22
Table 4-3 Operating expenditure in future price path .................................................................................. 22
Table 4-4 Assumed CPI .............................................................................................................................. 24
Table 4-5 SRW Labour growth assumptions............................................................................................... 25
Table 5-1 Actual capital expenditure in Water Plan 2 ($12/13) ................................................................... 28
Table 5-2 Forecast capital expenditure program ($M 12/13) ...................................................................... 29
Table 5-3 Water Plan 3 top capital projects ($M 12/13) .............................................................................. 30
Table 6-1 Recommendations for SRW’s Operating Expenditure Forecasts ............................................... 35
Table 6-2 Recommendations for SRW’s Capital Expenditure Forecasts ................................................... 35
Figures
Figure 2-1 Organisational structure ................................................................................................................ 6
Figure 2-2 Asset value (%) by type of asset ................................................................................................... 8
Figure 4-1 Operating expenditure in current price path ($12/13) planned vs. actual ................................... 21
Figure 4-2 Total Business As Usual Opex (from a common base of 100) ................................................... 23
Figure 4-3 Total Prescribed Opex (from a common base of 100) ................................................................ 24
Figure 4-4 SRW forecast FTEs for WP3 ...................................................................................................... 24
Figure 4-5 Percentage annual growth in total labour costs and labour cost per FTE .................................. 25
Figure 5-1 Historic actual and forecast BAU capital expenditure from 2004-2018 ...................................... 27
Figure 5-2 WP2 Forecast expenditure compared to actual expenditure ...................................................... 28
Figure 5-3 Forecast expenditure by driver.................................................................................................... 29

2012 Review of Water Prices Assessment of expenditure forecasts for Southern Rural Water
February 2013 Cardno 1 R:\3603-64 - ESC - Price Review 2012\006 - Southern Rural Water\Report\ESC - Assessment Of Expenditure Forecasts For SRW - FINAL For Issue.Docx
1 Introduction
1.1 Background
On 1 January 2004 the Essential Services Commission (ESC) became the economic regulator for the
Victorian water sector. The Commission’s role involves regulating the prices and service standards of 20
regulated water businesses supplying water, sewerage and related services to residential, industrial and
commercial, and irrigation customers throughout the State.
Each of the regulated water businesses is required to develop and submit a Water Plan to the Commission
for its approval. The Plans are required to set out:
> What the water business proposes to achieve over the regulatory period in meeting demands for rural
and where relevant urban water and sewerage services, and complying with its obligations.
> How the water business proposes to achieve those outcomes.
> The water business’s revenue requirement to deliver those outcomes.
> The proposed prices, or the manner in which prices will be calculated or otherwise determined, for each
of the prescribed services.
The businesses are required to consult with other relevant regulators (including the ESC, the Environmental
Protection Authority (EPA) and the Department of Human Services (DHS)) and the Minister with respect to
those other parties’ requirements and expectations prior to submitting their Water Plans to the Commission
for the formal assessment against the principles set out in the Water Industry Regulatory Order 2003
(WIRO).
In late September 2012, the ESC received Water Plan 3 setting out, among other things, the proposed
expenditure forecasts and prices for the five year period commencing 1 July 2013 from Southern Rural
Water (SRW).
The ESC is required to assess the proposals set out in SRW’s Water Plan 3, consistent with the
requirements of the legislative framework. With respect to the businesses’ expenditure forecasts, it must be
satisfied that, among other things, the forecasts:
> Reflect efficient expenditure.
> Are consistent with delivering the required service levels, outputs and obligations over the regulatory
period.
> Take into account a planning horizon that extends beyond the regulatory period.
In assessing SRW’s proposed Water Plan, the Commission is required to have regard to its objectives under
the Essential Services Commission Act 2001 including the primary objective to “promote the long term
interests of Victorian consumers” [section 8(1)]. Section 4C of the Water Industry Act 1994 also sets out a
number of specific objectives that the Commission must have regard to in regulating the water sector
namely:
> Wherever possible, to ensure the costs of regulation do not exceed the benefits.
> To ensure regulatory decision making and regulatory processes have regard to any differences in the
operating environments of regulated entities.
> To ensure regulatory decision making has regard to the health, safety, environmental sustainability
(including water conservation) and social obligations of regulated entities.

2012 Review of Water Prices Assessment of expenditure forecasts for Southern Rural Water
February 2013 Cardno 2 R:\3603-64 - ESC - Price Review 2012\006 - Southern Rural Water\Report\ESC - Assessment Of Expenditure Forecasts For SRW - FINAL For Issue.Docx
Further more detailed requirements that the Commission needs to have regard to are set out in the WIRO,
made under section 4D of the Water Industry Act. In particular, the Commission must be satisfied that the
prices proposed by a water business comply with the regulatory principles outlined in the WIRO. Specifically,
the WIRO requires prices to be set so as to, among other things:
> Provide for a sustainable revenue stream to the regulated entity that nonetheless does not reflect
monopoly rents or inefficient expenditure by the regulated entity.
> Allow the regulated entity to recover operational, maintenance and administrative costs.
> Allow the regulated entity to recover expenditure on renewing and rehabilitating existing assets.
> Allow the regulated entity to recover a rate of return on investments made after 1 July 2004 to augment
existing assets or construct new assets.
> Take into account the interests of customers of the regulated entity, including low income and vulnerable
customers, in receiving reliable services at affordable prices.
> Provide the regulated entity with incentives to pursue efficiency improvements and to promote the
sustainable use of Victoria’s water resources and enable customers or potential customers of the
regulated entity to readily understand the prices charged by the regulated entity for prescribed services,
or the manner in which such prices are to be calculated or otherwise determined.
The regulatory principles also require the expenditure forecasts in the Water Plan to reflect the efficient
delivery of the proposed outcomes contained in the Water Plan and take into account a planning horizon that
extends beyond the regulatory period.
1.2 Scope
Cardno has been engaged by the ESC to undertake an independent review of the expenditure forecasts
provided by SRW as part of its Water Plan submission for the five year period commencing 1 July 2013 and
provide advice on whether the proposed expenditure forecasts are consistent with the requirements of the
legislative framework.
The main objective of the review is to determine whether the operating expenditure (opex) and capital
expenditure (capex) forecasts included in SRW’s Water Plan:
> Reflect efficient expenditure.
> Are consistent with delivering the required service levels, outputs and obligations over the regulatory
period.
> Take into account a planning horizon that extends beyond the regulatory period.
In undertaking the review, Cardno is required to consider:
> Any guidance issued by the ESC with respect to how it will assess the businesses’ proposed expenditure
forecasts including the 2013 Water Price Review – Guidance on Water Plans (2011).
> The information set out in SRW’s Water Plans (and accompanying information templates) and any
explanations that the businesses provide with respect to the basis used to derive the forecasts including
any assumptions used.
> Any readily available data and information that Cardno has access to, to assess expenditure forecasts.
> The experience of the Cardno’s project team in preparing and assessing the veracity of forecasts as well
as costing projects in the water sector.

2012 Review of Water Prices Assessment of expenditure forecasts for Southern Rural Water
February 2013 Cardno 3 R:\3603-64 - ESC - Price Review 2012\006 - Southern Rural Water\Report\ESC - Assessment Of Expenditure Forecasts For SRW - FINAL For Issue.Docx
Review of operating expenditure
The ESC requires advice on SRW’s operating expenditure, specifically on whether:
> Changes in operating costs are consistent with the timing of major capital projects.
> The Commission expects that energy costs, labour costs, IT costs and chemical costs will be a significant
focus of the operating expenditure review.
> SRW is fulfilling its obligations and meeting customer service expectations as cost efficiently as possible,
including through the setting of an appropriate target for cost efficiency gains.
> Any forecast divergence from historical trends in operating expenditure can be readily explained, for
example, by changes in obligations imposed by Government, including technical regulatory and customer
service expectations.
> One-off costs associated with the drought (for example costs relating to advertising, education and
appliance changeover) have been removed.
Review of capital expenditure
The ESC requires advice on SRW’s capital expenditure, specifically whether the projects reviewed meet the
following criteria:
> Appropriate in relation to key drivers and obligations – proposed capital expenditure reflects obligations
imposed by Government (including technical regulators) or customers’ service expectations.
> Robust (with adequate supporting analysis and systems) – as demonstrated by reports which clearly
enunciate the service outcomes proposed by the water business, and sets out the analysis undertaken of
the options to deliver these outcomes and identifies the preferred approach. Evidence may also be
sought to demonstrate that proposed capital expenditure is consistent with efficient long-term expenditure
on infrastructure services (based on a best practice asset management framework which considers risk
and system-wide needs).
> Deliverable over the regulatory period – demonstrated that the key activities comprising the delivery of the
project from planning to construction have been identified and thought through and that the projects can
be practically delivered within the proposed timeframe, given the business’s delivery of major projects in
the past.
> Reasonable cost estimate – the cost estimate is well supported either by a schedule of quantities using
typical rates currently being experienced in the industry, or compare favourably with other similar projects
or preferably both of the above.
> Proposed trends in capital expenditure are compared with historical trends in expenditure; to identify the
reasons for divergences from historical trends can be identified, together with any other relevant factors.
> The business’s risk sharing and incentive and penalty payment arrangements with its contractors are
based on a symmetrical sharing of risk for delivery or non-delivery of projects.

2012 Review of Water Prices Assessment of expenditure forecasts for Southern Rural Water
February 2013 Cardno 4 R:\3603-64 - ESC - Price Review 2012\006 - Southern Rural Water\Report\ESC - Assessment Of Expenditure Forecasts For SRW - FINAL For Issue.Docx
1.3 Review methodology
Our approach to this review was based around structured interviews with key agency staff. Our review had
the following stages:
> Review of information, particularly SRW’s Water Plan 3 for the period 2013 to 2018 and the expenditure
information templates provided to us by the ESC.
> Development and issue of a Review Plan, which sets out the program, interview themes and information
requests.
> Detailed interviews with SRW staff between 20 and 22 November 2012.
> Preparation of a Draft Report that identifies our preliminary views on SRW’s proposed expenditure
forecasts and the nature of further work and investigation that will be undertaken.
> Accept comments on the Draft Report (by 18 January 2013).
> Issue of a Final Report that identifies our final view on SRW’s proposed expenditure forecasts.
We found that SRW staff responded in a professional and cooperative manner to this review.

2012 Review of Water Prices Assessment of expenditure forecasts for Southern Rural Water
February 2013 Cardno 5 R:\3603-64 - ESC - Price Review 2012\006 - Southern Rural Water\Report\ESC - Assessment Of Expenditure Forecasts For SRW - FINAL For Issue.Docx
2 Profile of SRW
2.1 Overview of SRW
Southern Rural Water (SRW) was formed on 1 July, 1995 when the Rural Water Corporation was dissolved.
SRW is a Victorian Government not-for-profit corporation with three primary business functions:
> Irrigation Supply – supplying an average of 150,000ML for the Macalister Irrigation District near Maffra,
4,000ML to the Bacchus Marsh Irrigation District (BMID) and 10,000ML to the Werribee Irrigation District
(WID) and associated rivers for irrigation and stock and domestic use.
> Licensing access to water from groundwater and rivers – administering around 7,800 licences for surface
and groundwater diversions, and licensing construction of bores and on-stream dams. SRW acts on
behalf of the Minister to regulate licensing and use.
> Managing large dams and weirs – with seven dams and eight weirs in the Werribee, Maribyrnong,
Latrobe and Macalister basins to harvest, store and deliver bulk water entitlements for its own irrigation
customers, urban water authorities and Latrobe Valley power generators.
SRW has approximately 160 staff based in offices across Victoria from Hamilton to Bairnsdale that serves a
customer base of over 10,000. It has revenue of about $28 million per year and assets with a current
replacement cost of approximately $1.4 billion.
2.2 Governance and organisational structure
The State Government appoints a Board of directors to oversee the direction of the business. The operation
of SRW is the responsibility of the Manager Director, supported by the Chief Financial Officer, two General
Managers and three Managers with the area of responsibilities being:
> Water Supply East
> Water Supply West
> Groundwater and Rivers
> Strategic and Technical
> People and Performance
> Finance.

2012 Review of Water Prices Assessment of expenditure forecasts for Southern Rural Water
February 2013 Cardno 6 R:\3603-64 - ESC - Price Review 2012\006 - Southern Rural Water\Report\ESC - Assessment Of Expenditure Forecasts For SRW - FINAL For Issue.Docx
Figure 2-1 Organisational structure
Source: SRW Annual report 2012

2012 Review of Water Prices Assessment of expenditure forecasts for Southern Rural Water
February 2013 Cardno 7 R:\3603-64 - ESC - Price Review 2012\006 - Southern Rural Water\Report\ESC - Assessment Of Expenditure Forecasts For SRW - FINAL For Issue.Docx
2.3 Changes in service standards
SRW’s current approved service standards are articulated in Water Plan 2, the ESC’s Rural Water Customer
Service Code and included in its Customer Charter. The ESC has advised that the service standards in
Water Plan 3 should be:
> Maintained at current levels, without deterioration.
> Increased only with strong customer support.
> Linked to increased performance where there are increases in expenditure.
> Included in a revised Customer Charter.
SRW’s Service Standards for Water Plan 3 are, based on achieving “business as usual‟ service outcomes
with implementation of improvements, where possible, through efficiency and modernisation programs.
The service standards proposed by SRW:
> Maintain existing service levels without deterioration
> Have been developed with widespread customer consultation. SRW have worked with its customer forum
and invited comment from its broader customer base through direct mailing. It has also run a focus group
with licence holders in early 2012 and met with local councils and the Catchment Management Authority
to discuss the Water Plan as part of regular engagement meetings.
> Have been linked to increased performance from scheduled capital works
2.4 Asset base
SRW manages seven bulk water storages (including Lake Narracan), seven weirs (including Yallourn Weir)
and over 740 km of gravity irrigation channels. The current replacement cost of its infrastructure assets is
$1,471M with a written down value of $1,204M.
Figure 2-2 summarises the CRC of SRW’s asset base.

2012 Review of Water Prices Assessment of expenditure forecasts for Southern Rural Water
February 2013 Cardno 8 R:\3603-64 - ESC - Price Review 2012\006 - Southern Rural Water\Report\ESC - Assessment Of Expenditure Forecasts For SRW - FINAL For Issue.Docx
Figure 2-2 Asset value (%) by type of asset
The storage assets account for 69% of the asset base value with the distribution network accounting for the
remaining 31%.
The combined current replacement cost of Blue Rock Reservoir ($305.6M), Lederderg Weir and Diversion
Tunnel ($178.4M) and Lake Glenmaggie ($153.3M) accounts for 43% of SRW’s asset base.
Much of the infrastructure is nearing the end of its useful life and is seen by SRW as being one of its major
challenges.
2.5 Benchmarking
Gravity irrigation operation and maintenance
Table 2-1 summarises the gravity irrigation operation and maintenance data that was reported to the
National Water Commission (NWC) for 2009/10 and has been utilised to benchmark SRW’s performance
with other irrigation business in Australia. While this benchmarking is broad-brush it can be useful in
identifying trends or matters than require further investigation.
The ranking for each indicator is included in Table 2-2 through to Table 2-8.
The analysis indicates that SRW has a strong focus on keeping its operating costs down and is competitive
when its costs are benchmarked against the number of customers it serves. This analysis also suggests that
either maintenance practices are efficient or that there is an under-investment in maintenance. Further
improvement in SRW’s asset management systems will allow it to determine optimal maintenance and
renewal expenditure in the future.
Flume gate 1%
Other 2% Pipelines
4% Drains
4%
Channels 9%
Irrigation 11%
Headwork Assets
69%

2012 Review of Water Prices Assessment of expenditure forecasts for Southern Rural Water
February 2013 Cardno 9 R:\3603-64 - ESC - Price Review 2012\006 - Southern Rural Water\Report\ESC - Assessment Of Expenditure Forecasts For SRW - FINAL For Issue.Docx
Table 2-1 Benchmarking gravity irrigation operation and maintenance
Business Customers Intake Volume
Volume Supplied
Assets Operations Maint Admin OM&A OM&A per ML
OM&A per
Customer
OM&A per km assets
Ops per ML
Maint per
Customer
Maint per km
of Assets
Network Delivery
Efficiency
(#) (ML) (ML) (km) ($M) ($M) ($M) ($M) ($) ($) ($) ($) ($) ($) (%)
G-MW 13,592 1,396 1,010 7,071 13.9 18 13 44.9 32,163 3,303 6,350 10 1,324 2,546 72.30%
Lower Murray 4,346 100 87 646 3.4 5.55 2.63 11.58 115,800 2,665 17,926 34 1,277 8,591 87%
Murrumbidgee 3,364 505 368 5,068 5 6 7.8 18.8 37,228 5,589 3,710 10 1,784 1,184 72.90%
SunWater 2,647 857 603 2,656 13.5 12 4 29.5 34,422 11,145 11,107 16 4,533 4,518 70.40%
Murray 2,404 385 161 2,946 8.4 2.9 7.6 18.9 49,091 7,862 6,415 22 1,206 984 41.80%
SRW 1,536 238 151 1,333 6.1 2.16 1.87 10.13 42,563 6,595 7,599 26 1,406 1,620 63.40%
Harvey 681 88 67 728 1.1 0.95 1.36 3.41 38,750 5,007 4,684 13 1,395 1,305 76.10%
Coleambally 493 157 115 1227 0.9 3.6 2.8 7.3 46,497 14,807 5,949 6 7,302 2,934 73.20%
Ord 111 151 114 293 1.3 0.82 0.68 2.8 18,543 25,225 9,556 9 7,387 2,799 75.50%

2012 Review of Water Prices Assessment of expenditure forecasts for Southern Rural Water
February 2013 Cardno 10 R:\3603-64 - ESC - Price Review 2012\006 - Southern Rural Water\Report\ESC - Assessment Of Expenditure Forecasts For SRW - FINAL For Issue.Docx
Table 2-2 Operations, maintenance and administration cost per ML
Business OM&A per ML
Observation
1 Ord 18,543 SRW is ranked 6th overall in this benchmark and ranks 2nd (behind SunWater) in utilities with a customer base between 500 and 3,000.
Despite the age and poor condition of its infrastructure, SRW is comparable to its peers in this benchmark.
2 G-MW 32,163
3 SunWater 34,422
4 Murrumbidgee 37,228
5 Harvey 38,750
6 SRW 42,563
7 Coleambally 46,497
8 Murray 49,091
9 Lower Murray 115,800
Table 2-3 Operations, maintenance and administration charge per customer
Business OM&A per Customer
Observation
1 Lower Murray 2,665 SRW is ranked 5th overall in this benchmark and ranks 2
nd (behind
Harvey) in utilities with a customer base between 500 and 3,000.
SRW performs well amongst its peers in this benchmark. 2 G-MW 3,303
3 Harvey 5,007
4 Murrumbidgee 5,589
5 SRW 6,595
6 Murray 7,862
7 SunWater 11,145
8 Coleambally 14,807
9 Ord 25,225
Table 2-4 Operations, maintenance and administration charge per km of assets
Business OM&A per km assets
Observation
1 Murrumbidgee 3,710 SRW is ranked 6th overall in this benchmark. It ranks 4
th (behind
Harvey, Coleambally and Murray) in utilities with a customer base between 500 and 3,000.
This benchmark suggests that SRW could be underperforming in the cost of running its assets per kilometre. This could be attributed to its aging infrastructure, delivery inefficiencies (water loss) or diseconomies of scale as it has the 3
rd lowest ratio of channel km
per customer.
2 Harvey 4,684
3 Coleambally 5,949
4 G-MW 6,350
5 Murray 6,415
6 SRW 7,599
7 Ord 9,556
8 SunWater 11,107
9 Lower Murray 17,926

2012 Review of Water Prices Assessment of expenditure forecasts for Southern Rural Water
February 2013 Cardno 11 R:\3603-64 - ESC - Price Review 2012\006 - Southern Rural Water\Report\ESC - Assessment Of Expenditure Forecasts For SRW - FINAL For Issue.Docx
Table 2-5 Operational costs per ML
Business Ops per ML
Observation
1 Coleambally 6 SRW is ranked 8th overall in this benchmark. It ranks last in utilities
with a customer base between 500 and 3,000.
This performance measure is based on intake volume and increases to $40 per ML when based on volume supplied, highlighting the inefficient nature of SRW’s irrigation network.
2 Ord 9
3 G-MW 10
4 Murrumbidgee 10
5 Harvey 13
6 SunWater 16
7 Murray 22
8 SRW 26
9 Lower Murray 34
Table 2-6 Maintenance costs per customer
Business Maint per Customer
Observation
1 Murray 1,206 SRW is ranked 5th overall in this benchmark and ranks 3
rd (behind
Murray and Harvey) in utilities with a customer base between 500 and 3,000.
SRW performs well in this measure considering the age of its network. This indicator may suggest efficiency in maintenance practice or under-investment in maintenance
2 Lower Murray 1,277
3 G-MW 1,324
4 Harvey 1,395
5 SRW 1,406
6 Murrumbidgee 1,784
7 SunWater 4,533
8 Coleambally 7,302
9 Ord 7,387
Table 2-7 Maintenance cost per km of assets
Business Maint per km of Assets
Observation
1 Murray 984 SRW is ranked 4th overall in this benchmark. It ranks 3
rd (behind
Murray and Harvey) in utilities with a customer base between 500 and 3,000. This indicator may suggest efficiency in maintenance practice or under-investment in maintenance
2 Murrumbidgee 1,184
3 Harvey 1,305
4 SRW 1,620
5 G-MW 2,546
6 Ord 2,799
7 Coleambally 2,934
8 SunWater 4,518
9 Lower Murray 8,591

2012 Review of Water Prices Assessment of expenditure forecasts for Southern Rural Water
February 2013 Cardno 12 R:\3603-64 - ESC - Price Review 2012\006 - Southern Rural Water\Report\ESC - Assessment Of Expenditure Forecasts For SRW - FINAL For Issue.Docx
Table 2-8 Network delivery efficiency
Business Network Delivery Efficiency
Observation
1 Lower Murray 87% SRW is ranked 8th overall in this benchmark. It ranks 4
rd (behind
Harvey, Coleambally, SunWater) in utilities with a customer base between 500 and 3,000.
This measure highlights SRW’s network delivery inefficiency as being well below average and is consistent with the observations in Section 2.6.
2 Harvey 76.10%
3 Ord 75.50%
4 Coleambally 73.20%
5 Murrumbidgee 72.90%
6 G-MW 72.30%
7 SunWater 70.40%
8 SRW 63.40%
9 Murray 41.80%
Gravity irrigation maintenance and capital expenditure
Table 2-9 summarises the gravity irrigation maintenance and capital expenditure data that was reported to
the National Water Commission (NWC) for 2009/10. As the bulk of assets transferred to SRW at inception
had zero value, benchmarking in these measures could not be performed.
Benchmarking headworks management
Table 2-10 includes comparative information on regulated river supply service. The SRW regulated river
supply service has very low OM&A costs per storage, however, because of relatively low volumes its cost
per volume supplied is more than double that of StateWater and SunWater, but still significantly lower than
G-MW. SRW has the highest cost of maintenance per storage weir. Without further detailed analysis it is
difficult to determine the reasons for these differences. SRW may find it beneficial to investigate this further.

2012 Review of Water Prices Assessment of expenditure forecasts for Southern Rural Water
February 2013 Cardno 13 R:\3603-64 - ESC - Price Review 2012\006 - Southern Rural Water\Report\ESC - Assessment Of Expenditure Forecasts For SRW - FINAL For Issue.Docx
Table 2-9 Benchmarking gravity irrigation maintenance and capital expenditure 2009/10
Business Current Replacement Cost (CRC)
Written Down Value (WDV)
WDV/CRC Maint Maint as % Current Replacement cost
Capital Expenditure
Capital Expenditure/CRC
($M) ($M) (%) ($M) % ($M) (%)
G-MW 2,747.4 1435 52% 18.0 0.66% 7.3 0.27%
Lower Murray 102.9 47.5 46% 5.6 5.39% 3.6 3.50%
Southern Rural Water 2.2 3.7
Coleambally 98.6 33.2 34% 3.6 3.65%
Murray 356.5 2.9 0.81% 5.7 1.60%
Murrumbidgee 481.0 411 85% 6.0 1.25% 13.2 2.74%
SunWater 1,873.0 1146 61% 12.0 0.64% 6.9 0.37%
Ord 87.7 18 21% 0.8 0.94% - 0.00%
Harvey 121.8 110.7 91% 1.0 0.78% 5.6 4.60%
Table 2-10 Benchmarking headworks management
Cu
sto
me
r
ba
se
Lo
ng
Te
rm
Su
pp
ly
Ex
pe
cta
tio
n
Vo
lum
e
Vo
lum
e
Su
pp
lie
d in
Ye
ar
Reg
ula
ted
Riv
er
Sto
rag
e
We
ir
Op
ex
Ma
int
Ad
min
OM
&A
pe
r
Sto
rag
e
OM
&A
pe
r
Vo
lum
e
Su
pp
lie
d
Ma
int
pe
r
Sto
rag
e &
We
ir
OM
&A
pe
r
lon
g t
erm
su
pp
ly
ex
pe
cta
tio
n
vo
lum
e
(#) (GL) GL (km) (#) (#) ($M) ($M) ($M) ($M) $/ML ($k) $/ML
G-MW 30 273 83 2,470 13 14 26 2.75 3.22 2.46 385 69 117
SRW 108 24 93 580 7 8 2.90 1.10 1 0.71 54 101 208
State Water
5,719 4,587 1,682 7,920 18 306 17.60 15.60 2.60 1.99 21 48 8
Sun
Water
1,778 1,234 1,108 3,254 17 60 10.12 4.99 3.26 1.08 17 71 15

2012 Review of Water Prices Assessment of expenditure forecasts for Southern Rural Water
February 2013 Cardno 14 R:\3603-64 - ESC - Price Review 2012\006 - Southern Rural Water\Report\ESC - Assessment Of Expenditure Forecasts For SRW - FINAL For Issue.Docx
2.6 Issues and challenges
SRW operates a relatively old distribution network with high water losses and has customers that are
particularly sensitive to the cost increases associated with the storage and delivery of water. To manage this
challenge, SRW has adopted a capital delivery model that clearly identifies the need for works and engages
its customers to obtain consensus on where significant costs are to be spent.
Its MID2030 strategic program in the Macalister Irrigation District aims to make this network more efficient in
a sustainable and cost effective manner for its customers through pipelining and channel automation with the
objective to provide improved service and real water savings to its customers and assist in developing the
region’s economic growth and resilience to climate change.
The bulk of the assets in the Werribee and Bacchus Marsh are inefficient, old and approaching the end of
design life. A recent drought in this region highlighted that a strategic focus on the water supply was required
and resulted in a recycled water scheme being set up in the Werribee Irrigation District (WID). SRW has
identified some channel lining and installation of accurate measurement technology to improve the delivery
efficiency in the WID in WP3 and is undertaking a feasibility study into the reconfiguration and modernisation
of the Bacchus Marsh Irrigation District (BMID) network.
Dealing with new technologies from the modernisation programs also has implications for the business. New
skill sets are required from staff and different operational and maintenance work processes need to be
implemented to obtain full benefit from the upgrades to the irrigation network.
Headworks staff are facing increased operational challenges in setting up work processes to align with
ANCOLD safety inspections. SRW intends to manage this challenge by improving efficiencies in its
operations through targeted capital works.
Operations outside of SRW’s normal environmental conditions create a unique set of challenges depending
on whether it is a wet or dry season. SRW has identified that it may benefit from a contingency fund to
absorb costs associated with these seasonal variations without amending the indicative WP3 price path. At
the time of the review there was no formal documentation to define the costs that this fund can be utilised for
and other governance arrangements in maintaining these funds to ensure that these funds are being utilised
as intended.
An audit of SRW’s asset management function was recently completed and identified a number of
recommendations. SRW’s progress in addressing these recommendations is discussed in Section 3.
2.7 Key outcomes identified in Water Plan 3
SRW’s vision is to provide “outstanding rural water management for a prosperous southern Victoria”.
During WP3 it proposes the following initiatives and works that are relevant to this review and are discussed
further in the report:
> Safe dams: SRW is planning to reduce dam safety risk to within the “Limit of Tolerability”, consistent with
DSE’s Guidance Note (2011).
> MID2030 leading works: SRW has identified leading works to improve the efficiencies of the MID irrigation
network.
> Werribee Irrigation District works: SRW is to commence modernisation of the district, starting with piping
or lining the 4/1 channel.
> Bacchus Marsh Irrigation District: a cost and feasibility study on the reconfiguration of the district was
recently completed and will form the basis of discussions with customers and stakeholders regarding
future capital works in the area. Due to the significant costs associated with these works, SRW will
continue engaging with its customers and stakeholders to determine its long-term strategy for the region.
In the meantime, SRW’s short-term focus will be on ensuring continuity of supply from an aging asset
base.
> Asset management system: SRW has budgeted to implement an asset management system in 2012/13
that extends the business’s capability in workforce scheduling, work order generation and maintenance

2012 Review of Water Prices Assessment of expenditure forecasts for Southern Rural Water
February 2013 Cardno 15 R:\3603-64 - ESC - Price Review 2012\006 - Southern Rural Water\Report\ESC - Assessment Of Expenditure Forecasts For SRW - FINAL For Issue.Docx
history recording. Two extra staff members have been budgeted for 2013/14 for managing the new
system. This initiative is expected to identify and deliver efficiencies in Water Plan 3.
> Meter compliance plan: SRW intends to achieve full compliance of its unregulated surface water and
groundwater systems by 2020. Due to the costs associated with compliance of this plan, existing meters
will only be replaced at the end of their useful life unless there is external funding provided or meters are
replaced within an automation project. An outlet rationalisation program in the MID will assist in reducing
the future capital costs associated with these works.

2012 Review of Water Prices Assessment of expenditure forecasts for Southern Rural Water
February 2013 Cardno 16 R:\3603-64 - ESC - Price Review 2012\006 - Southern Rural Water\Report\ESC - Assessment Of Expenditure Forecasts For SRW - FINAL For Issue.Docx
3 Asset management and project delivery
As part of our review, we took into consideration SRW’s asset management practices in relation to their
potential impact on its operating and capital expenditure projections. Key relevant information and
observations are noted in the following sub-sections.
3.1 Asset management information systems
The systems utilised by SRW to manage its asset information, and the status of these systems is
summarised in Table 3-1. These systems are not integrated, but the GIS, Asset Life and Finance One are
linked.
Table 3-1 Status of asset management information systems
System - Category
Code System Name
EIB
- I
rrig
ati
on
EIB
- D
am
s
WIB
-
Irri
ga
tio
n
WIB
- D
am
s
G&
R
Links with
Level of development
Planned upgrade
Customer management
CM IPMG2
Advanced No
Asset register AR AssetLife
CR, GIS Intermediate Full replacement
GIS GIS Esri AR
Maintenance management
MM Varies
None Minimum Module of new AR
Asset Performance
AP No System
Minimum Part of new AM
Cost reporting CP Finance One
None Intermediate Part of new AM
SCADA SC Mixed Minimum Site specific
Mobile computing
MC Mobiles, tablets and phones
Minimum Under review
Fully developed
Partially
developed
Implementation of the new asset management system in 2013/14 will improve the information available to
SRW and allow it to optimise its asset management processes.
The outputs from the upgrade to the asset management system include:
> A consolidated Asset Register
> Maintenance workflow management
> User defined reporting
> Asset strategic performance tool
> GIS Integration.

2012 Review of Water Prices Assessment of expenditure forecasts for Southern Rural Water
February 2013 Cardno 17 R:\3603-64 - ESC - Price Review 2012\006 - Southern Rural Water\Report\ESC - Assessment Of Expenditure Forecasts For SRW - FINAL For Issue.Docx
> Flexible User Interface
> Mobile device compatibility.
3.2 Progress in addressing recommendations of asset management audit
The asset management audit undertaken in late 2011 identified the following improvement opportunities:
Recommendation SRW Progress
1. An Asset Management Plan is required for the Werribee and Bacchus Marsh Irrigation Districts.
SRW anticipates having an Asset Management Plan completed for the WID and BMID in the 2012/13 financial year.
2. Completion of the project to implement a comprehensive Asset Management System.
SRW is progressing with the implementation of its new asset management system.
3. Review the current Dam Safety Management Manual against the recommended Asset Management Plan guidelines, as presented within the International Infrastructure Management Manual (IIMM).
In progress
4. Implementation of the Asset Management System should include consideration of access to timely and accurate information from headworks to allow for input of information, and access to reports for maintenance and operational purposes.
This recommendation is being addressed as part of the new asset management system implementation.
5. Timely access to accurate maintenance information required for water distribution assets. Maintenance budgets should be set based on a “bottom up” approach, i.e., such that maintenance budgets are calculated from the summation of anticipated spend against specific assets, based on their condition, criticality, expected level of service and risk of failure.
This recommendation is being addressed as part of the new asset management system implementation.
6. Complete the Western Irrigation Asset Management plan to cover the operation, maintenance and management of assets within the Werribee and Bacchus Marsh regions.
SRW anticipates having an Asset Management Plan completed for the WID and BMID in the 2012/13 financial year.
7. Reassess current staffing levels against required workload, specifically for the operation and maintenance of headworks.
SRW intends to manage this challenge by improving efficiencies in its operations through targeted capital works.
8. Confirm that tracking and reporting of maintenance activities has been considered as part of the current project to implement an Asset Management System.
This recommendation is being addressed as part of the new asset management system implementation.
9. Once an agreed pattern approved meter has been identified, a plan to upgrade current metering systems will need to be developed – it is understood that this metering upgrade plan will be included in the next SRW Water Plan.
SRW intends to achieve full compliance of its meters in the unregulated surface water and groundwater systems by 2020. Due to the costs, existing meters will be grandfathered unless there is external funding provided or meters are replaced within an automation project.
10. The Asset Life Asset Register does not currently allow for adequate information about meters to be recorded, and is an out of date product. Include required information within the Asset Management System currently being implemented.
This recommendation is being addressed as part of the new asset management system implementation.
11. Manage future maintenance of meters via the Asset Management System currently being implemented.
This recommendation is being addressed as part of the new asset management system implementation.
12. Meter maintenance needs to be improved from a reactive basis to a clearly defined proactive maintenance regime.
This recommendation is being addressed as part of the new asset management system implementation.

2012 Review of Water Prices Assessment of expenditure forecasts for Southern Rural Water
February 2013 Cardno 18 R:\3603-64 - ESC - Price Review 2012\006 - Southern Rural Water\Report\ESC - Assessment Of Expenditure Forecasts For SRW - FINAL For Issue.Docx
3.3 Capital delivery processes
SRW has developed and implemented a formalised capital delivery process which is documented in the
Capital Procedure Manual. This process aligns with the Victorian Department of Treasury and Finance’s
Gateway Model with staged approvals. The Manual includes the following Gate templates to initiate a capital
project:
Gate 1: Problem Statement
Gate 2: Business Case
Gate 3: Ready to procure
Gate 4: Other Assessment
Gate 5 & 6: Project Review and Close
The approach this process varies according to the value of the project:
>$500k Full process is to be followed
$100 – $500k Gate 1 and 2 is combined into one document
and approved jointly
<$100k Follow a simpler process
In our review of a sample of capital projects (refer Section 5) we found that generally these processes were
being followed.
A central part of SRW’s capital expenditure development and prioritisation process is assessment of risk.
ANCOLD guidelines provide the overall framework for risk management of SRW’s dams and its dam risk
portfolio is updated annually.
As risks are identified that relate to SRW’s physical assets, risk mitigation measures are recorded as
potential projects, a problem statement developed and potential consequences identified.
SRW has a formalised project prioritisation in place whereby the priority for identified capital projects is
assessed by scoring each project on a number of weighted criteria.
The capital expenditure prioritisation process assesses both risk and benefits. The risk component assesses
the level of change to risk associated with the implementation of the project. For example, a dam safety
project may take the probability of failure from a 1 in 1000 year event, to a 1 in > 100,000 year event. This
material change in the level of risk is then scored and all projects are ranked for benefit and risk reduction.
Customer Involvement
SRW interacts with its customers extensively regarding strategic projects (such as the MID2030 program)
and holds monthly customer committee meetings to address business as usual items.
Procurement
SRW follows the following procurement strategies for capital works:
Design: a consultancy panel is utilised and selected by open tender.
Construction: at least 2 quotes are obtained for works within $15,400 - $100,000
1 quote is obtained for works below $15,400
Works estimated to be greater than $100,000 are selected by open tender.

2012 Review of Water Prices Assessment of expenditure forecasts for Southern Rural Water
February 2013 Cardno 19 R:\3603-64 - ESC - Price Review 2012\006 - Southern Rural Water\Report\ESC - Assessment Of Expenditure Forecasts For SRW - FINAL For Issue.Docx
Process resources
SRW utilises internal resources for the identification and justification of capital initiatives.
Design and construction works are generally outsourced, but the program planning and project management
function of these works is retained in-house.
Most large projects are delivered by the Strategic and Technical group with smaller projects being delivered
by the relevant business group.
3.4 Cost estimating processes
Techniques used by SRW to estimate the cost of its projects varies depending on the nature and complexity
of the work required.
Routine works are based on standard costs collected from previous projects and applied to the scope of
works required. Where necessary, SRW allocates a contingency on an item by item basis to take into
account where the greatest variations may occur rather than adopting a blanket percentage.
For more complex works, preliminary estimates are calculated for initial options identified in the Problem
Statement. Upon approval of the Problem Statement, initial options identified are reconsidered and
thoroughly investigated to identify a preferred solution. Often external consultants will be engaged to review
the options proposed and to provide more detailed estimates of the potential solutions. SRW will review the
work of these investigations to identify a preferred solution. A detailed design is then commissioned for the
solution so that the best estimate of the cost of the required works can be determined and included in the
Business Case.
We conclude that SRW’s approach to cost estimation is appropriate.

2012 Review of Water Prices Assessment of expenditure forecasts for Southern Rural Water
February 2013 Cardno 20 R:\3603-64 - ESC - Price Review 2012\006 - Southern Rural Water\Report\ESC - Assessment Of Expenditure Forecasts For SRW - FINAL For Issue.Docx
4 Operating expenditure
4.1 Methodology
The review of SRW’s historic and forecast operating expenditure (opex) was based on interviews with key
SRW staff, analysis of data provided and consideration of the following documents:
> Water Plan 3 Submission
> Water Plan 3 Financial Template
> Information provided by SRW staff in response to interview questions and requests for clarification or
supporting material.
4.2 Operating expenditure in current price path
Operating expenditure in the current price path is summarised in Table 4-1. The expenditure shows a
consistent reduction in costs year on year from 2008/09 to 2010/11. It then increases marginally by 0.7% in
2011/12 and the forecast 2012/13 expenditure is anticipated to decrease by 2%.
Table 4-1 Operating expenditure in current price path ($12/13)
08/09 09/10 10/11 11/12 12/13
Irrigation 8.88 8.61 8.31 10.56 10.51
Drainage - - - - -
Domestic and stock - - - - -
Surface water diversions 2.25 2.28 2.48 2.64 2.67
Groundwater diversions 2.31 2.33 2.41 2.63 2.66
Bulk water services 4.90 4.91 5.18 2.82 2.90
Licence applications 2.68 2.57 1.71 1.32 1.20
Total Business as Usual 21.02 20.70 20.09 19.96 19.94
New initiatives and obligations
External bulk water charges (excl. temporary purchases)
2.11 2.03 0.25 0.47 0.47
External temporary water purchases - - - - -
Licence fees 0.03 0.03 0.02 0.03 0.03
Environment Contribution 0.30 0.33 0.25 0.29 0.28
Total prescribed opex 23.46 23.09 20.61 20.76 20.72
Fully Government funded programs/projects - - - - -
Fully customer funded programs/projects - - - - -

2012 Review of Water Prices Assessment of expenditure forecasts for Southern Rural Water
February 2013 Cardno 21 R:\3603-64 - ESC - Price Review 2012\006 - Southern Rural Water\Report\ESC - Assessment Of Expenditure Forecasts For SRW - FINAL For Issue.Docx
4.3 Forecast vs. actual operating expenditure in current price path
Figure 4-1 compares planned and actual operating expenditure in the current price path. The total actual
expenditure over the price path is estimated to be $108.63M compared to a planned expenditure of $98.83M
a variance of 9.93%.
* Forecast
Figure 4-1 Operating expenditure in current price path ($12/13) planned vs. actual
Due to drought conditions in 2008/09 and 2009/10, SRW incurred additional expenditure not included in its
original forecasts in the form of increased groundwater application costs and recycled water/emergency
water supply. Additional costs for these items totalled $4.4M in 2008/09 and $3.5M in 2009/10. These
additional costs account for a large proportion of the observed variance between the forecast and actual
expenditure in these periods.
The average variance of actual vs. forecast expenditure for WP2 when adjusted for the impact of the drought
is 3% which we believe is reasonable tolerable given the challenging operating environment faced by SRW
in WP2.
4.4 Determination of baseline operational expenditure
SRW has developed its forecast opex by adjusting its 2011/12 actual expenditure to formulate a baseline
figure that is representative of business-as-usual. Table 4-2 below reconciles the 2011/12 actual opex to its
2011/12 baseline opex.
20
.23
19
.79
19
.86
19
.54
19
.41
23
.46
23
.09
20
.61
20
.76
20
.72
0
5
10
15
20
25
08/09 09/10 10/11 11/12 12/13*
$M
Forecast Operating Expenditure inWP2 (adj to 12/13 $)
Actual Operating Expenditure inWP2
2012 Review of Water Prices Assessment of expenditure forecasts for Southern Rural Water
February 2013 Cardno 22 R:\3603-64 - ESC - Price Review 2012\006 - Southern Rural Water\Report\ESC - Assessment Of Expenditure Forecasts For SRW - FINAL For Issue.Docx
Table 4-2 Reconciliation of 2011-12 actual opex to baseline opex
Adjustment Amount
Actual 2011-12 BAU opex 19,356
Wet year savings 134
Intensive Management Fee (IMF) costs not incurred 243
Strategy position filled, deferral of communication activity due to flood work and increase in software cost that has been delayed by 12 months
124
Isolated legal and flood cost expenditure (188)
Other minor adjustments (18)
2011-12 Baseline BAU opex 19,651
Indexed to 2012/13 (1.58%) 19,962
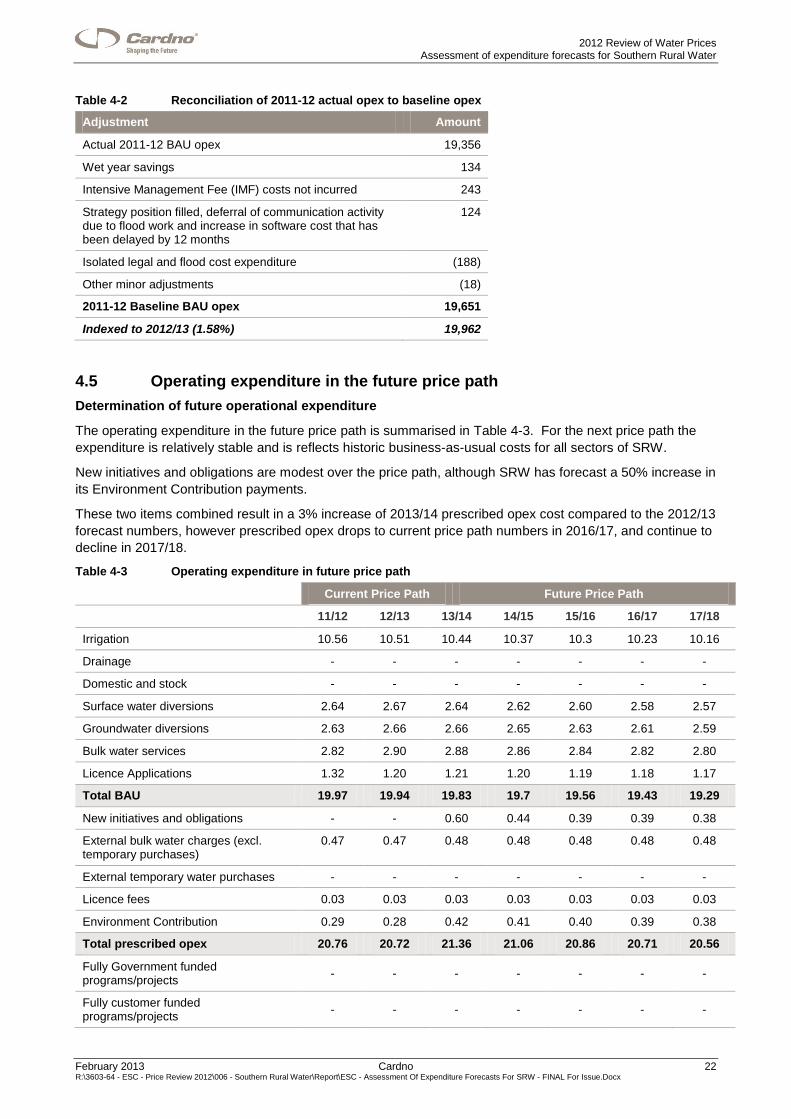
4.5 Operating expenditure in the future price path
Determination of future operational expenditure
The operating expenditure in the future price path is summarised in Table 4-3. For the next price path the
expenditure is relatively stable and is reflects historic business-as-usual costs for all sectors of SRW.
New initiatives and obligations are modest over the price path, although SRW has forecast a 50% increase in
its Environment Contribution payments.
These two items combined result in a 3% increase of 2013/14 prescribed opex cost compared to the 2012/13
forecast numbers, however prescribed opex drops to current price path numbers in 2016/17, and continue to
decline in 2017/18.
Table 4-3 Operating expenditure in future price path
Current Price Path Future Price Path
11/12 12/13 13/14 14/15 15/16 16/17 17/18
Irrigation 10.56 10.51 10.44 10.37 10.3 10.23 10.16
Drainage - - - - - - -
Domestic and stock - - - - - - -
Surface water diversions 2.64 2.67 2.64 2.62 2.60 2.58 2.57
Groundwater diversions 2.63 2.66 2.66 2.65 2.63 2.61 2.59
Bulk water services 2.82 2.90 2.88 2.86 2.84 2.82 2.80
Licence Applications 1.32 1.20 1.21 1.20 1.19 1.18 1.17
Total BAU 19.97 19.94 19.83 19.7 19.56 19.43 19.29
New initiatives and obligations - - 0.60 0.44 0.39 0.39 0.38
External bulk water charges (excl. temporary purchases)
0.47 0.47 0.48 0.48 0.48 0.48 0.48
External temporary water purchases - - - - - - -
Licence fees 0.03 0.03 0.03 0.03 0.03 0.03 0.03
Environment Contribution 0.29 0.28 0.42 0.41 0.40 0.39 0.38
Total prescribed opex 20.76 20.72 21.36 21.06 20.86 20.71 20.56
Fully Government funded programs/projects
- - - - - - -
Fully customer funded programs/projects
- - - - - - -

2012 Review of Water Prices Assessment of expenditure forecasts for Southern Rural Water
February 2013 Cardno 23 R:\3603-64 - ESC - Price Review 2012\006 - Southern Rural Water\Report\ESC - Assessment Of Expenditure Forecasts For SRW - FINAL For Issue.Docx
Benchmarking of operating expenditure price paths
In Section 2.5 we compared SRW’s performance against other rural water providers. This analysis
concluded that SRW has a strong focus on keeping its opex costs down and is competitive when its costs
are benchmarked against the number of customers it serves. However, this may also indicate underspending
on maintenance. Implementation of the new asset management system will provide SRW with the
information to identify opportunities for optimising maintenance and renewals.
In this section we trend the total business as usual operational and prescribed expenditure of SRW,
Grampians Wimmera Mallee Water (GWM Water), Lower Murray Water (LMW) and Goulburn-Murray Water
(G-MW) based on the information submitted in the Water Plan 3 financial template. All providers start with a
base of 100 in in a specific year (2005/06) and are adjusted for the % increase or decrease in expenditure.
Figure 4-2 shows very erratic movements in the % increases and decreases in the business as usual
operational expenditure of the four entities. This can be attributed to severe drought and subsequent flood
conditions in the mid to late 2000s. Projected expenditure is more stable from 2012/13 onwards.
This graph shows that SRW is projecting a gradual decrease in opex over WP3. SRW’s expenditure has
increased quite significantly in relation to 2005/06 expenditure.
Figure 4-2 Total Business As Usual Opex (from a common base of 100)
As with Figure 4-2 above, Figure 4-3 shows that following quite erratic movements in the percentage
increases and decreases in the prescribed operational expenditure due to the “non – business as usual
conditions” experienced by the businesses from 2005/06 to 2010/11. SRW’s expenditure is quite stable from
2011/12 onwards.
80
90
100
110
120
130
140
150
160
170
G-MW
LMW
GWM
SRW

2012 Review of Water Prices Assessment of expenditure forecasts for Southern Rural Water
February 2013 Cardno 24 R:\3603-64 - ESC - Price Review 2012\006 - Southern Rural Water\Report\ESC - Assessment Of Expenditure Forecasts For SRW - FINAL For Issue.Docx
Figure 4-3 Total Prescribed Opex (from a common base of 100)
4.6 Operating expenditure escalators
CPI
SRW has assumed the escalation factors listed in Table 4-4 for general inflation. These assumptions are
consistent with the CPI factors recommended by the ESC.
Table 4-4 Assumed CPI
13/14 14/15 15/16 16/17 17/18
CPI (per annum) 2.75% 2.75% 2.75% 2.75% 2.75%
Labour
SRW has forecast its number of FTEs to remain constant in WP3 as demonstrated in Figure 4-4.
Figure 4-4 SRW forecast FTEs for WP3
80
90
100
110
120
130
140
150
160
170
G-MW
LMW
GWM
SRW
16
2
16
2
16
2
16
2
16
2
-
20
40
60
80
100
120
140
160
180
13-14 14-15 15-16 16-17 17-18

2012 Review of Water Prices Assessment of expenditure forecasts for Southern Rural Water
February 2013 Cardno 25 R:\3603-64 - ESC - Price Review 2012\006 - Southern Rural Water\Report\ESC - Assessment Of Expenditure Forecasts For SRW - FINAL For Issue.Docx
The Southern Rural Water Enterprise Agreement was finalised 2010 and was approved by the
Commissioner to come into effect on 25 November 2010 with a nominal expiry date of 30 September 2014.
This agreement specifies that salary rates payable include a 4% increase on the previous base rate and that
there will be a further 4% increase on 1 October 2011, 1 October 2012 and 1 October 2013 to cover a four
year agreement.
SRW has adopted an initial increase to labour of 4.45% in 2013-14, and has assumed a 1% real increase in
its labour components for the remaining periods of WP3. This increase is offset with productivity savings to
forecast a relatively fixed labour cost from 2014-2018 as detailed in Figure 4-5 and Table 4-5.
Figure 4-5 Percentage annual growth in total labour costs and labour cost per FTE
Table 4-5 SRW Labour growth assumptions
13/14 14/15 15/16 16/17 17/18
Actual and forecast labour costs for FTEs ($m) 13.56 13.52 13.52 13.52 13.52
Cost per FTE ($000) 83.68 83.46 83.46 83.46 83.46
Annual growth in labour costs for FTEs 4.45% (0.27%) 0% 0% 0%
Electricity
Because most of SRW’s water supply is gravity fed, its electricity costs are mostly for office use and is a
minor cost in its business as usual estimates. SRW expects to manage electricity price increases within its
general basket of external costs and has therefore assumed a zero real electricity increase in this price path.
Chemicals
SRW provides raw water to its customers and hence the cost of chemicals forms an insignificant percentage
of its business as usual activities in the form of weed spraying. As a result SRW has not escalated its
chemical costs.
Productivity
In accordance with the ESC requirements, SRW is seeking to achieve a 1% per annum productivity gain until
2018 by actively generating efficiencies through improved work processes and targeted capital works. The
implementation of the asset management system in 2013/14 will assist SRW to identify opportunities to
achieve these efficiencies.
-1%
0%
1%
2%
3%
4%
5%
13-14 14-15 15-16 16-17 17-18
SRW Annual growth intotal labour costs
SRW Annual growth intotal labour costs perFTE

2012 Review of Water Prices Assessment of expenditure forecasts for Southern Rural Water
February 2013 Cardno 26 R:\3603-64 - ESC - Price Review 2012\006 - Southern Rural Water\Report\ESC - Assessment Of Expenditure Forecasts For SRW - FINAL For Issue.Docx
4.7 Conclusions and Recommendations
SRW has demonstrated in WP2 that it can set and achieve a 5 year budget forecast on its future operational
expenditure.
In WP3 it has submitted a modest increase in its operational costs.
Its normalisation of 2011/12 operational expenditure to determine baseline operation expenditure is
reasonable and its decreasing trend in costs over the price path is consistent with its peers.
The findings in Section 2.5 indicate that SRW has a strong focus on keeping its opex costs down and
appears to be competitive in relation to irrigation network costs against the number of customers it serves.
However this may be due to under-investment in maintenance. Implementation of the asset management
system in 2013/14 will enable SRW to optimise its maintenance and renewal expenditure.
Its escalation factors are reasonable and consistent with expectations.
SRW’s operational expenditure forecast reflects a focus on the business to keep its cost to customers low
without jeopardising its standards of service. SRW will monitor the implications of the modernisation
program and its maintenance strategies in WP3 to maintain a balance between service levels, risk, and cost.

2012 Review of Water Prices Assessment of expenditure forecasts for Southern Rural Water
February 2013 Cardno 27 R:\3603-64 - ESC - Price Review 2012\006 - Southern Rural Water\Report\ESC - Assessment Of Expenditure Forecasts For SRW - FINAL For Issue.Docx
5 Capital expenditure
5.1 Methodology
Our review of SRW’s historic and forecast capital expenditure (capex) was based on interviews with key
SRW staff, analysis of data provided and consideration of the following documents:
> Water Plan 3 Submission
> Water Plan 3 Financial Template
> Information provided by SRW staff in response to interview questions and requests for clarification or
supporting material.
5.2 Overview
Figure 5-1 illustrates the actual capital expenditure from 2008-2012 through to forecast expenditure in 2013-
2018 and shows the following trends:
> A significant increase in capital expenditure was incurred in 2007-2009 (due to $15.2M rollover works
from WP1 into WP2) and is forecast to increase again in 2012-2016 largely attributable to the forecast
MID2030 works.
> The main expenditure components are irrigation (mostly renewals) and bulk water (mostly related to dam
safety).
Figure 5-1 Historic actual and forecast BAU capital expenditure from 2004-2018
5.3 Capital expenditure in current price path
Capital expenditure in the current price path is summarised in Table 5-1. Figure 5-2 compares planned and actual expenditure during the price path.
-
2
4
6
8
10
12
14
16
18
Irrigation
Drainage
Domestic and stock
Surface water diversions
Groundwater diversions
Bulk Water
Licence applications
Total prescribed BAU capex

2012 Review of Water Prices Assessment of expenditure forecasts for Southern Rural Water
February 2013 Cardno 28 R:\3603-64 - ESC - Price Review 2012\006 - Southern Rural Water\Report\ESC - Assessment Of Expenditure Forecasts For SRW - FINAL For Issue.Docx
Table 5-1 Actual capital expenditure in Water Plan 2 ($12/13)
08/09 09/10 10/11 11/12 12/13
Irrigation 6.82 3.60 4.55 6.73 10.74
Surface water diversions 0.64 0.60 0.49 0.26 0.54
Groundwater diversions 0.54 0.75 0.35 0.27 0.91
Bulk Water 8.20 3.32 1.91 0.85 1.63
Licence applications 0.25 0.18 0.22 0.12 0.20
Total prescribed BAU capex 16.46 8.44 7.52 8.23 14.01
The capital expenditure forecast for WP2 included MID2030 planned works of $97M to provide an indication
of the scale and scope of the exercise. Final arrangements for the delivery of the full program are still
ongoing; however leading works for this project have been identified and have begun. Because of the
significant value of the full package of these works, and that work on this program has only recently
commenced (actual and forecast capital expenditure for WP2 is $8.2M), MID2030 projects have been
excluded for more meaningful analysis.
Figure 5-2 WP2 Forecast expenditure compared to actual expenditure
Figure 5-2 compares the adjusted WP2 forecast expenditure of $50.2M against WP2 adjusted actual capital
expenditure incurred of $46.4M (as reported in the Water Plan 3 spreadsheet). This equates to a -7.5%
variance on the forecast expenditure, that is, an underspend against forecast. The main reasons for this
$3.8M variance are:
> $6.5M underspend on minor projects. Approximately $2M of these works has been deferred to WP3. The
majority of the remaining underspend is a result of savings incurred on projects.
> $3.8M underspend in the Macalister Irrigation District Channel Automation Project as a result of the
Federal government’s decision to no longer fund these works.
> $2.1M construction works for the Southern Outlet Bypass Valve at Glenmaggie Reservoir, originally
budgeted for in the Channel Automation Project, but no longer funded by government.
> $2.1M of additional recoverable works at Yallourn as a result of project investigations identifying
significant undermining. The additional works performed underwent a full business case review.
17
.1
9.8
8.2
8.5
6.7
16
.5
8.4
7.5
8.2
5.8
-
2
4
6
8
10
12
14
16
18
08-09 09-10 10-11 11-12 12-13
WP2 Forecast Capex Path(excl MID2030)
WP2 Capex Path Actual

2012 Review of Water Prices Assessment of expenditure forecasts for Southern Rural Water
February 2013 Cardno 29 R:\3603-64 - ESC - Price Review 2012\006 - Southern Rural Water\Report\ESC - Assessment Of Expenditure Forecasts For SRW - FINAL For Issue.Docx
> $1M overspend in the embankment works at Melton Reservoir as a result of model studies identifying
additional necessary construction works.
> $0.5M overspend in the Carp Damage Channel Rehabilitation program in the MID as a result of additional
scope being identified.
> $0.5M overspend at Narracan due to additional works being required in the Anchor Lift project.
5.4 Capital expenditure in the future price path
SRW’s average annual capital spend in the future price path is $12.6M per annum, which is $1.7M more
than the $10.9M average annual spend in WP2. The increase is not substantial, and, given SRW’s track
record in the delivery of its capital works, should be able to be within SRW’s capability to deliver.
The forecast capital expenditure program by service is listed in Table 5-2 and indicates that 72% of the
scheduled works will be for irrigation assets and 19% for bulk water assets which has traditionally been the
main areas of capital investment. Expenditure by driver is illustrated in Figure 5-3 which indicates that the
primary drivers are renewals and improved service.
Table 5-2 Forecast capital expenditure program ($M 12/13)
13/14 14/15 15/16 16/17 17/18
Irrigation 10.40 10.06 9.15 8.40 7.88
Domestic and stock - - - - -
Surface water diversions 0.55 0.50 0.55 0.45 0.51
Groundwater diversions 0.53 0.40 0.46 0.42 0.32
Bulk water 3.31 4.08 1.77 1.56 1.09
Licence applications 0.17 0.18 0.19 0.19 0.18
Total prescribed BAU capex 14.97 15.22 12.13 11.02 9.97
Figure 5-3 Forecast expenditure by driver
The major renewal expenditure is:
> Channel renewal works ($2.8M).
> Replace Conduit at Melton Reservoir ($2M).
> IT Software and Hardware ($2M).
Renewals 34.37 54%
Growth -
0%
Improved service 25.30 40%
Compliance 3.63 6%

2012 Review of Water Prices Assessment of expenditure forecasts for Southern Rural Water
February 2013 Cardno 30 R:\3603-64 - ESC - Price Review 2012\006 - Southern Rural Water\Report\ESC - Assessment Of Expenditure Forecasts For SRW - FINAL For Issue.Docx
> Vehicle purchases ($8.4M).
In the case of vehicle purchases SRW has a fleet of approximately 130 vehicles and a policy to replace its
vehicles every 80,000km. It is estimated that each vehicle does 35,000km per annum and hence are
replaced almost every 2 years. This equates to 65 vehicles being replace a year at $26k per vehicle.
$20.5M of the MID2030 works represents 80% of the forecast improved service expenditure of $25.3M
The top capital projects are listed in Table 5-3.
Table 5-3 Water Plan 3 top capital projects ($M 12/13)
Project Total Cost ($M)
Driver Scope
Major projects
MID2030: Southern Cowwarr Balancing Storage
6.4 Improved Service To construct a balancing storage to act as a buffer between supply constraints and demand requirements alongside Nambrok Denison Main and 1 off take.
MID2030: Nambrok Denison Regulator Retrofit
4.7 Improved Service To automate the irrigation delivery in 4 channels buy modernising 27 in-channel regulators.
WIF: Piping or lining 4/1 Channel
4.0 Renewal To renew the 4/1pipe-channel system and improve access and operational characteristics.
MID2030: Outlet Rationalisation 3.7 Improved Service The Outlet Rationalisation Program aims to retain the existing supply area and volume but to reduce the size of the asset base required to provide the service. It also seeks to improve service through the use of modern outlets.
Interim Flood Capacity design at Merrrimu Reservoir
2.9 Compliance Detailed design to raise and keep existing zone orientation option – Use a larger gabion (or other retaining wall) filter buttress to provide greater crest width and enable filters and clay core to be raised on existing alignment.
MID2030: Eastern Regulator Retrofit
2.7 Improved Service To upgrade manually operated regulators to Flumegate® regulators. The nominated regulators are located on the Main Easter, Eastern 2, Eastern 7 and Eastern 11 channels.
Replace Conduit at Melton Reservoir
2.0 Renewal To renew a severely deteriorated 750mm cast iron outlet conduit at Melton Reservoir.
Heyfield Regulator Retrofit 1.6 Improved Service This project upgrades the manually operated regulators to FlumeGate™ regulators. The nominated regulators are located on the Heyfield 1 and the Heyfield 6 channels.
Carp Damage Channel Rehabilitation
1.5 Renewal To repair channel banks damaged by European Carp within the MID to prevent bank collapse and potential interruption of irrigation supply.

2012 Review of Water Prices Assessment of expenditure forecasts for Southern Rural Water
February 2013 Cardno 31 R:\3603-64 - ESC - Price Review 2012\006 - Southern Rural Water\Report\ESC - Assessment Of Expenditure Forecasts For SRW - FINAL For Issue.Docx
5.5 Detailed review of sample capital projects
Water Plan 2 sample projects
Melton embankment protection
Driver: Compliance
The Melton Reservoir was outside the ANCOLD Limit of Tolerability for existing dams. The susceptibility of
the right abutment to erosion was a major contributor to this noncompliance.
We viewed the business case and noted that it contained a thorough option analysis which clearly identified
that the preferred solution was to extend the concrete apron on the current alignment and is estimated to
cost $3.4M which included a $650k (20%) contingency. The project is ongoing.
Glenmaggie Reservoir southern outlet bypass valve
Driver: Improved service
The agreement for the MID Channel Automation Project involved the Commonwealth Government investing
$20M to achieve a target of 10,000 ML of savings for environmental flows. The final stage of the project
involves automating the southern outlet to provide flow control compatible with the Total Channel Control
(TCC) systems already installed downstream. The sequence to address this bypass valve last was a
deliberate project decision to allow time to resolve the technical solution at the outlet (this project) and to
resolve the logistics and contract issues with the hydro-power generation at the site.
TCC operation requires the ability for frequent (up to every 15 minutes) flow changes. These flows changes
require reliable and repeatable behaviour performance. The existing outlet valves were commissioned in the
1950s and are suitable for only one or two movements per day.
In the past, the needle valves have had a major overhaul about every 20 to 30 years. If a full TCC system
was introduced, the valves would receive as much service in a few months as they would receive in 30
years, creating an unacceptable risk of failure, along with a very high recurring cost (circa $400,000 each
service).
A detailed options analysis and cost estimate was performed in a business case approved by the Board on 2
June 2011 with the preferred option being identified to install an auxiliary off-take system on the southern
outlet conduits. This would allow frequent changes in flow to occur without calling on additional duty for the
large needle valves. This option would also allow the needle valves to be set at a relatively constant flow with
smaller changes (up to 300ML/d) being made via the auxiliary off-take. This would cover nearly all flow
changes and only large alterations in flow would require movement of the needle valves.
A detailed estimated of the works required was done by an external consultant to derive the $2.5M estimate.
This included contingencies of $590k.
At the time of our review, the valve had been put into operation and tuning of the valve was still ongoing.
It is anticipated that this project will be fully completed by the end of the 2011/12, with costs to date at $2.1M.
Water Plan 3 sample projects
As required under the scope set by the ESC, we have reviewed a sample of capital projects to inform our
opinion of G-MW’s future expenditure forecasts. Our findings are summarised below.
MID 2030 leading works program
Driver: Improved service
The MID2030 Leading Works Program represents $28M of irrigation modernisation works in the Macalister
Irrigation District and is expected to yield 15GL of water savings per annum.
Extensive investigation and customer consultation has occurred since 2007 to determine the appropriate
capital works to be undertaken in this region to modernise this irrigation network and thereby improving
network delivery efficiencies to its customers and contributing to the economic development of the MID.

2012 Review of Water Prices Assessment of expenditure forecasts for Southern Rural Water
February 2013 Cardno 32 R:\3603-64 - ESC - Price Review 2012\006 - Southern Rural Water\Report\ESC - Assessment Of Expenditure Forecasts For SRW - FINAL For Issue.Docx
Below is a review of a sample of the projects from this program scheduled for delivery in WP3.
Southern Cowwarr balancing storage
The nature of the Main Southern Channel does not allow for the full implementation of full Total Channel
Control system due to legacy issues associated with the long distance from the Glenmaggie and Thomson
and the lack of control on the Cowwarr channel. This results in reduced levels of service in the Southern
Cowwarr supply system and increased outfalls at the Thomson River siphon outfall. In addition the current
arrangement does not allow SRW to fully harvest surplus supplies from the Thomson system. Whilst there
has been significant automation in the Southern-Cowwarr Supply Zone further automation will not be able to
be implemented until the problem of control on the Main Southern Channel is resolved.
We were provided with a Problem Statement for this project and observed that it was endorsed by the
General Manager, Strategic and Technical on 25 January 2012 and accepted by the Manager, Water Supply
East on 26 January 2012 with the recommended option being to construct a balancing storage to act as a
buffer between supply constraints and demand requirements alongside Nambrok Denison Main and 1 off-
take. Preliminary project costing has been completed as part of the Problem Statement and once
geotechnical and civil design is completed SRW will gain a better understanding of the storage design
(control structures, filter, beaching and lining requirements), water saving and water harvest opportunities to
be included in the Business Case.
The investigation and design of this project was approved by the SRW Board on 1 March 2012 and a final
design tender for this project was awarded on 14 June 2012. Given the scope of works required, this detailed
investigation is necessary so that SRW can include the most accurate estimate of the works required in the
Business Case to be approved by the Board. This reduces the likelihood of significant variations to the cost
or scope of the project occurring after the Business Case has been approved.
Eastern regulator retrofit
The Eastern System is a predominantly manually operated system which has had a modest investment in
modernisation (four inline regulators and four outfall regulators). Analysis shows that the system has high
outfall volumes which are considered to be high avoidable losses. This problem statement focuses on the
Eastern Main, Eastern 2, Eastern 7 and Eastern 11 systems which has a combined outfall loss of 1,432ML
based on 09/10 data. Based on prior experience, infrastructure solutions could save approximately 1,000ML
(70%) in avoidable losses with a market value of $2.0M, at an assumed value of $2,000/ML.
The problem statement for this project was endorsed by the General Manager, Strategic and Technical on 4
February 2011 and accepted by the Manager, Water Supply on 24 February 2011. The document
considered a range of options with the recommended solution being to automate the irrigation delivery in the
4 channels by modernising 33 in-channel regulators with works estimated at $2.7M.
We were also provided with a copy of Business Case which provided a detailed analysis on the options
available to validate the preferred solution. The Business Case provided a detailed estimate of $2.7M
including a 24% contingency.
The capital cost estimates were developed by SRW utilising recent capital costs incurred in the channel
automation project. The cost estimates have been peer reviewed as part of the MID 2030 business case by
an independent cost estimator who performed a Monte Carlo analysis using their own data set.
The cost of this project implies a cost of $2,700 per ML of water saved as a result of improved efficiencies. .
Conclusion on suitability of the inclusion of sampled MID2030 in WP3 forecasts
The MID 2030 projects reviewed are appropriate to providing improved service to SRW’s customers. The
projects have been supported by adequate analysis and reasonable cost estimates and it is realistic to
expect that these works can be delivered in the timeframes proposed.

2012 Review of Water Prices Assessment of expenditure forecasts for Southern Rural Water
February 2013 Cardno 33 R:\3603-64 - ESC - Price Review 2012\006 - Southern Rural Water\Report\ESC - Assessment Of Expenditure Forecasts For SRW - FINAL For Issue.Docx
Werribee irrigation future program - Piping or lining of 4/1 channel Driver: Renewal
A problem statement has been prepared by the business demonstrating the need for rehabilitation of
channel sections in the hybrid 4/1 pipe-channel system having high water losses and difficult access and
operational characteristics. In the options analysis, detailed costing is provided for the relining ($3M) and
piping of the channels ($6.4M).
Due to increased diameters of uPVC pipes coming onto the market the cost of piping the channel has come
down significantly and revised costs are now estimated at $4M.
The options analysis will be updated upon further validation of these estimates and then a business case will
be prepared to substantiate the preferred option.
The proposed “Piping or lining of 4/1 channel” project is appropriate to SRW’s infrastructure renewal driver.
Whilst the project’s analysis and cost estimates are still being refined to ratify the preferred solution of piping
or lining – the process being followed by SRW is robust and has a strong focus on obtaining best value for
money for its customers and it is reasonable to expect that the works proposed can be delivered in the
timeframes proposed.
Replacement of conduit at Melton Reservoir Driver: Renewal
A review of the outlet works at Melton Reservoir was conducted by SMEC in 2009 and it was identified that
the condition of the 760mm diameter, 70 meter long cast iron outlet pipe was very poor and that extensive
corrosion had occurred. It was estimated that the conduit had less than six years of remaining life before the
pipe strength was compromised.
A problem statement was endorsed by the General Manager, Strategic and Technical on 16 February 2011
and accepted by the Manager, Water Supply.
The business case was prepared in August 2012 and approved by the Board on 24 August 2012.
A comprehensive options analysis and costing estimate was performed in the business case which identified
the preferred solution at a cost of $2.7M including a 33% contingency. SRW has allowed for $2M in its WP3
submission.
The proposed “Replacement of conduit at Melton Reservoir” project is appropriate to SRW’s infrastructure
renewal driver. The project has been supported by adequate analysis and reasonable cost estimates and it
is realistic to expect that these works can be delivered in the timeframes proposed.
Heyfield regulator retrofit
Driver: Improved Service
The irrigation method in the Heyfield area is predominately gravity fed surface irrigation and is expected to
remain so for some time. A major factor in the efficiency of this method is the ability to deliver constant flow
rates. The irrigation supply is from the Southern Main Channel. This channel is in good working condition
having been remodelled in the 1950’s and was upgraded to automated regulators in 2006.
Structures within the Heyfield distribution network are generally in reasonable condition and suited to the
retrofitting process as the manually operation system fails to provide adequate service levels to customers in
that area.
The objective of this project is to automate 32 manually operated regulators, generating an estimated 920
ML of water savings.
We were provided with a copy of the Business Case for this project that was approved by the SRW Board on
4 October 2012 that considered a variety of options to identify the preferred solution. The cost of this project
is estimated at $2.48M and has a 20% contingency. Estimates were determined using unit rates from
recently completed retrofit works incurred in the Eastern and Nambrok-Denison Regulator Retrofit projects.

2012 Review of Water Prices Assessment of expenditure forecasts for Southern Rural Water
February 2013 Cardno 34 R:\3603-64 - ESC - Price Review 2012\006 - Southern Rural Water\Report\ESC - Assessment Of Expenditure Forecasts For SRW - FINAL For Issue.Docx
Works valued at $900k is forecast to be constructed in 2012/13 with the balance of works to be delivered in
WP3.
The cost of this project implies a cost of $2,608 per ML of water saved as a result of improved efficiencies.
This project is appropriate to providing improved service to SRW’s customers. The project has been
supported by adequate analysis and reasonable cost estimates and it is realistic to expect that these works
can be delivered in the timeframes proposed.
5.6 Recommendations and conclusions
From discussions with SRW staff, a review of a sample of historical and forecast capital projects including
supporting documentation and a high level review of asset management and capital delivery processes we
consider that the capital projects undertaken in WP2 and proposed in WP3 are:
> Appropriate to key drivers and obligations.
> Are supported by adequate supporting analysis and systems.
> Are deliverable over the regulatory period.
> And, for projects planned for WP3, have reasonable cost estimates.

2012 Review of Water Prices Assessment of expenditure forecasts for Southern Rural Water
February 2013 Cardno 35 R:\3603-64 - ESC - Price Review 2012\006 - Southern Rural Water\Report\ESC - Assessment Of Expenditure Forecasts For SRW - FINAL For Issue.Docx
6 Recommended opex and capex expenditure
Following our review of SRW’s proposals for the upcoming Water Plan 3 regulatory period, we recommend
that SRW be allowed to recover in its revenue requirements the operating and capital expenditure detailed in
Table 6-1 and Table 6-2.
Table 6-1 Recommendations for SRW’s Operating Expenditure Forecasts
13/14 14/15 15/16 16/17 17/18
Final water plan 21.36 21.06 20.87 20.71 20.56
Cardno revised 21.36 21.06 20.87 20.71 20.56
Net change - - - - -
Table 6-2 Recommendations for SRW’s Capital Expenditure Forecasts
13/14 14/15 15/16 16/17 17/18
Final water plan 14.97 15.22 12.13 11.02 9.97
Cardno revised 14.97 15.22 12.13 11.02 9.97
Net change - - - - -
Related Documents