Department of Agricultural, Food, and Resource Economics Michigan State University Report No. 643 2012 MICHIGAN LAND VALUES and Leasing Rates Eric Wittenberg, Extension Specialist Christopher Wolf, Professor November 2012

Welcome message from author
This document is posted to help you gain knowledge. Please leave a comment to let me know what you think about it! Share it to your friends and learn new things together.
Transcript

Department of Agricultural, Food, and Resource Economics
Michigan State University
Report No. 643
2012 MICHIGAN LAND VALUES and
Leasing Rates
Eric Wittenberg, Extension Specialist
Christopher Wolf, Professor
November 2012

2012 MICHIGAN LAND VALUES
and
LEASING RATES
by
Eric Wittenberg and Christopher Wolf*
Michigan State University
* The authors are Extension Specialist and Professor, respectively in the Department of Agricultural,
Food, and Resource Economics, Michigan State University.

TABLE OF CONTENTS
Page
Survey Methods ............................................................................................................................................ 2
Agricultural-Use Farmland Values ............................................................................................................... 6 Average Farmland Values................................................................................................................. 6 Change in Farmland Values.............................................................................................................. 7
Farmland Leasing.......................................................................................................................................... 9 Crop Acres Leased ............................................................................................................................ 9 Cash Rent Levels ............................................................................................................................ 10 Land Value-to-Rent Multiplier ....................................................................................................... 11
Non-Agricultural-Use Values of Farmland................................................................................................. 12
Major Factors Influencing Land Values and Rents in Michigan ................................................................ 14
Conclusions................................................................................................................................................. 18
Appendix "Farmland Value Questionnaire" ............................................................................................. 20

LIST OF TABLES
Page
Table 1. Michigan Average Agricultural Land Values, 2012...................................................................... 6
Table 2. Percentage Change in Michigan Farmland Value, 2012................................................................ 8
Table 3. Characteristics of Leased Farmland in Michigan, 2012 .............................................................. 10
Table 4. Average Cash Rent and Value Multipliers for Michigan Agricultural Land Use, 2012.............. 11
Table 5. Non-Agricultural-Use Value of Undeveloped Land in Michigan, 2012...................................... 13
Table 6. Rating Importance of Agricultural Factors Affecting Value of Michigan Farmland, 2012 ........ 15
Table 7. Rating of Non-Agricultural Factors Affecting Value of Michigan Farmland, 2012…………....16
Table 8. Percentage Change in Land Value from 1991-2012 in the Southern Lower Peninsula….…..…18
LIST OF FIGURES Page
Figure 1. Farmland Value Questionnaire Responses ................................................................................... 3
Figure 2. Agricultural Statistics Districts and Number of Respondents ...................................................... 4

1
2012 MICHIGAN LAND VALUES Land is a natural resource that is valued for many reasons. Farmers utilize land to earn their
livelihood and as a store of wealth for future retirement. Rural residents have increasingly sought open
space for home sites and pursuit of a lifestyle. Developers seek financial opportunities to invest in and
develop land for non-farm uses. For some, land is viewed as an investment and a hedge against inflation.
This myriad of demands for land combined with its fixed supply continually alters its market price.
Land prices and expected changes in land prices are topics of interest to many. There are several
sources of information on Michigan farmland values. The Federal Reserve Bank of Chicago reports
quarterly farmland values for each state in its district based on a survey of lenders. However, Michigan
farmland sales transactions are sporadically reported due to insufficient survey response. The USDA
estimates the value of farmland and service buildings annually for every state based on a survey of
farmers. Both of these surveys provide useful information on aggregate farmland values in the state. For
land value information to be useful for individual decision-making, a more disaggregated measure of land
values based on land type, location, and use is desired. The State Equalized Value (SEV) used to
determine property taxes is set by township assessors at an estimated 50 percent of the market value of
farmland based on comparative sales studies conducted annually. County Equalization Directors review
the assessment rolls of local township assessors and make adjustments based on sales data. SEVs are
useful in determining representative land values but are handicapped by the historical sales perspective
upon which the appraisals are based.
Michigan State University (MSU) has also collected data on land values since 1991 by mail
survey. The goal of the MSU study is to provide information on the value of land based on its
agricultural use. The survey asks for information on the value of tiled and non-tiled land used to produce
field and fruit crops as well as information on the value of land that is used for sugar beets and irrigated
crops. The study also provides information on leasing rates and practices in the state. In addition, the
study collects information on the non-agricultural use value of farmland. The remainder of this report
contains the results for the MSU land value survey conducted in spring of 2012.
2
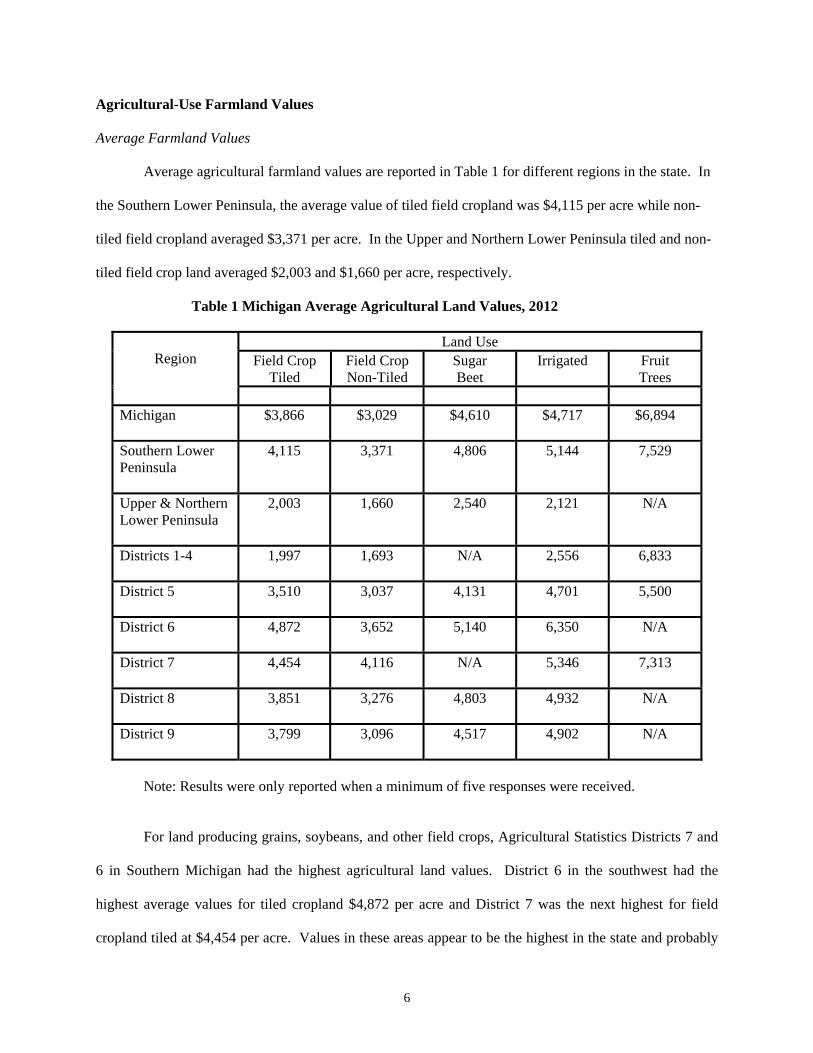
Survey Methods
The survey sample consists of members of the Farm Managers and Rural Appraisers Association,
Michigan Agricultural Lenders, County Equalization Directors in Michigan, and members of the Farm
Bureau Advisory Committees on feed grains, oil seeds, wheat, dry beans and sugar beets. After
accounting for overlap between the different groups, the total sample consisted of 600 potential
respondents. A total of 206 questionnaires were returned with useable information. In order to account
for potentially large differences in soil and climate characteristics, information is reported separately for
different regions of the state. Results are reported for two halves of the state, the southern-lower
peninsula and the upper and northern-lower peninsula, which are split at a line running from Oceana
County across to Bay County as shown in Figure 1. There were 165 responses received from the southern
half of the Lower Peninsula (Area 2 in Figure 1). The remaining 41 responses were received from the
Upper and Northern Lower Peninsula (Area 1 in Figure 1). This is a reasonable correspondence between
the location of respondents and the geographic distribution of agricultural production in the state. Figure
1 shows the distribution of respondents by county and Figure 2 shows the total number of responses by
the Agricultural Statistics District in the state. Results are also reported for the nine "Agricultural
Statistics Districts" across the state (Figure 2). The results for Districts 1 through 4 were combined
because of a low number of responses in that region. In addition, results are only reported for each
question when at least five responses were received for a reporting area.
It should be noted that some respondents might have been reporting for a group of individuals
who received the questionnaire, such as a Farm Credit Service branch or an appraisal group. It is also
important to recognize that the survey respondents, in many cases, were experts on land values in their
areas. These people often had access to a significant amount of land appraisal, transaction, and leasing
information.
Each sample member received a cover letter encouraging their participation in the study and a
two-page questionnaire asking for information on farmland. A summary of the survey results is provided

3
to the respondents upon request. The questionnaire was mailed in April of 2012. A postage paid return
envelope was provided to minimize the cost to potential respondents. A follow-up letter asking for
participation in the survey and a second copy of the questionnaire was sent to non-respondents
approximately four weeks after the original questionnaire was sent. Copies of the questionnaire used in
the survey are included in the Appendix.
Respondents were requested to provide the current agricultural-use value of the farmland, the
change in value during the last year, the expected change in value during the next year, and the cash rental
rate for their geographic area. In addition, information on the non-agricultural-use value of farmland was
requested. Estimates on agricultural-use values for farmland were reported separately for tiled (non-
irrigated) field crops, non-tiled field crops, fruit, sugar beets, and irrigated land. Price data on non-
agricultural use land values were collected for residential, commercial, and recreational development.
The respondents were also asked to indicate the county or counties to which their information
corresponds. In addition, an opportunity was provided for each respondent to rank the major agricultural
factors influencing land values and cash rents. Similarly, a ranking was requested of the major factors
influencing land values in rural areas for land that appears destined to transition to non-agricultural uses.
Efforts were made to report only the value of land in its agricultural production use. However, it
is difficult to separate out non-agricultural influences on land prices, so the agricultural-use values will
certainly display some non-agricultural-use impacts. The magnitude of these influences will vary across
local regions in state. The influences of non-agricultural factors on farmland values are addressed in
more detail later in the report.

Area 1North
Area 2South
Area No. Responses1 North2 SouthTotal Responses
41165206120
1
4
1
11
1
1
2
2
1 2 211
4
3
3
5
2
7
12
3
34
33
5
3
8
3
52
138
61
65
2 8 8
1
3 6
11
11
4
1
1
13
3
3
1
2 1
1 1
1
4
13
1
5
3
Figure 1. Farmland Value Questionnaire Responses
4

1
23
5
97
64
8
Ag Statistics Districts Number North D1-D4 43 Central D5 22 East Central D6 36 Southwest D7 27 South Central D8 44 Southeast D9 _34 Total 206
Figure 2. Agricultural Statistics Districts and Number of Respondents
5
6
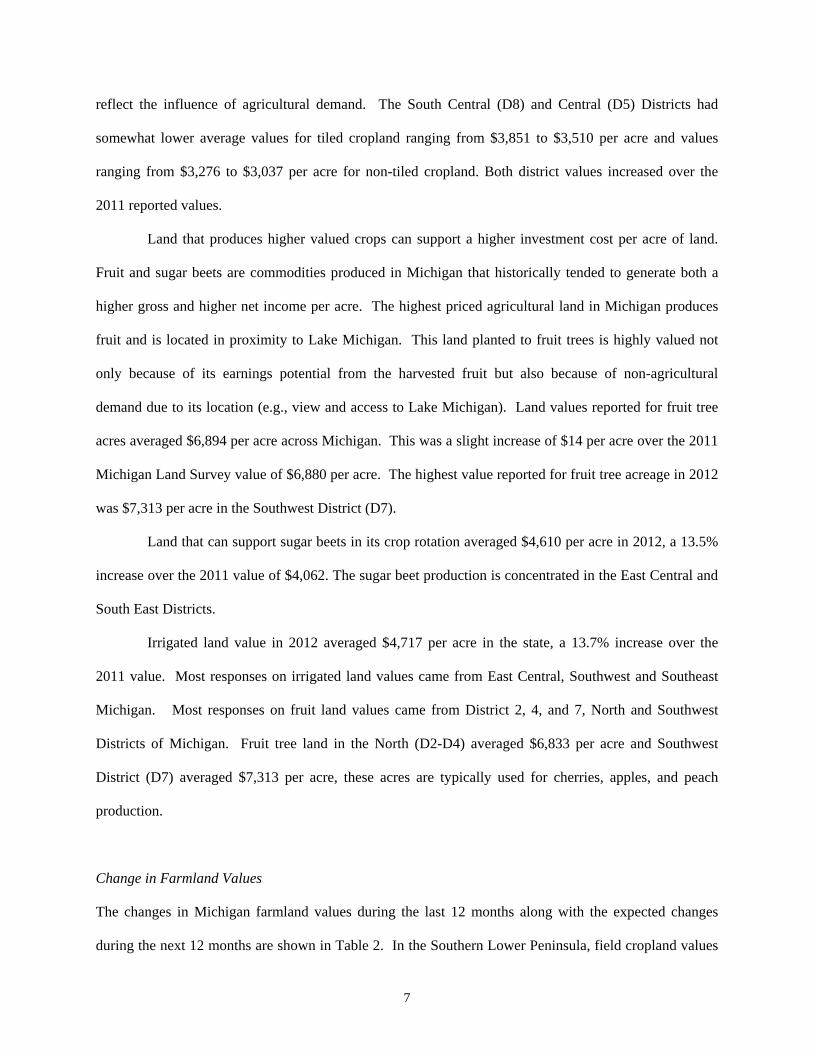
Agricultural-Use Farmland Values
Average Farmland Values
Average agricultural farmland values are reported in Table 1 for different regions in the state. In
the Southern Lower Peninsula, the average value of tiled field cropland was $4,115 per acre while non-
tiled field cropland averaged $3,371 per acre. In the Upper and Northern Lower Peninsula tiled and non-
tiled field crop land averaged $2,003 and $1,660 per acre, respectively.
Table 1 Michigan Average Agricultural Land Values, 2012
Land Use Field Crop
Tiled Field Crop Non-Tiled
Sugar Beet
Irrigated Fruit Trees
Region
Michigan
$3,866 $3,029 $4,610 $4,717 $6,894
Southern Lower Peninsula
4,115 3,371 4,806 5,144 7,529
Upper & Northern Lower Peninsula
2,003 1,660 2,540 2,121 N/A
Districts 1-4
1,997 1,693 N/A 2,556 6,833
District 5
3,510 3,037 4,131 4,701 5,500
District 6
4,872 3,652 5,140 6,350 N/A
District 7
4,454 4,116 N/A 5,346 7,313
District 8
3,851 3,276 4,803 4,932 N/A
District 9
3,799 3,096 4,517 4,902 N/A
Note: Results were only reported when a minimum of five responses were received. For land producing grains, soybeans, and other field crops, Agricultural Statistics Districts 7 and
6 in Southern Michigan had the highest agricultural land values. District 6 in the southwest had the
highest average values for tiled cropland $4,872 per acre and District 7 was the next highest for field
cropland tiled at $4,454 per acre. Values in these areas appear to be the highest in the state and probably
7
reflect the influence of agricultural demand. The South Central (D8) and Central (D5) Districts had
somewhat lower average values for tiled cropland ranging from $3,851 to $3,510 per acre and values
ranging from $3,276 to $3,037 per acre for non-tiled cropland. Both district values increased over the
2011 reported values.
Land that produces higher valued crops can support a higher investment cost per acre of land.
Fruit and sugar beets are commodities produced in Michigan that historically tended to generate both a
higher gross and higher net income per acre. The highest priced agricultural land in Michigan produces
fruit and is located in proximity to Lake Michigan. This land planted to fruit trees is highly valued not
only because of its earnings potential from the harvested fruit but also because of non-agricultural
demand due to its location (e.g., view and access to Lake Michigan). Land values reported for fruit tree
acres averaged $6,894 per acre across Michigan. This was a slight increase of $14 per acre over the 2011
Michigan Land Survey value of $6,880 per acre. The highest value reported for fruit tree acreage in 2012
was $7,313 per acre in the Southwest District (D7).
Land that can support sugar beets in its crop rotation averaged $4,610 per acre in 2012, a 13.5%
increase over the 2011 value of $4,062. The sugar beet production is concentrated in the East Central and
South East Districts.
Irrigated land value in 2012 averaged $4,717 per acre in the state, a 13.7% increase over the
2011 value. Most responses on irrigated land values came from East Central, Southwest and Southeast
Michigan. Most responses on fruit land values came from District 2, 4, and 7, North and Southwest
Districts of Michigan. Fruit tree land in the North (D2-D4) averaged $6,833 per acre and Southwest
District (D7) averaged $7,313 per acre, these acres are typically used for cherries, apples, and peach
production.
Change in Farmland Values
The changes in Michigan farmland values during the last 12 months along with the expected changes
during the next 12 months are shown in Table 2. In the Southern Lower Peninsula, field cropland values

8
increased in 2012 from the levels observed in 2011 for tiled land and non-tiled land, 7.8% and 6.8%
respectively. In the Upper and Northern Lower Peninsula, land values for field crops increased 6.6% for
tiled land, and 4.7% for non-tiled land. Districts (D1-D4) reported the lowest rate increases in value for
field cropland tiled land of 4.4% and non-tiled of 3.2%.
Table 2 Percentage Change in Michigan Farmland Value, 2012
Type of Land Use
Field Crop Tiled
Field Crop Non-Tiled
Sugar Beet Irrigated Tree Fruit Regions
Last Year
Expected Next Year
Last Year
Expected Next Year
Last Year
Expected Next Year
Last Year
Expected Next Year
Last Year
Expected Next Year
Michigan 7.6% 4.0% 6.5% 3.8% 9.7% 5.4% 9.4% 3.6% 9.3% 3.2%
Southern Lower Peninsula
7.8 3.9 6.8 3.6 9.5 5.0 9.6 3.6 9.3 3.2
Upper and Northern Lower Peninsula
6.6 5.0 4.7 4.5 N/A N/A 6.3 2.5 N/A N/A
District 1-4 4.4 3.5 3.2 3.6 N/A N/A 5.0 8.3 N/A N/A
District 5
8.5 4.5 6.9 4.6 9.3 5.6 9.6 3.5 N/A N/A
District 6 9.9 5.5 7.9 4.7 10.2 5.9 6.0 2.0 N/A N/A
District 7 6.8 1.4 5.9 1.0 N/A N/A 10.9 2.3 7.1 1.0
District 8 6.7 4.2 5.8 3.0 11.5 2.5 12.3 4.1 N/A N/A
District 9 7.7 3.0 9.2 4.8 6.7 5.0 10.0 2.0 N/A N/A
Note: Results were only reported when a minimum of five responses were received.
For the previous five years, the Southern Lower Peninsula has had the highest annual rate of increase in
land values, averaging 4.86%.
Expectations on changes in Michigan farmland values indicate that land should increase in value
in 2013 over the 2012 values. The largest expectations on changes in percentage land value were for
District (D6) at 5.5% for tiled and District (D9) at 4.8% for non-tiled. Field crop tiled land values in
Michigan are expected to increase by 4.0% tiled cropland and 3.8% for non-tiled cropland. The Central
District (D5) is expected to increase by 4.5% of tiled cropland and 4.6% for non-tiled cropland. Overall,

9
irrigated land values increased 9.4% and are expected to increase 3.6% during the upcoming year.
District (D8) irrigated land values have the largest increase in value of 12.3% over last year and are
expected to increase in value for next year by 4.1%. Districts (D1 –D4) land values increased 5.0% with
an expected 2013 land value increase of 8.3%. Michigan’s sugar beet land values increased by 9.7% in
2012 and are expected to increase about 5.4% in 2013.
Farmland Leasing
Leasing or renting of land provides an alternative method for farmers to gain control of land.
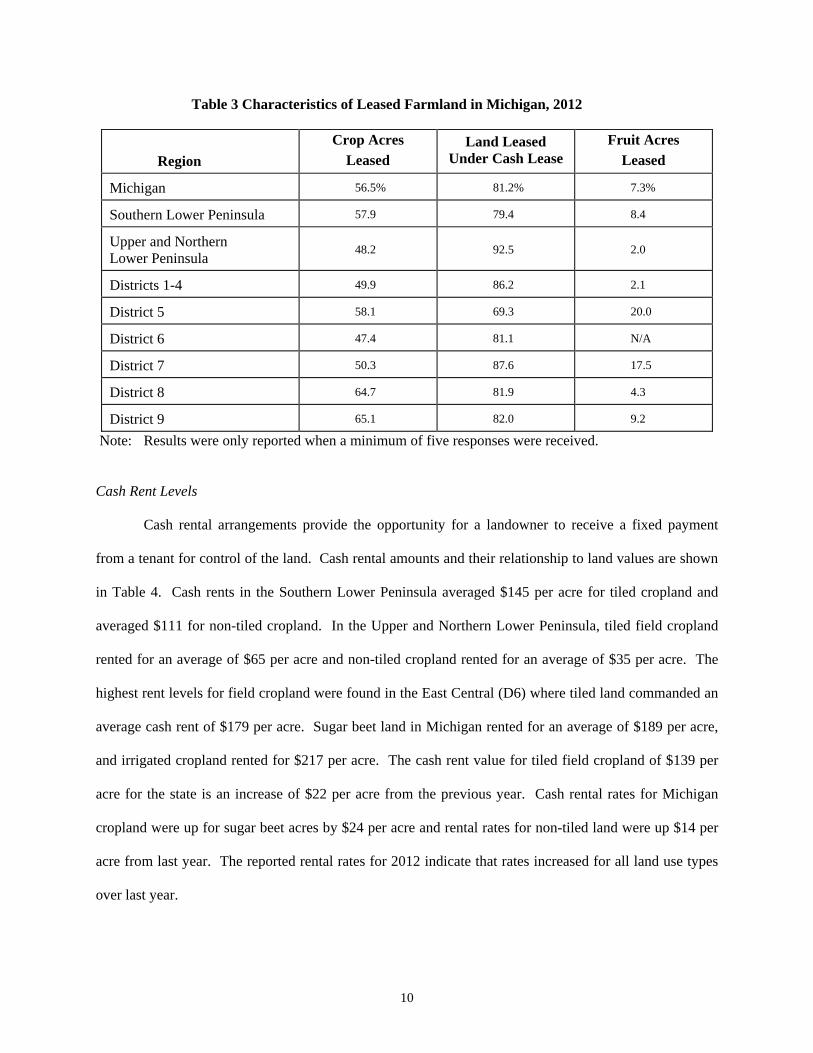
Table 3 reports land leasing activity in Michigan and indicates that 56.5% of crop acres are controlled by
lease. Cash leasing is the predominant form of land rental with 81.2% of leased land in Michigan
controlled by cash rental arrangements.
Crop Acres Leased
In the Southern Lower Peninsula, an estimated 57.9% of field crop acres appear to be controlled
by leases, while 48.2% of the cropland in the Upper and Northern Lower Peninsula is leased. The highest
amount of leasing occurs in the Southeast District (D9) where 65.1% of the cropland is leased. As with
the entire state, cash rent is the predominant leasing arrangement in all reporting districts of Michigan.
Farms featuring fruit production appear to be an exception to heavy use of leasing for agricultural
crops. One possible explanation for this difference is the long term investment required for production of
tree fruit. Renting provides flexibility in control of the land for both the lessee and lessor. This flexibility
is not an advantage for someone considering an investment in, for example, orchards or vineyards which
require several years of cash outflow before generating sales. Because tree fruit is a long-term
investment, leasing arrangements depend upon the age of the trees and expectation for maintenance.
10
Table 3 Characteristics of Leased Farmland in Michigan, 2012
Region Crop Acres
Leased Land Leased
Under Cash Lease Fruit Acres
Leased
Michigan 56.5% 81.2% 7.3%
Southern Lower Peninsula 57.9 79.4 8.4
Upper and Northern Lower Peninsula
48.2 92.5 2.0
Districts 1-4 49.9 86.2 2.1
District 5 58.1 69.3 20.0
District 6 47.4 81.1 N/A
District 7 50.3 87.6 17.5
District 8 64.7 81.9 4.3
District 9 65.1 82.0 9.2
Note: Results were only reported when a minimum of five responses were received.
Cash Rent Levels
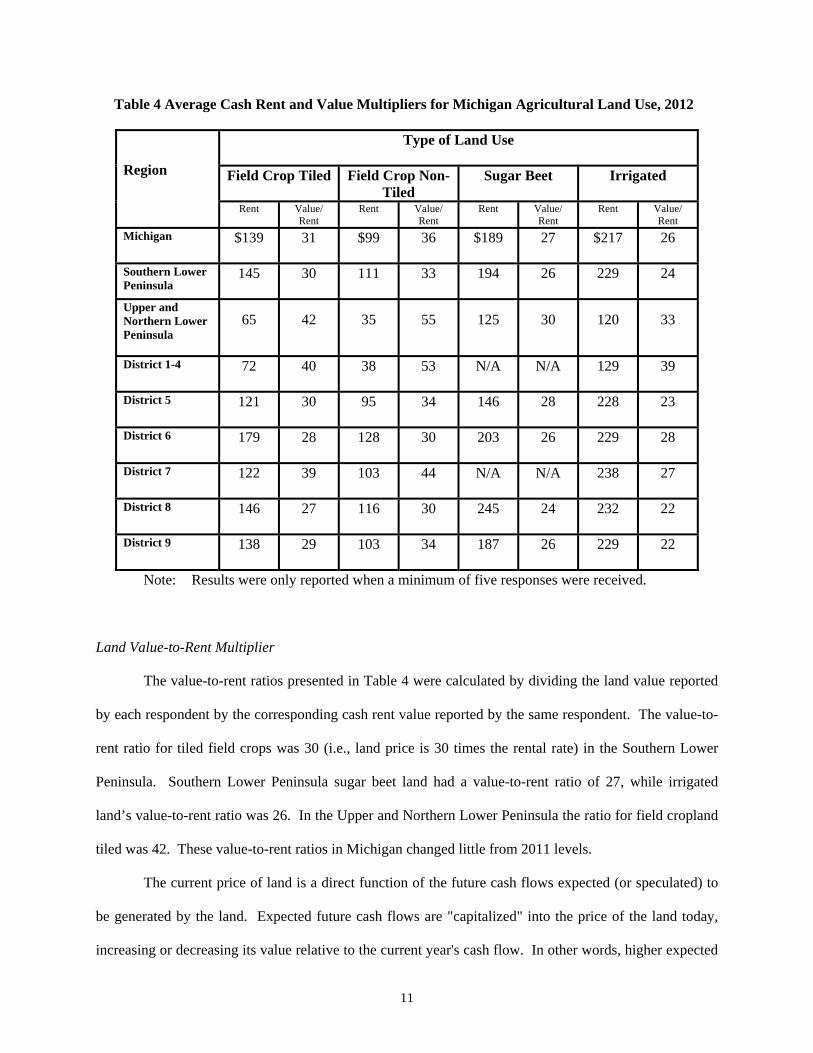
Cash rental arrangements provide the opportunity for a landowner to receive a fixed payment
from a tenant for control of the land. Cash rental amounts and their relationship to land values are shown
in Table 4. Cash rents in the Southern Lower Peninsula averaged $145 per acre for tiled cropland and
averaged $111 for non-tiled cropland. In the Upper and Northern Lower Peninsula, tiled field cropland
rented for an average of $65 per acre and non-tiled cropland rented for an average of $35 per acre. The
highest rent levels for field cropland were found in the East Central (D6) where tiled land commanded an
average cash rent of $179 per acre. Sugar beet land in Michigan rented for an average of $189 per acre,
and irrigated cropland rented for $217 per acre. The cash rent value for tiled field cropland of $139 per
acre for the state is an increase of $22 per acre from the previous year. Cash rental rates for Michigan
cropland were up for sugar beet acres by $24 per acre and rental rates for non-tiled land were up $14 per
acre from last year. The reported rental rates for 2012 indicate that rates increased for all land use types
over last year.
11
Table 4 Average Cash Rent and Value Multipliers for Michigan Agricultural Land Use, 2012
Type of Land Use
Field Crop Tiled Field Crop Non-Tiled
Sugar Beet Irrigated Region
Rent
Value/ Rent
Rent Value/ Rent
Rent Value/ Rent
Rent Value/ Rent
Michigan $139 31 $99 36 $189 27 $217 26
Southern Lower Peninsula
145 30 111 33 194 26 229 24
Upper and Northern Lower Peninsula
65 42 35 55 125 30 120 33
District 1-4 72 40 38 53 N/A N/A 129 39
District 5
121 30 95 34 146 28 228 23
District 6 179 28 128 30 203 26 229 28
District 7 122 39 103 44 N/A N/A 238 27
District 8 146 27 116 30 245 24 232 22
District 9 138 29 103 34 187 26 229 22
Note: Results were only reported when a minimum of five responses were received.
Land Value-to-Rent Multiplier
The value-to-rent ratios presented in Table 4 were calculated by dividing the land value reported
by each respondent by the corresponding cash rent value reported by the same respondent. The value-to-
rent ratio for tiled field crops was 30 (i.e., land price is 30 times the rental rate) in the Southern Lower
Peninsula. Southern Lower Peninsula sugar beet land had a value-to-rent ratio of 27, while irrigated
land’s value-to-rent ratio was 26. In the Upper and Northern Lower Peninsula the ratio for field cropland
tiled was 42. These value-to-rent ratios in Michigan changed little from 2011 levels.
The current price of land is a direct function of the future cash flows expected (or speculated) to
be generated by the land. Expected future cash flows are "capitalized" into the price of the land today,
increasing or decreasing its value relative to the current year's cash flow. In other words, higher expected

12
future cash flows translate into higher value-to-rent ratios and lower expected cash flows translate into
lower value-to-rent ratios. As speculation and expectations change about future cash flows, the resultant
value-to-rent ratio changes. The value-to-rent ratio calculation and movement is analogous to the
price/earnings ratio in equity stocks and funds traded on national exchanges. There are four possible
situations for the value-to-rent ratios to change: 1) the market anticipates that future cash flows will grow
at a faster rate than for alternative land parcels located in other areas and/or used for lower valued
purposes; 2) the land may be switched to alternative uses with higher expected cash flows in the future; 3)
non-farm uses of the land in the future may provide higher cash flows than those expected from current
land use; or 4) the market views the future cash flows to be less risky than the cash flows from alternative
land locations and is therefore willing to pay a higher price. When agricultural land is being transitioned
out of agriculture and/or its ownership is changed, land values may increase but agricultural rental values
may not increase proportionately as long as the acreage is used for agricultural purposes. It can be noted
that the highest cash rents per acre in Michigan tend to be associated with higher projected incomes per
acre (e.g., from irrigated acres producing higher valued crops and/or higher yields) but also tend to have
the lowest value-to-rent ratios.
Non-Agricultural-Use Values of Farmland
The value of farmland for development purposes are summarized in Table 5. In most cases, these values
are significantly above the agricultural-use value of the land and therefore tend to exert upward pressure
on surrounding farmland values. The average value of farmland being converted to residential
development was $6,566 per acre in the Southern Lower Peninsula and $3,500 per acre in the Upper and
Northern Lower Peninsula. The highest residential development values were found in the Southeast (D9)
where the average value was $7,665 per acre.

13
Table 5 Non-Agricultural-Use Value of Undeveloped Land in Michigan, 2011
Type of Land Use
Region Residential Commercial/Industrial Recreational
Michigan $5,972 $12,851 $3,063
Southern Lower Peninsula
6,566 14,420 3,291
Upper and Northern Lower Peninsula
3,500 5,679 2,386
Districts 1-4 3,563 5,682 2,446
District 5 4,512 7,688 2,550
District 6 6,420 10,147 3,168
District 7 7,589 19,921 3,464
District 8 6,450 12,017 2,924
District 9 7,665 21,892 4,819
Note: Results were reported when a minimum of five responses were received.
The value of farmland being converted to commercial use was $14,420 per acre in the Southern
Lower Peninsula and $5,679 per acre in the Upper and Northern Lower Peninsula. The average value for
farmland that was converted to commercial use was $12,851 per acre for the state of Michigan. However,
the variance in these estimates is quite high. The occasional extremely high values reported probably
reflect the often recited real estate mantra of “location, location, location."
The recreational development value of farmland was $3,291 per acre in the Southern Lower
Peninsula and $2,386 per acre in the Upper and Northern Lower Peninsula. The highest average value for
recreational development land was in the Southeast (D9) where land for recreational development

14
averaged $4,819 per acre. These reported price data on recreational values wee also skewed by a few
extremely high values attributed to the unique amenities of a particular parcel of land.
Factors Influencing Land Values and Rents in Michigan
The survey also elicited opinions about the major factors driving land values. Respondents were
provided the opportunity to indicate their perception of the importance of some agricultural-related
factors that influenced farmland values and cash rents. Factors including farm expansion, government
programs, interest rates and prices of agricultural commodities were rated on a scale from one to five with
one being “Not Important” and five being “Very Important. The mean ratings are presented in Table 6.
For Southern Michigan, “Grain Prices”, “Expansion by Farmers”, and “Low Interest Rates” were the
highest-ranking items at 4.4, 4.3 and 4.1, respectively. Next in order of importance were “Milk Prices”
and “Livestock Prices” with rating scores of 3.7 and 3.7, respectively. The 2008 Farm Bill provides a
floor for prices of program crops and reduces the crop price risk to farmers. Crop prices and milk prices
that are prevented from falling below the level provided by government programs should also provide
support to land prices. Livestock prices that impact land price will vary by the predominant livestock in
the reporting area. As commodity prices change cash flow also changes which affect demand for
agricultural land. Expansion by farmers suggests the strategy of lowering costs of production by
exploiting the concept of economies of size (i.e., costs decrease as the fixed costs of controlling capital
inputs, such as machinery, are spread over more acres) or the need for more land to support a possible
expansion of the management team associated with the expansion. With lower interest rates, it is easier to
manage the debt often associated with land purchases. The direction for land prices based on agricultural
factors becomes less certain when low agricultural commodity and product prices are combined with the
perceived need by farmers to lower unit cost of production by producing more units from an expanded
land base.

15
Table 6 Rating Importance of Agricultural Factors Affecting Value of Michigan Farmland, 2012
Government Programs Prices Regions Expansion by
farmers CRP* Current
Farm Bill Low Int. Fruit Grain Livestock Milk
Michigan 4.3 2.4 2.4 4.1 2.9 4.4 3.7 3.7
Southern Lower 4.4 2.3 2.4 4.2 2.9 4.5 3.8 3.7
Upper & North Lower
3.6 2.5 2.5 3.8 2.9 3.7 3.5 3.5
District 1-4 3.7 2.4 2.4 3.7 3.1 3.5 3.6 3.4
District 5
4.4 2.5 2.4 4.2 2.7 4.1 3.8 3.6
District 6 4.5 2.1 2.2 4.3 2.0 4.9 3.8 3.7
District 7 4.0 2.1 2.3 3.8 3.8 4.2 3.9 3.8
District 8 4.5 2.5 2.6 4.3 2.8 4.6 3.9 4.0
District 9 4.5 2.5 2.4 4.2 2.6 4.8 3.5 3.3
Note: Response scale ranges from one to five with one designating not important and five designating very important. *CRP -- Conservation Reserve Program
For the Upper and the Northern Lower Peninsula, the two highest agricultural related factors
influencing land prices were “Low Interest Rates” and “Grain Prices” with a score of 3.8 and a 3.7,
respectively.
Assessing the importance of non-agricultural factors upon land values in rural areas for land that
appears destined to transition from ownership by farmers was addressed with the final set of survey
questions. It is recognized that many factors not related to agriculture can influence the value of
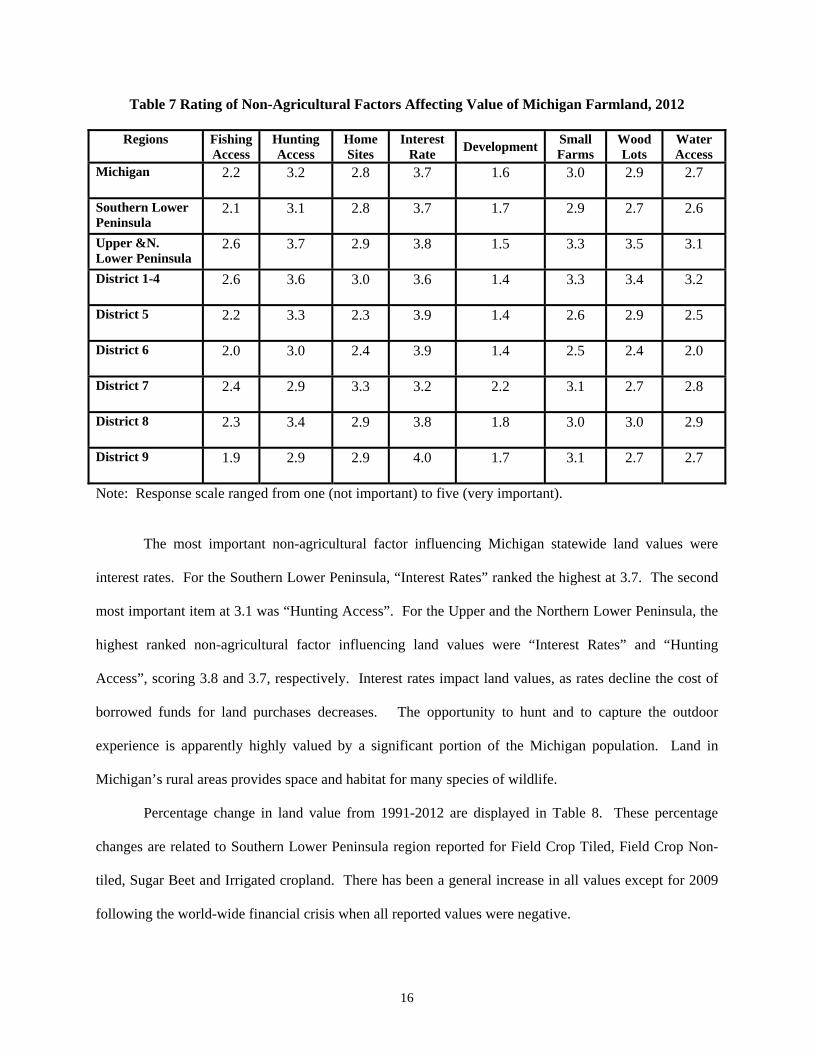
agricultural land in Michigan. Table 7 summarizes the non-agricultural factors influencing land values
for land in rural areas that appears to be transitioning out of agriculture.
16
Table 7 Rating of Non-Agricultural Factors Affecting Value of Michigan Farmland, 2012
Regions Fishing Access
Hunting Access
Home Sites
Interest Rate Development Small
Farms Wood Lots
Water Access
Michigan 2.2 3.2 2.8 3.7 1.6 3.0 2.9 2.7
Southern Lower Peninsula
2.1 3.1 2.8 3.7 1.7 2.9 2.7 2.6
Upper &N. Lower Peninsula
2.6 3.7 2.9 3.8 1.5 3.3 3.5 3.1
District 1-4 2.6 3.6 3.0 3.6 1.4 3.3 3.4 3.2
District 5
2.2 3.3 2.3 3.9 1.4 2.6 2.9 2.5
District 6 2.0 3.0 2.4 3.9 1.4 2.5 2.4 2.0
District 7 2.4 2.9 3.3 3.2 2.2 3.1 2.7 2.8
District 8 2.3 3.4 2.9 3.8 1.8 3.0 3.0 2.9
District 9 1.9 2.9 2.9 4.0 1.7 3.1 2.7 2.7
Note: Response scale ranged from one (not important) to five (very important).
The most important non-agricultural factor influencing Michigan statewide land values were
interest rates. For the Southern Lower Peninsula, “Interest Rates” ranked the highest at 3.7. The second
most important item at 3.1 was “Hunting Access”. For the Upper and the Northern Lower Peninsula, the
highest ranked non-agricultural factor influencing land values were “Interest Rates” and “Hunting
Access”, scoring 3.8 and 3.7, respectively. Interest rates impact land values, as rates decline the cost of
borrowed funds for land purchases decreases. The opportunity to hunt and to capture the outdoor
experience is apparently highly valued by a significant portion of the Michigan population. Land in
Michigan’s rural areas provides space and habitat for many species of wildlife.
Percentage change in land value from 1991-2012 are displayed in Table 8. These percentage
changes are related to Southern Lower Peninsula region reported for Field Crop Tiled, Field Crop Non-
tiled, Sugar Beet and Irrigated cropland. There has been a general increase in all values except for 2009
following the world-wide financial crisis when all reported values were negative.

17
Table 8 Percentage Change in Land Value from 1991-2012 in the Southern Lower Peninsula
Land Type
Year Field Crop
Tiled1Field Crop Non tiled
Sugar Beet Irrigated
1991 5.0% 3.0% 9.0% N/a
1992 2.5 1.6 3.0 3.4%
1993 2.0 1.4 1.9 3.6
1994 4.6 4.1 4.8 5.4
1995 4.3 3.3 6.2 2.8
1996 8.1 6.8 8.4 7.3
1997 8.4 8.1 5.3 10.0
1998 10.2 10.2 5.9 12.7
1999 7.0 7.5 2.3 9.2
2000 8.8 7.8 2.3 7.1
2001 7.4 6.8 -0.4 4.8
2002 4.2 3.9 2.3 6.5
2003 3.7 3.6 2.4 4.5
2004 8.9 9.3 7.9 9.8
2005 5.4 4.9 7.9 5.4
2006 5.7 6.0 4.9 5.8
2007 8.7 8.2 9.6 9.1
2008 8.9 8.8 9.9 9.5
2009 -0.6 -1.2 -1.2 -0.2
2010 0.2 0.0 4.4 1.1
2011 6.4 6.8 9.9 6.0
2012 7.8 6.8 9.5 9.6
Average 5.8 5.4 5.3 6.4
1 Beginning with the 1998 Survey, the question on agriculture land values and cash rents referred to "Field-crop tiled” and “Field-crop non-tiled”. Previously the similar categories were referred to as Corn-Soybean-Cropland – above average and below average.

18
Conclusions
Farmland values in Michigan overall increased in 2012 over 2011 values. This will be 21 years
of steady growth, except for 2009, sense the beginning of the annual Michigan Land Value Survey.
Sugar beet land values increased by 9.7%, irrigated land values increased by 9.4% and tree fruit values
increased by 9.3% for last year (Table 2).
Rental rates in the Southern Lower Peninsula (Table 4) averaged $145 per acre for tiled ground
and $111 per acre for non-tiled ground, an increase of $19 for tiled and increase of $16 for non-tiled
ground over 2011. In addition, sugar beet acreage rented for $194 per acre, an increase of $19 per acre
over 2011, while irrigated land averaged $229 per acre, an increase of $23 per acre from the 2011 rate.
Land values relative to cash rents were highest in Districts (1-4) and Southwestern (D7). In
Districts (1-4), the value-to-rent ratios were 40 and 53 for tiled and non-tiled land respectively, while the
value-to-rent ratios for Southwestern (D7) were 39 for tiled land and 44 for non-tiled land. The value-to-
rent ratios for most of the regions in the state are closer to 35. The 35 value-to-rent ratio implies a gross
current return to investment of 2.9 percent per year. A higher value to rent ratio suggests a lower annual
current return to investment.
Michigan farmland values in 2012 increased and land rental rates also increased in 2012. The
direction of Michigan agricultural land prices suggests a continuing upward trend. However, the drought
of 2012 for most of the Michigan and the corn/soybean belt regions of the US, the worst since 1988 has
helped increase commodity prices since this survey was performed. Higher prices for corn, soybeans and
hay will have a cascading affect on all related livestock industries. Economic conditions at the end of
2012 suggest the earnings for field crops should be strong in 2013. Interest rates also impact land values.
The “prime rate” charged by banks again held constant at 3.25 % in 2012.
The Michigan economy has a diversified structure with tourism and agriculture/food industries
vying closely for the number one ranking and with manufacturing following closely behind. It has been
noted that land in rural areas is valued not only for its agricultural productivity but for other amenities that
are valued by non-agricultural interests. Concern for year 2013 and beyond is whether the financial

19
performance from agriculture can sustain the current land prices. In the past, non-agricultural demand has
held farmland values high but this non-agricultural demand can be an effective influence only if Michigan
unemployment levels decline and incomes increase.
The forecasting view on land values can never be clear and certain but the authors believe that
agricultural producers planning to expand and outside investors are still bullish about agriculture.
Michigan land values should remain strong during 2013.

20
AppendixFARMLAND VALUE QUESTIONNAIRE
April 2012 Make the best estimates you can for your area. Complete only the sections applicable to your area. Indicate which county or counties you are reporting on. 1. Agricultural-Use Value
Percent Change in Value (Indicate + or -)
Type of Land
Current
Average Value Last 12 Months
Expected in Next
12 Months
Average Cash Rent
$/acre % change % change $/acre A. Field Crop (Non-irrigated) 1.Tiled for drainage
2.Not tiled
B. Irrigated Field Crop
C. Sugar Beet
D. Fruit Trees- Bearing
E. Orchard Acreage, No Trees
2. Non Agricultural-Use Value
Current Range in Value
Undeveloped Land*
Current Average Value
$/acre
High
$/acre
Low
$/acre
A. Residential
B. Commercial/ Industrial
C. Recreational
* Land that may be in agricultural use but the land value is being influenced by residential, commercial or recreational development pressure.

21
3. What percentage of field crop acres in your area is leased? % 4. What percentage of the leased field crop acres is on a cash-rent lease? % 5. What percentage of the fruit crop acres in your area is leased? _____________% 6. What are the major agricultural factors influencing farm land values and cash rents in your area?
Indicate your assessment of the situation by circling the appropriate number on the scale below. Not Very Important Neutral Important
A. Expansion by Farmers 1 2 3 4 5 B. Government Programs:
1. Conservation Reserve 1 2 3 4 5 2. Farm Bill of 2008 1 2 3 4 5
(Commodity Programs) C. Interest Rates - @ 40 year low 1 2 3 4 5 D. Prices: 1. Fruit 1 2 3 4 5 2. Grain 1 2 3 4 5 3. Livestock 1 2 3 4 5 4. Milk 1 2 3 4 5 E. Other: (please list) 1 2 3 4 5 1 2 3 4 5
7. What are the major non-agricultural factors influencing land values in rural areas for land that
appears destined to transition from ownership by farmers?
A. Fishing Access 1 2 3 4 5 B. Hunting Access 1 2 3 4 5 C. Home Building Sites 1 2 3 4 5 D. Interest Rates for Borrowing 1 2 3 4 5 E. Mall & Shopping Development 1 2 3 4 5 F. Farm/Ranchettes of 10 acres or so 1 2 3 4 5 G. Timber and Woodlots 1 2 3 4 5 H. Water for Recreation 1 2 3 4 5 I. Other: (please list)
1 2 3 4 5
1 2 3 4 5
8. Please provide other general comments you have about land values and rents in your area.
22
If you are interested in receiving a copy of the Michigan Farmland Value survey results, please provide your name, address and telephone number. Name: Phone:
Street:
Town/City:
Zip Code:
You can return this request in a separate mailing if anonymity is an issue; or if not, include it in the envelope provided in the questionnaire.
Related Documents