2012 International Conference on Lightning Protection (ICLP), Vienna, Austria Correlated Lightning Mapping Array (LMA) and Radar Observations of the Initial Stages of Florida Triggered Lightning Discharges J.D. Hill, J.Pilkey, M.A. Uman, D.M. Jordan Department of Electrical and Computer Engineering University of Florida Gainesville, FL, USA [email protected] W. Rison 1 , P.R. Krehbiel 2 1 Electrical Engineering Department 2 Physics Department New Mexico Institute of Mining and Technology Socorro, NM, USA M.I.Biggerstaff, P. Hyland School of Meteorology University of Oklahoma Norman, OK, USA Abstract— We characterize the geometrical and electrical characteristics of the initial stages of nine Florida triggered lightning discharges using a Lightning Mapping Array (LMA), a C-band SMART radar, and measured channel-base currents. We determine initial channel and subsequent branch lengths, average initial channel and branch propagation speeds, and channel-base current at the time of each branch initiation. The channel-base current is found to not change significantly when branching occurs, an unexpected result. The initial stage of Florida triggered lightning typically transitions from vertical to horizontal propagation at altitudes of 3-6 km, near the typical 0° C level of 4-5 km and several kilometers below the expected center of the negative cloud-charge region at 7-8 km. The data presented potentially provide information on thunderstorm electrical and hydrometeor structure and discharge propagation physics. LMA source locations were obtained from VHF sources of positive impulsive currents as small as 10 A, in contrast to expectations found in the literature. Keywords-triggered lightning; initial stage; Lightning Mapping Array I. INTRODUCTION The process of triggering lightning using the rocket-and- wire technique begins with the launching of a small rocket trailing a grounded triggering wire typically in the presence of negative cloud charge over the triggering site. In Florida, rockets are launched when the quasi-static electric field measured at ground surpasses a typical threshold of about +5 kV/m (physics sign convention- electric field vector pointing upward towards the negative charge overhead). As the rocket ascends, electrical breakdown called precursors occur at the wire tip [e.g., Lalande et al., 1998; Willett et al., 1999; Biagi et al., 2009, 2012]. The precursors are R. Blakeslee NASA Marshall Space Flight Center Huntsville, AL, USA essentially small sparks at the top of the wire that fail to evolve into an upward propagating leader channel. When the wire top reaches a typical height of 200-400 m, an upward-propagating, positively-charged-leader (UPL) is launched from the wire top and subsequently propagates towards the negative cloud charge. The triggering wire typically explodes when the UPL reaches an altitude of about 2 km, ten milliseconds or so after its initiation. The current measured at the triggered lightning channel base rises to a typical amplitude of about 100 A as the UPL ascends, often dropping sharply to a level at or near zero during the triggering wire explosion, and then resumes to a background level of about 100 A that persists for typically several hundred milliseconds. This long-duration current, which can have super-imposed current pulses with amplitudes of the order of a kilo-ampere, is referred to as the initial continuous current (ICC). The precursor current pulses, the UPL, and the ICC together comprise the initial stage (IS) of the triggered lightning discharge. The transition between the UPL and ICC is not well-defined. Often, after the cessation of the IS, dart leader/return stroke sequences follow the path of the IS channel between the negative cloud charge and ground. These dart leader/return stroke sequences are very similar to subsequent strokes in natural lightning. In Florida at sea level, the IS and the other processes that later illuminate the IS's path generally appear on photographs and to the human eye as a single channel below the cloud base [e.g., Biagi et al., 2009]. In contrast, photographs of triggered lightning in New Mexico at Langmuir Laboratory at about 3000 m altitude [e.g., Idone et al., 1984; Winn et al., 2012] and St. Privat d'Allier in France at about 1000 m altitude [e.g., Fieux et al., 1978; Hubert and Mouget, 1981] typically show an extensively branched UPL. These visual differences have long been a https://ntrs.nasa.gov/search.jsp?R=20120015985 2018-07-15T04:30:31+00:00Z

Welcome message from author
This document is posted to help you gain knowledge. Please leave a comment to let me know what you think about it! Share it to your friends and learn new things together.
Transcript

2012 International Conference on Lightning Protection (ICLP), Vienna, Austria
Correlated Lightning Mapping Array (LMA) and Radar Observations of the Initial Stages of Florida
Triggered Lightning Discharges
J.D. Hill, J.Pilkey, M.A. Uman, D.M. Jordan Department of Electrical and Computer Engineering
University of Florida Gainesville, FL, USA
W. Rison1, P.R. Krehbiel2 1Electrical Engineering Department
2Physics Department New Mexico Institute of Mining and Technology
Socorro, NM, USA
M.I.Biggerstaff, P. Hyland School of Meteorology University of Oklahoma
Norman, OK, USA
Abstract— We characterize the geometrical and electrical characteristics of the initial stages of nine Florida triggered lightning discharges using a Lightning Mapping Array (LMA), a C-band SMART radar, and measured channel-base currents. We determine initial channel and subsequent branch lengths, average initial channel and branch propagation speeds, and channel-base current at the time of each branch initiation. The channel-base current is found to not change significantly when branching occurs, an unexpected result. The initial stage of Florida triggered lightning typically transitions from vertical to horizontal propagation at altitudes of 3-6 km, near the typical 0° C level of 4-5 km and several kilometers below the expected center of the negative cloud-charge region at 7-8 km. The data presented potentially provide information on thunderstorm electrical and hydrometeor structure and discharge propagation physics. LMA source locations were obtained from VHF sources of positive impulsive currents as small as 10 A, in contrast to expectations found in the literature. Keywords-triggered lightning; initial stage; Lightning Mapping Array
I. INTRODUCTION
The process of triggering lightning using the rocket-and-wire technique begins with the launching of a small rocket trailing a grounded triggering wire typically in the presence of negative cloud charge over the triggering site. In Florida, rockets are launched when the quasi-static electric field measured at ground surpasses a typical threshold of about +5 kV/m (physics sign convention- electric field vector pointing upward towards the negative charge overhead). As the rocket ascends, electrical breakdown called precursors occur at the wire tip [e.g., Lalande et al., 1998; Willett et al., 1999; Biagi et al., 2009, 2012]. The precursors are
R. Blakeslee NASA Marshall Space Flight Center
Huntsville, AL, USA
essentially small sparks at the top of the wire that fail to evolve into an upward propagating leader channel. When the wire top reaches a typical height of 200-400 m, an upward-propagating, positively-charged-leader (UPL) is launched from the wire top and subsequently propagates towards the negative cloud charge. The triggering wire typically explodes when the UPL reaches an altitude of about 2 km, ten milliseconds or so after its initiation. The current measured at the triggered lightning channel base rises to a typical amplitude of about 100 A as the UPL ascends, often dropping sharply to a level at or near zero during the triggering wire explosion, and then resumes to a background level of about 100 A that persists for typically several hundred milliseconds. This long-duration current, which can have super-imposed current pulses with amplitudes of the order of a kilo-ampere, is referred to as the initial continuous current (ICC). The precursor current pulses, the UPL, and the ICC together comprise the initial stage (IS) of the triggered lightning discharge. The transition between the UPL and ICC is not well-defined. Often, after the cessation of the IS, dart leader/return stroke sequences follow the path of the IS channel between the negative cloud charge and ground. These dart leader/return stroke sequences are very similar to subsequent strokes in natural lightning. In Florida at sea level, the IS and the other processes that later illuminate the IS's path generally appear on photographs and to the human eye as a single channel below the cloud base [e.g., Biagi et al., 2009]. In contrast, photographs of triggered lightning in New Mexico at Langmuir Laboratory at about 3000 m altitude [e.g., Idone et al., 1984; Winn et al., 2012] and St. Privat d'Allier in France at about 1000 m altitude [e.g., Fieux et al., 1978; Hubert and Mouget, 1981] typically show an extensively branched UPL. These visual differences have long been a
https://ntrs.nasa.gov/search.jsp?R=20120015985 2018-07-15T04:30:31+00:00Z
subject of discussion among researchers. Cloud bases in New Mexico in summer are typically 4-4.5 km above sea level, but only 1-1.5 km above the level of Langmuir Laboratory, while typical cloud bases in Florida in summer are about 1 km (+/- 500 m) above sea level. The atmospheric pressure, and likely the temperature and relative humidity, are all generally higher in Florida near sea level than at the higher-altitude triggering sites noted above; and pressure, temperature, and humidity may well influence the height and degree of IS branching.
In this paper, we examine the channel shape and branch characteristics of the IS in nine lightning flashes that were triggered during summer 2011 at the International Center for Lightning Research and Testing (ICLRT) at Camp Blanding Army National Guard Base in north-central Florida. Some characteristics of these flashes are also found in Hill et al. [2012]. The IS channels are mapped in three-dimensions via the TOA locations of positive polarity VHF sources associated with the leader tip breakdown obtained from a local Lightning Mapping Array (LMA) [e.g., Rison et al., 1999; Krehbiel et al., 2000; Thomas et al., 2004]. The current during the IS is measured at the lightning channel base. We show and interpret projection views of the LMA sources and vertical-scan radar images during the IS periods of two unique lightning discharges that were triggered on 5 August 2011. We provide statistics on the IS branching processes of all nine triggered lightning flashes: the initial height of the branches, the current at ground when branches are initiated, and the three dimensional propagation speed and overall length of the initial UPL channel and IS branches. We compare the geometrical characteristics of the IS to those obtained by Yoshida et al. [2010] who used two-station VHF interferometric measurements to study two triggered lightning events at the ICLRT in 2009. Finally, we show that upward IS branching at the ICLRT is common above about 580 m but is generally obscured from view by the overhead cloud whose visible base is typically near 1 km and that initially-vertical IS channels generally turn horizontal between 3 and 6 km altitude, near the 0° C level of 4-5 km.
II. INSTRUMENTATION
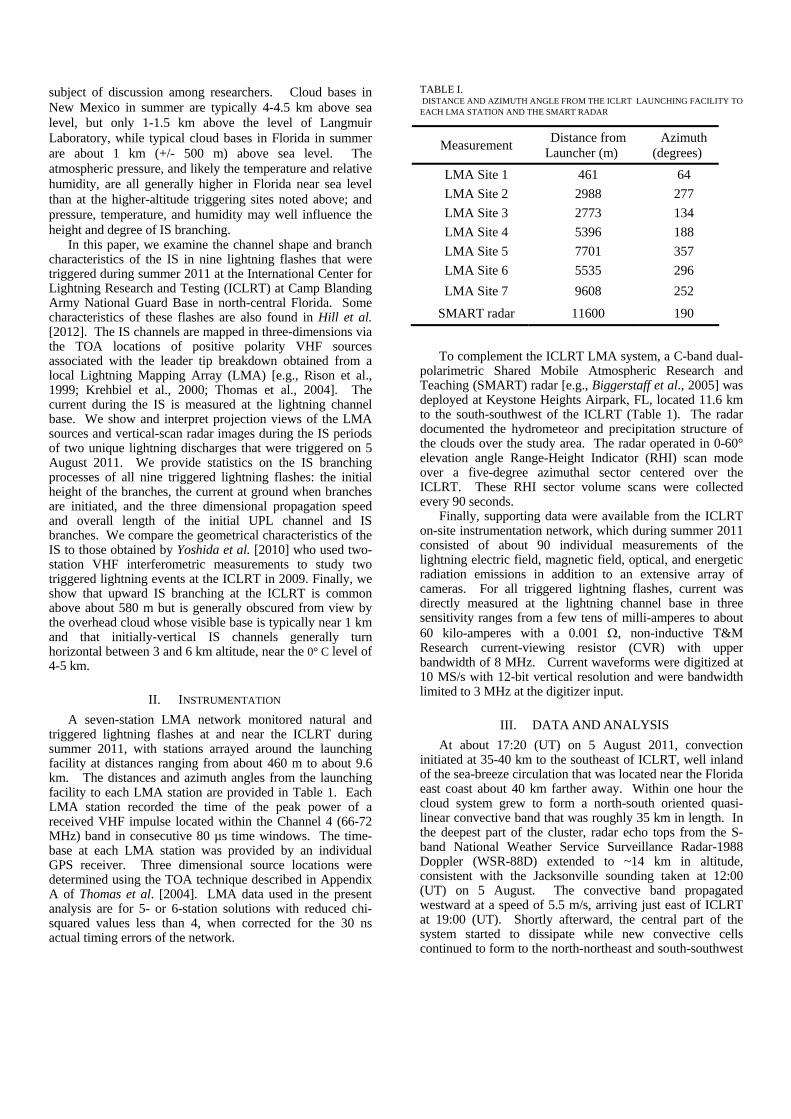
A seven-station LMA network monitored natural and triggered lightning flashes at and near the ICLRT during summer 2011, with stations arrayed around the launching facility at distances ranging from about 460 m to about 9.6 km. The distances and azimuth angles from the launching facility to each LMA station are provided in Table 1. Each LMA station recorded the time of the peak power of a received VHF impulse located within the Channel 4 (66-72 MHz) band in consecutive 80 µs time windows. The time-base at each LMA station was provided by an individual GPS receiver. Three dimensional source locations were determined using the TOA technique described in Appendix A of Thomas et al. [2004]. LMA data used in the present analysis are for 5- or 6-station solutions with reduced chi-squared values less than 4, when corrected for the 30 ns actual timing errors of the network.
TABLE I. DISTANCE AND AZIMUTH ANGLE FROM THE ICLRT LAUNCHING FACILITY TO EACH LMA STATION AND THE SMART RADAR
Measurement Distance from
Launcher (m) Azimuth
(degrees)
LMA Site 1 461 64
LMA Site 2 2988 277
LMA Site 3 2773 134
LMA Site 4 5396 188
LMA Site 5 7701 357
LMA Site 6 5535 296
LMA Site 7 9608 252
SMART radar 11600 190
To complement the ICLRT LMA system, a C-band dual-polarimetric Shared Mobile Atmospheric Research and Teaching (SMART) radar [e.g., Biggerstaff et al., 2005] was deployed at Keystone Heights Airpark, FL, located 11.6 km to the south-southwest of the ICLRT (Table 1). The radar documented the hydrometeor and precipitation structure of the clouds over the study area. The radar operated in 0-60° elevation angle Range-Height Indicator (RHI) scan mode over a five-degree azimuthal sector centered over the ICLRT. These RHI sector volume scans were collected every 90 seconds.
Finally, supporting data were available from the ICLRT on-site instrumentation network, which during summer 2011 consisted of about 90 individual measurements of the lightning electric field, magnetic field, optical, and energetic radiation emissions in addition to an extensive array of cameras. For all triggered lightning flashes, current was directly measured at the lightning channel base in three sensitivity ranges from a few tens of milli-amperes to about 60 kilo-amperes with a 0.001 , non-inductive T&M Research current-viewing resistor (CVR) with upper bandwidth of 8 MHz. Current waveforms were digitized at 10 MS/s with 12-bit vertical resolution and were bandwidth limited to 3 MHz at the digitizer input.
III. DATA AND ANALYSIS
At about 17:20 (UT) on 5 August 2011, convection initiated at 35-40 km to the southeast of ICLRT, well inland of the sea-breeze circulation that was located near the Florida east coast about 40 km farther away. Within one hour the cloud system grew to form a north-south oriented quasi-linear convective band that was roughly 35 km in length. In the deepest part of the cluster, radar echo tops from the S-band National Weather Service Surveillance Radar-1988 Doppler (WSR-88D) extended to ~14 km in altitude, consistent with the Jacksonville sounding taken at 12:00 (UT) on 5 August. The convective band propagated westward at a speed of 5.5 m/s, arriving just east of ICLRT at 19:00 (UT). Shortly afterward, the central part of the system started to dissipate while new convective cells continued to form to the north-northeast and south-southwest

of the ICLRT. The new cells also exhibited echo tops of about 14 km. Three lightning flashes, designated UF 11-24, UF 11-25, and UF 11-26, were triggered between 19:33:19 (UT) and 19:49:58 (UT). Correlated observations of the LMA source locations, measured channel-base currents, and radar images of the IS processes of UF 11-24 and UF 11-26 will be discussed in detail in the following sections.
A. Flash UF 11-24
Flash UF 11-24 was triggered at 19:33:19 (UT) on 5 August 2011 with quasi-static electric field at ground of about +5.5 kV/m. The flash contained a full IS process and one subsequent return stroke with peak current of 32.8 kA. Four projection views of the LMA source locations for flash UF 11-24 are shown in Fig. 1. The LMA located a significant number of precursor current pulses (Fig.1, bottom left) during the ascent of the triggering wire within 400 ms of the initiation of the sustained UPL. The UPL initiated at about 0.95 s in Fig. 1 and is clearly differentiated from the preceding precursor pulses by the abrupt change in propagation speed. The UPL propagated generally vertically to an altitude of about 4.7 km with no detected upward branching, then turned 90 degrees to the north and propagated generally horizontally for about 6 km (Fig 1., top
two figures). Here, the UPL channel branched with one channel propagating to the northeast and the other to the west. The northeast IS channel progressed for about 5 km, branching several more times, at an average altitude of about 4.7 km. The western IS channel also branched several more times over a propagation path of about 4 km as it ascended to an altitude of about 6.7 km (Fig. 1, top left), after which the LMA sources became more diffuse as the IS channel exhibited significant horizontal branching to the north and west (Fig. 1, bottom right). The two primary regions of positive electrical breakdown from the northeast and western IS branches were eventually separated by as much as 14 km laterally and by about 2 km in altitude. The initial UPL channel prior to channel branching had a total length, including channel tortuousity, of about 12.6 km, the longest observed IS channel during the 2011 experiment by more than a factor of three.
A SMART radar image (RHI scan, dBZ) at the time of flash UF 11-24 is shown in Fig. 2. The northing projection (Fig. 1, top right) of the LMA sources are overlaid on the radar image. LMA sources located within the radar sweep plane are colored black and sources to the west of the sweep plane are colored in dark green. The 0° C level is annotated and is clearly visible at the tops of the high-
Figure 1. Four projections of the LMA source locations for flash UF 11-24 on 5 August 2011: 1) at top left, an easting versus altitude plot (view looking due north), 2) at top right, a northing versus altitude plot (view looking due west), 3) at bottom left, an altitude versus time plot, 4) at bottom right, an easting versus northing plot (plan view, launching facility annotated by large red circle). The sources span 2 s in time beginning at 19:33:19 (UT) and are color coded according to the key at bottom right, each color corresponding to a 200 ms time window.

Figure 2. SMART radar RHI scan of the radar reflectivity factor (in dBZ) taken at 19:33:01 (UT) at 8.3 degrees north. LMA sources within ± 10 km of the plane of the radar cross-section are overlaid. The 4.7 km 0° C level is indicated on the ordinate axis.
reflectivity rainshafts to the north-northeast and south-southwest of the ICLRT. The rocket was launched with light precipitation at ground level. The IS propagated upward between the rainshafts with little deviation from the vertical until it reached an altitude around the 0° C level. The IS then turned and followed the general contour of the 0° C level for about 6 km prior to exhibiting the branching structure described previously. The northeast IS branch
propagated for several kilometers along the tops of the rainshafts to the north-northeast of the ICLRT while the western IS branch propagated towards a separate cell outside the plane of the RHI scan.
B. Flash UF 11-26
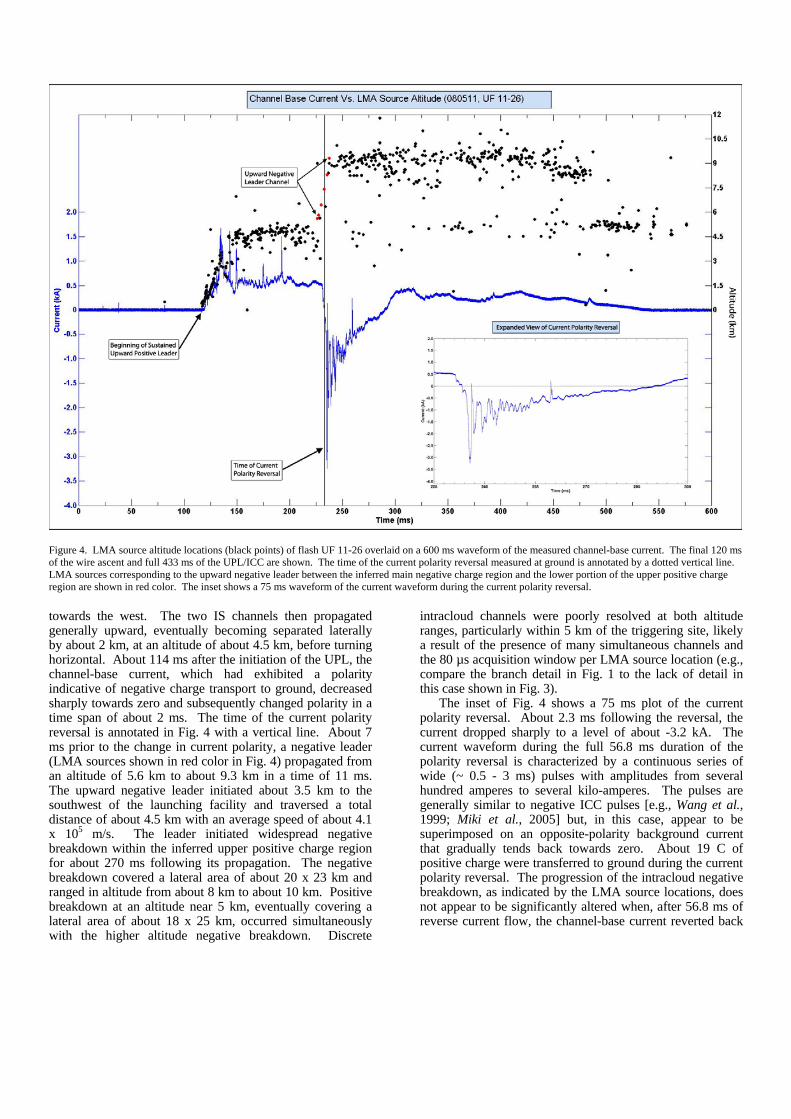
Flash UF 11-26 was triggered at 19:49:58 (UT) with quasi-static electric field at ground of +5.6 kV/m. At the time of the rocket launch, the low-level reflectivity observed over the ICLRT by the WSR-88D had decreased to about 30 dBZ and echo tops were about 12 km in altitude. UF 11-26 was composed of an IS process followed by an intracloud discharge. There were no return strokes to ground in the flash. In Fig. 3, four projections of the LMA source locations obtained during UF 11-26 are shown. In Fig. 4, a 600 ms waveform of the measured channel-base current and the altitude projection of the LMA source locations are plotted. A positive current corresponds to negative charge transported to ground and vice versa. The current waveform shows the final 120 ms of the rocket ascent and the full 433 ms duration of the UPL/ICC (IS) process. At top left in Fig. 3, the UPL is seen to propagate upward for about 3 ms before diverging to the east at an altitude of about 580 m. About 2.5 ms after the UPL turned to the east, an IS branch initiated at an altitude of about 710 m and propagated
Figure 3. Four projections of the LMA source locations for flash UF 11-26 on 5 August 2011: 1) at top left, an easting versus altitude plot (view looking due north), 2) at top right, a northing versus altitude plot (view looking due west), 3) at bottom left, an altitude versus time plot, 4) at bottom right, an easting versus northing plot (plan view, launching facility annotated by large red circle). The sources span 1 s in time beginning at 19:49:58 (UT) and are color coded according to the key at bottom right, each color corresponding to a 100 ms time window.
intracloud channels were poorly resolved at both altitude ranges, particularly within 5 km of the triggering site, likely a result of the presence of many simultaneous channels and the 80 µs acquisition window per LMA source location (e.g., compare the branch detail in Fig. 1 to the lack of detail in this case shown in Fig. 3).
The inset of Fig. 4 shows a 75 ms plot of the current polarity reversal. About 2.3 ms following the reversal, the current dropped sharply to a level of about -3.2 kA. The current waveform during the full 56.8 ms duration of the polarity reversal is characterized by a continuous series of wide (~ 0.5 - 3 ms) pulses with amplitudes from several hundred amperes to several kilo-amperes. The pulses are generally similar to negative ICC pulses [e.g., Wang et al., 1999; Miki et al., 2005] but, in this case, appear to be superimposed on an opposite-polarity background current that gradually tends back towards zero. About 19 C of positive charge were transferred to ground during the current polarity reversal. The progression of the intracloud negative breakdown, as indicated by the LMA source locations, does not appear to be significantly altered when, after 56.8 ms of reverse current flow, the channel-base current reverted back
Figure 4. LMA source altitude locations (black points) of flash UF 11-26 overlaid on a 600 ms waveform of the measured channel-base current. The final 120 ms of the wire ascent and full 433 ms of the UPL/ICC are shown. The time of the current polarity reversal measured at ground is annotated by a dotted vertical line. LMA sources corresponding to the upward negative leader between the inferred main negative charge region and the lower portion of the upper positive charge region are shown in red color. The inset shows a 75 ms waveform of the current waveform during the current polarity reversal.
towards the west. The two IS channels then propagated generally upward, eventually becoming separated laterally by about 2 km, at an altitude of about 4.5 km, before turning horizontal. About 114 ms after the initiation of the UPL, the channel-base current, which had exhibited a polarity indicative of negative charge transport to ground, decreased sharply towards zero and subsequently changed polarity in a time span of about 2 ms. The time of the current polarity reversal is annotated in Fig. 4 with a vertical line. About 7 ms prior to the change in current polarity, a negative leader (LMA sources shown in red color in Fig. 4) propagated from an altitude of 5.6 km to about 9.3 km in a time of 11 ms. The upward negative leader initiated about 3.5 km to the southwest of the launching facility and traversed a total distance of about 4.5 km with an average speed of about 4.1 x 10⁵ m/s. The leader initiated widespread negative breakdown within the inferred upper positive charge region for about 270 ms following its propagation. The negative breakdown covered a lateral area of about 20 x 23 km and ranged in altitude from about 8 km to about 10 km. Positive breakdown at an altitude near 5 km, eventually covering a lateral area of about 18 x 25 km, occurred simultaneously with the higher altitude negative breakdown. Discrete

to a polarity indicative of negative charge transport to ground.
At the ICLRT, rain at the ground surface was observed to have already ended just prior to the rocket launch. RHI scans taken with the SMART radar show that the rocket and subsequent UPL rose through a tilted descending reflectively pac
ajority of the LMA sources during the current pol
was atypical of a Florida convective thunderstorm negat ilar to that rep
ket (DRP) that was 2 km wide, on average, in the plane of the RHI (Fig. 5) and extended at least 1 km in the east-west direction, as determined by the five-degree azimuthal RHI sector scan centered on the ICLRT. At the time of the rocket launch, the north-south width of the DRP base was 600 m over the ICLRT and was found at an altitude of 500 m. A few hundred meters farther east, however, the DRP had already reached the surface. The DRP formation may have been associated with remnants of the convective cell in the central part of the storm system but appeared as localized coalescence of raindrops just below the 0° C level. When the IS channel turned horizontal near 4.5 km altitude, it propagated for some kilometers across the top of the DRP, and along the radar-determined 0° C level (Fig. 5). Thus, the path of the initial UPL and the subsequent channel development were closely associated with precipitation boundaries.
The marity reversal at ground were located in a layer between 8-
10 km in altitude and were associated with precipitation near the cores of dissipating convective cells to the north and southwest of the ICLRT.
IV. DISCUSSION OF RESULTS
Branching of the IS was observed via the LMA in eight of the nine triggered lightning events, starting from altitudes as low as 580 m (flash UF 11-26), but more typically from altitudes of about 700 m to 5 km. Due to the low cloud bases, 1 km (+/- 500 m) during typical Florida thunderstorms, and the fact that our array of cameras typically views only about 450 m above the launching facility, we rarely view by eye or optically image IS branches. For the nine events, statistics for the length and average speed of the initial UPL, and lengths, average speeds, initiation altitudes, and initiation currents for the well-resolved IS branches are given in Table 2.
For two triggered lightning flashes at the ICLRT in 2009, Yoshida et al. [2010] used a two-station interferometer to map two IS's from altitudes of 1.1 to 2.4 km and 1.5 to 3.7 km, with three-dimensional velocities of 2.2 x 10⁶ m/s and 3.3 x 10⁶ m/s, respectively. The highest source altitudes of the two recorded IS's were below the typical 0° C layer in Florida storms of 4-5 km. Yoshida et al. [2010] suggest that the cloud charge structure
and that there may have been aive charge layer between 2-4 km, sim
orted by Stolzenburg et al. [2002] for mesoscale convective systems.
Figure 5. SMART radar RHI scan of radar reflectivity factor (in dBZ) at 19:50:03 (UT) taken at 10.3 degrees north. LMA sources within ± 10 km of the plane of the radar cross-section are overlaid. Red (black) circles denote LMA sources that were west (east) of the radar cross-section. The 4.9 km 0° C level is indicated on the ordinate axis.
The distributions of LMA altitude sources for our nine triggered flashes, which have typical peaks between 3-6 km, suggest that the two events discussed in Yoshida et al. [2010] may, in fact, have been typical for triggered lightning in Florida thunderstorms. In contrast to the results of Yoshida who reported no sources following the clearly-defined IS channel, the LMA-located sources following the end of the clearly-defined IS channel generally propagated horizontally and outward from the ending point of the IS channel. Further, the average three-dimensional speed calculated for the initial UPLs before any branching occurs (see Table 2
f propagation of a UPL at the ICLRT, and of 1.0 x 10⁵ m/s given by Jiang et al. [2011]
itive charge (29 C vs. 19 C for UF 11-
) for the nine triggered flashes was about 8.7 x 10⁴ m/s, more than an order of magnitude slower than those calculated by Yoshida et al. [2010], and in much better agreement with the two-dimensional UPL speeds of 5.6 x 10⁴ m/s given by Biagi et al.[2009] for the first 100 m o
for an UPL in China propagating between 130-730 m above ground.
Yoshida et al. [2010], based on two triggered lightning events with abnormally large ICC pulses, suggest that positive VHF sources, which have traditionally been thought to have insufficient power to be routinely recorded by VHF imaging systems [e.g., Shao et al., 1996], can be recorded "if the current is sufficiently high (> 1 kA) and/or is impulsive". The LMA at the ICLRT resolved positive VHF sources from precursor current pulses during the triggering wire ascent with current amplitudes as small as 10 A, with the closest LMA station at about 2.7 km.
Current polarity reversals during the ICC periods of triggered lightning flashes at the ICLRT have been rarely observed. One case occurred in 2009 and is documented in Yoshida et al. [2012]. The current polarity reversal measured at ground in Yoshida et al. [2012] was shorter in duration (39 ms vs. 56.8 ms for UF 11-26) but transferred more pos

26) and exhi te a de urrent e 5 vs. - A fo 11-26). hida
ed roadba nter eter to he nne g lea etwe tive
ve charge reg that ated 7.6 rior cu polarity reve but they not ica racter of t ader. U UF ad ubseq retu trokes, t ent
d . [2 had subseque turn ne e cha with k current 29.6
kA.
on of LMA
bi d a higher m gnitu peak c during threversal period (-5. kA 3.2 k r UF Yoset al. [2012] us a b nd i ferom infer tpresence of a co ctin der b en the main negaand upper positi ions initi ms pto the observed rrent rsal, doprovide geometr l cha istics he le nlike11-26, which h no s uent rn s he evdiscussed in Yoshi a et al 012] one nt restroke lowering gativ rge, pea of
Aspects of the cloud charge structure during flash UF 11-26 can be inferred from the altitude distributisource locations shown in Fig. 6. The bimodal distribution of source altitudes together with the corresponding source powers measured by the LMA indicates a region of predominantly positive electrical breakdown spanning an altitude from about 4-5.5 km and a region of predominantly negative breakdown spanning in altitude from about 7.5-10.5 km. The vertical structure of the electrical breakdown
Figure 6. Histogram (bin size equal to 30 sources) of the altitude distribution of LMA sources of flash UF 11-26.
s t up g , ro 5.6 to 9 in a ude, con cted the expected top of
negative charge er itive char reg e a p de some po e flo h a und. The me (1 d a 3-D x 105 m of r l th in good agreem st o
, who ed a an ro d ard neg ve du of
propagation speeds of 1.5 to 3 x 10⁵ m/s for bi-level intracloud flashes in central Florida, and with statistics reported by Behnke et al. [2005], who used LMA sources to calculate the median initial upward negative leader speed to be 1.6 x 10⁵ m/s for 24 intracloud flashes in New Mexico and Kansas. The upward negative leader in this Florida study appeared to have initiated at an altitude of about 5.6 km, several kilometers lower than those reported by Shao et al. [1996] and Behnke et al. [2005] for naturally occurring bi-level intracloud discharges, both studies reporting initial altitudes of about 7-8 km.
V. SUMMARY
LMA data were recorded for the IS's of nine triggered lightning flashes. The first branching of the IS was observed in eight of the nine events at altitudes ranging from about
branching. For each
gth and Avg. Speed el Branching
IS Branch Geometry & Correlated Current
suggest hat the ward ne ative leader which p pagated from .3 km ltit nethe region to the low part of the upperpos ge ion. In th process, ath was velopedfor sitiv charge to w throug the IS ch nnel togro ti duration 1 ms) an verage speed(4.1 /s) the upwa d negative eader in is studyare ent with atistics rep rted by Shao et al.[1996] us narrowb d interfe meter to etermineupw ati leader rations 10-20 ms and
580 m to about 5.2 km. No significant change in the current at ground was observed at the time offlash, the IS was observed to transition at 3-6 km altitude, near the 0° C level of 4-5 km, from generally vertically-propagating continuous channels to many highly-branched channels that propagated more horizontally. For two flashes discussed in detail here, RHI radar images show that the horizontally propagating IS channels follow the contour of the 0° C level for many kilometers, indicating a preferred path for propagation either because of high electric fields there or perhaps because of the characteristics of the hydrometeors present in that range. For one event that exhibited a current polarity reversal measured at ground, it was shown that a classical normal polarity bi-level intracloud
Total UPL/ICC Current Parameters Initial UPL3-D Len
Prior to Chann
Date Shot Charge Duration
Avg.
Transfer (C) (ms) (A)
Current Length (km) Avg. Speed (104 m/s)
# of IS Branches
Initiation Altitudes
(km) Lengths (km)
Avg. Speeds(104 m/s)
Initiation Currents
(A)
062311 UF 11-11 22 344 64 3.7 13.5 0 - - - - 080511 UF 11-24 46 428 107 12.6* 8.4 4 5.2 - 5.4 5.2 - 7.2 1.7 - 3.3 90 - 125 080511 UF 11-25 28 404 70 0.15 7.9 6 0.75 - 2.7 1.2 - 2.4 2.8 - 7.9 12 - 60 080511 UF 11-26 120a 433 328a 0.07 3.8 2 0.58 - 0.71 2.8 - 4.1 4.7 - 18 9 - 43 081211 UF 11-28 136 694 196 2.5 9.3 3 2.1 - 2.4 0.81 - 3.1 4.0 - 9.3 29 - 42 081811 UF 11-32 225 945 236 0.63 9.5 6 0.87 - 4.9 0.51 - 14.7 2.0 - 11.9 11 - 156 081811 UF 11-33 110 630 219 6 1.1 - 5.0 0.82 - 11.3 4.0 - 7.5 24 - 183 0.81 7.5 081 11 UF 11-34 3 2038 120 567 211 5.0 11.8 4.4 - 4.7 5.0 - 13.7 2.0 - 14.8 193 -081811 UF 11-35 128 726 3.7 6.6 2 2.1 - 3.1 3.5 - 5.9 176 4.0 - 4.3 104 -169
TABLE II AT LEFT, MEASURED CHANNEL-BASE CURRENT PARAMETERS FOR THE DURATION OF THE UPL/ICC. AT MIDDLE, 3-D UPL LENGTH FROM THE FIRSTDETECTED LMA SOURCE OF THE UPL TO THE FIRST BRANCH LOCATION. AT RIGHT, IS CHANNEL BRANCHING STATISTICS.

oped important aspects of the LMA processing code. G. Carrie developed important aspects of the ode.
. L.; Meesters, A. C.; Perroud, P. H.; Hamelin, J. H.; Person, J. M.; , "Research on Artificiallyu TriggeredLightning in Fr and Systems, IEEE
0450(1976)015<0633:TDOCOO>2.0.CO;2 [7] Hill, J. D., J. Pilkey . M. Jordan, W. Rison,
e, P. Laroche, A. Eybert-
. rfer, M. Mair, F.
M. Jordan, J. Jerauld, M. A. ike
g, J. 29/2005JD006790.
man, “Lightning: Physics and
ng
ightning, J. Geophys.
, D14207,
4(D4), 4213–4222,
10.1016/S0169-
al
es., 117, D09119,
ray
discharge can be initiated using the classical rocket-and-wire triggering technique. The LMA resolved VHF sources radiated by positive current impulses with amplitudes as small as 10 A.
ACKNOWLEDGEMENT
This research was funded by the DARPA NIMBUS program. Assistance in the LMA installation was provided by J. Bailey. H. Edens devel
SMART radar processing c
REFERENCES
[1] Behnke, S. A., R. J. Thomas, P. R. Krehbiel, and W. Rison (2005), Initial leader velocities during intracloud lightning: Possible evidence for a runaway breakdown effect, J. Geophys. Res., 110, D10207, doi:10.1029/2004JD005312.
[2] Biagi, C. J., D. M. Jordan, M. A. Uman, J. D. Hill, W. H. Beasley, and J. Howard (2009), High-speed video observations of rocket-and-wire initiated lightning, Geophys. Res. Lett., 36, L15801, doi:10.1029/2009GL038525.
[3] Biagi, C. J., M. A. Uman, J. D. Hill, V. A. Rakov, and D. M. Jordan (2012), Transient current pulses in rocket-extended wires used to trigger lightning, J. Geophys. Res., 117, D07205, doi:10.1029/2011JD016161.
[4] Biggerstaff, M. I., L. J. Wicker, J. Guynes, C. Ziegler, J. M. Straka, E.N. Rasmussen, A. Dogget IV, L. D. Carey, J. L. Schroeder, and C. Weiss, 2005: The Shared Mobile Atmospheric Research and Teaching (SMART) Radar: A collaboration to enhance research and teaching. Bull. Amer. Meteor. Soc., 86, 1263-1274.
[5] Fieux, R. P.; Gary, C. H.; Hutzler, B. P.; Eybert-Berard, A. R.; Hubert, P
doi:ance," Power Apparatus
Transactions on , vol.PAS-97, no.3, pp.725-733, May 1978 doi: 10.1109/TPAS.1978.354543.
[6] Hendry, A., G. C. McCormick, B. L. Barge, 1976: The Degree of Common Orientation of Hydrometeors Observed by Polarization Diversity Radars. J. Appl. Meteor., 15, 633–640.doi:http://dx.doi.org/10.1175/1520-
, M. A. Uman, Dand P. R. Krehbiel (2012), Geometrical and electrical characteristics of the initial stage in Florida triggered lightning, Geophys. Res. Lett., 39, L09807, doi:10.1029/2012GL051932.
[8] Hubert, P., and G. Mouget (1981), Return Stroke Velocity Measurements in Two Triggered Lightning Flashes, J. Geophys.Res.86(C6),5253–5261,doi: 10.1029/JC086iC06p05253.
[9] Hubert, P., P. Laroche, A. Eybert-Berard, and L. Barret (1984), Triggered Lightning in New Mexico, J. Geophys. Res., 89(D2), 2511–2521, doi:10.1029/JD089iD02p02511.
[10] Idone, V. P., R. E. Orville, P. Hubert, L. Barret, and A. Eybert-Berard (1984), Correlated Observations of Three Triggered Lightning Flashes, J. Geophys. Res., 89(D1), 1385–1394, doi:10.1029/JD089iD01p01385.
[11] Rubin Jiang, Xiushu Qie, Caixia Wang, Jing Yang (2011) , Step-like characteristics of an upward positive leader in triggered lightning, Lightning (APL), 2011 7th Asia-Pacific
International Conference on , vol., no., pp.614-617, 1-4 Nov. 2011. doi:10.1109/APL.2011.6110200.
[12] Krehbiel, P. R., R. J. Thomas, W. Rison, T. Hamlin, J. Harlin, and M. Davis (2000), Lightning mapping observations in central Oklahoma, Eos Trans. AGU, 81(3), 21–25.
[13] Lalande, P., A. Bondiou-ClergeriBerard, J.-P. Berlandis, B. Bador, A. Bonamy, M. A. Uman, and V. A. Rakov (1998), Leader properties determined with triggered lightning techniques, J. Geophys. Res., 103(D12), 14,109–14,115, doi:10.1029/97JD02492
[14] Miki, M., V. A. Rakov, T. Shindo, G. DiendoHeidler, W. Zischank, M. A. Uman, R. Thottappillil, and D. Wang (2005), Initial stage in lightning initiated from tall objects and in rocket-triggered lightning, J. Geophys. Res., 110, D02109, doi:10.1029/2003JD004474.
[15] Olsen, R. C., III, V. A. Rakov, D.Uman, and K. J. Rambo (2006), Leader/return-stroke-lprocesses in the initial stage of rocket-triggered lightninGeophys. Res., 111, D13202, doi:10.10
[16] V. A. Rakov and M. A. UEffects”, New York, NY: Cambridge University Press, 2003.
[17] Rison, W., R. J. Thomas, P. R. Krehbiel, T. Hamlin, and J. Harlin (1999), A GPS-based three- dimensional lightnimapping system: Initial observations in central New Mexico, Geophys. Res. Lett., 26, 3573–3576.
[18] Shao, X. M., and P. R. Krehbiel (1996), The spatial and temporal development of intracloud lRes., 101(D21), 26,641–26,668, doi:10.1029/96JD01803.
[19] Stolzenburg, M., T. C. Marshall, W. D. Rust, and D. L. Bartels (2002), Two simultaneous charge structures in thunderstorm convection, J. Geophys. Res., 107(D18), 4352, doi:10.1029/2001JD000904.
[20] Thomas, R. J., P. R. Krehbiel, W. Rison, S. J. Hunyady, W. P. Winn, T. Hamlin, and J. Harlin (2004), Accuracy of the Lightning Mapping Array, J. Geophys. Res., 109
10.1029/2004JD004549. [21] Wang, D., V. A. Rakov, M. A. Uman, M. I. Fernandez, K. J.
Rambo, G. H. Schnetzer, and R. J. Fisher (1999), Characterization of the initial stage of negative rocket-triggered lightning, J. Geophys. Res., 10doi:10.1029/1998JD200087.
[22] J.C Willett, D.A Davis, P Laroche, An experimental study of positive leaders initiating rocket-triggered lightning, Atmospheric Research, Volume 51, Issues 3–4, July 1999, Pages 189-219, ISSN 0169-8095, 8095(99)00008-3.
[23] Yoshida, S., C. J. Biagi, V. A. Rakov, J. D. Hill, M. V. Stapleton, D. M. Jordan, M. A. Uman, T. Morimoto, T. Ushio, and Z.-I. Kawasaki (2010), Three-dimensionimaging of upward positive leaders in triggered lightning using VHF broadband digital interferometers, Geophys. Res. Lett., 37, L05805, doi:10.1029/2009GL042065.
[24] Yoshida, S., et al. (2012), The initial stage processes of rocket-and-wire triggered lightning as observed by VHF interferometry, J. Geophys. Rdoi:10.1029/2012JD017657.
[25] Winn, W. P., E. M. Eastvedt, J. J. Trueblood, K. B. Eack, H. E. Edens, G. D. Aulich, S. J. Hunyady, and W. C. Mur(2012), Luminous pulses during triggered lightning, J. Geophys. Res., 117, D10204, doi:10.1029/2011JD017105.

Related Documents