2012 California Annual Review of Energy Efficiency Programs January 1, 2012 – December 31, 2012 Issued March 15, 2013

Welcome message from author
This document is posted to help you gain knowledge. Please leave a comment to let me know what you think about it! Share it to your friends and learn new things together.
Transcript
2012 California Annual Review of Energy Efficiency Programs January 1, 2012 – December 31, 2012 Issued March 15, 2013

Page 2 of 29
(This page intentionally left blank)
Pacific Power California Report Table of Contents
Page 3 of 29
Table of Contents LIST OF ABBREVIATIONS AND ACRONYMS ................................................................................................... 5
EXECUTIVE SUMMARY ................................................................................................................................ 6
REGULATORY ACTIVITIES ............................................................................................................................. 8
PLANNING PROCESS .................................................................................................................................... 10
Integrated Resource Plan ........................................................................................................................ 10
ENERGY EFFICIENCY PROGRAMS................................................................................................................ 12
RESIDENTIAL PROGRAMS ............................................................................................................................ 13
Home Energy Savings ............................................................................................................................ 13
Program Management ......................................................................................................................... 13
Program Administration ...................................................................................................................... 14
Infrastructure ....................................................................................................................................... 14
Evaluation ........................................................................................................................................... 17
Refrigerator Recycling ........................................................................................................................... 18
Program Administration ...................................................................................................................... 18
Infrastructure ....................................................................................................................................... 19
Low Income Weatherization .................................................................................................................. 19
Program Management ......................................................................................................................... 20
Program Administration ...................................................................................................................... 20
COMMERCIAL AND INDUSTRIAL PROGRAMS .............................................................................................. 21
FinAnswer Express ................................................................................................................................ 21
Program Management ......................................................................................................................... 22
Program Administration ...................................................................................................................... 22
Infrastructure ....................................................................................................................................... 23
Evaluation ........................................................................................................................................... 23
Energy FinAnswer ................................................................................................................................. 24
Program Management ......................................................................................................................... 25
Infrastructure ....................................................................................................................................... 25
Evaluation ........................................................................................................................................... 26
COMMUNICATIONS, OUTREACH AND EDUCATION ..................................................................................... 27
Customer Communications .................................................................................................................. 27
Program Specific Communications ..................................................................................................... 27
Home Energy Savings ......................................................................................................................... 27
Pacific Power California Report Table of Contents
Page 4 of 29
Refrigerator Recycling ........................................................................................................................ 28
FinAnswer Express and Energy FinAnswer ....................................................................................... 28
EVALUATIONS ............................................................................................................................................. 29
Pacific Power California Report Abbreviations and Acronyms
Page 5 of 29
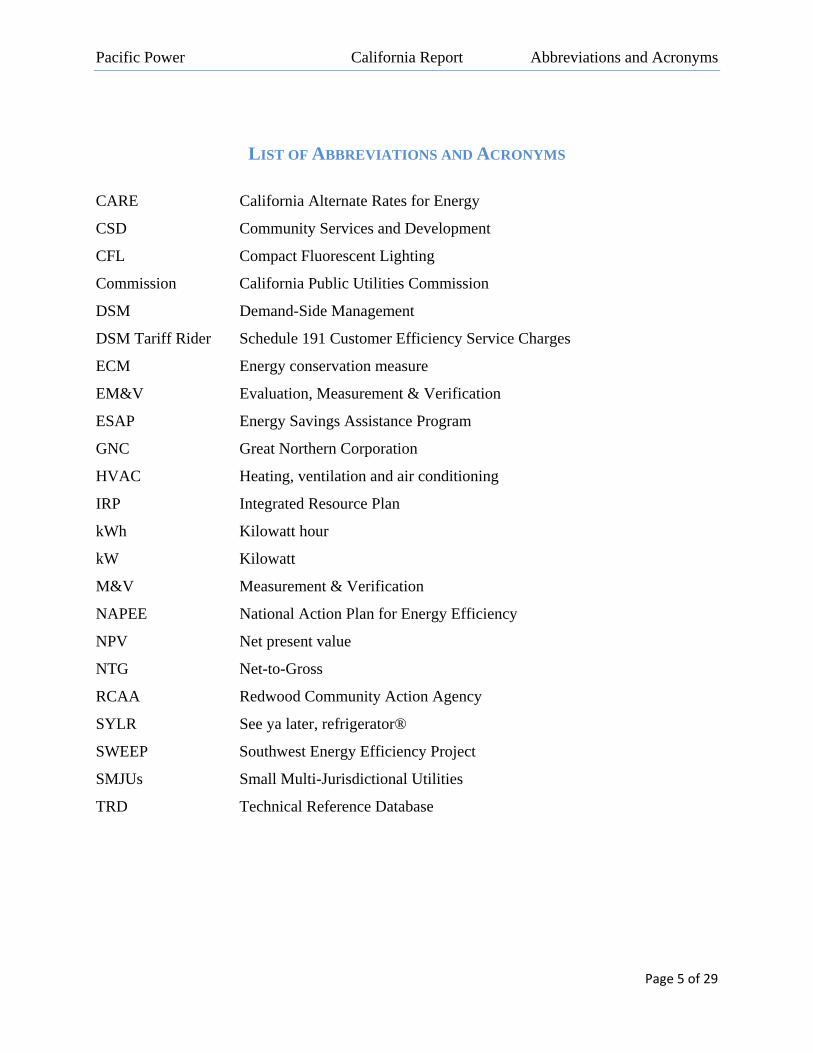
LIST OF ABBREVIATIONS AND ACRONYMS
CARE California Alternate Rates for Energy
CSD Community Services and Development
CFL Compact Fluorescent Lighting
Commission California Public Utilities Commission
DSM Demand-Side Management
DSM Tariff Rider Schedule 191 Customer Efficiency Service Charges
ECM Energy conservation measure
EM&V Evaluation, Measurement & Verification
ESAP Energy Savings Assistance Program
GNC Great Northern Corporation
HVAC Heating, ventilation and air conditioning
IRP Integrated Resource Plan
kWh Kilowatt hour
kW Kilowatt
M&V Measurement & Verification
NAPEE National Action Plan for Energy Efficiency
NPV Net present value
NTG Net-to-Gross
RCAA Redwood Community Action Agency
SYLR See ya later, refrigerator®
SWEEP Southwest Energy Efficiency Project
SMJUs Small Multi-Jurisdictional Utilities
TRD Technical Reference Database
Pacific Power California Report Executive Summary
Page 6 of 29
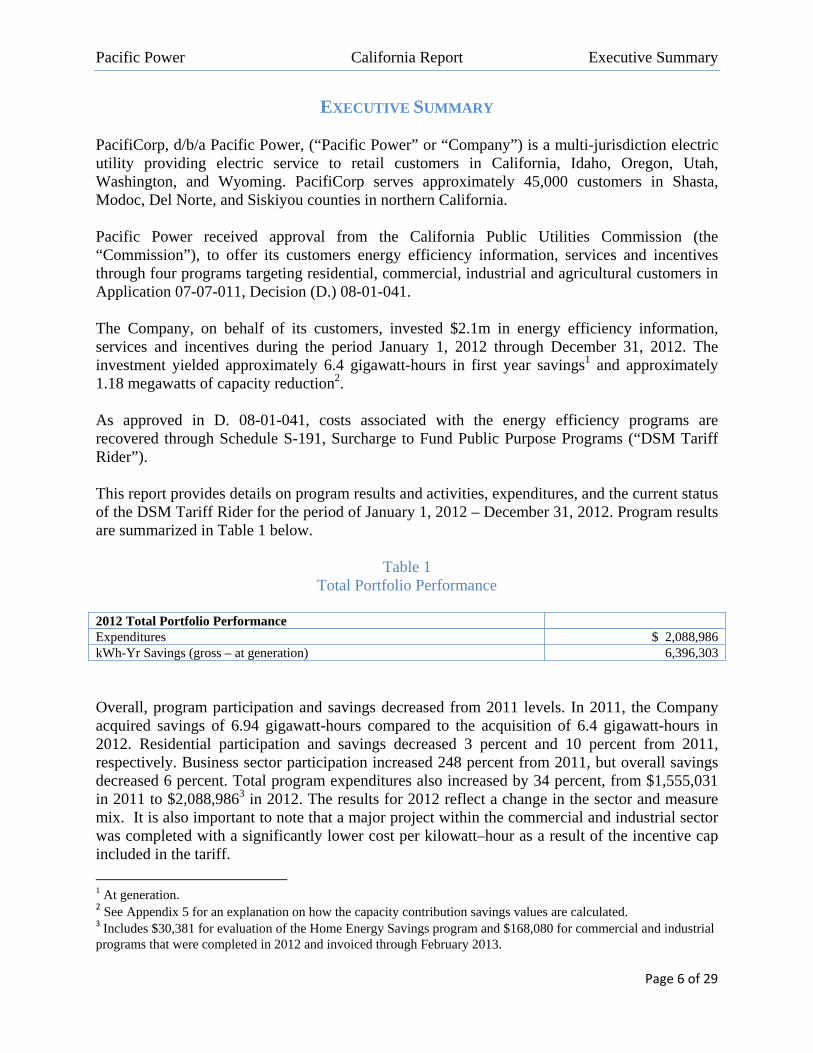
EXECUTIVE SUMMARY PacifiCorp, d/b/a Pacific Power, (“Pacific Power” or “Company”) is a multi-jurisdiction electric utility providing electric service to retail customers in California, Idaho, Oregon, Utah, Washington, and Wyoming. PacifiCorp serves approximately 45,000 customers in Shasta, Modoc, Del Norte, and Siskiyou counties in northern California. Pacific Power received approval from the California Public Utilities Commission (the “Commission”), to offer its customers energy efficiency information, services and incentives through four programs targeting residential, commercial, industrial and agricultural customers in Application 07-07-011, Decision (D.) 08-01-041. The Company, on behalf of its customers, invested $2.1m in energy efficiency information, services and incentives during the period January 1, 2012 through December 31, 2012. The investment yielded approximately 6.4 gigawatt-hours in first year savings1 and approximately 1.18 megawatts of capacity reduction2. As approved in D. 08-01-041, costs associated with the energy efficiency programs are recovered through Schedule S-191, Surcharge to Fund Public Purpose Programs (“DSM Tariff Rider”). This report provides details on program results and activities, expenditures, and the current status of the DSM Tariff Rider for the period of January 1, 2012 – December 31, 2012. Program results are summarized in Table 1 below.
Table 1 Total Portfolio Performance
2012 Total Portfolio Performance Expenditures $ 2,088,986 kWh-Yr Savings (gross – at generation) 6,396,303 Overall, program participation and savings decreased from 2011 levels. In 2011, the Company acquired savings of 6.94 gigawatt-hours compared to the acquisition of 6.4 gigawatt-hours in 2012. Residential participation and savings decreased 3 percent and 10 percent from 2011, respectively. Business sector participation increased 248 percent from 2011, but overall savings decreased 6 percent. Total program expenditures also increased by 34 percent, from $1,555,031 in 2011 to $2,088,9863 in 2012. The results for 2012 reflect a change in the sector and measure mix. It is also important to note that a major project within the commercial and industrial sector was completed with a significantly lower cost per kilowatt–hour as a result of the incentive cap included in the tariff.
1 At generation. 2 See Appendix 5 for an explanation on how the capacity contribution savings values are calculated. 3 Includes $30,381 for evaluation of the Home Energy Savings program and $168,080 for commercial and industrial programs that were completed in 2012 and invoiced through February 2013.
Pacific Power California Report Executive Summary
Page 7 of 29
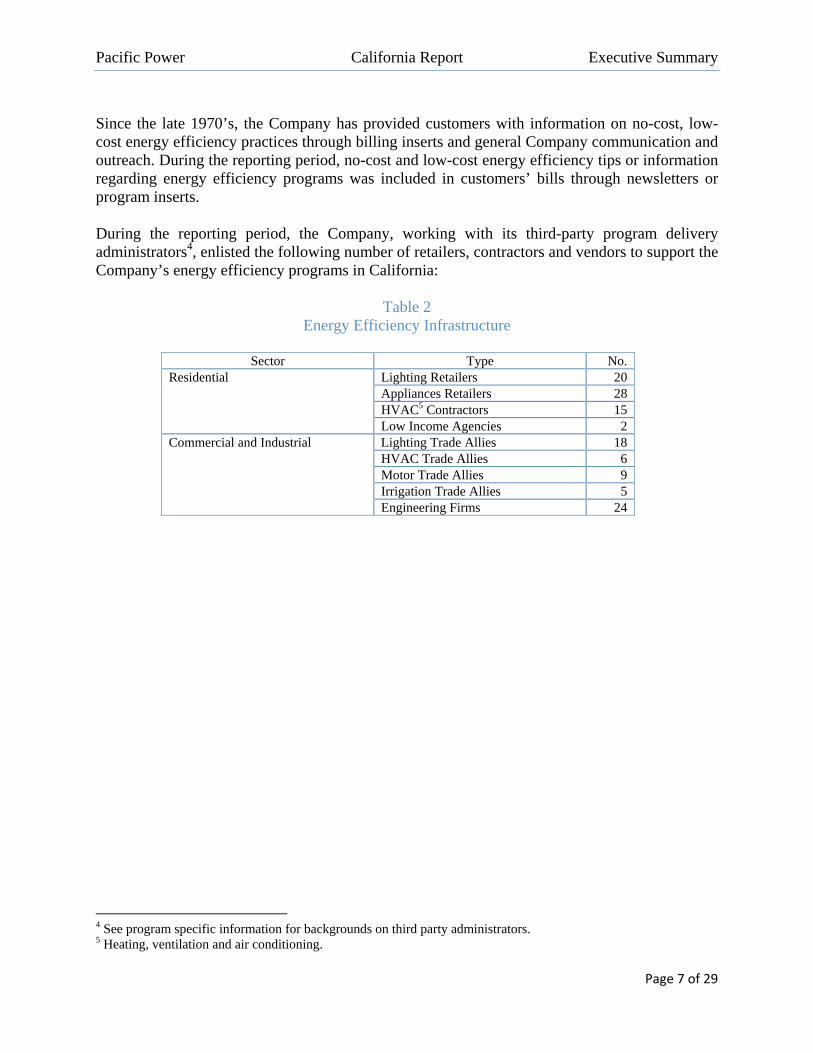
Since the late 1970’s, the Company has provided customers with information on no-cost, low-cost energy efficiency practices through billing inserts and general Company communication and outreach. During the reporting period, no-cost and low-cost energy efficiency tips or information regarding energy efficiency programs was included in customers’ bills through newsletters or program inserts. During the reporting period, the Company, working with its third-party program delivery administrators4, enlisted the following number of retailers, contractors and vendors to support the Company’s energy efficiency programs in California:
Table 2
Energy Efficiency Infrastructure
Sector Type No. Residential Lighting Retailers 20
Appliances Retailers 28 HVAC5 Contractors 15 Low Income Agencies 2
Commercial and Industrial Lighting Trade Allies 18 HVAC Trade Allies 6 Motor Trade Allies 9 Irrigation Trade Allies 5 Engineering Firms 24
4 See program specific information for backgrounds on third party administrators. 5 Heating, ventilation and air conditioning.
Pacific Power California Report Regulatory Activities
Page 8 of 29
REGULATORY ACTIVITIES
Pacific Power submitted an advice letter on September 27, 2011 to suspend the S-191 Surcharge (“Surcharge”) to Fund Public Purpose Programs and extend the Energy Efficiency Budget Cycle through December 31, 2012, or until the over-collection of Surcharge revenues was exhausted. The Commission accepted the request on November 29, 2011, effective October 27, 2011.
Regulatory activity in 2012 was limited to the filing of the 2011 Annual Review of Energy Efficiency programs. This report was filed with the Commission on March 15, 2012.
Pacific Power anticipates filing an application in 2013 to reactivate the Surcharge. The filing will provide a multi-year budget plan for the ongoing operation of energy efficiency programs in the Company’s California service territory, and information on the expected cost-effectiveness of the Company’s program proposal. The Company intends to continue to offer California customers opportunities for energy savings in their homes and businesses.
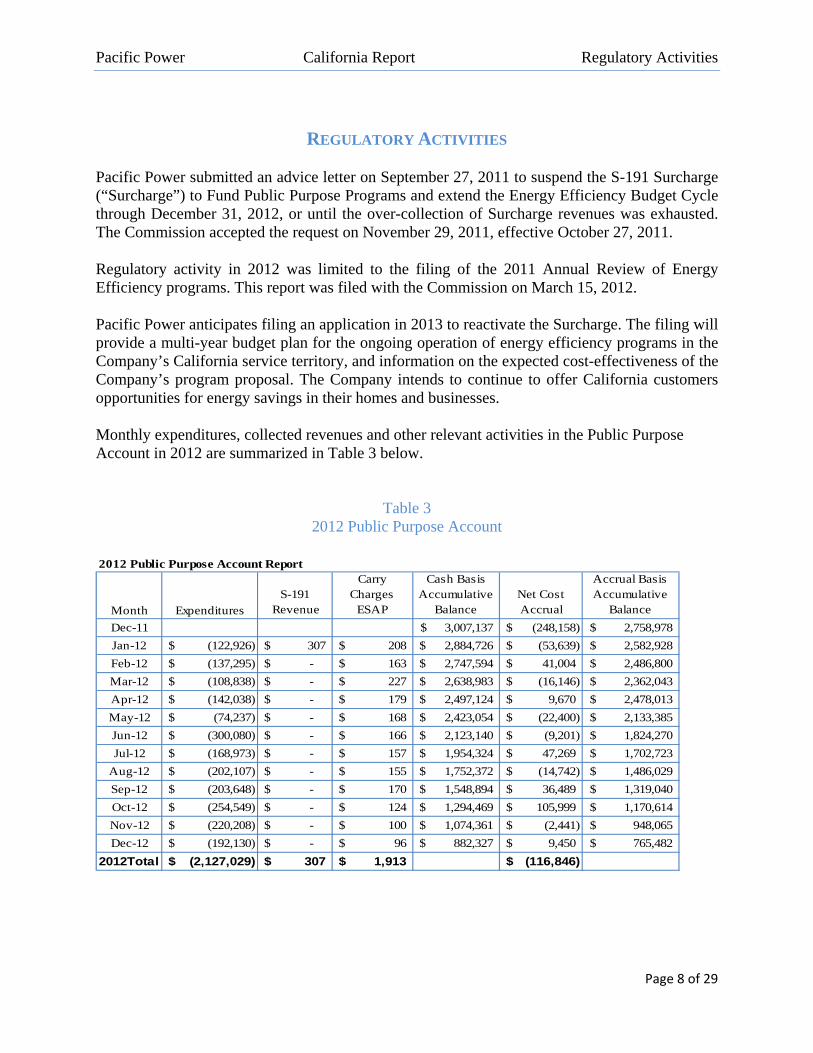
Monthly expenditures, collected revenues and other relevant activities in the Public Purpose Account in 2012 are summarized in Table 3 below.
Table 3
2012 Public Purpose Account 2012 Public Purpose Account Report
Month Expenditures
S-191 Revenue
Carry Charges
ESAP
Cash Basis Accumulative
BalanceNet Cost Accrual
Accrual Basis Accumulative
Balance
Dec-11 3,007,137$ (248,158)$ 2,758,978$
Jan-12 (122,926)$ 307$ 208$ 2,884,726$ (53,639)$ 2,582,928$
Feb-12 (137,295)$ -$ 163$ 2,747,594$ 41,004$ 2,486,800$
Mar-12 (108,838)$ -$ 227$ 2,638,983$ (16,146)$ 2,362,043$
Apr-12 (142,038)$ -$ 179$ 2,497,124$ 9,670$ 2,478,013$
May-12 (74,237)$ -$ 168$ 2,423,054$ (22,400)$ 2,133,385$
Jun-12 (300,080)$ -$ 166$ 2,123,140$ (9,201)$ 1,824,270$
Jul-12 (168,973)$ -$ 157$ 1,954,324$ 47,269$ 1,702,723$
Aug-12 (202,107)$ -$ 155$ 1,752,372$ (14,742)$ 1,486,029$
Sep-12 (203,648)$ -$ 170$ 1,548,894$ 36,489$ 1,319,040$
Oct-12 (254,549)$ -$ 124$ 1,294,469$ 105,999$ 1,170,614$
Nov-12 (220,208)$ -$ 100$ 1,074,361$ (2,441)$ 948,065$
Dec-12 (192,130)$ -$ 96$ 882,327$ 9,450$ 765,482$
2012Total (2,127,029)$ 307$ 1,913$ (116,846)$
Pacific Power California Report Regulatory Activities
Page 9 of 29
Column Explanations:
Expenditures: Monthly expenditures for approved energy efficiency programs. S-191 Revenue: Revenue collected through Schedule S-191, Public Purpose Charge. Carrying Charges ESAP: Monthly carrying charge for ESAP based on “Cash Basis Accumulated Balance” of the account.
Net Cost Accrual: Two accrual entries are made each month for expenditures of energy efficiency programs. The first estimates the incurred cost not yet processed, and the second reverses the estimate from the previous month. The amount shown here is the net of the two entries. This accounting principle was applied to the balancing account in December 2011 but is not included when calculating the carrying charges. Cash Basis Accumulative Balance: Current balance of the account; a running total of account activities, excluding the accrued cost. If more is collected in revenue than is spent in monthly program costs for a given month, then the balance will be increased by the net amount. A positive balance means cumulative revenue exceeds cumulative expenditures; a negative balance means cumulative expenditures exceed cumulative revenue. Accrual Basis Accumulative Balance: Current balance of the account including accrued costs. A positive balance means cumulative revenue exceeds cumulative expenditures; a negative balance means cumulative expenditures exceed cumulative revenue.
Pacific Power California Report Energy Efficiency Programs
Page 10 of 29
PLANNING PROCESS
Integrated Resource Plan The Company develops a biennial integrated resource plan (“IRP”) as a means of balancing cost, risk, uncertainty, supply reliability/deliverability and long-run public policy goals. The plan presents a framework of future actions to ensure the Company continues to provide reliable, reasonable-cost service with manageable risks to the Company’s customers. Energy efficiency and peak management opportunities are incorporated into the IRP based on their availability, characteristics and costs. Energy efficiency and peak management resources included in the IRP are divided into four general classes:
Class 1 DSM (Resources from fully dispatchable or scheduled firm capacity product offerings/programs) – Capacity savings occur as a result of active Company control or advanced scheduling. Once customers agree to participate, the timing and persistence of the load reduction is involuntary on their part within the agreed limits and parameters.
Class 2 DSM (Resources from non-dispatchable, firm energy and capacity product offerings/programs) – Sustainable energy and related capacity savings are achieved through facilitation of technological advancements in equipment, appliances, lighting and structures or sustainable verifiable changes in operating and maintenance practices, also commonly referred to as energy efficiency resources.
Class 3 DSM (Resources from price responsive energy and capacity product offerings/programs) – Short-duration energy and capacity savings from actions taken by customers voluntarily based on pricing incentives or signal.
Class 4 DSM (Resources from energy efficiency education and non-incentive based voluntary curtailment programs/communications pleas) – Energy and/or capacity reduction typically achieved from voluntary actions taken by customers to reduce costs or benefit the environment through education, communication and/or public pleas.
As technical support for the IRP, a third-party analysis is conducted to estimate the magnitude, timing and cost of alternative energy efficiency and peak management options.6 The main focus of the study has been on resources with sufficient reliability characteristics that are anticipated to be technically feasible and assumed achievable during the IRP’s 20-year planning horizon. The estimated achievable energy efficiency potential identified in the 2011 study for California was 26 average megawatts or 20 percent of retail sales.7 By definition this was the energy efficiency potential that may be achievable and cost effective to acquire during the 20-year planning horizon.
6www.pacificorp.com/content/dam/pacificorp/doc/Energy_Sources/Demand_Side_Management/DSM_VolumeI_2011_Potential Study.pdf 7www.pacificorp.com/content/dam/pacificorp/doc/Energy_Sources/Demand_Side_Management/DSM_VolumeI_2011_Potential Study.pdf. Page 49
Pacific Power California Report Regulatory Activities
Page 11 of 29
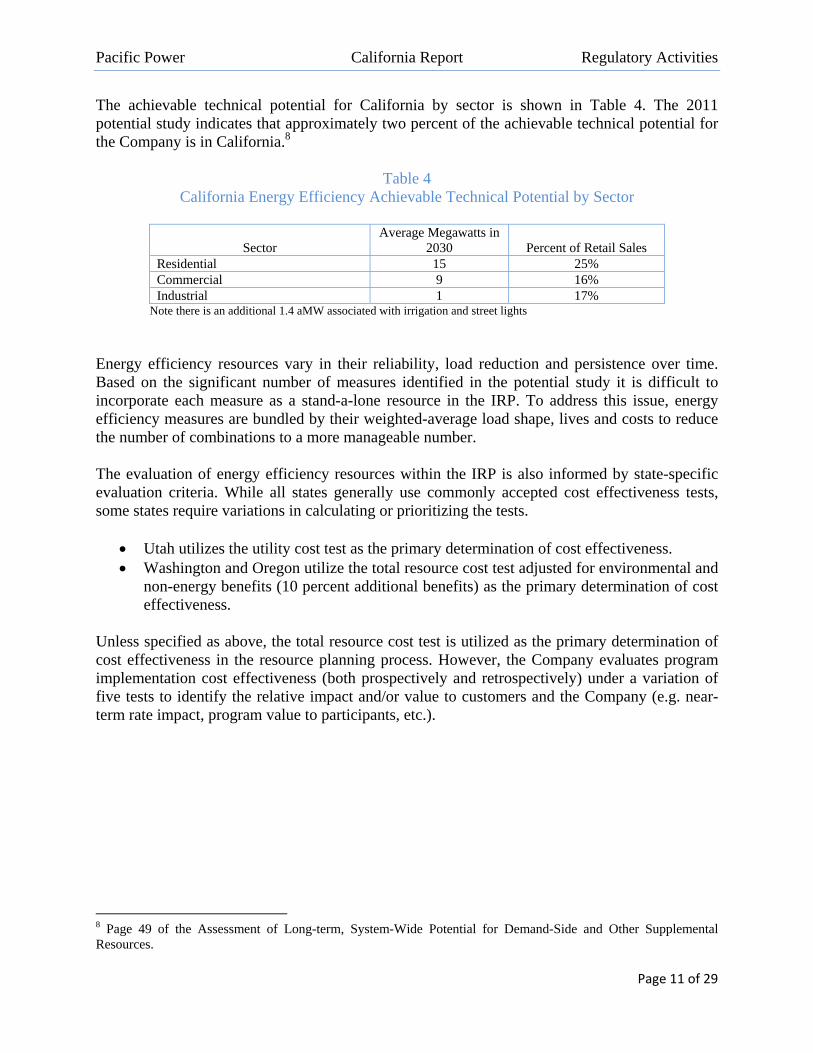
The achievable technical potential for California by sector is shown in Table 4. The 2011 potential study indicates that approximately two percent of the achievable technical potential for the Company is in California.8
Table 4 California Energy Efficiency Achievable Technical Potential by Sector
Sector Average Megawatts in
2030 Percent of Retail Sales Residential 15 25% Commercial 9 16% Industrial 1 17%
Note there is an additional 1.4 aMW associated with irrigation and street lights
Energy efficiency resources vary in their reliability, load reduction and persistence over time. Based on the significant number of measures identified in the potential study it is difficult to incorporate each measure as a stand-a-lone resource in the IRP. To address this issue, energy efficiency measures are bundled by their weighted-average load shape, lives and costs to reduce the number of combinations to a more manageable number. The evaluation of energy efficiency resources within the IRP is also informed by state-specific evaluation criteria. While all states generally use commonly accepted cost effectiveness tests, some states require variations in calculating or prioritizing the tests.
Utah utilizes the utility cost test as the primary determination of cost effectiveness. Washington and Oregon utilize the total resource cost test adjusted for environmental and
non-energy benefits (10 percent additional benefits) as the primary determination of cost effectiveness.
Unless specified as above, the total resource cost test is utilized as the primary determination of cost effectiveness in the resource planning process. However, the Company evaluates program implementation cost effectiveness (both prospectively and retrospectively) under a variation of five tests to identify the relative impact and/or value to customers and the Company (e.g. near-term rate impact, program value to participants, etc.).
8 Page 49 of the Assessment of Long-term, System-Wide Potential for Demand-Side and Other Supplemental Resources.
Pacific Power California Report Regulatory Activities
Page 12 of 29
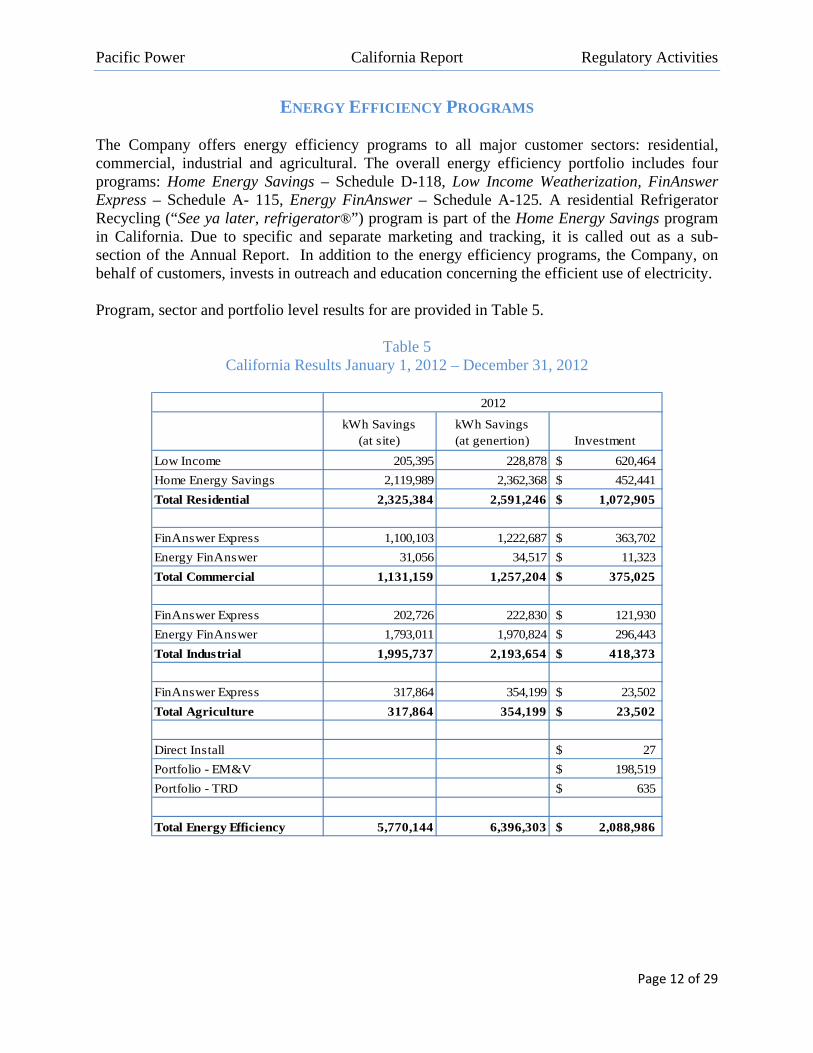
ENERGY EFFICIENCY PROGRAMS The Company offers energy efficiency programs to all major customer sectors: residential, commercial, industrial and agricultural. The overall energy efficiency portfolio includes four programs: Home Energy Savings – Schedule D-118, Low Income Weatherization, FinAnswer Express – Schedule A- 115, Energy FinAnswer – Schedule A-125. A residential Refrigerator Recycling (“See ya later, refrigerator®”) program is part of the Home Energy Savings program in California. Due to specific and separate marketing and tracking, it is called out as a sub-section of the Annual Report. In addition to the energy efficiency programs, the Company, on behalf of customers, invests in outreach and education concerning the efficient use of electricity. Program, sector and portfolio level results for are provided in Table 5.
Table 5
California Results January 1, 2012 – December 31, 2012
kWh Savings (at site)
kWh Savings (at genertion) Investment
Low Income 205,395 228,878 620,464$
Home Energy Savings 2,119,989 2,362,368 452,441$
Total Residential 2,325,384 2,591,246 1,072,905$
FinAnswer Express 1,100,103 1,222,687 363,702$
Energy FinAnswer 31,056 34,517 11,323$
Total Commercial 1,131,159 1,257,204 375,025$
FinAnswer Express 202,726 222,830 121,930$
Energy FinAnswer 1,793,011 1,970,824 296,443$
Total Industrial 1,995,737 2,193,654 418,373$
FinAnswer Express 317,864 354,199 23,502$
Total Agriculture 317,864 354,199 23,502$
Direct Install 27$
Portfolio - EM&V 198,519$
Portfolio - TRD 635$
Total Energy Efficiency 5,770,144 6,396,303 2,088,986$
2012
Pacific Power California Report Residential Programs
Page 13 of 29
RESIDENTIAL PROGRAMS The residential energy efficiency portfolio is comprised of two programs, Home Energy Savings and Low Income Weatherization.
Home Energy Savings
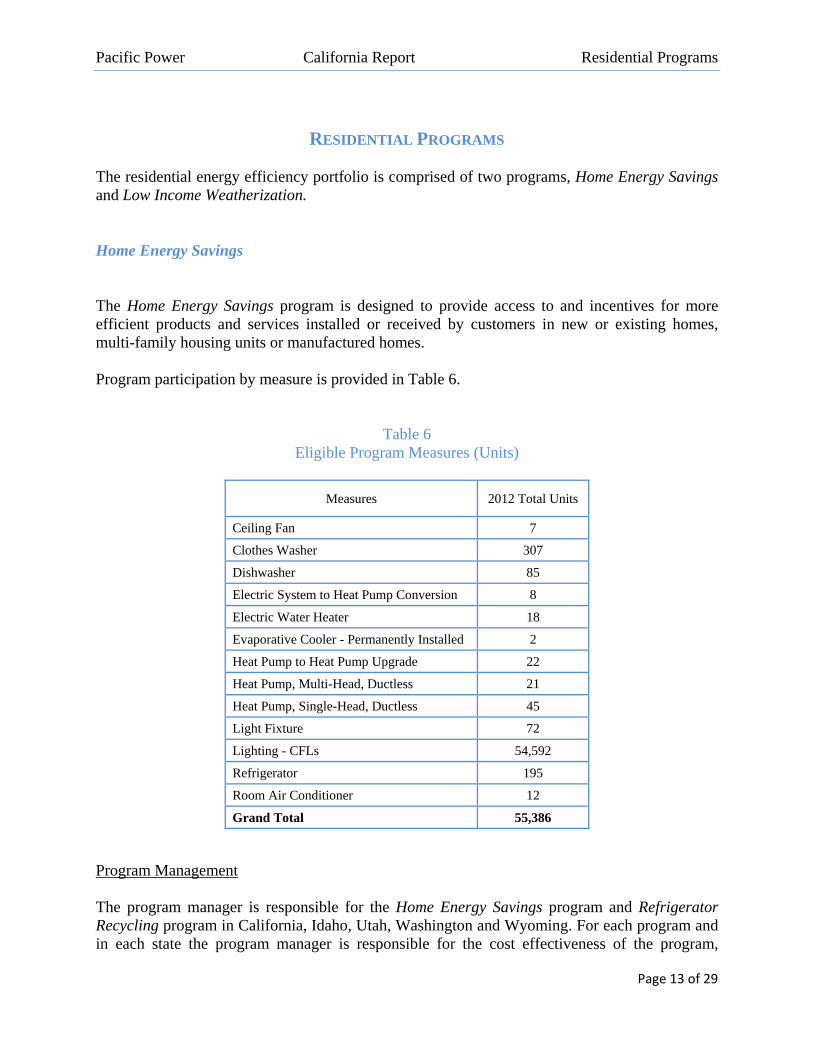
The Home Energy Savings program is designed to provide access to and incentives for more efficient products and services installed or received by customers in new or existing homes, multi-family housing units or manufactured homes. Program participation by measure is provided in Table 6.
Table 6 Eligible Program Measures (Units)
Measures 2012 Total Units
Ceiling Fan 7
Clothes Washer 307
Dishwasher 85
Electric System to Heat Pump Conversion 8
Electric Water Heater 18
Evaporative Cooler - Permanently Installed 2
Heat Pump to Heat Pump Upgrade 22
Heat Pump, Multi-Head, Ductless 21
Heat Pump, Single-Head, Ductless 45
Light Fixture 72
Lighting - CFLs 54,592
Refrigerator 195
Room Air Conditioner 12
Grand Total 55,386
Program Management The program manager is responsible for the Home Energy Savings program and Refrigerator Recycling program in California, Idaho, Utah, Washington and Wyoming. For each program and in each state the program manager is responsible for the cost effectiveness of the program,
Pacific Power California Report Residential Programs
Page 14 of 29
identifying and contracting with the program administrator through a competitive bid process, establishing and monitoring program performance and compliance, and recommending changes in the terms and conditions set out in the tariff.
Program Administration
The Home Energy Savings program is administered by Portland Energy Conservation, Inc. (“PECI”). PECI was incorporated by the City of Portland, Oregon in 1979 to carry out private sector aspects of the Portland Energy Conservation Policy. In 1984 the Company was spun-off from the City of Portland, becoming a private, non-profit corporation. PECI has been designing and implementing energy efficiency programs since 1990.
PECI is responsible for the following:
Retailer and trade ally engagement - PECI identifies, recruits, supports and assists retailers to increase the sale of energy efficient lighting, appliances and electronics. PECI enters into promotion agreements with each participating lighting manufacturer and retailer for the promotion of discounted compact fluorescent lights (“CFLs”). The agreements include specific retail locations, lighting products receiving incentives and not-to-exceed annual budgets. Heating, ventilation and air conditioning (“HVAC”) contractors engaged with the program are provided program materials, training and receive regular updates.
Inspections – PECI recruits and hires inspectors to verify on an on-going basis the installation of measures. A summary of the inspection process is included in Appendix 1 to this report.
Incentive processing and call-center operations – PECI receives all applications for incentives, determines whether the applications are completed, works directly with customers when information is incorrect and/or missing from the application and processes the application for payment.
Program specific customer communication and outreach – A summary of the communication and outreach conducted by PECI on behalf of the Company is outlined in the Communication, Outreach and Education section below.
Infrastructure
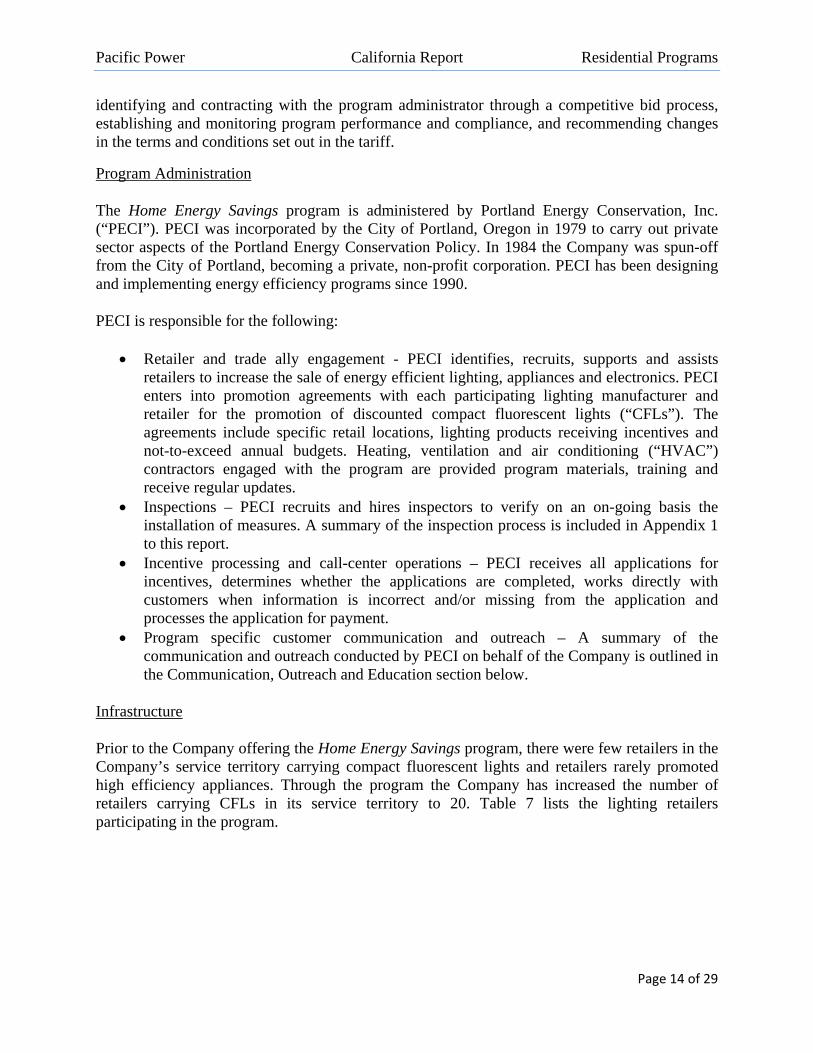
Prior to the Company offering the Home Energy Savings program, there were few retailers in the Company’s service territory carrying compact fluorescent lights and retailers rarely promoted high efficiency appliances. Through the program the Company has increased the number of retailers carrying CFLs in its service territory to 20. Table 7 lists the lighting retailers participating in the program.
Pacific Power California Report Residential Programs
Page 15 of 29
Table 79 Retail Stores – Compact Fluorescent Lights
Retailer City
Ace Hardware Crescent City
Ace Hardware Yreka
Ace Hardware Mount Shasta
Eller's Fort Dick Market Crescent City
Four Seasons Supply Center Alturas
Home Depot Crescent City
Luke's Yreka Drug Yreka
Platt Electric Supply Eureka
Platt Electric Supply Redding
True Value Hardware Crescent City
True Value Hardware Dorris
True Value Hardware Dunsmuir
True Value Hardware Weed
True Value Hardware Yreka
True Value Hardware Alturas
Walgreens Crescent City
Walmart Crescent City
Walmart Yreka
Weed Building Supply Mount Shasta
Weed Building Supply Weed
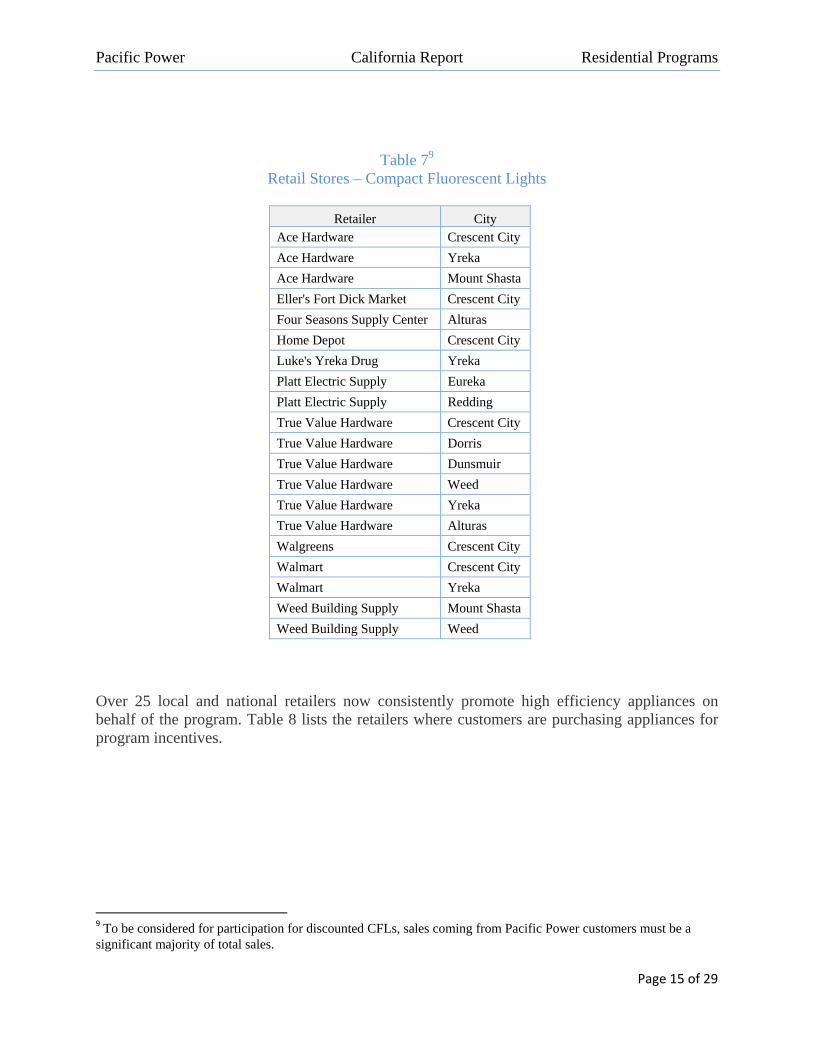
Over 25 local and national retailers now consistently promote high efficiency appliances on behalf of the program. Table 8 lists the retailers where customers are purchasing appliances for program incentives.
9 To be considered for participation for discounted CFLs, sales coming from Pacific Power customers must be a significant majority of total sales.
Pacific Power California Report Residential Programs
Page 16 of 29
Table 8 Retail Stores – Appliances
Retailer City
Cei
ling
Fan
Clo
thes
Was
her
Dis
hwas
her
Ele
ctri
c W
ater
Hea
ter
Eva
pora
tive
Coo
ler
Fix
ture
Ref
rige
rato
r
Roo
m A
ir C
ondi
tione
r
A & M Pump and Plumbing Alturas
Airport Home Appliance Hayward
ALCON Lighting Los Angeles
Best Buy #838 Redding
Best Buy #871 San Marcos
Biggins Lighting & Electric Supply, Inc. Redding
Black's Appliances and Video Yreka
Carmona's Appliance Center Redding
Crescent City Del Norte Plumbing Co Crescent City
Edgewood Weed
G & G Hardware Yreka
Home Depot #6682 Redding
Home Depot #8524 Crescent City
Lalightingstore.com Los Angeles
LGE USA Fontana
Lowe's of Redding Redding
Meek's Lumber & Hardware Yreka
Newegg.com Whittier
Ramshaw's Ace Hardware Mount Shasta
Ron's Furniture and Appliance Mount Shasta
Sears #2338 Redding
Sears #3998 Yreka
Sears of Sacramento Sacramento
Sun Frost Arcata
T.W. Smith Co. Sacramento
Thrifty Supply Company Eureka
Warehouse Discount Center (Internet Division) Moorpark
Weed Rental Center Weed
Pacific Power California Report Residential Programs
Page 17 of 29
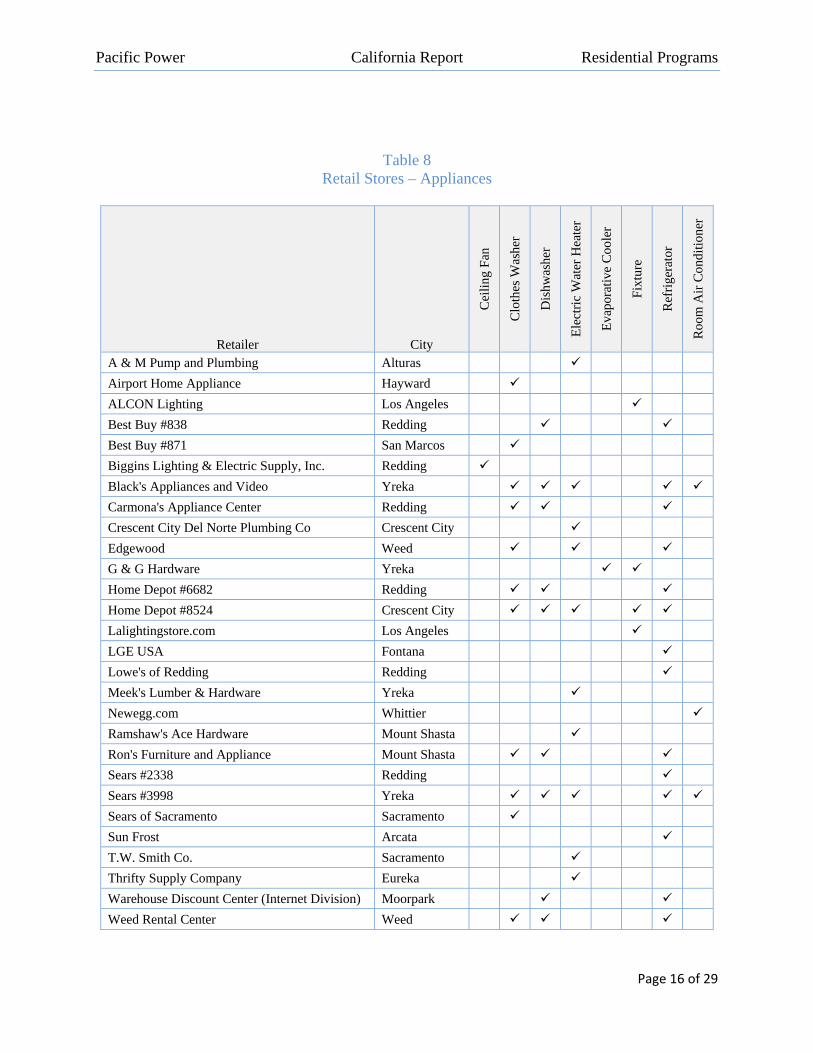
Table 9 lists the HVAC contractors participating in the program.
Table 9 HVAC Contractors
Contractor Name City
Cen
tral
Air
Con
diti
oner
(C
AC
)
CA
C T
une-
up
Duc
tless
HP
(S
ingl
e an
d M
ulti-
head
)
Hea
t Pum
p (H
P) U
pgra
de
HP
Con
vers
ion
HP
Tun
e-up
American Air Redding
Chimney Kraft Crescent City
Downey Heating and Cooling Fort Jones
Dressler Heating and AC Yreka Franks Heating and Refrigeration Crescent City
Harbor View Windows, Heating, and Air, Inc. Crescent City
Metal Masters Yreka
Meyer and Son’s Heating Plumbing and AC Inc. Dunsmuir
Mike Brown Heating and AC Yreka
Mountain Air Heating & Cooling Inc. Yreka
Orca Heating and Refrigeration Inc. Crescent City
Phil Carpenter AC & Heating Redding
Ray-Mac Mechanical Mt. Shasta SVM Plumbing, Heating & Air Yreka
United Mechanical Contractors Yreka
Evaluation
In February 2012, a process and impact evaluation was completed by a third party evaluator. The impact evaluation provided data on the gross realized savings and the net-to-gross (“NTG”) ratio10 (“NTG”). The process evaluation investigated participant satisfaction, implementation and delivery processes, marketing methods and quality assurance. The results of the evaluation and the Company’s response to recommendations are included in Appendix 2 to this report.
10 NTG is a factor representing net program savings divided by gross program savings that is applied to gross program impacts. This ratio is most often calculated as NTG = 1 – freeridership rate + spillover rate.
Pacific Power California Report Residential Programs
Page 18 of 29
Refrigerator Recycling
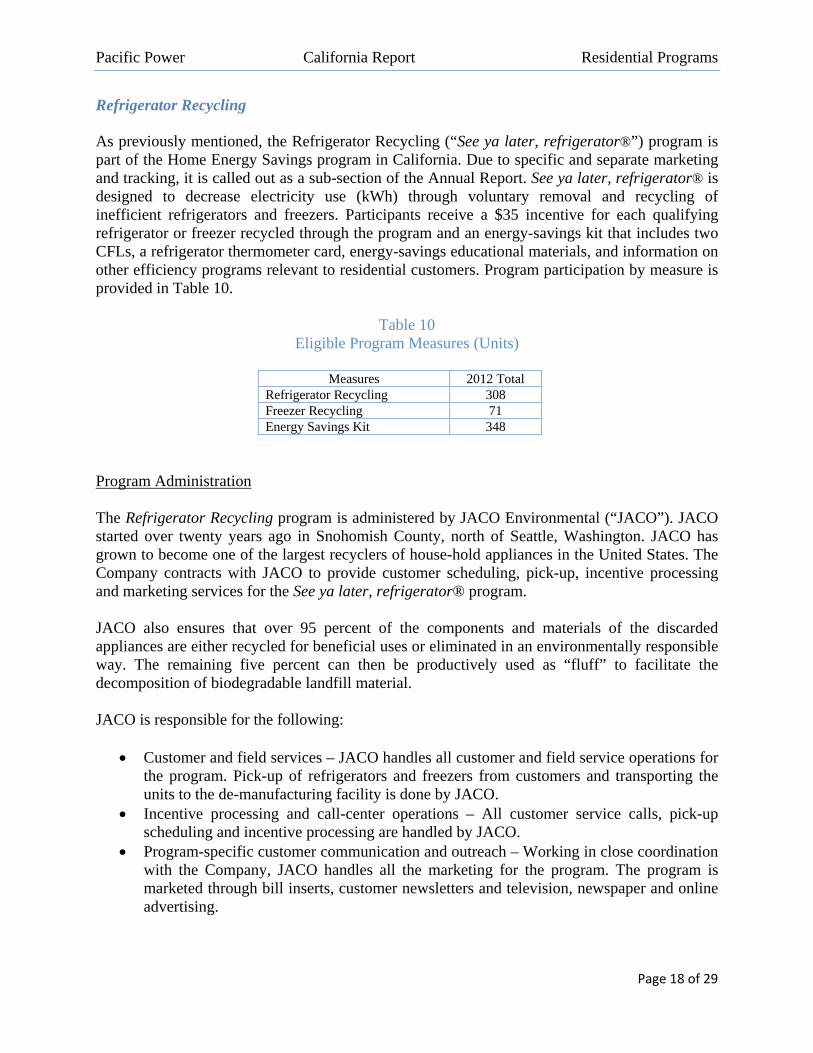
As previously mentioned, the Refrigerator Recycling (“See ya later, refrigerator®”) program is part of the Home Energy Savings program in California. Due to specific and separate marketing and tracking, it is called out as a sub-section of the Annual Report. See ya later, refrigerator® is designed to decrease electricity use (kWh) through voluntary removal and recycling of inefficient refrigerators and freezers. Participants receive a $35 incentive for each qualifying refrigerator or freezer recycled through the program and an energy-savings kit that includes two CFLs, a refrigerator thermometer card, energy-savings educational materials, and information on other efficiency programs relevant to residential customers. Program participation by measure is provided in Table 10.
Table 10 Eligible Program Measures (Units)
Measures 2012 Total
Refrigerator Recycling 308 Freezer Recycling 71 Energy Savings Kit 348
Program Administration The Refrigerator Recycling program is administered by JACO Environmental (“JACO”). JACO started over twenty years ago in Snohomish County, north of Seattle, Washington. JACO has grown to become one of the largest recyclers of house-hold appliances in the United States. The Company contracts with JACO to provide customer scheduling, pick-up, incentive processing and marketing services for the See ya later, refrigerator® program. JACO also ensures that over 95 percent of the components and materials of the discarded appliances are either recycled for beneficial uses or eliminated in an environmentally responsible way. The remaining five percent can then be productively used as “fluff” to facilitate the decomposition of biodegradable landfill material. JACO is responsible for the following:
Customer and field services – JACO handles all customer and field service operations for the program. Pick-up of refrigerators and freezers from customers and transporting the units to the de-manufacturing facility is done by JACO.
Incentive processing and call-center operations – All customer service calls, pick-up scheduling and incentive processing are handled by JACO.
Program-specific customer communication and outreach – Working in close coordination with the Company, JACO handles all the marketing for the program. The program is marketed through bill inserts, customer newsletters and television, newspaper and online advertising.
Pacific Power California Report Residential Programs
Page 19 of 29
Separate third-party contractors are employed to inspect and ensure the quality of JACO’s performance. The summary of the inspection process is included in Appendix 1 to this report.
Infrastructure
No refrigerator or freezer recycling services were available in Company’s service territory in the state prior to the Company’s recycling program. The Company offers the service to its customers in its California service territory.
Low Income Weatherization
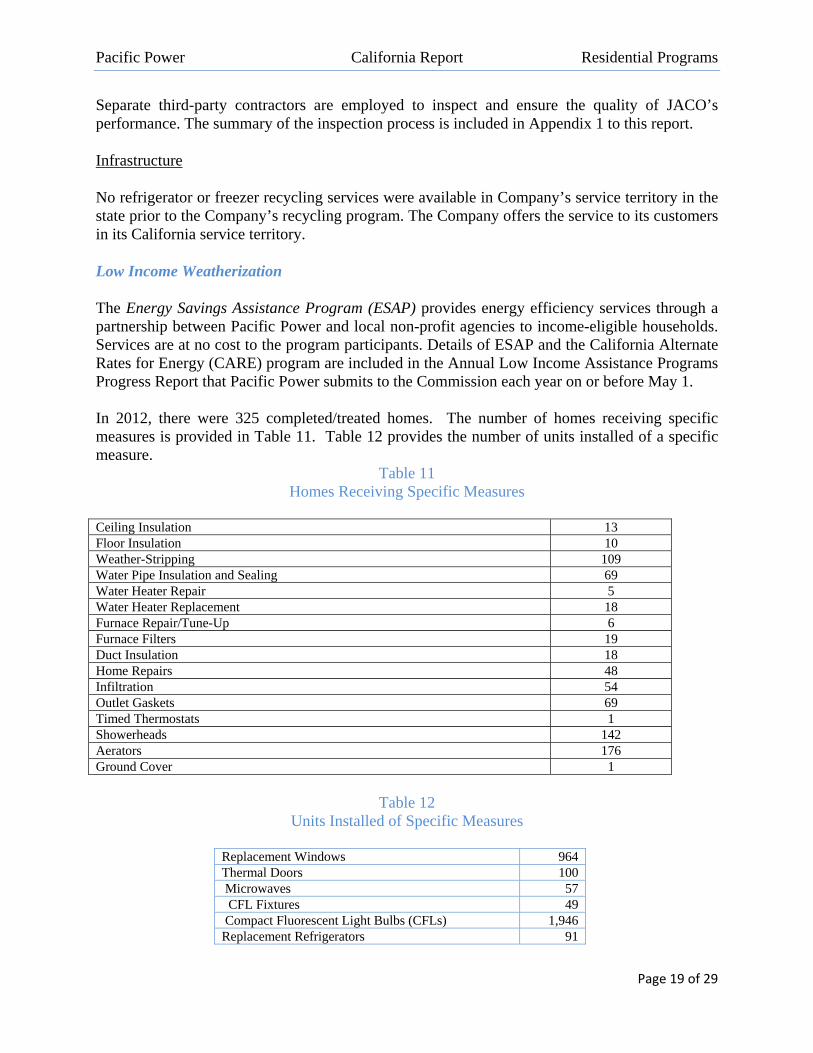
The Energy Savings Assistance Program (ESAP) provides energy efficiency services through a partnership between Pacific Power and local non-profit agencies to income-eligible households. Services are at no cost to the program participants. Details of ESAP and the California Alternate Rates for Energy (CARE) program are included in the Annual Low Income Assistance Programs Progress Report that Pacific Power submits to the Commission each year on or before May 1. In 2012, there were 325 completed/treated homes. The number of homes receiving specific measures is provided in Table 11. Table 12 provides the number of units installed of a specific measure.
Table 11 Homes Receiving Specific Measures
Ceiling Insulation 13 Floor Insulation 10 Weather-Stripping 109 Water Pipe Insulation and Sealing 69 Water Heater Repair 5 Water Heater Replacement 18 Furnace Repair/Tune-Up 6 Furnace Filters 19 Duct Insulation 18 Home Repairs 48 Infiltration 54 Outlet Gaskets 69 Timed Thermostats 1 Showerheads 142 Aerators 176 Ground Cover 1
Table 12 Units Installed of Specific Measures
Replacement Windows 964 Thermal Doors 100 Microwaves 57 CFL Fixtures 49 Compact Fluorescent Light Bulbs (CFLs) 1,946 Replacement Refrigerators 91
Pacific Power California Report Residential Programs
Page 20 of 29
Program Management The program manager is responsible for the Low Income Weatherization program in California, Idaho, Utah, Washington and Wyoming, energy assistance programs in California, Idaho, Oregon, Utah, Washington and Wyoming and bill discount programs in California, Utah and Washington. The program manager is responsible for the cost effectiveness of the weatherization program in each state, partnerships and agreements in place with local agencies that serve income eligible households, establishing and monitoring program performance and compliance, and recommending changes in the terms and conditions set out in the agency contracts and state specific tariffs.
Program Administration
Pacific Power currently has contracts in place with Great Northern Corporation (“GNC”) and Redwood Community Action Agency (“RCAA”) to provide services through the ESAP program. These two agencies subcontract with the California Department of Community Services and Development (“CSD”) to provide low income weatherization services throughout Del Norte, Modoc and Siskiyou Counties with federal and state grants. Company funding of 50 percent of the cost of approved measures is leveraged by the agencies with the funding allocated by CSD. When the government funding is depleted, Pacific Power will cover 100 percent of related costs.
By contract with the Company, GNC and RCAA are responsible for the following:
Income Verification – Agencies determine participants are income eligible based on CSD guidelines. Household’s interested in obtaining weatherization services apply through the agencies. The current income guidelines are included in Appendix 3.
Energy Audit – Agencies use a U.S. Department of Energy approved audit tool to determine the cost effective measures to install in the participant’s homes (audit results must indicate a savings to investment ratio of 1.0 or greater).
Installation of Measures – Agencies install the energy efficiency measures. Post Inspections – Agencies inspect 100 percent of completed homes. A sample of 5 -10
percent are inspected by a Pacific Power inspector. See Appendix 1 for verification summary.
Billing Notification - Agencies are required to submit a billing to Company within 45 days after job completion. A homeowner agreement and invoice form indicating the measures installed and associated cost is submitted on each completed home. A copy of this form is included in Appendix 3.
Pacific Power California Report Commercial and Industrial Programs
Page 21 of 29
COMMERCIAL AND INDUSTRIAL PROGRAMS The commercial and industrial energy efficiency portfolio is comprised of two programs, FinAnswer Express and Energy FinAnswer.
FinAnswer Express
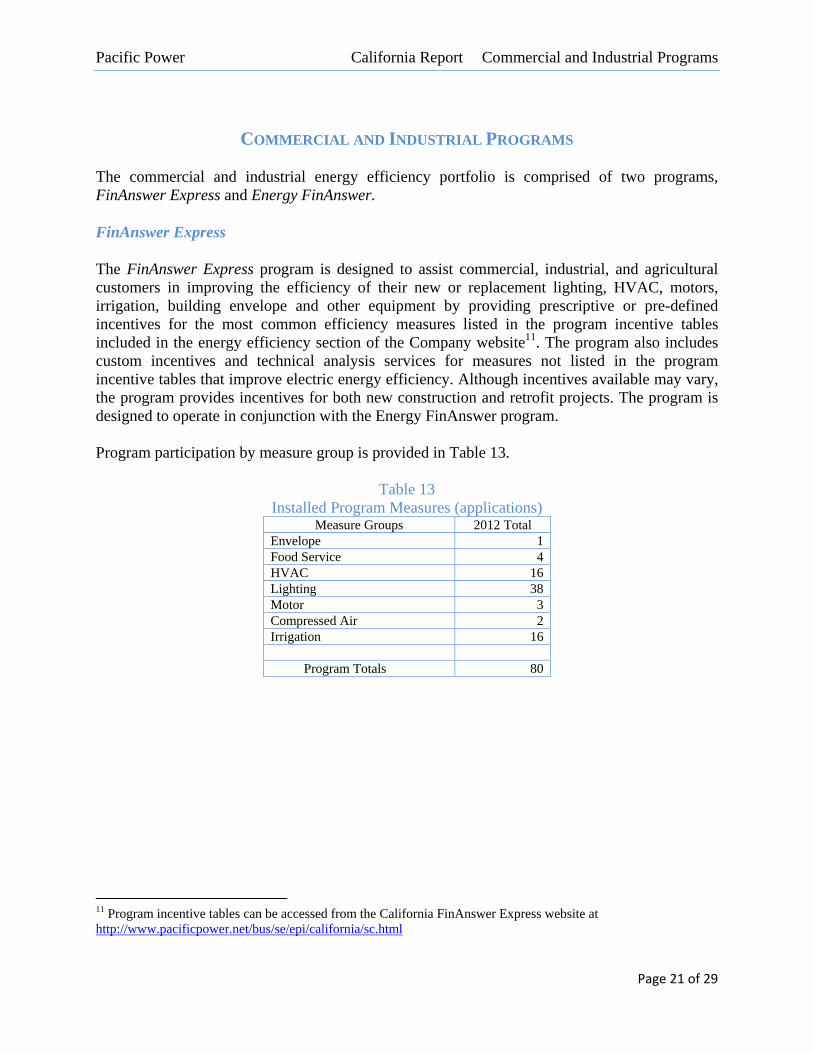
The FinAnswer Express program is designed to assist commercial, industrial, and agricultural customers in improving the efficiency of their new or replacement lighting, HVAC, motors, irrigation, building envelope and other equipment by providing prescriptive or pre-defined incentives for the most common efficiency measures listed in the program incentive tables included in the energy efficiency section of the Company website11. The program also includes custom incentives and technical analysis services for measures not listed in the program incentive tables that improve electric energy efficiency. Although incentives available may vary, the program provides incentives for both new construction and retrofit projects. The program is designed to operate in conjunction with the Energy FinAnswer program. Program participation by measure group is provided in Table 13.
Table 13 Installed Program Measures (applications)
Measure Groups 2012 Total Envelope 1 Food Service 4 HVAC 16 Lighting 38 Motor 3 Compressed Air 2 Irrigation 16 Program Totals 80
11 Program incentive tables can be accessed from the California FinAnswer Express website at http://www.pacificpower.net/bus/se/epi/california/sc.html
Pacific Power California Report Commercial and Industrial Programs
Page 22 of 29
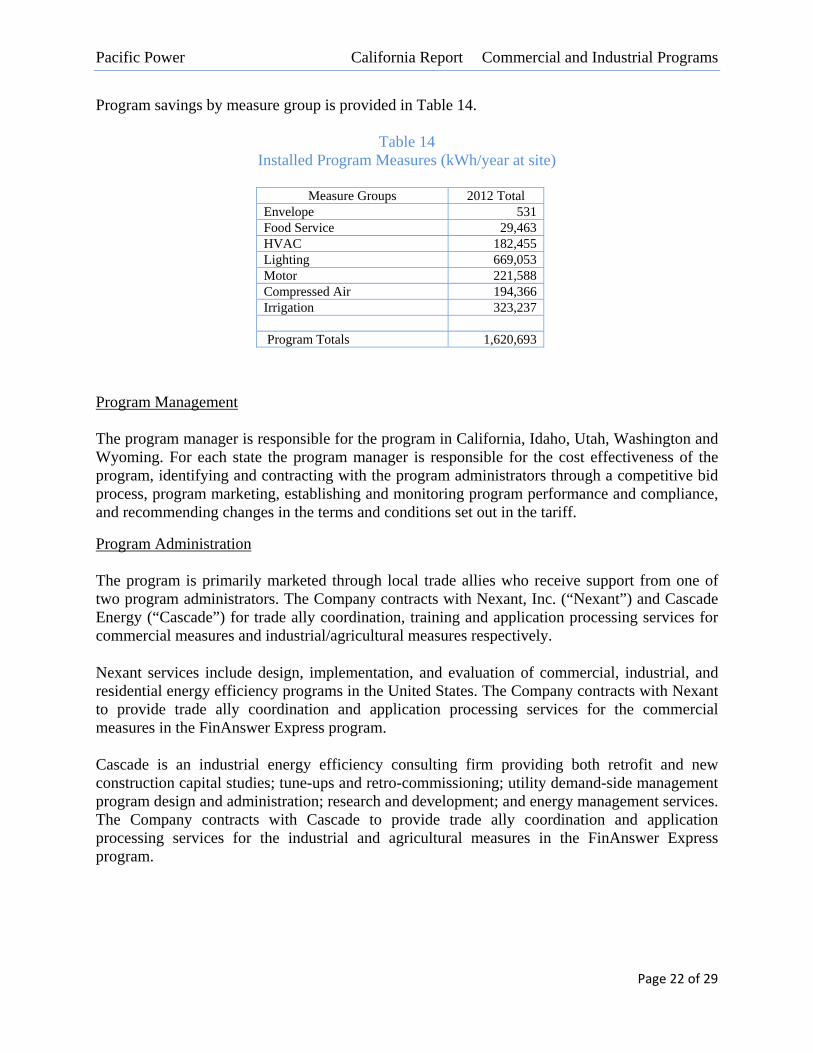
Program savings by measure group is provided in Table 14.
Table 14 Installed Program Measures (kWh/year at site)
Measure Groups 2012 Total
Envelope 531 Food Service 29,463 HVAC 182,455 Lighting 669,053 Motor 221,588 Compressed Air 194,366 Irrigation 323,237 Program Totals 1,620,693
Program Management The program manager is responsible for the program in California, Idaho, Utah, Washington and Wyoming. For each state the program manager is responsible for the cost effectiveness of the program, identifying and contracting with the program administrators through a competitive bid process, program marketing, establishing and monitoring program performance and compliance, and recommending changes in the terms and conditions set out in the tariff.
Program Administration The program is primarily marketed through local trade allies who receive support from one of two program administrators. The Company contracts with Nexant, Inc. (“Nexant”) and Cascade Energy (“Cascade”) for trade ally coordination, training and application processing services for commercial measures and industrial/agricultural measures respectively.
Nexant services include design, implementation, and evaluation of commercial, industrial, and residential energy efficiency programs in the United States. The Company contracts with Nexant to provide trade ally coordination and application processing services for the commercial measures in the FinAnswer Express program.
Cascade is an industrial energy efficiency consulting firm providing both retrofit and new construction capital studies; tune-ups and retro-commissioning; utility demand-side management program design and administration; research and development; and energy management services. The Company contracts with Cascade to provide trade ally coordination and application processing services for the industrial and agricultural measures in the FinAnswer Express program.
Pacific Power California Report Commercial and Industrial Programs
Page 23 of 29
Nexant and Cascade are responsible for the following:
Trade ally engagement – Nexant and Cascade identify, recruit, train, support and assist trade allies to increase sales and installation of energy efficient equipment at qualifying business customer facilities.
Incentive processing and administrative support – Nexant and Cascade handle incoming inquiries as assigned, process FinAnswer Express incentive applications, develop and maintain simplified analysis tools and provide program design services, evaluation and regulatory support upon request.
Inspections – Nexant and Cascade verify on an on-going basis the installation of measures. Summary of the inspection process is in Appendix 1 to this report.
In addition, the Company’s project managers manage FinAnswer Express projects and provide customers with program services and incentives using the energy engineering consultants described further in the Energy FinAnswer program section.
Infrastructure
To help increase and improve the supplier and installation contractor infrastructure for energy-efficient equipment and services, the Company established and developed trade ally networks for lighting, HVAC, motors and irrigation. This work includes identifying and recruiting trade allies, providing program and technical training and providing sales support on an ongoing basis. The current lists of the trade allies who have applied and been approved as participating vendors are posted on the Company website and is included as Appendix 4 to this report.
Customers are not required to select a vendor from these lists to receive an incentive.
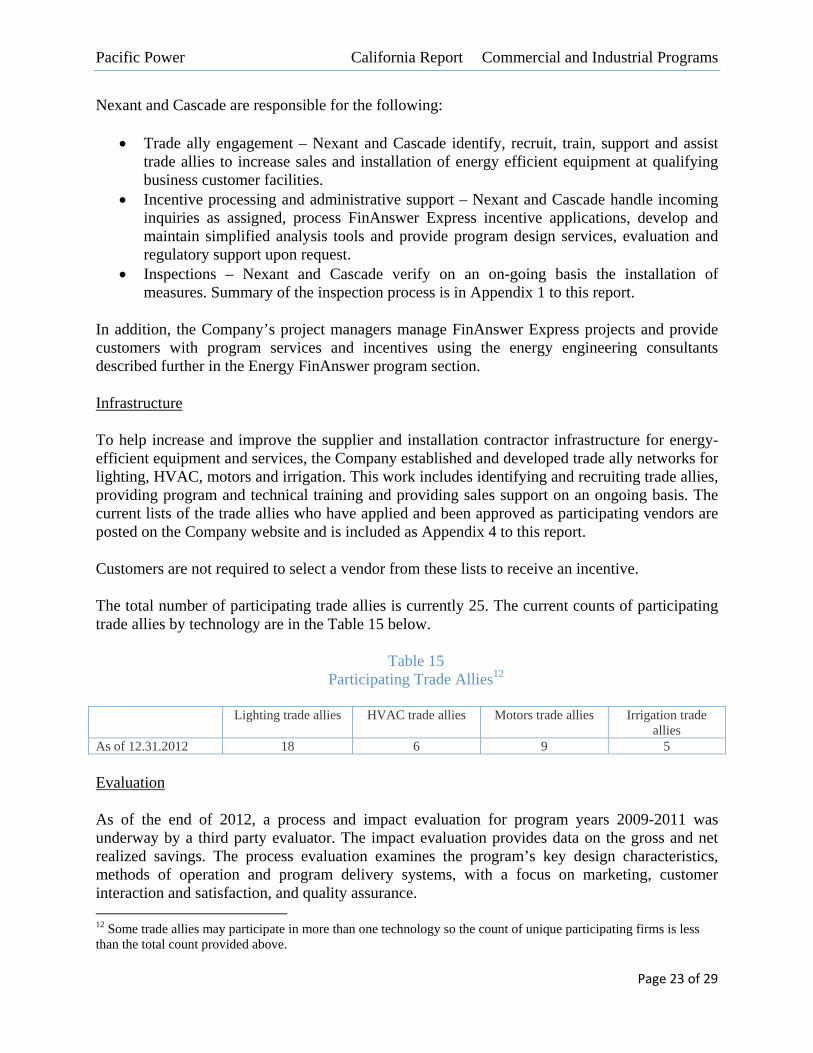
The total number of participating trade allies is currently 25. The current counts of participating trade allies by technology are in the Table 15 below.
Table 15 Participating Trade Allies12
Lighting trade allies HVAC trade allies Motors trade allies Irrigation trade
allies As of 12.31.2012 18 6 9 5
Evaluation
As of the end of 2012, a process and impact evaluation for program years 2009-2011 was underway by a third party evaluator. The impact evaluation provides data on the gross and net realized savings. The process evaluation examines the program’s key design characteristics, methods of operation and program delivery systems, with a focus on marketing, customer interaction and satisfaction, and quality assurance. 12 Some trade allies may participate in more than one technology so the count of unique participating firms is less than the total count provided above.
Pacific Power California Report Commercial and Industrial Programs
Page 24 of 29
A combination of in-depth project file reviews, interviews with facility staff, and on-site measurement and verification activities involving spot measurements and end-use metering of incented equipment informed the evaluated savings estimates for each project sampled during the evaluation.
Energy FinAnswer
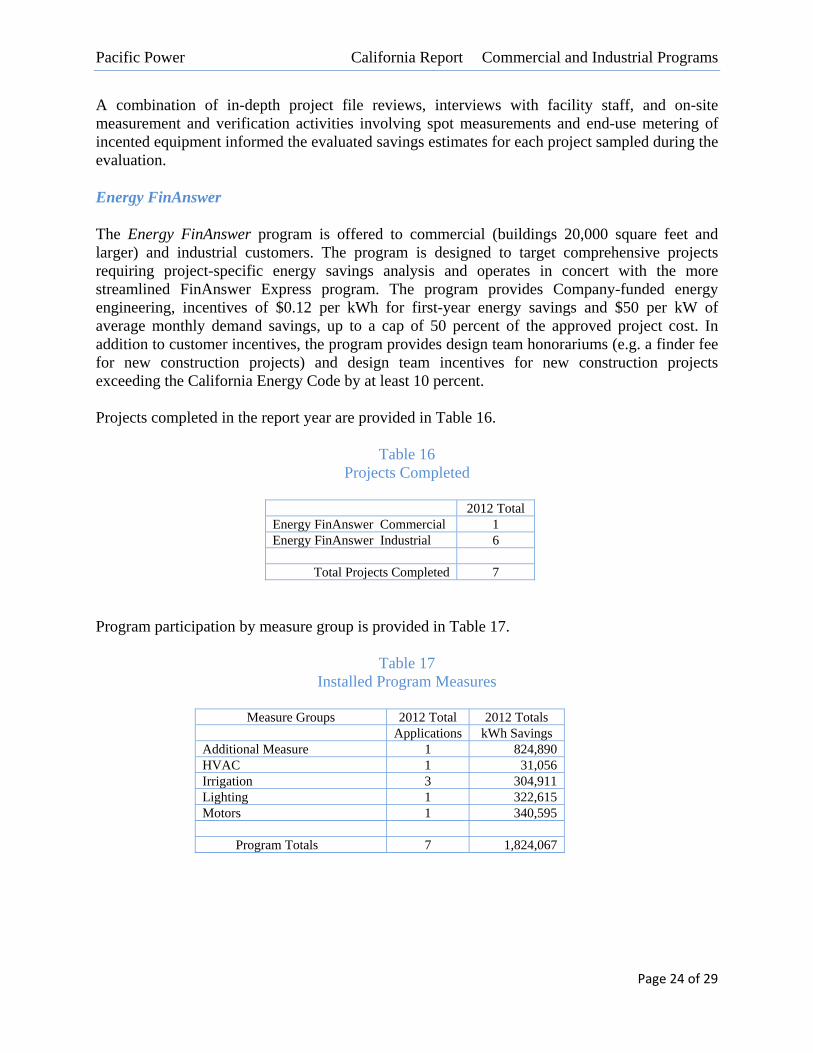
The Energy FinAnswer program is offered to commercial (buildings 20,000 square feet and larger) and industrial customers. The program is designed to target comprehensive projects requiring project-specific energy savings analysis and operates in concert with the more streamlined FinAnswer Express program. The program provides Company-funded energy engineering, incentives of $0.12 per kWh for first-year energy savings and $50 per kW of average monthly demand savings, up to a cap of 50 percent of the approved project cost. In addition to customer incentives, the program provides design team honorariums (e.g. a finder fee for new construction projects) and design team incentives for new construction projects exceeding the California Energy Code by at least 10 percent. Projects completed in the report year are provided in Table 16.
Table 16
Projects Completed
2012 Total Energy FinAnswer Commercial 1 Energy FinAnswer Industrial 6
Total Projects Completed 7 Program participation by measure group is provided in Table 17.
Table 17
Installed Program Measures
Measure Groups 2012 Total 2012 Totals Applications kWh Savings
Additional Measure 1 824,890 HVAC 1 31,056 Irrigation 3 304,911 Lighting 1 322,615 Motors 1 340,595 Program Totals 7 1,824,067
Pacific Power California Report Commercial and Industrial Programs
Page 25 of 29
Program Management The program manager is responsible for the Energy FinAnswer program in California, Idaho, Utah, Washington and Wyoming. The Company employs four full-time project managers13 in support of the program manager.
Energy FinAnswer program is administered by the Company. Consequently, the program manager is responsible for the following:
Program cost effectiveness and performance Ensuring the program is operated in compliance with applicable tariffs and Company
guidelines including but not limited to qualification of customers Customer communication and outreach Monitoring code and standard changes Qualification of materials and equipment Engineering analysis of customer opportunities Quality control and assurance Customer service, including the delivery of services and incentive Verification of installation and savings14
Infrastructure
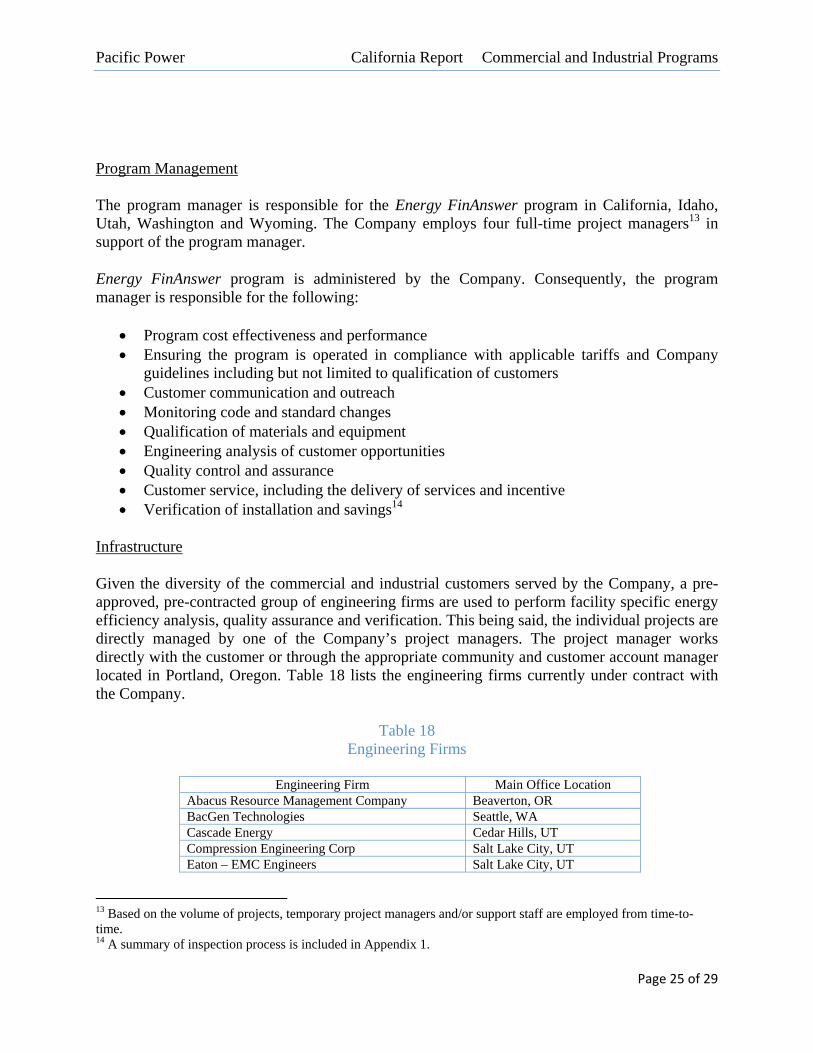
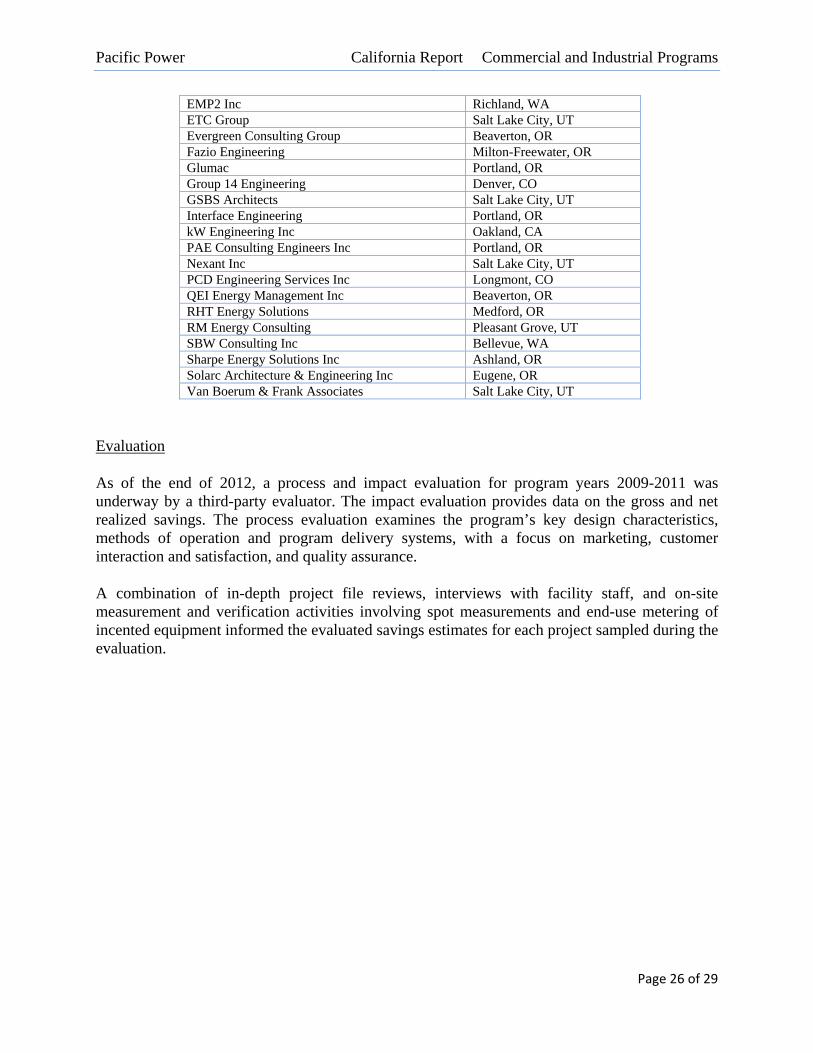
Given the diversity of the commercial and industrial customers served by the Company, a pre-approved, pre-contracted group of engineering firms are used to perform facility specific energy efficiency analysis, quality assurance and verification. This being said, the individual projects are directly managed by one of the Company’s project managers. The project manager works directly with the customer or through the appropriate community and customer account manager located in Portland, Oregon. Table 18 lists the engineering firms currently under contract with the Company.
Table 18 Engineering Firms
Engineering Firm Main Office Location
Abacus Resource Management Company Beaverton, OR BacGen Technologies Seattle, WA Cascade Energy Cedar Hills, UT Compression Engineering Corp Salt Lake City, UT Eaton – EMC Engineers Salt Lake City, UT
13 Based on the volume of projects, temporary project managers and/or support staff are employed from time-to-time. 14 A summary of inspection process is included in Appendix 1.
Pacific Power California Report Commercial and Industrial Programs
Page 26 of 29
EMP2 Inc Richland, WA ETC Group Salt Lake City, UT Evergreen Consulting Group Beaverton, OR Fazio Engineering Milton-Freewater, OR Glumac Portland, OR Group 14 Engineering Denver, CO GSBS Architects Salt Lake City, UT Interface Engineering Portland, OR kW Engineering Inc Oakland, CA PAE Consulting Engineers Inc Portland, OR Nexant Inc Salt Lake City, UT PCD Engineering Services Inc Longmont, CO QEI Energy Management Inc Beaverton, OR RHT Energy Solutions Medford, OR RM Energy Consulting Pleasant Grove, UT SBW Consulting Inc Bellevue, WA Sharpe Energy Solutions Inc Ashland, OR Solarc Architecture & Engineering Inc Eugene, OR Van Boerum & Frank Associates Salt Lake City, UT
Evaluation
As of the end of 2012, a process and impact evaluation for program years 2009-2011 was underway by a third-party evaluator. The impact evaluation provides data on the gross and net realized savings. The process evaluation examines the program’s key design characteristics, methods of operation and program delivery systems, with a focus on marketing, customer interaction and satisfaction, and quality assurance.
A combination of in-depth project file reviews, interviews with facility staff, and on-site measurement and verification activities involving spot measurements and end-use metering of incented equipment informed the evaluated savings estimates for each project sampled during the evaluation.
Pacific Power California Report Evaluations
Page 27 of 29
COMMUNICATIONS, OUTREACH AND EDUCATION
The Company utilizes earned media, customer communications, paid media and program-specific media in an effort to communicate the value of energy efficiency, provide information regarding low-cost, no-cost energy efficiency measures, and to educate customers on the availability of technical assistance, services and incentives. The overall goal is to engage customers in reducing their energy usage through behavioral changes as well as changes in equipment, appliances and structures. Customer Communications As part of the Company’s regular communications to its customers, newsletters across all customer classes promote energy efficiency initiatives and case studies on a regular basis. Inserts and outer envelopes featuring energy efficiency messages have also been used on a consistent basis. The Company also uses its website and social media, such as Twitter and Facebook to communicate and engage customers on DSM offers and incentives. Program Specific Communications Home Energy Savings Information on the Home Energy Savings program is communicated to customers, retailers and trade allies through a variety of channels. In January and February 2012, new heat pump collateral was developed and a retailer resource manual was distributed. Communications promoting online application processing were provided to retailers during the first part of the year as well. During the summer months, program communications focused on cooling measures. The cooling campaign included:
Room air conditioner point of purchase material Handout material for retailers and trade allies to use in their sales to customers Website features Online and print ads Bill insert
Results from the campaign indicate increased savings from cooling measures in 2012 compared to previous years.
Pacific Power California Report Evaluations
Page 28 of 29
A similar heating campaign was developed for the fall and winter, including: Website features Sales handout and outreach to trade allies Bill inserts Social media
Results from the campaign will be compiled after the heating season ends in 2013. In November 2012, the Company launched a “Black Friday” campaign to promote energy efficient equipment purchases during the holiday shopping season and encourage participation in the program. Refrigerator Recycling The Company promotes the See ya later, refrigerator® program through informational advertisements and other customer communications. In 2012, the program garnered 119,117 impressions. Breakdown of impressions by media type are shown in Table 19.
Table 19 See ya later, refrigerator® Program
Communications Channel 2012
Cable TV 14,577 Newspaper 104,540
In October 2012, new outreach materials were developed including point of purchase materials, magnets and website features. FinAnswer Express and Energy FinAnswer Customer communications and outreach in support of FinAnswer Express and Energy FinAnswer utilized print advertising throughout the reporting period. This was in addition to customer direct contact by Company project managers and corporate and community managers, articles in the Company newsletters and content on the Company website. During 2012 communications emphasized the change in federal lighting standards that took place July 14, 2012. This standard applies to manufacturers of general service fluorescent lamps. Customers were encouraged to retrofit their older linear fluorescent lighting before as well as after the standards change. The Company added a video to its website15 and retained a page16 on the website dedicated to this topic. In 2012, the program garnered 49,671 newspaper impressions.
15 www.pacificpower.net/casave 16 www.pacificpower.net/lightingstandards
Pacific Power California Report Evaluations
Page 29 of 29
EVALUATIONS Evaluations are performed by independent external evaluators to validate energy and demand savings derived from the Company’s energy efficiency programs. Industry best practices are adopted by the Company with regards to principles of operation, methodologies, evaluation methods, definitions of terms, and protocols including those outlined in the National Action Plan for Energy Efficiency (“NAPEE”) Program Impact Evaluation and the California Evaluation Framework guides. A component of the overall evaluation efforts is aimed at the reasonable verification of installations of energy efficient measures and associated documentation through review of documentation, surveys and/or ongoing onsite inspections.
Verification of the potential to achieve savings involves regular inspection and commissioning of equipment. The Company engages in programmatic verification activities, including inspections, quality assurance reviews, and tracking checks and balances as part of routine program implementation and may rely upon these practices in the verification of installation information for the purposes of savings verifications in advance of more formal impact evaluation results. A summary of the inspection process is included in Appendix 1.
Evaluation, measurement and verification (“EM&V”) tasks are segregated within the Company’s organization to ensure they are performed and managed by personnel who have a neutral interest in the benefits associated with anticipated savings. In June 2011, Pacific Power awarded multi-year contracts to evaluate the Company’s energy efficiency programs for all states. The contracts awarded were completed through a competitive bid process. The California Home Energy Savings program evaluation summary of recommendations is provided in Appendix 2. The evaluation report is provided in Appendix 2A
Appendix 1 California Measure Installation Verifications
Pacific Power
California Measure Installation Verifications
Low Income Weatherization
All projects All measures are qualified through US Department of Energy approved audit tool or priority list. 100 percent inspection by agency inspector of all homes treated, reconciling work completed and
quality (corrective action includes measure verification) prior to invoicing Company. State inspector follows with random inspections. Company hires independent inspector to inspect between 5-10 percent of homes treated (post
treatment and payment). Home Energy Savings Site inspections by Program Administrator staff for the following retrofit measures (>=5 percent)
Central air conditioner / heat pump tune-ups Site inspections of 100 percent by Program Administrator staff of all contractor installed measures in new homes such as insulation, windows, heating and cooling systems. No site inspections are conducted for the following measures. However all post-purchase incented measures undergo a quality assurance review prior to the issuance of the customer/dealer incentive and recording of savings (i.e. proof of purchase receipt review) and eligible equipment review. Additionally, customer account and customer address are checked to ensure the Company does not double pay for the same measure or double count measure savings.
Refrigerators Dishwasher Ceiling fans Light fixtures Clothes washers Water heaters Evaporative coolers Room air conditioners Central air conditioners Heat pump conversion / upgrade
Other measures CFLs – retail channel, manufacturer agreements and program administrator sales record reviews of
qualifying equipment. Invoicing and retail pricing is administered by program administrator. Refrigerator Recycling
Company hires an independent inspector to phone survey >=5 percent program participants and to site inspect >= 10 percent of program participants in order to verifying program participation, eligibility of equipment, that vendor pick-up procedures are followed (equipment is disabled at site, kits distributed, etc.) and to survey customer experience.
FinAnswer Express
For trade ally program administrated projects Lighting projects
100 percent post-site inspections by third party consultant of all projects with incentives over a specified dollar amount.
A percent of post-site inspections by program administrator of projects with incentives under a specified dollar amount.
Non-lighting projects
100 percent of applications with an incentive that exceeds a specified dollar amount will be inspected (via site inspection) by program administrator.
A minimum of a specified percent of remaining non-lighting applications will be inspected, either in person or via telephone interview, by program administrator.
For Company project manager delivered projects (lighting and non-lighting) Lighting and non-lighting
100 percent pre/post-installation site inspections by third party consulting engineering firms, invoice reconciled to inspection results.
Energy FinAnswer All projects
100 percent pre and/or post-site inspections by 3rd party engineering consultant, inspection is reconciled with project invoice for energy efficiency retrofit measures provided by customers. No pre-inspection for new construction.
Most projects have a post-installation commissioning requirement. All Programs
As part of the third-party program evaluations (two-year cycle) process, the Company is implementing semi-annual customer surveys to collect evaluation-relevant data more frequently to cure for memory loss and other detractors such as customers moving and data not be readily available at evaluation time). This will serve as a further check verifying customer participation and measures installed. Additional record reviews and site inspections (including metering/data logging) is conducted as part of the process and impact evaluations, a final verification of measure installations.
Appendix 2 California Program Evaluations
Pacific Power
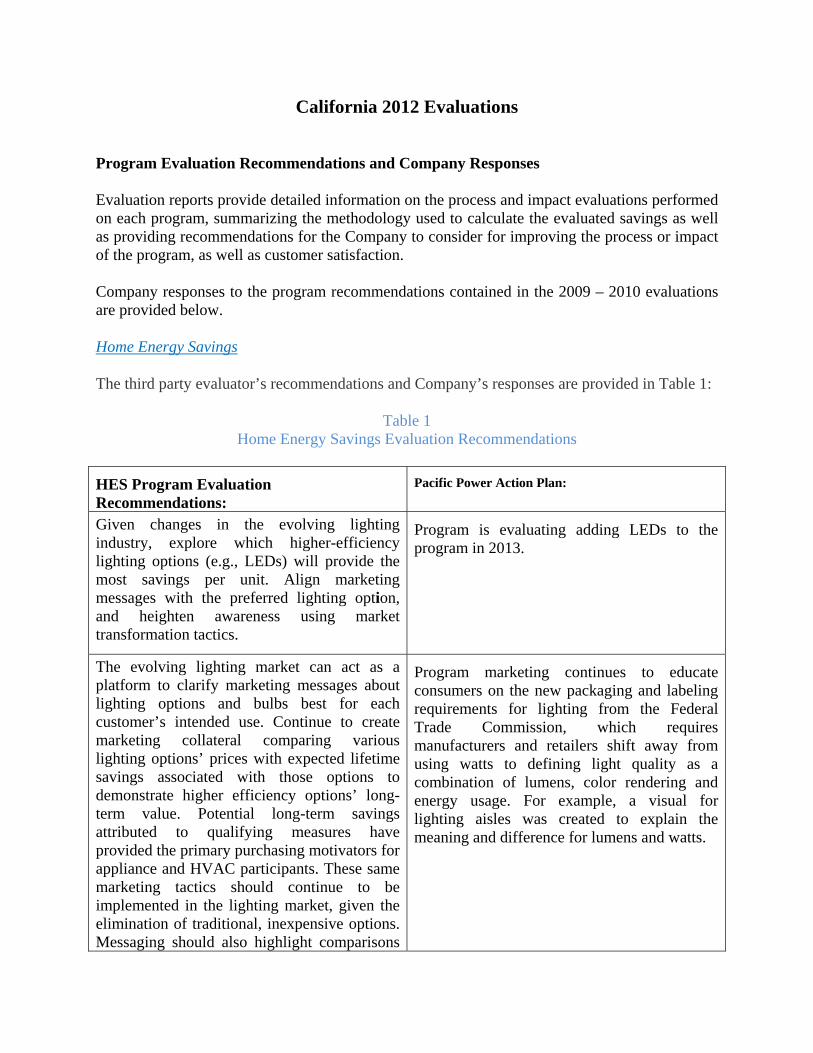
California 2012 Evaluations Program Evaluation Recommendations and Company Responses Evaluation reports provide detailed information on the process and impact evaluations performed on each program, summarizing the methodology used to calculate the evaluated savings as well as providing recommendations for the Company to consider for improving the process or impact of the program, as well as customer satisfaction. Company responses to the program recommendations contained in the 2009 – 2010 evaluations are provided below. Home Energy Savings
The third party evaluator’s recommendations and Company’s responses are provided in Table 1:
Table 1 Home Energy Savings Evaluation Recommendations
HES Program Evaluation Recommendations:
Pacific Power Action Plan:
Given changes in the evolving lighting industry, explore which higher-efficiency lighting options (e.g., LEDs) will provide the most savings per unit. Align marketing messages with the preferred lighting option, and heighten awareness using market transformation tactics.
Program is evaluating adding LEDs to the program in 2013.
The evolving lighting market can act as a platform to clarify marketing messages about lighting options and bulbs best for each customer’s intended use. Continue to create marketing collateral comparing various lighting options’ prices with expected lifetime savings associated with those options to demonstrate higher efficiency options’ long-term value. Potential long-term savings attributed to qualifying measures have provided the primary purchasing motivators for appliance and HVAC participants. These same marketing tactics should continue to be implemented in the lighting market, given the elimination of traditional, inexpensive options. Messaging should also highlight comparisons
Program marketing continues to educate consumers on the new packaging and labeling requirements for lighting from the Federal Trade Commission, which requires manufacturers and retailers shift away from using watts to defining light quality as a combination of lumens, color rendering and energy usage. For example, a visual for lighting aisles was created to explain the meaning and difference for lumens and watts.
HES Program Evaluation Recommendations:
Pacific Power Action Plan:
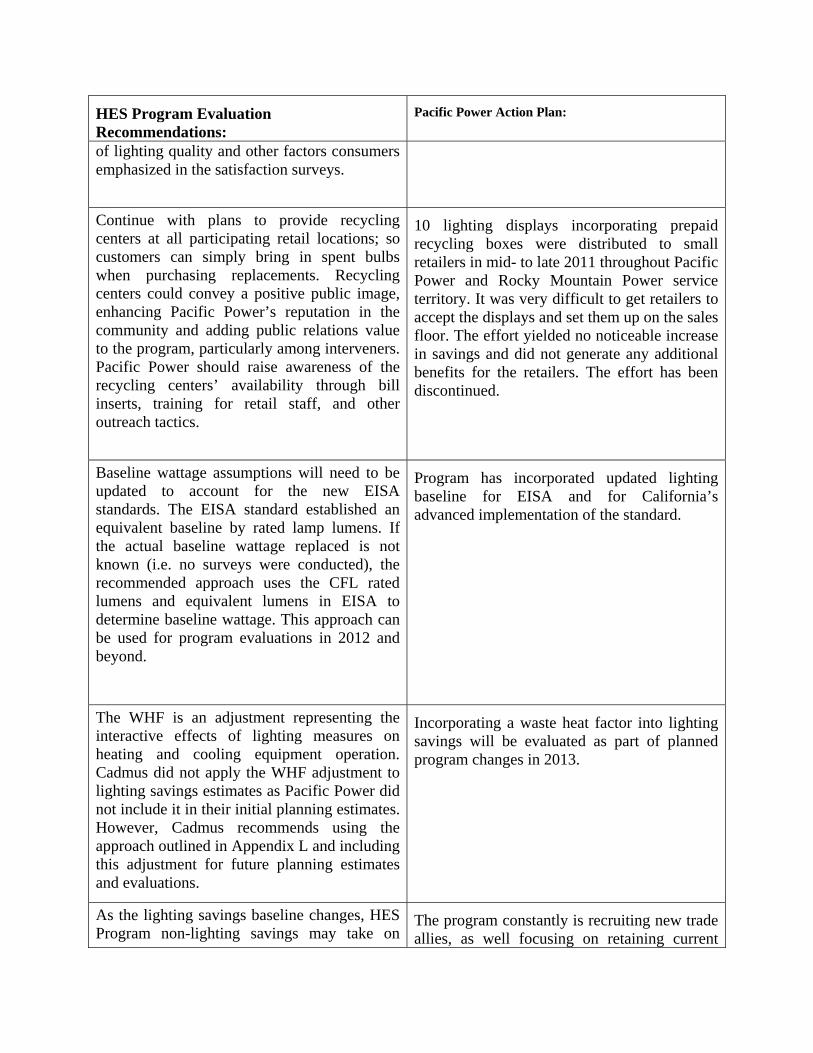
of lighting quality and other factors consumers emphasized in the satisfaction surveys.
Continue with plans to provide recycling centers at all participating retail locations; so customers can simply bring in spent bulbs when purchasing replacements. Recycling centers could convey a positive public image, enhancing Pacific Power’s reputation in the community and adding public relations value to the program, particularly among interveners. Pacific Power should raise awareness of the recycling centers’ availability through bill inserts, training for retail staff, and other outreach tactics.
10 lighting displays incorporating prepaid recycling boxes were distributed to small retailers in mid- to late 2011 throughout Pacific Power and Rocky Mountain Power service territory. It was very difficult to get retailers to accept the displays and set them up on the sales floor. The effort yielded no noticeable increase in savings and did not generate any additional benefits for the retailers. The effort has been discontinued.
Baseline wattage assumptions will need to be updated to account for the new EISA standards. The EISA standard established an equivalent baseline by rated lamp lumens. If the actual baseline wattage replaced is not known (i.e. no surveys were conducted), the recommended approach uses the CFL rated lumens and equivalent lumens in EISA to determine baseline wattage. This approach can be used for program evaluations in 2012 and beyond.
Program has incorporated updated lighting baseline for EISA and for California’s advanced implementation of the standard.
The WHF is an adjustment representing the interactive effects of lighting measures on heating and cooling equipment operation. Cadmus did not apply the WHF adjustment to lighting savings estimates as Pacific Power did not include it in their initial planning estimates. However, Cadmus recommends using the approach outlined in Appendix L and including this adjustment for future planning estimates and evaluations.
Incorporating a waste heat factor into lighting savings will be evaluated as part of planned program changes in 2013.
As the lighting savings baseline changes, HES Program non-lighting savings may take on
The program constantly is recruiting new trade allies, as well focusing on retaining current
HES Program Evaluation Recommendations:
Pacific Power Action Plan:
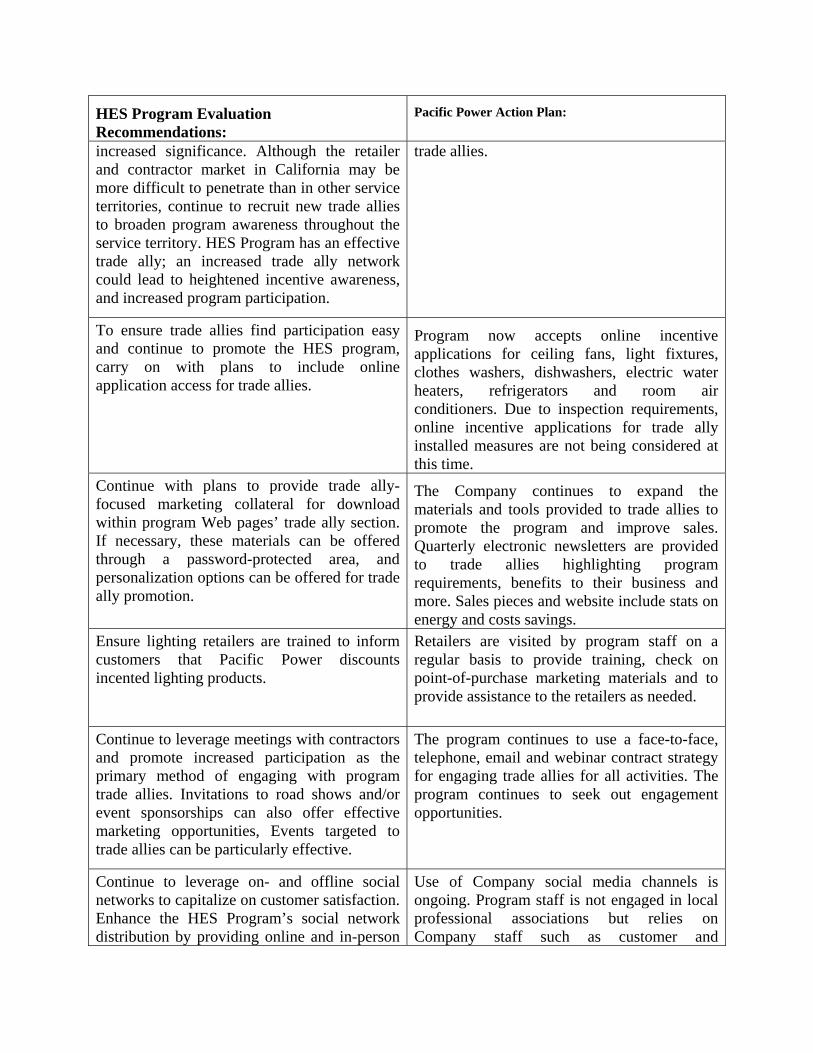
increased significance. Although the retailer and contractor market in California may be more difficult to penetrate than in other service territories, continue to recruit new trade allies to broaden program awareness throughout the service territory. HES Program has an effective trade ally; an increased trade ally network could lead to heightened incentive awareness, and increased program participation.
trade allies.
To ensure trade allies find participation easy and continue to promote the HES program, carry on with plans to include online application access for trade allies.
Program now accepts online incentive applications for ceiling fans, light fixtures, clothes washers, dishwashers, electric water heaters, refrigerators and room air conditioners. Due to inspection requirements, online incentive applications for trade ally installed measures are not being considered at this time.
Continue with plans to provide trade ally-focused marketing collateral for download within program Web pages’ trade ally section. If necessary, these materials can be offered through a password-protected area, and personalization options can be offered for trade ally promotion.
The Company continues to expand the materials and tools provided to trade allies to promote the program and improve sales. Quarterly electronic newsletters are provided to trade allies highlighting program requirements, benefits to their business and more. Sales pieces and website include stats on energy and costs savings.
Ensure lighting retailers are trained to inform customers that Pacific Power discounts incented lighting products.
Retailers are visited by program staff on a regular basis to provide training, check on point-of-purchase marketing materials and to provide assistance to the retailers as needed.
Continue to leverage meetings with contractors and promote increased participation as the primary method of engaging with program trade allies. Invitations to road shows and/or event sponsorships can also offer effective marketing opportunities, Events targeted to trade allies can be particularly effective.
The program continues to use a face-to-face, telephone, email and webinar contract strategy for engaging trade allies for all activities. The program continues to seek out engagement opportunities.
Continue to leverage on- and offline social networks to capitalize on customer satisfaction. Enhance the HES Program’s social network distribution by providing online and in-person
Use of Company social media channels is ongoing. Program staff is not engaged in local professional associations but relies on Company staff such as customer and
HES Program Evaluation Recommendations:
Pacific Power Action Plan:
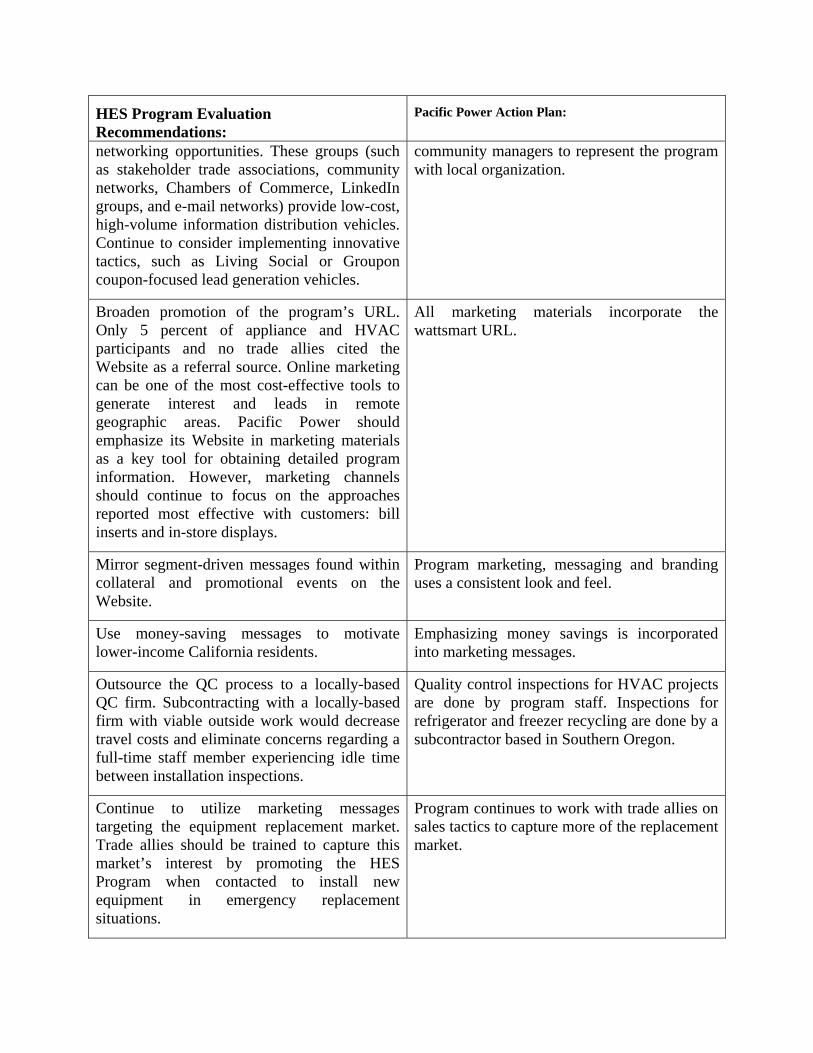
networking opportunities. These groups (such as stakeholder trade associations, community networks, Chambers of Commerce, LinkedIn groups, and e-mail networks) provide low-cost, high-volume information distribution vehicles. Continue to consider implementing innovative tactics, such as Living Social or Groupon coupon-focused lead generation vehicles.
community managers to represent the program with local organization.
Broaden promotion of the program’s URL. Only 5 percent of appliance and HVAC participants and no trade allies cited the Website as a referral source. Online marketing can be one of the most cost-effective tools to generate interest and leads in remote geographic areas. Pacific Power should emphasize its Website in marketing materials as a key tool for obtaining detailed program information. However, marketing channels should continue to focus on the approaches reported most effective with customers: bill inserts and in-store displays.
All marketing materials incorporate the wattsmart URL.
Mirror segment-driven messages found within collateral and promotional events on the Website.
Program marketing, messaging and branding uses a consistent look and feel.
Use money-saving messages to motivate lower-income California residents.
Emphasizing money savings is incorporated into marketing messages.
Outsource the QC process to a locally-based QC firm. Subcontracting with a locally-based firm with viable outside work would decrease travel costs and eliminate concerns regarding a full-time staff member experiencing idle time between installation inspections.
Quality control inspections for HVAC projects are done by program staff. Inspections for refrigerator and freezer recycling are done by a subcontractor based in Southern Oregon.
Continue to utilize marketing messages targeting the equipment replacement market. Trade allies should be trained to capture this market’s interest by promoting the HES Program when contacted to install new equipment in emergency replacement situations.
Program continues to work with trade allies on sales tactics to capture more of the replacement market.
HES Program Evaluation Recommendations:
Pacific Power Action Plan:
Continue to review measure incentive levels. Customers with less disposable income may need higher financial motivators to purchase qualifying measures. Based on Cadmus’ benchmarking study, measures that could be considered for review include dishwashers, refrigerators, room air conditioners, central air conditioners, and evaporative coolers.
All program measures are being evaluated as part of planned program changes in 2013.

Appendix 2A
Home Energy Savings Program Evaluation
Pacific Power
Principal Investigators: Katie Parkinson
Pacific Power 2009-2010 California Residential Home Energy Savings Evaluation
Final Report
Prepared by:
The Cadmus Group, Inc. / Energy Services 720 SW Washington Street, Suite 400 Portland, OR 97205
503.228.2992
Prepared for:
Pacific Power
February 29, 2012
Hossein Haeri Jeana Swedenburg
The Cadmus Group, Inc.
Jun Suzuki
Research Into Action, Inc
Pacific Power California HES Evaluation 2009–2010 Final Report February 29, 2012
The Cadmus Group, Inc. / Energy Services i
Table of Contents
Glossary of Terms ................................................................................................1
Executive Summary .............................................................................................3 Overview of Evaluation Activities .......................................................................................3
Key Findings ........................................................................................................................3
Summary and Recommendations ........................................................................................7
Introduction ..........................................................................................................9 Program Description ............................................................................................................9
Evaluated Gross and Net Savings Methodology ...............................................................10
Impact Evaluation .............................................................................................. 18 Lighting ..............................................................................................................................18
Appliances, HVAC, and Weatherization ...........................................................................38
Refrigerator and Freezer Recycling ...................................................................................50
Process Evaluation Findings ........................................................................... 57 Program Implementation and Delivery ..............................................................................57
Marketing ...........................................................................................................................64
Quality Assurance ..............................................................................................................69
Customer Response ............................................................................................................70
Communication ..................................................................................................................74
Summary and Recommendations ......................................................................................75
Cost-Effectiveness ............................................................................................ 80
Appendices ........................................................................................................ 84
Pacific Power California HES Evaluation 2009–2010 Final Report February 29, 2012
The Cadmus Group, Inc. / Energy Services 1
Glossary of Terms
Analysis of Covariance (ANCOVA) An ANCOVA model is an ANOVA model with a continuous variable added. An ANOVA model explains the variation in the independent variable, based on a series of characteristics (expressed as binary variables equaling either zero or one).
Evaluated Gross Savings Evaluated gross savings represent the total savings of a program, based on validated savings and installations, before adjusting for behavioral effects such as freeridership or spillover. They are most often calculated for a given measure, i, as:
Evaluated Net Savings Evaluated net savings are the savings “net” of what would have occurred in the program’s absence. These savings are the observed impacts attributable to the program. Net savings are calculated as:
Freeridership Freeridership in energy-efficiency programs is defined as participants who would have adopted the energy-efficient measure in the program’s absence. This is often expressed as the freeridership rate, or the proportion of evaluated gross savings that can be classified as freeridership.
Gross Realization Rate
The ratio of evaluated gross savings and the savings reported (or claimed) by the program administrator.
In-Service Rate (ISR) The ISR (also called the installation rate) is the proportion of incented measures actually installed.
Net-to-Gross (NTG) The NTG ratio is the ratio of net savings to evaluated gross savings. Analytically, NTG is defined as:
1
P-Value A p-value indicates the probability that a statistical finding might be due to chance. A p-value less than 0.10 indicates one can say, with 90 percent confidence, that the finding was due to the intervention.
Pacific Power California HES Evaluation 2009–2010 Final Report February 29, 2012
The Cadmus Group, Inc. / Energy Services 2
Spillover Spillover is the adoption of an energy-efficiency measure induced by the program’s presence, but not directly funded by the program. As with freeridership, this is expressed as a fraction of evaluated gross savings (or the spillover rate).
T-Test In regression analysis, a t-test is applied to determine whether the estimated coefficient differs significantly from zero. A t-test with a p-value less than 0.10 indicates that there is a 90 percent probability that the estimated coefficient is different from zero.
Pacific Power California HES Evaluation 2009–2010 Final Report February 29, 2012
The Cadmus Group, Inc. / Energy Services 3
Executive Summary
Pacific Power offers the Home Energy Savings (HES) Program in Northern California, Wyoming, Utah, Idaho, and Washington. In 2008, Pacific Power first offered the HES Program in California. The HES Program provides residential customers with incentives to help facilitate the purchase of energy-efficient products and services through upstream (manufacturer and retailer) and downstream (customer) incentive mechanisms. During the 2009 and 2010 program years, Pacific Power reported over 7,500 participants in the program and gross electricity savings of 2,995,175 kWh. The largest program in Pacific Power’s residential portfolio in California, the HES Program contributed 87 percent of residential program savings, and 55 percent of all California portfolio savings in 2009 and 2010.
The HES Program offers energy-efficiency measures in four categories:
Lighting: Upstream incentives for manufacturers to reduce retail prices on compact florescent lamps (CFLs), and incentives to customers for light fixtures and ceiling fans.
Appliances: Customer incentives for clothes washers, dishwashers, refrigerators, room air conditioners, and high-efficiency electric storage water heaters.
Heating, ventilation, and air conditioning (HVAC): Customer incentives for high-efficiency heating and cooling equipment and services, duct sealing, and evaporative cooling equipment.
Appliance Recycling: Customer incentives for recycling working refrigerator and freezers. Participants also receive free energy-efficient kits as part of this program.
Pacific Power contracted with The Cadmus Group, Inc., (Cadmus) to conduct process and impact evaluations of the California HES Program for program years 2009 and 2010. The impact evaluation assessed energy impacts and program cost-effectiveness. The process evaluation assessed: program delivery and efficacy, bottlenecks, barriers, best practices, and opportunities for improvements. This document presents these evaluations’ results.
Overview of Evaluation Activities The HES Program evaluation consisted of primary and secondary data collection activities, informing the impact and process evaluation components. The impact evaluation estimated two key components: gross savings and the net-to-gross (NTG) ratio. The gross savings calculations included adjustments for the installation rate and verification of engineering calculations and assumptions. NTG—the combination of freeridership and spillover—discounted savings from units that would have been installed in the program’s absence, and credited the program for unaccounted spillover savings achieved through the program’s influence.
The process evaluation investigated topics such as: participant satisfaction; implementation and delivery processes; marketing methods; quality assurance; and other qualitative issues.
Key Findings Launched in 2008 the HES Program provides incentives for 23energy-saving measures. Cadmus’ evaluation focused on the top 10 measures, which collectively contributed to over 99 percent of
Pacific Power California HES Evaluation 2009–2010 Final Report February 29, 2012
The Cadmus Group, Inc. / Energy Services 4
the HES Program savings. Cadmus collected primary data on the top savings measures, and performed engineering reviews utilizing secondary data for the remaining measures. CFLs accounted for 50 percent of total HES Program savings, and, as a result, became a primary focus of the evaluation.
Key Impact Findings Key impact evaluation findings include the following:
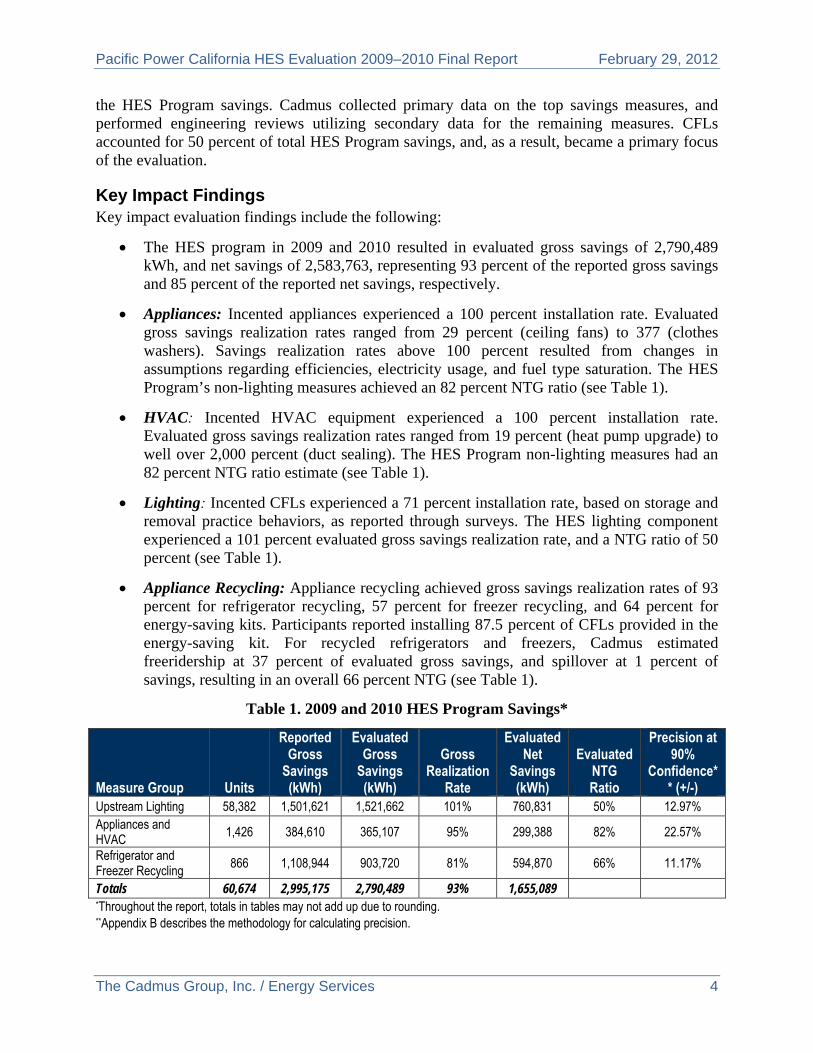
The HES program in 2009 and 2010 resulted in evaluated gross savings of 2,790,489 kWh, and net savings of 2,583,763, representing 93 percent of the reported gross savings and 85 percent of the reported net savings, respectively.
Appliances: Incented appliances experienced a 100 percent installation rate. Evaluated gross savings realization rates ranged from 29 percent (ceiling fans) to 377 (clothes washers). Savings realization rates above 100 percent resulted from changes in assumptions regarding efficiencies, electricity usage, and fuel type saturation. The HES Program’s non-lighting measures achieved an 82 percent NTG ratio (see Table 1).
HVAC: Incented HVAC equipment experienced a 100 percent installation rate. Evaluated gross savings realization rates ranged from 19 percent (heat pump upgrade) to well over 2,000 percent (duct sealing). The HES Program non-lighting measures had an 82 percent NTG ratio estimate (see Table 1).
Lighting: Incented CFLs experienced a 71 percent installation rate, based on storage and removal practice behaviors, as reported through surveys. The HES lighting component experienced a 101 percent evaluated gross savings realization rate, and a NTG ratio of 50 percent (see Table 1).
Appliance Recycling: Appliance recycling achieved gross savings realization rates of 93 percent for refrigerator recycling, 57 percent for freezer recycling, and 64 percent for energy-saving kits. Participants reported installing 87.5 percent of CFLs provided in the energy-saving kit. For recycled refrigerators and freezers, Cadmus estimated freeridership at 37 percent of evaluated gross savings, and spillover at 1 percent of savings, resulting in an overall 66 percent NTG (see Table 1).
Table 1. 2009 and 2010 HES Program Savings*
Measure Group Units
Reported Gross
Savings (kWh)
Evaluated Gross
Savings (kWh)
Gross Realization
Rate
Evaluated Net
Savings (kWh)
Evaluated NTG Ratio
Precision at 90%
Confidence** (+/-)
Upstream Lighting 58,382 1,501,621 1,521,662 101% 760,831 50% 12.97% Appliances and HVAC
1,426 384,610 365,107 95% 299,388 82% 22.57%
Refrigerator and Freezer Recycling
866 1,108,944 903,720 81% 594,870 66% 11.17%
Totals 60,674 2,995,175 2,790,489 93% 1,655,089 *Throughout the report, totals in tables may not add up due to rounding. **Appendix B describes the methodology for calculating precision.
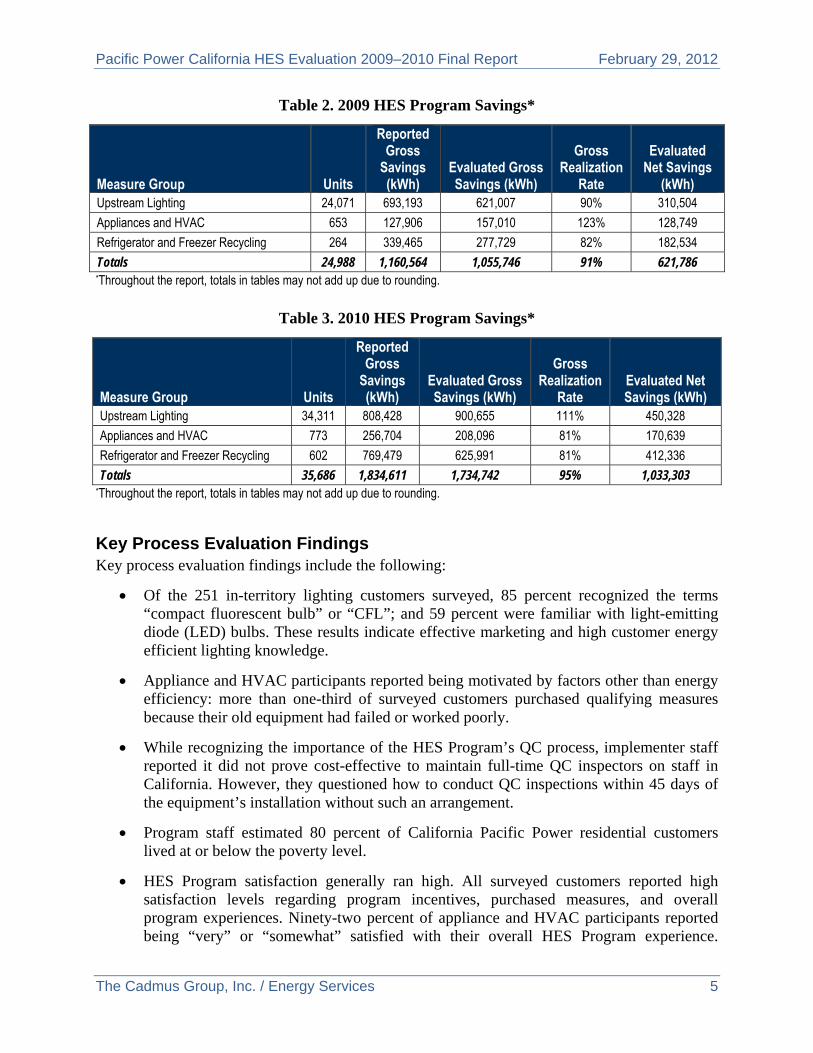
Pacific Power California HES Evaluation 2009–2010 Final Report February 29, 2012
The Cadmus Group, Inc. / Energy Services 5
Table 2. 2009 HES Program Savings*
Measure Group Units
Reported Gross
Savings (kWh)
Evaluated Gross Savings (kWh)
Gross Realization
Rate
Evaluated Net Savings
(kWh) Upstream Lighting 24,071 693,193 621,007 90% 310,504
Appliances and HVAC 653 127,906 157,010 123% 128,749
Refrigerator and Freezer Recycling 264 339,465 277,729 82% 182,534
Totals 24,988 1,160,564 1,055,746 91% 621,786 *Throughout the report, totals in tables may not add up due to rounding.
Table 3. 2010 HES Program Savings*
Measure Group Units
Reported Gross
Savings (kWh)
Evaluated Gross Savings (kWh)
Gross Realization
Rate Evaluated Net Savings (kWh)
Upstream Lighting 34,311 808,428 900,655 111% 450,328
Appliances and HVAC 773 256,704 208,096 81% 170,639
Refrigerator and Freezer Recycling 602 769,479 625,991 81% 412,336
Totals 35,686 1,834,611 1,734,742 95% 1,033,303 *Throughout the report, totals in tables may not add up due to rounding.
Key Process Evaluation Findings Key process evaluation findings include the following:
Of the 251 in-territory lighting customers surveyed, 85 percent recognized the terms “compact fluorescent bulb” or “CFL”; and 59 percent were familiar with light-emitting diode (LED) bulbs. These results indicate effective marketing and high customer energy efficient lighting knowledge.
Appliance and HVAC participants reported being motivated by factors other than energy efficiency: more than one-third of surveyed customers purchased qualifying measures because their old equipment had failed or worked poorly.
While recognizing the importance of the HES Program’s QC process, implementer staff reported it did not prove cost-effective to maintain full-time QC inspectors on staff in California. However, they questioned how to conduct QC inspections within 45 days of the equipment’s installation without such an arrangement.
Program staff estimated 80 percent of California Pacific Power residential customers lived at or below the poverty level.
HES Program satisfaction generally ran high. All surveyed customers reported high satisfaction levels regarding program incentives, purchased measures, and overall program experiences. Ninety-two percent of appliance and HVAC participants reported being “very” or “somewhat” satisfied with their overall HES Program experience.
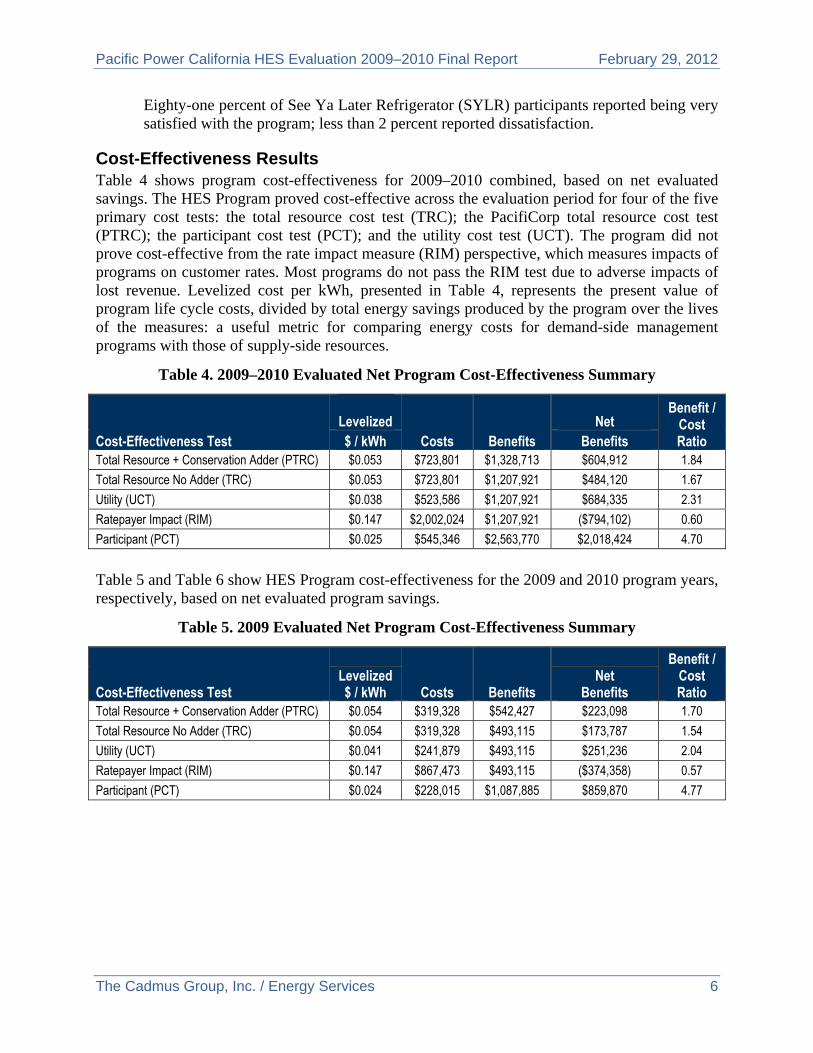
Pacific Power California HES Evaluation 2009–2010 Final Report February 29, 2012
The Cadmus Group, Inc. / Energy Services 6
Eighty-one percent of See Ya Later Refrigerator (SYLR) participants reported being very satisfied with the program; less than 2 percent reported dissatisfaction.
Cost-Effectiveness Results Table 4 shows program cost-effectiveness for 2009–2010 combined, based on net evaluated savings. The HES Program proved cost-effective across the evaluation period for four of the five primary cost tests: the total resource cost test (TRC); the PacifiCorp total resource cost test (PTRC); the participant cost test (PCT); and the utility cost test (UCT). The program did not prove cost-effective from the rate impact measure (RIM) perspective, which measures impacts of programs on customer rates. Most programs do not pass the RIM test due to adverse impacts of lost revenue. Levelized cost per kWh, presented in Table 4, represents the present value of program life cycle costs, divided by total energy savings produced by the program over the lives of the measures: a useful metric for comparing energy costs for demand-side management programs with those of supply-side resources.
Table 4. 2009–2010 Evaluated Net Program Cost-Effectiveness Summary
Cost-Effectiveness Test
Levelized
Costs Benefits Net
Benefit / Cost Ratio $ / kWh Benefits
Total Resource + Conservation Adder (PTRC) $0.053 $723,801 $1,328,713 $604,912 1.84
Total Resource No Adder (TRC) $0.053 $723,801 $1,207,921 $484,120 1.67
Utility (UCT) $0.038 $523,586 $1,207,921 $684,335 2.31
Ratepayer Impact (RIM) $0.147 $2,002,024 $1,207,921 ($794,102) 0.60
Participant (PCT) $0.025 $545,346 $2,563,770 $2,018,424 4.70
Table 5 and Table 6 show HES Program cost-effectiveness for the 2009 and 2010 program years, respectively, based on net evaluated program savings.
Table 5. 2009 Evaluated Net Program Cost-Effectiveness Summary
Cost-Effectiveness Test Costs Benefits
Benefit / Cost Ratio
Levelized $ / kWh
Net Benefits
Total Resource + Conservation Adder (PTRC) $0.054 $319,328 $542,427 $223,098 1.70
Total Resource No Adder (TRC) $0.054 $319,328 $493,115 $173,787 1.54
Utility (UCT) $0.041 $241,879 $493,115 $251,236 2.04
Ratepayer Impact (RIM) $0.147 $867,473 $493,115 ($374,358) 0.57
Participant (PCT) $0.024 $228,015 $1,087,885 $859,870 4.77
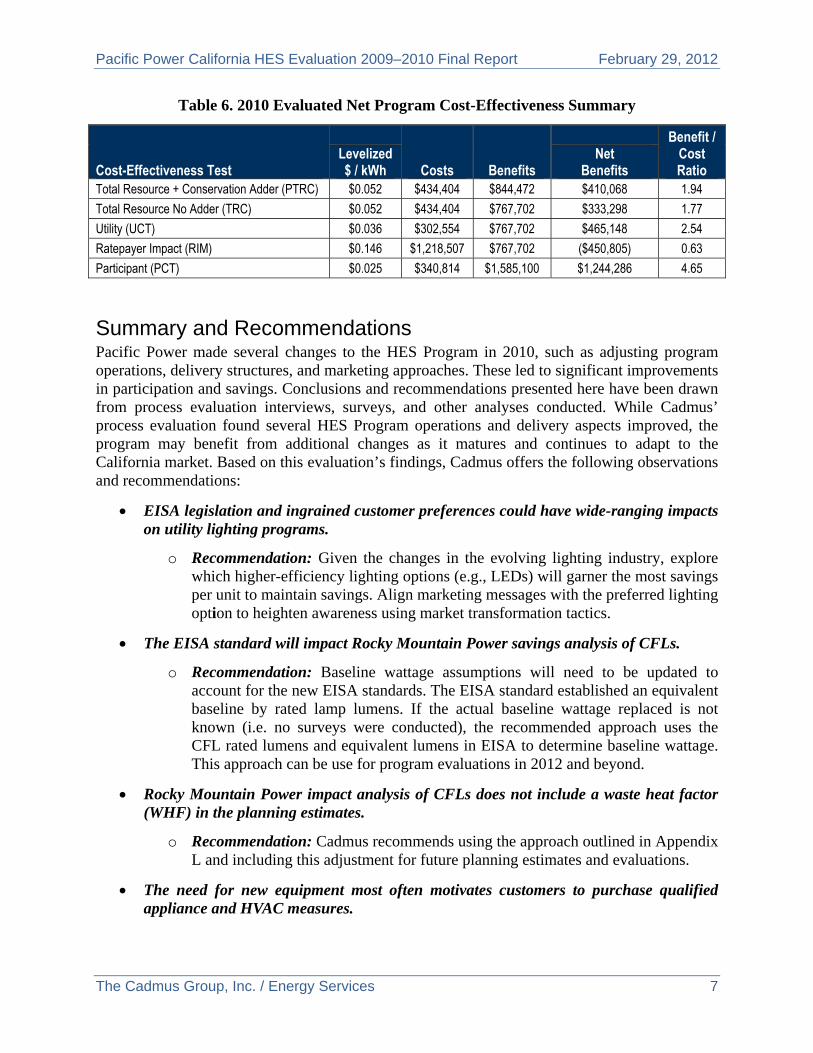
Pacific Power California HES Evaluation 2009–2010 Final Report February 29, 2012
The Cadmus Group, Inc. / Energy Services 7
Table 6. 2010 Evaluated Net Program Cost-Effectiveness Summary
Cost-Effectiveness Test Costs Benefits
Benefit / Cost Ratio
Levelized $ / kWh
Net Benefits
Total Resource + Conservation Adder (PTRC) $0.052 $434,404 $844,472 $410,068 1.94
Total Resource No Adder (TRC) $0.052 $434,404 $767,702 $333,298 1.77
Utility (UCT) $0.036 $302,554 $767,702 $465,148 2.54
Ratepayer Impact (RIM) $0.146 $1,218,507 $767,702 ($450,805) 0.63
Participant (PCT) $0.025 $340,814 $1,585,100 $1,244,286 4.65
Summary and Recommendations Pacific Power made several changes to the HES Program in 2010, such as adjusting program operations, delivery structures, and marketing approaches. These led to significant improvements in participation and savings. Conclusions and recommendations presented here have been drawn from process evaluation interviews, surveys, and other analyses conducted. While Cadmus’ process evaluation found several HES Program operations and delivery aspects improved, the program may benefit from additional changes as it matures and continues to adapt to the California market. Based on this evaluation’s findings, Cadmus offers the following observations and recommendations:
EISA legislation and ingrained customer preferences could have wide-ranging impacts on utility lighting programs.
o Recommendation: Given the changes in the evolving lighting industry, explore which higher-efficiency lighting options (e.g., LEDs) will garner the most savings per unit to maintain savings. Align marketing messages with the preferred lighting option to heighten awareness using market transformation tactics.
The EISA standard will impact Rocky Mountain Power savings analysis of CFLs.
o Recommendation: Baseline wattage assumptions will need to be updated to account for the new EISA standards. The EISA standard established an equivalent baseline by rated lamp lumens. If the actual baseline wattage replaced is not known (i.e. no surveys were conducted), the recommended approach uses the CFL rated lumens and equivalent lumens in EISA to determine baseline wattage. This approach can be use for program evaluations in 2012 and beyond.
Rocky Mountain Power impact analysis of CFLs does not include a waste heat factor (WHF) in the planning estimates.
o Recommendation: Cadmus recommends using the approach outlined in Appendix L and including this adjustment for future planning estimates and evaluations.
The need for new equipment most often motivates customers to purchase qualified appliance and HVAC measures.
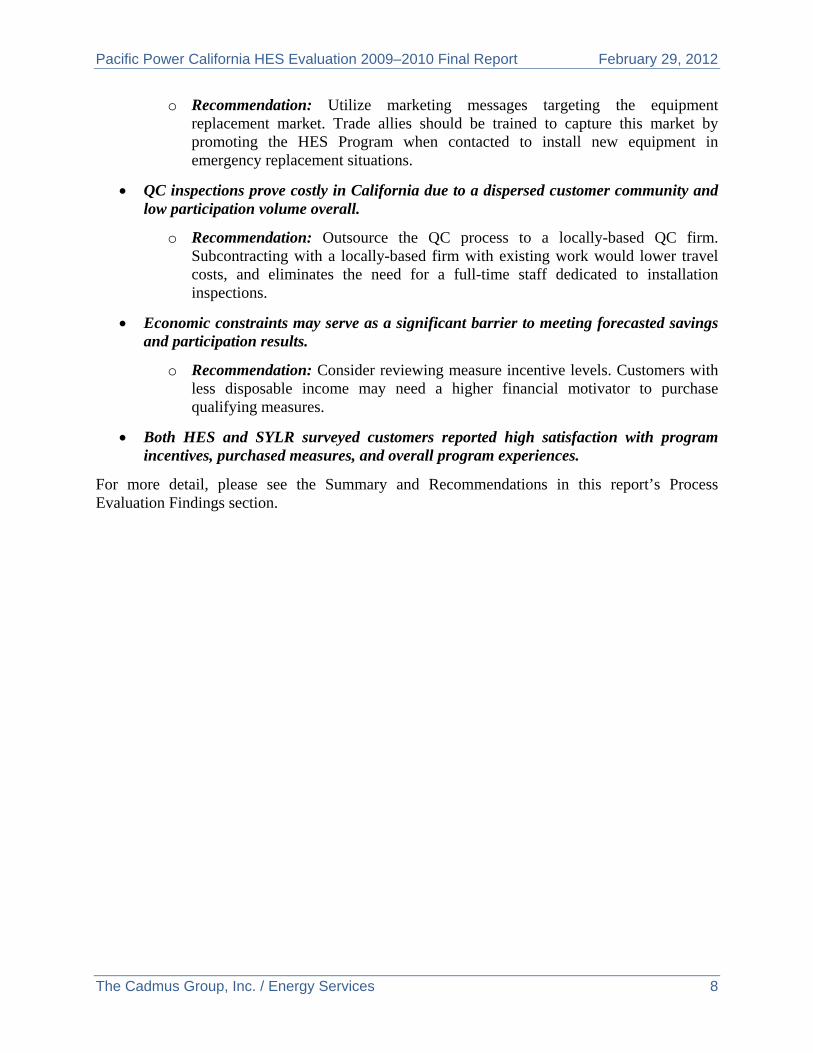
Pacific Power California HES Evaluation 2009–2010 Final Report February 29, 2012
The Cadmus Group, Inc. / Energy Services 8
o Recommendation: Utilize marketing messages targeting the equipment replacement market. Trade allies should be trained to capture this market by promoting the HES Program when contacted to install new equipment in emergency replacement situations.
QC inspections prove costly in California due to a dispersed customer community and low participation volume overall.
o Recommendation: Outsource the QC process to a locally-based QC firm. Subcontracting with a locally-based firm with existing work would lower travel costs, and eliminates the need for a full-time staff dedicated to installation inspections.
Economic constraints may serve as a significant barrier to meeting forecasted savings and participation results.
o Recommendation: Consider reviewing measure incentive levels. Customers with less disposable income may need a higher financial motivator to purchase qualifying measures.
Both HES and SYLR surveyed customers reported high satisfaction with program incentives, purchased measures, and overall program experiences.
For more detail, please see the Summary and Recommendations in this report’s Process Evaluation Findings section.
Pacific Power California HES Evaluation 2009–2010 Final Report February 29, 2012
The Cadmus Group, Inc. / Energy Services 9
Introduction
Program Description In 2008, Home Energy Savings (HES) was launched in California. Portland Energy Conservation, Inc. (PECI/program implementer) implemented the HES Program, which provided incentives to residential customers purchasing qualifying, high-efficiency equipment, appliances, and weatherization measures. JACO Environmental implemented the refrigerator and freezer recycling incentives. Prescriptive incentives offered included the following measures:
Clothes washers;
Dishwashers;
Water heaters;
Refrigerators;
Room air conditioners;
Evaporative coolers;
Central air conditioning units;
Heat pumps;
Duct sealing
Fluorescent fixtures;
Ceiling fans; and
Refrigerator and freezer recycling.
To encourage dealers to promote energy-efficient equipment incentives and to properly size, install, and maintain equipment, Pacific Power also offered dealer incentives for qualifying central air conditioning, evaporative coolers, duct sealing, and heat pump measures bought or installed through the HES Program.
The HES Program included an upstream lighting component, applying incentives for eligible compact fluorescent lamps (CFLs) at the manufacturer level, and discounting for end-use customers purchasing high-efficiency lighting options.
Table 7, below, lists HES Program measures and customer and dealer incentive amounts.
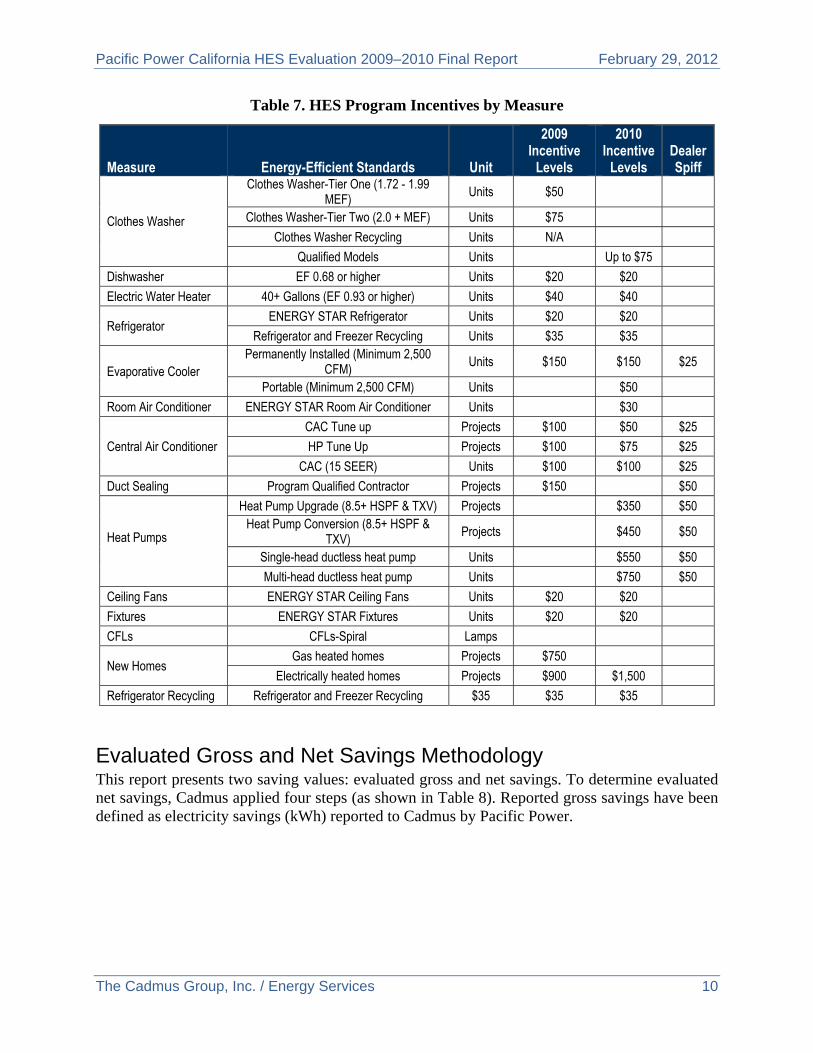
Pacific Power California HES Evaluation 2009–2010 Final Report February 29, 2012
The Cadmus Group, Inc. / Energy Services 10
Table 7. HES Program Incentives by Measure
Measure Energy-Efficient Standards Unit
2009 Incentive
Levels
2010 Incentive
Levels Dealer Spiff
Clothes Washer
Clothes Washer-Tier One (1.72 - 1.99 MEF) Units $50
Clothes Washer-Tier Two (2.0 + MEF) Units $75
Clothes Washer Recycling Units N/A
Qualified Models Units Up to $75
Dishwasher EF 0.68 or higher Units $20 $20
Electric Water Heater 40+ Gallons (EF 0.93 or higher) Units $40 $40
Refrigerator ENERGY STAR Refrigerator Units $20 $20
Refrigerator and Freezer Recycling Units $35 $35
Evaporative Cooler Permanently Installed (Minimum 2,500
CFM) Units $150 $150 $25
Portable (Minimum 2,500 CFM) Units $50
Room Air Conditioner ENERGY STAR Room Air Conditioner Units $30
Central Air Conditioner
CAC Tune up Projects $100 $50 $25
HP Tune Up Projects $100 $75 $25
CAC (15 SEER) Units $100 $100 $25
Duct Sealing Program Qualified Contractor Projects $150 $50
Heat Pumps
Heat Pump Upgrade (8.5+ HSPF & TXV) Projects $350 $50 Heat Pump Conversion (8.5+ HSPF &
TXV) Projects $450 $50
Single-head ductless heat pump Units $550 $50
Multi-head ductless heat pump Units $750 $50
Ceiling Fans ENERGY STAR Ceiling Fans Units $20 $20
Fixtures ENERGY STAR Fixtures Units $20 $20
CFLs CFLs-Spiral Lamps
New Homes Gas heated homes Projects $750
Electrically heated homes Projects $900 $1,500
Refrigerator Recycling Refrigerator and Freezer Recycling $35 $35 $35
Evaluated Gross and Net Savings Methodology This report presents two saving values: evaluated gross and net savings. To determine evaluated net savings, Cadmus applied four steps (as shown in Table 8). Reported gross savings have been defined as electricity savings (kWh) reported to Cadmus by Pacific Power.
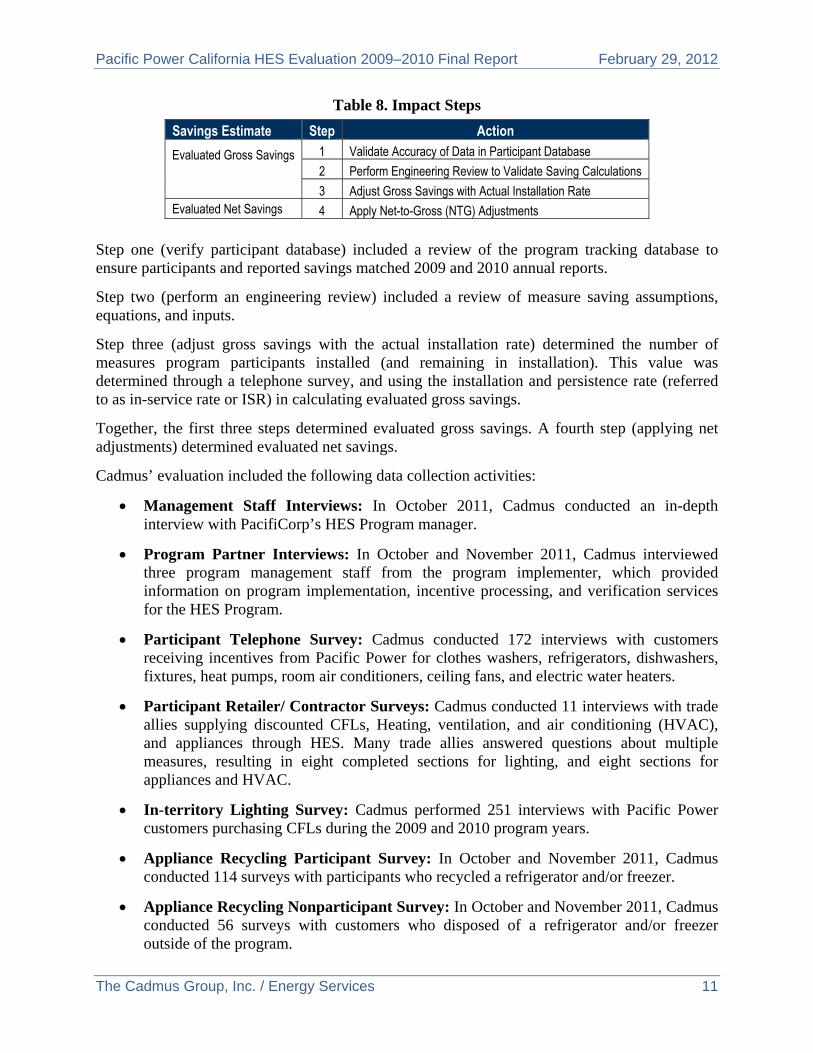
Pacific Power California HES Evaluation 2009–2010 Final Report February 29, 2012
The Cadmus Group, Inc. / Energy Services 11
Table 8. Impact Steps
Savings Estimate Step Action
Evaluated Gross Savings
1 Validate Accuracy of Data in Participant Database
2 Perform Engineering Review to Validate Saving Calculations
3 Adjust Gross Savings with Actual Installation Rate Evaluated Net Savings 4 Apply Net-to-Gross (NTG) Adjustments
Step one (verify participant database) included a review of the program tracking database to ensure participants and reported savings matched 2009 and 2010 annual reports.
Step two (perform an engineering review) included a review of measure saving assumptions, equations, and inputs.
Step three (adjust gross savings with the actual installation rate) determined the number of measures program participants installed (and remaining in installation). This value was determined through a telephone survey, and using the installation and persistence rate (referred to as in-service rate or ISR) in calculating evaluated gross savings.
Together, the first three steps determined evaluated gross savings. A fourth step (applying net adjustments) determined evaluated net savings.
Cadmus’ evaluation included the following data collection activities:
Management Staff Interviews: In October 2011, Cadmus conducted an in-depth interview with PacifiCorp’s HES Program manager.
Program Partner Interviews: In October and November 2011, Cadmus interviewed three program management staff from the program implementer, which provided information on program implementation, incentive processing, and verification services for the HES Program.
Participant Telephone Survey: Cadmus conducted 172 interviews with customers receiving incentives from Pacific Power for clothes washers, refrigerators, dishwashers, fixtures, heat pumps, room air conditioners, ceiling fans, and electric water heaters.
Participant Retailer/ Contractor Surveys: Cadmus conducted 11 interviews with trade allies supplying discounted CFLs, Heating, ventilation, and air conditioning (HVAC), and appliances through HES. Many trade allies answered questions about multiple measures, resulting in eight completed sections for lighting, and eight sections for appliances and HVAC.
In-territory Lighting Survey: Cadmus performed 251 interviews with Pacific Power customers purchasing CFLs during the 2009 and 2010 program years.
Appliance Recycling Participant Survey: In October and November 2011, Cadmus conducted 114 surveys with participants who recycled a refrigerator and/or freezer.
Appliance Recycling Nonparticipant Survey: In October and November 2011, Cadmus conducted 56 surveys with customers who disposed of a refrigerator and/or freezer outside of the program.
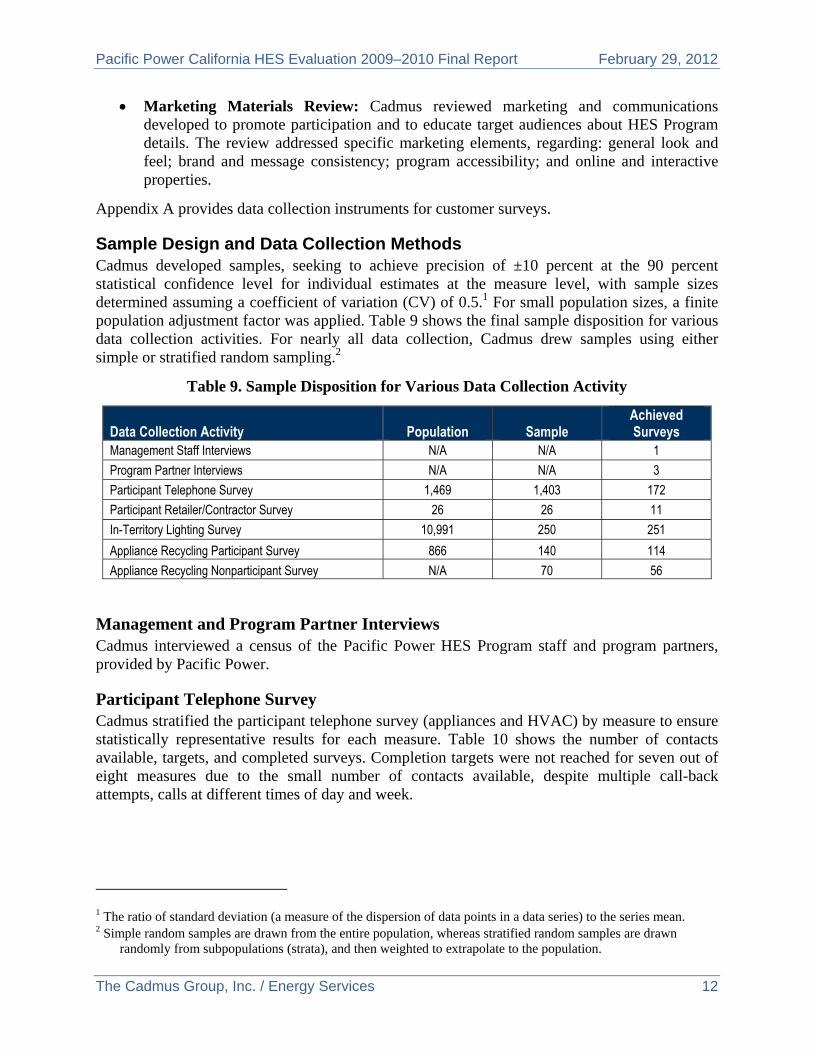
Pacific Power California HES Evaluation 2009–2010 Final Report February 29, 2012
The Cadmus Group, Inc. / Energy Services 12
Marketing Materials Review: Cadmus reviewed marketing and communications developed to promote participation and to educate target audiences about HES Program details. The review addressed specific marketing elements, regarding: general look and feel; brand and message consistency; program accessibility; and online and interactive properties.
Appendix A provides data collection instruments for customer surveys.
Sample Design and Data Collection Methods Cadmus developed samples, seeking to achieve precision of ±10 percent at the 90 percent statistical confidence level for individual estimates at the measure level, with sample sizes determined assuming a coefficient of variation (CV) of 0.5.1 For small population sizes, a finite population adjustment factor was applied. Table 9 shows the final sample disposition for various data collection activities. For nearly all data collection, Cadmus drew samples using either simple or stratified random sampling.2
Table 9. Sample Disposition for Various Data Collection Activity
Data Collection Activity Population Sample Achieved Surveys
Management Staff Interviews N/A N/A 1
Program Partner Interviews N/A N/A 3
Participant Telephone Survey 1,469 1,403 172
Participant Retailer/Contractor Survey 26 26 11
In-Territory Lighting Survey 10,991 250 251
Appliance Recycling Participant Survey 866 140 114
Appliance Recycling Nonparticipant Survey N/A 70 56
Management and Program Partner Interviews Cadmus interviewed a census of the Pacific Power HES Program staff and program partners, provided by Pacific Power.
Participant Telephone Survey Cadmus stratified the participant telephone survey (appliances and HVAC) by measure to ensure statistically representative results for each measure. Table 10 shows the number of contacts available, targets, and completed surveys. Completion targets were not reached for seven out of eight measures due to the small number of contacts available, despite multiple call-back attempts, calls at different times of day and week.
1 The ratio of standard deviation (a measure of the dispersion of data points in a data series) to the series mean. 2 Simple random samples are drawn from the entire population, whereas stratified random samples are drawn
randomly from subpopulations (strata), and then weighted to extrapolate to the population.
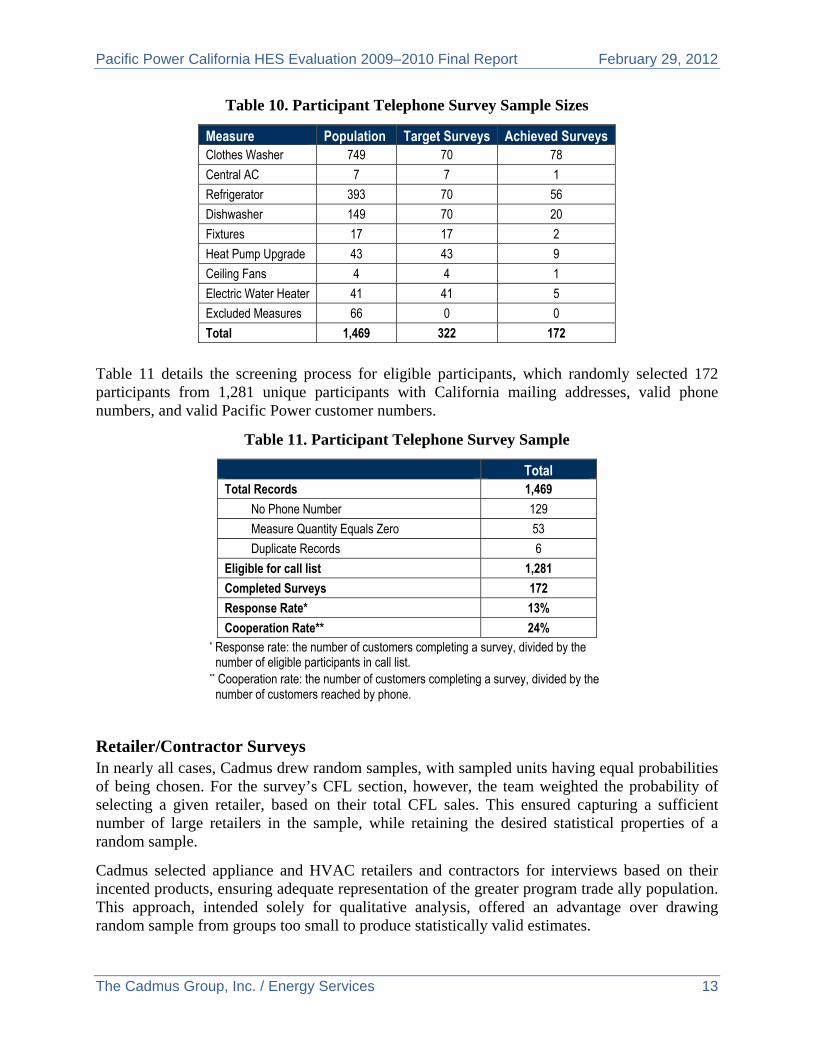
Pacific Power California HES Evaluation 2009–2010 Final Report February 29, 2012
The Cadmus Group, Inc. / Energy Services 13
Table 10. Participant Telephone Survey Sample Sizes
Measure Population Target Surveys Achieved Surveys Clothes Washer 749 70 78
Central AC 7 7 1
Refrigerator 393 70 56
Dishwasher 149 70 20
Fixtures 17 17 2
Heat Pump Upgrade 43 43 9
Ceiling Fans 4 4 1
Electric Water Heater 41 41 5
Excluded Measures 66 0 0
Total 1,469 322 172
Table 11 details the screening process for eligible participants, which randomly selected 172 participants from 1,281 unique participants with California mailing addresses, valid phone numbers, and valid Pacific Power customer numbers.
Table 11. Participant Telephone Survey Sample
Total Total Records 1,469
No Phone Number 129
Measure Quantity Equals Zero 53
Duplicate Records 6
Eligible for call list 1,281
Completed Surveys 172
Response Rate* 13%
Cooperation Rate** 24% * Response rate: the number of customers completing a survey, divided by the number of eligible participants in call list.
** Cooperation rate: the number of customers completing a survey, divided by the number of customers reached by phone.
Retailer/Contractor Surveys In nearly all cases, Cadmus drew random samples, with sampled units having equal probabilities of being chosen. For the survey’s CFL section, however, the team weighted the probability of selecting a given retailer, based on their total CFL sales. This ensured capturing a sufficient number of large retailers in the sample, while retaining the desired statistical properties of a random sample.
Cadmus selected appliance and HVAC retailers and contractors for interviews based on their incented products, ensuring adequate representation of the greater program trade ally population. This approach, intended solely for qualitative analysis, offered an advantage over drawing random sample from groups too small to produce statistically valid estimates.
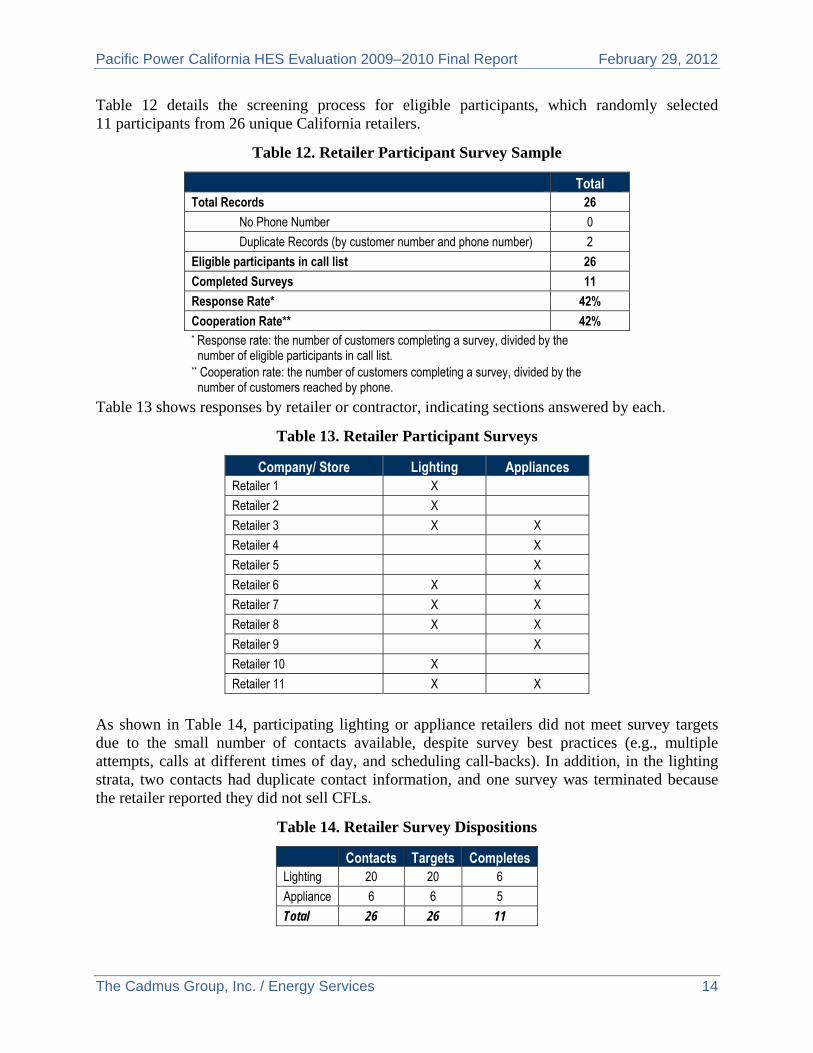
Pacific Power California HES Evaluation 2009–2010 Final Report February 29, 2012
The Cadmus Group, Inc. / Energy Services 14
Table 12 details the screening process for eligible participants, which randomly selected 11 participants from 26 unique California retailers.
Table 12. Retailer Participant Survey Sample
Total Total Records 26
No Phone Number 0
Duplicate Records (by customer number and phone number) 2
Eligible participants in call list 26
Completed Surveys 11
Response Rate* 42%
Cooperation Rate** 42% * Response rate: the number of customers completing a survey, divided by the number of eligible participants in call list.
** Cooperation rate: the number of customers completing a survey, divided by the number of customers reached by phone.
Table 13 shows responses by retailer or contractor, indicating sections answered by each.
Table 13. Retailer Participant Surveys
Company/ Store Lighting Appliances Retailer 1 X
Retailer 2 X
Retailer 3 X X
Retailer 4
X
Retailer 5
X
Retailer 6 X X
Retailer 7 X X
Retailer 8 X X
Retailer 9 X
Retailer 10 X
Retailer 11 X X
As shown in Table 14, participating lighting or appliance retailers did not meet survey targets due to the small number of contacts available, despite survey best practices (e.g., multiple attempts, calls at different times of day, and scheduling call-backs). In addition, in the lighting strata, two contacts had duplicate contact information, and one survey was terminated because the retailer reported they did not sell CFLs.
Table 14. Retailer Survey Dispositions
Contacts Targets Completes Lighting 20 20 6
Appliance 6 6 5
Total 26 26 11
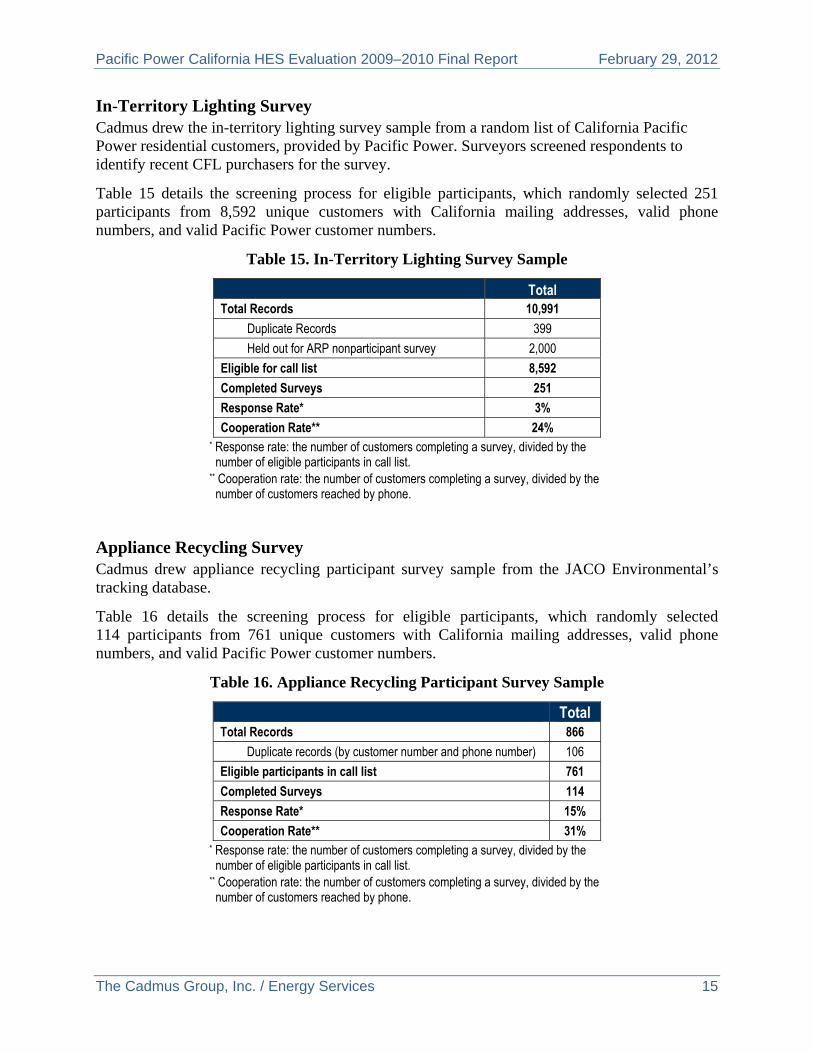
Pacific Power California HES Evaluation 2009–2010 Final Report February 29, 2012
The Cadmus Group, Inc. / Energy Services 15
In-Territory Lighting Survey Cadmus drew the in-territory lighting survey sample from a random list of California Pacific Power residential customers, provided by Pacific Power. Surveyors screened respondents to identify recent CFL purchasers for the survey.
Table 15 details the screening process for eligible participants, which randomly selected 251 participants from 8,592 unique customers with California mailing addresses, valid phone numbers, and valid Pacific Power customer numbers.
Table 15. In-Territory Lighting Survey Sample
Total Total Records 10,991
Duplicate Records 399
Held out for ARP nonparticipant survey 2,000
Eligible for call list 8,592
Completed Surveys 251
Response Rate* 3%
Cooperation Rate** 24% * Response rate: the number of customers completing a survey, divided by the number of eligible participants in call list.
** Cooperation rate: the number of customers completing a survey, divided by the number of customers reached by phone.
Appliance Recycling Survey Cadmus drew appliance recycling participant survey sample from the JACO Environmental’s tracking database.
Table 16 details the screening process for eligible participants, which randomly selected 114 participants from 761 unique customers with California mailing addresses, valid phone numbers, and valid Pacific Power customer numbers.
Table 16. Appliance Recycling Participant Survey Sample
Total Total Records 866
Duplicate records (by customer number and phone number) 106
Eligible participants in call list 761
Completed Surveys 114
Response Rate* 15%
Cooperation Rate** 31% * Response rate: the number of customers completing a survey, divided by the number of eligible participants in call list.
** Cooperation rate: the number of customers completing a survey, divided by the number of customers reached by phone.
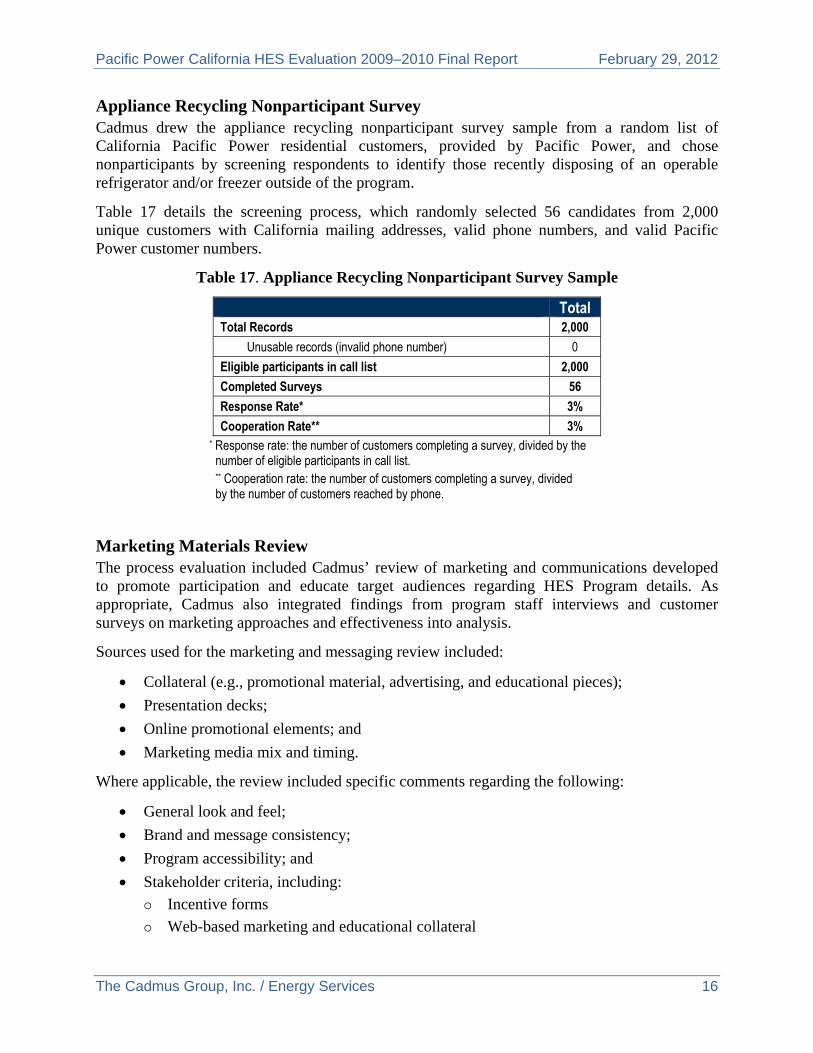
Pacific Power California HES Evaluation 2009–2010 Final Report February 29, 2012
The Cadmus Group, Inc. / Energy Services 16
Appliance Recycling Nonparticipant Survey Cadmus drew the appliance recycling nonparticipant survey sample from a random list of California Pacific Power residential customers, provided by Pacific Power, and chose nonparticipants by screening respondents to identify those recently disposing of an operable refrigerator and/or freezer outside of the program.
Table 17 details the screening process, which randomly selected 56 candidates from 2,000 unique customers with California mailing addresses, valid phone numbers, and valid Pacific Power customer numbers.
Table 17. Appliance Recycling Nonparticipant Survey Sample
Total Total Records 2,000
Unusable records (invalid phone number) 0
Eligible participants in call list 2,000
Completed Surveys 56
Response Rate* 3%
Cooperation Rate** 3% * Response rate: the number of customers completing a survey, divided by the number of eligible participants in call list. ** Cooperation rate: the number of customers completing a survey, divided by the number of customers reached by phone.
Marketing Materials Review The process evaluation included Cadmus’ review of marketing and communications developed to promote participation and educate target audiences regarding HES Program details. As appropriate, Cadmus also integrated findings from program staff interviews and customer surveys on marketing approaches and effectiveness into analysis.
Sources used for the marketing and messaging review included:
Collateral (e.g., promotional material, advertising, and educational pieces);
Presentation decks;
Online promotional elements; and
Marketing media mix and timing.
Where applicable, the review included specific comments regarding the following:
General look and feel;
Brand and message consistency;
Program accessibility; and
Stakeholder criteria, including:
Incentive forms
Web-based marketing and educational collateral
Pacific Power California HES Evaluation 2009–2010 Final Report February 29, 2012
The Cadmus Group, Inc. / Energy Services 17
Searchable retailer listings
Online processes availability
The marketing review also included a qualitative evaluation of online resources available from Pacific Power, and comparisons with other interactive resources.3
3 The online review assumed Pacific Power.net as an initial entry point for HES Program participants.
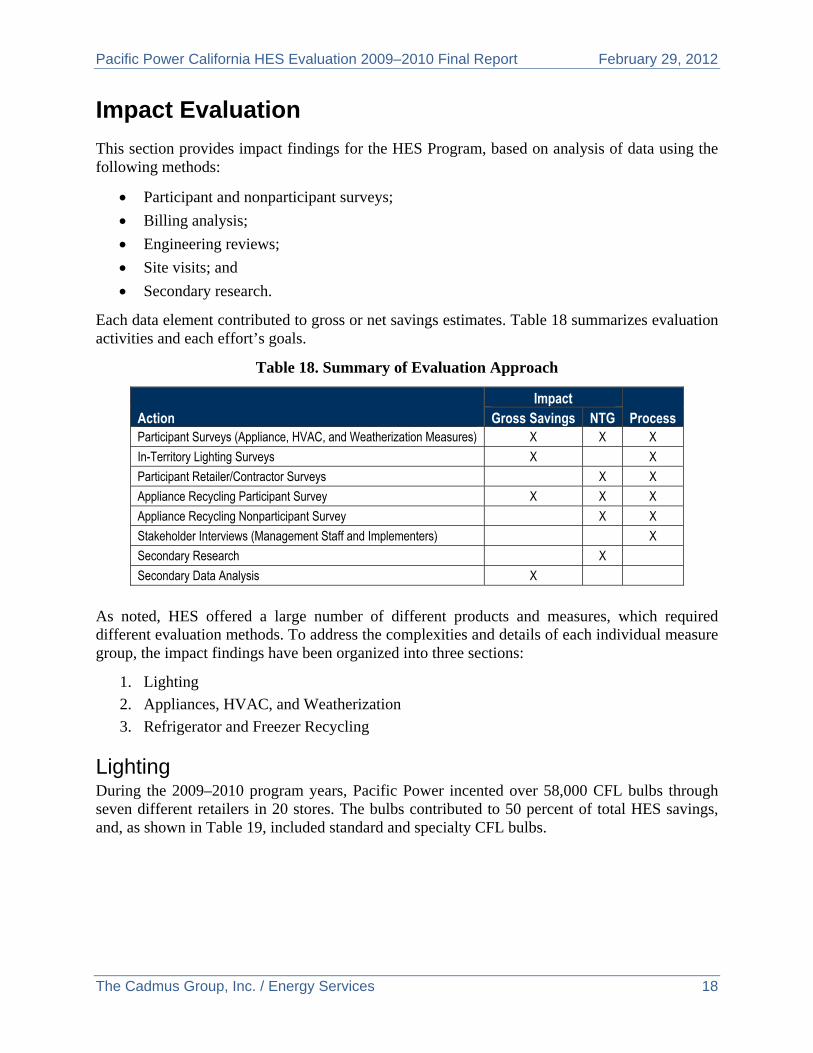
Pacific Power California HES Evaluation 2009–2010 Final Report February 29, 2012
The Cadmus Group, Inc. / Energy Services 18
Impact Evaluation
This section provides impact findings for the HES Program, based on analysis of data using the following methods:
Participant and nonparticipant surveys;
Billing analysis;
Engineering reviews;
Site visits; and
Secondary research.
Each data element contributed to gross or net savings estimates. Table 18 summarizes evaluation activities and each effort’s goals.
Table 18. Summary of Evaluation Approach
Action Impact
Process Gross Savings NTG Participant Surveys (Appliance, HVAC, and Weatherization Measures) X X X
In-Territory Lighting Surveys X X
Participant Retailer/Contractor Surveys
X X
Appliance Recycling Participant Survey X X X
Appliance Recycling Nonparticipant Survey X X
Stakeholder Interviews (Management Staff and Implementers)
X
Secondary Research
X
Secondary Data Analysis X
As noted, HES offered a large number of different products and measures, which required different evaluation methods. To address the complexities and details of each individual measure group, the impact findings have been organized into three sections:
1. Lighting
2. Appliances, HVAC, and Weatherization
3. Refrigerator and Freezer Recycling
Lighting During the 2009–2010 program years, Pacific Power incented over 58,000 CFL bulbs through seven different retailers in 20 stores. The bulbs contributed to 50 percent of total HES savings, and, as shown in Table 19, included standard and specialty CFL bulbs.
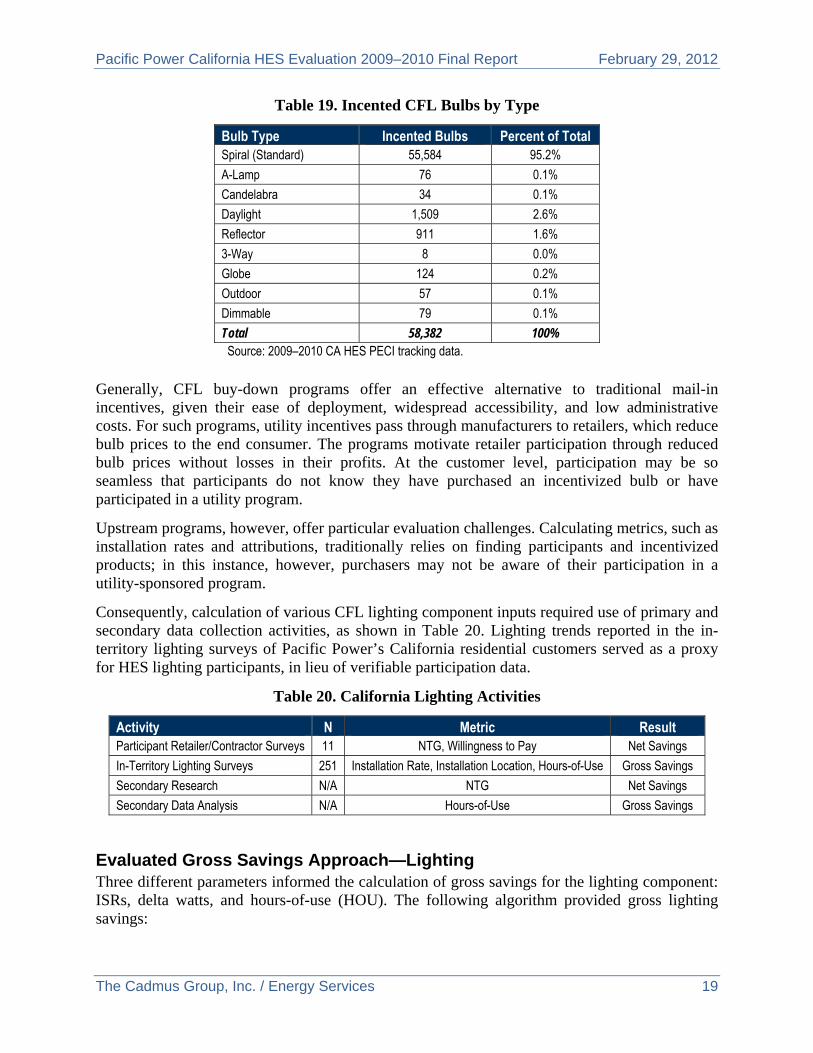
Pacific Power California HES Evaluation 2009–2010 Final Report February 29, 2012
The Cadmus Group, Inc. / Energy Services 19
Table 19. Incented CFL Bulbs by Type
Bulb Type Incented Bulbs Percent of Total Spiral (Standard) 55,584 95.2%
A-Lamp 76 0.1%
Candelabra 34 0.1%
Daylight 1,509 2.6%
Reflector 911 1.6%
3-Way 8 0.0%
Globe 124 0.2%
Outdoor 57 0.1%
Dimmable 79 0.1%
Total 58,382 100% Source: 2009–2010 CA HES PECI tracking data.
Generally, CFL buy-down programs offer an effective alternative to traditional mail-in incentives, given their ease of deployment, widespread accessibility, and low administrative costs. For such programs, utility incentives pass through manufacturers to retailers, which reduce bulb prices to the end consumer. The programs motivate retailer participation through reduced bulb prices without losses in their profits. At the customer level, participation may be so seamless that participants do not know they have purchased an incentivized bulb or have participated in a utility program.
Upstream programs, however, offer particular evaluation challenges. Calculating metrics, such as installation rates and attributions, traditionally relies on finding participants and incentivized products; in this instance, however, purchasers may not be aware of their participation in a utility-sponsored program.
Consequently, calculation of various CFL lighting component inputs required use of primary and secondary data collection activities, as shown in Table 20. Lighting trends reported in the in-territory lighting surveys of Pacific Power’s California residential customers served as a proxy for HES lighting participants, in lieu of verifiable participation data.
Table 20. California Lighting Activities
Activity N Metric Result Participant Retailer/Contractor Surveys 11 NTG, Willingness to Pay Net Savings
In-Territory Lighting Surveys 251 Installation Rate, Installation Location, Hours-of-Use Gross Savings
Secondary Research N/A NTG Net Savings
Secondary Data Analysis N/A Hours-of-Use Gross Savings
Evaluated Gross Savings Approach—Lighting Three different parameters informed the calculation of gross savings for the lighting component: ISRs, delta watts, and hours-of-use (HOU). The following algorithm provided gross lighting savings:
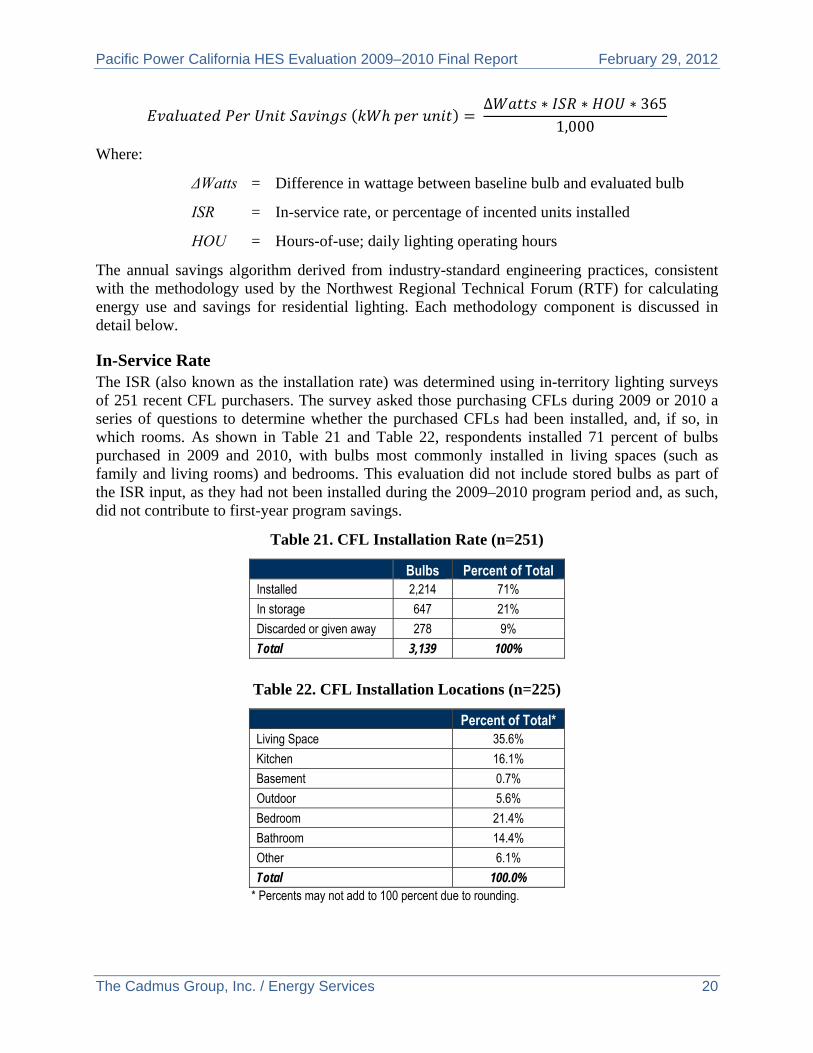
Pacific Power California HES Evaluation 2009–2010 Final Report February 29, 2012
The Cadmus Group, Inc. / Energy Services 20
∆ 365
1,000
Where:
ΔWatts = Difference in wattage between baseline bulb and evaluated bulb
ISR = In-service rate, or percentage of incented units installed
HOU = Hours-of-use; daily lighting operating hours
The annual savings algorithm derived from industry-standard engineering practices, consistent with the methodology used by the Northwest Regional Technical Forum (RTF) for calculating energy use and savings for residential lighting. Each methodology component is discussed in detail below.
In-Service Rate The ISR (also known as the installation rate) was determined using in-territory lighting surveys of 251 recent CFL purchasers. The survey asked those purchasing CFLs during 2009 or 2010 a series of questions to determine whether the purchased CFLs had been installed, and, if so, in which rooms. As shown in Table 21 and Table 22, respondents installed 71 percent of bulbs purchased in 2009 and 2010, with bulbs most commonly installed in living spaces (such as family and living rooms) and bedrooms. This evaluation did not include stored bulbs as part of the ISR input, as they had not been installed during the 2009–2010 program period and, as such, did not contribute to first-year program savings.
Table 21. CFL Installation Rate (n=251)
Bulbs Percent of Total Installed 2,214 71%
In storage 647 21%
Discarded or given away 278 9%
Total 3,139 100%
Table 22. CFL Installation Locations (n=225)
Percent of Total* Living Space 35.6%
Kitchen 16.1%
Basement 0.7%
Outdoor 5.6%
Bedroom 21.4%
Bathroom 14.4%
Other 6.1%
Total 100.0% * Percents may not add to 100 percent due to rounding.
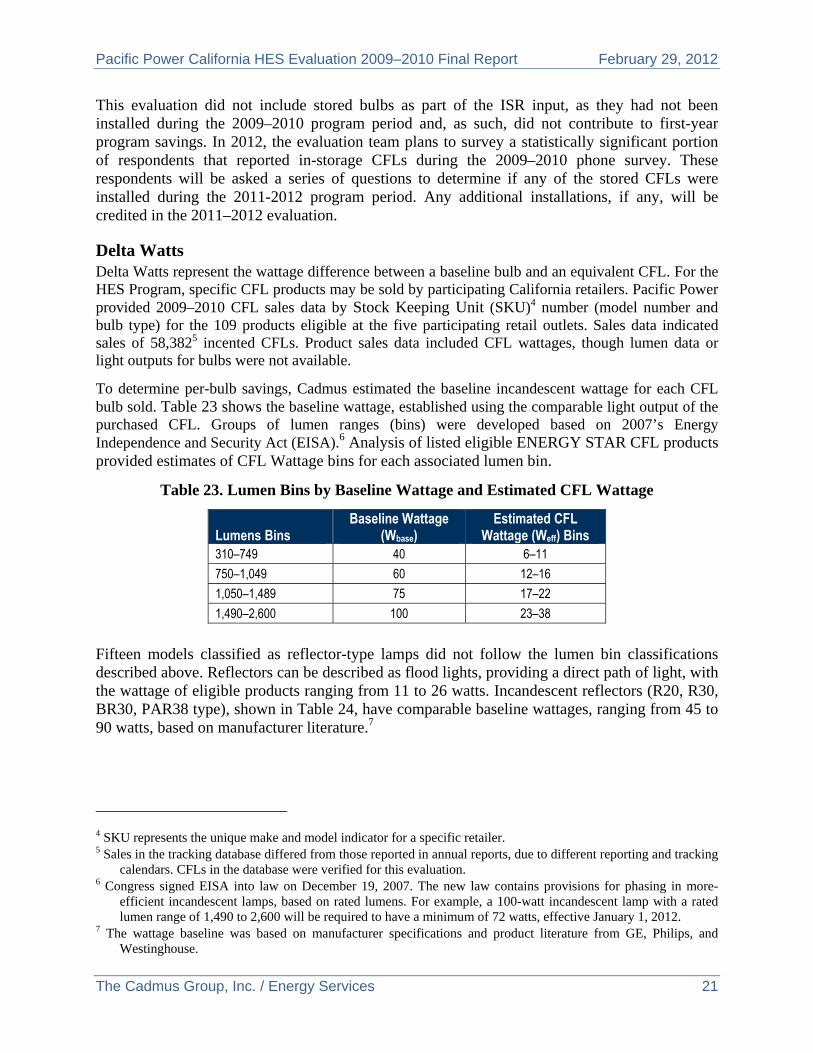
Pacific Power California HES Evaluation 2009–2010 Final Report February 29, 2012
The Cadmus Group, Inc. / Energy Services 21
This evaluation did not include stored bulbs as part of the ISR input, as they had not been installed during the 2009–2010 program period and, as such, did not contribute to first-year program savings. In 2012, the evaluation team plans to survey a statistically significant portion of respondents that reported in-storage CFLs during the 2009–2010 phone survey. These respondents will be asked a series of questions to determine if any of the stored CFLs were installed during the 2011-2012 program period. Any additional installations, if any, will be credited in the 2011–2012 evaluation.
Delta Watts Delta Watts represent the wattage difference between a baseline bulb and an equivalent CFL. For the HES Program, specific CFL products may be sold by participating California retailers. Pacific Power provided 2009–2010 CFL sales data by Stock Keeping Unit (SKU)4 number (model number and bulb type) for the 109 products eligible at the five participating retail outlets. Sales data indicated sales of 58,3825 incented CFLs. Product sales data included CFL wattages, though lumen data or light outputs for bulbs were not available.
To determine per-bulb savings, Cadmus estimated the baseline incandescent wattage for each CFL bulb sold. Table 23 shows the baseline wattage, established using the comparable light output of the purchased CFL. Groups of lumen ranges (bins) were developed based on 2007’s Energy Independence and Security Act (EISA).6 Analysis of listed eligible ENERGY STAR CFL products provided estimates of CFL Wattage bins for each associated lumen bin.
Table 23. Lumen Bins by Baseline Wattage and Estimated CFL Wattage
Lumens Bins Baseline Wattage
(Wbase) Estimated CFL
Wattage (Weff) Bins 310–749 40 6–11
750–1,049 60 12–16
1,050–1,489 75 17–22
1,490–2,600 100 23–38
Fifteen models classified as reflector-type lamps did not follow the lumen bin classifications described above. Reflectors can be described as flood lights, providing a direct path of light, with the wattage of eligible products ranging from 11 to 26 watts. Incandescent reflectors (R20, R30, BR30, PAR38 type), shown in Table 24, have comparable baseline wattages, ranging from 45 to 90 watts, based on manufacturer literature.7
4 SKU represents the unique make and model indicator for a specific retailer. 5 Sales in the tracking database differed from those reported in annual reports, due to different reporting and tracking
calendars. CFLs in the database were verified for this evaluation. 6 Congress signed EISA into law on December 19, 2007. The new law contains provisions for phasing in more-
efficient incandescent lamps, based on rated lumens. For example, a 100-watt incandescent lamp with a rated lumen range of 1,490 to 2,600 will be required to have a minimum of 72 watts, effective January 1, 2012.
7 The wattage baseline was based on manufacturer specifications and product literature from GE, Philips, and Westinghouse.
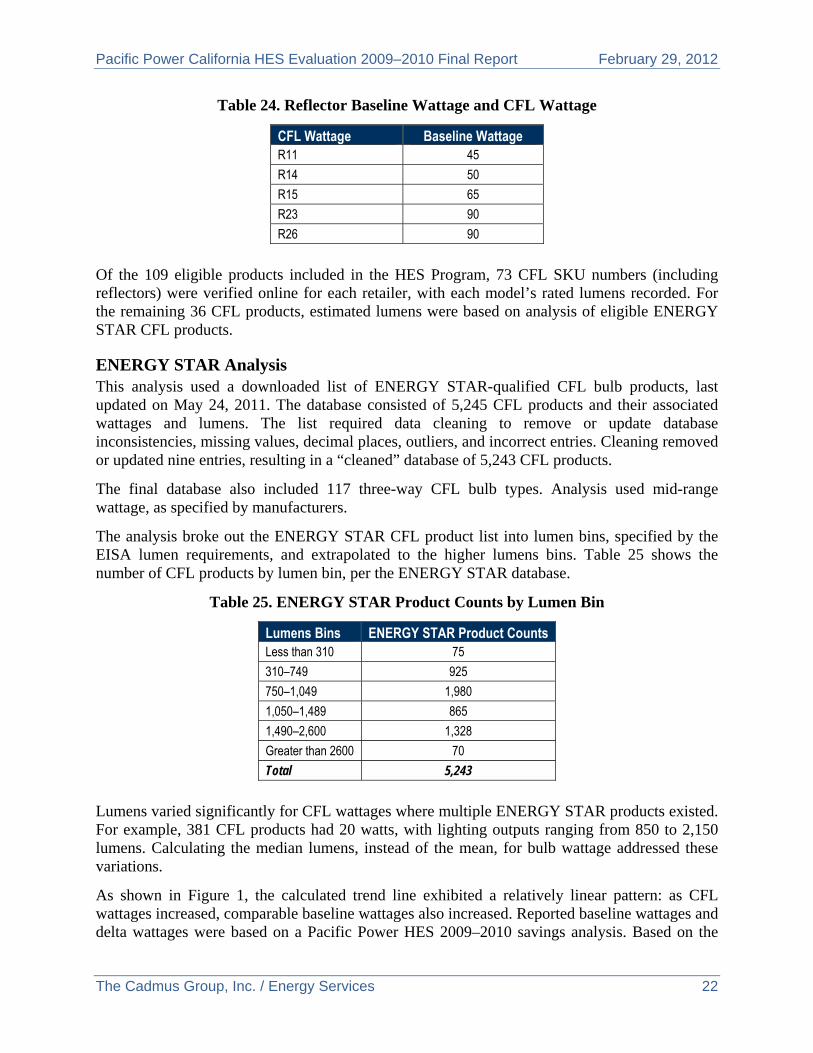
Pacific Power California HES Evaluation 2009–2010 Final Report February 29, 2012
The Cadmus Group, Inc. / Energy Services 22
Table 24. Reflector Baseline Wattage and CFL Wattage
CFL Wattage Baseline Wattage R11 45
R14 50
R15 65
R23 90
R26 90
Of the 109 eligible products included in the HES Program, 73 CFL SKU numbers (including reflectors) were verified online for each retailer, with each model’s rated lumens recorded. For the remaining 36 CFL products, estimated lumens were based on analysis of eligible ENERGY STAR CFL products.
ENERGY STAR Analysis This analysis used a downloaded list of ENERGY STAR-qualified CFL bulb products, last updated on May 24, 2011. The database consisted of 5,245 CFL products and their associated wattages and lumens. The list required data cleaning to remove or update database inconsistencies, missing values, decimal places, outliers, and incorrect entries. Cleaning removed or updated nine entries, resulting in a “cleaned” database of 5,243 CFL products.
The final database also included 117 three-way CFL bulb types. Analysis used mid-range wattage, as specified by manufacturers.
The analysis broke out the ENERGY STAR CFL product list into lumen bins, specified by the EISA lumen requirements, and extrapolated to the higher lumens bins. Table 25 shows the number of CFL products by lumen bin, per the ENERGY STAR database.
Table 25. ENERGY STAR Product Counts by Lumen Bin
Lumens Bins ENERGY STAR Product Counts Less than 310 75
310–749 925
750–1,049 1,980
1,050–1,489 865
1,490–2,600 1,328
Greater than 2600 70
Total 5,243
Lumens varied significantly for CFL wattages where multiple ENERGY STAR products existed. For example, 381 CFL products had 20 watts, with lighting outputs ranging from 850 to 2,150 lumens. Calculating the median lumens, instead of the mean, for bulb wattage addressed these variations.
As shown in Figure 1, the calculated trend line exhibited a relatively linear pattern: as CFL wattages increased, comparable baseline wattages also increased. Reported baseline wattages and delta wattages were based on a Pacific Power HES 2009–2010 savings analysis. Based on the
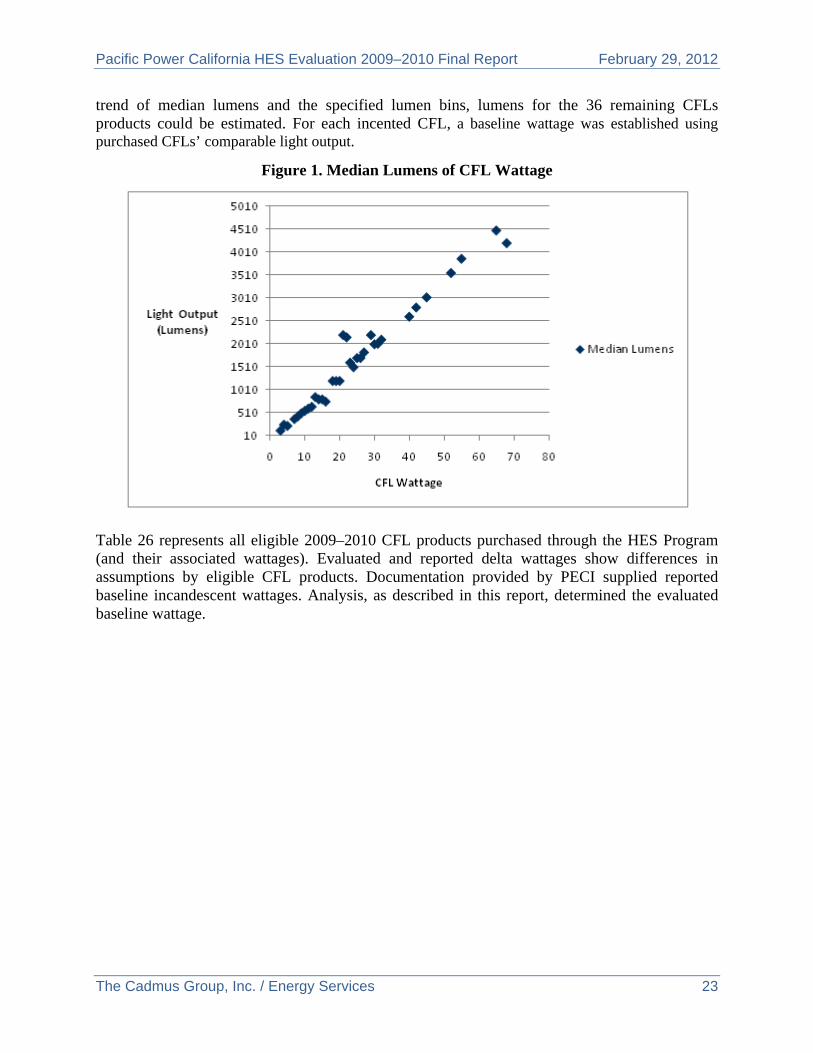
Pacific Power California HES Evaluation 2009–2010 Final Report February 29, 2012
The Cadmus Group, Inc. / Energy Services 23
trend of median lumens and the specified lumen bins, lumens for the 36 remaining CFLs products could be estimated. For each incented CFL, a baseline wattage was established using purchased CFLs’ comparable light output.
Figure 1. Median Lumens of CFL Wattage
Table 26 represents all eligible 2009–2010 CFL products purchased through the HES Program (and their associated wattages). Evaluated and reported delta wattages show differences in assumptions by eligible CFL products. Documentation provided by PECI supplied reported baseline incandescent wattages. Analysis, as described in this report, determined the evaluated baseline wattage.
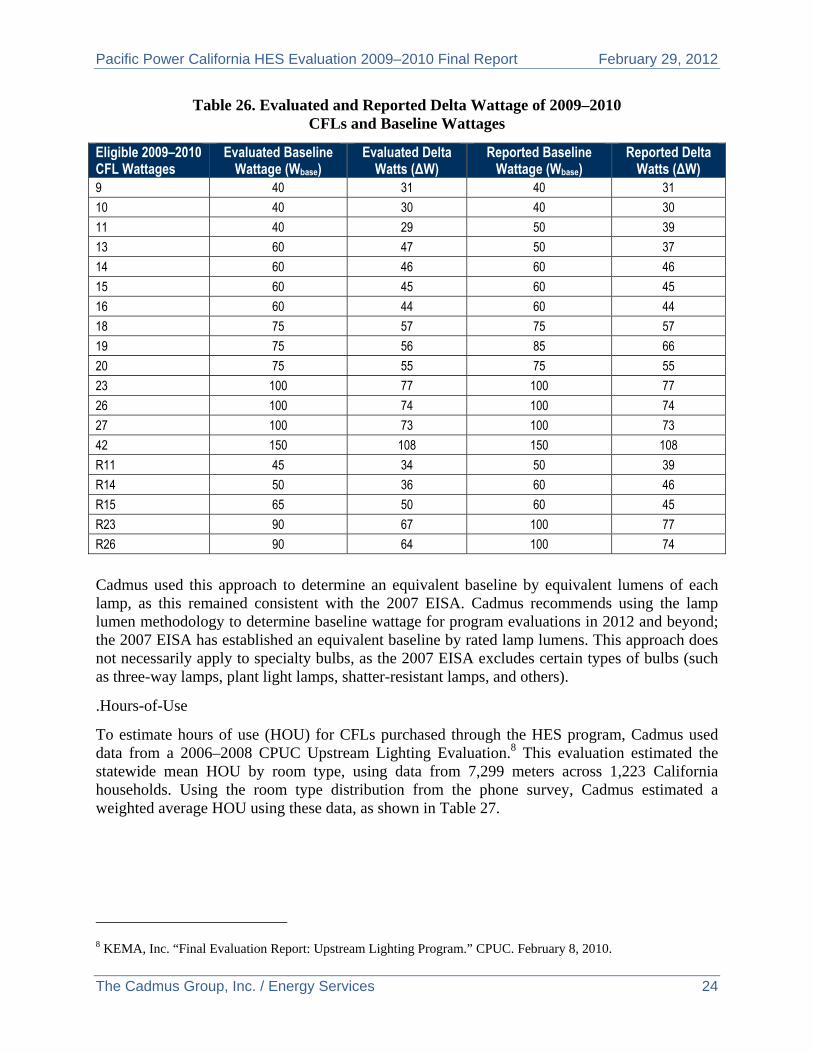
Pacific Power California HES Evaluation 2009–2010 Final Report February 29, 2012
The Cadmus Group, Inc. / Energy Services 24
Table 26. Evaluated and Reported Delta Wattage of 2009–2010 CFLs and Baseline Wattages
Eligible 2009–2010 CFL Wattages
Evaluated Baseline Wattage (Wbase)
Evaluated Delta Watts (ΔW)
Reported Baseline Wattage (Wbase)
Reported Delta Watts (ΔW)
9 40 31 40 31
10 40 30 40 30
11 40 29 50 39
13 60 47 50 37
14 60 46 60 46
15 60 45 60 45
16 60 44 60 44
18 75 57 75 57
19 75 56 85 66
20 75 55 75 55
23 100 77 100 77
26 100 74 100 74
27 100 73 100 73
42 150 108 150 108
R11 45 34 50 39
R14 50 36 60 46
R15 65 50 60 45
R23 90 67 100 77
R26 90 64 100 74
Cadmus used this approach to determine an equivalent baseline by equivalent lumens of each lamp, as this remained consistent with the 2007 EISA. Cadmus recommends using the lamp lumen methodology to determine baseline wattage for program evaluations in 2012 and beyond; the 2007 EISA has established an equivalent baseline by rated lamp lumens. This approach does not necessarily apply to specialty bulbs, as the 2007 EISA excludes certain types of bulbs (such as three-way lamps, plant light lamps, shatter-resistant lamps, and others).
.Hours-of-Use
To estimate hours of use (HOU) for CFLs purchased through the HES program, Cadmus used data from a 2006–2008 CPUC Upstream Lighting Evaluation.8 This evaluation estimated the statewide mean HOU by room type, using data from 7,299 meters across 1,223 California households. Using the room type distribution from the phone survey, Cadmus estimated a weighted average HOU using these data, as shown in Table 27.
8 KEMA, Inc. “Final Evaluation Report: Upstream Lighting Program.” CPUC. February 8, 2010.
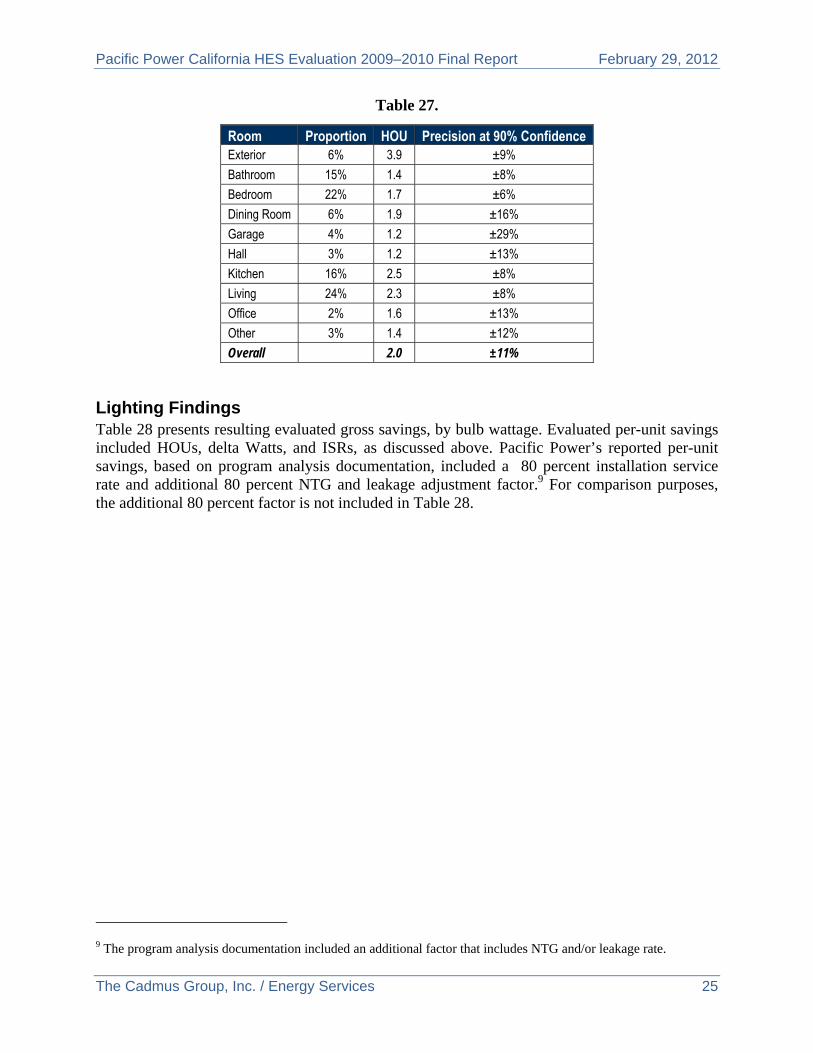
Pacific Power California HES Evaluation 2009–2010 Final Report February 29, 2012
The Cadmus Group, Inc. / Energy Services 25
Table 27.
Room Proportion HOU Precision at 90% Confidence Exterior 6% 3.9 ±9%
Bathroom 15% 1.4 ±8%
Bedroom 22% 1.7 ±6%
Dining Room 6% 1.9 ±16%
Garage 4% 1.2 ±29%
Hall 3% 1.2 ±13%
Kitchen 16% 2.5 ±8%
Living 24% 2.3 ±8%
Office 2% 1.6 ±13%
Other 3% 1.4 ±12%
Overall 2.0 ±11%
Lighting Findings Table 28 presents resulting evaluated gross savings, by bulb wattage. Evaluated per-unit savings included HOUs, delta Watts, and ISRs, as discussed above. Pacific Power’s reported per-unit savings, based on program analysis documentation, included a 80 percent installation service rate and additional 80 percent NTG and leakage adjustment factor.9 For comparison purposes, the additional 80 percent factor is not included in Table 28.
9 The program analysis documentation included an additional factor that includes NTG and/or leakage rate.
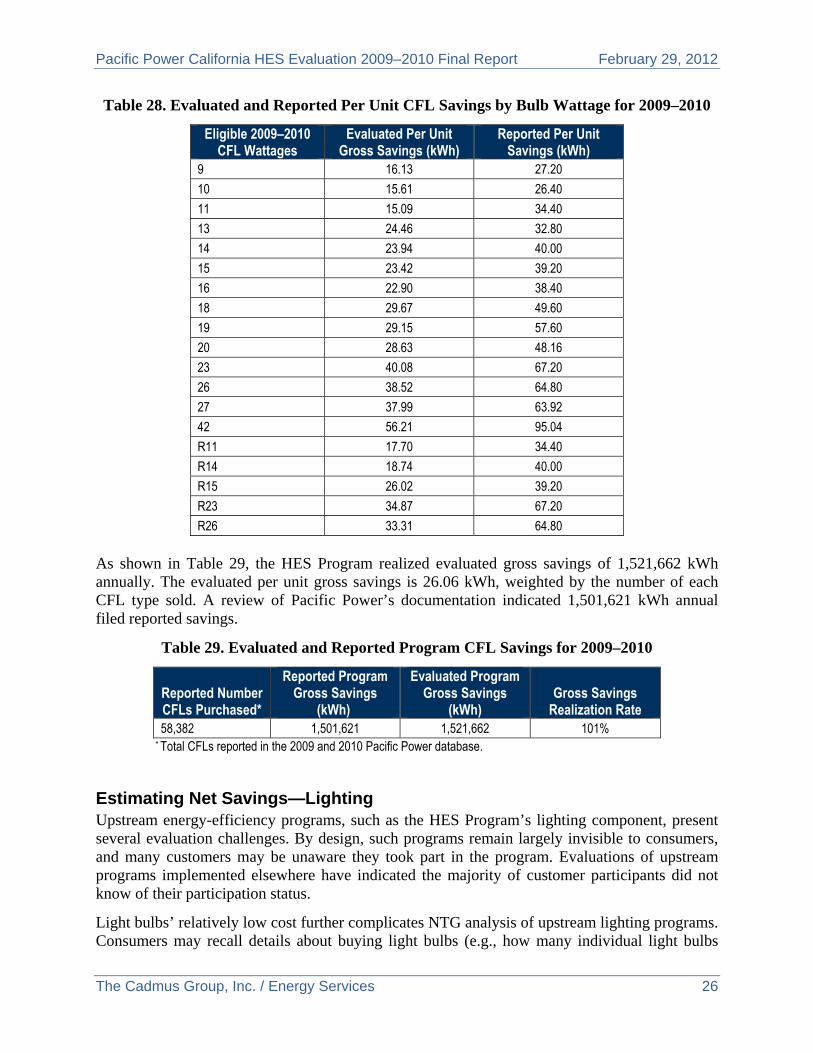
Pacific Power California HES Evaluation 2009–2010 Final Report February 29, 2012
The Cadmus Group, Inc. / Energy Services 26
Table 28. Evaluated and Reported Per Unit CFL Savings by Bulb Wattage for 2009–2010
Eligible 2009–2010 CFL Wattages
Evaluated Per Unit Gross Savings (kWh)
Reported Per Unit Savings (kWh)
9 16.13 27.20
10 15.61 26.40
11 15.09 34.40
13 24.46 32.80
14 23.94 40.00
15 23.42 39.20
16 22.90 38.40
18 29.67 49.60
19 29.15 57.60
20 28.63 48.16
23 40.08 67.20
26 38.52 64.80
27 37.99 63.92
42 56.21 95.04
R11 17.70 34.40
R14 18.74 40.00
R15 26.02 39.20
R23 34.87 67.20
R26 33.31 64.80
As shown in Table 29, the HES Program realized evaluated gross savings of 1,521,662 kWh annually. The evaluated per unit gross savings is 26.06 kWh, weighted by the number of each CFL type sold. A review of Pacific Power’s documentation indicated 1,501,621 kWh annual filed reported savings.
Table 29. Evaluated and Reported Program CFL Savings for 2009–2010
Reported Number CFLs Purchased*
Reported Program Gross Savings
(kWh)
Evaluated Program Gross Savings
(kWh) Gross Savings
Realization Rate 58,382 1,501,621 1,521,662 101%
* Total CFLs reported in the 2009 and 2010 Pacific Power database.
Estimating Net Savings—Lighting Upstream energy-efficiency programs, such as the HES Program’s lighting component, present several evaluation challenges. By design, such programs remain largely invisible to consumers, and many customers may be unaware they took part in the program. Evaluations of upstream programs implemented elsewhere have indicated the majority of customer participants did not know of their participation status.
Light bulbs’ relatively low cost further complicates NTG analysis of upstream lighting programs. Consumers may recall details about buying light bulbs (e.g., how many individual light bulbs
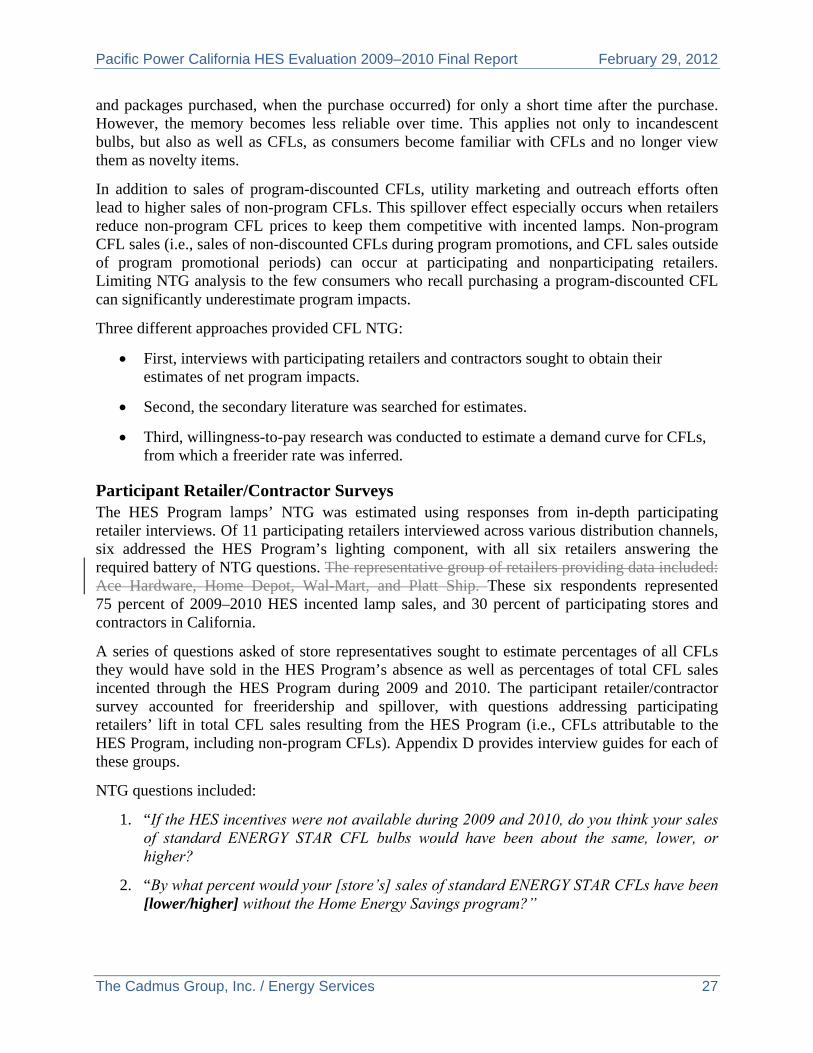
Pacific Power California HES Evaluation 2009–2010 Final Report February 29, 2012
The Cadmus Group, Inc. / Energy Services 27
and packages purchased, when the purchase occurred) for only a short time after the purchase. However, the memory becomes less reliable over time. This applies not only to incandescent bulbs, but also as well as CFLs, as consumers become familiar with CFLs and no longer view them as novelty items.
In addition to sales of program-discounted CFLs, utility marketing and outreach efforts often lead to higher sales of non-program CFLs. This spillover effect especially occurs when retailers reduce non-program CFL prices to keep them competitive with incented lamps. Non-program CFL sales (i.e., sales of non-discounted CFLs during program promotions, and CFL sales outside of program promotional periods) can occur at participating and nonparticipating retailers. Limiting NTG analysis to the few consumers who recall purchasing a program-discounted CFL can significantly underestimate program impacts.
Three different approaches provided CFL NTG:
First, interviews with participating retailers and contractors sought to obtain their estimates of net program impacts.
Second, the secondary literature was searched for estimates.
Third, willingness-to-pay research was conducted to estimate a demand curve for CFLs, from which a freerider rate was inferred.
Participant Retailer/Contractor Surveys The HES Program lamps’ NTG was estimated using responses from in-depth participating retailer interviews. Of 11 participating retailers interviewed across various distribution channels, six addressed the HES Program’s lighting component, with all six retailers answering the required battery of NTG questions. The representative group of retailers providing data included: Ace Hardware, Home Depot, Wal-Mart, and Platt Ship. These six respondents represented 75 percent of 2009–2010 HES incented lamp sales, and 30 percent of participating stores and contractors in California.
A series of questions asked of store representatives sought to estimate percentages of all CFLs they would have sold in the HES Program’s absence as well as percentages of total CFL sales incented through the HES Program during 2009 and 2010. The participant retailer/contractor survey accounted for freeridership and spillover, with questions addressing participating retailers’ lift in total CFL sales resulting from the HES Program (i.e., CFLs attributable to the HES Program, including non-program CFLs). Appendix D provides interview guides for each of these groups.
NTG questions included:
1. “If the HES incentives were not available during 2009 and 2010, do you think your sales of standard ENERGY STAR CFL bulbs would have been about the same, lower, or higher?
2. “By what percent would your [store’s] sales of standard ENERGY STAR CFLs have been [lower/higher] without the Home Energy Savings program?”
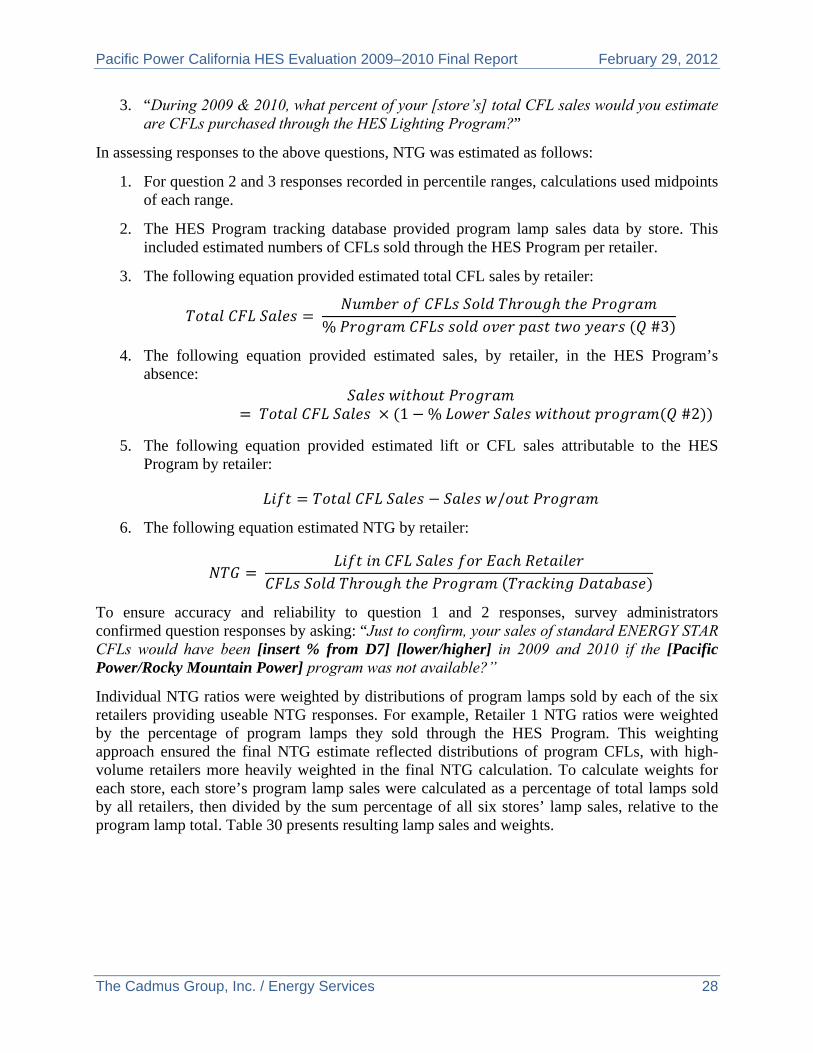
Pacific Power California HES Evaluation 2009–2010 Final Report February 29, 2012
The Cadmus Group, Inc. / Energy Services 28
3. “During 2009 & 2010, what percent of your [store’s] total CFL sales would you estimate are CFLs purchased through the HES Lighting Program?”
In assessing responses to the above questions, NTG was estimated as follows:
1. For question 2 and 3 responses recorded in percentile ranges, calculations used midpoints of each range.
2. The HES Program tracking database provided program lamp sales data by store. This included estimated numbers of CFLs sold through the HES Program per retailer.
3. The following equation provided estimated total CFL sales by retailer:
% #3
4. The following equation provided estimated sales, by retailer, in the HES Program’s absence:
1 % #2
5. The following equation provided estimated lift or CFL sales attributable to the HES Program by retailer:
/
6. The following equation estimated NTG by retailer:
To ensure accuracy and reliability to question 1 and 2 responses, survey administrators confirmed question responses by asking: “Just to confirm, your sales of standard ENERGY STAR CFLs would have been [insert % from D7] [lower/higher] in 2009 and 2010 if the [Pacific Power/Rocky Mountain Power] program was not available?”
Individual NTG ratios were weighted by distributions of program lamps sold by each of the six retailers providing useable NTG responses. For example, Retailer 1 NTG ratios were weighted by the percentage of program lamps they sold through the HES Program. This weighting approach ensured the final NTG estimate reflected distributions of program CFLs, with high-volume retailers more heavily weighted in the final NTG calculation. To calculate weights for each store, each store’s program lamp sales were calculated as a percentage of total lamps sold by all retailers, then divided by the sum percentage of all six stores’ lamp sales, relative to the program lamp total. Table 30 presents resulting lamp sales and weights.
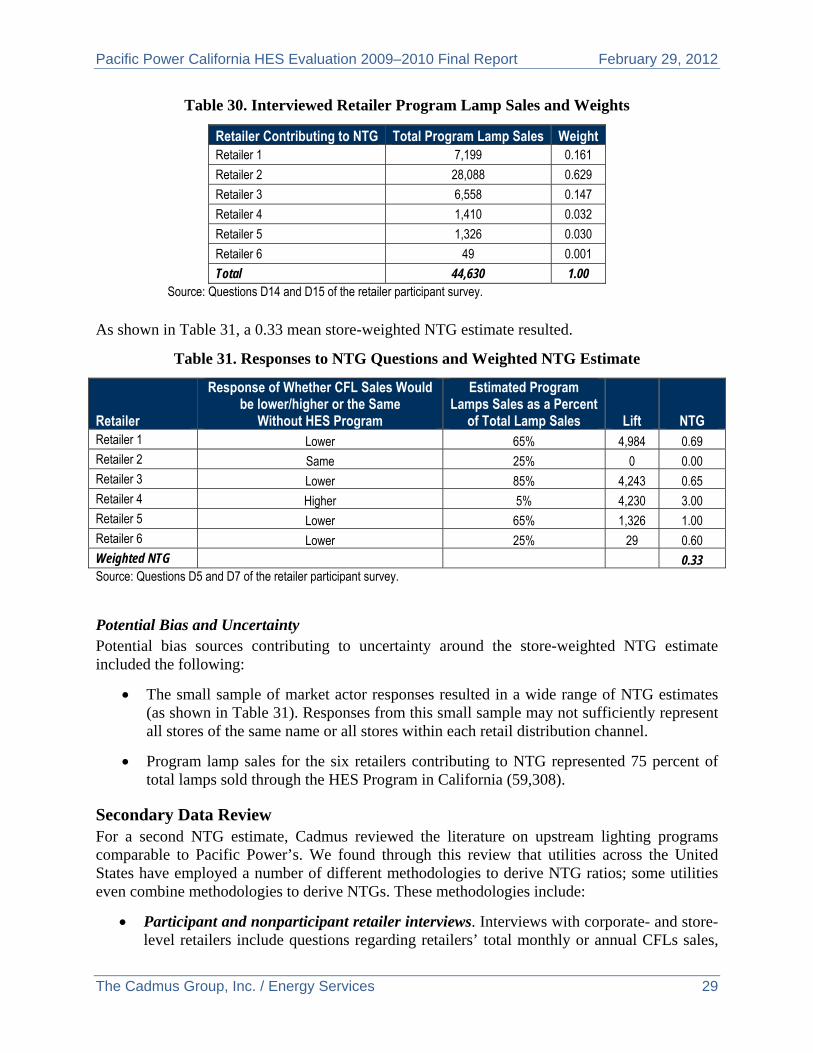
Pacific Power California HES Evaluation 2009–2010 Final Report February 29, 2012
The Cadmus Group, Inc. / Energy Services 29
Table 30. Interviewed Retailer Program Lamp Sales and Weights
Retailer Contributing to NTG Total Program Lamp Sales Weight Retailer 1 7,199 0.161
Retailer 2 28,088 0.629
Retailer 3 6,558 0.147
Retailer 4 1,410 0.032
Retailer 5 1,326 0.030
Retailer 6 49 0.001
Total 44,630 1.00 Source: Questions D14 and D15 of the retailer participant survey.
As shown in Table 31, a 0.33 mean store-weighted NTG estimate resulted.
Table 31. Responses to NTG Questions and Weighted NTG Estimate
Retailer
Response of Whether CFL Sales Would be lower/higher or the Same
Without HES Program
Estimated Program Lamps Sales as a Percent
of Total Lamp Sales Lift NTG Retailer 1 Lower 65% 4,984 0.69 Retailer 2 Same 25% 0 0.00 Retailer 3 Lower 85% 4,243 0.65 Retailer 4 Higher 5% 4,230 3.00 Retailer 5 Lower 65% 1,326 1.00 Retailer 6 Lower 25% 29 0.60 Weighted NTG 0.33 Source: Questions D5 and D7 of the retailer participant survey.
Potential Bias and Uncertainty Potential bias sources contributing to uncertainty around the store-weighted NTG estimate included the following:
The small sample of market actor responses resulted in a wide range of NTG estimates (as shown in Table 31). Responses from this small sample may not sufficiently represent all stores of the same name or all stores within each retail distribution channel.
Program lamp sales for the six retailers contributing to NTG represented 75 percent of total lamps sold through the HES Program in California (59,308).
Secondary Data Review For a second NTG estimate, Cadmus reviewed the literature on upstream lighting programs comparable to Pacific Power’s. We found through this review that utilities across the United States have employed a number of different methodologies to derive NTG ratios; some utilities even combine methodologies to derive NTGs. These methodologies include:
Participant and nonparticipant retailer interviews. Interviews with corporate- and store-level retailers include questions regarding retailers’ total monthly or annual CFLs sales,
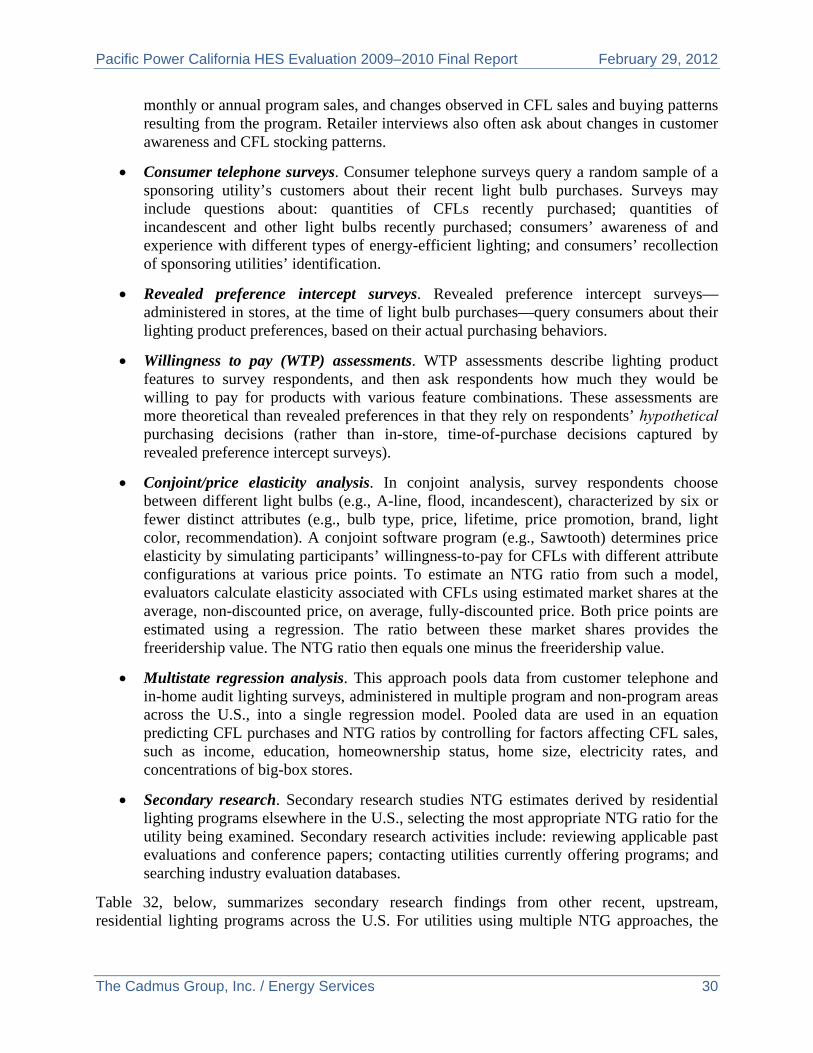
Pacific Power California HES Evaluation 2009–2010 Final Report February 29, 2012
The Cadmus Group, Inc. / Energy Services 30
monthly or annual program sales, and changes observed in CFL sales and buying patterns resulting from the program. Retailer interviews also often ask about changes in customer awareness and CFL stocking patterns.
Consumer telephone surveys. Consumer telephone surveys query a random sample of a sponsoring utility’s customers about their recent light bulb purchases. Surveys may include questions about: quantities of CFLs recently purchased; quantities of incandescent and other light bulbs recently purchased; consumers’ awareness of and experience with different types of energy-efficient lighting; and consumers’ recollection of sponsoring utilities’ identification.
Revealed preference intercept surveys. Revealed preference intercept surveys—administered in stores, at the time of light bulb purchases—query consumers about their lighting product preferences, based on their actual purchasing behaviors.
Willingness to pay (WTP) assessments. WTP assessments describe lighting product features to survey respondents, and then ask respondents how much they would be willing to pay for products with various feature combinations. These assessments are more theoretical than revealed preferences in that they rely on respondents’ hypothetical purchasing decisions (rather than in-store, time-of-purchase decisions captured by revealed preference intercept surveys).
Conjoint/price elasticity analysis. In conjoint analysis, survey respondents choose between different light bulbs (e.g., A-line, flood, incandescent), characterized by six or fewer distinct attributes (e.g., bulb type, price, lifetime, price promotion, brand, light color, recommendation). A conjoint software program (e.g., Sawtooth) determines price elasticity by simulating participants’ willingness-to-pay for CFLs with different attribute configurations at various price points. To estimate an NTG ratio from such a model, evaluators calculate elasticity associated with CFLs using estimated market shares at the average, non-discounted price, on average, fully-discounted price. Both price points are estimated using a regression. The ratio between these market shares provides the freeridership value. The NTG ratio then equals one minus the freeridership value.
Multistate regression analysis. This approach pools data from customer telephone and in-home audit lighting surveys, administered in multiple program and non-program areas across the U.S., into a single regression model. Pooled data are used in an equation predicting CFL purchases and NTG ratios by controlling for factors affecting CFL sales, such as income, education, homeownership status, home size, electricity rates, and concentrations of big-box stores.
Secondary research. Secondary research studies NTG estimates derived by residential lighting programs elsewhere in the U.S., selecting the most appropriate NTG ratio for the utility being examined. Secondary research activities include: reviewing applicable past evaluations and conference papers; contacting utilities currently offering programs; and searching industry evaluation databases.
Table 32, below, summarizes secondary research findings from other recent, upstream, residential lighting programs across the U.S. For utilities using multiple NTG approaches, the
Pacific Power California HES Evaluation 2009–2010 Final Report February 29, 2012
The Cadmus Group, Inc. / Energy Services 31
table shows NTG for each approach as well as the final NTG the utility selected for the overall program.
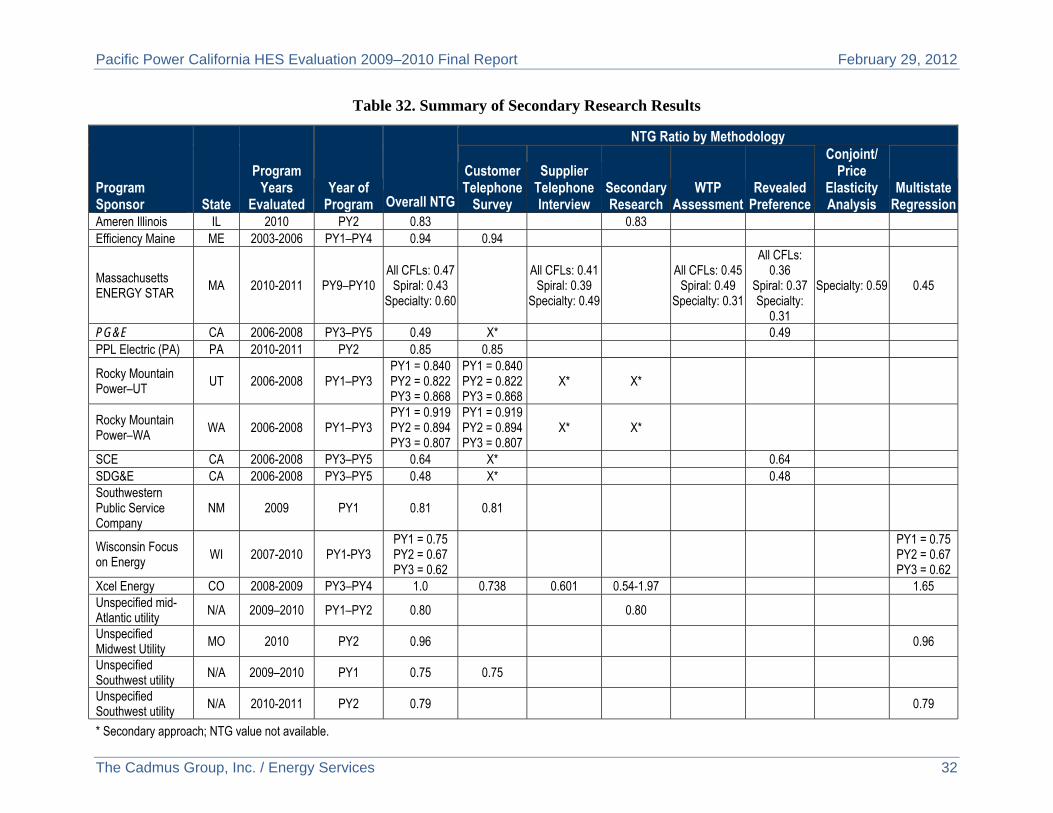
Pacific Power California HES Evaluation 2009–2010 Final Report February 29, 2012
The Cadmus Group, Inc. / Energy Services 32
Table 32. Summary of Secondary Research Results
Program Sponsor State
Program Years
Evaluated Year of
Program Overall NTG
NTG Ratio by Methodology
Customer Telephone
Survey
Supplier Telephone Interview
Secondary Research
WTP Assessment
Revealed Preference
Conjoint/ Price
Elasticity Analysis
Multistate Regression
Ameren Illinois IL 2010 PY2 0.83 0.83 Efficiency Maine ME 2003-2006 PY1–PY4 0.94 0.94
Massachusetts ENERGY STAR
MA 2010-2011 PY9–PY10 All CFLs: 0.47
Spiral: 0.43 Specialty: 0.60
All CFLs: 0.41
Spiral: 0.39 Specialty: 0.49
All CFLs: 0.45
Spiral: 0.49 Specialty: 0.31
All CFLs: 0.36
Spiral: 0.37 Specialty:
0.31
Specialty: 0.59 0.45
PG&E CA 2006-2008 PY3–PY5 0.49 X* 0.49 PPL Electric (PA) PA 2010-2011 PY2 0.85 0.85
Rocky Mountain Power–UT UT 2006-2008 PY1–PY3
PY1 = 0.840 PY2 = 0.822 PY3 = 0.868
PY1 = 0.840 PY2 = 0.822 PY3 = 0.868
X* X*
Rocky Mountain Power–WA WA 2006-2008 PY1–PY3
PY1 = 0.919 PY2 = 0.894 PY3 = 0.807
PY1 = 0.919 PY2 = 0.894 PY3 = 0.807
X* X*
SCE CA 2006-2008 PY3–PY5 0.64 X* 0.64 SDG&E CA 2006-2008 PY3–PY5 0.48 X* 0.48 Southwestern Public Service Company
NM 2009 PY1 0.81 0.81
Wisconsin Focus on Energy WI 2007-2010 PY1-PY3
PY1 = 0.75 PY2 = 0.67 PY3 = 0.62
PY1 = 0.75 PY2 = 0.67 PY3 = 0.62
Xcel Energy CO 2008-2009 PY3–PY4 1.0 0.738 0.601 0.54-1.97 1.65 Unspecified mid-Atlantic utility N/A 2009–2010 PY1–PY2 0.80 0.80
Unspecified Midwest Utility MO 2010 PY2 0.96 0.96
Unspecified Southwest utility
N/A 2009–2010 PY1 0.75 0.75
Unspecified Southwest utility
N/A 2010-2011 PY2 0.79 0.79
* Secondary approach; NTG value not available.
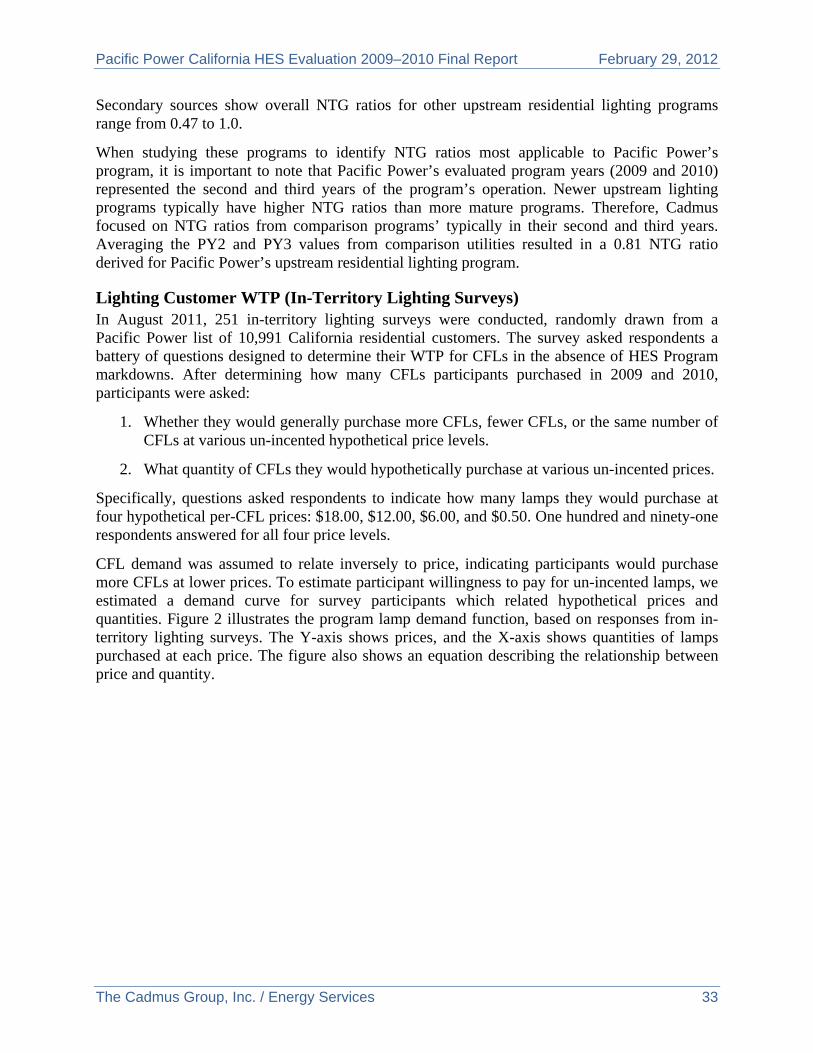
Pacific Power California HES Evaluation 2009–2010 Final Report February 29, 2012
The Cadmus Group, Inc. / Energy Services 33
Secondary sources show overall NTG ratios for other upstream residential lighting programs range from 0.47 to 1.0.
When studying these programs to identify NTG ratios most applicable to Pacific Power’s program, it is important to note that Pacific Power’s evaluated program years (2009 and 2010) represented the second and third years of the program’s operation. Newer upstream lighting programs typically have higher NTG ratios than more mature programs. Therefore, Cadmus focused on NTG ratios from comparison programs’ typically in their second and third years. Averaging the PY2 and PY3 values from comparison utilities resulted in a 0.81 NTG ratio derived for Pacific Power’s upstream residential lighting program.
Lighting Customer WTP (In-Territory Lighting Surveys) In August 2011, 251 in-territory lighting surveys were conducted, randomly drawn from a Pacific Power list of 10,991 California residential customers. The survey asked respondents a battery of questions designed to determine their WTP for CFLs in the absence of HES Program markdowns. After determining how many CFLs participants purchased in 2009 and 2010, participants were asked:
1. Whether they would generally purchase more CFLs, fewer CFLs, or the same number of CFLs at various un-incented hypothetical price levels.
2. What quantity of CFLs they would hypothetically purchase at various un-incented prices.
Specifically, questions asked respondents to indicate how many lamps they would purchase at four hypothetical per-CFL prices: $18.00, $12.00, $6.00, and $0.50. One hundred and ninety-one respondents answered for all four price levels.
CFL demand was assumed to relate inversely to price, indicating participants would purchase more CFLs at lower prices. To estimate participant willingness to pay for un-incented lamps, we estimated a demand curve for survey participants which related hypothetical prices and quantities. Figure 2 illustrates the program lamp demand function, based on responses from in-territory lighting surveys. The Y-axis shows prices, and the X-axis shows quantities of lamps purchased at each price. The figure also shows an equation describing the relationship between price and quantity.
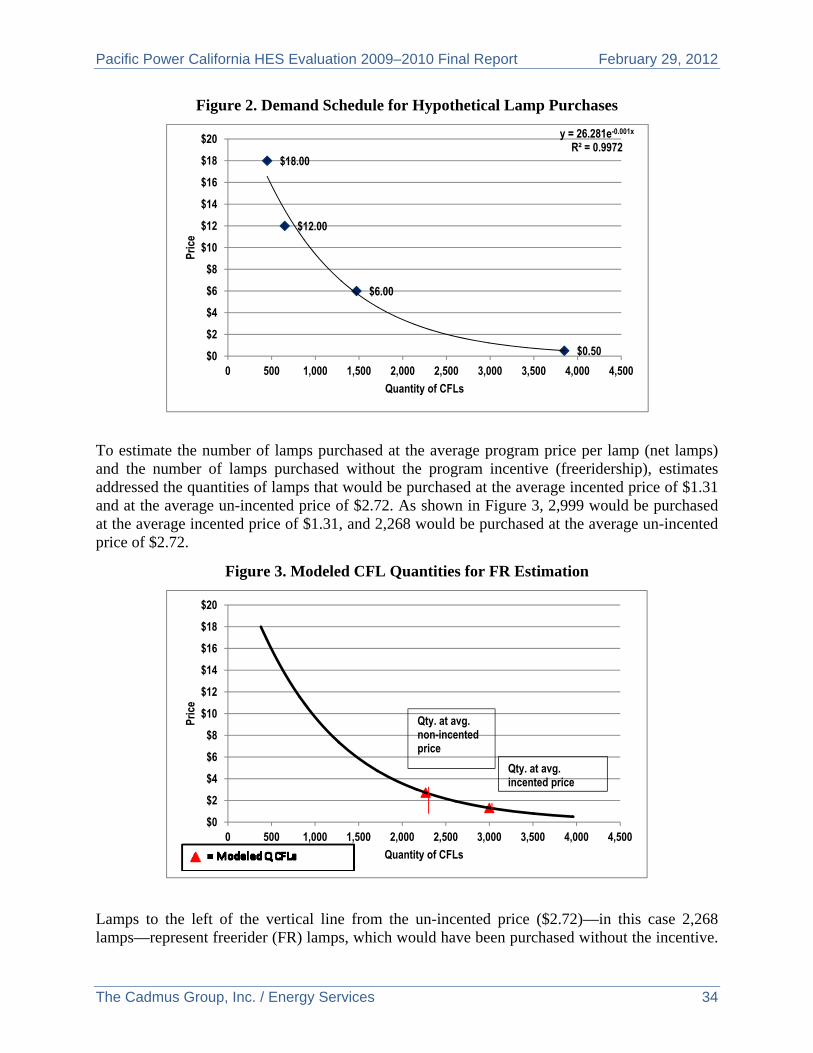
Pacific Power California HES Evaluation 2009–2010 Final Report February 29, 2012
The Cadmus Group, Inc. / Energy Services 34
Figure 2. Demand Schedule for Hypothetical Lamp Purchases
To estimate the number of lamps purchased at the average program price per lamp (net lamps) and the number of lamps purchased without the program incentive (freeridership), estimates addressed the quantities of lamps that would be purchased at the average incented price of $1.31 and at the average un-incented price of $2.72. As shown in Figure 3, 2,999 would be purchased at the average incented price of $1.31, and 2,268 would be purchased at the average un-incented price of $2.72.
Figure 3. Modeled CFL Quantities for FR Estimation
Lamps to the left of the vertical line from the un-incented price ($2.72)—in this case 2,268 lamps—represent freerider (FR) lamps, which would have been purchased without the incentive.
$18.00
$12.00
$6.00
$0.50
y = 26.281e-0.001x
R² = 0.9972
$0
$2
$4
$6
$8
$10
$12
$14
$16
$18
$20
0 500 1,000 1,500 2,000 2,500 3,000 3,500 4,000 4,500
Pric
e
Quantity of CFLs
$0
$2
$4
$6
$8
$10
$12
$14
$16
$18
$20
0 500 1,000 1,500 2,000 2,500 3,000 3,500 4,000 4,500
Pric
e
Quantity of CFLs
Qty. at avg. non-incented price
Qty. at avg. incented price
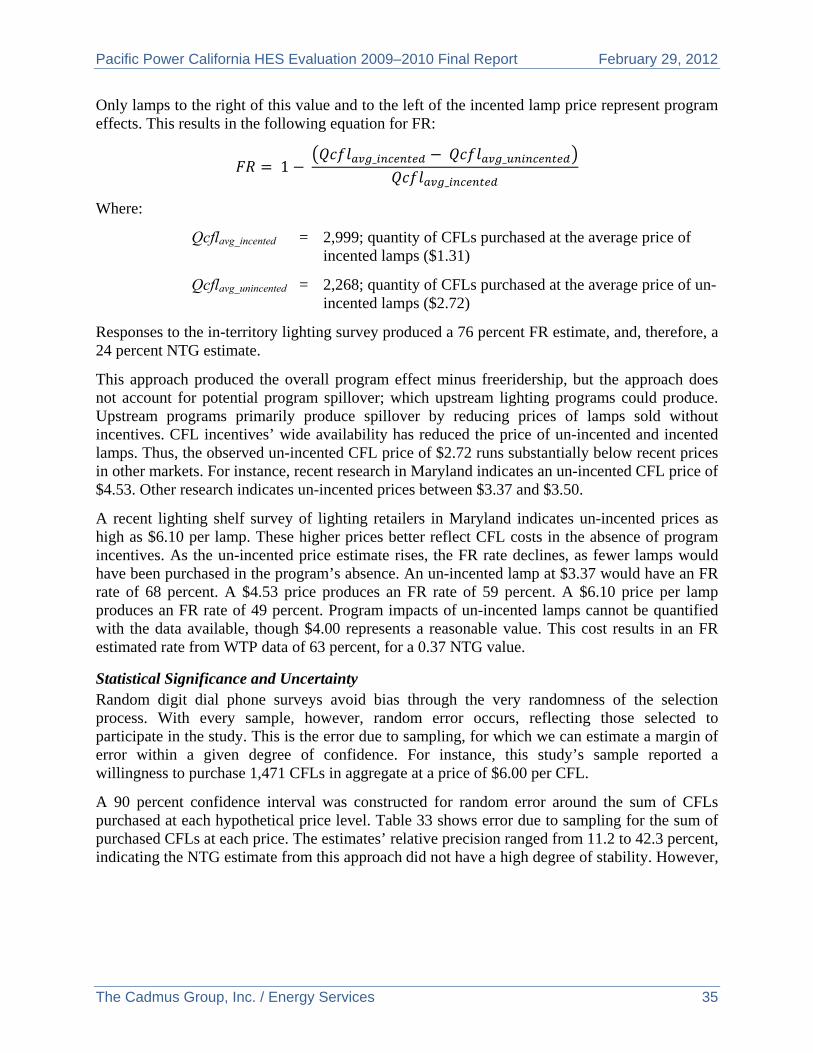
Pacific Power California HES Evaluation 2009–2010 Final Report February 29, 2012
The Cadmus Group, Inc. / Energy Services 35
Only lamps to the right of this value and to the left of the incented lamp price represent program effects. This results in the following equation for FR:
1 _ _
_
Where:
Qcflavg_incented = 2,999; quantity of CFLs purchased at the average price of incented lamps ($1.31)
Qcflavg_unincented = 2,268; quantity of CFLs purchased at the average price of un-incented lamps ($2.72)
Responses to the in-territory lighting survey produced a 76 percent FR estimate, and, therefore, a 24 percent NTG estimate.
This approach produced the overall program effect minus freeridership, but the approach does not account for potential program spillover; which upstream lighting programs could produce. Upstream programs primarily produce spillover by reducing prices of lamps sold without incentives. CFL incentives’ wide availability has reduced the price of un-incented and incented lamps. Thus, the observed un-incented CFL price of $2.72 runs substantially below recent prices in other markets. For instance, recent research in Maryland indicates an un-incented CFL price of $4.53. Other research indicates un-incented prices between $3.37 and $3.50.
A recent lighting shelf survey of lighting retailers in Maryland indicates un-incented prices as high as $6.10 per lamp. These higher prices better reflect CFL costs in the absence of program incentives. As the un-incented price estimate rises, the FR rate declines, as fewer lamps would have been purchased in the program’s absence. An un-incented lamp at $3.37 would have an FR rate of 68 percent. A $4.53 price produces an FR rate of 59 percent. A $6.10 price per lamp produces an FR rate of 49 percent. Program impacts of un-incented lamps cannot be quantified with the data available, though $4.00 represents a reasonable value. This cost results in an FR estimated rate from WTP data of 63 percent, for a 0.37 NTG value.
Statistical Significance and Uncertainty Random digit dial phone surveys avoid bias through the very randomness of the selection process. With every sample, however, random error occurs, reflecting those selected to participate in the study. This is the error due to sampling, for which we can estimate a margin of error within a given degree of confidence. For instance, this study’s sample reported a willingness to purchase 1,471 CFLs in aggregate at a price of $6.00 per CFL.
A 90 percent confidence interval was constructed for random error around the sum of CFLs purchased at each hypothetical price level. Table 33 shows error due to sampling for the sum of purchased CFLs at each price. The estimates’ relative precision ranged from 11.2 to 42.3 percent, indicating the NTG estimate from this approach did not have a high degree of stability. However,
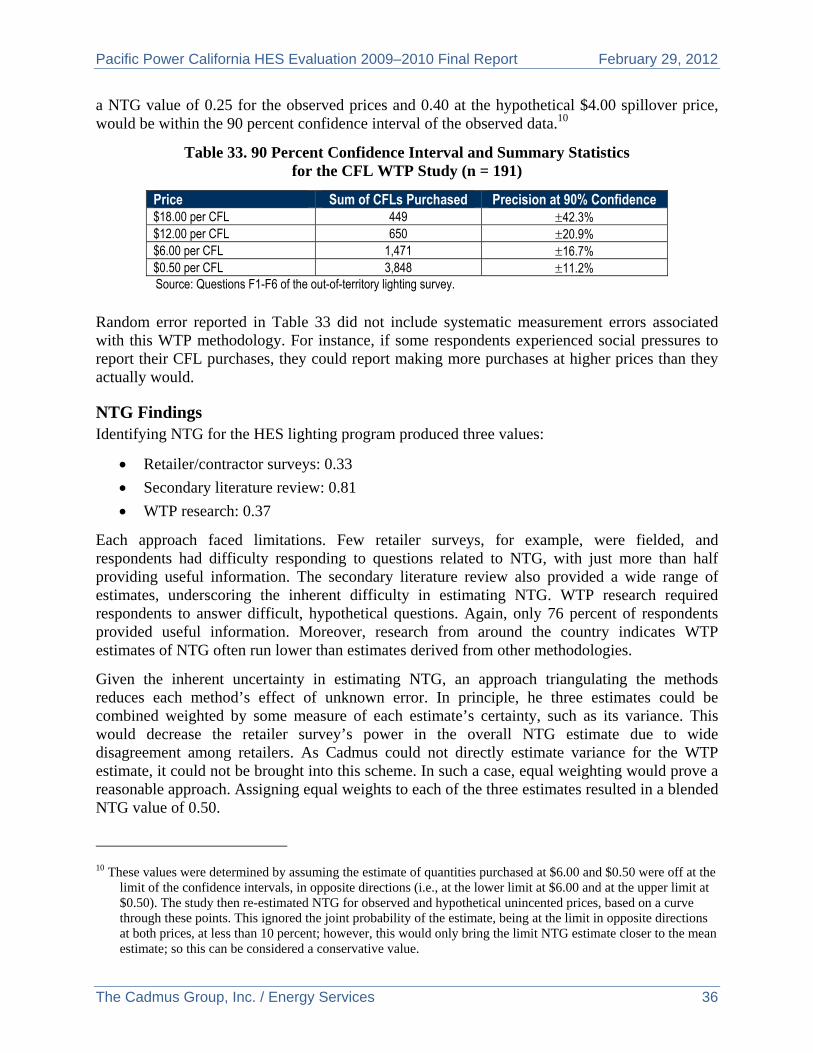
Pacific Power California HES Evaluation 2009–2010 Final Report February 29, 2012
The Cadmus Group, Inc. / Energy Services 36
a NTG value of 0.25 for the observed prices and 0.40 at the hypothetical $4.00 spillover price, would be within the 90 percent confidence interval of the observed data.10
Table 33. 90 Percent Confidence Interval and Summary Statistics for the CFL WTP Study (n = 191)
Price Sum of CFLs Purchased Precision at 90% Confidence $18.00 per CFL 449 42.3% $12.00 per CFL 650 20.9% $6.00 per CFL 1,471 16.7% $0.50 per CFL 3,848 11.2% Source: Questions F1-F6 of the out-of-territory lighting survey.
Random error reported in Table 33 did not include systematic measurement errors associated with this WTP methodology. For instance, if some respondents experienced social pressures to report their CFL purchases, they could report making more purchases at higher prices than they actually would.
NTG Findings Identifying NTG for the HES lighting program produced three values:
Retailer/contractor surveys: 0.33
Secondary literature review: 0.81
WTP research: 0.37
Each approach faced limitations. Few retailer surveys, for example, were fielded, and respondents had difficulty responding to questions related to NTG, with just more than half providing useful information. The secondary literature review also provided a wide range of estimates, underscoring the inherent difficulty in estimating NTG. WTP research required respondents to answer difficult, hypothetical questions. Again, only 76 percent of respondents provided useful information. Moreover, research from around the country indicates WTP estimates of NTG often run lower than estimates derived from other methodologies.
Given the inherent uncertainty in estimating NTG, an approach triangulating the methods reduces each method’s effect of unknown error. In principle, he three estimates could be combined weighted by some measure of each estimate’s certainty, such as its variance. This would decrease the retailer survey’s power in the overall NTG estimate due to wide disagreement among retailers. As Cadmus could not directly estimate variance for the WTP estimate, it could not be brought into this scheme. In such a case, equal weighting would prove a reasonable approach. Assigning equal weights to each of the three estimates resulted in a blended NTG value of 0.50.
10 These values were determined by assuming the estimate of quantities purchased at $6.00 and $0.50 were off at the
limit of the confidence intervals, in opposite directions (i.e., at the lower limit at $6.00 and at the upper limit at $0.50). The study then re-estimated NTG for observed and hypothetical unincented prices, based on a curve through these points. This ignored the joint probability of the estimate, being at the limit in opposite directions at both prices, at less than 10 percent; however, this would only bring the limit NTG estimate closer to the mean estimate; so this can be considered a conservative value.
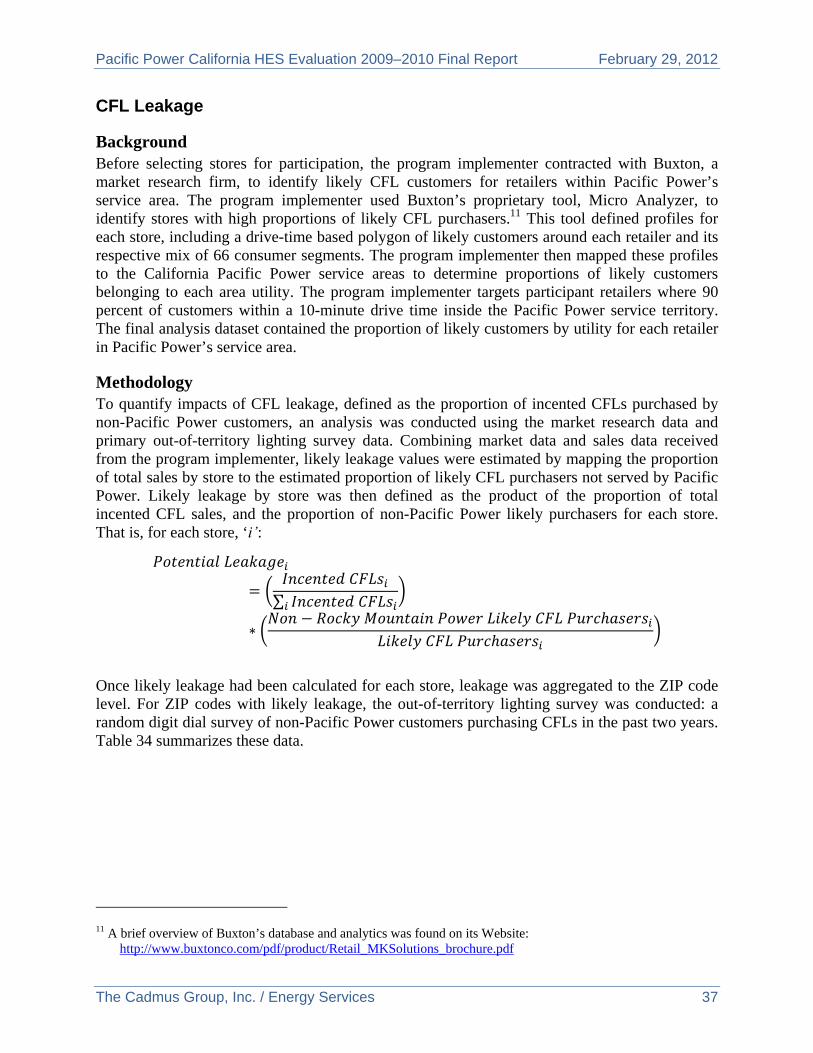
Pacific Power California HES Evaluation 2009–2010 Final Report February 29, 2012
The Cadmus Group, Inc. / Energy Services 37
CFL Leakage
Background Before selecting stores for participation, the program implementer contracted with Buxton, a market research firm, to identify likely CFL customers for retailers within Pacific Power’s service area. The program implementer used Buxton’s proprietary tool, Micro Analyzer, to identify stores with high proportions of likely CFL purchasers.11 This tool defined profiles for each store, including a drive-time based polygon of likely customers around each retailer and its respective mix of 66 consumer segments. The program implementer then mapped these profiles to the California Pacific Power service areas to determine proportions of likely customers belonging to each area utility. The program implementer targets participant retailers where 90 percent of customers within a 10-minute drive time inside the Pacific Power service territory. The final analysis dataset contained the proportion of likely customers by utility for each retailer in Pacific Power’s service area.
Methodology To quantify impacts of CFL leakage, defined as the proportion of incented CFLs purchased by non-Pacific Power customers, an analysis was conducted using the market research data and primary out-of-territory lighting survey data. Combining market data and sales data received from the program implementer, likely leakage values were estimated by mapping the proportion of total sales by store to the estimated proportion of likely CFL purchasers not served by Pacific Power. Likely leakage by store was then defined as the product of the proportion of total incented CFL sales, and the proportion of non-Pacific Power likely purchasers for each store. That is, for each store, ‘i’:
∑
Once likely leakage had been calculated for each store, leakage was aggregated to the ZIP code level. For ZIP codes with likely leakage, the out-of-territory lighting survey was conducted: a random digit dial survey of non-Pacific Power customers purchasing CFLs in the past two years. Table 34 summarizes these data.
11 A brief overview of Buxton’s database and analytics was found on its Website:
http://www.buxtonco.com/pdf/product/Retail_MKSolutions_brochure.pdf
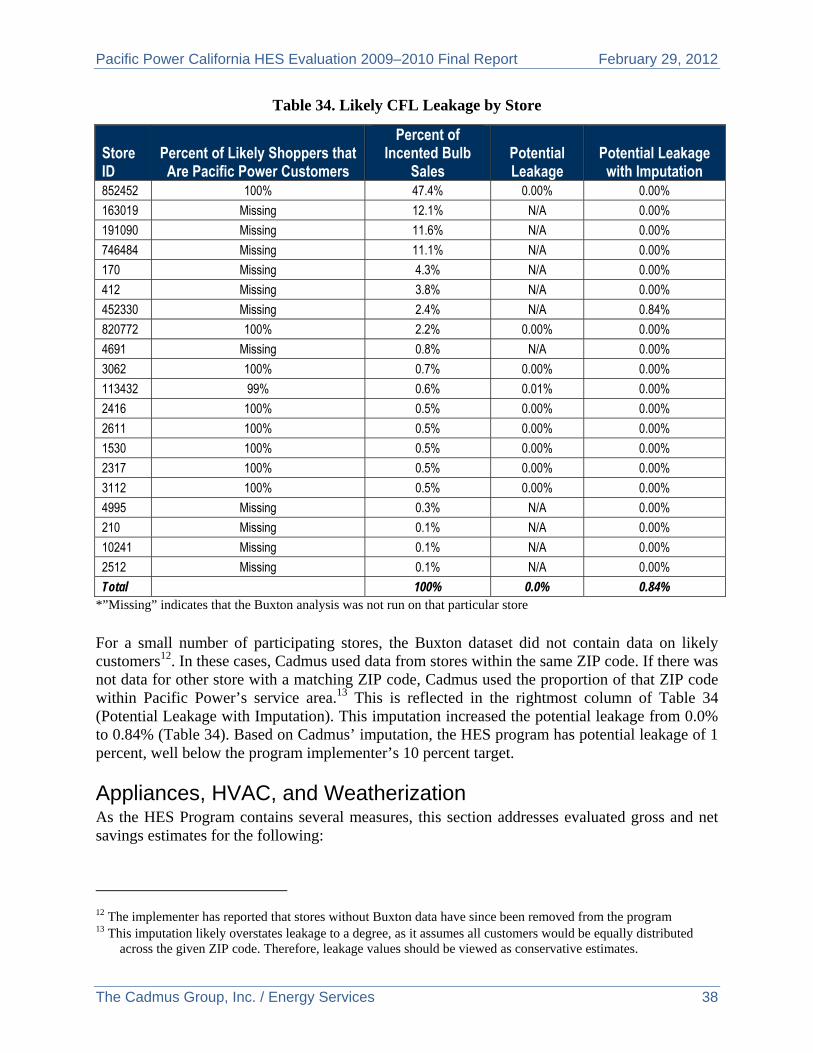
Pacific Power California HES Evaluation 2009–2010 Final Report February 29, 2012
The Cadmus Group, Inc. / Energy Services 38
Table 34. Likely CFL Leakage by Store
Store ID
Percent of Likely Shoppers that Are Pacific Power Customers
Percent of Incented Bulb
Sales Potential Leakage
Potential Leakage with Imputation
852452 100% 47.4% 0.00% 0.00%
163019 Missing 12.1% N/A 0.00%
191090 Missing 11.6% N/A 0.00%
746484 Missing 11.1% N/A 0.00%
170 Missing 4.3% N/A 0.00%
412 Missing 3.8% N/A 0.00%
452330 Missing 2.4% N/A 0.84%
820772 100% 2.2% 0.00% 0.00%
4691 Missing 0.8% N/A 0.00%
3062 100% 0.7% 0.00% 0.00%
113432 99% 0.6% 0.01% 0.00%
2416 100% 0.5% 0.00% 0.00%
2611 100% 0.5% 0.00% 0.00%
1530 100% 0.5% 0.00% 0.00%
2317 100% 0.5% 0.00% 0.00%
3112 100% 0.5% 0.00% 0.00%
4995 Missing 0.3% N/A 0.00%
210 Missing 0.1% N/A 0.00%
10241 Missing 0.1% N/A 0.00%
2512 Missing 0.1% N/A 0.00%
Total
100% 0.0% 0.84% *”Missing” indicates that the Buxton analysis was not run on that particular store For a small number of participating stores, the Buxton dataset did not contain data on likely customers12. In these cases, Cadmus used data from stores within the same ZIP code. If there was not data for other store with a matching ZIP code, Cadmus used the proportion of that ZIP code within Pacific Power’s service area.13 This is reflected in the rightmost column of Table 34 (Potential Leakage with Imputation). This imputation increased the potential leakage from 0.0% to 0.84% (Table 34). Based on Cadmus’ imputation, the HES program has potential leakage of 1 percent, well below the program implementer’s 10 percent target.
Appliances, HVAC, and Weatherization As the HES Program contains several measures, this section addresses evaluated gross and net savings estimates for the following:
12 The implementer has reported that stores without Buxton data have since been removed from the program 13 This imputation likely overstates leakage to a degree, as it assumes all customers would be equally distributed
across the given ZIP code. Therefore, leakage values should be viewed as conservative estimates.
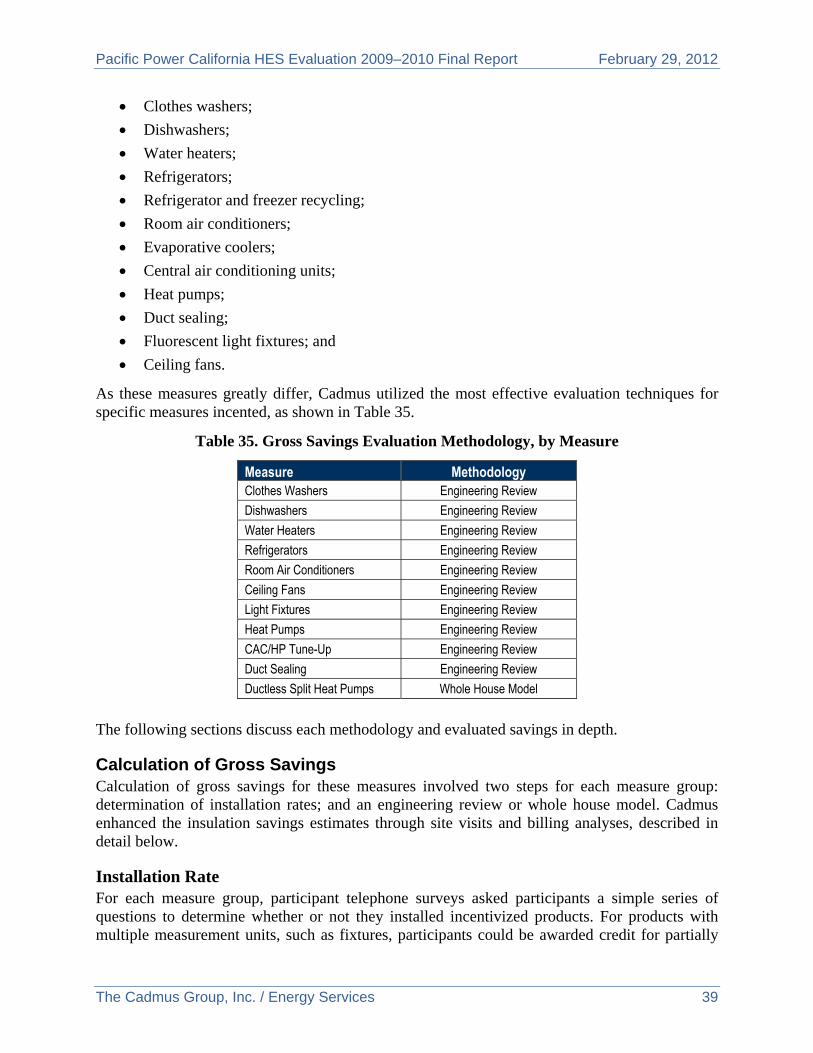
Pacific Power California HES Evaluation 2009–2010 Final Report February 29, 2012
The Cadmus Group, Inc. / Energy Services 39
Clothes washers;
Dishwashers;
Water heaters;
Refrigerators;
Refrigerator and freezer recycling;
Room air conditioners;
Evaporative coolers;
Central air conditioning units;
Heat pumps;
Duct sealing;
Fluorescent light fixtures; and
Ceiling fans.
As these measures greatly differ, Cadmus utilized the most effective evaluation techniques for specific measures incented, as shown in Table 35.
Table 35. Gross Savings Evaluation Methodology, by Measure
Measure Methodology Clothes Washers Engineering Review
Dishwashers Engineering Review
Water Heaters Engineering Review
Refrigerators Engineering Review
Room Air Conditioners Engineering Review
Ceiling Fans Engineering Review
Light Fixtures Engineering Review
Heat Pumps Engineering Review
CAC/HP Tune-Up Engineering Review
Duct Sealing Engineering Review
Ductless Split Heat Pumps Whole House Model
The following sections discuss each methodology and evaluated savings in depth.
Calculation of Gross Savings Calculation of gross savings for these measures involved two steps for each measure group: determination of installation rates; and an engineering review or whole house model. Cadmus enhanced the insulation savings estimates through site visits and billing analyses, described in detail below.
Installation Rate For each measure group, participant telephone surveys asked participants a simple series of questions to determine whether or not they installed incentivized products. For products with multiple measurement units, such as fixtures, participants could be awarded credit for partially
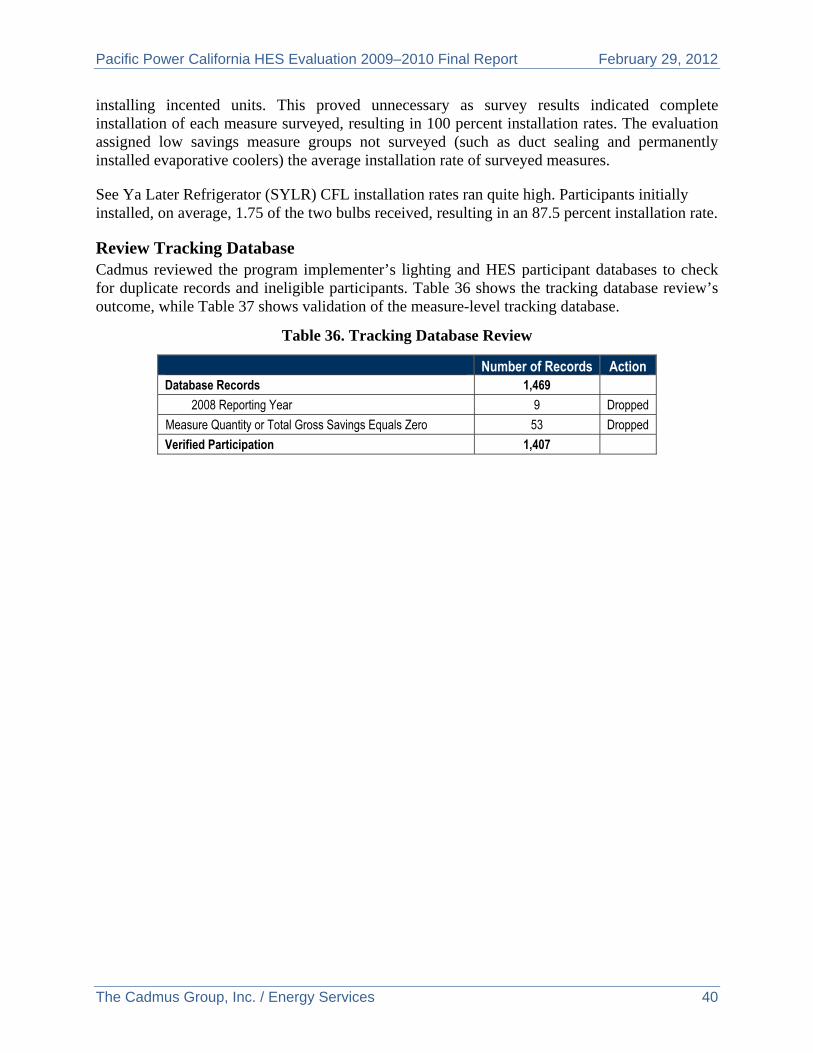
Pacific Power California HES Evaluation 2009–2010 Final Report February 29, 2012
The Cadmus Group, Inc. / Energy Services 40
installing incented units. This proved unnecessary as survey results indicated complete installation of each measure surveyed, resulting in 100 percent installation rates. The evaluation assigned low savings measure groups not surveyed (such as duct sealing and permanently installed evaporative coolers) the average installation rate of surveyed measures.
See Ya Later Refrigerator (SYLR) CFL installation rates ran quite high. Participants initially installed, on average, 1.75 of the two bulbs received, resulting in an 87.5 percent installation rate.
Review Tracking Database Cadmus reviewed the program implementer’s lighting and HES participant databases to check for duplicate records and ineligible participants. Table 36 shows the tracking database review’s outcome, while Table 37 shows validation of the measure-level tracking database.
Table 36. Tracking Database Review
Number of Records Action Database Records 1,469
2008 Reporting Year 9 Dropped
Measure Quantity or Total Gross Savings Equals Zero 53 Dropped
Verified Participation 1,407
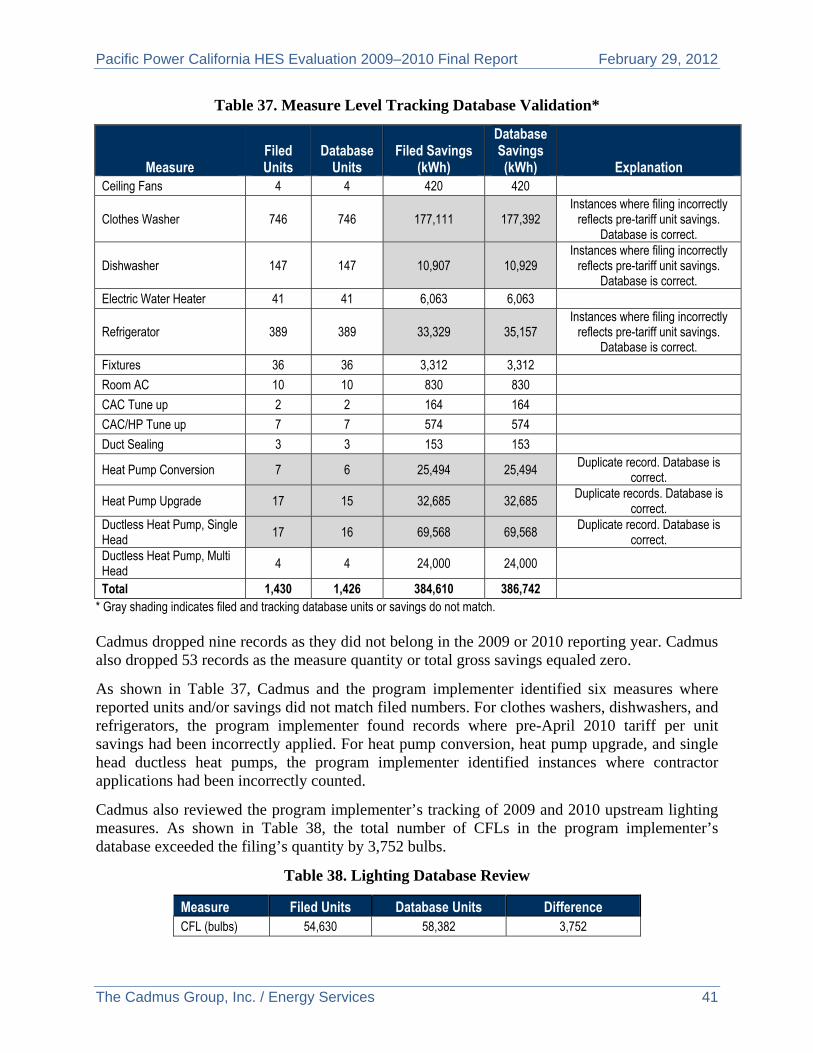
Pacific Power California HES Evaluation 2009–2010 Final Report February 29, 2012
The Cadmus Group, Inc. / Energy Services 41
Table 37. Measure Level Tracking Database Validation*
Measure Filed Units
Database Units
Filed Savings (kWh)
Database Savings (kWh) Explanation
Ceiling Fans 4 4 420 420
Clothes Washer 746 746 177,111 177,392 Instances where filing incorrectly
reflects pre-tariff unit savings. Database is correct.
Dishwasher 147 147 10,907 10,929 Instances where filing incorrectly
reflects pre-tariff unit savings. Database is correct.
Electric Water Heater 41 41 6,063 6,063
Refrigerator 389 389 33,329 35,157 Instances where filing incorrectly
reflects pre-tariff unit savings. Database is correct.
Fixtures 36 36 3,312 3,312
Room AC 10 10 830 830 CAC Tune up 2 2 164 164
CAC/HP Tune up 7 7 574 574
Duct Sealing 3 3 153 153 Heat Pump Conversion 7 6 25,494 25,494 Duplicate record. Database is
correct.
Heat Pump Upgrade 17 15 32,685 32,685 Duplicate records. Database is
correct. Ductless Heat Pump, Single Head 17 16 69,568 69,568
Duplicate record. Database is correct.
Ductless Heat Pump, Multi Head 4 4 24,000 24,000 Total 1,430 1,426 384,610 386,742
* Gray shading indicates filed and tracking database units or savings do not match.
Cadmus dropped nine records as they did not belong in the 2009 or 2010 reporting year. Cadmus also dropped 53 records as the measure quantity or total gross savings equaled zero.
As shown in Table 37, Cadmus and the program implementer identified six measures where reported units and/or savings did not match filed numbers. For clothes washers, dishwashers, and refrigerators, the program implementer found records where pre-April 2010 tariff per unit savings had been incorrectly applied. For heat pump conversion, heat pump upgrade, and single head ductless heat pumps, the program implementer identified instances where contractor applications had been incorrectly counted.
Cadmus also reviewed the program implementer’s tracking of 2009 and 2010 upstream lighting measures. As shown in Table 38, the total number of CFLs in the program implementer’s database exceeded the filing’s quantity by 3,752 bulbs.
Table 38. Lighting Database Review
Measure Filed Units Database Units Difference CFL (bulbs) 54,630 58,382 3,752
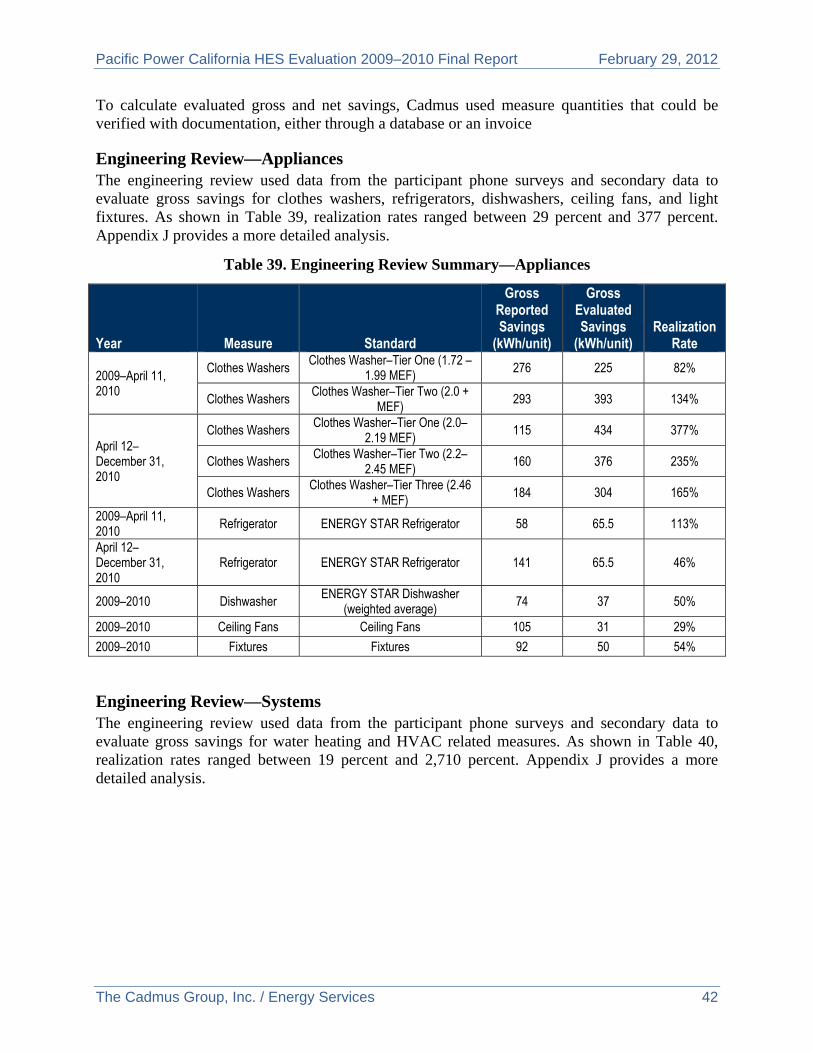
Pacific Power California HES Evaluation 2009–2010 Final Report February 29, 2012
The Cadmus Group, Inc. / Energy Services 42
To calculate evaluated gross and net savings, Cadmus used measure quantities that could be verified with documentation, either through a database or an invoice
Engineering Review—Appliances The engineering review used data from the participant phone surveys and secondary data to evaluate gross savings for clothes washers, refrigerators, dishwashers, ceiling fans, and light fixtures. As shown in Table 39, realization rates ranged between 29 percent and 377 percent. Appendix J provides a more detailed analysis.
Table 39. Engineering Review Summary—Appliances
Year Measure Standard
Gross Reported Savings
(kWh/unit)
Gross Evaluated Savings
(kWh/unit) Realization
Rate
2009–April 11, 2010
Clothes Washers Clothes Washer–Tier One (1.72 –
1.99 MEF) 276 225 82%
Clothes Washers Clothes Washer–Tier Two (2.0 +
MEF) 293 393 134%
April 12– December 31, 2010
Clothes Washers Clothes Washer–Tier One (2.0–2.19 MEF)
115 434 377%
Clothes Washers Clothes Washer–Tier Two (2.2–2.45 MEF)
160 376 235%
Clothes Washers Clothes Washer–Tier Three (2.46
+ MEF) 184 304 165%
2009–April 11, 2010 Refrigerator ENERGY STAR Refrigerator 58 65.5 113%
April 12– December 31, 2010
Refrigerator ENERGY STAR Refrigerator 141 65.5 46%
2009–2010 Dishwasher ENERGY STAR Dishwasher
(weighted average) 74 37 50%
2009–2010 Ceiling Fans Ceiling Fans 105 31 29%
2009–2010 Fixtures Fixtures 92 50 54%
Engineering Review—Systems The engineering review used data from the participant phone surveys and secondary data to evaluate gross savings for water heating and HVAC related measures. As shown in Table 40, realization rates ranged between 19 percent and 2,710 percent. Appendix J provides a more detailed analysis.
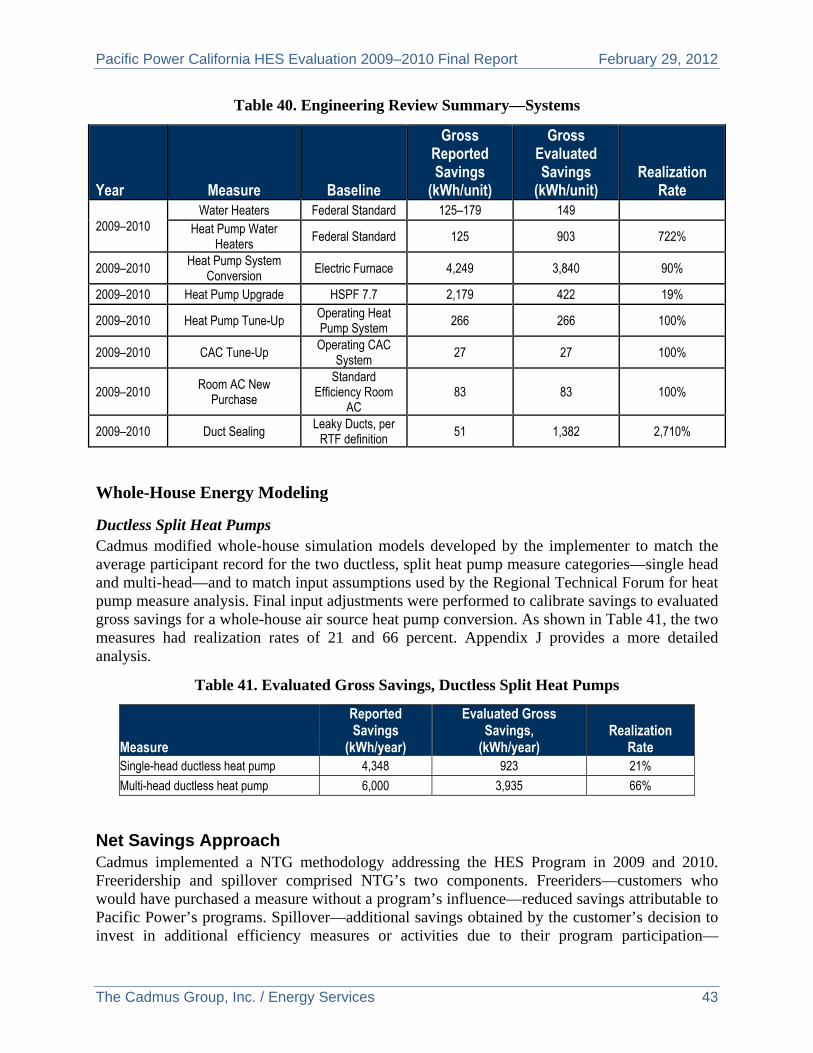
Pacific Power California HES Evaluation 2009–2010 Final Report February 29, 2012
The Cadmus Group, Inc. / Energy Services 43
Table 40. Engineering Review Summary—Systems
Year Measure Baseline
Gross Reported Savings
(kWh/unit)
Gross Evaluated Savings
(kWh/unit) Realization
Rate
2009–2010 Water Heaters Federal Standard 125–179 149
Heat Pump Water
Heaters Federal Standard 125 903 722%
2009–2010 Heat Pump System
Conversion Electric Furnace 4,249 3,840 90%
2009–2010 Heat Pump Upgrade HSPF 7.7 2,179 422 19%
2009–2010 Heat Pump Tune-Up Operating Heat Pump System 266 266 100%
2009–2010 CAC Tune-Up Operating CAC
System 27 27 100%
2009–2010 Room AC New
Purchase
Standard Efficiency Room
AC 83 83 100%
2009–2010 Duct Sealing Leaky Ducts, per
RTF definition 51 1,382 2,710%
Whole-House Energy Modeling
Ductless Split Heat Pumps Cadmus modified whole-house simulation models developed by the implementer to match the average participant record for the two ductless, split heat pump measure categories—single head and multi-head—and to match input assumptions used by the Regional Technical Forum for heat pump measure analysis. Final input adjustments were performed to calibrate savings to evaluated gross savings for a whole-house air source heat pump conversion. As shown in Table 41, the two measures had realization rates of 21 and 66 percent. Appendix J provides a more detailed analysis.
Table 41. Evaluated Gross Savings, Ductless Split Heat Pumps
Measure
Reported Savings
(kWh/year)
Evaluated Gross Savings,
(kWh/year) Realization
Rate Single-head ductless heat pump 4,348 923 21%
Multi-head ductless heat pump 6,000 3,935 66%
Net Savings Approach Cadmus implemented a NTG methodology addressing the HES Program in 2009 and 2010. Freeridership and spillover comprised NTG’s two components. Freeriders—customers who would have purchased a measure without a program’s influence—reduced savings attributable to Pacific Power’s programs. Spillover—additional savings obtained by the customer’s decision to invest in additional efficiency measures or activities due to their program participation—
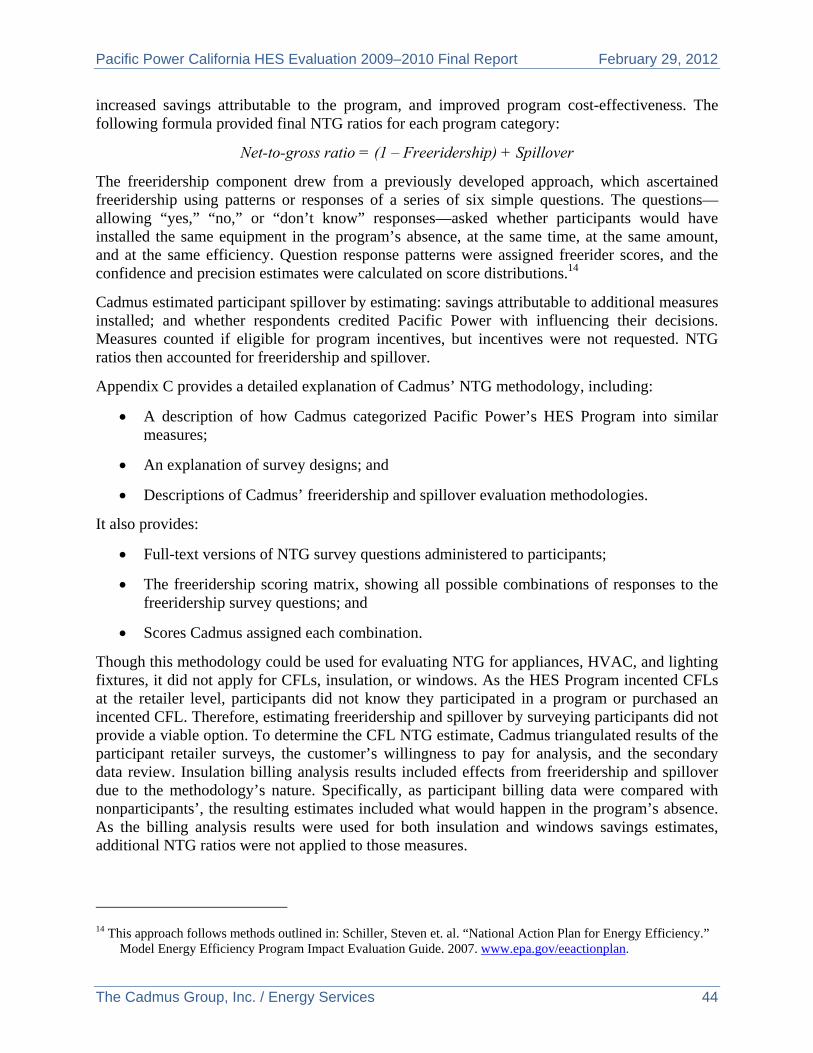
Pacific Power California HES Evaluation 2009–2010 Final Report February 29, 2012
The Cadmus Group, Inc. / Energy Services 44
increased savings attributable to the program, and improved program cost-effectiveness. The following formula provided final NTG ratios for each program category:
Net-to-gross ratio = (1 – Freeridership) + Spillover
The freeridership component drew from a previously developed approach, which ascertained freeridership using patterns or responses of a series of six simple questions. The questions—allowing “yes,” “no,” or “don’t know” responses—asked whether participants would have installed the same equipment in the program’s absence, at the same time, at the same amount, and at the same efficiency. Question response patterns were assigned freerider scores, and the confidence and precision estimates were calculated on score distributions.14
Cadmus estimated participant spillover by estimating: savings attributable to additional measures installed; and whether respondents credited Pacific Power with influencing their decisions. Measures counted if eligible for program incentives, but incentives were not requested. NTG ratios then accounted for freeridership and spillover.
Appendix C provides a detailed explanation of Cadmus’ NTG methodology, including:
A description of how Cadmus categorized Pacific Power’s HES Program into similar measures;
An explanation of survey designs; and
Descriptions of Cadmus’ freeridership and spillover evaluation methodologies.
It also provides:
Full-text versions of NTG survey questions administered to participants;
The freeridership scoring matrix, showing all possible combinations of responses to the freeridership survey questions; and
Scores Cadmus assigned each combination.
Though this methodology could be used for evaluating NTG for appliances, HVAC, and lighting fixtures, it did not apply for CFLs, insulation, or windows. As the HES Program incented CFLs at the retailer level, participants did not know they participated in a program or purchased an incented CFL. Therefore, estimating freeridership and spillover by surveying participants did not provide a viable option. To determine the CFL NTG estimate, Cadmus triangulated results of the participant retailer surveys, the customer’s willingness to pay for analysis, and the secondary data review. Insulation billing analysis results included effects from freeridership and spillover due to the methodology’s nature. Specifically, as participant billing data were compared with nonparticipants’, the resulting estimates included what would happen in the program’s absence. As the billing analysis results were used for both insulation and windows savings estimates, additional NTG ratios were not applied to those measures.
14 This approach follows methods outlined in: Schiller, Steven et. al. “National Action Plan for Energy Efficiency.”
Model Energy Efficiency Program Impact Evaluation Guide. 2007. www.epa.gov/eeactionplan.
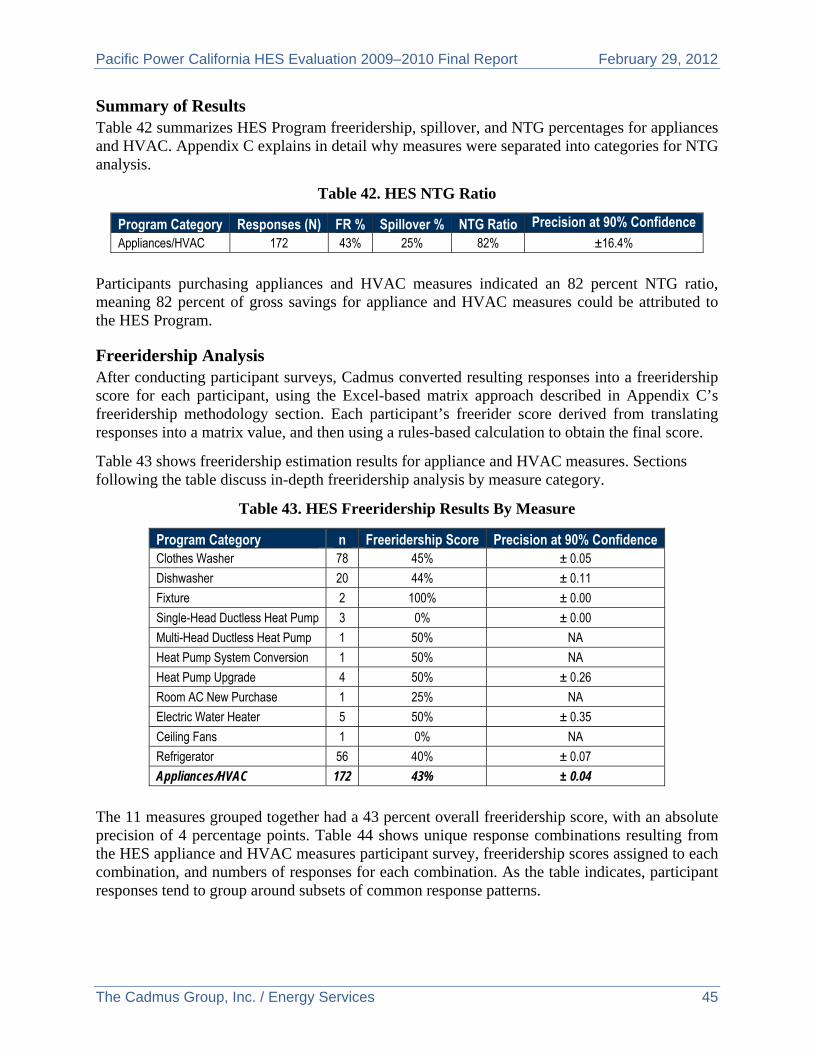
Pacific Power California HES Evaluation 2009–2010 Final Report February 29, 2012
The Cadmus Group, Inc. / Energy Services 45
Summary of Results Table 42 summarizes HES Program freeridership, spillover, and NTG percentages for appliances and HVAC. Appendix C explains in detail why measures were separated into categories for NTG analysis.
Table 42. HES NTG Ratio
Program Category Responses (N) FR % Spillover % NTG Ratio Precision at 90% Confidence Appliances/HVAC 172 43% 25% 82% ±16.4%
Participants purchasing appliances and HVAC measures indicated an 82 percent NTG ratio, meaning 82 percent of gross savings for appliance and HVAC measures could be attributed to the HES Program.
Freeridership Analysis After conducting participant surveys, Cadmus converted resulting responses into a freeridership score for each participant, using the Excel-based matrix approach described in Appendix C’s freeridership methodology section. Each participant’s freerider score derived from translating responses into a matrix value, and then using a rules-based calculation to obtain the final score.
Table 43 shows freeridership estimation results for appliance and HVAC measures. Sections following the table discuss in-depth freeridership analysis by measure category.
Table 43. HES Freeridership Results By Measure
Program Category n Freeridership Score Precision at 90% Confidence Clothes Washer 78 45% ± 0.05
Dishwasher 20 44% ± 0.11
Fixture 2 100% ± 0.00
Single-Head Ductless Heat Pump 3 0% ± 0.00
Multi-Head Ductless Heat Pump 1 50% NA
Heat Pump System Conversion 1 50% NA
Heat Pump Upgrade 4 50% ± 0.26
Room AC New Purchase 1 25% NA
Electric Water Heater 5 50% ± 0.35
Ceiling Fans 1 0% NA
Refrigerator 56 40% ± 0.07
Appliances/HVAC 172 43% ± 0.04
The 11 measures grouped together had a 43 percent overall freeridership score, with an absolute precision of 4 percentage points. Table 44 shows unique response combinations resulting from the HES appliance and HVAC measures participant survey, freeridership scores assigned to each combination, and numbers of responses for each combination. As the table indicates, participant responses tend to group around subsets of common response patterns.
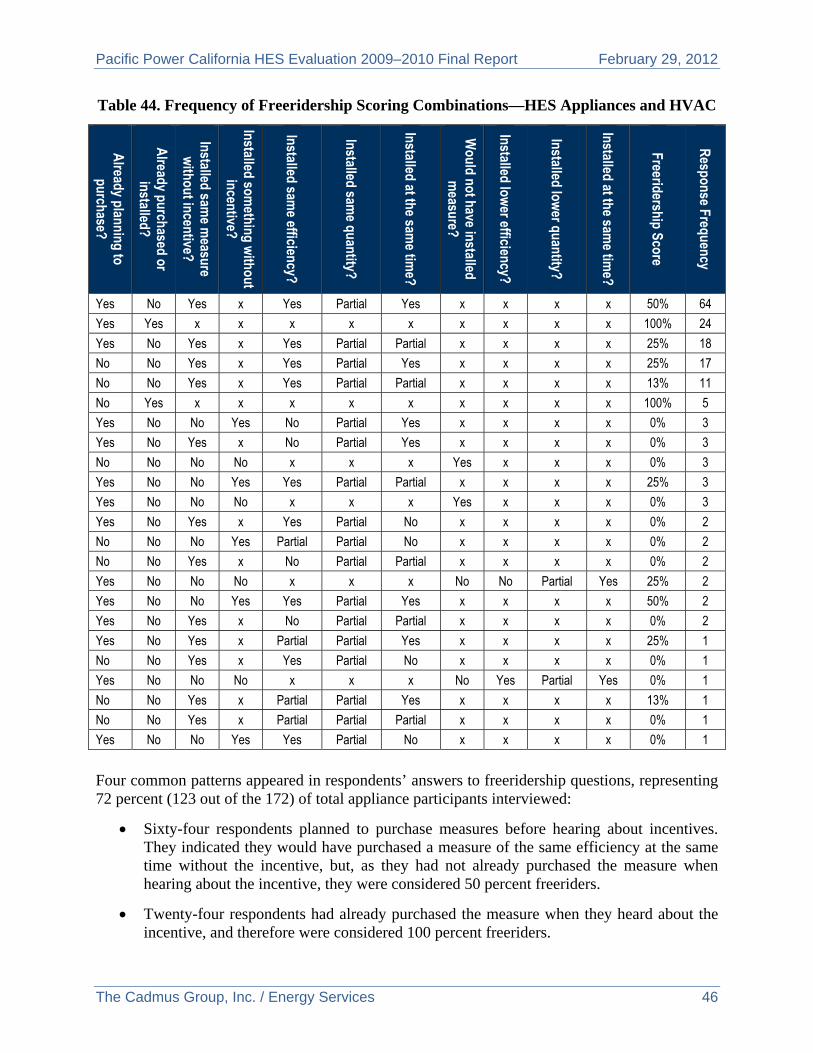
Pacific Power California HES Evaluation 2009–2010 Final Report February 29, 2012
The Cadmus Group, Inc. / Energy Services 46
Table 44. Frequency of Freeridership Scoring Combinations—HES Appliances and HVAC
Already planning to
purchase?
Already purchased or
installed?
Installed same m
easure w
ithout incentive?
Installed something w
ithout incentive?
Installed same efficiency?
Installed same quantity?
Installed at the same tim
e?
Would not have installed
measure?
Installed lower efficiency?
Installed lower quantity?
Installed at the same tim
e?
Freeridership Score
Response Frequency
Yes No Yes x Yes Partial Yes x x x x 50% 64
Yes Yes x x x x x x x x x 100% 24
Yes No Yes x Yes Partial Partial x x x x 25% 18
No No Yes x Yes Partial Yes x x x x 25% 17
No No Yes x Yes Partial Partial x x x x 13% 11
No Yes x x x x x x x x x 100% 5
Yes No No Yes No Partial Yes x x x x 0% 3
Yes No Yes x No Partial Yes x x x x 0% 3
No No No No x x x Yes x x x 0% 3
Yes No No Yes Yes Partial Partial x x x x 25% 3
Yes No No No x x x Yes x x x 0% 3
Yes No Yes x Yes Partial No x x x x 0% 2
No No No Yes Partial Partial No x x x x 0% 2
No No Yes x No Partial Partial x x x x 0% 2
Yes No No No x x x No No Partial Yes 25% 2
Yes No No Yes Yes Partial Yes x x x x 50% 2
Yes No Yes x No Partial Partial x x x x 0% 2
Yes No Yes x Partial Partial Yes x x x x 25% 1
No No Yes x Yes Partial No x x x x 0% 1
Yes No No No x x x No Yes Partial Yes 0% 1
No No Yes x Partial Partial Yes x x x x 13% 1
No No Yes x Partial Partial Partial x x x x 0% 1
Yes No No Yes Yes Partial No x x x x 0% 1
Four common patterns appeared in respondents’ answers to freeridership questions, representing 72 percent (123 out of the 172) of total appliance participants interviewed:
Sixty-four respondents planned to purchase measures before hearing about incentives. They indicated they would have purchased a measure of the same efficiency at the same time without the incentive, but, as they had not already purchased the measure when hearing about the incentive, they were considered 50 percent freeriders.
Twenty-four respondents had already purchased the measure when they heard about the incentive, and therefore were considered 100 percent freeriders.
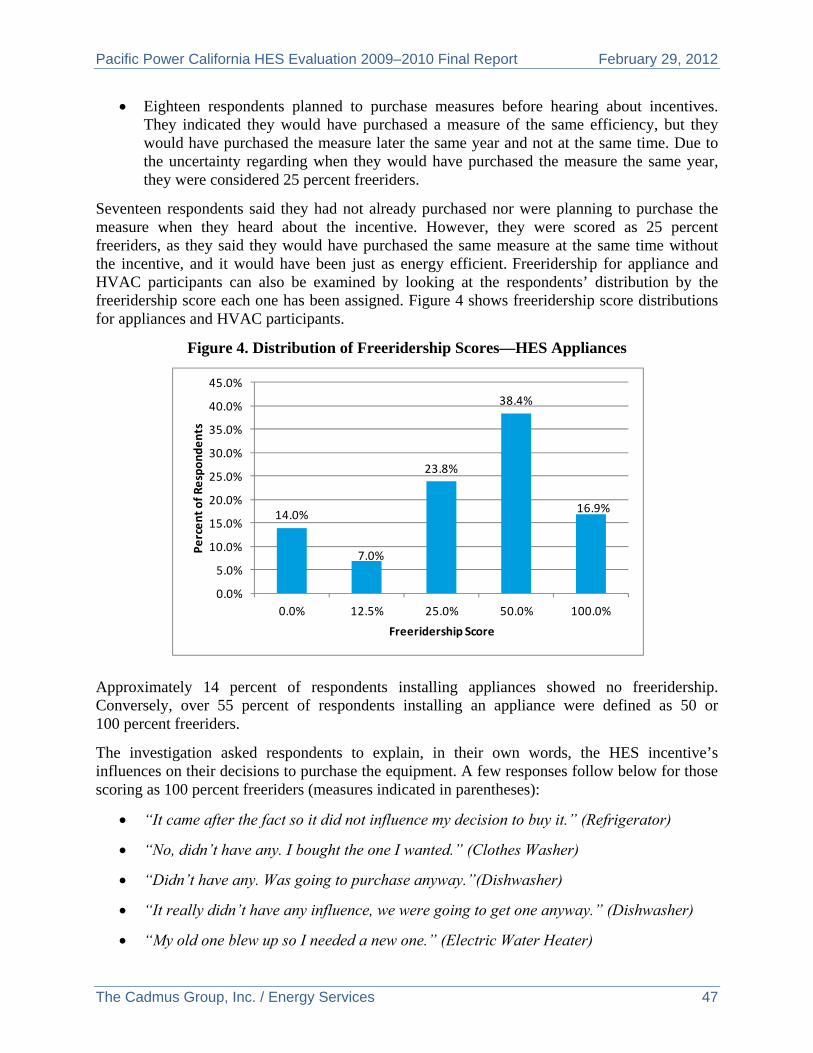
Pacific Power California HES Evaluation 2009–2010 Final Report February 29, 2012
The Cadmus Group, Inc. / Energy Services 47
Eighteen respondents planned to purchase measures before hearing about incentives. They indicated they would have purchased a measure of the same efficiency, but they would have purchased the measure later the same year and not at the same time. Due to the uncertainty regarding when they would have purchased the measure the same year, they were considered 25 percent freeriders.
Seventeen respondents said they had not already purchased nor were planning to purchase the measure when they heard about the incentive. However, they were scored as 25 percent freeriders, as they said they would have purchased the same measure at the same time without the incentive, and it would have been just as energy efficient. Freeridership for appliance and HVAC participants can also be examined by looking at the respondents’ distribution by the freeridership score each one has been assigned. Figure 4 shows freeridership score distributions for appliances and HVAC participants.
Figure 4. Distribution of Freeridership Scores—HES Appliances
Approximately 14 percent of respondents installing appliances showed no freeridership. Conversely, over 55 percent of respondents installing an appliance were defined as 50 or 100 percent freeriders.
The investigation asked respondents to explain, in their own words, the HES incentive’s influences on their decisions to purchase the equipment. A few responses follow below for those scoring as 100 percent freeriders (measures indicated in parentheses):
“It came after the fact so it did not influence my decision to buy it.” (Refrigerator)
“No, didn’t have any. I bought the one I wanted.” (Clothes Washer)
“Didn’t have any. Was going to purchase anyway.”(Dishwasher)
“It really didn’t have any influence, we were going to get one anyway.” (Dishwasher)
“My old one blew up so I needed a new one.” (Electric Water Heater)
14.0%
7.0%
23.8%
38.4%
16.9%
0.0%
5.0%
10.0%
15.0%
20.0%
25.0%
30.0%
35.0%
40.0%
45.0%
0.0% 12.5% 25.0% 50.0% 100.0%
Percent of Respondents
Freeridership Score
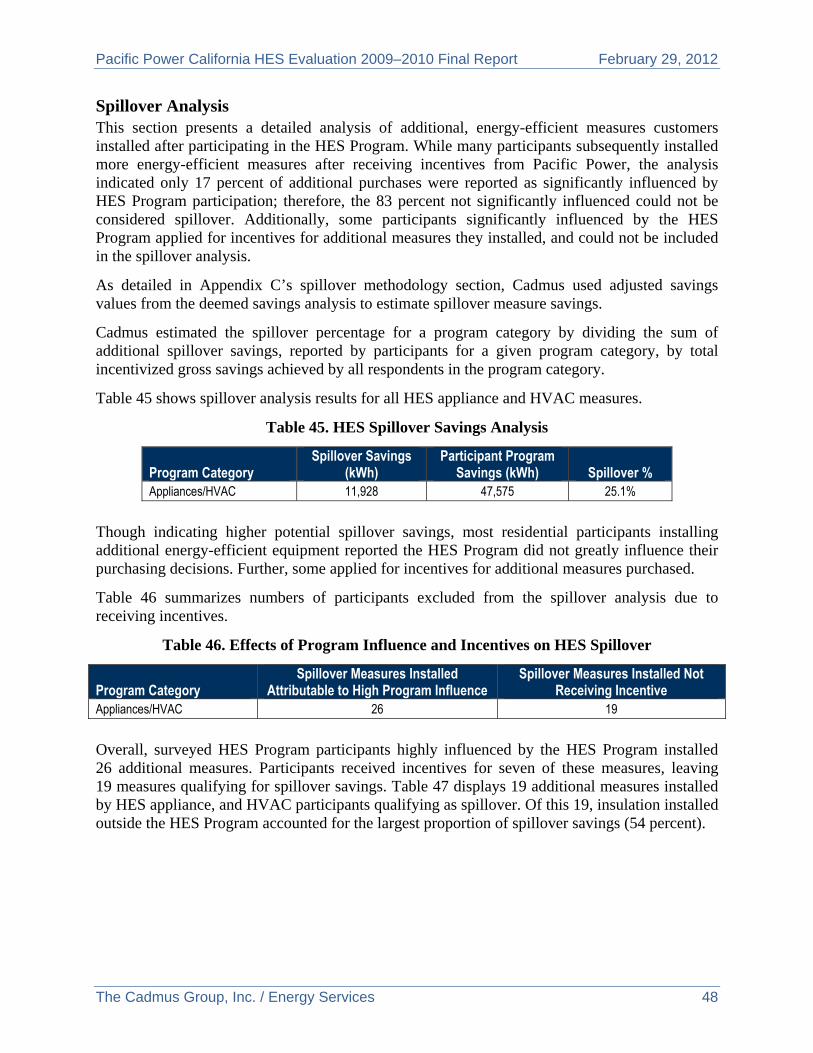
Pacific Power California HES Evaluation 2009–2010 Final Report February 29, 2012
The Cadmus Group, Inc. / Energy Services 48
Spillover Analysis This section presents a detailed analysis of additional, energy-efficient measures customers installed after participating in the HES Program. While many participants subsequently installed more energy-efficient measures after receiving incentives from Pacific Power, the analysis indicated only 17 percent of additional purchases were reported as significantly influenced by HES Program participation; therefore, the 83 percent not significantly influenced could not be considered spillover. Additionally, some participants significantly influenced by the HES Program applied for incentives for additional measures they installed, and could not be included in the spillover analysis.
As detailed in Appendix C’s spillover methodology section, Cadmus used adjusted savings values from the deemed savings analysis to estimate spillover measure savings.
Cadmus estimated the spillover percentage for a program category by dividing the sum of additional spillover savings, reported by participants for a given program category, by total incentivized gross savings achieved by all respondents in the program category.
Table 45 shows spillover analysis results for all HES appliance and HVAC measures.
Table 45. HES Spillover Savings Analysis
Program Category Spillover Savings
(kWh) Participant Program
Savings (kWh) Spillover % Appliances/HVAC 11,928 47,575 25.1%
Though indicating higher potential spillover savings, most residential participants installing additional energy-efficient equipment reported the HES Program did not greatly influence their purchasing decisions. Further, some applied for incentives for additional measures purchased.
Table 46 summarizes numbers of participants excluded from the spillover analysis due to receiving incentives.
Table 46. Effects of Program Influence and Incentives on HES Spillover
Program Category Spillover Measures Installed
Attributable to High Program Influence Spillover Measures Installed Not
Receiving Incentive Appliances/HVAC 26 19
Overall, surveyed HES Program participants highly influenced by the HES Program installed 26 additional measures. Participants received incentives for seven of these measures, leaving 19 measures qualifying for spillover savings. Table 47 displays 19 additional measures installed by HES appliance, and HVAC participants qualifying as spillover. Of this 19, insulation installed outside the HES Program accounted for the largest proportion of spillover savings (54 percent).
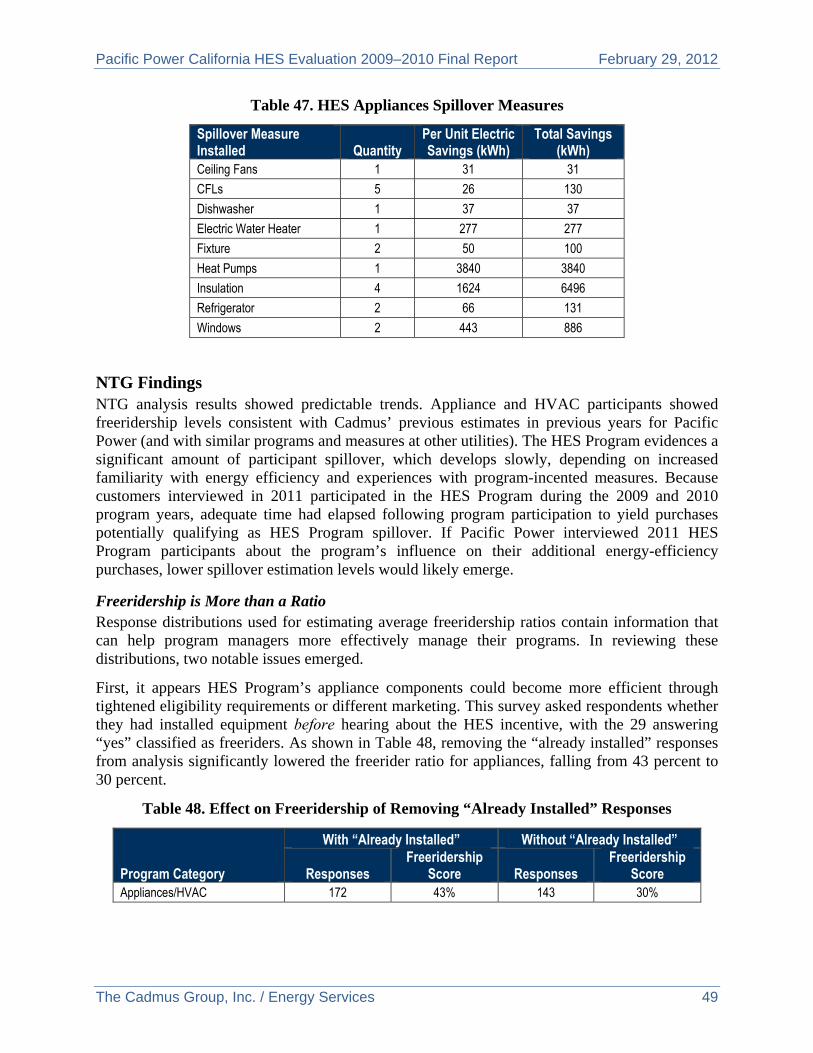
Pacific Power California HES Evaluation 2009–2010 Final Report February 29, 2012
The Cadmus Group, Inc. / Energy Services 49
Table 47. HES Appliances Spillover Measures
Spillover Measure Installed Quantity
Per Unit Electric Savings (kWh)
Total Savings (kWh)
Ceiling Fans 1 31 31
CFLs 5 26 130
Dishwasher 1 37 37
Electric Water Heater 1 277 277
Fixture 2 50 100
Heat Pumps 1 3840 3840
Insulation 4 1624 6496
Refrigerator 2 66 131
Windows 2 443 886
NTG Findings NTG analysis results showed predictable trends. Appliance and HVAC participants showed freeridership levels consistent with Cadmus’ previous estimates in previous years for Pacific Power (and with similar programs and measures at other utilities). The HES Program evidences a significant amount of participant spillover, which develops slowly, depending on increased familiarity with energy efficiency and experiences with program-incented measures. Because customers interviewed in 2011 participated in the HES Program during the 2009 and 2010 program years, adequate time had elapsed following program participation to yield purchases potentially qualifying as HES Program spillover. If Pacific Power interviewed 2011 HES Program participants about the program’s influence on their additional energy-efficiency purchases, lower spillover estimation levels would likely emerge.
Freeridership is More than a Ratio Response distributions used for estimating average freeridership ratios contain information that can help program managers more effectively manage their programs. In reviewing these distributions, two notable issues emerged.
First, it appears HES Program’s appliance components could become more efficient through tightened eligibility requirements or different marketing. This survey asked respondents whether they had installed equipment before hearing about the HES incentive, with the 29 answering “yes” classified as freeriders. As shown in Table 48, removing the “already installed” responses from analysis significantly lowered the freerider ratio for appliances, falling from 43 percent to 30 percent.
Table 48. Effect on Freeridership of Removing “Already Installed” Responses
Program Category
With “Already Installed” Without “Already Installed”
Responses Freeridership
Score Responses Freeridership
Score Appliances/HVAC 172 43% 143 30%
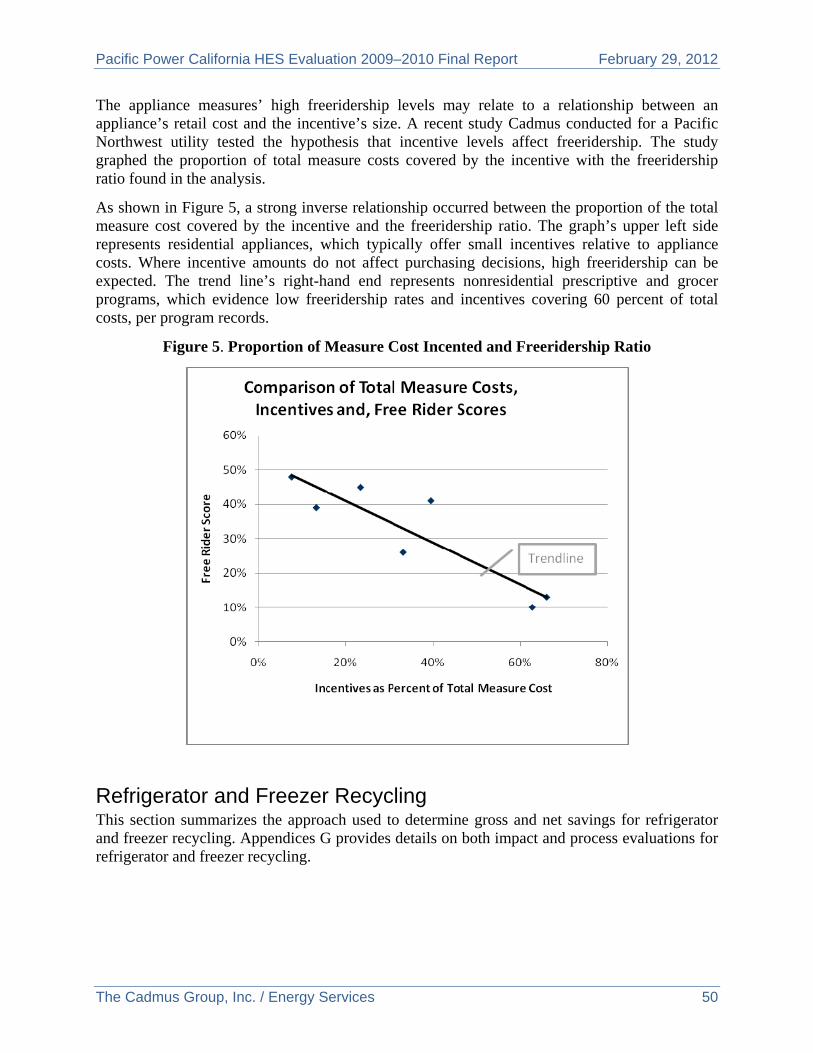
Pacific Power California HES Evaluation 2009–2010 Final Report February 29, 2012
The Cadmus Group, Inc. / Energy Services 50
The appliance measures’ high freeridership levels may relate to a relationship between an appliance’s retail cost and the incentive’s size. A recent study Cadmus conducted for a Pacific Northwest utility tested the hypothesis that incentive levels affect freeridership. The study graphed the proportion of total measure costs covered by the incentive with the freeridership ratio found in the analysis.
As shown in Figure 5, a strong inverse relationship occurred between the proportion of the total measure cost covered by the incentive and the freeridership ratio. The graph’s upper left side represents residential appliances, which typically offer small incentives relative to appliance costs. Where incentive amounts do not affect purchasing decisions, high freeridership can be expected. The trend line’s right-hand end represents nonresidential prescriptive and grocer programs, which evidence low freeridership rates and incentives covering 60 percent of total costs, per program records.
Figure 5. Proportion of Measure Cost Incented and Freeridership Ratio
Refrigerator and Freezer Recycling This section summarizes the approach used to determine gross and net savings for refrigerator and freezer recycling. Appendices G provides details on both impact and process evaluations for refrigerator and freezer recycling.
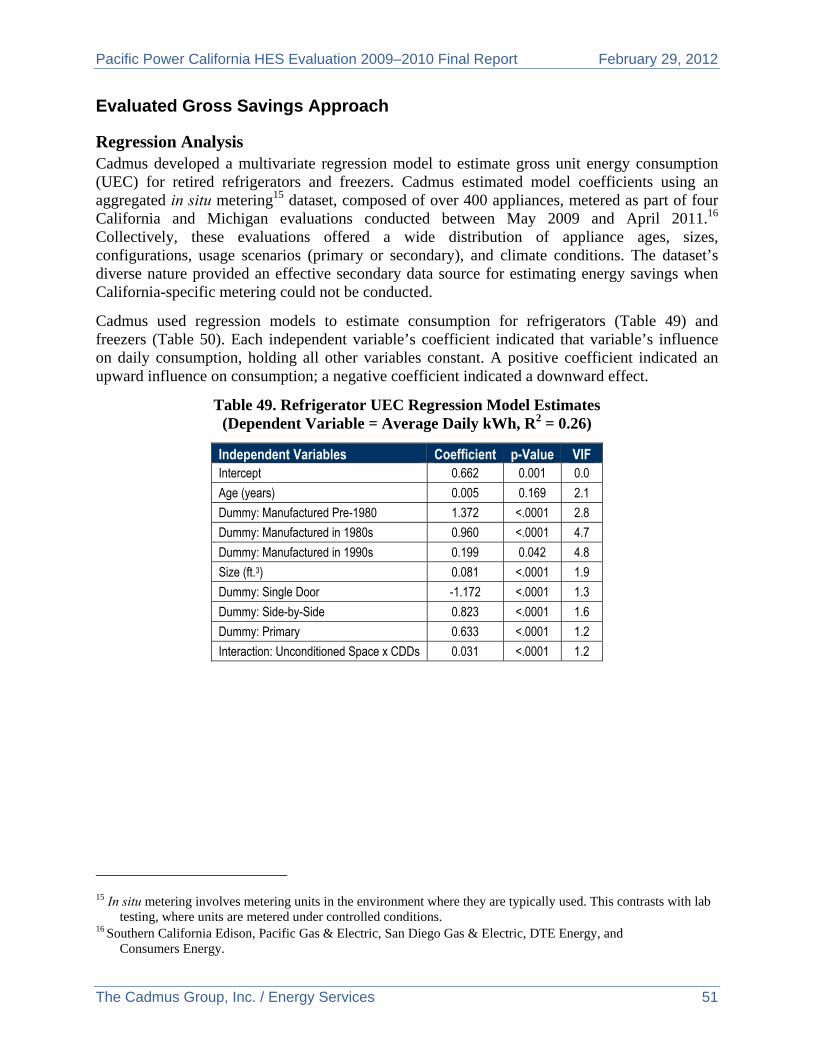
Pacific Power California HES Evaluation 2009–2010 Final Report February 29, 2012
The Cadmus Group, Inc. / Energy Services 51
Evaluated Gross Savings Approach
Regression Analysis Cadmus developed a multivariate regression model to estimate gross unit energy consumption (UEC) for retired refrigerators and freezers. Cadmus estimated model coefficients using an aggregated in situ metering15 dataset, composed of over 400 appliances, metered as part of four California and Michigan evaluations conducted between May 2009 and April 2011.16 Collectively, these evaluations offered a wide distribution of appliance ages, sizes, configurations, usage scenarios (primary or secondary), and climate conditions. The dataset’s diverse nature provided an effective secondary data source for estimating energy savings when California-specific metering could not be conducted.
Cadmus used regression models to estimate consumption for refrigerators (Table 49) and freezers (Table 50). Each independent variable’s coefficient indicated that variable’s influence on daily consumption, holding all other variables constant. A positive coefficient indicated an upward influence on consumption; a negative coefficient indicated a downward effect.
Table 49. Refrigerator UEC Regression Model Estimates (Dependent Variable = Average Daily kWh, R2 = 0.26)
Independent Variables Coefficient p-Value VIF Intercept 0.662 0.001 0.0
Age (years) 0.005 0.169 2.1
Dummy: Manufactured Pre-1980 1.372 <.0001 2.8
Dummy: Manufactured in 1980s 0.960 <.0001 4.7
Dummy: Manufactured in 1990s 0.199 0.042 4.8
Size (ft.3) 0.081 <.0001 1.9
Dummy: Single Door -1.172 <.0001 1.3
Dummy: Side-by-Side 0.823 <.0001 1.6
Dummy: Primary 0.633 <.0001 1.2
Interaction: Unconditioned Space x CDDs 0.031 <.0001 1.2
15 In situ metering involves metering units in the environment where they are typically used. This contrasts with lab
testing, where units are metered under controlled conditions. 16 Southern California Edison, Pacific Gas & Electric, San Diego Gas & Electric, DTE Energy, and
Consumers Energy.
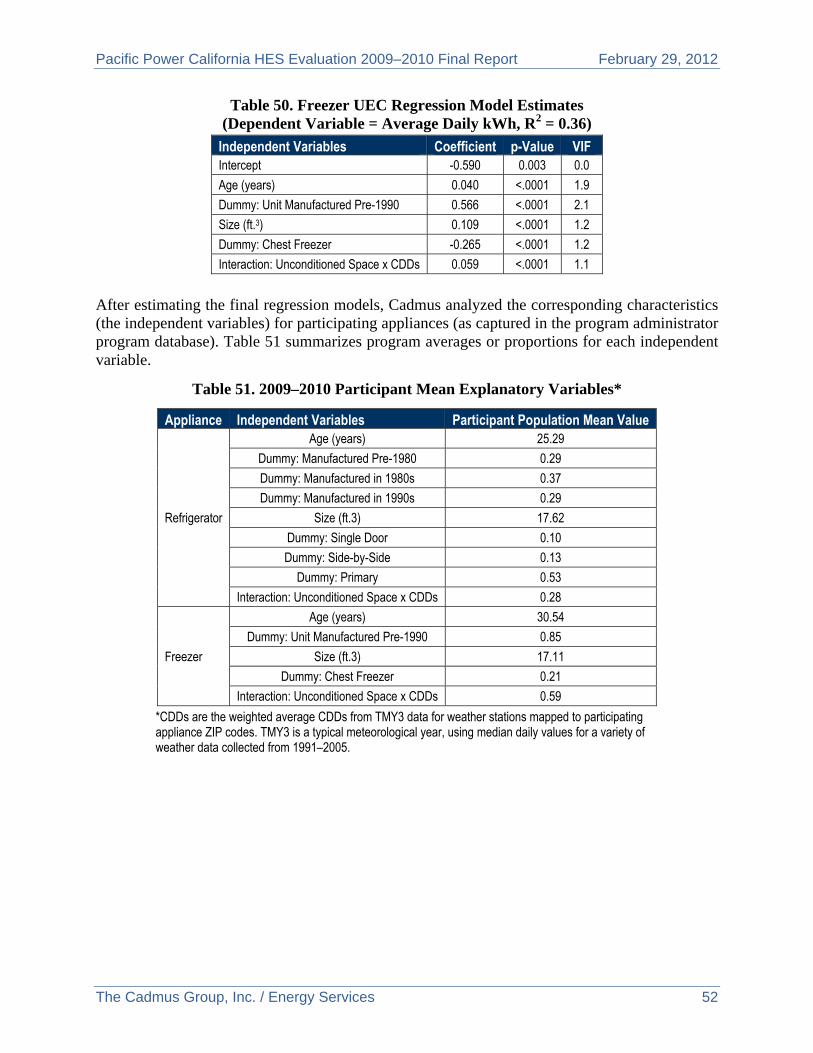
Pacific Power California HES Evaluation 2009–2010 Final Report February 29, 2012
The Cadmus Group, Inc. / Energy Services 52
Table 50. Freezer UEC Regression Model Estimates (Dependent Variable = Average Daily kWh, R2 = 0.36)
Independent Variables Coefficient p-Value VIF Intercept -0.590 0.003 0.0
Age (years) 0.040 <.0001 1.9
Dummy: Unit Manufactured Pre-1990 0.566 <.0001 2.1
Size (ft.3) 0.109 <.0001 1.2
Dummy: Chest Freezer -0.265 <.0001 1.2
Interaction: Unconditioned Space x CDDs 0.059 <.0001 1.1
After estimating the final regression models, Cadmus analyzed the corresponding characteristics (the independent variables) for participating appliances (as captured in the program administrator program database). Table 51 summarizes program averages or proportions for each independent variable.
Table 51. 2009–2010 Participant Mean Explanatory Variables*
Appliance Independent Variables Participant Population Mean Value
Refrigerator
Age (years) 25.29
Dummy: Manufactured Pre-1980 0.29
Dummy: Manufactured in 1980s 0.37
Dummy: Manufactured in 1990s 0.29
Size (ft.3) 17.62
Dummy: Single Door 0.10
Dummy: Side-by-Side 0.13
Dummy: Primary 0.53
Interaction: Unconditioned Space x CDDs 0.28
Freezer
Age (years) 30.54
Dummy: Unit Manufactured Pre-1990 0.85
Size (ft.3) 17.11
Dummy: Chest Freezer 0.21
Interaction: Unconditioned Space x CDDs 0.59
*CDDs are the weighted average CDDs from TMY3 data for weather stations mapped to participating appliance ZIP codes. TMY3 is a typical meteorological year, using median daily values for a variety of weather data collected from 1991–2005.
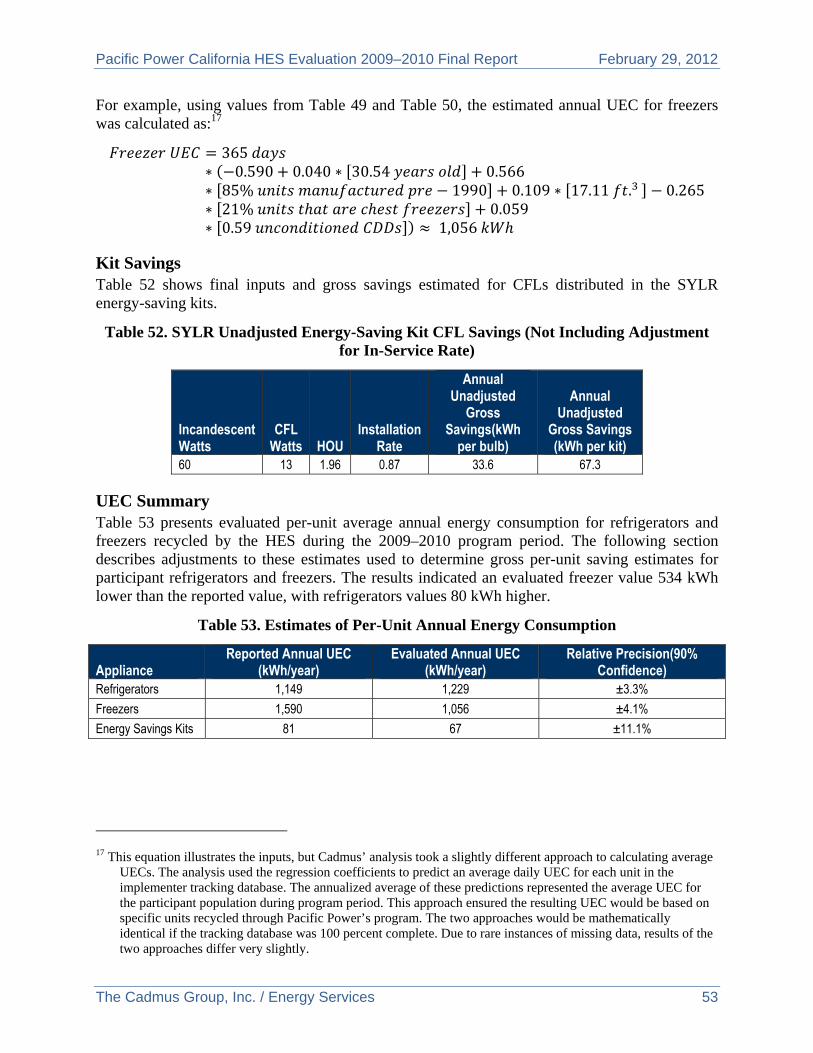
Pacific Power California HES Evaluation 2009–2010 Final Report February 29, 2012
The Cadmus Group, Inc. / Energy Services 53
For example, using values from Table 49 and Table 50, the estimated annual UEC for freezers was calculated as:17
365 0.590 0.040 30.54 0.566
85% 1990 0.109 17.11 . 0.26521% 0.0590.59 1,056
Kit Savings Table 52 shows final inputs and gross savings estimated for CFLs distributed in the SYLR energy-saving kits.
Table 52. SYLR Unadjusted Energy-Saving Kit CFL Savings (Not Including Adjustment for In-Service Rate)
Incandescent Watts
CFL Watts HOU
Installation Rate
Annual Unadjusted
Gross Savings(kWh
per bulb)
Annual Unadjusted
Gross Savings (kWh per kit)
60 13 1.96 0.87 33.6 67.3
UEC Summary Table 53 presents evaluated per-unit average annual energy consumption for refrigerators and freezers recycled by the HES during the 2009–2010 program period. The following section describes adjustments to these estimates used to determine gross per-unit saving estimates for participant refrigerators and freezers. The results indicated an evaluated freezer value 534 kWh lower than the reported value, with refrigerators values 80 kWh higher.
Table 53. Estimates of Per-Unit Annual Energy Consumption
Appliance Reported Annual UEC
(kWh/year) Evaluated Annual UEC
(kWh/year) Relative Precision(90%
Confidence) Refrigerators 1,149 1,229 ±3.3%
Freezers 1,590 1,056 ±4.1%
Energy Savings Kits 81 67 ±11.1%
17 This equation illustrates the inputs, but Cadmus’ analysis took a slightly different approach to calculating average
UECs. The analysis used the regression coefficients to predict an average daily UEC for each unit in the implementer tracking database. The annualized average of these predictions represented the average UEC for the participant population during program period. This approach ensured the resulting UEC would be based on specific units recycled through Pacific Power’s program. The two approaches would be mathematically identical if the tracking database was 100 percent complete. Due to rare instances of missing data, results of the two approaches differ very slightly.
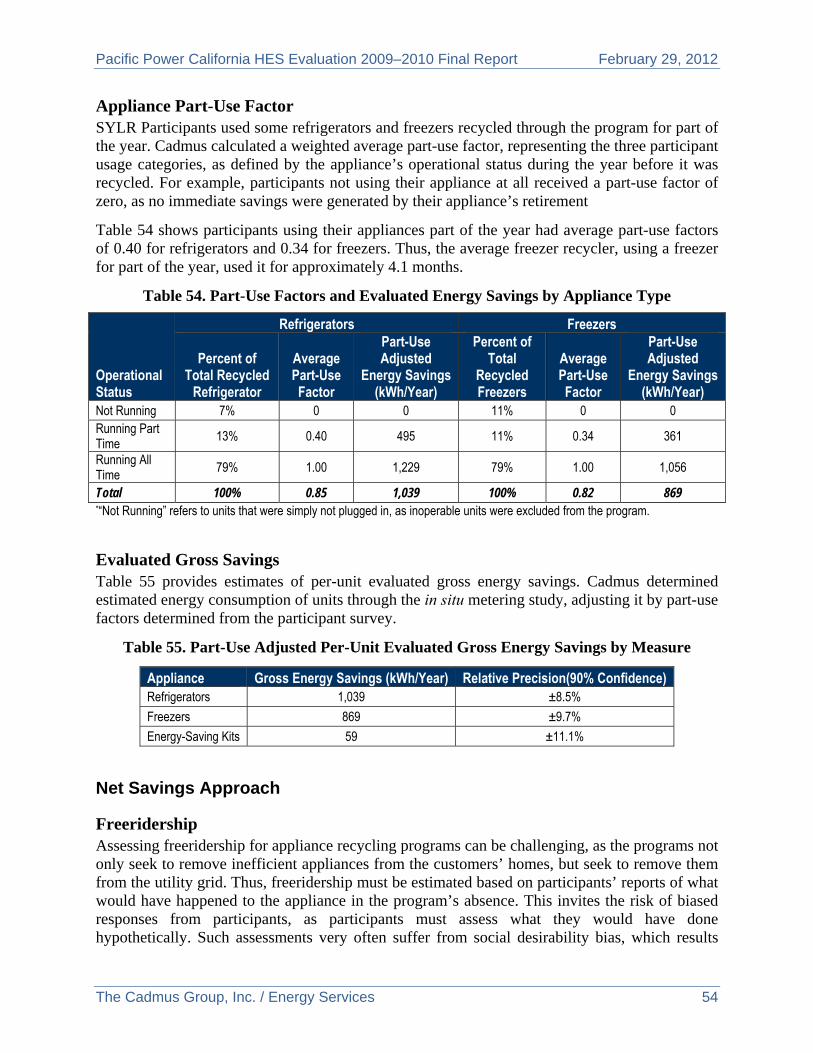
Pacific Power California HES Evaluation 2009–2010 Final Report February 29, 2012
The Cadmus Group, Inc. / Energy Services 54
Appliance Part-Use Factor SYLR Participants used some refrigerators and freezers recycled through the program for part of the year. Cadmus calculated a weighted average part-use factor, representing the three participant usage categories, as defined by the appliance’s operational status during the year before it was recycled. For example, participants not using their appliance at all received a part-use factor of zero, as no immediate savings were generated by their appliance’s retirement
Table 54 shows participants using their appliances part of the year had average part-use factors of 0.40 for refrigerators and 0.34 for freezers. Thus, the average freezer recycler, using a freezer for part of the year, used it for approximately 4.1 months.
Table 54. Part-Use Factors and Evaluated Energy Savings by Appliance Type
Operational Status
Refrigerators Freezers
Percent of Total Recycled
Refrigerator
Average Part-Use Factor
Part-Use Adjusted
Energy Savings (kWh/Year)
Percent of Total
Recycled Freezers
Average Part-Use Factor
Part-Use Adjusted
Energy Savings (kWh/Year)
Not Running 7% 0 0 11% 0 0 Running Part Time
13% 0.40 495 11% 0.34 361
Running All Time
79% 1.00 1,229 79% 1.00 1,056
Total 100% 0.85 1,039 100% 0.82 869 *“Not Running” refers to units that were simply not plugged in, as inoperable units were excluded from the program.
Evaluated Gross Savings Table 55 provides estimates of per-unit evaluated gross energy savings. Cadmus determined estimated energy consumption of units through the in situ metering study, adjusting it by part-use factors determined from the participant survey.
Table 55. Part-Use Adjusted Per-Unit Evaluated Gross Energy Savings by Measure
Appliance Gross Energy Savings (kWh/Year) Relative Precision(90% Confidence) Refrigerators 1,039 ±8.5%
Freezers 869 ±9.7%
Energy-Saving Kits 59 ±11.1%
Net Savings Approach
Freeridership Assessing freeridership for appliance recycling programs can be challenging, as the programs not only seek to remove inefficient appliances from the customers’ homes, but seek to remove them from the utility grid. Thus, freeridership must be estimated based on participants’ reports of what would have happened to the appliance in the program’s absence. This invites the risk of biased responses from participants, as participants must assess what they would have done hypothetically. Such assessments very often suffer from social desirability bias, which results
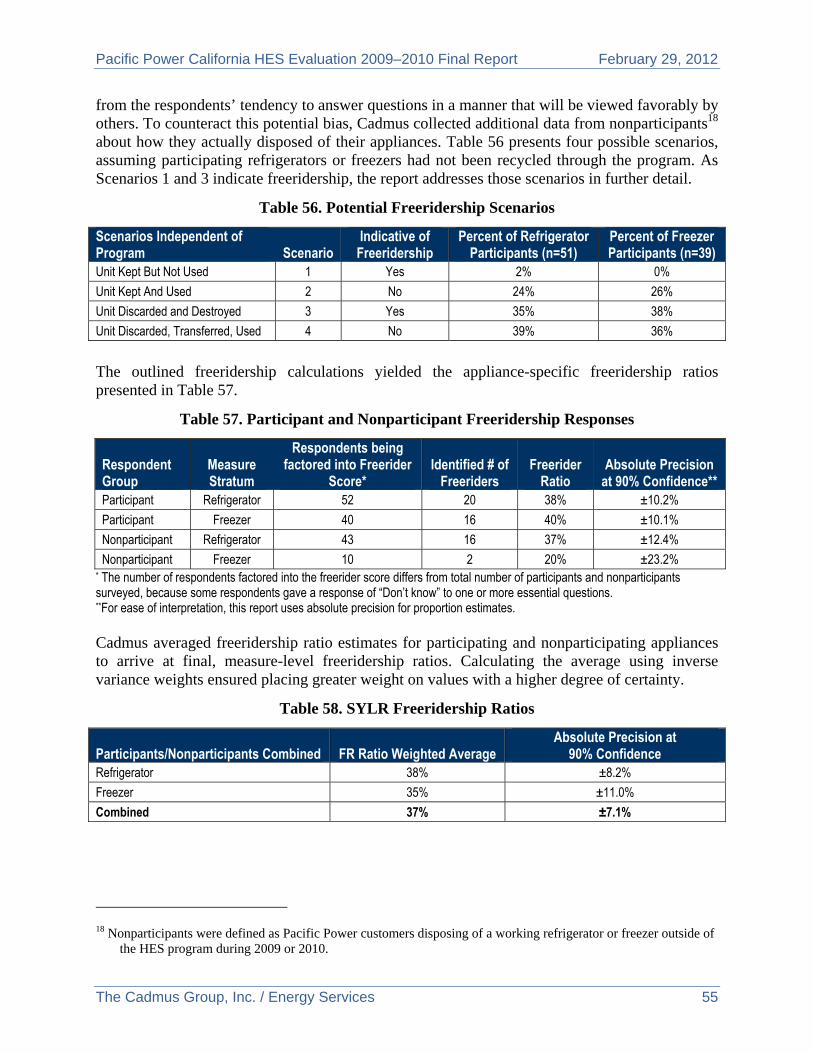
Pacific Power California HES Evaluation 2009–2010 Final Report February 29, 2012
The Cadmus Group, Inc. / Energy Services 55
from the respondents’ tendency to answer questions in a manner that will be viewed favorably by others. To counteract this potential bias, Cadmus collected additional data from nonparticipants18 about how they actually disposed of their appliances. Table 56 presents four possible scenarios, assuming participating refrigerators or freezers had not been recycled through the program. As Scenarios 1 and 3 indicate freeridership, the report addresses those scenarios in further detail.
Table 56. Potential Freeridership Scenarios
Scenarios Independent of Program Scenario
Indicative of Freeridership
Percent of Refrigerator Participants (n=51)
Percent of Freezer Participants (n=39)
Unit Kept But Not Used 1 Yes 2% 0%
Unit Kept And Used 2 No 24% 26%
Unit Discarded and Destroyed 3 Yes 35% 38%
Unit Discarded, Transferred, Used 4 No 39% 36%
The outlined freeridership calculations yielded the appliance-specific freeridership ratios presented in Table 57.
Table 57. Participant and Nonparticipant Freeridership Responses
Respondent Group
Measure Stratum
Respondents being factored into Freerider
Score* Identified # of
Freeriders Freerider
Ratio Absolute Precision
at 90% Confidence** Participant Refrigerator 52 20 38% ±10.2%
Participant Freezer 40 16 40% ±10.1%
Nonparticipant Refrigerator 43 16 37% ±12.4%
Nonparticipant Freezer 10 2 20% ±23.2% * The number of respondents factored into the freerider score differs from total number of participants and nonparticipants surveyed, because some respondents gave a response of “Don’t know” to one or more essential questions. **For ease of interpretation, this report uses absolute precision for proportion estimates.
Cadmus averaged freeridership ratio estimates for participating and nonparticipating appliances to arrive at final, measure-level freeridership ratios. Calculating the average using inverse variance weights ensured placing greater weight on values with a higher degree of certainty.
Table 58. SYLR Freeridership Ratios
Participants/Nonparticipants Combined FR Ratio Weighted Average Absolute Precision at
90% Confidence Refrigerator 38% ±8.2%
Freezer 35% ±11.0%
Combined 37% ±7.1%
18 Nonparticipants were defined as Pacific Power customers disposing of a working refrigerator or freezer outside of
the HES program during 2009 or 2010.
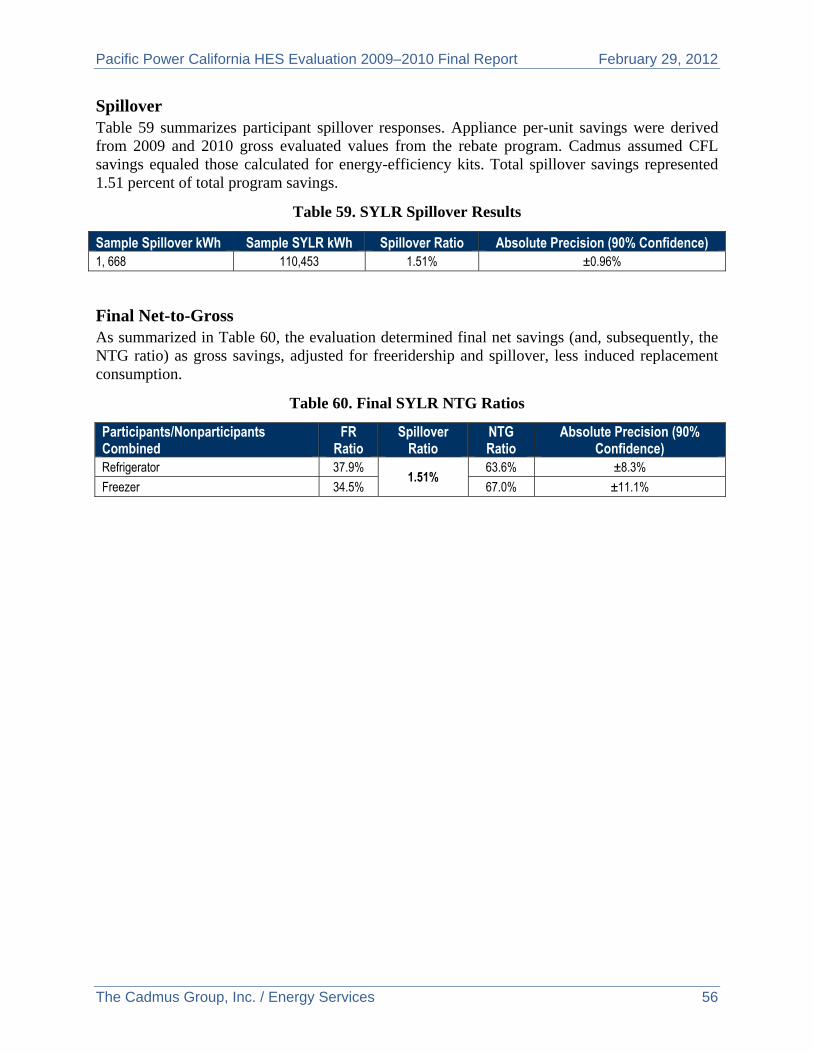
Pacific Power California HES Evaluation 2009–2010 Final Report February 29, 2012
The Cadmus Group, Inc. / Energy Services 56
Spillover Table 59 summarizes participant spillover responses. Appliance per-unit savings were derived from 2009 and 2010 gross evaluated values from the rebate program. Cadmus assumed CFL savings equaled those calculated for energy-efficiency kits. Total spillover savings represented 1.51 percent of total program savings.
Table 59. SYLR Spillover Results
Sample Spillover kWh Sample SYLR kWh Spillover Ratio Absolute Precision (90% Confidence) 1, 668 110,453 1.51% ±0.96%
Final Net-to-Gross As summarized in Table 60, the evaluation determined final net savings (and, subsequently, the NTG ratio) as gross savings, adjusted for freeridership and spillover, less induced replacement consumption.
Table 60. Final SYLR NTG Ratios
Participants/Nonparticipants Combined
FR Ratio
Spillover Ratio
NTG Ratio
Absolute Precision (90% Confidence)
Refrigerator 37.9% 1.51%
63.6% ±8.3%
Freezer 34.5% 67.0% ±11.1%
Pacific Power California HES Evaluation 2009–2010 Final Report February 29, 2012
The Cadmus Group, Inc. / Energy Services 57
Process Evaluation Findings
This section provides detailed process evaluation findings for the HES Program. Findings resulted from Cadmus’ data collection activities, including retailer/contractor surveys, program staff and market actor interviews, participant surveys, and secondary research.
Program Implementation and Delivery
Program Status The HES Program provided cash incentives to residential customers for purchases of energy-efficient products, home improvements, and heating and cooling equipment and services. In California, the HES Program also included an appliance recycling component. Appendix L provides detailed findings from Cadmus’ evaluation of the SYLR Program. According to implementation staff, the HES Program offered an à la carte energy-efficiency program, allowing customers to install multiple measures to create customized efficiency portfolios. HES Program operations “allow customers to pick what they need and apply for an incentive.” Accessible to all customers (even those who are not homeowners), the HES Program provided energy-saving opportunities for Pacific Power’s entire customer community. According to the program implementer, due to poor forecasting, the California HES Program did not meet its goals for the 2009 and 2010 program years.
Delivery Structure and Processes The program implementer delivered the HES Program. For most qualifying program measures, customers received incentives through a mail-in process. However, because the HES Program’s lighting component uses an upstream mechanism, the program implementer paid incentives directly to manufacturers of qualifying light bulbs. Local retailers and contractors supported the program by: upselling their customers to higher-efficiency equipment measures; installing equipment and service measures; and promoting available incentives. As part of the HES Program, Pacific Power also offered incentives to contractors for quality installation, sizing, and tune-ups of qualified HVAC measures.
According to implementer staff, the program implementer primarily used an allocation system to target lighting retailers. For each retail partner location, program implementer staff analyzed the customer base, assigning stores an allocation ranking, determined by the percentage of Pacific Power customers in that location. Targeted potential participating retailers needed a Pacific Power customer base of 90 percent or higher. The allocation ranking sought to minimize leakage of incented bulbs to customers outside Pacific Power’s service territory.
Program stakeholders noted program implementer staff working on Pacific Power’s HES Programs originally had not been assigned to specific states; rather, implementation staff constantly focused on all five states’ programs. In 2010, the program implementer began assigning staff to specific service territories, with state management positions created to streamline the program’s implementation within each individual state. Additionally, the program implementer created a two-channel structure to better manage relationships with participating retailers and contractors (trade allies) in each state. Implementer staff divided into two channels that focused entirely on either retailers or contractors. These teams were assigned a channel
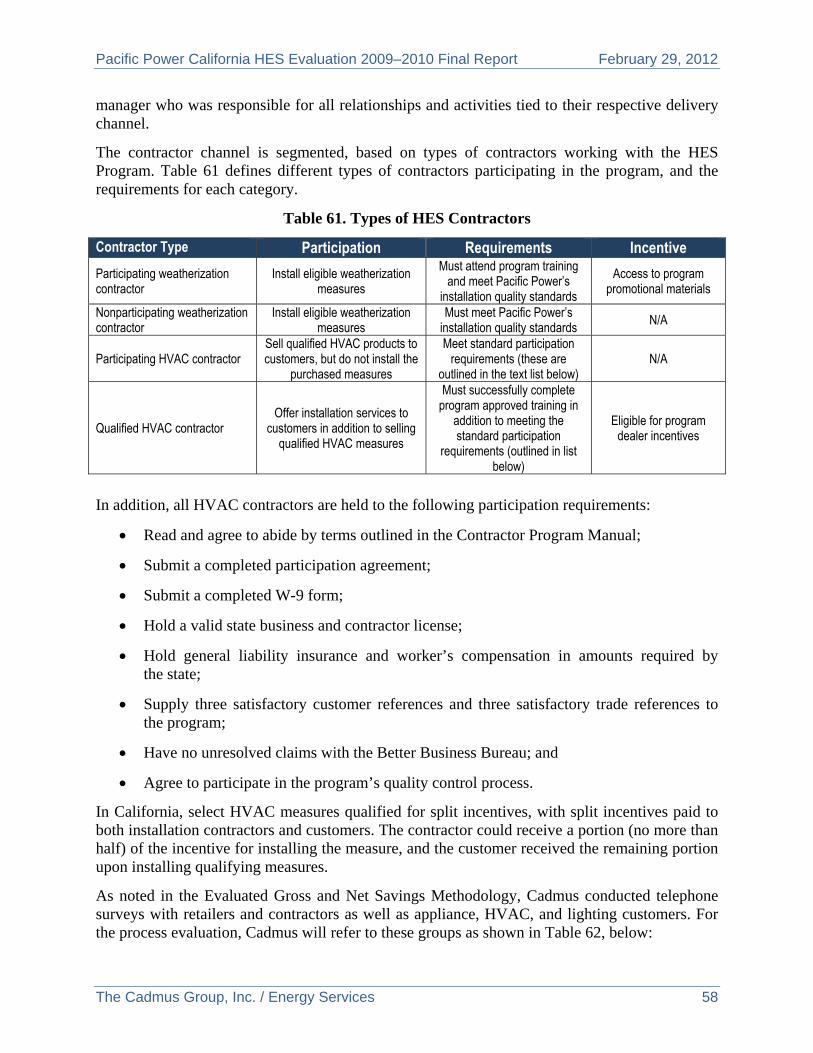
Pacific Power California HES Evaluation 2009–2010 Final Report February 29, 2012
The Cadmus Group, Inc. / Energy Services 58
manager who was responsible for all relationships and activities tied to their respective delivery channel.
The contractor channel is segmented, based on types of contractors working with the HES Program. Table 61 defines different types of contractors participating in the program, and the requirements for each category.
Table 61. Types of HES Contractors
Contractor Type Participation Requirements Incentive
Participating weatherization contractor
Install eligible weatherization measures
Must attend program training and meet Pacific Power’s
installation quality standards
Access to program promotional materials
Nonparticipating weatherization contractor
Install eligible weatherization measures
Must meet Pacific Power’s installation quality standards
N/A
Participating HVAC contractor Sell qualified HVAC products to customers, but do not install the
purchased measures
Meet standard participation requirements (these are
outlined in the text list below) N/A
Qualified HVAC contractor Offer installation services to
customers in addition to selling qualified HVAC measures
Must successfully complete program approved training in
addition to meeting the standard participation
requirements (outlined in list below)
Eligible for program dealer incentives
In addition, all HVAC contractors are held to the following participation requirements:
Read and agree to abide by terms outlined in the Contractor Program Manual;
Submit a completed participation agreement;
Submit a completed W-9 form;
Hold a valid state business and contractor license;
Hold general liability insurance and worker’s compensation in amounts required by the state;
Supply three satisfactory customer references and three satisfactory trade references to the program;
Have no unresolved claims with the Better Business Bureau; and
Agree to participate in the program’s quality control process.
In California, select HVAC measures qualified for split incentives, with split incentives paid to both installation contractors and customers. The contractor could receive a portion (no more than half) of the incentive for installing the measure, and the customer received the remaining portion upon installing qualifying measures.
As noted in the Evaluated Gross and Net Savings Methodology, Cadmus conducted telephone surveys with retailers and contractors as well as appliance, HVAC, and lighting customers. For the process evaluation, Cadmus will refer to these groups as shown in Table 62, below:
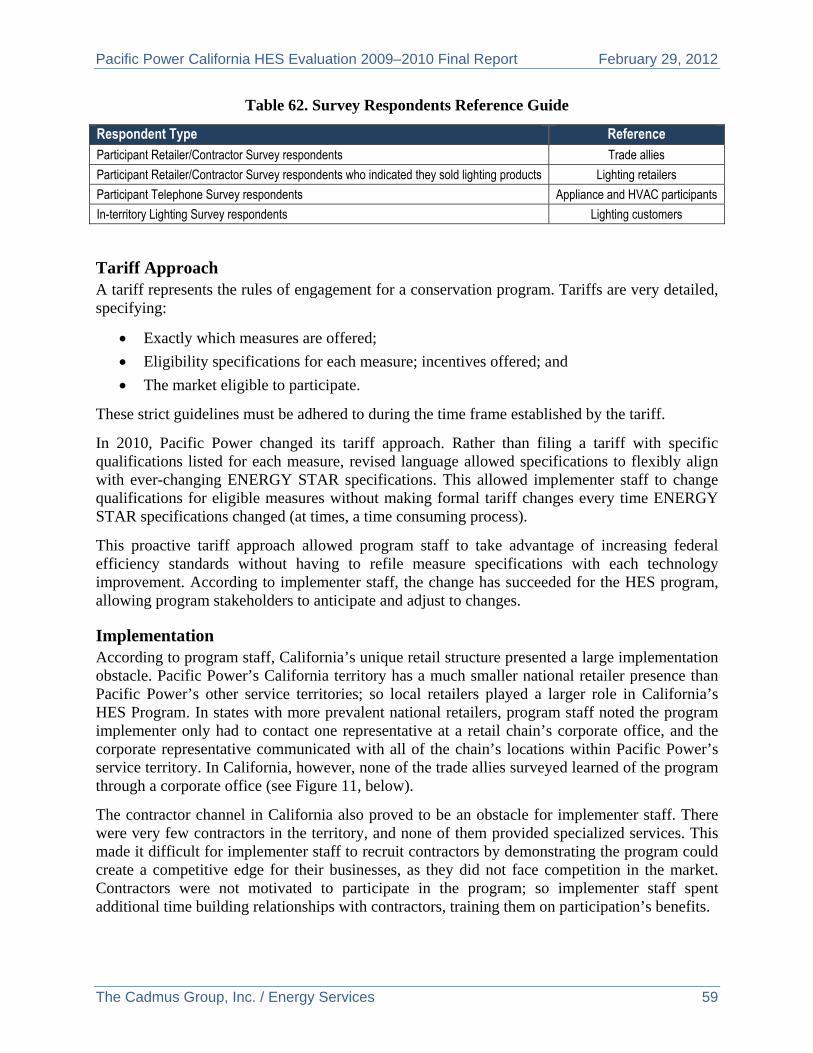
Pacific Power California HES Evaluation 2009–2010 Final Report February 29, 2012
The Cadmus Group, Inc. / Energy Services 59
Table 62. Survey Respondents Reference Guide
Respondent Type Reference Participant Retailer/Contractor Survey respondents Trade allies
Participant Retailer/Contractor Survey respondents who indicated they sold lighting products Lighting retailers
Participant Telephone Survey respondents Appliance and HVAC participants
In-territory Lighting Survey respondents Lighting customers
Tariff Approach A tariff represents the rules of engagement for a conservation program. Tariffs are very detailed, specifying:
Exactly which measures are offered;
Eligibility specifications for each measure; incentives offered; and
The market eligible to participate.
These strict guidelines must be adhered to during the time frame established by the tariff.
In 2010, Pacific Power changed its tariff approach. Rather than filing a tariff with specific qualifications listed for each measure, revised language allowed specifications to flexibly align with ever-changing ENERGY STAR specifications. This allowed implementer staff to change qualifications for eligible measures without making formal tariff changes every time ENERGY STAR specifications changed (at times, a time consuming process).
This proactive tariff approach allowed program staff to take advantage of increasing federal efficiency standards without having to refile measure specifications with each technology improvement. According to implementer staff, the change has succeeded for the HES program, allowing program stakeholders to anticipate and adjust to changes.
Implementation According to program staff, California’s unique retail structure presented a large implementation obstacle. Pacific Power’s California territory has a much smaller national retailer presence than Pacific Power’s other service territories; so local retailers played a larger role in California’s HES Program. In states with more prevalent national retailers, program staff noted the program implementer only had to contact one representative at a retail chain’s corporate office, and the corporate representative communicated with all of the chain’s locations within Pacific Power’s service territory. In California, however, none of the trade allies surveyed learned of the program through a corporate office (see Figure 11, below).
The contractor channel in California also proved to be an obstacle for implementer staff. There were very few contractors in the territory, and none of them provided specialized services. This made it difficult for implementer staff to recruit contractors by demonstrating the program could create a competitive edge for their businesses, as they did not face competition in the market. Contractors were not motivated to participate in the program; so implementer staff spent additional time building relationships with contractors, training them on participation’s benefits.
Pacific Power California HES Evaluation 2009–2010 Final Report February 29, 2012
The Cadmus Group, Inc. / Energy Services 60
California also face a specific barrier in its geographically dispersed population in Pacific Power’s territory. The program implementer’s field staff drove many miles between the territory’s main population centers, making in-person meetings and training with contractors time-consuming and expensive, although, according to program stakeholders, such meetings proved essential for building relationships with local retailers and contractors.
Additionally, Pacific Power’s has a very small territory in California; and its target market is rural, with limited income. Program staff estimated 80 percent of Pacific Power customers in California lived at or below the poverty level.
These barriers led Pacific Power and the program implementer to realize they had to increase field staff to raise their local presence and delivery capacity in California. The program implementer added locally based staff to increase program outreach to individual retailers. The program implementer’s field staff visits retailers regularly, recruiting new participants, and expanding relationships with participating trade allies.
Given California’s lack of a deep national chain presence and its widely distributed population centers, the program implementer required greater time and budget for field staff to visit individual stores to promote the HES Program. Program and implementer staff quickly realized this proved crucial in addressing California’s unique market barriers and ensuring the program’s success.
Energy Independence and Security Act EISA, an omnibus energy policy law requiring 25 percent greater efficiency for light bulbs, with new standards phased in from 2012 through 2014,19 effectively phases out 100-, 75-, 60-, and 40-watt incandescent light bulbs currently in the market. In 2007, California’s government passed the Huffman Bill which mandated reducing lighting energy usage in indoor residences and state facilities by no less than 50 percent by 2018, and requires a 25 percent reduction in commercial facilities’ usage.20 To achieve these efficiency levels, incandescent bulbs were already being phased out in California during the 2009–2010 HES program year, consequently phasing out the previous lighting savings baseline in the DSM market.
Program staff noted Pacific Power has been working to diversify its lighting portfolio in response to EISA legislation and the Huffman Bill, offering program incentives for all energy-efficient lighting options, including an expanded selection of specialty CFLs. Program staff have also planned to move away from the Database for Energy Efficiency Resources (DEER) savings assumptions they have used in the past, as these have not been updated to account for the Huffman Bill. Starting in 2012, the lighting savings for the HES program in California will be based on the regional technical forum (RTF), as in other Pacific Power territories.
In-territory lighting survey responses indicated lighting customers preferred CFLs to other energy-efficient lighting options. When presented with a choice of purchasing a more efficient incandescent bulb or a CFL, LED, or halogen bulb, 39 percent of lighting customers chose CFLs. Figure 6 illustrates the full distribution of choices lighting customers made regarding energy-
19 http://www.epa.gov/cfl/ 20 http://www.cawrecycles.org/issues/current_legislation/ab1109_07
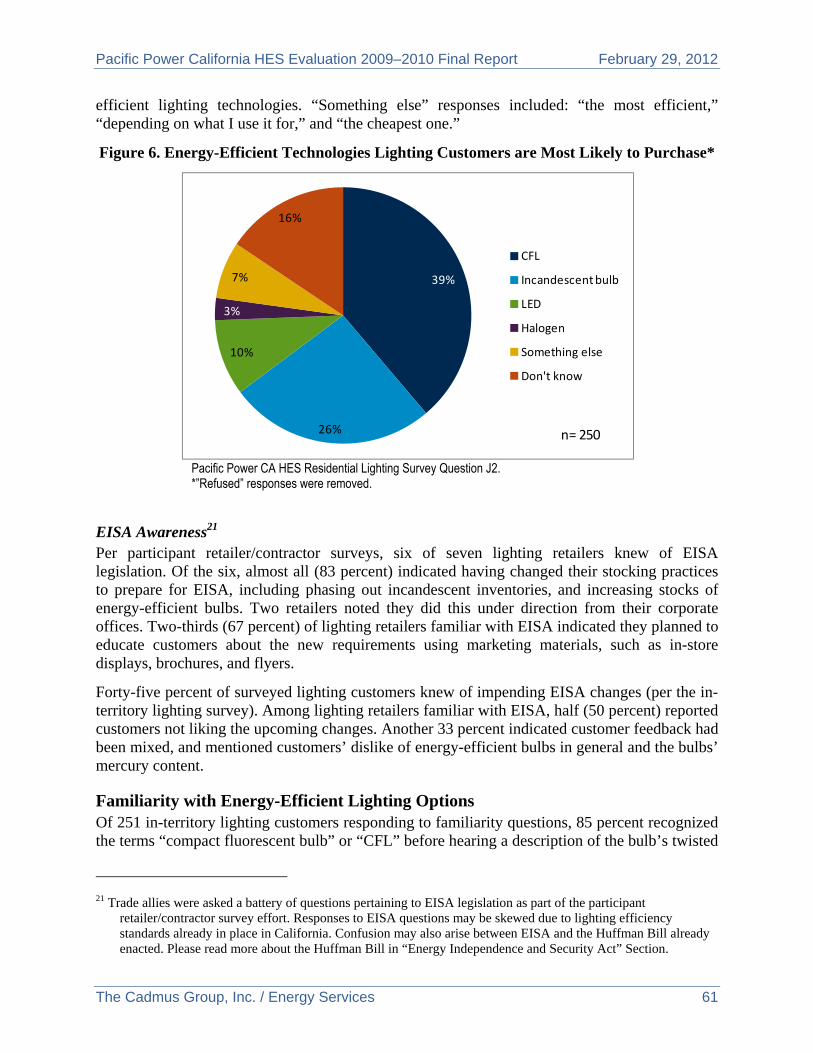
Pacific Power California HES Evaluation 2009–2010 Final Report February 29, 2012
The Cadmus Group, Inc. / Energy Services 61
efficient lighting technologies. “Something else” responses included: “the most efficient,” “depending on what I use it for,” and “the cheapest one.”
Figure 6. Energy-Efficient Technologies Lighting Customers are Most Likely to Purchase*
Pacific Power CA HES Residential Lighting Survey Question J2.
*”Refused” responses were removed.
EISA Awareness21 Per participant retailer/contractor surveys, six of seven lighting retailers knew of EISA legislation. Of the six, almost all (83 percent) indicated having changed their stocking practices to prepare for EISA, including phasing out incandescent inventories, and increasing stocks of energy-efficient bulbs. Two retailers noted they did this under direction from their corporate offices. Two-thirds (67 percent) of lighting retailers familiar with EISA indicated they planned to educate customers about the new requirements using marketing materials, such as in-store displays, brochures, and flyers.
Forty-five percent of surveyed lighting customers knew of impending EISA changes (per the in-territory lighting survey). Among lighting retailers familiar with EISA, half (50 percent) reported customers not liking the upcoming changes. Another 33 percent indicated customer feedback had been mixed, and mentioned customers’ dislike of energy-efficient bulbs in general and the bulbs’ mercury content.
Familiarity with Energy-Efficient Lighting Options Of 251 in-territory lighting customers responding to familiarity questions, 85 percent recognized the terms “compact fluorescent bulb” or “CFL” before hearing a description of the bulb’s twisted
21 Trade allies were asked a battery of questions pertaining to EISA legislation as part of the participant
retailer/contractor survey effort. Responses to EISA questions may be skewed due to lighting efficiency standards already in place in California. Confusion may also arise between EISA and the Huffman Bill already enacted. Please read more about the Huffman Bill in “Energy Independence and Security Act” Section.
39%
26%
10%
3%
7%
16%
CFL
Incandescent bulb
LED
Halogen
Something else
Don't know
n= 250
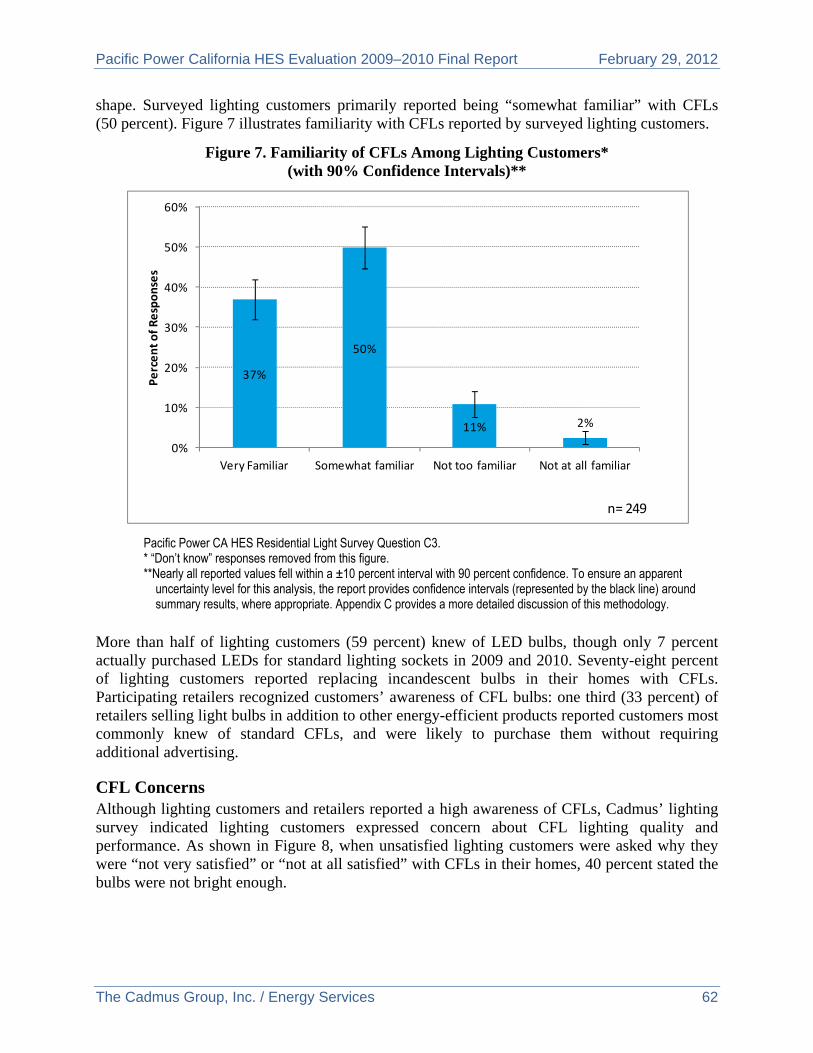
Pacific Power California HES Evaluation 2009–2010 Final Report February 29, 2012
The Cadmus Group, Inc. / Energy Services 62
shape. Surveyed lighting customers primarily reported being “somewhat familiar” with CFLs (50 percent). Figure 7 illustrates familiarity with CFLs reported by surveyed lighting customers.
Figure 7. Familiarity of CFLs Among Lighting Customers* (with 90% Confidence Intervals)**
Pacific Power CA HES Residential Light Survey Question C3. * “Don’t know” responses removed from this figure. **Nearly all reported values fell within a ±10 percent interval with 90 percent confidence. To ensure an apparent
uncertainty level for this analysis, the report provides confidence intervals (represented by the black line) around summary results, where appropriate. Appendix C provides a more detailed discussion of this methodology.
More than half of lighting customers (59 percent) knew of LED bulbs, though only 7 percent actually purchased LEDs for standard lighting sockets in 2009 and 2010. Seventy-eight percent of lighting customers reported replacing incandescent bulbs in their homes with CFLs. Participating retailers recognized customers’ awareness of CFL bulbs: one third (33 percent) of retailers selling light bulbs in addition to other energy-efficient products reported customers most commonly knew of standard CFLs, and were likely to purchase them without requiring additional advertising.
CFL Concerns Although lighting customers and retailers reported a high awareness of CFLs, Cadmus’ lighting survey indicated lighting customers expressed concern about CFL lighting quality and performance. As shown in Figure 8, when unsatisfied lighting customers were asked why they were “not very satisfied” or “not at all satisfied” with CFLs in their homes, 40 percent stated the bulbs were not bright enough.
37%
50%
11% 2%
0%
10%
20%
30%
40%
50%
60%
Very Familiar Somewhat familiar Not too familiar Not at all familiar
Percent of Responses
n= 249
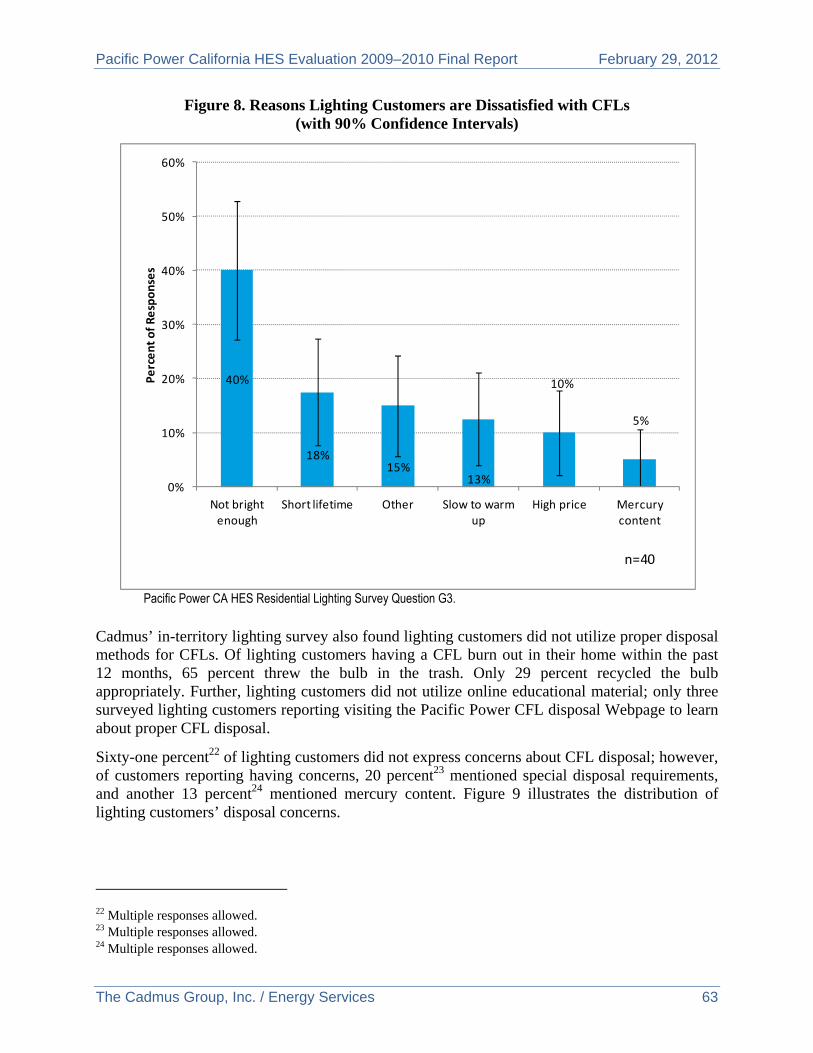
Pacific Power California HES Evaluation 2009–2010 Final Report February 29, 2012
The Cadmus Group, Inc. / Energy Services 63
Figure 8. Reasons Lighting Customers are Dissatisfied with CFLs (with 90% Confidence Intervals)
Pacific Power CA HES Residential Lighting Survey Question G3.
Cadmus’ in-territory lighting survey also found lighting customers did not utilize proper disposal methods for CFLs. Of lighting customers having a CFL burn out in their home within the past 12 months, 65 percent threw the bulb in the trash. Only 29 percent recycled the bulb appropriately. Further, lighting customers did not utilize online educational material; only three surveyed lighting customers reporting visiting the Pacific Power CFL disposal Webpage to learn about proper CFL disposal.
Sixty-one percent22 of lighting customers did not express concerns about CFL disposal; however, of customers reporting having concerns, 20 percent23 mentioned special disposal requirements, and another 13 percent24 mentioned mercury content. Figure 9 illustrates the distribution of lighting customers’ disposal concerns.
22 Multiple responses allowed. 23 Multiple responses allowed. 24 Multiple responses allowed.
40%
18%15%
13%
10%
5%
0%
10%
20%
30%
40%
50%
60%
Not bright enough
Short lifetime Other Slow to warm up
High price Mercury content
Percent of Responses
n=40
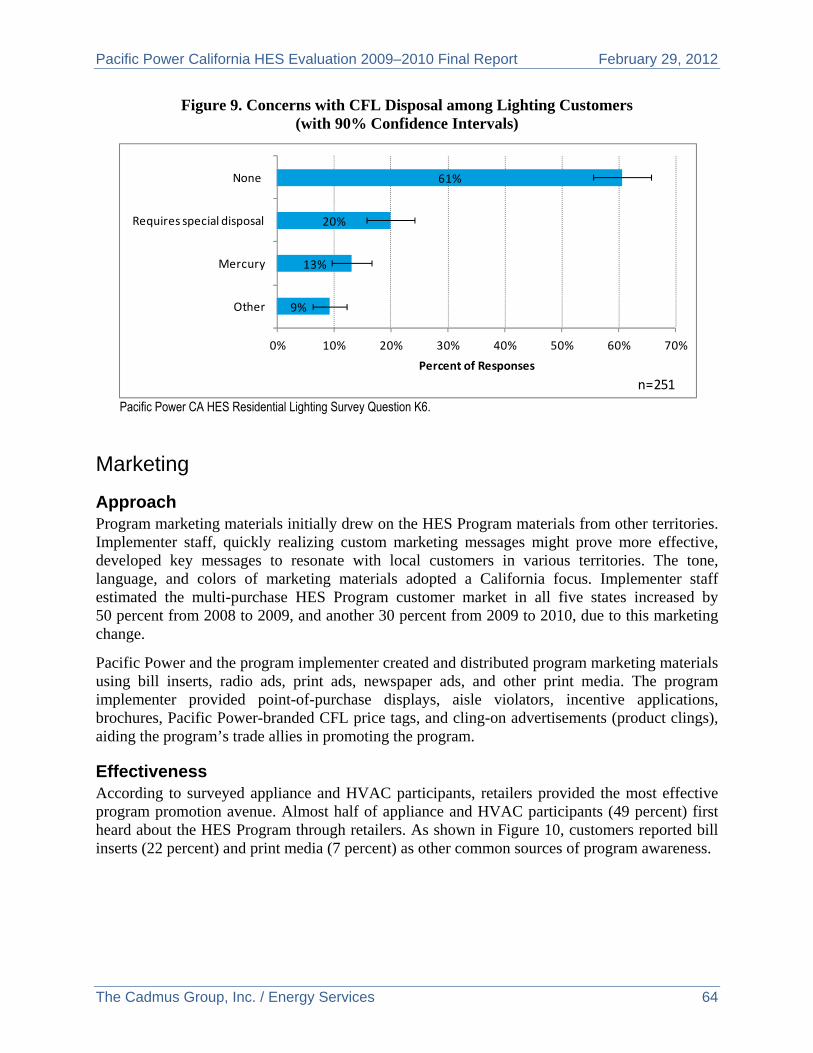
Pacific Power California HES Evaluation 2009–2010 Final Report February 29, 2012
The Cadmus Group, Inc. / Energy Services 64
Figure 9. Concerns with CFL Disposal among Lighting Customers (with 90% Confidence Intervals)
Pacific Power CA HES Residential Lighting Survey Question K6.
Marketing
Approach Program marketing materials initially drew on the HES Program materials from other territories. Implementer staff, quickly realizing custom marketing messages might prove more effective, developed key messages to resonate with local customers in various territories. The tone, language, and colors of marketing materials adopted a California focus. Implementer staff estimated the multi-purchase HES Program customer market in all five states increased by 50 percent from 2008 to 2009, and another 30 percent from 2009 to 2010, due to this marketing change.
Pacific Power and the program implementer created and distributed program marketing materials using bill inserts, radio ads, print ads, newspaper ads, and other print media. The program implementer provided point-of-purchase displays, aisle violators, incentive applications, brochures, Pacific Power-branded CFL price tags, and cling-on advertisements (product clings), aiding the program’s trade allies in promoting the program.
Effectiveness According to surveyed appliance and HVAC participants, retailers provided the most effective program promotion avenue. Almost half of appliance and HVAC participants (49 percent) first heard about the HES Program through retailers. As shown in Figure 10, customers reported bill inserts (22 percent) and print media (7 percent) as other common sources of program awareness.
9%
13%
20%
61%
0% 10% 20% 30% 40% 50% 60% 70%
Other
Mercury
Requires special disposal
None
Percent of Responses
n=251
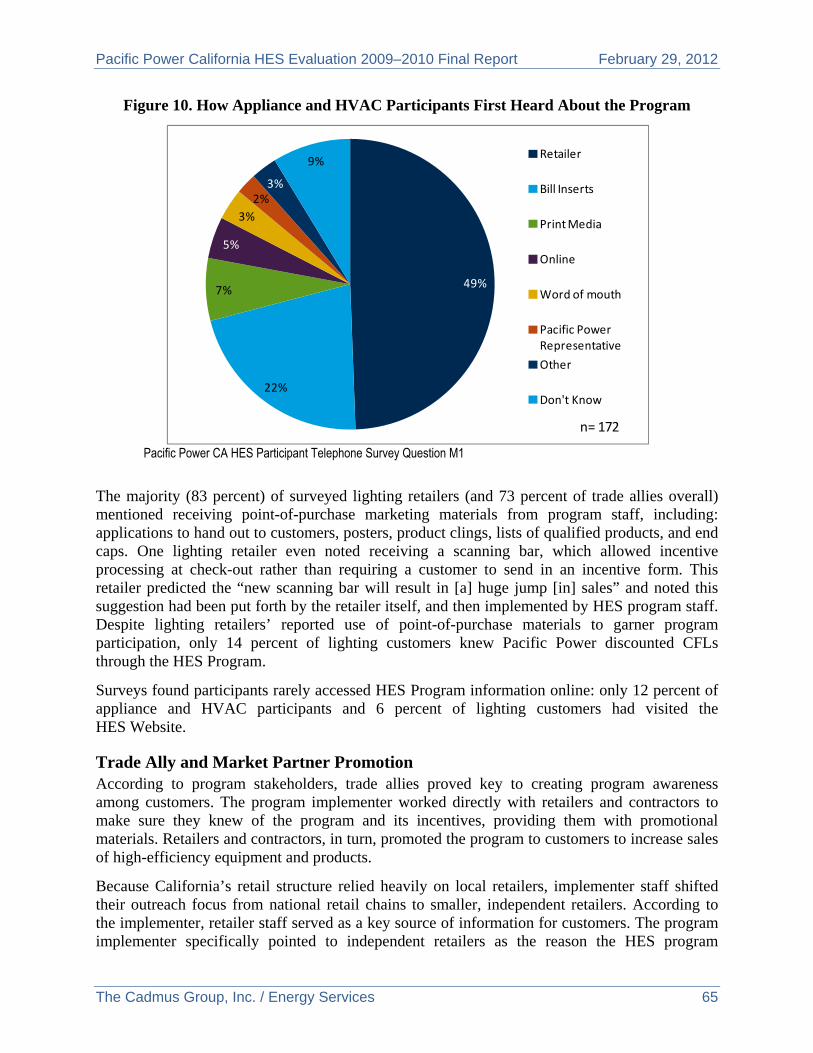
Pacific Power California HES Evaluation 2009–2010 Final Report February 29, 2012
The Cadmus Group, Inc. / Energy Services 65
Figure 10. How Appliance and HVAC Participants First Heard About the Program
Pacific Power CA HES Participant Telephone Survey Question M1
The majority (83 percent) of surveyed lighting retailers (and 73 percent of trade allies overall) mentioned receiving point-of-purchase marketing materials from program staff, including: applications to hand out to customers, posters, product clings, lists of qualified products, and end caps. One lighting retailer even noted receiving a scanning bar, which allowed incentive processing at check-out rather than requiring a customer to send in an incentive form. This retailer predicted the “new scanning bar will result in [a] huge jump [in] sales” and noted this suggestion had been put forth by the retailer itself, and then implemented by HES program staff. Despite lighting retailers’ reported use of point-of-purchase materials to garner program participation, only 14 percent of lighting customers knew Pacific Power discounted CFLs through the HES Program.
Surveys found participants rarely accessed HES Program information online: only 12 percent of appliance and HVAC participants and 6 percent of lighting customers had visited the HES Website.
Trade Ally and Market Partner Promotion According to program stakeholders, trade allies proved key to creating program awareness among customers. The program implementer worked directly with retailers and contractors to make sure they knew of the program and its incentives, providing them with promotional materials. Retailers and contractors, in turn, promoted the program to customers to increase sales of high-efficiency equipment and products.
Because California’s retail structure relied heavily on local retailers, implementer staff shifted their outreach focus from national retail chains to smaller, independent retailers. According to the implementer, retailer staff served as a key source of information for customers. The program implementer specifically pointed to independent retailers as the reason the HES program
49%
22%
7%
5%
3%
2%3%
9%Retailer
Bill Inserts
Print Media
Online
Word of mouth
Pacific Power Representative
Other
Don't Know
n= 172
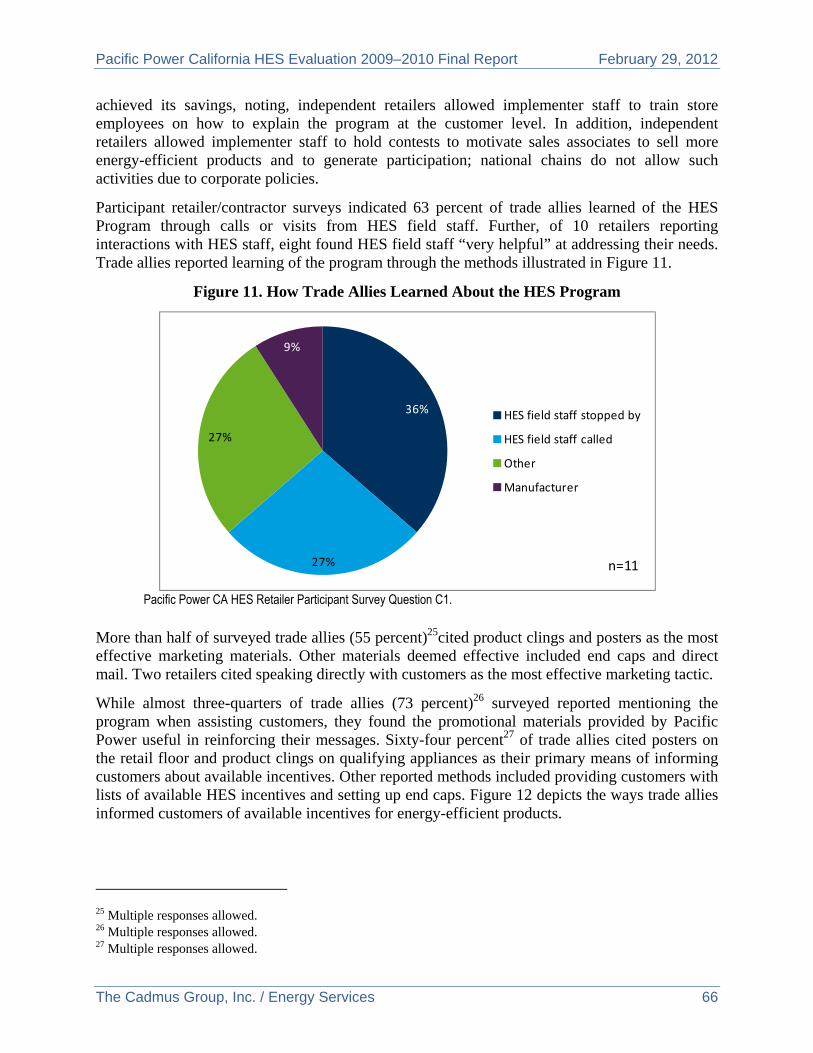
Pacific Power California HES Evaluation 2009–2010 Final Report February 29, 2012
The Cadmus Group, Inc. / Energy Services 66
achieved its savings, noting, independent retailers allowed implementer staff to train store employees on how to explain the program at the customer level. In addition, independent retailers allowed implementer staff to hold contests to motivate sales associates to sell more energy-efficient products and to generate participation; national chains do not allow such activities due to corporate policies.
Participant retailer/contractor surveys indicated 63 percent of trade allies learned of the HES Program through calls or visits from HES field staff. Further, of 10 retailers reporting interactions with HES staff, eight found HES field staff “very helpful” at addressing their needs. Trade allies reported learning of the program through the methods illustrated in Figure 11.
Figure 11. How Trade Allies Learned About the HES Program
Pacific Power CA HES Retailer Participant Survey Question C1.
More than half of surveyed trade allies (55 percent)25cited product clings and posters as the most effective marketing materials. Other materials deemed effective included end caps and direct mail. Two retailers cited speaking directly with customers as the most effective marketing tactic.
While almost three-quarters of trade allies (73 percent)26 surveyed reported mentioning the program when assisting customers, they found the promotional materials provided by Pacific Power useful in reinforcing their messages. Sixty-four percent27 of trade allies cited posters on the retail floor and product clings on qualifying appliances as their primary means of informing customers about available incentives. Other reported methods included providing customers with lists of available HES incentives and setting up end caps. Figure 12 depicts the ways trade allies informed customers of available incentives for energy-efficient products.
25 Multiple responses allowed. 26 Multiple responses allowed. 27 Multiple responses allowed.
36%
27%
27%
9%
HES field staff stopped by
HES field staff called
Other
Manufacturer
n=11
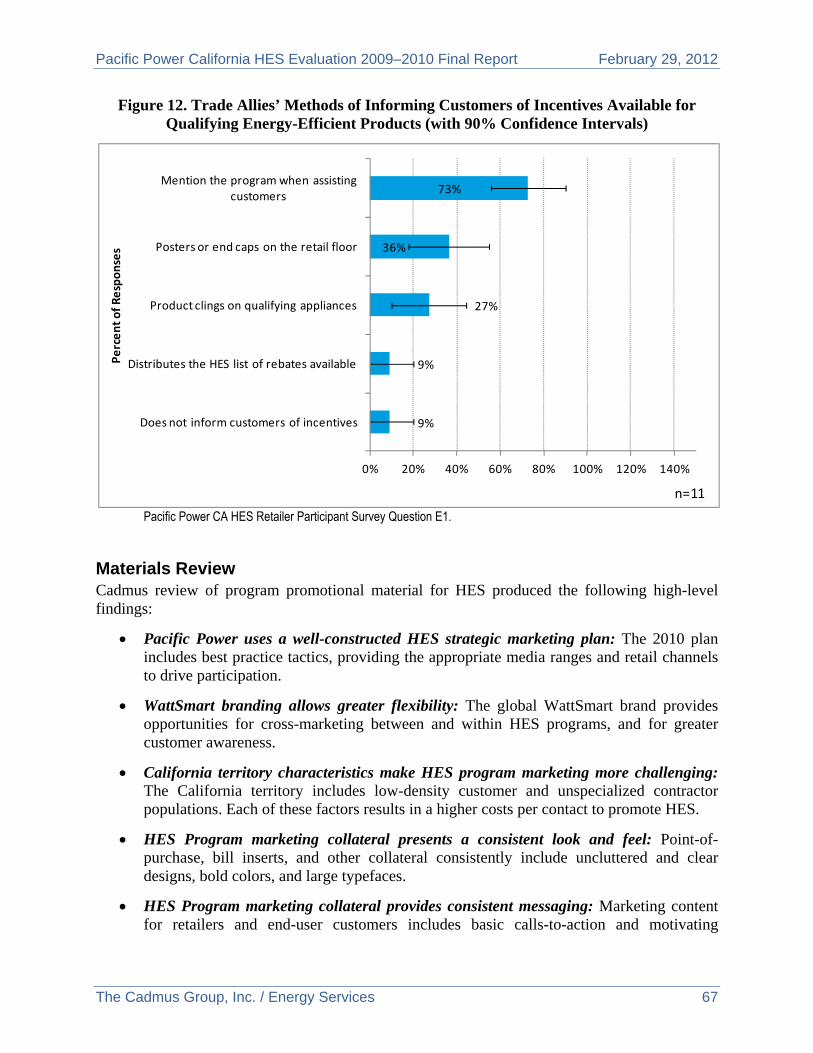
Pacific Power California HES Evaluation 2009–2010 Final Report February 29, 2012
The Cadmus Group, Inc. / Energy Services 67
Figure 12. Trade Allies’ Methods of Informing Customers of Incentives Available for Qualifying Energy-Efficient Products (with 90% Confidence Intervals)
Pacific Power CA HES Retailer Participant Survey Question E1.
Materials Review Cadmus review of program promotional material for HES produced the following high-level findings:
Pacific Power uses a well-constructed HES strategic marketing plan: The 2010 plan includes best practice tactics, providing the appropriate media ranges and retail channels to drive participation.
WattSmart branding allows greater flexibility: The global WattSmart brand provides opportunities for cross-marketing between and within HES programs, and for greater customer awareness.
California territory characteristics make HES program marketing more challenging: The California territory includes low-density customer and unspecialized contractor populations. Each of these factors results in a higher costs per contact to promote HES.
HES Program marketing collateral presents a consistent look and feel: Point-of-purchase, bill inserts, and other collateral consistently include uncluttered and clear designs, bold colors, and large typefaces.
HES Program marketing collateral provides consistent messaging: Marketing content for retailers and end-user customers includes basic calls-to-action and motivating
9%
9%
27%
36%
73%
0% 20% 40% 60% 80% 100% 120% 140%
Does not inform customers of incentives
Distributes the HES list of rebates available
Product clings on qualifying appliances
Posters or end caps on the retail floor
Mention the program when assisting customers
Percent of Responses
n=11
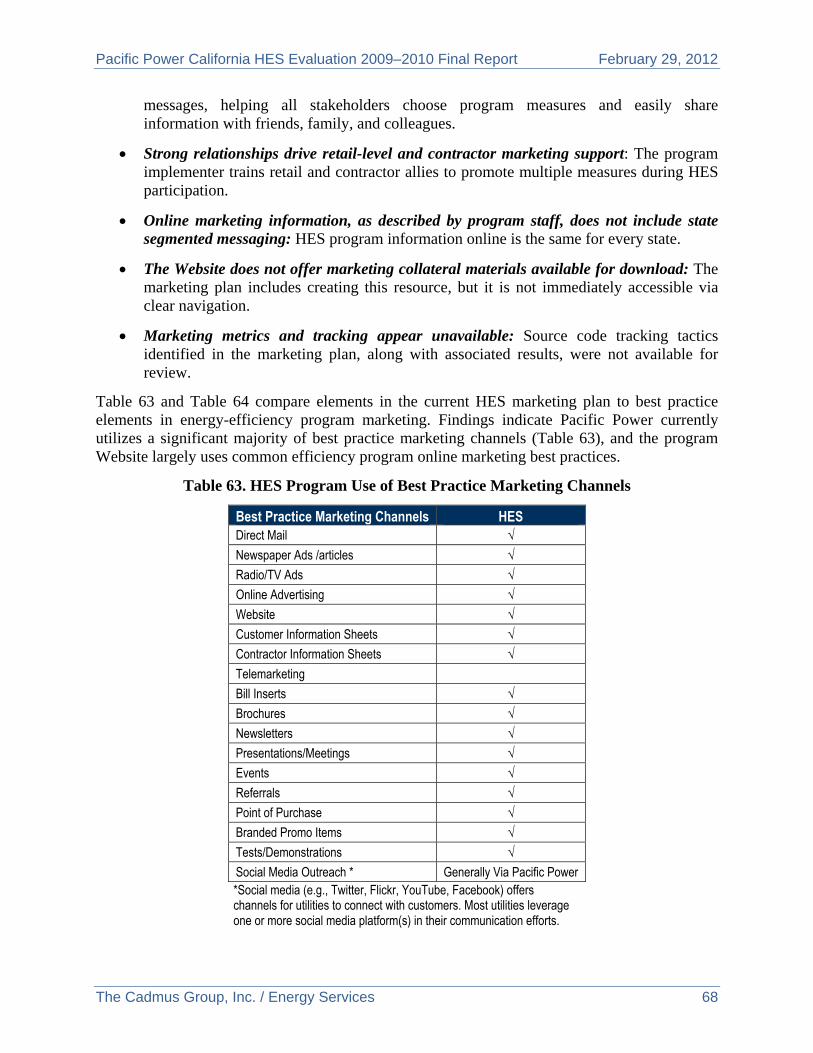
Pacific Power California HES Evaluation 2009–2010 Final Report February 29, 2012
The Cadmus Group, Inc. / Energy Services 68
messages, helping all stakeholders choose program measures and easily share information with friends, family, and colleagues.
Strong relationships drive retail-level and contractor marketing support: The program implementer trains retail and contractor allies to promote multiple measures during HES participation.
Online marketing information, as described by program staff, does not include state segmented messaging: HES program information online is the same for every state.
The Website does not offer marketing collateral materials available for download: The marketing plan includes creating this resource, but it is not immediately accessible via clear navigation.
Marketing metrics and tracking appear unavailable: Source code tracking tactics identified in the marketing plan, along with associated results, were not available for review.
Table 63 and Table 64 compare elements in the current HES marketing plan to best practice elements in energy-efficiency program marketing. Findings indicate Pacific Power currently utilizes a significant majority of best practice marketing channels (Table 63), and the program Website largely uses common efficiency program online marketing best practices.
Table 63. HES Program Use of Best Practice Marketing Channels
Best Practice Marketing Channels HES Direct Mail √
Newspaper Ads /articles √
Radio/TV Ads √
Online Advertising √
Website √
Customer Information Sheets √
Contractor Information Sheets √
Telemarketing Bill Inserts √
Brochures √
Newsletters √
Presentations/Meetings √
Events √
Referrals √
Point of Purchase √
Branded Promo Items √
Tests/Demonstrations √
Social Media Outreach * Generally Via Pacific Power *Social media (e.g., Twitter, Flickr, YouTube, Facebook) offers channels for utilities to connect with customers. Most utilities leverage one or more social media platform(s) in their communication efforts.
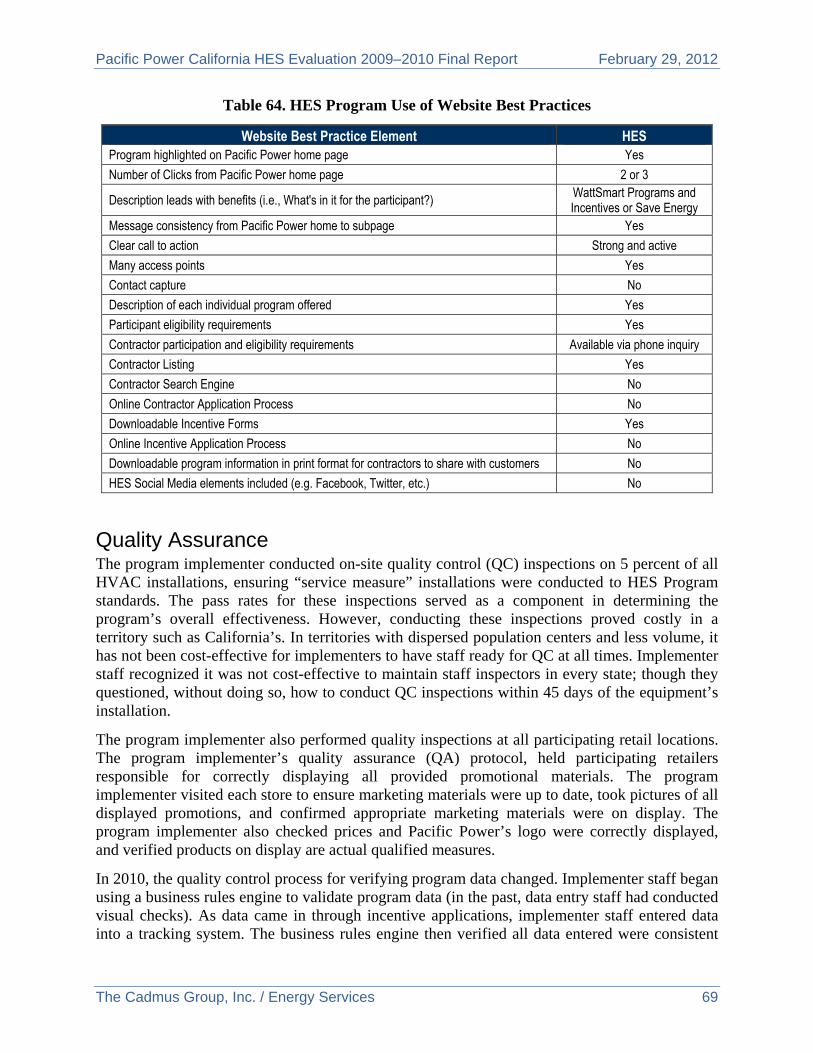
Pacific Power California HES Evaluation 2009–2010 Final Report February 29, 2012
The Cadmus Group, Inc. / Energy Services 69
Table 64. HES Program Use of Website Best Practices
Website Best Practice Element HES Program highlighted on Pacific Power home page Yes
Number of Clicks from Pacific Power home page 2 or 3
Description leads with benefits (i.e., What's in it for the participant?) WattSmart Programs and Incentives or Save Energy
Message consistency from Pacific Power home to subpage Yes
Clear call to action Strong and active
Many access points Yes
Contact capture No
Description of each individual program offered Yes
Participant eligibility requirements Yes
Contractor participation and eligibility requirements Available via phone inquiry
Contractor Listing Yes
Contractor Search Engine No
Online Contractor Application Process No
Downloadable Incentive Forms Yes
Online Incentive Application Process No
Downloadable program information in print format for contractors to share with customers No
HES Social Media elements included (e.g. Facebook, Twitter, etc.) No
Quality Assurance The program implementer conducted on-site quality control (QC) inspections on 5 percent of all HVAC installations, ensuring “service measure” installations were conducted to HES Program standards. The pass rates for these inspections served as a component in determining the program’s overall effectiveness. However, conducting these inspections proved costly in a territory such as California’s. In territories with dispersed population centers and less volume, it has not been cost-effective for implementers to have staff ready for QC at all times. Implementer staff recognized it was not cost-effective to maintain staff inspectors in every state; though they questioned, without doing so, how to conduct QC inspections within 45 days of the equipment’s installation.
The program implementer also performed quality inspections at all participating retail locations. The program implementer’s quality assurance (QA) protocol, held participating retailers responsible for correctly displaying all provided promotional materials. The program implementer visited each store to ensure marketing materials were up to date, took pictures of all displayed promotions, and confirmed appropriate marketing materials were on display. The program implementer also checked prices and Pacific Power’s logo were correctly displayed, and verified products on display are actual qualified measures.
In 2010, the quality control process for verifying program data changed. Implementer staff began using a business rules engine to validate program data (in the past, data entry staff had conducted visual checks). As data came in through incentive applications, implementer staff entered data into a tracking system. The business rules engine then verified all data entered were consistent
Pacific Power California HES Evaluation 2009–2010 Final Report February 29, 2012
The Cadmus Group, Inc. / Energy Services 70
those eligible for incentives. If data fell outside tariff parameters, the application was rejected. Most commonly, data were rejected if information was missing or the application data did not meet incentive qualifications.
Implementer staff estimated 20 percent of the business engines’ rejections resulted from missing information. Implementer staff tried to resolve these rejections by redesigning the incentive applications. If information was missing, the implementer sent the customer a letter, explaining the missing material. If there no response arrived within two weeks, another letter was sent. If there no response followed the second letter, a third and final attempt for resolution was to send the application back to the customer with an explanation of information missing. Implementer staff approximated 70 percent of missing information issues were resolved after the first letter, and 95 percent were resolved after the second letter. An additional 3 percent of missing information issues were resolved after the third attempt for resolution from implementer staff.
If measure data specified on an application did not qualify for an incentive, implementer staff sent a letter to the customer, explaining specific reasons their applications were not approved for an incentive, and offered solutions regarding how the customer could quickly resolve the issue.
Pacific Power’s call center handled customer complaints, with call center agents attempting to resolve issues on the first call. If customers had more serious complaints, the call agent contacted program managers at Pacific Power or the program implementer. The agent directed all customer complaint correspondence to Pacific Power’s regulatory group for recording. The program implementer program staff personally called customers to resolve their issues. Customer complaints regarding participating trade allies were taken very seriously. If several customers complained about a trade ally, the program implementer informed Pacific Power, which usually removed the retailer or contractor as a promotional partner. In extreme cases, Pacific Power may take legal action against the trade ally in question.
A customer may also complain to the public utilities commission. In such cases, Pacific Power took a more formal approach. The program implementer provided all customer correspondence data to Pacific Power’s regulatory group. Correspondence data included any e-mails, phone conversations, meeting dates, and meeting summaries involving any party in the complaint. Pacific Power’s regulatory group then coordinated the customer complaint with the commission until the issue could be fully resolved.
Customer Response
Satisfaction Appliance and HVAC participants expressed strong satisfaction with incentive timing and amounts (as drawn from participant telephone surveys). Thirty-nine percent of appliance and HVAC participants received incentive payments within four to six weeks of submitting their incentive applications, and an additional 22 percent received payments in less than four weeks. At the same time, almost one-quarter (23 percent) of appliance and HVAC participants said they did not know how long it took to get their incentive checks. Among the group that could estimate the period, almost all (95 percent) reported satisfaction with time required to get their incentive checks in the mail. Overall, 94 percent expressed some level of satisfaction with the incentive amounts, with 61 percent “very” satisfied and 33 percent “somewhat” satisfied.
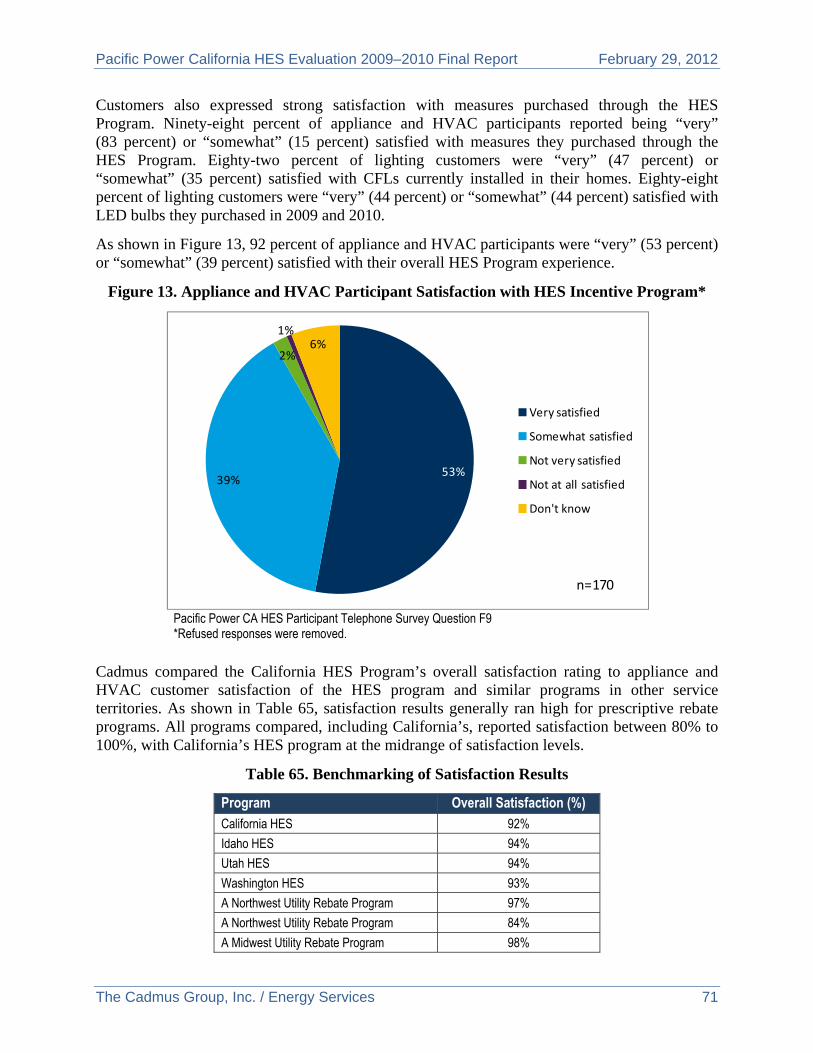
Pacific Power California HES Evaluation 2009–2010 Final Report February 29, 2012
The Cadmus Group, Inc. / Energy Services 71
Customers also expressed strong satisfaction with measures purchased through the HES Program. Ninety-eight percent of appliance and HVAC participants reported being “very” (83 percent) or “somewhat” (15 percent) satisfied with measures they purchased through the HES Program. Eighty-two percent of lighting customers were “very” (47 percent) or “somewhat” (35 percent) satisfied with CFLs currently installed in their homes. Eighty-eight percent of lighting customers were “very” (44 percent) or “somewhat” (44 percent) satisfied with LED bulbs they purchased in 2009 and 2010.
As shown in Figure 13, 92 percent of appliance and HVAC participants were “very” (53 percent) or “somewhat” (39 percent) satisfied with their overall HES Program experience.
Figure 13. Appliance and HVAC Participant Satisfaction with HES Incentive Program*
Pacific Power CA HES Participant Telephone Survey Question F9 *Refused responses were removed.
Cadmus compared the California HES Program’s overall satisfaction rating to appliance and HVAC customer satisfaction of the HES program and similar programs in other service territories. As shown in Table 65, satisfaction results generally ran high for prescriptive rebate programs. All programs compared, including California’s, reported satisfaction between 80% to 100%, with California’s HES program at the midrange of satisfaction levels.
Table 65. Benchmarking of Satisfaction Results
Program Overall Satisfaction (%) California HES 92%
Idaho HES 94%
Utah HES 94%
Washington HES 93%
A Northwest Utility Rebate Program 97%
A Northwest Utility Rebate Program 84%
A Midwest Utility Rebate Program 98%
53%39%
2%
1%6%
Very satisfied
Somewhat satisfied
Not very satisfied
Not at all satisfied
Don't know
n=170
Pacific Power California HES Evaluation 2009–2010 Final Report February 29, 2012
The Cadmus Group, Inc. / Energy Services 72
Barriers
Perceptions Regarding Energy Efficiency During management staff and partner interviews, HES program staff felt a poor economy, coupled with a lack of general knowledge regarding energy efficiency in Pacific Power’s California territory, presented participation barriers for the program. While implementer staff cited California’s general sense of energy efficiency as better than in other territories, a lack of knowledge continued in the market.
Surveyed trade allies’ opinions split regarding whether energy efficiency offered a useful tactic to promote their businesses; just over half of trade allies (55 percent) reported they used the availability of high-efficiency products to attract customers to their business.
Fifty-six percent of retailers who sold energy-efficient products beyond just lighting reported they believed customers were least aware of energy-efficient appliances, such as dishwashers, refrigerators, freezers, and washing machines. Two of these retailers suggested implementing increased advertising to promote these technologies, and another specifically said it might help to inform customers how much more energy old appliances used compared to energy-efficient ones.
While 91 percent of trade allies believed customers understood the energy-related benefits of higher-efficiency products, and 73 percent noted energy savings tend to be selling points for high-efficiency products, 18 percent of retailers believed customers chose not to participate in the HES Program as they disliked energy-efficient products. Retailers specifically noted consumer aversion to CFLs, either due to negative perceptions of their lighting quality or concerns about mercury content.
Appliance and HVAC participants reported being motivated by other factors than energy efficiency. While 26 percent28 of appliance and HVAC participants overall were motivated to purchase high-efficiency equipment to save energy, 35 percent29 simply needed new equipment. Figure 14 illustrates the full distribution of customers’ purchasing motivations.
28 Multiple responses allowed. 29 Multiple responses allowed.
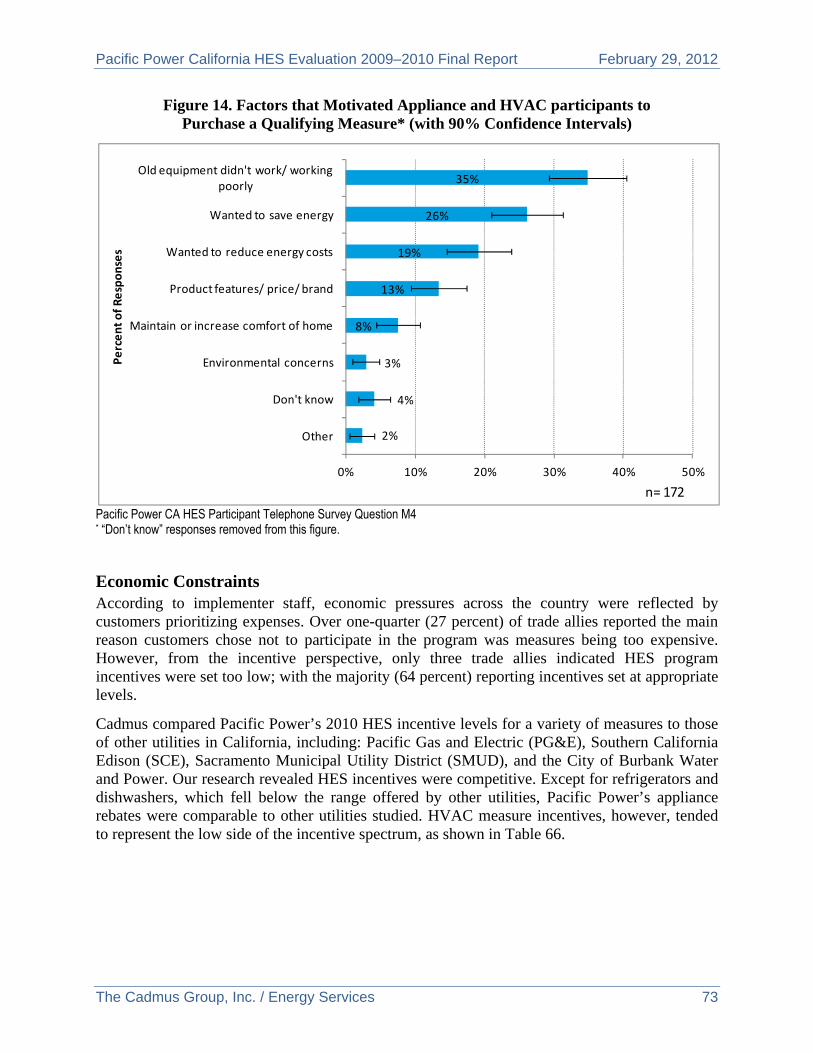
Pacific Power California HES Evaluation 2009–2010 Final Report February 29, 2012
The Cadmus Group, Inc. / Energy Services 73
Figure 14. Factors that Motivated Appliance and HVAC participants to Purchase a Qualifying Measure* (with 90% Confidence Intervals)
Pacific Power CA HES Participant Telephone Survey Question M4 * “Don’t know” responses removed from this figure.
Economic Constraints According to implementer staff, economic pressures across the country were reflected by customers prioritizing expenses. Over one-quarter (27 percent) of trade allies reported the main reason customers chose not to participate in the program was measures being too expensive. However, from the incentive perspective, only three trade allies indicated HES program incentives were set too low; with the majority (64 percent) reporting incentives set at appropriate levels.
Cadmus compared Pacific Power’s 2010 HES incentive levels for a variety of measures to those of other utilities in California, including: Pacific Gas and Electric (PG&E), Southern California Edison (SCE), Sacramento Municipal Utility District (SMUD), and the City of Burbank Water and Power. Our research revealed HES incentives were competitive. Except for refrigerators and dishwashers, which fell below the range offered by other utilities, Pacific Power’s appliance rebates were comparable to other utilities studied. HVAC measure incentives, however, tended to represent the low side of the incentive spectrum, as shown in Table 66.
2%
4%
3%
8%
13%
19%
26%
35%
0% 10% 20% 30% 40% 50%
Other
Don't know
Environmental concerns
Maintain or increase comfort of home
Product features/ price/ brand
Wanted to reduce energy costs
Wanted to save energy
Old equipment didn't work/ working poorly
Percent of Responses
n= 172
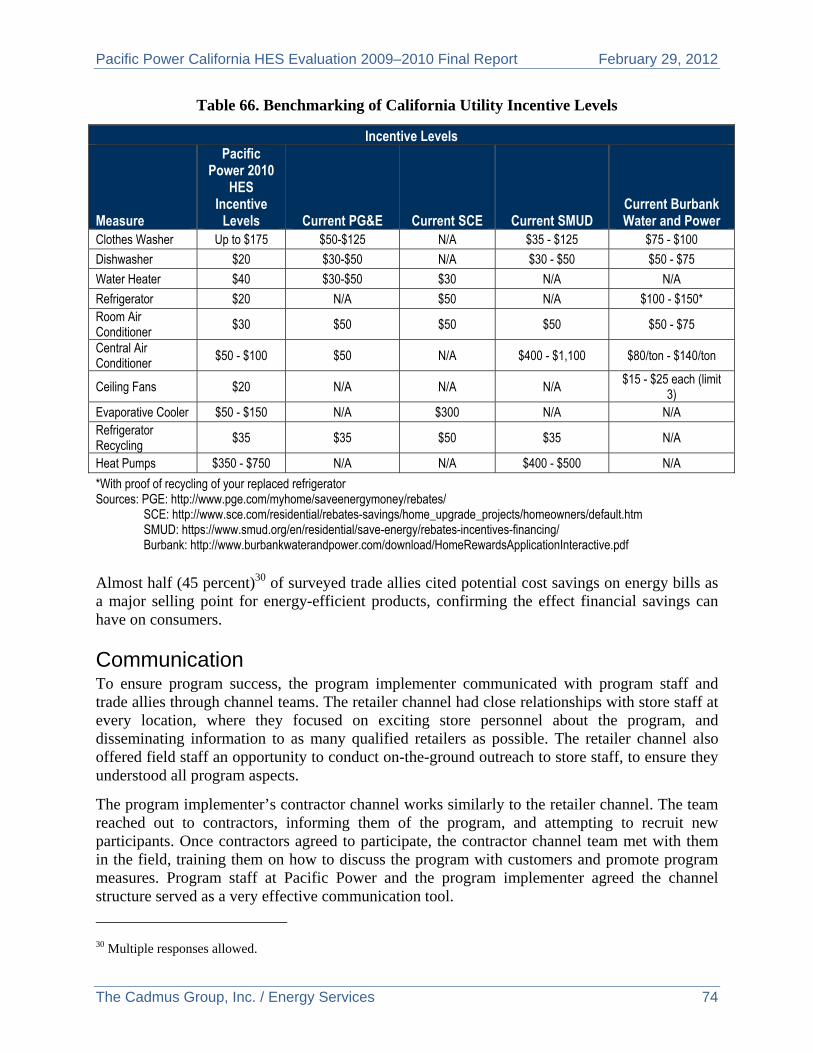
Pacific Power California HES Evaluation 2009–2010 Final Report February 29, 2012
The Cadmus Group, Inc. / Energy Services 74
Table 66. Benchmarking of California Utility Incentive Levels
Incentive Levels
Measure
Pacific Power 2010
HES Incentive
Levels Current PG&E Current SCE Current SMUD Current Burbank Water and Power
Clothes Washer Up to $175 $50-$125 N/A $35 - $125 $75 - $100
Dishwasher $20 $30-$50 N/A $30 - $50 $50 - $75
Water Heater $40 $30-$50 $30 N/A N/A
Refrigerator $20 N/A $50 N/A $100 - $150* Room Air Conditioner
$30 $50 $50 $50 $50 - $75
Central Air Conditioner
$50 - $100 $50 N/A $400 - $1,100 $80/ton - $140/ton
Ceiling Fans $20 N/A N/A N/A $15 - $25 each (limit
3) Evaporative Cooler $50 - $150 N/A $300 N/A N/A Refrigerator Recycling
$35 $35 $50 $35 N/A
Heat Pumps $350 - $750 N/A N/A $400 - $500 N/A
*With proof of recycling of your replaced refrigerator Sources: PGE: http://www.pge.com/myhome/saveenergymoney/rebates/
SCE: http://www.sce.com/residential/rebates-savings/home_upgrade_projects/homeowners/default.htm SMUD: https://www.smud.org/en/residential/save-energy/rebates-incentives-financing/ Burbank: http://www.burbankwaterandpower.com/download/HomeRewardsApplicationInteractive.pdf
Almost half (45 percent)30 of surveyed trade allies cited potential cost savings on energy bills as a major selling point for energy-efficient products, confirming the effect financial savings can have on consumers.
Communication To ensure program success, the program implementer communicated with program staff and trade allies through channel teams. The retailer channel had close relationships with store staff at every location, where they focused on exciting store personnel about the program, and disseminating information to as many qualified retailers as possible. The retailer channel also offered field staff an opportunity to conduct on-the-ground outreach to store staff, to ensure they understood all program aspects.
The program implementer’s contractor channel works similarly to the retailer channel. The team reached out to contractors, informing them of the program, and attempting to recruit new participants. Once contractors agreed to participate, the contractor channel team met with them in the field, training them on how to discuss the program with customers and promote program measures. Program staff at Pacific Power and the program implementer agreed the channel structure served as a very effective communication tool.
30 Multiple responses allowed.
Pacific Power California HES Evaluation 2009–2010 Final Report February 29, 2012
The Cadmus Group, Inc. / Energy Services 75
Summary and Recommendations In 2010, Pacific Power implemented several changes to program operations, delivery structures, and marketing approaches, leading to significant improvements in participation and savings: specifically, a 30 percent increase in participation volume, and a 55 percent increase in reported savings results from 2009 to 2010.31 Conclusions and recommendations have been drawn from process evaluation interviews, surveys, and other analysis. While Cadmus’ process evaluation found several aspects of HES Program operations and delivery have improved, the program may benefit from additional changes through providing additional value to customers, preparing for upcoming changes in the lighting market, and continuing to increase participation and savings results as the HES Program matures.
Some of the following conclusions include recommendations, while others indicate the current approach appears to be working well.
Program Design and Implementation The program implementer’s management of retailer and contractor delivery channels
provides the structure for communication and program success among program implementers and trade allies. The program implementer’s revised delivery structure has reduced many initial HES Program’s implementation barriers by streamlining program staff responsibilities, building relationships with retailers and contractors, and increasing the total number of trade allies promoting the program to end-use customers.
The implementation of a flexible tariff approach proved to be a positive change for the California HES Program. Allowing for “floating specifications” in the tariff will ensure program requirements evolve in concert with ENERGY STAR specifications. The proactive approach will also alleviate administrative burdens of filing tariff changes.
More California-based outreach staff in the field increased the frequency of one-on-one meetings with participating and potential trade allies. While this strategy proved helpful in terms of increasing retailer and contractor participation, especially in California’s diverse market, other implementation barriers have yet to be addressed.
Lighting Very few lighting customers and retailers know of the upcoming EISA legislation. This
most likely resulted from the Huffman Bill’s mandated standards, which phase out incandescent bulbs in California a year before EISA.
EISA legislation and ingrained customer preferences could have wide-ranging impacts on utility lighting programs. Lighting participant surveys indicated customers tend to purchase CFLs over other energy-efficient lighting options (despite survey findings indicating many customers have concerns about CFL quality and other issues). When presented with choices to purchase a more efficient incandescent bulb, CFL, LED, or halogen bulb, more than one-third of lighting customers chose CFLs. Given more than a decade’s history of successful utility market transformation activities, customers’ CFL
31 According to a comparison of Pacific Power’s 2009 Annual Review of DSM Programs and 2010 Annual Review
of Energy Efficiency Programs.
Pacific Power California HES Evaluation 2009–2010 Final Report February 29, 2012
The Cadmus Group, Inc. / Energy Services 76
preference likely results from familiarity with CFLs as energy-efficient, inexpensive options. Additionally, as reported in the impact evaluation’s WTP section, CFL demand relates inversely to price, indicating participants tend to purchase products at lower prices. This same theory likely applies to other lighting options.
Due to EISA’s phase out of incandescent bulbs, however, the DSM market’s lighting savings baseline will likely increase; resulting in attributing approximately 75 percent lower savings per CFL to utility lighting programs. Program stakeholders report Pacific Power’s plans to offer a robust variety of EISA-compliant bulbs through its lighting portfolio. Given customers’ preference for CFLs over other the market’s energy-efficiency lighting options, Pacific Power may still face challenges in meeting its lighting savings targets, due to the adjusted baseline.
o Recommendation: Given changes in the evolving lighting industry, explore which higher-efficiency lighting options (e.g., LEDs) will provide the most savings per unit. Align marketing messages with the preferred lighting option, and heighten awareness using market transformation tactics.
o Recommendation: The evolving lighting market can act as a platform to clarify marketing messages about lighting options and bulbs best for each customer’s intended use. Continue to create marketing collateral comparing various lighting options’ prices with expected lifetime savings associated with those options to demonstrate higher efficiency options’ long-term value. Potential long-term savings attributed to qualifying measures have provided the primary purchasing motivators for appliance and HVAC participants. These same marketing tactics should continue to be implemented in the lighting market, given the elimination of traditional, inexpensive options. Messaging should also highlight comparisons of lighting quality and other factors consumers emphasized in the satisfaction surveys.
Lighting customers do not know of proper CFL disposal methods. The majority of surveyed CFL owners disposing of a CFL in the past 12 months threw the bulb in the trash.
o Recommendation: Continue with plans to provide recycling centers at all participating retail locations; so customers can simply bring in spent bulbs when purchasing replacements. Recycling centers could convey a positive public image, enhancing Pacific Power’s reputation in the community and adding public relations value to the program, particularly among interveners. Pacific Power should raise awareness of the recycling centers’ availability through bill inserts, training for retail staff, and other outreach tactics.
The EISA standard will impact Rocky Mountain Power savings analysis of CFLs.
o Recommendation: Baseline wattage assumptions will need to be updated to account for the new EISA standards. The EISA standard established an equivalent baseline by rated lamp lumens. If the actual baseline wattage replaced is not known (i.e. no surveys were conducted), the recommended approach uses the
Pacific Power California HES Evaluation 2009–2010 Final Report February 29, 2012
The Cadmus Group, Inc. / Energy Services 77
CFL rated lumens and equivalent lumens in EISA to determine baseline wattage. This approach can be use for program evaluations in 2012 and beyond.
Rocky Mountain Power impact analysis of CFLs does not include a waste heat factor (WHF) in the planning estimates.
o Recommendation: The WHF is an adjustment representing the interactive effects of lighting measures on heating and cooling equipment operation. Cadmus did not apply the WHF adjustment to lighting savings estimates as Rocky Mountain Power did not include it in their initial planning estimates. However, Cadmus recommends using the approach outlined in Appendix L and including this adjustment for future planning estimates and evaluations.
Marketing and Participation Decisions Program staff report service territory-focused marketing messages benefit program
participation. The program implementer believes the shift from “one-size-fits-all” marketing messages to those targeting particular states may contribute to increased multi-purchase HES participation.
Trade allies (both retailers and contractors) provide a valuable channel for increasing program awareness. Maintaining trade ally satisfaction remains important to further motivating contractors to promote the program as a trusted partner.
o Recommendation: As the lighting savings baseline changes, HES Program non-lighting savings may take on increased significance. Although the retailer and contractor market in California may be more difficult to penetrate than in other service territories, continue to recruit new trade allies to broaden program awareness throughout the service territory. HES Program has an effective trade ally; an increased trade ally network could lead to heightened incentive awareness, and increased program participation.
o Recommendation: To ensure trade allies find participation easy and continue to promote the HES program, carry on with plans to include online application access for trade allies.
o Recommendation: Continue with plans to provide trade ally-focused marketing collateral for download within program Web pages’ trade ally section. If necessary, these materials can be offered through a password-protected area, and personalization options can be offered for trade ally promotion.
Customers do not connect upstream lighting products they purchase with Pacific Power’s HES Program incentives. Although most HES Program savings accrue through the lighting component, very few lighting customers know Pacific Power’s HES Program provides CFL discounts.
o Recommendation: Ensure lighting retailers are trained to inform customers that Pacific Power discounts incented lighting products.
Pacific Power California HES Evaluation 2009–2010 Final Report February 29, 2012
The Cadmus Group, Inc. / Energy Services 78
Pacific Power has created compelling, broad-reaching marketing materials. Cadmus understands marketing represents a key lever for controlling program participation. The utility’s marketing materials, use of marketing channels, and online presence largely remain consistent with utility program best practices. The below recommendations offer additional marketing opportunities.
o Recommendation: Continue to leverage meetings with contractors and promote increased participation as the primary method of engaging with program trade allies. Invitations to road shows and/or event sponsorships can also offer effective marketing opportunities, Events targeted to trade allies can be particularly effective.
o Recommendation: Continue to leverage on- and offline social networks to capitalize on customer satisfaction. Enhance the HES Program’s social network distribution by providing online and in-person networking opportunities. These groups (such as stakeholder trade associations, community networks, Chambers of Commerce, LinkedIn groups, and e-mail networks) provide low-cost, high-volume information distribution vehicles. Continue to consider implementing innovative tactics, such as Living Social or Groupon coupon-focused lead generation vehicles.
o Recommendation: Broaden promotion of the program’s URL. Only 5 percent of appliance and HVAC participants and no trade allies cited the Website as a referral source. Online marketing can be one of the most cost-effective tools to generate interest and leads in remote geographic areas. Pacific Power should emphasize its Website in marketing materials as a key tool for obtaining detailed program information. However, marketing channels should continue to focus on the approaches reported most effective with customers: bill inserts and in-store displays.
Website content does not reflect market segmentation described by program staff. Program descriptions, currently identical, have not been tailored for each state.
o Recommendation: Mirror segment-driven messages found within collateral and promotional events on the Website.
o Recommendation: Use money-saving messages to motivate lower-income California residents.
Quality Assurance QC inspections prove costly in California due to the dispersed customer community
and low overall participation volumes. While California’s HES participation volume does not merit budgeting for full-time, locally-based QC staff, travel between installation sites proves budget constricting for the program implementer required to conduct QC inspections within 45 days of a service measure installation.
o Recommendation: Outsource the QC process to a locally-based QC firm. Subcontracting with a locally-based firm with viable outside work would decrease travel costs and eliminate concerns regarding a full-time staff member experiencing idle time between installation inspections.
Pacific Power California HES Evaluation 2009–2010 Final Report February 29, 2012
The Cadmus Group, Inc. / Energy Services 79
Satisfaction and Perceived Barriers Program satisfaction generally runs high. In benchmarking program satisfaction against
results from other states and other utilities’ programs, Cadmus found customer satisfaction consistent with good performance. Pacific Power and its trusted program partners (including the program implementer and participating retailers and contractors) facilitate program clarity at the customer level, promotion of high-quality products, and short turnaround times for incentive checks.
The need for new equipment most often motivates appliance and HVAC participants to purchase qualified measures. Many appliance and HVAC participants reported participating in the HES Program as their existing equipment ceased working or functioned poorly.
o Recommendation: Continue to utilize marketing messages targeting the equipment replacement market. Trade allies should be trained to capture this market’s interest by promoting the HES Program when contacted to install new equipment in emergency replacement situations.
Economic constraints may serve as significant barriers to meeting savings and participation goals. In benchmarking program incentives against those offered by other utilities’ programs throughout California, Cadmus found measure incentives comparable with other offerings; however, a limited income customer community, married with lower incentive offerings, may hinder program performance.
o Recommendation: Continue to review measure incentive levels. Customers with less disposable income may need higher financial motivators to purchase qualifying measures. Based on Cadmus’ benchmarking study, measures that could be considered for review include dishwashers, refrigerators, room air conditioners, central air conditioners, and evaporative coolers.
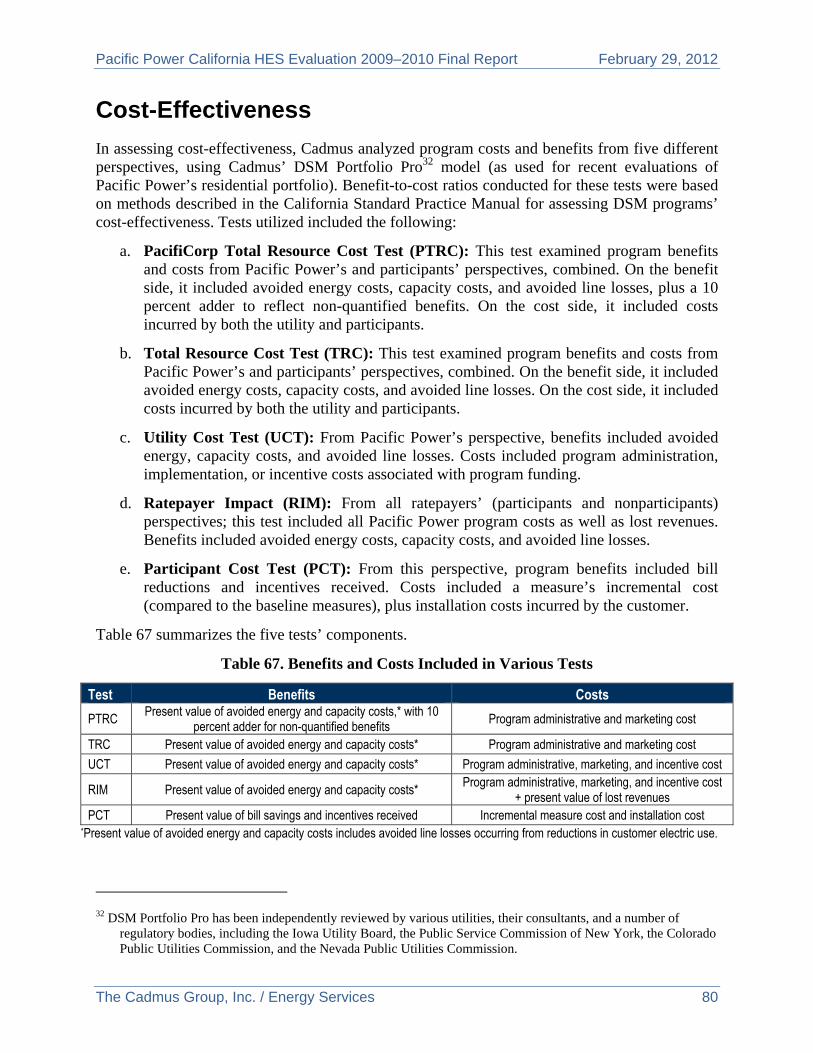
Pacific Power California HES Evaluation 2009–2010 Final Report February 29, 2012
The Cadmus Group, Inc. / Energy Services 80
Cost-Effectiveness
In assessing cost-effectiveness, Cadmus analyzed program costs and benefits from five different perspectives, using Cadmus’ DSM Portfolio Pro32 model (as used for recent evaluations of Pacific Power’s residential portfolio). Benefit-to-cost ratios conducted for these tests were based on methods described in the California Standard Practice Manual for assessing DSM programs’ cost-effectiveness. Tests utilized included the following:
a. PacifiCorp Total Resource Cost Test (PTRC): This test examined program benefits and costs from Pacific Power’s and participants’ perspectives, combined. On the benefit side, it included avoided energy costs, capacity costs, and avoided line losses, plus a 10 percent adder to reflect non-quantified benefits. On the cost side, it included costs incurred by both the utility and participants.
b. Total Resource Cost Test (TRC): This test examined program benefits and costs from Pacific Power’s and participants’ perspectives, combined. On the benefit side, it included avoided energy costs, capacity costs, and avoided line losses. On the cost side, it included costs incurred by both the utility and participants.
c. Utility Cost Test (UCT): From Pacific Power’s perspective, benefits included avoided energy, capacity costs, and avoided line losses. Costs included program administration, implementation, or incentive costs associated with program funding.
d. Ratepayer Impact (RIM): From all ratepayers’ (participants and nonparticipants) perspectives; this test included all Pacific Power program costs as well as lost revenues. Benefits included avoided energy costs, capacity costs, and avoided line losses.
e. Participant Cost Test (PCT): From this perspective, program benefits included bill reductions and incentives received. Costs included a measure’s incremental cost (compared to the baseline measures), plus installation costs incurred by the customer.
Table 67 summarizes the five tests’ components.
Table 67. Benefits and Costs Included in Various Tests
Test Benefits Costs
PTRC Present value of avoided energy and capacity costs,* with 10 percent adder for non-quantified benefits
Program administrative and marketing cost
TRC Present value of avoided energy and capacity costs* Program administrative and marketing cost
UCT Present value of avoided energy and capacity costs* Program administrative, marketing, and incentive cost
RIM Present value of avoided energy and capacity costs* Program administrative, marketing, and incentive cost
+ present value of lost revenues PCT Present value of bill savings and incentives received Incremental measure cost and installation cost
*Present value of avoided energy and capacity costs includes avoided line losses occurring from reductions in customer electric use.
32 DSM Portfolio Pro has been independently reviewed by various utilities, their consultants, and a number of
regulatory bodies, including the Iowa Utility Board, the Public Service Commission of New York, the Colorado Public Utilities Commission, and the Nevada Public Utilities Commission.
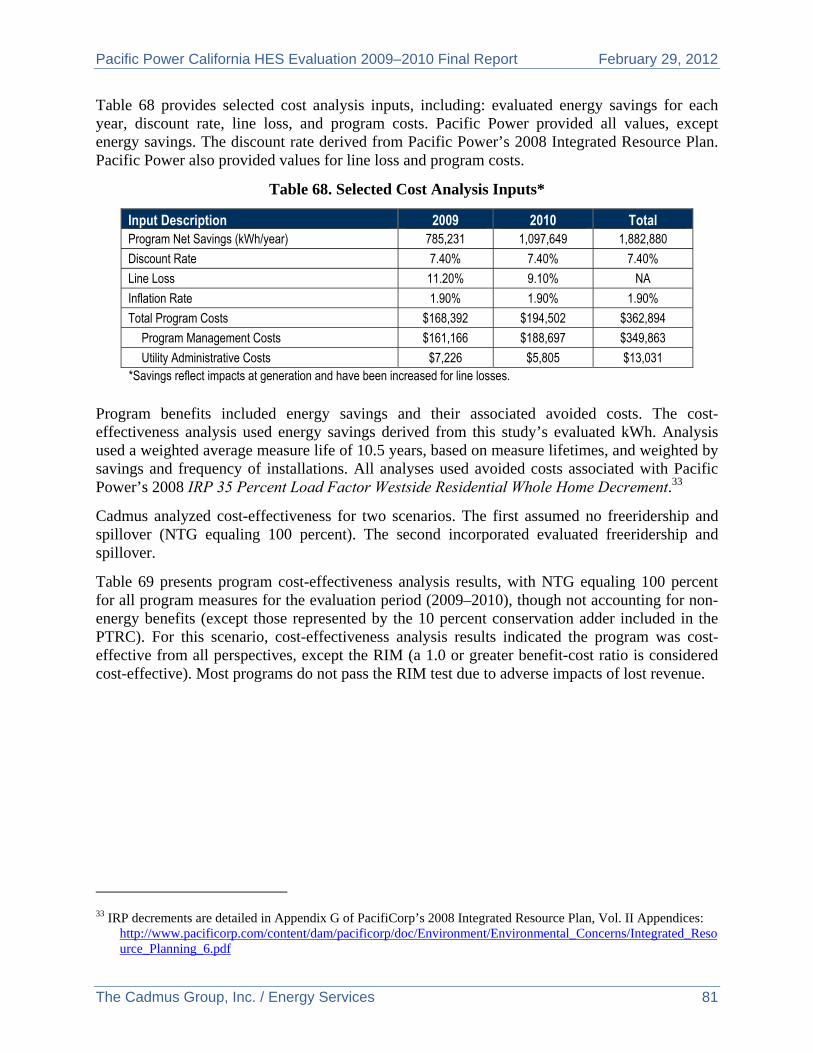
Pacific Power California HES Evaluation 2009–2010 Final Report February 29, 2012
The Cadmus Group, Inc. / Energy Services 81
Table 68 provides selected cost analysis inputs, including: evaluated energy savings for each year, discount rate, line loss, and program costs. Pacific Power provided all values, except energy savings. The discount rate derived from Pacific Power’s 2008 Integrated Resource Plan. Pacific Power also provided values for line loss and program costs.
Table 68. Selected Cost Analysis Inputs*
Input Description 2009 2010 Total Program Net Savings (kWh/year) 785,231 1,097,649 1,882,880
Discount Rate 7.40% 7.40% 7.40%
Line Loss 11.20% 9.10% NA
Inflation Rate 1.90% 1.90% 1.90%
Total Program Costs $168,392 $194,502 $362,894
Program Management Costs $161,166 $188,697 $349,863
Utility Administrative Costs $7,226 $5,805 $13,031 *Savings reflect impacts at generation and have been increased for line losses.
Program benefits included energy savings and their associated avoided costs. The cost-effectiveness analysis used energy savings derived from this study’s evaluated kWh. Analysis used a weighted average measure life of 10.5 years, based on measure lifetimes, and weighted by savings and frequency of installations. All analyses used avoided costs associated with Pacific Power’s 2008 IRP 35 Percent Load Factor Westside Residential Whole Home Decrement.33
Cadmus analyzed cost-effectiveness for two scenarios. The first assumed no freeridership and spillover (NTG equaling 100 percent). The second incorporated evaluated freeridership and spillover.
Table 69 presents program cost-effectiveness analysis results, with NTG equaling 100 percent for all program measures for the evaluation period (2009–2010), though not accounting for non-energy benefits (except those represented by the 10 percent conservation adder included in the PTRC). For this scenario, cost-effectiveness analysis results indicated the program was cost-effective from all perspectives, except the RIM (a 1.0 or greater benefit-cost ratio is considered cost-effective). Most programs do not pass the RIM test due to adverse impacts of lost revenue.
33 IRP decrements are detailed in Appendix G of PacifiCorp’s 2008 Integrated Resource Plan, Vol. II Appendices:
http://www.pacificorp.com/content/dam/pacificorp/doc/Environment/Environmental_Concerns/Integrated_Resource_Planning_6.pdf
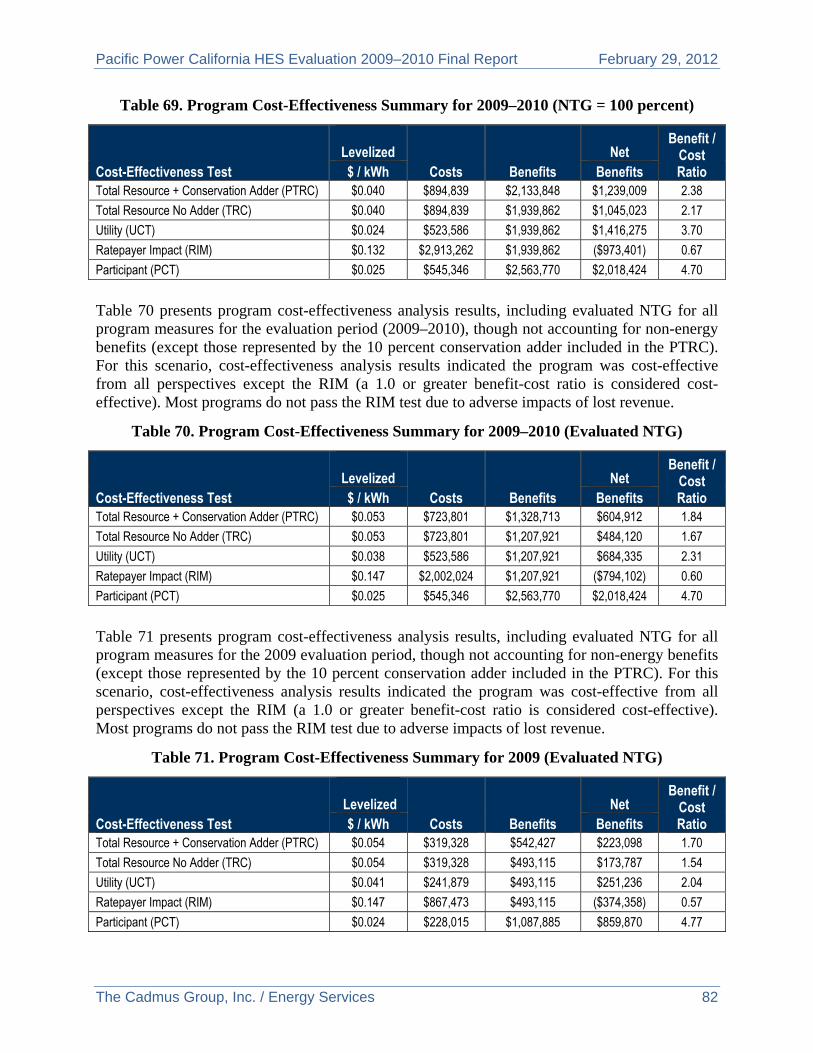
Pacific Power California HES Evaluation 2009–2010 Final Report February 29, 2012
The Cadmus Group, Inc. / Energy Services 82
Table 69. Program Cost-Effectiveness Summary for 2009–2010 (NTG = 100 percent)
Cost-Effectiveness Test
Levelized
Costs Benefits Net
Benefit / Cost Ratio $ / kWh Benefits
Total Resource + Conservation Adder (PTRC) $0.040 $894,839 $2,133,848 $1,239,009 2.38
Total Resource No Adder (TRC) $0.040 $894,839 $1,939,862 $1,045,023 2.17
Utility (UCT) $0.024 $523,586 $1,939,862 $1,416,275 3.70
Ratepayer Impact (RIM) $0.132 $2,913,262 $1,939,862 ($973,401) 0.67
Participant (PCT) $0.025 $545,346 $2,563,770 $2,018,424 4.70
Table 70 presents program cost-effectiveness analysis results, including evaluated NTG for all program measures for the evaluation period (2009–2010), though not accounting for non-energy benefits (except those represented by the 10 percent conservation adder included in the PTRC). For this scenario, cost-effectiveness analysis results indicated the program was cost-effective from all perspectives except the RIM (a 1.0 or greater benefit-cost ratio is considered cost-effective). Most programs do not pass the RIM test due to adverse impacts of lost revenue.
Table 70. Program Cost-Effectiveness Summary for 2009–2010 (Evaluated NTG)
Cost-Effectiveness Test
Levelized
Costs Benefits Net
Benefit / Cost Ratio $ / kWh Benefits
Total Resource + Conservation Adder (PTRC) $0.053 $723,801 $1,328,713 $604,912 1.84
Total Resource No Adder (TRC) $0.053 $723,801 $1,207,921 $484,120 1.67
Utility (UCT) $0.038 $523,586 $1,207,921 $684,335 2.31
Ratepayer Impact (RIM) $0.147 $2,002,024 $1,207,921 ($794,102) 0.60
Participant (PCT) $0.025 $545,346 $2,563,770 $2,018,424 4.70
Table 71 presents program cost-effectiveness analysis results, including evaluated NTG for all program measures for the 2009 evaluation period, though not accounting for non-energy benefits (except those represented by the 10 percent conservation adder included in the PTRC). For this scenario, cost-effectiveness analysis results indicated the program was cost-effective from all perspectives except the RIM (a 1.0 or greater benefit-cost ratio is considered cost-effective). Most programs do not pass the RIM test due to adverse impacts of lost revenue.
Table 71. Program Cost-Effectiveness Summary for 2009 (Evaluated NTG)
Cost-Effectiveness Test
Levelized
Costs Benefits Net
Benefit / Cost Ratio $ / kWh Benefits
Total Resource + Conservation Adder (PTRC) $0.054 $319,328 $542,427 $223,098 1.70
Total Resource No Adder (TRC) $0.054 $319,328 $493,115 $173,787 1.54
Utility (UCT) $0.041 $241,879 $493,115 $251,236 2.04
Ratepayer Impact (RIM) $0.147 $867,473 $493,115 ($374,358) 0.57
Participant (PCT) $0.024 $228,015 $1,087,885 $859,870 4.77
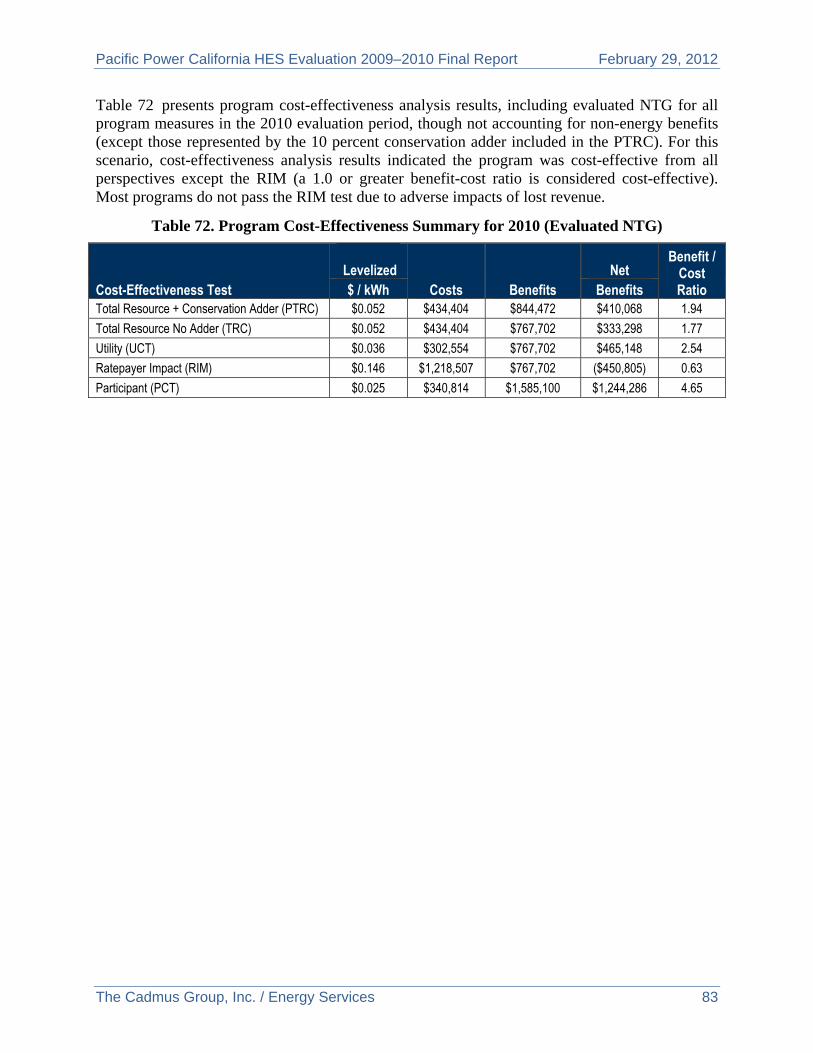
Pacific Power California HES Evaluation 2009–2010 Final Report February 29, 2012
The Cadmus Group, Inc. / Energy Services 83
Table 72 presents program cost-effectiveness analysis results, including evaluated NTG for all program measures in the 2010 evaluation period, though not accounting for non-energy benefits (except those represented by the 10 percent conservation adder included in the PTRC). For this scenario, cost-effectiveness analysis results indicated the program was cost-effective from all perspectives except the RIM (a 1.0 or greater benefit-cost ratio is considered cost-effective). Most programs do not pass the RIM test due to adverse impacts of lost revenue.
Table 72. Program Cost-Effectiveness Summary for 2010 (Evaluated NTG)
Cost-Effectiveness Test
Levelized
Costs Benefits Net
Benefit / Cost Ratio $ / kWh Benefits
Total Resource + Conservation Adder (PTRC) $0.052 $434,404 $844,472 $410,068 1.94
Total Resource No Adder (TRC) $0.052 $434,404 $767,702 $333,298 1.77
Utility (UCT) $0.036 $302,554 $767,702 $465,148 2.54
Ratepayer Impact (RIM) $0.146 $1,218,507 $767,702 ($450,805) 0.63
Participant (PCT) $0.025 $340,814 $1,585,100 $1,244,286 4.65
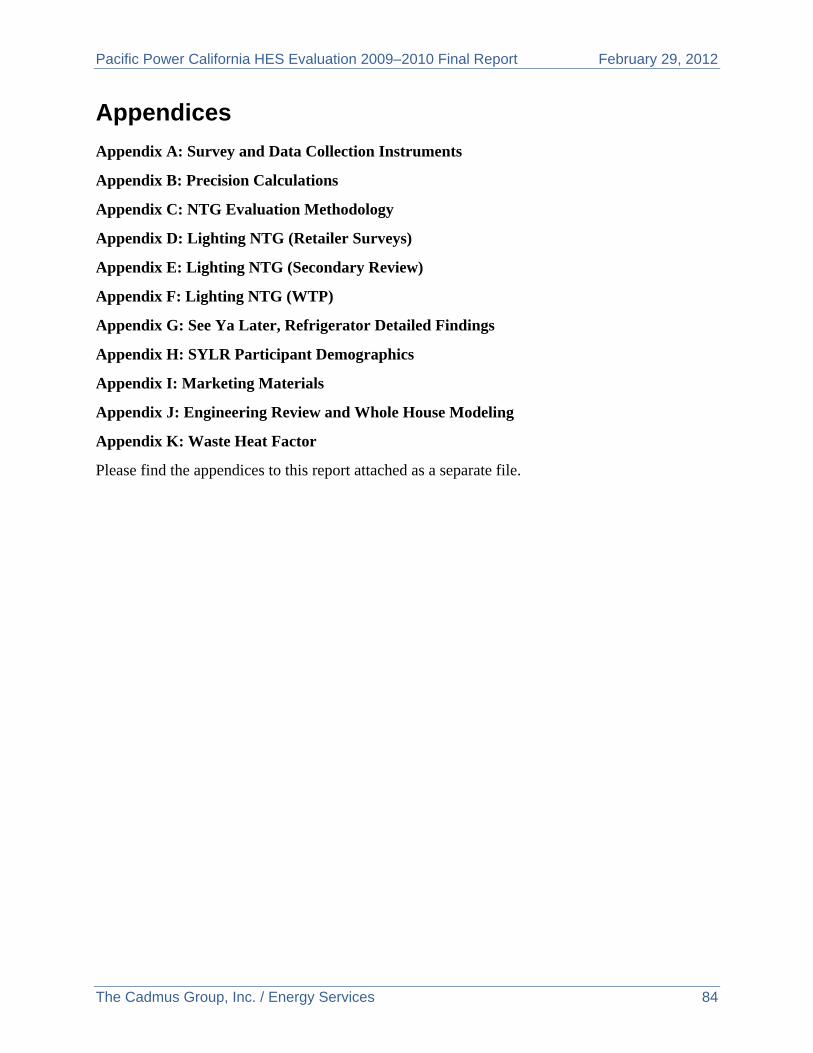
Pacific Power California HES Evaluation 2009–2010 Final Report February 29, 2012
The Cadmus Group, Inc. / Energy Services 84
Appendices
Appendix A: Survey and Data Collection Instruments
Appendix B: Precision Calculations
Appendix C: NTG Evaluation Methodology
Appendix D: Lighting NTG (Retailer Surveys)
Appendix E: Lighting NTG (Secondary Review)
Appendix F: Lighting NTG (WTP)
Appendix G: See Ya Later, Refrigerator Detailed Findings
Appendix H: SYLR Participant Demographics
Appendix I: Marketing Materials
Appendix J: Engineering Review and Whole House Modeling
Appendix K: Waste Heat Factor
Please find the appendices to this report attached as a separate file.
Appendix 3
California Low Income Weatherization
Pacific Power
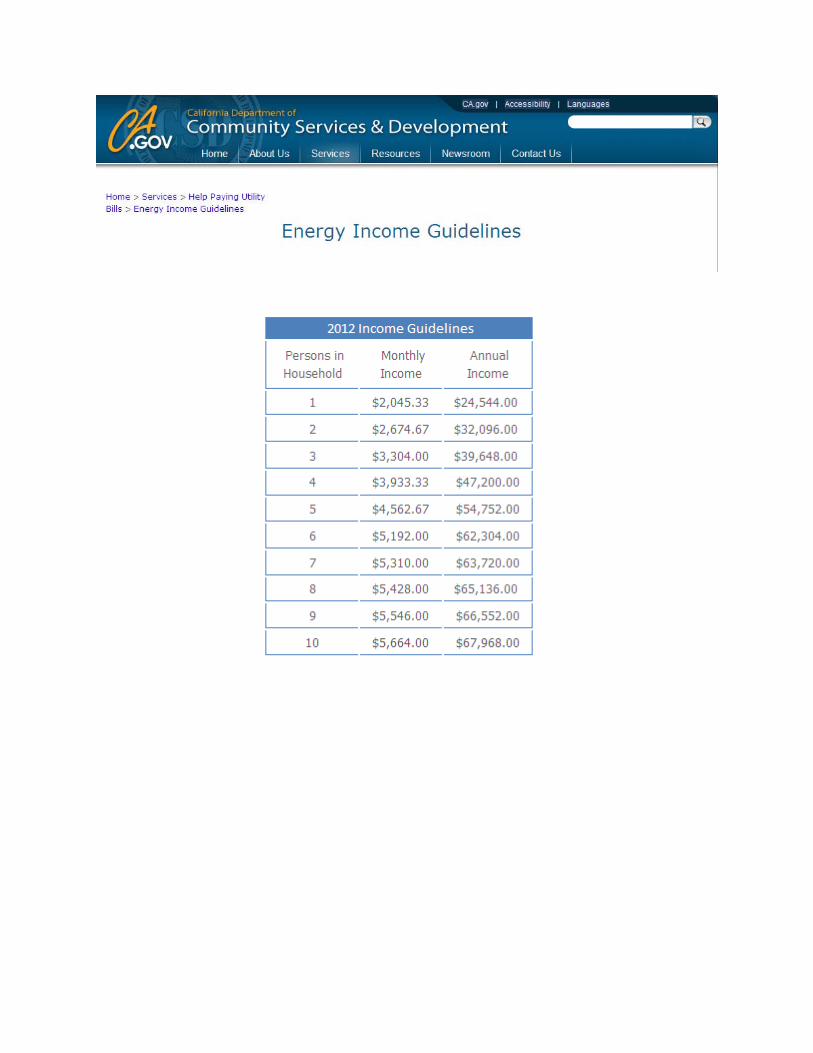
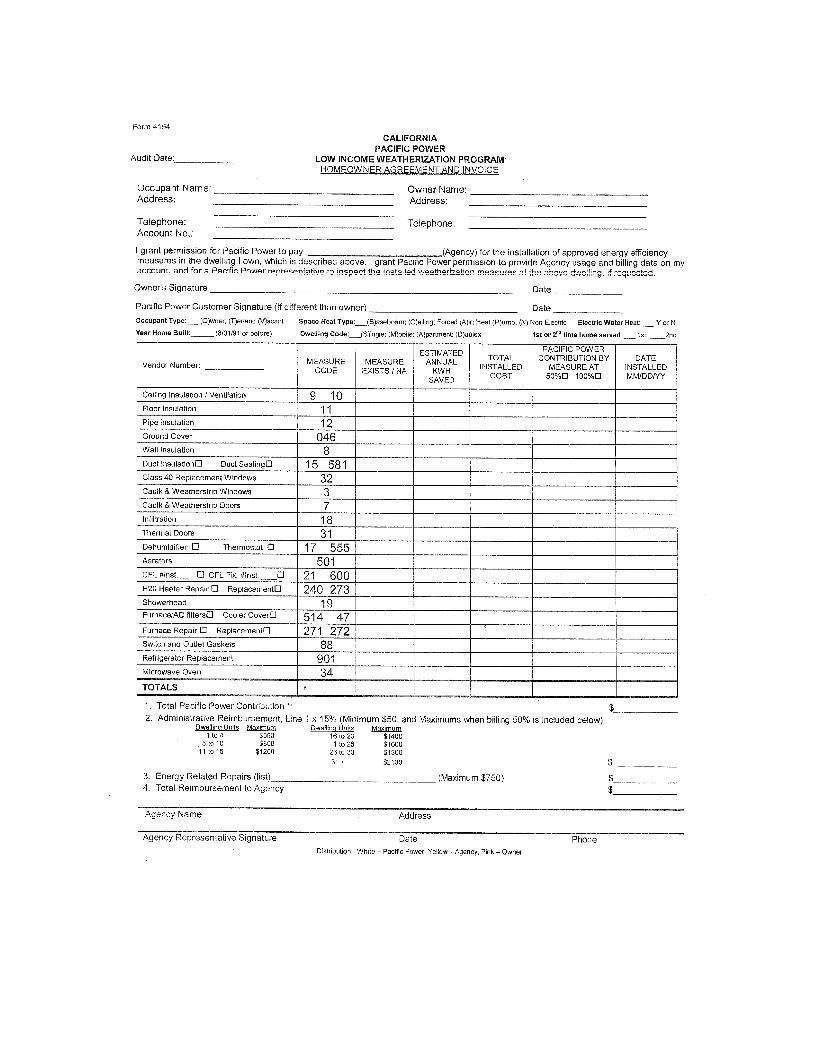

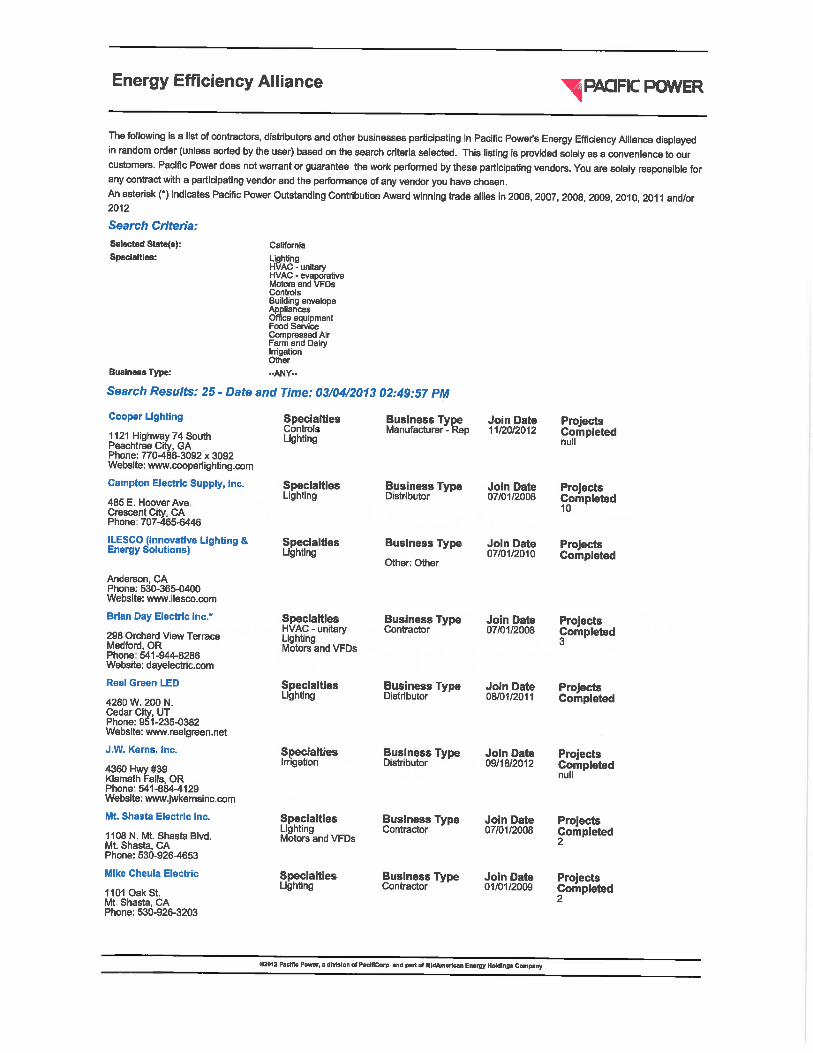
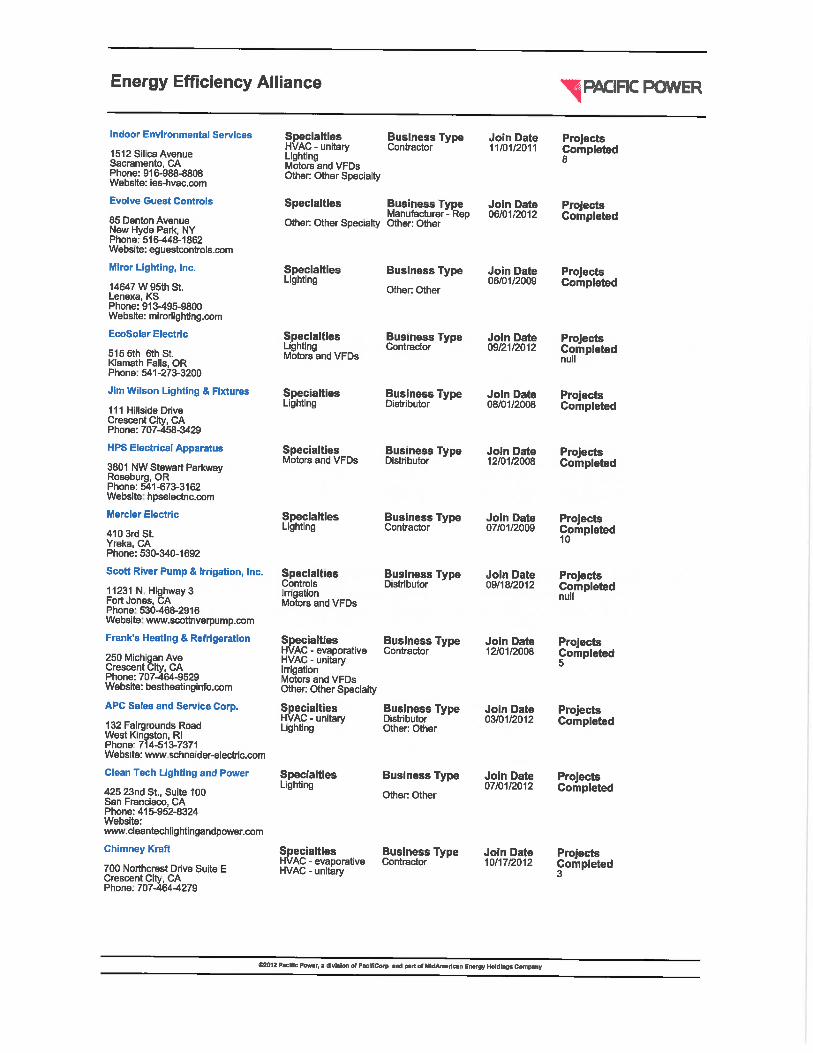
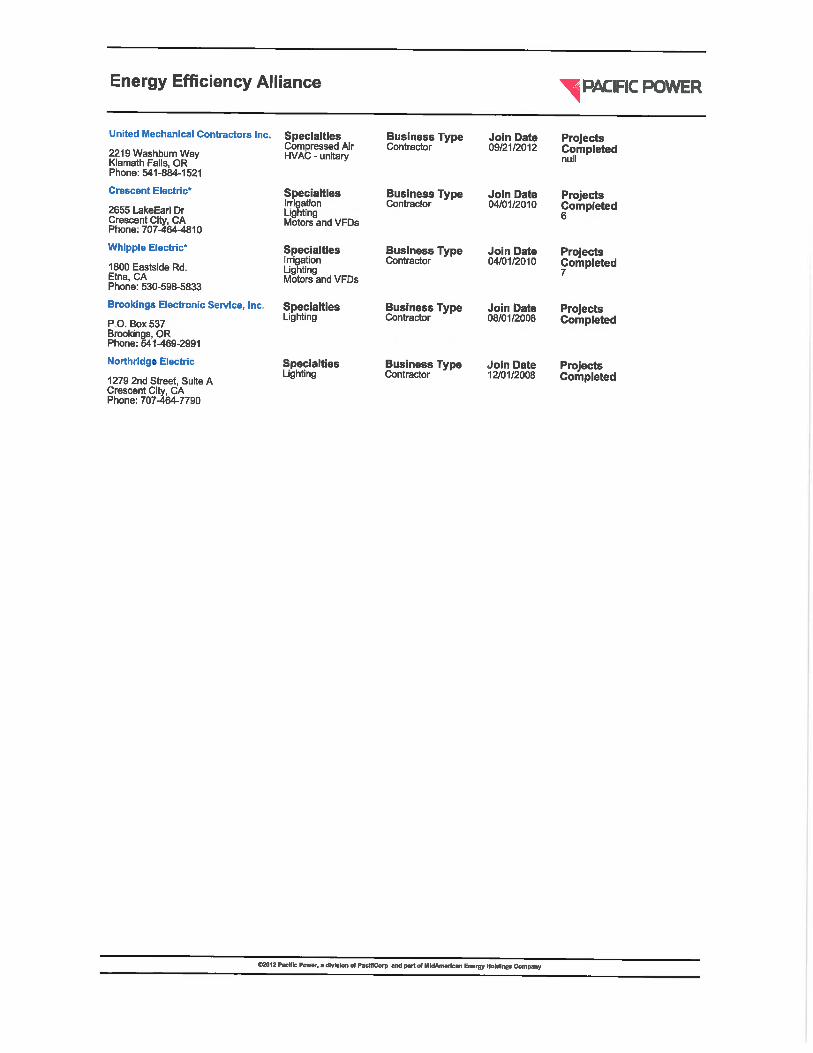
Appendix 5 Estimated Peak Contributions
2012
Pacific Power
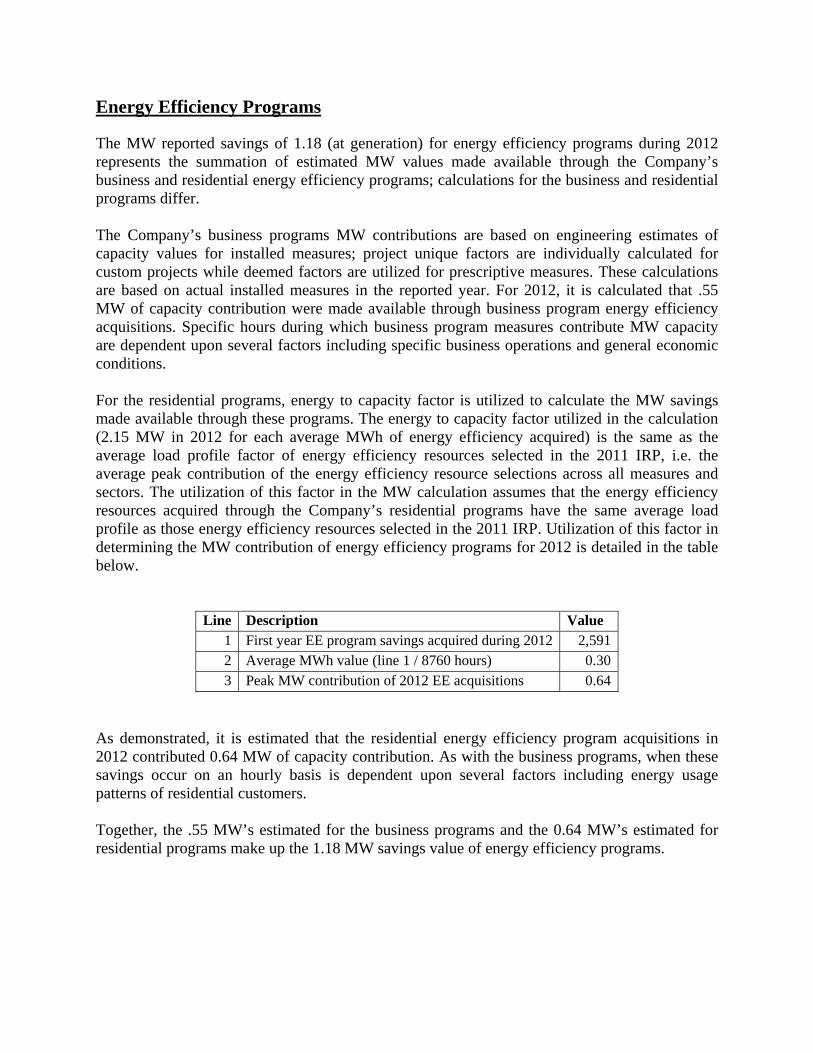
Energy Efficiency Programs The MW reported savings of 1.18 (at generation) for energy efficiency programs during 2012 represents the summation of estimated MW values made available through the Company’s business and residential energy efficiency programs; calculations for the business and residential programs differ. The Company’s business programs MW contributions are based on engineering estimates of capacity values for installed measures; project unique factors are individually calculated for custom projects while deemed factors are utilized for prescriptive measures. These calculations are based on actual installed measures in the reported year. For 2012, it is calculated that .55 MW of capacity contribution were made available through business program energy efficiency acquisitions. Specific hours during which business program measures contribute MW capacity are dependent upon several factors including specific business operations and general economic conditions. For the residential programs, energy to capacity factor is utilized to calculate the MW savings made available through these programs. The energy to capacity factor utilized in the calculation (2.15 MW in 2012 for each average MWh of energy efficiency acquired) is the same as the average load profile factor of energy efficiency resources selected in the 2011 IRP, i.e. the average peak contribution of the energy efficiency resource selections across all measures and sectors. The utilization of this factor in the MW calculation assumes that the energy efficiency resources acquired through the Company’s residential programs have the same average load profile as those energy efficiency resources selected in the 2011 IRP. Utilization of this factor in determining the MW contribution of energy efficiency programs for 2012 is detailed in the table below.
Line Description Value 1 First year EE program savings acquired during 2012 2,591 2 Average MWh value (line 1 / 8760 hours) 0.30 3 Peak MW contribution of 2012 EE acquisitions 0.64
As demonstrated, it is estimated that the residential energy efficiency program acquisitions in 2012 contributed 0.64 MW of capacity contribution. As with the business programs, when these savings occur on an hourly basis is dependent upon several factors including energy usage patterns of residential customers. Together, the .55 MW’s estimated for the business programs and the 0.64 MW’s estimated for residential programs make up the 1.18 MW savings value of energy efficiency programs.
Related Documents