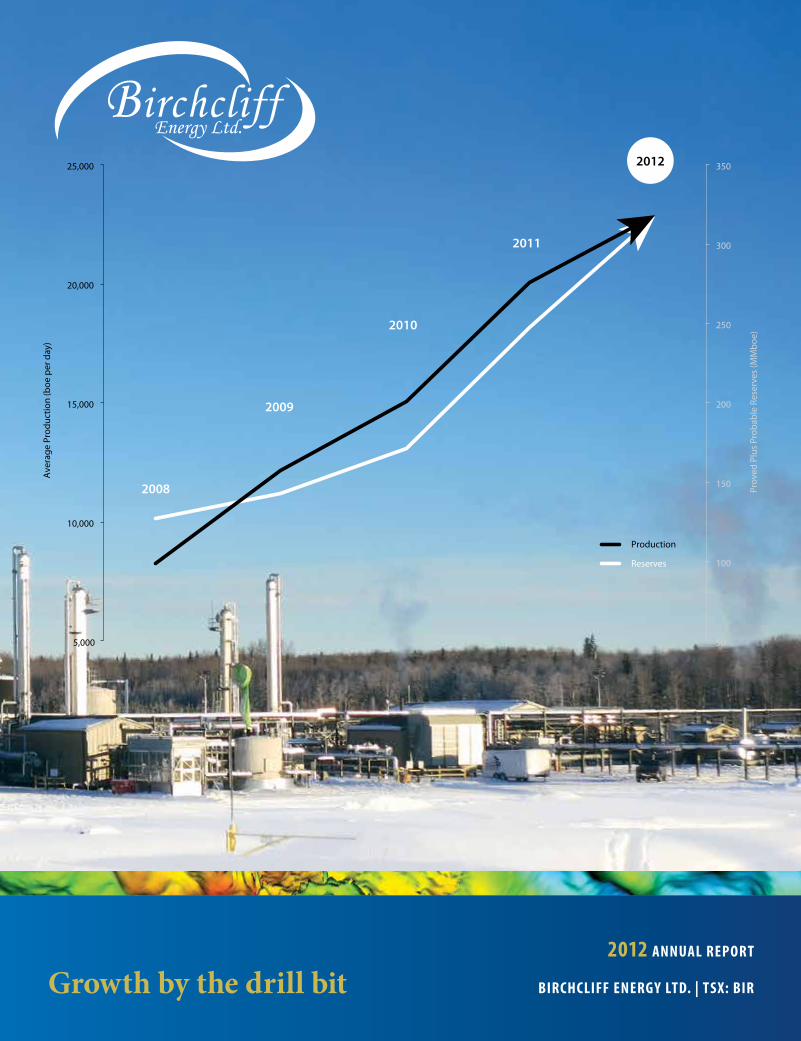
BIRCHCLIFF ENERGY LTD. | TSX: BIR 2012 ANNUAL REPORT 50 100 150 200 250 300 350 5,000 10,000 15,000 20,000 25,000 2008 2009 2010 2011 2012 Proved Plus Probable Reserves (MMboe) Average Production (boe per day) Production Reserves Growth by the drill bit

Welcome message from author
This document is posted to help you gain knowledge. Please leave a comment to let me know what you think about it! Share it to your friends and learn new things together.
Transcript
birchcliff energy ltd. | tsx: bir
2012 AnnuAl report
50
100
150
200
250
300
350
5,000
10,000
15,000
20,000
25,000
2008
2009
2010
2011
2012
Prov
ed P
lus
Prob
able
Res
erve
s (M
Mb
oe)
Ave
rage
Pro
duct
ion
(boe
per
day
)
Production
Reserves
Growth by the drill bit
Bir
ch
cliff E
nE
rg
y lt
d. | 2
012 A
nn
uA
l rE
po
rt

finAnciAl And operAtionAl highlights
three months ended twelve months ended
dec 31, 2012 dec 31, 2011 dec 31, 2012 dec 31, 2011
opErAtingAverage daily production
Light oil – (barrels) 3,986 4,229 4,270 3,905Natural gas – (thousands of cubic feet) 131,120 90,116 106,868 82,116NGLs – (barrels) 816 564 721 545total – barrels of oil equivalent (6:1) 26,655 19,812 22,802 18,136
Average sales price ($ CDN)Light oil – (per barrel) 83.38 95.52 84.45 92.00Natural gas – (per thousand cubic feet) 3.43 3.40 2.63 3.85NGLs – (per barrel) 80.44 94.67 83.78 89.33total – barrels of oil equivalent (6:1) 31.78 38.54 30.80 39.94
Undeveloped landGross (acres) 544,129 531,903 544,129 531,903Net (acres) 506,024 493,968 506,024 493,968
nEtBAcK And coSt ($ per barrel of oil equivalent at 6:1)Petroleum and natural gas revenue 31.81 38.55 30.82 39.97Royalty expense (2.52) (4.16) (2.90) (4.44)Operating expense (5.88) (6.90) (6.06) (6.75)Transportation and marketing expense (2.09) (2.66) (2.28) (2.64)
netback 21.32 24.83 19.58 26.14General & administrative expense, net (2.66) (5.88) (2.75) (3.74)Interest expense (2.41) (2.27) (2.42) (2.64)
funds flow netback 16.25 16.68 14.41 19.76Stock-based compensation expense, net (0.41) (1.48) (0.60) (1.42)Depletion and depreciation expense (11.75) (11.97) (11.48) (10.84)Accretion expense (0.18) (0.23) (0.21) (0.27)Amortization of deferred financing fees (0.08) (0.11) (0.09) (0.13)Gain on sale of assets – – 0.46 0.32Income tax expense (1.26) (1.06) (0.91) (2.22)
Net income 2.57 1.83 1.58 5.20Preferred share dividends (0.41) – (0.19) –
net income available to common shareholders 2.16 1.83 1.39 5.20
finAnciAlPetroleum and natural gas revenue ($000) 78,001 70,261 257,206 264,587Funds flow from operations ($000)(1) 39,848 30,400 120,259 130,826
Per common share – basic ($)(1) 0.28 0.24 0.88 1.04Per common share – diluted ($)(1) 0.28 0.23 0.86 1.00
Net income ($000) 6,305 3,333 13,196 34,454Net income available to common shareholders ($000)(2) 5,305 3,333 11,617 34,454
Per common share – basic ($)(2) 0.04 0.03 0.08 0.27Per common share – diluted ($)(2) 0.04 0.03 0.08 0.26
Common shares outstandingEnd of period – basic 141,596,279 126,745,577 141,596,279 126,745,577End of period – diluted 162,997,383 140,152,250 162,997,383 140,152,250Weighted average common shares for period – basic 141,585,180 126,731,919 137,083,519 126,282,910Weighted average common shares for period – diluted 144,238,774 132,216,022 139,904,484 131,444,878
Capital expenditures ($000) 32,137 81,023 298,903 237,480Preferred share dividends ($000) 1,000 – 1,579 –Working capital deficit ($000) 29,567 48,598 29,567 48,598Non-revolving five-year term credit facility ($000) 68,250 68,925 68,250 68,925Revolving credit facilities ($000) 364,313 319,500 364,313 319,500Total debt ($000) 462,130 437,023 462,130 437,023
(1) Funds flow from operations and per common share amounts are non-GAAP measures that represent cash flow from operating activities as per the Statements of Cash Flows before the effects of changes in non-cash working capital and decommissioning expenditures.
(2) Net income per common share amounts are calculated using net income available to Birchcliff’s shareholders, adjusted for any preferred share dividends paid and divid-ed by the weighted average number of common shares outstanding for the period.

6 2012 highlights 22 pouce coupe south gA s pl Ant
27 reserves And resources
2 Message to Shareholders
6 2012 highlights Growth by the drill bit
8 Financial Performance
9 Strategy
10 peAce river Arch One core area
12 Resource Plays
20 Drilling Program
21 Facilities
22 pouce coupe south gAs plAnt Investing in our future
24 Responsibility
26 Well Located
27 reserves And resources The Upside
34 finAnciAl review By the numbers
35 Management’s Discussion and Analysis
65 Financial Statements
71 Notes to Financial Statements
96 Glossary and Advisories
100 Corporate Information
BIRChCLIFF ENERGy LTD. is a Calgary,
Alberta based intermediate oil
and gas company with operations
concentrated within its one core area,
the Peace River Arch area of Alberta.
Our strategy is to develop extensive
drilling opportunities on our two
established resource plays to support
growth in a repeatable, low risk
manner.
Birchcliff’s common shares are listed
on the Toronto Stock Exchange (“tSX”)
under the symbol BIR and are included
in the S&P/TSX Composite Index.
Birchcliff’s Preferred Shares, Series A
and Warrants are listed for trading on
the TSX under the symbols BIR.PR.A
and BIR.WT respectively. At March 1,
2013, Birchcliff had an enterprise value
of approximately $1.5 billion.
by the nuMbers:
93% AvErAgE worKing intErESt in undEvElopEd lAnd
95% production opErAtEd
99% nEw drilling initiAtEd And controllEd
100% drilling SuccESS
2 0 1 2 A N N U A L r e p o r t | o p e r A t i o N s r e v i e w 1
B i r c h c l i f f e n e r g y l t d .
From 2009 to 2012, on a per common share basis, Birchcliff’s proved developed producing reserves are up 131%, proved reserves are up 81% and proved plus probable reserves are up 77%. Production per common share is up 75% and funds flow per common share is up 54%, despite a 40% decline in AECO natural gas prices since 2009. This growth has been primarily achieved through Birchcliff’s low risk development drilling on the Montney/Doig Natural Gas Resource Play and the impact of the low cost operating structure of our PCS Gas Plant
and related infrastructure. ”
“
M e s s a g e t o s h a r e h o l d e r s | 2 0 1 2 a N N U a l r e p o r t2

B i r c h c l i f f e n e r g y l t d .
The key to Birchcliff’s continued success is our high working
interest, operated, low cost asset base. Over the last five years,
we have developed a core producing property in the Peace
River Arch with significant undeveloped land surrounding our
production where we own and control infrastructure.
This business strategy has translated into exceptional results.
Looking back five years:
Production increased from 10,148 boe per day in 2008 to
22,800 boe per day in 2012, a 79% increase on a common
share basis.
Discovered and developed our Montney/Doig Natural
Gas Resource Play, where we now have 1,929 net future
drilling locations.
Reduced our operating costs on a per boe basis to $6.06,
compared to $10.41 five years ago, a 42% decrease.
Proved plus probable reserves increased from 99 MMboe
in 2008 to 318 MMboe in 2012, a 156% increase on a
common share basis.
Expansion of net undeveloped land base by 45% from
five years ago, to 544,129 (504,024 net) acres with a 93%
average working interest.
In past five years, we have drilled and cased 224
(197.2 net) wells, including 93 (80.8 net) Montney/Doig
horizontal natural gas wells.
Made significant investments in 100% owned and
operated infrastructure.
Birchcliff has consistently reduced its operating costs on a
per boe basis. We have been able to add significant reserves
at low finding and development costs. These costs are now
very low and are some of the most competitive among our
industry contemporaries. Financial flexibility has given us a
position of strength from which to execute on our business
plan, despite volatile market conditions. The infrastructure
and development projects launched over the course of the
last five years have laid the foundation for sustainable produc-
tion and reserves growth for many years to come.
It is this success story that attracted an unsolicited expression
of interest and launched Birchcliff’s corporate sale process
in October 2011. We terminated the process in March 2012
because, in the face of falling natural gas prices, we did not
receive an offer that represented sufficient value to Birchcliff’s
shareholders. Birchcliff is now, and was at the time, in a very
strong position. We are well positioned to capitalize on
growth opportunities and continue to enhance shareholder
value over the long term.
MessAge to shAreholders
Few oil and gas companies can match Birchcliff’s track record. We have developed an asset base that has allowed us to consistently perform on all metrics, because we do it with the drill bit, on a repeatable basis.
2012 was another excellent year.
Jeff Tonken,President and CEO
Growth by the drill bit
2 0 1 2 A N N U A L r e p o r t | M e s s A g e t o s h A r e h o L d e r s 3
B i r c h c l i f f e n e r g y l t d .
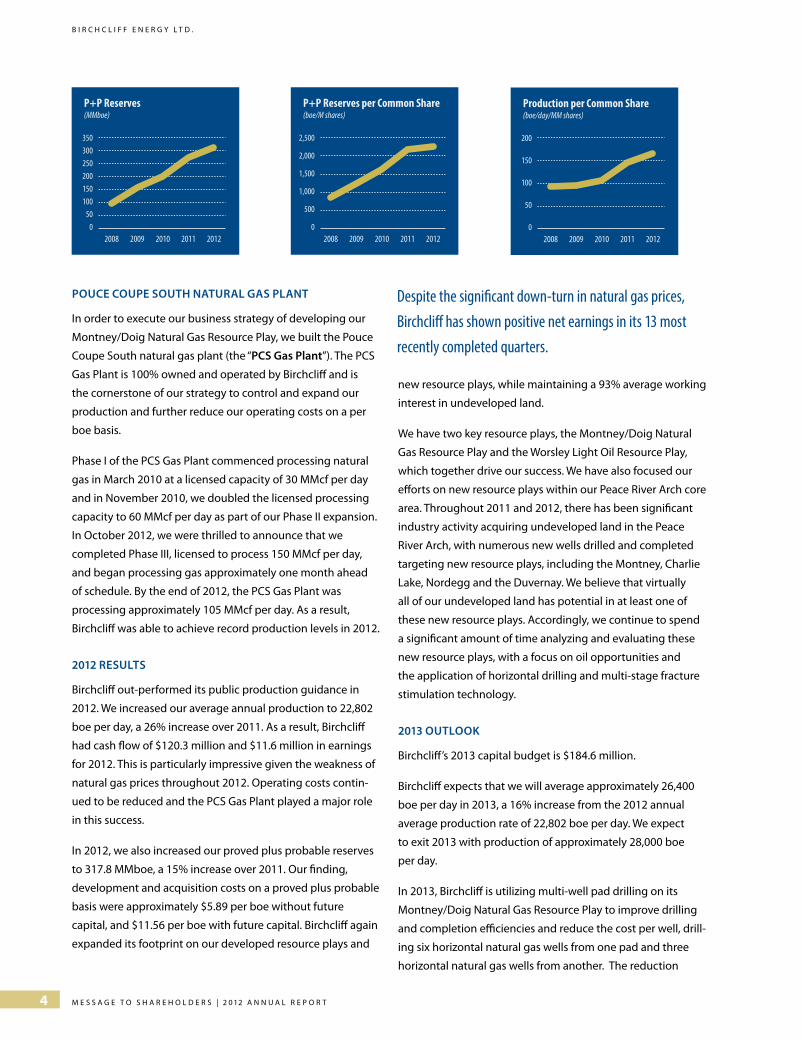
poucE coupE South nAturAl gAS plAnt
In order to execute our business strategy of developing our
Montney/Doig Natural Gas Resource Play, we built the Pouce
Coupe South natural gas plant (the “pcS gas plant”). The PCS
Gas Plant is 100% owned and operated by Birchcliff and is
the cornerstone of our strategy to control and expand our
production and further reduce our operating costs on a per
boe basis.
Phase I of the PCS Gas Plant commenced processing natural
gas in March 2010 at a licensed capacity of 30 MMcf per day
and in November 2010, we doubled the licensed processing
capacity to 60 MMcf per day as part of our Phase II expansion.
In October 2012, we were thrilled to announce that we
completed Phase III, licensed to process 150 MMcf per day,
and began processing gas approximately one month ahead
of schedule. By the end of 2012, the PCS Gas Plant was
processing approximately 105 MMcf per day. As a result,
Birchcliff was able to achieve record production levels in 2012.
2012 rESultS
Birchcliff out-performed its public production guidance in
2012. We increased our average annual production to 22,802
boe per day, a 26% increase over 2011. As a result, Birchcliff
had cash flow of $120.3 million and $11.6 million in earnings
for 2012. This is particularly impressive given the weakness of
natural gas prices throughout 2012. Operating costs contin-
ued to be reduced and the PCS Gas Plant played a major role
in this success.
In 2012, we also increased our proved plus probable reserves
to 317.8 MMboe, a 15% increase over 2011. Our finding,
development and acquisition costs on a proved plus probable
basis were approximately $5.89 per boe without future
capital, and $11.56 per boe with future capital. Birchcliff again
expanded its footprint on our developed resource plays and
new resource plays, while maintaining a 93% average working
interest in undeveloped land.
We have two key resource plays, the Montney/Doig Natural
Gas Resource Play and the Worsley Light Oil Resource Play,
which together drive our success. We have also focused our
efforts on new resource plays within our Peace River Arch core
area. Throughout 2011 and 2012, there has been significant
industry activity acquiring undeveloped land in the Peace
River Arch, with numerous new wells drilled and completed
targeting new resource plays, including the Montney, Charlie
Lake, Nordegg and the Duvernay. We believe that virtually
all of our undeveloped land has potential in at least one of
these new resource plays. Accordingly, we continue to spend
a significant amount of time analyzing and evaluating these
new resource plays, with a focus on oil opportunities and
the application of horizontal drilling and multi-stage fracture
stimulation technology.
2013 outlooK
Birchcliff’s 2013 capital budget is $184.6 million.
Birchcliff expects that we will average approximately 26,400
boe per day in 2013, a 16% increase from the 2012 annual
average production rate of 22,802 boe per day. We expect
to exit 2013 with production of approximately 28,000 boe
per day.
In 2013, Birchcliff is utilizing multi-well pad drilling on its
Montney/Doig Natural Gas Resource Play to improve drilling
and completion efficiencies and reduce the cost per well, drill-
ing six horizontal natural gas wells from one pad and three
horizontal natural gas wells from another. The reduction
0
50
100
150
200
250
300
350P+P Reserves(MMboe)
350
250300
200 150 100
50 0
2008 2009 2010 2011 2012
P+P Reserves per Common Share(boe/M shares)
2,500
1,500
2,000
1,000
500
02008 2009 2010 2011 2012
Wells Drilled
60
50
40
30
20
10
02008 2009 2010 2011 2012
netgross
Production per Common Share(boe/day/MM shares)
200
150
100
50
02008 2009 2010 2011 2012
0
500
1000
1500
2000
2500
0
50
100
150
200
0
50
100
150
200
250
300
350P+P Reserves(MMboe)
350
250300
200 150 100
50 0
2008 2009 2010 2011 2012
P+P Reserves per Common Share(boe/M shares)
2,500
1,500
2,000
1,000
500
02008 2009 2010 2011 2012
Wells Drilled
60
50
40
30
20
10
02008 2009 2010 2011 2012
netgross
Production per Common Share(boe/day/MM shares)
200
150
100
50
02008 2009 2010 2011 2012
0
500
1000
1500
2000
2500
0
50
100
150
200
Despite the significant down-turn in natural gas prices, Birchcliff has shown positive net earnings in its 13 most recently completed quarters.
M e s s a g e t o s h a r e h o l d e r s | 2 0 1 2 a N N U a l r e p o r t4

B i r c h c l i f f e n e r g y l t d .
in drilling and completion costs are significant and allows
Birchcliff to drill right through spring break-up. however,
production growth during 2013 will come in large increments
as the new horizontal natural gas wells effectively commence
production simultaneously, not one at a time as they are
drilled. Accordingly, Birchcliff will see normal production
declines during the second quarter followed by material
production growth in the third and fourth quarters.
In 2013, we will not be required to allocate capital to any
major facility projects as we have in prior years. Capital
efficiencies will improve as most of our capital will go to the
drilling, completion, equipping and tie-in of new wells.
Birchcliff will continue to develop and expand its two proven
resource plays, the Montney/Doig Natural Gas Resource
Play and the Worsley Light Oil Resource Play. These plays are
characterized by repeatable and predictable opportunities
with scalable development potential, which is reflected in
our three-year finding and development costs. Because
we operate in a focused area, where we have substantial
ownership and control of the necessary infrastructure, we
have low operating costs. As our engine for future growth,
Birchcliff has a significant amount of undeveloped land, with
a 93% average working interest that surrounds or is proximal
to our core production. Management estimates that Birchcliff
has 1,928 future drilling locations on the Montney/Doig
Natural Gas Resource Play.
Birchcliff’s 2013 goals are to convert long life reserves into
production and expand our footprint on the Montney/Doig
Natural Gas Resource Play and the Worsley Light Oil Resource
Play. We will focus on the reduction of our per boe operating
costs as we make use of the expanded capacity of our PCS
Gas Plant. We will continue to develop our high quality asset
base, which will result in long-term production and reserves
growth, with low finding and development costs.
thAnK you to thE Birchcliff tEAm
Birchcliff’s 2012 results were achieved thanks to the
dedication and hard work of our talented team.
Thank you to our office staff, who develop and plan each of
the individual initiatives that bring us success and to our field
staff, who safely and efficiently perform the field operations
that turn good ideas into reality on the ground. Their commit-
ment, talent and team orientation are what make Birchcliff
a great place to work, and I am grateful for their loyalty and
support.
Thank you to our management team, who all work very long
hours for the benefit of our employees and shareholders.
Thank you to our directors for their continued dedication,
input and guidance.
Thank you to Mr. Seymour Schulich, our largest shareholder,
for his sage advice and ongoing financial and moral support,
which has played an integral role in our success. Mr. Schulich
holds 40,000,000 common shares representing approximately
28% of the current issued and outstanding common shares of
Birchcliff.
Thank you to all our shareholders for their continued support
and their trust in all of us at Birchcliff.
Birchcliff has built a strong foundation for continued growth
as a result of the talent and efforts of our people. We are well
positioned to capitalize on our existing and future growth
opportunities and enhance shareholder value over the
long-term.
We look forward to another excellent year.
Respectfully,
(signed) “A. Jeffery Tonken”
A. Jeffery tonken
President and Chief Executive Officer
Birchcliff has built a strong foundation for continued growth as a result of the talent and efforts of our people. We are well positioned to capitalize on growth opportunities and enhance shareholder value over the long term. ”
“
2 0 1 2 A N N U A L r e p o r t | M e s s A g e t o s h A r e h o L d e r s 5
B i r c h c l i f f e n e r g y l t d .
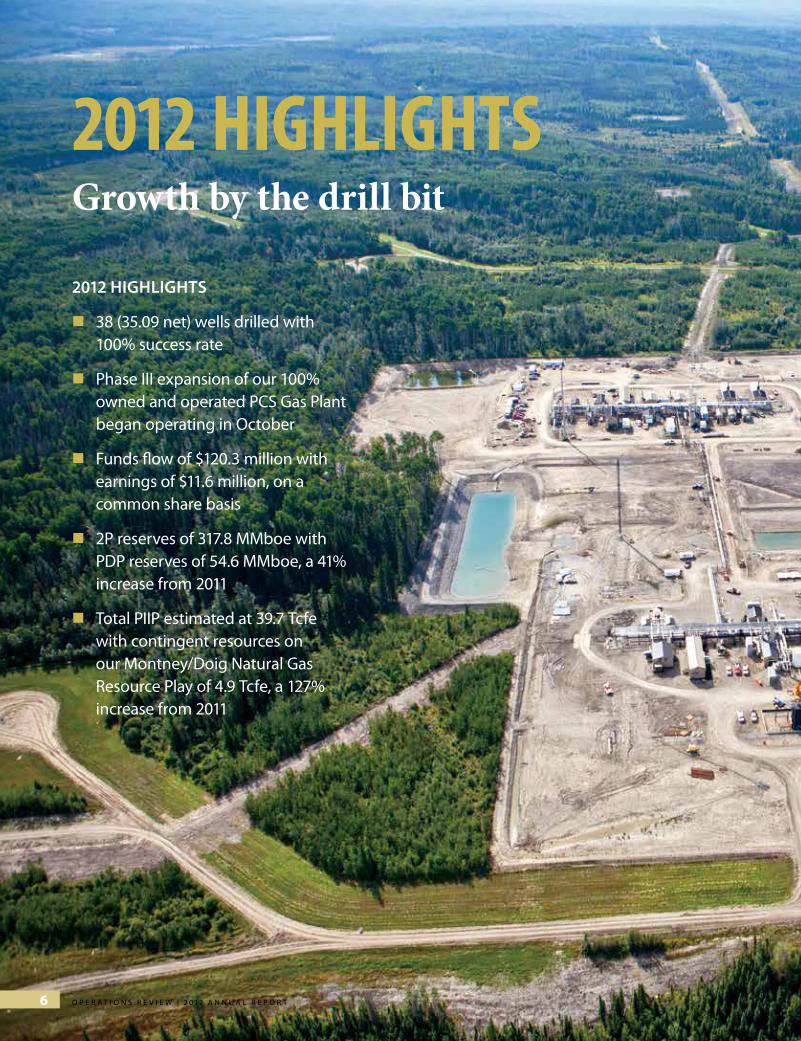
2012 highlightsGrowth by the drill bit
2012 highlightS
38 (35.09 net) wells drilled with 100% success rate
Phase III expansion of our 100% owned and operated PCS Gas Plant began operating in October
Funds flow of $120.3 million with earnings of $11.6 million, on a common share basis
2P reserves of 317.8 MMboe with PDP reserves of 54.6 MMboe, a 41% increase from 2011
Total PIIP estimated at 39.7 Tcfe with contingent resources on our Montney/Doig Natural Gas Resource Play of 4.9 Tcfe, a 127% increase from 2011
O p e r a t i O n s r e v i e w | 2 0 1 2 a n n U a L r e p O r t6
B i r c h c l i f f e n e r g y l t d .
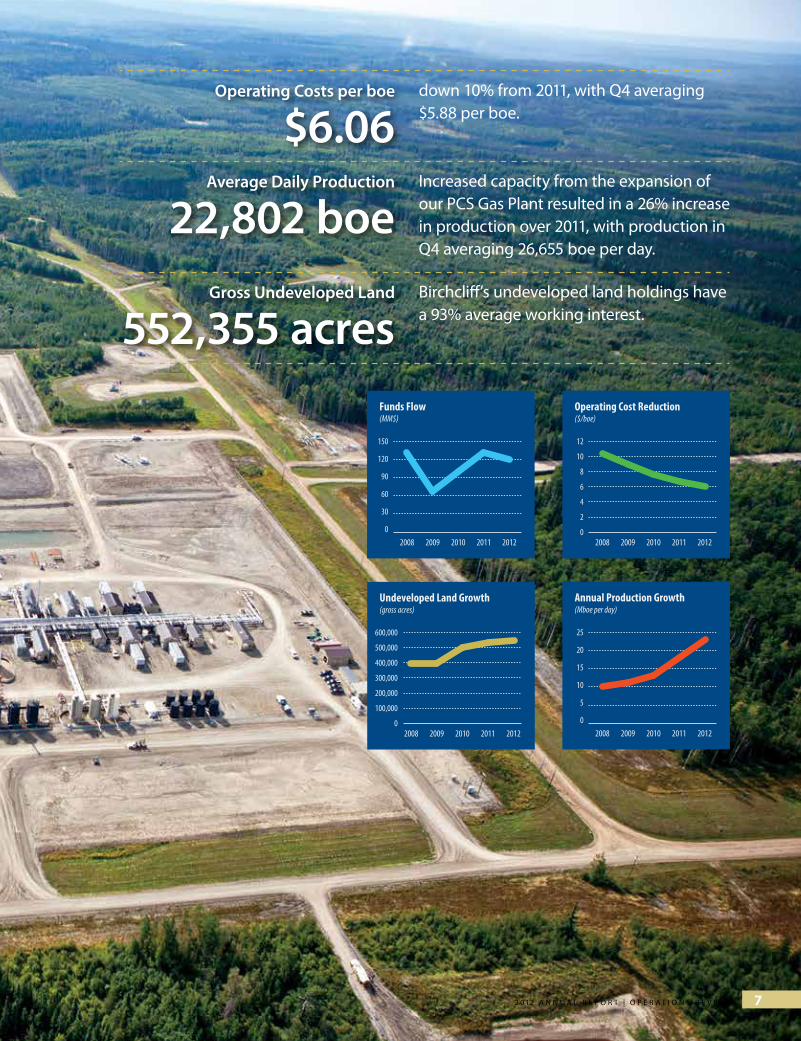
down 10% from 2011, with Q4 averaging $5.88 per boe.
Increased capacity from the expansion of our PCS Gas Plant resulted in a 26% increase in production over 2011, with production in Q4 averaging 26,655 boe per day.
Birchcliff’s undeveloped land holdings have a 93% average working interest.
operating costs per boe
$6.06Average daily production
22,802 boegross undeveloped land
552,355 acres
0
2
4
6
8
10
12
0
5000
10000
15000
20000
25000
0
30
60
90
120
150
0
100000
200000
300000
400000
500000
600000
Operating Cost Reduction($/boe)
12
10
8
6
2
4
02008 2009 2010 2011 2012
Annual Production Growth(Mboe per day)
25
20
15
10
5
02008 2009 2010 2011 2012
Undeveloped Land Growth(gross acres)
600,000
500,000
400,000
300,000
200,000
0
100,000
2008 2009 2010 2011 2012
Funds Flow(MM$)
150
120
90
60
30
02008 2009 2010 2011 2012
0
2
4
6
8
10
12
0
5000
10000
15000
20000
25000
0
30
60
90
120
150
0
100000
200000
300000
400000
500000
600000
Operating Cost Reduction($/boe)
12
10
8
6
2
4
02008 2009 2010 2011 2012
Annual Production Growth(Mboe per day)
25
20
15
10
5
02008 2009 2010 2011 2012
Undeveloped Land Growth(gross acres)
600,000
500,000
400,000
300,000
200,000
0
100,000
2008 2009 2010 2011 2012
Funds Flow(MM$)
150
120
90
60
30
02008 2009 2010 2011 2012
2 0 1 2 A N N U A L r e p o r t | o p e r A t i o N s r e v i e w 7
B i r c h c l i f f e n e r g y l t d .
finAnciAl perforMAnce
2012 finAnciAl highlightS
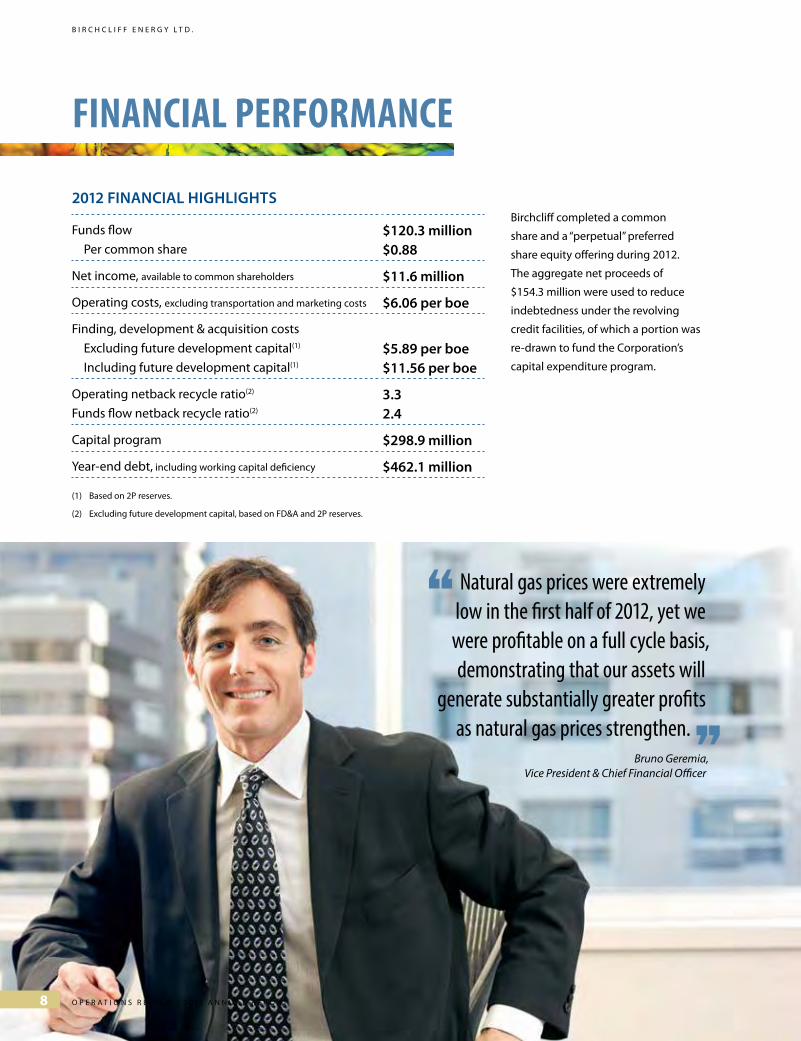
Funds flow
Per common share $120.3 million$0.88
Net income, available to common shareholders $11.6 million
Operating costs, excluding transportation and marketing costs $6.06 per boe
Finding, development & acquisition costs
Excluding future development capital(1)
Including future development capital(1)
$5.89 per boe$11.56 per boe
Operating netback recycle ratio(2)
Funds flow netback recycle ratio(2)
3.32.4
Capital program $298.9 million
year-end debt, including working capital deficiency $462.1 million
(1) Based on 2P reserves.
(2) Excluding future development capital, based on FD&A and 2P reserves.
Natural gas prices were extremely low in the first half of 2012, yet we were profitable on a full cycle basis, demonstrating that our assets will
generate substantially greater profits as natural gas prices strengthen. ”Bruno Geremia,
Vice President & Chief Financial Officer
“
Birchcliff completed a common
share and a “perpetual” preferred
share equity offering during 2012.
The aggregate net proceeds of
$154.3 million were used to reduce
indebtedness under the revolving
credit facilities, of which a portion was
re-drawn to fund the Corporation’s
capital expenditure program.
O p e r a t i O n s r e v i e w | 2 0 1 2 a n n U a L r e p O r t8

F I N A N C I A L P E R F O R M A N C E
strAtegy Our mission is to develop large-scale
exploration and development oppor-
tunities in the Peace River Arch area
of Alberta that can support extensive
drilling and production growth in a
repeatable low-cost, low-risk manner.
Birchcliff has a full cycle exploration,
exploitation and development strategy
for the Montney/Doig Natural Gas
Resource Play. We are very focused
on improvements to our drilling and
completion operations that will result
in cost reductions. Our PCS Gas Plant is
strategically situated in the heart of our
Montney/Doig Natural Gas Resource
Play, enabling us to process natural
gas at a fraction of the costs borne
by others who rely on third-party
processing.
In our Worsley Light Oil Resource Play
we have received approval to expand
the waterflood area and we are con-
ducting the field operations necessary
to convert wells to injectors and install
pipelines and related facilities. Our
control of infrastructure in the Worsley
area allows us to effectively manage
the operating costs associated with
light oil production at Worsley.
In our Peace River Arch core area we
are analyzing and evaluating new
resource plays on which virtually all of
our undeveloped land has potential,
with a focus on oil opportunities and
the application of horizontal drilling
and multi-stage fracture stimulation
technology.
We are committed to building long-term value for our shareholders and we have now succeeded
in building the foundation to do so. ”Jim Surbey,
Vice President, Corporate Development
“
2 0 1 2 A N N U A L r e p o r t | o p e r A t i o N s r e v i e w 9

B i r c h c l i f f e n e r g y l t d .
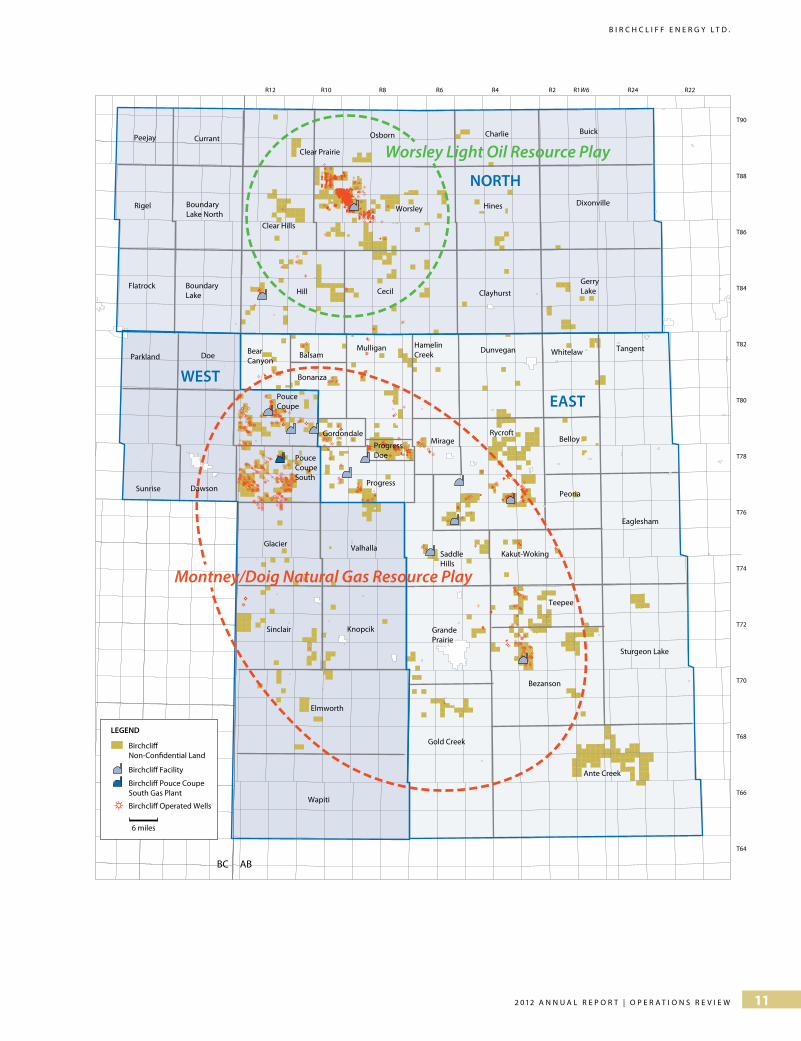
PEACE RIVER ARCH
The Peace River Arch is one of the most prolific natural gas and oil producing areas of the Western Canadian Sedimentary Basin
and is generally characterized by multiple horizons with a myriad of structural, stratigraphic and hydrodynamic traps. There is
an abundance of prolific resource plays, related in part to the proximity of the area to the deep basin, where generation and
trapping of hydrocarbons preferentially occurs. The Peace River Arch provides all-season access that allows Birchcliff to drill,
complete, equip and tie-in wells on a continuous basis.
Within its core area in the Peace River Arch, the Corporation utilizes three technical teams, each responsible for their own
district: West, North and East. Each of the districts is comprised of a number of regions. The Montney/Doig Natural Gas Resource
Play is situated on Birchcliff’s West and East districts and the Worsley Light Oil Resource Play is situated on the North district.
peAce river ArchOne Core Area
Birchcliff’s operations are concentrated within the Peace River Arch, which is centered northwest of Grande Prairie, Alberta, adjacent to the Alberta/British Columbia border. Management considers this area to be one of the most desirable natural gas and light oil drilling areas in North America.
O p e r a t i O n s r e v i e w | 2 0 1 2 a n n U a L r e p O r t10
B i r c h c l i f f e n e r g y l t d .
Peace River Arch
ABBC
ABBC
Birchcliff Facility
Birchcliff Pouce Coupe South Gas Plant
LEGEND
Birchcliff Operated Wells
Birchcliff Non-Confidential Land
6 miles
C
GCCFC
FC
AUFU
FV FV
FVDUCU
CU
FV
FV
F
VF
V FV
FV
FV
FV
FA
FVF
VF
VF
VF
VF
VF
V
F
V
CV
FV
FV
CVKUAUDUF V
FV
FV
FV
FV
FV
FVFV
CV
FV
FVFV
FVFF
VF
VKCFC
CUKUAU
F
FUAU
FV
CF
VF
V
CFA
FU
CUFF
FV
FV
FV
FV
FU
C
FAFA
FU
FV
FA
A
G
GU
GK
GG
G
GUCU
G
KKLLKUGUGGLGC
GU
K
GU
CUFU
CKKCF
GC
KU
KU
KKK
CGUIUGU
F
AV
GU
GD
GUF
CUCU
KC
GGG
CU
K
FV FV
FVFVCV
FUAUAUFU
FV
FV
FV
FV
FV
FV
CV
FV
FV FVF
V FV FA
FUKUCUFV
FVFV
FV
FVF
V
FUAU
FV
FV
F VF V
FV
F
FU
FUFV
FVF
VEV
FU
F
K
FV
KF
FV
GV
FV
C
GG
FUAUFFUAU
FV
E
FV
FV
FG
CUCU
FV
FV
CFF
V
FA
FV
FV
A
VKF
AV
FV
FVGUKUF
CU
FV
FV
FV
F
GGGCCKU
GLGG
GUGUCUFU
F
FFKKFGGGGF
V
G
F
F
JGFFCUEUEU
LGGGKI
F
LFFULUFU
FFGLCLLLGUGUCUF
V
FC
EU
FA
G
CCGF
GGG
CC
IV
G
GGII
KF
JC
GGF
I
EVDV
G
E
F
GU
EUCGCC
J
G
I
EUJUGU
GUFUAU
C
K
EULUEU
G
EVFUEV
C
F
F
V
GG
F
FF
V
K
GV
CV
G
G
FI
CCK
GGGGCC
KKK
K
GGKF
GG
GLC
FF
KK
GE V
GUEV DV EV DV EV
EV
EVEV DV DV EVEVICGIGV
EVEVEVEV
JVJCE VEV
GCIEVE
F
GI
E VE VI VE VG
ICCDIK
G
EUELDEE
EEUE
JCCIEUEUEUEEE
IEEEUEU
EE
EUCUC
ESS
C
SA
EU
EEUEUE
EUCUEUCU
EE V
E
EU
IU
EECEU
EU
GU EV
EU
SUISU
EUEU
SESV
EU
EV
EUS
AE
EVEV
IDVEU
EV
IEUIU
EU
EUEUEUEUEV
E
E
E
SSE
SU
E
EU
EV
EU
EU
EV
EIUEUEU
EEU
EV
GF
EEV
EU
EE
EUSU
EUEU
EUIUEVI
EUE
EUEEEUGV
EU
EUEU
IUEUEUEUDV
S
GVIVEUDSCV
IVEU
ECS
EUISIEVEG
E
EEEE
GUGUE
DVEDVEEVE
EV
IESUCUSCECEEUEEV
EE
EUECEEUEIIECISEEUEUEEEIUIIU
LKEKCEGLGGI
G
L
G
LUK
GILE
KKC
G
K
GULUCU
GU
LKK
L
GKGLLL
G
GGGKALKIKJKK
K
GKKUKJLL
GGGLG
KK
GJ
IU
K
GLKC
KC
IGGCUGG
GC
CC
C
K
FGK
EA
V
KGGK
E
GG
SV
EVEESSDSE VEVEEV
LG
DVEVSEVCDVISV
EEIESVEEEVE V
C
FF
FF
GFGG
G
GJ
C
K
K
G
DV EVG
G
G
G VC V
GUIUCUGU
G VC VC
GUEUCU
CEV EV GVCCE
EVEV EVEV
EE
EU
E
IEEVEV EV GU EV DV EV GV DVEV
GC
EVEVEV
ECCEIUIU
I
EUAUE VE VE VE VI VD VIUCUCU
G
GEA V
E V
E V
E V
IG
CU
E V
E V
E V
E VE V
E V
G
EIIV
F
FLGL
GG
IEE
EEIE
EF
IE
Montney/Doig Natural Gas Resource Play
Worsley Light Oil Resource PlayPeejay Currant
Rigel BoundaryLake North
Flatrock Boundary Lake
Parkland Doe
Sunrise Dawson
Clear Prairie
Osborn Charlie Buick
DixonvilleHinesWorsley
Clear Hills
HamelinCreek
Hill Cecil Clayhurst
GerryLake
BearCanyon
Balsam
Bonanza
Mulligan Dunvegan Whitelaw
ProgressDoe
Gordondale
Progress
Mirage
PouceCoupe
PouceCoupeSouth
Glacier Valhalla
Sinclair Knopcik
RycroftBelloy
Peoria
SaddleHills
Kakut-Woking
GrandePrairie
Teepee
Gold Creek
Elmworth
Bezanson
Ante Creek
Sturgeon Lake
Eaglesham
Tangent
Wapiti
NORTH
WEST
EAST
T90
R12 R10 R8 R6 R4 R2 R24R1W6 R22
T88
T86
T84
T82
T80
T78
T76
T74
T72
T70
T68
T66
T64
2 0 1 2 A N N U A L r e p o r t | o p e r A t i o N s r e v i e w 11
B i r c h c l i f f e n e r g y l t d .
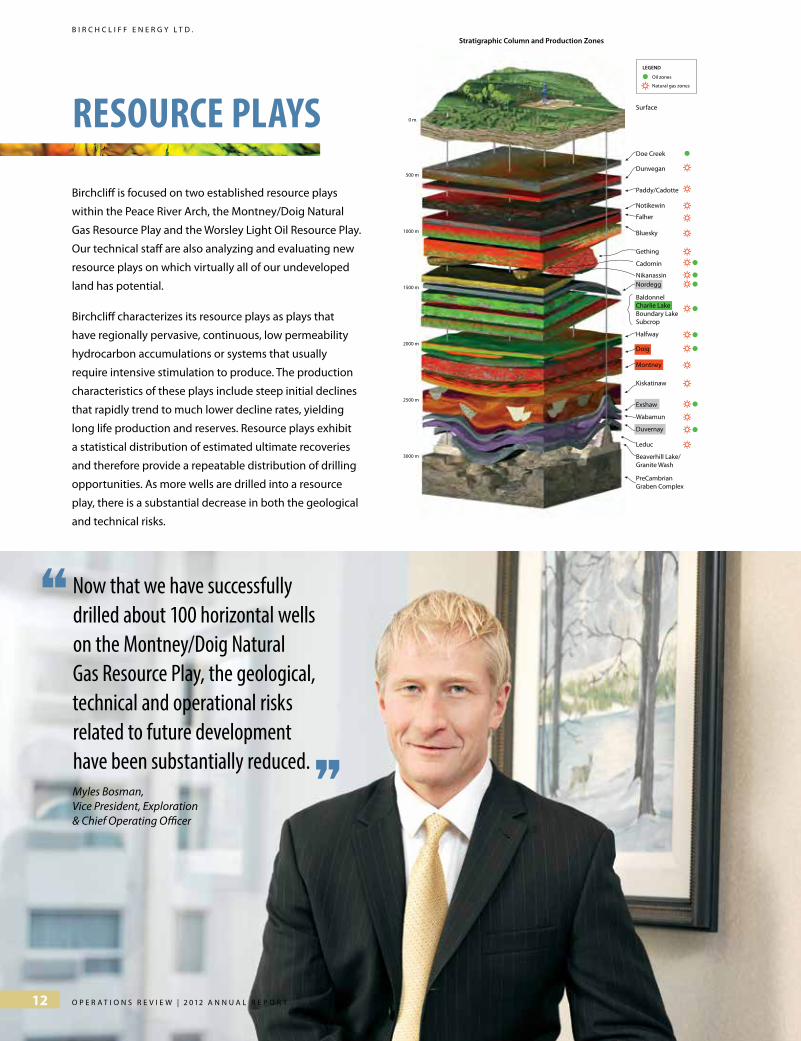
Birchcliff is focused on two established resource plays
within the Peace River Arch, the Montney/Doig Natural
Gas Resource Play and the Worsley Light Oil Resource Play.
Our technical staff are also analyzing and evaluating new
resource plays on which virtually all of our undeveloped
land has potential.
Birchcliff characterizes its resource plays as plays that
have regionally pervasive, continuous, low permeability
hydrocarbon accumulations or systems that usually
require intensive stimulation to produce. The production
characteristics of these plays include steep initial declines
that rapidly trend to much lower decline rates, yielding
long life production and reserves. Resource plays exhibit
a statistical distribution of estimated ultimate recoveries
and therefore provide a repeatable distribution of drilling
opportunities. As more wells are drilled into a resource
play, there is a substantial decrease in both the geological
and technical risks.
Oil zones
Natural gas zones
LEGEND
Surface
Doe Creek
Dunvegan
Paddy/Cadotte
Notikewin
Falher
Bluesky
Gething
Cadomin
NikanassinNordegg
Halfway
Doig
Montney
Kiskatinaw
Exshaw
Wabamun
Duvernay
Leduc
Beaverhill Lake/Granite Wash
PreCambrianGraben Complex
BaldonnelCharlie LakeBoundary LakeSubcrop
Stratigraphic Column and Production Zones
0 m
500 m
1000 m
1500 m
2000 m
2500 m
3000 m
resource plAys
Now that we have successfully drilled about 100 horizontal wells on the Montney/Doig Natural Gas Resource Play, the geological, technical and operational risks related to future development have been substantially reduced. ”Myles Bosman,Vice President, Exploration & Chief Operating Officer
“
O p e r a t i O n s r e v i e w | 2 0 1 2 a n n U a L r e p O r t12

B i r c h c l i f f e n e r g y l t d .
• Well placement in the reservoir
• Horizontal well length
well position
• Cased versus open hole
• Spacing of induced fractures
• Sand and fluid volume
coMpletion design
• Maximize pad drilling and completion efficiencies to minimize cost
pAd design
mEASurEd & intErprEtEd dAtA dESign conSidErAtionS
This analysis is unique for the Basal Doig/Upper Montney and the Middle/Lower Montney Plays.
what are the controlling
factors driving initial production (ip) and expected ultimate recovery
(eur)?
Deliverability, decline parameters, reserves, pressure, liquids yields
Reservoir porosity and fluid saturations, stratigraphy, rock properties
Faults, fractures, mechanical properties, amplitude, micro seismic data
Rock fracturing pressure, flow back characteristics
reservoir
geologicAl &petrophysicAl
interpretAtion
geologicAl interpretAtion
coMpletion
dAtA AnAlysis And process flow
Our robust economic modelling and stringent capital control
systems have helped us achieve, year over year, some of the
industry’s lowest cost reserve additions. ”Karen Pagano, P.Eng.
Vice President, Engineering
“
2 0 1 2 A N N U A L r e p o r t | o p e r A t i o N s r e v i e w 13

B i r c h c l i f f e n e r g y l t d .
montnEy/doig nAturAl gAS rESourcE plAy
The Montney/Doig Natural Gas Resource Play is classified by Birchcliff as a hybrid resource play
because it is comprised of approximately 300 metres (1,000 feet) of gas saturated rock with both
tight silt and sand reservoir rock interlayered with shale gas source rock.
Our Montney/Doig Natural Gas Resource Play horizontal wells are drilled to a measured depth of
4,000 to 5,000 metres and deliver initial productivity rates of 2,000 to 8,000 Mcf per day (333 to
1,333 boe per day).
Well spacing is an important consideration for the Montney/Doig Natural Gas Resource Play. Industry
competitors typically have drilled up to four horizontal wells per section, per stratigraphic zone, on
160 acre spacing. Recently, industry competitors in the Peace River Arch area have drilled up to eight
horizontal wells per section, per stratigraphic zone, using 80 acre spacing units. Reserve assignments
by AJM Deloitte to Birchcliff’s lands in the Montney/Doig Natural Gas Resource Play are currently
based on four horizontal wells per section, per stratigraphic zone. Our technological analysis
supports reducing inter-well spacing and in the future we expect AJM Deloitte to assign additional
future horizontal locations and reserves based on reduced inter-well spacing.
AnonymouslyT hick S andstone
AnonymouslyT hick S andstone
B3C
B2
A
B1
TSE
TSE
TSERSE RSE
Lower Member
(E. Griesbachian-Dienerian)
Shoreface Sands
AnomalouslyThick Sandstone
AnomalouslyThick Sandstone
Tidal Inlet
Doig Phosphate
Upper Doig
Shoreface SandsShoreface Sands
Shoreface Sands
Doi
g F
orm
atio
nM
ontn
ey F
orm
atio
n
BC 6th MERIDIANALBERTAWEST EAST
Montney / Doig Schematic Stratigraphic Cross Section
POUCE COUPE PROGRESSSWAN
F GGE D
CB
A
Upper Member
(Smithian)
D1
D2D3D4
D5
D6
Doig Phosphate
Basal Doig Doi
g F
orm
atio
nM
ontn
ey F
orm
atio
n
Upper Doig
(after Davies, Moslow and Sherwin, 1997)
Established Reserves orSignificant Test
Transgressive Surface Of ErosionTSE
Regressive Surface Of ErosionRSE
3rd Ord. Max. Flood. Surface?
Shoreface Sandstone,Coarse Siltstones, > 6% Ø
Lower ShorefaceSiltstones, 3-6% Ø
Turbiditic Siltstones,Sandstones, 3-6% Ø
Turbiditic Coarse Siltstones,Sandstones, >6% Ø
Dolomitized Coquinas, > 9% Ø
Silts and Shales with HighTotal Organic Content, < 3% Ø
Phosphate with HighTotal Organic Content, Low Ø
Anomalously ThickSandstone, > 9% Ø
montnEy/doig SchEmAtic StrAtigrAphic croSS SEction
O p e r a t i O n s r e v i e w | 2 0 1 2 a n n U a L r e p O r t14

B i r c h c l i f f e n e r g y l t d .
montnEy/doig nAturAl gAS rESourcE plAy
Birchcliff’s reserves on the montney/doig natural gas resource play
FF
V
K
F
V
F
VF
V
F
V
F
V
V
F
V
V
E
V
E
E
V
F
E
V
FV
F
V
LFV
F
V
F
V
F
VFV
F
V
F
V
F
V
F
V
F
V
E
V
F
VF
V
FV
F
V
F
V
F
V
FU
F
V
L
FV
F
V
FV
F
VFV
FUFV
F
VF
V
F
V
FV
F
F
FV
F
V
FV
FVF
U
FV
F
V
F
F
F
FV
FFV
FV
F
V
FV
F
V
F
V
F
V
FV
F
V
F
V
FV
F
VF
VF
V
FV
F
V
F
VF
VF
V
F
V
F
V
F
V
F
V
FV
FV
F
VF
F
V
FV
FV F
V
F
VF
V
F
V
F
VF
V
F
VF
V
FV
FVF
V
F
VF
V
FV
F
V
F
U
FV
F
VF
V
FV
KV
FV
FV
F
F
V
F
VF
VF
VF
V
F
VF
VKF
V
FV
F
VF
V
F
V
FV
FU
K
V
F
V
FV
F
V
FV
F
V
F
V
F
V
FV
FV
K
FV FV FVF
V
FV
F
V
F
FV
FV
FVF VF VF V
F
FV
FV
FU
FVF
VF
V
FU
F
V
F
V
F
V
FU
FF VF
V
F VF VF
VK
V
K VF
V
F VF VF
V F V
F
FV FV FV
F
U
F
VF
FV
F V
FV
FVF V
F V
FV
FV
F V
F V
F
V
F
V FU
FV
F
FV
FU
FV FV FV
F
F
FF
V
FV
FU
F VF VF
V
K
FV
F
F
FV
F
V
F
V
FU
F
V
FV
F
V
F
V
F
V
F
V
F
V
F
V
F
V
F
V
FV
F
V F
V
F
V
F
V
F
V
F
V
FV
F
V
EV
F
V
EV
EV
F
V
FV
FV
F
VF
V
F
V
F
V
F
V
F
V
F
V
F
V
F
V
F
V
F
V
F
V
F
V
F
F
V
F
V
F
V
F
U
F
V
FV
F
V
F
V
F
VFV
F
V
F
V
FV
F
V
F
V
FV
F
V
FV
F
V
KV
FV
F
V
F
V
F
V
F
V
FV
F
V
F
V
F
V
F
V
F
VF
V
F
V
F
VF
VF
V
F
V
F
V
F
V
F
V
F
V
F
V
F
V
FV
F
V
FV
F
V
F
V
F
V
FV
F
V
F
VF
V FV
FV
F
V
EV
F
V
FV
FV
FV
F
FV
F
V
F
V
FV
F
F
F
K
V
FV
F
V
FV
FV
F
F
V
F
V
F
V
F
V
K
V
F
V
F
V
F
V
FV
F
VF
VF
V
F
V
F
VF
VF
VFV
F
VFV FVF
VF
V
F
V
FV
FV FV
F
V
FV
F
VF
VF
VFVF
V
FV
FV
FV
FV
FV
KV
FV
K
V
FV
F
V
K
V
K
VF
V
K
V
FV
F
VF
V FV
F
VF
VF
V
F
V FVF
V
FV
FV
FV
FV
FV
FV
FV
F
FV
FV
FV
FV
FV
FV
F
V FV
F
VFVF V
FV
FV
F
VF
V
FV
FV
FV
FFV
FV
FV
FV
FV
FV
F
V
FVF V
FVFV
FV
FV
F V
F
VF
V
F
VF
V
F V
FV
FV
FU
FV
FV
FVF VF V
FV
FVF V
FV
FVF V
F V
FV
FV
FV
FV
FV
FVF
V
FV
FV
FU
F VF
VF
VF VF V
F
V
F
VF
V
F
F
F
FU
FV
F
V
F
F
FV
F
VF
V
FV
FV
FV
FV
FU
FV
F
FV
FV
FU
FV
FV
F V
FV
F
V
FV
F
V
FV
F
VF
VF
V
F
V
F
V
FV
FV
FV
FV
FV
FVFVF VF VF VF V
F
V
F
V
FV
F
VF
VF
VF
VF
V FV FV FVFV
F
F
V
F
VFV
FFV
FVF
VV
FV
FV
F
V
FV
FV
F V
F VF
FV
F V
FV
F
V FV
F
FV
FV
F
F VF VF V
FU
F
VFV
F
F
F
V
FVF
FV
F
FV
F
V
VVF
V
F
V
F
V
F
F
F
F
F
V
L
KF
F
V
F
VKU
FV
FV
F
V
FV
FV
F
V
F
V
F
V
F
V
F
V
F
V
FV
F
V
FV
F
V
F
V
FV
F
VF
VF
V
F
V
FUAUAU
F
F
F
F
F
F
F
F
FFU
F
F
V
F
F
V
F
F
V
L
FV
FV
FV
F
V
FV
AUFU
F
V
FV
F
V
FV
F
V
FV
FV F
VF
V
F
V
F
V
F
V
FA
F
V
F
V
FV
FV
FV
F
V
F
V F
V
F
V
F
V
F
V
FV
F
V
F
F
FV
F
V
FV
FV
F
F
V
KUKUKU
FV F
VKUFU
FV
F
V
F
V
F
V
FV
F
V
FV
F
V
F
V
FV
FV
F
V
FV
F
VF
V
FVF
V
FV
FV
FV
FU
FV
FV
FV
FV
FV
FV
KU
F
V
F
FV
F
VF
V
F
V
FVF
V
F
V
F
V
FV
FV
F
V
FVFV
FV
KU
F
VFV
FV
F
V
F
VF
VF
V
FV
FV
F
V
F
V
FV
F
V
F
V
FV
FV
FV F
V
FV F
VF
V
FV
FV
F
V F
VF
V
F
VF
V
F
VF
V F
V
F
V
F
V
F
F
F
FV
FV
F
V FV
F
FV
K V
FV
FV
FV
FV
F
V
FV
F
V
FV
FV
F
V F
V
FV
FV
FV
F V
FV
FV
F VF
V
FV
F
V
K
V
F
V
F
V
FV
F
V
FF
V
FV
F
FV
FV
F
V
FV
FVF
V
F
V
FU
FV
FVF
V F
V
F
V
F
VF
VF
V
FV
F
V
FV
FV
FV
FV
FU
F
V
F
V
F
FV
FU
FV
F
V
F
V
F
F
FU
FV
F
V
FV
F
FU
F
V
FV
FV
FV
FVF VF
V
FU
F
V
F
V
F
FU
FV
FUFU
FV
FF V
FV
FV
FV
FV
FV
FV
FV
F
FF
F
V
F
FV
FV
FV
FV
F
VF
V
F
F
V
F
FV
FV
F
VF
V
FV
FV
FV
F
V
FV
F
F
V
F
FV
F
VF
V
F
V
FV
F
V
F
FV
F
VF
V
F
F
FV
FV
FV
F
V
FV
FF
VF
FV
FV
F
V
FV
F
V
FV
FV
FVF
F
FV
F
V FV
F
V
F V
F
V
FV
FVF
V FV
FV
FV
FV
F
FV
F
FV
FV
FV
FV
F
V F
V
FV
F
FV
FV
FV
FVF
FF
FV
FV
FV
F
V
F
F
V
FV
FV
FV
F
F
V
FV
FV
F
V
F
V
FV
F
FV
F
F
FV
F
V FV
FV
F
V
FV
F
VF
V
FV
FV
FV
F
V
F
VF
V FV
F V
F
F
V
F
V
F VF
V
FV
FV
FV
F
V
F
VF
V
FV
K
FV
FV
FV F
F
V
FV
F
FV
FV
F
V
L
FV
F
V
FV
F
V
FVF
VF
V
F
FV
F
V
FVFV
F
VF
V
FV
FV
F
V
FV
F
V
F
V
F
V
FV
F
V
F
FF
VF
V
F
V
F
VFV
FV
FV
F
V
F
F
V
F
V FV
FV
FV
K
V
K
FA
FV
F
FVF
K
FV
K
F
KU
F
KUF
FU
FV
F
V
K
FV
F
FU
K
F
FV
F
V
F
V
F
FV
F
F
F
V
K
F
F
V
FF
V
FV
FVF
F
FV
F
F
FV
F
V
FV
FV
FV
FV
F
F
F
V
FV
FF
VF
V
FV
F
V
FV F
FV
F
F
F
FF
VF
V
F
F
FF
F
FV
F
V
F
F
F
VF
F
FU
F
F
V
F
F
F
FF
FF
VFF
F
F
F
V
F
V
F
VFV
F
F
F
V
FUFV
F
V
F
F
F
V
F
FV
F
F
V
FV
F
FV
F
F
F
VF
F
FV
F
FV
FU
F
F
FVF
V
FV
F
F
F
V
FU
KV
FU
F
F
F
V
F
V
F
V
F
V
F
K
FF
FV
FF
F
FF
F
V
FV
FUFU
F
V
FV
F
FF
V
F
V
FF
F
F
V
F
V
F
F
F
V
F
VF
V
F VF
V
F
F
V
FV FV
FV
F
V FV
F
V
FV
FV
FV
F
VF
V
F
F
V
F
V
K
FV
EV
VEUE
EEUE
EUEEEE
EEV
EV
F
C
K
F
E
VE
VLE
VE
VK
E
V
E
V
FUF
F
K
F
VKUFUF
V
KFF
V
F
FU
FUF
F
F
FFU
F
FUKU
KUF
FUF
FU
FUF
F
K
F
F
FFU
F
F
FU
FF
J
F
F
FU
F
F
F
F
F
KFU
F
FK
K
FU
F
F
F
F
F
KU
F
F
F
F
F
L
F
FL
F
V
F
V
FF
F
K
F
F
V
FU
F
F
FV
LF
F V
F
FU
F
V
F
F
F
FU
FV
F
F
F
FU
F
F
FUF
KU
F
V
F
FV
FUFA
F
LU
F V
F
VKULU
FU
FFU
FU
K
FU
FEU
F
FU
FU
F
F
F
K
FU
F
F
F
V
FU
FU
FAKFA
FU
F
F
F
FA
KU
F
F
K
F
FU
F V
FU
F
V
F
FU
FU
F
F
F
FUAU
F
FU
F
FF
F
F
F
FV
FU
F
F
F
V
F
FU
F
F
FU
F
F
AUFU
L
F
F
F
FU
F UF
F
FU
K
FF
F
FU
F
FK
F
V
FU
F
F
K
F
F
FUAUAU
F
F
F
F
V
FV
FU
FF
V
F
V
F
KU
L
FV
FV
F
F
V
F
VF
VF
V
F
V F
V
K
F
VF
V
FV
FV
FK
FVKV
FUFU
FFVF
VF
V
KFU
KA
FUFF
VFF
FU
FU
FU
FFAFF
V
F
F
VFF
V
F
V
E
VF
F
F
V
F
V
FV
F
V
FU
FVL
F
V
F
KFV
F
F
VKF
V
FV
F
F
VF
VF
VF
V
F V
FU
F
V
F
V
F
V
A
FV
F
V
F
V
F
F
FU
F
F
V
F
FF
V
F
V
F
FV
F
V
FV
F
K
FUFU
LF
FV
FV
FU
F
V
FV
F
F
FV
F
FU
F
V
F
F
E
E
EU
I
JU
I
IV
FAA
L
FUFV
K
KFVKF
VF
FUFU
L
L
F
F
K
F
FK
FFFUF
KUAUJEEEE
UEVJ
L
EEUJEEDEU
F
L
FA
F
F
FFFF
JFU
K
FUFU
F
F
F
F
FUFU
FL
K
F
FU
LF
F
I
LU
EF
KU
F
K
F
FUF
F
E
K
F
F
FE
F V
L
KKF
F
E
FU
L
KU
KU
FFF
K
F
L
FA
I
KF
EEIU
FF
FU
F
F
FA
FU
K
F
F
FV
F
F
F
FVF
AF
F
FA
FF
VAFFA
F
V
K
FU
F
F
FF
F
V
K
K
F
FV F
V
F
FFV
F
FU AU AUFU
F
V
FU
F
FFU
F
AUFUAUFU
F
FU
F
F
AF
F
F
FUFUFUAUAU
FU
FUAU
F
VF
V
F
V FU
FF
V F
K
F
FU
F
F
KF
F
FU
F
F
F
F
F
FUF
F
F
F
F
F
FUF
KU
FU
FUFUFU
K
F
F
KUAU
FU
FU
FU
FF
FU
F
F
FUAUFU
FU
FU
FUAUFAFA
FU
KF
E
V
F
F
F
VF
VK
FU
FVF
FU
I
F
F
L
KFALFF
LF
F
FVFUFUKU
FUFV
FVFFUAU
FF
V
FAKK
FF
K
KAFF
FV
KF
K
FK
K
F
J
FL
FKDF
K
L
KK
J
KL
KL
KULU
LKK
KUKU
KKL
F
EUEEV
EV
EV
EV
EVEVEV
F
E
EUEU
EUEEUEU
EUE
EU
E V
EUE
EUEU
EV
E V
E V
E VE VEUJUDU
E VE V
F
F
F
F
K
F
FU
F
F
FU
F
KU
F
F
F
F
F
E
FU
K
FU
F
F
F
FFU
FF
FU
F
F
F
F
F
F
FU
F
F
F
L
FU
F
K
FU
FU
F
F
F
L
L
K
L
FFU
FU
K
F
FUFU
FF
FU
F
FF
F
FU
F
FU
F
LFF
FU
FU
F
EF
FUF
F
FUE
F
F
F
EV EV
FF
FUAU
FU
J
FUF
F
F
F
E
FUKUFU
F
FF
E
V
FU
F
IE
F
E
E
FFF
I
F
K
F
EU
FFFUAUIE
FEU
FU
FFF
F
E
F
EF
FU
FU
KEU
F
LFUKU
KU
E
IUFUKU
E
EU
I
I
S
FE
E
E
V
EUJ
ES
E
SEFU
E
EU
SEV
FU
S
EU
EV
E
VS
E U
EU
E
S
EJEUIU
EU
E
VEE
E
I
E
EV
JS
E
E
E
E
E
E
E
E
EU
E
SEE
E
EA
S
E
S
F
SE
E
E
SV
E
EEES
E
EEE
EE
VE
E
S
E
V
ES
V
EU
KUS
EEEUSEE
VEE
V EEE
EJU
F
KF
FE
EAEE
F
F
EV
LU
FEUEE
V
E
V
E
V
F
L
GUGU
EU
K
F
KK
L
L
K
FU
FL
K
F
JLKF
L
FFFFA
AF
F
FFUFU
EV
EV
E
V
VV EE
FFL
L
KK
FUKUE
V
K
KL
KK
L
F
LLKAL
FKFF
F
KFFD
LEV
KU
FKL
F
FU
FFU
FF
F
FF
FU
F
FF
F
F
KFFU
FFU
F
EJ
FAAFU
K
EJ
L
L
FU
FUE
IU
FUFU
F
V
FV
FU
F
FU
F
V
FU
FU
KU
FUFU
FU
F
F
F
V
FV FU
F
FU
FU
FV FU
FU
FU
F
FU
F
F
F
F
F
F
FU
FUFU
FU
K
FUFU
F
FUKU
FU
FU
FU
F
F
F
VFF
F
FU
FU
FKUFU
K
FU
FU
FFF
K
F
FF
FUFFUF
K
FU
FFFU
FC
F
F
KUFF
KVFV
K
FUF
K
KUFUFU
F
FKU
FU
FF
FF
F
KF
F
FV
F
F V
K
K
F
F
FUFF
FF
F
FFFF
F
FU
FFF
FUFUF
FU
F
FUFU
K
FFFF
FF
FF
F
FFF
F
FUKF
FF
F
FUF
FUA
F
F
FFFU
FU
FU
F
F
FUF
FV
F
FKF
FU
FFFF
K
F
K
FUF
K
F
LK
F
E
II
L
I
L
I
EU
I
F
J
FU
F
FUFUAUAU
F
FKFUF
U
L
FUFF
FU
FU
FU
FUFU
F
F
FU
FU
F
F
FV
F
F
V
FV
FV
F
V
F
V
F
V
FV
F
V
FV
F
VF
F
F
V
F
FAF
FU
F
FV
K
F
KU
KUF
FU
FU
K
F
F
F
FU
K
F
K
FV
EU
EUEU
EU
K
LK
EUEE
EFEF
F
K
KEU
K
III
EU
EU
EVEU
EU
EV
J
J
IEE
E
E
EUEUJU
FUFFU
F
K
F
FU
FJ
F
LF
FJU
J
F
IE
J
F
F
V
FUF
F
LFFU
K
LK
FUFUF
F
L
FU
F
F
F U
F
F
F
F
FU
FUF
FU
F
F
FU
FU
F
FU
F
V
FF
F
FU
FU
F
F
F
F
F
FU
FU
FFF
FF
F
V
F
V
FV
F
V
F
FU
FF
FUFA
K
KU
F
V
FU
FFU
FA
F
V
F V
EUEUEU
FU
E
EA
KU
FA
E
F V
FV
I
FA
FA
FV
FA
F
F
FU
FUAU
K
F
FV
FU
F
VKU
FUKU
AU
F
AUFU
K
FU
K
F
V
FV
F
V
F
V
K
F
F
FFUAUAU
FU
FV
FV
F
V
FU
FV
F
V
F
F
F
V
FV
FV
FV F
V
F
V
F
FU
F
FV
F
V
FV
F
V
F
V
F
V
L
F
E
FV
EU
F
VF
V
FV
FV
F
FUF
V
F
VF
V
I
L
F
FU
F
V
F
FUFU
F
V
F
FAF
F
FU
JUIV
EVEU
FU
IAEEEUE
K
F
EU
EU
K
EU
FU
I
I
LE
FF
F
EVI
V
EV J
EV
JE
VE
VEIU
IUEV
EU
J
FU
F
EUF
IU
EE
E
EVE U
EEV
KUKU
FU
IV
IIU
F
V
F
V
F
V
F
V
E
V
E
VE
V
E
V
E
V
EV
J
E
V
E
V
EV
JE
V
E
V
E
V
IV
E
V
E
V
E
V
IV
I
V
E
V
E
V
IV
LLL
K
EVEU
E
F
FUKEEEE
JU
EUIU
F
KK
FFFU
FLE
FFUF
KUK
E
FU
EJ
EVEE
EEVE
E
VIII
EV
EE
V
E
V
EV
E
VIEE
V
FF
FUK
KU
F
F
F
KU
KV
F
F
FA
FUK
V
F
F
F
FA
FV
FU
F
V
FFF
FV
F
FVFU
FU
F
F
F
F
F
F
K
F
K
AKF
JJC
FA
F
F
KK
I
K
AF
KU
K
F
F
I
FU
F
EU
K
F
VA
KA
F
FAFU
K
E
F
F
F
EE
FV
F
V
F
V
A
F
FU AU AUAUFUAU
A
KU
F
V
AF
FUAUAU
E
K
FA
F
E
E
FF
F
LK
FK
JU
E
F
F
K
FU
F
FU
F
E
F
EE
F
E
F
FU
E
JE
L
KU
LK
L
KV
JV
IEUEV
IE
E
EE
E
V
E
V
E
VEV
EEEE
E
EUE
FL
JF
FFAL
F
K
SA
EJEJ
E
EI
AU
FUF
FU
EIA
EL
II
I
E
T81
T80
T79
T78
T77
T76
T76
T76
T76
T76
T76
T76
T76
T68
T67
T66
T65
T64
T63
T81
T80
T79
T78
T77
R13 R12 R11 R10 R9 R8 R7 R6 R5 R4 R3 R2 R1W6 R27 R26W5
R24W5R25R26R1W6R2R3R4R5R6R7R8R9R10R11R12R13R14R15R16R17R18R19R20
31 3636
31 3631 36
31 3631 3631 3631 3631 3631 3631 3631 3631 3631 3631 3636
16
31 36
1
36
16
31 36
16
31 36
16
31 36
16
31 36
16
31 36
16
31 36
16
31 36
16
31 36
16
31 36
16
31 36
16
31 36
16
31 36
16
31 36
1
36
16
31 36
1
36
16
31 36
16
31 36
16
31 36
16
31 36
16
31 36
16
31 36
16
31 36
16
31 36
16
31 36
16
31 36
16
31 36
16
31 36
16
31 36
1
36
16
31 36
1
36
16
31 36
16
31 36
16
31 36
16
31 36
16
31 36
16
31 36
16
31 36
16
31 36
16
31 36
16
31 36
16
31 36
16
31 36
16
31 36
1
36
6
31
16
31 36
1
36
16
31 36
16
31 36
16
31 36
16
31 36
16
31 36
16
31 36
16
31 36
16
31 36
16
31 36
16
31 36
16
31 36
16
31 36
16
31 36
1
36
6
31
16
31 36
1
36
16
31 36
16
31 36
16
31 36
16
31 36
16
31 36
16
31 36
16
31 36
16
31 36
16
31 36
16
31 36
16
31 36
16
31 36
16
31 36
1
36
6
31
16
31 36
1
36
16
31 36
16
31 36
16
31 36
16
31 36
16
31 36
16
31 36
16
31 36
16
31 36
16
31 36
16
31 36
16
31 36
16
31 36
16
31 36
1
36
6
31
16
31 36
1
36
16
31 36
16
31 36
16
31 36
16
31 36
16
31 36
16
31 36
16
31 36
16
31 36
16
31 36
16
31 36
16
31 36
16
31 36
16
31 36
1
36
6
31
16
3136
16
31 36
16
31 36
16
31 36
16
31 36
16
31 36
16
31 36
16
31 36
16
31 36
16
31 36
16
31 36
16
31 36
16
31 36
16
31 36
6
31
16
3136
16
31 36
16
31 36
16
31 36
16
31 36
16
31 36
16
31 36
16
31 36
16
31 36
16
31 36
16
31 36
16
31 36
16
31 36
16
31 36
6
31
16
3136
16
31 36
16
31 36
16
31 36
16
31 36
16
31 36
16
31 36
16
31 36
16
31 36
16
31 36
16
31 36
16
31 36
16
31 36
16
31 36
6
31
16
31 36
16
31 36
16
31 36
16
31 36
16
31 36
16
31 36
16
31 36
16
31 36
16
31 36
16
31 36
16
31 36
16
31 36
16
31 36
16
31 36
6
31
1
36
16
31 36
16
31 36
16
31 36
16
31 36
16
31 36
16
31 36
16
31 36
16
31 36
16
31 36
16
31 36
16
31 36
16
31 36
1
36
16
31 36
1
36
16
31 36
16
31 36
16
31 36
16
31 36
16
31 36
16
31 36
16
31 36
16
31 36
16
31 36
16
31 36
16
31 36
16
31 36
1
36
16
31 36
1
36
16
31 36
16
31 36
16
31 36
16
31 36
16
31 36
16
31 36
16
31 36
16
31 36
16
31 36
16
31 36
16
31 36
16
31 36
16
31 36
16
31 36
16
31 36
16
31 36
16
31 36
16
31 36
16
31 36
1
36
16
31 36
1
36
16
31 36
16
31 36
16
31 36
16
31 36
16
31 36
16
31 36
16
31 36
16
31 36
16
31 36
16
31 36
16
31 36
16
31 36
16
31 36
16
31 36
16
31 36
16
31 36
16
31 36
16
31 36
16
31 36
1
36
6
31
16
31 36
1
36
16
31 36
16
31 36
16
31 36
16
31 36
16
31 36
16
31 36
16
31 36
16
31 36
16
31 36
16
31 36
16
31 36
16
31 36
16
31 36
16
31 36
16
31 36
16
31 36
16
31 36
16
31 36
16
31 36
1
36
6
31
16
31 36
1
36
16
31 36
16
31 36
16
31 36
16
31 36
16
31 36
16
31 36
16
31 36
16
31 36
16
31 36
16
31 36
16
31 36
16
31 36
16
31 36
16
31 36
16
31 36
16
31 36
16
31 36
16
31 36
16
31 36
1
36
6
31
16
31 36
1
36
16
31 36
16
31 36
16
31 36
16
31 36
16
31 36
16
31 36
16
31 36
16
31 36
16
31 36
16
31 36
16
31 36
16
31 36
16
31 36
16
31 36
16
31 36
16
31 36
16
31 36
16
31 36
16
31 36
1
36
616161616161616161616161616161
L K J I L K J I
D C B A D C B A
E F G H E F G H
L K J I L K J I
D C B A D C B A
E F G H E F G H
L K J I L K J I
D C B A D C B A
E F G H E F G H
L K J I L K J I
D C B A D C B A
E F G H E F G H
L K J I L K J I
D C B A D C B A
E F G H E F G H
10 9
15 16
2 1
7 8
10 9
GUEVC
VCVG
F
VCVA VA V
V
CV
CVFV
AV
CU
CV
CV
CV
FV
FV
FV
CVF
V
CVV
CA
VC
V
VV
EV
EV
E
V
GV
GV
AVA
VA
A
U
A
A
CV
A
V
E
VE
C V
CV
AV
AV
C
V
CV
EV
AVAV
AVAVCV
AVGVEV
CV
AV
E
V
C
V
C
V
A
VF
V
CUFUAUAU
GCDFVFVAVAVAVCV
GFFV
CV
AV
FV
A
VFVFV
CV
AV
EVFV
FV
CV
AV
FUCUCUCU
AV
GCV
FV
AV
CV
CV
CV
GUAU
CV
A V
A V
C
CVGV
C
AA
FV
FV
FVFV
A
CV
CV
F VAVC
V
AV
FV
FV
CCK
C
F
V
AV
CU
C
GVCV
AV
FV
C
A
FV
A
C
CU
AU
C
FV
AV
C
CV
C
C V
CV
FVC
V
FV
FV
FV
CVC
V
FV
F
CVC
AUCVCV
F V
AV
AV
AV
AV
AV
FV
AVA
V
FV
C
AU
AV
AVAV
AVA
V
AV
FV
FVF
V
AVA
VF
V
CV
FV
FV
FV
AV
FV
AV
FVA
VA
VF
VF
V
FVF
V
FV
FVF
V
AVC
V
CV
FV F
VFVA
VA
VF
VF
VFVFV
FVAVA
V
FV
FVF
V
FV
FV
FVA
V
FV
AV
AV
C
A V
FVF V
FVF
VF
VF
VAV F
V
AV
A
V
AV
CV
AVA
VAVA V
KV
FV
AV
A V
CV
AV
C V
CVC
CC
V
C VC VC VC V
FV FVFVFVFV
AV
C
AV C
FV
FV
F V
A VA V
F VF VF V
FV
FVFV
AV
AV AV AVAV AV
FU
FV
A VA VA VA VA VF VF
V
F VF VF VK V
F VC V
CC
K VF V
F VF V
AV AV AV AVAV AVA
V AV
AV
AV
FV
FV
A
V
F V
A VA VA VA VA VA V
AV
FV
FV
F V
F VF
V
CV
A
FV
AV
AV
F VF VF V
GC
FV
AV
F
V
F
V
FV
AV
AV AV
AV
AV
AV
A VA V
FVF
VK
VA
V
FV
FV
AV
FV
F
V
FV
CV
AV AV
AVC
V
C
F
V
FV
A
V
FV
FV
FV
FV
FV
F
V
EV
AV
AV
A
V
AV
A
V
EVE
V
FV
FV
F
V
FV
F
V
AV
AV
A
V
AV
FV
AV
FV
AV
CC
V
AV
FV
FV
CV
AV
AV
AV
AV
AV
A
VAVA
V
FV
FV
FV
AV
FV
CV
FV
FV
FV
C
V
AV
AV
A
V
CVC
V
AVAV
A
V
AVA
V
FV
CV
FV
F
V
AV
A
V
FV
CV
AV
AV
AV
K V
FVF
V
AU
FV
FV
AV
AV
FV
FV
FV
AV
AV
AV
FV
FV
AV
FV
FVAV
AV
FV
FV
CV
FV
C
FV
AUA
VA
VA
VA
V
AV
AVA
V
FV
AV
AV
AV
AV
AV
AVA
V
FV
FV
AV
AV
FV
FV
CV
EV
CV
C
FV
AVA VA VA VA VA VA VA V
C
VAVA
VAV
F V
AVA
V
FV
AV
AV
K
V
CV
FV
CV
FV
C V
C
FV
AV
FV
KV
FV
AV
FV
FV
FVFVAV
AVA V
AV
AV
CV
FVFV
FV
FV
FVF VF V
FVFV FV FV FV
AV AV
AV
CUAV
F
V
A VA VA V
F
V
A
V
FV
AV
FV
CVF
V
CV
FV FV
KV CV
AV
FV
KV
FV
FV
KV
KV
FV
KV
FVF
VF
V FV
FV
CV CV
FV
CV FV FV
FV
AV AV AVA
VA
VA
VA
VA
VA
VA
VA
VA
V
FVAVA
VA
VA
V
AV
C
CV
AV
AV
AV AV
AVA V
AV
AVAV
AV AVA
VA
VA
VA
VA
VA
V
C
AV
AV
CV
CV
C V
AV AV
C VC VC VC
FV
F V
CV
A VC
VC
VC
VC
AV
FV
FV
FVF VF VF V
AV
AV
AV
AV
AV
AVA V
A V
F V
AV
AV
AV
AV
AV
FV
FV
FV
FV
CV
F V
F V
FV
FVF VF VF VF V
FVF VF VF VF V
CF VC V
AV
AV
AV
AVA VA V
CV
F V
FV
FVF V
AVA
VA
V
AV
F V
FV
C
CV
CV
AV AV AV AV AV AV AV AVA
VA
V
CV
CV
AV
AV
AV
AV
AV
A
VAV
A VA VVV
AV C
V AV
A VA
V AV
FV
FV
FV
FV
AV
AV
F VF VF VF
VC
V
CU
AV
FVF
VFV FV FV FV
AV
AV A
FV
A VA VFVFV
AV AV
CV FV
CA VFVA VV
FV
FV
FV
F VC
FV
F V
F VFVCV
F V
FVF
V F VF V
AV
AV
F VF V
A VA
VA
VA
VA
V
AVA
V CV
AV
FV
CVC V
FV
FV
CV CVC
V CV
AAAAAAAAAAAAA
AAAAAAA
VV
V
V
GUCUCC
AV
CV
CV
CV
GC
VA
V
A V
CV
A
V
AV
CFCV
GUFUAUAU
C
CFA
C
FV
AVF
V
A
A
AV
CVGV
CV
AV
CV
FVA
V
FV
CUFUAUCU
AV
FV
CV
C
V
FVFV
C
FVF
V
FVA
V
A
V AV
CVF
V
FV
AVA
VA
VA
V
AV
FVF
VF
VAVFV
A
VA
V
FV
AV
G
FVFV
FV
AV
A
V
A
V
CU
C
V
F
CUGUC
C
G
CU
GU
FVGVC
FVF
VCV
GCCFC
FC
CC V
AV
FV
AV
CV F
VF
V
FV
FV
FV
CV
FV
FVFV
CVF
VF
VF
V
FV FV
FV
F
CV
FV
FV FV
FV
FV
CV
FV
FV
FV
AV
FV
FV
FV
FV
FV
FV
FV
FV
FVF
VF
V FV
AV
AV
FV
FV
FV
FV
C
AVG
V
FV
FVC
VFV
FV
FV
CV
FV
FV
FV
FV
F VF
VF
V
FV
AV
FV
FV
FVF V
FV
FV
A V
FV
FV
FV
FV
FV
FV
FV
CV
CV
CV
CV
CV CV
FV
CVC
VC
V
FV
AV
FV
FV FV
AVA
V
FV
AV
FV
C
FVA
VF
V CV
FV
AV
AVA
VF
V
FV
FV
FV
FVA
V
FVF VF VFV
FVA
VF
V
AV
CV
FV
AV
AVAV
AV
FV FV
FV
FV
FV
F VF
V
FVF V
FV
FV
FV
AV
AV
FV
CV
F
V
CV
FV
FV
FVA
VA
V AV
FV
FV
AV
FV
AV
FV
AVF
V
AV
FVF
VF
V
AV
AV
FV
F VF VFVF
V
A V
AV
AV
AV
AV
AV
AV
FVC
V
A VA
VF
V
FV
F
V
FV
AV
AV
FV
FV
F
V
FVCC
V
C
V
CV
FVF
V
FV
FV
FV
FVF
V
C
FV
CV
FV
FV
FVF
VF
V
CV
AV
F V
C
FVFV
FVFV
FVA
VA
V
CU
AV
KV
FV
FV
C
FV
FVA V
C
V
CV
AV
C
VF VF
V
C
FV
AV AVA
V
FV FV
FVF
VF
V
FV
E
CCU
C
AUAAV
AV
AV
C
AVA
VA
VF VEV
VV CV CV
EVCV
G
IU
AV
EV
A
V
GU
EUEU
AVAVGVEVA V
C
CC
EUFUFU
CU
EVCUEV
GGV
AV
CVC
V
FV
C V
C
VA
VA
VA
VF
VA
VA
VCU
AV
CU
CV
AV
EU
CUIUEU
CE
F
V
AEU
A
EU
GC
FVF
V
AV
FV
FV
F
V
AV
FV
A
VCU
FVFVAV
FV
F VFVF
VC
VAG
FV
A VF V
FV
AV
AV
FVEU
EUEU
FVF
VF V
FV
C
V
FV
AVFV
AV
FV FV
FA
FV
FV
FV
AV
FV
FV
FV
FV
FVF
V
FV
FVF
V FV
FV
FV
C
FVF
V
FVF
V FV
CV
CVF
V
AV
FV
FV
GVF
V
EV
CV
FV
FV
AV
C
V
C
V
C
V
E
V
A
VC
V
FVE
V
FV
FV
A
V CV
E
V
FV
C
V
C
V
FVFV
C
V
FV
F
V
F V
G
FV
FVF
V
FV
EV
E
V
E
VA
V
C
V
FVFV
GV
C
V
FV
C
C
V
FV F
VF
VC
V
FV
FV
FV
FV
FV
C
CV
AVA
VF
VF
V
AV
FV
FV
FV
FVGV
CV
A
CV EV
GV
CV
C
A
GVEVEV
C
JU
CV
C
CV
GU
A
A
FVFV
GG
GVFVGG
I
FVGVFV
AVFV
FV
AVAV
EVEVE
V
EVEV
AV
AVEV
EV
AV
IV
EV
EVEV
AVIV
EVGVAV
CVCVGU
CU
DU
F
CU
GC
AVEVAVEVGV
EV
EV
EV
EV
EVEVEV
GU
C U
AAEU
G
F V
FV
FVFV
E
FV
G
FVFVFV
FV
FV
FVFV
FV
AV
A
V
A
V
A
V
EV
F
V
E
GUGU
CV
AV
FV
CU
FVF V
GU
GUCU
GVGVKV
GVJVAE
V
EVEVEVEVEV A
VGVG
GC VE V
E VE VE VE V
CV
G
VC
VEV EV AV
C VEV
CV
CVCKC
EVE
V
EV
EVAVEVCV
CV
CEV
EV
EVEV
EVEVE
AVS
VEVEV
EUEVE
V
AV
C
EVCVEVEV
EV
C
GVC
VG
CEU
C
CV
FUAUFU
FUAV
FUCUFU
FU
FUAUFUCU
AUFU
FVC
VEV AVE
VE
V
VVE
CV
G
AVEVCV
A
VAV F
V
FV FAU
A VCV
A
GU
AA
C V
C
CAV
CE
CV
AV
CU
AEEIUEUFCCE
FUCUCV
C
CFA
CUFUAUCU
AV
CU
CV
CV
CV
FV
FV
FV
CVF
V
CVV
VV
A
AV
FV
F
V
CUA
V
C
FV
C
AV
C
CV
C
C V
CV
FVC
V
FV
FV
FV
CVC
V
FV
F
CVC
AUCVCV
F V
AV
AV
AV
AV
AV
FV
AVA
V
FV
AV
AV
CVC
CC
V
CC
AV
AV
A
V
AV
F
V
F
V
FV
AV
AV AV
AV
AV
AV
FVF
VK
VA
V
FV
FV
AV
FV
F
V
FV
CV
AV AV
AVC
V
F
V
A
V
FV
FV
FV
FV
FV
F
V
AV
AV
A
V
AV
A
VFV
F
V
FV
F
V
AV
AV
A
V
FV
FV
AV
CC
V
FV
FV
AV
AV
AV
AV
AV
A
VAVA
V
FV
FV
FV
AV
FV
FV
FV
C
V
AV
A
V
CVC
V
AVAV
A
V
AVA
V
FV
FV
F
V
AV
A
V
FV
AV
AV
AV
FV
AV
AV
FV
AV
AV
FVAV
AV
FV
FV
CV
FV
AV
AVA
V
AV
AV
AV
AV
AV
AVA
V
AV
AV
C
C
VAVA
VAV
AVA
VA
VA
V
K
V
FV
AV
AV
AV
AV
F
V
F
V
A
V
C
VFVA
V
A
V AV
FV
FV
AVA
VA
VA
VAVFV
A
VA
V
AV
GF
VC
V
F
CU
AVA
VA
V
C
AV
FV CV
FV
AV
AVA
VF
VFVFV
AV
CVAV
AVAV
AV
FV FV
FV
FV
F VF
V
FVF V
FV
AV
F
VF
V
FV
FVA
VA
V AV
FV
FV
AV
FV
AV
FV
AVF
V
AV
FVF
VF
V
AV
AV
FV
FVF
V
A V
AV
AV
AV
AV
AV
AV
FVC
V
A VA
VF
V
FV
F
V
FV
AV
AV
FV
FV
F
V
FVCC
V
C
V
C
C
V
C
VF VF
VFV FVF
V
AV
CVC
V
FV C
VA
VA
VA
VF
VA
VA
VA
VA V
FV
GVF
VF
VA
V
C
V
C
V
C
V
E
V
A
VC
V
FVE
VF
V
A
V CV
E
V
C
V
C
V
FVFV
C
VF
VG
EV
E
V
E
VA
V
C
V
C
V
C
V
A
V
A
V
A
V
EV
F
V
CV
G
V
AV
A
VAV F
V
FV
AV
FV
CV
CV
CV
C
C
FV
AV
A
A
AV
CV
FVA
V
FV
AV
FV
CV
CV
FUCUCUCU
CV
AVC
V
CCK
C
A
CU
AVA
V CV AV
A VA
V AVA
V
AV
FVF
VA
VF
VA VA VF
V
CV FV
FVFV
F VC
FV
F V
FVCV
FVF
V F VF V
AVA
V CV
FV
CVC V
FV
FV
CV CVC
V CVVV
V
V
A
V
CV
FV
CGU
C
FV
E
A
C
CU
EVCUEV
GGVC V
CU
CU
CV
F
V
FV
CU
EUEUEU
FV
C
V
FAFV
CV EV
AV
E
EVEVEVEVEV A
V
GC VE V
E VE VE VE V
C V
A V
AV
FV
AV
CV F
VF
V
FV
FV
FV
CV
FV
FVFV
CVF
VF
VF
V
F
CV
FV FV
CV
FVA
VF
V
FV
FV
FV
FV
AV
AV
FV
FV
FV AVG
V
FVC
VFV
FV
FV
FV
FV
AVA V
FV
FV
FV
FV
FV
FV
FV
CV
CV
CV
CV
C
FVF
V
FVF
V FV
CV
CVF
V
AV
CV
AV
AVAV
AV
AV
GUEVC
VCV
CV
EV
CV
AV
E
V
C
V
C
V
A
VF
V
CV
AV
FV
AVC
V
CVGV
FV
FV
FVFV
CV
F V
C
AVGV
CVF
VAU
CVGVFVF
VFVF
V
C
AA
FV
C VC VC VC V
FV FVFVFV
FV
F V
A VA V
F VF VF V
FVFV
FVF V
FVF VK V
K VF V
F VF VFVFV
FV
F VF
V
GC
FV
AUA
VA
VA
VA
VF
VFVC
VC
VC VF
VF
VFVAV
AVA V
CV
FVFV
FV
FV
FVF VF V
FV
AV
CV
CV
KV
AV AVA
V
C
AV
FVF
VF
V
FVF
VF
V
AV
A
V
A
V
C U
C
GV
CCU
FVG
F
CEV
EV
EVEV
EVEVE
AVS
VEVEV
EUEVE
VE
VCVEVEV
EV
C
FV C
AV CAV AV AVAV AV
A VA VA VA VA V
F VF VF VC V
AV AV AV AVAV AVA
V AVFV
F V
A VA VA VA VA VA V
AV
F VC
V
A
FV
AV
AV
F VF VF VFV
A VA V
CF
VEV EVE
V FVA
VK V
AV
FV
EV
AVA VA VA VA VA VA VA V
C
KV
FV
FV
FVCUA
V
CVC
A VA VVV
FV
C
FV
CV
FV
FV
FVF
VF
V
CV
AV
F V
C
FVFV
FVFV
FVA
VA
VA
V
FV
FV
FV
FVA V
CV
AV
C
FV
FVF
VF
V
EV
VV CV CV
CV
AV
AVAV
AVA
V
AV
FV
FVF
V
AVA
VF
V
CV
FV
FV
FV
AV
FV
AV
FVA
VA
VF
VF
VF
VF
V
CV
FV F
VFVA
VA
VF
VF
VFVFV
FVAVA
V
FV
FVF
V
FV
FV
FVA
V
C
FVF V
FVF
VF
VF
VAV F
V
AV
A
V
AV
CV
AVA
VAVA V
AV
AVC
VC
VCVC
VF
VF
VF
V
FV
FV
AV
FV
FV
FV
C
FV
FV
FV
FV
CVC
VF VFVF
V
AV
AV
CAVAV
CVC
CVCC V
CV CV
FV
CVC
VC
V
FV
FV
FV FVF
V
FVF
V
FV
FVFVA
V
FVF VF VFV
AV
FV
FVF
V FV
FV
AV
FV
CVCVF VF V
CVG
F
VCVA VA V
V
AVAVCV
CUFUAUAU
GCDFVFVAVAVAVCV
GFFV
AV
FV
A
VFVFV
CV
EVFV
GCVAV
A V
A V
CF
FV
AV
FV
F
V
AV
A
V
FVFVAV
FV
F V
A VF V
AV
FV
F V
FVFV
CA
VC
V
A VKV
FV
AV
A V
CV
C V
A VA VA VFV
CVF
V
CV
FV FV
KV CV
FV
KV
FV
FV
KV
KV
FV
KV
FVF
VF
V FV
FV
CV CV
FV
CV FV FV
FV
AV AV AVA
VA
VA
VA
VA
VA
VA
VA
VA
V
FVAVA
VA
VA
VCV
AV
AV
AV AV AV
AV AVA
VA
VA
VA
VA
VA
V
AV
AV
CV
CV
C V
AV AV
C VC VC VCA VC
VC
VC
VC
AV
FV
FV
FVF VF VF V
AV
AV
AV
AV
AV
AVA V
A V
F V
AV
AV
AV
AV
AV
FV
FV
FV
FV
CV
F V
F V
FV
FVF VF VF VF V
FVF VF VF VF VF VC V
AV
AV
AV
AVA VA V
F V
FV
FVF V
AVA
VA
V
AV
F V
FV
CV
CV
AV AV AV AV AV AV AV AVA
VA
V
CV
CV
AV
AV
AV
AV
AV
A
VAV
FV
FV
FV
FV
AV
F VF VF VF
VC
V
CU
AV AVA
VA
VA VA
VA
VA
VA
VA
V
AAAAAAAAAAAAA
AAAAAAA
CVC
V
AV
GVC
V
CV
C
GCCFC
FC
FV FV
FV
FV
FV
FV FV
FV
FV
FVF
VF
VF
V FV
FV
FV
FV
FV
CVF V
FV
FV
FV
FV
FVF V
FV
FV
FVF
V
FV
FV
FV
FV
AV
FUFU
FV
FVFV
FVF
V
FV
FVF
V FV
FVFV
FV
F VF
VFV
FV
GV
FV
C
FV F
VF
V
FV
FV
FV
FV
FV
CV
AVA
VF
VF
V
AV
FV
FV
FV
GF
V
N
N
N Birchcliff Non-Confidential Land
Montney land sales from Jan 2008 >$1500 per ha
Birchcliff Prospects
LEGEND
BIR Doig/Doig Lic 2010 plus
Industry Montney/Doig Lic 2010 plus
Industry Montney/Doig Producers
6 miles
GORDONDALEPROSPECT
MONTNEY/DOIGDEEP BASIN EDGE
VALHALLA PROSPECT
ELMWORTHPROSPECT
GOLD CREEKPROSPECT BEZANSON
PROSPECT
SINCLAIRPROSPECT
POUCE COUPEDEVELOPMENT AREA
2P Reserves(MMboe)
35
25
1520
30
5 10
02008 2009 2010 2011 2012
PDP Reserves(MMboe)
50
40
30
20
10
02008 2009 2010 2011 2012
1P Reserves(MMboe)
200
150
100
50
02008 2009 2010 2011 2012
2P Reserves(MMboe)
250
300
200
150
100
50
02008 2009 2010 2011 2012
1P Reserves(MMboe)
20
15
10
5
02008 2009 2010 2011 2012
PDP Reserves(MMboe)
2
4
6
8
02008 2009 2010 2011 2012
2 0 1 2 A N N U A L r e p o r t | o p e r A t i o N s r e v i e w 15

B i r c h c l i f f e n e r g y l t d .
worSlEy light oil rESourcE plAy
The Worsley Light Oil Resource Play has demonstrated
consistent and prolific production performance. Successful
expansion of the pool, waterflood performance and the
application of horizontal drilling and multi-stage fracture
stimulation technology have all contributed to its continued
reserve growth, production growth and high netbacks. Our
assets in the Worsley Property (acquired in September 2007)
have provided $317.1 million in operating funds flow from
September 2007 to December 2012, $260.3 million of which
has been invested back into the property.
Our Worsley Light Oil Resource Play horizontal wells are drilled
to a measured depth of 2,500 to 3,500 metres and deliver
initial productivity rates of 60 to 400 boe per day.
Ch
arlie
Lak
e Fo
rmat
ion
POUCE COUPE
(after Stokes Campbell Geoconsulting Ltd., 1989)
PROGRESS SPIRIT RIVER MANIR RYCROFT WORSLEY KAKUT
Nordegg FmWorsley Unconformity
‘C’ MarkerA
B
C
Subcrop
Outlier
Outlier
Yellow Marker
Boundary Mbr
Boundary Unconformity
Nancy Mbr
Siphon Mbr
Coplin Unconformity
Braeburn Mbr
Baldonnel Fm
‘B’ Marker
Orange Marker
‘A’ Marker
Datum
Halfway Fm
Doig Fm
Montney Fm
Charlie Lake Schematic Stratigraphic Cross Section of the Peace River Arch
BC ALBERTA
6th MERIDIANWEST EAST
chArliE lAKE SchEmAtic StrAtigrAphic croSS SEction
O p e r a t i O n s r e v i e w | 2 0 1 2 a n n U a L r e p O r t16
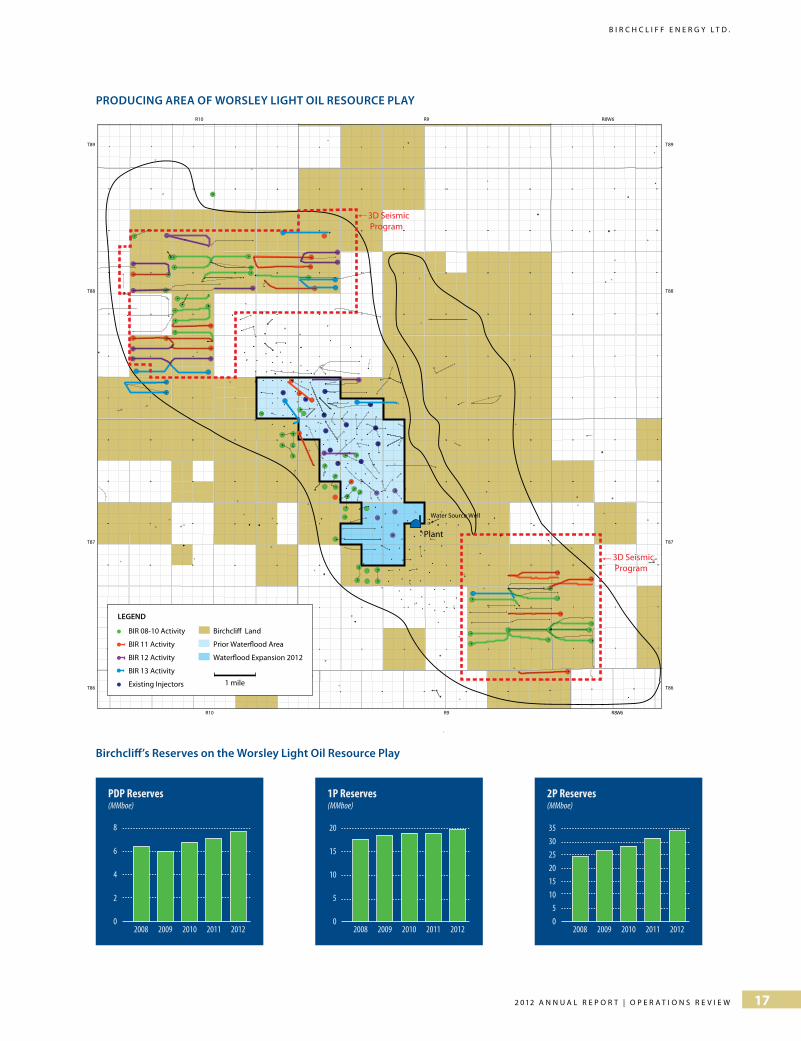
B i r c h c l i f f e n e r g y l t d .
31 32
31 32 33 34 3536
32 33 34 35 36
456
7 8 9
161718
19 20 21
282930
31 32 33
123456
7 8 9 10 11 12
131415161718
19 20 21 22 23 24
252627282930
31 32 33 34 35 36
12345
8 9 10 11 12
1314151617
20 21 22 23 24
2526272829
32 33 34 35 36
456
7 8 9
161718
19 20 21
282930
31 32 33
123456
7 8 9 10 11 12
131415161718
19 20 1 2 22 23 24
252627282930
31 32 33 34 5 3 36
12345
8 9 10 11 12
1314151617
20 21 22 23 24
2526272829
32 33 34 35 36
45612345612345
T86
T87
T88
T89
T86
T87
T88
T89
R8W6R9R10
R8W6R9R10
Plant
Water Source Well
W
3D Seismic Program
3D Seismic Program
I
G
U
C
U
E
V
D
V
E
V
D
V EV
EV
EV
E
V
D
V
DV
E
V
E
V
IC
G
IGV
EV
EV
EV
E
V
JV
G
JC
E V
EV
G
C
IEV
LGG
LC
E
F
G
I
E
V
EV
I
VE
V
G
E
U
G
G
I
I
I
U
E
E
E
E
CC
D
C
U
C
U
K
U
GK
E
IK
G
G
E
E
E
C UC U
EU
I
EU
LD
E
G
E
E
E
E
E
E
U
E
JC
EU
C
I
E
EU
E
U
EU
E
E
E
E
I
E
E
E
E
U
E
U
E
E
E
E
U
C
U
C
E
S
S
C
SA
E
U
E
E
U
E U
E
E
U
C
U
E
U
C
U
E
EV
E
EU
I
U
E
E
EC
E U
EU
GU EV
E
U
S
U
I
S
U
E
U
E
U
S
E
U
S
V
E
U
E
V
E
US
AE
EV
EV
I
D
V
E
U
EV
I
E
U
I
U
E
U
E
U
EU
E
U
E
U
E
U
EV
E
E
E
S
G
S
E
S
U
E
E
U
EV
E
V
E
U
E
U
EV
E
I
U
E
U
E
U
E
LUMU
E
U
E
V
CC
E
E
V
JU
EU
E
E
E
U
S
U
E
U
E
U
E
U
I
U
E
V
I
E
U
E
E
U
G
E
E
EU
G
V
E U
EU
E
U
IU
EU
E
U
E
U
D
V
S
G
V
I
V E
U
D
S
C
V
I
V
K
E
U
E
U
EC
S
E
U
I
S
LDK
I
E
V
J
E
G
E
E
E
E
E
G
U
G
U
G
E
D
V
E
D
V
LLCCFAFC
E
FK
E
V
G
E
E
V
G
FA
IE
S
U
C
U
LLG
SC
E
C
E
EU
E
E
V
E
E
G
U
E
U
EC
E
E
U
E
II
G
E
CI
S
E
E
U
EU
G
E
E
E
IU
G
I
IU
LKE
G
KCE
G
G
G
L
LGGI
K
G
L
CG
GU
G
V
J
L
F
UFU AU
F
F
GGG
L
G
KU
CKCF
J
G
G
KFG
D
V
E
V
LG
I U
G
G
GG
G
E
U
GGLL
GG
G
G
G
V
C
V
G
U
I
U
C
U
G
U
G VC V
C
G
U
E
U
C
U
G
C
GG
E
V
E
V
E
V
E
EV
E
V
AV
G
V
E
CCE
I
G
EU
E
V
E
U
EV
I
V
E
V
E
V
E
S
II
E
E
E
E
K
E
E
E
E
FC
S U
II
J
U
E
U
E
E
C
U
F
U
E
E
II
E
E
U
E
C
U
E
E
U
E
U
IE
I
EE
E
E
V
EV
E
V
G
E
V
G
U
E
E
V
SS
E
E
D
V
E
V
E
U
G
V
E
U
S
EC
D
V
D
E
V
GC
E
V
EV
E
V
E
CCE
I UIU
G
I
E
U
A
U
E
V
E
V
E
V
E
V
I
V
D
V
I
U
C
U
C
U
G
E
V
GE
A
V
C
V
A
V
E
V
E
V
EV
I
G
C
U
E
V
EV
E
V
E
V
E V
E
V
E
V
E V
E
V
C
U
CLL
V
V
Producing Area of Worsley Light Oil Resource Play
Birchcliff Land
Prior Waterflood Area
Waterflood Expansion 2012
BIR 08-10 Activity
BIR 11 Activity
BIR 12 Activity
BIR 13 Activity
Existing Injectors
LEGEND
1 mile
producing ArEA of worSlEy light oil rESourcE plAy
2P Reserves(MMboe)
35
25
1520
30
5 10
02008 2009 2010 2011 2012
PDP Reserves(MMboe)
50
40
30
20
10
02008 2009 2010 2011 2012
1P Reserves(MMboe)
200
150
100
50
02008 2009 2010 2011 2012
2P Reserves(MMboe)
250
300
200
150
100
50
02008 2009 2010 2011 2012
1P Reserves(MMboe)
20
15
10
5
02008 2009 2010 2011 2012
PDP Reserves(MMboe)
2
4
6
8
02008 2009 2010 2011 2012
Birchcliff’s reserves on the worsley light oil resource play
2 0 1 2 A N N U A L r e p o r t | o p e r A t i o N s r e v i e w 17
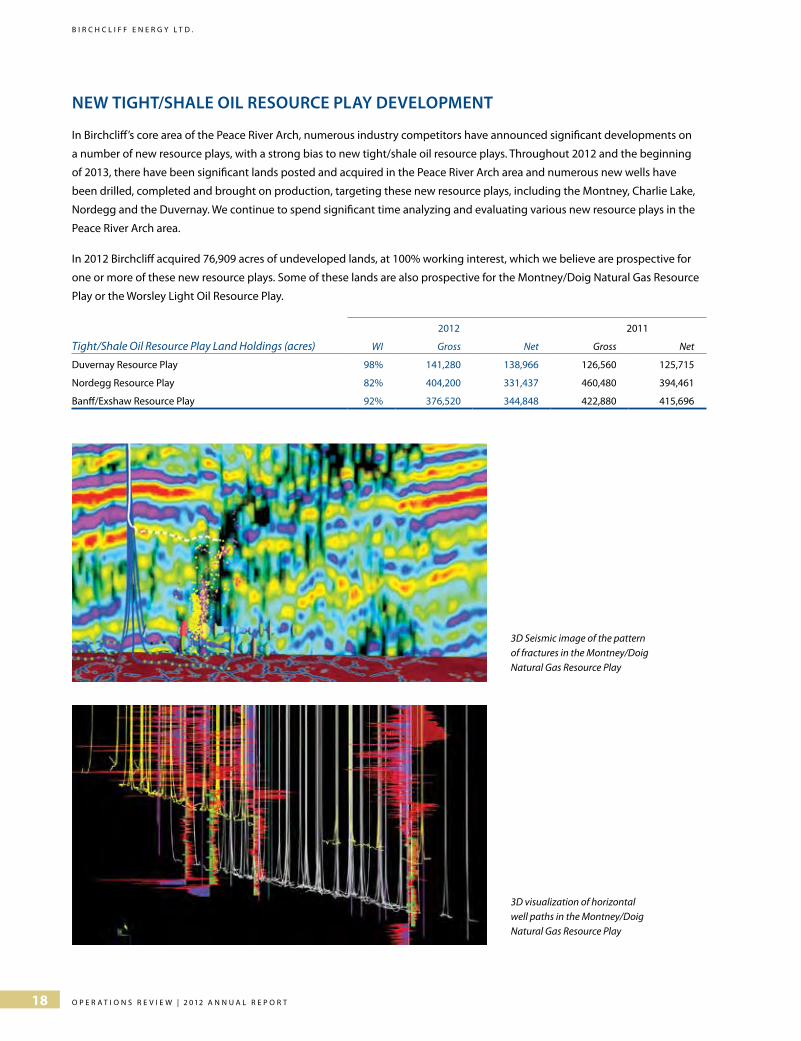
B i r c h c l i f f e n e r g y l t d .
nEw tight/ShAlE oil rESourcE plAy dEvElopmEnt
In Birchcliff’s core area of the Peace River Arch, numerous industry competitors have announced significant developments on
a number of new resource plays, with a strong bias to new tight/shale oil resource plays. Throughout 2012 and the beginning
of 2013, there have been significant lands posted and acquired in the Peace River Arch area and numerous new wells have
been drilled, completed and brought on production, targeting these new resource plays, including the Montney, Charlie Lake,
Nordegg and the Duvernay. We continue to spend significant time analyzing and evaluating various new resource plays in the
Peace River Arch area.
In 2012 Birchcliff acquired 76,909 acres of undeveloped lands, at 100% working interest, which we believe are prospective for
one or more of these new resource plays. Some of these lands are also prospective for the Montney/Doig Natural Gas Resource
Play or the Worsley Light Oil Resource Play.
2012 2011
Tight/Shale Oil Resource Play Land Holdings (acres) WI Gross Net Gross Net
Duvernay Resource Play 98% 141,280 138,966 126,560 125,715
Nordegg Resource Play 82% 404,200 331,437 460,480 394,461
Banff/Exshaw Resource Play 92% 376,520 344,848 422,880 415,696
3D Seismic image of the pattern of fractures in the Montney/Doig Natural Gas Resource Play
3D visualization of horizontal well paths in the Montney/Doig Natural Gas Resource Play
O p e r a t i O n s r e v i e w | 2 0 1 2 a n n U a L r e p O r t18
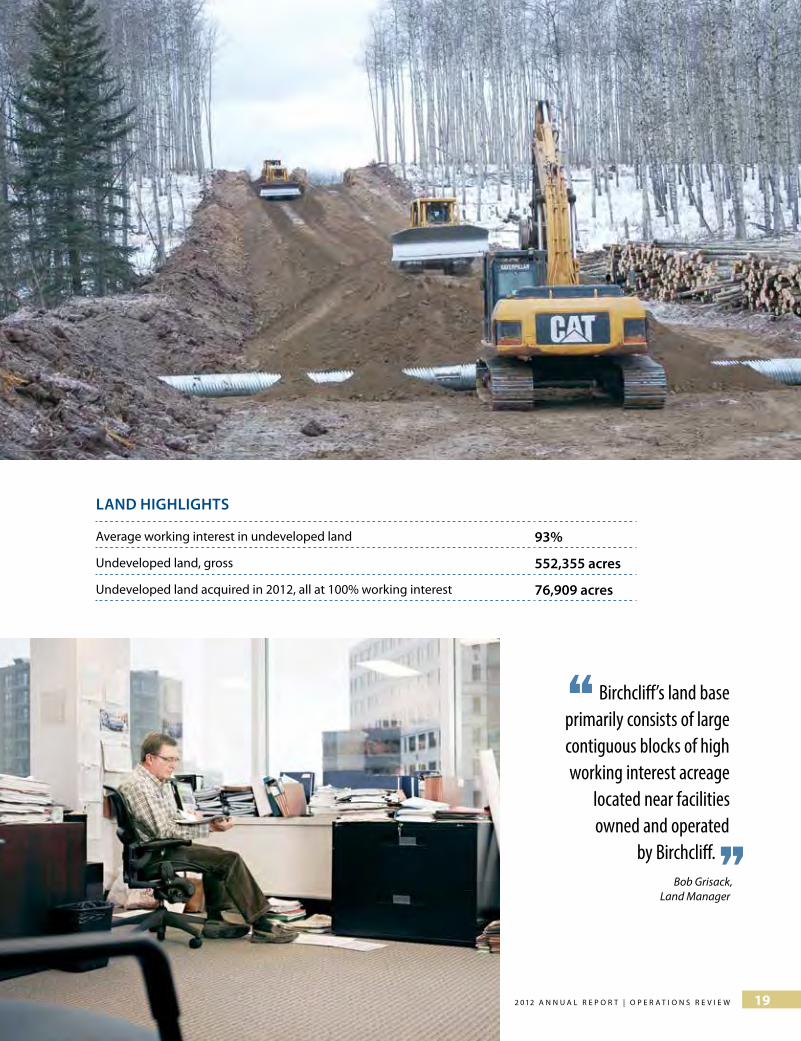
B i r c h c l i f f e n e r g y l t d .
lAnd highlightS
Average working interest in undeveloped land 93%
Undeveloped land, gross 552,355 acres
Undeveloped land acquired in 2012, all at 100% working interest 76,909 acres
Birchcliff’s land base primarily consists of large contiguous blocks of high working interest acreage
located near facilities owned and operated
by Birchcliff. ”Bob Grisack, Land Manager
“
2 0 1 2 A N N U A L r e p o r t | o p e r A t i o N s r e v i e w 19
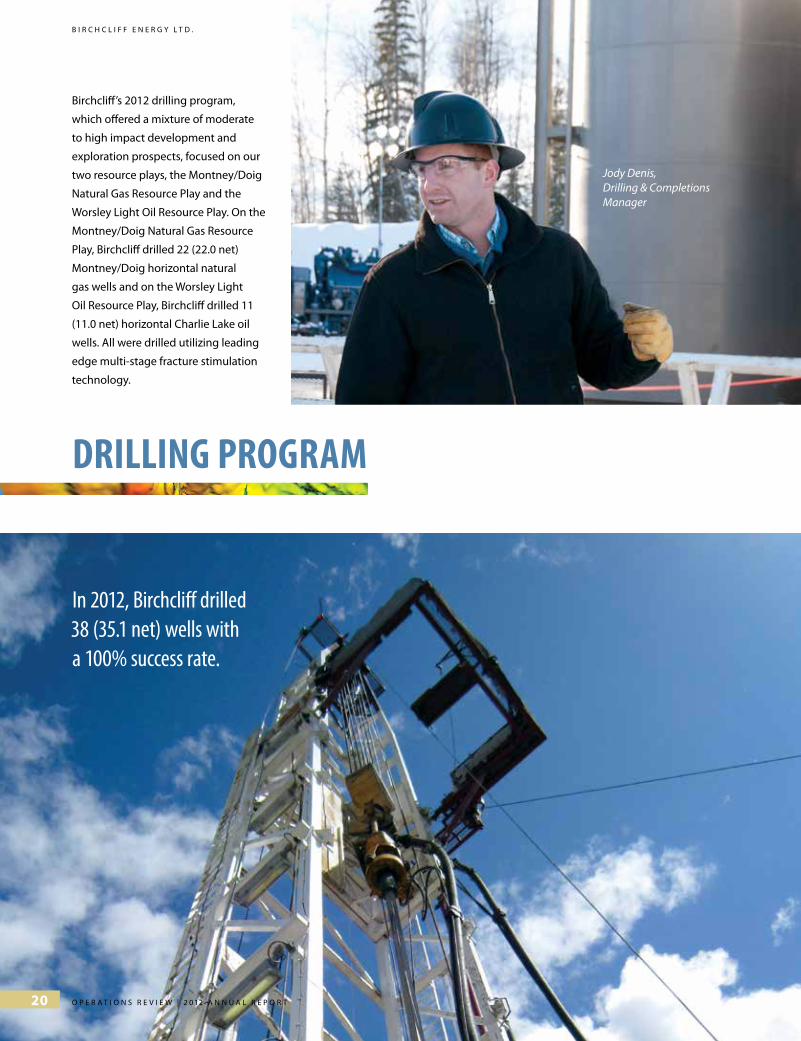
B i r c h c l i f f e n e r g y l t d .
Birchcliff’s 2012 drilling program,
which offered a mixture of moderate
to high impact development and
exploration prospects, focused on our
two resource plays, the Montney/Doig
Natural Gas Resource Play and the
Worsley Light Oil Resource Play. On the
Montney/Doig Natural Gas Resource
Play, Birchcliff drilled 22 (22.0 net)
Montney/Doig horizontal natural
gas wells and on the Worsley Light
Oil Resource Play, Birchcliff drilled 11
(11.0 net) horizontal Charlie Lake oil
wells. All were drilled utilizing leading
edge multi-stage fracture stimulation
technology.
drilling progrAM
Jody Denis, Drilling & Completions Manager
In 2012, Birchcliff drilled 38 (35.1 net) wells with a 100% success rate.
O p e r a t i O n s r e v i e w | 2 0 1 2 a n n U a L r e p O r t20
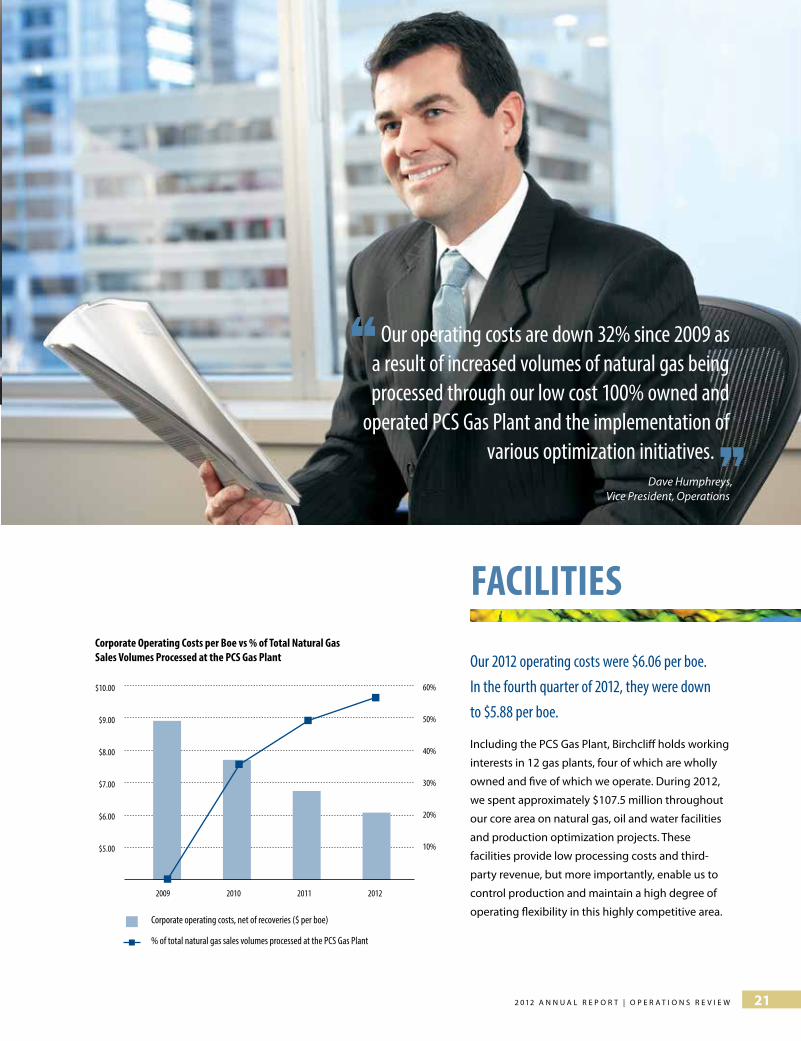
B i r c h c l i f f e n e r g y l t d .
fAcilities
Our 2012 operating costs were $6.06 per boe. In the fourth quarter of 2012, they were down to $5.88 per boe.
Including the PCS Gas Plant, Birchcliff holds working
interests in 12 gas plants, four of which are wholly
owned and five of which we operate. During 2012,
we spent approximately $107.5 million throughout
our core area on natural gas, oil and water facilities
and production optimization projects. These
facilities provide low processing costs and third-
party revenue, but more importantly, enable us to
control production and maintain a high degree of
operating flexibility in this highly competitive area.
“ Our operating costs are down 32% since 2009 as a result of increased volumes of natural gas being processed through our low cost 100% owned and
operated PCS Gas Plant and the implementation of various optimization initiatives. ”Dave Humphreys,
Vice President, Operations
Corporate operating costs, net of recoveries ($ per boe)
% of total natural gas sales volumes processed at the PCS Gas Plant
Corporate Operating Costs per Boe vs % of Total Natural Gas Sales Volumes Processed at the PCS Gas Plant
2009 2010 2011 2012
60%
50%
40%
30%
20%
10%
$10.00
$9.00
$8.00
$7.00
$6.00
$5.00
2 0 1 2 A N N U A L r e p o r t | o p e r A t i o N s r e v i e w 21
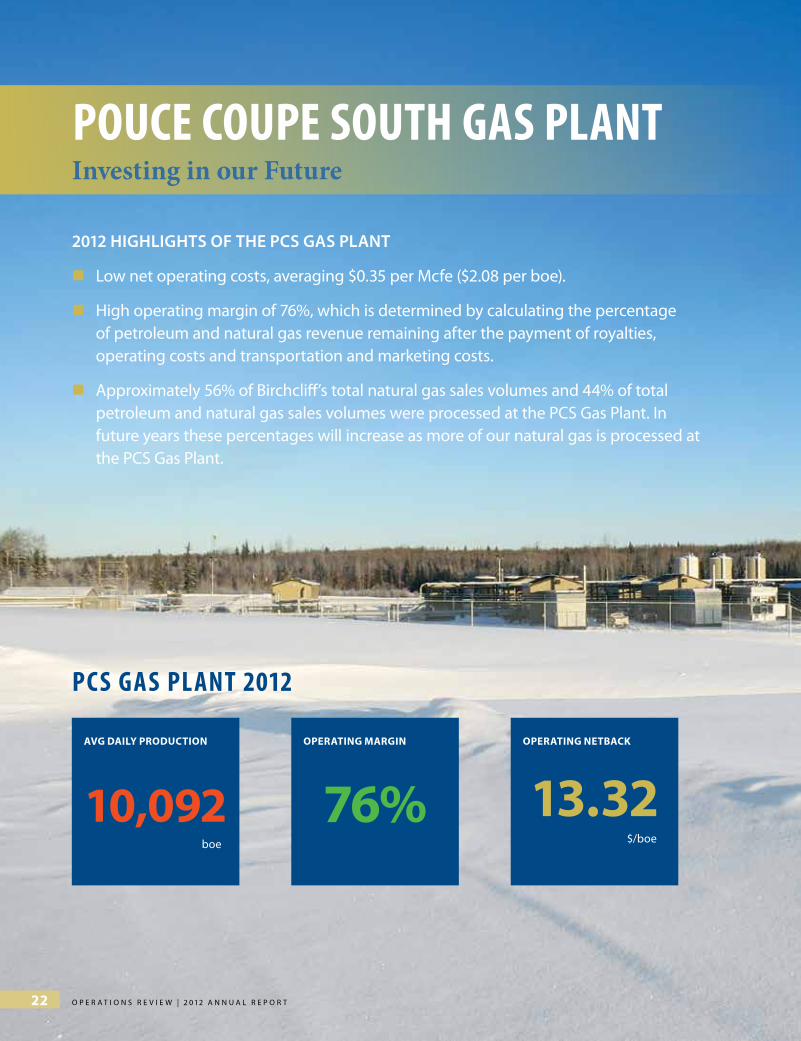
B i r c h c l i f f e n e r g y l t d .
Avg DAily ProDuction
10,092boe
oPerAting MArgin
76%oPerAting netbAck
13.32$/boe
2012 highlightS of thE pcS gAS plAnt
Low net operating costs, averaging $0.35 per Mcfe ($2.08 per boe).
high operating margin of 76%, which is determined by calculating the percentage of petroleum and natural gas revenue remaining after the payment of royalties, operating costs and transportation and marketing costs.
Approximately 56% of Birchcliff’s total natural gas sales volumes and 44% of total petroleum and natural gas sales volumes were processed at the PCS Gas Plant. In future years these percentages will increase as more of our natural gas is processed at the PCS Gas Plant.
pouce coupe south gAs plAntInvesting in our Future
pcs gAs plAnt 2012
O p e r a t i O n s r e v i e w | 2 0 1 2 a n n U a L r e p O r t22

B i r c h c l i f f e n e r g y l t d .
Birchcliff’s 100% owned PCS Gas Plant
is located in the heart of our Montney/
Doig Natural Gas Resource Play. The
PCS Gas Plant is licensed to process up
to 150 MMcf per day of natural gas. The
strategically situated site for the PCS
Gas Plant enables Birchcliff to control
and operate all essential infrastructure
– from wellhead to sales point.
Construction of the PCS Gas Plant was
divided into three phases: Phase I,
licensed to process 30 MMcf per day,
commenced operation in March 2010;
Phase II, which brought the licensed
processing capability to 60 MMcf
per day, commenced operation in
November 2010; and Phase III, which
brought the total licensed processing
capacity to 150 MMcf per day, com-
menced operation in October 2012.
The PCS Gas Plant is a state-of-the-
art facility and meets or exceeds
all ERCB and Alberta Environment
requirements. The facility employs
energy efficient equipment to optimize
performance and keep operating
costs low. The PCS Gas Plant uses
an amine system to remove sulphur
content, and refrigeration to meet dew
point specification. The acid gas wells
located at and near the site of the PCS
Gas Plant are in a high quality reservoir
for injection.
The low operating costs of the PCS
Gas Plant and related infrastructure
gives Birchcliff a strong competitive
advantage over others paying for third
party natural gas processing.
The PCS Gas Plant is a key component
in positioning Birchcliff as a low-cost
finder and producer of natural gas
on the Montney/Doig Natural Gas
Resource Play.
In 2012, Birchcliff received premium pricing of $2.91 per Mcfe, due to the heat content of our natural gas sales and the value of recovered condensate. During the same period, AECO natural gas spot price averaged $2.39 per Mcf.
The estimated operating netback for Birchcliff’s natural gas production flowing to the PCS Gas Plant was $2.22 per Mcfe or $13.32 per boe in 2012. The strong netback is a result of the low cost structure of the PCS Gas Plant and the premium price received for its natural gas and condensate.
2 0 1 2 A N N U A L r e p o r t | o p e r A t i o N s r e v i e w 23

B i r c h c l i f f e n e r g y l t d .
Looking out for our Team and the Community
responsibility
hEAlth, SAfEty & EnvironmEnt
In all of our operations, we are committed to the health and safety of our
employees, the public at large and the environment. We strive to minimize
the environmental impact of our operations and to meet or exceed industry
best practices and government standards applicable to our business. We have
implemented rigorous safety policies, procedures and standards and strive to
continually improve our employee training.
Fostering a relationship with the community is as integral to the success of our
projects as obtaining the required regulatory approvals. At Birchcliff, we believe
cooperative, sincere and responsive consultation efforts with residents in the areas
in which we operate creates a solid foundation for our business. Birchcliff has an
experienced team working with local residents to learn their values and priorities
and to resolve any issues or concerns that arise in the course of our field operations.
Through investments in state-of-the-art equipment and technology, we have
taken an innovative approach to reducing our environmental impact. We are
continuously evaluating new technology and techniques across our operations to
help improve efficiency and reduce our environmental footprint.
O p e r a t i O n s r e v i e w | 2 0 1 2 a n n U a L r e p O r t24

B i r c h c l i f f e n e r g y l t d .
community Support
Birchcliff recognizes the role that communities play in our company’s success and looks for opportunities
to “give back.” We have been a staunch supporter of the community and the educational initiatives of the
First Nations who live in areas in which we operate. Every year, we participate in a number of community
support endeavours in the areas surrounding our field operations and in Calgary.
In 2012 we contributed to a number of local community initiatives that elevate and enhance quality of life
at the local level – including minor hockey, amateur sports, agricultural societies and fire departments.
STARS Air Ambulance is an important partner in trauma care for the Grande Prairie region of Alberta. In
2012, our annual golf tournament and auction raised $140,000 towards STARS Air Ambulance - the largest
single fund raising event ever, in terms of money raised, in the Grand Prairie area. We support the United
Way and make a direct annual contribution to home Front Calgary, a community-justice response team
dedicated to helping families experiencing domestic violence. During the holiday season, our employees
“adopt” a number of families in need and donate gifts, food and decorations to help make the holidays
special.
Through these various activities and numerous others, Birchcliff creates and maintains long-term, positive
partnerships and relationships, while promoting employee engagement in the communities where we
live and work.
2 0 1 2 A N N U A L r e p o r t | o p e r A t i o N s r e v i e w 25

B i r c h c l i f f e n e r g y l t d .
well locAted
Summit Lake
BirchcliffPouce Coupe South
Gas Plant
LNG Terminals Montney FairwayPrince George
Vanderhoof
Groundbirch Spirit River
Sumas
SpectraT-SouthMainline
To PacificNorthwest
SpectraT-NorthMainline
Station 2
Aitken Creek
Fort St. John
BC AB
Vancouver
Kitimat
Prince RupertGrande Prairie
Fox Creek
Dawson Creek
Source: US National Park Service
Existing Pipelines
TCPL Groundbirch
Spectra
Pacific Northern Gas
Malaysia
7,500 miles
5,100 miles
4,600 miles
4,300 miles
Birchcliff Non-Confidential Land
Proposed PipelinesPrince Rupert Gas Transmission Project
BG Group and Spectra Energy Pipeline Project
Coastal GasLink Pipeline Project
Northern Gateway Project
Pacific Trails Pipeline Project
Birchcliff’s assets are well located to supply gas to LNG export projects. A number of liquefied natural gas
(“lng”) export projects have been announced by various
parties that envisage the pipelining of natural gas from
northwest Alberta and northeast British Columbia to Canada’s
west coast, where it will be liquefied and exported. Most of
these projects contemplate commencement of operations in
the next four to five years.
Birchcliff’s Montney/Doig natural gas production, PCS Gas
Plant and large undeveloped land base are ideally located
to access both existing and proposed pipelines that can
transport natural gas to the proposed LNG projects.
Birchcliff expects to participate as a supplier of natural gas
to one or more of these proposed projects.
Birchcliff is one of the founding members of the BC LNG
Cooperative that is currently building a relatively small
first phase of a LNG facility at Kitimat, British Columbia.
The BC LNG Cooperative is planning to commence
operations in 2015 and expects to liquefy a feed-stream
of approximately 90 MMcf per day of natural gas. Birchcliff
expects to bid to supply gas to the second phase of this
project when it moves forward.
26
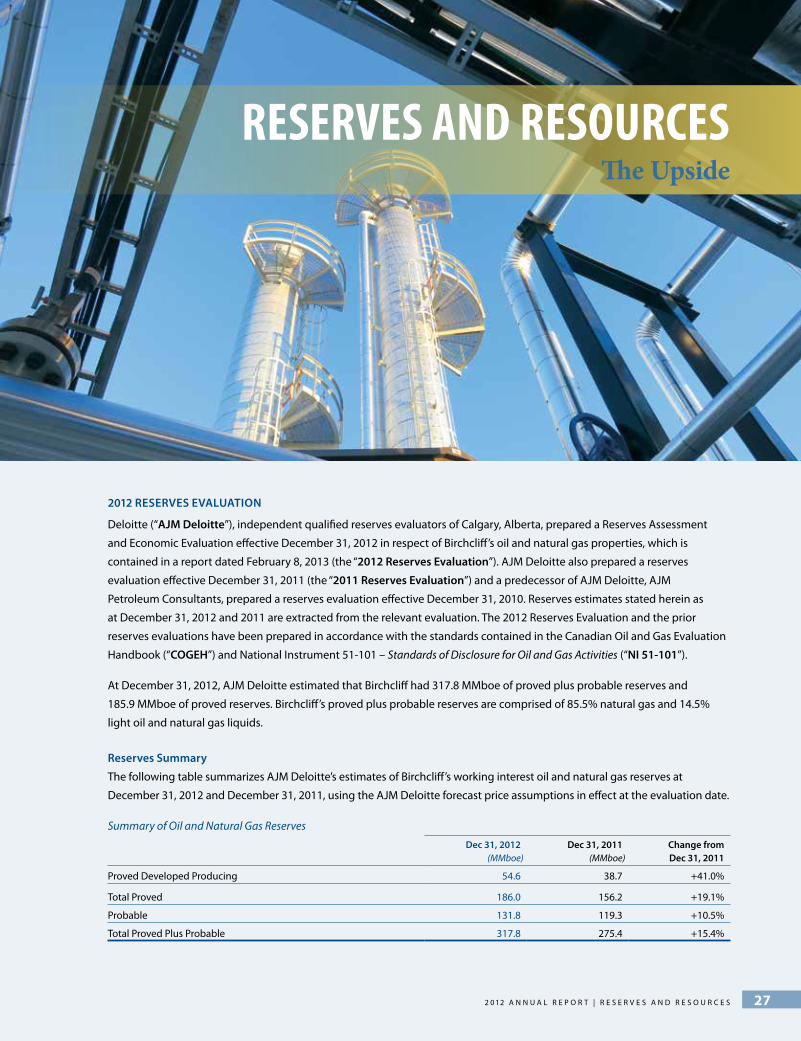
B i r c h c l i f f e n e r g y l t d .
2012 rESErvES EvAluAtion
Deloitte (“AJm deloitte”), independent qualified reserves evaluators of Calgary, Alberta, prepared a Reserves Assessment
and Economic Evaluation effective December 31, 2012 in respect of Birchcliff’s oil and natural gas properties, which is
contained in a report dated February 8, 2013 (the “2012 reserves Evaluation”). AJM Deloitte also prepared a reserves
evaluation effective December 31, 2011 (the “2011 reserves Evaluation”) and a predecessor of AJM Deloitte, AJM
Petroleum Consultants, prepared a reserves evaluation effective December 31, 2010. Reserves estimates stated herein as
at December 31, 2012 and 2011 are extracted from the relevant evaluation. The 2012 Reserves Evaluation and the prior
reserves evaluations have been prepared in accordance with the standards contained in the Canadian Oil and Gas Evaluation
handbook (“cogEh”) and National Instrument 51-101 – Standards of Disclosure for Oil and Gas Activities (“ni 51-101”).
At December 31, 2012, AJM Deloitte estimated that Birchcliff had 317.8 MMboe of proved plus probable reserves and
185.9 MMboe of proved reserves. Birchcliff’s proved plus probable reserves are comprised of 85.5% natural gas and 14.5%
light oil and natural gas liquids.
reserves Summary
The following table summarizes AJM Deloitte’s estimates of Birchcliff’s working interest oil and natural gas reserves at
December 31, 2012 and December 31, 2011, using the AJM Deloitte forecast price assumptions in effect at the evaluation date.
Summary of Oil and Natural Gas Reserves
dec 31, 2012(MMboe)
dec 31, 2011(MMboe)
change from dec 31, 2011
Proved Developed Producing 54.6 38.7 +41.0%
Total Proved 186.0 156.2 +19.1%
Probable 131.8 119.3 +10.5%
Total Proved Plus Probable 317.8 275.4 +15.4%
reserves And resourcesThe Upside
2 0 1 2 A N N U A L r e p o r t | r e s e r v e s A N d r e s o U r c e s 27

B i r c h c l i f f e n e r g y l t d .
net present value of future net revenue
The following table is a summary of the net present value of future net revenue associated with Birchcliff’s reserves at
December 31, 2012 before deducting future income tax expense, and calculated at various discount rates. The net present
value of future net revenue attributable to the Corporation’s reserves is based on AJM Deloitte’s December 31, 2012 forecast
price assumptions of commodity prices, which can be found at http://www.ajmpc.com/price-forecasts.html.
Net Present Value of Future Net Revenue Before Income Taxes(1)(2)
discounted At
(Forecast Prices and Costs) (MM$) (per year) 0% 5% 8% 10% 15% 20%
Proved
Developed Producing 1,428.1 1,050.0 905.3 829.7 688.5 591.4
Developed Non-Producing 155.6 117.9 102.8 94.7 78.9 67.5
Undeveloped 2,515.2 1,341.4 931.9 730.3 384.3 175.6
Total Proved 4,099.0 2,509.2 1,940.0 1,654.7 1,151.7 834.6
Probable 4,096.8 1,860.4 1,233.3 956.0 532.6 312.9
Total Proved Plus Probable 8,195.8 4,369.7 3,173.3 2,610.7 1,684.3 1,147.4
(1) Estimates of future net revenue, whether discounted or not, do not represent fair market value.
(2) Future net revenue is after deduction of estimated costs of abandonment of existing and future wells and reclamation of future wells and does not include costs of abandonment of facilities, reclamation of facilities and reclamation of existing wells.
The natural gas price forecast used by AJM Deloitte in the 2012 Reserves Evaluation for the years 2013 through 2017 is
approximately $1.10 per MMbtu lower than the forecast used by AJM Deloitte for the same years in its 2011 Reserves
Evaluation. Notwithstanding the natural gas price forecast for these years decreased by more than 22%, the net present
value of the proved developed producing reserves (at a 10% discount rate) increased by 3% as a result of increased reserves
volumes and reduced operating costs recognized in the additional reserves in the 2012 Reserves Evaluation. The proved plus
probable reserves (at a 10% discount rate) decreased by 21% primarily as a result of the drop in the natural gas price forecast.
forecast prices used in Estimates
The following table sets out the forecast price assumptions used by AJM Deloitte for the 2012 Reserves Evaluation.
The pricing and cost assumptions used were determined by AJM Deloitte using information available from numerous
governmental agencies, industry publications, oil refineries, natural gas marketers and industry trends. These long-term
forecasts of prices are subject to the many uncertainties that effect long-term future forecasts.
AJM Deloitte Price Forecast
crude oil natural gas natural gas liquids
year
wti crude oil
($US/bbl)
Edmonton city gate
($CDN/bbl)
natural gas at AEco
($CDN/Mcf)
Edmonton propane
($CDN/bbl)
Edmonton Butane
($CDN/bbl)
Edmonton c5+
($CDN/bbl)
currency Exchange rate
($US/$CDN)
inflation rate
(%)
2013 90.00 85.00 3.20 46.75 72.25 89.25 1.00 0.0
2014 89.75 84.70 3.75 46.60 72.00 88.95 1.00 2.0
2015 91.55 89.45 4.05 49.20 76.05 93.90 1.00 2.0
2016 93.40 91.20 4.35 50.15 77.50 95.75 1.00 2.0
2017 92.00 89.80 4.65 49.40 76.35 94.30 1.00 2.0
2018 93.85 91.60 5.10 50.40 77.85 96.20 1.00 2.0
2019 95.70 93.40 5.40 51.35 79.40 98.05 1.00 2.0
2020 97.65 95.30 5.75 52.40 81.00 100.05 1.00 2.0
2021 99.60 97.20 6.10 53.45 82.60 102.05 1.00 2.0
2022 101.60 99.15 6.45 54.55 84.30 104.10 1.00 2.0
Thereafter Escalate at 2.0% per annum
R e s e R v e s a n d R e s o u R c e s | 2 0 1 2 a n n u a L R e p o R t28
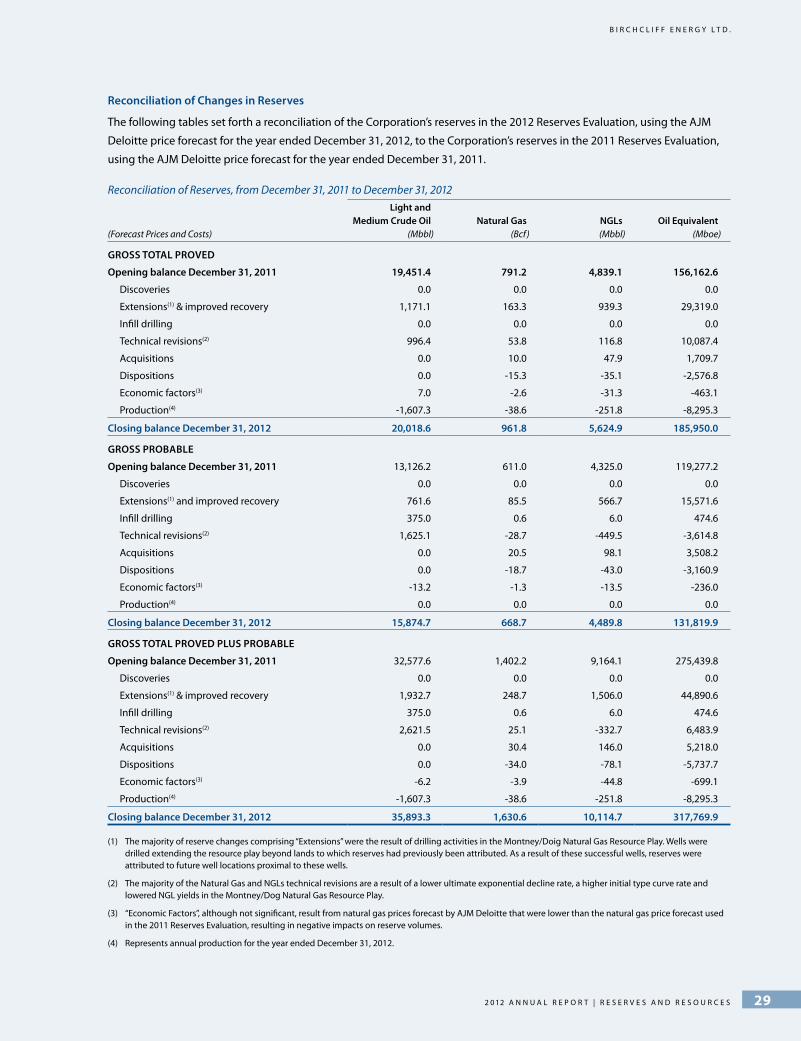
B i r c h c l i f f e n e r g y l t d .
reconciliation of changes in reserves
The following tables set forth a reconciliation of the Corporation’s reserves in the 2012 Reserves Evaluation, using the AJM
Deloitte price forecast for the year ended December 31, 2012, to the Corporation’s reserves in the 2011 Reserves Evaluation,
using the AJM Deloitte price forecast for the year ended December 31, 2011.
Reconciliation of Reserves, from December 31, 2011 to December 31, 2012
(Forecast Prices and Costs)
light and medium crude oil
(Mbbl)natural gas
(Bcf)ngls(Mbbl)
oil Equivalent (Mboe)
groSS totAl provEd
opening balance december 31, 2011 19,451.4 791.2 4,839.1 156,162.6
Discoveries 0.0 0.0 0.0 0.0
Extensions(1) & improved recovery 1,171.1 163.3 939.3 29,319.0
Infill drilling 0.0 0.0 0.0 0.0
Technical revisions(2) 996.4 53.8 116.8 10,087.4
Acquisitions 0.0 10.0 47.9 1,709.7
Dispositions 0.0 -15.3 -35.1 -2,576.8
Economic factors(3) 7.0 -2.6 -31.3 -463.1
Production(4) -1,607.3 -38.6 -251.8 -8,295.3
closing balance december 31, 2012 20,018.6 961.8 5,624.9 185,950.0
groSS proBABlE
opening balance december 31, 2011 13,126.2 611.0 4,325.0 119,277.2
Discoveries 0.0 0.0 0.0 0.0
Extensions(1) and improved recovery 761.6 85.5 566.7 15,571.6
Infill drilling 375.0 0.6 6.0 474.6
Technical revisions(2) 1,625.1 -28.7 -449.5 -3,614.8
Acquisitions 0.0 20.5 98.1 3,508.2
Dispositions 0.0 -18.7 -43.0 -3,160.9
Economic factors(3) -13.2 -1.3 -13.5 -236.0
Production(4) 0.0 0.0 0.0 0.0
closing balance december 31, 2012 15,874.7 668.7 4,489.8 131,819.9
groSS totAl provEd pluS proBABlE
opening balance december 31, 2011 32,577.6 1,402.2 9,164.1 275,439.8
Discoveries 0.0 0.0 0.0 0.0
Extensions(1) & improved recovery 1,932.7 248.7 1,506.0 44,890.6
Infill drilling 375.0 0.6 6.0 474.6
Technical revisions(2) 2,621.5 25.1 -332.7 6,483.9
Acquisitions 0.0 30.4 146.0 5,218.0
Dispositions 0.0 -34.0 -78.1 -5,737.7
Economic factors(3) -6.2 -3.9 -44.8 -699.1
Production(4) -1,607.3 -38.6 -251.8 -8,295.3
closing balance december 31, 2012 35,893.3 1,630.6 10,114.7 317,769.9
(1) The majority of reserve changes comprising “Extensions” were the result of drilling activities in the Montney/Doig Natural Gas Resource Play. Wells were drilled extending the resource play beyond lands to which reserves had previously been attributed. As a result of these successful wells, reserves were attributed to future well locations proximal to these wells.
(2) The majority of the Natural Gas and NGLs technical revisions are a result of a lower ultimate exponential decline rate, a higher initial type curve rate and lowered NGL yields in the Montney/Dog Natural Gas Resource Play.
(3) “Economic Factors”, although not significant, result from natural gas prices forecast by AJM Deloitte that were lower than the natural gas price forecast used in the 2011 Reserves Evaluation, resulting in negative impacts on reserve volumes.
(4) Represents annual production for the year ended December 31, 2012.
2 0 1 2 A N N U A L r e p o r t | r e s e r v e s A N d r e s o U r c e s 29
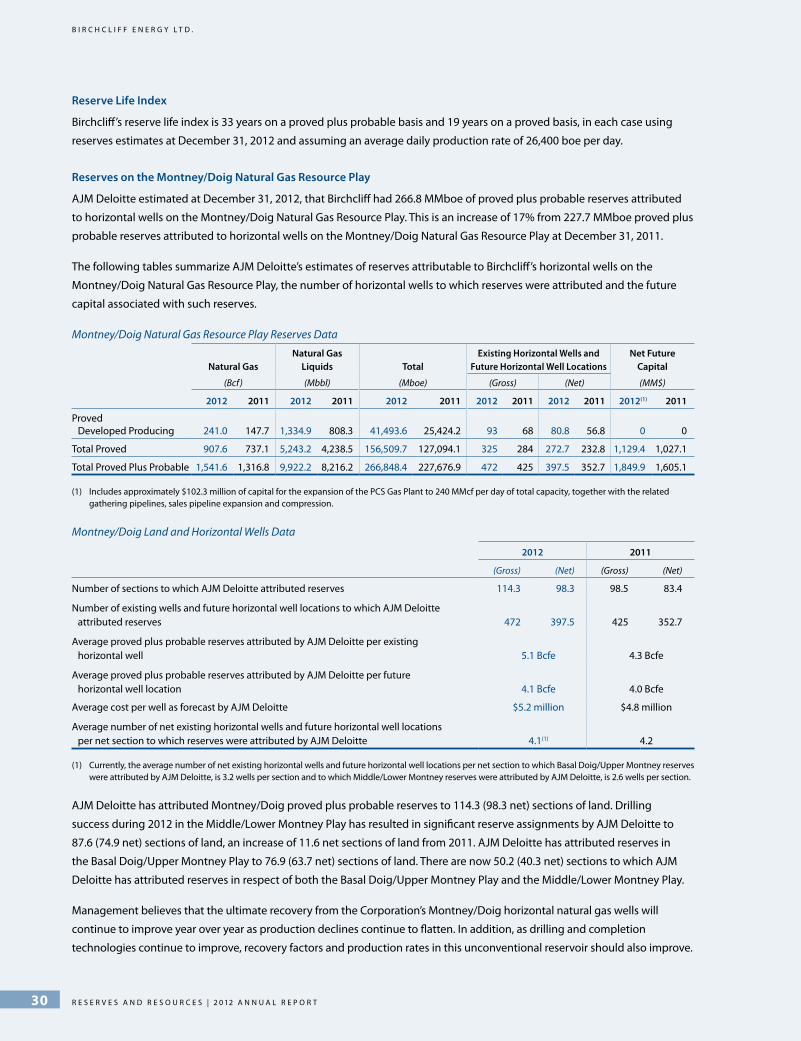
B i r c h c l i f f e n e r g y l t d .
reserve life index
Birchcliff’s reserve life index is 33 years on a proved plus probable basis and 19 years on a proved basis, in each case using
reserves estimates at December 31, 2012 and assuming an average daily production rate of 26,400 boe per day.
reserves on the montney/doig natural gas resource play
AJM Deloitte estimated at December 31, 2012, that Birchcliff had 266.8 MMboe of proved plus probable reserves attributed
to horizontal wells on the Montney/Doig Natural Gas Resource Play. This is an increase of 17% from 227.7 MMboe proved plus
probable reserves attributed to horizontal wells on the Montney/Doig Natural Gas Resource Play at December 31, 2011.
The following tables summarize AJM Deloitte’s estimates of reserves attributable to Birchcliff’s horizontal wells on the
Montney/Doig Natural Gas Resource Play, the number of horizontal wells to which reserves were attributed and the future
capital associated with such reserves.
Montney/Doig Natural Gas Resource Play Reserves Data
natural gasnatural gas
liquids totalExisting horizontal wells and
future horizontal well locations net future
capital
(Bcf) (Mbbl) (Mboe) (Gross) (Net) (MM$)
2012 2011 2012 2011 2012 2011 2012 2011 2012 2011 2012(1) 2011
Proved Developed Producing 241.0 147.7 1,334.9 808.3 41,493.6 25,424.2 93 68 80.8 56.8 0 0
Total Proved 907.6 737.1 5,243.2 4,238.5 156,509.7 127,094.1 325 284 272.7 232.8 1,129.4 1,027.1
Total Proved Plus Probable 1,541.6 1,316.8 9,922.2 8,216.2 266,848.4 227,676.9 472 425 397.5 352.7 1,849.9 1,605.1
(1) Includes approximately $102.3 million of capital for the expansion of the PCS Gas Plant to 240 MMcf per day of total capacity, together with the related gathering pipelines, sales pipeline expansion and compression.
Montney/Doig Land and Horizontal Wells Data
2012 2011
(Gross) (Net) (Gross) (Net)
Number of sections to which AJM Deloitte attributed reserves 114.3 98.3 98.5 83.4
Number of existing wells and future horizontal well locations to which AJM Deloitte attributed reserves 472 397.5 425 352.7
Average proved plus probable reserves attributed by AJM Deloitte per existing horizontal well 5.1 Bcfe 4.3 Bcfe
Average proved plus probable reserves attributed by AJM Deloitte per future horizontal well location 4.1 Bcfe 4.0 Bcfe
Average cost per well as forecast by AJM Deloitte $5.2 million $4.8 million
Average number of net existing horizontal wells and future horizontal well locations per net section to which reserves were attributed by AJM Deloitte 4.1(1) 4.2
(1) Currently, the average number of net existing horizontal wells and future horizontal well locations per net section to which Basal Doig/Upper Montney reserves were attributed by AJM Deloitte, is 3.2 wells per section and to which Middle/Lower Montney reserves were attributed by AJM Deloitte, is 2.6 wells per section.
AJM Deloitte has attributed Montney/Doig proved plus probable reserves to 114.3 (98.3 net) sections of land. Drilling
success during 2012 in the Middle/Lower Montney Play has resulted in significant reserve assignments by AJM Deloitte to
87.6 (74.9 net) sections of land, an increase of 11.6 net sections of land from 2011. AJM Deloitte has attributed reserves in
the Basal Doig/Upper Montney Play to 76.9 (63.7 net) sections of land. There are now 50.2 (40.3 net) sections to which AJM
Deloitte has attributed reserves in respect of both the Basal Doig/Upper Montney Play and the Middle/Lower Montney Play.
Management believes that the ultimate recovery from the Corporation’s Montney/Doig horizontal natural gas wells will
continue to improve year over year as production declines continue to flatten. In addition, as drilling and completion
technologies continue to improve, recovery factors and production rates in this unconventional reservoir should also improve.
R e s e R v e s a n d R e s o u R c e s | 2 0 1 2 a n n u a L R e p o R t30

B i r c h c l i f f e n e r g y l t d .
reserves on the worsley light oil resource play
At December 31, 2012, AJM Deloitte estimated that in the Worsley Charlie Lake Pool on the Worsley Light Oil Resource Play,
Birchcliff had 34.7 MMboe proved plus probable reserves and 19.6 MMboe of proved reserves. This continues the growth
trend for Birchcliff’s Worsley reserves since July 1, 2007 (being the effective date of the acquisition of this property), when
recoverable reserves were estimated at 15.1 MMboe on a proved plus probable basis and 11.3 MMboe on a proved basis.
Both the original oil in place and the estimated recoverable reserves continue to grow and Birchcliff is pleased to report that
the Worsley light oil pool continues to be a top quality asset.
History of Reserves Estimated for Worsley Charlie Lake Pool
(MMboe) dec 31, 2012 dec 31, 2011 dec 31, 2010 dec 31, 2009 dec 31, 2008 dec 31, 2007 July 1, 2007
Proved 19.6 18.8 18.8 18.3 17.5 15.0 11.3
Proved Plus Probable 34.7 31.3 28.2 26.3 24.6 21.2 15.1
finding and development costs
During 2012, Birchcliff’s finding, development and acquisition (“fd&A”) costs were $298.5 million, which included approxi-
mately $62 million for the Phase III expansion of the PCS Gas Plant and major related pipelines.
The following table sets forth Birchcliff’s estimates of its finding and development (“f&d”) costs per boe and FD&A costs
per boe, excluding future development capital and including future development capital, on a proved and proved plus
probable basis.
Finding and Development Costs
Excluding future development capital 2012 2011 2010three year
Average
F&D – Proved $7.77 $4.77 $9.09 $6.75
F&D – Proved Plus Probable $6.09 $2.88 $5.49 $4.42
Acquisitions – Proved $10.96 $732.34 $0.62 $5.88
Acquisitions – Proved Plus Probable $3.38 $36.11 $0.31 $2.34
FD&A – Proved(1) $7.83 $4.85 $7.61 $6.52
FD&A – Proved Plus Probable(1) $5.89 $2.92 $4.49 $4.18
including future development capital(2)
F&D – Proved $11.10 $13.15 $13.01 $12.43
F&D – Proved Plus Probable $11.99 $12.01 $9.89 $11.49
Acquisitions – Proved $17.78 $732.34 $0.62 $8.64
Acquisitions – Proved Plus Probable $9.61 $36.11 $0.31 $5.59
FD&A – Proved(1) $10.91 $13.47 $11.12 $12.04
FD&A – Proved Plus Probable(1) $11.56 $12.31 $8.34 $11.03
(1) Based upon FD&A costs, net of disposition proceeds, and reserve additions, net of reserves disposed of.
(2) Includes the increase in future development capital for 2012 over 2011 of $117.4 million on a proved basis and $287.5 million on a proved plus probable basis.
AJM Deloitte’s estimates of future development costs are $1.30 billion on a proved basis and $2.19 billion on a proved plus
probable basis, which includes approximately $102.3 million for the Phase IV expansion of the PCS Gas Plant to 240 MMcf per
day of total capacity, together with the related gathering pipeline, sales pipeline expansion and compression. The increase
in future development capital for 2012 over 2011 is $117.4 million on a proved basis and $287.5 million on a proved plus
probable basis.
The 2011 Reserves Evaluation included, on average, $4.8 million for each future Montney/Doig horizontal natural gas well to
which reserves were assigned. The 2012 Reserves Evaluation included, on average, $5.2 million for each future Montney/Doig
horizontal natural gas well to which reserves were assigned.
2 0 1 2 A N N U A L r e p o r t | r e s e r v e s A N d r e s o U r c e s 31
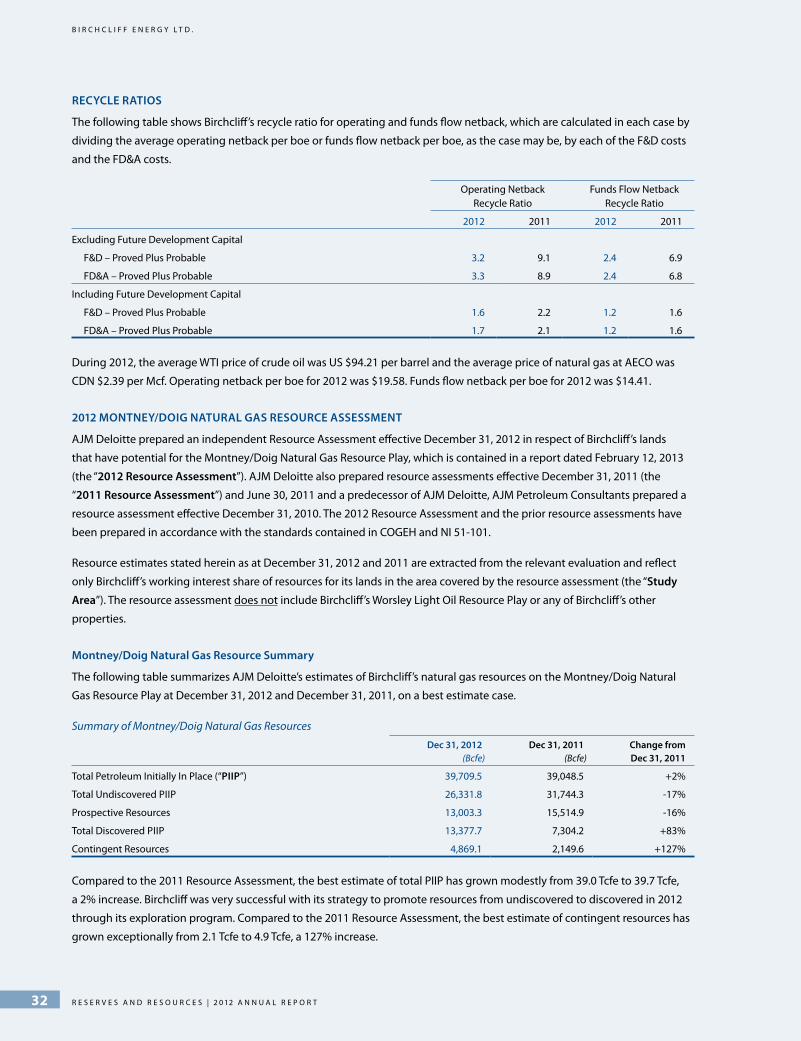
B i r c h c l i f f e n e r g y l t d .
rEcyclE rAtioS
The following table shows Birchcliff’s recycle ratio for operating and funds flow netback, which are calculated in each case by
dividing the average operating netback per boe or funds flow netback per boe, as the case may be, by each of the F&D costs
and the FD&A costs.
Operating NetbackRecycle Ratio
Funds Flow NetbackRecycle Ratio
2012 2011 2012 2011
Excluding Future Development Capital
F&D – Proved Plus Probable 3.2 9.1 2.4 6.9
FD&A – Proved Plus Probable 3.3 8.9 2.4 6.8
Including Future Development Capital
F&D – Proved Plus Probable 1.6 2.2 1.2 1.6
FD&A – Proved Plus Probable 1.7 2.1 1.2 1.6
During 2012, the average WTI price of crude oil was US $94.21 per barrel and the average price of natural gas at AECO was
CDN $2.39 per Mcf. Operating netback per boe for 2012 was $19.58. Funds flow netback per boe for 2012 was $14.41.
2012 montnEy/doig nAturAl gAS rESourcE ASSESSmEnt
AJM Deloitte prepared an independent Resource Assessment effective December 31, 2012 in respect of Birchcliff’s lands
that have potential for the Montney/Doig Natural Gas Resource Play, which is contained in a report dated February 12, 2013
(the “2012 resource Assessment”). AJM Deloitte also prepared resource assessments effective December 31, 2011 (the
“2011 resource Assessment”) and June 30, 2011 and a predecessor of AJM Deloitte, AJM Petroleum Consultants prepared a
resource assessment effective December 31, 2010. The 2012 Resource Assessment and the prior resource assessments have
been prepared in accordance with the standards contained in COGEh and NI 51-101.
Resource estimates stated herein as at December 31, 2012 and 2011 are extracted from the relevant evaluation and reflect
only Birchcliff’s working interest share of resources for its lands in the area covered by the resource assessment (the “Study
Area”). The resource assessment does not include Birchcliff’s Worsley Light Oil Resource Play or any of Birchcliff’s other
properties.
montney/doig natural gas resource Summary
The following table summarizes AJM Deloitte’s estimates of Birchcliff’s natural gas resources on the Montney/Doig Natural
Gas Resource Play at December 31, 2012 and December 31, 2011, on a best estimate case.
Summary of Montney/Doig Natural Gas Resources
dec 31, 2012(Bcfe)
dec 31, 2011(Bcfe)
change from dec 31, 2011
Total Petroleum Initially In Place (“piip”) 39,709.5 39,048.5 +2%
Total Undiscovered PIIP 26,331.8 31,744.3 -17%
Prospective Resources 13,003.3 15,514.9 -16%
Total Discovered PIIP 13,377.7 7,304.2 +83%
Contingent Resources 4,869.1 2,149.6 +127%
Compared to the 2011 Resource Assessment, the best estimate of total PIIP has grown modestly from 39.0 Tcfe to 39.7 Tcfe,
a 2% increase. Birchcliff was very successful with its strategy to promote resources from undiscovered to discovered in 2012
through its exploration program. Compared to the 2011 Resource Assessment, the best estimate of contingent resources has
grown exceptionally from 2.1 Tcfe to 4.9 Tcfe, a 127% increase.
R e s e R v e s a n d R e s o u R c e s | 2 0 1 2 a n n u a L R e p o R t32
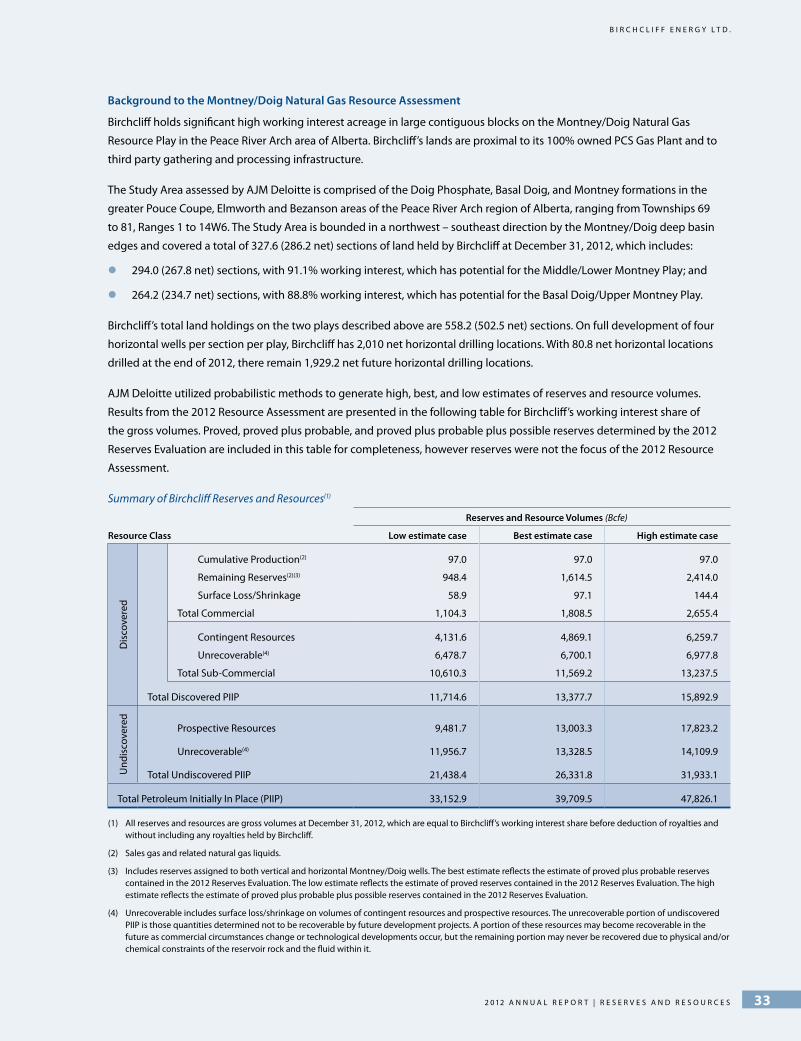
B i r c h c l i f f e n e r g y l t d .
Background to the montney/doig natural gas resource Assessment
Birchcliff holds significant high working interest acreage in large contiguous blocks on the Montney/Doig Natural Gas
Resource Play in the Peace River Arch area of Alberta. Birchcliff’s lands are proximal to its 100% owned PCS Gas Plant and to
third party gathering and processing infrastructure.
The Study Area assessed by AJM Deloitte is comprised of the Doig Phosphate, Basal Doig, and Montney formations in the
greater Pouce Coupe, Elmworth and Bezanson areas of the Peace River Arch region of Alberta, ranging from Townships 69
to 81, Ranges 1 to 14W6. The Study Area is bounded in a northwest – southeast direction by the Montney/Doig deep basin
edges and covered a total of 327.6 (286.2 net) sections of land held by Birchcliff at December 31, 2012, which includes:
294.0 (267.8 net) sections, with 91.1% working interest, which has potential for the Middle/Lower Montney Play; and
264.2 (234.7 net) sections, with 88.8% working interest, which has potential for the Basal Doig/Upper Montney Play.
Birchcliff’s total land holdings on the two plays described above are 558.2 (502.5 net) sections. On full development of four
horizontal wells per section per play, Birchcliff has 2,010 net horizontal drilling locations. With 80.8 net horizontal locations
drilled at the end of 2012, there remain 1,929.2 net future horizontal drilling locations.
AJM Deloitte utilized probabilistic methods to generate high, best, and low estimates of reserves and resource volumes.
Results from the 2012 Resource Assessment are presented in the following table for Birchcliff’s working interest share of
the gross volumes. Proved, proved plus probable, and proved plus probable plus possible reserves determined by the 2012
Reserves Evaluation are included in this table for completeness, however reserves were not the focus of the 2012 Resource
Assessment.
Summary of Birchcliff Reserves and Resources(1)
resource class
reserves and resource volumes (Bcfe)
low estimate case Best estimate case high estimate case
Dis
cove
red
Cumulative Production(2) 97.0 97.0 97.0
Remaining Reserves(2)(3) 948.4 1,614.5 2,414.0
Surface Loss/Shrinkage 58.9 97.1 144.4
Total Commercial 1,104.3 1,808.5 2,655.4
Contingent Resources 4,131.6 4,869.1 6,259.7
Unrecoverable(4) 6,478.7 6,700.1 6,977.8
Total Sub-Commercial 10,610.3 11,569.2 13,237.5
Total Discovered PIIP 11,714.6 13,377.7 15,892.9
Und
isco
vere
d
Prospective Resources 9,481.7 13,003.3 17,823.2
Unrecoverable(4) 11,956.7 13,328.5 14,109.9
Total Undiscovered PIIP 21,438.4 26,331.8 31,933.1
Total Petroleum Initially In Place (PIIP) 33,152.9 39,709.5 47,826.1
(1) All reserves and resources are gross volumes at December 31, 2012, which are equal to Birchcliff’s working interest share before deduction of royalties and without including any royalties held by Birchcliff.
(2) Sales gas and related natural gas liquids.
(3) Includes reserves assigned to both vertical and horizontal Montney/Doig wells. The best estimate reflects the estimate of proved plus probable reserves contained in the 2012 Reserves Evaluation. The low estimate reflects the estimate of proved reserves contained in the 2012 Reserves Evaluation. The high estimate reflects the estimate of proved plus probable plus possible reserves contained in the 2012 Reserves Evaluation.
(4) Unrecoverable includes surface loss/shrinkage on volumes of contingent resources and prospective resources. The unrecoverable portion of undiscovered PIIP is those quantities determined not to be recoverable by future development projects. A portion of these resources may become recoverable in the future as commercial circumstances change or technological developments occur, but the remaining portion may never be recovered due to physical and/or chemical constraints of the reservoir rock and the fluid within it.
2 0 1 2 A N N U A L r e p o r t | r e s e r v e s A N d r e s o U r c e s 33
B i r c h c l i f f e n e r g y l t d .
finAnciAl reviewBy the Numbers
34 F I N A N C I A L I N F O R M A T I O N | 2 0 1 2 A N N U A L R E P O R T

B i r c h c l i f f e n e r g y l t d .
MANAGEMENT’S DISCUSSION AND ANALYSIS
GENERAL
Birchcliff Energy Ltd. (“Birchcliff” or the “Corporation”) is a Calgary, Alberta based intermediate oil and natural gas company
with operations concentrated in its one core area, the Peace River Arch of Alberta. Additional information relating to the
Corporation, including its Annual Information Form, is available on the SEDAR website at www.sedar.com and on the
Corporation’s website at www.birchcliffenergy.com. Birchcliff’s common shares are listed for trading on the Toronto Stock
Exchange (“TSX”) under the symbol “BIR” and are included in the S&P/TSX Composite Index.
The following Management’s Discussion and Analysis (“MD&A”) is dated March 13, 2013. The annual financial information
with respect to the three and twelve months ended December 31, 2012 (the “Reporting Periods”) as compared to the three
and twelve months ended December 31, 2011 (the “Comparable Prior Periods”) and this MD&A have been prepared by
management and approved by the Corporation’s Audit Committee and Board of Directors. This MD&A should be read in
conjunction with the audited financial statements of the Corporation and related notes for the year ended December 31,
2012. All financial information is expressed in thousands of Canadian dollars, unless otherwise stated.
2013 OUTLOOK
The Corporation’s goals for 2013 are to continue to convert long life reserves into production and expand its footprint on
the Montney/Doig Natural Gas Resource Play and the Worsley Light Oil Resource Play. The Corporation will focus on the
reduction of per boe operating costs as it makes use of the expanded capacity of its 100% owned and operated Pouce Coupe
South natural gas plant (the “PCS Gas Plant”). Birchcliff will continue to develop its high quality asset base, which will result in
long-term production and reserves growth, with low finding and development costs.
Production in 2013 is expected to average approximately 26,400 boe per day, a 16% increase from 2012 annual average
production of 22,802 boe per day. Management expects to exit 2013 with production of approximately 28,000 boe per day.
In 2013, Birchcliff is utilizing multi-well pad drilling on its Montney/Doig Natural Gas Resource Play to improve drilling
and completion efficiencies and reduce the cost per well, drilling six horizontal natural gas wells from one pad and three
horizontal natural gas wells from another. The reduction in drilling and completion costs are significant and allows Birchcliff
to drill right through spring break-up. However, production growth during 2013 will come in large increments as the
new horizontal natural gas wells effectively commence production simultaneously, not one at a time as they are drilled.
Accordingly, Birchcliff will see normal production declines during the second quarter followed by material production growth
in the third and fourth quarters.
The recently announced 2013 capital spending program of $184.6 million is largely focused on the drilling, completion and
tie-in of Montney/Doig horizontal natural gas wells that will produce to the PCS Gas Plant. The recently completed expansion
of the PCS Gas Plant provides Birchcliff with excess natural gas processing capacity that can be utilized over time as additional
Montney/Doig horizontal natural gas wells are drilled and brought on-stream. The PCS Gas Plant is currently processing
about 105 MMcf per day, but has a licenced processing capacity of 150 MMcf per day. To operate the PCS Gas Plant at
150 MMcf per day will require some modification to Birchcliff’s pipeline systems and to the sales metre on the NOVA pipeline
system, but the capital required is not material. In 2013, Birchcliff will not be required to allocate material capital to any major
facilities projects, as it has in prior years. Capital efficiencies will improve as most of the Corporation’s capital in 2013 will go to
the drilling, completion and tie-in of new wells. Further details regarding the 2013 capital spending program can be found in
Birchcliff’s press release dated February 13, 2013.
The Corporation intends to finance its business primarily through funds flow from operations, working capital, potential
sales of minor assets and available credit limit under its bank credit facilities. Should commodity prices deteriorate materially,
Birchcliff may adjust its capital spending accordingly. Birchcliff does not anticipate it will require additional common equity in
2 0 1 2 A N N U A L r e p o r t | M A N A g e M e N t ’ s D i s c U s s i o N & A N A L y s i s 35
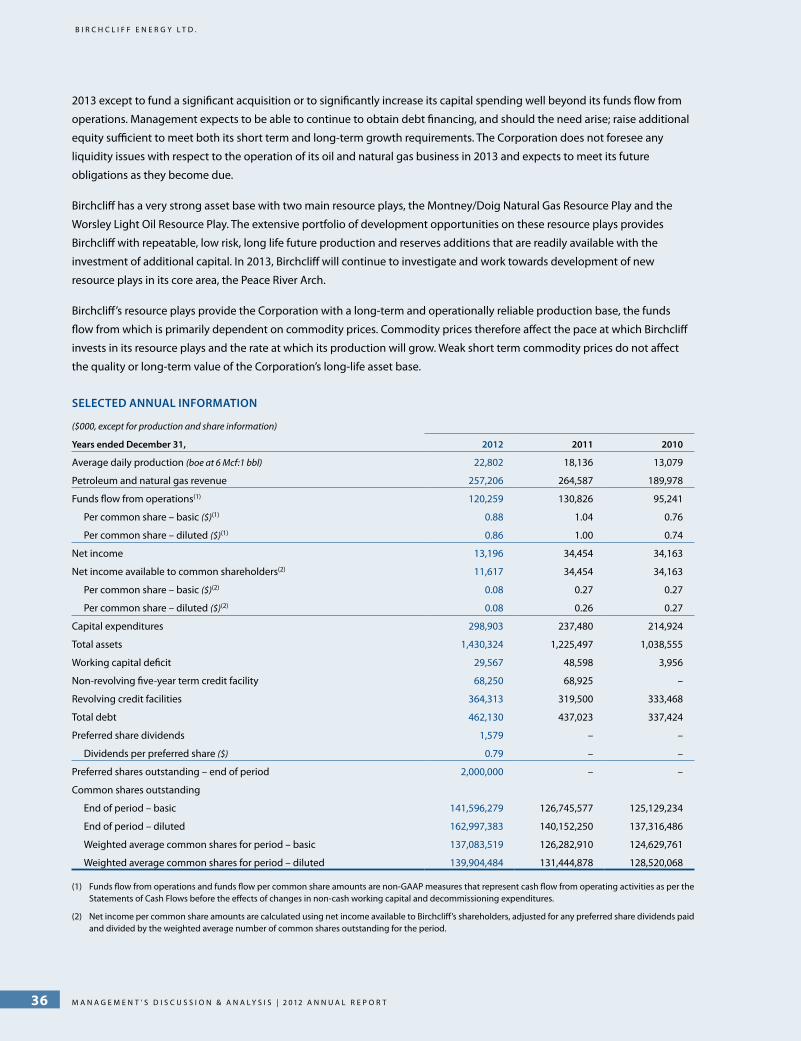
B i r c h c l i f f e n e r g y l t d .
2013 except to fund a significant acquisition or to significantly increase its capital spending well beyond its funds flow from
operations. Management expects to be able to continue to obtain debt financing, and should the need arise; raise additional
equity sufficient to meet both its short term and long-term growth requirements. The Corporation does not foresee any
liquidity issues with respect to the operation of its oil and natural gas business in 2013 and expects to meet its future
obligations as they become due.
Birchcliff has a very strong asset base with two main resource plays, the Montney/Doig Natural Gas Resource Play and the
Worsley Light Oil Resource Play. The extensive portfolio of development opportunities on these resource plays provides
Birchcliff with repeatable, low risk, long life future production and reserves additions that are readily available with the
investment of additional capital. In 2013, Birchcliff will continue to investigate and work towards development of new
resource plays in its core area, the Peace River Arch.
Birchcliff’s resource plays provide the Corporation with a long-term and operationally reliable production base, the funds
flow from which is primarily dependent on commodity prices. Commodity prices therefore affect the pace at which Birchcliff
invests in its resource plays and the rate at which its production will grow. Weak short term commodity prices do not affect
the quality or long-term value of the Corporation’s long-life asset base.
SELECTED ANNUAL INFORMATION
($000, except for production and share information)
Years ended December 31, 2012 2011 2010
Average daily production (boe at 6 Mcf:1 bbl) 22,802 18,136 13,079
Petroleum and natural gas revenue 257,206 264,587 189,978
Funds flow from operations(1) 120,259 130,826 95,241
Per common share – basic ($)(1) 0.88 1.04 0.76
Per common share – diluted ($)(1) 0.86 1.00 0.74
Net income 13,196 34,454 34,163
Net income available to common shareholders(2) 11,617 34,454 34,163
Per common share – basic ($)(2) 0.08 0.27 0.27
Per common share – diluted ($)(2) 0.08 0.26 0.27
Capital expenditures 298,903 237,480 214,924
Total assets 1,430,324 1,225,497 1,038,555
Working capital deficit 29,567 48,598 3,956
Non-revolving five-year term credit facility 68,250 68,925 –
Revolving credit facilities 364,313 319,500 333,468
Total debt 462,130 437,023 337,424
Preferred share dividends 1,579 – –
Dividends per preferred share ($) 0.79 – –
Preferred shares outstanding – end of period 2,000,000 – –
Common shares outstanding
End of period – basic 141,596,279 126,745,577 125,129,234
End of period – diluted 162,997,383 140,152,250 137,316,486
Weighted average common shares for period – basic 137,083,519 126,282,910 124,629,761
Weighted average common shares for period – diluted 139,904,484 131,444,878 128,520,068
(1) Funds flow from operations and funds flow per common share amounts are non-GAAP measures that represent cash flow from operating activities as per the Statements of Cash Flows before the effects of changes in non-cash working capital and decommissioning expenditures.
(2) Net income per common share amounts are calculated using net income available to Birchcliff’s shareholders, adjusted for any preferred share dividends paid and divided by the weighted average number of common shares outstanding for the period.
M a n a g e M e n t ’ s D i s c u s s i o n & a n a l y s i s | 2 0 1 2 a n n u a l r e p o r t36
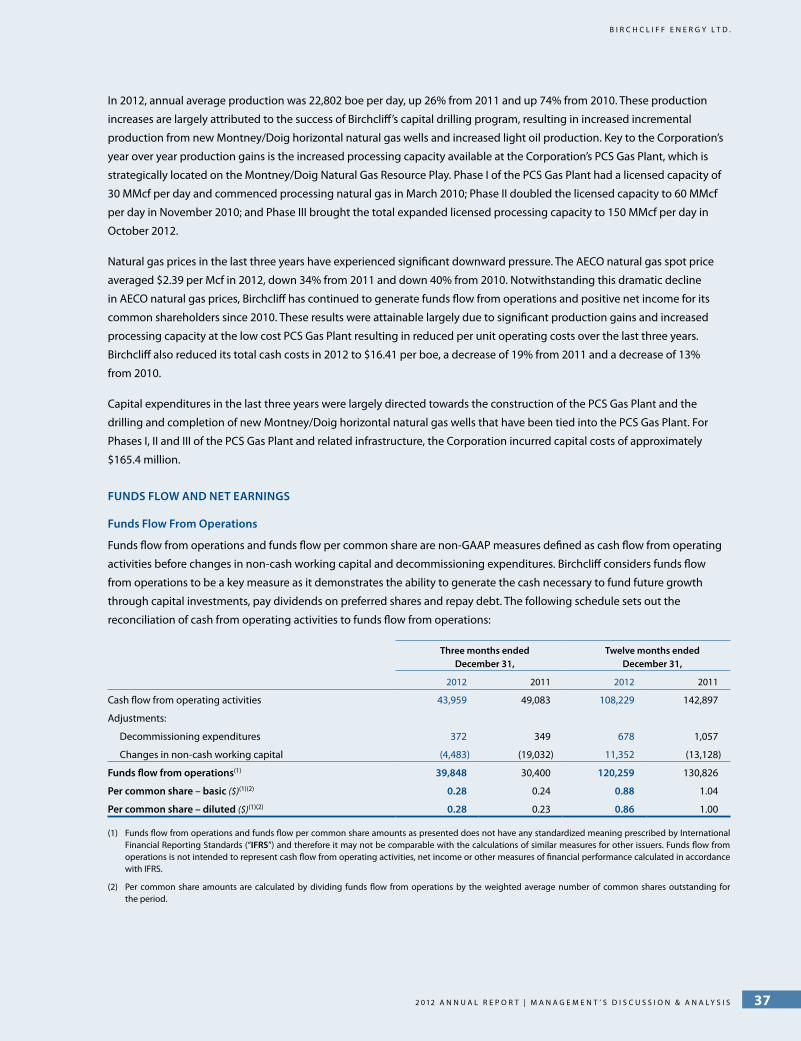
B i r c h c l i f f e n e r g y l t d .
In 2012, annual average production was 22,802 boe per day, up 26% from 2011 and up 74% from 2010. These production
increases are largely attributed to the success of Birchcliff’s capital drilling program, resulting in increased incremental
production from new Montney/Doig horizontal natural gas wells and increased light oil production. Key to the Corporation’s
year over year production gains is the increased processing capacity available at the Corporation’s PCS Gas Plant, which is
strategically located on the Montney/Doig Natural Gas Resource Play. Phase I of the PCS Gas Plant had a licensed capacity of
30 MMcf per day and commenced processing natural gas in March 2010; Phase II doubled the licensed capacity to 60 MMcf
per day in November 2010; and Phase III brought the total expanded licensed processing capacity to 150 MMcf per day in
October 2012.
Natural gas prices in the last three years have experienced significant downward pressure. The AECO natural gas spot price
averaged $2.39 per Mcf in 2012, down 34% from 2011 and down 40% from 2010. Notwithstanding this dramatic decline
in AECO natural gas prices, Birchcliff has continued to generate funds flow from operations and positive net income for its
common shareholders since 2010. These results were attainable largely due to significant production gains and increased
processing capacity at the low cost PCS Gas Plant resulting in reduced per unit operating costs over the last three years.
Birchcliff also reduced its total cash costs in 2012 to $16.41 per boe, a decrease of 19% from 2011 and a decrease of 13%
from 2010.
Capital expenditures in the last three years were largely directed towards the construction of the PCS Gas Plant and the
drilling and completion of new Montney/Doig horizontal natural gas wells that have been tied into the PCS Gas Plant. For
Phases I, II and III of the PCS Gas Plant and related infrastructure, the Corporation incurred capital costs of approximately
$165.4 million.
FUNDS FLOW AND NET EARNINGS
Funds Flow From Operations
Funds flow from operations and funds flow per common share are non-GAAP measures defined as cash flow from operating
activities before changes in non-cash working capital and decommissioning expenditures. Birchcliff considers funds flow
from operations to be a key measure as it demonstrates the ability to generate the cash necessary to fund future growth
through capital investments, pay dividends on preferred shares and repay debt. The following schedule sets out the
reconciliation of cash from operating activities to funds flow from operations:
Three months endedDecember 31,
Twelve months endedDecember 31,
2012 2011 2012 2011
Cash flow from operating activities 43,959 49,083 108,229 142,897
Adjustments:
Decommissioning expenditures 372 349 678 1,057
Changes in non-cash working capital (4,483) (19,032) 11,352 (13,128)
Funds flow from operations(1) 39,848 30,400 120,259 130,826
Per common share – basic ($)(1)(2) 0.28 0.24 0.88 1.04
Per common share – diluted ($)(1)(2) 0.28 0.23 0.86 1.00
(1) Funds flow from operations and funds flow per common share amounts as presented does not have any standardized meaning prescribed by International Financial Reporting Standards (“IFRS”) and therefore it may not be comparable with the calculations of similar measures for other issuers. Funds flow from operations is not intended to represent cash flow from operating activities, net income or other measures of financial performance calculated in accordance with IFRS.
(2) Per common share amounts are calculated by dividing funds flow from operations by the weighted average number of common shares outstanding for the period.
2 0 1 2 A N N U A L r e p o r t | M A N A g e M e N t ’ s D i s c U s s i o N & A N A L y s i s 37

B i r c h c l i f f e n e r g y l t d .
The aggregate funds flow increased by 31% as compared to the three month Comparable Prior Period and decreased by 8%
as compared to the twelve month Comparable Prior Period. Funds flow, when compared to the three month Comparable
Prior Period, was positively impacted by slightly higher average realized natural gas wellhead prices, increased natural gas
production, lower general and administrative and royalty expenses, negatively offset by lower realized oil wellhead prices,
decreased oil production, higher interest expense and an increase in operating and transportation and marketing costs
resulting from higher average daily production in the three month Reporting Period.
When compared to the twelve month Comparable Prior Period, the decrease in aggregate funds flow was largely due
to significantly lower natural gas prices, with AECO natural gas spot price decreasing by 34% to $2.39 per Mcf in 2012 as
compared to $3.63 per Mcf in 2011. Funds flow as compared to 2011 was also negatively impacted by lower realized oil
wellhead price and higher interest expense offset by a significant increase in average daily production and lower royalty
and general and administrative costs in 2012. Higher average production resulted in aggregate increases to production and
transportation and marketing costs in 2012.
Birchcliff continued to focus on controlling costs on a per boe basis during this very low natural gas price environment. Total
cash costs were $15.56 per boe and $16.41 per boe in the three and twelve month Reporting Period, a decrease of 29% and
19% from the Comparable Prior Periods.
Net Earnings
Three months ended
December 31,Twelve months ended
December 31,
2012 2011 2012 2011
Net income 6,305 3,333 13,196 34,454
Net income available to common shareholders 5,305(1) 3,333 11,617(1) 34,454
Per common share – basic ($)(2) 0.04 0.03 0.08 0.27
Per common share – diluted ($)(2) 0.04 0.03 0.08 0.26
(1) Amounts reduced for the payment of preferred share dividends totalling $1.0 million and $1.6 million in the three and twelve months ended December 31, 2012.
(2) Per common share amounts are calculated using net income available to Birchcliff’s shareholders, adjusted for any preferred share dividends paid and divided by the weighted average number of common shares outstanding for the period.
Notwithstanding low natural gas prices in 2012, Birchcliff continued to achieve positive net earnings during the Reporting
Periods largely as a result of processing significant natural gas production at the low cost PCS Gas Plant. The increase in net
income available to common shareholders from the fourth quarter of 2011 was mainly attributable to higher funds flow from
operations and lower net stock-based compensation expense offset by higher income taxes, payment of preferred share
dividends and an increase in depletion expense resulting from higher average daily production in the current quarter.
The decrease in net income available to common shareholders from 2011 was due to lower funds flow from operations, an
increase in depletion expense resulting from higher average daily production and payment of preferred share dividends,
offset by lower net stock-based compensation expense and income taxes and higher reported gain on sale of assets in 2012.
PCS GAS PLANT NETBACKS
Despite contending with very low AECO natural gas spot prices, the estimated operating netback for Birchcliff’s natural gas
production flowing to the PCS Gas Plant was $2.22 per Mcfe on a production month basis in 2012. This netback is a result of
the low cost structure of the PCS Gas Plant and the premium price received for the Corporation’s natural gas and condensate.
During 2012 natural gas processed at the PCS Gas Plant received premium pricing of $2.91 per Mcfe, due to the heat content
and the value of recovered condensate. Operating costs for natural gas processed at the PCS Gas Plant were low, averaging
$0.35 per Mcfe ($2.08 per boe). As a result, the PCS Gas Plant had a operating margin of 76%, which is determined by dividing
M a n a g e M e n t ’ s D i s c u s s i o n & a n a l y s i s | 2 0 1 2 a n n u a l r e p o r t38
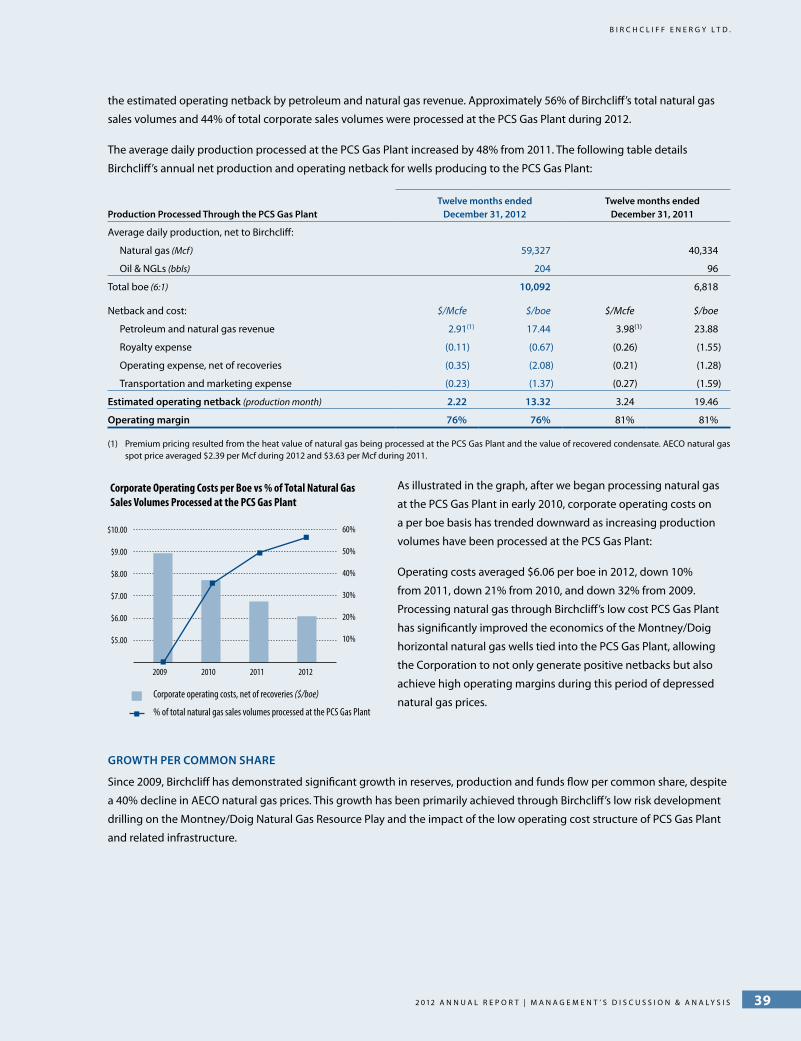
B i r c h c l i f f e n e r g y l t d .
the estimated operating netback by petroleum and natural gas revenue. Approximately 56% of Birchcliff’s total natural gas
sales volumes and 44% of total corporate sales volumes were processed at the PCS Gas Plant during 2012.
The average daily production processed at the PCS Gas Plant increased by 48% from 2011. The following table details
Birchcliff’s annual net production and operating netback for wells producing to the PCS Gas Plant:
Production Processed Through the PCS Gas PlantTwelve months ended
December 31, 2012Twelve months ended
December 31, 2011
Average daily production, net to Birchcliff:
Natural gas (Mcf) 59,327 40,334
Oil & NGLs (bbls) 204 96
Total boe (6:1) 10,092 6,818
Netback and cost: $/Mcfe $/boe $/Mcfe $/boe
Petroleum and natural gas revenue 2.91(1) 17.44 3.98(1) 23.88
Royalty expense (0.11) (0.67) (0.26) (1.55)
Operating expense, net of recoveries (0.35) (2.08) (0.21) (1.28)
Transportation and marketing expense (0.23) (1.37) (0.27) (1.59)
Estimated operating netback (production month) 2.22 13.32 3.24 19.46
Operating margin 76% 76% 81% 81%
(1) Premium pricing resulted from the heat value of natural gas being processed at the PCS Gas Plant and the value of recovered condensate. AECO natural gas spot price averaged $2.39 per Mcf during 2012 and $3.63 per Mcf during 2011.
As illustrated in the graph, after we began processing natural gas
at the PCS Gas Plant in early 2010, corporate operating costs on
a per boe basis has trended downward as increasing production
volumes have been processed at the PCS Gas Plant:
Operating costs averaged $6.06 per boe in 2012, down 10%
from 2011, down 21% from 2010, and down 32% from 2009.
Processing natural gas through Birchcliff’s low cost PCS Gas Plant
has significantly improved the economics of the Montney/Doig
horizontal natural gas wells tied into the PCS Gas Plant, allowing
the Corporation to not only generate positive netbacks but also
achieve high operating margins during this period of depressed
natural gas prices.
GROWTH PER COMMON SHARE
Since 2009, Birchcliff has demonstrated significant growth in reserves, production and funds flow per common share, despite
a 40% decline in AECO natural gas prices. This growth has been primarily achieved through Birchcliff’s low risk development
drilling on the Montney/Doig Natural Gas Resource Play and the impact of the low operating cost structure of PCS Gas Plant
and related infrastructure.
Corporate Operating Costs per Boe vs % of Total Natural Gas Sales Volumes Processed at the PCS Gas Plant
Corporate operating costs, net of recoveries ($/boe)
% of total natural gas sales volumes processed at the PCS Gas Plant
2009 2010 2011 2012
60%
50%
40%
30%
20%
10%
$10.00
$9.00
$8.00
$7.00
$6.00
$5.00
2 0 1 2 A N N U A L r e p o r t | M A N A g e M e N t ’ s D i s c U s s i o N & A N A L y s i s 39

B i r c h c l i f f e n e r g y l t d .
The following table highlights Birchcliff’s reserves, production and funds flow per common share and average benchmark
prices since 2009:
2009 2010 2011 2012
Change Since
2009 (%)
Average Annualized Growth (%)
Reserves per common share (boe/1000 shares):
Proved Developed Producing 166 246 305 385 132% 44%
Total Proved 727 911 1,232 1,313 81% 27%
Total Proved Plus Probable 1,270 1,607 2,173 2,244 77% 26%
Average daily production per common share(boe/day/million shares)(1):
Average daily production per million common shares 95.1 104.9 143.6 166.3 75% 25%
Funds flow per common share ($/share)(1):
Funds flow per common share 0.57 0.76 1.04 0.88 54% 18%
Average benchmark prices:
Natural gas – AECO – C Daily ($/MMbtu) 3.96 4.01 3.63 2.39 (40)% (13)%
Light oil – Edmonton Par ($/bbl) 69.50 77.50 95.03 86.12 24% 8%
(1) Based on weighted average basic common shares outstanding in the respective year.
MAJOR TRANSACTIONS AFFECTING FINANCIAL RESULTS
Equity Financings
Birchcliff completed a common share and a preferred unit equity offering in 2012, for aggregate net proceeds of
$154.3 million, which were used to reduce indebtedness under the revolving credit facilities, of which a portion was
re-drawn to fund the Corporation’s capital expenditure program. Further details can be found in the Corporation’s short form
prospectus for the relevant offering, dated April 12, 2012 and July 30, 2012 respectively, available on the SEDAR website at
www.sedar.com.
On August 8, 2012, Birchcliff completed a bought deal preferred unit equity financing for gross proceeds of $50 million
(the “August Financing”). An aggregate of two million Series A Preferred Shares and six million warrants were issued in the
August Financing. The Series A Preferred Shares pay cumulative dividends of $2.00 per Series A Preferred Share per annum,
payable quarterly if, as and when declared by Birchcliff’s Board of Directors. Each warrant provides the right to purchase one
common share of the Corporation until August 8, 2014, at an exercise price of $8.30 per common share.
On April 19, 2012, Birchcliff completed a bought deal common share equity financing and a private placement for gross
proceeds of $110 million (the “April Financing”). The Corporation issued 8,075,000 common shares at a price of $7.65 per
share for gross proceeds of $61.8 million and 1,100,000 common shares on a “flow-through” basis pursuant to the Income
Tax Act (Canada), at a price of $9.20 per share for gross proceeds of $10.1 million. Birchcliff’s major shareholder purchased
5,000,000 common shares issued at a price of $7.65 per share in a concurrent private placement for gross proceeds of
$38.3 million.
Credit Facilities
On June 26, 2012, the Corporation’s bank syndicate approved an increase to the revolving credit facilities for an aggregate
limit of $470 million from $450 million and extended the conversion date of those facilities to May 17, 2013 (the “Revolving
Credit Facilities”). The amended Revolving Credit Facilities include an increased credit limit for the extendible revolving term
credit facility (the “Syndicated Credit Facility”) of $440 million from $420 million and an extendible revolving working capital
facility (the “Working Capital Facility”) of $30 million. The aggregate maximum amount under the Corporation’s bank credit
facilities is $540 million, of which $70 million is under the non-revolving five-year term credit facility with a maturity date of
May 25, 2016 (the “Non-Revolving Five-Year Term Facility”) and $470 million is under the Revolving Credit Facilities. The Non-
Revolving Five-Year Term Facility requires principal payment of $350,000 per quarter, commencing July 1, 2013.
M a n a g e M e n t ’ s D i s c u s s i o n & a n a l y s i s | 2 0 1 2 a n n u a l r e p o r t40

B i r c h c l i f f e n e r g y l t d .
DISCUSSION OF OPERATIONS
Petroleum and Natural Gas Revenues
Petroleum and Natural Gas (“P&NG”) revenues totalled $78.0 million ($31.81 per boe) for the three month Reporting Period
and $257.2 million ($30.82 per boe) for the twelve month Reporting Period as compared to $70.3 million ($38.55 per boe)
and $264.6 million ($39.97 per boe) for the Comparable Prior Periods. The increase in P&NG revenues from the three month
Comparable Prior Period was largely due to a 46% increase in natural gas production offset by a decrease in oil production
and lower realized oil wellhead prices during the current quarter. The decrease in P&NG revenues from the twelve month
Comparable Prior Period was due to lower realized oil and natural gas wellhead prices offset by an increase in average
daily oil and natural gas production during the year. The following table details Birchcliff’s P&NG revenues, production and
percentage of production and sales prices by category:
Three months endedDecember 31, 2012
Three months endedDecember 31, 2011
TotalRevenue
($000)
AverageDaily
Production (%) Average
($/unit)
TotalRevenue
($000)
AverageDaily
Production (%)Average
($/unit)
Light oil (bbls) 30,575 3,986 15 83.38 37,160 4,229 21 95.52
Natural gas (Mcf) 41,325 131,120 82 3.43 28,169 90,116 76 3.40
Natural gas liquids (bbls) 6,041 816 3 80.44 4,911 564 3 94.67
Total P&NG sales (boe) 77,941 26,655 100 31.79 70,240 19,812 100 38.54
Royalty revenue 60 0.02 21 0.01
P&NG revenues 78,001 31.81 70,261 38.55
Twelve months endedDecember 31, 2012
Twelve months endedDecember 31, 2011
TotalRevenue
($000)
AverageDaily
Production (%) Average
($/unit)
TotalRevenue
($000)
AverageDaily
Production (%)Average
($/unit)
Light oil (bbls) 131,964 4,270 19 84.45 131,118 3,905 22 92.00
Natural gas (Mcf) 102,966 106,868 78 2.63 115,487 82,116 75 3.85
Natural gas liquids (bbls) 22,113 721 3 83.78 17,775 545 3 89.33
Total P&NG sales (boe) 257,043 22,802 100 30.80 264,380 18,136 100 39.94
Royalty revenue 163 0.02 207 0.03
P&NG revenues 257,206 30.82 264,587 39.97
Production
Production averaged 26,655 boe per day in the three month Reporting Period and 22,802 boe per day in the twelve month
Reporting Period, as compared to 19,812 boe per day and 18,136 boe per day in the Comparable Prior Periods.
The 35% increase in production from the three month Comparable Prior Period was mainly due to incremental sales volumes
added from new Montney/Doig horizontal natural gas wells that were tied into Phase III of the PCS Gas Plant during the
fourth quarter of 2012, offset by lower production from the Worsley Light Oil Resource Play. Light oil production was down
in the fourth quarter of 2012 due to infrastructure limitations in a portion of the Worsley field, which are scheduled to be
resolved in the first quarter of 2013.
The 26% increase in production from the twelve month Comparable Prior Period was achieved through the success of
Birchcliff’s capital drilling program, increased incremental production from Montney/Doig horizontal natural gas wells
processed through the PCS Gas Plant and increased light oil production.
2 0 1 2 A N N U A L r e p o r t | M A N A g e M e N t ’ s D i s c U s s i o N & A N A L y s i s 41
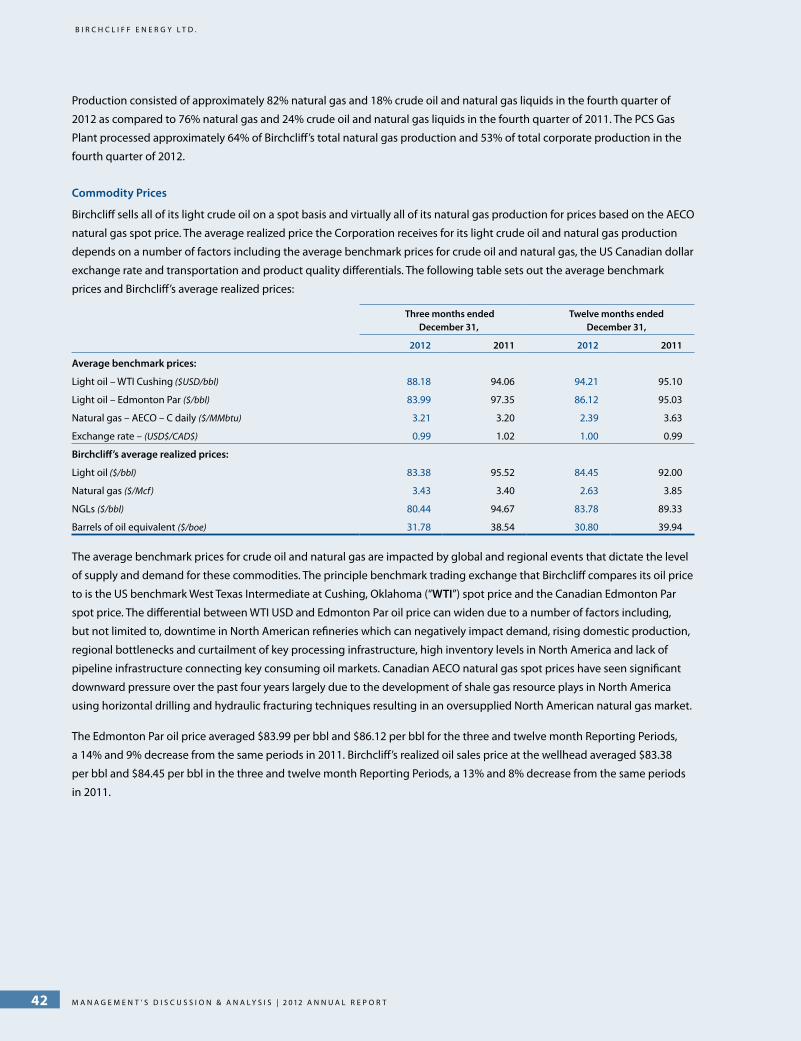
B i r c h c l i f f e n e r g y l t d .
Production consisted of approximately 82% natural gas and 18% crude oil and natural gas liquids in the fourth quarter of
2012 as compared to 76% natural gas and 24% crude oil and natural gas liquids in the fourth quarter of 2011. The PCS Gas
Plant processed approximately 64% of Birchcliff’s total natural gas production and 53% of total corporate production in the
fourth quarter of 2012.
Commodity Prices
Birchcliff sells all of its light crude oil on a spot basis and virtually all of its natural gas production for prices based on the AECO
natural gas spot price. The average realized price the Corporation receives for its light crude oil and natural gas production
depends on a number of factors including the average benchmark prices for crude oil and natural gas, the US Canadian dollar
exchange rate and transportation and product quality differentials. The following table sets out the average benchmark
prices and Birchcliff’s average realized prices:
Three months endedDecember 31,
Twelve months endedDecember 31,
2012 2011 2012 2011
Average benchmark prices:
Light oil – WTI Cushing ($USD/bbl) 88.18 94.06 94.21 95.10
Light oil – Edmonton Par ($/bbl) 83.99 97.35 86.12 95.03
Natural gas – AECO – C daily ($/MMbtu) 3.21 3.20 2.39 3.63
Exchange rate – (USD$/CAD$) 0.99 1.02 1.00 0.99
Birchcliff’s average realized prices:
Light oil ($/bbl) 83.38 95.52 84.45 92.00
Natural gas ($/Mcf) 3.43 3.40 2.63 3.85
NGLs ($/bbl) 80.44 94.67 83.78 89.33
Barrels of oil equivalent ($/boe) 31.78 38.54 30.80 39.94
The average benchmark prices for crude oil and natural gas are impacted by global and regional events that dictate the level
of supply and demand for these commodities. The principle benchmark trading exchange that Birchcliff compares its oil price
to is the US benchmark West Texas Intermediate at Cushing, Oklahoma (“WTI”) spot price and the Canadian Edmonton Par
spot price. The differential between WTI USD and Edmonton Par oil price can widen due to a number of factors including,
but not limited to, downtime in North American refineries which can negatively impact demand, rising domestic production,
regional bottlenecks and curtailment of key processing infrastructure, high inventory levels in North America and lack of
pipeline infrastructure connecting key consuming oil markets. Canadian AECO natural gas spot prices have seen significant
downward pressure over the past four years largely due to the development of shale gas resource plays in North America
using horizontal drilling and hydraulic fracturing techniques resulting in an oversupplied North American natural gas market.
The Edmonton Par oil price averaged $83.99 per bbl and $86.12 per bbl for the three and twelve month Reporting Periods,
a 14% and 9% decrease from the same periods in 2011. Birchcliff’s realized oil sales price at the wellhead averaged $83.38
per bbl and $84.45 per bbl in the three and twelve month Reporting Periods, a 13% and 8% decrease from the same periods
in 2011.
M a n a g e M e n t ’ s D i s c u s s i o n & a n a l y s i s | 2 0 1 2 a n n u a l r e p o r t42
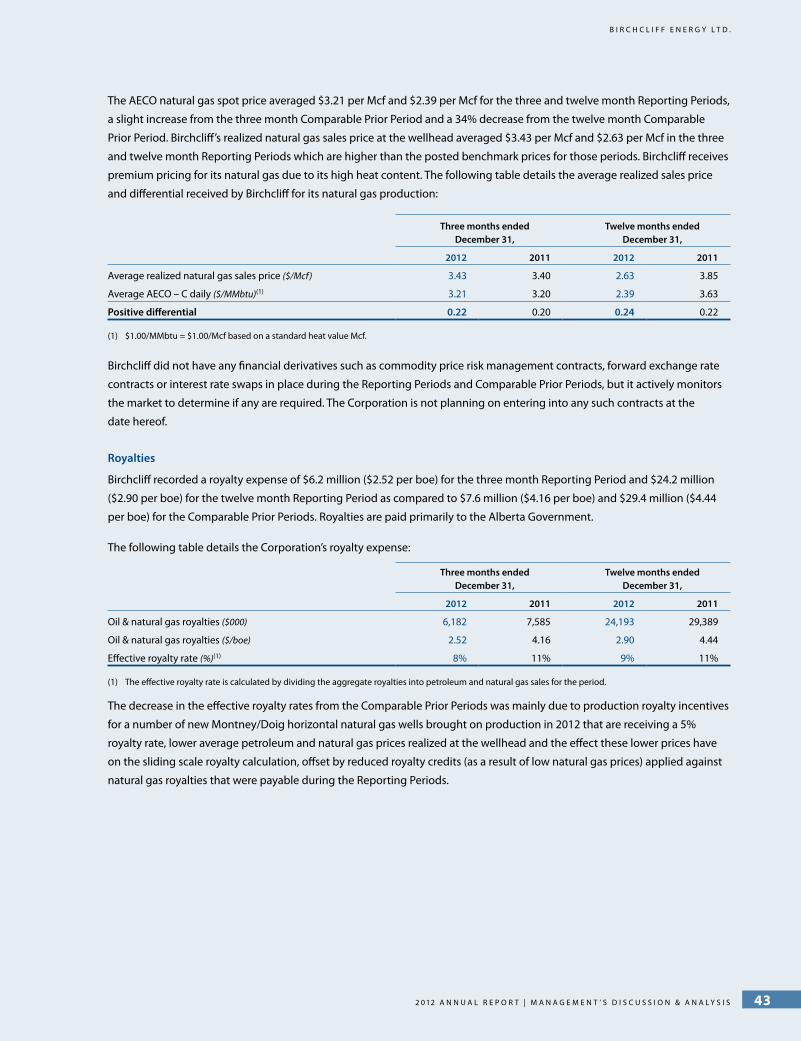
B i r c h c l i f f e n e r g y l t d .
The AECO natural gas spot price averaged $3.21 per Mcf and $2.39 per Mcf for the three and twelve month Reporting Periods,
a slight increase from the three month Comparable Prior Period and a 34% decrease from the twelve month Comparable
Prior Period. Birchcliff’s realized natural gas sales price at the wellhead averaged $3.43 per Mcf and $2.63 per Mcf in the three
and twelve month Reporting Periods which are higher than the posted benchmark prices for those periods. Birchcliff receives
premium pricing for its natural gas due to its high heat content. The following table details the average realized sales price
and differential received by Birchcliff for its natural gas production:
Three months endedDecember 31,
Twelve months endedDecember 31,
2012 2011 2012 2011
Average realized natural gas sales price ($/Mcf) 3.43 3.40 2.63 3.85
Average AECO – C daily ($/MMbtu)(1) 3.21 3.20 2.39 3.63
Positive differential 0.22 0.20 0.24 0.22
(1) $1.00/MMbtu = $1.00/Mcf based on a standard heat value Mcf.
Birchcliff did not have any financial derivatives such as commodity price risk management contracts, forward exchange rate
contracts or interest rate swaps in place during the Reporting Periods and Comparable Prior Periods, but it actively monitors
the market to determine if any are required. The Corporation is not planning on entering into any such contracts at the
date hereof.
Royalties
Birchcliff recorded a royalty expense of $6.2 million ($2.52 per boe) for the three month Reporting Period and $24.2 million
($2.90 per boe) for the twelve month Reporting Period as compared to $7.6 million ($4.16 per boe) and $29.4 million ($4.44
per boe) for the Comparable Prior Periods. Royalties are paid primarily to the Alberta Government.
The following table details the Corporation’s royalty expense:
Three months endedDecember 31,
Twelve months endedDecember 31,
2012 2011 2012 2011
Oil & natural gas royalties ($000) 6,182 7,585 24,193 29,389
Oil & natural gas royalties ($/boe) 2.52 4.16 2.90 4.44
Effective royalty rate (%)(1) 8% 11% 9% 11%
(1) The effective royalty rate is calculated by dividing the aggregate royalties into petroleum and natural gas sales for the period.
The decrease in the effective royalty rates from the Comparable Prior Periods was mainly due to production royalty incentives
for a number of new Montney/Doig horizontal natural gas wells brought on production in 2012 that are receiving a 5%
royalty rate, lower average petroleum and natural gas prices realized at the wellhead and the effect these lower prices have
on the sliding scale royalty calculation, offset by reduced royalty credits (as a result of low natural gas prices) applied against
natural gas royalties that were payable during the Reporting Periods.
2 0 1 2 A N N U A L r e p o r t | M A N A g e M e N t ’ s D i s c U s s i o N & A N A L y s i s 43
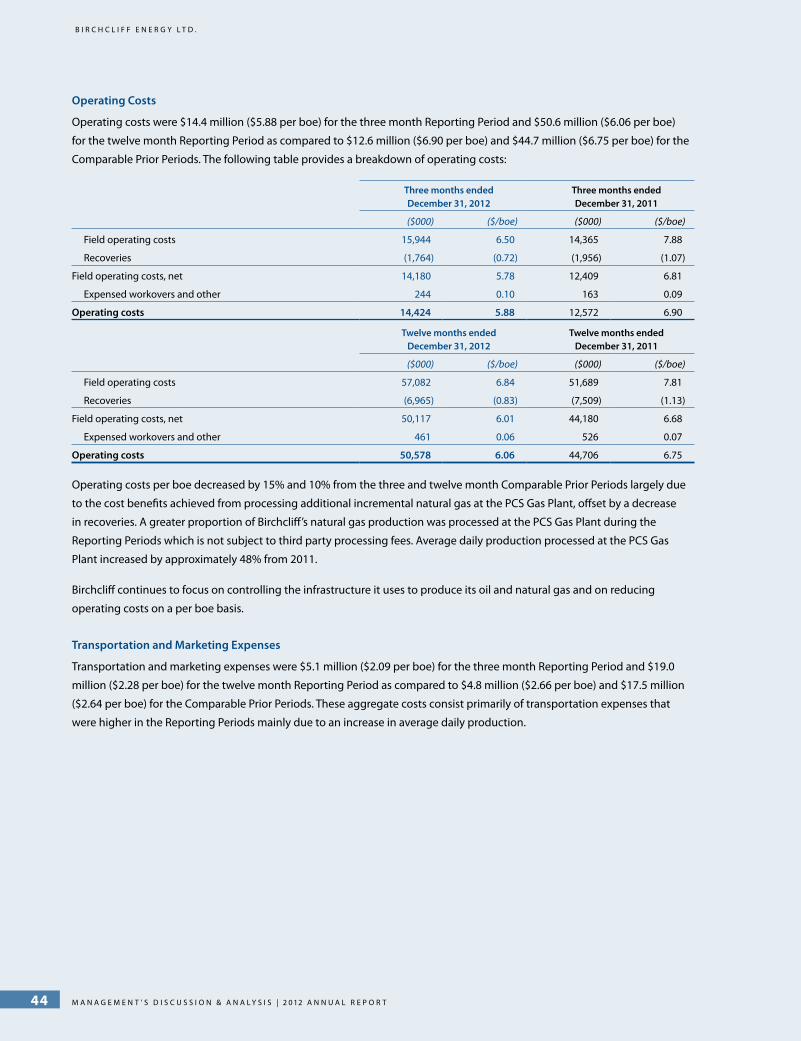
B i r c h c l i f f e n e r g y l t d .
Operating Costs
Operating costs were $14.4 million ($5.88 per boe) for the three month Reporting Period and $50.6 million ($6.06 per boe)
for the twelve month Reporting Period as compared to $12.6 million ($6.90 per boe) and $44.7 million ($6.75 per boe) for the
Comparable Prior Periods. The following table provides a breakdown of operating costs:
Three months endedDecember 31, 2012
Three months endedDecember 31, 2011
($000) ($/boe) ($000) ($/boe)
Field operating costs 15,944 6.50 14,365 7.88
Recoveries (1,764) (0.72) (1,956) (1.07)
Field operating costs, net 14,180 5.78 12,409 6.81
Expensed workovers and other 244 0.10 163 0.09
Operating costs 14,424 5.88 12,572 6.90
Twelve months endedDecember 31, 2012
Twelve months endedDecember 31, 2011
($000) ($/boe) ($000) ($/boe)
Field operating costs 57,082 6.84 51,689 7.81
Recoveries (6,965) (0.83) (7,509) (1.13)
Field operating costs, net 50,117 6.01 44,180 6.68
Expensed workovers and other 461 0.06 526 0.07
Operating costs 50,578 6.06 44,706 6.75
Operating costs per boe decreased by 15% and 10% from the three and twelve month Comparable Prior Periods largely due
to the cost benefits achieved from processing additional incremental natural gas at the PCS Gas Plant, offset by a decrease
in recoveries. A greater proportion of Birchcliff’s natural gas production was processed at the PCS Gas Plant during the
Reporting Periods which is not subject to third party processing fees. Average daily production processed at the PCS Gas
Plant increased by approximately 48% from 2011.
Birchcliff continues to focus on controlling the infrastructure it uses to produce its oil and natural gas and on reducing
operating costs on a per boe basis.
Transportation and Marketing Expenses
Transportation and marketing expenses were $5.1 million ($2.09 per boe) for the three month Reporting Period and $19.0
million ($2.28 per boe) for the twelve month Reporting Period as compared to $4.8 million ($2.66 per boe) and $17.5 million
($2.64 per boe) for the Comparable Prior Periods. These aggregate costs consist primarily of transportation expenses that
were higher in the Reporting Periods mainly due to an increase in average daily production.
M a n a g e M e n t ’ s D i s c u s s i o n & a n a l y s i s | 2 0 1 2 a n n u a l r e p o r t44

B i r c h c l i f f e n e r g y l t d .
Operating Netbacks
The following table details Birchcliff’s net production and operating netbacks for the Montney/Doig Natural Gas Resource
Play, the Worsley Light Oil Resource Play and on a Corporate basis:
Three months endedDecember 31,
Twelve months endedDecember 31,
2012 2011 2012 2011
Montney/Doig Natural Gas Resource Play(1) :
Average daily production, net:
Natural gas (Mcf) 116,899 76,454 92,006 68,405
Oil & NGLs (bbls) 603 431 562 431
Total boe (6:1) 20,087 13,174 15,896 11,831
% of total corporate production(2) 75% 66% 70% 65%
Netback and cost ($/Mcfe):
Petroleum and natural gas revenue 3.73 3.82 3.05 4.26
Royalty expense (0.17) (0.11) (0.11) (0.06)
Operating expense, net of recoveries (0.66) (0.85) (0.70) (0.85)
Transportation and marketing expense (0.24) (0.27) (0.24) (0.27)
Operating netback 2.66 2.59 2.00 3.08
Worsley Light Oil Resource Play(1) :
Average daily production, net:
Natural gas (Mcf) 7,652 8,746 7,944 8,567
Oil & NGLs (bbls) 3,252 3,305 3,313 3,087
Total boe (6:1) 4,527 4,763 4,637 4,514
% of total corporate production(2) 17% 24% 20% 25%
Netback and cost ($/boe):
Petroleum and natural gas revenue 66.08 72.24 64.75 69.73
Royalty expense (7.90) (12.05) (8.26) (8.18)
Operating expense, net of recoveries (9.64) (8.89) (8.60) (8.04)
Transportation and marketing expense (5.06) (5.19) (5.34) (5.12)
Operating netback 43.48 46.11 42.55 48.39
Total Corporate:
Average daily production, net:
Natural gas (Mcf) 131,120 90,116 106,868 82,116
Oil & NGLs (bbls) 4,802 4,793 4,991 4,450
Total boe (6:1) 26,655 19,812 22,802 18,136
Netback and cost ($/boe)
Petroleum and natural gas revenue 31.81 38.55 30.82 39.97
Royalty expense (2.52) (4.16) (2.90) (4.44)
Operating expense, net of recoveries (5.88) (6.90) (6.06) (6.75)
Transportation and marketing expense (2.09) (2.66) (2.28) (2.64)
Operating netback 21.32 24.83 19.58 26.14
(1) Most resource plays produce both oil and natural gas, therefore a resource play is categorized as either a natural gas resource play or an oil resource play based upon the predominate production or play type in that area.
(2) Production from Birchcliff’s other conventional oil and natural gas properties were not significant during the Reporting Periods and Comparable Prior Periods and are less than 10% of total corporate production.
2 0 1 2 A N N U A L r e p o r t | M A N A g e M e N t ’ s D i s c U s s i o N & A N A L y s i s 45
B i r c h c l i f f e n e r g y l t d .
Montney/Doig Natural Gas Resource Play
Birchcliff’s production from the Montney/Doig Natural Gas Resource Play was 20,087 boe per day in the three month
Reporting Period and 15,896 boe per day for the twelve month Reporting Period, a 52% and 34% increase from the same
periods in 2011. The increase from the Comparable Prior Periods was largely due to incremental production adds from new
Montney/Doig horizontal natural gas wells that produced to the PCS Gas Plant during the Reporting Periods. The PCS Gas
Plant is strategically situated on the Montney/Doig Natural Gas Resource Play and processes gas predominately from the
Pouce Coupe and Glacier areas. Production from the Montney/Doig Natural Gas Resource Play accounted for 70% of the total
corporate production in 2012. Natural gas produced from Birchcliff’s other conventional natural gas properties accounted for
3% of total corporate production in 2012.
Birchcliff’s operating netback from the Montney/Doig Natural Gas Resource Play was $2.66 per Mcfe ($15.97 per boe) in the
three month Reporting Period and $2.00 per Mcfe ($12.02 per boe) for the twelve month Reporting Period, a 3% increase
and 35% decrease from the same periods in 2011. The year over year decrease was mainly due to lower average realized
petroleum and natural gas prices offset by a decline in per unit operating costs attributed to a greater proportion of
production from new Montney/Doig natural gas wells producing to the low cost PCS Gas Plant in the Reporting Periods.
Worsley Light Oil Resource Play
Birchcliff’s production from the Worsley Light Oil Resource Play was 4,527 boe per day in the three month Reporting Period
and 4,637 boe per day in the twelve month Reporting Period, a 5% decrease and 3% increase from the Comparable Prior
Periods. The decrease in production from the three month Comparable Prior Period was due to infrastructure limitations in a
portion of the Worsley field, which are scheduled to be resolved in the first quarter of 2013. The year over year increase was
largely due to increased light oil production from the drilling of successful horizontal oil wells in the Worsley area. Birchcliff’s
production from the Worsley Light Oil Resource Play accounted for 20% of the total corporate production in 2012. Oil
produced from Birchcliff’s other conventional oil properties accounted for 7% of total corporate production in 2012.
Operating netback from the Worsley Light Oil Resource Play was $43.48 per bbl in the three month Reporting Period and
$42.55 per bbl for the twelve month Reporting Period, a 6% and 12% decrease from the Comparable Prior Periods. The
decrease from the Comparable Prior Periods was mainly due to lower realized wellhead oil prices offset by higher per unit
operating costs during the Reporting Periods.
M a n a g e M e n t ’ s D i s c u s s i o n & a n a l y s i s | 2 0 1 2 a n n u a l r e p o r t46
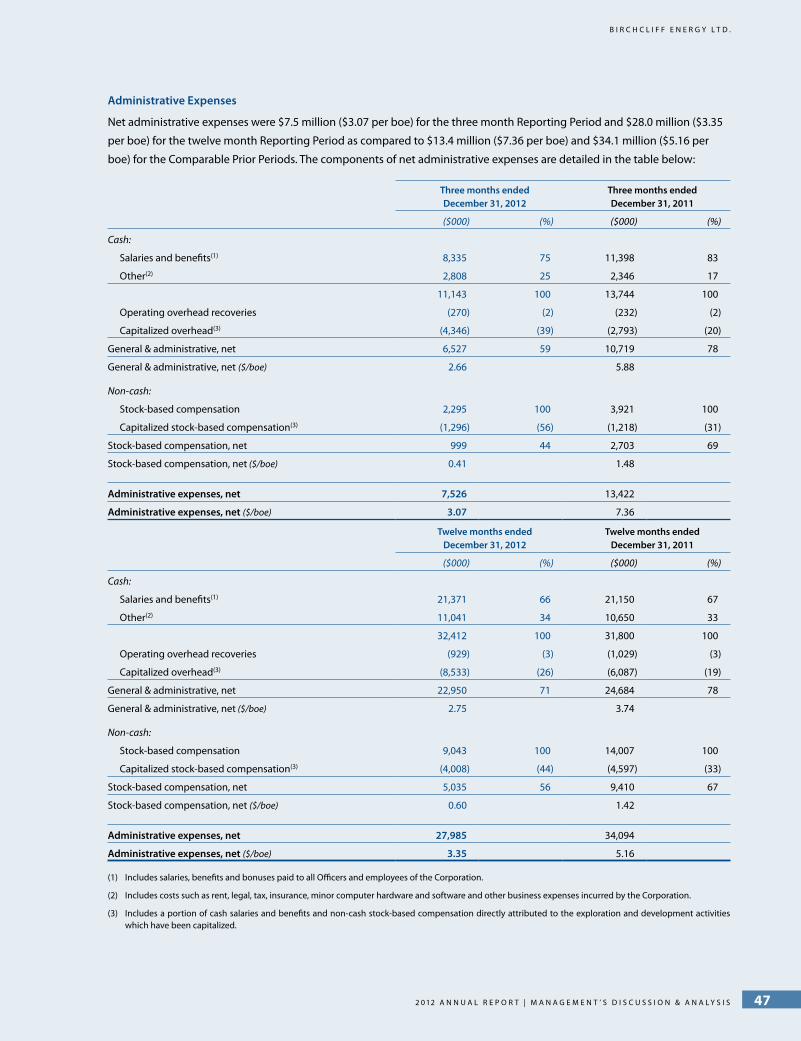
B i r c h c l i f f e n e r g y l t d .
Administrative Expenses
Net administrative expenses were $7.5 million ($3.07 per boe) for the three month Reporting Period and $28.0 million ($3.35
per boe) for the twelve month Reporting Period as compared to $13.4 million ($7.36 per boe) and $34.1 million ($5.16 per
boe) for the Comparable Prior Periods. The components of net administrative expenses are detailed in the table below:
Three months endedDecember 31, 2012
Three months endedDecember 31, 2011
($000) (%) ($000) (%)
Cash:
Salaries and benefits(1) 8,335 75 11,398 83
Other(2) 2,808 25 2,346 17
11,143 100 13,744 100
Operating overhead recoveries (270) (2) (232) (2)
Capitalized overhead(3) (4,346) (39) (2,793) (20)
General & administrative, net 6,527 59 10,719 78
General & administrative, net ($/boe) 2.66 5.88
Non-cash:
Stock-based compensation 2,295 100 3,921 100
Capitalized stock-based compensation(3) (1,296) (56) (1,218) (31)
Stock-based compensation, net 999 44 2,703 69
Stock-based compensation, net ($/boe) 0.41 1.48
Administrative expenses, net 7,526 13,422
Administrative expenses, net ($/boe) 3.07 7.36
Twelve months endedDecember 31, 2012
Twelve months endedDecember 31, 2011
($000) (%) ($000) (%)
Cash:
Salaries and benefits(1) 21,371 66 21,150 67
Other(2) 11,041 34 10,650 33
32,412 100 31,800 100
Operating overhead recoveries (929) (3) (1,029) (3)
Capitalized overhead(3) (8,533) (26) (6,087) (19)
General & administrative, net 22,950 71 24,684 78
General & administrative, net ($/boe) 2.75 3.74
Non-cash:
Stock-based compensation 9,043 100 14,007 100
Capitalized stock-based compensation(3) (4,008) (44) (4,597) (33)
Stock-based compensation, net 5,035 56 9,410 67
Stock-based compensation, net ($/boe) 0.60 1.42
Administrative expenses, net 27,985 34,094
Administrative expenses, net ($/boe) 3.35 5.16
(1) Includes salaries, benefits and bonuses paid to all Officers and employees of the Corporation.
(2) Includes costs such as rent, legal, tax, insurance, minor computer hardware and software and other business expenses incurred by the Corporation.
(3) Includes a portion of cash salaries and benefits and non-cash stock-based compensation directly attributed to the exploration and development activities which have been capitalized.
2 0 1 2 A N N U A L r e p o r t | M A N A g e M e N t ’ s D i s c U s s i o N & A N A L y s i s 47

B i r c h c l i f f e n e r g y l t d .
Birchcliff’s cash net general and administrative expenses in the three month Comparable Prior Period included non-recurring
costs totalling approximately $2.9 million incurred in respect of the corporate sale process, which was terminated on
March 29, 2012.
Net stock-based compensation expense decreased on an aggregate basis from the Comparable Prior Periods mainly due to
a lower Black-Scholes fair value expense calculated for stock options granted during the Reporting Periods. The fair value per
option decreased to $2.50 in 2012 as compared to $5.36 in 2011 mainly due to a lower average share trading price in 2012.
The assumptions used in the Black-Scholes calculation are disclosed in the annual audited financial statements for the year
ended December 31, 2012.
A summary of the Corporation’s outstanding stock options is presented below:
NumberWeighted Average
Exercise Price ($)
Outstanding, December 31, 2010 9,247,520 7.26
Granted 3,164,900 11.53
Exercised (1,616,343) (5.57)
Forfeited (329,136) (9.81)
Outstanding, December 31, 2011 10,466,941 8.73
Granted 3,860,900 6.16
Exercised (675,702) (4.41)
Forfeited (1,188,267) (9.85)
Outstanding, December 31, 2012 12,463,872 8.06
There are 2,939,732 performance warrants with an exercise price of $3.00 per common share outstanding and exercisable at
December 31, 2012 and 6,000,000 warrants with an exercise price of $8.30 per common share outstanding at December 31,
2012. There were no performance warrants exercised or forfeited during 2012. Each stock option, performance warrant and
warrant entitles the holder to purchase one common share at the exercise price.
Depletion and Depreciation Expenses
Depletion and depreciation (“D&D”) expenses were $28.8 million ($11.75 per boe) for the three month Reporting Period
and $95.8 million ($11.48 per boe) for the twelve month Reporting Period as compared to $21.9 million ($11.97 per boe)
and $71.7 million ($10.84 per boe) for the Comparable Prior Periods. D&D expenses increased on an aggregate basis mainly
due to a 35% and 26% increase in average daily production from the three and twelve months ended December 31, 2011,
respectively.
D&D is a function of the estimated proved plus probable reserve additions, the finding and development costs attributable
to those reserves, the associated future development capital required to recover those reserves and production in the period.
Included in the depletion calculation for 2012 were 317.8 MMboe of proved plus probable reserves and $2.19 billion of future
development capital required to recover those reserves. The Corporation determines its D&D expenses on an area basis.
M a n a g e M e n t ’ s D i s c u s s i o n & a n a l y s i s | 2 0 1 2 a n n u a l r e p o r t48

B i r c h c l i f f e n e r g y l t d .
Asset Impairment Test
The Corporation reviews its petroleum and natural gas assets for impairment in accordance with International Accounting
Standards (“IAS”) 36 under IFRS. Birchcliff’s assets are grouped into cash generating units (“CGU”) for the purpose of
determining impairment. A CGU represents the smallest group of assets that generates cash inflows from continuing use
that are largely independent of the cash inflows of other assets or groups of assets. In determining the Corporation’s CGU,
the Corporation took into consideration all available information including, but not limited to, the geographical proximity,
geological similarities (ie. reservoir characteristic, production profiles), degree of shared infrastructure, independent versus
interdependent cash flows, operating structure, regulatory environment and management decision making and overall
business strategy.
CGU’s are reviewed at each reporting date for both internal and external indicators of potential impairment. Potential
impairment indicators include, but are not limited to, changes in Birchcliff’s business plan; deterioration in commodity prices;
negative changes in technological, economic, legal, capital or operating environment; change in the physical condition of
a CGU; current expectation that a material CGU (or a significant component thereof ), is more likely than not to be sold or
otherwise disposed of before the end of its previously estimated useful life; non-compliance of financial debt covenants;
financial and operational performance of a CGU; whether net assets exceed market capitalization and; significant downward
revisions of estimated recoverable proved plus probable reserves.
If impairment indicators exist, an impairment test is performed by comparing a CGU’s carrying value to its recoverable
amount. The recoverable amount of Birchcliff’s CGU is determined as the greater of its current “value in use” and its “fair
value less cost to sell”. In assessing the value in use, the estimated future cash flows from proved and probable reserves
are discounted to their present value using a pre-tax discount rate that reflects current market assessment of the time
value of money. Fair value is determined as the amount that would be obtained from the sale of an asset in an arm’s length
transaction between knowledgeable and willing parties. If the recoverable amount of Birchcliff’s CGU exceeds its carrying
value, no impairment is required.
In light of the low natural gas price environment, Birchcliff performed an impairment test for its petroleum and natural gas
assets on a CGU basis to assess for recoverability. Management has determined that the recoverable amount of Birchcliff’s
CGU exceeds the carrying amount at December 31, 2012 and therefore no impairment exists.
Management has determined that the calculation of the recoverable amount is most sensitive to key assumptions regarding
discount rates, commodity prices and estimated quantities of proved plus probable reserves and future production profile
of those reserves. Each of these underlying key assumptions are reviewed by management and corroborated independently
to assess for reasonableness. In determining the recoverable amount, Birchcliff applied a pre-tax discount rate of 10%
on cash flows from proved plus probable reserves. The petroleum and natural gas future prices are based on period-end
commodity price forecast assumptions determined by the Corporation’s independent reserves evaluator which can be found
at http://www.ajmpc.com/price-forecasts.html.
2 0 1 2 A N N U A L r e p o r t | M A N A g e M e N t ’ s D i s c U s s i o N & A N A L y s i s 49
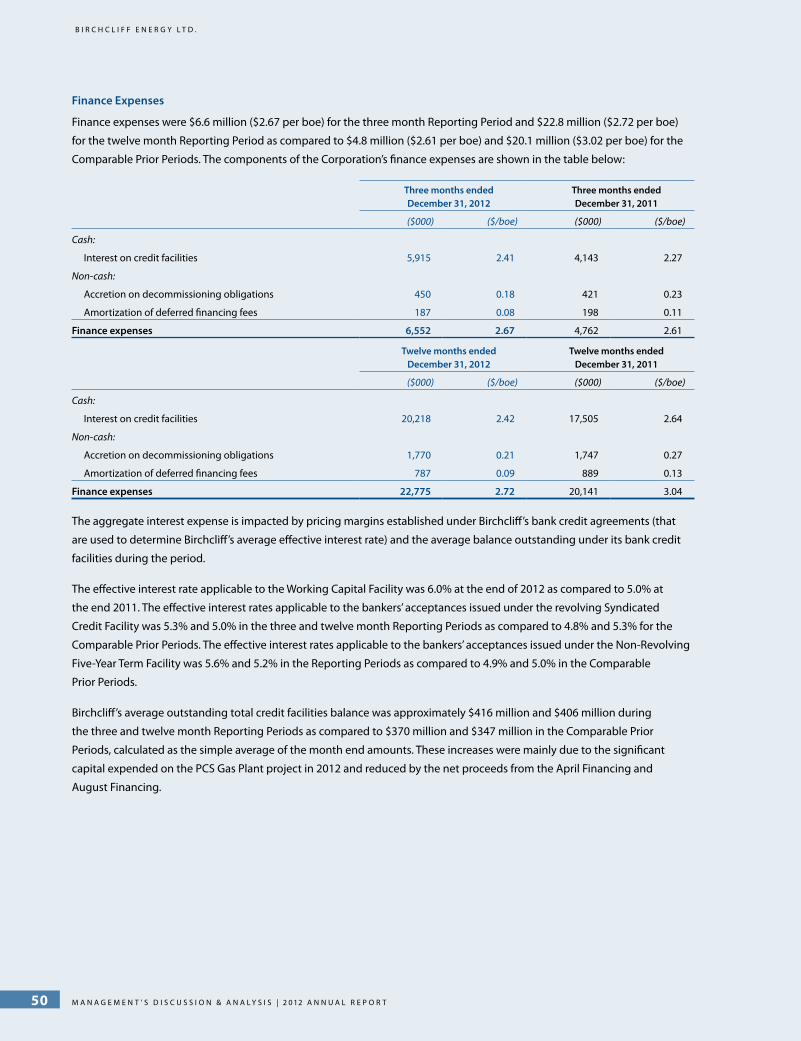
B i r c h c l i f f e n e r g y l t d .
Finance Expenses
Finance expenses were $6.6 million ($2.67 per boe) for the three month Reporting Period and $22.8 million ($2.72 per boe)
for the twelve month Reporting Period as compared to $4.8 million ($2.61 per boe) and $20.1 million ($3.02 per boe) for the
Comparable Prior Periods. The components of the Corporation’s finance expenses are shown in the table below:
Three months endedDecember 31, 2012
Three months endedDecember 31, 2011
($000) ($/boe) ($000) ($/boe)
Cash:
Interest on credit facilities 5,915 2.41 4,143 2.27
Non-cash:
Accretion on decommissioning obligations 450 0.18 421 0.23
Amortization of deferred financing fees 187 0.08 198 0.11
Finance expenses 6,552 2.67 4,762 2.61
Twelve months endedDecember 31, 2012
Twelve months endedDecember 31, 2011
($000) ($/boe) ($000) ($/boe)
Cash:
Interest on credit facilities 20,218 2.42 17,505 2.64
Non-cash:
Accretion on decommissioning obligations 1,770 0.21 1,747 0.27
Amortization of deferred financing fees 787 0.09 889 0.13
Finance expenses 22,775 2.72 20,141 3.04
The aggregate interest expense is impacted by pricing margins established under Birchcliff’s bank credit agreements (that
are used to determine Birchcliff’s average effective interest rate) and the average balance outstanding under its bank credit
facilities during the period.
The effective interest rate applicable to the Working Capital Facility was 6.0% at the end of 2012 as compared to 5.0% at
the end 2011. The effective interest rates applicable to the bankers’ acceptances issued under the revolving Syndicated
Credit Facility was 5.3% and 5.0% in the three and twelve month Reporting Periods as compared to 4.8% and 5.3% for the
Comparable Prior Periods. The effective interest rates applicable to the bankers’ acceptances issued under the Non-Revolving
Five-Year Term Facility was 5.6% and 5.2% in the Reporting Periods as compared to 4.9% and 5.0% in the Comparable
Prior Periods.
Birchcliff’s average outstanding total credit facilities balance was approximately $416 million and $406 million during
the three and twelve month Reporting Periods as compared to $370 million and $347 million in the Comparable Prior
Periods, calculated as the simple average of the month end amounts. These increases were mainly due to the significant
capital expended on the PCS Gas Plant project in 2012 and reduced by the net proceeds from the April Financing and
August Financing.
M a n a g e M e n t ’ s D i s c u s s i o n & a n a l y s i s | 2 0 1 2 a n n u a l r e p o r t50

B i r c h c l i f f e n e r g y l t d .
Sale of Assets
There were no asset divestitures during the fourth quarter of 2012.
During 2012, Birchcliff completed a transaction whereby it disposed of minor assets in the Glacier area of Alberta in exchange
for strategic assets acquired in the Pouce Coupe area of Alberta. The fair value of the swap transaction was estimated at
$25 million. As a result of the disposition, Birchcliff recorded a gain on sale of approximately $3.9 million ($2.9 million, net
of tax) or $0.46 per boe during the year. The Glacier assets were not material to the Corporation’s financial and operational
performance.
During 2011, Birchcliff disposed of minor assets for proceeds of $8.9 million and recorded a net gain of approximately
$2.1 million ($1.6 million, net of tax) or $0.32 per boe in that period.
Income Taxes
Birchcliff recorded an income tax expense of $3.1 million ($1.26 per boe) for the three month Reporting Period and
$7.6 million ($0.91 per boe) for the twelve month Reporting Period as compared to $1.9 million ($1.06 per boe) and
$14.7 million ($2.22 per boe) for the Comparable Prior Periods. Income taxes are impacted by the Corporation’s net income
before taxes and, to a lesser extent, include Part VI.I dividend tax on preferred share dividends paid in the period.
The increase from the three month Comparable Prior Period was due to higher recorded net income before taxes which
resulted in a deferred income tax expense of $2.7 million and a dividend tax of $0.4 million recorded in the fourth quarter of
2012. The year over year decrease was due to lower net income before taxes which resulted in a deferred income tax expense
of $7.0 million offset by a dividend tax of $0.6 million recorded in 2012.
The Corporation’s estimated income tax pools totalled $1.18 billion at December 31, 2012. Management expects that future
taxable income will be available to utilize accumulated tax pools. Birchcliff’s estimated tax pools at December 31, 2012 are
comprised of the following:
Tax pools as atDecember 31, 2012
Canadian oil and gas property expense 260,973
Canadian development expense 224,987
Canadian exploration expense 190,596
Undepreciated cost of capital 231,867
Non-capital losses 268,668
Financing costs 4,217
Estimated income tax pools 1,181,308
The Corporation’s 2006 and 2007 income tax filings were reassessed by the Canada Revenue Agency (“CRA”) in 2011.
The reassessments are based on the CRA’s determination that the tax pools available to Veracel Inc. (“Veracel”), prior
to the amalgamation, ceased to be available to Birchcliff after the amalgamation. The Veracel tax pools in dispute
totalled $39.3 million and include approximately $16.2 million in non-capital losses, $15.6 million in scientific research
and experimental development expenditures and $7.5 million in investment tax credits. The disputed assessments are
outstanding at December 31, 2012. The resolution of the disputed assessments may impact future income tax expense but
will not impact cash taxes payable by the Corporation. Management believes that it will be successful in defending its tax
position respecting the Veracel transaction, and as such, the Corporation has not recognized a related provision for deferred
income tax liability at December 31, 2012.
2 0 1 2 A N N U A L r e p o r t | M A N A g e M e N t ’ s D i s c U s s i o N & A N A L y s i s 51
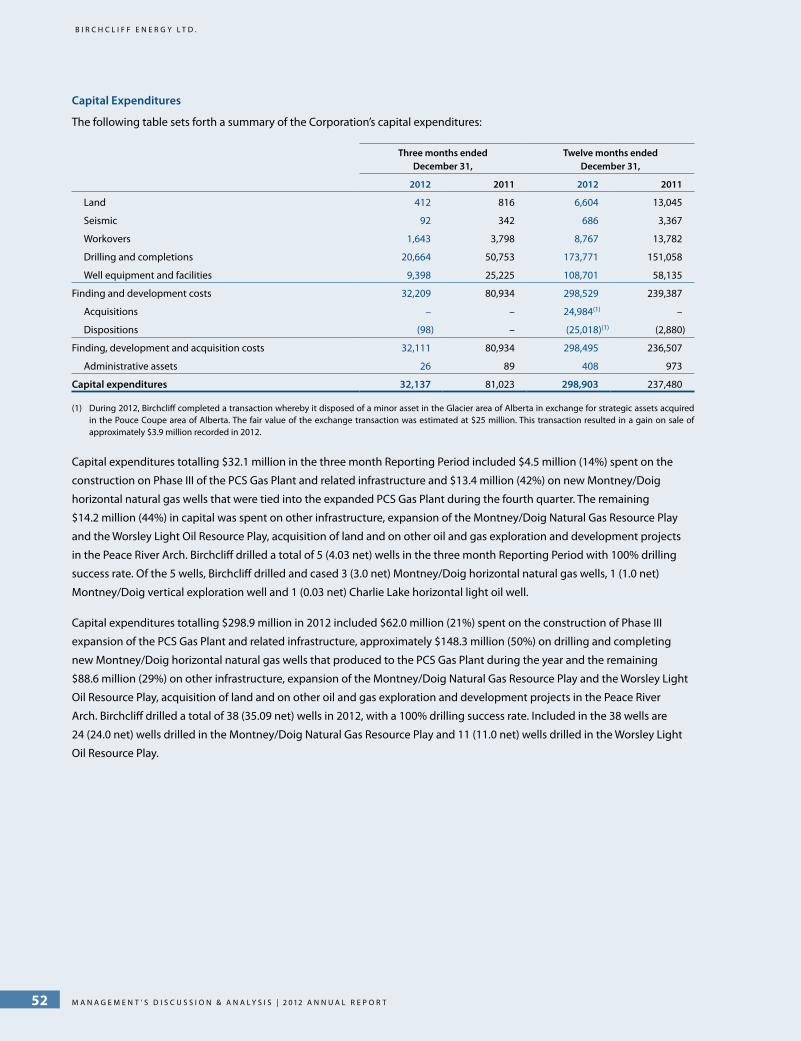
B i r c h c l i f f e n e r g y l t d .
Capital Expenditures
The following table sets forth a summary of the Corporation’s capital expenditures:
Three months ended December 31,
Twelve months ended December 31,
2012 2011 2012 2011
Land 412 816 6,604 13,045
Seismic 92 342 686 3,367
Workovers 1,643 3,798 8,767 13,782
Drilling and completions 20,664 50,753 173,771 151,058
Well equipment and facilities 9,398 25,225 108,701 58,135
Finding and development costs 32,209 80,934 298,529 239,387
Acquisitions – – 24,984(1) –
Dispositions (98) – (25,018)(1) (2,880)
Finding, development and acquisition costs 32,111 80,934 298,495 236,507
Administrative assets 26 89 408 973
Capital expenditures 32,137 81,023 298,903 237,480
(1) During 2012, Birchcliff completed a transaction whereby it disposed of a minor asset in the Glacier area of Alberta in exchange for strategic assets acquired in the Pouce Coupe area of Alberta. The fair value of the exchange transaction was estimated at $25 million. This transaction resulted in a gain on sale of approximately $3.9 million recorded in 2012.
Capital expenditures totalling $32.1 million in the three month Reporting Period included $4.5 million (14%) spent on the
construction on Phase III of the PCS Gas Plant and related infrastructure and $13.4 million (42%) on new Montney/Doig
horizontal natural gas wells that were tied into the expanded PCS Gas Plant during the fourth quarter. The remaining
$14.2 million (44%) in capital was spent on other infrastructure, expansion of the Montney/Doig Natural Gas Resource Play
and the Worsley Light Oil Resource Play, acquisition of land and on other oil and gas exploration and development projects
in the Peace River Arch. Birchcliff drilled a total of 5 (4.03 net) wells in the three month Reporting Period with 100% drilling
success rate. Of the 5 wells, Birchcliff drilled and cased 3 (3.0 net) Montney/Doig horizontal natural gas wells, 1 (1.0 net)
Montney/Doig vertical exploration well and 1 (0.03 net) Charlie Lake horizontal light oil well.
Capital expenditures totalling $298.9 million in 2012 included $62.0 million (21%) spent on the construction of Phase III
expansion of the PCS Gas Plant and related infrastructure, approximately $148.3 million (50%) on drilling and completing
new Montney/Doig horizontal natural gas wells that produced to the PCS Gas Plant during the year and the remaining
$88.6 million (29%) on other infrastructure, expansion of the Montney/Doig Natural Gas Resource Play and the Worsley Light
Oil Resource Play, acquisition of land and on other oil and gas exploration and development projects in the Peace River
Arch. Birchcliff drilled a total of 38 (35.09 net) wells in 2012, with a 100% drilling success rate. Included in the 38 wells are
24 (24.0 net) wells drilled in the Montney/Doig Natural Gas Resource Play and 11 (11.0 net) wells drilled in the Worsley Light
Oil Resource Play.
M a n a g e M e n t ’ s D i s c u s s i o n & a n a l y s i s | 2 0 1 2 a n n u a l r e p o r t52

B i r c h c l i f f e n e r g y l t d .
CAPITAL RESOURCES AND LIQUIDITY
Capital Resources
The following table sets forth a summary of the Corporation’s capital resources:
Three months ended December 31,
Twelve months ended December 31,
2012 2011 2012 2011
Funds flow from operations 39,848 30,400 120,259 130,826
Changes in non-cash working capital from operations 4,483 19,032 (11,352) 13,128
Decommissioning expenditures (372) (349) (678) (1,057)
Issue of common shares 358 444 113,126 9,001
Issue of preferred shares and warrants – – 50,000 –
Share issue costs (57) – (5,915) –
Dividends paid on preferred shares (1,000) – (1,579) –
Financing fees paid on credit facilities – – (600) (1,356)
Net change in Non-Revolving Five-Year Term Facility 52 78 (114) 69,537
Net change in Revolving Credit Facilities 42,482 28,841 44,767 (14,114)
Changes in non-cash working capital from investing (53,657) 2,577 (9,030) 26,717
Capital resources 32,137 81,023 298,884 232,682
Working Capital
The Corporation’s working capital deficit (current assets minus current liabilities) decreased to $29.6 million at December 31,
2012 from $48.6 million at December 31, 2011. The deficit at December 31, 2012 is largely comprised of costs incurred for
Phase III expansion of the PCS Gas Plant, related infrastructure and associated wells.
At December 31, 2012, the major components of Birchcliff’s current assets were: joint interest billings to be received from
its partners (15%) and revenue to be received from its marketers in respect of December 2012 production (78%), which was
subsequently received in January 2013. In contrast, current liabilities largely consisted of trade and joint venture payables
(61%) and accrued capital and operating costs (36%). Birchcliff routinely assesses the financial strength of its marketers
and joint venture partners in accordance with the Corporation’s credit risk guidelines. At this time, Birchcliff expects that
such counterparties will be able to meet their financial obligations during this period of low natural gas prices. For further
assessment of credit risk, refer to the Financial Instrument section of the financial statements of the Corporation for the year
ended December 31, 2012.
Birchcliff manages its working capital using its funds flow from operations and advances under its bank credit facilities. The
Corporation’s working capital deficit does not reduce the amount available under its bank credit facilities. The Corporation
did not identify any liquidity issues with respect to the operation of its petroleum and natural gas business during 2012.
2 0 1 2 A N N U A L r e p o r t | M A N A g e M e N t ’ s D i s c U s s i o N & A N A L y s i s 53

B i r c h c l i f f e n e r g y l t d .
Bank Debt
Total debt, including the working capital deficit, was $462.1 million at December 31, 2012 as compared to $437.0 million at
December 31, 2011. Total debt from the end of 2011 was increased by $178.6 million in capital spent in excess of funds flow
in 2012 and was reduced by aggregate net proceeds of $154.3 million from the April Financing and August Financing.
The amount outstanding under Birchcliff’s long-term bank credit facilities at December 31, 2012 (as disclosed on the
Statement of Financial Position of the Corporation) was $432.6 million (December 31, 2011 – $388.4 million), which is net of
$5.4 million (December 31, 2011 – $4.8 million) in unamortized interest and fees.
A significant portion of the funds drawn under Birchcliff’s bank credit facilities in 2012 was to pay costs relating to the
construction of Phase III of the PCS Gas Plant, including the drilling and completion of new Montney/Doig horizontal natural
gas wells that were tied into Phase III and on expansion of the Montney/Doig Resource Natural Gas Play and the Worsley
Light Oil Resource Play.
The following table shows the Corporation’s unused bank credit facilities:
As at December 31, 2012 2011
Maximum borrowing base limit (1)(2):
Non-Revolving Five-Year Term Facility 70,000 70,000
Revolving Credit Facilities 470,000 450,000
540,000 520,000
Principal amount utilized:
Drawn Non-Revolving Five-Year Term Facility(3) (70,000) (70,000)
Drawn Revolving Credit Facilities(3) (368,654) (323,221)
Outstanding letters of credit(4) (184) (2,668)
(438,838) (395,889)
Unused credit(2) 101,162 124,111
(1) The Corporation’s credit facilities are subject to a semi-annual review of the borrowing base limit, which is directly impacted by the value of Birchcliff’s petroleum and natural gas reserves.
(2) The quarterly financial covenants applicable to the Corporation’s credit facilities include (i) an interest coverage ratio, which is calculated on a historical rolling four quarter basis, as earnings before interest and non-cash items including income taxes, stock-based compensation, gains and losses on sale of assets and depletion, depreciation and amortization (“EBITDA”) divided by interest expense and (ii) a debt to EBITDA ratio. Debt for this purpose means indebtedness for borrowed money, as determined at the end of the reporting period, and includes outstanding debt under the Corporation’s credit facilities as shown on the Statements of Financial Position before unamortized deferred financing fees and including outstanding letters of credit but does not include working capital deficiency.
The Corporation is required to ensure that on the last day of each reporting period, the ratio of EBITDA to interest expense, determined on a historical rolling four quarter basis equals or exceeds 3.5:1.0 and the ratio of debt to EBITDA, determined on a historical rolling four quarter basis does not exceed 4.0:1.0. At December 31, 2012, Birchcliff’s EBITDA to interest expense coverage was 6:9:1.0 and Debt to EBITDA was 3:0:1.0. The Corporation was compliant with all financial covenants under its credit facilities as at December 31, 2012 and December 31, 2011.
At December 31, 2012, Birchcliff’s debt to EBITDA covenant does not restrict the Corporation from drawing the maximum amount of $540 million available under its credit facilities.
(3) The drawn amounts are not reduced for unamortized costs and fees associated with each credit facility.
(4) Letters of credit are issued to various service providers. There were no amounts drawn on the letters of credit as at and during the periods ended December 31, 2012 and December 31, 2011.
M a n a g e M e n t ’ s D i s c u s s i o n & a n a l y s i s | 2 0 1 2 a n n u a l r e p o r t54

B i r c h c l i f f e n e r g y l t d .
Contractual Obligations
The Corporation enters into contractual obligations in the ordinary course of conducting its day-to-day business. The
following table lists Birchcliff’s estimated material contractual obligations at December 31, 2012:
2013 2014 2015 – 2017
Accounts payable and accrued liabilities 58,846 – –
Drawn Non-Revolving Five-Year Term Facility 700 1,400 67,900
Drawn Revolving Credit Facilities – – 368,654
Office lease(1) 3,285 3,285 9,582
Transportation and processing 16,235 9,339 7,978
Estimated contractual obligations(2) 79,066 14,024 454,114
(1) The Corporation is committed under an operating lease relating to its office premises, beginning December 1, 2007 and expiring on November 30, 2017. Commencing November 2012, Birchcliff is committed to the entire leased premise and has not sublet any excess space to an arms’ length party.
(2) Contractual commitments that are routine in nature and form part of the normal course of operations for Birchcliff are not included. The Corporation’s decommissioning obligations are excluded from the table as these obligations arise from a regulatory requirement rather than from a contractual arrangement. Birchcliff estimates the total undiscounted cash flow to settle its decommissioning obligations at December 31, 2012 to be approximately $124.0 million and will be incurred as follows: 2013 - $0.8 million, 2014 - $1.2 million, 2015 to 2017 - $5.4 million and $116.6 million thereafter. The estimate for undiscounted decommissioning obligations requires significant assumptions on both the abandonment cost and timing of the decommissioning and therefore the actual obligation may differ materially.
Off-Balance Sheet Transactions
Birchcliff was not involved in any off-balance sheet transactions that would result in a material change to its financial position,
performance or cash flows during the Reporting Periods.
OUTSTANDING SHARE INFORMATION
The common shares and preferred shares of Birchcliff are the only class of shares outstanding as at December 31, 2012.
Birchcliff’s common shares began trading on the TSX on July 21, 2005 under the symbol “BIR” and were at the same time
de-listed from the TSX Venture Exchange where they were trading under the same symbol prior to such time. Birchcliff’s
common shares are included in the S&P/TSX Composite Index. Birchcliff’s Series A Preferred Shares and warrants began
trading on August 8, 2012 and are individually listed on the TSX under the symbols BIR.PR.A and BIR.WT, respectively.
The following table summarizes the common shares issued in the Reporting Periods:
Common shares
Balance at December 31, 2010 125,129,234
Issue of common shares upon exercise of options 1,616,343
Balance at December 31, 2011 126,745,577
Issue of common shares(1) 13,075,000
Issue of flow-through common shares(1) 1,100,000
Issue of common shares upon exercise of options 675,702
Balance at December 31, 2012 141,596,279
(1) Issued in conjunction with the April Financing.
At March 12, 2013, there were outstanding 141,893,129 common shares, 2,000,000 Preferred Shares, Series A, 13,377,422
stock options to purchase an equivalent number of common shares, 2,939,732 performance warrants to purchase an
equivalent number of common shares and 6,000,000 warrants to purchase an equivalent number of common shares.
On December 6, 2012, the Board of Directors declared a quarterly cash dividend of $1.0 million or $0.50 per Series A Preferred
Share, payable to the shareholders of record as at the close of business on December 19, 2012. On September 6, 2012, the
2 0 1 2 A N N U A L r e p o r t | M A N A g e M e N t ’ s D i s c U s s i o N & A N A L y s i s 55
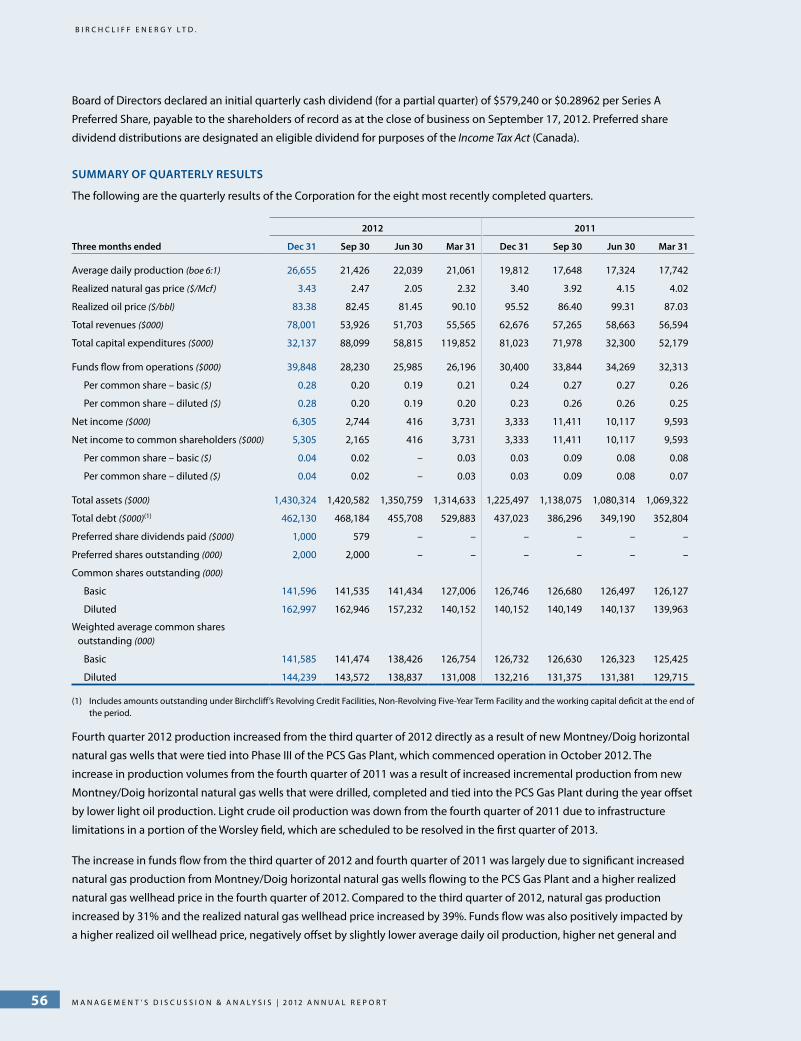
B i r c h c l i f f e n e r g y l t d .
Board of Directors declared an initial quarterly cash dividend (for a partial quarter) of $579,240 or $0.28962 per Series A
Preferred Share, payable to the shareholders of record as at the close of business on September 17, 2012. Preferred share
dividend distributions are designated an eligible dividend for purposes of the Income Tax Act (Canada).
SUMMARY OF QUARTERLY RESULTS
The following are the quarterly results of the Corporation for the eight most recently completed quarters.
2012 2011
Three months ended Dec 31 Sep 30 Jun 30 Mar 31 Dec 31 Sep 30 Jun 30 Mar 31
Average daily production (boe 6:1) 26,655 21,426 22,039 21,061 19,812 17,648 17,324 17,742
Realized natural gas price ($/Mcf) 3.43 2.47 2.05 2.32 3.40 3.92 4.15 4.02
Realized oil price ($/bbl) 83.38 82.45 81.45 90.10 95.52 86.40 99.31 87.03
Total revenues ($000) 78,001 53,926 51,703 55,565 62,676 57,265 58,663 56,594
Total capital expenditures ($000) 32,137 88,099 58,815 119,852 81,023 71,978 32,300 52,179
Funds flow from operations ($000) 39,848 28,230 25,985 26,196 30,400 33,844 34,269 32,313
Per common share – basic ($) 0.28 0.20 0.19 0.21 0.24 0.27 0.27 0.26
Per common share – diluted ($) 0.28 0.20 0.19 0.20 0.23 0.26 0.26 0.25
Net income ($000) 6,305 2,744 416 3,731 3,333 11,411 10,117 9,593
Net income to common shareholders ($000) 5,305 2,165 416 3,731 3,333 11,411 10,117 9,593
Per common share – basic ($) 0.04 0.02 – 0.03 0.03 0.09 0.08 0.08
Per common share – diluted ($) 0.04 0.02 – 0.03 0.03 0.09 0.08 0.07
Total assets ($000) 1,430,324 1,420,582 1,350,759 1,314,633 1,225,497 1,138,075 1,080,314 1,069,322
Total debt ($000)(1) 462,130 468,184 455,708 529,883 437,023 386,296 349,190 352,804
Preferred share dividends paid ($000) 1,000 579 – – – – – –
Preferred shares outstanding (000) 2,000 2,000 – – – – – –
Common shares outstanding (000)
Basic 141,596 141,535 141,434 127,006 126,746 126,680 126,497 126,127
Diluted 162,997 162,946 157,232 140,152 140,152 140,149 140,137 139,963
Weighted average common shares outstanding (000)
Basic 141,585 141,474 138,426 126,754 126,732 126,630 126,323 125,425
Diluted 144,239 143,572 138,837 131,008 132,216 131,375 131,381 129,715
(1) Includes amounts outstanding under Birchcliff’s Revolving Credit Facilities, Non-Revolving Five-Year Term Facility and the working capital deficit at the end of the period.
Fourth quarter 2012 production increased from the third quarter of 2012 directly as a result of new Montney/Doig horizontal
natural gas wells that were tied into Phase III of the PCS Gas Plant, which commenced operation in October 2012. The
increase in production volumes from the fourth quarter of 2011 was a result of increased incremental production from new
Montney/Doig horizontal natural gas wells that were drilled, completed and tied into the PCS Gas Plant during the year offset
by lower light oil production. Light crude oil production was down from the fourth quarter of 2011 due to infrastructure
limitations in a portion of the Worsley field, which are scheduled to be resolved in the first quarter of 2013.
The increase in funds flow from the third quarter of 2012 and fourth quarter of 2011 was largely due to significant increased
natural gas production from Montney/Doig horizontal natural gas wells flowing to the PCS Gas Plant and a higher realized
natural gas wellhead price in the fourth quarter of 2012. Compared to the third quarter of 2012, natural gas production
increased by 31% and the realized natural gas wellhead price increased by 39%. Funds flow was also positively impacted by
a higher realized oil wellhead price, negatively offset by slightly lower average daily oil production, higher net general and
M a n a g e M e n t ’ s D i s c u s s i o n & a n a l y s i s | 2 0 1 2 a n n u a l r e p o r t56

B i r c h c l i f f e n e r g y l t d .
administrative and interest costs and increased royalty, production and transportation and marketing costs due to increased
production in the fourth quarter of 2012. Compared to the fourth quarter of 2011, natural gas production increased by 46%
and the realized natural gas wellhead price increased less than 1%. Funds flow from operations was positively impacted by
lower royalty and cash general and administrative expenses and negatively impacted by decreased oil production, a lower
realized oil wellhead price and higher interest costs in the fourth quarter of 2012. Higher average production in the fourth
quarter of 2012 resulted in aggregate increases to production and transportation and marketing costs in the period.
Notwithstanding a decline in natural gas prices over the last four years, Birchcliff has continued to report positive earnings in
each of its last 13 recently completed quarters. The increase in net income available to common shareholders from the third
quarter of 2012 and fourth quarter of 2011 was largely due to higher funds flow from operations and lower net stock-based
compensation expense offset by higher depletion expense in the current quarter resulting from increased natural gas
production, higher income taxes and increased payments on preferred share dividends in the fourth quarter of 2012.
Total debt in 2012 was reduced by net proceeds of $154.3 million from the April Financing and August Financing, offset by an
increase in capital spending in excess of funds flow totalling $178.6 million during the year. A significant portion of the capital
spent in 2012 was on the PCS Gas Plant project.
As a result of the April Financing, both the end of period and weighted average common shares outstanding at December 31,
2012 increased from December 31, 2011. Birchcliff also issued 2,000,000 Series A Preferred Shares in the third quarter of 2012
as part of the August Financing.
POTENTIAL TRANSACTIONS
Within its focus area, the Corporation is always reviewing potential property acquisitions and corporate mergers and
acquisitions for the purposes of determining whether any such potential transaction is of interest to the Corporation and
the terms on which such a potential transaction would be available. As a result, the Corporation may from time to time be
involved in discussions or negotiations with other parties or their agents in respect of potential property acquisitions and
corporate merger and acquisition opportunities, but the Corporation is not committed to any such potential transaction and
cannot be reasonably confident that it can complete any such potential transaction until appropriate legal documentation
has been signed by the relevant parties.
CONTROLS AND PROCEDURES
Disclosure Controls and Procedures
The Corporation has established and maintained disclosure control and procedures (“DC&P”) that have been designed by,
or under the supervision of, the Corporation’s Chief Executive Officer and the Chief Financial Officer (“Certifying Officers”)
to provide reasonable assurance that information required to be disclosed by the Corporation in its annual filings, interim
filings or other reports filed or submitted under securities legislation is accumulated and communicated to management, as
appropriate, to allow timely decisions regarding required disclosure. The Certifying Officers have evaluated, or caused to be
evaluated under their supervision, the effectiveness of the Corporation’s DC&P at December 31, 2012 and have concluded
that the Corporation’s DC&P are appropriately designed and operating effectively to provide reasonable assurance that
information required by securities legislation to be disclosed is made known to them by others, to allow timely decisions
regarding the required disclosure.
While the Certifying Officers believe that the Corporation’s DC&P provide a reasonable level of assurance and are effective,
they do not expect that the DC&P will prevent all errors and fraud. A control system, no matter how well conceived,
maintained and operated, can provide only reasonable, but not absolute, assurance that the objectives of the control system
will be met.
2 0 1 2 A N N U A L r e p o r t | M A N A g e M e N t ’ s D i s c U s s i o N & A N A L y s i s 57
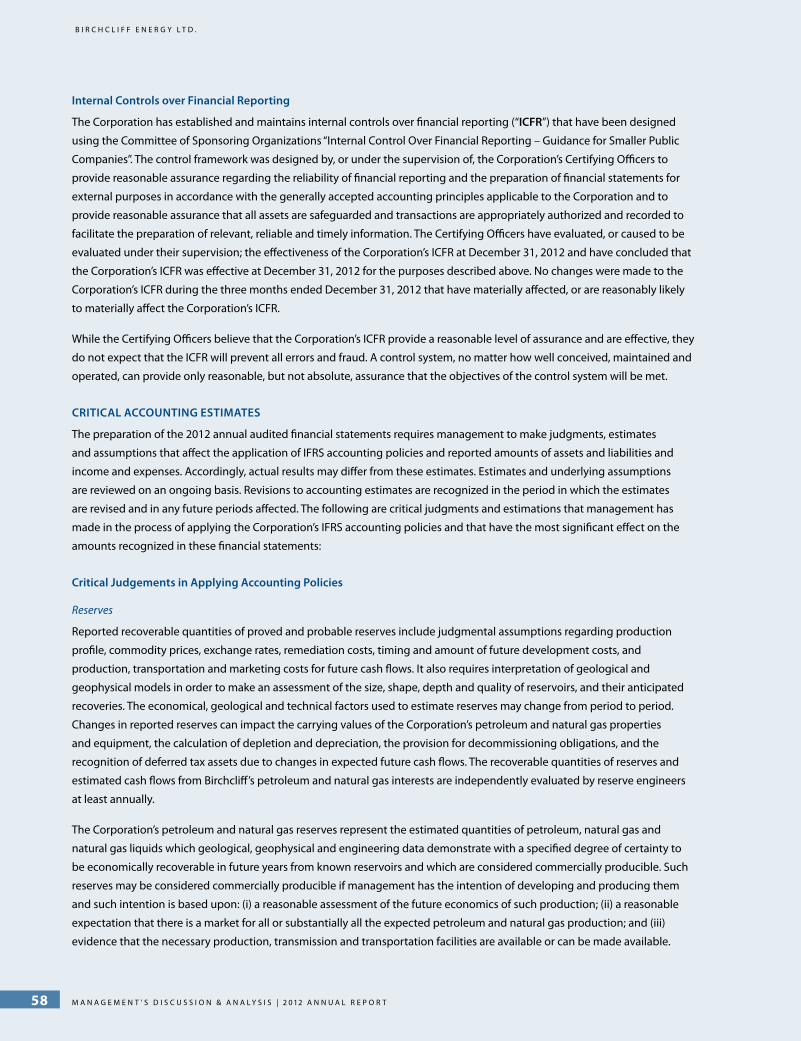
B i r c h c l i f f e n e r g y l t d .
Internal Controls over Financial Reporting
The Corporation has established and maintains internal controls over financial reporting (“ICFR”) that have been designed
using the Committee of Sponsoring Organizations “Internal Control Over Financial Reporting – Guidance for Smaller Public
Companies”. The control framework was designed by, or under the supervision of, the Corporation’s Certifying Officers to
provide reasonable assurance regarding the reliability of financial reporting and the preparation of financial statements for
external purposes in accordance with the generally accepted accounting principles applicable to the Corporation and to
provide reasonable assurance that all assets are safeguarded and transactions are appropriately authorized and recorded to
facilitate the preparation of relevant, reliable and timely information. The Certifying Officers have evaluated, or caused to be
evaluated under their supervision; the effectiveness of the Corporation’s ICFR at December 31, 2012 and have concluded that
the Corporation’s ICFR was effective at December 31, 2012 for the purposes described above. No changes were made to the
Corporation’s ICFR during the three months ended December 31, 2012 that have materially affected, or are reasonably likely
to materially affect the Corporation’s ICFR.
While the Certifying Officers believe that the Corporation’s ICFR provide a reasonable level of assurance and are effective, they
do not expect that the ICFR will prevent all errors and fraud. A control system, no matter how well conceived, maintained and
operated, can provide only reasonable, but not absolute, assurance that the objectives of the control system will be met.
CRITICAL ACCOUNTING ESTIMATES
The preparation of the 2012 annual audited financial statements requires management to make judgments, estimates
and assumptions that affect the application of IFRS accounting policies and reported amounts of assets and liabilities and
income and expenses. Accordingly, actual results may differ from these estimates. Estimates and underlying assumptions
are reviewed on an ongoing basis. Revisions to accounting estimates are recognized in the period in which the estimates
are revised and in any future periods affected. The following are critical judgments and estimations that management has
made in the process of applying the Corporation’s IFRS accounting policies and that have the most significant effect on the
amounts recognized in these financial statements:
Critical Judgements in Applying Accounting Policies
Reserves
Reported recoverable quantities of proved and probable reserves include judgmental assumptions regarding production
profile, commodity prices, exchange rates, remediation costs, timing and amount of future development costs, and
production, transportation and marketing costs for future cash flows. It also requires interpretation of geological and
geophysical models in order to make an assessment of the size, shape, depth and quality of reservoirs, and their anticipated
recoveries. The economical, geological and technical factors used to estimate reserves may change from period to period.
Changes in reported reserves can impact the carrying values of the Corporation’s petroleum and natural gas properties
and equipment, the calculation of depletion and depreciation, the provision for decommissioning obligations, and the
recognition of deferred tax assets due to changes in expected future cash flows. The recoverable quantities of reserves and
estimated cash flows from Birchcliff’s petroleum and natural gas interests are independently evaluated by reserve engineers
at least annually.
The Corporation’s petroleum and natural gas reserves represent the estimated quantities of petroleum, natural gas and
natural gas liquids which geological, geophysical and engineering data demonstrate with a specified degree of certainty to
be economically recoverable in future years from known reservoirs and which are considered commercially producible. Such
reserves may be considered commercially producible if management has the intention of developing and producing them
and such intention is based upon: (i) a reasonable assessment of the future economics of such production; (ii) a reasonable
expectation that there is a market for all or substantially all the expected petroleum and natural gas production; and (iii)
evidence that the necessary production, transmission and transportation facilities are available or can be made available.
M a n a g e M e n t ’ s D i s c u s s i o n & a n a l y s i s | 2 0 1 2 a n n u a l r e p o r t58

B i r c h c l i f f e n e r g y l t d .
Reserves may only be considered proven and probable if producibility is supported by either production or conclusive
formation tests. Birchcliff’s oil and gas reserves are determined in accordance with the standards contained in National
Instrument 51-101 Standard of Disclosures for Oil and Gas Activities and the Canadian Oil and Gas Evaluation Handbook.
Identification of cash-generating units
Birchcliff’s assets are aggregated into CGU’s for the purpose of calculating impairment based on their ability to generate
largely independent cash inflows. CGU’s have been determined based on similar geological structure, shared infrastructure,
geographical proximity, operating structure, commodity type and similar exposures to market risks. By their nature, these
assumptions are subject to management’s judgement and may impact the carrying value of the Corporation’s assets in future
periods.
Identification of impairment indicators
IFRS requires Birchcliff to assess, at each reporting date, whether there are any indicators that its assets may be impaired.
Birchcliff is required to consider information from both external sources (such as negative downturn in commodity prices,
significant adverse changes in the technological, market, economic or legal environment in which the entity operates)
and internal sources (such as downward revisions in reserves, significant adverse effect on the financial and operational
performance of a CGU, evidence of obsolescence or physical damage to the asset). By their nature, these assumptions are
subject to management’s judgement and may impact the carrying value of the Corporation’s assets in future periods.
Tax uncertainties
IFRS requires Birchcliff, at each reporting date, to make certain judgements on uncertain tax positions by relevant tax
authorities. Judgements include determining whether the Corporation will “more likely than not” be successful in defending
its tax positions by considering information from relevant tax interpretations and tax laws in Canada. As such, this recognition
threshold is subject to management’s judgement and may impact the carrying value of the Corporation’s deferred tax assets
and liabilities at the end of the reporting period.
Key Sources of Estimation Uncertainty
The following are the key assumptions concerning the sources of estimation uncertainty at the end of the reporting period,
that have a significant risk of causing adjustments to the carrying amounts of assets and liabilities within the next financial
year:
Share-based payments
All equity-settled, share-based awards issued by the Corporation are fair valued using the Black-Scholes option-pricing
model. In assessing the fair value of equity-based compensation, estimates have to be made regarding the expected volatility
in share price, option life, dividend yield, risk-free rate and estimated forfeitures at the initial grant date.
Decommissioning obligations
The Corporation estimates future remediation costs of production facilities, wells and pipelines at different stages of
development and construction of assets or facilities. In most instances, removal of assets occurs many years into the future.
This requires an estimate regarding abandonment date, future environmental and regulatory legislation, the extent of
reclamation activities, the engineering methodology for estimating cost, future removal technologies in determining the
removal cost and liability-specific discount rates to determine the present value of these cash flows.
2 0 1 2 A N N U A L r e p o r t | M A N A g e M e N t ’ s D i s c U s s i o N & A N A L y s i s 59

B i r c h c l i f f e n e r g y l t d .
Impairment of non-financial assets
For the purposes of determining whether impairment of petroleum and natural gas assets has occurred, and the extent of
any impairment or its reversal, the key assumptions the Corporation uses in estimating future cash flows are future petroleum
and natural gas prices, expected production volumes and anticipated recoverable quantities of proved and probable
reserves. These assumptions are subject to change as new information becomes available. Changes in economic conditions
can also affect the rate used to discount future cash flow estimates. Changes in the aforementioned assumptions could affect
the carrying amount of the Corporation’s assets, and impairment charges and reversal will affect profit or loss.
Income taxes
Birchcliff files corporate income tax, goods and service tax and other tax returns with various provincial and federal taxation
authorities in Canada. There can be differing interpretations of applicable tax laws and regulations. The resolution of these tax
positions through negotiations or litigation with tax authorities can take several years to complete. The Corporation does not
anticipate that there will be any material impact upon the results of its operations, financial position or liquidity.
Tax provisions are based on enacted or substantively enacted laws. Changes in those laws could affect amounts recognized in
profit or loss both in the period of change, which would include any impact on cumulative provisions, and in future periods.
Deferred tax assets (if any) are recognized only to the extent it is considered probable that those assets will be recoverable.
This involves an assessment of when those deferred tax assets are likely to reverse and a judgment as to whether or not there
will be sufficient taxable profits available to offset the tax assets when they do reverse. This requires assumptions regarding
future profitability and is therefore inherently uncertain. Estimates of future taxable income are based on forecasted cash
flows from operations. To the extent that any interpretation of tax law is challenged by the tax authorities or future cash flows
and taxable income differ significantly from estimates, the ability of Birchcliff to realize the deferred tax assets recorded at the
balance sheet date could be impacted.
CHANGES IN ACCOUNTING POLICIES
Accounting Policies Issued but not yet Effective
The following accounting standards and interpretations have been issued but are not yet effective at December 31, 2012.
The IASB issued the following new and revised IFRSs effective for annual periods beginning on or after January 1, 2013. Earlier
application is permitted providing that IFRS 10, IFRS 11, IFRS 12 and IFRS 13 are adopted together, except that IFRS 12 may be
adopted earlier. Birchcliff is currently assessing the impact of adopting these pronouncements, however, it anticipates that
these standards will not have a material impact on the Corporation’s financial statements.
IFRS 10 Consolidated Financial Statements builds on existing principles by identifying the concept of control as the
determining factor in whether an entity should be included within the consolidated financial statements of the parent
company. The standard provides additional guidance to assist in the determination of control where this is difficult to assess.
IFRS 10 replaces those parts of IAS 27 Consolidated and Separate Financial Statements (revised 2011) that address when and
how an entity should prepare consolidated financial statements and replaces SIC 12 Consolidation – Special Purpose Entities in
its entirety. IAS 27 retains the current guidance for separate financial statements.
IFRS 11 Joint Arrangements provides for a more substance based reflection of joint arrangements by focusing on the
rights and obligations of the arrangement, rather than its legal form (as is currently the case). The standard addresses
inconsistencies in the reporting of joint arrangements by requiring a single method to account for interests in jointly
controlled entities. IFRS 11 supersedes IAS 31 Interests in Joint Ventures and SIC 13 Jointly Controlled Entities – Non-Monetary
Contributions by Ventures. IAS 28 Investments in Associates and Joint Ventures (revised 2011) has been amended to conform to
changes based on the issuance of IFRS 10 and IFRS 11.
M a n a g e M e n t ’ s D i s c u s s i o n & a n a l y s i s | 2 0 1 2 a n n u a l r e p o r t60

B i r c h c l i f f e n e r g y l t d .
IFRS 12 Disclosure of Interests in Other Entities requires extensive disclosures relating to an entity’s interests in subsidiaries,
joint arrangements, associates and unconsolidated structured entities. An entity is required to disclose information that helps
users of its financial statements evaluate the nature of and risks associated with its interests in other entities and the effects
of those interests on its financial statements. The effective date of IFRS 12 is January 1, 2013 but entities are permitted to
incorporate any of the new disclosures in their financial statements before that date.
IFRS 13 Fair Value Measurement establishes a single framework for measuring fair values. This standard applies to all
transactions and balances (whether financial or non-financial) for which IFRS requires or permits fair value measurements,
with the exception of share-based payment transactions accounted for under IFRS 2 Share-based Payment and leasing
transactions within the scope of IAS 17 Leases. IFRS 13 defines fair value, provides guidance on its determination and
introduces consistent requirements for disclosures on fair value measurements.
IFRS 9 Financial Instruments issued in November 2009 and amended in October 2010, introduces new requirements for
the classification and measurement of financial assets and financial liabilities and for de-recognition. IFRS 9 is expected
to be published in three parts. The first part, Phase 1 – classification and measurement of financial instruments sets out
the requirements for recognizing and measuring financial assets, financial liabilities and some contracts to buy or sell
non-financial items. Phase 1 simplifies the measurement of financial assets by classifying all financial assets as those being
recorded at amortized cost or being recorded at fair value. Phase 1 is effective for periods beginning on or after January 1,
2015, although earlier adoption is allowed. Except for certain additional disclosures, the adoption of this standard is not
expected to have an impact on the Corporation’s financial statements.
Other Accounting Policies
Share capital
Birchcliff’s common shares and preferred shares are classified as equity. Incremental costs directly attributable to the issuance
of common shares and preferred shares are recognized as a reduction in share capital, net of any tax effects. The preferred
shares may be issued in one or more series and the directors are authorized to fix the number of shares in each series and to
determine the designation, rights, privileges, restrictions and conditions attached to the shares of each series.
Per common share amounts
The Corporation calculates basic and diluted per common share amounts using net income available to Birchcliff’s
shareholders, adjusted for preferred share dividends and divided by the weighted average number of common shares
outstanding. Diluted per common share information is calculated using the treasury stock method, which assumes that any
proceeds from the exercise of “in-the-money” stock options, performance warrants or warrants, plus the unamortized stock-
based compensation expense amounts, would be used to purchase common shares at the average market price during the
period. No adjustment to diluted earnings per common share is made if the result of these calculations is anti-dilutive.
RISK FACTORS AND RISK MANAGEMENT
Exploration, Development and Production Risks
Oil and natural gas operations involve many risks that even a combination of experience, knowledge and careful evaluation
may not be able to overcome. The long-term commercial success of the Corporation depends on its ability to find, acquire,
develop and commercially produce oil and natural gas reserves. Without the continual addition of new reserves, any existing
reserves the Corporation may have at any particular time and the production therefrom will decline over time as such
existing reserves are exploited.
2 0 1 2 A N N U A L r e p o r t | M A N A g e M e N t ’ s D i s c U s s i o N & A N A L y s i s 61
B i r c h c l i f f e n e r g y l t d .
The Corporation remains subject to the risk that the production rate of a significant well may decrease in an unpredictable
and uncontrollable manner, which could result in a decrease in the Corporation’s overall production and associated cash
flows. The Corporation mitigates this risk by having a large number of wells on production, reducing the ability of any one
well to materially affect overall production and associated cash flow.
Commodity Price Volatility
Birchcliff’s liquidity and cash flow is largely impacted by petroleum and natural gas commodity prices. Oil and natural gas
prices fluctuate in response to changes in the supply of and demand for crude oil and natural gas, market uncertainty and
a variety of additional factors that are largely beyond the Corporation’s control. The Corporation has not hedged any of its
oil and natural gas production at the date hereof and although it does monitor the hedge market, its strategy is to continue
to sell its oil and natural gas production at the spot market rate. Management remains optimistic about future commodity
prices and believes the Corporation is well positioned to take advantage of a rising oil and natural gas price environment.
If there is a significant deterioration in the price it receives for oil and natural gas, the Corporation will consider reducing its
capital spending or access alternate sources of capital.
Variations in Foreign Exchange Rates and Interest Rates
The Corporation is exposed to foreign currency fluctuations as its Canadian revenues are strongly linked to United States
dollar denominated benchmark prices. The Corporation has not hedged any of its foreign exchange risk at the date hereof.
An increase in interest rates could result in a significant increase in the amount the Corporation pays to service debt, which
could negatively impact the market price of the Common Shares of the Corporation.
Reserve Replacement
Oil and natural gas reserves naturally deplete as they are produced over time. The success of the Corporation’s business
is highly dependent on its ability to acquire or discover new reserves in a cost efficient manner. Substantially, all of the
Corporation’s cash flow is derived from the sale of the petroleum and natural gas reserves it accumulates and develops.
In order to remain financially viable, the Corporation must be able to replace reserves over time at a lesser cost on a per
unit basis than its cash flow on a per unit basis. The reserves and costs used in this determination are estimated each year
based on numerous assumptions and these estimates and costs may vary materially from the actual reserves produced
or from the costs required to produce those reserves. In order to mitigate this risk, the Corporation employs a competent
and experienced team of petroleum and natural gas professionals and closely monitors the capital expenditures made
for the purposes of increasing its petroleum and natural gas reserves. Historically, the Corporation’s finding, development
and acquisition costs and reserves replacement on a proved plus probable basis have remained competitive compared to
industry peers.
Health, Safety and Environment Risks
Health, safety and environment risks influence the workforce, operating costs and the establishment of regulatory standards.
These risks include, but are not limited to, encountering unexpected formations or pressures, premature declines of
reservoirs, blow-outs, equipment failures, human error or wilful misconduct by field workers, other accidents, cratering, sour
gas releases, uncontrollable flows of oil, natural gas or well fluids, adverse weather conditions, pollution, other environmental
risks, fires and spills. The Corporation provides staff with the training and resources they need to complete work safely and
effectively; incorporates hazard assessment and risk management as an integral part of everyday operations; monitors
performance to ensure its operations comply with legal obligations and internal standards; and identifies and manages
environmental liabilities associated with its existing asset base. The Corporation has a site inspection program and a corrosion
risk management program designed to ensure compliance with environmental laws and regulations. The Corporation carries
M a n a g e M e n t ’ s D i s c u s s i o n & a n a l y s i s | 2 0 1 2 a n n u a l r e p o r t62
B i r c h c l i f f e n e r g y l t d .
insurance to cover a portion of property losses, liability to third parties and business interruption resulting from unusual
events.
The Corporation is subject to the risk that the unexpected failure of its equipment used in drilling, completing or producing
wells or in transporting production could result in release of fluid substances that pollute or contaminate lands at or near its
facilities, which could result in significant liability to the Corporation for costs of clean up, remediation and reclamation of
contaminated lands. The Corporation conducts its operations with due regard for the potential impact on the environment.
This includes hiring skilled personnel, providing adequate training to all staff involved with operations, and by retaining
expert advice and assistance to deal with environmental remediation and reclamation work where such expertise is needed.
Access to Credit Markets
Due to the nature of the Corporation’s business, it is necessary from time to time for the Corporation to access other sources
of capital beyond its internally generated cash flow in order to fund the development and acquisition of its long-term asset
base. As part of this strategy, the Corporation obtains some of this necessary capital by incurring debt and therefore the
Corporation is dependent to a certain extent on continued availability of the credit markets.
The continued availability of the credit markets for the Corporation is primarily dependent on the state of the economy
and the health of the banking industry in Canada and the United States. There is risk that if the economy and banking
industry experienced unexpected and/or prolonged deterioration, the Corporation’s access to credit markets may contract
or disappear altogether. The Corporation tries to mitigate this risk by dealing with reputable lenders and tries to structure its
lending agreements to give it the most flexibility possible should these situations arise. However, the situations that may give
rise to credit markets tightening or disappearing are beyond the Corporation’s control.
The Corporation is also dependent, to a certain extent, on continued access to equity capital markets. The Corporation
is listed on TSX and maintains an active investor relations program. Continued access to capital is dependent on the
Corporation’s ability to continue to perform at a level that meets market expectations.
Availability of Processing and Pipeline Capacity
The Corporation is subject to deliverability uncertainties related to the proximity of its reserves to pipelines and processing
facilities and the possible inability to secure space on gathering systems that deliver production to processing facilities and
on pipelines which deliver oil and natural gas to commercial markets. The majority of the Corporation’s production passes
through Birchcliff owned or third party infrastructure prior to it being ready for transfer at designated commodity sales
points. There is a risk that should this infrastructure fail and cause a significant portion of the Corporation’s production to
be shut-in and be unable to be sold, which could have a material adverse effect on the Corporation’s available cash flow.
The Corporation mitigates this risk by purchasing business interruption and property insurance policies for Birchcliff owned
infrastructure and contingent business interruption insurance policies for its significant third party infrastructure.
Costs and Availability of Equipment and Services
Inflation is a risk common to all businesses in Canada. During times of high commodity prices for oil and natural gas, there is
a risk of substantially increased cost of operation, which impacts both the amount of capital required to perform operations
and the netback the Corporation achieves from its production sales. Oil and natural gas exploration and development
activities are dependent on the availability of drilling and related equipment in the particular areas where such activities will
be conducted. Demand for such limited equipment or access restrictions may affect the availability of such equipment to
the Corporation and may delay exploration and development activities. To the extent the Corporation is not the operator of
its oil and gas properties, the Corporation will be dependent on other operators for the timing of activities related to such
properties and will be largely be unable to direct or control the activities of the operators. Although the Corporation strives
2 0 1 2 A N N U A L r e p o r t | M A N A g e M e N t ’ s D i s c U s s i o N & A N A L y s i s 63

B i r c h c l i f f e n e r g y l t d .
for continuous improvement in its planning, operations and procurement of materials, unexpected changes in the market for
such equipment and services could negatively affect the Corporation’s financial performance.
Management of Growth
The Corporation may be subject to growth-related risks including capacity constraints and pressure on its internal systems
and controls. An inability of the Corporation to effectively deal with this growth could have a material adverse impact on
its business, operations and business prospects. Management mitigates this risk by continually implementing appropriate
procedures and policies for its size, upgrading its systems, training its employees and providing effective supervision and
management of its staff.
Changes in Legislation
Government royalties, income tax laws, environmental laws and regulatory requirements can have a significant financial and
operational impact on the Corporation. As an oil and natural gas producer, the Corporation is subject to a broad range of
regulatory requirements. The Corporation hires and retains skilled personnel that are knowledgeable regarding changes to
the regulatory regime under which it operates.
All of the Corporation’s properties are currently located within the province of Alberta. There is a risk that, although the
Corporation believes it is making an economic investment at the time all of the upfront capital is invested in facilities or
drilling, completing and equipping an oil or natural gas well, the Government of Alberta may at any point in the economic
life of that project, expropriate without compensation a portion of the expected profit under a new royalty/tax regulation
or regime with no grandfathering provisions. This may cause a particular project to become uneconomic once the new
royalties or taxes take effect. This type of possible future government action is unpredictable and cannot be forecast by the
Corporation.
Reliance on Key Personnel
The Corporation’s success depends, in large measure, on certain key personnel. The loss of the services of such key personnel
could have a material adverse effect on the Corporation. The Corporation does not have “key person” insurance in effect for
management and the contributions of these individuals to the Corporation’s immediate operations is of central importance.
In addition, the competition for qualified personnel in the oil and natural gas industry is intense and there can be no
assurance that the Corporation will be able to continue to attract and retain all personnel necessary for the development and
operation of its business. Shareholders must rely upon the ability, expertise, judgment, discretion, integrity and good faith of
the Corporation’s management.
M a n a g e M e n t ’ s D i s c u s s i o n & a n a l y s i s | 2 0 1 2 a n n u a l r e p o r t64
B i r c h c l i f f e n e r g y l t d .
To the Shareholders of Birchcliff Energy Ltd.
The annual financial statements of Birchcliff Energy Ltd. for the year ended December 31, 2012 were prepared by
management within the acceptable limits of materiality and are in accordance with accounting principles generally accepted
in Canada. Management is responsible for ensuring that the financial and operating information presented in this annual
report is consistent with that shown in the financial statements.
The financial statements have been prepared by management in accordance with the accounting policies as described in the
notes to the financial statements. Timely release of financial information sometimes necessitates the use of estimates when
transactions affecting the current accounting period cannot be finalized until future periods. When necessary, such estimates
are based on informed judgments made by management.
Management has designed and maintains an appropriate system of internal controls to provide reasonable assurance that
all assets are safeguarded and financial records properly maintained to facilitate the preparation of financial statements for
reporting purposes.
KPMG LLP, an independent firm of Chartered Accountants appointed by shareholders, have conducted an examination of the
corporate and accounting records in order to express their opinion on the financial statements.
The Audit Committee, consisting of non-management directors, has met with representatives of KPMG LLP and management
in order to determine if management has fulfilled its responsibilities in the preparation of the financial statements. The Board
of Directors has approved the financial statements on the recommendation of the Audit Committee.
Respectfully,
(signed) “Bruno P. Geremia” (signed) “A. Jeffery Tonken”
Bruno P. Geremia A. Jeffery Tonken
Vice President and Chief Financial Officer President and Chief Executive Officer
Calgary, Canada
March 13, 2013
MANAGEMENT’S REPORT
652 0 1 2 A N N U A L R E P O R T | F I N A N C I A L S T A T E M E N T S
B i r c h c l i f f e n e r g y l t d .
To the Shareholders of Birchcliff Energy Ltd.
We have audited the accompanying financial statements of Birchcliff Energy Ltd., which comprise the statements of financial
position as at December 31, 2012 and December 31, 2011, the statements of net income and comprehensive income,
changes in shareholders’ equity and cash flows for the years then ended, and notes, comprising a summary of significant
accounting policies and other explanatory information.
Management’s responsibility for the financial statements
Management is responsible for the preparation and fair presentation of these financial statements in accordance with
International Financial Reporting Standards, and for such internal control as management determines is necessary to enable
the preparation of financial statements that are free from material misstatement, whether due to fraud or error.
Auditors’ responsibility
Our responsibility is to express an opinion on these financial statements based on our audits. We conducted our audits in
accordance with Canadian generally accepted auditing standards. Those standards require that we comply with ethical
requirements and plan and perform the audit to obtain reasonable assurance about whether the financial statements are free
from material misstatement.
An audit involves performing procedures to obtain audit evidence about the amounts and disclosures in the financial
statements. The procedures selected depend on our judgment, including the assessment of the risks of material
misstatement of the financial statements, whether due to fraud or error. In making those risk assessments, we consider
internal control relevant to the entity’s preparation and fair presentation of the financial statements in order to design audit
procedures that are appropriate in the circumstances, but not for the purpose of expressing an opinion on the effectiveness
of the entity’s internal control. An audit also includes evaluating the appropriateness of accounting policies used and the
reasonableness of accounting estimates made by management, as well as evaluating the overall presentation of the financial
statements.
We believe that the audit evidence we have obtained in our audits is sufficient and appropriate to provide a basis for our
audit opinion.
Opinion
In our opinion, the financial statements present fairly, in all material respects, the financial position of Birchcliff Energy Ltd. as
at December 31, 2012 and December 31, 2011, and its financial performance and its cash flows for the years then ended in
accordance with International Financial Reporting Standards.
(signed) “KPMG LLP”
Chartered Accountants
Calgary, Canada
March 13, 2013
INDEPENDENT AUDITORS’ REPORT
66 F I N A N C I A L S T A T E M E N T S | 2 0 1 2 A N N U A L R E P O R T

B i r c h c l i f f e n e r g y l t d .
(Expressed in thousands of Canadian dollars)
As at December 31, 2012 2011
ASSETS
Current assets:
Cash 46 65
Accounts receivable (Note 17) 27,728 37,699
Prepaid expenses and deposits 2,205 2,240
29,979 40,004
Non-current assets:
Exploration and evaluation (Note 5) 2,106 1,858
Petroleum and natural gas properties and equipment (Note 6) 1,398,239 1,183,635
1,400,345 1,185,493
Total assets 1,430,324 1,225,497
LIABILITIES
Current liabilities:
Accounts payable and accrued liabilities (Note 17) 58,846 88,602
Non-revolving five year term facility (Note 7) 700 –
59,546 88,602
Non-current liabilities:
Non-revolving five year term facility (Note 7) 68,250 68,925
Revolving credit facilities (Note 8) 364,313 319,500
Decommissioning obligations (Note 9) 68,967 64,023
Deferred income taxes (Note 10) 35,001 27,845
536,531 480,293
Total liabilities 596,077 568,895
SHAREHOLDERS’ EQUITY
Share capital (Note 11)
Common shares 677,802 567,816
Preferred shares 41,434 –
Contributed surplus 57,678 43,070
Retained earnings 57,333 45,716
834,247 656,602
Total shareholders’ equity and liabilities 1,430,324 1,225,497
Commitments (Note 18)
The accompanying notes are an integral part of these financial statements.
Approved by the Board
(signed) “Larry A. Shaw” (signed) “A. Jeffery Tonken”
Larry A. Shaw A. Jeffery Tonken
Director Director
STATEMENTS Of fINANCIAL POSITION
672 0 1 2 A N N U A L R E P O R T | F I N A N C I A L S T A T E M E N T S
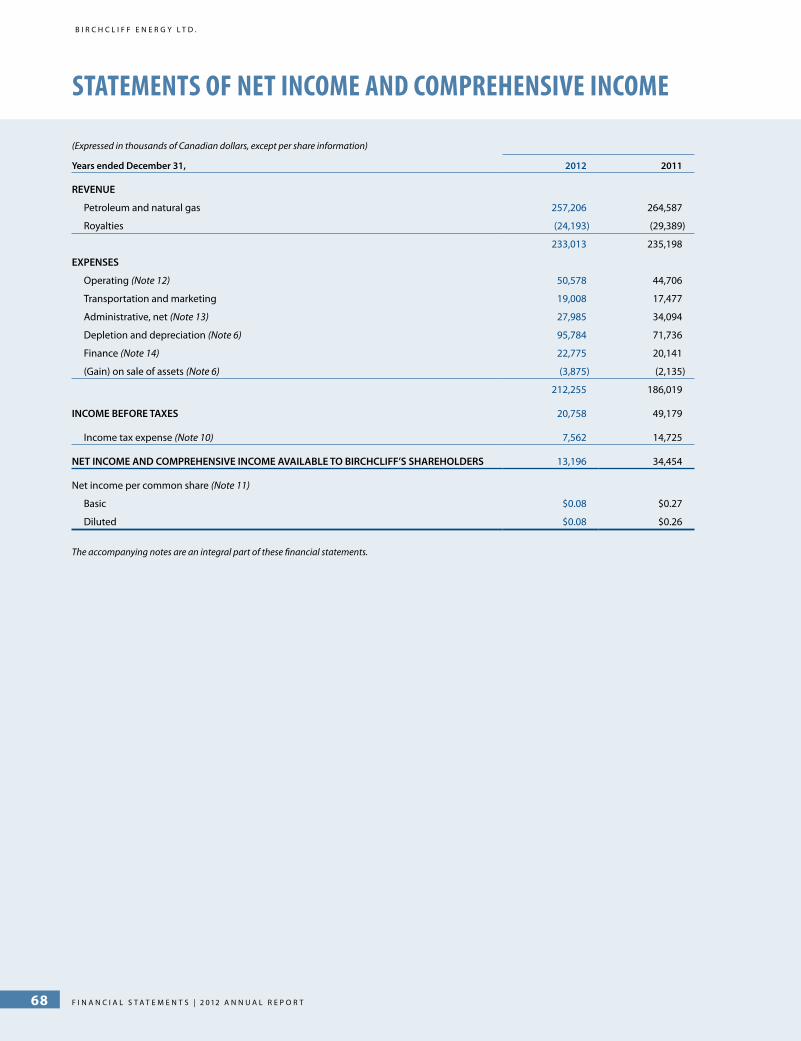
B i r c h c l i f f e n e r g y l t d .
(Expressed in thousands of Canadian dollars, except per share information)
Years ended December 31, 2012 2011
REVENUE
Petroleum and natural gas 257,206 264,587
Royalties (24,193) (29,389)
233,013 235,198
EXPENSES
Operating (Note 12) 50,578 44,706
Transportation and marketing 19,008 17,477
Administrative, net (Note 13) 27,985 34,094
Depletion and depreciation (Note 6) 95,784 71,736
Finance (Note 14) 22,775 20,141
(Gain) on sale of assets (Note 6) (3,875) (2,135)
212,255 186,019
INCOME BEFORE TAXES 20,758 49,179
Income tax expense (Note 10) 7,562 14,725
NET INCOME AND COMPREHENSIVE INCOME AVAILABLE TO BIRCHCLIFF’S SHAREHOLDERS 13,196 34,454
Net income per common share (Note 11)
Basic $0.08 $0.27
Diluted $0.08 $0.26
The accompanying notes are an integral part of these financial statements.
STATEMENTS Of NET INCOME AND COMPREhENSIvE INCOME
68 F I N A N C I A L S T A T E M E N T S | 2 0 1 2 A N N U A L R E P O R T
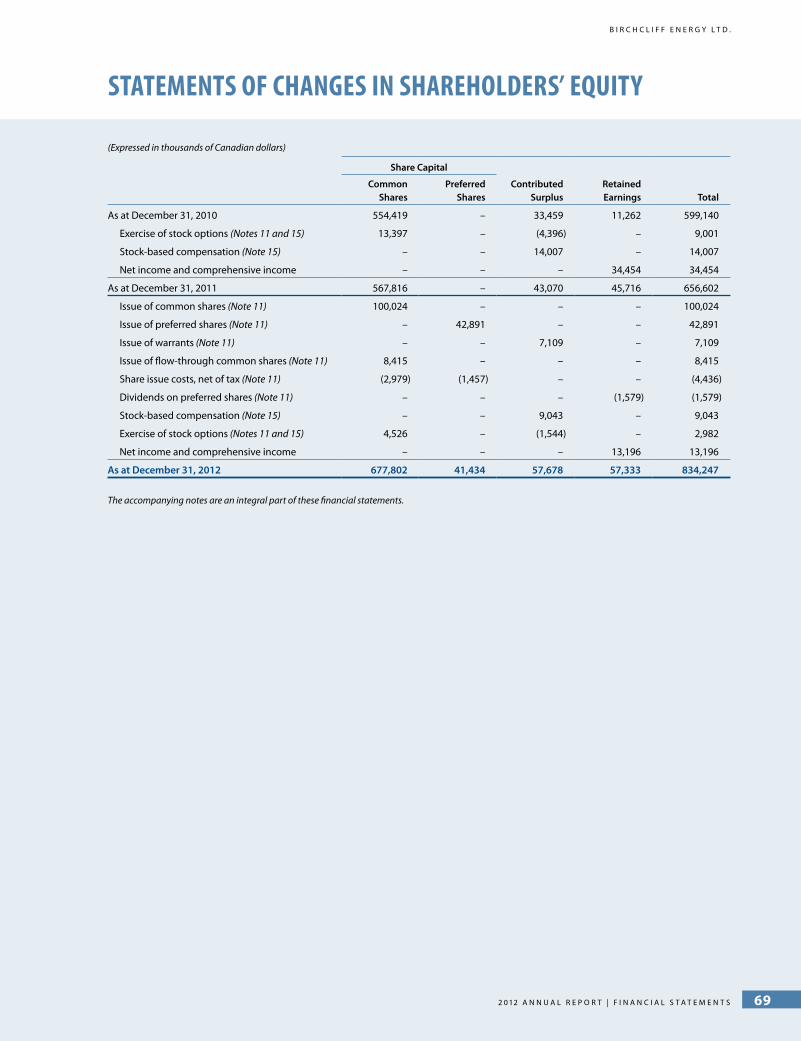
B i r c h c l i f f e n e r g y l t d .
(Expressed in thousands of Canadian dollars)
Share Capital
CommonShares
PreferredShares
ContributedSurplus
RetainedEarnings Total
As at December 31, 2010 554,419 – 33,459 11,262 599,140
Exercise of stock options (Notes 11 and 15) 13,397 – (4,396) – 9,001
Stock-based compensation (Note 15) – – 14,007 – 14,007
Net income and comprehensive income – – – 34,454 34,454
As at December 31, 2011 567,816 – 43,070 45,716 656,602
Issue of common shares (Note 11) 100,024 – – – 100,024
Issue of preferred shares (Note 11) – 42,891 – – 42,891
Issue of warrants (Note 11) – – 7,109 – 7,109
Issue of flow-through common shares (Note 11) 8,415 – – – 8,415
Share issue costs, net of tax (Note 11) (2,979) (1,457) – – (4,436)
Dividends on preferred shares (Note 11) – – – (1,579) (1,579)
Stock-based compensation (Note 15) – – 9,043 – 9,043
Exercise of stock options (Notes 11 and 15) 4,526 – (1,544) – 2,982
Net income and comprehensive income – – – 13,196 13,196
As at December 31, 2012 677,802 41,434 57,678 57,333 834,247
The accompanying notes are an integral part of these financial statements.
STATEMENTS Of ChANGES IN ShAREhOLDERS’ EqUITY
692 0 1 2 A N N U A L R E P O R T | F I N A N C I A L S T A T E M E N T S

B i r c h c l i f f e n e r g y l t d .
(Expressed in thousands of Canadian dollars)
Years ended December 31, 2012 2011
Cash provided by (used in):
OPERATING
Net income 13,196 34,454
Adjustments for items not affecting operating cash:
Depletion and depreciation 95,784 71,736
Stock-based compensation 5,035 9,410
Finance 22,775 20,141
(Gain) on sale of assets (3,875) (2,135)
Income taxes 7,562 14,725
Interest paid (Note 14) (20,218) (17,505)
Decommissioning expenditures (Note 9) (678) (1,057)
Changes in non-cash working capital (Note 19) (11,352) 13,128
108,229 142,897
FINANCING
Issue of common shares 113,126 9,001
Issue of preferred shares and warrants 50,000 –
Share issue costs (5,915) –
Financing fees paid on credit facilities (Notes 7 and 8) (600) (1,356)
Dividends paid on preferred shares (1,579) –
Net change in non-revolving five year term facility (114) 69,537
Net change in revolving credit facilities 44,767 (14,114)
199,685 63,068
INVESTING
Development of petroleum and natural gas properties and equipment (298,657) (240,047)
Additions of exploration and evaluation assets (246) (313)
Acquisition of petroleum and natural gas properties and equipment – (6,005)
Sale of petroleum and natural gas properties and equipment – 8,885
Changes in non-cash working capital (Note 19) (9,030) 26,717
(307,933) (210,763)
NET CHANGE IN CASH (19) (4,798)
CASH, BEGINNING OF YEAR 65 4,863
CASH, END OF YEAR 46 65
The accompanying notes are an integral part of these financial statements.
STATEMENTS Of CASh fLOwS
70 F I N A N C I A L S T A T E M E N T S | 2 0 1 2 A N N U A L R E P O R T
B i r c h c l i f f e n e r g y l t d .
For the years ended December 31, 2012 and 2011
(Expressed in thousands of Canadian dollars, except for share and per share information)
1. NATURE OF OPERATIONS
Birchcliff Energy Ltd. (“Birchcliff” or the “Corporation”) is domiciled and incorporated in Canada. Birchcliff is engaged in the
exploration for and the development, production and acquisition of petroleum and natural gas reserves in Western Canada.
The Corporation’s financial year end is December 31. The address of the Corporation’s registered office is 500, 630 – 4th
Avenue SW, Calgary, Alberta, Canada T2P 0J9. Birchcliff’s Common Shares, Preferred Shares, Series A and Warrants are listed
for trading on the Toronto Stock Exchange under the symbols “BIR”, “BIR.PR.A” and “BIR.WT”, respectively.
These annual audited financial statements were approved and authorized for issuance by the Board of Directors on March 13,
2013.
2. BASIS OF PREPARATION
These financial statements present Birchcliff’s financial results of operations and financial position under International
Financial Reporting Standards (“IFRS”) as issued by the International Accounting Standards Board as at and for the years
ended December 31, 2012 and 2011. These financial statements have been prepared in accordance with IFRS accounting
policies and methods of computation as set forth in Note 3.
Operating, transportation and marketing expenses in profit or loss are presented as a combination of function and nature
in conformity with industry practices. Depletion and depreciation and finance expenses are presented in a separate line by
their nature, while net administrative expenses are presented on a functional basis. Significant expenses such as salaries and
benefits and stock-based compensation are presented by their nature in the notes to the financial statements.
These financial statements have been prepared on a historical cost basis, except for certain financial and non-financial
assets and liabilities, which have been measured at fair value. The Corporation’s financial statements include the accounts of
Birchcliff only and are expressed in thousands of Canadian dollars, except for share and per share information. There are no
subsidiary companies.
3. SIGNIFICANT ACCOUNTING POLICIES
(a) Revenue Recognition
Revenue from the sale of petroleum and natural gas is recognized when volumes are delivered and title passes to
an external party at contractual delivery points and are recorded gross of transportation charges incurred by the
Corporation. The costs associated with the delivery, including transportation and production-based royalty expenses,
are recognized in the same period in which the related revenue is earned and recorded.
(b) Cash and Cash Equivalents
Cash may consist of cash on hand, deposits and term investments held with a financial institution, with a maturity of
three months or less. Restricted cash is not considered part of cash and cash equivalents.
NOTES TO ThE fINANCIAL STATEMENTS
2 0 1 2 A N N U A L r e p o r t | N o t e s t o t h e F i N A N c i A L s t A t e m e N t s 71
B i r c h c l i f f e n e r g y l t d .
(c) Joint Controlled Operations and Assets
Certain activities of the Corporation are conducted jointly with others where the participants have a direct ownership
interest in, and jointly control, the related assets. Accordingly, the accounts of Birchcliff reflect only its working interest
share of revenues, expenses and capital expenditures related to these jointly controlled assets.
(d) Exploration and Evaluation Assets
Costs incurred prior to obtaining the right to explore a mineral resource are recognized as an expense in the period
incurred.
Intangible exploration and evaluation expenditures are initially capitalized and may include mineral license acquisitions,
geological and geophysical evaluations, technical studies, exploration drilling and testing and other directly attributable
administrative costs. Tangible assets acquired which are consumed in developing an intangible exploration asset are
recorded as part of the cost of the exploration asset. These costs are accumulated in cost centres by exploration area
pending the determination of technical feasibility and commercial viability.
The technical feasibility and commercial viability of extracting a mineral resource in an exploration area is considered
to be determinable when economic quantities of proven reserves are determined to exist. A review of each exploration
project by area is carried out at each reporting date to ascertain whether such reserves have been discovered. Upon
determination of commercial proven reserves, associated exploration costs are transferred from exploration and
evaluation to developing and producing petroleum and natural gas properties and equipment as reported on the
Statements of Financial Position. Exploration and evaluation assets are reviewed for impairment prior to any such
transfer. Assets classified as exploration and evaluation are not subject to depletion and depreciation until they are
reclassified to petroleum and natural gas properties and equipment.
(e) Petroleum and Natural Gas Properties and Equipment
(i) Recognition and measurement
Petroleum and natural gas properties and equipment are measured at cost less accumulated depletion and
depreciation and accumulated impairment losses, if any.
Petroleum and natural gas properties and equipment consists of the purchase price and costs directly attributable
to bringing the asset to the location and condition necessary for its intended use. Petroleum and natural gas assets
include developing and producing interests such as mineral lease acquisitions, geological and geophysical costs,
facility and production equipment and associated turnarounds, other directly attributable administrative costs and
the initial estimate of the costs of dismantling and removing an asset and restoring the site on which it was located.
(ii) Subsequent costs
Costs incurred subsequent to the determination of technical feasibility and commercial viability are recognized as
developing and producing petroleum and natural gas interests when they increase the future economic benefits
embodied in the specific asset to which they relate. Such capitalized petroleum and natural gas interests generally
represent costs incurred in developing proved and/or probable reserves and bringing in or enhancing production
from such reserves, and are accumulated on an area basis. The cost of day-to-day servicing of an item of petroleum
and natural gas properties and equipment is expensed in profit or loss as incurred.
Petroleum and natural gas properties and equipment are de-recognized upon disposal or when no future economic
benefits are expected to arise from the continued use of the asset. Any gain or loss arising from the disposal of an
N o t e s t o t h e F i N a N c i a l s t a t e m e N t s | 2 0 1 2 a N N U a l r e p o r t72
B i r c h c l i f f e n e r g y l t d .
asset, determined as the difference between the net disposal proceeds and the carrying amount of the asset, is
recognized in profit or loss.
(iii) Asset exchanges
For exchanges or parts of exchanges that involve only exploration and evaluation assets, the exchange is accounted
for at carrying value. Exchanges of development and production assets are measured at fair value, unless the
exchange transaction lacks commercial substance or the fair value of the assets given up or the assets received
cannot be reliably estimated. The cost of the acquired asset is measured at the fair value of the asset given up,
unless the fair value of the asset received is more reliable. Where fair value is not used, the cost of the acquired asset
is measured at the carrying amount of the asset given up. Any gain or loss on the de-recognition of the asset given
up is recognized in profit and loss.
(iv) Depletion and depreciation
The net carrying value of developing and producing petroleum and natural gas assets, net of estimated residual
value, is depleted on an area basis using the unit of production method. This depletion calculation includes actual
production in the period and total estimated proved plus probable reserves attributable to the assets being
depreciated, taking into account total capitalized costs plus estimated future development costs necessary to bring
those reserves into production. Relative volumes of reserves and production (before royalties) are converted at the
energy equivalent conversion ratio of six thousand cubic feet of natural gas to one barrel of oil. These estimates are
reviewed by the Corporation’s independent reserves evaluator at least annually.
Capitalized plant turnaround costs are depreciated on a straight-line basis over the estimated time until the next
turnaround is completed. Corporate assets, which include office furniture and equipment, software, computer
equipment and leasehold improvements, are depreciated on a straight-line basis over the estimated useful lives of
the assets, which are estimated to be four years.
When significant parts of property and equipment, including petroleum and natural gas interests, have different
useful lives, they are accounted for as separate items (major components). Depreciation methods, useful lives and
residual values for petroleum and natural gas properties and equipment are reviewed at each reporting date.
(f) Provisions
Provisions are recognized when the Corporation has a present obligation (legal or constructive), as a result of a past
event, if it is probable that the Corporation will be required to settle the obligation and a reliable estimate can be made
of the amount of the obligation.
The amount recognized as a provision is the best estimate of the consideration required to settle the present obligation
at the end of the reporting period, taking into account the risks and uncertainties surrounding the obligation. When a
provision is measured using the cash flows estimated to settle the present obligation, its carrying amount is the present
value of those cash flows (where the effect of the time value of money is significant).
When some or all of the economic benefits required to settle a provision are expected to be recovered from a third party,
a receivable is recognized as an asset if it is virtually certain that reimbursement will be received and the amount of the
receivable can be measured reliably.
Provisions are not recognized for future operating losses.
2 0 1 2 A N N U A L r e p o r t | N o t e s t o t h e F i N A N c i A L s t A t e m e N t s 73
B i r c h c l i f f e n e r g y l t d .
(g) Decommissioning Obligations
The Corporation’s activities give rise to dismantling, restoration and site disturbance remediation activities. Costs related
to abandonment activities are estimated by management in consultation with the Corporation’s independent reserves
evaluators based on risk-adjusted current costs which take into consideration current technology in accordance with
existing legislation and industry practices.
Decommissioning obligations are measured at the present value of the best estimate of expenditures required to settle
the present obligations at the reporting date. When the fair value of the liability is initially measured, the estimated
cost, discounted using a pre-tax risk-free discount rate, is capitalized by increasing the carrying amount of the related
petroleum and natural gas properties and equipment. The increase in the provision due to the passage of time, which
is referred to as accretion, is recognized as a finance expense. Actual costs incurred upon settlement of the liability
are charged against the obligation to the extent that the obligation was previously established. The carrying amount
capitalized in petroleum and natural gas properties and equipment is depleted in accordance with the Corporation’s
depletion and depreciation policy. The Corporation reviews the obligation at each reporting date and revisions to the
estimated timing of cash flows, discount rates and estimated costs result in an increase or decrease to the obligations
and the related petroleum and natural gas properties and equipment. Any difference between the actual costs incurred
upon settlement of the obligation and the recorded liability is recognized as a gain or loss in profit or loss.
(h) Share-Based Payments
Equity-settled share-based awards granted by the Corporation include stock options and performance warrants granted
to officers, directors and employees. The fair value determined at the grant date of an award is expensed on a graded
basis over the vesting period of each respective tranche of an award with a corresponding increase to contributed
surplus. In calculating the expense of share-based awards, the Corporation revises its estimate of the number of equity
instruments expected to vest by applying an estimated forfeiture rate for each vesting tranche and subsequently
revising this estimate throughout the vesting period, as necessary, with a final adjustment to reflect the actual number
of awards that vest. Upon the exercise of share-based awards, consideration paid together with the amount previously
recognized in contributed surplus is recorded as an increase to share capital. In the event that vested share-based
awards expire without being exercised, previously recognized compensation costs associated with such awards are not
reversed. The expense related to share-based awards is included within administrative expenses in profit or loss.
The fair value of equity-settled share-based awards is measured using the Black-Scholes option-pricing model taking
into account the terms and conditions upon which the awards were granted. Measurement inputs as at the grant date
include: share price, exercise price, expected volatility (based on weighted average historical traded daily volatility),
weighted average expected life of the instruments (based on historical experience and general option holder
behaviour), expected dividends and the risk-free interest rate (based on government bonds) applicable to the term of
the award.
A portion of share-based compensation expense directly attributable to the exploration and development of the
Corporation’s assets are capitalized.
(i) Finance Income and Expenses
Finance expenses include interest expense on borrowings, accretion of the discount on decommissioning obligations,
amortization of deferred charges and impairment losses (if any) recognized on financial assets. Interest income is
recognized as it is earned.
N o t e s t o t h e F i N a N c i a l s t a t e m e N t s | 2 0 1 2 a N N U a l r e p o r t74
B i r c h c l i f f e n e r g y l t d .
(j) Borrowing Costs
Borrowing costs incurred for the acquisition, construction or production of qualifying assets are capitalized during the
period of time that is required to complete and prepare the asset for its intended use or sale. Assets are considered to
be qualifying assets when this period of time is substantial. The capitalization rate, used to determine the amount of
borrowing costs to be capitalized, is the weighted average interest rate applicable to the Corporation’s outstanding
borrowings during the period. All other borrowing costs are charged to profit or loss using the effective interest method.
(k) Financial Instruments
(i) Non-derivative financial instruments
Non-derivative financial instruments are comprised of cash, accounts receivable, accounts payable and accrued
liabilities and outstanding credit facilities. Non-derivative financial instruments are recognized initially at fair
value plus any directly attributable transaction costs. Subsequent to initial recognition, non-derivative financial
instruments are measured based on their classification. The Corporation has made the following classifications:
Cash is classified as financial assets at fair value through profit or loss, showing separately (i) those designated
as such upon initial recognition and (ii) those classified as held for trading in accordance with IAS 39 Financial
Instruments: Recognition and Measurement.
Accounts receivable are classified as loans and receivables and are measured at amortized cost using the
effective interest method. Typically, the fair value of these balances approximates their carrying value due to
their short term to maturity.
Accounts payable and accrued liabilities and outstanding credit facilities are classified as other liabilities
and are measured at amortized cost using the effective interest method. Due to the short term nature of
accounts payable and accrued liabilities, their carrying values approximate their fair values. The Corporation’s
outstanding credit facilities bear interest at a floating rate and accordingly the fair market value approximates
the carrying value before the carrying value is reduced for any remaining unamortized costs.
(ii) Derivative financial instruments
Derivatives may be used by the Corporation to manage economic exposure to market risk relating to commodity
prices. Birchcliff’s policy is not to utilize derivative financial instruments for speculative purposes. The Corporation
does not designate its financial derivative contracts as hedges, and as such does not apply hedge accounting.
As a result, financial derivative contracts are classified at fair value through profit or loss and are recorded on the
Statements of Financial Position at fair value.
The Corporation accounts for any forward physical delivery sales contracts, which were entered into and continue
to be held for the purpose of receipt or delivery of non-financial items, in accordance with its expected purchase,
sale or usage requirements as executory contracts. As such, these contracts are not considered to be derivative
financial instruments and have not been recorded at fair value on the Statement of Financial Position.
(iii) Share capital
Common shares and preferred shares are classified as equity. Incremental costs directly attributable to the issuance
of shares are recognized as a reduction in share capital, net of any tax effects.
2 0 1 2 A N N U A L r e p o r t | N o t e s t o t h e F i N A N c i A L s t A t e m e N t s 75

B i r c h c l i f f e n e r g y l t d .
(l) Impairment
(i) Impairment of financial assets
Financial assets are assessed at each reporting date to determine whether there is any objective evidence that
they are impaired. A financial asset is considered to be impaired if objective evidence indicates that one or more
events have had a negative effect on the estimated future cash flows of that asset. An impairment loss in respect
of a financial asset measured at amortized cost is calculated as the difference between its carrying amount and the
present value of the estimated future cash flows discounted at the original effective interest rate.
Significant financial assets are tested for impairment on an individual basis. The remaining financial assets are
assessed collectively in groups that share similar credit risk characteristics. Impairment losses are recognized in
profit or loss. An impairment loss is reversed if the reversal can be related objectively to an event occurring after the
impairment loss was recognized.
(ii) Impairment of non-financial assets
The Corporation’s petroleum and natural gas properties and equipment are grouped into Cash Generating Units
(“CGU”) for the purpose of assessing impairment. A CGU represents the smallest group of assets that generates cash
inflows from continuing use that are largely independent of the cash inflows of other assets or groups of assets.
CGU’s are reviewed at each reporting date for indicators of potential impairment. Such indicators may include, but
are not limited to, changes in the Corporation’s business plan, deterioration in commodity prices or a significant
downward revision of estimated recoverable reserves. If indicators of asset impairment exist, an impairment test
is performed by comparing a CGU’s carrying value to its recoverable amount. A CGU’s recoverable amount is the
greater of its fair value less cost to sell and its current value in use. The calculation of the recoverable amount is
sensitive to the assumptions regarding production volumes, discount rates and commodity prices. Any excess of
carrying value over recoverable amount is recognized as impairment loss in profit or loss.
In assessing the value in use, the estimated future cash flows from proved and probable reserves are discounted
to their present value using a pre-tax discount rate that reflects current market assessment of the time value of
money. Fair value is determined as the amount that would be obtained from the sale of the asset in an arm’s length
transaction between knowledgeable and willing parties. The petroleum and natural gas future prices used in the
impairment test are based on period-end commodity price forecasts estimated by the Corporation’s independent
reserves evaluator and are adjusted for petroleum and natural gas differentials and transportation and marketing
costs specific to the Corporation.
Where circumstances change such that an impairment no longer exists or is less than the amount previously
recognized, the carrying amount of the CGU is increased to the revised estimate of its recoverable amount as long
as the revised estimate does not exceed the carrying amount that would have been determined, net of depletion
and depreciation, had no impairment loss been recognized for the CGU in prior periods. A reversal of an impairment
loss is recognized immediately through profit or loss.
Exploration and evaluation assets are assessed for impairment if: (i) sufficient data exists to determine technical
feasibility and commercial viability of an exploration area, or (ii) facts and circumstances suggest that the carrying
amount exceeds the recoverable amount. For purposes of impairment testing, exploration and evaluation assets are
allocated to CGU’s.
N o t e s t o t h e F i N a N c i a l s t a t e m e N t s | 2 0 1 2 a N N U a l r e p o r t76
B i r c h c l i f f e n e r g y l t d .
(m) Income Taxes
Birchcliff is a corporation as defined under the Income Tax Act (Canada) and is subject to Canadian Federal and provincial
taxes. Birchcliff is subject to provincial taxes in Alberta as the Corporation operates in this jurisdiction. The Corporation’s
income tax expenses include current and/or deferred tax. Income tax expense is recognized through profit or loss
except to the extent that it relates to items recognized directly in equity, in which case the related income taxes are also
recognized in equity.
Current tax is the expected tax payable on taxable income and Part VI.I dividend tax payable on taxable preferred shares
for the period, using tax rates enacted or substantively enacted at the reporting date, and any adjustment to tax payable
in respect of previous years.
Deferred tax is recognized on temporary differences between the carrying amounts of assets and liabilities in the
financial statements and the corresponding tax bases used in the computation of taxable income. Deferred tax liabilities
are generally recognized for all taxable temporary differences. Deferred tax assets are generally recognized for all
deductible temporary differences to the extent that it is probable that taxable income will be available against which
those deductible temporary differences can be utilized. The carrying amount of deferred tax assets is reviewed at the
end of each reporting period and reduced to the extent that it is no longer probable that sufficient taxable income will
be available to allow all or part of the asset to be recovered.
Deferred tax assets and liabilities are measured at the tax rates that are expected to apply in the period in which the
liability is expected to be settled or the asset realized, based on tax rates (and tax laws) that have been enacted or
substantively enacted by the end of the reporting period. The measurement of deferred tax liabilities and assets reflects
the tax consequences that would follow from the manner in which Birchcliff expects, at the end of the reporting period,
to recover or settle the carrying amount of its assets and liabilities.
(n) Flow-Through Shares
The Corporation may issue flow-through shares to finance a portion of its capital expenditure program. Pursuant to
the terms of the flow-through share agreements, the tax deductions associated with the expenditures are renounced
to the subscribers. The difference between the value ascribed to flow-through shares issued and the value that would
have been received for common shares at the date of announcements of the flow-through shares is initially recognized
as a liability on the Statements of Financial Position. When the expenditures are incurred, the liability is drawn down, a
deferred tax liability is recorded equal to the estimated amount of deferred income tax payable by the Corporation as a
result of the renunciation and the difference is recognized as a deferred tax expense.
(o) Critical Accounting Judgments and Key Sources of Estimation Uncertainty
The timely preparation of the financial statements requires management to make judgments, estimates and
assumptions that affect the application of accounting policies and reported amounts of assets and liabilities and income
and expenses. Accordingly, actual results may differ from these estimates. Estimates and underlying assumptions are
reviewed on an ongoing basis. Revisions to accounting estimates are recognized in the period in which the estimates are
revised and in any future periods affected.
Critical judgments in applying accounting policies:
The following are the critical judgments that management has made in the process of applying the Corporation’s
accounting policies and that have the most significant effect on the amounts recognized in these financial statements:
2 0 1 2 A N N U A L r e p o r t | N o t e s t o t h e F i N A N c i A L s t A t e m e N t s 77

B i r c h c l i f f e n e r g y l t d .
(i) Reserves
Reported recoverable quantities of proved and probable reserves include judgmental assumptions regarding
production profile, commodity prices, exchange rates, remediation costs, timing and amount of future
development costs, and production, transportation and marketing costs for future cash flows. It also requires
interpretation of geological and geophysical models in order to make an assessment of the size, shape, depth
and quality of reservoirs, and their anticipated recoveries. The economical, geological and technical factors used
to estimate reserves may change from period to period. Changes in reported reserves can impact the carrying
values of the Corporation’s petroleum and natural gas properties and equipment, the calculation of depletion
and depreciation, the provision for decommissioning obligations, and the recognition of deferred tax assets due
to changes in expected future cash flows. The recoverable quantities of reserves and estimated cash flows from
Birchcliff’s petroleum and natural gas interests are independently evaluated by reserve engineers at least annually.
The Corporation’s petroleum and natural gas reserves represent the estimated quantities of petroleum, natural
gas and natural gas liquids which geological, geophysical and engineering data demonstrate with a specified
degree of certainty to be economically recoverable in future years from known reservoirs and which are considered
commercially producible. Such reserves may be considered commercially producible if management has the
intention of developing and producing them and such intention is based upon (i) a reasonable assessment of the
future economics of such production; (ii) a reasonable expectation that there is a market for all or substantially all
the expected petroleum and natural gas production; and (iii) evidence that the necessary production, transmission
and transportation facilities are available or can be made available. Reserves may only be considered proven and
probable if producibility is supported by either production or conclusive formation tests. Birchcliff’s oil and gas
reserves are determined in accordance with the standards contained in National Instrument 51-101 Standard of
Disclosures for Oil and Gas Activities and the Canadian Oil and Gas Evaluation Handbook.
(ii) Identification of cash-generating units
Birchcliff’s assets are aggregated into CGU’s for the purpose of calculating impairment based on their ability to
generate largely independent cash inflows. CGU’s have been determined based on similar geological structure,
shared infrastructure, geographical proximity, operating structure, commodity type and similar exposures to market
risks. By their nature, these assumptions are subject to management’s judgment and may impact the carrying value
of the Corporation’s assets in future periods.
(iii) Identification of impairment indicators
IFRS requires Birchcliff to assess, at each reporting date, whether there are any indicators that its assets may be
impaired. Birchcliff is required to consider information from both external sources (such as negative downturn in
commodity prices, significant adverse changes in the technological, market, economic or legal environment in
which the entity operates) and internal sources (such as downward revisions in reserves, significant adverse effect
on the financial and operational performance of a CGU, evidence of obsolescence or physical damage to the asset).
By their nature, these assumptions are subject to management’s judgment.
(iv) Tax uncertainties
IFRS requires Birchcliff, at each reporting date, to make certain judgments on uncertain tax positions by relevant
tax authorities. Judgments include determining whether the Corporation will “more likely than not” be successful
in defending its tax positions by considering information from relevant tax interpretations and tax laws in Canada.
As such, this recognition threshold is subject to management’s judgment and may impact the carrying value of the
Corporation’s deferred tax assets and liabilities at the end of the reporting period.
N o t e s t o t h e F i N a N c i a l s t a t e m e N t s | 2 0 1 2 a N N U a l r e p o r t78

B i r c h c l i f f e n e r g y l t d .
Key sources of estimation uncertainty:
The following are the key assumptions concerning the sources of estimation uncertainty at the end of the reporting
period, that have a significant risk of causing adjustments to the carrying amounts of assets and liabilities within the
next financial year:
(i) Share-based payments
All equity-settled, share-based awards issued by the Corporation are fair valued using the Black-Scholes option-
pricing model. In assessing the fair value of equity-based compensation, estimates have to be made regarding the
expected volatility in share price, option life, dividend yield, risk-free rate and estimated forfeitures at the initial
grant date.
(ii) Decommissioning obligations
The Corporation estimates future remediation costs of production facilities, wells and pipelines at different stages
of development and construction of assets or facilities. In most instances, removal of assets occurs many years into
the future. This requires an estimate regarding abandonment date, future environmental and regulatory legislation,
the extent of reclamation activities, the engineering methodology for estimating cost, future removal technologies
in determining the removal cost and liability-specific discount rates to determine the present value of these cash
flows.
(iii) Impairment of non-financial assets
For the purposes of determining whether impairment of petroleum and natural gas assets has occurred, and the
extent of any impairment or its reversal, the key assumptions the Corporation uses in estimating future cash flows
are future petroleum and natural gas prices, expected production volumes and anticipated recoverable quantities
of proved and probable reserves. These assumptions are subject to change as new information becomes available.
Changes in economic conditions can also affect the rate used to discount future cash flow estimates. Changes in the
aforementioned assumptions could affect the carrying amount of the Corporation’s assets, and impairment charges
and reversal will affect profit or loss.
(iv) Income taxes
Birchcliff files corporate income tax, goods and service tax and other tax returns with various provincial and federal
taxation authorities in Canada. There can be differing interpretations of applicable tax laws and regulations. The
resolution of these tax positions through negotiations or litigation with tax authorities can take several years
to complete. The Corporation does not anticipate that there will be any material impact upon the results of its
operations, financial position or liquidity.
Tax provisions are based on enacted or substantively enacted laws. Changes in those laws could affect amounts
recognized in profit or loss both in the period of change, which would include any impact on cumulative provisions,
and in future periods.
Deferred tax assets (if any) are recognized only to the extent it is considered probable that those assets will be
recoverable. This involves an assessment of when those deferred tax assets are likely to reverse and a judgment
as to whether or not there will be sufficient taxable profits available to offset the tax assets when they do reverse.
This requires assumptions regarding future profitability and is therefore inherently uncertain. Estimates of future
taxable income are based on forecasted cash flows from operations. To the extent that any interpretation of tax law
is challenged by the tax authorities or future cash flows and taxable income differ significantly from estimates, the
ability of Birchcliff to realize the deferred tax assets recorded at the balance sheet date could be impacted.
2 0 1 2 A N N U A L r e p o r t | N o t e s t o t h e F i N A N c i A L s t A t e m e N t s 79
B i r c h c l i f f e n e r g y l t d .
(p) Earnings Per Common Share
The Corporation calculates per common share amounts using net income available to Birchcliff’s shareholders, reduced
for preferred share dividends and divided by the weighted average number of common shares outstanding. Basic
per share information is computed using the weighted average number of basic common shares outstanding during
the period. Diluted per share information is calculated using the treasury stock method, which assumes that any
proceeds from the exercise of “in-the-money” stock options or performance warrants, plus the unamortized stock-based
compensation expense amounts, would be used to purchase common shares at the average market price during the
period. No adjustment to diluted earnings per share is made if the result of these calculations is anti-dilutive.
4. CHANGES IN ACCOUNTING POLICIES
Recent Accounting Standards and Interpretations Issued but not yet Effective:
The IASB issued the following IFRSs effective for annual periods beginning on or after January 1, 2013. Earlier application
is permitted providing that IFRS 10, IFRS 11, IFRS 12, IAS 27 and IAS 28 are adopted together, except that IFRS 12 may be
adopted earlier. Birchcliff is currently assessing the impact of adopting these pronouncements, however, it anticipates that
these standards will not have a material impact on the Corporation’s financial statements.
IFRS 10 Consolidated Financial Statements builds on existing principles by identifying the concept of control as the
determining factor in whether an entity should be included within the consolidated financial statements of the parent
company. The standard provides additional guidance to assist in the determination of control where this is difficult to assess.
IFRS 10 replaces those parts of IAS 27 Consolidated and Separate Financial Statements (revised 2011) that address when and
how an entity should prepare consolidated financial statements and replaces SIC 12 Consolidation – Special Purpose Entities in
its entirety. IAS 27 retains the current guidance for separate financial statements.
IFRS 11 Joint Arrangements provides for a more substance based reflection of joint arrangements by focusing on the
rights and obligations of the arrangement, rather than its legal form (as is currently the case). The standard addresses
inconsistencies in the reporting of joint arrangements by requiring a single method to account for interests in jointly
controlled entities. IFRS 11 supersedes IAS 31 Interests in Joint Ventures and SIC 13 Jointly Controlled Entities – Non-Monetary
Contributions by Ventures. IAS 28 Investments in Associates and Joint Ventures (revised 2011) has been amended to conform to
changes based on the issuance of IFRS 10 and IFRS 11.
IFRS 12 Disclosure of Interests in Other Entities requires extensive disclosures relating to an entity’s interests in subsidiaries,
joint arrangements, associates and unconsolidated structured entities. An entity is required to disclose information that helps
users of its financial statements evaluate the nature of and risks associated with its interests in other entities and the effects
of those interests on its financial statements. The effective date of IFRS 12 is January 1, 2013 but entities are permitted to
incorporate any of the new disclosures in their financial statements before that date.
IFRS 13 Fair Value Measurement establishes a single framework for measuring fair values. This standard applies to all
transactions and balances (whether financial or non-financial) for which IFRS requires or permits fair value measurements,
with the exception of share-based payment transactions accounted for under IFRS 2 Share-based Payment and leasing
transactions within the scope of IAS 17 Leases. IFRS 13 defines fair value, provides guidance on its determination and
introduces consistent requirements for disclosures on fair value measurements.
N o t e s t o t h e F i N a N c i a l s t a t e m e N t s | 2 0 1 2 a N N U a l r e p o r t80

B i r c h c l i f f e n e r g y l t d .
Other Accounting Standards and Interpretations
IFRS 9 Financial Instruments issued in November 2009 and amended in October 2010 introduces new requirements for
the classification and measurement of financial assets and financial liabilities and for de-recognition. IFRS 9 is expected
to be published in three parts. The first part, Phase 1 – classification and measurement of financial instruments sets out
the requirements for recognizing and measuring financial assets, financial liabilities and some contracts to buy or sell
non-financial items. Phase 1 simplifies the measurement of financial assets by classifying all financial assets as those being
recorded at amortized cost or being recorded at fair value. Phase 1 is effective for periods beginning on or after January 1,
2015, although earlier adoption is allowed. Except for certain additional disclosures, the adoption of this standard is not
expected to have an impact on the Corporation’s financial statements.
5. EXPLORATION AND EVALUATION ASSETS
The continuity for Exploration and Evaluation (“E&E”) assets are as follows:
E&E(1)(2)
As at December 31, 2010 1,540
Additions 318
As at December 31, 2011 1,858
Additions 248
As at December 31, 2012 2,106
(1) E&E assets consist of the Corporation’s exploration activities which are pending the determination of economic quantities of commercially producible proven reserves. Additions represent the Corporation’s net share of costs incurred on E&E activities during the period. A review of each exploration project by area is carried out at each reporting date to ascertain whether economical quantities of proven reserves have been discovered and whether such costs should be transferred to depletable petroleum and natural gas components. There were no exploration costs reclassified from the E&E category to petroleum and natural gas properties and equipment category during 2012 and 2011.
(2) At the end of each reporting period, the Corporation performed an asset impairment review of its E&E assets to ensure that the carrying values of those assets are recoverable. The Corporation’s E&E assets were not impaired at December 31, 2012 and December 31, 2011.
2 0 1 2 A N N U A L r e p o r t | N o t e s t o t h e F i N A N c i A L s t A t e m e N t s 81
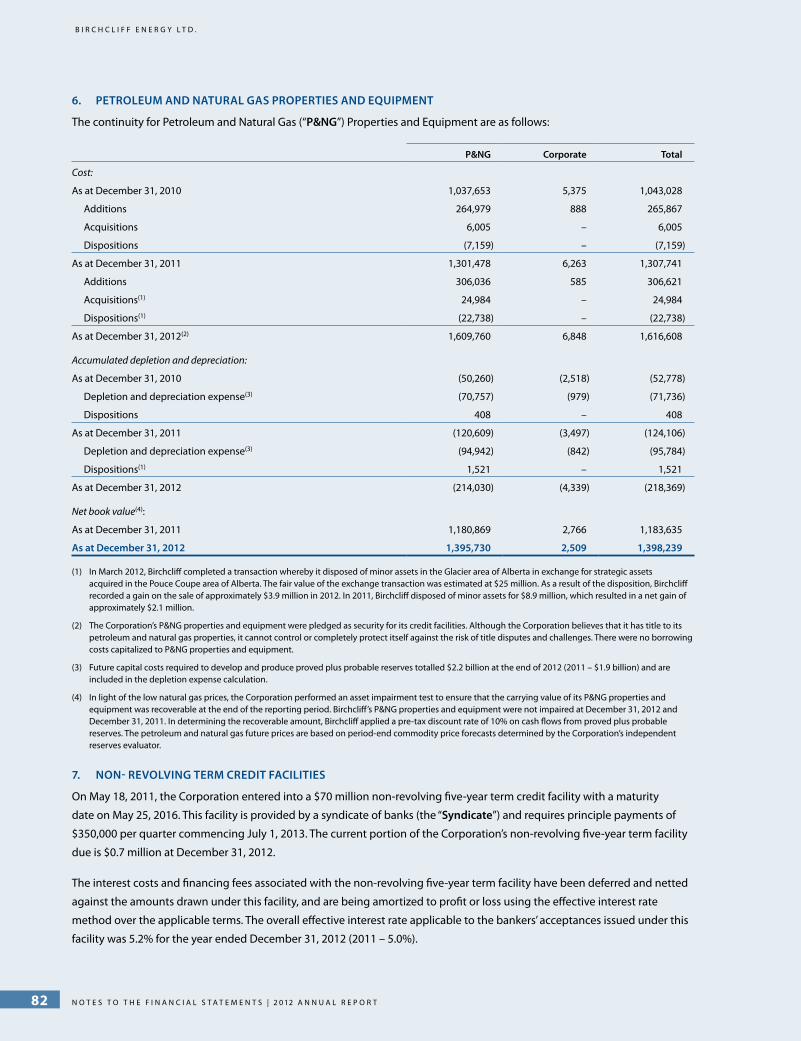
B i r c h c l i f f e n e r g y l t d .
6. PETROLEUM AND NATURAL GAS PROPERTIES AND EQUIPMENT
The continuity for Petroleum and Natural Gas (“P&NG”) Properties and Equipment are as follows:
P&NG Corporate Total
Cost:
As at December 31, 2010 1,037,653 5,375 1,043,028
Additions 264,979 888 265,867
Acquisitions 6,005 – 6,005
Dispositions (7,159) – (7,159)
As at December 31, 2011 1,301,478 6,263 1,307,741
Additions 306,036 585 306,621
Acquisitions(1) 24,984 – 24,984
Dispositions(1) (22,738) – (22,738)
As at December 31, 2012(2) 1,609,760 6,848 1,616,608
Accumulated depletion and depreciation:
As at December 31, 2010 (50,260) (2,518) (52,778)
Depletion and depreciation expense(3) (70,757) (979) (71,736)
Dispositions 408 – 408
As at December 31, 2011 (120,609) (3,497) (124,106)
Depletion and depreciation expense(3) (94,942) (842) (95,784)
Dispositions(1) 1,521 – 1,521
As at December 31, 2012 (214,030) (4,339) (218,369)
Net book value(4):
As at December 31, 2011 1,180,869 2,766 1,183,635
As at December 31, 2012 1,395,730 2,509 1,398,239
(1) In March 2012, Birchcliff completed a transaction whereby it disposed of minor assets in the Glacier area of Alberta in exchange for strategic assets acquired in the Pouce Coupe area of Alberta. The fair value of the exchange transaction was estimated at $25 million. As a result of the disposition, Birchcliff recorded a gain on the sale of approximately $3.9 million in 2012. In 2011, Birchcliff disposed of minor assets for $8.9 million, which resulted in a net gain of approximately $2.1 million.
(2) The Corporation’s P&NG properties and equipment were pledged as security for its credit facilities. Although the Corporation believes that it has title to its petroleum and natural gas properties, it cannot control or completely protect itself against the risk of title disputes and challenges. There were no borrowing costs capitalized to P&NG properties and equipment.
(3) Future capital costs required to develop and produce proved plus probable reserves totalled $2.2 billion at the end of 2012 (2011 – $1.9 billion) and are included in the depletion expense calculation.
(4) In light of the low natural gas prices, the Corporation performed an asset impairment test to ensure that the carrying value of its P&NG properties and equipment was recoverable at the end of the reporting period. Birchcliff’s P&NG properties and equipment were not impaired at December 31, 2012 and December 31, 2011. In determining the recoverable amount, Birchcliff applied a pre-tax discount rate of 10% on cash flows from proved plus probable reserves. The petroleum and natural gas future prices are based on period-end commodity price forecasts determined by the Corporation’s independent reserves evaluator.
7. NON- REVOLVING TERM CREDIT FACILITIES
On May 18, 2011, the Corporation entered into a $70 million non-revolving five-year term credit facility with a maturity
date on May 25, 2016. This facility is provided by a syndicate of banks (the “Syndicate”) and requires principle payments of
$350,000 per quarter commencing July 1, 2013. The current portion of the Corporation’s non-revolving five-year term facility
due is $0.7 million at December 31, 2012.
The interest costs and financing fees associated with the non-revolving five-year term facility have been deferred and netted
against the amounts drawn under this facility, and are being amortized to profit or loss using the effective interest rate
method over the applicable terms. The overall effective interest rate applicable to the bankers’ acceptances issued under this
facility was 5.2% for the year ended December 31, 2012 (2011 – 5.0%).
N o t e s t o t h e F i N a N c i a l s t a t e m e N t s | 2 0 1 2 a N N U a l r e p o r t82
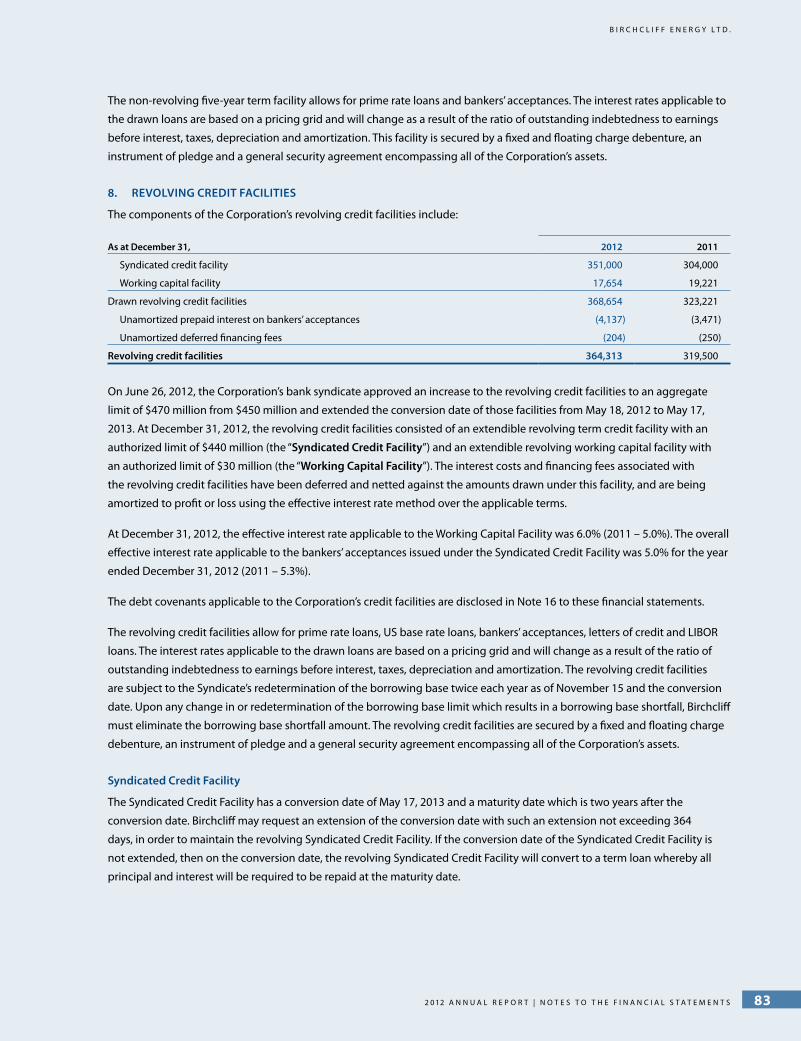
B i r c h c l i f f e n e r g y l t d .
The non-revolving five-year term facility allows for prime rate loans and bankers’ acceptances. The interest rates applicable to
the drawn loans are based on a pricing grid and will change as a result of the ratio of outstanding indebtedness to earnings
before interest, taxes, depreciation and amortization. This facility is secured by a fixed and floating charge debenture, an
instrument of pledge and a general security agreement encompassing all of the Corporation’s assets.
8. REVOLVING CREDIT FACILITIES
The components of the Corporation’s revolving credit facilities include:
As at December 31, 2012 2011
Syndicated credit facility 351,000 304,000
Working capital facility 17,654 19,221
Drawn revolving credit facilities 368,654 323,221
Unamortized prepaid interest on bankers’ acceptances (4,137) (3,471)
Unamortized deferred financing fees (204) (250)
Revolving credit facilities 364,313 319,500
On June 26, 2012, the Corporation’s bank syndicate approved an increase to the revolving credit facilities to an aggregate
limit of $470 million from $450 million and extended the conversion date of those facilities from May 18, 2012 to May 17,
2013. At December 31, 2012, the revolving credit facilities consisted of an extendible revolving term credit facility with an
authorized limit of $440 million (the “Syndicated Credit Facility”) and an extendible revolving working capital facility with
an authorized limit of $30 million (the “Working Capital Facility”). The interest costs and financing fees associated with
the revolving credit facilities have been deferred and netted against the amounts drawn under this facility, and are being
amortized to profit or loss using the effective interest rate method over the applicable terms.
At December 31, 2012, the effective interest rate applicable to the Working Capital Facility was 6.0% (2011 – 5.0%). The overall
effective interest rate applicable to the bankers’ acceptances issued under the Syndicated Credit Facility was 5.0% for the year
ended December 31, 2012 (2011 – 5.3%).
The debt covenants applicable to the Corporation’s credit facilities are disclosed in Note 16 to these financial statements.
The revolving credit facilities allow for prime rate loans, US base rate loans, bankers’ acceptances, letters of credit and LIBOR
loans. The interest rates applicable to the drawn loans are based on a pricing grid and will change as a result of the ratio of
outstanding indebtedness to earnings before interest, taxes, depreciation and amortization. The revolving credit facilities
are subject to the Syndicate’s redetermination of the borrowing base twice each year as of November 15 and the conversion
date. Upon any change in or redetermination of the borrowing base limit which results in a borrowing base shortfall, Birchcliff
must eliminate the borrowing base shortfall amount. The revolving credit facilities are secured by a fixed and floating charge
debenture, an instrument of pledge and a general security agreement encompassing all of the Corporation’s assets.
Syndicated Credit Facility
The Syndicated Credit Facility has a conversion date of May 17, 2013 and a maturity date which is two years after the
conversion date. Birchcliff may request an extension of the conversion date with such an extension not exceeding 364
days, in order to maintain the revolving Syndicated Credit Facility. If the conversion date of the Syndicated Credit Facility is
not extended, then on the conversion date, the revolving Syndicated Credit Facility will convert to a term loan whereby all
principal and interest will be required to be repaid at the maturity date.
2 0 1 2 A N N U A L r e p o r t | N o t e s t o t h e F i N A N c i A L s t A t e m e N t s 83
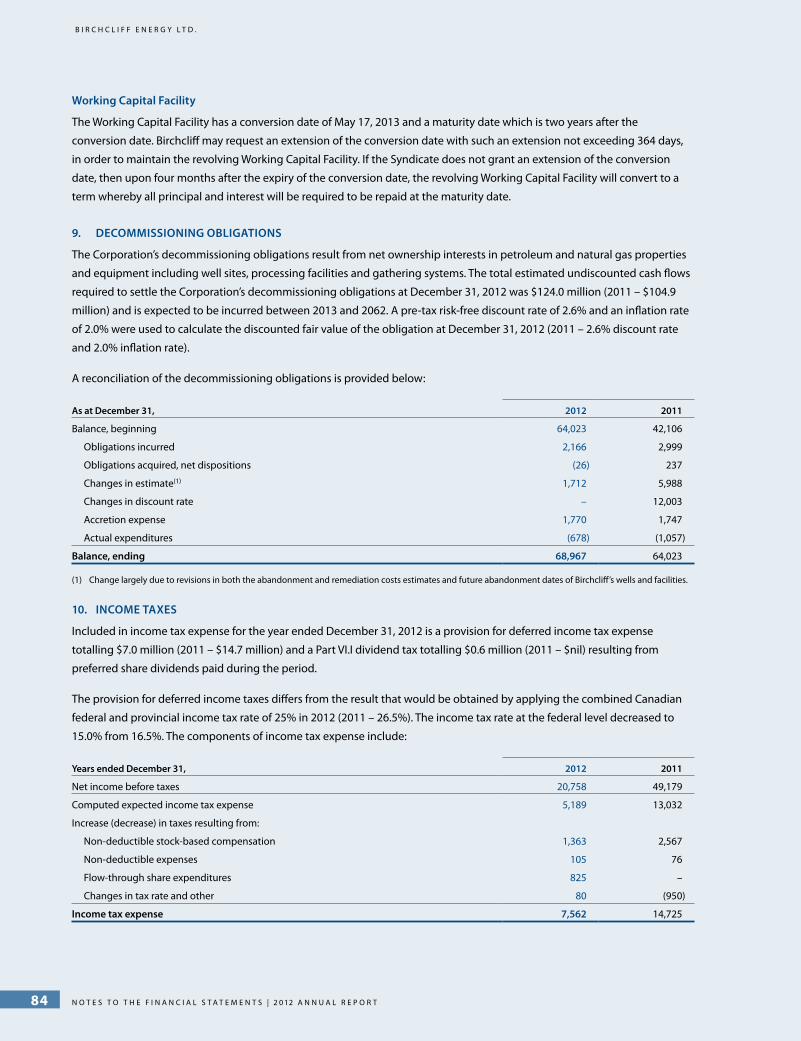
B i r c h c l i f f e n e r g y l t d .
Working Capital Facility
The Working Capital Facility has a conversion date of May 17, 2013 and a maturity date which is two years after the
conversion date. Birchcliff may request an extension of the conversion date with such an extension not exceeding 364 days,
in order to maintain the revolving Working Capital Facility. If the Syndicate does not grant an extension of the conversion
date, then upon four months after the expiry of the conversion date, the revolving Working Capital Facility will convert to a
term whereby all principal and interest will be required to be repaid at the maturity date.
9. DECOMMISSIONING OBLIGATIONS
The Corporation’s decommissioning obligations result from net ownership interests in petroleum and natural gas properties
and equipment including well sites, processing facilities and gathering systems. The total estimated undiscounted cash flows
required to settle the Corporation’s decommissioning obligations at December 31, 2012 was $124.0 million (2011 – $104.9
million) and is expected to be incurred between 2013 and 2062. A pre-tax risk-free discount rate of 2.6% and an inflation rate
of 2.0% were used to calculate the discounted fair value of the obligation at December 31, 2012 (2011 – 2.6% discount rate
and 2.0% inflation rate).
A reconciliation of the decommissioning obligations is provided below:
As at December 31, 2012 2011
Balance, beginning 64,023 42,106
Obligations incurred 2,166 2,999
Obligations acquired, net dispositions (26) 237
Changes in estimate(1) 1,712 5,988
Changes in discount rate – 12,003
Accretion expense 1,770 1,747
Actual expenditures (678) (1,057)
Balance, ending 68,967 64,023
(1) Change largely due to revisions in both the abandonment and remediation costs estimates and future abandonment dates of Birchcliff’s wells and facilities.
10. INCOME TAXES
Included in income tax expense for the year ended December 31, 2012 is a provision for deferred income tax expense
totalling $7.0 million (2011 – $14.7 million) and a Part VI.I dividend tax totalling $0.6 million (2011 – $nil) resulting from
preferred share dividends paid during the period.
The provision for deferred income taxes differs from the result that would be obtained by applying the combined Canadian
federal and provincial income tax rate of 25% in 2012 (2011 – 26.5%). The income tax rate at the federal level decreased to
15.0% from 16.5%. The components of income tax expense include:
Years ended December 31, 2012 2011
Net income before taxes 20,758 49,179
Computed expected income tax expense 5,189 13,032
Increase (decrease) in taxes resulting from:
Non-deductible stock-based compensation 1,363 2,567
Non-deductible expenses 105 76
Flow-through share expenditures 825 –
Changes in tax rate and other 80 (950)
Income tax expense 7,562 14,725
N o t e s t o t h e F i N a N c i a l s t a t e m e N t s | 2 0 1 2 a N N U a l r e p o r t84

B i r c h c l i f f e n e r g y l t d .
The components of deferred income tax liabilities include:
As at December 31, 2012 2011
Deferred income tax liabilities:
P&NG properties and equipment and E&E assets 119,573 83,730
Deferred financing fees 169 216
Deferred income tax assets:
Decommissioning obligations (17,242) (16,006)
Share issue costs (1,054) (544)
Non-capital losses (66,445) (39,551)
Deferred income tax liabilities 35,001 27,845
A continuity of the net deferred income tax liabilities is provided below:
BalanceJan. 1, 2011
Recognized inProfit or Loss
BalanceDec 31, 2011
P&NG properties and equipment and E&E assets 69,173 14,557 83,730
Deferred financing fees 105 111 216
Decommissioning obligations (10,564) (5,442) (16,006)
Share issue costs (1,465) 921 (544)
Non-capital losses (44,129) 4,578 (39,551)
13,120 14,725 27,845
BalanceJan. 1, 2012
Recognized inProfit or Loss
Recognizedin Equity
Flow-ThroughShares
BalanceDec 31, 2012
P&NG properties and equipment and E&E assets 83,730 34,138 – 1,705 119,573
Deferred financing fees 216 (47) – – 169
Decommissioning obligations (16,006) (1,236) – – (17,242)
Share issue costs (544) 969 (1,479) – (1,054)
Non-capital losses (39,551) (26,894) – – (66,445)
27,845 6,930 (1,479) 1,705 35,001
As at December 31, 2012, the Corporation had approximately $1.2 billion in tax pools available for deduction against future
taxable income. Included in this tax basis are estimated non-capital loss carry forwards of approximately $268.7 million that
expire between 2026 and 2032. Discretionary tax deductions, including Canadian Development Expenses, Canadian Oil and
Gas Property Expense and Capital Cost Allowance, were maximized in the respective tax years in order to reduce Birchcliff’s
accounting profits into a loss position for tax purposes. Management expects that future taxable income will be available to
utilize non-capital losses.
11. SHAREHOLDERS’ EQUITY
Share Capital
(a) Authorized:
Unlimited number of voting common shares, with no par value
Unlimited number of preferred shares, with no par value
Common shares and preferred shares are classified as equity. Incremental costs directly attributable to the issuance of
shares are recognized as a reduction in share capital, net of any tax effects. The preferred shares may be issued in one or
2 0 1 2 A N N U A L r e p o r t | N o t e s t o t h e F i N A N c i A L s t A t e m e N t s 85
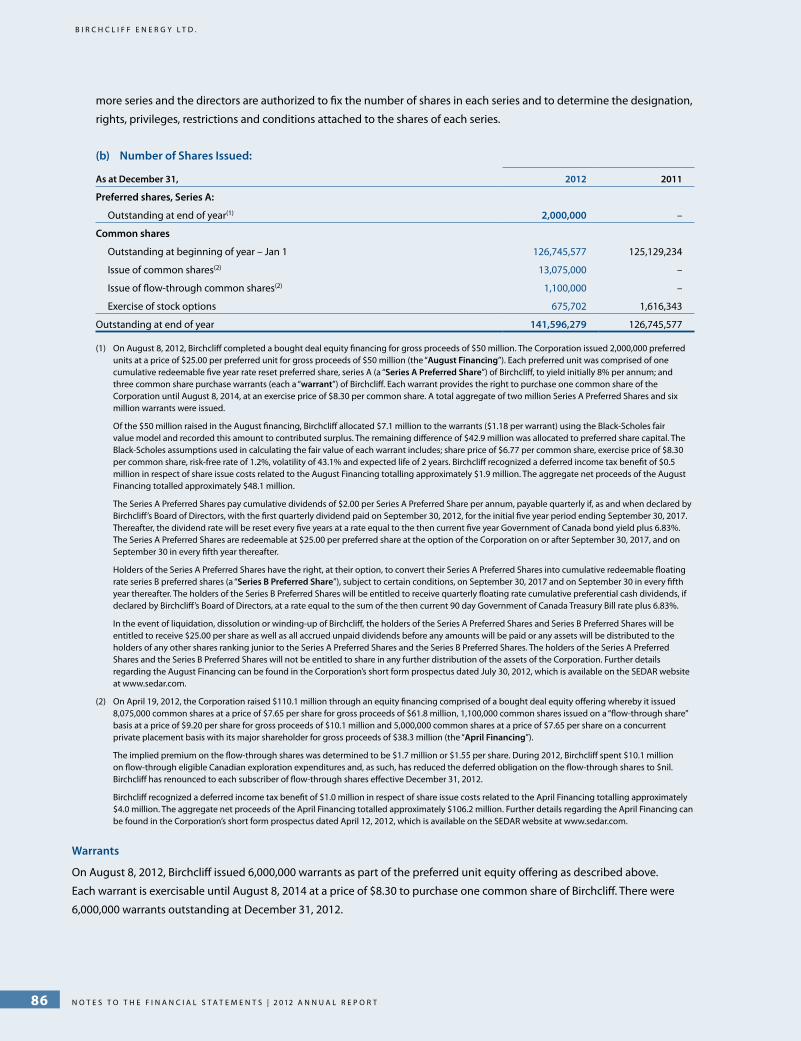
B i r c h c l i f f e n e r g y l t d .
more series and the directors are authorized to fix the number of shares in each series and to determine the designation,
rights, privileges, restrictions and conditions attached to the shares of each series.
(b) Number of Shares Issued:
As at December 31, 2012 2011
Preferred shares, Series A:
Outstanding at end of year(1) 2,000,000 –
Common shares
Outstanding at beginning of year – Jan 1 126,745,577 125,129,234
Issue of common shares(2) 13,075,000 –
Issue of flow-through common shares(2) 1,100,000 –
Exercise of stock options 675,702 1,616,343
Outstanding at end of year 141,596,279 126,745,577
(1) On August 8, 2012, Birchcliff completed a bought deal equity financing for gross proceeds of $50 million. The Corporation issued 2,000,000 preferred units at a price of $25.00 per preferred unit for gross proceeds of $50 million (the “August Financing”). Each preferred unit was comprised of one cumulative redeemable five year rate reset preferred share, series A (a “Series A Preferred Share”) of Birchcliff, to yield initially 8% per annum; and three common share purchase warrants (each a “warrant”) of Birchcliff. Each warrant provides the right to purchase one common share of the Corporation until August 8, 2014, at an exercise price of $8.30 per common share. A total aggregate of two million Series A Preferred Shares and six million warrants were issued.
Of the $50 million raised in the August financing, Birchcliff allocated $7.1 million to the warrants ($1.18 per warrant) using the Black-Scholes fair value model and recorded this amount to contributed surplus. The remaining difference of $42.9 million was allocated to preferred share capital. The Black-Scholes assumptions used in calculating the fair value of each warrant includes; share price of $6.77 per common share, exercise price of $8.30 per common share, risk-free rate of 1.2%, volatility of 43.1% and expected life of 2 years. Birchcliff recognized a deferred income tax benefit of $0.5 million in respect of share issue costs related to the August Financing totalling approximately $1.9 million. The aggregate net proceeds of the August Financing totalled approximately $48.1 million.
The Series A Preferred Shares pay cumulative dividends of $2.00 per Series A Preferred Share per annum, payable quarterly if, as and when declared by Birchcliff’s Board of Directors, with the first quarterly dividend paid on September 30, 2012, for the initial five year period ending September 30, 2017. Thereafter, the dividend rate will be reset every five years at a rate equal to the then current five year Government of Canada bond yield plus 6.83%. The Series A Preferred Shares are redeemable at $25.00 per preferred share at the option of the Corporation on or after September 30, 2017, and on September 30 in every fifth year thereafter.
Holders of the Series A Preferred Shares have the right, at their option, to convert their Series A Preferred Shares into cumulative redeemable floating rate series B preferred shares (a “Series B Preferred Share”), subject to certain conditions, on September 30, 2017 and on September 30 in every fifth year thereafter. The holders of the Series B Preferred Shares will be entitled to receive quarterly floating rate cumulative preferential cash dividends, if declared by Birchcliff’s Board of Directors, at a rate equal to the sum of the then current 90 day Government of Canada Treasury Bill rate plus 6.83%.
In the event of liquidation, dissolution or winding-up of Birchcliff, the holders of the Series A Preferred Shares and Series B Preferred Shares will be entitled to receive $25.00 per share as well as all accrued unpaid dividends before any amounts will be paid or any assets will be distributed to the holders of any other shares ranking junior to the Series A Preferred Shares and the Series B Preferred Shares. The holders of the Series A Preferred Shares and the Series B Preferred Shares will not be entitled to share in any further distribution of the assets of the Corporation. Further details regarding the August Financing can be found in the Corporation’s short form prospectus dated July 30, 2012, which is available on the SEDAR website at www.sedar.com.
(2) On April 19, 2012, the Corporation raised $110.1 million through an equity financing comprised of a bought deal equity offering whereby it issued 8,075,000 common shares at a price of $7.65 per share for gross proceeds of $61.8 million, 1,100,000 common shares issued on a “flow-through share” basis at a price of $9.20 per share for gross proceeds of $10.1 million and 5,000,000 common shares at a price of $7.65 per share on a concurrent private placement basis with its major shareholder for gross proceeds of $38.3 million (the “April Financing”).
The implied premium on the flow-through shares was determined to be $1.7 million or $1.55 per share. During 2012, Birchcliff spent $10.1 million on flow-through eligible Canadian exploration expenditures and, as such, has reduced the deferred obligation on the flow-through shares to $nil. Birchcliff has renounced to each subscriber of flow-through shares effective December 31, 2012.
Birchcliff recognized a deferred income tax benefit of $1.0 million in respect of share issue costs related to the April Financing totalling approximately $4.0 million. The aggregate net proceeds of the April Financing totalled approximately $106.2 million. Further details regarding the April Financing can be found in the Corporation’s short form prospectus dated April 12, 2012, which is available on the SEDAR website at www.sedar.com.
Warrants
On August 8, 2012, Birchcliff issued 6,000,000 warrants as part of the preferred unit equity offering as described above.
Each warrant is exercisable until August 8, 2014 at a price of $8.30 to purchase one common share of Birchcliff. There were
6,000,000 warrants outstanding at December 31, 2012.
N o t e s t o t h e F i N a N c i a l s t a t e m e N t s | 2 0 1 2 a N N U a l r e p o r t86

B i r c h c l i f f e n e r g y l t d .
Preferred Share Dividends
On September 6, 2012, the Board of Directors declared an initial quarterly cash dividend (for a partial quarter) of $579,240
or $0.28962 per Series A Preferred Share, payable to the shareholders of record as at the close of business on September 17,
2012.
On December 6, 2012, the Board of Directors declared a quarterly cash dividend of $1.0 million or $0.50 per Series A Preferred
Share, payable to the shareholders of record as at the close of business on December 19, 2012.
The preferred share dividend distributions are designated an eligible dividend for purposes of the Income Tax Act (Canada).
Per Common Share Amounts
The Corporation calculates basic and diluted per common share amounts using net income available to Birchcliff’s
shareholders, adjusted for preferred share dividend distributions and divided by the weighted average number of common
shares outstanding. The following table presents the computation of net income per common share:
Years ended December 31, 2012 2011
Net income 13,196 34,454
Preferred share dividends (1,579) –
Net income available to Birchcliff’s common shareholders 11,617 34,454
Weighted average common shares:
Weighted average common shares outstanding (basic) 137,083,519 126,282,910
Effect of dilutive stock options & performance warrants 2,820,965 5,161,968
Weighted average common shares outstanding (diluted)(1) 139,904,484 131,444,878
Net income per common share
Basic $0.08 $0.27
Diluted $0.08 $0.26
(1) Diluted per common share information is calculated using the treasury stock method, which assumes that any proceeds from the exercise of “in-the-money” stock options, performance warrants or warrants, plus the unamortized stock-based compensation expense amounts, would be used to purchase common shares at the average market price during the period. No adjustment to diluted earnings per common share is made if the result of these calculations is anti-dilutive. The weighted average diluted common shares outstanding for the year ended December 31, 2012 excludes 9,256,735 (2011 – 3,219,500) of stock options and performance warrants and 6,000,000 (2011 – nil) of warrants that are anti-dilutive.
12. OPERATING EXPENSES
The Corporation’s operating expenses include all costs with respect to day-to-day well and facility operations. Processing
recoveries related to joint interest and third party natural gas reduces operating expenses. The components of operating
expenses are as follows:
Years ended December 31, 2012 2011
Field operating costs 57,082 51,689
Recoveries (6,965) (7,509)
Field operating costs, net 50,117 44,180
Expensed workovers and other 461 526
Operating expenses 50,578 44,706
2 0 1 2 A N N U A L r e p o r t | N o t e s t o t h e F i N A N c i A L s t A t e m e N t s 87
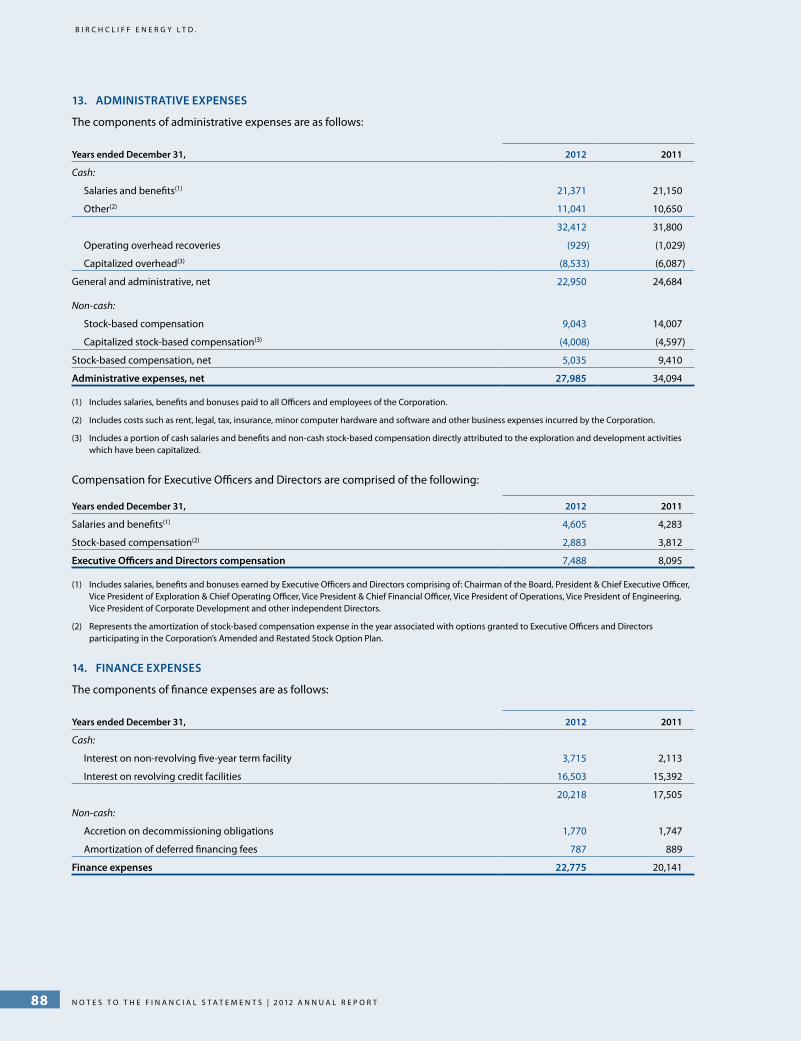
B i r c h c l i f f e n e r g y l t d .
13. ADMINISTRATIVE EXPENSES
The components of administrative expenses are as follows:
Years ended December 31, 2012 2011
Cash:
Salaries and benefits(1) 21,371 21,150
Other(2) 11,041 10,650
32,412 31,800
Operating overhead recoveries (929) (1,029)
Capitalized overhead(3) (8,533) (6,087)
General and administrative, net 22,950 24,684
Non-cash:
Stock-based compensation 9,043 14,007
Capitalized stock-based compensation(3) (4,008) (4,597)
Stock-based compensation, net 5,035 9,410
Administrative expenses, net 27,985 34,094
(1) Includes salaries, benefits and bonuses paid to all Officers and employees of the Corporation.
(2) Includes costs such as rent, legal, tax, insurance, minor computer hardware and software and other business expenses incurred by the Corporation.
(3) Includes a portion of cash salaries and benefits and non-cash stock-based compensation directly attributed to the exploration and development activities which have been capitalized.
Compensation for Executive Officers and Directors are comprised of the following:
Years ended December 31, 2012 2011
Salaries and benefits(1) 4,605 4,283
Stock-based compensation(2) 2,883 3,812
Executive Officers and Directors compensation 7,488 8,095
(1) Includes salaries, benefits and bonuses earned by Executive Officers and Directors comprising of: Chairman of the Board, President & Chief Executive Officer, Vice President of Exploration & Chief Operating Officer, Vice President & Chief Financial Officer, Vice President of Operations, Vice President of Engineering, Vice President of Corporate Development and other independent Directors.
(2) Represents the amortization of stock-based compensation expense in the year associated with options granted to Executive Officers and Directors participating in the Corporation’s Amended and Restated Stock Option Plan.
14. FINANCE EXPENSES
The components of finance expenses are as follows:
Years ended December 31, 2012 2011
Cash:
Interest on non-revolving five-year term facility 3,715 2,113
Interest on revolving credit facilities 16,503 15,392
20,218 17,505
Non-cash:
Accretion on decommissioning obligations 1,770 1,747
Amortization of deferred financing fees 787 889
Finance expenses 22,775 20,141
N o t e s t o t h e F i N a N c i a l s t a t e m e N t s | 2 0 1 2 a N N U a l r e p o r t88

B i r c h c l i f f e n e r g y l t d .
15. SHARE-BASED PAYMENTS
Stock Options
During 2012, the Corporation recorded $5.0 million (2011 – $9.4 million) of non-cash stock-based compensation expense,
net of $4.0 million (2011 – $4.6 million) in capitalized amounts directly attributable to the exploration and development of
the Corporation’s assets. In determining the non-cash stock-based compensation expense for options issued in 2012, the
Corporation applied a weighted average estimated forfeiture rate of 14% (2011 – 16%).
At December 31, 2012, the Corporation’s Amended and Restated Stock Option Plan permitted the grant of options in respect
of a maximum of 14,159,628 (2011 – 12,674,558 common shares). At December 31, 2012, there remained available for
issuance options in respect of 1,695,756 (2011 – 2,207,617) common shares. For stock options exercised during 2012, the
weighted average share trading price was $8.30 (2011 – $12.53) per common share.
A summary of the outstanding stock options is presented below:
NumberWeighted Average
Exercise Price ($)
Outstanding, December 31, 2010 9,247,520 7.26
Granted 3,164,900 11.53
Exercised (1,616,343) (5.57)
Forfeited (329,136) (9.81)
Outstanding, December 31, 2011 10,466,941 8.73
Granted 3,860,900 6.16
Exercised (675,702) (4.41)
Forfeited (1,188,267) (9.85)
Outstanding, December 31, 2012 12,463,872 8.06
The weighted average fair value per option granted during 2012 was $2.50 (2011 - $5.36). The weighted average assumptions
used in calculating the Black-Scholes fair values are set forth below:
Years ended December 31, 2012 2011
Risk-free interest rate 1.5% 2.2%
Option life (years) 3.8 3.7
Expected volatility 52.3% 61.4%
Dividend yield – –
A summary of the stock options outstanding and exercisable under the plan at December 31, 2012 is presented below:
Exercise Price Awards Outstanding Awards Exercisable
Low High Quantity
WeightedAverage
RemainingContractual Life
WeightedAverage
Exercise Price Quantity
WeightedAverage
RemainingContractual Life
WeightedAverage
Exercise Price
$4.53 $6.00 5,047,937 3.05 $5.61 1,954,937 1.05 $5.06
$6.01 $9.00 2,197,367 1.58 $7.65 1,661,532 0.61 $7.68
$9.01 $12.00 4,920,768 2.55 $10.48 2,512,801 2.37 $10.23
$12.01 $13.60 297,800 2.52 $12.84 164,465 1.75 $12.78
12,463,872 2.58 $8.06 6,293,735 1.48 $8.02
2 0 1 2 A N N U A L r e p o r t | N o t e s t o t h e F i N A N c i A L s t A t e m e N t s 89

B i r c h c l i f f e n e r g y l t d .
Performance Warrants
Performance warrants were issued on January 14, 2005 as part of the Corporation’s initial restructuring to become a public
entity. Birchcliff issued 4,049,665 performance warrants with an exercise price of $3.00 with an amended expiration date of
January 31, 2015. There were no performance warrants granted, exercised or forfeited in 2011 and 2012. There are 2,939,732
performance warrants outstanding and exercisable at December 31, 2012 (2011 - 2,939,732).
Each stock option and performance warrant entitles the holder to purchase one common share at the exercise price.
16. CAPITAL MANAGEMENT
The Corporation’s general policy is to maintain a sufficient capital base in order to manage its business in the most effective
manner with the goal of increasing the value of its assets and thus its underlying share value. The Corporation’s objectives
when managing capital are to maintain financial flexibility in order to preserve its ability to meet financial obligations,
including potential obligations arising from additional acquisitions; to maintain a capital structure that allows Birchcliff to
finance its growth strategy using primarily internally-generated cash flow and its available debt capacity; and to optimize the
use of its capital to provide an appropriate investment return to its shareholders. There were no changes in the Corporation’s
approach to capital management in 2012.
The following table shows the Corporation’s total available credit:
As at December 31, 2012 2011
Maximum borrowing base limit (1)(2):
Non-revolving five-year term credit facility 70,000 70,000
Revolving credit facilities 470,000 450,000
540,000 520,000
Principal amount utilized:
Drawn non-revolving five-year term credit facility (70,000) (70,000)
Drawn revolving credit facilities (368,654) (323,221)
Outstanding letters of credit(3) (184) (2,668)
(438,838) (395,889)
Unused credit(2) 101,162 124,111
(1) The Corporation’s credit facilities are subject to a semi-annual review of the borrowing base limit, which is directly impacted by the value of Birchcliff’s petroleum and natural gas reserves. In June 2012, the Corporation’s borrowing base limit under its revolving credit facilities was increased to an aggregate limit of $470 million from $450 million.
(2) The quarterly financial covenants applicable to the Corporation’s credit facilities include (i) an interest coverage ratio, which is calculated on a historical rolling four quarter basis, as earnings before interest and non-cash items including income taxes, stock-based compensation, gains and losses on sale of assets and depletion, depreciation and amortization (“EBITDA”) divided by interest expense and (ii) a debt to EBITDA ratio. Debt for this purpose means indebtedness for borrowed money, as determined at the end of the reporting period, and includes outstanding debt under the Corporation’s credit facilities as shown on the Statements of Financial Position before unamortized deferred financing fees and including outstanding letters of credit, but does not include working capital deficiency.
The Corporation is required to ensure that on the last day of each quarter, the ratio of EBITDA to interest expense, determined on a historical rolling four quarter basis equals or exceeds 3.5:1.0 and the ratio of debt to EBITDA, determined on a historical rolling four quarter basis does not exceed 4.0:1.0. At December 31, 2012, Birchcliff’s EBITDA to interest expense was 6.9:1.0 and Debt to EBITDA was 3.0:1.0. The Corporation was compliant with all financial covenants under its credit facilities as at December 31, 2012 and December 31, 2011.
At December 31, 2012, Birchcliff’s debt to EBITDA covenant does not restrict the Corporation from drawing the maximum amount of $540 million available under its credit facilities.
(3) Letters of credit are issued to various service providers. There were no amounts drawn on the letters of credit as at and during the periods ended December 31, 2012 and December 31, 2011.
N o t e s t o t h e F i N a N c i a l s t a t e m e N t s | 2 0 1 2 a N N U a l r e p o r t90
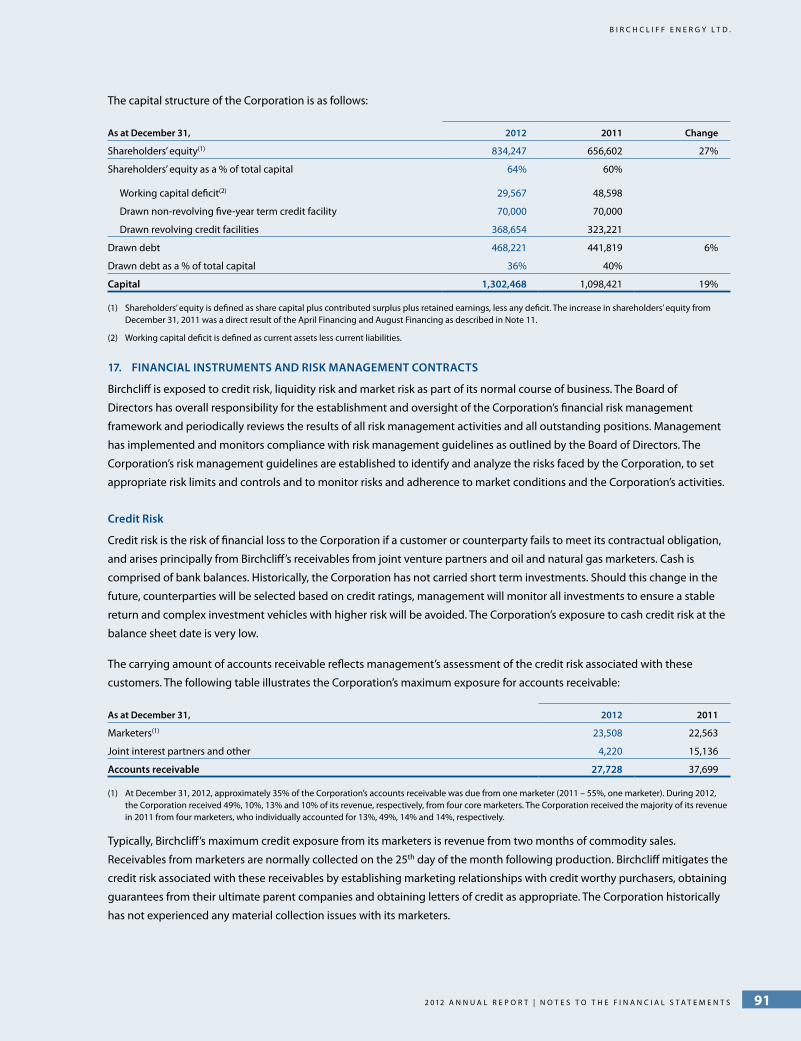
B i r c h c l i f f e n e r g y l t d .
The capital structure of the Corporation is as follows:
As at December 31, 2012 2011 Change
Shareholders’ equity(1) 834,247 656,602 27%
Shareholders’ equity as a % of total capital 64% 60%
Working capital deficit(2) 29,567 48,598
Drawn non-revolving five-year term credit facility 70,000 70,000
Drawn revolving credit facilities 368,654 323,221
Drawn debt 468,221 441,819 6%
Drawn debt as a % of total capital 36% 40%
Capital 1,302,468 1,098,421 19%
(1) Shareholders’ equity is defined as share capital plus contributed surplus plus retained earnings, less any deficit. The increase in shareholders’ equity from December 31, 2011 was a direct result of the April Financing and August Financing as described in Note 11.
(2) Working capital deficit is defined as current assets less current liabilities.
17. FINANCIAL INSTRUMENTS AND RISK MANAGEMENT CONTRACTS
Birchcliff is exposed to credit risk, liquidity risk and market risk as part of its normal course of business. The Board of
Directors has overall responsibility for the establishment and oversight of the Corporation’s financial risk management
framework and periodically reviews the results of all risk management activities and all outstanding positions. Management
has implemented and monitors compliance with risk management guidelines as outlined by the Board of Directors. The
Corporation’s risk management guidelines are established to identify and analyze the risks faced by the Corporation, to set
appropriate risk limits and controls and to monitor risks and adherence to market conditions and the Corporation’s activities.
Credit Risk
Credit risk is the risk of financial loss to the Corporation if a customer or counterparty fails to meet its contractual obligation,
and arises principally from Birchcliff’s receivables from joint venture partners and oil and natural gas marketers. Cash is
comprised of bank balances. Historically, the Corporation has not carried short term investments. Should this change in the
future, counterparties will be selected based on credit ratings, management will monitor all investments to ensure a stable
return and complex investment vehicles with higher risk will be avoided. The Corporation’s exposure to cash credit risk at the
balance sheet date is very low.
The carrying amount of accounts receivable reflects management’s assessment of the credit risk associated with these
customers. The following table illustrates the Corporation’s maximum exposure for accounts receivable:
As at December 31, 2012 2011
Marketers(1) 23,508 22,563
Joint interest partners and other 4,220 15,136
Accounts receivable 27,728 37,699
(1) At December 31, 2012, approximately 35% of the Corporation’s accounts receivable was due from one marketer (2011 – 55%, one marketer). During 2012, the Corporation received 49%, 10%, 13% and 10% of its revenue, respectively, from four core marketers. The Corporation received the majority of its revenue in 2011 from four marketers, who individually accounted for 13%, 49%, 14% and 14%, respectively.
Typically, Birchcliff’s maximum credit exposure from its marketers is revenue from two months of commodity sales.
Receivables from marketers are normally collected on the 25th day of the month following production. Birchcliff mitigates the
credit risk associated with these receivables by establishing marketing relationships with credit worthy purchasers, obtaining
guarantees from their ultimate parent companies and obtaining letters of credit as appropriate. The Corporation historically
has not experienced any material collection issues with its marketers.
2 0 1 2 A N N U A L r e p o r t | N o t e s t o t h e F i N A N c i A L s t A t e m e N t s 91
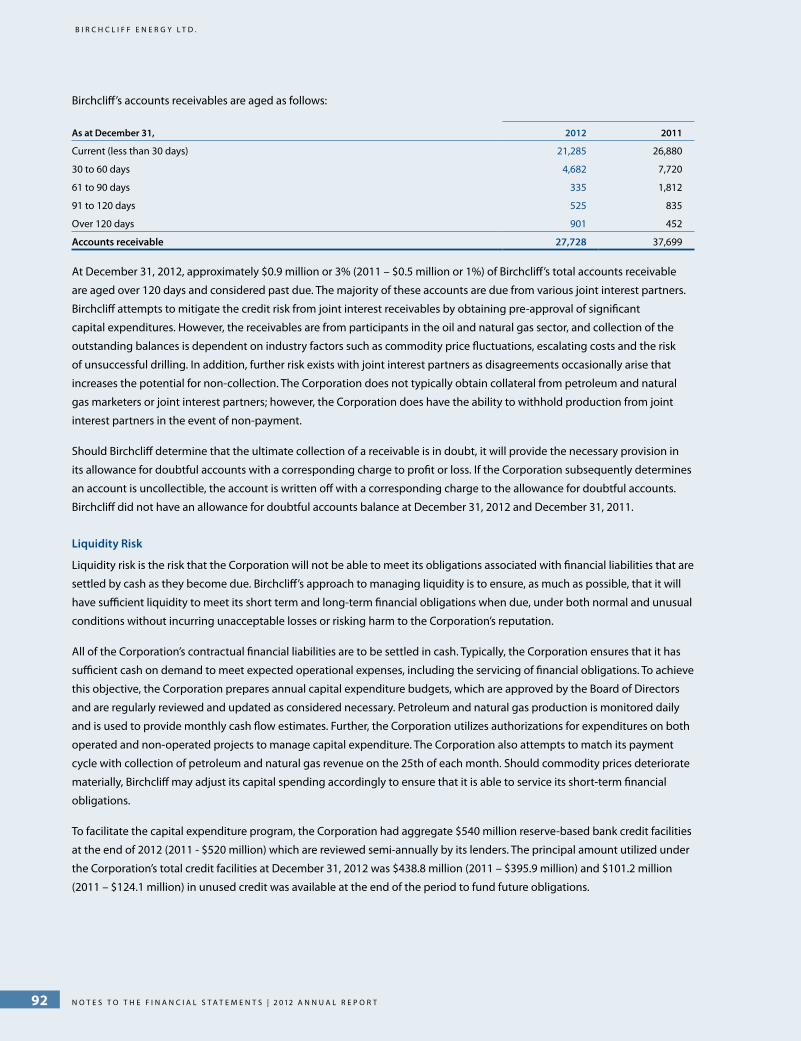
B i r c h c l i f f e n e r g y l t d .
Birchcliff’s accounts receivables are aged as follows:
As at December 31, 2012 2011
Current (less than 30 days) 21,285 26,880
30 to 60 days 4,682 7,720
61 to 90 days 335 1,812
91 to 120 days 525 835
Over 120 days 901 452
Accounts receivable 27,728 37,699
At December 31, 2012, approximately $0.9 million or 3% (2011 – $0.5 million or 1%) of Birchcliff’s total accounts receivable
are aged over 120 days and considered past due. The majority of these accounts are due from various joint interest partners.
Birchcliff attempts to mitigate the credit risk from joint interest receivables by obtaining pre-approval of significant
capital expenditures. However, the receivables are from participants in the oil and natural gas sector, and collection of the
outstanding balances is dependent on industry factors such as commodity price fluctuations, escalating costs and the risk
of unsuccessful drilling. In addition, further risk exists with joint interest partners as disagreements occasionally arise that
increases the potential for non-collection. The Corporation does not typically obtain collateral from petroleum and natural
gas marketers or joint interest partners; however, the Corporation does have the ability to withhold production from joint
interest partners in the event of non-payment.
Should Birchcliff determine that the ultimate collection of a receivable is in doubt, it will provide the necessary provision in
its allowance for doubtful accounts with a corresponding charge to profit or loss. If the Corporation subsequently determines
an account is uncollectible, the account is written off with a corresponding charge to the allowance for doubtful accounts.
Birchcliff did not have an allowance for doubtful accounts balance at December 31, 2012 and December 31, 2011.
Liquidity Risk
Liquidity risk is the risk that the Corporation will not be able to meet its obligations associated with financial liabilities that are
settled by cash as they become due. Birchcliff’s approach to managing liquidity is to ensure, as much as possible, that it will
have sufficient liquidity to meet its short term and long-term financial obligations when due, under both normal and unusual
conditions without incurring unacceptable losses or risking harm to the Corporation’s reputation.
All of the Corporation’s contractual financial liabilities are to be settled in cash. Typically, the Corporation ensures that it has
sufficient cash on demand to meet expected operational expenses, including the servicing of financial obligations. To achieve
this objective, the Corporation prepares annual capital expenditure budgets, which are approved by the Board of Directors
and are regularly reviewed and updated as considered necessary. Petroleum and natural gas production is monitored daily
and is used to provide monthly cash flow estimates. Further, the Corporation utilizes authorizations for expenditures on both
operated and non-operated projects to manage capital expenditure. The Corporation also attempts to match its payment
cycle with collection of petroleum and natural gas revenue on the 25th of each month. Should commodity prices deteriorate
materially, Birchcliff may adjust its capital spending accordingly to ensure that it is able to service its short-term financial
obligations.
To facilitate the capital expenditure program, the Corporation had aggregate $540 million reserve-based bank credit facilities
at the end of 2012 (2011 - $520 million) which are reviewed semi-annually by its lenders. The principal amount utilized under
the Corporation’s total credit facilities at December 31, 2012 was $438.8 million (2011 – $395.9 million) and $101.2 million
(2011 – $124.1 million) in unused credit was available at the end of the period to fund future obligations.
N o t e s t o t h e F i N a N c i a l s t a t e m e N t s | 2 0 1 2 a N N U a l r e p o r t92

B i r c h c l i f f e n e r g y l t d .
The following table lists the contractual obligations of the Corporation’s financial liabilities at December 31, 2012:
2013 2014 2015 - 2017
Accounts payable and accrued liabilities 58,846 – –
Drawn revolving credit facilities – – 368,654
Drawn non-revolving five-year term facility 700 1,400 67,900
Office lease(1) 3,285 3,285 9,582
Financial liabilities 62,831 4,685 446,136
(1) The Corporation is committed under an operating lease relating to its office premises, beginning December 1, 2007 and expiring on November 30, 2017.
Market Risk
Market risk is the risk that changes in market conditions, such as commodity prices, exchange rates and interest rates, will
affect the Corporation’s net income or the value of its financial instruments, if any. The objective of market risk management
is to manage and control exposures within acceptable limits, while maximizing returns. These risks are consistent with prior
years. All risk management transactions are conducted within risk management tolerances that are reviewed by the Board of
Directors.
Commodity Price Risk
Commodity price risk is the risk that the fair value of future cash flows will fluctuate as a result of changes in commodity
prices. Significant changes in commodity prices can materially impact cash flows and the Corporation’s borrowing base
limit. Lower commodity prices can also reduce the Corporation’s ability to raise capital. Commodity prices for petroleum and
natural gas are not only influenced by Canadian (“CDN”) and United States (“US”) demand, but also by world events that
dictate the levels of supply and demand.
The Corporation may attempt to mitigate commodity price risk through the use of financial derivatives such as commodity
price risk management contracts. Birchcliff had no risk management contracts in place as at or during the years ended
December 31, 2012 and 2011. The Corporation actively monitors the market to determine whether any commodity price risk
management contracts are warranted.
Foreign Currency Risk
Foreign currency risk is the risk that future cash flows will fluctuate as a result of changes in foreign currency exchange rates.
The exchange rate effect cannot be quantified but generally an increase in the value of the CDN dollar as compared to the
US dollar will reduce the prices received by Birchcliff for its petroleum and natural gas sales. The Corporation had no forward
exchange rate contracts in place as at or during the years ended December 31, 2012 and 2011.
Interest Rate Risk
Interest rate risk is the risk that future cash flows will fluctuate as a result of changes in market interest rates. The Corporation’s
credit facilities are exposed to interest rate cash flow risk on a floating interest rate due to fluctuations in market interest rates.
The remainder of Birchcliff’s financial assets and liabilities are not exposed directly to interest rate risk.
A 1% change in the CDN prime interest rate in 2012 would have changed net income and comprehensive income by
approximately $3.0 million, assuming that all other variables remain constant. A sensitivity of 1% is considered reasonable
given the current level of the bank prime rate and market expectations for future movements. The Corporation considers this
risk to be limited and thus does not hedge its interest rate risk. The Corporation had no interest rate swap contracts in place
as at or during the years ended December 31, 2012 and 2011.
2 0 1 2 A N N U A L r e p o r t | N o t e s t o t h e F i N A N c i A L s t A t e m e N t s 93

B i r c h c l i f f e n e r g y l t d .
Fair Value of Financial Instruments
Birchcliff’s financial instruments include cash, accounts receivable, accounts payable and accrued liabilities and outstanding
credit facilities. All of Birchcliff’s financial instruments are transacted in active markets. Financial instruments carried at fair
value are assessed using the following hierarchy based on the amount of observable inputs used to value the instrument:
Level 1 – Quoted prices are available in active markets for identical assets or liabilities as of the reporting date. Active
markets are those in which transactions occur in sufficient frequency and volume to provide pricing information on an
ongoing basis.
Level 2 – Pricing inputs are other than quoted prices in active markets included in Level 1. Prices in Level 2 are either
directly or indirectly observable as of the reporting date. Level 2 valuations are based on inputs, including quoted
forward prices for commodities, time value and volatility factors, which can be substantially observed or corroborated in
the marketplace.
Level 3 – Valuations in this level are those with inputs for the asset or liability that are not based on observable market
data.
Assessment of the significance of a particular input to the fair value measurement requires judgment and may affect
the placement within the fair value hierarchy level. The carrying value and fair value of financial instruments at December 31,
2012 is disclosed below by financial instrument category, as well as any related loss or interest expense for the period:
Carrying Value Fair Value Loss Interest Expense
Assets held for trading:
Cash(1) 46 46 – –
Loans and receivables:
Accounts receivable(2) 27,728 27,728 – –
Other liabilities:
Accounts payable and accrued liabilities(2) 58,846 58,846 – –
Drawn non-revolving five-year term facility(3) 70,000 70,000 – 3,715
Drawn revolving credit facilities(3) 368,654 368,654 – 16,503
(1) Cash is reported at fair value, based on a Level 1 designation.
(2) Accounts receivable, deposits and accounts payable and accrued liabilities are reported at amortized cost. Due to the short term nature of accounts receivable, deposits and accounts payable and accrued liabilities, their carrying values approximate their fair values.
(3) The Corporation’s credit facilities bear interest at a floating rate and accordingly the fair market value approximates the carrying value before the carrying value is reduced for any remaining unamortized costs.
18. COMMITMENTS
The Corporation is committed under an operating lease relating to its office premises beginning December 1, 2007 which
expires on November 30, 2017. The Corporation is committed to the following aggregate minimum lease payments:
Year Amount
2013 3,285
2014 3,285
2015 3,285
2016 3,285
2017 3,012
N o t e s t o t h e F i N a N c i a l s t a t e m e N t s | 2 0 1 2 a N N U a l r e p o r t94

B i r c h c l i f f e n e r g y l t d .
19. SUPPLEMENTARY CASH FLOW INFORMATION
Years ended December 31, 2012 2011
Provided by (used in):
Accounts receivable 9,972 1,542
Prepaid expenses and deposits 35 421
Accounts payable and accrued liabilities (29,757) 37,882
Dividend tax (632) –
(20,382) 39,845
Provided by (used in):
Operating (11,352) 13,128
Investing (9,030) 26,717
(20,382) 39,845
20. CONTINGENT LIABILITY
The Corporation’s 2006 and 2007 income tax filings were reassessed by the Canada Revenue Agency (“CRA”) in 2011. The
reassessments are based on the CRA’s determination that the tax pools available to Veracel Inc. (“Veracel”), prior to the
amalgamation, ceased to be available to Birchcliff after the amalgamation. The Veracal tax pools in dispute totalled $39.3
million and include approximately $16.2 million in non-capital losses, $15.6 million in scientific research and experimental
development expenditures and $7.5 million in investment tax credits. The disputed assessments are outstanding at
December 31, 2012. The resolution of the disputed assessments may impact future income tax expense but will not impact
cash taxes payable by the Corporation. Management believes that it will be successful in defending its tax position respecting
the Veracel transaction, and as such, the Corporation has not recognized a related provision for deferred income tax liability
at December 31, 2012.
2 0 1 2 A N N U A L r e p o r t | N o t e s t o t h e F i N A N c i A L s t A t e m e N t s 95
B i r c h c l i f f e n e r g y l t d .
RESERVES AND RESOURCES INFORMATION
Reserves are estimated remaining quantities of oil and natural gas and related substances anticipated to be recoverable from known
accumulations, as of a given date, based on the analysis of drilling, geological, geophysical and engineering data; the use of established
technology; and specified economic conditions, which are generally accepted as being reasonable. Reserves are classified according to the
degree of certainty associated with the estimates:
Proved Reserves are those reserves that can be estimated with a high degree of certainty to be recoverable. It is likely that the actual
remaining quantities recovered will exceed the estimated proved reserves.
Probable Reserves are those additional reserves that are less certain to be recovered than proved reserves. It is equally likely that the
actual remaining quantities recovered will be greater or less than the sum of the estimated proved plus probable reserves.
Possible Reserves are those additional reserves that are less certain to be recovered than probable reserves. It is unlikely that the actual
remaining quantities recovered will exceed the sum of the estimated proved plus probable plus possible reserves.
Resources encompass all petroleum quantities that originally existed on or within the earth’s crust in naturally occurring accumulations,
including Discovered and Undiscovered (recoverable and unrecoverable) plus quantities already produced. “Total resources” is equivalent to
“Total Petroleum Initially-In-Place”. Resources are classified in the following categories:
Total Petroleum Initially-In-Place (“PIIP”) is that quantity of petroleum that is estimated to exist originally in naturally occurring
accumulations. It includes that quantity of petroleum that is estimated, as of a given date, to be contained in known accumulations,
prior to production, plus those estimated quantities in accumulations yet to be discovered;
Discovered PIIP is that quantity of petroleum that is estimated, as of a given date, to be contained in known accumulations prior to
production. The recoverable portion of discovered petroleum initially in place includes production, reserves, and contingent resources;
the remainder is unrecoverable;
Contingent Resources are those quantities of petroleum estimated, as of a given date, to be potentially recoverable from known accu-
mulations using established technology or technology under development but which are not currently considered to be commercially
recoverable due to one or more contingencies;
Undiscovered PIIP is that quantity of petroleum that is estimated, on a given date, to be contained in accumulations yet to be
discovered. The recoverable portion of undiscovered petroleum initially in place is referred to as “prospective resources” and the
remainder as “unrecoverable”;
Prospective Resources are those quantities of petroleum estimated, as of a given date, to be potentially recoverable from undiscovered
accumulations by application of future development projects;
Unrecoverable is that portion of Discovered and Undiscovered PIIP quantities which is estimated, as of a given date, not to be
recoverable by future development projects. A portion of these quantities may become recoverable in the future as commercial
circumstances change or technological developments occur; the remaining portion may never be recovered due to the physical/
chemical constraints represented by subsurface interaction of fluids and reservoir rocks; and
Production is the cumulative quantity of petroleum that has been recovered at a given date.
Uncertainty Ranges are described by COGEH as low, best, and high estimates for reserves and resources as follows:
Low Estimate is considered to be a conservative estimate of the quantity that will actually be recovered. It is likely that the actual
remaining quantities recovered will exceed the low estimate. If probabilistic methods are used, there should be at least a 90%
probability (P90) that the quantities actually recovered will equal or exceed the low estimate;
Best Estimate is considered to be the best estimate of the quantity that will actually be recovered. It is equally likely that the actual
remaining quantities recovered will be greater or less than the best estimate. If probabilistic methods are used, there should be at least
a 50% probability (P50) that the quantities actually recovered will equal or exceed the best estimate; and
High Estimate is considered to be an optimistic estimate of the quantity that will actually be recovered. It is unlikely that the actual
remaining quantities recovered will exceed the high estimate. If probabilistic methods are used, there should be at least a 10%
probability (P10) that the quantities actually recovered will equal or exceed the high estimate.
GLOSSARY
96 G L O S S A R Y | 2 0 1 2 A N N U A L R E P O R T
B i r c h c l i f f e n e r g y l t d .
DEFINITIONS
2P: Proved plus probable reserves.
2012 Reserves Evaluation: Independent evaluation dated
February 8, 2013 prepared by AJM Deloitte, evaluating the
Corporation’s oil and natural gas reserves at December 31, 2012.
2012 Resource Assessment: Independent evaluation dated
February 12, 2013 prepared by AJM Deloitte, evaluating the
Corporation’s natural gas resources on the Montney/Doig Natural
Gas Resource Play at December 31, 2012.
AJM Deloitte: Deloitte, independent qualified reserves evaluators
of Calgary, Alberta.
COGEH: Canadian Oil and Gas Evaluation Handbook.
Crown: Government of Alberta.
East district: Area designated by Birchcliff as “East” on the map
found at page 11.
ERCB: Energy Resources Conservation Board.
FDC: Future development capital.
F&D: Finding and development.
FD&A: Finding, development and acquisition.
IFRS: International Financial Reporting Standards.
Montney/Doig Natural Gas Resource Play: Birchcliff’s Montney
and Doig formation natural gas resource play located in Birchcliff’s
West and East districts.
NI 51-101: National Instrument 51-101 - Standards of Disclosure for
Oil and Gas Activities.
North district: Area designated by Birchcliff as “North” on the map
found on page 11.
NPV: Net present value.
PCS Gas Plant: Birchcliff’s 100% owned and operated natural gas
processing plant located in the West District, Pouce Coupe South
region, at 03-22-078-12W6.
Peace River Arch: Peace River Arch area of Alberta, a geological
area centred northwest of Grande Prairie, adjacent to the British
Columbia border.
SEDAR: System for Electronic Document Analysis and Retrieval.
TSX: Toronto Stock Exchange.
West district: Area designated by Birchcliff as “West” on the map
found on page 11.
Western Canadian Sedimentary Basin: The vast sedimentary
basin underlying Western Canada that is the source of most of
Western Canada’s current oil and gas production.
Working interest: Percentage of ownership in an oil and gas
property, obligating the owner to share in the costs of exploration,
development and operations and granting the owner the right to
share in production revenues after royalties are paid.
Worsley Light Oil Resource Play: Birchcliff’s Charlie Lake
formation light oil resource play located near the Town of Worsley
in the North district.
ABBREVIATIONS
Oil and natural gas liquids
bbl barrel
bbls barrels
bbls/d barrels per day
Mbbls thousand barrels
MMbbls million barrels
boe barrel of oil equivalent
boe/d barrel of oil equivalent per day
Mboe thousand barrels of oil equivalent
MMboe million barrels of oil equivalent
NGLs natural gas liquids
LNG liquefied natural gas
Natural gas
Mcf thousand cubic feet
MMcf million cubic feet
Bcf billion cubic feet
Tcf trillion cubic feet
Mcf/d thousand cubic feet per day
MMcf/d million cubic feet per day
m3 cubic metres
GJ gigajoule
Other
AECO benchmark natural gas price determined at the AECO ‘C’ hub in southeast Alberta
WTI West Texas Intermediate crude oil, a benchmark oil price determined at Cushing, Oklahoma
°API the measure of the density or gravity of liquid petroleum products
psi pounds per square inch
kPa kilopascals
$000 thousands of dollars
$MM millions of dollars
CONVERSIONS
The following table sets forth certain Standard Imperial Units and
International System of Units conversions:
From To Multiply By
Mcf cubic metres 28.174
Mcf GJ 1.055
cubic metres cubic feet 35.494
bbls cubic metres 0.159
feet metres 0.305
miles kilometres 1.609
acres hectares 0.405
sections acres 640
sections hectares 256
kPa psi 0.145
CONVENTIONS
Unless otherwise indicated, references herein to “$” or “dollars”
are to Canadian dollars. All financial information herein has been
presented in Canadian dollars in accordance with IFRS.
2 0 1 2 A N N U A L r e p o r t | N o t e s t o t h e F i N A N c i A L s t A t e m e N t s 97
B i r c h c l i f f e n e r g y l t d .
Non-GAAP measures: This Annual Report and MD&A uses “funds flow”, “funds flow from operations”, “funds flow netback”, “funds flow per
common share”, “netback”, “operating netback”, “estimated operating netback” and “operating margin”, which do not have standardized
meanings prescribed by generally accepted accounting principles (“GAAP”) and therefore may not be comparable measures to other
companies where similar terminology is used. Netback or operating netback denotes petroleum and natural gas revenue less royalties, less
operating expenses and less transportation and marketing expenses. Estimated operating netback is based upon certain cost allocations
and accruals directly related to the PCS Gas Plant and related wells and infrastructure, on a production month basis. Funds flow, funds flow
netback or funds flow from operations denotes cash flow from operating activities as it appears on the Corporation’s Condensed Statements
of Cash Flows before decommissioning expenditures and changes in non-cash working capital. Funds flow, funds flow netback or funds flow
from operations is derived from net income plus income tax expense, depletion and depreciation expense, accretion expense, stock-based
compensation expense, amortization of deferred financing fees and gains on divestitures. Funds flow per common share denotes funds flow
divided by the weighted average number of common shares. Operating margin is calculated by dividing the estimated operating netback for
the period by the petroleum and natural gas revenue for the period.
Boe conversions: Barrels of oil equivalent (“boe”) amounts have been calculated by using the conversion ratio of six thousand cubic feet
(6 Mcf ) of natural gas to one barrel of oil (1 bbl). Boe amounts may be misleading, particularly if used in isolation. A boe conversion ratio of
6 Mcf to 1 bbl is based on an energy equivalency conversion method primarily applicable at the burner tip and does not represent a value
equivalency at the wellhead.
Mcfe, MMcfe, Bcfe and Tcfe conversions: Thousands of cubic feet of gas equivalent (“Mcfe”), millions of cubic feet of gas equivalent
(“MMcfe”), billions of cubic feet of gas equivalent (“Bcfe”) and trillions of cubic feet of gas equivalent (“Tcfe”) amounts have been calculated
by using the conversion ratio of six thousand cubic feet (6 Mcf ) of natural gas to one barrel of oil (1 bbl). Mcfe, MMcfe, Bcfe and Tcfe may
be misleading, particularly if used in isolation. A conversion ratio of 6 Mcf to 1 bbl is based on an energy equivalency conversion method
primarily applicable at the burner tip and does not represent a value equivalency at the wellhead.
MMbtu pricing conversions: $1.00 per MMbtu equals $1.00 per Mcf based on a standard heat value Mcf.
Finding and development costs: With respect to disclosure of finding and development costs disclosed in this Annual Report:
a) The amounts of finding and development and/or acquisition costs contained in the table and disclosure for each of the years 2010,
2011 and 2012 are calculated by dividing the total of the net amount of the particular costs noted in each line incurred during such year
by the amounts of additions to proved reserves and proved plus probable reserves during such year that resulted from the expenditure
of such costs.
b) In calculating the amounts of finding and development and/or acquisition costs for a year, the changes during the year in estimated
future development costs and in estimated reserves are based upon the evaluations of Birchcliff’s reserves prepared by AJM Deloitte, or
their predecessor, effective December 31 of such year.
c) The aggregate of the exploration and development costs incurred in the most recent financial year and any change during that year
in estimated future development costs generally will not reflect total finding and development costs related to reserves additions for
that year.
Reserves for a portion of properties: Certain reserves disclosure contained in this Annual Report relates to a portion of the Corporation’s
properties. Accordingly, the estimates of reserves and future net revenue for individual properties may not reflect the same confidence level
as estimates of reserves and future net revenue for all properties due to the effects of aggregation.
Discovered resources: With respect to the discovered resources (including contingent resources) described in this Annual Report, there is no
certainty that it will be commercially viable to produce any portion of the resources.
Undiscovered resources: With respect to the undiscovered resources (including prospective resources) described in this Annual Report,
there is no certainty that any portion of the resources will be discovered. If discovered, there is no certainty that it will be commercially viable
to produce any portion of the resources.
Forward-looking information: This Annual Report and MD&A contains forward-looking information within the meaning of applicable
Canadian securities laws. Forward-looking information relates to future events or future performance and is based upon the Corporation’s
current internal expectations, estimates, projections, assumptions and beliefs.
All information other than historical fact is forward-looking information. Information relating to “reserves” or “resources” is forward-looking
as it involves the implied assessment, based on certain estimates and assumptions, that the reserves or resources exist in the quantities
estimated and that they will be commercially viable to produce in the future. Words such as “plan”, “expect”, “project”, “intend”, “believe”,
ADvISORIES
98 A D V I S O R I E S | 2 0 1 2 A N N U A L R E P O R T

B i r c h c l i f f e n e r g y l t d .
“anticipate”, “estimate”, “may”, “will”, “potential”, “proposed” and other similar words that convey certain events or conditions “may” or
“will” occur are intended to identify forward-looking information. In particular, this Annual Report and MD&A contains forward-looking
information related to estimates of recoverable reserves and resource volumes; planned production increases; planned 2013 capital
spending and sources of funding; and the intention to drill and complete future wells.
The forward-looking information is based upon assumptions as to future commodity prices, currency exchange rates, inflation rates, well
production rates, well drainage areas, success rates for future drilling and availability of labour and services. With respect to estimates of
reserves and resource volumes, a key assumption is the validity of the data used by AJM Deloitte in their independent reserves and resource
evaluations. With respect to estimates of numbers of future wells to be drilled a key assumption is that geological and other technical
interpretations performed by the Corporation’s technical staff, which indicate that commercially economic reserves can be recovered
from the Corporation’s lands as a result of drilling such future wells, are valid. Estimates as to 2013 average production rates assume that
no unexpected outages occur in the infrastructure that the Corporation relies on to produce its wells, that existing wells continue to meet
production expectations and that any future wells, scheduled to come on production in 2013, meet timing and production expectations.
Undue reliance should not be placed on forward-looking information, as there can be no assurance that the plans, intentions or expectations
upon which they are based will occur. Although the Corporation believes that the expectations reflected in the forward-looking statements
are reasonable, there can be no assurance that such expectations will prove to be correct. As a consequence, actual results may differ
materially from those anticipated.
Forward-looking information necessarily involves both known and unknown risks associated with oil and gas exploration, production,
transportation and marketing such as uncertainty of geological and technical data, imprecision of reserves and resource estimates,
operational risks, environmental risks, loss of market demand, general economic conditions affecting ability to access sufficient capital,
changes in governmental regulation of the oil and gas industry and competition from others for scarce resources.
The foregoing list of risk factors is not exhaustive. Additional information on these and other risk factors that could affect operations or
financial results are included in the Corporation’s most recent Annual Information Form and in other reports filed with Canadian securities
regulatory authorities. Forward-looking information is based on estimates and opinions of management at the time the information is
presented. The Corporation is not under any duty to update the forward-looking information after the date of this Annual Report and MD&A
to conform such information to actual results or to changes in the Corporation’s plans or expectations, except as otherwise required by
applicable securities laws.
2 0 1 2 A N N U A L r e p o r t | N o t e s t o t h e F i N A N c i A L s t A t e m e N t s 99

B i r c h c l i f f e n e r g y l t d .
OFFICERS
A. Jeffery Tonken
President & Chief Executive Officer
Myles R. Bosman
Vice President, Exploration &
Chief Operating Officer
Bruno P. Geremia
Vice President & Chief Financial Officer
David M. Humphreys
Vice President, Operations
Karen A. Pagano
Vice President, Engineering
James W. Surbey
Vice President, Corporate Development
DIRECTORS
Larry A. Shaw (Chairman) (1)(2)(3)
Calgary, Alberta
Gordon W. Cameron (1)(2)(3)
Calgary, Alberta
Kenneth N. Cullen (1)(2)(3)
Calgary, Alberta
Werner A. Siemens (1)(2)(3)
Calgary, Alberta
A. Jeffery Tonken
President & Chief Executive Officer
Calgary, Alberta
(1) Member of Audit Committee
(2) Member of Compensation Committee
(3) Member of the Reserves Evaluation Committee
SOLICITORS
Borden Ladner Gervais LLP
Calgary, Alberta
AUDITORS
KPMG LLP, Chartered Accountants
Calgary, Alberta
RESERVES EVALUATOR
Deloitte (AJM Deloitte)
Calgary, Alberta
BANKERS
The Bank of Nova Scotia
HSBC Bank Canada
Alberta Treasury Branch
Union Bank
The Toronto Dominion Bank
Business Development Bank of Canada
United Overseas Bank
National Bank of Canada
ICICI Bank Canada
TRANSFER AGENT
Olympia Trust Company
Calgary, Alberta and Toronto, Ontario
TSX: BIR, BIR.PR.A, BIR.WT
HEAD OFFICE
500, 630 – 4th Avenue S.W.
Calgary, Alberta T2P 0J9
Phone: 403-261-6401
Fax: 403-261-6424
SPIRIT RIVER OFFICE
5604 – 49th Avenue
Spirit River, Alberta T0H 3G0
Phone: 780-864-4624
Fax: 780-864-4628
Email: [email protected]
www.birchcliffenergy.com
CORPORATE INfORMATION
www.birchcliffenergy.com
About the photos
All field photos in this Annual Report are of Birchcliff operations in Alberta. Photos: Trudie Lee Photography, Jerilyn McLeod and Birchcliff archives.
ANNUAL GENERAL MEETING
The Annual General Meeting of
Shareholders will be held at 3:00 pm on
Thursday, May 16, 2013, in the Devonian
Room of the Calgary Petroleum Club,
319 - 5th Avenue SW, Calgary, Alberta.
100 C O R P O R A T E I N F O R M A T I O N | 2 0 1 2 A N N U A L R E P O R T

Rob Anderson, Danielle Armstrong, Camille Ashton, Stephanie Ashton, Rainer Augsten, Gates Aurigemma, Al Basnett, Bill Baxter, Angela
Belbeck, Charmaine Belley, Tim Berg, Amber Boisvert, Myles Bosman, Bradley Bouck, David Boyle, Judy Brazer, Shauna Brisebois, Wayne Brown,
James Burke, Scotty Cameron, Chris Carlsen, Alex Carlson, Robert Charchuk, Matt Chorney, David Christensen, Jordan Calderwood, Bob Clark,
Wendy Clay, Rory Collins, Laura Conroy, Mike Cordingley, Ken Cullen, Brad Culver, Krystal Dafoe, Jody Denis, Cindy Desmarais, Jesse Doenz,
Kellen Doenz, Keifer Dolen, Kelly Dolen, Randy Dorscheid, Cliff Ennis, Tim Etcheverry, Laura Ferguson, Rhonda Ferguson, Trisha Flanagan, Tonya
Fleming, Gordon Forbes, Grant Friesen, Alan Fritz, Sherry Frost, George Fukushima, Andy Fulford, Bruno Geremia, Melina Geremia, Melodie
Gilker, Chad Goddard, Jolanda Goertzen, Bob Grisack, Lindsay Gropp, Neil Guenter, Grant Guidi, Mike hale, Ratha halford, Sam hampton,
Theresa hannouche, Paul hayward, Kolten helgesen, Lorna hildebrand, Jack hingley, Janet hogan, Braden holmes, Jasen holmstrom, Daryl
hudak, Dave humphreys, Derek Jamieson, Dave Johnson, Stacy Johnson, Dustin Kelm, Claire Knight, Diane Knoblauch, Adam Knox, Joe Kocsis,
heather Kwiatkowski, Dani Laird, Melony Lauzon, Troy Lock, Thomas Lundquist, Joe Lyste, Bob MacLean, Dallas MacLean, Tyson Magnowski,
Dan Masuch, Jeff McAndrews, holly McFarlane, Deb McFee, Angie McGonigal, Ryan McIntosh, Darin McLarty, Jerilyn McLeod, Danielle McPhee,
Melissa Meyers-Frasz, Al Michetti, Derek Michetti, Roy Modrall, Emelyia Moghaddami, Tyler Montpellier, Ron Morgan, Shaun Moskalyk, Steve
Mueller, Mckenzie Murdoch, Ed Murphy, Sarah Nance, Shane Nelson, Michael Ng, Marcel Njongwe, Karen Pagano, Bruce Palmer, Bill Partridge,
Dean Paterson, Brenda Pearson, Colin Penner, Barry Peters, Allan Pickel, Melanie Pituch, Landon Poppenroth, Lindsay Postma, Derek Rae,
Lynn Reid-Bicknell, Aidan Richardson, Dale Richardson, Megan Roche, Michelle Rodgerson, Craig Rogers, Jeff Rogers, Jordan Rossworm, Todd
Sajtovich, Lee Sallenbach, Victor Sandhawalia, Don Scharein, Andreas Scheel, Larry Shaw, Vern Siemens, Nick Sizer, Nick Skyrpan, Chris Sorenson,
Meredith St. John, Ben Stevenson, Bob Stinn, Darby Stolk, Tracey Suchlandt, Jim Surbey, Corey Thorson, Jeff Tonken, Gillian Topping, hue
Tran, Tammy Tran, Trevor Trudeau, Theo van der Werken, Chad Van Iderstine, Kara Vance, Clint Vickery, Linda Wang, Blair Watchorn, Matthew
Weiss, Jonathan White, Greg Willson, Daryl Winnicky, Chris Wurz, John yeo, Rhonda yurchyshyn, Julius Zacharias, Steve Zylinski, Vince Zylinski
teAM birchcliff

Bir
ch
cliff E
nE
rg
y lt
d. | 2
012 A
nn
uA
l rE
po
rt
www.birchcliffenergy.com | tsx: birPrinted in Canada
From 2009 to 2012, on a per common share basis, Birchcliff’s proved developed producing reserves are up 131%, proved reserves are up 81% and proved plus probable reserves are up 77%. Production per common share is up 75% and funds flow per common share is up 54%, despite a 40% decline in AECO natural gas prices since 2009. This growth has been primarily achieved through Birchcliff’s low risk development drilling on the Montney/Doig Natural Gas Resource Play and the impact of the low cost operating structure of our PCS Gas Plant and related infrastructure.
Related Documents