2012-2013 Annual Report Facilities Condition Assessment Program NC STATE UNIVERSITY Jack Colby - Assistant Vice Chancellor for Facilities Operations David Hatch - Director, Repair and Renovation Services Kevin Ingalls - Program Manager, FCAP Scott Crowder - Electrical Systems Inspector, FCAP Kevin Cummings - Architectural Systems Analyst, FCAP Joe Riley - Mechanical and Plumbing Systems Inspector, FCAP

Welcome message from author
This document is posted to help you gain knowledge. Please leave a comment to let me know what you think about it! Share it to your friends and learn new things together.
Transcript

2012-2013 Annual Report Facilities Condition Assessment Program
NC STATE UNIVERSITY
Jack Colby - Assistant Vice Chancellor for Facilities Operations David Hatch - Director, Repair and Renovation Services Kevin Ingalls - Program Manager, FCAP Scott Crowder - Electrical Systems Inspector, FCAP Kevin Cummings - Architectural Systems Analyst, FCAP Joe Riley - Mechanical and Plumbing Systems Inspector, FCAP

NORTH CAROLINA STATE UNIVERSITY
2012-2013 FCAP Annual Report 2
This page is intentionally left blank
NORTH CAROLINA STATE UNIVERSITY
2012-2013 FCAP Annual Report 3
Table of Contents Executive Summary ............................................................................................................................ 4
The Year in Review ............................................................................................................................. 5
2012-2013 FCAP Goals ......................................................................................................................... 5
2012-2013 FCAP Achievements ............................................................................................................ 5
2013-2014 FCAP Goals ......................................................................................................................... 6
The Core Campus .................................................................................................................................. 6
Current Replacement Value (CRV) ........................................................................................................ 7
2012-2013 Findings ............................................................................................................................. 8
Costs by System in Assessed Buildings ................................................................................................. 8
Priority Classes ...................................................................................................................................... 9
Graph 2: System Code by Priority Class ................................................................................................ 9
Project Classes .................................................................................................................................... 10
Graph 3: Project Class by Priority Class for Surveyed Buildings .......................................................... 10
CR+DM+PA by System Charts ............................................................................................................ 11
Graph 5: System Code by Project Class Totals ................................................................................... 12
Assessment Priority ............................................................................................................................. 13
2010-2013 Campus Data Summary Table ........................................................................................... 14
Funding History and Projection Modeling ...................................................................................... 15
Graph 6: APPA Recommended Funding vs. Actual Funding 2003-2013 .............................................. 15
Model 1: Campus Condition Over 20 Years at Average Funding Level ................................................ 16
Model 2: Funding Required to Reduce FCI Over 20 Years .................................................................. 17
Appendix............................................................................................................................................ 18
2012-2013 Data Summary Table by Building ....................................................................................... 18
Assessment Status Maps ................................................................................................................ 23
NORTH CAROLINA STATE UNIVERSITY
2012-2013 FCAP Annual Report 4
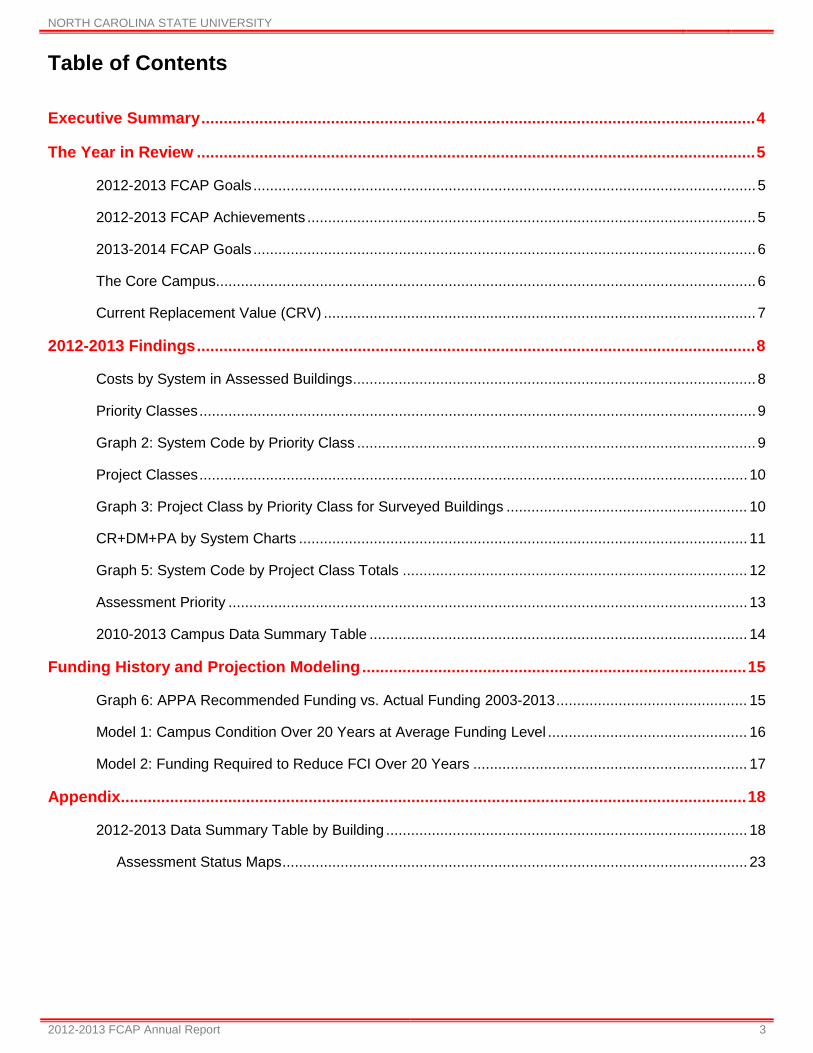
Executive Summary Although the university owns property across the state, NCSU FCAP’s focus is limited to state-appropriated and certain combination-funded buildings located on the core campus (Main, Centennial, and Centennial Biomedical Campuses). Athletic, residential, and other self-liquidating Campus Enterprise facilities are addressed by request. The program’s main goal is to identify needs in terms of capital renewal, deferred maintenance, and plant adaptation as mandated by code. Corrective projects and cost projections are then developed to address the identified deficiencies, and are assigned priorities based on the urgency of need. This work facilitates long-term planning for repair and replacement of major equipment and building systems. This year, the program has achieved its five-year goal of surveying all core campus buildings, eliminating previous reliance on projected/extrapolated costs. The 2013 Core Campus
• 292 Buildings (state-appropriated and selected combination-funded buildings): • 8,061,365 GSF • $2,916,140,145 CRV
Facility Condition Index According to the National Association of College and University Business Officers in “Managing the Facilities Portfolio”, the Facilities Condition Index (FCI) has become an industry standard tool by which facility conditions are measured and compared. The FCI represents a ratio of projected Capital Renewal (CR) and Deferred Maintenance (DM) costs to the current replacement value (CRV) of the facility (FCI = CR+DM /CRV). NCSU FCAP also reports the Facilities Condition Quality Index (FCQI), which includes Capital Renewal, Deferred Maintenance, and code-mandated Plant Adaptation (PA).
The FCQI is considered a better indicator of actual real-world conditions, and is used throughout the remainder of this report to indicate the “total deferred maintenance backlog”.
• Total backlog (CR+DM+PA) = $362,944,432 • Backlog/CRV = .12 • Per APPA, the Core Campus is in poor condition.
Under .05 = Good Condition
.05 to.10 = Fair Condition Over .10 = Poor Condition
Findings
• 53.7% of the total costs are represented by the top two system categories alone. These costs also represent a larger percentage of total costs than last year.
• More than two-thirds of identified deficiencies are in systems critical to the mission of the university.
33.2% HVAC 20.5% Electrical 6.7% Plumbing 6.6% Fire/Life Safety
67.0% Total Funding
• Repair and Renovation Funding for Fiscal 2012-2013 = $12,900,000 • Average Repair and Renovation Funding 2003-2013 = $ 9,485,277
Conclusion:
• The backlog will continue to rise in the absence of sustained and predictable maintenance funding.
FCI = $331,925,986 = 0.11 FCQI = $362,944,432 = 0.12 $2,916,140,145 $2,916,140,145

NORTH CAROLINA STATE UNIVERSITY
2012-2013 FCAP Annual Report 5
The Year in Review 2012-2013 FCAP Goals • Survey all state-appropriated facilities, reduce reliance on extrapolation • Develop a mission-critical priority-based assessment cycle • Publish an annual report summarizing activities, findings, recommendations • Continue ongoing training for full-time team members • Improve program efficiency to lower PSF cost of each assessment • Streamline format of FCAP reports to speed publication of findings • Update and improve the quality of information in the ISES database • Review and adapt procedures to ensure best use of limited resources • Identify smaller-scale projects in lieu of comprehensive renovations • Identify potential energy-saving upgrades, providing initial cost and payback • Utilize ISES data for R&R and Six-Year Capital Planning • Participate in additional activities as requested 2012-2013 FCAP Achievements • All state-appropriated and select combination-funded facilities are assessed • A priority-based assessment cycle has been established • This report is the fifth in the series of FCAP Annual Reports • Training classes are available through Community Colleges, APPA, and on-line sources • Short-form assessment templates for low priority buildings are completed within hours • Volume of completed assessments indicates 4% gain in productivity over last year’s effort • ISES data is reconciled with AERES and other data streams quarterly • Specific tasks and job responsibility assignments rotate through the team to ensure cross-training
The FCAP team has again participated in additional activities beyond its core mission this year, supporting the University’s commitment to sustainability and reduced energy consumption by specifically creating projects for the R&R Shops to implement. Conditions are documented where T12 lighting could be upgraded to T8 or LED, or where common areas and informal lounge/study areas could be equipped with light sensors to turn off lighting fixtures during times of abundant daylight. Cost savings and payback schedules are projected. The team collaborated with the R&R Projects Group over the past summer to manage several construction and renovation projects, reducing the need for temporary hires. Scott Crowder, a licensed electrician since 2012, is a member of the Campus Electrical Safety Committee. Construction warranty issues are managed by the FCAP team. Warranty expiration dates are tracked on major projects and 90-day alerts are issued to Project Managers. The web-hosted RoofManager® database has been enriched with updated drawings, photographs, and current warranty status of approximately 100 campus buildings’ roof installations. An expanded menu of attributes identifies candidates for urethane coating projects, suitability for supporting solar arrays, and the need for fall protection. Customized reporting capabilities allow more meaningful reports targeting roof replacement projects over time. The outdated Design Review process has been revamped to become the online Facilities Operations Portal, affording campus stakeholders greater access to review, discuss, and document the development of construction documents and specifications. The FCAP team assisted Real Estate, OUA, and CPM staff with the proposed purchase and renovation of 3501 Avent Ferry Road, a former fraternity house that could provide much-needed swing space for displaced university personnel.
Lighting retrofit project at MEAS Field Labs
Former Fraternity House 3501 Avent Ferry Road

NORTH CAROLINA STATE UNIVERSITY
2012-2013 FCAP Annual Report 6
2013-2014 FCAP Goals • Implement priority-based assessment cycle • Aging assessments will be updated to keep data current • Partner with ISES and other resources for latest product releases • Support SCO and other UNC campus assessment programs • Assist Utility Infrastructure Planning with Asset Inventory • Continue to innovate and improve internal processes • Migrate existing data to new platforms as warranted • Publish findings and projects to S: drive to facilitate access • Publish an annual report • Participate in additional activities as requested The Core Campus In last year’s report, the Core Campus included 313 buildings. Through demolition, relocation/reassignment, and new construction, there are 292 buildings this year. The detail is as follows: The addition of the three new buildings, 783A – Hunt Library, 430 – Arboretum greenhouse, and 174B – Method Road greenhouse, brings the total to 294. The merging of David Clark Labs (075) and the David Clark Addition (075A) under one number, (075), brought the total number of buildings to 292.
These buildings were demolished in 2012 and were removed from campus inventory
327 - CVM Warehouse
337 - Bird House Raptor Center-CVM
456 - Greenhouse UFL 456
455 - Greenhouse UFL 455
495 - Grinding Facility UFL 495
603 - Crop Science Storage UFL
611 - Storage Bldg. UFL 611
614 - Entomology Lab UFL 614
616 - Storage Bldg. UFL 616
604 - Soil Science Storage UFL 64
605 - Plant Pathology Storage UFL
631 - Poultry Bldg. UFL 631
These buildings were moved to outlying areas or had ownership transferred to another state entity
134C - Bull Barn RPRL-CVM
324 - CVM Chemical Storage Bldg.
328 - Leonard Storage Bldg. CVM
329 - Leonard Storage Bldg. CVM
329D - Leonard Storage Bldg. CVM
329E - Leonard Storage Bldg. CVM
331A - Leonard Storage Bldg. CVM
331B - Leonard Storage Bldg. CVM
331C - Leonard Storage Bldg. CVM
387 - Facilities Equipment Storage
157Z - Olympic Trailer Unit
These twelve demolitions reduced overall campus building total to 301
These further eleven reductions brought the building total to 290
New Buildings Added: 783A – Hunt Library 430 – Arboretum Greenhouse 174B – Method Road Greenhouse

NORTH CAROLINA STATE UNIVERSITY
2012-2013 FCAP Annual Report 7
Current Replacement Value (CRV) In prior years, CRV data had been drawn exclusively from the AERES database, developed jointly by NCDOI and UNC-GA; these values were found to vary by as much as 15% from current market rates. Last year, we developed a cost model determined by building type, and again this year has used that model, adjusted for inflation as of Monday, September 16, 2013.
Fan coil unit in disrepair at Early College High School
Crumbling concrete awning at Gardner Hall Brick veneer out of plane at Riddick Hall
Failed breaker at Carmichael Gym
NORTH CAROLINA STATE UNIVERSITY
2012-2013 FCAP Annual Report 8
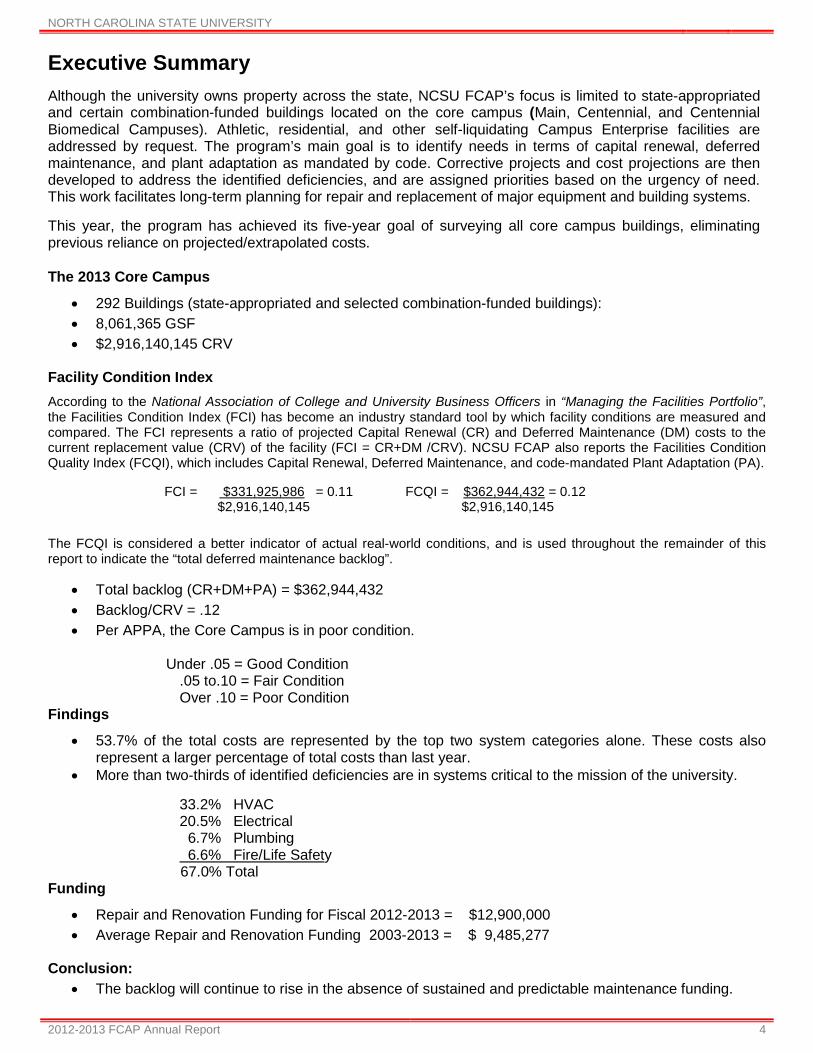
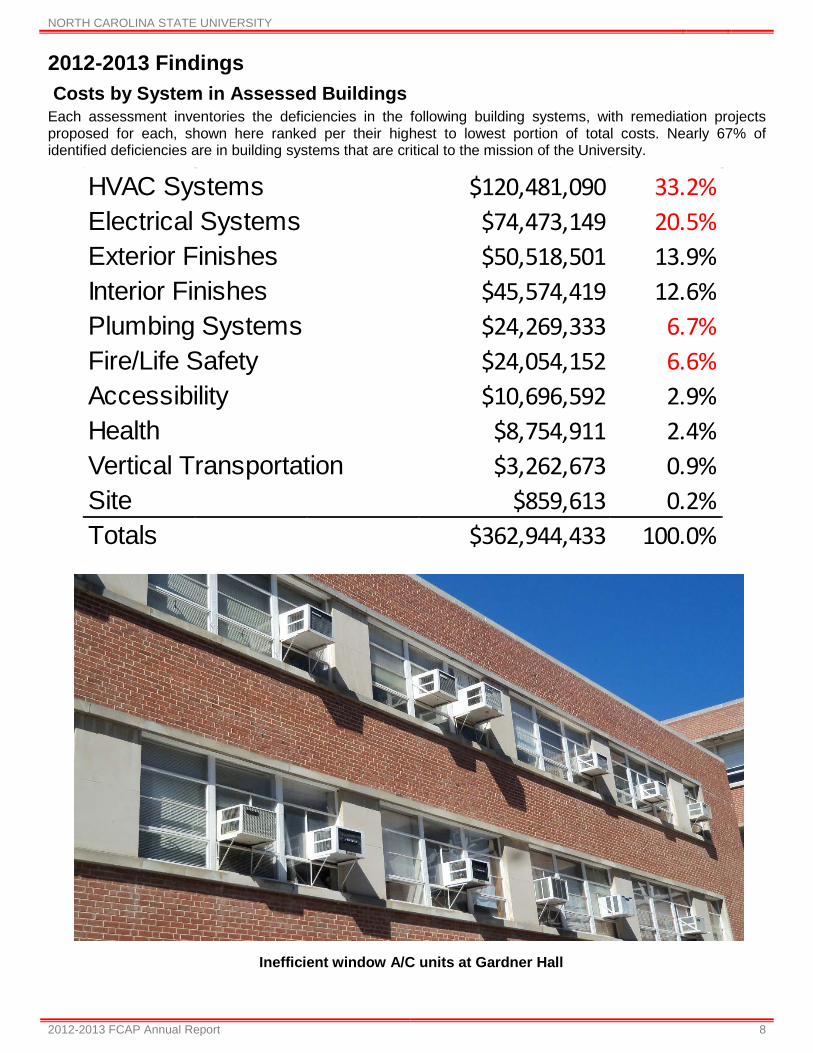
2012-2013 Findings Costs by System in Assessed Buildings Each assessment inventories the deficiencies in the following building systems, with remediation projects proposed for each, shown here ranked per their highest to lowest portion of total costs. Nearly 67% of identified deficiencies are in building systems that are critical to the mission of the University.
Inefficient window A/C units at Gardner Hall
HVAC Systems $120,481,090 33.2%Electrical Systems $74,473,149 20.5%Exterior Finishes $50,518,501 13.9%Interior Finishes $45,574,419 12.6%Plumbing Systems $24,269,333 6.7%Fire/Life Safety $24,054,152 6.6%Accessibility $10,696,592 2.9%Health $8,754,911 2.4%Vertical Transportation $3,262,673 0.9%Site $859,613 0.2%Totals $362,944,433 100.0%
NORTH CAROLINA STATE UNIVERSITY
2012-2013 FCAP Annual Report 9
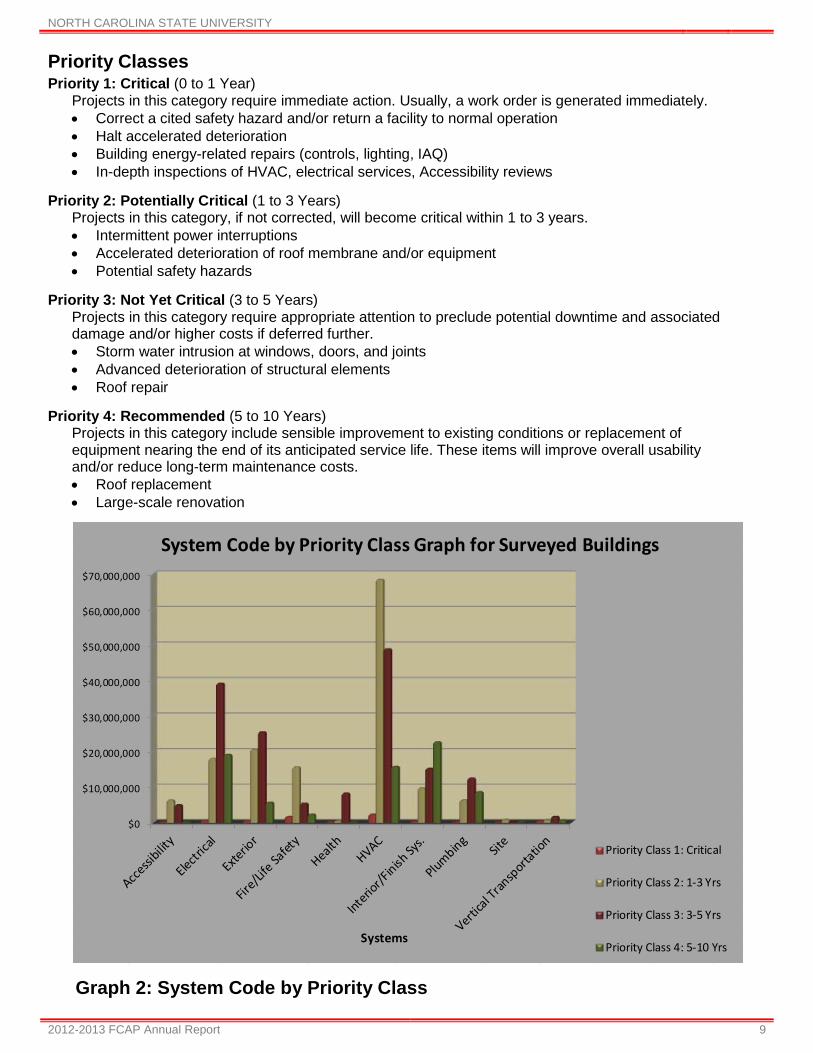
Priority Classes Priority 1: Critical (0 to 1 Year)
Projects in this category require immediate action. Usually, a work order is generated immediately. • Correct a cited safety hazard and/or return a facility to normal operation • Halt accelerated deterioration • Building energy-related repairs (controls, lighting, IAQ) • In-depth inspections of HVAC, electrical services, Accessibility reviews
Priority 2: Potentially Critical (1 to 3 Years)
Projects in this category, if not corrected, will become critical within 1 to 3 years. • Intermittent power interruptions • Accelerated deterioration of roof membrane and/or equipment • Potential safety hazards
Priority 3: Not Yet Critical (3 to 5 Years)
Projects in this category require appropriate attention to preclude potential downtime and associated damage and/or higher costs if deferred further. • Storm water intrusion at windows, doors, and joints • Advanced deterioration of structural elements • Roof repair
Priority 4: Recommended (5 to 10 Years)
Projects in this category include sensible improvement to existing conditions or replacement of equipment nearing the end of its anticipated service life. These items will improve overall usability and/or reduce long-term maintenance costs. • Roof replacement • Large-scale renovation
Graph 2: System Code by Priority Class
$0
$10,000,000
$20,000,000
$30,000,000
$40,000,000
$50,000,000
$60,000,000
$70,000,000
Systems
System Code by Priority Class Graph for Surveyed Buildings
Priority Class 1: Critical
Priority Class 2: 1-3 Yrs
Priority Class 3: 3-5 Yrs
Priority Class 4: 5-10 Yrs

NORTH CAROLINA STATE UNIVERSITY
2012-2013 FCAP Annual Report 10
Project Classes Capital Renewal: refers to major repairs or the replacement and/or rebuilding of major facility components based upon effective service life (anticipated life cycle) e.g., roof replacement at the end of its normal useful life is capital renewal; roof replacement several years beyond the end of its effective service life is deferred maintenance. The routine replacement of aging/obsolete equipment/material accounts for nearly half of all probable costs. Deferred Maintenance: Refers to expenditures for repairs which were not accomplished as a part of normal maintenance or capital renewal, and which have accumulated to the point that facility deterioration is evident and could impair the proper functioning of the facility. Cost estimates for deferred maintenance projects should include compliance with current applicable codes, even if such compliance requires expenditures beyond those essential to affect the needed repairs. Plant Adaptation: Refers to expenditures required to adapt the facility to the evolving needs of the institution and/or to changing codes or standards. Examples include compliance with changing codes (ADA, NCBC, NCEC), facility alterations required by changing teaching or research methods, improvements to accompany the adoption of modern technology (telecommunications), and energy-efficiency improvements as mandated by the NCSU administration or the State of North Carolina. Routine Maintenance: Refers to the day-to-day efforts to control deterioration of facilities through scheduled repetitive activities (e.g., cleaning), periodic scheduled work (e.g., inspections, equipment adjustments, filter replacement, painting) and minor repairs that are performed on an as-needed basis. This type of work is not addressed in FCAP reports unless routine maintenance cycles appear to be insufficient or inadequate. Work Orders are created in the AiM work management system, or conditions are noted for future funding.
Graph 3: Project Class by Priority Class for Surveyed Buildings
$0
$10,000,000
$20,000,000
$30,000,000
$40,000,000
$50,000,000
$60,000,000
$70,000,000
$80,000,000
1: Critical 2: 1-3 Yrs 3: 3-5 Yrs 4: 5-10 YrsPriority Classes
Project Class by Priority Class for Surveyed Buildings
Capital Renewal
DeferredMaintenance
Plant Adaption
Project Classes

NORTH CAROLINA STATE UNIVERSITY
2012-2013 FCAP Annual Report 11
CR+DM+PA by System Charts The following charts show project costs classified as Capital Renewal, Deferred Maintenance, or Plant Adaptation as aggregate totals per system for all surveyed buildings.

NORTH CAROLINA STATE UNIVERSITY
2012-2013 FCAP Annual Report 12
Graph 5: System Code by Project Class Totals
$-
$10,000,000
$20,000,000
$30,000,000
$40,000,000
$50,000,000
$60,000,000
$70,000,000
System Code by Project Class Totals
Capital Renewal
Deferred Maintenance
Plant Adaption

NORTH CAROLINA STATE UNIVERSITY
2012-2013 FCAP Annual Report 13
Assessment Priority The FCAP database now includes assessments of all state-appropriated campus buildings. Going forward, the program will shift from its earlier data gathering phase to data management, and older reports will be replaced as the second and third rounds of assessments are conducted; a new assessment cycle has been developed to guide this work. In priority-based assessments, buildings are classified by purpose (classroom, laboratory, administrative), square footage, and CRV, to determine which are the most mission-critical.
• Buildings with higher FCI’s and higher priority scores will be assessed early in the cycle:
Building Number and Name FCI Priority 011 Brooks Hall 0.3847 50.78 024 Poe Hall 0.3005 41.51 067A Bostian Hall 0.3719 33.47 048 Hillsborough Building 0.3870 31.34 038 Daniels Hall 0.2459 29.50 054 Dabney Hall 0.2450 29.40 040 Mann Hall 0.2377 28.52 023 Winston Hall 0.2809 28.49 01A Kamphoefner Hall 0.2608 25.82 025 Caldwell Hall 0.2448 24.82 070 Phytotron 0.2394 21.54 117 D.S. Weaver Laboratories 0.2566 20.53 055 Cox Hall 0.2155 19.39
• Buildings with lower FCI’s and lower priority scores will be assessed later in the cycle:
Building Number and Name FCI Priority 106 Clark Hall 0.0347 2.29 720C EGRC Constructed Facilities Lab 0.0166 1.50 058A Jordan Addition 0.0166 1.49 043 Withers Hall 0.0125 1.24 782B EB II 0.0081 .98 036 1911 Building 0.0121 .65 712 Toxicology Building 0.0061 .55 008 Peele Hall 0.0138 .50 132 Joyner Visitor Center 0.0060 .48 128 Butler Communications 0.0165 .45 126 Fleet Services Facility 0.0075 .31 029 Yarbrough Steam Plant 0.0148 .24 086 Cates Avenue Steam Plant 0.0096 .23 076 Marye Anne Fox Science Teaching Lab 0.0005 .06 713 Partners III 0.0004 .03

NORTH CAROLINA STATE UNIVERSITY
2012-2013 FCAP Annual Report 14
2010-2013 Campus Data Summary Table The table below illustrates the rate at which the FCAP group has worked to complete assessments on all 292 buildings, as indicated by steadily increasing gross square footage totals and replacement values associated with surveyed buildings. Notice as well the growing numbers associated with deferred maintenance costs; these indicators have increased more than 41.1 million dollars in the last three years alone, a clear indicator that the University’s deferred maintenance needs are far outpacing both the State’s ability to fund these needs, as well as facility replacement values. Campus-wide FCI will continue to rise in the absence of sustained and predictable maintenance funding, as will be discussed in the following pages. Graphs are provided to project the possible outcomes of alternate funding models.
Yarbrough Steam Plant Roof
313 313 292Fiscal Years 2010-2011 2011-2012 2012-2013GSF 7,777,736 7,823,678 8,061,365Surveyed Buildings GSF 6,980,464 7,087,029 8,061,365CRV 2,478,325,898$ 2,718,252,284$ 2,916,140,145$ Surveyed Buildings CRV 2,267,051,758$ 2,503,960,158$ 2,916,140,145$ Total Maintenance Backlog Costs 294,328,792$ 305,356,165$ 362,944,432$ FCQI Surveyed Buildings 0.130 0.122 0.124Maintenance Backlog Cost per SF 42$ 43$ 45$ Maintenance Backlog % of CRV 11.81% 11.09% 12.45%Total Estimated DM Costs 321,758,277$ 331,488,938$ 362,944,432$ Infrastructure Costs 72,774,151$ 72,774,151$ 72,774,151$ Grand Total 394,532,428$ 404,263,090$ 435,718,583$
292 State-Appropriated Only
Number of Buildings
NORTH CAROLINA STATE UNIVERSITY
2012-2013 FCAP Annual Report 15
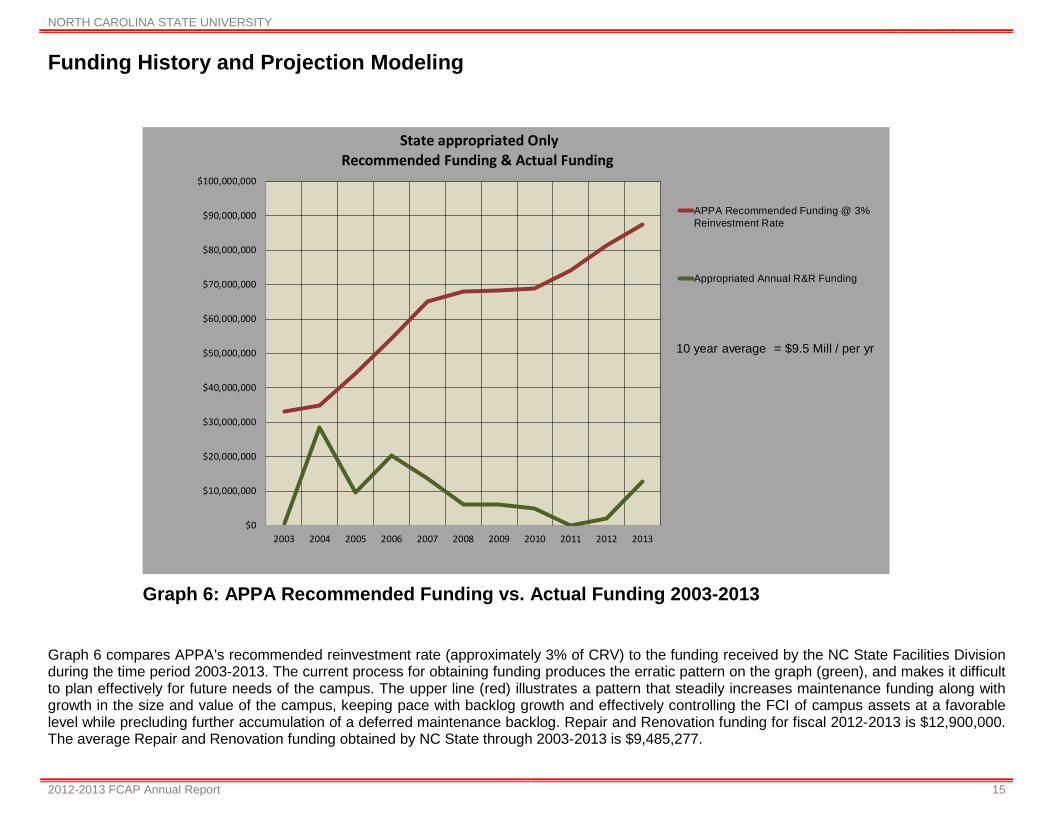
Funding History and Projection Modeling Graph 6 compares APPA’s recommended reinvestment rate (approximately 3% of CRV) to the funding received by the NC State Facilities Division during the time period 2003-2013. The current process for obtaining funding produces the erratic pattern on the graph (green), and makes it difficult to plan effectively for future needs of the campus. The upper line (red) illustrates a pattern that steadily increases maintenance funding along with growth in the size and value of the campus, keeping pace with backlog growth and effectively controlling the FCI of campus assets at a favorable level while precluding further accumulation of a deferred maintenance backlog. Repair and Renovation funding for fiscal 2012-2013 is $12,900,000. The average Repair and Renovation funding obtained by NC State through 2003-2013 is $9,485,277.
Graph 6: APPA Recommended Funding vs. Actual Funding 2003-2013
$0
$10,000,000
$20,000,000
$30,000,000
$40,000,000
$50,000,000
$60,000,000
$70,000,000
$80,000,000
$90,000,000
$100,000,000
2003 2004 2005 2006 2007 2008 2009 2010 2011 2012 2013
State appropriated OnlyRecommended Funding & Actual Funding
APPA Recommended Funding @ 3%Reinvestment Rate
Appropriated Annual R&R Funding
10 year average = $9.5 Mill / per yr

NORTH CAROLINA STATE UNIVERSITY
2012-2013 FCAP Annual Report 16
Model 1 illustrates the effect of the 10-year average funding on campus maintenance backlog and FCI over a 20 year period. If the average funding is maintained, the backlog will grow and the FCI will rise. If the 10-Year Average Funding Level is maintained for the next 20 years, by 2033 the backlog will rise to $1,384,156,248 and the campus-wide FCI will be .250.
Model 1: Campus Condition Over 20 Years at Average Funding Level
2013 2018 2023 2028 2033Average Funding Level $9,485,277 $9,485,277 $9,485,277 $9,485,277 $9,485,277Backlog Projection $362,944,432 $555,685,683 $768,373,442 $1,040,235,392 $1,384,156,248FCI 0.124 0.162 0.191 0.221 0.250
0.000
0.050
0.100
0.150
0.200
0.250
0.300
$1
$10
$100
$1,000
$10,000
$100,000
$1,000,000
$10,000,000
$100,000,000
$1,000,000,000
$10,000,000,000
FCI
Campus Condition Index Over 20 Years At Average Funding Level From 2002-2013

NORTH CAROLINA STATE UNIVERSITY
2012-2013 FCAP Annual Report 17
Model 2 shows the recommended funding to reduce the campus FCI to within industry standards from .12 (poor condition) to .09 (fair condition) over a twenty year period. This model represents a gradual increase in reinvestment in five year divisions beginning with 1.9% of CRV and steadily increasing to the recommended standard of at least 3.0% of CRV.
Model 2: Funding Required to Reduce FCI Over 20 Years
2013 2018 2023 2028 2033Funding Level $55,406,663 $64,155,083 $72,903,504 $81,651,924 $87,484,204Backlog Projection $362,944,432 $417,959,318 $444,491,707 $471,024,095 $497,556,484FCI 0.124 0.126 0.114 0.103 0.093Percentage of CRV 0.019000 0.022000 0.025000 0.028000 0.030000
1.9% 2.2% 2.5% 2.8% 3.0%
0.000
0.020
0.040
0.060
0.080
0.100
0.120
0.140
$0.00
$100,000,000.00
$200,000,000.00
$300,000,000.00
$400,000,000.00
$500,000,000.00
$600,000,000.00
FCI
Funding Required To Reduce FCI From .12 To .09 In 20 Years

NORTH CAROLINA STATE UNIVERSITY
2012-2013 FCAP Annual Report 18
Appendix 2012-2013 Data Summary Table by Building
Bldg. Num. Building Name GrossSF Assessed CRV for 2013
Reporting Capital Renewal
CRDeferred Maint.
DMDeferred Maint.
CR+DMPlant Adapt.
PA
2012-2013 Total Maintenance Backlog Costs
FCICR+DM
CRV
FCQICR+DM+PA
CRV001 Chancellor's Residence (formerly) 8,412 2009 3,048,511$ 249,472$ 118,617$ $ 368,089 5,818$ 373,908$ 0.12 0.12
001A Chancellor's Garage (formerly) 500 2009 63,444$ 17,714$ -$ $ 17,714 -$ 17,714$ 0.28 0.28 002 Memorial Bell Tower 400 2010 7,073,611$ -$ 2,340,377$ $ 2,340,377 -$ 2,340,377$ 0.33 0.33 003 Holladay Hall 29,810 2008 7,785,684$ 988,049$ 2,417,781$ $ 3,405,830 117,445$ 3,523,275$ 0.44 0.45 004 Winslow Hall (formerly Alumni Building) 14,051 2010 5,060,064$ -$ 159,368$ $ 159,368 4,120$ 163,488$ 0.03 0.03 006 Primrose Hall 3,926 2007 1,037,835$ 171,883$ 21,845$ $ 193,728 4,295$ 198,023$ 0.19 0.19 008 Peele Hall 23,010 2010 7,425,245$ -$ 95,226$ $ 95,226 6,897$ 102,124$ 0.01 0.01 011 Brooks Hall 77,575 2008 28,791,663$ 3,815,822$ 6,525,788$ $ 10,341,611 735,404$ 11,077,015$ 0.36 0.38
011A Kamphoefner Hall 49,664 2010 17,749,915$ 819,296$ 3,317,067$ $ 4,136,363 492,244$ 4,628,607$ 0.23 0.26 018 Leazar Hall 64,202 2010 23,662,025$ -$ 144,446$ $ 144,446 634,474$ 778,920$ 0.01 0.03 022 Tompkins Hall 66,086 2008 31,952,023$ 494,022$ 4,573,608$ $ 5,067,630 28,257$ 5,095,887$ 0.16 0.16 023 Winston Hall 46,181 2008 13,506,419$ 2,017,536$ 1,684,891$ $ 3,702,427 91,221$ 3,793,647$ 0.27 0.28 024 Poe Hall 152,835 2011 44,922,639$ 4,087,871$ 8,148,262$ $ 12,236,133 1,264,042$ 13,500,175$ 0.27 0.30 025 Caldwell Hall 45,457 2008 13,382,413$ 1,813,957$ 1,433,601$ $ 3,247,559 28,182$ 3,275,741$ 0.24 0.24 029 Yarbrough Steam Plant 17,185 2008 29,899,744$ 152,926$ -$ $ 152,926 -$ 152,926$ 0.01 0.01
029A Facilities Operations Storage 1,004 2008 127,396$ 14,779$ -$ $ 14,779 -$ 14,779$ 0.12 0.12 029B Yarbrough Chiller Plant 38,639 2008 35,014,228$ -$ -$ $ - -$ -$ - - 030 Language and Computer Labs 14,084 2009 4,129,524$ 814,519$ 5,311$ $ 819,830 -$ 819,830$ 0.20 0.20
032A SAS Hall 121,616 2009 42,715,961$ -$ -$ -$ -$ -$ - - 033 Park Shops 49,978 2009 21,058,293$ -$ -$ $ - -$ -$ - - 034 Page Hall 30,994 2008 9,308,044$ 806,773$ 287,734$ $ 1,094,507 520,302$ 1,614,809$ 0.12 0.17 036 1911 Building 49,884 2008 17,696,734$ 214,145$ -$ $ 214,145 -$ 214,145$ 0.01 0.01 038 Daniels Hall 136,426 2010 48,758,653$ 5,533,888$ 6,264,101$ $ 11,797,989 189,889$ 11,987,879$ 0.24 0.25 039 Riddick Hall 127,490 2008 56,390,466$ 1,199,899$ 116,793$ $ 1,316,692 -$ 1,316,692$ 0.02 0.02 040 Mann Hall 84,615 2008 38,651,733$ 8,671,479$ 206,523$ $ 8,878,002 307,628$ 9,185,629$ 0.23 0.24 042 BURLINGTON NUC LABS 71,236 2013 28,554,729$ 1,709,966$ 1,540,240$ 3,250,206$ 303,731$ 3,553,938$ 0.11 0.12 043 Withers Hall 71,420 2011 21,522,988$ 252,483$ -$ $ 252,483 17,389$ 269,872$ 0.01 0.01 045 Ricks Hall 44,263 2011 13,339,009$ 1,257,077$ 1,892,835$ $ 3,149,912 477,707$ 3,627,619$ 0.24 0.27
045A Ricks Hall Addition 8,787 2011 2,648,033$ 927,371$ -$ $ 927,371 21,273$ 948,644$ 0.35 0.36 046 Patterson Hall 43,252 2011 11,433,628$ 2,585,611$ 982,515$ $ 3,568,126 469,015$ 4,037,140$ 0.31 0.35 047 D H Hill Library 103,462 2008 38,399,525$ 1,447,624$ 324,633$ $ 1,772,257 4,572$ 1,776,829$ 0.05 0.05
047A Erdahl Cloyd Wing 59,885 2008 16,769,240$ 463,726$ 3,788,541$ $ 4,252,267 2,377,981$ 6,630,248$ 0.25 0.40 047B D. H. Hill North Tower (Old Stacks) 108,956 2008 40,438,601$ 2,704,904$ 5,666,078$ $ 8,370,982 353,493$ 8,724,475$ 0.21 0.22 047C D.H. Hill South Tower (New Stacks) 111,605 2008 41,421,768$ 6,201,199$ 44,047$ $ 6,245,246 10,375$ 6,255,621$ 0.15 0.15 048 Hillsborough Building 41,287 2008 11,787,317$ 744,259$ 3,527,497$ $ 4,271,756 289,428$ 4,561,184$ 0.36 0.39
049A 2806 HILLSBOROUGH ST-BLDG A 4,954 2013 1,272,917$ 88,550$ 190,683$ 279,233$ 34,962$ 314,195$ 0.22 0.25 049B 2806 HILLSBOROUGH ST-BLDG B 2,709 2013 696,070$ 52,720$ 59,726$ 112,446$ 11,302$ 123,748$ 0.16 0.18 050 Polk Hall 126,915 2010 52,418,950$ 3,296,208$ 2,607,948$ $ 5,904,156 1,436,523$ 7,340,679$ 0.11 0.14 051 BROUGHTON HALL 99,348 2013 42,212,536$ 2,527,847$ 2,276,941$ 4,804,789$ 449,007$ 5,253,796$ 0.11 0.12 053 Bureau of Mines 16,814 2002 4,800,347$ 1,554,516$ 323,340$ $ 1,877,856 526,187$ 2,404,043$ 0.39 0.50 054 Dabney Hall 139,827 2008 63,872,314$ 3,085,865$ 12,408,850$ $ 15,494,715 153,555$ 15,648,271$ 0.24 0.24
054A CHEMICAL STORAGE UNIT @ DABNEY 121 2013 45,565$ -$ $ 12,918 $ 12,918 -$ 12,918$ 0.28 0.28 054B CHEMICAL STORAGE UNIT @ DABNEY 121 2013 34,545$ -$ $ 12,918 $ 12,918 -$ 12,918$ 0.37 0.37 055 Cox Hall 66,004 2008 30,150,315$ 753,321$ 3,436,404$ $ 4,189,725 2,306,527$ 6,496,252$ 0.14 0.22 056 HARRELSON HALL 111,688 2013 47,010,253$ 2,815,153$ 2,535,730$ 5,350,883$ 500,039$ 5,850,922$ 0.11 0.12 058 Jordan Hall 114,443 2012 40,901,930$ 545,010$ 1,403,763$ $ 1,948,773 468,839$ 2,417,612$ 0.05 0.06
058A Jordan Addition 46,000 2012 16,440,400$ 189,845$ 82,472$ $ 272,316 -$ 272,316$ 0.02 0.02 062 Williams Hall 136,393 2008 35,045,819$ 999,456$ 12,042,207$ $ 13,041,662 2,188,647$ 15,230,309$ 0.37 0.43 065 MAIN DISTRIBUTION FRAME 1,547 2013 515,565$ -$ 111,663$ $ 111,663 -$ 111,663$ 0.22 0.22 067 Gardner Hall 106,455 2008 48,628,141$ 936,517$ 12,098,238$ $ 13,034,755 1,368,533$ 14,403,288$ 0.27 0.30
067A Bostian Hall 44,042 2008 12,573,861$ 3,474,575$ 1,192,931$ $ 4,667,506 8,935$ 4,676,442$ 0.37 0.37 067B Thomas Hall (formerly South Gardner) 99,386 2008 35,520,557$ 964,532$ 27,617$ $ 992,149 711,568$ 1,703,718$ 0.03 0.05 068 Scott Hall 86,604 2012 36,629,906$ 5,819,542$ 1,725,738$ $ 7,545,280 67,346$ 7,612,626$ 0.21 0.21
068A CHEMICAL STORAGE UNIT @ SCOTT 143 2012 47,034$ -$ -$ $ - -$ -$ - - 069 Kilgore Hall 54,112 2007 14,304,459$ 743,006$ 677,327$ $ 1,420,333 350,297$ 1,770,630$ 0.10 0.12 070 Phytotron 41,281 2007 14,753,830$ 3,347,597$ 53,060$ $ 3,400,657 130,695$ 3,531,352$ 0.23 0.24 072 Biological Resources Facility 21,532 2010 9,114,466$ 859,143$ 24,206$ $ 883,349 191,431$ 1,074,780$ 0.10 0.12 075 David Clark Labs and Addition 97,263 2008 33,295,255$ -$ -$ $ - -$ -$ - -

NORTH CAROLINA STATE UNIVERSITY
2012-2013 FCAP Annual Report 19
Bldg. Num. Building Name GrossSF Assessed CRV for 2013
Reporting Capital Renewal
CRDeferred Maint.
DMDeferred Maint.
CR+DMPlant Adapt.
PA
2012-2013 Total Maintenance Backlog Costs
FCICR+DM
CRV
FCQICR+DM+PA
CRV076 Marye Anne Fox Science Teaching Lab 112,969 2008 51,603,706$ 24,545$ -$ $ 24,545 -$ 24,545$ 0.00 0.00 078 Nelson Hall 148,377 2008 44,714,595$ 3,868,676$ 1,263,598$ $ 5,132,273 438,833$ 5,571,107$ 0.11 0.12 080 TURNER HOUSE 2,097 2013 549,906$ 38,975$ 67,379$ 106,353$ 7,219$ 113,572$ 0.19 0.21
080A TURNER HOUSE GARAGE 375 2013 47,583$ -$ 6,306$ $ 6,306 -$ 6,306$ 0.13 0.13 083 West Dunn Building 8,690 2010 2,297,194$ 254,498$ 508,989$ $ 763,487 110,088$ 873,575$ 0.33 0.38 086 Cates Ave. Power Plant 33,301 2009 20,006,625$ 188,456$ -$ $ 188,456 4,249$ 192,705$ 0.01 0.01 090 Harris Hall 23,097 2009 6,105,765$ 755,039$ 850,469$ $ 1,605,508 25,527$ 1,631,035$ 0.26 0.27
090A Pullen Hall 16,062 2009 4,127,088$ 159,241$ 1,073,252$ $ 1,232,493 141,626$ 1,374,119$ 0.30 0.33 101 Carmichael Gym 355,600 2009 78,233,957$ 18,657,638$ 8,239,889$ $ 26,897,527 3,865,741$ 30,763,268$ 0.34 0.39 104 Price Music Center 24,096 2010 7,261,523$ 722,815$ 1,672,581$ $ 2,395,396 235,730$ 2,631,126$ 0.33 0.36 106 Clark Hall 26,819 2009 12,061,126$ 255,841$ 88,698$ $ 344,540 74,311$ 418,850$ 0.03 0.03 113 Biltmore Hall (incl Robertson wing) 75,161 2007 26,862,542$ 3,653,072$ 338,727$ $ 3,991,799 245,173$ 4,236,972$ 0.15 0.16
113B Pulp and Paper Labs 38,494 2007 13,757,756$ 913,343$ 83,973$ $ 997,316 143,494$ 1,140,810$ 0.07 0.08 114 Hodges Wood Products 29,449 2007 $ 10,525,073 $ 605,408 $ 211,639 $ 817,047 $ 31,556 $ 848,603 0.08 0.08
114A HODGES WOOD PROD STOR CENTRAL 356 2012 56,465$ -$ -$ $ - -$ -$ - - 114B HODGES WOOD PROD STOR NORTH 1,129 2012 101,473$ 7,873$ 3,505$ $ 11,378 -$ 11,378$ 0.11 0.11 114C HODGES WOOD PROD STOR EAST 2,207 2012 198,362$ 4,448$ 12,663$ 17,111$ -$ 17,111$ 0.09 0.09 115C Dail Softball Stadium/Pressbox & Seating 3,911 2011 866,909$ -$ -$ -$ -$ -$ - - 116 SOLAR BULK CURING BARN 1,746 2013 156,929$ -$ 153,015$ $ 153,015 -$ 153,015$ 0.98 0.98 117 D.S. Weaver Laboratories 88,798 2008 31,736,406$ 3,055,627$ 4,178,231$ $ 7,233,858 910,843$ 8,144,701$ 0.23 0.26
117A Weaver Administration Building 9,746 2008 2,504,209$ 1,015,323$ 109,783$ 1,125,107$ 193,253$ 1,318,359$ 0.45 0.53 117B Weaver Labs Garage 5,629 2008 505,927$ -$ 279,496$ 279,496$ 68,733$ 348,230$ 0.55 0.69 118 Grinnells Lab 28,128 2008 11,663,083$ 956,319$ 21,634$ $ 977,952 209,970$ 1,187,922$ 0.08 0.10 120 Schaub Food Science Bldg. 98,409 2008 41,622,932$ 4,160,138$ 1,057,738$ $ 5,217,877 211,446$ 5,429,322$ 0.13 0.13 121 Administrative Services II 30,194 2009 8,027,733$ 618,251$ 216,261$ $ 834,513 44,189$ 878,702$ 0.10 0.11 122 Administrative Services I 27,998 2010 7,401,247$ 303,266$ 1,232,104$ $ 1,535,370 10,622$ 1,545,992$ 0.21 0.21
124A SULLIVAN SHOPS BUILDING III 13,536 2013 3,478,039$ -$ -$ -$ -$ -$ - - 124B SULLIVAN BUILDING III RECYCLING 3,093 2013 523,284$ -$ -$ -$ -$ -$ - - 124C LANDSCAPE EQUIP 3,468 2013 311,699$ -$ 10,464$ 10,464$ -$ 10,464$ 0.03 0.03 124E LANDSCAPE STORAGE 4,182 2013 375,872$ -$ 11,512$ 11,512$ -$ 11,512$ 0.03 0.03 124F LANDSCAPE HAZARDOUS MATERIALS 120 2013 10,787$ 1,012$ 2,606$ 3,618$ -$ 3,618$ 0.34 0.34 124G LANDSCAPE HAZARDOUS MATERIALS 560 2013 50,332$ -$ 2,128$ 2,128$ -$ 2,128$ 0.04 0.04 124H HEAVY EQUIPMENT STORAGE SHED 96 2013 8,628$ 517$ 465$ 982$ 92$ 1,074$ 0.11 0.12 124J SULLIVAN SITE STORAGE SHED 96 2013 8,628$ 517$ 465$ 982$ 92$ 1,074$ 0.11 0.12 124K STORAGE BUILDING at Sullivan Drive 3,736 2013 342,174$ -$ -$ -$ -$ -$ - - 124P FACILITIES OPERATIONS SUPPORT STOR 3,840 2013 334,957$ -$ 2,530$ 2,530$ -$ 2,530$ 0.01 0.01 126 MOTOR POOL FACILITY 12,770 2012 3,645,797$ 27,315$ -$ $ 27,315 -$ 27,315$ 0.01 0.01
126D SULLIVAN SHOPS BUILDING I 14,097 2012 3,622,186$ 4,153$ -$ 4,153$ 23,034$ 27,187$ 0.00 0.01 126E SULLIVAN SHOPS BUILDING II 20,243 2012 5,201,385$ -$ -$ -$ -$ -$ - - 128 Butler Communications Bldg. 33,814 2007 8,688,418$ 26,262$ 60,987$ $ 87,249 56,517$ 143,766$ 0.01 0.02
129A MCKIMMON ADDITION 15,115 2013 3,883,760$ 232,574$ 209,490$ 442,064$ 41,311$ 483,375$ 0.11 0.12 131 Early College High School 12,398 2013 4,431,045$ 102,217$ 1,123,559$ $ 1,225,776 249,950$ 1,475,726$ 0.28 0.33 132 Joyner Visitor Center 28,074 2011 7,213,539$ 5,287$ 3,172$ $ 8,459 34,656$ 43,115$ 0.00 0.01 133 Don E Ellis Building 7,809 2013 3,137,740$ 25,427$ 182,408$ $ 207,835 126,889$ 334,724$ 0.07 0.11 134 CVM ANNEX 5,224 2012 1,491,437$ 19,331$ 146,422$ $ 165,753 13,322$ 179,075$ 0.11 0.12
134A STORAGE BUILDING RPRL - CVM ANNEX 854 2012 76,757$ 6,815$ 6,822$ 13,638$ -$ 13,638$ 0.18 0.18 134B CATTLE AND SWINE PENS RPRL - CVM 1,200 2012 107,855$ -$ 11,883$ 11,883$ -$ 11,883$ 0.11 0.11 134D UTILITY BUILDING RPRL - CVM 322 2012 28,941$ 6,491$ -$ 6,491$ -$ 6,491$ 0.22 0.22 134E GILT/BOAR BUILDING RPRL CVM 912 2012 81,970$ -$ 8,626$ 8,626$ -$ 8,626$ 0.11 0.11 135H Lot 86 Groundwater Treatment Plant 1,134 2006 817,055$ -$ -$ -$ -$ -$ - - 138 3709 Hillsborough Street 20,661 2011 7,384,242$ 1,005,986$ 532,760$ $ 1,538,746 218,892$ 1,757,638$ 0.21 0.24
138A 3709 Hillsborough Street Garage 919 2011 68,023$ 20,892$ 12,809$ 33,701$ -$ 33,701$ 0.50 0.50 140A 3115 Western Blvd (Fmr Armory Garage) 4,460 2013 601,911$ -$ 140,200$ 140,200$ 25,300$ 165,500$ 0.23 0.27 162 Daylight Research Lab 560 2010 105,806$ 28,656$ 17,764$ $ 46,420 18,478$ 64,898$ 0.44 0.61
162A Daylight Rotating Lab 255 2010 29,943$ -$ -$ -$ -$ -$ - - 162B Brick Research Facility 688 2010 87,299$ -$ -$ -$ -$ -$ - - 163 Pfiesteria Research Lab 8,000 2010 2,283,976$ 399,076$ 290,317$ $ 689,393 55,549$ 744,942$ 0.30 0.33
163B Small Animal Research Facility 700 2010 240,558$ -$ -$ -$ -$ -$ - - 163C Modular Dinoflagellate Facility 709 2010 215,408$ -$ -$ -$ -$ -$ - - 163D Aquatic Research Fish Lab 1,128 2010 101,383$ -$ -$ -$ -$ -$ - -

NORTH CAROLINA STATE UNIVERSITY
2012-2013 FCAP Annual Report 20
Bldg. Num. Building Name GrossSF Assessed CRV for 2013
Reporting Capital Renewal
CRDeferred Maint.
DMDeferred Maint.
CR+DMPlant Adapt.
PA
2012-2013 Total Maintenance Backlog Costs
FCICR+DM
CRV
FCQICR+DM+PA
CRV163E CALS Record Storage 782 2010 94,402$ -$ -$ -$ -$ -$ - - 163F MAE Lab 11,171 2010 3,992,515$ 520,869$ -$ 520,869$ 3,260$ 524,129$ 0.13 0.13 163G Natural Resources Storage Building 2,053 2010 184,521$ 2,017$ -$ 2,017$ -$ 2,017$ 0.01 0.01 163H Salt Barn at Bulk Debris Site 837 2011 60,125$ -$ -$ -$ -$ -$ - - 163J Storage Shelter at Bulk Debris Site 240 2011 17,240$ -$ -$ -$ -$ -$ - - 163K Attendant Station at Bulk Debris Site 76 2011 40,945$ -$ -$ -$ -$ -$ - - 164A Dearstyne Complex A 2,100 2010 750,540$ 109,786$ 244,844$ 354,629$ 40,348$ 394,977$ 0.47 0.53 164B Dearstyne Complex B 5,280 2010 1,205,940$ 124,716$ 247,763$ 372,480$ 140,229$ 512,709$ 0.31 0.43 164C Dearstyne Complex C 6,300 2010 1,522,234$ 167,339$ 614,503$ 781,842$ 117,709$ 899,551$ 0.51 0.59 164D Dearstyne Complex D 233 2010 20,942$ -$ -$ -$ -$ -$ - - 165A West Research Annex A 5,100 2010 1,822,741$ 53,934$ 666,394$ 720,328$ 52,761$ 773,089$ 0.40 0.42 165B West Research Annex B 3,602 2010 457,049$ 68,567$ 307,560$ 376,127$ 34,357$ 410,484$ 0.82 0.90 166 WEED CONTROL LAB 8,238 2013 2,790,955$ 76,984$ 722,828$ 799,812$ 44,860$ 844,672$ 0.29 0.30
166B WEED CONTROL LAB "B" 1,090 2013 130,800$ -$ 23,119$ 23,119$ -$ 23,119$ 0.18 0.18 166C WEED CONTROL LAB "C" 1,090 2013 130,800$ -$ 15,250$ 15,250$ -$ 15,250$ 0.12 0.12 166D WEED CONTROL LAB "D" 1,275 2013 108,375$ -$ 23,792$ 23,792$ -$ 23,792$ 0.22 0.22 167 WEED CONTROL LAB STORAGE 1,758 2013 210,960$ -$ 36,045$ 36,045$ -$ 36,045$ 0.17 0.17
169A Applied Energy Lab 169A 2,091 2010 265,322$ 38,353$ 44,733$ 83,086$ 12,985$ 96,070$ 0.31 0.36 169B Applied Energy Lab 169B 2,091 2010 265,322$ 17,791$ 44,733$ 62,524$ 12,985$ 75,509$ 0.24 0.28 169E Applied Energy Lab 169E 1,823 2010 231,316$ 30,444$ -$ 30,444$ 12,985$ 43,428$ 0.13 0.19 170A BOOSTER PUMP STATION 1,168 2013 333,461$ 19,969$ 17,987$ 37,956$ 3,547$ 41,503$ 0.11 0.12 171 Headhouse Unit 1 8,895 2007 2,031,597$ 539,170$ 56,317$ $ 595,488 20,879$ 616,366$ 0.29 0.30
171A Greenhouse Unit 1 5,663 2007 898,204$ 7,898$ 6,131$ 14,029$ 2,957$ 16,986$ 0.02 0.02 171B Greenhouse Unit 1 5,663 2007 898,204$ 7,898$ 4,747$ 12,645$ -$ 12,645$ 0.01 0.01 171C Greenhouse Unit 1 5,663 2007 898,204$ 9,126$ 2,902$ 12,028$ -$ 12,028$ 0.01 0.01 171D Greenhouse Unit 1 4,781 2007 758,311$ 6,338$ 4,106$ 10,444$ 2,645$ 13,089$ 0.01 0.02 172 Headhouse Unit 2 15,071 2007 4,036,163$ 717,228$ 53,890$ $ 771,117 78,132$ 849,249$ 0.19 0.21
172A Greenhouse Unit 2 7,732 2007 1,243,496$ 33,014$ 1,254$ 34,268$ -$ 34,268$ 0.03 0.03 172B Greenhouse Unit 2 8,339 2007 1,322,642$ 22,703$ -$ 22,703$ -$ 22,703$ 0.02 0.02 172C Greenhouse Unit 2 8,339 2007 1,322,642$ 23,813$ 1,254$ 25,067$ -$ 25,067$ 0.02 0.02 172D Unit 2 Greenhouse D 9,395 2007 1,490,133$ 34,286$ -$ 34,286$ -$ 34,286$ 0.02 0.02 172E Unit 2 Greenhouse E 9,200 2007 1,490,133$ -$ -$ -$ -$ -$ - - 172F Greenhouse Unit 2 Mech. Bldg. 1,500 2007 342,597$ -$ -$ -$ -$ -$ - - 173 Headhouse Unit 3 14,938 2007 3,411,804$ 443,472$ 135,754$ $ 579,227 155,859$ 735,086$ 0.17 0.22
173A Greenhouse Unit 3 9,323 2007 5,295,306$ 12,510$ 2,851$ 15,361$ -$ 15,361$ 0.00 0.00 173B Greenhouse Unit 3 10,624 2007 2,426,496$ 15,522$ 1,460$ 16,982$ -$ 16,982$ 0.01 0.01 173C Greenhouse Unit 3 9,657 2007 2,205,636$ 13,102$ 7,881$ 20,983$ -$ 20,983$ 0.01 0.01 174 Headhouse Unit 4 11,875 2007 2,712,222$ 212,658$ 109,169$ $ 321,827 76,813$ 398,640$ 0.12 0.15
174A Greenhouse Unit 4 6,529 2007 1,066,326$ -$ 3,103$ 3,103$ -$ 3,103$ 0.00 0.00 174B GREENHOUSE B UNIT 4 AT METHOD 3,424 2011 291,040$ -$ -$ -$ -$ -$ - - 210 ENV HEALTH AND SAFETY CENTER 20,341 2012 5,807,296$ 318,615$ 34,624$ $ 353,239 15,734$ 368,972$ 0.06 0.06 215 Administrative Services III 53,973 2009 14,267,715$ -$ -$ -$ -$ -$ - - 223 West Chiller Plant 7,704 2009 4,939,628$ -$ -$ -$ -$ -$ - - 238 Public Safety Center 18,274 2010 4,824,371$ -$ -$ -$ -$ -$ - - 240 MEAS FIELD LAB 7,200 2013 3,288,926$ 21,189$ 27,542$ 48,731$ 10,233$ 58,964$ 0.01 0.02 242 Solar House 2,547 2010 673,297$ 96,525$ -$ 96,525$ 22,712$ 119,237$ 0.14 0.18
242A Solar House Storage I 199 2010 71,123$ -$ -$ -$ -$ -$ - - 242B Solar House Garage 1,055 2010 94,822$ -$ -$ -$ 39,158$ 39,158$ - 0.41 242D Solar House Storage II 211 2007 15,618$ -$ -$ -$ -$ -$ - - 246A AIR RESOURCES RESEARCH 3,450 2013 787,972$ -$ -$ -$ -$ -$ - - 250A Varsity Research Building 54,745 2011 14,066,582$ 1,013,548$ -$ 1,013,548$ -$ 1,013,548$ 0.07 0.07 300A CVM Research Building 100,020 2012 45,688,664$ 2,134,591$ -$ 2,134,591$ -$ 2,134,591$ 0.05 0.05 300C Terry Veterinary Hospital 129,525 2011 64,598,418$ -$ -$ -$ -$ -$ - - 301 CVM / Main Vet School 312,413 2008 132,137,763$ 4,496,242$ 244,526$ 4,740,768$ 403,967$ 5,144,735$ 0.04 0.04 302 CVM Power Plant (CVM-PP) 15,504 2012 6,763,971$ 109,403$ 109,635$ 219,039$ 73,403$ 292,442$ 0.03 0.04 303 Vet School West Barn 13,248 2008 1,681,007$ -$ 219,777$ 219,777$ -$ 219,777$ 0.13 0.13 304 Vet School East Barn 11,880 2008 1,507,424$ 44,971$ 122,410$ 167,381$ -$ 167,381$ 0.11 0.11 305 TEACHING ANIMAL UNIT - CVM 5,487 2013 1,566,522$ -$ 90,034$ 90,034$ -$ 90,034$ 0.06 0.06 306 GROUNDS SHOP - CVM 3,880 2013 348,729$ -$ 33,529$ 33,529$ -$ 33,529$ 0.10 0.10 307 Vet School Unit 1 (Finger Barn 1) 5,690 2008 1,299,583$ 148,419$ 57,511$ 205,931$ 27,047$ 232,977$ 0.16 0.18

NORTH CAROLINA STATE UNIVERSITY
2012-2013 FCAP Annual Report 21
Bldg. Num. Building Name GrossSF Assessed CRV for 2013
Reporting Capital Renewal
CRDeferred Maint.
DMDeferred Maint.
CR+DMPlant Adapt.
PA
2012-2013 Total Maintenance Backlog Costs
FCICR+DM
CRV
FCQICR+DM+PA
CRV308 Vet School Unit 2 (Finger Barn 2) 7,076 2008 1,616,142$ 241,817$ -$ $ 241,817 44,067$ 285,884$ 0.15 0.18 309 Vet School Unit 3 (Finger Barn 3) 6,986 2008 1,595,586$ 306,339$ -$ $ 306,339 55,825$ 362,163$ 0.19 0.23 310 Vet School Unit 4 (Finger Barn 4) 6,966 2008 1,591,018$ 317,684$ -$ $ 317,684 57,892$ 375,577$ 0.20 0.24 311 Vet School Unit 5 (Finger Barn 5) 6,382 2008 1,457,634$ 281,255$ 8,037$ $ 289,292 51,254$ 340,546$ 0.20 0.23 312 Ruminant Shelter 1,773 2011 159,354$ -$ 6,081$ $ 6,081 -$ 6,081$ 0.04 0.04 314 TAU Poultry House CVM 6,442 2013 578,998$ -$ 4,815$ $ 4,815 -$ 4,815$ 0.01 0.01 315 Vet School Milking Parlor 1,249 2008 330,172$ 20,060$ 108,278$ $ 128,338 13,895$ 142,233$ 0.39 0.43
317A 1528 BLUE RIDGE ROAD(1500) - CVM 14,577 2013 3,329,352$ 469,464$ 267,524$ 736,988$ 122,257$ 859,244$ 0.22 0.26 320 GESTATION BREEDING HOUSE - CVM 1,872 2012 168,253$ -$ 29,012$ $ 29,012 -$ 29,012$ 0.17 0.17 321 TAU FINISHING HOUSE - CVM 1,368 2012 122,954$ 3,855$ 22,892$ $ 26,747 -$ 26,747$ 0.22 0.22 322 FARROWING HOUSE CVM 990 2012 88,980$ -$ 14,760$ $ 14,760 -$ 14,760$ 0.17 0.17 323 CVM CHEMICAL STORAGE BUILDING 726 2012 65,252$ -$ 6,487$ $ 6,487 -$ 6,487$ 0.10 0.10 330 CVM CHEMICAL STORAGE BUILDING 180 2012 47,420$ -$ 2,143$ $ 2,143 -$ 2,143$ 0.05 0.05
338A EQUINE ISOLATION STALLS - CVM 933 2012 443,743$ -$ 2,596$ 2,596$ -$ 2,596$ 0.01 0.01 340 Canine Facility III 1,696 2013 387,363$ -$ 55,356$ $ 55,356 -$ 55,356$ 0.14 0.14 341 Freshwater Fish House CVM 2,169 2013 194,947$ -$ 22,474$ $ 22,474 -$ 22,474$ 0.12 0.12 342 PIG HOUSE CVM 1,080 2012 97,069$ -$ 10,385$ $ 10,385 -$ 10,385$ 0.11 0.11 343 POULTRY HOUSE CVM 980 2012 88,081$ 5,642$ 10,637$ $ 16,279 -$ 16,279$ 0.18 0.18 344 FISH HOUSE CVM 800 2012 71,903$ 4,606$ 12,284$ $ 16,890 -$ 16,890$ 0.23 0.23
345A CANINE FACILITY I CVM 1,030 2012 92,576$ -$ 12,234$ 12,234$ -$ 12,234$ 0.13 0.13 345B CANINE FACILITY II CVM 778 2012 98,718$ 5,095$ 8,001$ 13,097$ -$ 13,097$ 0.13 0.13 346 OYSTER RES FAC CVM 1,554 2012 354,930$ 7,237$ 7,127$ $ 14,365 -$ 14,365$ 0.04 0.04 347 ALUMINUM STORAGE BLDG - CVM 168 2012 40,743$ -$ 1,039$ $ 1,039 -$ 1,039$ 0.03 0.03 405 QUONSET HUT UFL 45 502 2012 45,119$ -$ 23,756$ $ 23,756 -$ 23,756$ 0.53 0.53 406 WELL PUMP HSE UFL 46 131 2012 9,697$ -$ 3,408$ $ 3,408 -$ 3,408$ 0.35 0.35 407 WALK-IN COOLER UFL 47 287 2012 36,417$ -$ 12,767$ $ 12,767 -$ 12,767$ 0.35 0.35 408 EQUIP SHED UFL 48 1,148 2012 103,180$ -$ 16,942$ $ 16,942 -$ 16,942$ 0.16 0.16 409 WELL HOUSE UFL 49 27 2012 2,427$ -$ 513$ $ 513 -$ 513$ 0.21 0.21 410 ARBORETUM RESTROOMS 169 2012 62,723$ -$ 1,039$ $ 1,039 974$ 2,012$ 0.02 0.03 411 GREENHOUSE UFL 411 899 2012 141,955$ 4,608$ 7,644$ $ 12,252 -$ 12,252$ 0.09 0.09 412 GREENHOUSE UFL 412 908 2012 144,335$ -$ 17,648$ $ 17,648 -$ 17,648$ 0.12 0.12 413 GREENHOUSE UFL 413 899 2012 141,955$ -$ 12,654$ $ 12,654 -$ 12,654$ 0.09 0.09 414 GREENHOUSE UFL 414 899 2012 141,955$ -$ 19,242$ $ 19,242 -$ 19,242$ 0.14 0.14 415 GREENHOUSE UFL 415 899 2012 141,955$ -$ 13,753$ $ 13,753 -$ 13,753$ 0.10 0.10 416 GREENHOUSE UFL 416 899 2012 141,955$ -$ 12,513$ $ 12,513 -$ 12,513$ 0.09 0.09 417 GREENHOUSE UFL 417 899 2012 142,589$ 2,242$ 14,885$ $ 17,127 -$ 17,127$ 0.12 0.12 418 GREENHOUSE UFL 418 899 2012 141,955$ -$ 18,650$ $ 18,650 -$ 18,650$ 0.13 0.13 420 GREENHOUSE UFL 420 426 2012 68,996$ -$ 3,210$ $ 3,210 -$ 3,210$ 0.05 0.05 421 GREENHOUSE UFL 421 426 2012 68,996$ 649$ 10,457$ $ 11,106 -$ 11,106$ 0.16 0.16 422 GREENHOUSE UFL 422 426 2012 68,996$ 649$ 14,306$ $ 14,955 -$ 14,955$ 0.22 0.22 423 GREENHOUSE UFL 423 426 2012 68,996$ 1,298$ 10,187$ $ 11,485 -$ 11,485$ 0.17 0.17 424 GREENHOUSE UFL 424 426 2012 68,996$ 1,298$ 12,894$ $ 14,192 -$ 14,192$ 0.21 0.21 430 GREENHOUSE UFL 430 2,225 2012 338,646$ 9,217$ -$ $ 9,217 -$ 9,217$ 0.03 0.03 431 GREENHOUSE UFL 431 1,488 2012 234,583$ -$ 14,765$ $ 14,765 -$ 14,765$ 0.06 0.06 432 GREENHOUSE UFL 432 2,225 2012 348,941$ -$ 13,971$ $ 13,971 -$ 13,971$ 0.04 0.04 433 GREENHOUSE UFL 433 2,217 2012 355,285$ -$ 6,379$ $ 6,379 -$ 6,379$ 0.02 0.02 434 GREENHOUSE UFL 434 1,196 2012 189,697$ 3,319$ 5,840$ $ 9,159 -$ 9,159$ 0.05 0.05 435 GREENHOUSE # 435 2,880 2012 456,795$ -$ 4,459$ $ 4,459 -$ 4,459$ 0.01 0.01 436 POTTING HOUSE UFL 436 1,500 2012 146,323$ 3,894$ -$ $ 3,894 -$ 3,894$ 0.03 0.03 439 HORTICULTURE STORAGE UFL 439 2,016 2012 181,195$ -$ 1,947$ $ 1,947 6,176$ 8,123$ 0.01 0.04 441 HORTICULTURE SHED UFL 441 5,040 2012 452,988$ -$ 3,894$ $ 3,894 -$ 3,894$ 0.01 0.01
442A Horticulture Building at Arboretum 1,307 2008 174,134$ -$ 5,387$ 5,387$ -$ 5,387$ 0.03 0.03 444 HORTICULTURE HEADHOUSE 6,235 2012 1,602,067$ 38,544$ 30,326$ $ 68,870 -$ 68,870$ 0.04 0.04
444A HORTICULTURE GREENHOUSE A 10,000 2012 2,283,976$ 15,048$ 37,592$ 52,640$ -$ 52,640$ 0.02 0.02 444B HORTICULTURE GREENHOUSE B 10,000 2012 2,283,976$ -$ 13,501$ 13,501$ -$ 13,501$ 0.01 0.01 446 RUBY MCSWAIN EDUCATION CTR 7,216 2013 3,937,156$ 27,344$ 8,200$ 35,544$ -$ 35,544$ 0.01 0.01
446A ARBORETUM-SUPPORT OFFICE BLDG 2,100 2012 539,589$ 3,894$ 5,193$ 9,087$ -$ 9,087$ 0.02 0.02 446B BOBBY G. WILDER VISITOR CENTER 1,510 2013 602,946$ -$ 4,920$ 4,920$ -$ 4,920$ 0.01 0.01 446C ARBORETUM-HFL SUPPORT BLDG 1,792 2012 409,289$ -$ 7,075$ 7,075$ -$ 7,075$ 0.02 0.02 446D JC RAULSTON ARBORETUM LATH HOUSE 6,557 2010 263,468$ -$ -$ -$ -$ -$ - -

NORTH CAROLINA STATE UNIVERSITY
2012-2013 FCAP Annual Report 22
Bldg. Num. Building Name GrossSF Assessed CRV for 2013
Reporting Capital Renewal
CRDeferred Maint.
DMDeferred Maint.
CR+DMPlant Adapt.
PA
2012-2013 Total Maintenance Backlog Costs
FCICR+DM
CRV
FCQICR+DM+PA
CRV449A 516 BRICKHAVEN DRIVE 16,789 2013 3,834,568$ 229,629$ 206,836$ 436,465$ 40,788$ 477,252$ 0.11 0.12 449B 512 BRICKHAVEN DRIVE 30,902 2013 7,057,944$ 422,657$ 380,705$ 803,362$ 75,074$ 878,436$ 0.11 0.12 449C 520 BRICKHAVEN DRIVE 6,164 2013 1,407,843$ -$ 441,184$ 441,184$ 238,513$ 679,697$ 0.31 0.48 449D 520 BRICKHAVEN METAL SHED 40x75 3,000 2013 222,053$ -$ 15,123$ 15,123$ -$ 15,123$ 0.07 0.07 449E 520 BRICKHAVEN STORAGE SHED 16x65 1,040 2013 93,473$ -$ 2,413$ 2,413$ -$ 2,413$ 0.03 0.03 450 GREENHOUSE UFL 450 336 2012 53,293$ -$ 8,065$ $ 8,065 -$ 8,065$ 0.15 0.15 451 GREENHOUSE UFL 451 336 2012 53,293$ -$ 18,394$ $ 18,394 -$ 18,394$ 0.35 0.35 452 GREENHOUSE UFL 452 336 2012 53,293$ -$ 18,394$ $ 18,394 -$ 18,394$ 0.35 0.35 453 GREENHOUSE UFL 453 336 2012 53,293$ -$ 12,799$ $ 12,799 -$ 12,799$ 0.24 0.24 454 GREENHOUSE UFL 454 336 2012 53,293$ -$ 6,141$ $ 6,141 -$ 6,141$ 0.12 0.12 457 GREENHOUSE UFL 457 1,793 2012 284,387$ -$ 2,309$ $ 2,309 -$ 2,309$ 0.01 0.01 458 WALK-IN COOLER UFL 458 286 2012 34,404$ -$ 10,645$ $ 10,645 -$ 10,645$ 0.31 0.31 459 POTTING SHED UFL 459 576 2012 42,635$ -$ 584$ $ 584 -$ 584$ 0.01 0.01 460 PLANT PATHOLOGY EQUIP SHED 523 2012 38,711$ -$ 5,410$ $ 5,410 -$ 5,410$ 0.14 0.14 461 GREENHOUSE CONTROL ROOM 49 2012 5,181$ -$ 2,726$ $ 2,726 -$ 2,726$ 0.53 0.53 462 LAKE PUMP HOUSE 59 2012 4,368$ -$ 1,298$ $ 1,298 -$ 1,298$ 0.30 0.30 463 E/WELL PUMPHOUSE UFL 463 137 2012 10,141$ -$ 2,596$ $ 2,596 -$ 2,596$ 0.26 0.26 492 HORTICULTURE STORAGE TRAILER 179 2012 40,883$ -$ 5,257$ $ 5,257 -$ 5,257$ 0.13 0.13 494 UTILITY BLDG UFL 494 53 2012 5,752$ -$ -$ $ - -$ -$ - - 496 UTILITY BLDG UFL 496 120 2012 10,785$ -$ 286$ $ 286 -$ 286$ 0.03 0.03 497 UTILITY BLDG UFL 497 40 2012 3,595$ -$ 649$ $ 649 -$ 649$ 0.18 0.18 498 UTILITY BLDG UFL 498 240 2012 21,571$ -$ 1,428$ $ 1,428 -$ 1,428$ 0.07 0.07 499 UTILITY BLDG UFL 499 98 2012 8,808$ -$ 1,947$ $ 1,947 -$ 1,947$ 0.22 0.22 632 POULTRY HOUSE UFL 632 2,560 2013 230,089$ -$ 33,047$ $ 33,047 -$ 33,047$ 0.14 0.14 633 POULTRY HOUSE UFL 633 2,560 2013 230,089$ -$ 7,242$ $ 7,242 -$ 7,242$ 0.03 0.03 636 POULTRY BLDG UFL 636 2,295 2013 206,271$ -$ 6,298$ $ 6,298 -$ 6,298$ 0.03 0.03 637 POULTRY BLDG UFL 637 10,572 2013 950,198$ -$ 78,860$ $ 78,860 1,492$ 80,352$ 0.08 0.08 640 AQUA DEMO BLDG UFL 640 2,253 2013 1,029,160$ -$ 2,329$ 2,329$ -$ 2,329$ 0.00 0.00 641 GREENHOUSE UFL 641 160 2013 77,825$ -$ 14,364$ $ 14,364 -$ 14,364$ 0.18 0.18 700 College Of Textiles 307,163 2010 109,780,059$ 9,634,361$ 6,771,359$ $ 16,405,720 210,393$ 16,616,113$ 0.15 0.15
705A Centennial Campus Central Utility Plant 44,978 2009 27,013,841$ 202,100$ -$ 202,100$ -$ 202,100$ 0.01 0.01 710 Partners II 63,760 2012 29,125,267$ 751,057$ 43,317$ $ 794,374 -$ 794,374$ 0.03 0.03 712 Toxicology Building 61,177 2008 27,945,364$ 169,731$ -$ $ 169,731 -$ 169,731$ 0.01 0.01 713 Partners III 82,988 2012 37,908,527$ 1,617$ 4,907$ $ 6,524 7,257$ 13,781$ 0.00 0.00 717 CENTENNIAL CAMPUS INFO BOOTH 210 2013 114,358$ 3,269$ 5,280$ $ 8,549 -$ 8,549$ 0.07 0.07
720A Monteith Engineering Research Center 136,507 2011 62,355,753$ 4,685,512$ 672,663$ 5,358,175$ 80,064$ 5,438,238$ 0.09 0.09 720C EGRC Constructed Facilities Lab 31,265 2008 13,223,800$ 74,211$ 136,999$ 211,210$ 8,670$ 219,880$ 0.02 0.02 720D STRUCTURES STORAGE BLDG 186 2013 42,482$ -$ 1,800$ 1,800$ -$ 1,800$ 0.04 0.04 730 Research I 41,254 2010 17,448,734$ 1,070,758$ 4,566,619$ $ 5,637,377 182,689$ 5,820,067$ 0.32 0.33 731 Research II 46,307 2010 19,585,943$ 1,821,887$ 3,676,724$ $ 5,498,611 61,523$ 5,560,134$ 0.28 0.28 733 Research III 25,326 2010 9,051,513$ 1,435,674$ 206,574$ $ 1,642,248 32,807$ 1,675,055$ 0.18 0.19 734 Research IV 81,030 2010 28,960,122$ 5,299,762$ 51,787$ $ 5,351,548 62,166$ 5,413,715$ 0.18 0.19
755A SPRING HILL HOUSE 3,351 2013 875,204$ 42,412$ 114,615$ 157,027$ 23,635$ 180,662$ 0.18 0.21 755B SPRING HILL STORAGE 120 2013 8,882$ -$ 7,500$ 7,500$ -$ 7,500$ 0.84 0.84 761 PUMP HOUSE CENT CAMPUS 534 2013 47,995$ 2,874$ 2,589$ 5,463$ 511$ 5,974$ 0.11 0.12
762A BTEC 89,308 2008 39,591,880$ -$ -$ -$ -$ -$ - - 775 Partners I 86,874 2010 31,048,769$ 6,526,506$ 491,812$ $ 7,018,318 633,715$ 7,652,033$ 0.23 0.25
782A EB 1 158,849 2011 56,772,634$ 1,737,088$ 20,152$ 1,757,240$ 3,894$ 1,761,135$ 0.03 0.03 782B EB II 231,049 2011 81,168,759$ 661,407$ -$ 661,407$ -$ 661,407$ 0.01 0.01 782C EB III 253,859 2010 88,052,416$ -$ -$ -$ -$ -$ - - 783A JAMES B HUNT Jr LIBRARY 253,028 2013 88,812,828$ -$ -$ -$ -$ -$ - - 786A Dorothy and Roy Park Alumni Center 58,313 2006 21,004,121$ 1,434,926$ -$ 1,434,926$ -$ 1,434,926$ 0.07 0.07 791 LANDSCAPE SERVICES STOR UNIT 96 2013 8,628$ 2,000$ -$ $ 2,000 -$ 2,000$ 0.23 0.23
792B FRIDAY INSTITUTE 36,986 2013 9,503,455$ 569,103$ 512,616$ 1,081,719$ 101,087$ 1,182,805$ 0.11 0.12
292 8,061,365 2,916,140,145$ 174,629,583$ 157,296,402$ 331,925,986$ 31,018,446$ 362,944,432$ 0.11 0.12

NORTH CAROLINA STATE UNIVERSITY
2012-2013 FCAP Annual Report 23
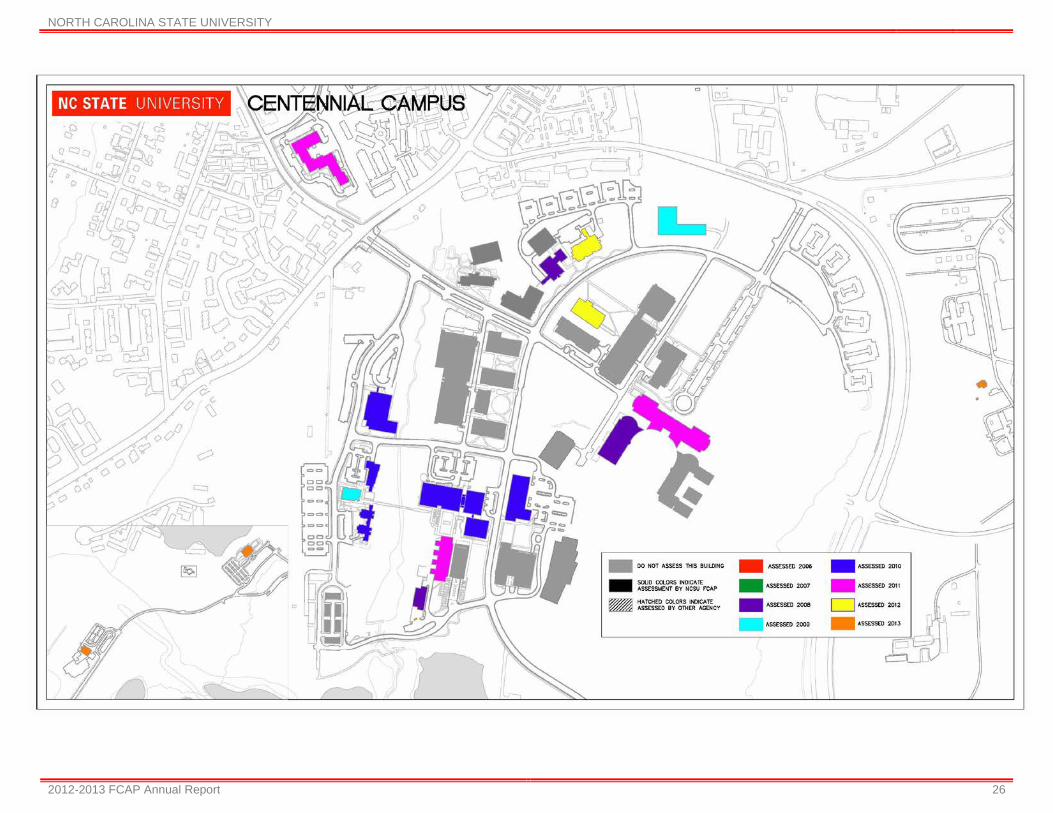
Assessment Status Maps

NORTH CAROLINA STATE UNIVERSITY
2012-2013 FCAP Annual Report 24

NORTH CAROLINA STATE UNIVERSITY
2012-2013 FCAP Annual Report 25
NORTH CAROLINA STATE UNIVERSITY
2012-2013 FCAP Annual Report 26

NORTH CAROLINA STATE UNIVERSITY
2012-2013 FCAP Annual Report 27
This page is intentionally left blank.

Related Documents