E.ON – Cleaner & better energy Global Unit Generation

Welcome message from author
This document is posted to help you gain knowledge. Please leave a comment to let me know what you think about it! Share it to your friends and learn new things together.
Transcript

E.ON – Cleaner & better energy Global Unit Generation

2
Sustainable performanceculture
Selective efficiency programs
Focus on competitive businesses
Integrated across value chain
Competence-based Capital intensive
Targeted expansion outside Europe
Eurocentric
ToFrom
EuropeFocused & synergisticpositioning
OutsideEurope
Targetedexpansion
PerformanceEfficiency &
effective organization
Cleaner & better energy
InvestmentLess capital,more value
E.ON strategy
Transform European utility into global, specialized energy solutions provider

3
E.ON Group strategic priorities
Markets require intensified self-help measures
Performance
Intensify cost & quality management
Simplify structures
Execute portfolio measures
Create balance sheet flexibility
Capture growth in renewables & decentralized energies
Exploit opportunities in new markets
Growth
Challenging markets
Political interventions
Europe: System transformation
Outside Europe: Growth & new technologies

4
2011E Adjusted EBITDA €bn 9.1 – 9.31
Adjusted EPS €/share 1.2 – 1.31
2013E Adjusted EBITDA €bn 11.6 – 12.32
Adjusted EPS €/share 1.7 – 2.02
2015E Adjusted EBITDA €bn 12.5 - 13.03
Adjusted EPS €/share 2.0 – 2.33
Results
Dividend payout policy % adj. net income 50 – 60
2011E €/share 1.0
2012E €/share 1.1
2013E €/share ≥1.1
Dividends
Rating target Solid single A
Medium-term debt factor <3x
Investments 2011-13 €bn ~19
Total disposals until 2013 €bn ~15
Other
Transparent financial targets for coming yearsAssumed 2015 debt factor allows ~€6bn of additional growth CAPEX
1. 2011 post €0.5bn effect of achieved disposals (€9.1bn) 2. 2013 post €0.9bn effect of achieved disposals (€9.1bn) 3. 2015 post ~€1.7bn effect of total disposals (€~15bn)
E.ON Group key financial targets

5
Global Unit Gas within E.ON’s structure
Leaner and more market oriented organization
Generation RenewablesSupport functions
TradingOther EU countries
Germany Russia
Group Management
Gas
Nuclear
Steam
CCGTs
Other/Consolidation

6
Position portfolio for the future and get the most out of the existing asset base
Generation – Executive summary
Share of renewables generation to increase from ~21% in 2010 to ~36% in 2020, broadly in line with EU targets
Power markets well supplied in coming years, making for challenging environment for conventional generation
Volatility in delivery markets to rise due to expanding share of intermittent renewables
Continue expansion in renewables: >40% growth of installed capacity until 2013
Only very selective investments in conventional generation, such as 300 MW Waldeck 2+ extension
Keep options open for development of carbon-free alternatives to renewables, such as nuclear & CCS
Extend E.ON’s fleet approach as key competitive advantage
Enhance flexibility to capitalize on higher volatility in delivery markets
Tap alternative value pools, such as intraday markets
Decommission plants if economics not adequate
Position portfolio for the future
Get the most out of the existing asset base
Market environment

7
Generation - Financials and outlook
Intensified self-help measures to face challenging environment
2010A 2011E 2013E
€3.7bn
€1.9–2.2bn
Three major changes in the coming years
Nuclear exit and nuclear tax
CO2 auctioning
Lower spreads
Outlook 2011 compared to 2010
Nuclear tax ~ -€0.6bn
Nuclear exit
Nuclear one-off costs ~ -€1.5bn
Higher transfer prices and spreads
Target 2013 compared to 2010
Nuclear tax ~ -€0.7-0.8bn
Nuclear exit
CO2 auctioning: ~ -€0.9bn
Lower spreads
Financials and outlookEarnings drivers
Generation – FY 2010 financials
2.83.714.7Generation
1.01.79.6Fossil
1.82.05.1Nuclear
Adj. EBITAdj. EBITDASales€bn

Discussion material

9
Market environment
Strategic focus
Generation
Fleet approach

10
Power demand forecast
0,2 0,2 1,21,00,2 0,4
Germany France Nordic UK Italy Spain
2004 2006 2008 2010 2012 2014 2016 2018 2020
600
500
400
300
0
350 Italy
Nordic
Spain
UK
France
Germany
450
550
Total gross demand [TWh]
2010-2020 CAGR [%]
Only limited demand growth assumed until 2020 in main European countries
2000-2010 demand growth in EU: +1.1%
2010-2020 demand growth in EU: +0.7%
Future demand development reduced due to:
Persisting financial constraints
Various policies to improve energy efficiency
Potentially offset thanks to:
Recovery following the crisis and consequent demand drop in 2009
Tendency of electrification, such as e-heating and e-mobility
Market environment

11
0
300
600
900
1.200
2010 2020
Hydro Biomass Solar Wind
Expansion of renewable generation
1. Share of renewables in total power generation
36%1 Commitments of all European governments reflected in ambitious National Renewable Energy Action Plans
Frequent changes to subsidies schemes due to political will to reduce total costs of system
Interventions partially related to pressure from national budget deficits
Subsidy cuts also reflecting significant learning curve and consequent cost reduction in renewables business
21%1
Expectedbandwidth
European renewable generation expected grow from 21% today to 36% in 2020
European renewable generation [TWh]
Market environment

12
-5
5
15
25
35
2011 2012 2013 2014 2015 2016 2017 2018 2019 2020
Capacity situation
Immediate shutdown of ~8 GW of German nuclear capacity is not so significant compared to truly relevant market (Germany+France+Benelux)
Approx 20 GW of conventional new-builds initiated before economic crisis online by 2014
Continuous build-up of renewables undermines load of conventional plants, especially older ones
Economic and environmental pressures will push older conventional capacity into retirement
Spreads could benefit from larger amount of retirement, but will stay below new entry levels in most markets except UK
Reserve margins of European power markets
ItalyUKSpainNordicGermany
%
Germany + France + Benelux
Current healthy reserve margin will decrease after 2015
Market environment

13
Power price volatility
Volatility in forward markets
Volatility of forward spreads mainly driven by the balance between supply and demand
Current oversupply of thermal capacity together with strong growth of renewables reduces volatility of forward spreads
Volatility in delivery markets
Rising share of intermittent renewables will lead to higher price volatility in the delivery markets (day ahead, intraday and balancing markets)
Hydro pumping storage and fossil generation flexibility to capture value from unpredictability of intermittent renewables in the delivery markets
Increasing volatility in delivery market prices due to growth of renewables
Market environment
PV & Wind largely impacting German power market
Highly dispatchable reserve capacities necessary to ensure constant balance between supply and demand of the electricity system
0
2.500
5.000
7.500
10.000
12.500
1 Jul 11 2 Jul 11 3 Jul 11 4 Jul 11 5 Jul 11 6 Jul 11 7 Jul 11
Wind Solar Sources: E.ON Energy Trading, EEX
Germany – Actual production – MWh/h
12 GW of infeed
lost in 12h
14
Market environment
Strategic focus
Generation
Fleet approach

15
Strategy
Portfolio development Managing the existing asset base
Position portfolio for the future and get the most out of the existing asset base
Strategy
Growth investments concentrated onrenewables
Selective opportunities in conventional generation
Opportunities from integration of renewables, such as hydro pumping
storage
Investigate low carbon options such as nuclear and CCS
Enhance flexibility ofexisting assets
Improve competitivenessof assets via fleet approach
Capture full value fromasset optimization
Decommissionnon-economic plants

16
Expansion in renewables generation
90
80 440
90
240
450
200
300
Continued growth in onshore wind with clear steps towards industrialization; significant size increase in wind farms (Ø 15 to 93 MW) and wind turbines (Ø 1.2 to 2.7 MW) already from 2007 to 2010
O&M strategy: Bringing a utility mind-set to a rapidly maturing industry, e.g. condition monitoring
Focus on offshore wind development with cost reduction target of 40% by 2015 (based on 2010 levels)
At YE2010, EC&R is No. 3 in global offshore wind
EC&R installed 40% of Europe’s new offshore capacity in 2010
Biomass, especially conversion of coal-fired power plants using synergies between different businesses (conventional & renewable generation, trading)
Engagement in solar (PV, CSP) – also with industrial approach in PV and focus on flexibility in CSP
European renewables portfolio
Installedcapacityin MW*
Technologically focused extension of renewable generation
2008A 2010A 2013E
Wind on-shore Wind off-shore Other
1.1 GW1.8 GW
Strategy: portfolio development

17
Selective opportunities in conventional generation
Example: Trapani refurbishment
Refurbishment of 2 existing gas turbines essential for grid stability
Regulated contract with TSO provides guaranteed return above hurdle rate
Commercial operation scheduled on December 2012 and May 2013.
Broad portfolio offer better opportunities for selective investments in conventional generation
Investments in new conventional generation oriented to catch existing niche opportunities in the market
Selective lifetime extension (LTE) projects, where LTE plants as alternative to new build OCGT and/or site conditions very attractive:
Limited capex for 5-10 years longer life time
favourable grid location to capture significant revenues from ancilliary services
Broad and relevant presence in all the main generation markets with:
Unique access to market opportunities
Reputation as reliable counterpart in the main political and regulatory tables
Strategy: portfolio development

18
Opportunities from integration of renewables
E.ON well positioned to seize opportunities from integration of renewables
Extension of Waldeck plant with the new build of a 300 MW PHS plant
Utilization of existing infrastructure, (e.g. basins, access gallery, control room, workshops and 380 kV grid-connection)
Synergies due to sharing of employees at PSP Waldeck 2
Focus on brownfield opportunities
Catch the system needs for flexible capacity to cope with growing intermittent production of renewables
Take advantage from strong technical, operational and market optimization capabilities
Exploit the asset portfolio to deliver projects with significant profitability
Lower CAPEX and lower OPEX from brown-field synergies
Example: Pump storage plant Waldeck 2+
Strategy: portfolio development

19
Enhance flexibility of existing generation portfolio
OstigliaMinimumtime aftershutdown
Staudinger 5Minimum
load
Waldeck 1Minimum
load
Coal
Hydro
50%reduction
Technology Power Plantexample
Parameter Outcome
CCGT
Examples of improvement measures
Higher flexibility of portfolio to tap added value of increasing volatility of power prices in delivery markets
Measures include improvements of certain power plant characteristics:
- Minimum load
- Start time
- Start reliability
- Power gradient
- Etc.
25%reduction
90%reduction
Higher flexibility substantially enhances competitiveness of generation portfolio
Strategy: managing existing base

20
Fleet concept
Fleet concept key to keep and extend E.ON’s competitive edge
Example: E.ON’s CCGT fleet
Conventional Generation in Europe challenged by lower margins and increasing competition
Key to maintain or recover profitability in such an environment is to gain and/or extend competitive edge
Competitive advantage by strengthening synergies and sharing best practices in all markets and across all technologies in which E.ON operates
E.ON organization with Global Unit Generation strongly focused to achieve target
Global Unit Generation steers 4 functional, technology-driven fleets: Nuclear, CCGTs, Steam and Hydro
Vision and mission
Strategy: managing existing base

21
Market
Balancing group
Pipeline or cable
Gas Power
Excess Missingcommodity
Capture full value from asset optimizationIllustration for two different commodities in four countries
Prerequisite
Access to gas and power transportation capacity, to gas long term allocation and power intraday allocation
24/7 power, gas & scheduling teams managing assets in different regulatory regimes & markets
Action
Decrease power output in one country (or in case of outage) and substitute with power at lower cost from a different market or portfolio
Sell excess gas (incl. transport to liquid intraday market) or store it
Choose the optimal “market/value channel”: imbalance market, intraday wholesale market, asset portfolio, storage
Value
Cross-regional / cross commodity arbitrage
Reduction of penalty costs for system imbalance
Optimization: Making most of assets and marketsInvolved assets, transport capacity and markets
Reaping the value of asset base via cross-regional and cross-commodity arbitrage
NBPgas
market long termBooked capacity
-+
-+
Strategy: managing existing base
Germany: powerplant portfolio
Emile Huchet: 860 MW CCGT
Intradaybookedcapacity
22
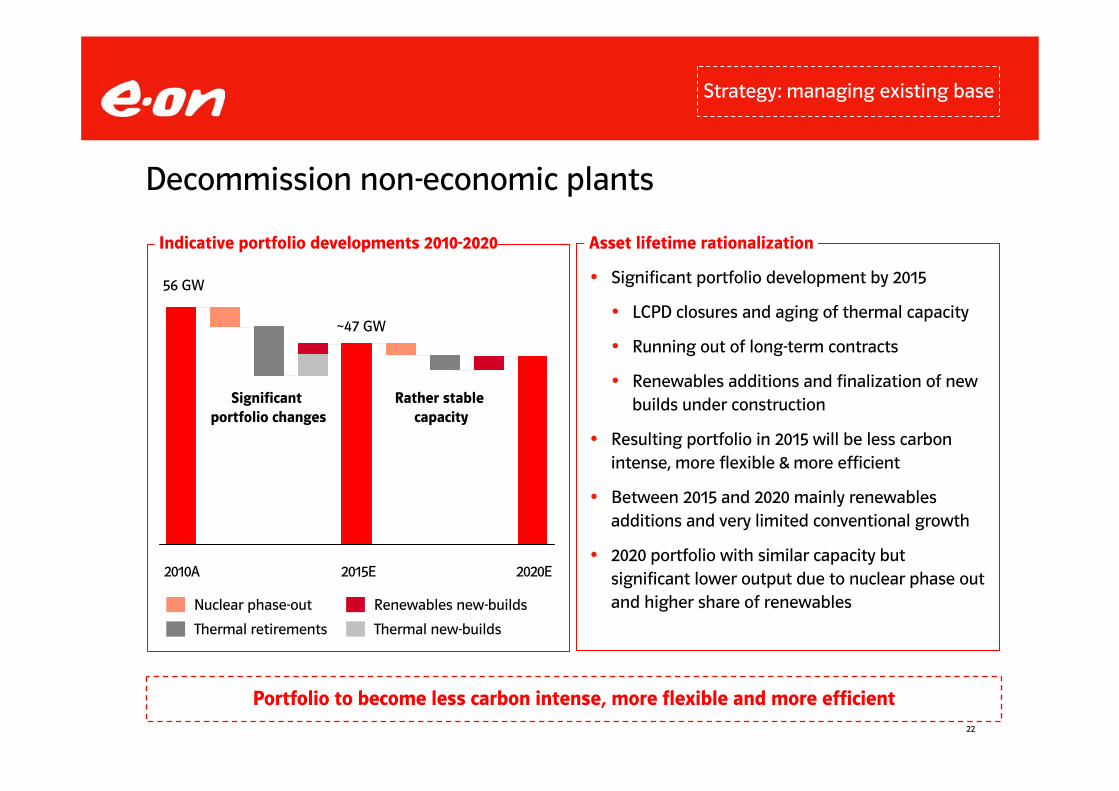
Decommission non-economic plants
Significant portfolio development by 2015
LCPD closures and aging of thermal capacity
Running out of long-term contracts
Renewables additions and finalization of new builds under construction
Resulting portfolio in 2015 will be less carbon intense, more flexible & more efficient
Between 2015 and 2020 mainly renewablesadditions and very limited conventional growth
2020 portfolio with similar capacity but significant lower output due to nuclear phase out and higher share of renewables
Asset lifetime rationalization
Renewables new-builds
Thermal new-buildsThermal retirements
Nuclear phase-out
Significant portfolio changes
Rather stable capacity
Portfolio to become less carbon intense, more flexible and more efficient
Strategy: managing existing base
Indicative portfolio developments 2010-2020
2010A 2015E 2020E
56 GW
~47 GW

23
Market environment
Strategic focus
Generation
Fleet approach

24
Benefits of fleet approach vs. independent plant operator
Functional fleet management provides substantial competitive advantages
Large fleet operator Independent plant operator
Is limited to on-site and OEM expertise to solve technical issues
Shared engineering resources allow to address technical problems more rapidly and efficiently
With single asset, difficult to manage risks when straying away from OEM’s parameters
Risk management: engineering knowledge allows to stretch technical parameters without taking undue risks
Little knowledge outside single asset drastically limit potential for applying best practices
Wide variety of assets and know-how multiplies opportunities for sharing best practices
Unlikely with single plant to have required expertise to optimize fuel procurement
Deep commercial and technical expertise harnessed to optimize fuel procurement
No ways to benefit from scale: has to hold the complete set of spare parts locally; has to remain with expensive OEM parts arrangements; etc.
Few possibilities to prioritize projects with only single asset
Many possibilities to leverage scale benefits: getting better terms for maintenance agree-ments or equipment purchases, sharing spare parts inventories, lowering costs by using 3rd
party components, etc.
Project prioritization among large asset base allows to select most profitable projects
Fleet approach

25
All major risks for each individual assets identified and scored using in-house ranking software
Mitigation strategies for each risk defined and mitigation costs quantified
Transparency provided over risks across entire generation fleets
Optimization of fund allocation to reduce the most critical risks and to add most value to the entire generation portfolio
Large scale savings anticipated in the forthcoming years
Immediate benefits on existing projects where risks can be revaluated in light of new information and from learnings from other projects;
Example: €21m saved on Maasvlakte 1 & 2 following investment review
Project prioritization
Better project prioritization deliver large-scale savings in capex and opex
Generation-wide risk ranking and optimization Impact on capex and opex
1,000
1,100
1,200
2011 2012
Capex€m
1,000
1,500
2,000
2,500
2011 2012
Opex€m
Beforeprojectprioritization
Afterprojectprioritization
Fleet approach

26
Major project in Northern Sweden, started before creation of hydro fleet
Enhancement of Storfinnforsen which is the biggest concrete dam in Sweden at 800m long and 40m high
Enhancement of Ramsele, a smaller dam of similar construction type
By tapping the broader experience and expertise available in thefleet, the programme has see many adjustments and improvements
Specifically, thanks to German expertise, the repair technique was changed from conventional concrete coating to an innovative solution using a membrane sealing technique
Up to €20m of cost savings from using this innovative solution on the two Swedish projects
Other similar projects to benefit in the future as well
Sharing best practices
Large asset base enhances opportunities for sharing best practices
Example: dam safety enhancement in Sweden
Storfinnforsen dam
Ramsele dam
Fleet approach

27
Burning coal and cleaning flue gas creates two key residues: ash and gypsum
Both residues can either be sent to a waste dispo-sal facility or used in the construction industry
Every tonne of by-product sold is “win-win”: gene-rates revenues and saves on waste disposal costs
E.ON moving towards a pan European approach to by-product management:
~€1m per year benefit following intervention by German experts which resulted in the sale of gypsum from Los Barios (Spain) to a UK plasterboard manufacturer
Fiume Santo (Italy) working with internal experts to change ash removal strategy - trials underway
Leveraging scale benefits
Leveraging scale benefits in all aspects of the business
Example: boiler residue – gypsum and ash
More than 70% of maintenance costs for a CCGT relate to the gas turbine
Long Term Service Agreements with gas turbine OEMs typically costs ~€20m per year per site
Moving away from plant-specific contract towards fleet-wide agreement with OEM focused on self-managed maintenance program
Negotiations with OEMs concerning 20 CCGT installations in Europe
>€200M of savings over 20 years
Only achievable thanks to experience and engineering knowledge accumulated across large fleet
Example: CCGT O&M contracts
Fleet approach

28
Puento Nuevo experienced problems since major refurbishment in 2009 and sought assistance from fleet following turbine damage in Feb 2010
Steam Global Fleet Management Centrecoordinated root cause analysis across 3 countriessupported discussion with manufacturerssupervised turbine rebuildstructured test programme which lead to the final removal of load restrictions
Puento Nuevo now returned to reliable operation
Applying engineering expertise
Shared engineering expertise provides competitive edge
Example: Puente Nuevo coal plant (Spain)
Provence coal plant experienced issues with retrofitted equipment necessitating chimney repair
~€2m saved thanks to expertise of the fleet in analyzing initial root cause, developing corrective strategies and negotiating contract with German vendors
Missing blades on rotor Analysis of broken blades
Example: Provence coal plant (France)
Chimney requiring repairs
Fleet approach

29
Coal fired power stations have a range of coals that they can burn based on technical parameters
Steam fleet challenged the usual range of coals from a more commercial viewpoint, especially the use of high-priced South African coals
Working with individual power stations, coal traders and specialist combustion experts, the fleet succeeded to reduce fuel costs
Langerlo (Belgium) has transferred from 70% South African coal to a Columbian and Russian coal blend, saving ~€2.4m per year starting in 2011
Similarly, Wilhelmshaven (Germany) move-away from South African coal is scheduled to save ~€2.1m per year starting in 2011
Fuel optimization
Technical and commercial expertise brought together to optimize fuel procurement
Example: optimizing coal blend
Steam Fleet also takes opportunities to gain value from co-firing when practicable
Co-firing supplies can range from sewage sludge through to purpose-made pelletized biomass
Addition of co-firing capabilities at Fiume Santo to generate extra €40m of value between 2011 and 2016
Example: biomass co-firing
Biomass pellets
Fleet approach

30
Old schedule:
New schedule:
Extension of the inspection intervals from 24,000 to 36,000 operating hours on modern gas turbines
Tested one engine type to prove the concept
Progressive fleet-wide roll-out programme across relevant engine types
An independent operator could not do this: this type of risk management only possible thanks to fleet synergies
Two benefits from longer inspection intervals:
Lower inspection costs: ~€1.5m saved per year and per installation
Higher availability: elimination of one overhaul per installation every 12 years
Risk management
Advanced technical risk management creates value
Example: extension of inspection intervals Inspection and overhaul schedule
24,000 h 24,000 h 24,000 h 24,000 h
Inspection
Overhaul
Inspection
36,000 h 36,000 h 36,000 h
Inspection
Overhaul
Fleet approach

Backup material

32
Safety
Operations
Maintenance
Capex prioritization for O&M projects
Introducing standards & best practices
Central procurement of major items
Central management of key contracts:
Long Term Service Agreements
Technical support
Purchase/delivery of fuels
Commodity risks
Dispatch and trading
Fleets: Responsibilities & Key internal interfaces
Clear allocation of responsibilities
Functional fleets Trading
Infrastructure issues
Stakeholder management
New build activities
Technical fleet support
New Build & Technology
Regional Units
Organization

33
European generation & fleet concept
Europe
Outside Europe
Generation
Renewables
Nuclear
Steam
CCGTs
Other/Consolidation
Hydro
Wind/Solar/Other
Global Units
Fleets
Climate & Renewables
Other Reporting Units
European generation
Organization
34
0
1
2
3
2008 2015 2020 2025 2030 2035
Gas Coal Oil Nuclear
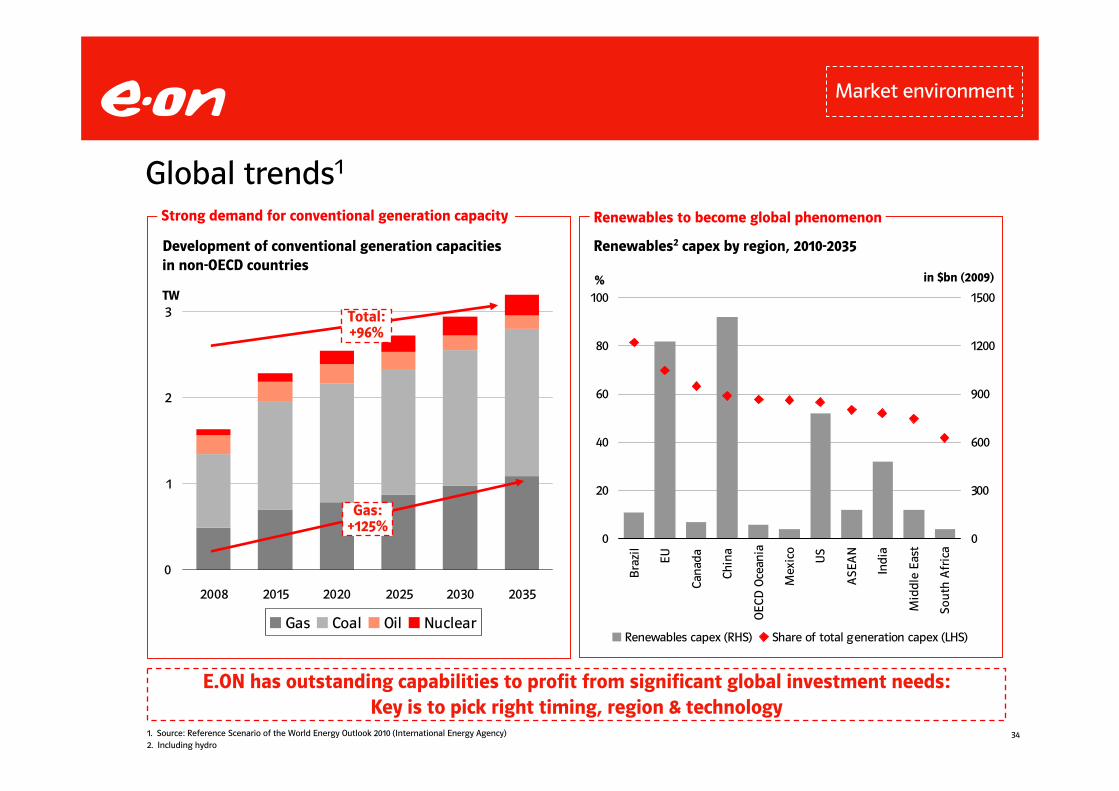
Global trends1
Strong demand for conventional generation capacity Renewables to become global phenomenon
E.ON has outstanding capabilities to profit from significant global investment needs:Key is to pick right timing, region & technology
Development of conventional generation capacitiesin non-OECD countries
TW
0
20
40
60
80
100
Bra
zil
EU
Cana
da
Chin
a
OEC
D O
cean
ia
Mex
ico
US
ASE
AN
Indi
a
Mid
dle
East
Sout
h A
fric
a
0
300
600
900
1200
1500
Renewables capex (RHS) Share of total generation capex (LHS)
Renewables2 capex by region, 2010-2035
in $bn (2009) %
Gas:+125%
Total:+96%
1. Source: Reference Scenario of the World Energy Outlook 2010 (International Energy Agency)2. Including hydro
Market environment

35
Market environment
10.711.78.611.0
23.926.0
18.319.9
19.220.9
12.613.7
Wind &
Solar: 2.5
28.7
21.1
15.0
Power system balance in Germany
Nuclear exit substantially reduces security of supply in winter
Estimated December 2011 power system balance Remarks
NuclearHydro
Coal
Lignite
Gas
Other
Wind
Solar
Imports
~80
~7~9
~168
~96
In GW
Sources: Entso-e, E.ON 1. Breakdown by fuel type based on own assumptions 2. Load incl. margin against peak load
Maximumload2
Systemservicereserve
Remainingmargin
Nameplatecapacity
Reliablyavailablecapacity1
Very minor contribution of wind & solar to reliably available capacity
Wind unavailable on windless days
Solar unavailable during evening hours
Import capacity not taken into account for capacity balance, but might be available depending of cross national flows
Remaining margin reduced by half due to nuclear exit
Remaining margin not comfortable in winter

36
Capacity Markets on the agenda across Europe
E.ON believe in energy market driven by competition
Up to now ‘energy only’ markets have worked well in our perspective, delivering adequate signals to support capacity development
We acknowledge the current capacity market under discussion and development, in particular due to the challenges of system changes
If any capacity market, it has to be settled to promote competition and reward efficiency
Set up for new capacity market complex and potentially with risk of market distortions
Potential impacts for E.ON
Isolated markets
Markets more depen-dent on own capacityfor security of supply
Capacity markets potentially positive for E.ON assets
Central Western Market
Markets strongly inter-connected and no needof new capacity
Strong support necessary (close to 100% capex) to incentivize new-builds
Uncertainties that currently discussed incen-tives (15% capex) will trigger capacity addition
France
Germany
Austria
Switzerland
Benelux
E.ON position
From 21 % today European RES generation will very likely grow to 36 % in 2020.
UKItaly Iberia
Market environment

37
1,8 2
3
4
6
75
9
10
11
Name Type Capacity (MW)1
1 Irsching 52 CCGT 430
2 Malzenice CCGT 430
3 Scandale2 CCGT 415
4 Grain CCGT 1,275
5 Emile Huchet CCGT 860
6 Algeciras CCGT 820
7 Gönyü CCGT 430
8 Irsching 4 CCGT 540
9 Livorno Ferraris2 CCGT 60010 Escatron CCGT 80011 Malmö CCGT 440
11 CCGTs commissioned since 2008
1. Gross capacity stated. Pro rata E.ON‘s interest2. Irsching 5: 50% of 860 MW
Scandale: 50% of 830 MWLivorno Ferraris: 75% of 800 MW
New-builds since 2008
Portfolio development

38
Decarbonization
E.ON power generation fuel mix in Europe E.ON carbon intensity in Europe
g CO2/kWh
56% 56%
33%23%
10%21%
2010A 2020E
Fossil Nuclear Renewables (incl. Hydro)
100%
630
391310
0
200
400
600
1990A 2010A 2020E
Expected increaseof specific carbonemissions due to nuclear phase out
50% CO2 reduction target based on lifetime extensionof German NPP
Increase of renewable
share by factor 2 due to
significant investments
Nuclear phase-out makes carbon reduction target (-50% by 2020) difficult to reach
Portfolio development

39
Significant negative effects in 2011
Accelerated nuclear phase-out: Key effects1
One-off effects within and below adj. EBITDA
---0.2Write-down nuclear fuel/spareparts Isar 1 & Unterweser
---0.3Additions to nuclear provisions Isar 1 & Unterweser
---0.6Additions to other provisions(Brunsbüttel & Krümmel)
---0.4Additions to other provisions(Isar 1 & Unterweser)
-0.7 - 0.8-0.7 - 0.8-0.6Nuclear tax
---1.5One-off effects Adj. EBITDA
-0.4
12
3.2
2011E
- 0.2 - 0.3
23
3.2
2012E
- 0.2 - 0.3
Recurring effects Adj. EBITDAForegone gross margin(incl. avoided nuclear tax)
23Production loss (TWh)
3.2Capacity loss (GW)
2013E€bn
1. Disclaimer: Figures only reflect adjusted EBITDA & below EBITDA effects and do not show damage for E.ON
Full year effects 2011 - 2013
German nuclear
-1.5One-off effects within adj. EBITDA
+0.1Interest expense: Reversal interest charge renewable energy fund
-0.2One-off effects below adj. EBITDA
-0.1Depreciation: Write-down fixed-assets in use (Isar 1 & Unterweser)
-0.2Non-operating earnings
-0.1Impairment shareholdings Brunsbüttel & Krümmel
-0.1Impairment assets under construction Isar 1 & Unterweser
1H 2011E€bn

40
E.ON’s nuclear fleet in Germany – Remaining lifetime1
20215910.4251,2881985 Gundremmingen C
20218210.883.31,3601985Grohnde
2017509.5251,2841984Gundremmingen B
2015427.51001,2751982Grafenrheinfeld
2011880501,3461984Krümmel
201111033.37711977Brunsbüttel
20111410.71001,3451979Unterweser
201146.31008781979Isar 1
105
109
94
Remainingrest volumes
December 31, 2010
1988
1988
1986
Start-up date2
202211.4751,410Isar 2
12.5
80
E.ON share (%)
1,329
1,410
Capacity net (MW)
11.0
11.4
Total outputFY 2010
2022
2021
Shutdown date(31 December of the
respective year,except for 2011)
Emsland
Brokdorf
in TWH
1. Source: Bundesamt für Strahlenschutz, Tabelle der erzeugten Strommengen und verbleibenden Reststrommengen2. Start of commercial production
German nuclear

41
E.ON Investor Relations Contact
Sascha BibertHead of IR T +49 2 11-45 79-5 42
Peter BlankenhornManager T +49 2 11-45 79-4 81
François PoulletManager T +49 2 11-45 79-3 32
Marc KoebernickManager T +49 2 11-45 79-2 39
Dr. Stephan SchönefußManager T +49 2 11-45 79-48 08
Aleksandr AksenovManager T +49 2 11-45 79-5 54
Carmen SchneiderManager T +49 2 11-45 79-3 45
Sabine BurkhardtExecutive Assistant T +49 2 11-45 79-5 49
What can we do to help you?

42
Investor Relations
E.ON IR and reporting calendar
Dividend paymentMay 4, 2012
DüsseldorfInterim Report II: January – June 2012August 13, 2012
DüsseldorfInterim Report I: January – March 2012May 9, 2012
EssenAGM 2012May 3, 2012
DüsseldorfAnnual Report 2011March 14, 2012
LocationEventDate

43
This presentation may contain forward-looking statements based on current assumptions and forecasts made
by E.ON Group management and other information currently available to E.ON. Various known and unknown
risks, uncertainties and other factors could lead to material differences between the actual future results,
financial situation, development or performance of the company and the estimates given here. E.ON AG does
not intend, and does not assume any liability whatsoever, to update these forward-looking statements or to
conform them to future events or developments.
Related Documents


