AUGUST 2011 McGinn Actuaries Ltd. ACTUARIAL REPORT AS OF JANUARY 1, 2011 FOR THE WESTERN CONFERENCE OF TEAMSTERS PENSION PLAN Prepared by: Martin M Ventura Systems Analyst David A Moonitz Senior Systems Analyst Henri V Tran Consulting Actuary Christopher M McGinn President Steven A. Brannon Consulting Actuary Under the General Supervision of: J. THOMAS BOLEN Member of the American Academy of Actuaries Enrolled Actuary, Enrollment #11-00382 August 31, 2011 Date

Welcome message from author
This document is posted to help you gain knowledge. Please leave a comment to let me know what you think about it! Share it to your friends and learn new things together.
Transcript
AUGUST 2011 McGinn Actuaries Ltd.
ACTUARIAL REPORT
AS OF JANUARY 1, 2011
FOR THE
WESTERN CONFERENCE OF TEAMSTERS PENSION PLAN
Prepared by:
Martin M Ventura
Systems Analyst David A Moonitz
Senior Systems Analyst
Henri V Tran
Consulting Actuary Christopher M McGinn
President
Steven A. Brannon
Consulting Actuary
Under the General Supervision of:
J. THOMAS BOLEN
Member of the American Academy of Actuaries
Enrolled Actuary, Enrollment #11-00382
August 31, 2011
Date

WESTERN CONFERENCE OF TEAMSTERS PENSION PLAN
AUGUST 2011 McGinn Actuaries Ltd.
Table of Contents
SECTION A – INTRODUCTION ........................................................................................................... 1
SECTION B – SUMMARY OF PRINCIPAL RESULTS .................................................................... 2
1. UNFUNDED ACTUARIAL LIABILITY AND AMORTIZATION PERIOD ................................................................2
2. FUNDING STATUS – ESTIMATED LEVEL OF EMPLOYER CONTRIBUTIONS .....................................................3
3. FUNDED STATUS OF VESTED BENEFIT LIABILITY .........................................................................................3
SECTION C – CURRENT FINANCIAL EXPERIENCE .................................................................... 4
1. SUMMARY REVIEW OF EXPERIENCE .............................................................................................................4
2. RATES OF INVESTMENT RETURN ...................................................................................................................5
3. INCOME AND EXPENSE ..................................................................................................................................6
4. NET ASSETS AT MARKET VALUE ..................................................................................................................7
SECTION D – ACTUARIAL RESULTS ............................................................................................... 8
1. ACTUARIAL VALUE OF ASSETS .....................................................................................................................8
2. ACTUARIAL PRESENT VALUES AND LIABILITIES ........................................................................................10
3. ANNUAL VALUES ........................................................................................................................................12
4. ACTUARIAL BALANCE SHEET .....................................................................................................................13
5. UNFUNDED VESTED BENEFIT LIABILITY .....................................................................................................14
SECTION E – REVISIONS OF ACTUARIAL ASSUMPTIONS AND PLAN PROVISIONS ...... 15
1. CHANGES IN ACTUARIAL ASSUMPTIONS .....................................................................................................15
2. CHANGES IN CONTRIBUTION RATES AND PEER COVERAGE ......................................................................15
SECTION F – COMPARISON OF VALUATION RESULTS USING FORMER AND REVISED
ACTUARIAL ASSUMPTIONS AND PLAN PROVISIONS ............................................................. 16
1. PRIOR ASSUMPTIONS AND PLAN COVERAGES ............................................................................................16
2. CURRENT ASSUMPTIONS AND PLAN COVERAGES .......................................................................................16
SECTION G – GOVERNMENT AND FINANCIAL REPORTING INFORMATION ................. 18
1. 2011 PROJECTED SCHEDULE MB INFORMATION ........................................................................................18
2. MAXIMUM TAX DEDUCTIBLE EMPLOYER CONTRIBUTIONS FOR 2011 .......................................................20
3. INFORMATION FOR AUDITORS .....................................................................................................................22
SECTION H – PARTICIPANT DATA ................................................................................................ 23
1. DATA BASE FOR ACTIVE AND VESTED INACTIVE PARTICIPANTS ...............................................................23
2. STATISTICAL INFORMATION ........................................................................................................................24
3. COMPARISON OF SAMPLE DATA CHARACTERISTICS WITH FULL POPULATION DATA CHARACTERISTICS .28
4. PROCEDURES TO ACCOUNT FOR DATA WITH MISSING OR INVALID BIRTHDATES OR SEX CODES .............28
5. AGE RETIREES, DISABILITY RETIREES, AND SURVIVING BENEFICIARIES ...................................................30
WESTERN CONFERENCE OF TEAMSTERS PENSION PLAN
AUGUST 2011 McGinn Actuaries Ltd.
SECTION I – ACTUARIAL ASSUMPTIONS AND METHODS ..................................................... 31
1. ACTUARIAL ASSUMPTIONS ..........................................................................................................................31
2. ACTUARIAL METHODS ................................................................................................................................38
SECTION J – SUMMARY OF PLAN PROVISIONS EFFECTIVE JANUARY 1, 2011 ............... 40
1. ACTIVE PARTICIPATION ...............................................................................................................................40
2. MONTHLY PENSION AT NORMAL RETIREMENT ..........................................................................................40
3. PAST SERVICE CREDITS ...............................................................................................................................40
4. VESTING SERVICE ........................................................................................................................................41
5. NORMAL RETIREMENT AGE ........................................................................................................................41
6. NORMAL PENSION FORM .............................................................................................................................41
7. OTHER PENSION FORMS ..............................................................................................................................41
8. EARLY RETIREMENT ELIGIBILITY DATE .....................................................................................................41
9. MONTHLY PENSION AT EARLY RETIREMENT FOR A PARTICIPANT WITH RECENT COVERAGE ...................42
10. MONTHLY PENSION AT EARLY RETIREMENT FOR A PARTICIPANT WITH CURRENT PEER COVERAGE ......42
11. DISABILITY BENEFIT ...................................................................................................................................42
12. VESTED BENEFIT UPON TERMINATION OF EMPLOYMENT ..........................................................................42
13. DEATH BENEFITS .........................................................................................................................................43
14. TRANSITION PROVISIONS ............................................................................................................................44
INTRODUCTION TO THE TABLES OF 2011 STATISTICAL DATA .......................................... 45
APPENDIX – BRIEF HISTORY OF PLAN AMENDMENTS ......................................................... 61

WESTERN CONFERENCE OF TEAMSTERS PENSION PLAN
AUGUST 2011 - 1 - McGinn Actuaries Ltd
SECTION A – INTRODUCTION
The results presented in this January 1, 2011 Actuarial Report for the Western Conference of Teamsters
Pension Plan (WCT Pension Plan) are based on (1) census data supplied by Prudential Investments and
Northwest Administrators, Inc. and (2) asset information reported by the Plan’s auditor, Lindquist, LLP,
Prudential Investments and the Plan’s investment advisor, Alan D. Biller & Associates, Inc. In our
opinion, the data were adequate for our actuarial computations.
This report includes:
A summary of the funding status of the Plan, including the expected amortization period for the
Plan’s January 1, 2011 unfunded actuarial Liability;
A comparison of the December 31, 2010 vested benefit liability with the actuarial value of the
Plan’s assets;
A comparison of the Plan’s liabilities and costs from the Plan’s January 1, 2010 actuarial
valuation with the liabilities and costs from this actuarial valuation;
A statement of the effects on principal actuarial values of any Plan changes and actuarial
assumption changes;
Descriptions of the census data used, together with statistical tables that illustrate the data
characteristics and validate the data sampling techniques used for non-retired participants;
A projection of the 2011 Funding Standard Account. This projection estimates the Plan’s funded
status for Schedule MB (Form 5500) purposes;
The development of the maximum tax deductible contributions for 2011, including disclosure of
the various full funding limitations;
Information required for disclosure in the Plan’s Financial Statements; and
A summary of Plan provisions effective January 1, 2011 and a brief history of Plan amendments
since 1984.

WESTERN CONFERENCE OF TEAMSTERS PENSION PLAN
AUGUST 2011 - 2 - McGinn Actuaries Ltd
SECTION B – SUMMARY OF PRINCIPAL RESULTS
1. Unfunded Actuarial Liability and Amortization Period
The Actuarial Liability for this Plan is calculated assuming that the Plan will continue indefinitely
at the benefit levels in effect on the valuation date, using the Entry Age Actuarial Cost Method and
the actuarial assumptions, as described in Section I. The Unfunded Actuarial Liability (UAL) is
the amount by which the Actuarial Liability exceeds the Actuarial Value of Assets.
The existence of the UAL is primarily the result of Plan provisions that grant benefits to
participants for (a) periods of contributory service before the valuation date when benefit levels
and related contribution rates were lower than those in effect on the valuation date and (b) service
rendered by a participant before his/her coverage by the Plan. The UAL as of January 1, 2011
reflects the Plan provisions in effect on that date, together with the employer contribution rates and
census data as of December 31, 2010.
The amortization periods shown below represent a measure of how rapidly this UAL can be
expected to be paid-off if (a) the demographics and Plan provisions existing on the valuation date
remain constant, (b) the actuarially assumed experience is realized, and (c) the annual level of
employer contributions is $1.270 billion. The UAL and amortization period as of January 1, 2010
reflect the Plan provisions, assets, and actuarial assumptions described in the 2010 Actuarial
Report. The UAL and amortization period as of January 1, 2011 reflect the Plan provisions, asset
values and actuarial assumptions described in this Actuarial Report. The restated January 1, 2010
results and January 1, 2011 results, as shown below, both reflect the Trustees’ election to apply 10-
year smoothing to the 2008 market value investment return shortfall as allowed by the Pension
Relief Act. Details of both the January 1, 2010 and January 1, 2011 results are shown in Section
D.
Development of Unfunded Actuarial Liability (in thousands)
January 1, 2010
(Restated)
January 1, 2011
Actuarial Liability $36,501,307 $37,950,278
Assets (actuarial value) $30,734,944 $32,880,990
Unfunded Actuarial Liability $5,766,363 $5,069,288
Amortization Period 11.0 Years 9.5 Years
WESTERN CONFERENCE OF TEAMSTERS PENSION PLAN
AUGUST 2011 - 3 - McGinn Actuaries Ltd
SECTION B – SUMMARY OF PRINCIPAL RESULTS
2. Funding Status – Estimated Level of Employer Contributions
The contribution assumption is used to determine the expected amortization period for the Plan’s
UAL. Based on our review of the recent history of employer contributions and contributory hours,
we have assumed that annual employer contributions would be approximately $1.270 billion,
including expected PEER contributions. This assumed annual employer contribution amount is
about 0.8% lower than was assumed for 2010.
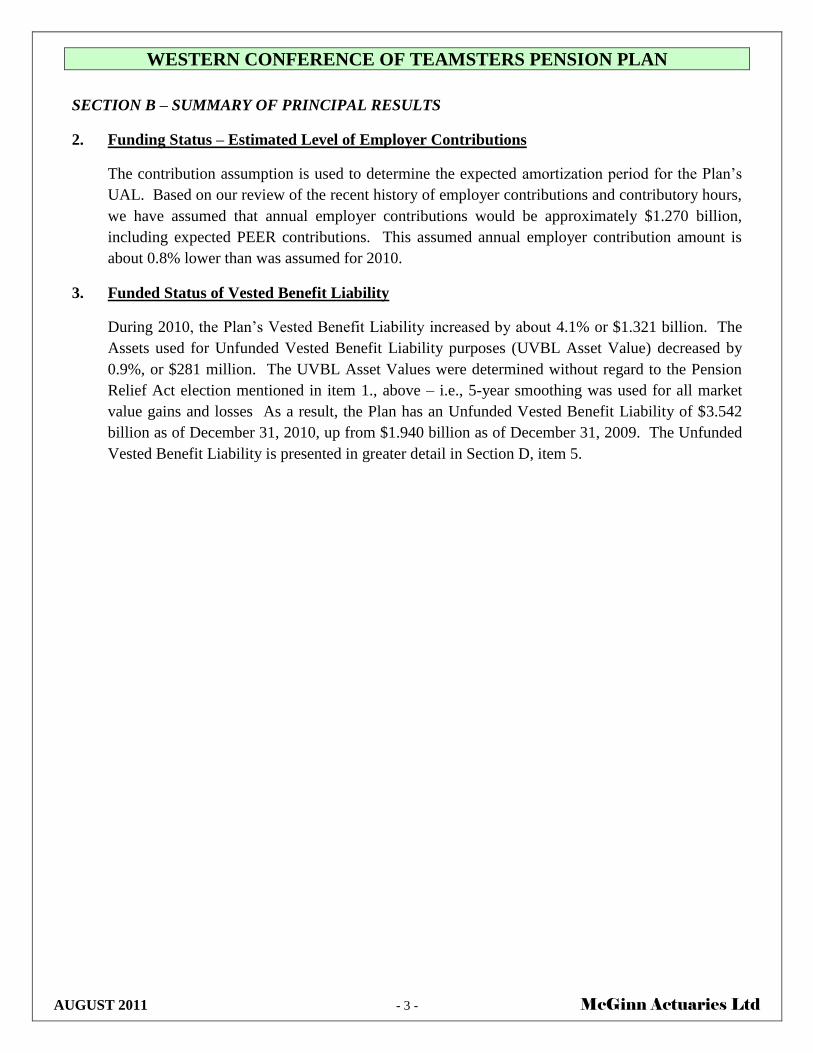
3. Funded Status of Vested Benefit Liability
During 2010, the Plan’s Vested Benefit Liability increased by about 4.1% or $1.321 billion. The
Assets used for Unfunded Vested Benefit Liability purposes (UVBL Asset Value) decreased by
0.9%, or $281 million. The UVBL Asset Values were determined without regard to the Pension
Relief Act election mentioned in item 1., above – i.e., 5-year smoothing was used for all market
value gains and losses As a result, the Plan has an Unfunded Vested Benefit Liability of $3.542
billion as of December 31, 2010, up from $1.940 billion as of December 31, 2009. The Unfunded
Vested Benefit Liability is presented in greater detail in Section D, item 5.
WESTERN CONFERENCE OF TEAMSTERS PENSION PLAN
AUGUST 2011 - 4 - McGinn Actuaries Ltd
SECTION C – CURRENT FINANCIAL EXPERIENCE
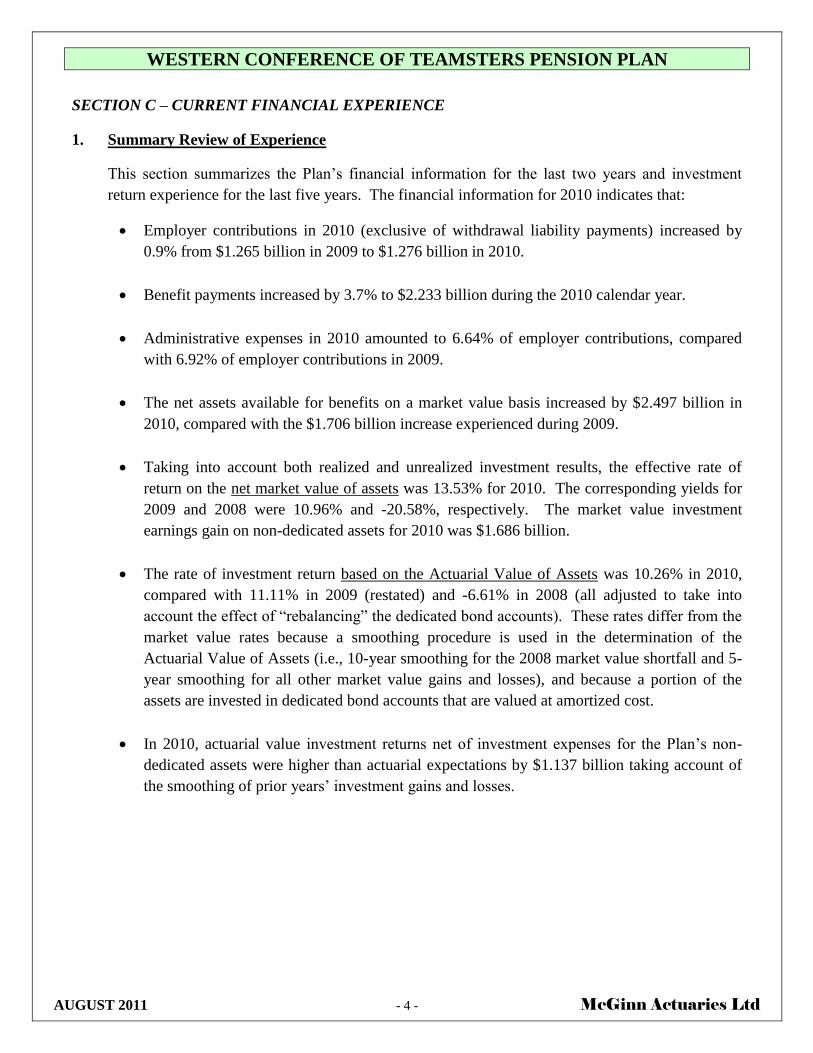
1. Summary Review of Experience
This section summarizes the Plan’s financial information for the last two years and investment
return experience for the last five years. The financial information for 2010 indicates that:
Employer contributions in 2010 (exclusive of withdrawal liability payments) increased by
0.9% from $1.265 billion in 2009 to $1.276 billion in 2010.
Benefit payments increased by 3.7% to $2.233 billion during the 2010 calendar year.
Administrative expenses in 2010 amounted to 6.64% of employer contributions, compared
with 6.92% of employer contributions in 2009.
The net assets available for benefits on a market value basis increased by $2.497 billion in
2010, compared with the $1.706 billion increase experienced during 2009.
Taking into account both realized and unrealized investment results, the effective rate of
return on the net market value of assets was 13.53% for 2010. The corresponding yields for
2009 and 2008 were 10.96% and -20.58%, respectively. The market value investment
earnings gain on non-dedicated assets for 2010 was $1.686 billion.
The rate of investment return based on the Actuarial Value of Assets was 10.26% in 2010,
compared with 11.11% in 2009 (restated) and -6.61% in 2008 (all adjusted to take into
account the effect of “rebalancing” the dedicated bond accounts). These rates differ from the
market value rates because a smoothing procedure is used in the determination of the
Actuarial Value of Assets (i.e., 10-year smoothing for the 2008 market value shortfall and 5-
year smoothing for all other market value gains and losses), and because a portion of the
assets are invested in dedicated bond accounts that are valued at amortized cost.
In 2010, actuarial value investment returns net of investment expenses for the Plan’s non-
dedicated assets were higher than actuarial expectations by $1.137 billion taking account of
the smoothing of prior years’ investment gains and losses.
WESTERN CONFERENCE OF TEAMSTERS PENSION PLAN
AUGUST 2011 - 5 - McGinn Actuaries Ltd
SECTION C – CURRENT FINANCIAL EXPERIENCE
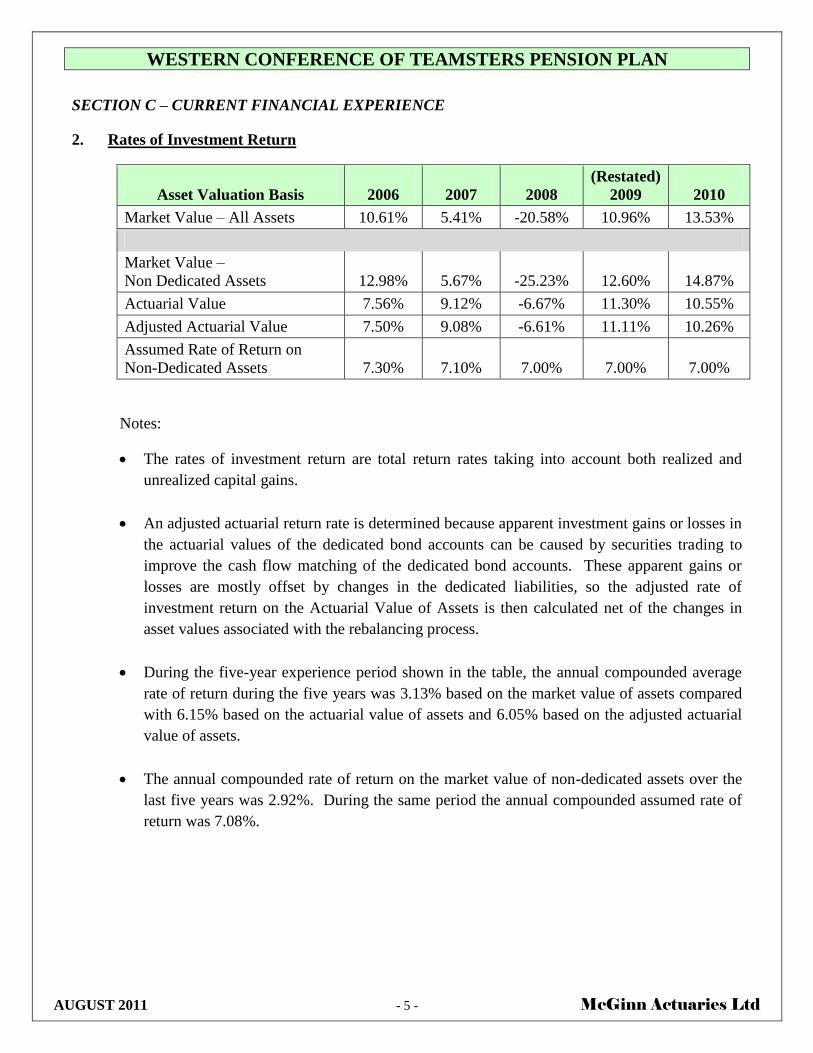
2. Rates of Investment Return
Asset Valuation Basis
2006
2007
2008
(Restated)
2009
2010
Market Value – All Assets 10.61% 5.41% -20.58% 10.96% 13.53%
Market Value –
Non Dedicated Assets
12.98%
5.67%
-25.23%
12.60%
14.87%
Actuarial Value 7.56% 9.12% -6.67% 11.30% 10.55%
Adjusted Actuarial Value 7.50% 9.08% -6.61% 11.11% 10.26%
Assumed Rate of Return on
Non-Dedicated Assets
7.30%
7.10%
7.00%
7.00%
7.00%
Notes:
The rates of investment return are total return rates taking into account both realized and
unrealized capital gains.
An adjusted actuarial return rate is determined because apparent investment gains or losses in
the actuarial values of the dedicated bond accounts can be caused by securities trading to
improve the cash flow matching of the dedicated bond accounts. These apparent gains or
losses are mostly offset by changes in the dedicated liabilities, so the adjusted rate of
investment return on the Actuarial Value of Assets is then calculated net of the changes in
asset values associated with the rebalancing process.
During the five-year experience period shown in the table, the annual compounded average
rate of return during the five years was 3.13% based on the market value of assets compared
with 6.15% based on the actuarial value of assets and 6.05% based on the adjusted actuarial
value of assets.
The annual compounded rate of return on the market value of non-dedicated assets over the
last five years was 2.92%. During the same period the annual compounded assumed rate of
return was 7.08%.
WESTERN CONFERENCE OF TEAMSTERS PENSION PLAN
AUGUST 2011 - 6 - McGinn Actuaries Ltd
SECTION C – CURRENT FINANCIAL EXPERIENCE
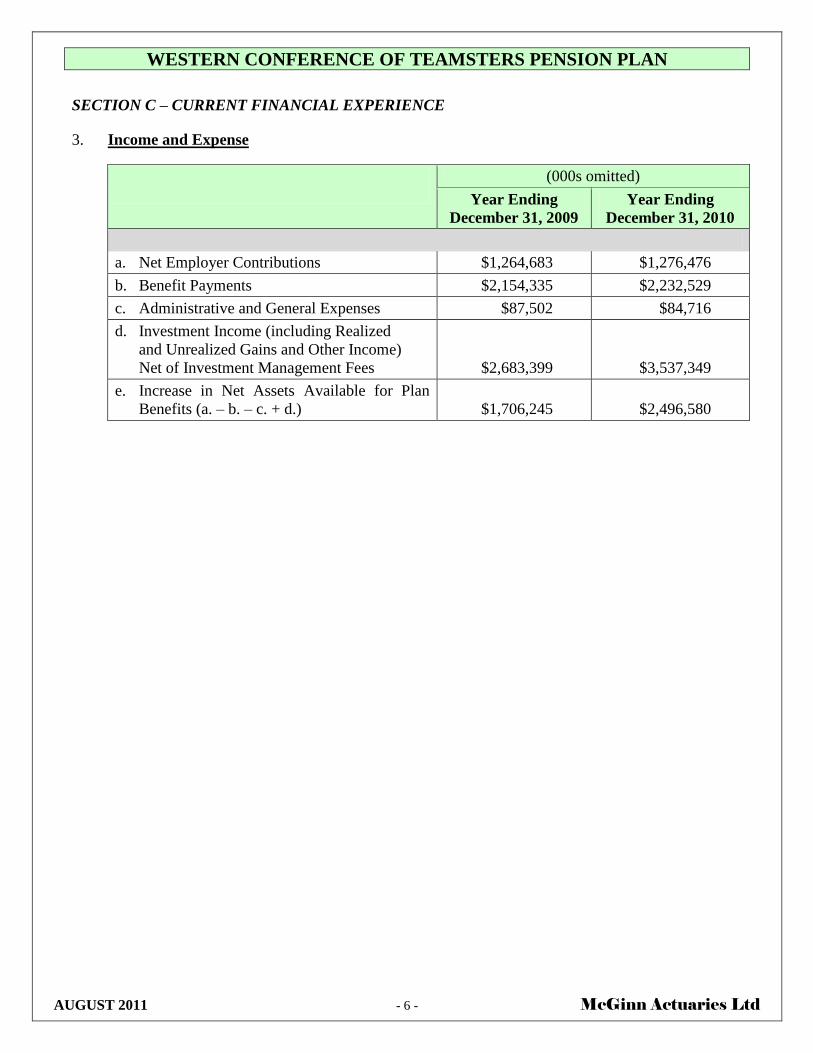
3. Income and Expense
(000s omitted)
Year Ending
December 31, 2009
Year Ending
December 31, 2010
a. Net Employer Contributions $1,264,683 $1,276,476
b. Benefit Payments $2,154,335 $2,232,529
c. Administrative and General Expenses $87,502 $84,716
d. Investment Income (including Realized
and Unrealized Gains and Other Income)
Net of Investment Management Fees
$2,683,399
$3,537,349
e. Increase in Net Assets Available for Plan
Benefits (a. – b. – c. + d.)
$1,706,245
$2,496,580

WESTERN CONFERENCE OF TEAMSTERS PENSION PLAN
AUGUST 2011 - 7 - McGinn Actuaries Ltd
SECTION C – CURRENT FINANCIAL EXPERIENCE
4. Net Assets at Market Value
(000s omitted)
Year Ending
December 31, 2009
Year Ending
December 31, 2010
a. Fixed Dollar Account
(Including Supplemental Bond Account)
$183,641
$296,089
b. 1982/1984 Annuity Account $267,568 $263,025
c. Strategic Bond Account $4,407,315 $4,353,127
d. All Remaining Assets $21,809,743 $24,252,606
e. Net Assets Available for Plan Benefits $26,668,267 $29,164,847
Note: The assets shown above generally are valued as described in the Western Conference of
Teamsters Pension Trust Fund Financial Statements. The Supplemental Bond Account,
1982/1984 Annuity Account, and Strategic Bond Account values are provided by
Prudential Investments. These amounts are listed at fair market value and differ from the
Actuarial Value of Assets, as described in Section D.
Market Value Asset Allocation
WESTERN CONFERENCE OF TEAMSTERS PENSION PLAN
AUGUST 2011 - 8 - McGinn Actuaries Ltd
SECTION D – ACTUARIAL RESULTS
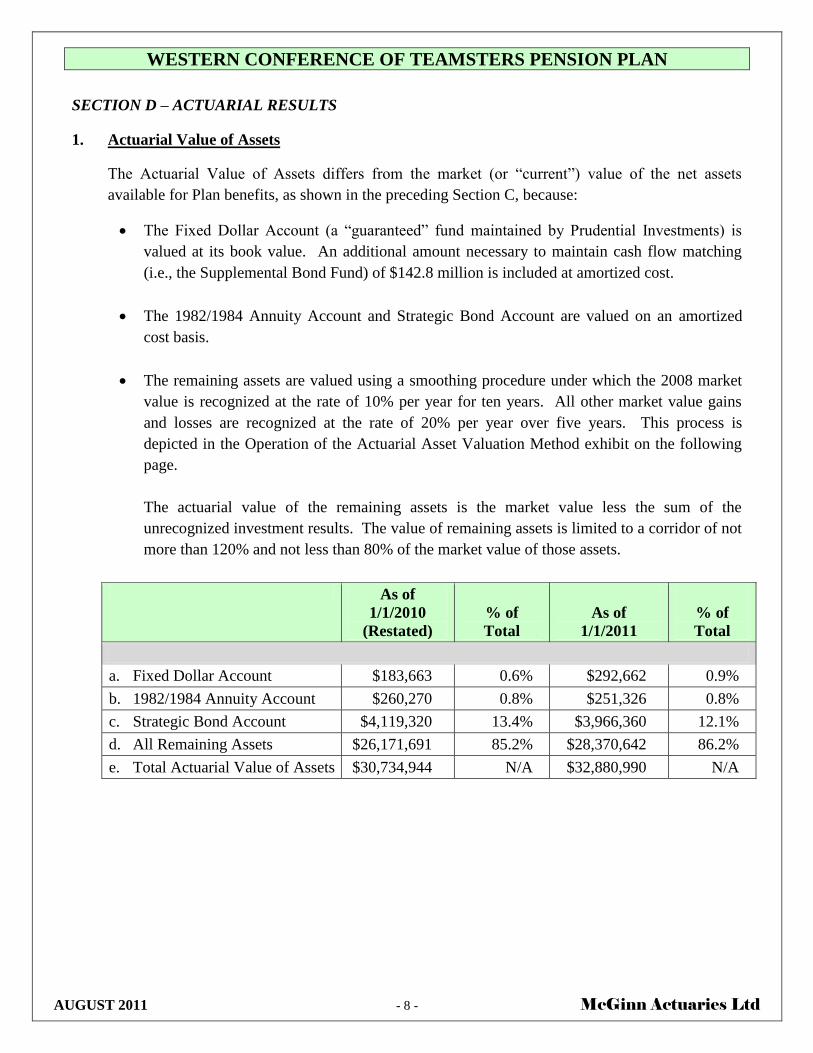
1. Actuarial Value of Assets
The Actuarial Value of Assets differs from the market (or “current”) value of the net assets
available for Plan benefits, as shown in the preceding Section C, because:
The Fixed Dollar Account (a “guaranteed” fund maintained by Prudential Investments) is
valued at its book value. An additional amount necessary to maintain cash flow matching
(i.e., the Supplemental Bond Fund) of $142.8 million is included at amortized cost.
The 1982/1984 Annuity Account and Strategic Bond Account are valued on an amortized
cost basis.
The remaining assets are valued using a smoothing procedure under which the 2008 market
value is recognized at the rate of 10% per year for ten years. All other market value gains
and losses are recognized at the rate of 20% per year over five years. This process is
depicted in the Operation of the Actuarial Asset Valuation Method exhibit on the following
page.
The actuarial value of the remaining assets is the market value less the sum of the
unrecognized investment results. The value of remaining assets is limited to a corridor of not
more than 120% and not less than 80% of the market value of those assets.
As of
1/1/2010
(Restated)
% of
Total
As of
1/1/2011
% of
Total
a. Fixed Dollar Account $183,663 0.6% $292,662 0.9%
b. 1982/1984 Annuity Account $260,270 0.8% $251,326 0.8%
c. Strategic Bond Account $4,119,320 13.4% $3,966,360 12.1%
d. All Remaining Assets $26,171,691 85.2% $28,370,642 86.2%
e. Total Actuarial Value of Assets $30,734,944 N/A $32,880,990 N/A

WESTERN CONFERENCE OF TEAMSTERS PENSION PLAN SECTION D — ACTUARIAL RESULTS
AUGUST 2011 - 9 - McGinn Actuaries Ltd.
1. Actuarial Value of Assets (000s omitted) (Continued)
Investment Investment
Gain / (Loss) Gain / (Loss)
Market over Recognized
Actuarially in Current
Expected Year
Year 2006 2007 2008 2009 2010 2011 2012 2013 2014 2015 2016 2017 2018
2006 $1,304,407 $260,881.4 $260,881.4 $260,881.4 $260,881.4 $260,881.4
2007 ($367,932) ($73,586.4) ($73,586.4) ($73,586.4) ($73,586.4) ($73,586.4)
2008 ($8,646,585) ($864,658.5) ($864,658.5) ($864,658.5) ($864,658.5) ($864,658.5) ($864,658.5) ($864,658.5) ($864,658.5) ($864,658.5) ($864,658.5)
2009 $1,098,417 $219,683.4 $219,683.4 $219,683.4 $219,683.4 $219,683.4
2010 $1,686,388 $337,277.6 $337,277.6 $337,277.6 $337,277.6 $337,277.6
Net Gains / (Losses) Recognized by Year ($120,402.5) ($381,283.9) ($307,697.5) ($307,697.5) ($527,380.9) ($864,658.5) ($864,658.5) ($864,658.5) $0.0
Interest on Prior Year Gains / (Losses) ($414,737.8) ($288,262.5) ($261,572.6) ($240,033.8) ($218,494.9) ($181,578.3) ($121,052.2) ($60,526.1) $0.0
Total Gains / (Losses) Deferred and to be Recognized in Future Years ($4,118,035.3) ($3,736,751.4) ($3,429,053.9) ($3,121,356.4) ($2,593,975.5) ($1,729,317.0) ($864,658.5) $0.0 $0.0
Additional Gains / (Losses) Recognized in Current year because of 80% - 120% Corridor $0.0
Adjusted Total Gains / (Losses) Deferred in Current year and to be recognized in Future Years ($4,118,035.3)
OPERATION OF THE ACTUARIAL ASSET VALUATION METHOD FOR NON-DEDICATED ASSETS (in 000s)
Investment Gain / (Loss) Recongized as of January 1, 2011
Recognition in Past Years Recognized in Future Years
Investment Gain / (Loss) Investment Gain / (Loss)
WESTERN CONFERENCE OF TEAMSTERS PENSION PLAN
AUGUST 2011 - 10 - McGinn Actuaries Ltd
SECTION D – ACTUARIAL RESULTS
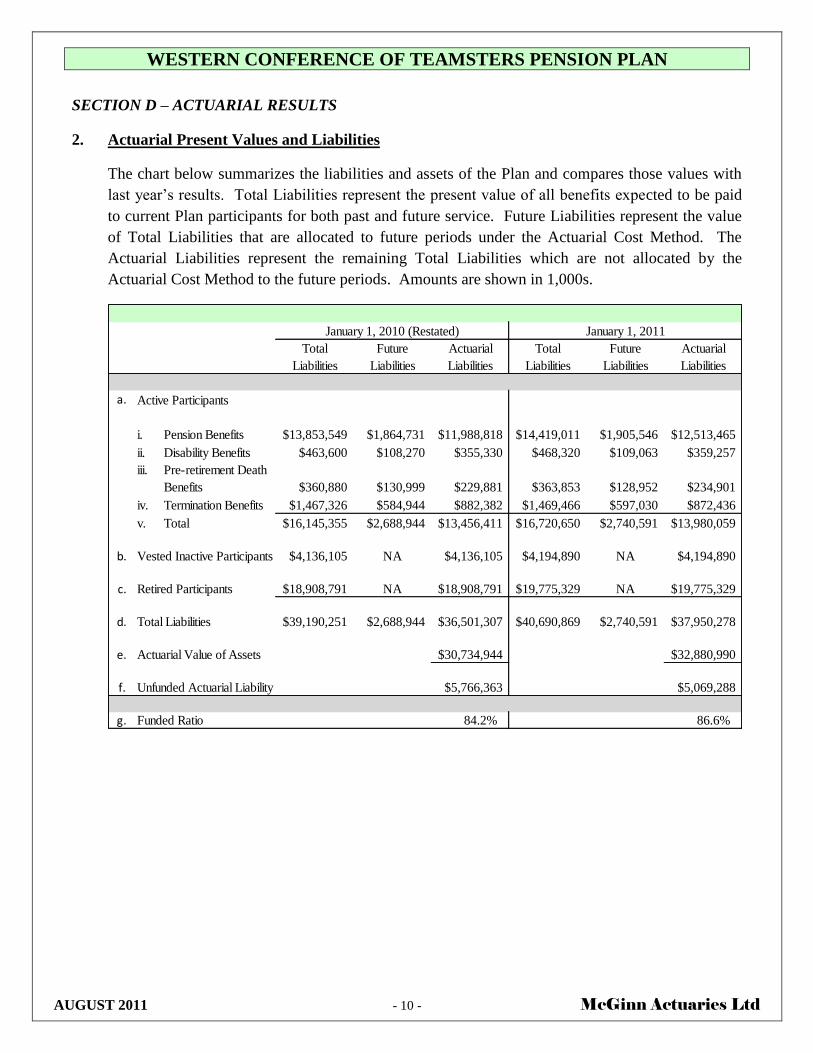
2. Actuarial Present Values and Liabilities
The chart below summarizes the liabilities and assets of the Plan and compares those values with
last year’s results. Total Liabilities represent the present value of all benefits expected to be paid
to current Plan participants for both past and future service. Future Liabilities represent the value
of Total Liabilities that are allocated to future periods under the Actuarial Cost Method. The
Actuarial Liabilities represent the remaining Total Liabilities which are not allocated by the
Actuarial Cost Method to the future periods. Amounts are shown in 1,000s.
Total Future Actuarial Total Future Actuarial
Liabilities Liabilities Liabilities Liabilities Liabilities Liabilities
a. Active Participants
i. Pension Benefits $13,853,549 $1,864,731 $11,988,818 $14,419,011 $1,905,546 $12,513,465
ii. Disability Benefits $463,600 $108,270 $355,330 $468,320 $109,063 $359,257
iii.
$360,880 $130,999 $229,881 $363,853 $128,952 $234,901
iv. Termination Benefits $1,467,326 $584,944 $882,382 $1,469,466 $597,030 $872,436
v. Total $16,145,355 $2,688,944 $13,456,411 $16,720,650 $2,740,591 $13,980,059
b. Vested Inactive Participants $4,136,105 NA $4,136,105 $4,194,890 NA $4,194,890
c. Retired Participants $18,908,791 NA $18,908,791 $19,775,329 NA $19,775,329
d. Total Liabilities $39,190,251 $2,688,944 $36,501,307 $40,690,869 $2,740,591 $37,950,278
e. Actuarial Value of Assets $30,734,944 $32,880,990
f. Unfunded Actuarial Liability $5,766,363 $5,069,288
g. Funded Ratio 84.2% 86.6%
January 1, 2010 (Restated) January 1, 2011
Pre-retirement Death
Benefits
WESTERN CONFERENCE OF TEAMSTERS PENSION PLAN
AUGUST 2011 - 11 - McGinn Actuaries Ltd
SECTION D – ACTUARIAL RESULTS
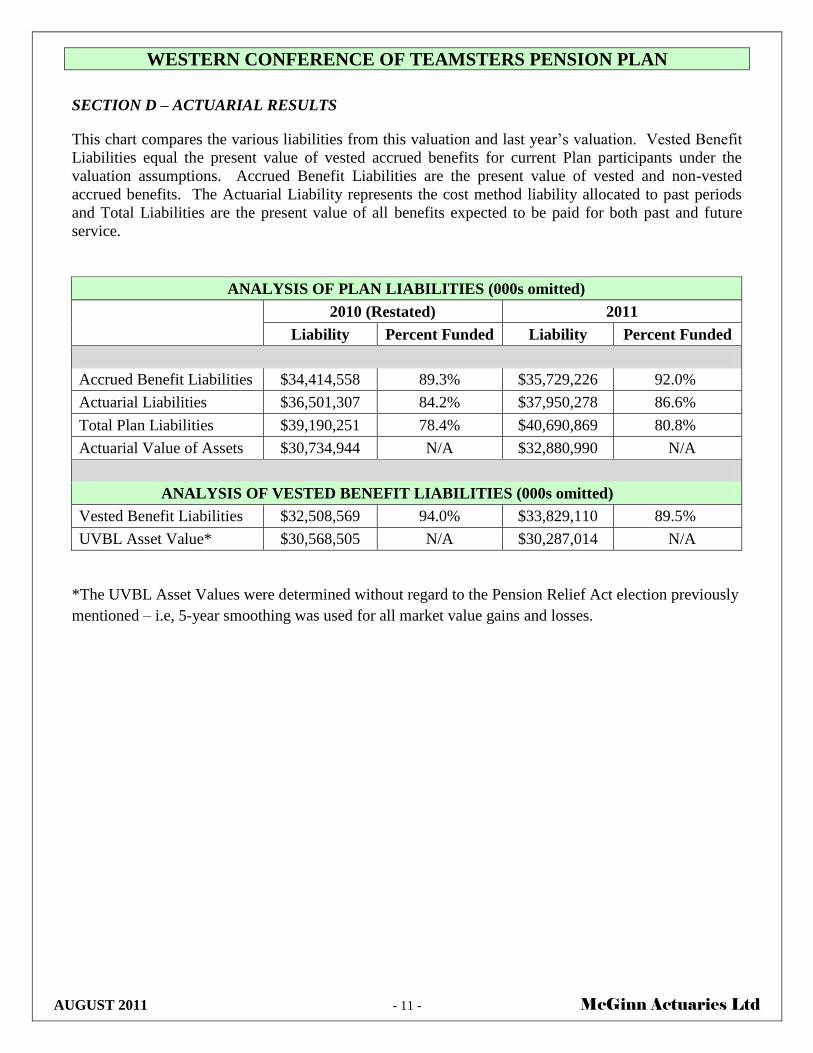
This chart compares the various liabilities from this valuation and last year’s valuation. Vested Benefit
Liabilities equal the present value of vested accrued benefits for current Plan participants under the
valuation assumptions. Accrued Benefit Liabilities are the present value of vested and non-vested
accrued benefits. The Actuarial Liability represents the cost method liability allocated to past periods
and Total Liabilities are the present value of all benefits expected to be paid for both past and future
service.
ANALYSIS OF PLAN LIABILITIES (000s omitted)
2010 (Restated) 2011
Liability Percent Funded Liability Percent Funded
Accrued Benefit Liabilities $34,414,558 89.3% $35,729,226 92.0%
Actuarial Liabilities $36,501,307 84.2% $37,950,278 86.6%
Total Plan Liabilities $39,190,251 78.4% $40,690,869 80.8%
Actuarial Value of Assets $30,734,944 N/A $32,880,990 N/A
ANALYSIS OF VESTED BENEFIT LIABILITIES (000s omitted)
Vested Benefit Liabilities $32,508,569 94.0% $33,829,110 89.5%
UVBL Asset Value* $30,568,505 N/A $30,287,014 N/A
*The UVBL Asset Values were determined without regard to the Pension Relief Act election previously
mentioned – i.e, 5-year smoothing was used for all market value gains and losses.
WESTERN CONFERENCE OF TEAMSTERS PENSION PLAN
AUGUST 2011 - 12 - McGinn Actuaries Ltd
SECTION D – ACTUARIAL RESULTS
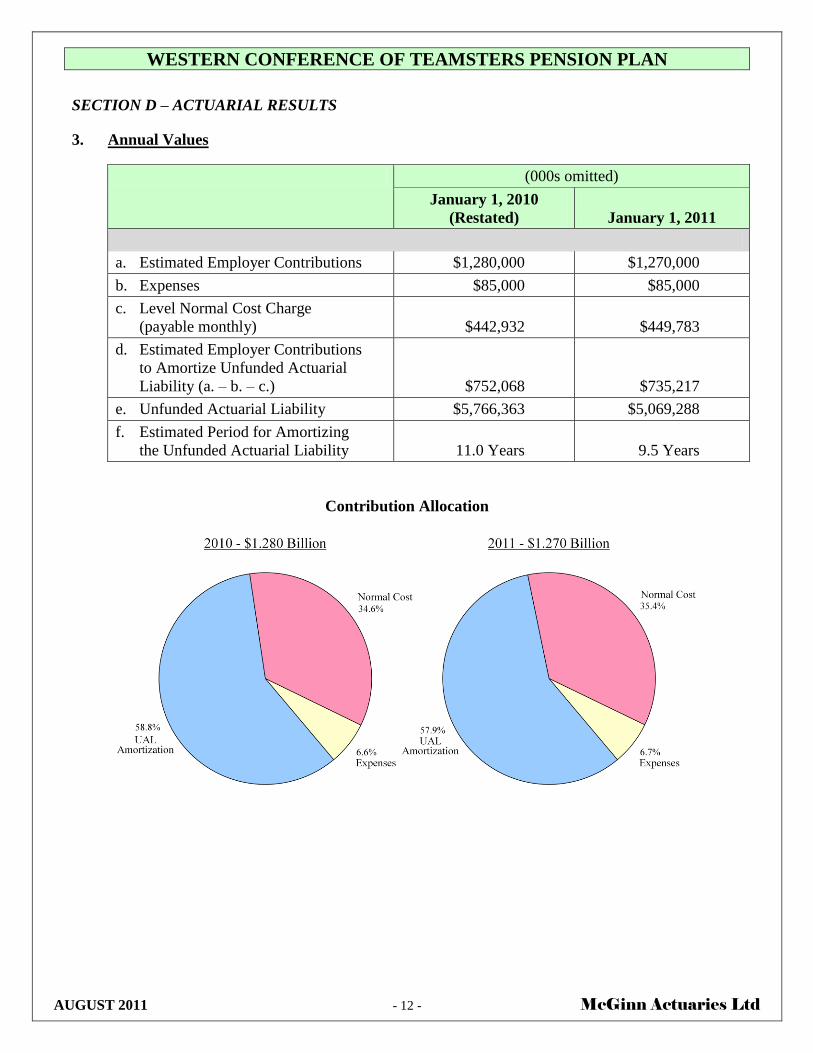
3. Annual Values
(000s omitted)
January 1, 2010
(Restated)
January 1, 2011
a. Estimated Employer Contributions $1,280,000 $1,270,000
b. Expenses $85,000 $85,000
c. Level Normal Cost Charge
(payable monthly)
$442,932
$449,783
d. Estimated Employer Contributions
to Amortize Unfunded Actuarial
Liability (a. – b. – c.)
$752,068
$735,217
e. Unfunded Actuarial Liability $5,766,363 $5,069,288
f. Estimated Period for Amortizing
the Unfunded Actuarial Liability
11.0 Years
9.5 Years
Contribution Allocation
WESTERN CONFERENCE OF TEAMSTERS PENSION PLAN
AUGUST 2011 - 13 - McGinn Actuaries Ltd
SECTION D – ACTUARIAL RESULTS
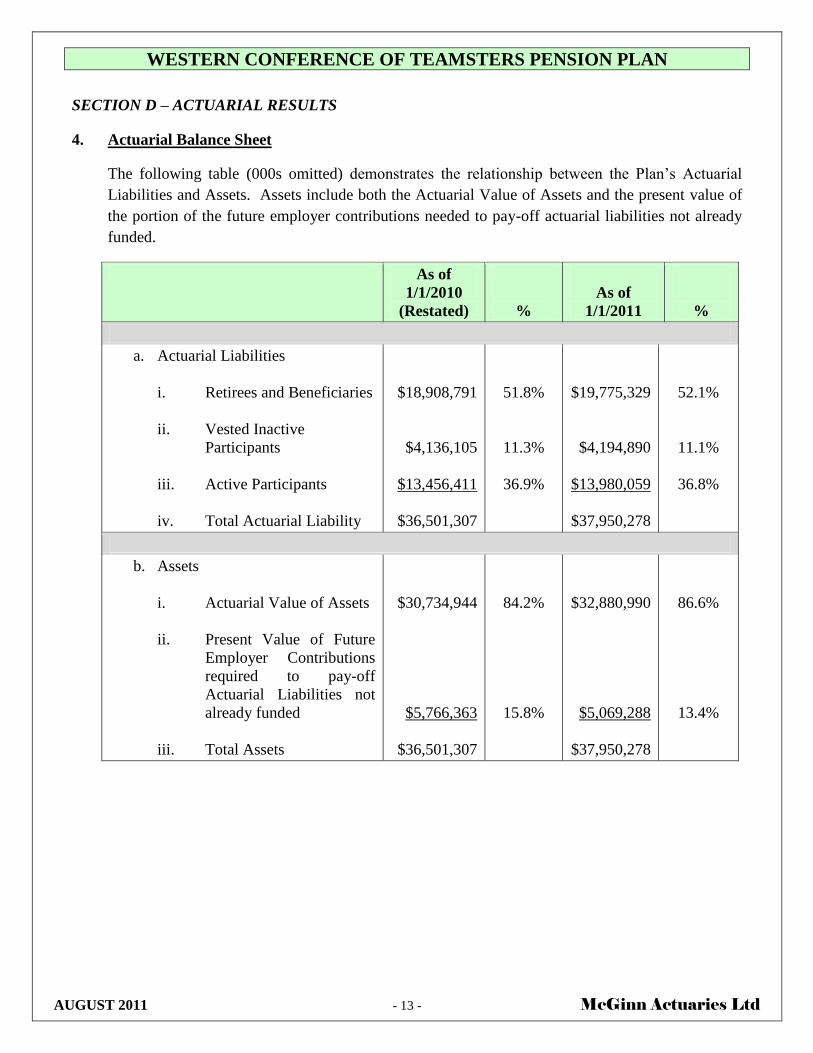
4. Actuarial Balance Sheet
The following table (000s omitted) demonstrates the relationship between the Plan’s Actuarial
Liabilities and Assets. Assets include both the Actuarial Value of Assets and the present value of
the portion of the future employer contributions needed to pay-off actuarial liabilities not already
funded.
As of
1/1/2010
(Restated)
%
As of
1/1/2011
%
a. Actuarial Liabilities
i. Retirees and Beneficiaries
ii. Vested Inactive
Participants
iii. Active Participants
iv. Total Actuarial Liability
$18,908,791
$4,136,105
$13,456,411
$36,501,307
51.8%
11.3%
36.9%
$19,775,329
$4,194,890
$13,980,059
$37,950,278
52.1%
11.1%
36.8%
b. Assets
i. Actuarial Value of Assets
ii. Present Value of Future
Employer Contributions
required to pay-off
Actuarial Liabilities not
already funded
iii. Total Assets
$30,734,944
$5,766,363
$36,501,307
84.2%
15.8%
$32,880,990
$5,069,288
$37,950,278
86.6%
13.4%
WESTERN CONFERENCE OF TEAMSTERS PENSION PLAN
AUGUST 2011 - 14 - McGinn Actuaries Ltd
SECTION D – ACTUARIAL RESULTS
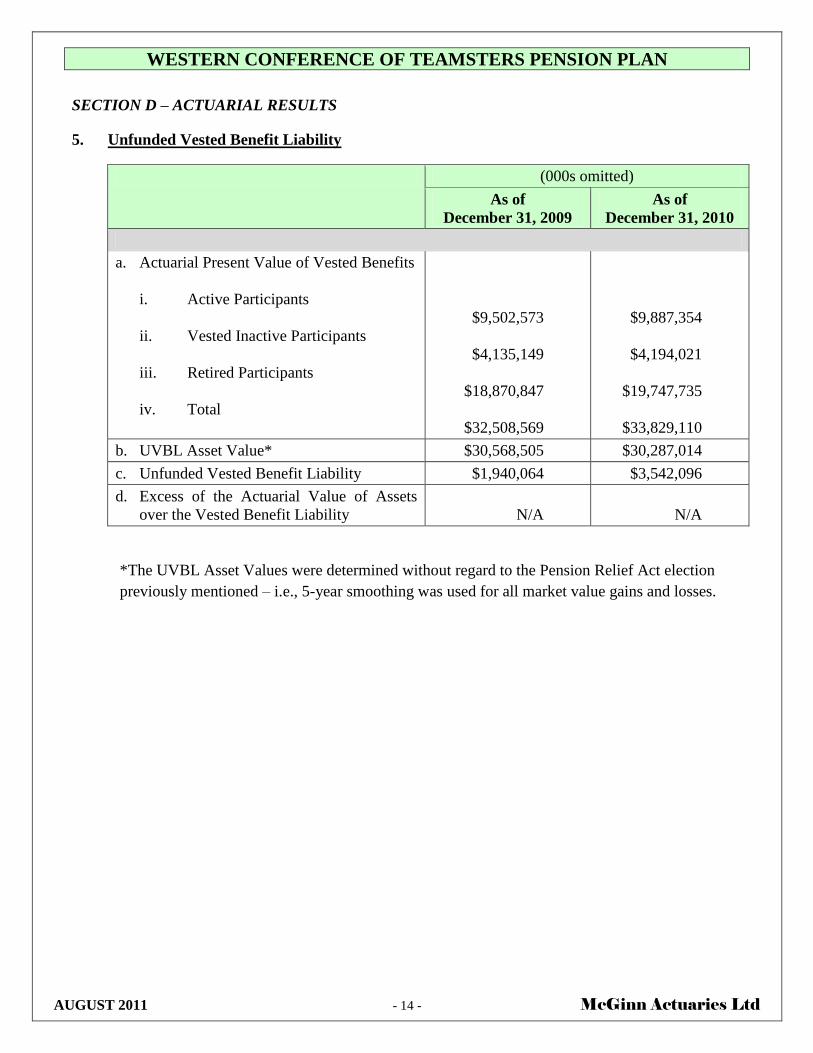
5. Unfunded Vested Benefit Liability
(000s omitted)
As of
December 31, 2009
As of
December 31, 2010
a. Actuarial Present Value of Vested Benefits
i. Active Participants
ii. Vested Inactive Participants
iii. Retired Participants
iv. Total
$9,502,573
$4,135,149
$18,870,847
$32,508,569
$9,887,354
$4,194,021
$19,747,735
$33,829,110
b. UVBL Asset Value* $30,568,505 $30,287,014
c. Unfunded Vested Benefit Liability $1,940,064 $3,542,096
d. Excess of the Actuarial Value of Assets
over the Vested Benefit Liability
N/A
N/A
*The UVBL Asset Values were determined without regard to the Pension Relief Act election
previously mentioned – i.e., 5-year smoothing was used for all market value gains and losses.
WESTERN CONFERENCE OF TEAMSTERS PENSION PLAN
AUGUST 2011 - 15 - McGinn Actuaries Ltd
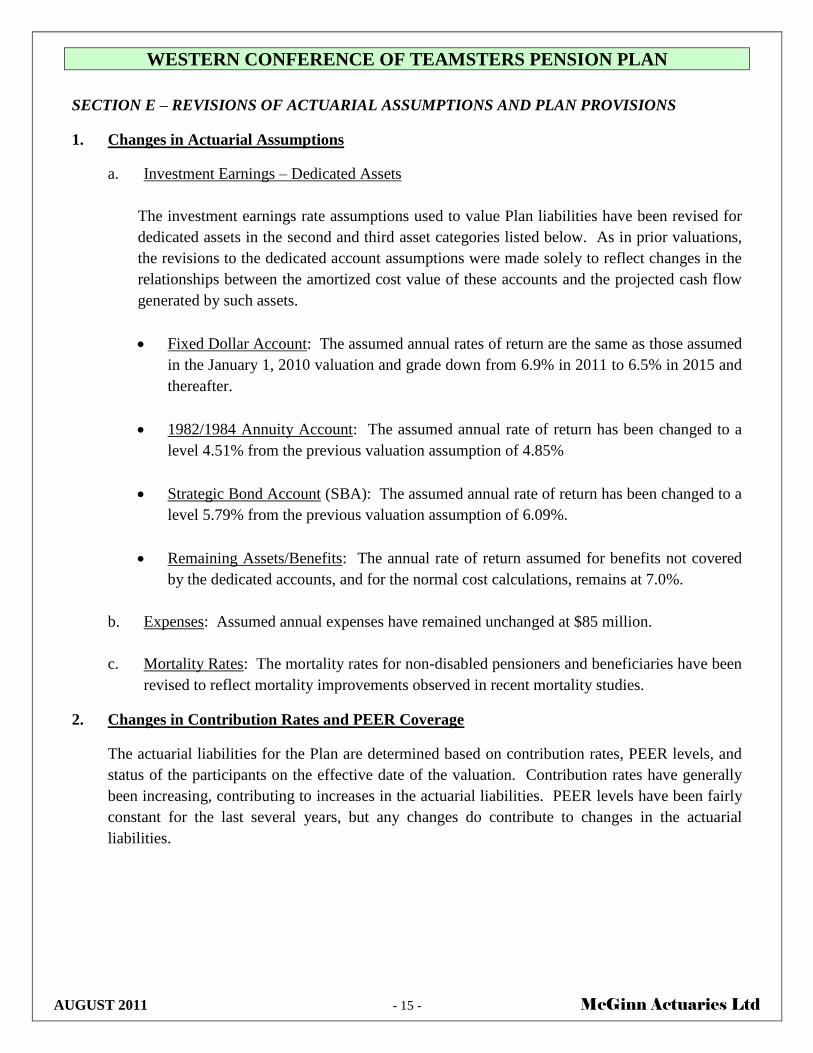
SECTION E – REVISIONS OF ACTUARIAL ASSUMPTIONS AND PLAN PROVISIONS
1. Changes in Actuarial Assumptions
a. Investment Earnings – Dedicated Assets
The investment earnings rate assumptions used to value Plan liabilities have been revised for
dedicated assets in the second and third asset categories listed below. As in prior valuations,
the revisions to the dedicated account assumptions were made solely to reflect changes in the
relationships between the amortized cost value of these accounts and the projected cash flow
generated by such assets.
Fixed Dollar Account: The assumed annual rates of return are the same as those assumed
in the January 1, 2010 valuation and grade down from 6.9% in 2011 to 6.5% in 2015 and
thereafter.
1982/1984 Annuity Account: The assumed annual rate of return has been changed to a
level 4.51% from the previous valuation assumption of 4.85%
Strategic Bond Account (SBA): The assumed annual rate of return has been changed to a
level 5.79% from the previous valuation assumption of 6.09%.
Remaining Assets/Benefits: The annual rate of return assumed for benefits not covered
by the dedicated accounts, and for the normal cost calculations, remains at 7.0%.
b. Expenses: Assumed annual expenses have remained unchanged at $85 million.
c. Mortality Rates: The mortality rates for non-disabled pensioners and beneficiaries have been
revised to reflect mortality improvements observed in recent mortality studies.
2. Changes in Contribution Rates and PEER Coverage
The actuarial liabilities for the Plan are determined based on contribution rates, PEER levels, and
status of the participants on the effective date of the valuation. Contribution rates have generally
been increasing, contributing to increases in the actuarial liabilities. PEER levels have been fairly
constant for the last several years, but any changes do contribute to changes in the actuarial
liabilities.
WESTERN CONFERENCE OF TEAMSTERS PENSION PLAN
AUGUST 2011 - 16 - McGinn Actuaries Ltd
SECTION F – COMPARISON OF VALUATION RESULTS USING FORMER AND REVISED
ACTUARIAL ASSUMPTIONS AND PLAN PROVISIONS
The following table illustrates the effects on principal actuarial values of the changes in the actuarial
assumptions, as described in the preceding Section E. All amounts are shown to the nearest $1,000.
1. Prior Assumptions and Plan Coverages
The liabilities and assets presented using former assumptions and Plan coverages on December 31,
2009 provide a “snap-shot” of the liabilities assuming no changes in basic contribution rates,
PEER benefit coverage or actuarial assumptions.
2. Current Assumptions and Plan Coverages
The values shown in this column reflect contribution rates and PEER benefit coverages as of
December 31, 2010, and other changes, as described in Section E.
WESTERN CONFERENCE OF TEAMSTERS PENSION PLAN
AUGUST 2011 - 17 - McGinn Actuaries Ltd
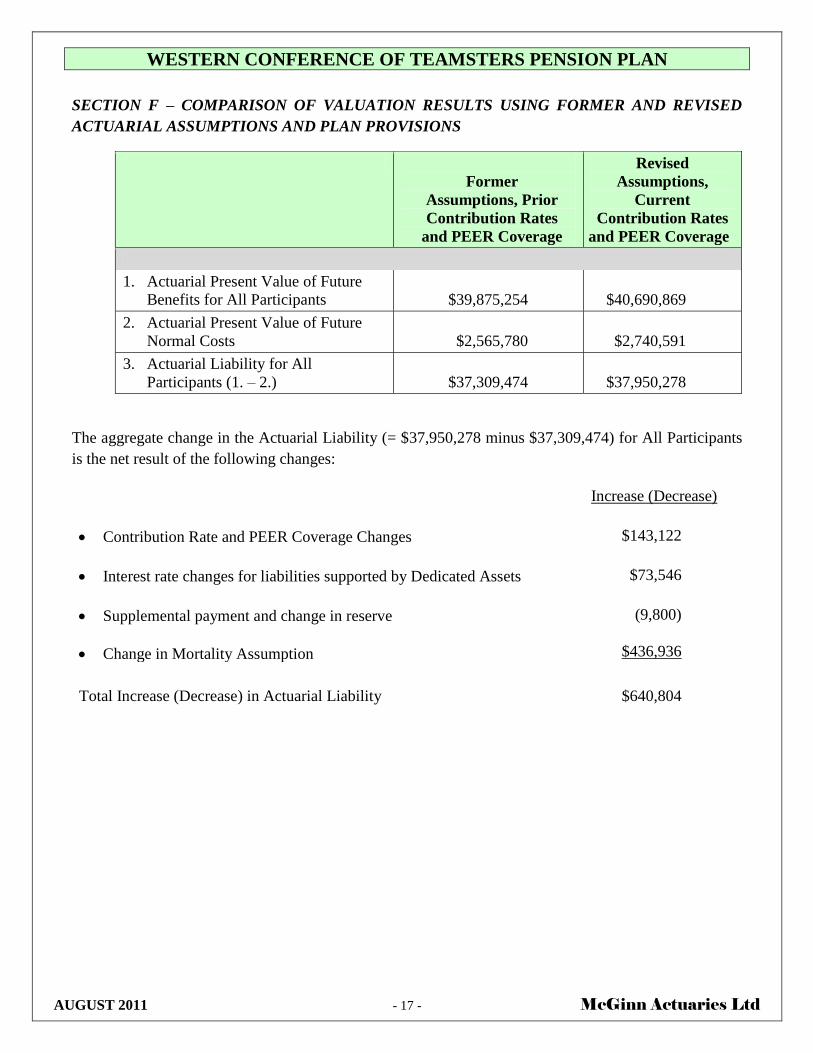
SECTION F – COMPARISON OF VALUATION RESULTS USING FORMER AND REVISED
ACTUARIAL ASSUMPTIONS AND PLAN PROVISIONS
Former
Assumptions, Prior
Contribution Rates
and PEER Coverage
Revised
Assumptions,
Current
Contribution Rates
and PEER Coverage
1. Actuarial Present Value of Future
Benefits for All Participants
$39,875,254
$40,690,869
2. Actuarial Present Value of Future
Normal Costs
$2,565,780
$2,740,591
3. Actuarial Liability for All
Participants (1. – 2.)
$37,309,474
$37,950,278
The aggregate change in the Actuarial Liability (= $37,950,278 minus $37,309,474) for All Participants
is the net result of the following changes:
Increase (Decrease)
Contribution Rate and PEER Coverage Changes $143,122
Interest rate changes for liabilities supported by Dedicated Assets $73,546
Supplemental payment and change in reserve
Change in Mortality Assumption
(9,800)
$436,936
Total Increase (Decrease) in Actuarial Liability $640,804

WESTERN CONFERENCE OF TEAMSTERS PENSION PLAN
AUGUST 2011 - 18 - McGinn Actuaries Ltd
SECTION G – GOVERNMENT AND FINANCIAL REPORTING INFORMATION
The following Funding Standard Account, Full Funding Limit, Funding Standard Account Amortization
Base, and Maximum Tax Deductible Contribution determinations reflect the Pension Relief elections
made by the Trustees. In particular, the Trustees elected to smooth the 2008 market value investment
return shortfall over 10 years and to apply extended amortization to the actuarial investment return
losses associated with the 2008 shortfall as these losses are reflected in the actuarial asset values.
1. 2011 Projected Schedule MB Information
a. Projected Funding Standard Account (000s omitted)
The Funding Standard Account (FSA) measures a plan’s compliance with the minimum
funding standards of ERISA. ERISA’s minimum funding standards are satisfied whenever the
Credit Balance is equal to or greater than zero.
Projected Funding Standard Account
i. Charges
Beginning of Year Normal Cost (including expenses) $515,637
Amortization Charges on January 1, 2011 $1,104,196
Interest on above to year End $113,388
Total End of Year Charges $1,733,221
ii. Credits
Prior Year Credit Balance $1,989,373
Expected Employer Contributions during 2011 $1,270,000
Amortization Credits on January 1, 2011 $348,864
Interest on Above to Year End $200,534
Total End of Year Credits $3,808,771
iii. Projected Credit Balance on December 31, 2011 $2,075,550

WESTERN CONFERENCE OF TEAMSTERS PENSION PLAN
AUGUST 2011 - 19 - McGinn Actuaries Ltd
SECTION G – GOVERNMENT AND FINANCIAL REPORTING INFORMATION
b. Full Funding Limits (000s omitted)
i. ERISA Full Funding Limit $12,080,772
ii. 90% Current Liability Override $16,862,698
c. Amortization Bases (000s omitted)
The following table depicts the various entries used to establish the year-by-year charges and
credits with respect to the Funding Standard Account.
Year Original Remaining Remaining Amortization
Established Balance Balance 1/1/2011 Years 1/1/2011 Payment for 2011
Charges
Combined Base 2009 4,889,122 4,259,569 9.1 604,086
2008 Net Investment Loss 2009 4,407,752 4,303,297 27.0 335,519
Plan Change:Peer Changes 2009 12,122 11,123 13.0 1,244
Allocated Reserves 2009 40,000 21,350 2.0 11,036
Plan Change:Peer Changes 2010 13,349 12,818 14.0 1,370
2008 Net Investment Loss 2010 588,120 580,832 27.0 45,286
Assumption Change 2011 507,482 507,482 15.0 52,074
Plan Change:Peer Changes 2011 5,731 5,731 15.0 588
Plan Change:Extra Check 2011 655 655 1.0 655
2008 Net Investment Loss 2011 671,272 671,272 27.0 52,338
Total 11,135,605 10,374,129 1,104,196
Credits
All other experience gain 2009 207,518 190,424 13.0 21,294
Assumption Change 2009 14,196 13,026 13.0 1,457
All other experience gain 2010 1,461,750 1,403,580 14.0 149,993
Assumption Change 2010 199,500 191,561 14.0 20,471
All other experience gain 2011 1,516,877 1,516,877 15.0 155,649
Total 3,399,841 3,315,468 348,864
WESTERN CONFERENCE OF TEAMSTERS PENSION PLAN
AUGUST 2011 - 20 - McGinn Actuaries Ltd
SECTION G – GOVERNMENT AND FINANCIAL REPORTING INFORMATION
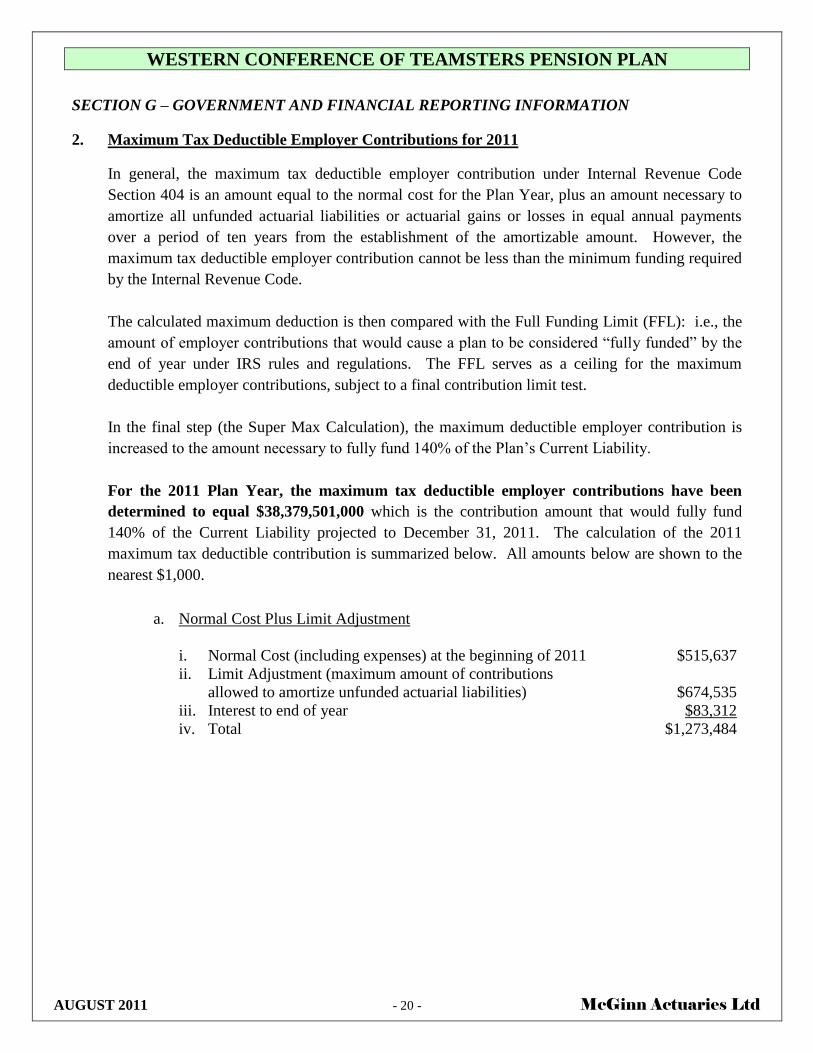
2. Maximum Tax Deductible Employer Contributions for 2011
In general, the maximum tax deductible employer contribution under Internal Revenue Code
Section 404 is an amount equal to the normal cost for the Plan Year, plus an amount necessary to
amortize all unfunded actuarial liabilities or actuarial gains or losses in equal annual payments
over a period of ten years from the establishment of the amortizable amount. However, the
maximum tax deductible employer contribution cannot be less than the minimum funding required
by the Internal Revenue Code.
The calculated maximum deduction is then compared with the Full Funding Limit (FFL): i.e., the
amount of employer contributions that would cause a plan to be considered “fully funded” by the
end of year under IRS rules and regulations. The FFL serves as a ceiling for the maximum
deductible employer contributions, subject to a final contribution limit test.
In the final step (the Super Max Calculation), the maximum deductible employer contribution is
increased to the amount necessary to fully fund 140% of the Plan’s Current Liability.
For the 2011 Plan Year, the maximum tax deductible employer contributions have been
determined to equal $38,379,501,000 which is the contribution amount that would fully fund
140% of the Current Liability projected to December 31, 2011. The calculation of the 2011
maximum tax deductible contribution is summarized below. All amounts below are shown to the
nearest $1,000.
a. Normal Cost Plus Limit Adjustment
i. Normal Cost (including expenses) at the beginning of 2011
ii. Limit Adjustment (maximum amount of contributions
allowed to amortize unfunded actuarial liabilities)
iii. Interest to end of year
iv. Total
$515,637
$674,535
$83,312
$1,273,484
WESTERN CONFERENCE OF TEAMSTERS PENSION PLAN
AUGUST 2011 - 21 - McGinn Actuaries Ltd
SECTION G – GOVERNMENT AND FINANCIAL REPORTING INFORMATION
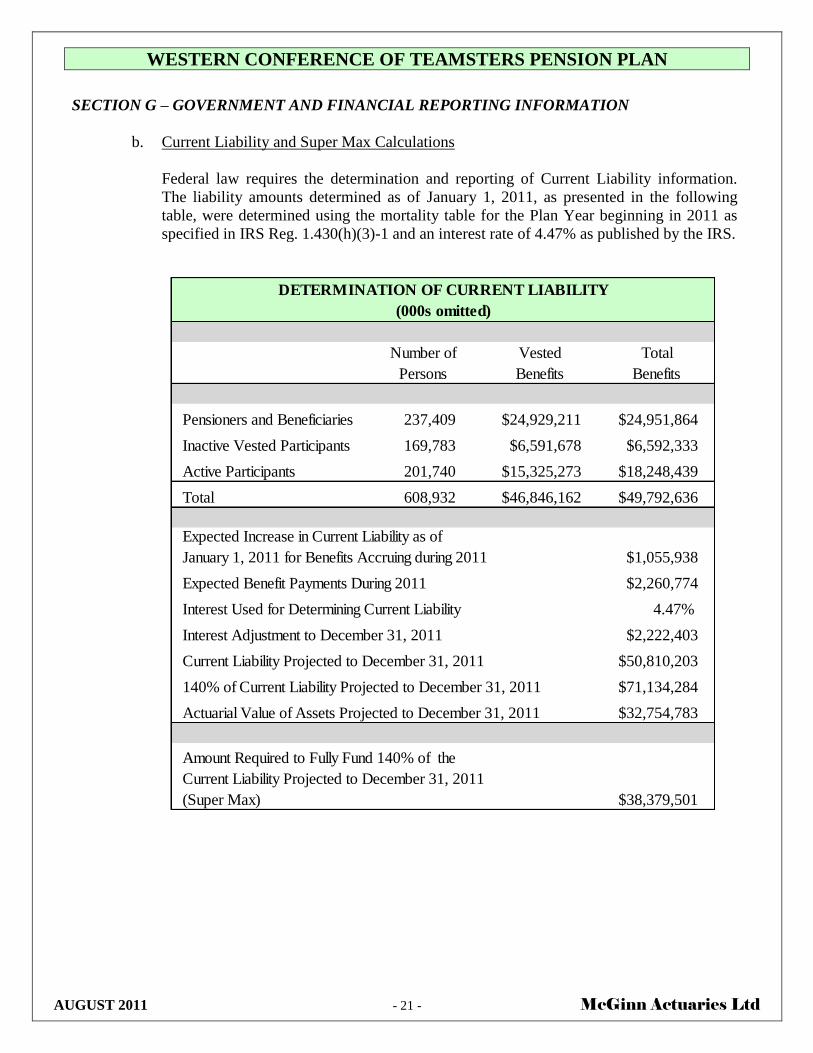
b. Current Liability and Super Max Calculations
Federal law requires the determination and reporting of Current Liability information.
The liability amounts determined as of January 1, 2011, as presented in the following
table, were determined using the mortality table for the Plan Year beginning in 2011 as
specified in IRS Reg. 1.430(h)(3)-1 and an interest rate of 4.47% as published by the IRS.
DETERMINATION OF CURRENT LIABILITY
(000s omitted)
Number of Vested Total
Persons Benefits Benefits
Pensioners and Beneficiaries 237,409 $24,929,211 $24,951,864
Inactive Vested Participants 169,783 $6,591,678 $6,592,333
Active Participants 201,740 $15,325,273 $18,248,439
Total 608,932 $46,846,162 $49,792,636
$1,055,938
$2,260,774
4.47%
$2,222,403
$50,810,203
$71,134,284
$32,754,783
$38,379,501
Actuarial Value of Assets Projected to December 31, 2011
Amount Required to Fully Fund 140% of the
Current Liability Projected to December 31, 2011
(Super Max)
Expected Increase in Current Liability as of
January 1, 2011 for Benefits Accruing during 2011
Expected Benefit Payments During 2011
Interest Used for Determining Current Liability
Interest Adjustment to December 31, 2011
Current Liability Projected to December 31, 2011
140% of Current Liability Projected to December 31, 2011

WESTERN CONFERENCE OF TEAMSTERS PENSION PLAN
AUGUST 2011 - 22 - McGinn Actuaries Ltd
SECTION G – GOVERNMENT AND FINANCIAL REPORTING INFORMATION
3. Information for Auditors
The following information is required by the auditors for inclusion in the Plan’s Financial
Statements.
Financial Statement Information (000s omitted)
a. January 1, 2011 Actuarial Value of Accumulated Plan Benefits $35,729,226
i. Vested Benefits in Pay Status $19,747,735
ii. Other Vested Benefits $14,081,375
iii. Nonvested Benefits $1,900,116
b. January 1, 2010 Actuarial Value of Accumulated Plan Benefits $34,414,558
c. Increase (Decrease) in the Actuarial Value of Accumulated Plan Benefits $1,314,668
i. Plan Amendment $0
ii. Change in Nature of Plan $0
iii. Change in Actuarial Assumptions $481,367
iv. Benefits Paid ($2,232,529)
v. Decrease in Discount Period $2,340,795
vi. Benefits Accumulated $590,984
vii. Other Experience $134,051
WESTERN CONFERENCE OF TEAMSTERS PENSION PLAN
AUGUST 2011 - 23 - McGinn Actuaries Ltd
SECTION H – PARTICIPANT DATA
The sources of WCT Plan participant data for our actuarial calculations are: (a) extracts from Prudential
Investments’ Annuitant Benefit Consolidation (ABC) System file, (b) extracts from the T2 Participant
Data File (PDF) maintained by Northwest Administrators and Prudential Investments, and (c) extracts
from the Western States Food database.
The following paragraphs describe how the data were prepared for valuation purposes and present
statistical characteristics of the data base.
1. Data Base for Active and Vested Inactive Participants
Northwest Administrators sent us a December 31, 2010 valuation data file that included T2 extract
records for non-retired participants and all claims and deaths for the last five years.
From this file containing 399,588 records, we selected the 5% sample valuation file of active and
vested inactive participants (Social Security numbers ending in 00, 05, 10, 15, or 20). A
participant was considered Active as of January 1, 2011 if he or she was not included on the ABC
file as retired as of the valuation date, and if he/she earned at least 250 covered hours during 2010,
or earned at least 1 covered hour in 2010 and at least 250 covered hours in 2009.
9,458 Non-Seasonal Active 5% sample records representing 189,160 participants were included in
the valuation. For this purpose, Active participant records with non-seasonal industry codes or
with 1,000 or more covered hours in each of the last two years were considered Non-Seasonal.
629 Seasonal Active 5% sample records representing 12,580 participants were included in the
valuation. Active participants with a seasonal industry code and less than 1,000 covered hours in
one or both of the last two years were considered Seasonal.
8,381 Vested Inactive 5% sample records representing 167,620 participants were included in the
valuation.
381,120 T2 extract records were not used for the valuation. These records primarily represent
non-5% sample participant records, pre-valuation date claims, and non-vested inactives.
Finally, in order to account for vested inactive participants associated with the Western States
Food Processors plan, but not represented among the T2 extract records, the above count of
167,620 vested inactive participants has been increased by 2,163 to 169,783. Liabilities have also
been increased to account for these participants.
WESTERN CONFERENCE OF TEAMSTERS PENSION PLAN
AUGUST 2011 - 24 - McGinn Actuaries Ltd
SECTION H – PARTICIPANT DATA
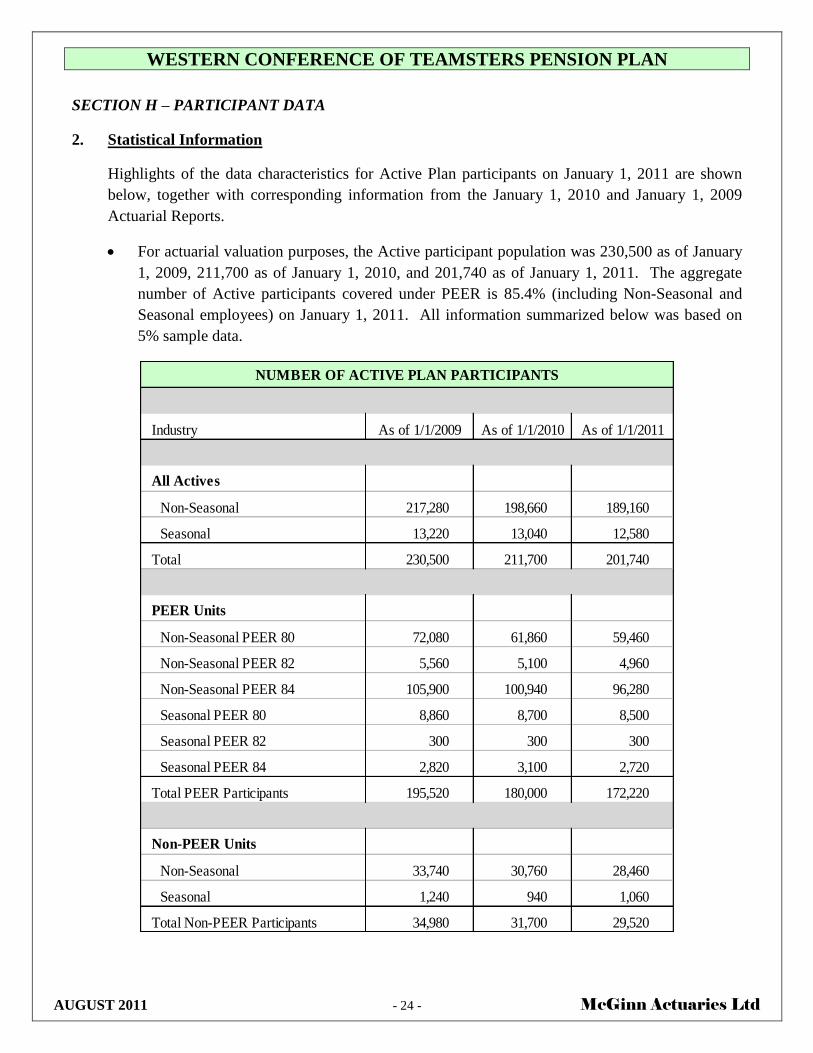
2. Statistical Information
Highlights of the data characteristics for Active Plan participants on January 1, 2011 are shown
below, together with corresponding information from the January 1, 2010 and January 1, 2009
Actuarial Reports.
For actuarial valuation purposes, the Active participant population was 230,500 as of January
1, 2009, 211,700 as of January 1, 2010, and 201,740 as of January 1, 2011. The aggregate
number of Active participants covered under PEER is 85.4% (including Non-Seasonal and
Seasonal employees) on January 1, 2011. All information summarized below was based on
5% sample data.
Industry As of 1/1/2009 As of 1/1/2010 As of 1/1/2011
All Actives
Non-Seasonal 217,280 198,660 189,160
Seasonal 13,220 13,040 12,580
Total 230,500 211,700 201,740
PEER Units
Non-Seasonal PEER 80 72,080 61,860 59,460
Non-Seasonal PEER 82 5,560 5,100 4,960
Non-Seasonal PEER 84 105,900 100,940 96,280
Seasonal PEER 80 8,860 8,700 8,500
Seasonal PEER 82 300 300 300
Seasonal PEER 84 2,820 3,100 2,720
Total PEER Participants 195,520 180,000 172,220
Non-PEER Units
Non-Seasonal 33,740 30,760 28,460
Seasonal 1,240 940 1,060
Total Non-PEER Participants 34,980 31,700 29,520
NUMBER OF ACTIVE PLAN PARTICIPANTS
WESTERN CONFERENCE OF TEAMSTERS PENSION PLAN
AUGUST 2011 - 25 - McGinn Actuaries Ltd
SECTION H – PARTICIPANT DATA
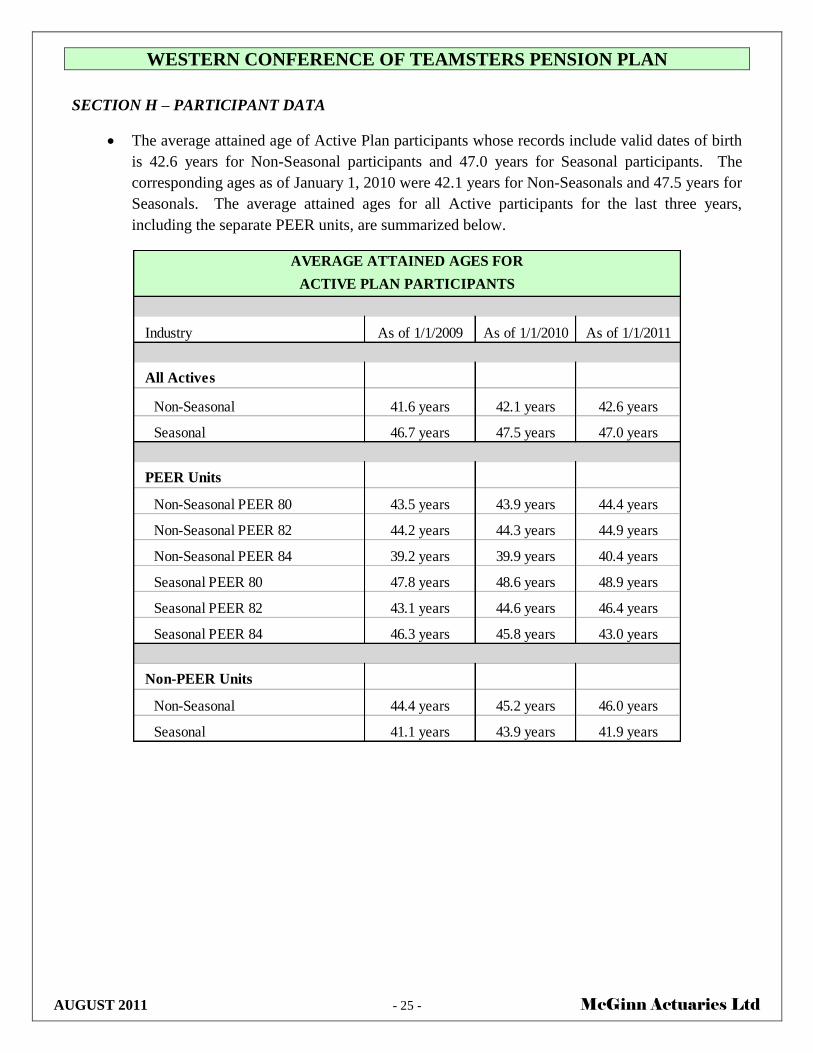
The average attained age of Active Plan participants whose records include valid dates of birth
is 42.6 years for Non-Seasonal participants and 47.0 years for Seasonal participants. The
corresponding ages as of January 1, 2010 were 42.1 years for Non-Seasonals and 47.5 years for
Seasonals. The average attained ages for all Active participants for the last three years,
including the separate PEER units, are summarized below.
Industry As of 1/1/2009 As of 1/1/2010 As of 1/1/2011
All Actives
Non-Seasonal 41.6 years 42.1 years 42.6 years
Seasonal 46.7 years 47.5 years 47.0 years
PEER Units
Non-Seasonal PEER 80 43.5 years 43.9 years 44.4 years
Non-Seasonal PEER 82 44.2 years 44.3 years 44.9 years
Non-Seasonal PEER 84 39.2 years 39.9 years 40.4 years
Seasonal PEER 80 47.8 years 48.6 years 48.9 years
Seasonal PEER 82 43.1 years 44.6 years 46.4 years
Seasonal PEER 84 46.3 years 45.8 years 43.0 years
Non-PEER Units
Non-Seasonal 44.4 years 45.2 years 46.0 years
Seasonal 41.1 years 43.9 years 41.9 years
ACTIVE PLAN PARTICIPANTS
AVERAGE ATTAINED AGES FOR

WESTERN CONFERENCE OF TEAMSTERS PENSION PLAN
AUGUST 2011 - 26 - McGinn Actuaries Ltd
SECTION H – PARTICIPANT DATA
The average number of years of contributory service for Active Plan participants is 11.8 years
for Non-Seasonal participants and is 11.1 years for Seasonal participants. As of January 1,
2010 the corresponding average number of years of contributory service was 11.1 years for
Non-Seasonals and 10.9 years for Seasonals. The average number of years of contributory
service for Active participants during the last three years are compared below.
Industry As of 1/1/2009 As of 1/1/2010 As of 1/1/2011
All Actives
Non-Seasonal 10.5 years 11.1 years 11.8 years
Seasonal 10.7 years 10.9 years 11.1 years
PEER Units
Non-Seasonal PEER 80 14.4 years 15.3 years 15.9 years
Non-Seasonal PEER 82 11.7 years 12.3 years 12.7 years
Non-Seasonal PEER 84 9.1 years 9.6 years 10.3 years
Seasonal PEER 80 12.2 years 12.6 years 13.2 years
Seasonal PEER 82 11.2 years 7.8 years 8.0 years
Seasonal PEER 84 8.2 years 7.6 years 6.6 years
Non-PEER Units
Non-Seasonal 6.7 years 7.4 years 8.0 years
Seasonal 6.1 years 7.6 years 7.4 years
AVERAGE CONTRIBUTORY SERVICE YEARS
FOR ACTIVE PLAN PARTICIPANTS
WESTERN CONFERENCE OF TEAMSTERS PENSION PLAN
AUGUST 2011 - 27 - McGinn Actuaries Ltd
SECTION H – PARTICIPANT DATA
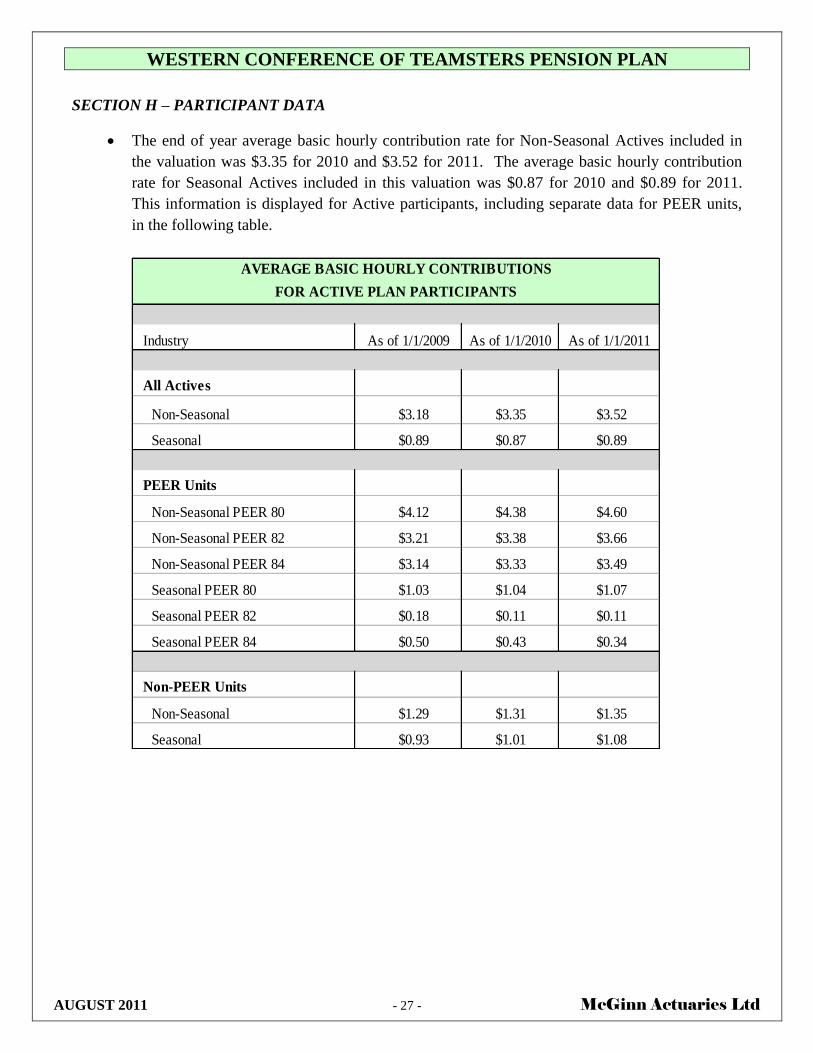
The end of year average basic hourly contribution rate for Non-Seasonal Actives included in
the valuation was $3.35 for 2010 and $3.52 for 2011. The average basic hourly contribution
rate for Seasonal Actives included in this valuation was $0.87 for 2010 and $0.89 for 2011.
This information is displayed for Active participants, including separate data for PEER units,
in the following table.
Industry As of 1/1/2009 As of 1/1/2010 As of 1/1/2011
All Actives
Non-Seasonal $3.18 $3.35 $3.52
Seasonal $0.89 $0.87 $0.89
PEER Units
Non-Seasonal PEER 80 $4.12 $4.38 $4.60
Non-Seasonal PEER 82 $3.21 $3.38 $3.66
Non-Seasonal PEER 84 $3.14 $3.33 $3.49
Seasonal PEER 80 $1.03 $1.04 $1.07
Seasonal PEER 82 $0.18 $0.11 $0.11
Seasonal PEER 84 $0.50 $0.43 $0.34
Non-PEER Units
Non-Seasonal $1.29 $1.31 $1.35
Seasonal $0.93 $1.01 $1.08
AVERAGE BASIC HOURLY CONTRIBUTIONS
FOR ACTIVE PLAN PARTICIPANTS
WESTERN CONFERENCE OF TEAMSTERS PENSION PLAN
AUGUST 2011 - 28 - McGinn Actuaries Ltd
SECTION H – PARTICIPANT DATA
Based on the data for continuing non-seasonal Active participants in the sample who worked
500 or more hours in each of the last two years, the Plan’s hourly contribution rates for
“continuing” Non-Seasonals increased an average of 9.8%. When the data are analyzed by
broad contribution rate groupings, the average increase for groups with hourly rates $2.00 and
below was 7.6% while the average increase was 9.2% for rate groups between $2.00 and $4.00,
and 12.4% for rate groups over $4.00. The higher contribution rate groups generally have
longer service and older age characteristics than the lower rate groups, and they are becoming a
larger portion of the total population. Table 2011-2 presents substantial statistical data on rate
increases during the most recent four Plan years.
3. Comparison of Sample Data Characteristics with Full Population Data Characteristics
Each year, we receive three Employee Census Reports from the Administrative Office based on
the T2 Participant Data File (PDF). The first report contains information for the full population of
Plan participants and the second and third contain corresponding information for the 2% and 5%
samples of the full population. A comparison of key information from the full population and 5%
reports is used to corroborate our assumption that the sample records adequately represent the total
population (see Table 2011-1).
4. Procedures to Account for Data with Missing or Invalid Birthdates or Sex Codes
Records with missing or invalid birthdates were accounted for by prorating the present values
generated by the records with valid birthdates, based on the number of career hours in the records
with missing or invalid birthdates. The prorating is done separately for employee groups
categorized by valuation industry code (Non-Seasonal or Seasonal), valuation status (Active or
Vested Inactive), sex code and vesting status. This straightforward approach is adequate because
of the very small liability represented by the relatively few participants in the data sample whose
records are lacking valid birthdates.
Records with missing sex codes were assumed to represent males in the Non-Seasonal group and
females in the Seasonal group. We have concluded that this assumption is reasonable based on the
population characteristics illustrated in this section.

WESTERN CONFERENCE OF TEAMSTERS PENSION PLAN
AUGUST 2011 - 29 - McGinn Actuaries Ltd
SECTION H – PARTICIPANT DATA
There were 108 non-retired valuation records, representing 2,160 participants with missing dates
of birth. There were 1,187 Non-Seasonal non-retired sample valuation records with missing or
invalid sex codes who are assumed to be males and 137 Seasonal non-retired sample valuation
records with missing or invalid sex codes who are assumed to be female. The non-retired
participant T2 extract records included in the valuation had the characteristics shown in the
following table:
Non-Retired Data With Missing or Invalid Birthdates or Sex Codes
Number of Records x 20 % Without
With Valid Without Valid Valid
Status Sex Code Date of Birth Date of Birth Date of Birth
Non-Seasonal Active Vested Male 121,800 40 0.03%
Non-Seasonal Active Vested Female 21,160 20 0.09%
Non-Seasonal Active Non-Vested Male 39,680 1,220 2.98%
Non-Seasonal Active Non-Vested Female 5,180 60 1.15%
Seasonal Active Vested Male 2,240 0 0.00%
Seasonal Active Vested Female 6,260 40 0.63%
Seasonal Active Non-Vested Male 1,280 0 0.00%
Seasonal Active Non-Vested Female 2,660 100 3.62%
Non-Seasonal Vested Inactive Male 128,700 380 0.29%
Non-Seasonal Vested Inactive Female 22,480 40 0.18%
Seasonal Vested Inactive Male 5,500 20 0.36%
Seasonal Vested Inactive Female 10,260 240 2.29%
WESTERN CONFERENCE OF TEAMSTERS PENSION PLAN
AUGUST 2011 - 30 - McGinn Actuaries Ltd
SECTION H – PARTICIPANT DATA
5. Age Retirees, Disability Retirees, and Surviving Beneficiaries
We based our actuarial calculations for retired lives on extracts from the ABC retired file provided
by Prudential Investments. This file contains records for all Pensioners and Beneficiaries.
We received 247,942 records from Prudential, and added 3 records from the prior year file, based
on our review of Prudential’s “Previous Year Liability Lives Missing from Current Year File”
exhibit. Of these 247,945 records, 10,536 were disregarded (9,415 deaths, 391 expirations, and
730 other rejects such as cancellations, post-valuation date retirements, etc.). This resulted in the
inclusion of 237,409 records representing all benefits associated with 201,398 participants.
Approximately 77.1% of these records are for Age Retirees, 9.0% are for Disability Retirees, and
13.9% are for Beneficiaries. There were no missing birthdates in these records.

WESTERN CONFERENCE OF TEAMSTERS PENSION PLAN
AUGUST 2011 - 31 - McGinn Actuaries Ltd
SECTION I – ACTUARIAL ASSUMPTIONS AND METHODS
1. Actuarial Assumptions
a. Investment Earnings Assumptions
i. Fixed Dollar Account: The assumed investment return for these assets, which is used to
value the pension benefits1 for Pensioners and Beneficiaries whose benefits commenced
on or before August 1, 1982 (as identified by Prudential Investments), is determined by a
schedule of rates that varies by calendar year, starting at 6.9% in 2011 and decreasing to
6.5% in 2015 and thereafter.
ii. 1982/1984 Annuity Account: The assumed rate of return for these assets, which is used
to value the pension benefits1
for Pensioners and Beneficiaries whose benefits
commenced from September, 1982 through December, 1984 (as identified by Prudential
Investments), is 4.51%.
iii. Strategic Bond Account (SBA): The assumed rate of return for these assets is 5.79%.
This assumption is used to value 85.2% of the pension benefits1 related to service through
December 31, 1985, based on December 31, 1984 Plan provisions and not covered by the
prior asset dedications.
iv. Remaining Assets/Benefits: The assumed rate of investment return which is used to
value all benefits expected to be paid out of remaining assets and future contributions is
7.0%.
1 Single sum death benefits are not valued using the investment earnings assumptions
described above. Instead, the “Remaining Assets” assumption is used.
WESTERN CONFERENCE OF TEAMSTERS PENSION PLAN
AUGUST 2011 - 32 - McGinn Actuaries Ltd
SECTION I – ACTUARIAL ASSUMPTIONS AND METHODS
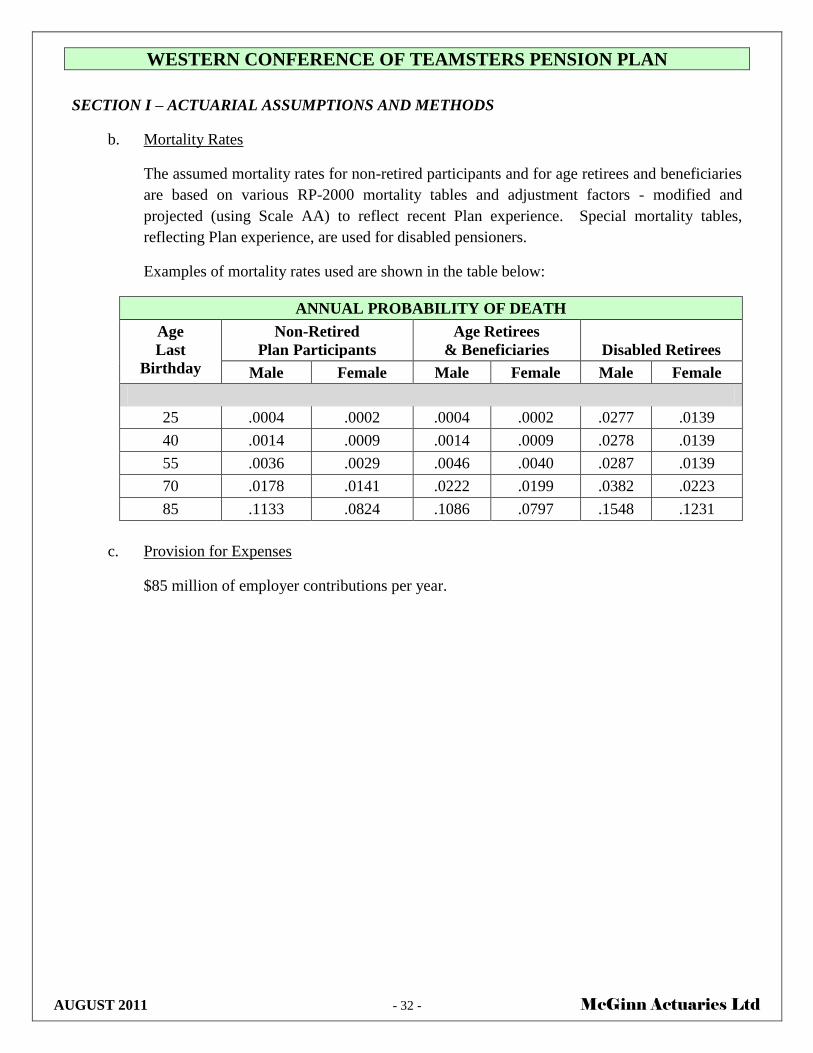
b. Mortality Rates
The assumed mortality rates for non-retired participants and for age retirees and beneficiaries
are based on various RP-2000 mortality tables and adjustment factors - modified and
projected (using Scale AA) to reflect recent Plan experience. Special mortality tables,
reflecting Plan experience, are used for disabled pensioners.
Examples of mortality rates used are shown in the table below:
ANNUAL PROBABILITY OF DEATH
Age
Last
Birthday
Non-Retired
Plan Participants
Age Retirees
& Beneficiaries
Disabled Retirees
Male Female Male Female Male Female
25 .0004 .0002 .0004 .0002 .0277 .0139
40 .0014 .0009 .0014 .0009 .0278 .0139
55 .0036 .0029 .0046 .0040 .0287 .0139
70 .0178 .0141 .0222 .0199 .0382 .0223
85 .1133 .0824 .1086 .0797 .1548 .1231
c. Provision for Expenses
$85 million of employer contributions per year.

WESTERN CONFERENCE OF TEAMSTERS PENSION PLAN
AUGUST 2011 - 33 - McGinn Actuaries Ltd
SECTION I – ACTUARIAL ASSUMPTIONS AND METHODS
d. Age Retirement Rates for Participants with fewer than 25 Years of Service
Age retirement rates apply only to retirement eligible participants.
Age Last Birthday
Non-PEER
Actives
PEER Eligible
Actives
Vested
Terminated
49 .030 .150 N/A
50 .030 .150 N/A
51 .030 .150 N/A
52 .030 .150 N/A
53 .030 .150 N/A
54 .080 .160 .160
55 .060 .120 .120
56 .060 .120 .060
57 .060 .120 .060
58 .060 .120 .060
59 .100 .200 .100
60 .100 .200 .100
61 .350 .350 .300
62 .350 .350 .200
63 .150 .150 .150
64 .300 .300 .300
65 .300 .300 .200
66 .200 .200 .060
67 .200 .200 .060
68 .200 .200 .060
69 1.000 1.000 1.000
WESTERN CONFERENCE OF TEAMSTERS PENSION PLAN
AUGUST 2011 - 34 - McGinn Actuaries Ltd
SECTION I – ACTUARIAL ASSUMPTIONS AND METHODS
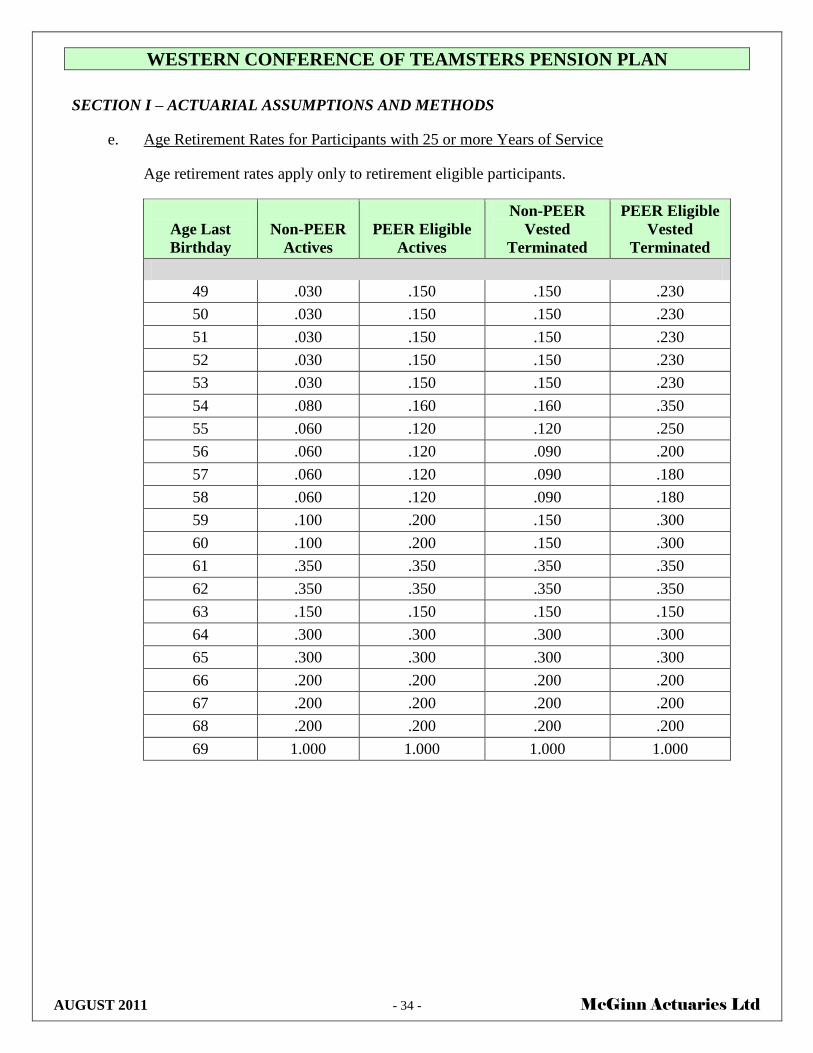
e. Age Retirement Rates for Participants with 25 or more Years of Service
Age retirement rates apply only to retirement eligible participants.
Age Last
Birthday
Non-PEER
Actives
PEER Eligible
Actives
Non-PEER
Vested
Terminated
PEER Eligible
Vested
Terminated
49 .030 .150 .150 .230
50 .030 .150 .150 .230
51 .030 .150 .150 .230
52 .030 .150 .150 .230
53 .030 .150 .150 .230
54 .080 .160 .160 .350
55 .060 .120 .120 .250
56 .060 .120 .090 .200
57 .060 .120 .090 .180
58 .060 .120 .090 .180
59 .100 .200 .150 .300
60 .100 .200 .150 .300
61 .350 .350 .350 .350
62 .350 .350 .350 .350
63 .150 .150 .150 .150
64 .300 .300 .300 .300
65 .300 .300 .300 .300
66 .200 .200 .200 .200
67 .200 .200 .200 .200
68 .200 .200 .200 .200
69 1.000 1.000 1.000 1.000

WESTERN CONFERENCE OF TEAMSTERS PENSION PLAN
AUGUST 2011 - 35 - McGinn Actuaries Ltd
SECTION I – ACTUARIAL ASSUMPTIONS AND METHODS
f. Disability Retirement
Disability rates apply only to employees with 4 or more years of vesting service.
Age
Last
Birthday
Examples of
Annual Probability
of Retirement
32 .0006
37 .0008
42 .0011
47 .0017
52 .0030
57 .0052

WESTERN CONFERENCE OF TEAMSTERS PENSION PLAN
AUGUST 2011 - 36 - McGinn Actuaries Ltd
SECTION I – ACTUARIAL ASSUMPTIONS AND METHODS
g. Employee Termination Rates
The termination rates shown below exclude death, disability and retirement rates.
Termination rates are not applied when an individual is eligible for age retirement. Below
are examples of annual probabilities of employment termination for active employees with
less than 9 years of coverage.
NON-SEASONAL EMPLOYEES
Age Last Birthday
At First Covered Hour
Years Since First Covered Hour
0 1 2 8
22 .0945 .1795 .2272 .1120
32 .0844 .1478 .1914 .0896
42 .0776 .1214 .1674 .0784
52 .0641 .0898 .1435 .0784
62 .0574 .0686
SEASONAL EMPLOYEES
Age Last Birthday
At First Covered Hour
Years Since First Covered Hour
0 1 2 8
22 .7004 .5443 .3039 .1600
32 .6254 .4482 .2559 .1280
42 .5754 .3682 .2240 .1120
52 .4753 .2721 .1920 .1120
62 .4253 .2081
WESTERN CONFERENCE OF TEAMSTERS PENSION PLAN
AUGUST 2011 - 37 - McGinn Actuaries Ltd
SECTION I – ACTUARIAL ASSUMPTIONS AND METHODS
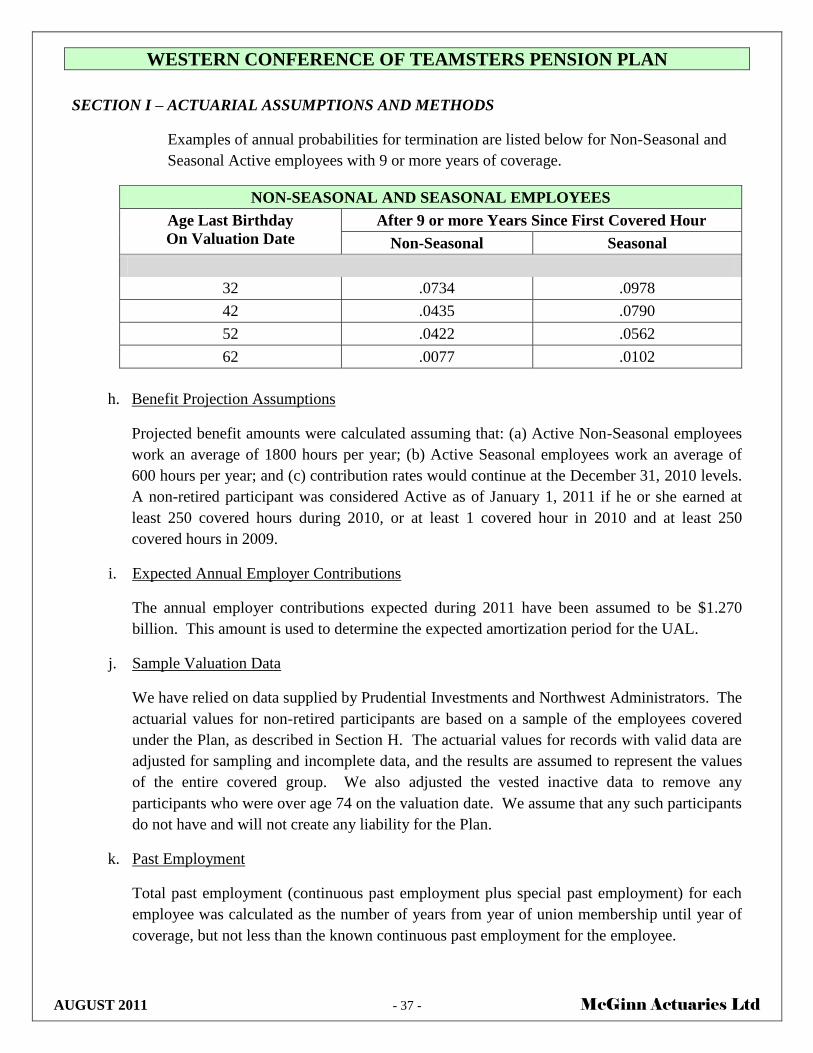
Examples of annual probabilities for termination are listed below for Non-Seasonal and
Seasonal Active employees with 9 or more years of coverage.
NON-SEASONAL AND SEASONAL EMPLOYEES
Age Last Birthday
On Valuation Date
After 9 or more Years Since First Covered Hour
Non-Seasonal Seasonal
32 .0734 .0978
42 .0435 .0790
52 .0422 .0562
62 .0077 .0102
h. Benefit Projection Assumptions
Projected benefit amounts were calculated assuming that: (a) Active Non-Seasonal employees
work an average of 1800 hours per year; (b) Active Seasonal employees work an average of
600 hours per year; and (c) contribution rates would continue at the December 31, 2010 levels.
A non-retired participant was considered Active as of January 1, 2011 if he or she earned at
least 250 covered hours during 2010, or at least 1 covered hour in 2010 and at least 250
covered hours in 2009.
i. Expected Annual Employer Contributions
The annual employer contributions expected during 2011 have been assumed to be $1.270
billion. This amount is used to determine the expected amortization period for the UAL.
j. Sample Valuation Data
We have relied on data supplied by Prudential Investments and Northwest Administrators. The
actuarial values for non-retired participants are based on a sample of the employees covered
under the Plan, as described in Section H. The actuarial values for records with valid data are
adjusted for sampling and incomplete data, and the results are assumed to represent the values
of the entire covered group. We also adjusted the vested inactive data to remove any
participants who were over age 74 on the valuation date. We assume that any such participants
do not have and will not create any liability for the Plan.
k. Past Employment
Total past employment (continuous past employment plus special past employment) for each
employee was calculated as the number of years from year of union membership until year of
coverage, but not less than the known continuous past employment for the employee.
WESTERN CONFERENCE OF TEAMSTERS PENSION PLAN
AUGUST 2011 - 38 - McGinn Actuaries Ltd
SECTION I – ACTUARIAL ASSUMPTIONS AND METHODS
l. Survivor Benefit Costs
The family composition of covered employees was assumed to be similar to that tabulated in
the 15th
Actuarial Valuation published by the Railroad Retirement Board. This assumption was
used to estimate the probability that an employee will be survived by a beneficiary eligible for
a survivor benefit and to establish the probable duration of the benefit.
m. Entry Age Distribution
The entry age distributions used to determine the normal cost were based on the age-at-
participation characteristics of employees who have recently become participants. The
assumed distributions are illustrated in Table 2011-4. New Non-Seasonal participants were
assumed to have accrued 900 covered hours and new Seasonal participants 450 covered hours
on their participation date.
2. Actuarial Methods
a. Actuarial Value of Assets
The Prudential Investments Fixed Dollar Account (FDA), in general, was valued at book
value. However, to the extent the FDA value was lower than the retired life liabilities that its
value was required to support, certain bonds valued at amortized cost were assigned to the
FDA so that all FDA liabilities were supported by dedicated assets. When book value is
referenced, such value is equal to amounts deposited, plus interest credited less amounts
disbursed. The 1982/1984 Annuity Account and the SBA were valued on an amortized cost
basis, running from cost at purchase to par value at maturity or earliest call date.
The remaining assets were valued using a smoothing procedure under which the 2008 market
value is recognized at the rate of 10% per year for ten years. All other market value gains
and losses are recognized at the rate of 20% per year over five years. The actuarial value of
the remaining assets may not be greater than 120% or less than 80% of the market value.
WESTERN CONFERENCE OF TEAMSTERS PENSION PLAN
AUGUST 2011 - 39 - McGinn Actuaries Ltd
SECTION I – ACTUARIAL ASSUMPTIONS AND METHODS
b. Actuarial Cost Method
The entry age actuarial cost method was used. Specifically, prospective pension and other
benefits are calculated for cohorts of new entrants with entry age characteristics as outlined
above. Level cost factors, expressed as a fraction of expected contributions payable from
entry age to retirement or earlier termination, are developed based upon the actuarial
assumptions for each of four major categories of active participants. – i.e., Non-Seasonal
with PEER participation, Non-Seasonal without PEER participation, Seasonal with PEER
participation, and Seasonal without PEER participation. These cost factors are then applied
to the respective active participant categories to determine the normal costs.
The present value of the expected future benefits payable to current Plan members is also
calculated. The actuarial liability is the excess of the present value of the future benefits of
current Plan members over the present value of future normal costs.

WESTERN CONFERENCE OF TEAMSTERS PENSION PLAN
AUGUST 2011 - 40 - McGinn Actuaries Ltd
SECTION J – SUMMARY OF PLAN PROVISIONS EFFECTIVE JANUARY 1, 2011
1. Active Participation
Non-Seasonal employees for whom contributions are required to be made to the Trust under the
terms of a pension agreement become “Active Participants” on the day on which they first
accumulate 750 covered hours in the current and immediately preceding calendar years. Seasonal
employees become “Active Participants” if they satisfy one-half of the covered hour requirement
of Non-Seasonal employees.
2. Monthly Pension at Normal Retirement
The monthly pension earned for service prior to 1987 is determined based on the 1986 Plan
provisions as outlined in the January 1, 1986 Actuarial Report. The final five-year average
contribution rate used for this determination will recognize contribution rates applicable to all 500
hour years through 1991.
For service after 1986, monthly pension benefits are earned as follows:
Calendar Year
Contribution Percentage
1st 20 years After 20 years
1987 – 1991 2.00% 2.65%
1992 – 1996 2.30% 3.05%
1997 – 1999 2.46% 3.26%
2000 – 2002 2.70% 3.58%
1/2003 – 6/2003 2.20% 2.92%
7/2003 – 2006 1.20% 1.20%
2007 1.65% 1.65%
2008 2.00% 2.65%
2009 + 1.20% 1.20%
3. Past Service Credits
A participant is granted credit for the number of years and months of specified types of unbroken
employment rendered prior to his or her first covered hour, subject to limits specified in the Plan.

WESTERN CONFERENCE OF TEAMSTERS PENSION PLAN
AUGUST 2011 - 41 - McGinn Actuaries Ltd
SECTION J – SUMMARY OF PLAN PROVISIONS EFFECTIVE JANUARY 1, 2011
4. Vesting Service
A Plan member earns a vesting service year for each year after 1975 during which he or she is
credited with at least 500 covered hours (250 covered hours for Seasonal Plan members). For
service before 1976, a Plan member is credited with a vesting service year for each year of
continuous coverage under the Plan.
5. Normal Retirement Age
The later of age 65 or an Active participant’s age on the second anniversary of his or her first
covered hour.
6. Normal Pension Form
The normal form of pension for unmarried participants is a Life Only Pension. In general, married
participants who do not elect otherwise receive a reduced Employee and Spouse Pension. This
reduced amount is an “actuarial equivalent” of the Life Only Pension. Participants who retired
under the Employee and Spouse Pension Option will have their pension restored to the amount
payable under the Normal Form if the spouse dies first. In the event that the participant dies first,
the amount of spouse pension is 66 2/3% of the retiree’s pension for those who retired after 1991
with recent coverage; otherwise the amount of spouse pension is 50% of the retiree’s pension. In
both instances, the actuarial reduction factor for the Employee and Spouse Benefit amount is
calculated as though the spouse pension benefit would be 50% of the reduced Employee and
Spouse Pension.
7. Other Pension Forms
An Optional Employee and Spouse Pension providing a 75% spouse pension is available.
Participants retiring under age 65 may elect a Benefit Adjustment Option with or without the
regular or Optional Employee and Spouse Pension.
8. Early Retirement Eligibility Date
In general, this date is the first day of the month coincident with or immediately following the later
of the participant’s 55th
birthday or the date the individual becomes a vested participant. However,
a participant with recent coverage may retire at any age if he or she meets the Rule of 84 (or Rule
of 82 or Rule of 80) under the Program for Enhanced Early Retirement (PEER program); that is,
the sum of his or her attained age plus years of contributory service is equal to or greater than 84
(or 82 or 80).
WESTERN CONFERENCE OF TEAMSTERS PENSION PLAN
AUGUST 2011 - 42 - McGinn Actuaries Ltd
SECTION J – SUMMARY OF PLAN PROVISIONS EFFECTIVE JANUARY 1, 2011
9. Monthly Pension at Early Retirement for a Participant with Recent Coverage
If a participant meets the Rule of 84 and has recent coverage, the monthly pension benefit is
reduced by the sum of 0.45% for each of the first 60 months that the early retirement date precedes
his or her 62nd
birthday plus 0.33% for each month that the early retirement date precedes his or
her 57th
birthday.
If a participant has recent coverage but does not meet the Rule of 84, his or her monthly pension
benefit is reduced by the sum of 0.60% for each of the first 60 months that the early retirement
date precedes his or her 62nd
birthday plus 0.40% for each month that the early retirement date
precedes his or her 57th
birthday.
10. Monthly Pension at Early Retirement for a Participant with Current PEER Coverage
If a participant meets the Rule of 84 (or Rule of 82 or Rule of 80), is a member of a bargaining unit
which has negotiated PEER 84 (or PEER 82 or PEER 80) contribution surcharges, and has current
PEER coverage, the early retirement benefit equals 100% of the earned pension benefits. A
participant has current PEER coverage at his or her retirement effective date if the applicable
PEER contributions have been paid for at least 1,000 covered hours in the 24-month period
immediately preceding his or her retirement effective date.
Note: If a participant is in a category of early retirement where benefits are subsidized (as
described in paragraph 1 of Item 9 or in Item 10) and accumulates 25 years of service
under the Plan while so covered, then his or her subsidized early retirement benefits are
“locked-in” and cannot be forfeited.
11. Disability Benefit
Upon a vested participant’s total and permanent disability before age 65, the monthly benefit is the
greater of (a) 85% of the earned monthly pension benefit or (b) the early retirement pension
otherwise payable, provided the vested participant has met the specified recent coverage
requirement on the disability onset date.
12. Vested Benefit Upon Termination of Employment
Upon termination of employment, a participant is vested in his or her accrued pension, based on
past and future service credits, if he or she has completed at least 5 years of vesting service, one of
which was completed during or after 1991.
WESTERN CONFERENCE OF TEAMSTERS PENSION PLAN
AUGUST 2011 - 43 - McGinn Actuaries Ltd
SECTION J – SUMMARY OF PLAN PROVISIONS EFFECTIVE JANUARY 1, 2011
A terminated vested participant may elect early commencement of the earned retirement benefit at
any time on or after the Early Retirement Eligibility Date. If the participant does not have recent
coverage and has not “locked-in” rights to unreduced pension benefits by having completed 25
years of Plan service before termination, the benefit is reduced by the sum of 0.6% per month for
each of the first 60 months that the early retirement date precedes the participant’s 65th
birthday
plus 0.4% per month for each month that such early retirement date precedes the participant’s 60th
birthday.
Vested participants who are not covered by the current Plan provisions may be subject to
additional limitations on their benefits.
13. Death Benefits
Upon the death of a participant or pensioner who has met the specified recent coverage
requirement, a temporary monthly pension is payable to the surviving children under conditions
specified in the Plan.
A pre-retirement benefit to the surviving spouse is payable upon the death of a vested participant.
If a married participant had recent coverage at the time of death, the spouse receives an immediate
benefit based on the participant’s earned benefit. The earned benefit is reduced to reflect early
retirement, as specified in the Plan, and the appropriate Employee and Spouse Pension factor. 66
2/3% of the resulting amount is then payable immediately to the spouse. If the participant does not
have recent coverage, the benefit is calculated as described above, but a 50% factor is applied in
lieu of the 66 2/3% factor, and, if the participant was not eligible to retire on the date of death,
commencement of the pension is deferred until the time the participant would have been first
eligible to retire.
A single sum death benefit equal to 50% of contributions, subject to a maximum of $10,000, is
payable upon the death of an Active or Terminated participant who has completed at least 5 years
of vesting service. In addition, for unmarried vested participants who satisfy the recent coverage
requirements and would otherwise be eligible to retire, a death benefit of 48 times the participant’s
accrued pension, reduced to reflect early retirement as specified in the Plan, is payable as a lump
sum amount.
Upon the death of a pensioner with a retirement date before January 1, 1992, a single sum benefit
of 12 times the monthly normal form pension (Life Only annuity), subject to a maximum of
$10,000 is payable. Beginning with retirements in 1992, beneficiaries of retirees with recent
coverage who elect a Life Only or Benefit Adjustment Option (without the Spouse Pension)
receive a 4-Year Certain death benefit payment equal to 48 times the pensioner’s Life Only benefit
minus the total monthly payments already received by the pensioner.

WESTERN CONFERENCE OF TEAMSTERS PENSION PLAN
AUGUST 2011 - 44 - McGinn Actuaries Ltd
SECTION J – SUMMARY OF PLAN PROVISIONS EFFECTIVE JANUARY 1, 2011
If a pensioner retires after January 1, 1992, he or she may elect an Optional Lump Sum Death
Benefit equal to 12 times the monthly normal form pension (Life Only annuity). The Optional
Lump Sum Death Benefit is paid for by reducing the pensioner’s monthly payment.
14. Transition Provisions
Certain minimum benefits are provided to participants who were covered by prior versions of the
Plan.
WESTERN CONFERENCE OF TEAMSTERS PENSION PLAN
AUGUST 2011 - 45 - McGinn Actuaries Ltd
INTRODUCTION TO THE TABLES OF 2011 STATISTICAL DATA
In the process of completing the actuarial valuation, we have compiled a considerable amount of
statistical information that may prove useful in understanding the operation of the Plan. This
information is illustrated in the following tables:
TABLE 2011-1 Comparison of Sample Data with Total Population Data for Active Vested
Participants
This table demonstrates that the 5% sample reasonably represents the entire population. Sample
and full file participant counts, average hours and average contribution rates are compared for
Active Vested participants. The table provides breakdowns of the data by forty-cent rate bands
through $5.20, and for rates over $5.20. The correlation between sample and total population
also was tested for non-vested and new participants and, in our opinion, actuarial results based
on the sample population (as described in Section H) adequately represent values for the total
population.
TABLE 2011-2 Basic Rate Increases for Continuing Non-Seasonal Active Participants
This table shows the year-to-year increases in contribution rates for continuing Active Non-
Seasonal participants, analyzed by end of year basic contribution rates. The percentage increases
are shown for four experience years.
TABLE 2011-3 Distribution of Non-Seasonal Active Participants in PEER and Non-PEER
Units by Contribution Rate
This table shows the distribution of Non-Seasonal Actives in PEER and Non-PEER units by their
basic hourly contribution rates.
TABLE 2011-4 Age at First Participation Distributions – Comparison of Experience with
Actuarial Assumptions
This table compares the entry age distributions of new participants during the most recent three
years with the assumed distributions used in calculating the Plan’s normal cost. The relationship
of actual versus assumed percentages indicates that the assumptions remain suitable for normal
cost calculation purposes.

WESTERN CONFERENCE OF TEAMSTERS PENSION PLAN
AUGUST 2011 - 46 - McGinn Actuaries Ltd
INTRODUCTION TO THE TABLES OF 2011 STATISTICAL DATA
TABLE 2011-5 Distribution of Non-Seasonal Active Participants with Good Birthdates by
Attained Age and Contributory Service
This table shows how Non-Seasonal Active participants with valid birthdates are distributed by
attained age and length of service.
TABLE 2011-6 Data Build-Through Report/Participant Reconciliation
This table exhibits a data reconciliation by status for Active and Vested Terminated participants.
TABLE 2011-7 and 2011-8 New 2010 Pensioners and Beneficiaries; Recent History of New
Pensioners
Table 2011-7 shows the counts and average monthly pensions for Age Pensioners, Disabled
Pensioners and Beneficiaries who were new to the December 31, 2010 retiree data file. The data
for Age Pensioners is shown by option election.
Table 2011-8 compares the counts and average monthly pensions of new Pensioners during the
most recent three-year period.
TABLE 2011-9 Historical Statistics by Year of Retirement
For this table, all records representing Age Pensioners were analyzed by year of retirement.
TABLE 2011-10 through 2011-12 Age/Longevity of Age Pensioners, Beneficiaries and
Disabled Pensioners
These tables show the distribution of Pensioners and Beneficiaries by attained age group and
number of years since retirement or pension commencement, as applicable.
The count for Disabled Pensioners is somewhat inflated by the existence of record pairs for
many of the Disabled Retirees receiving an increase because of the increase in the floor
percentage from 62% to 85%, effective January 1, 2000.

WESTERN CONFERENCE OF TEAMSTERS PENSION PLAN
AUGUST 2011 - 47 - McGinn Actuaries Ltd
INTRODUCTION TO THE TABLES OF 2011 STATISTICAL DATA
TABLE 2011-13 Life Expectancies for Pensioners
This table shows the number of years of life expectancy for retirees according to the mortality
tables (see Section I.1.b. for description of tables) used to value liabilities under the Plan. The
long periods over which age retirees are expected to receive payments indicate the significant
assets required to fund benefits for participants who are already retired. The shorter life
expectancies for Disabled Pensioners imply a lower level of assets required for males and
females who retire under the Plan’s disability provisions.

WESTERN CONFERENCE OF TEAMSTERS PENSION PLAN
AUGUST 2011 - 48 - McGinn Actuaries Ltd
TABLE 2011-1
Comparison of Sample Data with Total Population Data
for Active Vested Participants
No. of Avg. 2010 Avg. 2010 Avg. 2010 Avg. 2010
Participants Hrs. per Contrib. No. of Hrs. per Contrib.
Contribution Rates (Times 20) Participant Rate Participants Participant Rate
Seasonals - Food Processing
All Contribution Rates 8,980 663 $0.99 9,538 654 $0.94
Regulars - Food Processing
All Contribution Rates 7,100 2,040 $1.66 6,856 2,010 $1.64
Non-Seasonals - Non-Food Processing
$0.40 and under 2,140 1,707 $0.24 2,146 1,725 $0.24
Over $0.40 but not
more than $0.80 3,940 1,879 $0.59 4,132 1,871 $0.60
Over $0.80 but not
more than $1.20 12,360 1,847 $1.02 11,874 1,838 $1.02
Over $1.20 but not
more than $1.60 7,500 1,891 $1.42 7,762 1,903 $1.42
Over $1.60 but not
more than $2.00 8,900 1,918 $1.83 8,577 1,921 $1.82
Over $2.00 but not
more than $2.40 6,760 1,910 $2.20 7,340 1,953 $2.20
Over $2.40 but not
more than $2.80 6,800 1,898 $2.66 6,902 1,919 $2.65
Over $2.80 but not
more than $3.20 12,680 1,932 $3.04 12,151 1,950 $3.04
Over $3.20 but not
more than $3.60 12,460 1,929 $3.41 12,175 1,935 $3.41
Over $3.60 but not
more than $4.00 8,880 1,980 $3.83 8,656 1,962 $3.82
Over $4.00 but not
more than $4.40 7,580 1,982 $4.20 7,899 1,942 $4.20
Over $4.40 but not
more than $4.80 2,680 1,912 $4.61 3,082 1,910 $4.61
Over $4.80 but not
more than $5.20 2,220 1,884 $4.93 2,371 1,914 $4.93
Over $5.20 37,360 1,689 $6.46 37,213 1,705 $6.47
Total Non-Seasonals -
Non-Food Processing 132,260 1,849 $3.61 132,280 1,856 $3.61
5% Sample Total Population
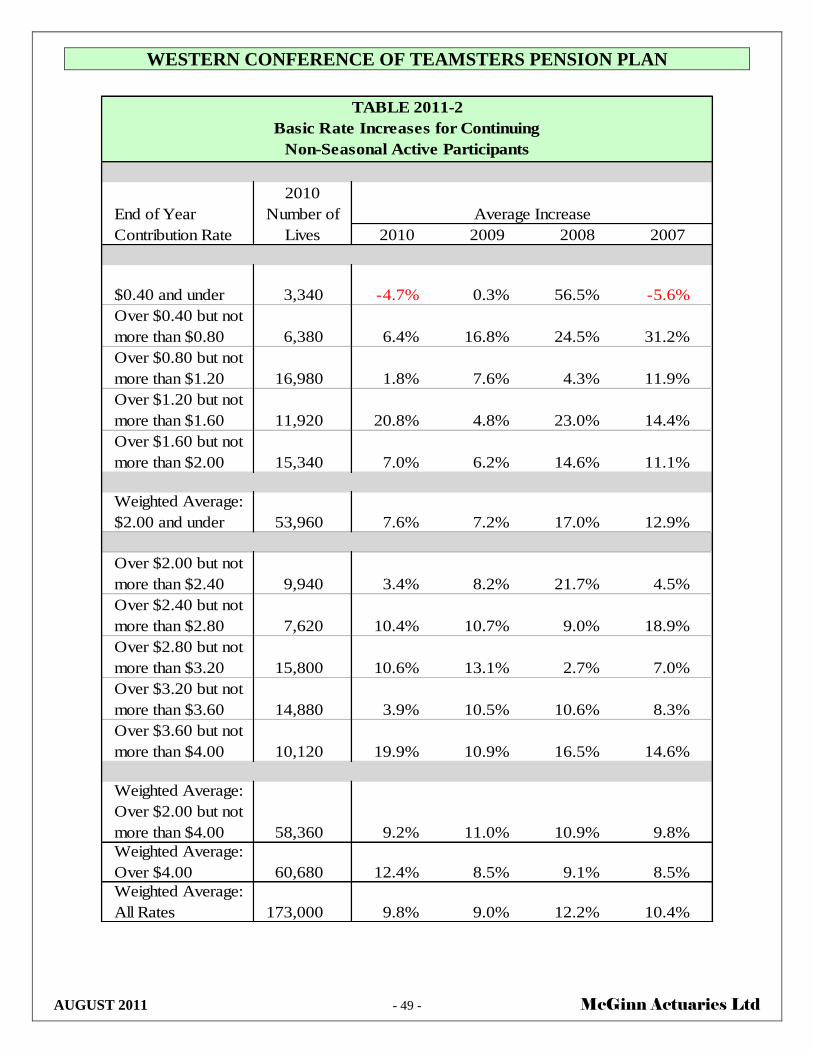
WESTERN CONFERENCE OF TEAMSTERS PENSION PLAN
AUGUST 2011 - 49 - McGinn Actuaries Ltd
TABLE 2011-2
Basic Rate Increases for Continuing
Non-Seasonal Active Participants
2010
End of Year Number of
Contribution Rate Lives 2010 2009 2008 2007
$0.40 and under 3,340 -4.7% 0.3% 56.5% -5.6%
Over $0.40 but not
more than $0.80 6,380 6.4% 16.8% 24.5% 31.2%
Over $0.80 but not
more than $1.20 16,980 1.8% 7.6% 4.3% 11.9%
Over $1.20 but not
more than $1.60 11,920 20.8% 4.8% 23.0% 14.4%
Over $1.60 but not
more than $2.00 15,340 7.0% 6.2% 14.6% 11.1%
Weighted Average:
$2.00 and under 53,960 7.6% 7.2% 17.0% 12.9%
Over $2.00 but not
more than $2.40 9,940 3.4% 8.2% 21.7% 4.5%
Over $2.40 but not
more than $2.80 7,620 10.4% 10.7% 9.0% 18.9%
Over $2.80 but not
more than $3.20 15,800 10.6% 13.1% 2.7% 7.0%
Over $3.20 but not
more than $3.60 14,880 3.9% 10.5% 10.6% 8.3%
Over $3.60 but not
more than $4.00 10,120 19.9% 10.9% 16.5% 14.6%
Weighted Average:
Over $2.00 but not
more than $4.00 58,360 9.2% 11.0% 10.9% 9.8%
Weighted Average:
Over $4.00 60,680 12.4% 8.5% 9.1% 8.5%
Weighted Average:
All Rates 173,000 9.8% 9.0% 12.2% 10.4%
Average Increase

WESTERN CONFERENCE OF TEAMSTERS PENSION PLAN
AUGUST 2011 - 50 - McGinn Actuaries Ltd
Number of Total
End of Year Number of Non-PEER Number of
Contribution Rate PEER Actives Actives Actives
$0.40 and under 760 3,640 4,400
Over $0.40 but not more than $0.80 1,820 5,160 6,980
Over $0.80 but not more than $1.20 13,460 5,620 19,080
Over $1.20 but not more than $1.60 6,840 6,180 13,020
Over $1.60 but not more than $2.00 13,660 3,080 16,740
Total for Rates $2.00 and under 36,540 23,680 60,220
Over $2.00 but not more than $2.40 9,080 1,620 10,700
Over $2.40 but not more than $2.80 7,600 680 8,280
Over $2.80 but not more than $3.20 15,520 980 16,500
Over $3.20 but not more than $3.60 15,480 540 16,020
Over $3.60 but not more than $4.00 10,600 300 10,900
Total for Rates over $2.00
but not more than $4.00 58,280 4,120 62,400
Total for Rates over $4.00 65,880 660 66,540
Total for All Rates 160,700 28,460 189,160
Prior Year's
Percentage of Percentage of
Non-Seasonal Non-Seasonal
Number of Actives by Actives by
PEER Unit Actives PEER Unit PEER Unit
Non-PEER 28,460 15.0% 15.5%
PEER 84 96,280 51.0% 50.8%
PEER 82 4,960 2.6% 2.6%
PEER 80 59,460 31.4% 31.1%
TABLE 2011-3
Distribution of Non-Seasonal Active Participants
in PEER and Non-PEER Units by Contribution Rate
PEER Eligibility Statistics (Non-Seasonal Actives)

WESTERN CONFERENCE OF TEAMSTERS PENSION PLAN
AUGUST 2011 - 51 - McGinn Actuaries Ltd
Percentages Percentages
Actual Percentages Assumed for Actual Percentages Assumed for
for 2008 thru 2010 Actuarial Calculation for 2008 thru 2010 Actuarial Calculation
Ages New Participants Purposes New Participants Purposes
Through 24 29.4% 30.0% 22.7% 22.5%
25 - 29 17.6% 16.5% 9.3% 15.0%
30 - 34 12.1% 15.0% 11.3% 10.0%
35 - 39 10.7% 12.5% 14.0% 12.5%
40 - 44 9.6% 12.5% 10.0% 15.0%
45 - 49 7.7% 7.5% 10.0% 12.5%
50 - 54 6.9% 6.0% 8.0% 12.5%
55 and Over 6.0% 0.0% 14.7% 0.0%
Non-Seasonal Employees Seasonal Employees
TABLE 2011-4
Age at First Participation Distributions
Comparison of Experience with Actuarial Assumptions
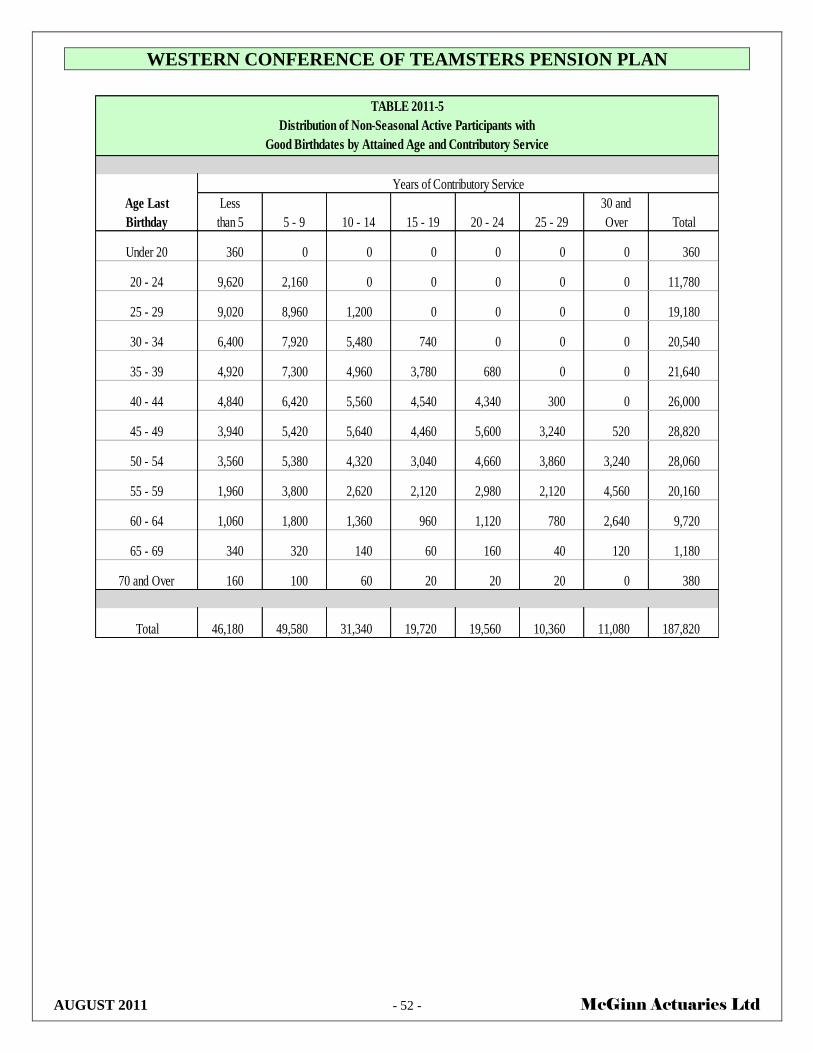
WESTERN CONFERENCE OF TEAMSTERS PENSION PLAN
AUGUST 2011 - 52 - McGinn Actuaries Ltd
TABLE 2011-5
Distribution of Non-Seasonal Active Participants with
Good Birthdates by Attained Age and Contributory Service
Age Last Less 30 and
Birthday than 5 5 - 9 10 - 14 15 - 19 20 - 24 25 - 29 Over Total
Under 20 360 0 0 0 0 0 0 360
20 - 24 9,620 2,160 0 0 0 0 0 11,780
25 - 29 9,020 8,960 1,200 0 0 0 0 19,180
30 - 34 6,400 7,920 5,480 740 0 0 0 20,540
35 - 39 4,920 7,300 4,960 3,780 680 0 0 21,640
40 - 44 4,840 6,420 5,560 4,540 4,340 300 0 26,000
45 - 49 3,940 5,420 5,640 4,460 5,600 3,240 520 28,820
50 - 54 3,560 5,380 4,320 3,040 4,660 3,860 3,240 28,060
55 - 59 1,960 3,800 2,620 2,120 2,980 2,120 4,560 20,160
60 - 64 1,060 1,800 1,360 960 1,120 780 2,640 9,720
65 - 69 340 320 140 60 160 40 120 1,180
70 and Over 160 100 60 20 20 20 0 380
Total 46,180 49,580 31,340 19,720 19,560 10,360 11,080 187,820
Years of Contributory Service
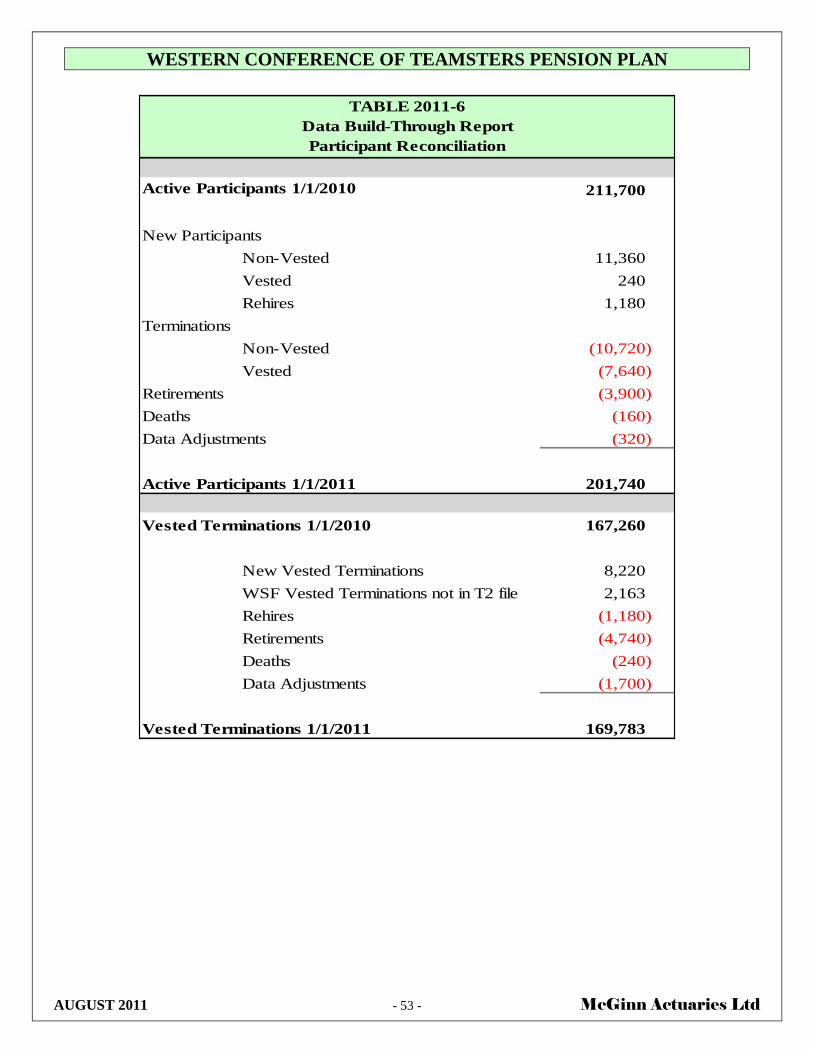
WESTERN CONFERENCE OF TEAMSTERS PENSION PLAN
AUGUST 2011 - 53 - McGinn Actuaries Ltd
TABLE 2011-6
Data Build-Through Report
Participant Reconciliation
Active Participants 1/1/2010 211,700
New Participants
Non-Vested 11,360
Vested 240
Rehires 1,180
Terminations
Non-Vested (10,720)
Vested (7,640)
Retirements (3,900)
Deaths (160)
Data Adjustments (320)
Active Participants 1/1/2011 201,740
Vested Terminations 1/1/2010 167,260
New Vested Terminations 8,220
WSF Vested Terminations not in T2 file 2,163
Rehires (1,180)
Retirements (4,740)
Deaths (240)
Data Adjustments (1,700)
Vested Terminations 1/1/2011 169,783

WESTERN CONFERENCE OF TEAMSTERS PENSION PLAN
AUGUST 2011 - 54 - McGinn Actuaries Ltd
Average Average Age
Monthly as of
Option Count Pension January 1, 2011
Life 2,201 $881.19 63.6
Employee and Spouse 50% 306 $303.59 63.5
Employee and Spouse 67% 685 $1,250.40 64.0
Employee and Spouse 75% 756 $1,013.61 64.1
Benefit Adjustment 2,682 $1,390.10 58.9
Employee and Spouse 50%
with Benefit Adjustment 210 $434.54 59.8
Employee and Spouse 67%
with Benefit Adjustment 555 $2,002.27 59.8
Employee and Spouse 75%
with Benefit Adjustment 1,014 $1,516.30 59.6
All Age Pensioners 8,409 $1,203.89 61.4
Disabled Pensioners 814 $984.13 54.8
Surviving Beneficiaries 409 $554.60 50.3
Total 9,632 $1,157.75 60.3
Total Last Year 10,291 $1,163.04 60.2
Notes:
The average monthly pension amount shown for the Benefit Adjustment Option and the Employee and
Spouse with Benefit Adjustment Option is the sum of the lifetime portion of the benefit, plus any temporary
benefit remaining as of December 31, 2010.
TABLE 2011-7
New 2010 Pensioners and Beneficiaries
Option Elections, Average Pensions and Average Ages
This exhibit includes all pensions associated with participants new to the December 31, 2010 ABC file.
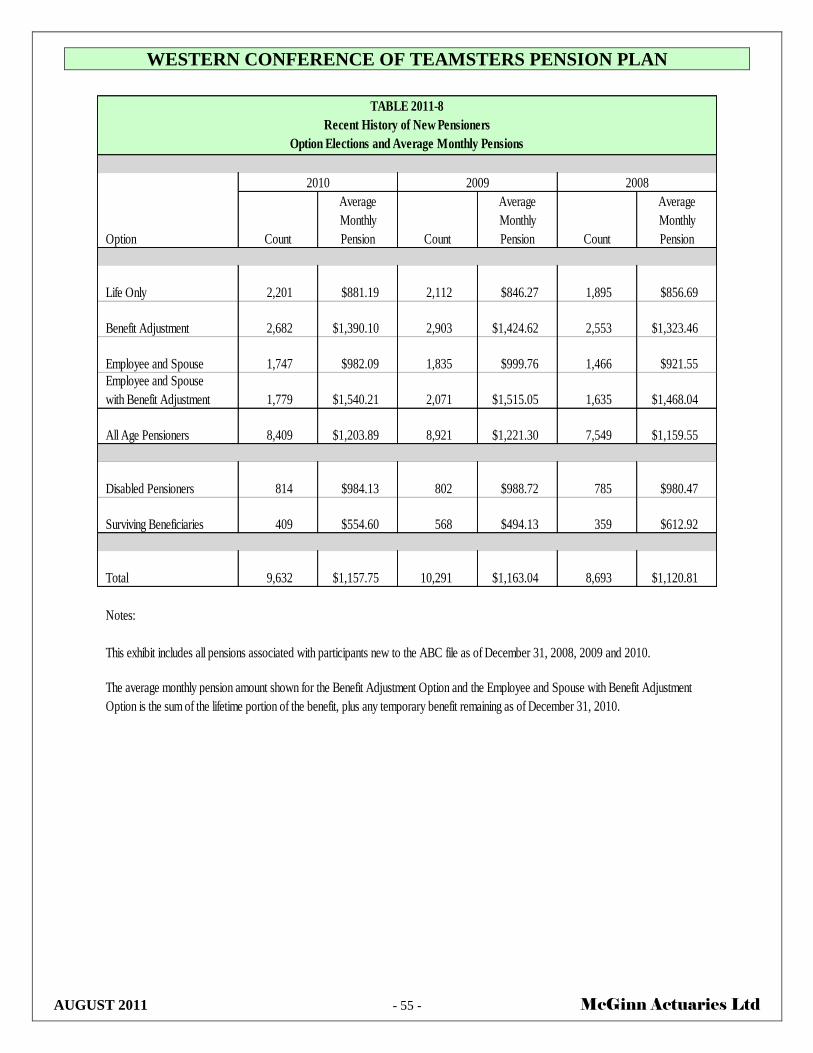
WESTERN CONFERENCE OF TEAMSTERS PENSION PLAN
AUGUST 2011 - 55 - McGinn Actuaries Ltd
Average Average Average
Monthly Monthly Monthly
Option Count Pension Count Pension Count Pension
Life Only 2,201 $881.19 2,112 $846.27 1,895 $856.69
Benefit Adjustment 2,682 $1,390.10 2,903 $1,424.62 2,553 $1,323.46
Employee and Spouse 1,747 $982.09 1,835 $999.76 1,466 $921.55
Employee and Spouse
with Benefit Adjustment 1,779 $1,540.21 2,071 $1,515.05 1,635 $1,468.04
All Age Pensioners 8,409 $1,203.89 8,921 $1,221.30 7,549 $1,159.55
Disabled Pensioners 814 $984.13 802 $988.72 785 $980.47
Surviving Beneficiaries 409 $554.60 568 $494.13 359 $612.92
Total 9,632 $1,157.75 10,291 $1,163.04 8,693 $1,120.81
Notes:
TABLE 2011-8
Recent History of New Pensioners
Option Elections and Average Monthly Pensions
This exhibit includes all pensions associated with participants new to the ABC file as of December 31, 2008, 2009 and 2010.
The average monthly pension amount shown for the Benefit Adjustment Option and the Employee and Spouse with Benefit Adjustment
Option is the sum of the lifetime portion of the benefit, plus any temporary benefit remaining as of December 31, 2010.
2010 2009 2008

WESTERN CONFERENCE OF TEAMSTERS PENSION PLAN
AUGUST 2011 - 56 - McGinn Actuaries Ltd
Number of Average
Year of Average Age Average Age Surviving Monthly Pension
Retirement at Retirement as of 1/1/2011 Retirees Normal Form
1985 and prior 58.9 87.5 15,425 $334.48
1986 - 1990 59.7 82.0 18,601 $589.94
1991 - 1995 59.8 77.0 27,204 $823.86
1996 - 2000 60.0 72.3 34,675 $923.10
2001 - 2005 60.3 67.6 45,532 $1,105.91
2006 - 2010 60.4 63.0 41,625 $1,122.04
Total 60.0 72.0 183,062 $915.61
Total Last Year 60.0 71.9 178,488 $905.15
TABLE 2011-9
Historical Statistics by Year of Retirement
(Based on Number of Records)
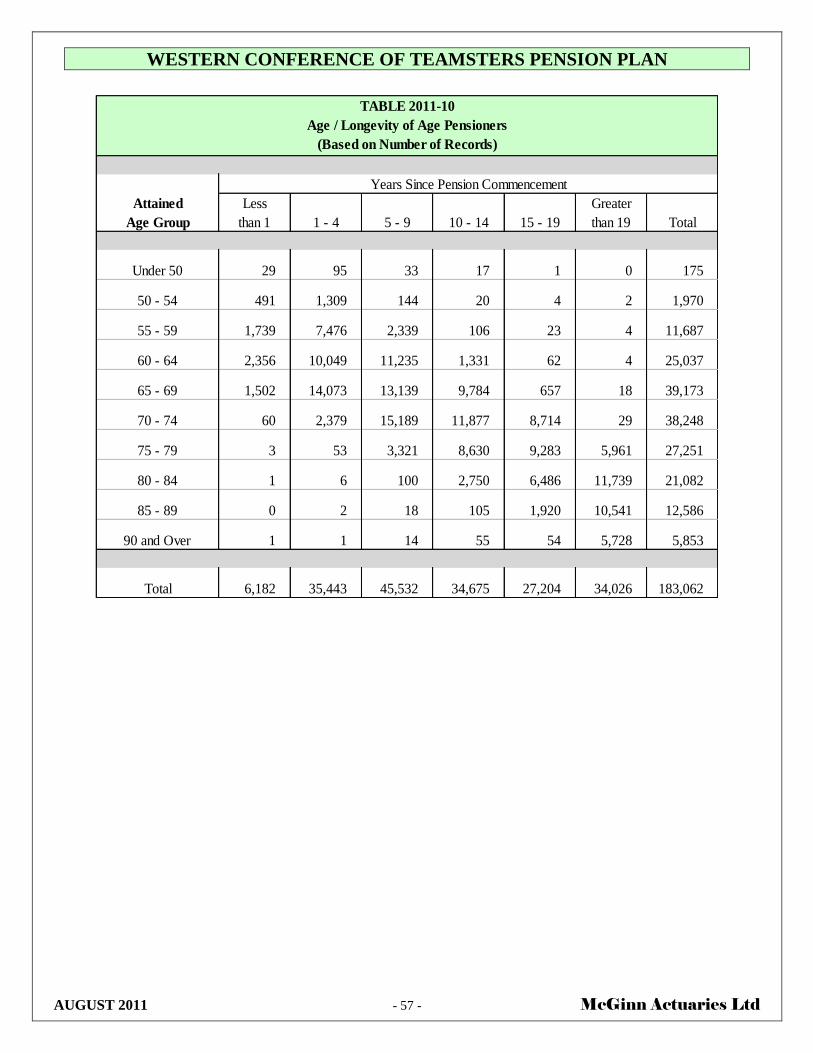
WESTERN CONFERENCE OF TEAMSTERS PENSION PLAN
AUGUST 2011 - 57 - McGinn Actuaries Ltd
TABLE 2011-10
Age / Longevity of Age Pensioners
(Based on Number of Records)
Attained Less Greater
Age Group than 1 1 - 4 5 - 9 10 - 14 15 - 19 than 19 Total
Under 50 29 95 33 17 1 0 175
50 - 54 491 1,309 144 20 4 2 1,970
55 - 59 1,739 7,476 2,339 106 23 4 11,687
60 - 64 2,356 10,049 11,235 1,331 62 4 25,037
65 - 69 1,502 14,073 13,139 9,784 657 18 39,173
70 - 74 60 2,379 15,189 11,877 8,714 29 38,248
75 - 79 3 53 3,321 8,630 9,283 5,961 27,251
80 - 84 1 6 100 2,750 6,486 11,739 21,082
85 - 89 0 2 18 105 1,920 10,541 12,586
90 and Over 1 1 14 55 54 5,728 5,853
Total 6,182 35,443 45,532 34,675 27,204 34,026 183,062
Years Since Pension Commencement

WESTERN CONFERENCE OF TEAMSTERS PENSION PLAN
AUGUST 2011 - 58 - McGinn Actuaries Ltd
TABLE 2011-11
Age / Longevity of Beneficiaries
(Based on Number of Records)
Attained Less Greater
Age Group Deferred than 1 1 - 4 5 - 9 10 - 14 15 - 19 than 19 Total
39 and Under 9 139 891 864 358 45 23 2,329
40 - 44 25 13 75 65 55 26 28 287
45 - 49 65 18 157 177 137 63 46 663
50 - 54 82 65 324 345 262 175 77 1,330
55 - 59 43 63 512 612 554 339 235 2,358
60 - 64 22 36 427 999 915 686 335 3,420
65 - 69 2 6 266 791 1,327 1,297 738 4,427
70 - 74 0 3 77 436 1,158 1,881 1,396 4,951
75 - 79 0 1 25 119 485 1,618 2,394 4,642
80 - 84 0 0 1 40 153 712 3,187 4,093
85 - 89 0 0 1 5 48 175 2,714 2,943
90 and Over 0 0 0 2 10 41 1,403 1,456
Total 248 344 2,756 4,455 5,462 7,058 12,576 32,899
Years Since Pension Commencement

WESTERN CONFERENCE OF TEAMSTERS PENSION PLAN
AUGUST 2011 - 59 - McGinn Actuaries Ltd
TABLE 2011-12
Age / Longevity of Disabled Pensioners
(Based on Number of Records)
Attained Less Greater
Age Group than 1 1 - 4 5 - 9 10 - 14 15 - 19 than 19 Total
39 and Under 1 33 36 5 0 0 75
40 - 44 5 77 88 43 19 0 232
45 - 49 16 180 230 110 46 4 586
50 - 54 47 415 513 245 169 48 1,437
55 - 59 68 816 945 400 315 207 2,751
60 - 64 33 723 1,381 746 521 464 3,868
65 - 69 2 149 937 1,041 917 784 3,830
70 - 74 0 0 142 757 1,299 1,246 3,444
75 - 79 0 0 0 94 691 1,831 2,616
80 - 84 0 0 0 4 52 1,598 1,654
85 - 89 0 0 0 3 0 744 747
90 and Over 0 0 0 0 0 208 208
Total 172 2,393 4,272 3,448 4,029 7,134 21,448
Years Since Pension Commencement

WESTERN CONFERENCE OF TEAMSTERS PENSION PLAN
AUGUST 2011 - 60 - McGinn Actuaries Ltd
Age Male Female Male Female
45 35.2 37.3 22.9 30.3
50 30.5 32.6 21.0 27.3
55 26.0 28.0 18.8 24.1
60 21.7 23.7 16.5 20.7
62 20.1 22.1 15.4 19.2
65 17.7 19.6 13.9 17.0
70 14.0 15.9 11.0 13.1
75 10.7 12.6 8.3 9.8
80 7.8 9.6 6.1 7.2
85 5.6 7.0 4.5 5.1
90 3.9 5.2 3.4 3.5
Note: Life expectancies change only when retired life mortality rates are revised.
Age Pensioner Disabled Pensioner
TABLE 2011-13
Life Expecancies for Pensioners
Years of Life Expectancy

WESTERN CONFERENCE OF TEAMSTERS PENSION PLAN
AUGUST 2011 - 61 - McGinn Actuaries Ltd
APPENDIX – BRIEF HISTORY OF PLAN AMENDMENTS
The following is a summary of the major Plan changes since 1984.
Effective Date Description of Change
1/1/2009
A 75% Optional Employee and Spouse Pension was added. Also, a $40 million
reserve for extra check payments was established.
1/1/2008
Effective for calendar year 2008 only, the percentages used to calculate Plan
participant account benefits have been increased from 1.20% to 2.00% for
participants who have not completed 20 years of service, and from 1.20% to
2.65% for participants who have completed at least 20 years of service. The
percentages for years 2009 and later remain at 1.20%.
1/1/2007
Effective for calendar year 2007 only, the percentage used to calculate Plan
participant account benefits was increased from 1.20% to 1.65%. The
percentages for years 2008 and later remain at 1.20%.
7/1/2003
Effective July 1, 2003, the percentage used to calculate Plan participant account
benefits has been reduced to 1.20% for the second half of 2003 and all
subsequent years.
1/1/2000
Effective for calendar years 2000, 2001 and 2002, the percentage used to
calculate Plan participant account benefits has been increased. An Active
participant will earn a monthly pension benefit of 2.70% instead of 2.16% for
contributions credited in this period if he/she has not completed 20 year of
service. If such participant has completed at least 20 years of contributory
service, he/she will earn a monthly pension benefit of 3.58% instead of 2.86%
during this same period.
Effective for calendar years 2003, 2004 and 2005, the percentage used to
calculate Plan participant contribution account benefits has been increased. An
Active participant will earn a monthly pension benefit of 2.20% instead of 2.00%
for contributions credited in this period, if he/she has not completed 20 years of
service. If such participant has completed at least 20 years of contributory
service, he/she will earn a monthly pension benefit of 2.92% instead of 2.65%
during this same period.
Effective with calendar year 2000, all Disability Pensioner benefits have been
increased to 85% of his/her Normal Retirement Benefit unless said Disability
Pensioner’s benefits are already payable in a greater amount. Spouses of certain
deceased Disability Pensioners have had their benefits appropriately adjusted, as
applicable. The same 85% ”floor” monthly pension benefit shall be paid to all
Disability Pensioners and, as applicable, to their spouses for Plan participants
who become Disabled Pensioners after calendar year 1999.
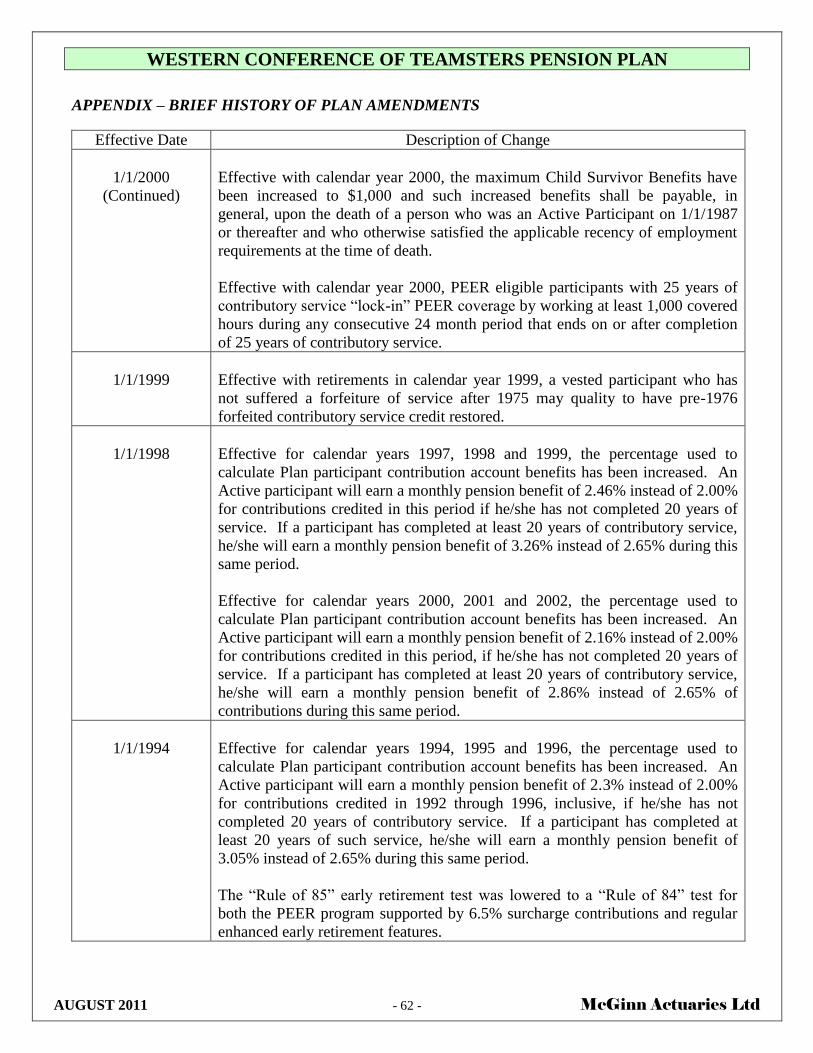
WESTERN CONFERENCE OF TEAMSTERS PENSION PLAN
AUGUST 2011 - 62 - McGinn Actuaries Ltd
APPENDIX – BRIEF HISTORY OF PLAN AMENDMENTS
Effective Date Description of Change
1/1/2000
(Continued)
Effective with calendar year 2000, the maximum Child Survivor Benefits have
been increased to $1,000 and such increased benefits shall be payable, in
general, upon the death of a person who was an Active Participant on 1/1/1987
or thereafter and who otherwise satisfied the applicable recency of employment
requirements at the time of death.
Effective with calendar year 2000, PEER eligible participants with 25 years of
contributory service “lock-in” PEER coverage by working at least 1,000 covered
hours during any consecutive 24 month period that ends on or after completion
of 25 years of contributory service.
1/1/1999
Effective with retirements in calendar year 1999, a vested participant who has
not suffered a forfeiture of service after 1975 may quality to have pre-1976
forfeited contributory service credit restored.
1/1/1998
Effective for calendar years 1997, 1998 and 1999, the percentage used to
calculate Plan participant contribution account benefits has been increased. An
Active participant will earn a monthly pension benefit of 2.46% instead of 2.00%
for contributions credited in this period if he/she has not completed 20 years of
service. If a participant has completed at least 20 years of contributory service,
he/she will earn a monthly pension benefit of 3.26% instead of 2.65% during this
same period.
Effective for calendar years 2000, 2001 and 2002, the percentage used to
calculate Plan participant contribution account benefits has been increased. An
Active participant will earn a monthly pension benefit of 2.16% instead of 2.00%
for contributions credited in this period, if he/she has not completed 20 years of
service. If a participant has completed at least 20 years of contributory service,
he/she will earn a monthly pension benefit of 2.86% instead of 2.65% of
contributions during this same period.
1/1/1994
Effective for calendar years 1994, 1995 and 1996, the percentage used to
calculate Plan participant contribution account benefits has been increased. An
Active participant will earn a monthly pension benefit of 2.3% instead of 2.00%
for contributions credited in 1992 through 1996, inclusive, if he/she has not
completed 20 years of contributory service. If a participant has completed at
least 20 years of such service, he/she will earn a monthly pension benefit of
3.05% instead of 2.65% during this same period.
The “Rule of 85” early retirement test was lowered to a “Rule of 84” test for
both the PEER program supported by 6.5% surcharge contributions and regular
enhanced early retirement features.
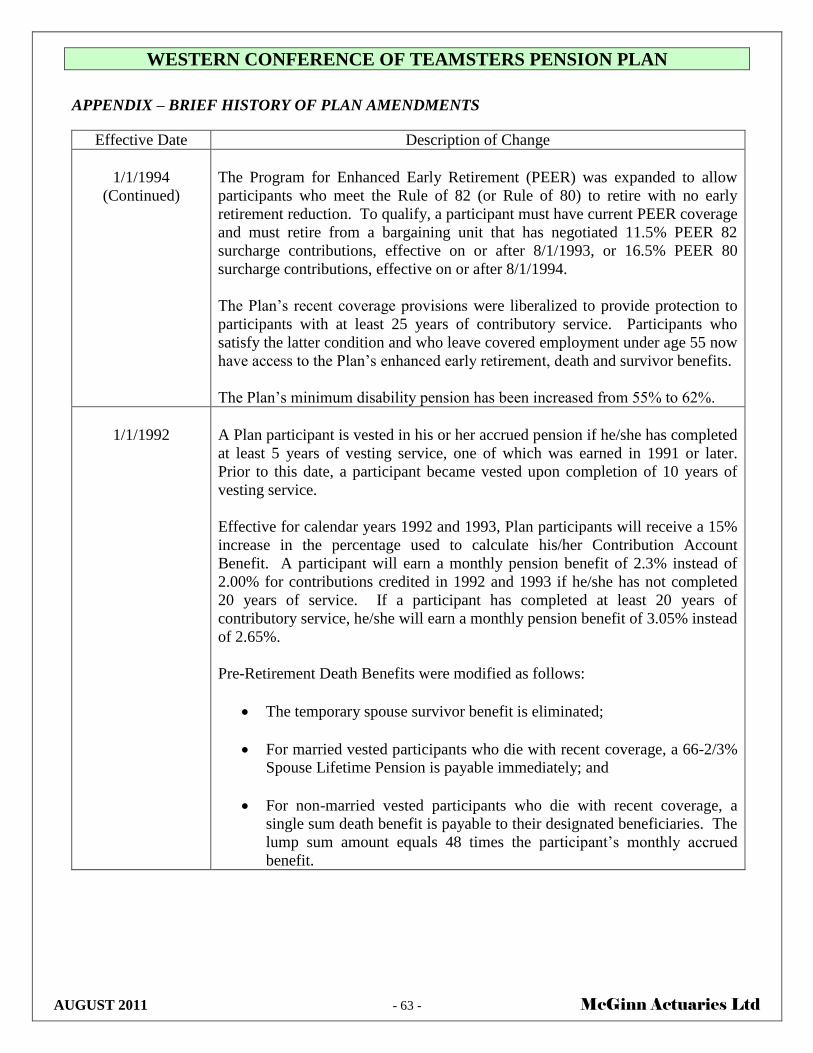
WESTERN CONFERENCE OF TEAMSTERS PENSION PLAN
AUGUST 2011 - 63 - McGinn Actuaries Ltd
APPENDIX – BRIEF HISTORY OF PLAN AMENDMENTS
Effective Date Description of Change
1/1/1994
(Continued)
The Program for Enhanced Early Retirement (PEER) was expanded to allow
participants who meet the Rule of 82 (or Rule of 80) to retire with no early
retirement reduction. To qualify, a participant must have current PEER coverage
and must retire from a bargaining unit that has negotiated 11.5% PEER 82
surcharge contributions, effective on or after 8/1/1993, or 16.5% PEER 80
surcharge contributions, effective on or after 8/1/1994.
The Plan’s recent coverage provisions were liberalized to provide protection to
participants with at least 25 years of contributory service. Participants who
satisfy the latter condition and who leave covered employment under age 55 now
have access to the Plan’s enhanced early retirement, death and survivor benefits.
The Plan’s minimum disability pension has been increased from 55% to 62%.
1/1/1992
A Plan participant is vested in his or her accrued pension if he/she has completed
at least 5 years of vesting service, one of which was earned in 1991 or later.
Prior to this date, a participant became vested upon completion of 10 years of
vesting service.
Effective for calendar years 1992 and 1993, Plan participants will receive a 15%
increase in the percentage used to calculate his/her Contribution Account
Benefit. A participant will earn a monthly pension benefit of 2.3% instead of
2.00% for contributions credited in 1992 and 1993 if he/she has not completed
20 years of service. If a participant has completed at least 20 years of
contributory service, he/she will earn a monthly pension benefit of 3.05% instead
of 2.65%.
Pre-Retirement Death Benefits were modified as follows:
The temporary spouse survivor benefit is eliminated;
For married vested participants who die with recent coverage, a 66-2/3%
Spouse Lifetime Pension is payable immediately; and
For non-married vested participants who die with recent coverage, a
single sum death benefit is payable to their designated beneficiaries. The
lump sum amount equals 48 times the participant’s monthly accrued
benefit.

WESTERN CONFERENCE OF TEAMSTERS PENSION PLAN
AUGUST 2011 - 64 - McGinn Actuaries Ltd
APPENDIX – BRIEF HISTORY OF PLAN AMENDMENTS
Effective Date Description of Change
1/1/1992
(Continued)
Post-Retirement Death Benefits were revised as follows:
For participants who retire with recent coverage, the After Retirement
Spouse Lifetime Pension is increased from 50% to 66-2/3%. If a
participant retires without recent coverage, the After Retirement Spouse
Lifetime Pension remains at 50%.
Non-married vested participants or married vested participants who did
not elect the Employee and Spouse Pension, who retired with recent
coverage and die before receiving 4 years of benefit payments will have
the remainder of 4 years benefits paid to their designated beneficiary.
Enhanced early retirement benefits became available for participants with recent
coverage if the sum of their attained age and years of contributory service is
equal to or greater than 85 (the “Rule of 85”). Reduction for early retirement
under this provision is cut by approximately 25%.
The Program for Enhanced Early Retirement (PEER) also became available.
Under this program, participants who meet the Rule of 85, who retire from a
bargaining unit that has negotiated 6.5% surcharge PEER contributions, and who
have current PEER coverage can retire with no early retirement reduction,
regardless of their age.
There is a 9 month period (4/1/1991 to 12/31/1991) where members with
pension effective dates or application requests (and recent coverage) within this
time frame were permitted to rescind their 1991 pension effective dates and defer
them until 1/1/1992 in order to benefit from Plan improvements effective on that
date. Members electing to rescind and defer their pension effective dates were
required to repay any benefit amounts paid to them. Also, pension increases
effective after 1991 are governed by the new death and survivor benefit rules.
7/1/1988
The Plan was modified to provide an additional optional pension form: The
Employee and Spouse Pension with Benefit Adjustment Option.
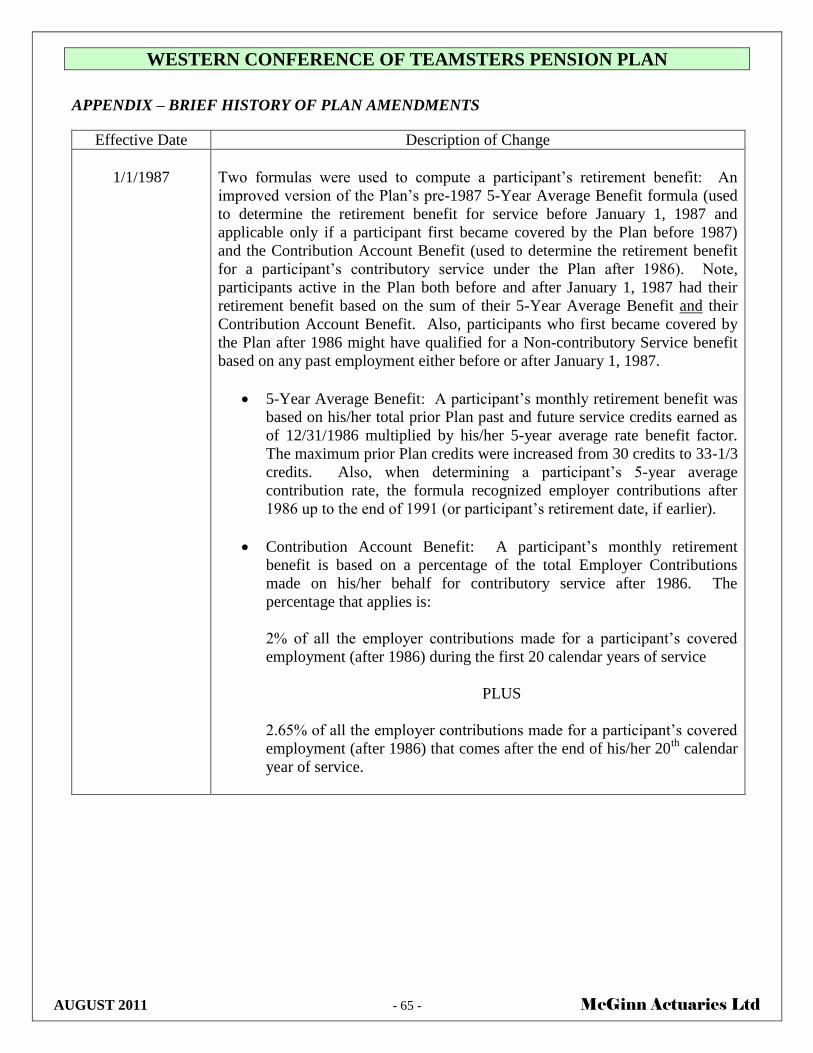
WESTERN CONFERENCE OF TEAMSTERS PENSION PLAN
AUGUST 2011 - 65 - McGinn Actuaries Ltd
APPENDIX – BRIEF HISTORY OF PLAN AMENDMENTS
Effective Date Description of Change
1/1/1987
Two formulas were used to compute a participant’s retirement benefit: An
improved version of the Plan’s pre-1987 5-Year Average Benefit formula (used
to determine the retirement benefit for service before January 1, 1987 and
applicable only if a participant first became covered by the Plan before 1987)
and the Contribution Account Benefit (used to determine the retirement benefit
for a participant’s contributory service under the Plan after 1986). Note,
participants active in the Plan both before and after January 1, 1987 had their
retirement benefit based on the sum of their 5-Year Average Benefit and their
Contribution Account Benefit. Also, participants who first became covered by
the Plan after 1986 might have qualified for a Non-contributory Service benefit
based on any past employment either before or after January 1, 1987.
5-Year Average Benefit: A participant’s monthly retirement benefit was
based on his/her total prior Plan past and future service credits earned as
of 12/31/1986 multiplied by his/her 5-year average rate benefit factor.
The maximum prior Plan credits were increased from 30 credits to 33-1/3
credits. Also, when determining a participant’s 5-year average
contribution rate, the formula recognized employer contributions after
1986 up to the end of 1991 (or participant’s retirement date, if earlier).
Contribution Account Benefit: A participant’s monthly retirement
benefit is based on a percentage of the total Employer Contributions
made on his/her behalf for contributory service after 1986. The
percentage that applies is:
2% of all the employer contributions made for a participant’s covered
employment (after 1986) during the first 20 calendar years of service
PLUS
2.65% of all the employer contributions made for a participant’s covered
employment (after 1986) that comes after the end of his/her 20th
calendar
year of service.
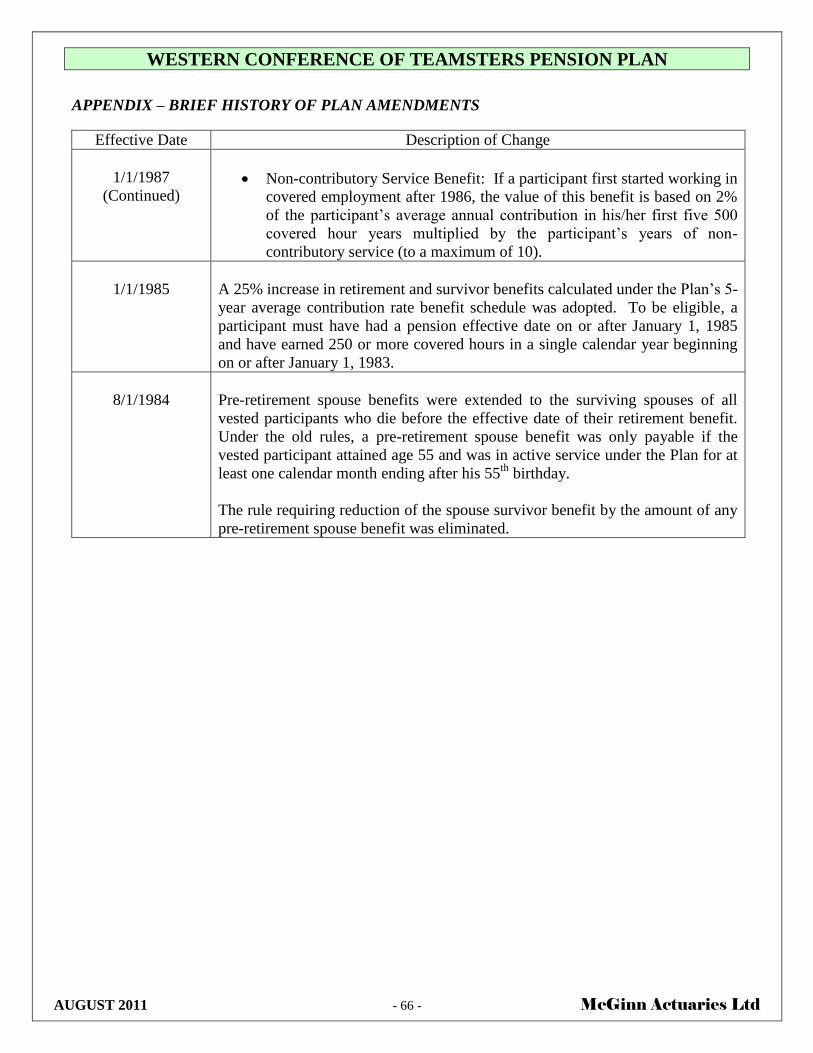
WESTERN CONFERENCE OF TEAMSTERS PENSION PLAN
AUGUST 2011 - 66 - McGinn Actuaries Ltd
APPENDIX – BRIEF HISTORY OF PLAN AMENDMENTS
Effective Date Description of Change
1/1/1987
(Continued)
Non-contributory Service Benefit: If a participant first started working in
covered employment after 1986, the value of this benefit is based on 2%
of the participant’s average annual contribution in his/her first five 500
covered hour years multiplied by the participant’s years of non-
contributory service (to a maximum of 10).
1/1/1985
A 25% increase in retirement and survivor benefits calculated under the Plan’s 5-
year average contribution rate benefit schedule was adopted. To be eligible, a
participant must have had a pension effective date on or after January 1, 1985
and have earned 250 or more covered hours in a single calendar year beginning
on or after January 1, 1983.
8/1/1984
Pre-retirement spouse benefits were extended to the surviving spouses of all
vested participants who die before the effective date of their retirement benefit.
Under the old rules, a pre-retirement spouse benefit was only payable if the
vested participant attained age 55 and was in active service under the Plan for at
least one calendar month ending after his 55th
birthday.
The rule requiring reduction of the spouse survivor benefit by the amount of any
pre-retirement spouse benefit was eliminated.
Related Documents