LASTING VALUE. WE DELIVER 2011 SUSTAINABILITY REPORT

2011 Sustainability Report
Mar 22, 2016
Port Metro Vancouver's 2011 Sustainability Report.
Welcome message from author
This document is posted to help you gain knowledge. Please leave a comment to let me know what you think about it! Share it to your friends and learn new things together.
Transcript

lastingValue.
WE DELIVER
2011 SUSTAINABILITY REPORT

RePORt DetailsSupporting information about our accountability
46 Independent assurance statement
48 Global Reporting Initiative index
52 Summary of panel recommendations
tHe PORtInformation about the broader supply chain
24 Operations and planning
28 Performance and reliability
30 Port growth and development
34 Environmental management
40 Community engagement
tHe PORt autHORitYInformation about our operations
14 Vancouver Fraser Port Authority
15 Our approach to sustainability
16 Governance
17 Our workplace
18 Our environmental footprint
20 Financial results
OuR RePORtBusiness overview and reporting approach
04 Messages
06 Business overview
08 About our report
10 Report overview
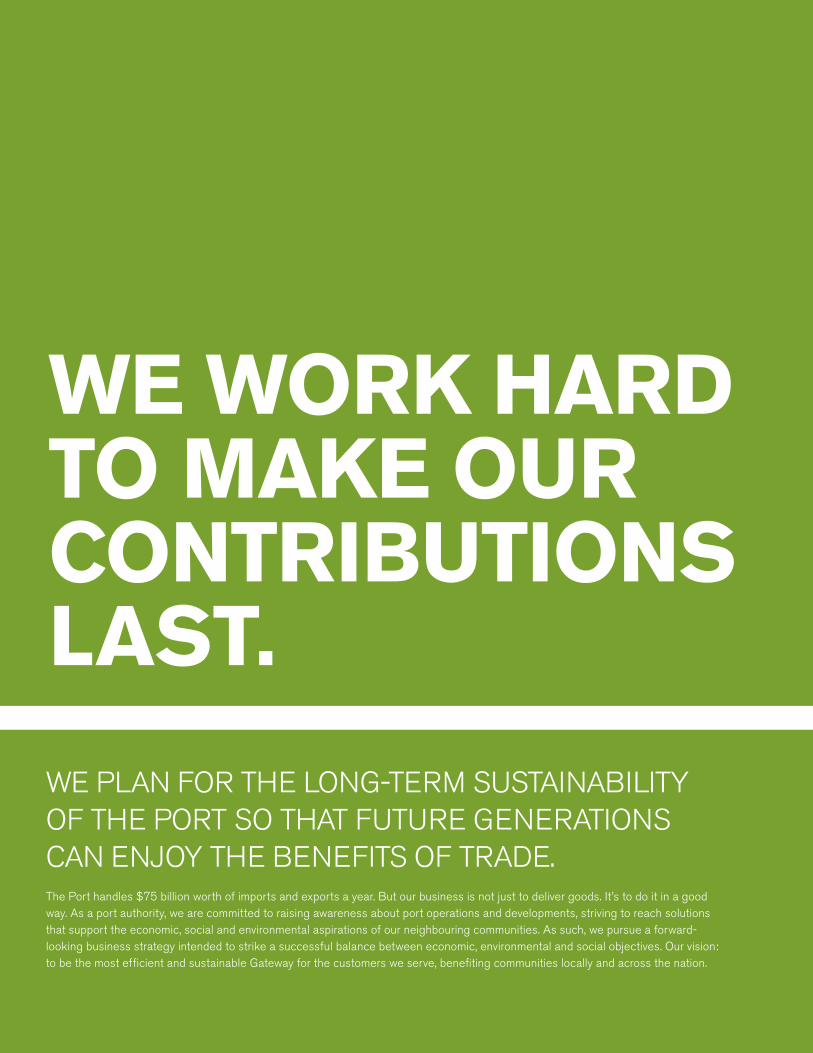
WE PLAN fOR ThE LONg-TERm SUSTAINABILITY Of ThE PORT SO ThAT fUTURE gENERATIONS cAN ENjOY ThE BENEfITS Of TRAdE.The Port handles $75 billion worth of imports and exports a year. But our business is not just to deliver goods. It’s to do it in a good way. As a port authority, we are committed to raising awareness about port operations and developments, striving to reach solutions that support the economic, social and environmental aspirations of our neighbouring communities. As such, we pursue a forward-looking business strategy intended to strike a successful balance between economic, environmental and social objectives. Our vision: to be the most efficient and sustainable gateway for the customers we serve, benefiting communities locally and across the nation.
We WORk HaRD tO make OuR cOntRibutiOns last.

4 | OuR RePORt PORT mETRO VANcOUVER 2011 SUSTAINABILITY REPORT
tom longworth chair, community and corporate Social Responsibility committee
accountability to our stakeholders. We will review the policy’s implementation throughout the course of its first year, and communicate the results in our 2012 report.
We also published Port metro Vancouver’s first Sustainability Report in 2011. We invited a diverse cross-section of stakeholders, first Nations representatives and community members to provide feedback on the report. Several changes have been made as a result of their recommendations, such as providing more information on Port metro Vancouver’s role.
I would like to take this opportunity to thank the members of Port metro Vancouver’s community and corporate Social Responsibility committee for their efforts to advance port sustainability in 2011. The committee provided valuable oversight on Port metro Vancouver’s goals, policies and programs related to the organization’s corporate social responsibility, environmental activities, communications and community and first Nations engagement practices.
We continuously learn from our experiences and recognize there are outstanding challenges. A clear vision and sound governance based on principles guides us when challenges inevitably arise. Over the next few years we will continue to review Port metro Vancouver’s sustainability performance and incorporate feedback from port stakeholders.
We are committed to working together with our partners to build a sustainable future for both communities and business as we support the growth of the canadian economy. By making comprehensive decisions today, we believe that we can deliver lasting value and be the most efficient and sustainable gateway for the customers we serve, benefiting communities locally and across the nation.
tom longworth chair, community and corporate Social Responsibility committee
I am pleased to present Port metro Vancouver’s second annual Sustainability Report, in which we report on new insights into our economic, environmental and social performance.
The process of planning, implementing, tracking and reporting on our sustainability performance has given us a better understanding of our achievements and opportunities for improvement, as well as the future challenges we face as an organization. Our goal is to address these challenges and document our progress in subsequent reports, with a view to develop an integrated report in the future.
In 2011, we advanced the integration of corporate social responsibility in our organization by welcoming our first Vice President, corporate Social Responsibility to the Executive Leadership Team.
We introduced a new policy on corporate social responsibility in june 2011, formalizing our commitment to the integration of social and environmental considerations into the organization’s values, culture, decision-making, strategy development and day-to-day operations. The policy represents a continued movement toward transparency and

| 5PORT mETRO VANcOUVER 2011 SUSTAINABILITY REPORT OuR RePORt
Duncan Wilson Vice President, corporate Social Responsibility
In this, our second annual Sustainability Report, we recognize that while it is important for our organization to tackle sustainability aspects over which we have direct control, the greatest opportunities to bring about change exists within the Port as a whole. We offer this report as a basis for continued dialogue and collaboration and in that spirit, we ask you to provide your feedback on how we can improve. I look forward to hearing from you and continuing the discussion.
Duncan Wilson Vice President, corporate Social Responsibility
canadian trade continues to be an integral component of the regional and national economy. As canada’s largest and most diverse port, Port metro Vancouver represents an important trade asset and is a significant regional economic force: one in every 12 working people in metro Vancouver earns a living because of port-related business and many more are dependent on the goods that flow through the Port.
Increased demand for Asian imports and canadian exports means that our existing terminals are nearing capacity. Along with our mandate – to lead the growth of canada’s Pacific gateway in a manner that enhances the well-being of canadians – comes a responsibility to balance growth with social and environmental performance. growth brings opportunity, but also new challenges, including increased noise and truck traffic, impacts to air quality and habitat, and risks related to the transportation of goods. We must continue to use our influence across the gateway to address these challenges as we explore port growth and development.
In 2011, we completed Port 2050, a long-term shared visioning process built around collaboration and engagement with our diverse stakeholders, to identify what good growth looks like. As a result, we revised our strategic vision and mission statements to help guide our business priorities, help shape new initiatives and help us to understand, anticipate and plan for a transitioning global social and economic environment.
We have since initiated a two-year process to update our Land Use Plan to guide physical development of the Port. We also launched our container capacity Improvement Program to look at opportunities to improve existing terminals and infrastructure, and the potential for new infrastructure that may be required as demand continues to increase. We welcome the opportunity to engage in important discussions about land use – in particular, industrial and agricultural land uses – in a respectful and meaningful way.
I would like to thank our many stakeholders for their commitment to improve the Port’s performance over the long-term, our Board of directors for their direction and guidance during the year, and the dedication of Port metro Vancouver employees to advance port sustainability everyday.
Please see our 2011 annual Report for a message from Port metro Vancouver’s President and ceO, and chair of the board of Directors at:portmetrovancouver.com/accountability
nA
VIG
At
IOn
Al
j
uR
ISd
ICt
IOn
B
Ou
nd
AR
y
ROBERTS BANKRAIL CORRIDOR
RICHMOND
SURREY
DELTA
Tsawwassen First Nation
VANCOUVER
NORTHVANCOUVER
NEWWESTMINSTER
BURNABY
PORTMOODY
COQUITLAM
Kingsway
Knig
ht
Str
eet
Kin
g G
eorg
e H
ighw
ay
Lougheed Hwy
South FraserPerimeter Road
99
99
91
91
99
99
99
99
10
10
15
15
1
1
1
7
7B
1A
10
17
17
NORTH SHORETRADE AREA
SOUTH SHORETRADE AREA
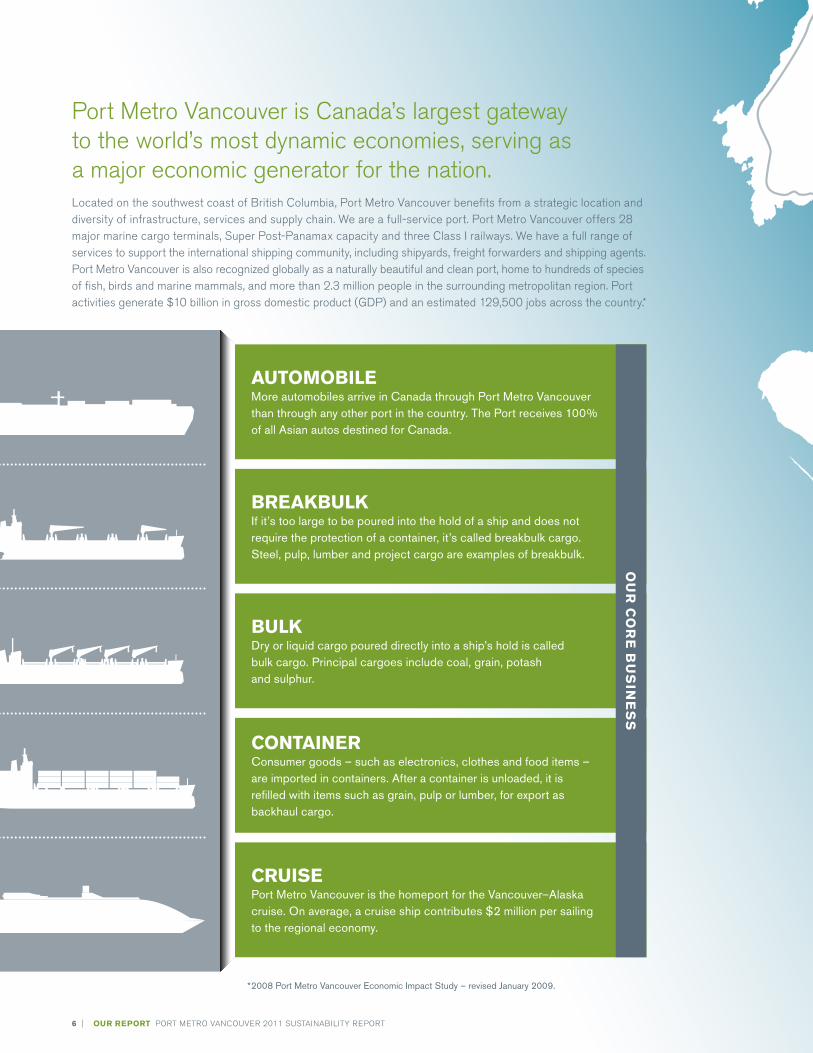
* 2008 Port Metro Vancouver Economic Impact Study – revised january 2009.
6 | OuR RePORt PORT mETRO VANcOUVER 2011 SUSTAINABILITY REPORT
6 Port Metro Vancouver
6 Port Metro Vancouver
6 Port Metro Vancouver
6 Port Metro Vancouver
6 Port Metro Vancouver
Ou
R c
OR
e b
us
ine
ss
bReakbulkIf it’s too large to be poured into the hold of a ship and does not require the protection of a container, it’s called breakbulk cargo. Steel, pulp, lumber and project cargo are examples of breakbulk.
bulkdry or liquid cargo poured directly into a ship’s hold is called bulk cargo. Principal cargoes include coal, grain, potash and sulphur.
cOntaineR Consumer goods – such as electronics, clothes and food items – are imported in containers. After a container is unloaded, it is refilled with items such as grain, pulp or lumber, for export as backhaul cargo.
cRuisePort Metro Vancouver is the homeport for the Vancouver–Alaska cruise. On average, a cruise ship contributes $2 million per sailing to the regional economy.
autOmObileMore automobiles arrive in Canada through Port Metro Vancouver than through any other port in the country. the Port receives 100% of all Asian autos destined for Canada.
Port metro Vancouver is canada’s largest gateway to the world’s most dynamic economies, serving as a major economic generator for the nation.Located on the southwest coast of British columbia, Port metro Vancouver benefits from a strategic location and diversity of infrastructure, services and supply chain. We are a full-service port. Port metro Vancouver offers 28 major marine cargo terminals, Super Post-Panamax capacity and three class I railways. We have a full range of services to support the international shipping community, including shipyards, freight forwarders and shipping agents. Port metro Vancouver is also recognized globally as a naturally beautiful and clean port, home to hundreds of species of fish, birds and marine mammals, and more than 2.3 million people in the surrounding metropolitan region. Port activities generate $10 billion in gross domestic product (gdP) and an estimated 129,500 jobs across the country.*

ROBERTS BANKRAIL CORRIDOR
RICHMOND
SURREY
DELTA
Tsawwassen First Nation
VANCOUVER
NORTHVANCOUVER
NEWWESTMINSTER
BURNABY
PORTMOODY
COQUITLAM
Kingsway
Knig
ht
Str
eet
Kin
g G
eorg
e H
ighw
ay
Lougheed Hwy
South FraserPerimeter Road
99
99
91
91
99
99
99
99
10
10
15
15
1
1
1
7
7B
1A
10
17
17
NORTH SHORETRADE AREA
SOUTH SHORETRADE AREA
V
Port metro Vancouver Navigational jurisdictionRail networkRoads
Port terminals
Auto
Breakbulk
Bulk
container
cruise
Port Authority
head Office
Other facilities
Valparaiso
Guayaquil
Port MetroVancouver
Busan TokyoShanghai Yokohama
ShenzhenHong Kong
Kaohsiung
Singapore
Sydney
| 7PORT mETRO VANcOUVER 2011 SUSTAINABILITY REPORT OuR RePORt
8 | OuR RePORt PORT mETRO VANcOUVER 2011 SUSTAINABILITY REPORT
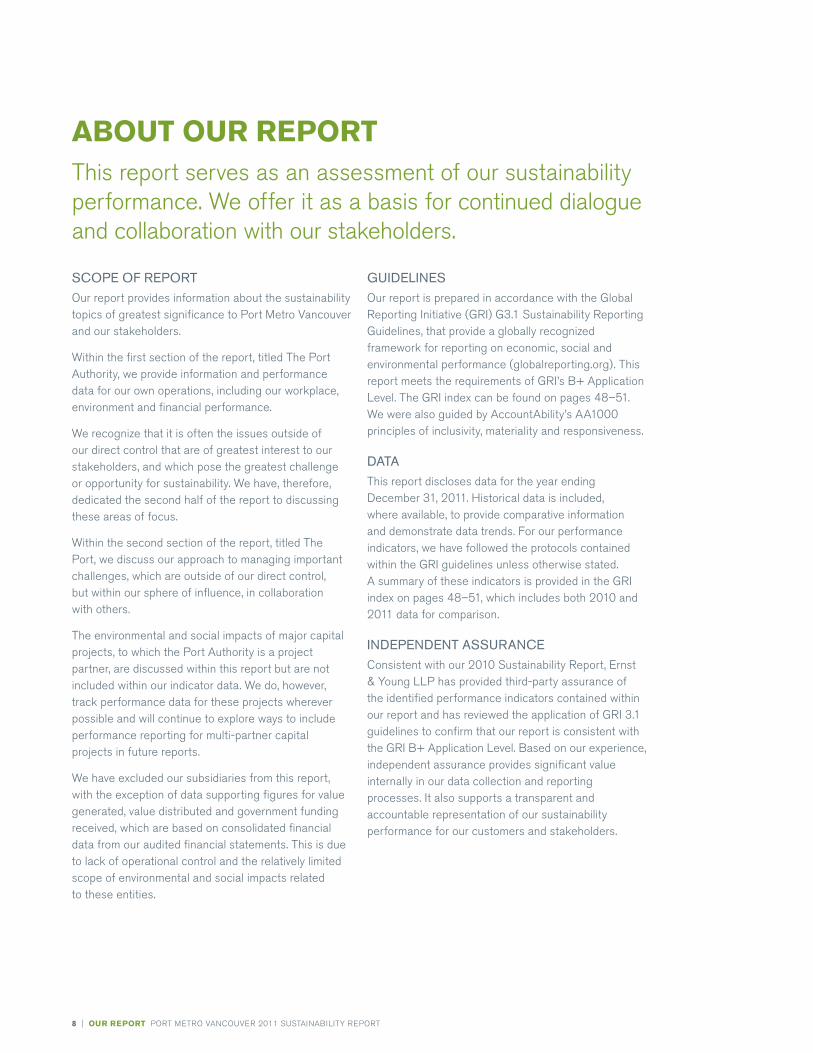
GuIdElInESOur report is prepared in accordance with the global Reporting Initiative (gRI) g3.1 Sustainability Reporting guidelines, that provide a globally recognized framework for reporting on economic, social and environmental performance (globalreporting.org). This report meets the requirements of gRI’s B+ Application Level. The gRI index can be found on pages 48–51. We were also guided by AccountAbility’s AA1000 principles of inclusivity, materiality and responsiveness.
dAtA This report discloses data for the year ending december 31, 2011. historical data is included, where available, to provide comparative information and demonstrate data trends. for our performance indicators, we have followed the protocols contained within the gRI guidelines unless otherwise stated. A summary of these indicators is provided in the gRI index on pages 48–51, which includes both 2010 and 2011 data for comparison.
IndEPEndEnt ASSuRAnCE consistent with our 2010 Sustainability Report, Ernst & Young LLP has provided third-party assurance of the identified performance indicators contained within our report and has reviewed the application of gRI 3.1 guidelines to confirm that our report is consistent with the gRI B+ Application Level. Based on our experience, independent assurance provides significant value internally in our data collection and reporting processes. It also supports a transparent and accountable representation of our sustainability performance for our customers and stakeholders.
SCOPE OF REPORt Our report provides information about the sustainability topics of greatest significance to Port metro Vancouver and our stakeholders.
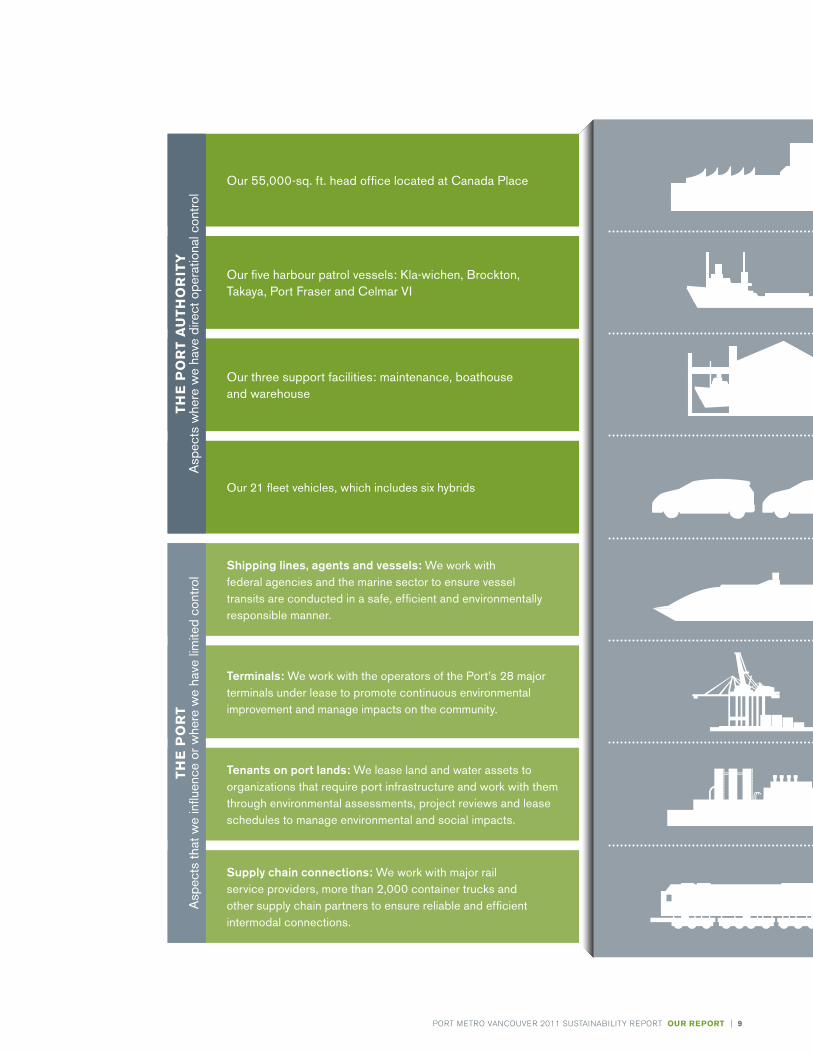
Within the first section of the report, titled The Port Authority, we provide information and performance data for our own operations, including our workplace, environment and financial performance.
We recognize that it is often the issues outside of our direct control that are of greatest interest to our stakeholders, and which pose the greatest challenge or opportunity for sustainability. We have, therefore, dedicated the second half of the report to discussing these areas of focus.
Within the second section of the report, titled The Port, we discuss our approach to managing important challenges, which are outside of our direct control, but within our sphere of influence, in collaboration with others.
The environmental and social impacts of major capital projects, to which the Port Authority is a project partner, are discussed within this report but are not included within our indicator data. We do, however, track performance data for these projects wherever possible and will continue to explore ways to include performance reporting for multi-partner capital projects in future reports.
We have excluded our subsidiaries from this report, with the exception of data supporting figures for value generated, value distributed and government funding received, which are based on consolidated financial data from our audited financial statements. This is due to lack of operational control and the relatively limited scope of environmental and social impacts related to these entities.
abOut OuR RePORt This report serves as an assessment of our sustainability performance. We offer it as a basis for continued dialogue and collaboration with our stakeholders.
| 9PORT mETRO VANcOUVER 2011 SUSTAINABILITY REPORT OuR RePORt
Our 55,000-sq. ft. head office located at Canada Place
Our five harbour patrol vessels: Kla-wichen, Brockton, takaya, Port Fraser and Celmar VI
Our three support facilities: maintenance, boathouse and warehouse
Our 21 fleet vehicles, which includes six hybrids
tH
e P
OR
t A
spec
ts th
at w
e in
fluen
ce o
r whe
re w
e ha
ve li
mite
d co
ntro
l
6 Port Metro Vancouver
tH
e P
OR
t a
ut
HO
Rit
Y
A
spec
ts w
here
we
have
dire
ct o
pera
tiona
l con
trol
Shipping lines, agents and vessels: We work with federal agencies and the marine sector to ensure vessel transits are conducted in a safe, efficient and environmentally responsible manner.
Terminals: We work with the operators of the Port’s 28 major terminals under lease to promote continuous environmental improvement and manage impacts on the community.
Tenants on port lands: We lease land and water assets to organizations that require port infrastructure and work with them through environmental assessments, project reviews and lease schedules to manage environmental and social impacts.
Supply chain connections: We work with major rail service providers, more than 2,000 container trucks and other supply chain partners to ensure reliable and efficient intermodal connections.
10 | OuR RePORt PORT mETRO VANcOUVER 2011 SUSTAINABILITY REPORT
RePORt OVeRVieW
sectiOn Of RePORt
mateRial tOPics
2011 initiatiVes status initiatiVes fOR 2012
The PorT AuThoriTy
Our Workplace
(Page 17)
Our Workplace Embed new corporate values into business processes
Support employees in completing training identified in development plans
●
●
80% of employees to complete goals-setting training and activities identified in 2012 development plans
Our Environmental Footprint
(Pages 18–19)
Our Workplace Footprint
Reduce energy consumption and waste at our maintenance facility
Identify further energy conservation and waste management opportunities
Encourage employees to commute sustainably
develop a Sustainable Purchasing Program for implementation in 2012
transition to 100% post-consumer recycled content copy paper
●
●
●
◗
●
Reduce energy use at our head office and maintenance facility by 2%
Maintain 2011 level of waste diversion and roll out improvements to the SortSmart Program
Work with our waste service provider to obtain comprehensive data for 2012
Increase the number of employees commuting sustainably
Implement a Sustainable Purchasing Program
Financial Results
(Pages 20–21)
Our Financial Performance
Complete transition to the International Financial Reporting Standards
● Release first standalone financial report
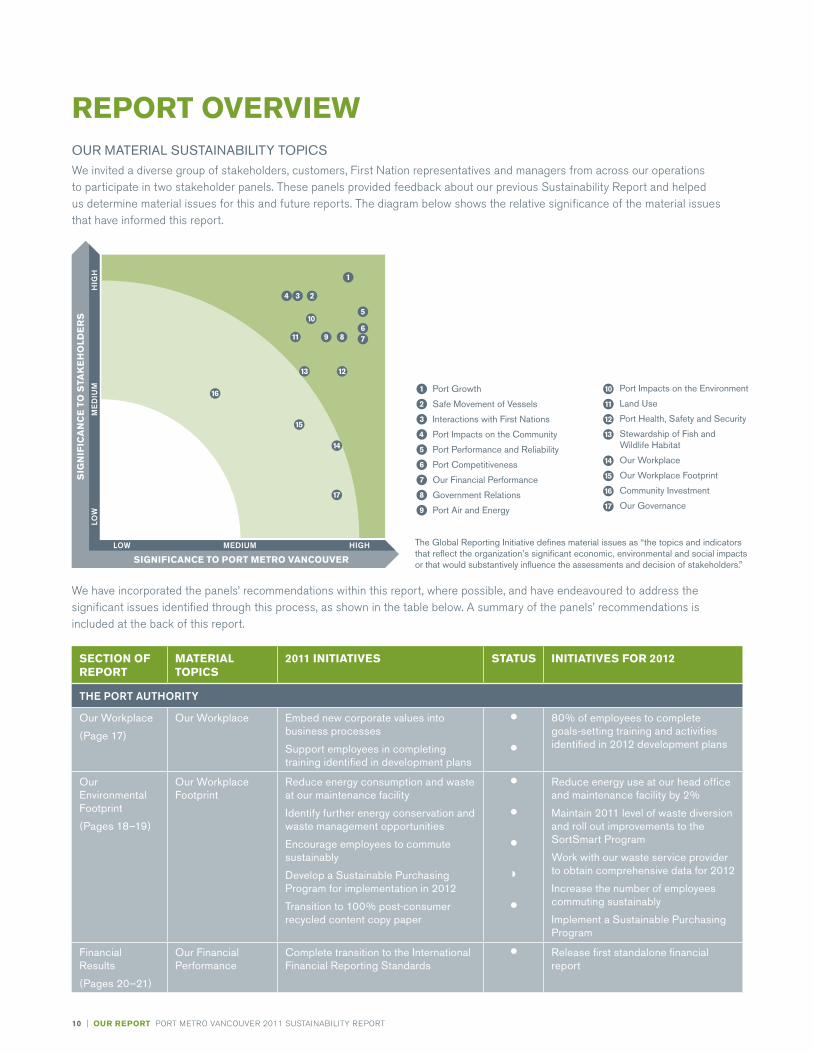
OuR MAtERIAl SuStAInABIlIty tOPICSWe invited a diverse group of stakeholders, customers, first Nation representatives and managers from across our operations to participate in two stakeholder panels. These panels provided feedback about our previous Sustainability Report and helped us determine material issues for this and future reports. The diagram below shows the relative significance of the material issues that have informed this report.
SIG
NIF
ICA
NC
E T
O S
TAK
EH
OLD
ER
S
SIGNIFICANCE TO PORT METRO VANCOUVER
HIG
H
HIGH
ME
DIU
M
MEDIUM
LOW
LOW The Global Reporting Initiative defines material issues as “the topics and indicators that reflect the organization’s significant economic, environmental and social impacts or that would substantively influence the assessments and decision of stakeholders.”
Port Growth
Safe Movement of Vessels
Interactions with First Nations
Port Impacts on the Community
Port Performance and Reliability
Port Competitiveness
Our Financial Performance
Government Relations
Port Air and Energy
Port Impacts on the Environment
Land Use
Port Health, Safety and Security
Stewardship of Fish andWildlife Habitat
Our Workplace
Our Workplace Footprint
Community Investment
Our Governance
1
1
2
2
3
3
4
4
5
5
6
6
7
7
8
8
9
9
10
10
11
11
12
12
13
13
14
14
15
15
16
16
1717
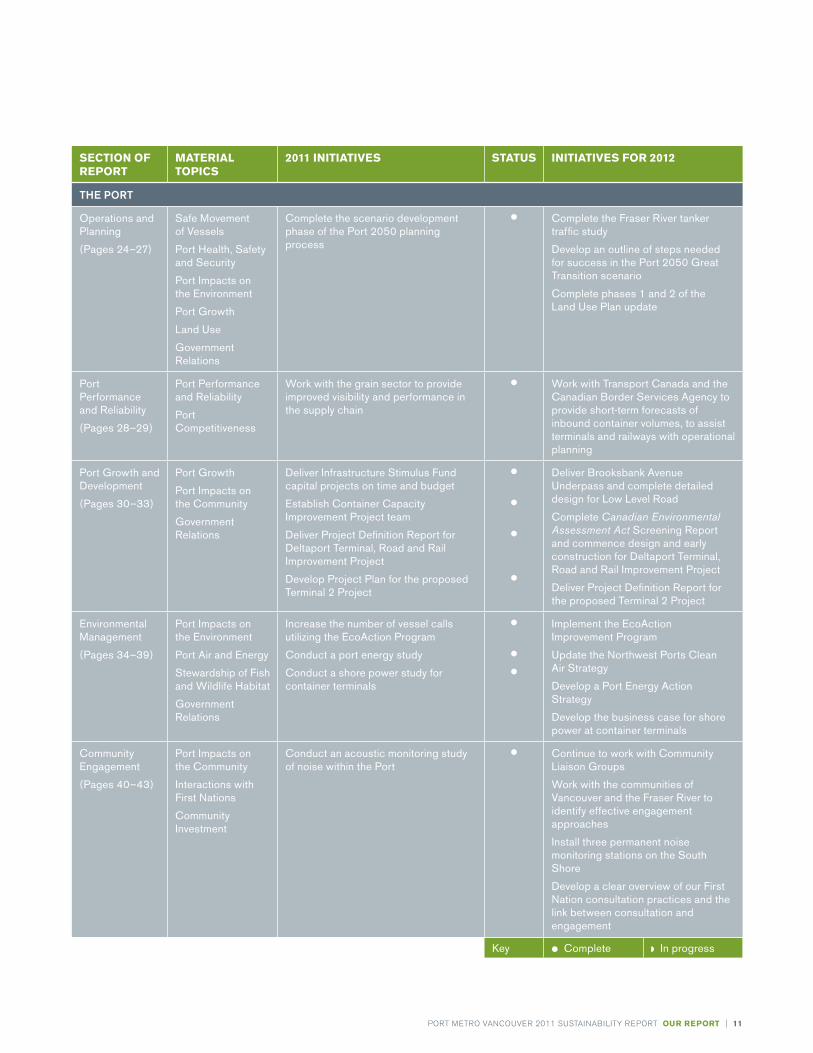
We have incorporated the panels’ recommendations within this report, where possible, and have endeavoured to address the significant issues identified through this process, as shown in the table below. A summary of the panels’ recommendations is included at the back of this report.
| 11
sectiOn Of RePORt
mateRial tOPics
2011 initiatiVes status initiatiVes fOR 2012
The PorT
Operations and Planning
(Pages 24–27)
Safe Movement of Vessels
Port Health, Safety and Security
Port Impacts on the Environment
Port Growth
land use
Government Relations
Complete the scenario development phase of the Port 2050 planning process
● Complete the Fraser River tanker traffic study
develop an outline of steps needed for success in the Port 2050 Great transition scenario
Complete phases 1 and 2 of the land use Plan update
Port Performance and Reliability
(Pages 28–29)
Port Performance and Reliability
Port Competitiveness
Work with the grain sector to provide improved visibility and performance in the supply chain
● Work with transport Canada and the Canadian Border Services Agency to provide short-term forecasts of inbound container volumes, to assist terminals and railways with operational planning
Port Growth and development
(Pages 30–33)
Port Growth
Port Impacts on the Community
Government Relations
deliver Infrastructure Stimulus Fund capital projects on time and budget
Establish Container Capacity Improvement Project team
deliver Project definition Report for deltaport terminal, Road and Rail Improvement Project
develop Project Plan for the proposed terminal 2 Project
●
●
●
●
deliver Brooksbank Avenue underpass and complete detailed design for low level Road
Complete Canadian Environmental Assessment Act Screening Report and commence design and early construction for deltaport terminal, Road and Rail Improvement Project
deliver Project definition Report for the proposed terminal 2 Project
Environmental Management
(Pages 34–39)
Port Impacts on the Environment
Port Air and Energy
Stewardship of Fish and Wildlife Habitat
Government Relations
Increase the number of vessel calls utilizing the EcoAction Program
Conduct a port energy study
Conduct a shore power study for container terminals
●
●
●
Implement the EcoAction Improvement Program
update the northwest Ports Clean Air Strategy
develop a Port Energy Action Strategy
develop the business case for shore power at container terminals
Community Engagement
(Pages 40–43)
Port Impacts on the Community
Interactions with First nations
Community Investment
Conduct an acoustic monitoring study of noise within the Port
● Continue to work with Community liaison Groups
Work with the communities of Vancouver and the Fraser River to identify effective engagement approaches
Install three permanent noise monitoring stations on the South Shore
develop a clear overview of our First nation consultation practices and the link between consultation and engagement
Key ● Complete ◗ In progress
PORT mETRO VANcOUVER 2011 SUSTAINABILITY REPORT OuR RePORt

$72mconsolidated net income
WE OVERSEE A SIgNIfIcANT PART Of cANAdA’S PORT INfRASTRUcTURE ANd PLAY A cRITIcAL ROLE IN ThE dEVELOPmENT ANd gROWTh Of cANAdA’S PAcIfIc gATEWAY.
tHe PORt autHORitY

14 | tHe PORt autHORitY PORT mETRO VANcOUVER 2011 SUSTAINABILITY REPORT
VancOuVeR fRaseR PORt autHORitYThe Vancouver fraser Port Authority, doing business as Port metro Vancouver, is a non-shareholder, financially self-sufficient corporation, established by the government of canada in january 2008, pursuant to the Canada Marine Act, and is accountable to the federal minister of Transport, Infrastructure and communities.
We have a statutory mandate to ensure that we provide canada with the marine infrastructure it needs that offers effective support for the achievement of national, social and economic objectives, and that we will promote and safeguard canada’s competitiveness and trade objectives.
Our customers include marine carriers, major shippers, terminal operators and tenants. most of the major deep-sea terminals within Port metro Vancouver’s jurisdiction are privately owned and operated on land and/or water lots leased from the Port Authority.
OuR juRISdICtIOnWe are primarily responsible for managing federal property and waterways. We administer over 16,000 hectares of water, nearly 1,000 hectares of land, and assets along 640 kilometres of shoreline. Our jurisdiction borders 16 Lower mainland municipalities and one treaty first Nation, and intersects the traditional territories of several first Nations. We also acquire and develop industrial real estate in our own name in support of canada’s international trade.
OuR missiOn
to lead the growth of Canada’s Pacific Gateway in a manner that enhances the well-being of Canadians.
OuR VisiOn
to be the most efficient and sustainable Gateway for the customers we serve, benefiting communities locally and across the nation.
OuR Values
CoLLABorATioN AND TeAMWorK We work together to achieve our greatest potential. We communicate openly and treat each other with trust and respect.
CuSToMer reSPoNSiVeNeSS We strive to understand our customers’ needs and to proactively provide them with distinctive value.
iNNoVATioNWe seek new ideas and creative solutions.
LeADerShiP AND ACCouNTABiLiTyWe lead by example, act with integrity and are accountable for our actions.
our PeoPLeWe are committed to continuous learning, diversity and balance.
SuSTAiNABiLiTyWe think long-term, considering social, environmental and financial matters.
for further information about our organization, please see our website at:portmetrovancouver.com/corporate
| 15PORT mETRO VANcOUVER 2011 SUSTAINABILITY REPORT tHe PORt autHORitY
OuR aPPROacH tO sustainabilitYWe focus on long-term economic, social and environmental performance so that future generations will enjoy the benefits of trade, improved quality of life, and a healthy and vibrant ecosystem.
We lead by example and collaborate with our partners to promote development that improves the Port’s economic, environmental and social performance over the long-term.
We measure our sustainability performance through our corporate Balanced Scorecard. This Scorecard tracks our performance in economic, environmental and social priorities, as well as our corporate strategic initiatives. The Scorecard is shared with all employees on a monthly basis at our town hall meetings and is a factor in employee compensation.
Our Scorecard contains a corporate social responsibility component that looks at both our workplace environmental footprint, including energy, employee commuting and waste, and broader port-related issues, including noise, truck traffic and air quality.
cORPORate stRategic PRiORities
operational efficiency, Capacity and Customer Value enhancement: Improve supply chain reliability and throughput capacity to meet customer needs and enhance value to our customers.
Land Asset Strategy: Ensure there is sufficient land, appropriately utilized, to meet long-term requirements of the Port.
Community and Government engagement: Engage communities and government to build relationships and awareness of the Port.
organizational excellence: Engage employees, create effective processes and implement appropriate technologies.
Corporate Social responsibility (CSr): deliver material progress on relevant CSR initiatives to improve long-term sustainability of the Port.
Strategy and Long-range Planning: Engage stakeholders to inform the creation of Port Metro Vancouver’s strategy and long-term plans.
We believe a sustainable port requires long-term thinking, which is why in 2011 we embarked on the Port 2050 planning process. collaborating with our diverse stakeholders on this long-range planning process helped us develop a shared perspective of a sustainable port – one that informs our actions today.
OuR StAKEHOldERSWe serve a diverse range of stakeholders. Neighbouring communities, customers, marine carriers, major shippers, tenants, terminal operators, federal, provincial and municipal governments, first Nations, labour, railways, trucking companies and our employees all have a stake in the future of the gateway. continued engagement with our stakeholders deepens our understanding of shared goals and creates opportunities for further collaboration.

16 | tHe PORt autHORitY PORT mETRO VANcOUVER 2011 SUSTAINABILITY REPORT
BOARd OF dIRECtORS Port metro Vancouver is guided by an independent Board of directors, responsible for reviewing and approving our strategic direction and related land use, business, operating and capital plans, selecting qualified management, overseeing our business activities and material risks, and developing a succession-planning process.
Our Board is composed of 11 members: one federal appointee; one British columbia provincial appointee; one appointee for the prairie provinces of Alberta, Saskatchewan and manitoba; one municipal appointee; and seven federal appointees recommended by port users.
Board candidates are appointed based on two main criteria: their experience and expertise within the transportation industry or business community, and their knowledge regarding the management of business and trade.
The following standing committees oversee matters critical to the organization, receive input from employees and management on a variety of topics and make recommendations to the Board:
• Audit• community and corporate Social Responsibility• governance and conduct• human Resources and compensation• major capital Projects
CORPORAtE SOCIAl RESPOnSIBIlItyOur governance structure supports an integrated approach to corporate social responsibility (cSR). Executive oversight for cSR matters resides with the Vice President, corporate Social Responsibility, who reports through the chief Executive Officer to the community and corporate Social Responsibility committee of the Board of directors.
We have staff dedicated to corporate social responsibility, along with a cross-functional team, consisting of various business units throughout the organization, that supports sustainability initiatives, engages employees on related issues, and monitors performance through our monthly corporate Social Responsibility Scorecard.
gOVeRnance
for further information about our board of Directors, please see our website at:portmetrovancouver.com/corporate
corporate Social Responsibility PolicyIn june 2011, we introduced a CSR Policy that
formalizes our commitment to integrate social
and environmental matters into our values, culture,
decision-making, strategy development and
operations, in a transparent and accountable
manner. We work to ensure CSR considerations
are demonstrated in decision-making processes
and daily work activities.

| 17PORT mETRO VANcOUVER 2011 SUSTAINABILITY REPORT tHe PORt autHORitY
The successes and strengths of our organization are a direct result of our talented people. Our commitment to continuous learning, diversity and balance is reflected in our corporate values.
OuR PEOPlEAt the end of 2011, there were 224 employees based in Vancouver, plus two representatives working out of our office in Beijing, china. during the year, we also employed six post-secondary school students to support our community outreach, and a number of casual staff who were called on as needed throughout the year.
PORt metRO VancOuVeR’s WORkfORce
Employment Contract Employment type
Permanent Fixed term
Full time Part time
total 200 26 214 12
Male 96 7 102 1
Female 104 19 112 11
emPlOYees jOining anD leaVing DuRing 2011
Employees joining
Employees leaving
Employee turnover Rate1
total 46 26 9%
Male 24 17 15%
Female 22 9 3%
under 30 12 3 8%
30 – 50 30 13 6%
50+ 4 10 15%
1 Calculation of turnover rate applies to permanent employees only. In 2011, 17 permanent employees left Port Metro Vancouver.
We strive to provide our employees with a challenging and enjoyable work environment, competitive salaries and a comprehensive benefits package. Benefits include an earned time off program, access to an on-site fitness facility and programs for employee and family assistance.
We consider the safety and well-being of employees a top priority. Our Safety Policy defines our commitment to conducting operations in a manner that minimizes the risk of injury or disease to employees, the public, customers and contractors. A joint management and worker health and Safety committee oversees our health and safety programs.
lABOuR RElAtIOnSPort metro Vancouver is a unionized workplace, with our employees represented by the International Longshore and Warehouse Union, Local 517. We have a long history of collaborative labour relations and work jointly on the collective agreement and other matters.
EMPlOyEE EnGAGEMEntWe engage our employees to share their experiences within the organization. We conduct surveys and focus groups to identify our strengths and areas for improvement. Our most recent employee survey, conducted in june 2011, identified three of our corporate values – sustainability, customer responsiveness and our people – as strengths, while bureaucracy and hierarchy were identified as areas for improvement. We are currently working on several initiatives to leverage our strengths and make improvements.
EduCAtIOn And tRAInInG We encourage our employees to undertake continuous education, training and development. All employees prepare an annual development plan. completion of training identified in development plans is a component of our corporate Balanced Scorecard and a factor in the annual corporate Performance Award for employees. In 2011, we invested more than $365,000 in training and development of our employees, an average of about $1,600 per employee. We are developing a process to track the hours of training per employee and plan to report on this in the future.
We provide a broad orientation program for new employees, including an overview of the Port, a harbour tour, security training and an introduction to our corporate Social Responsibility programs. New employees are required to acknowledge our code of Ethical conduct Policy and complete online harassment awareness training. In 2011 this training was completed by 42 employees.
OuR WORkPlace
18 | tHe PORt autHORitY PORT mETRO VANcOUVER 2011 SUSTAINABILITY REPORT
We measure our environmental performance through our corporate Social Responsibility Scorecard. The Scorecard looks at our workplace footprint, including our energy, waste and employee commuting performance, and monitors broader port-related issues including noise, truck traffic and air quality.
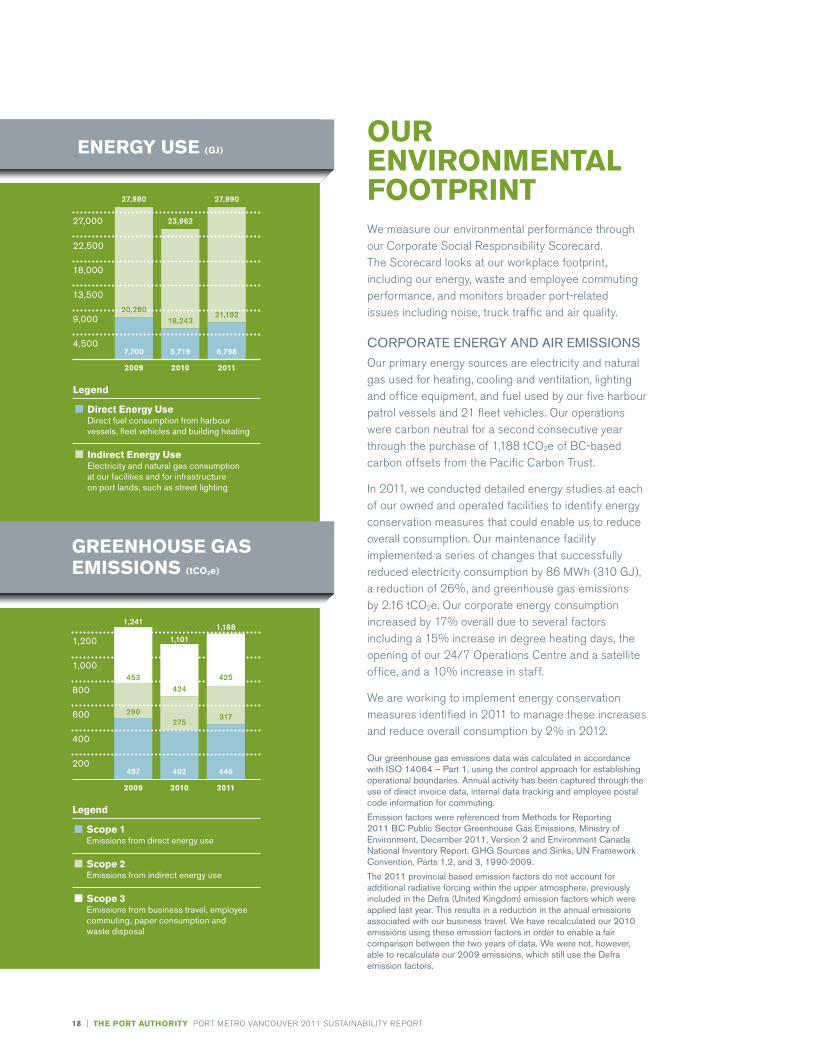
CORPORAtE EnERGy And AIR EMISSIOnSOur primary energy sources are electricity and natural gas used for heating, cooling and ventilation, lighting and office equipment, and fuel used by our five harbour patrol vessels and 21 fleet vehicles. Our operations were carbon neutral for a second consecutive year through the purchase of 1,188 tcO2e of Bc-based carbon offsets from the Pacific carbon Trust.
In 2011, we conducted detailed energy studies at each of our owned and operated facilities to identify energy conservation measures that could enable us to reduce overall consumption. Our maintenance facility implemented a series of changes that successfully reduced electricity consumption by 86 mWh (310 gj), a reduction of 26%, and greenhouse gas emissions by 2.16 tcO2e. Our corporate energy consumption increased by 17% overall due to several factors including a 15% increase in degree heating days, the opening of our 24/7 Operations centre and a satellite office, and a 10% increase in staff.
We are working to implement energy conservation measures identified in 2011 to manage these increases and reduce overall consumption by 2% in 2012.
OuR enViROnmental fOOtPRint
gReenHOuse gas emissiOns (tcO2e)
eneRgY use (gj)
2009 2010 2011
4,500
9,000
13,500
18,000
22,500
27,000
7,700 5,719 6,798
18,24320,280
Legend
Indirect Energy UseElectricity and natural gas consumption at our facilities and for infrastructure on port lands, such as street lighting
Direct Energy UseDirect fuel consumption from harbour vessels, fleet vehicles and building heating
21,192
23,962
27,980 27,990
2010 2011
200
400
600
800
1,000
1,200
402 446
275317
424425
1,101
2009
497
290
453
1,2411,188
Legend
Scope 1Emissions from direct energy use
Scope 2Emissions from indirect energy use
Scope 3Emissions from business travel, employee commuting, paper consumption and waste disposal
Our greenhouse gas emissions data was calculated in accordance with ISO 14064 – Part 1, using the control approach for establishing operational boundaries. Annual activity has been captured through the use of direct invoice data, internal data tracking and employee postal code information for commuting.
Emission factors were referenced from Methods for Reporting 2011 BC Public Sector Greenhouse Gas Emissions, Ministry of Environment, december 2011, Version 2 and Environment Canada national Inventory Report, GHG Sources and Sinks, un Framework Convention, Parts 1,2, and 3, 1990-2009.
the 2011 provincial based emission factors do not account for additional radiative forcing within the upper atmosphere, previously included in the defra (united Kingdom) emission factors which were applied last year. this results in a reduction in the annual emissions associated with our business travel. We have recalculated our 2010 emissions using these emission factors in order to enable a fair comparison between the two years of data. We were not, however, able to recalculate our 2009 emissions, which still use the defra emission factors.
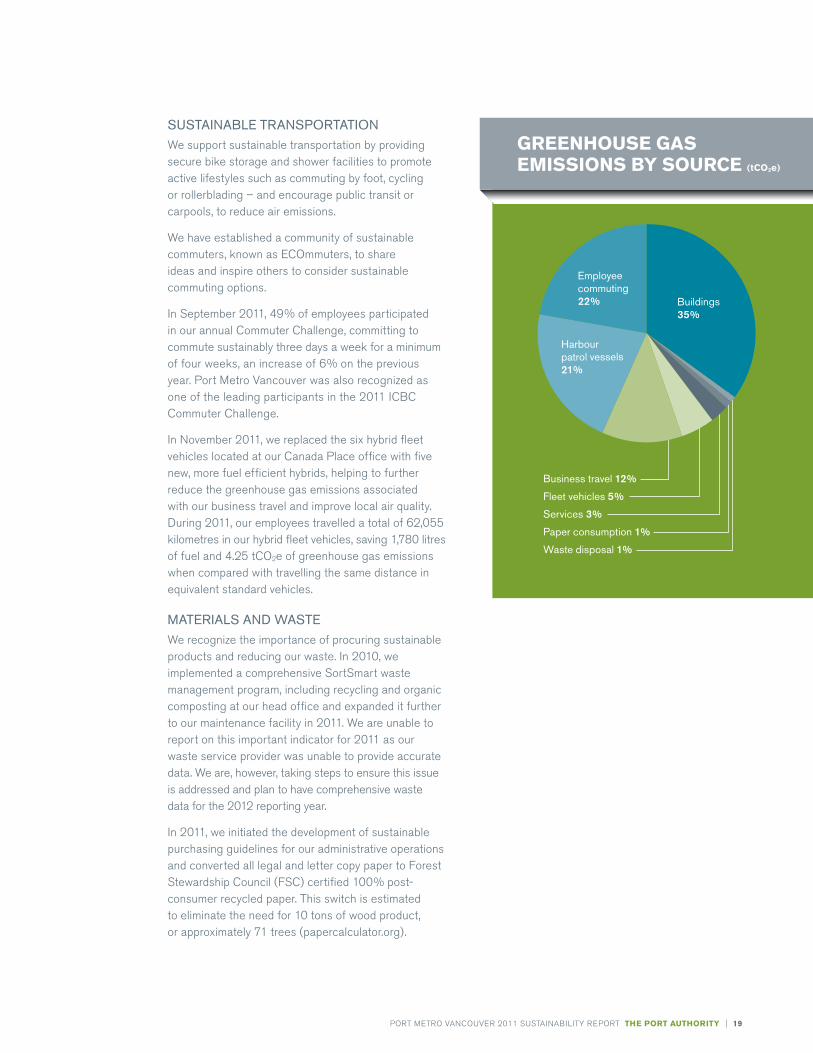
gReenHOuse gas emissiOns bY sOuRce (tcO2e)
Business travel 12%
Fleet vehicles 5%
Services 3%
Paper consumption 1%
Waste disposal 1%
Buildings35%
Employeecommuting22%
Harbour patrol vessels21%
| 19PORT mETRO VANcOUVER 2011 SUSTAINABILITY REPORT tHe PORt autHORitY
SuStAInABlE tRAnSPORtAtIOnWe support sustainable transportation by providing secure bike storage and shower facilities to promote active lifestyles such as commuting by foot, cycling or rollerblading – and encourage public transit or carpools, to reduce air emissions.
We have established a community of sustainable commuters, known as EcOmmuters, to share ideas and inspire others to consider sustainable commuting options.
In September 2011, 49% of employees participated in our annual commuter challenge, committing to commute sustainably three days a week for a minimum of four weeks, an increase of 6% on the previous year. Port metro Vancouver was also recognized as one of the leading participants in the 2011 IcBc commuter challenge.
In November 2011, we replaced the six hybrid fleet vehicles located at our canada Place office with five new, more fuel efficient hybrids, helping to further reduce the greenhouse gas emissions associated with our business travel and improve local air quality. during 2011, our employees travelled a total of 62,055 kilometres in our hybrid fleet vehicles, saving 1,780 litres of fuel and 4.25 tcO2e of greenhouse gas emissions when compared with travelling the same distance in equivalent standard vehicles.
MAtERIAlS And WAStEWe recognize the importance of procuring sustainable products and reducing our waste. In 2010, we implemented a comprehensive SortSmart waste management program, including recycling and organic composting at our head office and expanded it further to our maintenance facility in 2011. We are unable to report on this important indicator for 2011 as our waste service provider was unable to provide accurate data. We are, however, taking steps to ensure this issue is addressed and plan to have comprehensive waste data for the 2012 reporting year.
In 2011, we initiated the development of sustainable purchasing guidelines for our administrative operations and converted all legal and letter copy paper to forest Stewardship council (fSc) certified 100% post-consumer recycled paper. This switch is estimated to eliminate the need for 10 tons of wood product, or approximately 71 trees (papercalculator.org).
20 | tHe PORt autHORitY PORT mETRO VANcOUVER 2011 SUSTAINABILITY REPORT
Port metro Vancouver is committed to financial self-sufficiency and the reinvestment of profits: to continuously improve port facilities, infrastructure and services for users; to benefit communities; and to enhance our environmental programs. Our financial results are affected by the success of our trading partners and the growth of trade across the country. We plan and invest to support sustainable growth for future generations while ensuring our financial targets are met today.
OVERVIEW OF RESultSPort metro Vancouver continues to be a financially sound entity with a strong credit profile and cash position.
We demonstrated financial strength in 2011 through an increase in our economic value generated. Port metro Vancouver endured major world events in 2011, including the continued global economic slow-down, the ongoing debt crisis in Europe and japan’s tsunami disaster. Our strength and resiliency lies in diversity. We are the most diversified port in canada in terms of cargo sectors, trading partners and import-export balance. Increased cargo volumes through the Port translated into increased harbour dues, wharfage, berthage and variable rent revenues for 2011. In addition, fixed rent accounts for approximately half of our total revenues, meaning that half of our revenues are protected against fluctuations in commodity volumes.
Our 2011 economic value retained (our net income for accounting purposes) did however decrease from $74.3 million in 2010 to $72.0 million in 2011.
financial ResultsWe continue to create value and jobs through a tough economic cycle by focusing on diversity and investing in infrastructure.
This 3% decline had been anticipated in Port metro Vancouver’s 2011 operating budget and was largely due to the loss of the one-time Vancouver 2010 Olympic and Paralympic Winter games revenues earned in 2010, as well as increased expenditures on dredging and financing costs. The table on page 21 summarizes Port metro Vancouver’s direct economic value generated, distributed and retained for 2011 and 2010, and includes the results of our subsidiaries. This information should be read in conjunction with our 2011 financial Report.
RISK MAnAGEMEntWe assess risks and associated controls internally on a regular basis throughout the year in order to identify, evaluate and manage risks posed to the achievement of our objectives. This assessment is led by our Enterprise Risk management committee. Our Board of directors retain overall responsibility for risk management and for determining the appropriate level of risk in the conduct of Port metro Vancouver’s business activities. Examples of top risks include interruptions to port operations, environmental impacts, community relations and climate change. Please see our financial Report for more information on our approach to risk management.
In 2011, all of Port metro Vancouver’s six divisions and 18 business units were assessed for corruption-related risks as part of our Enterprise Risk management initiative.
| 21PORT mETRO VANcOUVER 2011 SUSTAINABILITY REPORT tHe PORt autHORitY
Please see our 2011 financial Report for a full financial review, including highlights from 2011, detailed statements, and our management discussion and analysis at: portmetrovancouver.com/accountability
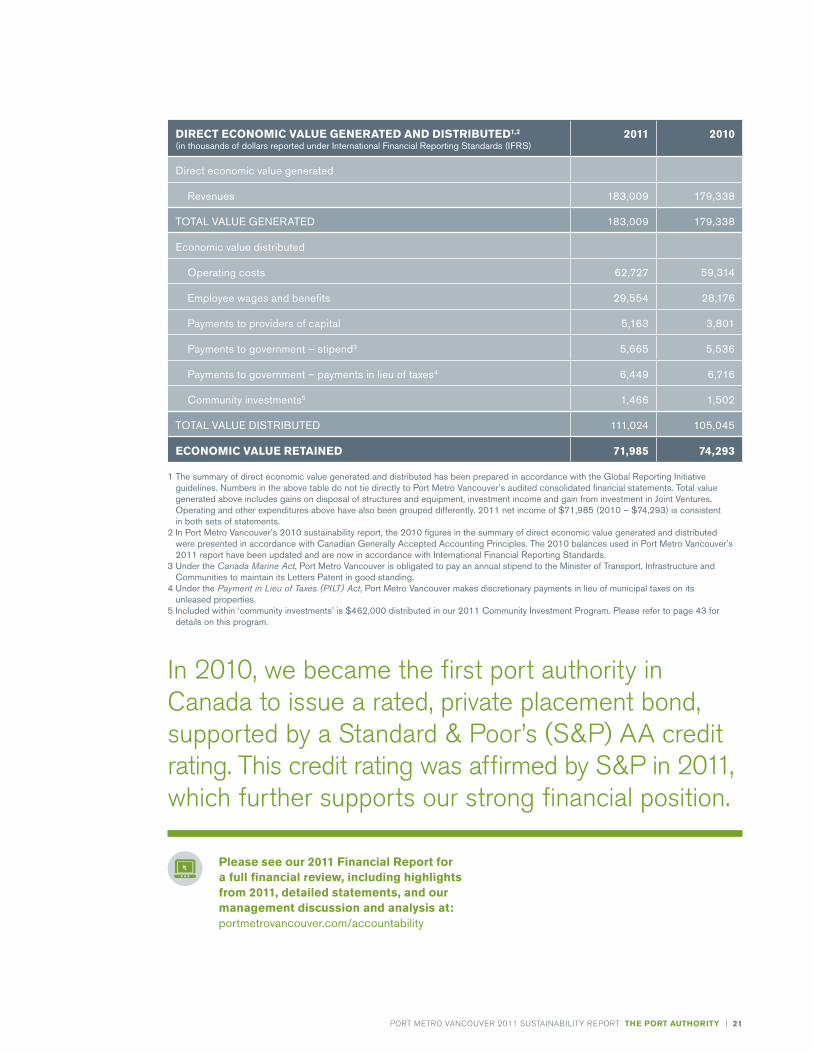
In 2010, we became the first port authority in canada to issue a rated, private placement bond, supported by a Standard & Poor’s (S&P) AA credit rating. This credit rating was affirmed by S&P in 2011, which further supports our strong financial position.
1 the summary of direct economic value generated and distributed has been prepared in accordance with the Global Reporting Initiative guidelines. numbers in the above table do not tie directly to Port Metro Vancouver’s audited consolidated financial statements. total value generated above includes gains on disposal of structures and equipment, investment income and gain from investment in joint Ventures. Operating and other expenditures above have also been grouped differently. 2011 net income of $71,985 (2010 – $74,293) is consistent in both sets of statements.
2 In Port Metro Vancouver’s 2010 sustainability report, the 2010 figures in the summary of direct economic value generated and distributed were presented in accordance with Canadian Generally Accepted Accounting Principles. the 2010 balances used in Port Metro Vancouver’s 2011 report have been updated and are now in accordance with International Financial Reporting Standards.
3 under the Canada Marine Act, Port Metro Vancouver is obligated to pay an annual stipend to the Minister of transport, Infrastructure and Communities to maintain its letters Patent in good standing.
4 under the Payment in Lieu of Taxes (PILT) Act, Port Metro Vancouver makes discretionary payments in lieu of municipal taxes on its unleased properties.
5 Included within ‘community investments’ is $462,000 distributed in our 2011 Community Investment Program. Please refer to page 43 for details on this program.
DiRect ecOnOmic Value geneRateD anD DistRibuteD1,2
(in thousands of dollars reported under International Financial Reporting Standards (IFRS)2011 2010
direct economic value generated
Revenues 183,009 179,338
tOtAl VAluE GEnERAtEd 183,009 179,338
Economic value distributed
Operating costs 62,727 59,314
Employee wages and benefits 29,554 28,176
Payments to providers of capital 5,163 3,801
Payments to government – stipend3 5,665 5,536
Payments to government – payments in lieu of taxes4 6,449 6,716
Community investments5 1,466 1,502
tOtAl VAluE dIStRIButEd 111,024 105,045
ecOnOmic Value RetaineD 71,985 74,293

$75bn in goods traded annually
129,500jobs generated across Canada
44% other
25%China
Major foreign trading economies
16%SouthKorea
15%Japan
tHe PORtcANAdA’S LARgEST gATEWAY TO ThE ASIA-PAcIfIc REgION, cONNEcTINg cANAdIANS WITh TRAdINg PARTNERS IN mORE ThAN 160 EcONOmIES ANd mOVINg mORE ThAN $200 mILLION Of cARgO dAILY.

24 | tHe PORt PORT mETRO VANcOUVER 2011 SUSTAINABILITY REPORT
and dependable gateway for canada’s domestic and international trade and tourism. Our safety and security measures incorporate best practices and meet or exceed Transport canada’s marine Transport Regulations.
Emergency managementPort Metro Vancouver routinely participates in
incident response exercises with other responding
agencies as part of our ongoing efforts to maintain
a high state of readiness.
In October 2011, Port Metro Vancouver, deltaport
and Westshore terminals participated in a Command
Post Exercise to test communication and command
readiness in the event of a transport Canada Marine
Security (MARSEC) level increase. the exercise put
our Operations Centre employees and management
through the test of multiple scenarios leading to a
MARSEC level 2 situation. the exercise was undertaken
as the first of a two-phase plan; the second phase
will be a “live play” exercise in 2012, involving first
responders, regulatory agencies, port stakeholders
and clients testing responses to a simulated MARSEC
level increase experienced in real time.
OPERAtIOnS CEntREPort metro Vancouver’s Operations centre, which opened march 1, 2011, is a centralized hub to manage port operational activities, security incidents and emergency response. The Operations centre is staffed by the operations and security department, and is supported by various industry specialists, providing continuous 24/7 coverage, 365 days of the year. This team works to enhance safe, secure, efficient and reliable port operations and minimize the impact of any incidents. The Operations centre is located on the waterfront in our head office at canada Place.
OPeRatiOns anD PlanningWe are committed to the safe, efficient and environmentally responsible movement of goods and passengers through the Port.
3,024 foreign vessel calls24/7operations
Centre
Visit transport canada’s website for further information on marine security:tc.gc.ca/eng/marine-menu.htm
PORt SECuRItyPort metro Vancouver works with Transport canada, local law enforcement and the canadian Border Services Agency to ensure that the Port is a secure
Marine safety and
environmental protection
Supply chain efficiency and reliability
Port security
emergency management
Ensuring the safe, efficient and environmentally responsible movement of goods and passengers through the Port
| 25PORT mETRO VANcOUVER 2011 SUSTAINABILITY REPORT tHe PORt
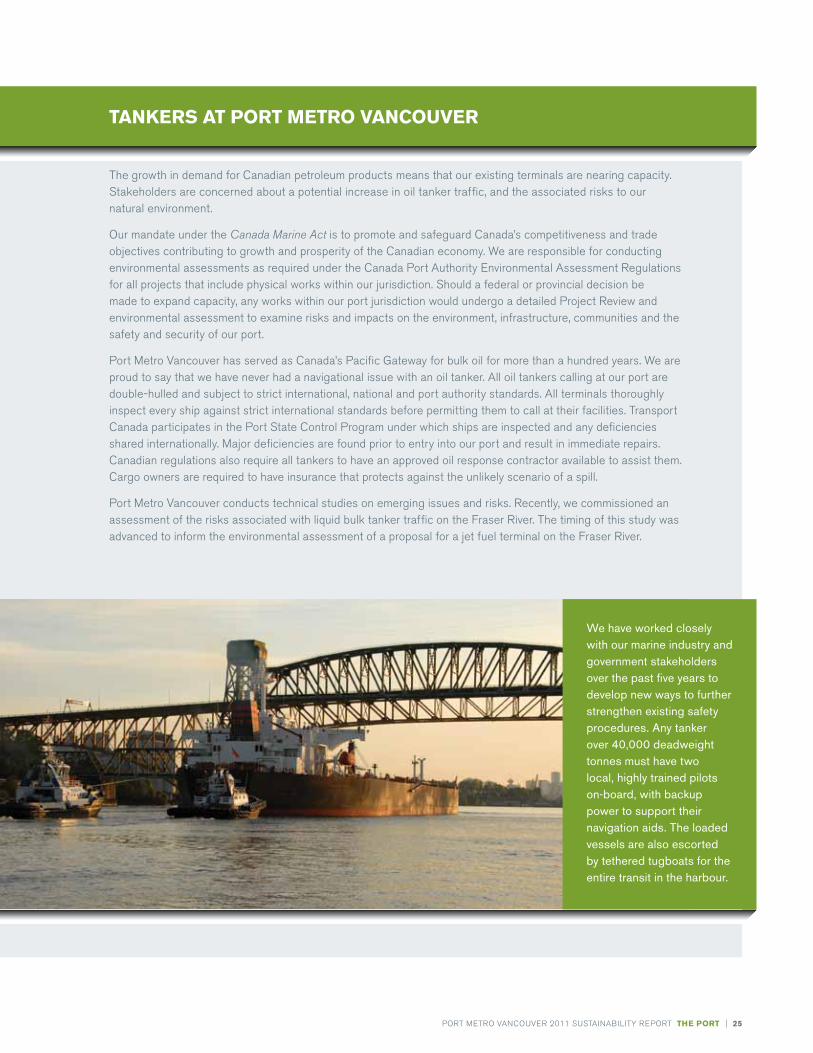
The growth in demand for canadian petroleum products means that our existing terminals are nearing capacity. Stakeholders are concerned about a potential increase in oil tanker traffic, and the associated risks to our natural environment.
Our mandate under the Canada Marine Act is to promote and safeguard canada’s competitiveness and trade objectives contributing to growth and prosperity of the canadian economy. We are responsible for conducting environmental assessments as required under the canada Port Authority Environmental Assessment Regulations for all projects that include physical works within our jurisdiction. Should a federal or provincial decision be made to expand capacity, any works within our port jurisdiction would undergo a detailed Project Review and environmental assessment to examine risks and impacts on the environment, infrastructure, communities and the safety and security of our port.
Port metro Vancouver has served as canada’s Pacific gateway for bulk oil for more than a hundred years. We are proud to say that we have never had a navigational issue with an oil tanker. All oil tankers calling at our port are double-hulled and subject to strict international, national and port authority standards. All terminals thoroughly inspect every ship against strict international standards before permitting them to call at their facilities. Transport canada participates in the Port State control Program under which ships are inspected and any deficiencies shared internationally. major deficiencies are found prior to entry into our port and result in immediate repairs. canadian regulations also require all tankers to have an approved oil response contractor available to assist them. cargo owners are required to have insurance that protects against the unlikely scenario of a spill.
Port metro Vancouver conducts technical studies on emerging issues and risks. Recently, we commissioned an assessment of the risks associated with liquid bulk tanker traffic on the fraser River. The timing of this study was advanced to inform the environmental assessment of a proposal for a jet fuel terminal on the fraser River.
tankeRs at PORt metRO VancOuVeR
We have worked closely with our marine industry and government stakeholders over the past five years to develop new ways to further strengthen existing safety procedures. Any tanker over 40,000 deadweight tonnes must have two local, highly trained pilots on-board, with backup power to support their navigation aids. the loaded vessels are also escorted by tethered tugboats for the entire transit in the harbour.
26 | tHe PORt PORT mETRO VANcOUVER 2011 SUSTAINABILITY REPORT
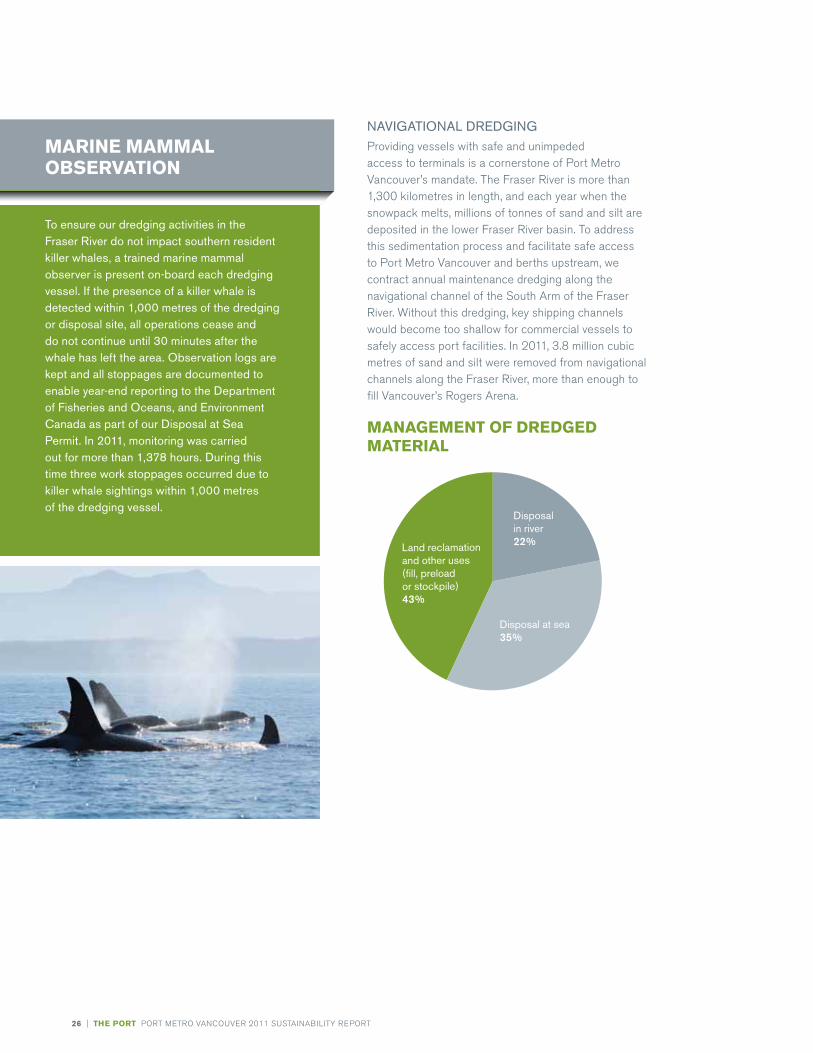
nAVIGAtIOnAl dREdGInGProviding vessels with safe and unimpeded access to terminals is a cornerstone of Port metro Vancouver’s mandate. The fraser River is more than 1,300 kilometres in length, and each year when the snowpack melts, millions of tonnes of sand and silt are deposited in the lower fraser River basin. To address this sedimentation process and facilitate safe access to Port metro Vancouver and berths upstream, we contract annual maintenance dredging along the navigational channel of the South Arm of the fraser River. Without this dredging, key shipping channels would become too shallow for commercial vessels to safely access port facilities. In 2011, 3.8 million cubic metres of sand and silt were removed from navigational channels along the fraser River, more than enough to fill Vancouver’s Rogers Arena.
management Of DReDgeD mateRial
Land reclamation and other uses (fill, preload or stockpile)43%
Disposal at sea35%
Disposal in river22%
maRine mammal ObseRVatiOn
to ensure our dredging activities in the Fraser River do not impact southern resident killer whales, a trained marine mammal observer is present on-board each dredging vessel. If the presence of a killer whale is detected within 1,000 metres of the dredging or disposal site, all operations cease and do not continue until 30 minutes after the whale has left the area. Observation logs are kept and all stoppages are documented to enable year-end reporting to the department of Fisheries and Oceans, and Environment Canada as part of our disposal at Sea Permit. In 2011, monitoring was carried out for more than 1,378 hours. during this time three work stoppages occurred due to killer whale sightings within 1,000 metres of the dredging vessel.
LOCAL FORTRESS
Economic Growth-Driven Model Remains Dominant
Alternative Prosperity Model Emerges
Our Anticipated Future
Where we are today
Current Trajectory
Constrained/Decreasing
Adaptive/Increasing
MISSED THE BOAT
THE GREAT TRANSITION
RISING TIDE
GLOBAL PROSPERITY MODEL
CA
PAC
ITY
OF
THE
GAT
EW
AY
| 27PORT mETRO VANcOUVER 2011 SUSTAINABILITY REPORT tHe PORt
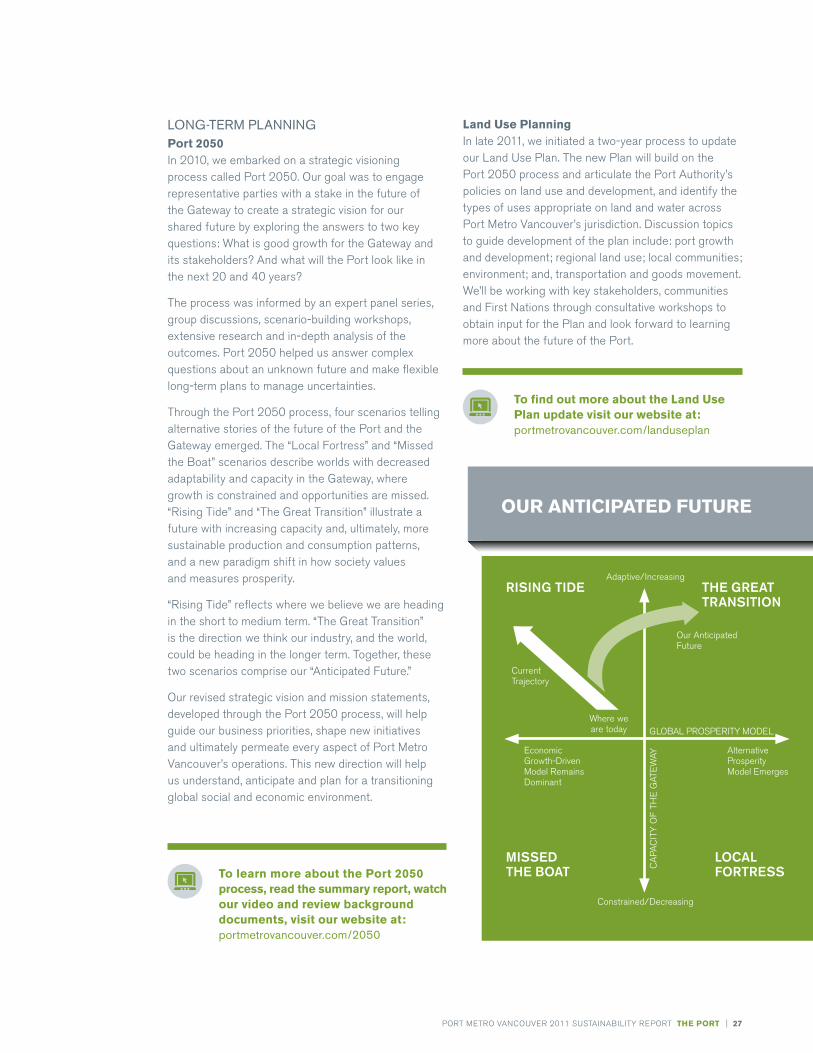
land use PlanningIn late 2011, we initiated a two-year process to update our Land Use Plan. The new Plan will build on the Port 2050 process and articulate the Port Authority’s policies on land use and development, and identify the types of uses appropriate on land and water across Port metro Vancouver’s jurisdiction. discussion topics to guide development of the plan include: port growth and development; regional land use; local communities; environment; and, transportation and goods movement. We’ll be working with key stakeholders, communities and first Nations through consultative workshops to obtain input for the Plan and look forward to learning more about the future of the Port.
lOnG-tERM PlAnnInGPort 2050In 2010, we embarked on a strategic visioning process called Port 2050. Our goal was to engage representative parties with a stake in the future of the gateway to create a strategic vision for our shared future by exploring the answers to two key questions: What is good growth for the gateway and its stakeholders? And what will the Port look like in the next 20 and 40 years?
The process was informed by an expert panel series, group discussions, scenario-building workshops, extensive research and in-depth analysis of the outcomes. Port 2050 helped us answer complex questions about an unknown future and make flexible long-term plans to manage uncertainties.
Through the Port 2050 process, four scenarios telling alternative stories of the future of the Port and the gateway emerged. The “Local fortress” and “missed the Boat” scenarios describe worlds with decreased adaptability and capacity in the gateway, where growth is constrained and opportunities are missed. “Rising Tide” and “The great Transition” illustrate a future with increasing capacity and, ultimately, more sustainable production and consumption patterns, and a new paradigm shift in how society values and measures prosperity.
“Rising Tide” reflects where we believe we are heading in the short to medium term. “The great Transition” is the direction we think our industry, and the world, could be heading in the longer term. Together, these two scenarios comprise our “Anticipated future.”
Our revised strategic vision and mission statements, developed through the Port 2050 process, will help guide our business priorities, shape new initiatives and ultimately permeate every aspect of Port metro Vancouver’s operations. This new direction will help us understand, anticipate and plan for a transitioning global social and economic environment.
OuR anticiPateD futuRe
to find out more about the land use Plan update visit our website at:portmetrovancouver.com/landuseplan
to learn more about the Port 2050 process, read the summary report, watch our video and review background documents, visit our website at: portmetrovancouver.com/2050
28 | tHe PORt PORT mETRO VANcOUVER 2011 SUSTAINABILITY REPORT
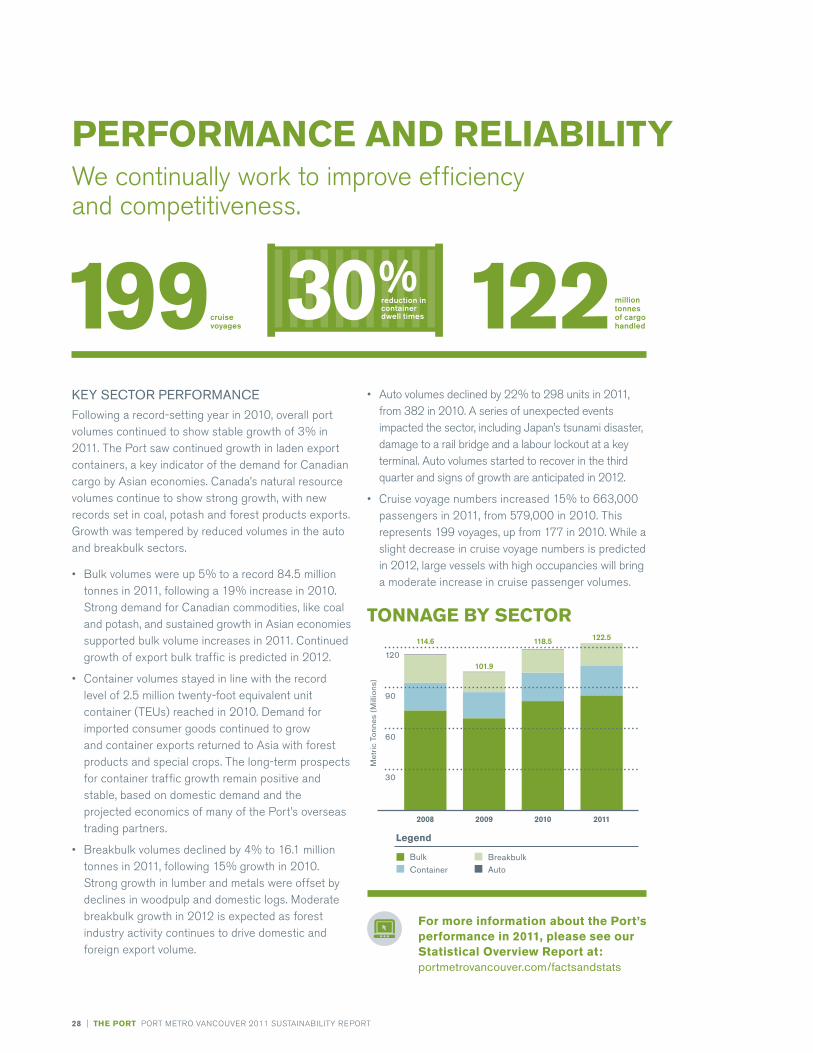
• Auto volumes declined by 22% to 298 units in 2011, from 382 in 2010. A series of unexpected events impacted the sector, including japan’s tsunami disaster, damage to a rail bridge and a labour lockout at a key terminal. Auto volumes started to recover in the third quarter and signs of growth are anticipated in 2012.
• cruise voyage numbers increased 15% to 663,000 passengers in 2011, from 579,000 in 2010. This represents 199 voyages, up from 177 in 2010. While a slight decrease in cruise voyage numbers is predicted in 2012, large vessels with high occupancies will bring a moderate increase in cruise passenger volumes.
tOnnage bY sectOR
KEy SECtOR PERFORMAnCEfollowing a record-setting year in 2010, overall port volumes continued to show stable growth of 3% in 2011. The Port saw continued growth in laden export containers, a key indicator of the demand for canadian cargo by Asian economies. canada’s natural resource volumes continue to show strong growth, with new records set in coal, potash and forest products exports. growth was tempered by reduced volumes in the auto and breakbulk sectors.
• Bulk volumes were up 5% to a record 84.5 million tonnes in 2011, following a 19% increase in 2010. Strong demand for canadian commodities, like coal and potash, and sustained growth in Asian economies supported bulk volume increases in 2011. continued growth of export bulk traffic is predicted in 2012.
• container volumes stayed in line with the record level of 2.5 million twenty-foot equivalent unit container (TEUs) reached in 2010. demand for imported consumer goods continued to grow and container exports returned to Asia with forest products and special crops. The long-term prospects for container traffic growth remain positive and stable, based on domestic demand and the projected economics of many of the Port’s overseas trading partners.
• Breakbulk volumes declined by 4% to 16.1 million tonnes in 2011, following 15% growth in 2010. Strong growth in lumber and metals were offset by declines in woodpulp and domestic logs. moderate breakbulk growth in 2012 is expected as forest industry activity continues to drive domestic and foreign export volume.
PeRfORmance anD ReliabilitYWe continually work to improve efficiency and competitiveness.
122million tonnes of cargo handled199cruise
voyages30%
reduction in container dwell times
30
60
120
2008 2009 2010 2011
90
ContainerBulk Breakbulk
Auto
Legend
122.5118.5
101.9
114.6
Met
ric T
onne
s (M
illio
ns)
for more information about the Port’s performance in 2011, please see our statistical Overview Report at:portmetrovancouver.com/factsandstats

| 29PORT mETRO VANcOUVER 2011 SUSTAINABILITY REPORT tHe PORt
SuRVEyInG PORt uSERSWe have conducted annual research among port users, since 2003. We use independent survey methodology, or reputation monitoring, to measure awareness, attitudes and our reputation in five key areas: economic, environmental, social, port operations and leadership advocacy.
Among port users in 2011, overall impressions of Port metro Vancouver continued to be stable. favourable impressions were largely due to satisfaction with Port metro Vancouver’s consultative relationship-building approach, forward-thinking vision and efficient operation. In particular, continuing efforts to improve service, plan for the future, provide good communication and opportunities for engagement, including knowledgeable and friendly staff, and well-run operations management, were highlighted as important contributing factors. Notable improvements were seen this year in the importance of the Port to the economy overall and in a stronger reputation for having a vision for growth and development and for addressing security.
The 2011 findings revealed that the primary area of opportunity is to maintain a strong operational reputation. Port users indicated that our continued focus should be to provide cost-effective service, as well as to ensure quality of services and port competitiveness. The strongest driver of our leadership advocacy reputation is working to advance the interest of the Port and port businesses. This is further supported by being open, honest and trustworthy, communicating, and working with and engaging with government, port businesses and users.
SuPPly CHAIn IMPROVEMEntSAn efficient and reliable supply chain is an important part of canada’s economy. While volumes have increased, container dwell times have decreased, improving the efficiency of the vital intermodal supply chain from the Port to Eastern canada and the midwest of the USA.
Rail service agreementsIn 2011, the Port experienced a marked improvement in import container terminal dwell performance. container dwell times were reduced by approximately 30%, to consistently fewer than three days.
One of the main reasons for this is the collaborative manner in which container terminals, canadian National Railway (cN) and canadian Pacific Railway (cP) work together to achieve service efficiencies and improve supply chain performance. This new approach is enhanced by the port-wide supply chain collaboration agreements between Port metro Vancouver, cN and cP, as well as service agreements that both railways have with individual terminal operators.
labour reliabilityBoth the British columbia maritime Employers Association and the International Longshore and Warehouse Union (canada) Longshore and foremen ratified unprecedented eight-year labour agreements, through to march 2018. The contracts deliver certainty for current and future port customers.
custOmeR imPRessiOns Of PORt metRO VancOuVeR
2008 2009 2010 2011 Change since 2010
Mean score (out of 10) 6.9 7.0 6.9 7.0 1%
custOmeR imPRessiOns Of PORt metRO VancOuVeR’s imPORtance tO tHe ecOnOmY
2008 2009 2010 2011 Change since 2010
Mean score (out of 10) 8.9 8.9 9.0 9.2 2%
Survey results based on 152 customer responses
30 | tHe PORt PORT mETRO VANcOUVER 2011 SUSTAINABILITY REPORT
explore the opportunities that infrastructure development presents. We believe that by working with our stakeholders we can influence new and better practices across the Port that address both operational issues and reduce community impacts.
KEy PARtnERSHIPS Infrastructure development within the Vancouver gateway includes significant ongoing and planned capital investment from governments, Port metro Vancouver and private industry. By working together with government, industry, first Nations, communities and stakeholders, we are able to deliver operational and infrastructure improvements that provide benefits to both port users and local communities.
In 2011, Port metro Vancouver received funding from the government of canada, Transport canada and the Province of Bc as a reimbursement for the purchase and construction of infrastructure, shore power and security assets, deemed to be of critical importance to the Pacific gateway. during the reporting period, we received $19 million in capital project funding.
InFRAStRuCtuRE dEVElOPMEntforeign trade, particularly with the Asia-Pacific region, is a major driver of economic growth, not just in metro Vancouver but across the country. container volumes moving through the gateway are forecasted to double over the next five to 10 years – and nearly triple by 2030 – as demand for consumer goods grows and Asian demand for bulk commodities, such as forest products, increases. As a port authority, we have a mandated role to support the growth of canadian trade. We are working to ensure that the Asia-Pacific gateway is well-positioned to service this anticipated increase in trade volumes.
Investment to improve the goods-transportation network and enhance the gateway’s competitive status is not always focused on supplying additional capacity. Investments are also used to improve the reliability and efficiency of the entire supply chain, and reduce the impacts of growth on our communities. We are taking a leadership role on port development whether it’s in planning, development, delivery or partnerships, and working with communities to understand concerns and
PORt gROWtH anD DeVelOPmentWe are committed to leading the growth of canada’s Asia-Pacific gateway, in a manner that enhances the well-being of canadians.
17major infrastructureprojects underway in three trade areas 5,000
estimated jobs from Deltaport Terminal, road and rail improvement Project
$167m contribution to Trade Areas Program

| 31PORT mETRO VANcOUVER 2011 SUSTAINABILITY REPORT tHe PORt
We’re part of your community.We understand and respect that port communities
need meaningful and ongoing input into the
development of port facilities. We employ best
practices in consultation following the International
Association of Public Participation (IAP2) core values
and guidelines, and promote open communication
and a collaborative approach to problem solving.
An example of Port Metro Vancouver’s collaborative
work is the Roberts Bank Rail Corridor Program,
which will relieve road and rail congestion within
affected communities south of the Fraser River.
We are working with government and industry
WHat We’Ve HeaRDWe know that port operations can impact our communities and we’re working to understand the challenges and solutions. Some examples of these challenges include port noise, increased traffic (truck, rail and vessels), air quality and climate change impacts, fish and wildlife habitat, light trespass, and the project consultation process. We have included some of the initiatives that address these challenges within this report and encourage you to read about them and provide us with feedback.
partners to ensure that the effects of port growth, and
specifically those resulting from increased road and
rail traffic, are mitigated. together with our partners,
we are engaging with First nations, communities,
stakeholders and the public to identify and address
social and environmental concerns resulting from
port operations and future developments.
for further information, visit the international association of Public Participation’s website: iap2.org
32 | tHe PORt PORT mETRO VANcOUVER 2011 SUSTAINABILITY REPORT
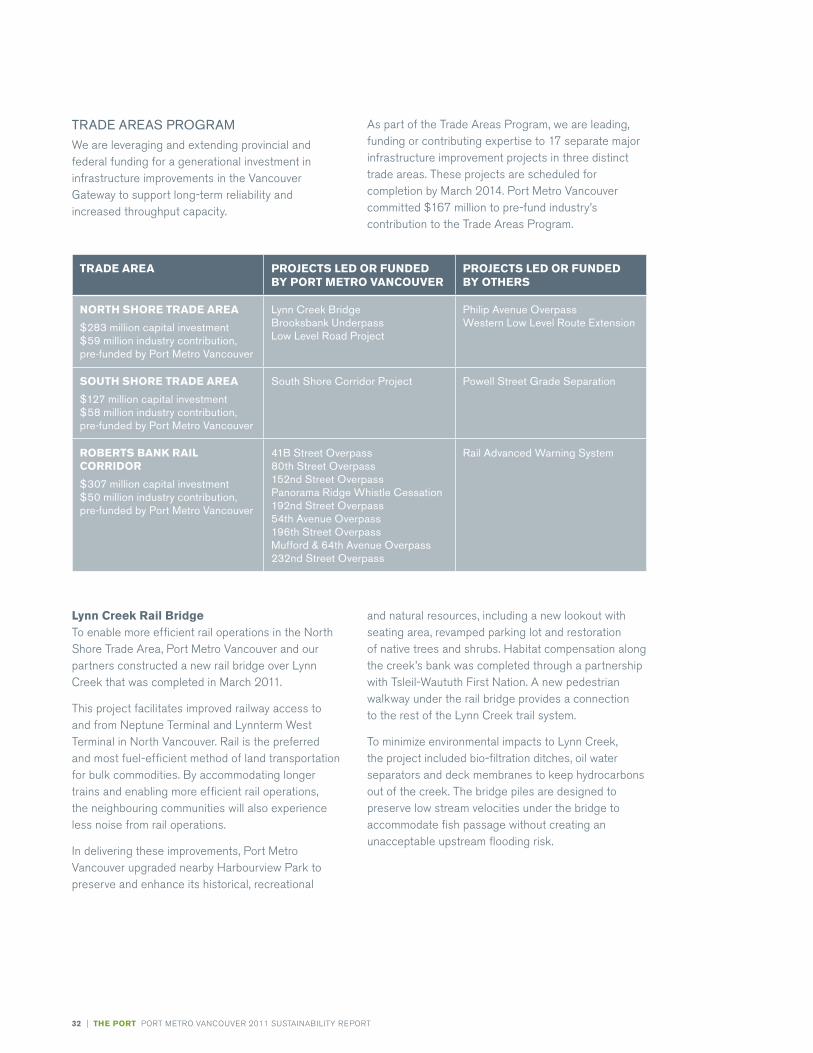
As part of the Trade Areas Program, we are leading, funding or contributing expertise to 17 separate major infrastructure improvement projects in three distinct trade areas. These projects are scheduled for completion by march 2014. Port metro Vancouver committed $167 million to pre-fund industry’s contribution to the Trade Areas Program.
lynn creek Rail bridge To enable more efficient rail operations in the North Shore Trade Area, Port metro Vancouver and our partners constructed a new rail bridge over Lynn creek that was completed in march 2011.
This project facilitates improved railway access to and from Neptune Terminal and Lynnterm West Terminal in North Vancouver. Rail is the preferred and most fuel-efficient method of land transportation for bulk commodities. By accommodating longer trains and enabling more efficient rail operations, the neighbouring communities will also experience less noise from rail operations.
In delivering these improvements, Port metro Vancouver upgraded nearby harbourview Park to preserve and enhance its historical, recreational
tRAdE AREAS PROGRAMWe are leveraging and extending provincial and federal funding for a generational investment in infrastructure improvements in the Vancouver gateway to support long-term reliability and increased throughput capacity.
tRaDe aRea PROjects leD OR funDeD bY PORt metRO VancOuVeR
PROjects leD OR funDeD bY OtHeRs
nORtH sHORe tRaDe aRea
$283 million capital investment $59 million industry contribution, pre-funded by Port Metro Vancouver
lynn Creek Bridge Brooksbank underpass low level Road Project
Philip Avenue Overpass Western low level Route Extension
sOutH sHORe tRaDe aRea
$127 million capital investment $58 million industry contribution, pre-funded by Port Metro Vancouver
South Shore Corridor Project Powell Street Grade Separation
RObeRts bank Rail cORRiDOR
$307 million capital investment $50 million industry contribution, pre-funded by Port Metro Vancouver
41B Street Overpass 80th Street Overpass 152nd Street Overpass Panorama Ridge Whistle Cessation 192nd Street Overpass 54th Avenue Overpass 196th Street Overpass Mufford & 64th Avenue Overpass 232nd Street Overpass
Rail Advanced Warning System
and natural resources, including a new lookout with seating area, revamped parking lot and restoration of native trees and shrubs. habitat compensation along the creek’s bank was completed through a partnership with Tsleil-Waututh first Nation. A new pedestrian walkway under the rail bridge provides a connection to the rest of the Lynn creek trail system.
To minimize environmental impacts to Lynn creek, the project included bio-filtration ditches, oil water separators and deck membranes to keep hydrocarbons out of the creek. The bridge piles are designed to preserve low stream velocities under the bridge to accommodate fish passage without creating an unacceptable upstream flooding risk.

DeltaPORt teRminal, ROaD anD Rail imPROVement PROject
Project Cost: Approximately $280 million
Project Partners: Port Metro Vancouver, Province of BC and tSI terminal Systems Inc.
Container Capacity Provided: 600,000 tEus
Estimated Completion: late 2014
Estimated jobs: 5,000 – 5,500
| 33PORT mETRO VANcOUVER 2011 SUSTAINABILITY REPORT tHe PORt
The container capacity Improvement Program is Port metro Vancouver’s long-term strategy to reliably support growing international trade in an efficient and sustainable manner. Based on population and economic growth forecasts, our current container traffic projections identify a gap in our ability to meet future demand as early as 2015. In keeping with our mission to support the growth of canada’s Pacific gateway, we are exploring potential improvements to facilities in the Lower mainland to meet future growth and demand for container capacity. To deliver this capacity when and where it is needed, the program looks at two main opportunities: improvements that can be made to existing terminals and infrastructure, and potential new infrastructure that may be required as demand continues to increase.
Deltaport terminal, Road and Rail improvement ProjectAs an efficient and cost-effective improvement to existing infrastructure, the deltaport Terminal, Road and Rail Improvement Project addresses current road and rail constraints that limit the capacity of the terminal. The project works have a low risk of environmental impacts, as the improvements are primarily within the existing terminal, road and rail footprint. Work will not occur within the marine environment.
Proposed Roberts bank terminal 2 ProjectThis proposed multi-berth marine container terminal could provide additional capacity of more than 2 million twenty-foot equivalent units (TEUs) per year to meet forecast demand until 2030. This project will be subject to a thorough and independent environmental assessment. We are undertaking a comprehensive multi-stage community, stakeholder and public consultation process. The process began with pre-consultation in june 2011. The results are summarized in a Pre-consultation Summary Report available on our website.
tHe cOntaineR caPacitY imPROVement PROgRam
for more information, please visit:portmetrovancouver.com/ccip
34 | tHe PORt PORT mETRO VANcOUVER 2011 SUSTAINABILITY REPORT
StEWARdSHIP OF PORt lAndS And WAtERSProtecting biodiversity across land and marine environments is a core function of the Port Authority. The lands along our 640 kilometres of shoreline are used for a variety of purposes, ranging from port operations and commercial enterprises to residential developments, recreational activities and parkland. We partner with agencies to deliver a coordinated approach to environmental management and work with project partners to promote stewardship of natural resources.
coordinated ReviewWe are a partner in the Burrard Inlet Environmental Action Program and the fraser River Estuary management Program (BIEAP-fREmP). The organization is a unique inter-governmental partnership program established to proactively coordinate environmental management of the Burrard Inlet and fraser River Estuary. Partners include: Environment canada, fisheries and Oceans canada, Bc ministry of Environment, Bc ministry of forests, Lands and Natural Resource Operations and metro Vancouver. Projects involving physical works within the BIEAP-fREmP jurisdiction undergo review by multiple regulatory agencies in a coordinated and efficient manner.
enViROnmental managementOur port shares its home with fish and wildlife, and with neighbouring communities. We care about the quality of our port environment because it’s where we live, work and play.
230 environmental assessments conducted
1,318 tCo2e net reduction in greenhouse gas emissions through cruise ships connecting to shore power
for more information, please visit:portmetrovancouver.com/environment
Environment PolicyWe are committed to conducting our operations
in a responsible and sustainable manner that
safeguards the environment and promotes continual
improvement. We take a precautionary approach
and uphold a high level of environmental protection
within our jurisdiction, to meet and exceed
legislative requirements.
going Beyond Regulatory RequirementsPort Metro Vancouver’s Environmental Assessment
Procedure goes beyond the regulatory requirements
of the Canada Port Authority Environmental
Assessment Regulations. In 2011, Port Metro
Vancouver conducted 230 environmental
assessments, of which only 10% had a legislative
trigger that mandated an environmental assessment.
| 35PORT mETRO VANcOUVER 2011 SUSTAINABILITY REPORT tHe PORt
environmental assessmentEnvironmental assessments are conducted on all projects or activities within Port metro Vancouver’s jurisdiction that could have an adverse environmental affect on land, air or water. In accordance with the Species at Risk Act, we conduct surveys for endangered species and habitat, and require our project proponents to do the same. Whenever possible, we explore opportunities for project development to result in net gain of habitat area and productivity.
Project Review Projects that involve significant physical works go through a full Project Review. This review comprises an environmental assessment and a planning review, considering potential community impacts such as noise, traffic congestion and aesthetic issues, as well as consultation with communities and first Nations, where appropriate.
sPecies at Risk
Key species at risk within Port Metro Vancouver’s jurisdiction include:
• Barnowl• Greatblueheron• Harbourporpoise• Pacificwatershrew• Southernresidentkillerwhale• Stellarsealion• Streambanklupine• Transientkillerwhale• Westernpaintedturtle
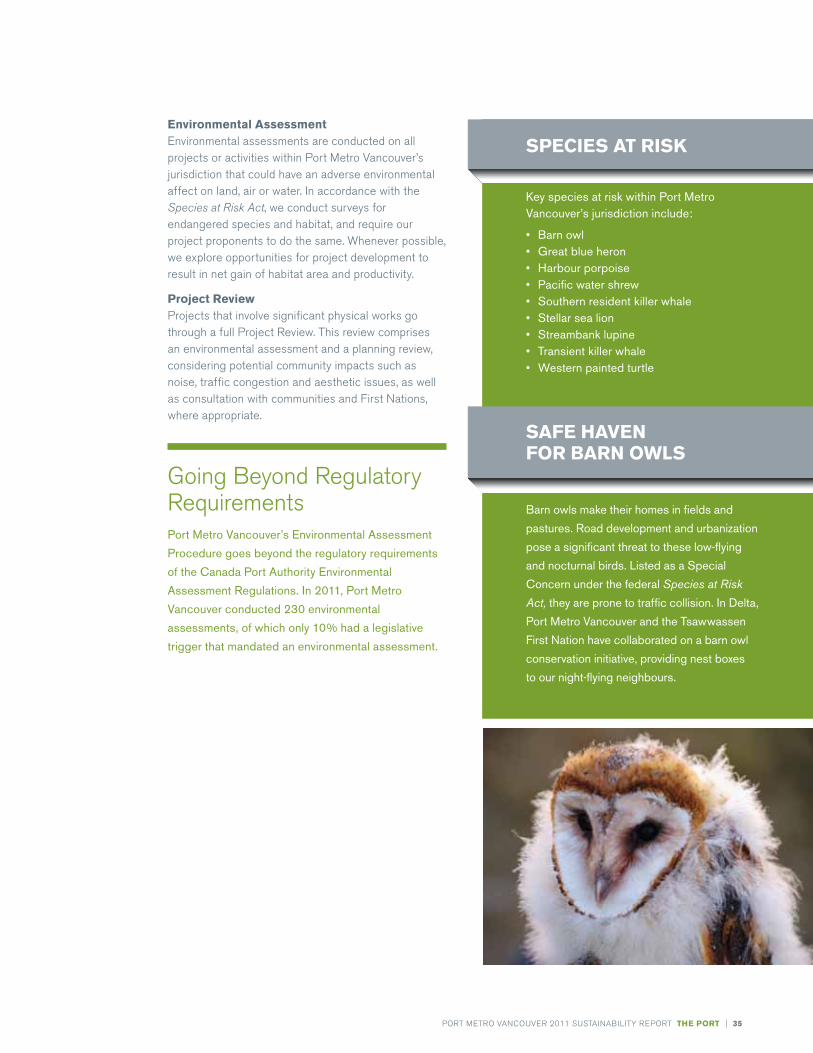
Barn owls make their homes in fields and
pastures. Road development and urbanization
pose a significant threat to these low-flying
and nocturnal birds. listed as a Special
Concern under the federal Species at Risk
Act, they are prone to traffic collision. In delta,
Port Metro Vancouver and the tsawwassen
First nation have collaborated on a barn owl
conservation initiative, providing nest boxes
to our night-flying neighbours.
safe HaVen fOR baRn OWls
36 |
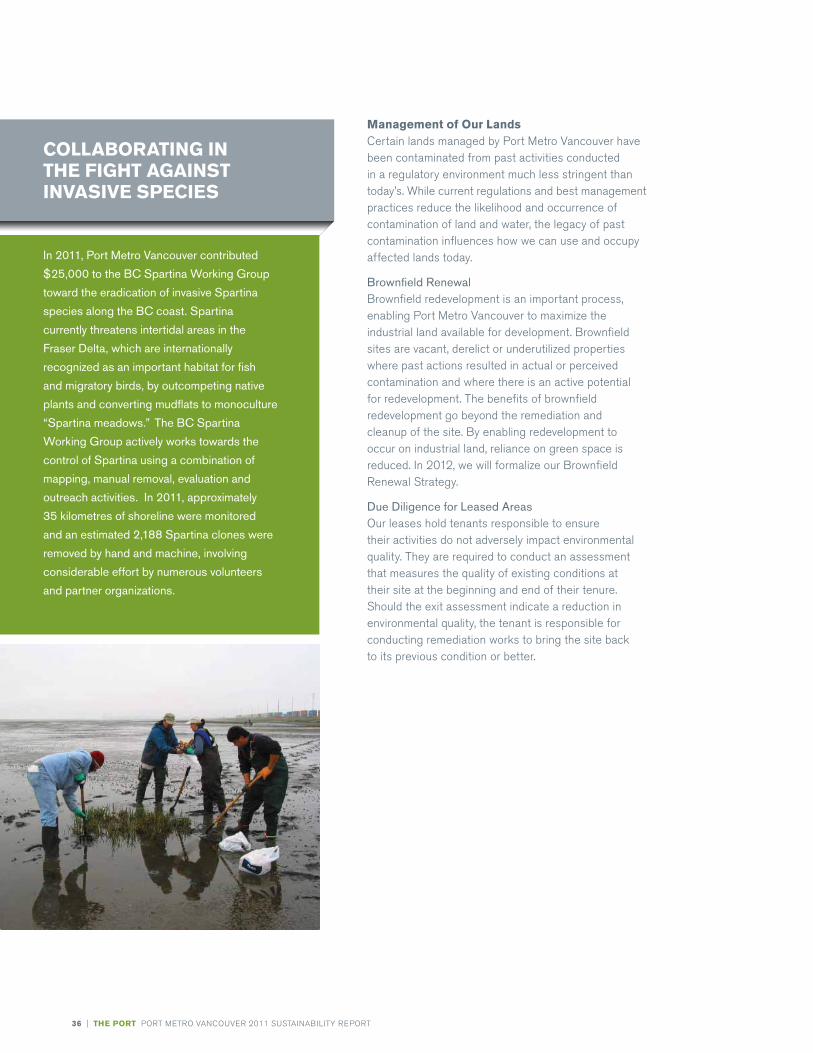
management of Our landscertain lands managed by Port metro Vancouver have been contaminated from past activities conducted in a regulatory environment much less stringent than today’s. While current regulations and best management practices reduce the likelihood and occurrence of contamination of land and water, the legacy of past contamination influences how we can use and occupy affected lands today.
Brownfield RenewalBrownfield redevelopment is an important process, enabling Port metro Vancouver to maximize the industrial land available for development. Brownfield sites are vacant, derelict or underutilized properties where past actions resulted in actual or perceived contamination and where there is an active potential for redevelopment. The benefits of brownfield redevelopment go beyond the remediation and cleanup of the site. By enabling redevelopment to occur on industrial land, reliance on green space is reduced. In 2012, we will formalize our Brownfield Renewal Strategy.
due diligence for leased AreasOur leases hold tenants responsible to ensure their activities do not adversely impact environmental quality. They are required to conduct an assessment that measures the quality of existing conditions at their site at the beginning and end of their tenure. Should the exit assessment indicate a reduction in environmental quality, the tenant is responsible for conducting remediation works to bring the site back to its previous condition or better.
cOllabORating in tHe figHt against inVasiVe sPecies
In 2011, Port Metro Vancouver contributed
$25,000 to the BC Spartina Working Group
toward the eradication of invasive Spartina
species along the BC coast. Spartina
currently threatens intertidal areas in the
Fraser delta, which are internationally
recognized as an important habitat for fish
and migratory birds, by outcompeting native
plants and converting mudflats to monoculture
“Spartina meadows.” the BC Spartina
Working Group actively works towards the
control of Spartina using a combination of
mapping, manual removal, evaluation and
outreach activities. In 2011, approximately
35 kilometres of shoreline were monitored
and an estimated 2,188 Spartina clones were
removed by hand and machine, involving
considerable effort by numerous volunteers
and partner organizations.
tHe PORt PORT mETRO VANcOUVER 2011 SUSTAINABILITY REPORT
| 37PORT mETRO VANcOUVER 2011 SUSTAINABILITY REPORT tHe PORt
Our Blue circle Award recognizes EcoAction Program participants that achieve the highest emissions reductions for the year.the 2011 recipients were:
•APL(Canada)
•DisneyCruiseLine
•GriegStarShipping(Canada)Ltd.
•HollandAmericaLine
•“K”Line
•MaerskLine
•PrincessCruises
•WestwoodShippingLines
“ We’ve been committed to shore power for many years, so we’re pleased we can ‘plug in’ our ships at Port metro Vancouver. We know that local air quality issues are important to the community, and we’re proud to join with all those involved in realizing this important environmental initiative.” Charlie Ball, President Holland America-Princess Alaska
2011 cRuise seasOn
Shore power connections 35 connections
Reduction in fuel use 424 tonnes
net reduction in greenhouse gas emissions
1,318 tCO2e
Reduction in nitrogen oxides (nOx)
27 tonnes
Reduction in sulphur oxides (SOx)
14 tonnes
Reduction in particulate matter (≤2.5 µm)
2 tonnes
AIR And EnERGy ACtIOn PROGRAMWe recognize that port operations affect air quality and contribute to climate change. Reducing emissions from port-related activities such as ships, trucks, trains and terminal equipment is a key component of making the Port sustainable. Our Air and Energy Action Programs address these challenges by working collaboratively to implement solutions in each activity area. We’re looking for ways to reduce emissions and improve port performance through energy conservation and the use of clean energy for port operations. Studies are conducted to investigate the feasibility of energy efficiency and alternative energy at terminals throughout the Port. By improving our understanding of these opportunities we are better positioned to support innovation and work with our partners toward building a more sustainable port.
shore Power for cruise shipsPort metro Vancouver was the first port in canada, and the third in the world, to install shore power facilities for cruise ships. In 2011 we saw 35 cruise vessel calls plug in and shut off their engines. As a result, greenhouse gas emissions were reduced by 1,318 tcO2e – equivalent to removing more than 650 cars from the road. We also conducted a study to assess the feasibility of shore power at container terminals and identified a series of next steps to advance this initiative, including a detailed assessment of the electrical infrastructure and development of a business case with our marine partners.

Cargo-handling equipment 14%
Trucks 3%
Rail 2%
Ocean-goingvessels 81%
PORt emissiOn sOuRces tcO2e
Ocean-going vessels 434,407
Cargo-handling equipment 72,890
trucks 18,861
Rail 12,294
tOtAl 538,452
38 | tHe PORt PORT mETRO VANcOUVER 2011 SUSTAINABILITY REPORT
northwest Ports clean air strategy The Northwest Ports clean Air Strategy aims to reduce port-related emissions that affect air quality and climate change in the Pacific Northwest via a collaborative approach led by the Ports of Seattle and Tacoma in Washington State and Port metro Vancouver in British columbia. The Ports created the Strategy in collaboration with Environment canada, the Puget Sound clean Air Agency, the United States Environmental Protection Agency, and Washington department of Ecology.
In 2011, the three Ports were honoured with an Environmental Achievement Award from the Pacific Northwest International Section of the Air & Water management Association, in recognition of their partnership on the Northwest Ports clean Air Strategy.
landside emissions inventory In 2005, Port metro Vancouver was the first port in canada to complete a formal port air emissions inventory, referred to as the Landside Emissions Inventory. In 2011, we completed the 2010 update of this inventory, capturing emissions data for more than 100 tenants on port lands. The inventory contains emissions estimates for common Air contaminants (cAcs) and greenhouse gases (ghgs) associated with significant land-based sources, including cargo-handling equipment, trucks and rail.
The estimate of commercial marine vessel emissions associated with port activities is addressed within a broader National marine Emissions Inventory led by Environment canada, scheduled for completion in the spring of 2012. By leveraging the marine inventory, we will have a complete activity and emissions profile for all of the significant emission sources associated with the movement of goods at the Port.
PORt gReenHOuse gas emissiOns bY sOuRce (tcO2e)
to find out more about this strategy please visit our website at:portmetrovancouver.com/environment
to view the full report, please visit our website at:portmetrovancouver.com/environment
Emissions are reported in metric tonnes of greenhouse gas equivalent. landside emissions are derived from the 2010 inventory and reported for port lands and boundary.
the emission estimate for ocean-going vessels is derived from the draft 2010 national Marine Emissions Inventory of Canada, with permission from Environment Canada, and may be subject to change upon completion.
the above figures do not include greenhouse gas emissions associated with port administration activities (6,661 tCO2e), which include buildings and site lighting.
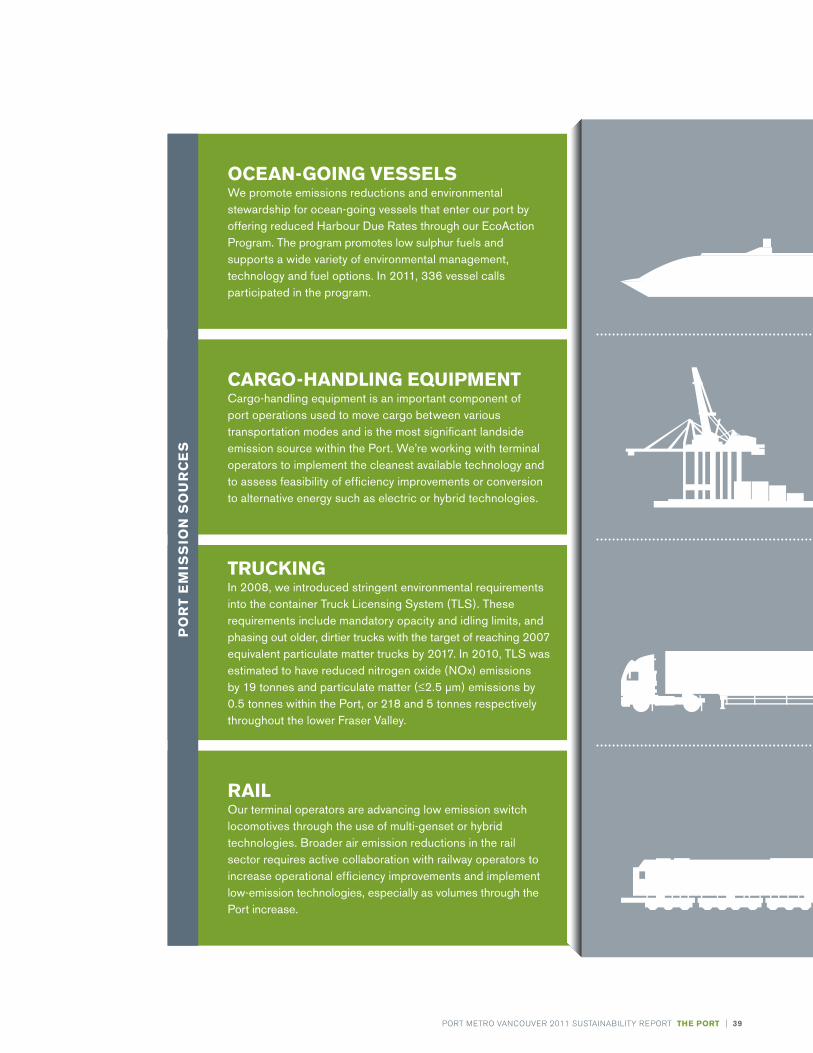
| 39PORT mETRO VANcOUVER 2011 SUSTAINABILITY REPORT tHe PORt
Ocean-gOing Vessels We promote emissions reductions and environmental stewardship for ocean-going vessels that enter our port by offering reduced Harbour due Rates through our EcoAction Program. the program promotes low sulphur fuels and supports a wide variety of environmental management, technology and fuel options. In 2011, 336 vessel calls participated in the program.
caRgO-HanDling equiPment Cargo-handling equipment is an important component of port operations used to move cargo between various transportation modes and is the most significant landside emission source within the Port. We’re working with terminal operators to implement the cleanest available technology and to assess feasibility of efficiency improvements or conversion to alternative energy such as electric or hybrid technologies.
PO
Rt
em
iss
iOn
sO
uR
ce
s
RailOur terminal operators are advancing low emission switch locomotives through the use of multi-genset or hybrid technologies. Broader air emission reductions in the rail sector requires active collaboration with railway operators to increase operational efficiency improvements and implement low-emission technologies, especially as volumes through the Port increase.
tRuckingIn 2008, we introduced stringent environmental requirements into the container truck licensing System (tlS). these requirements include mandatory opacity and idling limits, and phasing out older, dirtier trucks with the target of reaching 2007 equivalent particulate matter trucks by 2017. In 2010, tlS was estimated to have reduced nitrogen oxide (nOx) emissions by 19 tonnes and particulate matter (≤2.5 µm) emissions by 0.5 tonnes within the Port, or 218 and 5 tonnes respectively throughout the lower Fraser Valley.
6 Port Metro Vancouver
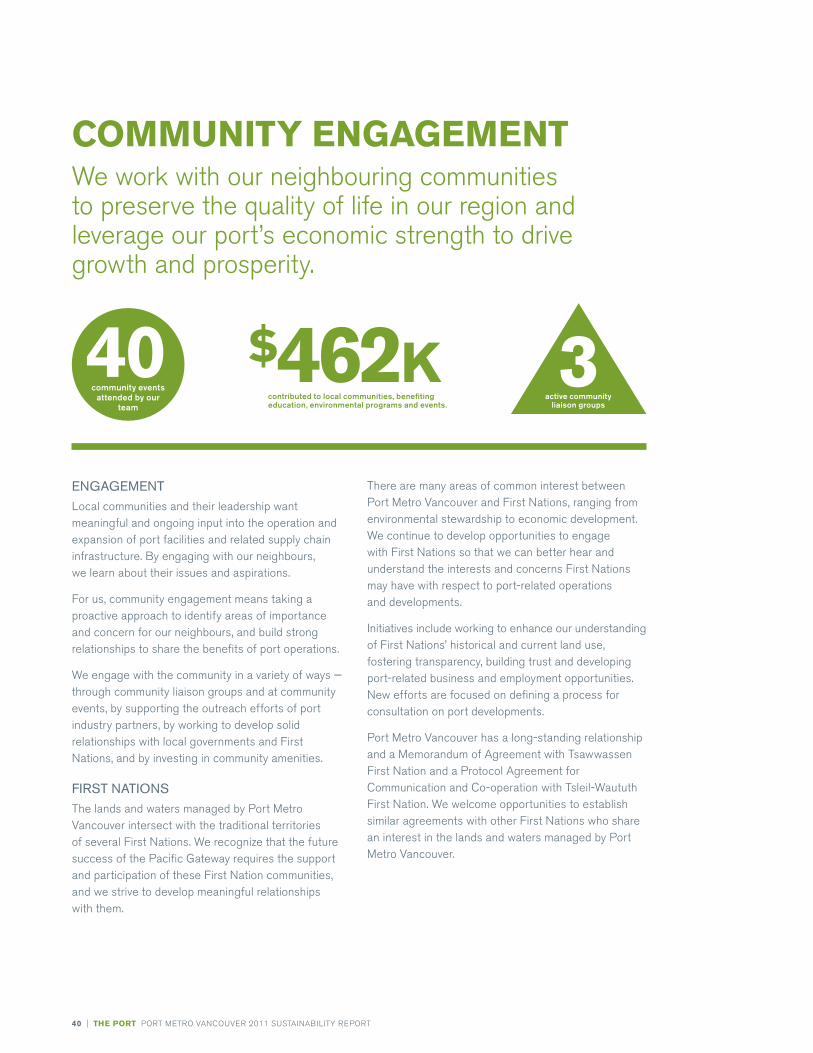
40 | tHe PORt PORT mETRO VANcOUVER 2011 SUSTAINABILITY REPORT
There are many areas of common interest between Port metro Vancouver and first Nations, ranging from environmental stewardship to economic development. We continue to develop opportunities to engage with first Nations so that we can better hear and understand the interests and concerns first Nations may have with respect to port-related operations and developments.
Initiatives include working to enhance our understanding of first Nations’ historical and current land use, fostering transparency, building trust and developing port-related business and employment opportunities. New efforts are focused on defining a process for consultation on port developments.
Port metro Vancouver has a long-standing relationship and a memorandum of Agreement with Tsawwassen first Nation and a Protocol Agreement for communication and co-operation with Tsleil-Waututh first Nation. We welcome opportunities to establish similar agreements with other first Nations who share an interest in the lands and waters managed by Port metro Vancouver.
EnGAGEMEntLocal communities and their leadership want meaningful and ongoing input into the operation and expansion of port facilities and related supply chain infrastructure. By engaging with our neighbours, we learn about their issues and aspirations.
for us, community engagement means taking a proactive approach to identify areas of importance and concern for our neighbours, and build strong relationships to share the benefits of port operations.
We engage with the community in a variety of ways — through community liaison groups and at community events, by supporting the outreach efforts of port industry partners, by working to develop solid relationships with local governments and first Nations, and by investing in community amenities.
FIRSt nAtIOnSThe lands and waters managed by Port metro Vancouver intersect with the traditional territories of several first Nations. We recognize that the future success of the Pacific gateway requires the support and participation of these first Nation communities, and we strive to develop meaningful relationships with them.
cOmmunitY engagementWe work with our neighbouring communities to preserve the quality of life in our region and leverage our port’s economic strength to drive growth and prosperity.
community events attended by our
team
40 $462kcontributed to local communities, benefiting education, environmental programs and events.
active community liaison groups
3
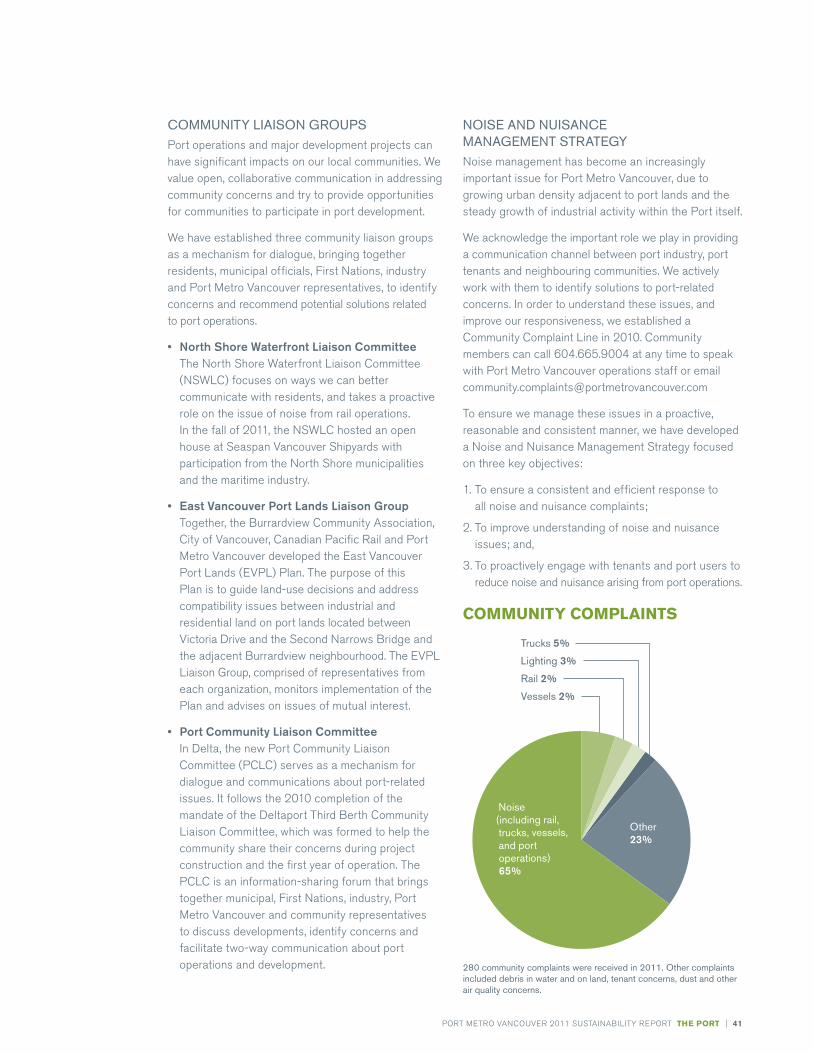
| 41PORT mETRO VANcOUVER 2011 SUSTAINABILITY REPORT tHe PORt
nOISE And nuISAnCE MAnAGEMEnt StRAtEGyNoise management has become an increasingly important issue for Port metro Vancouver, due to growing urban density adjacent to port lands and the steady growth of industrial activity within the Port itself.
We acknowledge the important role we play in providing a communication channel between port industry, port tenants and neighbouring communities. We actively work with them to identify solutions to port-related concerns. In order to understand these issues, and improve our responsiveness, we established a community complaint Line in 2010. community members can call 604.665.9004 at any time to speak with Port metro Vancouver operations staff or email [email protected]
To ensure we manage these issues in a proactive, reasonable and consistent manner, we have developed a Noise and Nuisance management Strategy focused on three key objectives:
1. To ensure a consistent and efficient response to all noise and nuisance complaints;
2. To improve understanding of noise and nuisance issues; and,
3. To proactively engage with tenants and port users to reduce noise and nuisance arising from port operations.
cOmmunitY cOmPlaints
COMMunIty lIAISOn GROuPSPort operations and major development projects can have significant impacts on our local communities. We value open, collaborative communication in addressing community concerns and try to provide opportunities for communities to participate in port development.
We have established three community liaison groups as a mechanism for dialogue, bringing together residents, municipal officials, first Nations, industry and Port metro Vancouver representatives, to identify concerns and recommend potential solutions related to port operations.
• North Shore Waterfront Liaison CommitteeThe North Shore Waterfront Liaison committee (NSWLc) focuses on ways we can better communicate with residents, and takes a proactive role on the issue of noise from rail operations. In the fall of 2011, the NSWLc hosted an open house at Seaspan Vancouver Shipyards with participation from the North Shore municipalities and the maritime industry.
• east Vancouver Port Lands Liaison GroupTogether, the Burrardview community Association, city of Vancouver, canadian Pacific Rail and Port metro Vancouver developed the East Vancouver Port Lands (EVPL) Plan. The purpose of this Plan is to guide land-use decisions and address compatibility issues between industrial and residential land on port lands located between Victoria drive and the Second Narrows Bridge and the adjacent Burrardview neighbourhood. The EVPL Liaison group, comprised of representatives from each organization, monitors implementation of the Plan and advises on issues of mutual interest.
• Port Community Liaison CommitteeIn delta, the new Port community Liaison committee (PcLc) serves as a mechanism for dialogue and communications about port-related issues. It follows the 2010 completion of the mandate of the deltaport Third Berth community Liaison committee, which was formed to help the community share their concerns during project construction and the first year of operation. The PcLc is an information-sharing forum that brings together municipal, first Nations, industry, Port metro Vancouver and community representatives to discuss developments, identify concerns and facilitate two-way communication about port operations and development.
Trucks 5%
Lighting 3%
Rail 2%
Vessels 2%
Noise (including rail, trucks, vessels, and port operations) 65%
Other23%
280 community complaints were received in 2011. Other complaints included debris in water and on land, tenant concerns, dust and other air quality concerns.
42 | tHe PORt PORT mETRO VANcOUVER 2011 SUSTAINABILITY REPORT
safetY siRens at PORt teRminals
Sirens and alarms associated with the movement of rail cars can have an impact on local communities. These alarms are sounded to ensure the safety of employees on terminals so issues like this can be challenging to mitigate. In 2011, in response to increased numbers of community complaints on the South Shore of Burrard Inlet, Port metro Vancouver commissioned an acoustic study to investigate siren impacts, confirm the sources and identify potential noise mitigation measures. Using data from the acoustic study — and working together with the railway, terminal operator and the union — it was possible to reduce the volume of the sirens to an acceptable level while still keeping employees safe.
listening tO tHe cOmmunitY
tRain WHistles anD nigHt-time nOise at Rail cROssings
Using new equipment purchased in 2011, Port metro Vancouver conducted noise monitoring of rail crossings at six locations on the North Shore. The collected data and sound recordings were analyzed to identify sources of maximum sound levels, with a focus on night-time noise associated with rail activities. The data is being used to inform decision-making on the prioritization of rail crossing upgrades to reduce the need for train whistling at crossings. The North Shore Rail Steering committee brings together North Shore municipalities, canadian National Railway, Port metro Vancouver, the Squamish Nation and Transport canada to work collaboratively to identify ways to mitigate rail noise impacts while protecting the operational efficiency of the trade area.
tRuck tRaffic On citY stReets
In the summer of 2010, the clark drive entrance to the Port was closed to inbound commercial vehicles due to severe congestion affecting intersections including hastings Street, Venables Street and first Avenue. Trucks were directed to use the Port’s mcgill Street access, which quickly absorbed truck traffic, so that the trucks would not disrupt traffic flow or residents. This operational change had the unexpected result of increased truck traffic travelling on Nanaimo Street north of Broadway, a city of Vancouver designated truck route in a residential area. In an effort to mitigate this impact, we implemented a 90-day Truck Traffic Pilot Program requiring container trucks to use only major Road Network authorized routes in Vancouver. The Pilot Program was extended until january 25, 2012 when the city of Vancouver implemented new turn restrictions for port-bound commercial trucks and a speed limit change for all trucks. continued collaboration between Port metro Vancouver, the city of Vancouver and the trucking community is critical to finding solutions to mitigate the community impacts of truck traffic on city streets.
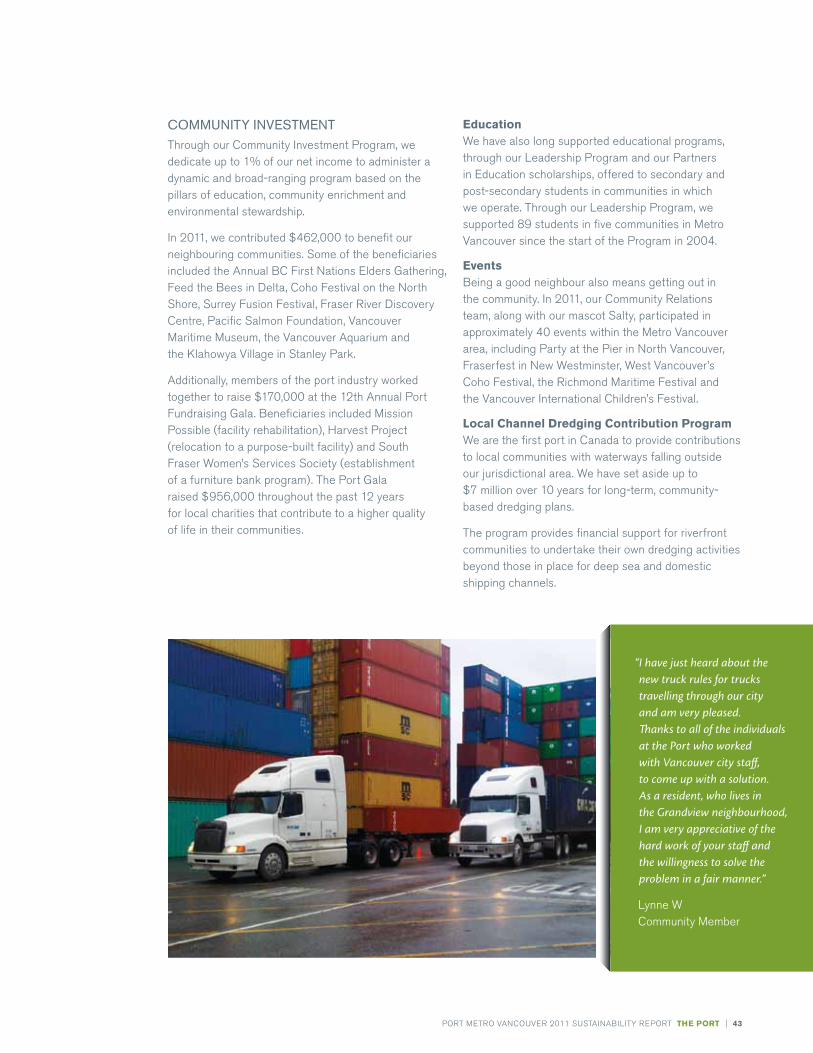
| 43PORT mETRO VANcOUVER 2011 SUSTAINABILITY REPORT tHe PORt
educationWe have also long supported educational programs, through our Leadership Program and our Partners in Education scholarships, offered to secondary and post-secondary students in communities in which we operate. Through our Leadership Program, we supported 89 students in five communities in metro Vancouver since the start of the Program in 2004.
eventsBeing a good neighbour also means getting out in the community. In 2011, our community Relations team, along with our mascot Salty, participated in approximately 40 events within the metro Vancouver area, including Party at the Pier in North Vancouver, fraserfest in New Westminster, West Vancouver’s coho festival, the Richmond maritime festival and the Vancouver International children’s festival.
local channel Dredging contribution ProgramWe are the first port in canada to provide contributions to local communities with waterways falling outside our jurisdictional area. We have set aside up to $7 million over 10 years for long-term, community-based dredging plans.
The program provides financial support for riverfront communities to undertake their own dredging activities beyond those in place for deep sea and domestic shipping channels.
COMMunIty InVEStMEntThrough our community Investment Program, we dedicate up to 1% of our net income to administer a dynamic and broad-ranging program based on the pillars of education, community enrichment and environmental stewardship.
In 2011, we contributed $462,000 to benefit our neighbouring communities. Some of the beneficiaries included the Annual Bc first Nations Elders gathering, feed the Bees in delta, coho festival on the North Shore, Surrey fusion festival, fraser River discovery centre, Pacific Salmon foundation, Vancouver maritime museum, the Vancouver Aquarium and the Klahowya Village in Stanley Park.
Additionally, members of the port industry worked together to raise $170,000 at the 12th Annual Port fundraising gala. Beneficiaries included mission Possible (facility rehabilitation), harvest Project (relocation to a purpose-built facility) and South fraser Women’s Services Society (establishment of a furniture bank program). The Port gala raised $956,000 throughout the past 12 years for local charities that contribute to a higher quality of life in their communities.
“ I have just heard about the new truck rules for trucks travelling through our city and am very pleased. Thanks to all of the individuals at the Port who worked with Vancouver city staff, to come up with a solution. As a resident, who lives in the Grandview neighbourhood, I am very appreciative of the hard work of your staff and the willingness to solve the problem in a fair manner.”
Lynne W community member
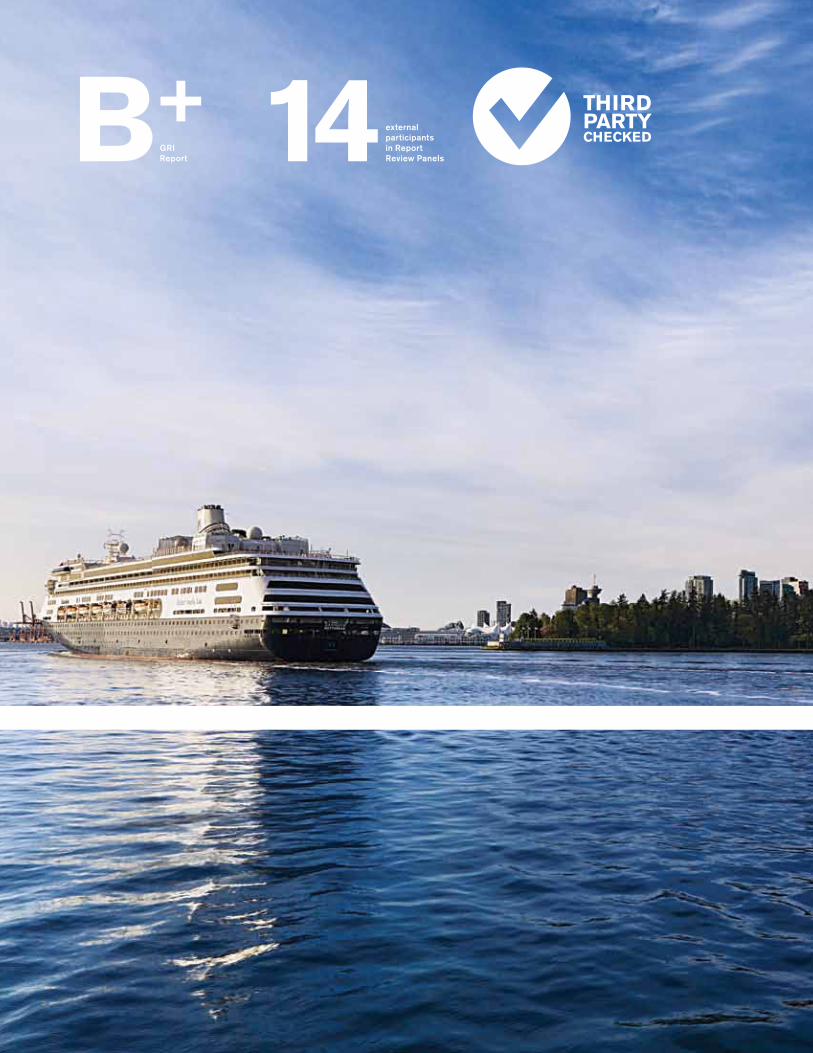
14 external participants in report review Panelsb+
Gri report
RePORt Details
WE cOLLABORATE WITh OUR STAKEhOLdERS ANd APPLY BEST PRAcTIcES TO PREPARE A REPORT ThAT OffERS A fAIR ANd REASONABLE ASSESSmENT Of OUR SUSTAINABILITY PERfORmANcE.
46 |
RePORt Details PORT mETRO VANcOUVER 2011 SUSTAINABILITY REPORT
• Subject matter 5: To obtain a limited level of assurance on the fair presentation of Port metro Vancouver’s assertion of the number of community complaints and classification by type of complaint presented in the Report (the “community complaints Assertion”) and to express a conclusion thereon.
CRItERIA• Subject matter 1: gRI g3.1 guidelines• Subject matter 2: ISO 14064 – Part 1 and gRI g3.1 guidelines• Subject matter 3: ISO 14064 – Part 1 and criteria internally
developed by management• Subject matter 4: the Application Level criteria set out in the
gRI g3.1 guidelines.• Subject matter 5: criteria internally developed by management
PORt MEtRO VAnCOuVER’S BOARd And MAnAGEMEnt RESPOnSIBIlItIESThe Report was prepared by management of Port metro Vancouver, who is responsible for the collection and presentation of the Specified Performance Information, greenhouse gas Assertions, carbon Neutral Assertion, community complaints Assertion, statements, claims and assertions in the Report, and the criteria used in determining that the information is appropriate for the purpose of disclosure in the Report. In addition, management is responsible for the identification of stakeholders and identification and prioritization of material issues.
management is responsible for maintaining adequate records and internal controls that are designed to support the reporting process. management is also responsible for the integrity of the Report, and for reviewing and approving the Report.
The community and corporate Social Responsibility committee of the Board is responsible for reviewing the Report, providing advice to management and making recommendations, as appropriate, to the Board.
There are currently no prescribed requirements relating to the preparation, publication and verification of sustainability information.
WORK WE PERFORMEd In order for us to provide conclusions in relation to the above scope of work, we have sought to answer the following questions for the five selected subject matters:
1. completenesshas Port metro Vancouver provided fair representation of their Specified Performance Information, the greenhouse gas Assertions, the carbon Neutral Assertion, and the community
To the Board members and management of Port metro Vancouver,
OuR RESPOnSIBIlItIES Our assurance engagement has been planned and performed in accordance with the International Standard on Assurance Engagements ISAE 3000 Assurance Engagements other than Audits or Reviews of historical financial Information and the canadian Institute of chartered Accountants handbook Section 5025 (“cIcA hB Section 5025”), standard for assurance engagements and ISO 14064-Part 3 Specification with guidance for the validation and verification of greenhouse gas assertions.
SCOPE OF OuR EnGAGEMEntWe have carried out a combined ‘reasonable’ and ‘limited’ assurance engagement over specified performance information appearing in Port metro Vancouver’s 2011 Sustainability Report (the “Report”) for the period january 1, 2011 to december 31, 2011 prepared by Port metro Vancouver management. The scope of our engagement, as agreed with management, is as follows:
• Subject matter 1: To obtain a limited level of assurance on the fair presentation of the specified performance information, as identified by the ‘ ’ symbol in the gRI content Index within the Report (the “Specified Performance Information”) and to express a conclusion thereon.
• Subject matter 2: To obtain a reasonable level of assurance on the fair presentation of Port metro Vancouver’s 2011 greenhouse gas assertions identified in the gRI content Index table within the Report and to express an opinion thereon:
- EN16: Total direct and indirect greenhouse gas (“ghg”) emissions by weight
- EN17: Other relevant indirect greenhouse gas emissions by weight
(together, the “greenhouse gas Assertions”)
• Subject matter 3: To obtain a reasonable level of assurance on the fair presentation of Port metro Vancouver’s assertion that the Scope 1, Scope 2 and Scope 3 greenhouse gas emissions reported for indicators EN16 and EN17 have been neutralized through the purchase of carbon offsets as presented in the Report (the “carbon Neutral Assertion”) and to express an opinion thereon.
• Subject matter 4: To obtain a limited level of assurance that Port metro Vancouver’s Report has achieved the Application Level of B+ in accordance with the Application Level criteria set out in the gRI g3.1 guidelines.
inDePenDent assuRance statement

| 47
PORT mETRO VANcOUVER 2011 SUSTAINABILITY REPORT RePORt Details
- The appropriateness of definitions for internally developed criteria applied to the carbon Neutral Assertion and the community complaints Assertion.
OuR COnCluSIOnSWe were engaged to perform a combined ‘reasonable’ and ‘limited’ assurance engagement. A ‘limited’ assurance engagement is comprised primarily of enquiries and analytical procedures and the work is substantially less than that undertaken for a ‘reasonable’ assurance engagement, as such, the level of assurance for the subject matters for which we performed ‘limited’ assurance procedures (as identified in the section ‘Scope of our Engagement’ above) is lower than the level of assurance that would be obtained if we had performed reasonable assurance procedures.
Subject to the section on Limitations noted above and on the basis of our procedures for this assurance engagement, we provide the following conclusions:
• Subject matter 1 – Specified Performance Information: Nothing has come to our attention that causes us to believe that the Specified Performance Information is not, in all material respects, in accordance with the gRI g3.1 guidelines.
• Subject matter 2 – greenhouse gas Assertions: In our opinion, the Report presents fairly, in all material respects, the greenhouse gas Assertions for the year ended december 31, 2011 in accordance with ISO 14064 – Part 1 and gRI g3.1 guidelines.
• Subject matter 3 – carbon Neutral Assertion: In our opinion, the Report presents fairly, in all material respects, the carbon Neutral Assertion for the year ended december 31, 2011 in accordance with ISO 14064 – Part 1 and with criteria internally developed by management.
• Subject matter 4 – Application Level: Nothing has come to our attention that causes us to believe that the Report does not, in all material respects, meet the criteria for application level B+ in accordance with the Application Level criteria set out in the gRI g3.1 guidelines.
• Subject matter 5 – community complaints Assertion: Nothing has come to our attention that causes us to believe that the community complaints Assertion is not, in all material respects, in accordance with criteria internally developed by management.
chartered Accountants Vancouver, canada may 11 2012
complaints Assertion with respect to the organizational boundaries and time period defined in the Report?
has Port metro Vancouver accurately collated corporate data relating to the Specified Performance Information, the greenhouse gas Assertions, the carbon Neutral Assertion, and the community complaints Assertion?
2. accuracyAre the data for the Specified Performance Information, the greenhouse gas Assertions, the carbon Neutral Assertion, and the community complaints Assertion accurate and sufficiently detailed for stakeholders to assess Port metro Vancouver’s performance?
ASSuRAnCE PROCEduRESOur assurance procedures for concluding on the Subject matters, included but were not limited to:
- Interviewing selected personnel, including the gRI Reporting Team to understand the reporting process
- Interviewing selected personnel responsible for the Specified Performance Information, the greenhouse gas Assertions, the carbon Neutral Assertion and the community complaints Assertion to understand collection and reporting processes
- Where relevant, performing walk-throughs of systems and processes for data aggregation and reporting
- Assessing the accuracy of calculations performed
- Assessing whether data and statements had been correctly transcribed from corporate systems and/or supporting evidence into the Report
- Assessing key assumptions and the evidence to support the assumptions
- Examination, on a test basis, of evidence supporting the information in Port metro Vancouver’s schedules of 2011 greenhouse gas emissions and the 2011 carbon offsets
lIMItAtIOnSOur scope of work did not include providing conclusions in relation to:
- The completeness or accuracy of information relating to areas other than the Specified Performance Information, the greenhouse gas Assertions, the carbon Neutral Assertion and the community complaints Assertion.
- Information reported by Port metro Vancouver other than in its Report, such as information contained on its website.
- management’s forward-looking statements.
- Any comparisons made by Port metro Vancouver against historical data, with the exception of Specific Performance Information, the greenhouse gas Assertions and the carbon Neutral Assertion for which we have provided assurance for the period january 1, 2010 to december 31, 2010.
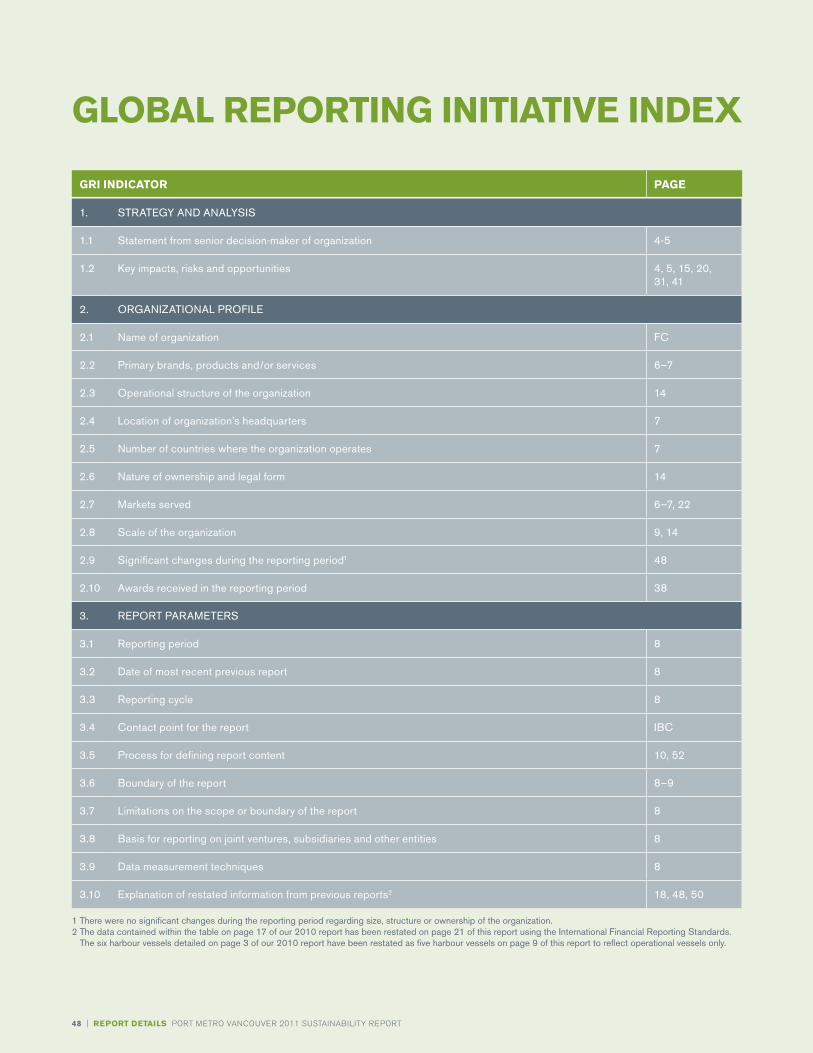
48 |
RePORt Details PORT mETRO VANcOUVER 2011 SUSTAINABILITY REPORT
1. StRAtEGy And AnAlySIS
1.1 Statement from senior decision-maker of organization 4-5
1.2 Key impacts, risks and opportunities 4, 5, 15, 20, 31, 41
2. ORGAnIZAtIOnAl PROFIlE
2.1 name of organization FC
2.2 Primary brands, products and/or services 6–7
2.3 Operational structure of the organization 14
2.4 location of organization’s headquarters 7
2.5 number of countries where the organization operates 7
2.6 nature of ownership and legal form 14
2.7 Markets served 6–7, 22
2.8 Scale of the organization 9, 14
2.9 Significant changes during the reporting period1 48
2.10 Awards received in the reporting period 38
3. REPORt PARAMEtERS
3.1 Reporting period 8
3.2 date of most recent previous report 8
3.3 Reporting cycle 8
3.4 Contact point for the report IBC
3.5 Process for defining report content 10, 52
3.6 Boundary of the report 8–9
3.7 limitations on the scope or boundary of the report 8
3.8 Basis for reporting on joint ventures, subsidiaries and other entities 8
3.9 data measurement techniques 8
3.10 Explanation of restated information from previous reports2 18, 48, 50
glObal RePORting initiatiVe inDex
gRi inDicatOR Page
1 there were no significant changes during the reporting period regarding size, structure or ownership of the organization.2 the data contained within the table on page 17 of our 2010 report has been restated on page 21 of this report using the International Financial Reporting Standards.
the six harbour vessels detailed on page 3 of our 2010 report have been restated as five harbour vessels on page 9 of this report to reflect operational vessels only.

| 49
PORT mETRO VANcOUVER 2011 SUSTAINABILITY REPORT RePORt Details
3.11 Significant changes from previous reporting periods 18, 50
3.12 Standard disclosures table 48–51
3.13 Independent assurance for the report 46–47
4. GOVERnAnCE
4.1 Governance structure of the organization 16
4.2 Whether Board Chair is also an executive officer 16
4.3 Independent and/or non-executive members of the Board 16
4.4 Mechanisms for shareholders and employees to provide recommendations to the Board 16
4.5 linkage between compensation and organization’s performance 15
4.6 Processes to ensure conflicts of interest are avoided 16
4.7 Process for determining the composition, qualifications and expertise of Board members 16
4.8 Mission, values, codes of conduct and principles 14
4.9 Board procedures for overseeing management of economic, environmental and social performance
16
4.10 Processes for evaluating the Board’s performance 16
4.11 Explanation of how the precautionary approach is addressed by the organization 34
4.12 Externally developed economic, environmental or social charters/principles 46
4.13 Memberships in associations 34
4.14 list of stakeholder groups engaged by the organization 15
4.15 Identification and selection of stakeholders with whom to engage 10, 15, 40, IBC
4.16 Approaches to stakeholder engagement 10, 17, 31, 40, 41
4.17 Key topics and concerns raised through stakeholder engagement 10, 17, 31, 41, 42, 52
keY
FC Front CoverIBC Inside Back Coverna not applicable
Externally assured by Independent Assurance provider, Ernst & young llP
gRi inDicatOR Page

50 |
RePORt Details PORT mETRO VANcOUVER 2011 SUSTAINABILITY REPORT
ECOnOMIC PERFORMAnCE IndICAtORS
Management Approach 20–21
EC1 direct economic value generated and distributed3
total value generated (thousands) total value distributed (thousands) Economic value retained (thousands)
$179,338 $105,045 $74,293
$183,009 $111,024 $71,985
21
EC4 Financial assistance received from government
Capital project funding received (thousands) $1,782 $19,455 30
EnVIROnMEntAl PERFORMAnCE IndICAtORS
Management Approach 18–19, 34–39
En3 direct energy consumption by primary energy source
diesel natural Gas Gasoline Propane
3,620 Gj 1,224 Gj 786 Gj 89 Gj
3,295 Gj 2,549 Gj 804 Gj 150 Gj
18
En4 Indirect energy consumption by primary energy source
natural Gas Electricity
3,127 Gj 15,116 Gj
3,581 Gj 17,612 Gj
18
En5 Energy saved due to conservation and efficiency improvements
Reduction in electricity use at Maintenance Office
134 MWh (482 Gj)
86 MWh (310 Gj)
18
En6 Initiatives to provide energy-efficient or renewable energy based products and services
Reduction in fuel use of cruise vessels through Shore Power
475 tonnes 424 tonnes 37
En7 Initiatives to reduce indirect energy consumption and reductions achieved
Participation in Commuter Challenge Fuel saved by use of hybrid vehicles
43% 1,925 litres
49% 1,780 litres
19
En16 total direct and indirect greenhouse gas emissions
Scope 1 corporate emissions Scope 2 corporate emissions
402 tCO2e 275 tCO2e
446 tCO2e 317 tCO2e
18
En17 Other relevant indirect greenhouse gas emissions4
Scope 3 corporate emissions 424 tCO2e 425 tCO2e 18
En18 Initiatives to reduce greenhouse gas emissions and reductions achieved
Reduction in emissions through: -Energy conservation measures -Hybrid fleet vehicles -Carbon Offsets Purchased
3.4 tCO2e 4.6 tCO2e 1,199 tCO2e
2.16 tCO2e 4.25 tCO2e 1,188 tCO2e
18–19
En20 nO, SO and other significant air emissions5
nitrogen Oxides Sulphur Oxides Particulate Matter (≤2.5 µm)
3,840 kg 44 kg 380 kg
3,876 kg 47 kg 366 kg
50
En22 total weight of waste by type and disposal method
Composted landfill
2,970 kg 7,600 kg
See footnote6 na 19
En26 Initiatives to mitigate environmental impacts of products and services
Shore Power Initiative: Reduction in fuel use of cruise vessels net reduction in GHG emissions Reduction in nitrogen oxides Reduction in Sulphur oxides Reduction in particulate matter (≤2.5 µm)
Marine Mammal Observer Program: number of monitoring hours number of work stoppages
475 tonnes 1,521 tCO2e 31 tonnes 17 tonnes 2.4 tonnes
1,341 h 3
424 tonnes 1,318 tCO2e 27 tonnes 14 tonnes 2 tonnes
1,378 h 31m 3
26, 37
gRi inDicatOR measuRe 2010 Value 2011 Value Page
3 the 2010 values have been restated in accordance with the International Financial Reporting Standards, to enable comparison between the two years of data. For more information please see page 21.
4 Emission factors have been sourced from Methods for Reporting 2011 BC Public Sector Greenhouse Gas Emissions, Ministry of Environment, December 2011, Version 2. We have recalculated our 2010 emissions using these emission factors in order to enable a fair comparison between the two years of data. Please see page 18 for more information.
5 to calculate our Common Air Contaminant emissions we have used the same activity data as for the Greenhouse Gas calculations. Emission factors have been sourced from the US EPA MOBILE and NONROAD models, US EPA AP 42 Handbook, and the International Civil Aviation Airport Air Quality Manual. these emission factors reflect a better understanding of non-road emission sources and capture changes in fuel properties. Prior to this, marine patrol vessels were characterized using emission factors associated with ocean-going vessels, which underestimated particulate matter for low sulphur fuels and overestimated nitrogen oxides for smaller marine engines. We have recalculated our 2010 emissions using these more appropriate emission factors in order to enable a fair comparison between the two years of data.
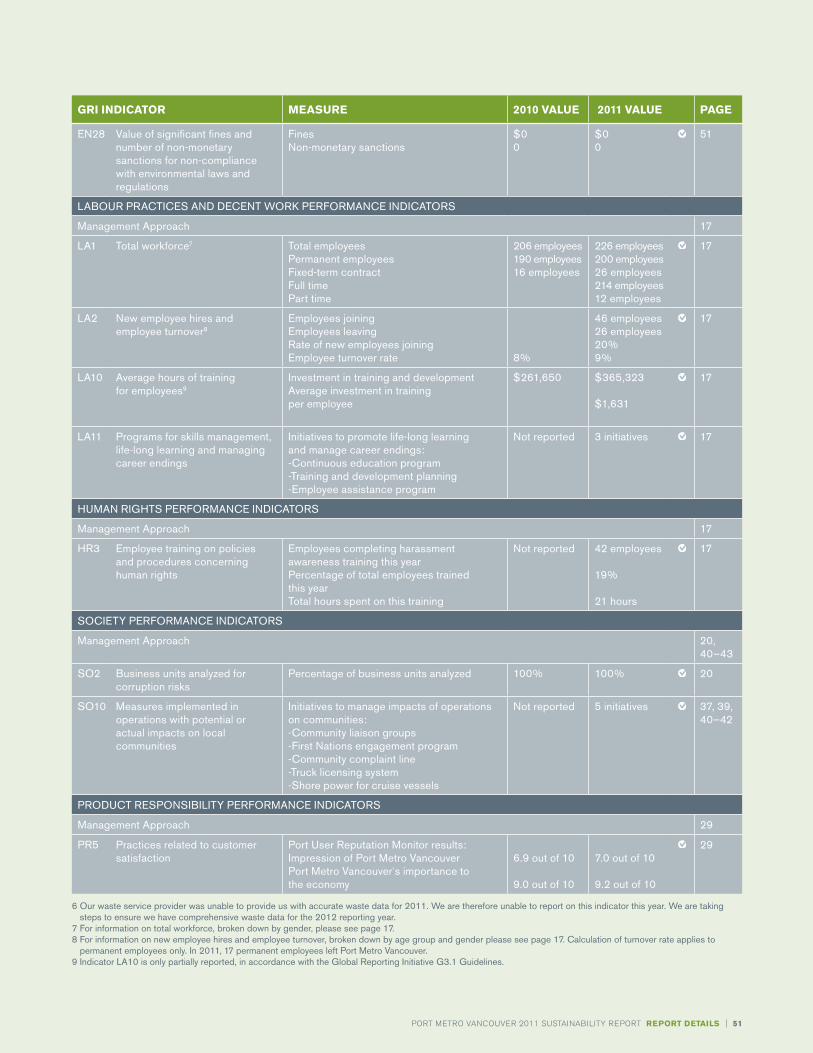
| 51
PORT mETRO VANcOUVER 2011 SUSTAINABILITY REPORT RePORt Details
En28 Value of significant fines and number of non-monetary sanctions for non-compliance with environmental laws and regulations
Fines non-monetary sanctions
$0 0
$0 0
51
lABOuR PRACtICES And dECEnt WORK PERFORMAnCE IndICAtORS
Management Approach 17
lA1 total workforce7 total employees Permanent employees Fixed-term contract Full time Part time
206 employees 190 employees 16 employees
226 employees 200 employees 26 employees 214 employees 12 employees
17
lA2 new employee hires and employee turnover8
Employees joining Employees leaving Rate of new employees joining Employee turnover rate
8%
46 employees 26 employees 20% 9%
17
lA10 Average hours of training for employees9
Investment in training and development Average investment in training per employee
$261,650 $365,323 $1,631
17
lA11 Programs for skills management, life-long learning and managing career endings
Initiatives to promote life-long learning and manage career endings: -Continuous education program -training and development planning - Employee assistance program
not reported 3 initiatives 17
HuMAn RIGHtS PERFORMAnCE IndICAtORS
Management Approach 17
HR3 Employee training on policies and procedures concerning human rights
Employees completing harassment awareness training this year Percentage of total employees trained this year total hours spent on this training
not reported
42 employees 19% 21 hours
17
SOCIEty PERFORMAnCE IndICAtORS
Management Approach 20, 40–43
SO2 Business units analyzed for corruption risks
Percentage of business units analyzed 100% 100% 20
SO10 Measures implemented in operations with potential or actual impacts on local communities
Initiatives to manage impacts of operations on communities: -Community liaison groups -First nations engagement program -Community complaint line -truck licensing system -Shore power for cruise vessels
not reported 5 initiatives 37, 39, 40–42
PROduCt RESPOnSIBIlIty PERFORMAnCE IndICAtORS
Management Approach 29
PR5 Practices related to customer satisfaction
Port user Reputation Monitor results: Impression of Port Metro Vancouver Port Metro Vancouver`s importance to the economy
6.9 out of 10 9.0 out of 10
7.0 out of 10 9.2 out of 10
29
6 Our waste service provider was unable to provide us with accurate waste data for 2011. We are therefore unable to report on this indicator this year. We are taking steps to ensure we have comprehensive waste data for the 2012 reporting year.
7 For information on total workforce, broken down by gender, please see page 17.8 For information on new employee hires and employee turnover, broken down by age group and gender please see page 17. Calculation of turnover rate applies to
permanent employees only. In 2011, 17 permanent employees left Port Metro Vancouver.9 Indicator lA10 is only partially reported, in accordance with the Global Reporting Initiative G3.1 Guidelines.
gRi inDicatOR measuRe 2010 Value 2011 Value Page

52 | RePORt Details PORT mETRO VANcOUVER 2011 SUSTAINABILITY REPORT
# Panel RecOmmenDatiOn PORt metRO VancOuVeR’s ResPOnse
StRuCtuRE
1.1 Clarify Port Metro Vancouver’s scope of responsibility and influence
this recommendation significantly influenced the overall report structure. the report is now split into two distinct sections – the Port Authority, covering areas where we have direct control, and the Port, covering areas within our sphere of influence. We have also provided an overview of our control and influence on page 9.
1.2 Consider using themes for perspectives that run throughout the report
We endeavoured to incorporate themes into the report, such as long-term planning and collaboration, where appropriate, and will continue to consider ways to advance this further in future reports.
1.3 Consider using the Port 2050 vision to frame the report
the outcomes of the Port 2050 process are discussed on page 27. this process influenced our updated vision and mission shown on page 14. In 2012, we will outline the steps required for success in the Port 2050 Great transition scenario and use this information to help frame subsequent reports.
COntEnt
2.1 Ensure material topics are adequately covered
We endeavoured to structure the report and its content based on the material topics identified by the panel through the materiality matrix, as shown on pages 10 and 11.
2.2 Provide a regional context for Port Metro Vancouver performance
We will work toward integrating more regional context for specific initiatives and targets in future reports.
2.3 Provide shipping facts as context
We expanded the report content which provides information on port operations, performance and reliability, as well as overviews of business sectors, growth and supporting infrastructure.
2.4 link critical business factors, risks and strategic priorities to sustainability performance
We are working to develop an integrated reporting format that provides greater connection between business planning and sustainability performance.
2.5 Recognize initiatives involving collaboration
We included information about collaborative initiatives throughout the report, such as the northwest Ports Clean Air Strategy on page 38 and the East Vancouver Port lands Plan on page 41. We will continue to seek ways to highlight collaborative initiatives in future reports.
2.6 Add more substance to some topics
We added greater detail on topics of interest such as community complaints, air emissions and business sectors, and have included historical data, where available.
2.7 distinguish mandatory and voluntary actions
We distinguished between voluntary and mandatory actions where appropriate and will continue to consider ways to maintain a clear delineation.
2.8 Enhance review process to ensure accuracy of all statements
A substantial report review process is in place to ensure the material in the report is accurate and all indicator data is independently assured by Ernst & young llP.
PRESEntAtIOn
3.1 Continue to use a reader-friendly layout and design
We have attempted to improve the report layout and design to create a more reader-friendly format.
3.2 Improve table of contents and add other navigational features
Improvements were made to the table of contents and other features added, such as web links, to assist navigation.
3.3 Ensure balance in selection of topics and use of language
We targeted a balanced approach to report content and language, and will continue to work on developing our approach to meet this objective.
for the full Review Panel Report, including detailed recommendations, panel participants and our response, please see our website: portmetrovancouver.com/accountability
summaRY Of Panel RecOmmenDatiOns

Over the past year, Port metro Vancouver’s progress toward sustainability can be attributed to the efforts of many people. We thank those who provided advice on our reporting efforts and sustainability commitments. We would especially like to thank the following organizations: • ChamberofShippingofBritishColumbia
• CityofVancouver
• EastVancouverPortLandsLiaisonGroup
• InternationalLongshoreandWarehouse
union Canada
• LafargeHarbourPlant
• MetroVancouver
• NorthShoreWaterfrontLiaisonCommittee
• NorthWest&CanadaCruiseAssociation
• SeaspanMarineCorporation
• TSITerminalSystemsInc.
• SolsticeSustainabilityWorks
• TeckResourcesLimited
• TsawwassenFirstNationEconomic
development Corporation
• Vancity
We welcome your feedback. Please contact us at: [email protected]
duncan Wilson Vice President, Corporate Social Responsibility Port Metro Vancouver 100 the Pointe, 999 Canada Place Vancouver, BC Canada V6C 3t4 telephone: 1.604.665.9000 Fax: 1.866.284.4271
We Want tO HeaR fROm YOu
this is a summary of our sustainability efforts. for more detailed reporting and additional information please visit:portmetrovancouver.com/accountability

100%
designed by Karo Group Inc.
PorT MeTro VANCouVer
100 the Pointe, 999 Canada PlaceVancouver, BC, Canada V6C 3t4telephone: 1.604.665.9000Fax: 1.866.284.4271Email: [email protected]: @PortMetroVanWeb: portmetrovancouver.com
Related Documents