2011 Kansas City Scout Congestion Index Report

Welcome message from author
This document is posted to help you gain knowledge. Please leave a comment to let me know what you think about it! Share it to your friends and learn new things together.
Transcript

2011 Kansas City Scout
Congestion Index
Report

K a n s a s C i t y s C o u t
20
11C
on
ge
sti
on
In
de
x R
ep
ort
Brought to you by: the Kansas and Missouri Departments of Transportation
with the assistance of:

K a n s a s C i t y s C o u t C o n g e s t i o n i n d e x R e p o R t
20
11C
on
ge
sti
on
In
de
x R
ep
ort
Table of ContentsTable of Contents .....................................................................................................................1
Introduction .............................................................................................................................2
Approach..................................................................................................................................2
Travel Time Index ....................................................................................................................4
Planning Time Index ..............................................................................................................11
Buffer Time Index ..................................................................................................................17
Vehicle Miles Traveled ............................................................................................................23
2010 Index Comparisons .......................................................................................................25
List of TablesTable1: Travel Time Index ............................................................................................5
Table 2: Planning Time Index ......................................................................................11
Table 3: Buffer Time Index ..........................................................................................17
Table 4: Vehicle Miles Traveled ....................................................................................23
Table 5. 2009 vs. 2010 TTI Comparisons....................................................................26
List of FiguresFigure 1: Section Map of Kansas City .............................................................................3
Figure 2: Travel Time Index AM .....................................................................................7
Figure 3: Travel Time Index PM ......................................................................................8
Figure 4: Travel Time Index Downtown AM ...................................................................9
Figure 5: Travel Time Index Downtown PM .................................................................10
Figure 6: Planning Time Index AM ...............................................................................13
Figure 7: Planning Time Index PM ...............................................................................14
Figure 8: Planning Time Index Downtown AM ............................................................15
Figure 9: Planning Time Index Downtown PM ............................................................16
Figure 10: Buffer Time Index AM ...................................................................................19
Figure 11: Buffer Time Index PM ...................................................................................20
Figure 12: Buffer Time Index Downtown AM ................................................................21
Figure 13: Buffer Time Index Downtown PM .................................................................22
1

K a n s a s C i t y s C o u t
20
11C
on
ge
sti
on
In
de
x R
ep
ort
Introduction
Congestion Management in the Kansas City area is a focus of the Kansas and Missouri Departments of Transportation, for which purpose they jointly formed the Kansas City Scout Advanced Traffic Management System (KC Scout). The purpose of the report is to compare the levels of congestion during peak periods on the freeway segments managed by KC Scout. This second annual Congestion Index Report is based on data gathered through KC Scout’s Vehicle Detection Stations (VDS). KC Scout maintains and operates traffic monitoring devices on over 100 miles of highway across the bi-state region. The VDS gather vehicle speed, volume and occupancy information in real-time. The report utilizes three nationally recognized traffic congestion indices as the basis of analysis. As additional detectors are added to the system, the new sections will be added into the report.
Approach
For the period of this analysis, KC Scout maintained a total of 471 freeway mainline VDS stations. Most of these stations are spaced at approximate ½ mile intervals, with wider spacing along some outlying corridors. Each station provides 30-second aggregated data, including average speed, total volume, and average occupancy, for each lane covered by the station. This data is reported back to KC Scout’s freeway management software and is used for real-time traffic information display for the operators, the motoring public and the KC Scout website. Each day, the data is aggregated into 5 minute intervals and stored in KC Scout’s data archive.
The data in the archive is “raw” in the sense that no efforts are made to filter, condition the data, or to interpolate missing data. Prior to this analysis, attempts were made to eliminate invalid data records that may have been posted by malfunctioning VDS detectors or stations. Specifically, data elements were eliminated if the following conditions existed:
Non-zero volume with zero speed »
Non-zero speed with zero volume »
Volumes reported over 2,400 vehicles per hour per lane »
For the purpose of this congestion management analysis, KC Scout has organized the Kansas City area into 25 individual bi-directional freeway segments, consisting of multiple VDS within each segment. While not all of these segments have sensors, they have been identified at this time in anticipation of their future instrumentation and incorporation. Figure 1 shows how all of the interstates are divided in the Kansas City area.
The congestion data for each segment is analyzed for non-holiday weekdays during two-hour AM and PM peak periods, defined as 6:45 am to 8:45 am and 3:45 pm to 5:45 pm. It is notable that these peak periods vary from the 2008 congestion report, which used four-hour peak periods.
2

K a n s a s C i t y s C o u t C o n g e s t i o n i n d e x R e p o R t
20
11C
on
ge
sti
on
In
de
x R
ep
ort
The 3 selected congestion indices are: the Travel Time Index (TTI), the Planning Time Index (PTI) and the Buffer Time Index (BTI). Vehicle Miles Traveled (VMT) are also included in the report as a reference. The report contains sections for each index that summarize the findings as well as identify any significant changes.
Figure 1: Section Map of Kansas City
3
K a n s a s C i t y s C o u t
20
11C
on
ge
sti
on
In
de
x R
ep
ort
Travel Time Index
The Travel Time Index (TTI) is defined as the ratio of the average travel time over the free flow travel time for a section of the freeway. For a specific lane and time period, this is calculated as follows:
TTI = TT Avg./ TT Freeflow
To calculate the TTI for a station, a weighted average is used with the lane volume as a basis, as follows:
TT Station Avg. = ∑(TT1 * V1) + (TT2 * V2) + (TTn* Vn)… _____________________________∑V
n
The TTI for a freeway section is then calculated using a weighted average of all Station TTI averages using VMT as a basis, (VMT being defined as the product of the total station volume and the distance that station represents). The TT calculation is shown below:
TT Section Avg. = ∑(TTSta 1 * VMTSta 1) + (TTSta 2 * VMTSta 2) + (TTSta n * VMTSta n)… _______________________________________________ ∑VMT n
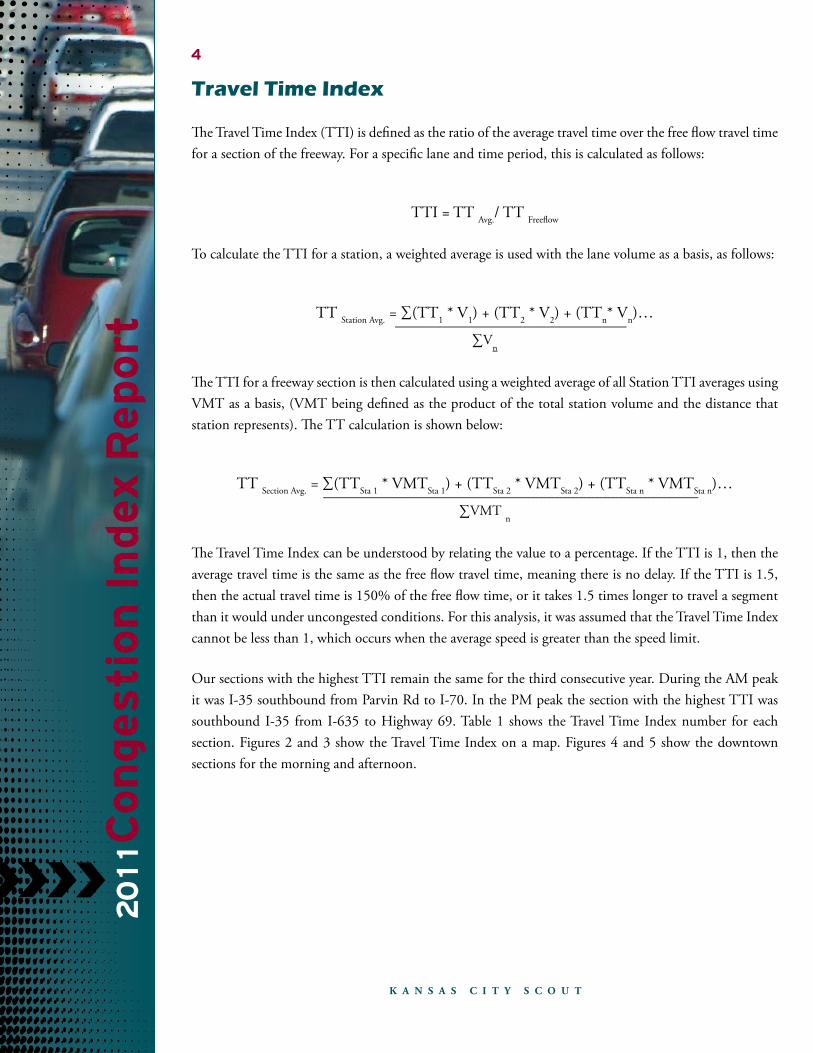
The Travel Time Index can be understood by relating the value to a percentage. If the TTI is 1, then the average travel time is the same as the free flow travel time, meaning there is no delay. If the TTI is 1.5, then the actual travel time is 150% of the free flow time, or it takes 1.5 times longer to travel a segment than it would under uncongested conditions. For this analysis, it was assumed that the Travel Time Index cannot be less than 1, which occurs when the average speed is greater than the speed limit.
Our sections with the highest TTI remain the same for the third consecutive year. During the AM peak it was I-35 southbound from Parvin Rd to I-70. In the PM peak the section with the highest TTI was southbound I-35 from I-635 to Highway 69. Table 1 shows the Travel Time Index number for each section. Figures 2 and 3 show the Travel Time Index on a map. Figures 4 and 5 show the downtown sections for the morning and afternoon.
4

K a n s a s C i t y s C o u t C o n g e s t i o n i n d e x R e p o R t
20
11C
on
ge
sti
on
In
de
x R
ep
ort
Segment and Freeway Description Segment Length
Morning Peak TTI
Evening Peak TTI
1.I-35 NB (from I-435 to 69 Hwy) 2.92 1.37 1.22
1.I-35 SB (from 69 Hwy to I-435) 2.92 1.07 1.11
2.I-35 NB (from 69 Hwy to I-635) 5.13 1.25 1.22
2.I-35 SB (from I-635 to 69 Hwy) 5.13 1.20 1.78
3.I-35 NB (from I-635 to I-70) Kansas 4.60 1.00 1.00
3.I-35 SB (from I-70 to I-635) Kansas 4.60 1.00 1.44
3.I-35 NB (from I-635 to I-70) Missouri 2.00 1.00 1.11
3.I-35 SB (from I-70 to I-635) Missouri 2.00 1.00 1.01
3.I-35 NB (from I-635 to I-70) Downtown 0.80 1.00 1.46
3.I-35 SB (from I-70 to I-635) Downtown 0.80 1.00 1.01
4.I-35 NB (from I-70 to Parvin Rd) 4.62 1.04 1.09
4.I-35 SB (from Parvin Rd to I-70) 4.62 1.50 1.08
5.I-35 NB (from Parvin Rd to I-435) 4.82No Detection as of January 2011
5.I-35 SB (from I-435 to Parvin Rd) 4.82
6.I-35 NB (from I-435 to 152 Hwy) 3.36No Detection as of January 2011
6.I-35 SB (from 152 Hwy to I-435) 3.36
7.I-70 EB (from I-35 to I-435) 5.80 1.05 1.56
7.I-70 WB (from I-435 to I-35) 5.80 1.07 1.04
7.I-70 EB (from I-35 to I-435) Downtown 1.70 1.04 1.35
7.I-70 WB (from I-435 to I-35) Downtown 1.70 1.00 1.25
8.I-70 EB (from I-435 to I-470) 6.91 1.01 1.21
8.I-70 WB (from I-470 to I-435) 6.91 1.41 1.04
9.I-70 EB (from I-470 to MO 7) 5.34 1.03 1.11
9.I-70 WB (from MO 7 to I-470) 5.34 1.06 1.00
10.I-670 EB (from I-35 to I-70) 0.94 1.11 1.42
10.I-670 WB (from I-70 to I-35) 0.94 1.19 1.17
11.I-435 EB (from I-35 to State Line) 7.32 1.08 1.31
11.I-435 WB (from State Line to I-35) 7.32 1.06 1.30
12.I-435 EB (from State Line to 71 Hwy) 4.22 1.00 1.40
12.I-435 WB (from 71 Hwy to State Line) 4.22 1.15 1.00
13.I-435 NB (from 71 Hwy to 350 Hwy) 5.82 1.00 1.01
13.I-435 SB (from 350 Hwy to 71 Hwy) 5.82 1.01 1.00
14.I-435 NB (from 350 Hwy to I-70) 3.17 1.00 1.12
14.I-435 SB (from I-70 to 350 Hwy) 3.17 1.04 1.05
15.I-435 NB (from I-70 to the Missouri River) 6.36No Detection as of January 2011
15.I-435 SB (from the Missouri River to I-70) 6.36
16.I-435 NB (from the Missouri River to I-35) 4.17No Detection as of January 2011
16.I-435 SB (from I-35 to the Missouri River) 4.17
17.I-635 NB (from I-35 to I-70) 4.09 1.00 1.02
17.I-635 SB (from I-70 to I-35) 4.09 1.01 1.01
18.I-635 NB (from I-70 to the Missouri River) 4.26 1.00 1.04
18.I-635 SB (from the Missouri River to I-70) 4.26 1.06 1.07
Table 1: Travel Time Index
5

K a n s a s C i t y s C o u t
20
11C
on
ge
sti
on
In
de
x R
ep
ort
Segment and Freeway Description Segment Length
Morning Peak TTI
Evening Peak TTI
19.I-635 NB (from the Missouri River to I-29) 3.77No Detection as of January 2011
19.I-635 SB (from I-29 to the Missouri River) 3.77
20.I-470 EB (from 71 Hwy to 291 Hwy) 10.1No Detection as of January 2011
20.I-470 WB (from 291 Hwy to 71 Hwy) 10.1
21.I-470 NB (from 291 Hwy to I-70) 6.98No Detection as of January 2011
21.I-470 SB (from I-70 to 291 Hwy) 6.98
22.I-29 NB (from Parvin Rd to I-635) 3.95No Detection as of January 2011
22.I-29 SB (from I-635 to Parvin Rd) 3.95
23.I-29 NB (from I-635 to 152 Hwy) 4.15No Detection as of January 2011
23.I-29 SB (from 152 Hwy to I-635) 4.15
24.71 Hwy NB (from 58 Hwy to I-435) 8.29No Detection as of January 2011
24.71 Hwy SB (from I-435 to 58 Hwy) 8.29
25.71 Hwy NB (from I-435 to I-70) 12.52No Detection as of January 2011
25.71 Hwy SB (from I-70 to I-435) 12.52
Table 1: Travel Time Index (continued)
6

K a n s a s C i t y s C o u t C o n g e s t i o n i n d e x R e p o R t
20
11C
on
ge
sti
on
In
de
x R
ep
ort
Figure 2. Travel Time Index AM
7
See Downtown Insert Map

K a n s a s C i t y s C o u t
20
11C
on
ge
sti
on
In
de
x R
ep
ort
Figure 3: Travel Time Index – PM
8
K a n s a s C i t y s C o u t C o n g e s t i o n i n d e x R e p o R t
20
11C
on
ge
sti
on
In
de
x R
ep
ort
Figure 4: Travel Time Index Downtown – AM
9

K a n s a s C i t y s C o u t
20
11C
on
ge
sti
on
In
de
x R
ep
ort
Figure 5: Travel Time Index Downtown – PM
10

K a n s a s C i t y s C o u t C o n g e s t i o n i n d e x R e p o R t
20
11C
on
ge
sti
on
In
de
x R
ep
ort
Planning Time Index
The Planning Time Index is an indicator of the variability of the average Travel Time. If the travel time is very volatile along a particular segment it relates to the percent of time that a segment experiences congestion. It is named Planning Time because a traveler may have to plan additional time into their trip in order to arrive at their destination on time at least 95 percent of the time. Factors that can affect planning time include accidents, roadwork, and general congestion. The PTI is the ratio of the 95th percentile travel time over the free flow travel time for the segment of the freeway.
PTI = TTI 95th Percentile
When a segment value is less than 1, it is assumed to be 1. The higher the PTI value, the longer the planning time needed to reach the required destination on time 95% of the time.
For 2010, the southbound I-35 section from Parvin Rd to I-70 had the highest PTI for the morning. For the afternoon the section with the highest PTI was eastbound I-670 from I-35 to I-70. For example if it takes 5 minutes to travel on this section in free flow traffic then one should plan for 15 minutes. This is 5 minutes multiplied by a 3.00 planning time index. A few sections saw an increase of their PTI numbers from 2009. Most of the effected sections were in direct relation to the construction of the new Christopher S. Bond Bridge. Table 2 shows the Planning Time Index number for each section. Figures 6 and 7 show the Planning Time Index on a map. Figures 8 and 9 show the downtown sections for the morning and afternoon.
Table 2: Planning Time Index
Segment and Freeway Description Segment Length
Morning Peak PTI
Evening Peak PTI
1.I-35 NB (from I-435 to 69 Hwy) 2.92 3.05 1.63
1.I-35 SB (from 69 Hwy to I-435) 2.92 1.20 1.30
2.I-35 NB (from 69 Hwy to I-635) 5.13 2.54 1.68
2.I-35 SB (from I-635 to 69 Hwy) 5.13 1.73 3.66
3.I-35 NB (from I-635 to I-70) Kansas 4.60 1.19 1.16
3.I-35 SB (from I-70 to I-635) Kansas 4.60 1.05 3.22
3.I-35 NB (from I-635 to I-70) Missouri 2.00 1.14 1.61
3.I-35 SB (from I-70 to I-635) Missouri 2.00 1.09 1.20
3.I-35 NB (from I-635 to I-70) Downtown 0.80 1.13 2.52
3.I-35 SB (from I-70 to I-635) Downtown 0.80 1.05 1.10
4.I-35 NB (from I-70 to Parvin Rd) 4.62 1.27 1.50
4.I-35 SB (from Parvin Rd to I-70) 4.62 3.11 1.28
5.I-35 NB (from Parvin Rd to I-435) 4.82No Detection as of January 2011
5.I-35 SB (from I-435 to Parvin Rd) 4.82
6.I-35 NB (from I-435 to 152 Hwy) 3.36No Detection as of January 2011
6.I-35 SB (from 152 Hwy to I-435) 3.36
11

K a n s a s C i t y s C o u t
20
11C
on
ge
sti
on
In
de
x R
ep
ort
Table 2: Planning Time Index (continued)
Segment and Freeway Description Segment Length
Morning Peak PTI
Evening Peak PTI
7.I-70 EB (from I-35 to I-435) 5.80 1.32 3.29
7.I-70 WB (from I-435 to I-35) 5.80 1.43 1.39
7.I-70 EB (from I-35 to I-435) Downtown 1.70 1.64 2.13
7.I-70 WB (from I-435 to I-35) Downtown 1.70 2.14 3.82
8.I-70 EB (from I-435 to I-470) 6.91 1.10 2.19
8.I-70 WB (from I-470 to I-435) 6.91 2.61 1.13
9.I-70 EB (from I-470 to MO 7) 5.34 1.17 1.39
9.I-70 WB (from MO 7 to I-470) 5.34 1.45 1.05
10.I-670 EB (from I-35 to I-70) 0.94 1.42 3.82
10.I-670 WB (from I-70 to I-35) 0.94 1.43 1.40
11.I-435 EB (from I-35 to State Line) 7.32 1.38 2.63
11.I-435 WB (from State Line to I-35) 7.32 1.36 2.82
12.I-435 EB (from State Line to 71 Hwy) 4.22 1.08 2.38
12.I-435 WB (from 71 Hwy to State Line) 4.22 1.82 1.21
13.I-435 NB (from 71 Hwy to 350 Hwy) 5.82 1.10 1.12
13.I-435 SB (from 350 Hwy to 71 Hwy) 5.82 1.16 1.06
14.I-435 NB (from 350 Hwy to I-70) 3.17 1.07 1.84
14.I-435 SB (from I-70 to 350 Hwy) 3.17 1.12 1.13
15.I-435 NB (from I-70 to the Missouri River) 6.36No Detection as of January 2011
15.I-435 SB (from the Missouri River to I-70) 6.36
16.I-435 NB (from the Missouri River to I-35) 4.17No Detection as of January 2011
16.I-435 SB (from I-35 to the Missouri River) 4.17
17.I-635 NB (from I-35 to I-70) 4.09 1.12 1.16
17.I-635 SB (from I-70 to I-35) 4.09 1.19 1.17
18.I-635 NB (from I-70 to the Missouri River) 4.26 1.25 1.34
18.I-635 SB (from the Missouri River to I-70) 4.26 1.32 1.31
19.I-635 NB (from the Missouri River to I-29) 3.77No Detection as of January 2011
19.I-635 SB (from I-29 to the Missouri River) 3.77
20.I-470 EB (from 71 Hwy to 291 Hwy) 10.1No Detection as of January 2011
20.I-470 WB (from 291 Hwy to 71 Hwy) 10.1
21.I-470 NB (from 291 Hwy to I-70) 6.98No Detection as of January 2011
21.I-470 SB (from I-70 to 291 Hwy) 6.98
22.I-29 NB (from Parvin Rd to I-635) 3.95No Detection as of January 2011
22.I-29 SB (from I-635 to Parvin Rd) 3.95
23.I-29 NB (from I-635 to 152 Hwy) 4.15No Detection as of January 2011
23.I-29 SB (from 152 Hwy to I-635) 4.15
24.71 Hwy NB (from 58 Hwy to I-435) 8.29No Detection as of January 2011
24.71 Hwy SB (from I-435 to 58 Hwy) 8.29
25.71 Hwy NB (from I-435 to I-70) 12.52No Detection as of January 2011
25.71 Hwy SB (from I-70 to I-435) 12.52
12

K a n s a s C i t y s C o u t C o n g e s t i o n i n d e x R e p o R t
20
11C
on
ge
sti
on
In
de
x R
ep
ort
Figure 6. Planning Time Index AM
13

K a n s a s C i t y s C o u t
20
11C
on
ge
sti
on
In
de
x R
ep
ort
Figure 7. Planning Time Index PM
14

K a n s a s C i t y s C o u t C o n g e s t i o n i n d e x R e p o R t
20
11C
on
ge
sti
on
In
de
x R
ep
ort
Figure 8. Planning Time Index Downtown AM
15

K a n s a s C i t y s C o u t
20
11C
on
ge
sti
on
In
de
x R
ep
ort
Figure 9. Planning Time Index Downtown PM
16

K a n s a s C i t y s C o u t C o n g e s t i o n i n d e x R e p o R t
20
11C
on
ge
sti
on
In
de
x R
ep
ort
Buffer time index
The Buffer Time Index is the amount of time that a traveler adds onto a trip when planning trips. The buffer time is the difference between the 95th percentile and the average travel time.
BTI= TT95th Percentile – TT Avg, _________________
TT Avg,
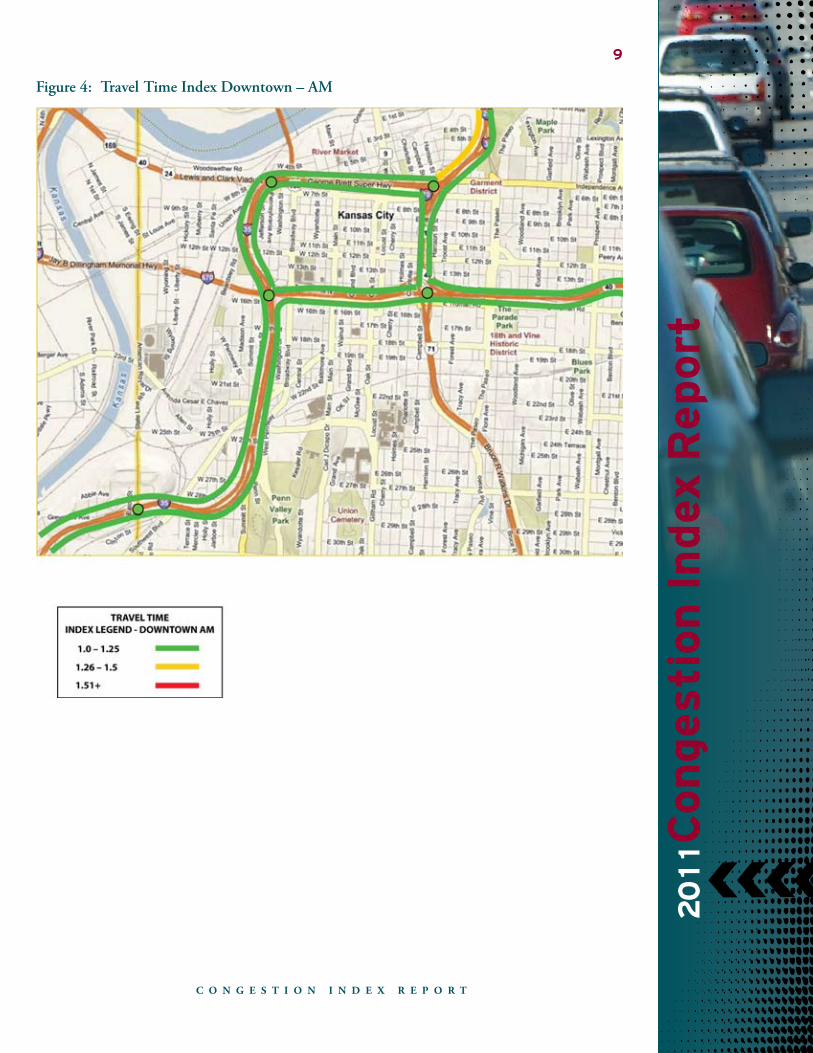
For 2010, the highest BTI percentage in the AM and PM peaks was westbound I-70 in the northeast corner of the downtown loop. Again the increase in the BTI reflected the construction of the Bond Bridge. Eastbound I-670 also saw a significant increase in the BTI. It was 171.02% in 2009. Similar to the example in the planning time index, if it takes 5 minutes to travel through this section at free flow speed then one should add approximately 8.5 minutes to their commute to get there on time 95% of the time. Table 3 shows the Buffer Time Index number for each section. Figures 10 and 11 show the Buffer Time Index on a map. Figures 12 and 13 show the downtown sections for the morning and afternoon.
Table 3: Buffer Time Index
Segment and Freeway Description Segment Length
Morning Peak BTI
Evening Peak BTI
1.I-35 NB (from I-435 to 69 Hwy) 2.92 122.19% 33.48%
1.I-35 SB (from 69 Hwy to I-435) 2.92 12.59% 16.87%
2.I-35 NB (from 69 Hwy to I-635) 5.13 101.58% 37.79%
2.I-35 SB (from I-635 to 69 Hwy) 5.13 43.62% 106.12%
3.I-35 NB (from I-635 to I-70) Kansas 4.60 25.62% 26.04%
3.I-35 SB (from I-70 to I-635) Kansas 4.60 14.97% 122.95%
3.I-35 NB (from I-635 to I-70) Missouri 2.00 13.26% 45.33%
3.I-35 SB (from I-70 to I-635) Missouri 2.00 12.04% 18.63%
3.I-35 NB (from I-635 to I-70) Downtown 0.80 15.80% 72.26%
3.I-35 SB (from I-70 to I-635) Downtown 0.80 5.54% 8.84%
4.I-35 NB (from I-70 to Parvin Rd) 4.62 21.91% 38.42%
4.I-35 SB (from Parvin Rd to I-70) 4.62 107.23% 18.46%
5.I-35 NB (from Parvin Rd to I-435) 4.82No Detection as of January 2011
5.I-35 SB (from I-435 to Parvin Rd) 4.82
6.I-35 NB (from I-435 to 152 Hwy) 3.36No Detection as of January 2011
6.I-35 SB (from 152 Hwy to I-435) 3.36
7.I-70 EB (from I-35 to I-435) 5.80 25.67% 110.37%
7.I-70 WB (from I-435 to I-35) 5.80 33.73% 33.43%
7.I-70 EB (from I-35 to I-435) Downtown 1.70 57.02% 58.36%
7.I-70 WB (from I-435 to I-35) Downtown 1.70 116.08% 201.91%
8.I-70 EB (from I-435 to I-470) 6.91 9.38% 81.03%
8.I-70 WB (from I-470 to I-435) 6.91 84.35% 8.86%
9.I-70 EB (from I-470 to MO 7) 5.34 13.30% 24.63%
9.I-70 WB (from MO 7 to I-470) 5.34 37.44% 8.68%
17

K a n s a s C i t y s C o u t
20
11C
on
ge
sti
on
In
de
x R
ep
ort
Table 3: Buffer Time Index (continued)
Segment and Freeway Description Segment Length
Morning Peak BTI
Evening Peak BTI
10.I-670 EB (from I-35 to I-70) 0.94 28.22% 169.34%
10.I-670 WB (from I-70 to I-35) 0.94 20.19% 19.54%
11.I-435 EB (from I-35 to State Line) 7.32 27.28% 101.20%
11.I-435 WB (from State Line to I-35) 7.32 28.46% 117.95%
12.I-435 EB (from State Line to 71 Hwy) 4.22 9.01% 69.22%
12.I-435 WB (from 71 Hwy to State Line) 4.22 58.59% 20.82%
13.I-435 NB (from 71 Hwy to 350 Hwy) 5.82 11.03% 11.35%
13.I-435 SB (from 350 Hwy to 71 Hwy) 5.82 14.38% 5.58%
14.I-435 NB (from 350 Hwy to I-70) 3.17 7.61% 64.24%
14.I-435 SB (from I-70 to 350 Hwy) 3.17 7.92% 6.77%
15.I-435 NB (from I-70 to the Missouri River) 6.36No Detection as of January 2011
15.I-435 SB (from the Missouri River to I-70) 6.36
16.I-435 NB (from the Missouri River to I-35) 4.17No Detection as of January 2011
16.I-435 SB (from I-35 to the Missouri River) 4.17
17.I-635 NB (from I-35 to I-70) 4.09 12.20% 13.22%
17.I-635 SB (from I-70 to I-35) 4.09 17.87% 15.61%
18.I-635 NB (from I-70 to the Missouri River) 4.26 24.53% 28.77%
18.I-635 SB (from the Missouri River to I-70) 4.26 24.91% 22.81%
19.I-635 NB (from the Missouri River to I-29) 3.77No Detection as of January 2011
19.I-635 SB (from I-29 to the Missouri River) 3.77
20.I-470 EB (from 71 Hwy to 291 Hwy) 10.1No Detection as of January 2011
20.I-470 WB (from 291 Hwy to 71 Hwy) 10.1
21.I-470 NB (from 291 Hwy to I-70) 6.98No Detection as of January 2011
21.I-470 SB (from I-70 to 291 Hwy) 6.98
22.I-29 NB (from Parvin Rd to I-635) 3.95No Detection as of January 2011
22.I-29 SB (from I-635 to Parvin Rd) 3.95
23.I-29 NB (from I-635 to 152 Hwy) 4.15No Detection as of January 2011
23.I-29 SB (from 152 Hwy to I-635) 4.15
24.71 Hwy NB (from 58 Hwy to I-435) 8.29No Detection as of January 2011
24.71 Hwy SB (from I-435 to 58 Hwy) 8.29
25.71 Hwy NB (from I-435 to I-70) 12.52No Detection as of January 2011
25.71 Hwy SB (from I-70 to I-435) 12.52
18

K a n s a s C i t y s C o u t C o n g e s t i o n i n d e x R e p o R t
20
11C
on
ge
sti
on
In
de
x R
ep
ort
Figure 10. Buffer Time Index AM
19

K a n s a s C i t y s C o u t
20
11C
on
ge
sti
on
In
de
x R
ep
ort
Figure 11. Buffer Time Index PM
20

K a n s a s C i t y s C o u t C o n g e s t i o n i n d e x R e p o R t
20
11C
on
ge
sti
on
In
de
x R
ep
ort
Figure 12. Buffer Time Index Downtown AM
21
K a n s a s C i t y s C o u t
20
11C
on
ge
sti
on
In
de
x R
ep
ort
Figure 13. Buffer Time Index Downtown PM
22

K a n s a s C i t y s C o u t C o n g e s t i o n i n d e x R e p o R t
20
11C
on
ge
sti
on
In
de
x R
ep
ort
Vehicle Miles Traveled
Vehicle Miles Traveled is calculated by multiplying the total vehicle volume by the segment distance.
VMT= Total Vol. of Vehicles X Distance Section
Table 4: Vehicle Miles Traveled in 2010
Segment and Freeway Description Segment Length
Total Peak Period Volume (in millions)
Total Peak Period Vehicle Miles Traveled (in millions)
1.I-35 NB (from I-435 to 69 Hwy) 2.92 9.27 88.54
1.I-35 SB (from I-435 to 69 Hwy) 2.92 11.83 103.67
2.I-35 NB (from 69 Hwy to I-635) 5.13 25.18 481.55
2.I-35 SB (from 69 Hwy to I-635) 5.13 27.34 537.60
3.I-35 NB (from I-635 to I-70) Kansas 4.60 14.67 218.15
3.I-35 SB (from I-635 to I-70) Kansas 4.60 13.44 185.49
3.I-35 NB (from I-635 to I-70) Missouri 2.00 2.42 14.93
3.I-35 SB (from I-635 to I-70) Missouri 2.00 2.36 18.86
3.I-35 NB (from I-635 to I-70) Downtown 0.80 1.67 3.24
3.I-35 SB (from I-635 to I-70) Downtown 0.80 0.75 2.99
4.I-35 NB (from I-70 to Parvin Rd) 4.62 4.48 53.27
4.I-35 SB (from I-70 to Parvin Rd) 4.62 6.32 79.30
5.I-35 NB (from Parvin Rd to I-435) 4.82No Detection as of January 2011
5.I-35 SB (from Parvin Rd to I-435) 4.82
6.I-35 NB (from I-435 to 152 Hwy) 3.36No Detection as of January 2011
6.I-35 SB (from I-435 to 152 Hwy) 3.36
7.I-70 EB (from I-35 to I-435) 5.80 10.79 197.33
7.I-70 WB (from I-35 to I-435) 5.80 14.94 282.90
7.I-70 EB (from I-35 to I-435) Downtown 1.70 5.05 24.52
7.I-70 WB (from I-35 to I-435) Downtown 1.70 3.31 14.79
8.I-70 EB (from I-435 to I-470) 6.91 20.08 416.33
8.I-70 WB (from I-435 to I-470) 6.91 21.39 439.48
9.I-70 EB (from I-470 to MO 7) 5.34 14.82 237.41
9.I-70 WB (from I-470 to MO 7) 5.34 15.91 254.90
10.I-670 EB (from I-35 to I-70) 0.94 2.33 6.00
10.I-670 WB (from I-35 to I-70) 0.94 3.13 8.83
11.I-435 EB (from I-35 to State Line) 7.32 38.76 1167.62
11.I-435 WB (from I-35 to State Line) 7.32 35.64 1069.48
12.I-435 EB (from State Line to 71 Hwy) 4.22 15.98 285.32
12.I-435 WB (from State Line to 71 Hwy) 4.22 15.16 271.67
13.I-435 NB (from 71 Hwy to 350 Hwy) 5.82 14.29 251.38
13.I-435 SB (from 71 Hwy to 350 Hwy) 5.82 12.87 217.16
23

K a n s a s C i t y s C o u t
20
11C
on
ge
sti
on
In
de
x R
ep
ort
Table 4: Vehicle Miles Traveled in 2010 (continued)
Segment and Freeway Description Segment Length
Total Peak Period Volume (in millions)
Total Peak Period Vehicle Miles Traveled (in millions)
14.I-435 NB (from 350 Hwy to I-70) 3.17 8.76 83.28
14.I-435 SB (from 350 Hwy to I-70) 3.17 12.15 115.53
15.I-435 NB (from I-70 to the Missouri River) 6.36No Detection as of January 2011
15.I-435 SB (from I-70 to the Missouri River) 6.36
16.I-435 NB (from the Missouri River to I-35) 4.17No Detection as of January 2011
16.I-435 SB (from the Missouri River to I-35) 4.17
17.I-635 NB (from I-35 to I-70) 4.09 10.41 133.53
17.I-635 SB (from I-35 to I-70) 4.09 10.99 144.64
18.I-635 NB (from I-70 to the Missouri River) 4.26 4.26 54.95
18.I-635 SB (from I-70 to the Missouri River) 4.26 4.49 57.98
19.I-635 NB (from the Missouri River to I-29) 3.77No Detection as of January 2011
19.I-635 SB (from the Missouri River to I-29) 3.77
20.I-470 EB (from 71 Hwy to 291 Hwy) 10.1No Detection as of January 2011
20.I-470 WB (from 71 Hwy to 291 Hwy) 10.1
21.I-470 NB (from 291 Hwy to I-70) 6.98No Detection as of January 2011
21.I-470 SB (from 291 Hwy to I-70) 6.98
22.I-29 NB (from Parvin to I-635) 3.95No Detection as of January 2011
22.I-29 SB (from Parvin to I-635) 3.95
23.I-29 NB (from I-635 to 152 Hwy) 4.15No Detection as of January 2011
23.I-29 SB (from I-635 to 152 Hwy) 4.15
24.71 Hwy NB (from 58 Hwy to I-435) 8.29No Detection as of January 2011
24.71 Hwy SB (from 58 Hwy to I-435) 8.29
25.71 Hwy NB (from I-435 to I-70) 12.52No Detection as of January 2011
25.71 Hwy SB (from I-435 to I-70) 12.52
24

K a n s a s C i t y s C o u t C o n g e s t i o n i n d e x R e p o R t
20
11C
on
ge
sti
on
In
de
x R
ep
ort
2010 Index Comparisons
The methodology changes that have been incorporated into the 2010 congestion report are as follows:
The peak hour utilized is 2 hours versus the 4-hour period used in the »2008 congestion report. Reducing the peak hour, allows for less smoothing of the data, and focuses on times when traffic is the most critical.
The VMT was calculated for the 4-hour period »
Many factors go into reducing congestion and this report is designed to outline the performance of the system by using travel time reliability measures. Congestion can be measured in other ways, such as point to point travel times. The Scout system archives information from a vast network of vehicle detectors, which provides the data to report on congestion, a feature that was non-existent prior to establishing an Intelligent Transportation System.
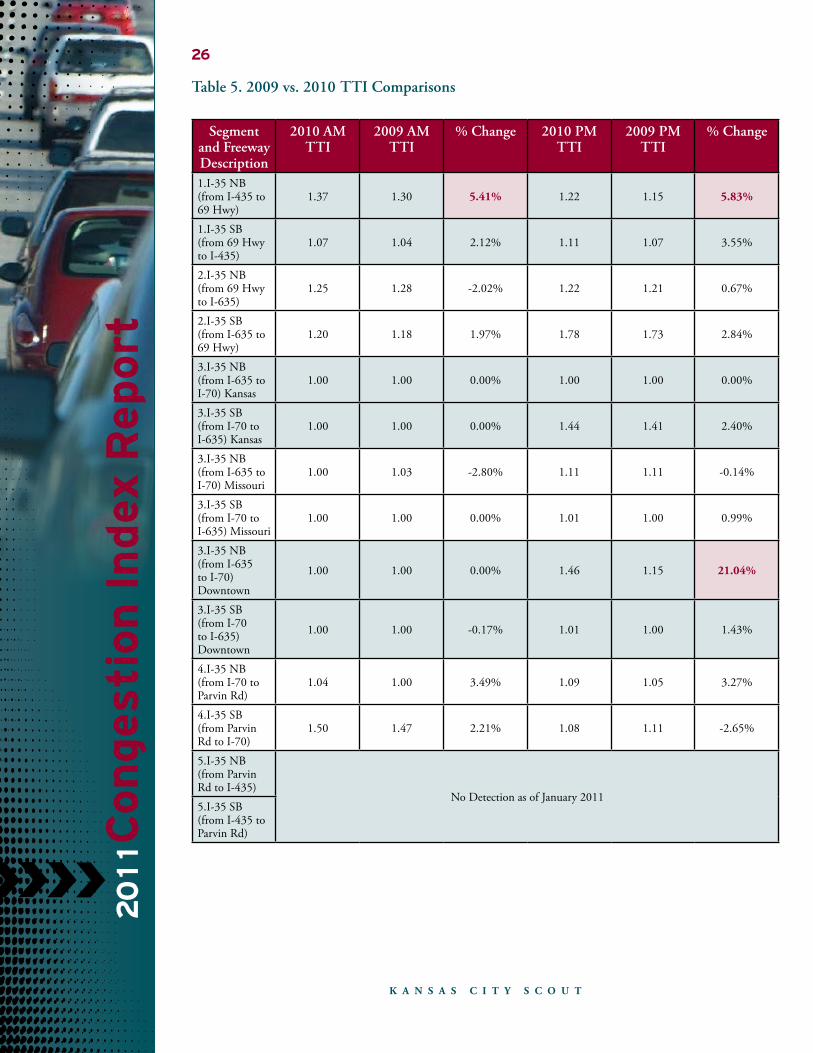
Attached is a summary of sections that have increases in the TTI of more than 5% and the cause of the increase. Table 5 is located on pages 26-29.
25
Sections Reason3, 7, 8, 10 Construction Projects1, 11 Additional Volume
The Construction projects that affected the TTI were the reconstruction of the I-70 & 435 interchange, resurfacing of I-70 from downtown to 435 and other long term projects like the new Christopher S. Bond Bridge which was completed in late 2010. Long term major construction projects, like the ones listed above have a big effect on the buffer time and planning time. Therefore, the chart shows a dramatic increase in buffer times. This is logical because the travel time reliability has more variation in work zones and additional time should be accounted for to make it to a destination on time consistently. Other work zone factors that contribute to high buffer and planning time indexes are:
Vehicle detection is disabled or not properly aligned with the »road due to construction lane configurations
Reduction in speed limits »
Reduction of lanes and capacity »
Through the comparison of 2010 the Kansas City Metropolitan Area remains consistent and congestion continues to be fairly low with 85% of the roadway falling under low congestion thresholds. The region’s lack of roadway capacity and loss of lanes makes Traffic Incident Management critical to maintaining a downward trend for congestion. Table 5 reflects each segment’s performance in comparison to the previous year.
K a n s a s C i t y s C o u t
20
11C
on
ge
sti
on
In
de
x R
ep
ort
Table 5. 2009 vs. 2010 TTI Comparisons
Segment and Freeway Description
2010 AM TTI
2009 AM TTI
% Change 2010 PM TTI
2009 PM TTI
% Change
1.I-35 NB (from I-435 to 69 Hwy)
1.37 1.30 5.41% 1.22 1.15 5.83%
1.I-35 SB (from 69 Hwy to I-435)
1.07 1.04 2.12% 1.11 1.07 3.55%
2.I-35 NB (from 69 Hwy to I-635)
1.25 1.28 -2.02% 1.22 1.21 0.67%
2.I-35 SB (from I-635 to 69 Hwy)
1.20 1.18 1.97% 1.78 1.73 2.84%
3.I-35 NB (from I-635 to I-70) Kansas
1.00 1.00 0.00% 1.00 1.00 0.00%
3.I-35 SB (from I-70 to I-635) Kansas
1.00 1.00 0.00% 1.44 1.41 2.40%
3.I-35 NB (from I-635 to I-70) Missouri
1.00 1.03 -2.80% 1.11 1.11 -0.14%
3.I-35 SB (from I-70 to I-635) Missouri
1.00 1.00 0.00% 1.01 1.00 0.99%
3.I-35 NB (from I-635 to I-70) Downtown
1.00 1.00 0.00% 1.46 1.15 21.04%
3.I-35 SB (from I-70 to I-635) Downtown
1.00 1.00 -0.17% 1.01 1.00 1.43%
4.I-35 NB (from I-70 to Parvin Rd)
1.04 1.00 3.49% 1.09 1.05 3.27%
4.I-35 SB (from Parvin Rd to I-70)
1.50 1.47 2.21% 1.08 1.11 -2.65%
5.I-35 NB (from Parvin Rd to I-435)
No Detection as of January 20115.I-35 SB (from I-435 to Parvin Rd)
26

K a n s a s C i t y s C o u t C o n g e s t i o n i n d e x R e p o R t
20
11C
on
ge
sti
on
In
de
x R
ep
ort
Segment and Freeway Description
2010 AM TTI
2009 AM TTI
% Change 2010 PM TTI
2009 PM TTI
% Change
6.I-35 NB (from I-435 to 152 Hwy)
No Detection as of January 20116.I-35 SB (from 152 Hwy to I-435)
7.I-70 EB (from I-35 to I-435)
1.05 1.00 4.99% 1.56 1.47 6.14%
7.I-70 WB (from I-435 to I-35)
1.07 1.08 -0.96% 1.04 1.02 1.77%
7.I-70 EB (from I-35 to I-435) Downtown
1.04 1.05 -0.55% 1.35 1.19 11.54%
7.I-70 WB (from I-435 to I-35) Downtown
1.00 1.00 0.00% 1.25 1.00 20.00%
8.I-70 EB (from I-435 to I-470)
1.01 1.03 -2.19% 1.21 1.35 -11.38%
8.I-70 WB (from I-470 to I-435)
1.41 1.27 10.52% 1.04 1.04 0.01%
9.I-70 EB (from I-470 to MO 7)
1.03 1.03 0.02% 1.11 1.10 1.05%
9.I-70 WB (from MO 7 to I-470)
1.06 1.06 0.01% 1.00 1.00 0.00%
10.I-670 EB (from I-35 to I-70)
1.11 1.00 9.69% 1.42 1.11 21.90%
10.I-670 WB (from I-70 to I-35)
1.19 1.02 14.23% 1.17 1.00 14.48%
11.I-435 EB (from I-35 to State Line)
1.08 1.06 1.95% 1.31 1.24 5.52%
11.I-435 WB (from State Line to I-35)
1.06 1.02 3.54% 1.30 1.17 10.05%
12.I-435 EB (from State Line to 71 Hwy)
1.00 1.00 0.00% 1.40 1.39 1.09%
12.I-435 WB (from 71 Hwy to State Line)
1.15 1.12 1.85% 1.00 1.00 0.40%
Table 5. 2009 vs. 2010 TTI Comparisons (continued)
27

K a n s a s C i t y s C o u t
20
11C
on
ge
sti
on
In
de
x R
ep
ort
Segment and Freeway Description
2010 AM TTI
2009 AM TTI
% Change 2010 PM TTI
2009 PM TTI
% Change
13.I-435 NB (from 71 Hwy to 350 Hwy)
1.00 N/A 1.01 N/A
13.I-435 SB (from 350 Hwy to 71 Hwy)
1.01 N/A 1.00 N/A
14.I-435 NB (from 350 Hwy to I-70)
1.00 N/A 1.12 N/A
14.I-435 SB (from I-70 to 350 Hwy)
1.04 N/A 1.05 N/A
15.I-435 NB (from I-70 to the MO River)
No Detection as of January 201115.I-435 SB (from the MO River to I-70)
16.I-435 NB (from the MO River to I-35)
No Detection as of January 201116.I-435 SB (from I-35 to the MO River)
17.I-635 NB (from I-35 to I-70)
1.00 1.00 0.14% 1.02 1.04 -1.58%
17.I-635 SB (from I-70 to I-35)
1.01 1.00 0.63% 1.01 1.00 0.82%
18.I-635 NB (from I-70 to the MO River)
1.00 1.02 -1.54% 1.04 1.08 -4.06%
18.I-635 SB (from the MO River to I-70)
1.06 1.05 0.75% 1.07 1.06 0.55%
19.I-635 NB (from the MO River to I-29)
No Detection as of January 201119.I-635 SB (from I-29 to the MO River)
20.I-470 EB (from 71 Hwy to 291 Hwy)
No Detection as of January 201120.I-470 WB (from 291 Hwy to 71 Hwy)
Table 5. 2009 vs. 2010 TTI Comparisons (continued)
28

K a n s a s C i t y s C o u t C o n g e s t i o n i n d e x R e p o R t
20
11C
on
ge
sti
on
In
de
x R
ep
ort
Segment and Freeway Description
2010 AM TTI
2009 AM TTI
% Change 2010 PM TTI
2009 PM TTI
% Change
21.I-470 NB (from 291 Hwy to I-70)
No Detection as of January 201121.I-470 SB (from I-70 to 291 Hwy)
22.I-29 NB (from Parvin Rd to I-635)
No Detection as of January 201122.I-29 SB (from I-635 to Parvin Rd)
23.I-29 NB (from I-635 to 152 Hwy)
No Detection as of January 201123.I-29 SB (from 152 Hwy to I-635)
24.71 Hwy NB (from 58 Hwy to I-435)
No Detection as of January 201124.71 Hwy SB (from I-435 to 58 Hwy)
25.71 Hwy NB (from I-435 to I-70)
No Detection as of January 201125.71 Hwy SB (from I-70 to I-435)
Table 5. 2009 vs. 2010 TTI Comparisons (continued)
29

600 NE Colbern Rd, Lee’s Summit, Missouri 64086
816-347-2200 office 816-622-6550 fax
Related Documents