2011 Housing & Population Census Socio economic profile of Rodriguans Thursday 04 July 2013 Presented by: Ms. N. Gujadhur Statistician 1

2011 Housing & Population Census Socio economic profile of Rodriguans Thursday 04 July 2013 Presented by: Ms. N. Gujadhur Statistician 1.
Dec 13, 2015
Welcome message from author
This document is posted to help you gain knowledge. Please leave a comment to let me know what you think about it! Share it to your friends and learn new things together.
Transcript

2011 Housing & Population Census
Socio economic profile of Rodriguans
Thursday 04 July 2013
Presented by:Ms. N. Gujadhur
Statistician1
OverviewEducational level and literacyLabour force, employment and unemploymentHousehold and living arrangementsDisabilityMarital status of Rodriguans
2
Census 2011: Key statistics for a better understanding of Rodrigues
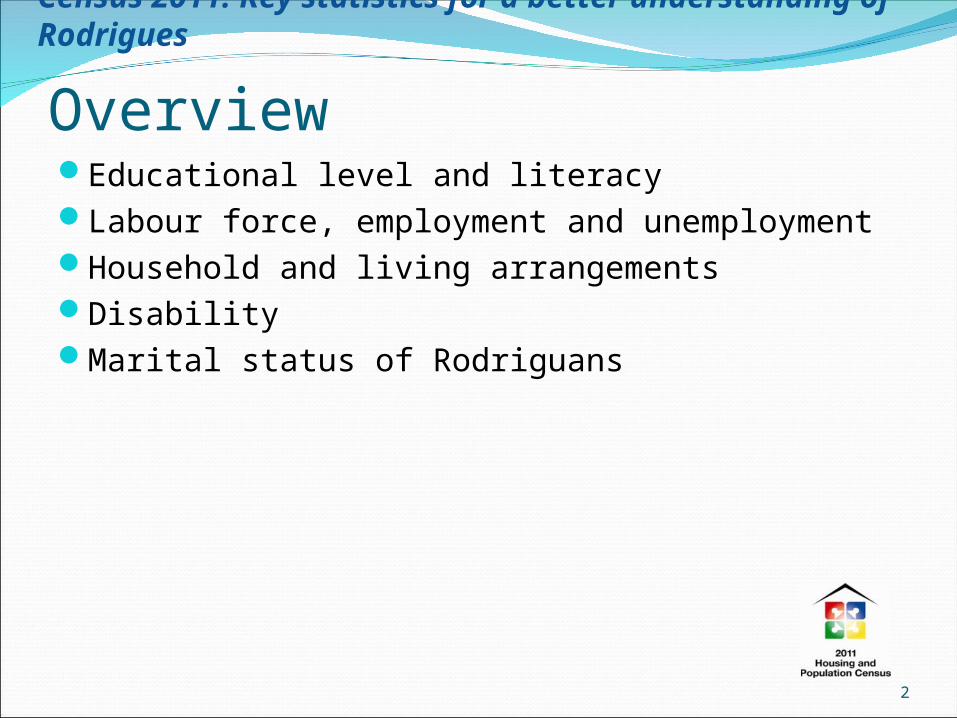
Literacy• A literate person=> can with understanding, both read and
write a short sentence in his/her every life.• Literacy rate for population 12+ has improved from 68% to 79%
• Women reported a higher literacy rate than men.• Men are bridging the gap.
3
Census 2011: Key statistics for a better understanding of Rodrigues

• Literacy Rate for population 12 years and over
has improved from 68% to 79%
Youth literacy rate => population 15-24 years
has improved from 82% to 95%
Literacy rate for population 12 years + will increase more.
4
Census 2011: Key statistics for a better understanding of Rodrigues
Educational attainment• Both men and women more qualified• There has been a significant increase in the proportion of
Rodriguans who hold a qualification at SC or higher.
• School Certificate or higher has doubled from 10% to 21%
• Tertiary level increased from 0.5% to 1.4%
5
Census 2011: Key statistics for a better understanding of Rodrigues

6
Census 2011: Key statistics for a better understanding of Rodrigues

Employment• From 2000 to 2011, more workers are having job in the Tertiary Sector • -
• In 2011, around 52% of employed persons were engaged in the tertiary sector, e.g. Hotels & restaurant; trade, transport & communication etc.
• The primary sector, i.e. Agriculture with 33% was almost the same.
• The secondary sector,e.g manufacturing sector decreased. 7
Census 2011: Key statistics for a better understanding of Rodrigues

8
Census 2011: Key statistics for a better understanding of Rodrigues

9
Census 2011: Key statistics for a better understanding of Rodrigues

Living arrangementsThe number of households increases but their average size decreases
From 2000 to 2011:-
(i) No. of Private Households increased from:
8,600 => 11,300 ~ increase of 30%
(ii) Household size decreased from:
4.2 => 3.6
(iii) No. of female headed household increased from:
1,780 => 3,210 ~ increase of 80%
10
Census 2011: Key statistics for a better understanding of Rodrigues

Living arrangements of Rodriguans have changed
HH comprising a couple +unmarried children =>51 % in 2000 is becoming less common in 2011 =>42% Persons living alone from 10 to 12%
11
Census 2011: Key statistics for a better understanding of Rodrigues

Living arrangements
One member HH and Composite HH are more common in Rodrigues Extended HHs almost same in both islands
12
Census 2011: Key statistics for a better understanding of Rodrigues

Disability In 2011, the number of persons with a disability almost doubled:
from: 1,150 to 2,112; In terms of proportion, the disabled went up from 3.2% to 5.2%
Proportion of people with a disability by age group, Island of Rodrigues,
2000 and 2011 Censuses
• Highest increase among the elderly aged 60 years and over.
13
Census 2011: Key statistics for a better understanding of Rodrigues
Disability
The most common types of disability reported at Census 2011 were: Walking or climbing stairs only - 30% Seeing even if wearing glasses-12% Walking/climbing stairs and manual activities -10%
14
Census 2011: Key statistics for a better understanding of Rodrigues

Marital condition deteriorates slightly
Consensually married/ Divorved/Separated and unmarried parent increased from 2000 to 2011.
Single – i.e. those who were never married decreased from 33% to 26%
15
Census 2011: Key statistics for a better understanding of Rodrigues

Marital status in Rodrigues compared with Mauritius -2011
In Rodrigues, 13% were consensually married as compared to 2% in Mauritius.
Unmarried parent were 4% as compared to 0.3% Divorced/Separated was higher in Rodrigues .
16
Census 2011: Key statistics for a better understanding of Rodrigues

17
Related Documents