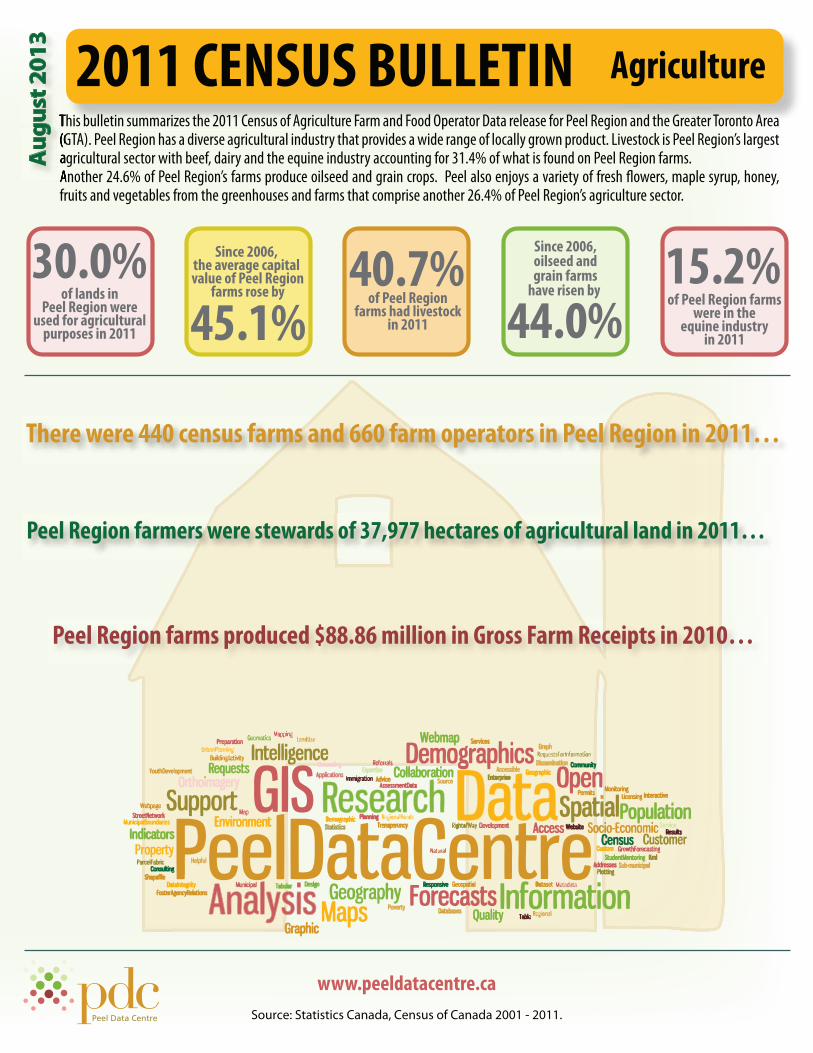
2011 CENSUS BULLETIN Agriculture This bulletin summarizes the 2011 Census of Agriculture Farm and Food Operator Data release for Peel Region and the Greater Toronto Area (GTA). Peel Region has a diverse agricultural industry that provides a wide range of locally grown product. Livestock is Peel Region’s largest agricultural sector with beef, dairy and the equine industry accounting for 31.4% of what is found on Peel Region farms. Another 24.6% of Peel Region’s farms produce oilseed and grain crops. Peel also enjoys a variety of fresh flowers, maple syrup, honey, fruits and vegetables from the greenhouses and farms that comprise another 26.4% of Peel Region’s agriculture sector. Since 2006, the average capital value of Peel Region farms rose by 45.1% of Peel Region farms had livestock in 2011 40.7% of lands in Peel Region were used for agricultural purposes in 2011 30.0% of Peel Region farms were in the equine industry in 2011 15.2% Peel Region farms produced $88.86 million in Gross Farm Receipts in 2010… Peel Region farmers were stewards of 37,977 hectares of agricultural land in 2011… There were 440 census farms and 660 farm operators in Peel Region in 2011… www.peeldatacentre.ca Since 2006, oilseed and grain farms have risen by 44.0% Source: Statistics Canada, Census of Canada 2001 - 2011. August 2013

Welcome message from author
This document is posted to help you gain knowledge. Please leave a comment to let me know what you think about it! Share it to your friends and learn new things together.
Transcript
2011 CENSUS BULLETIN AgricultureThis bulletin summarizes the 2011 Census of Agriculture Farm and Food Operator Data release for Peel Region and the Greater Toronto Area (GTA). Peel Region has a diverse agricultural industry that provides a wide range of locally grown product. Livestock is Peel Region’s largest agricultural sector with beef, dairy and the equine industry accounting for 31.4% of what is found on Peel Region farms. Another 24.6% of Peel Region’s farms produce oilseed and grain crops. Peel also enjoys a variety of fresh �owers, maple syrup, honey, fruits and vegetables from the greenhouses and farms that comprise another 26.4% of Peel Region’s agriculture sector.
Since 2006, the average capital value of Peel Region
farms rose by
45.1%of Peel Region
farms had livestockin 2011
40.7%of lands in
Peel Region wereused for agricultural
purposes in 2011
30.0%of Peel Region farms
were in theequine industry
in 2011
15.2%
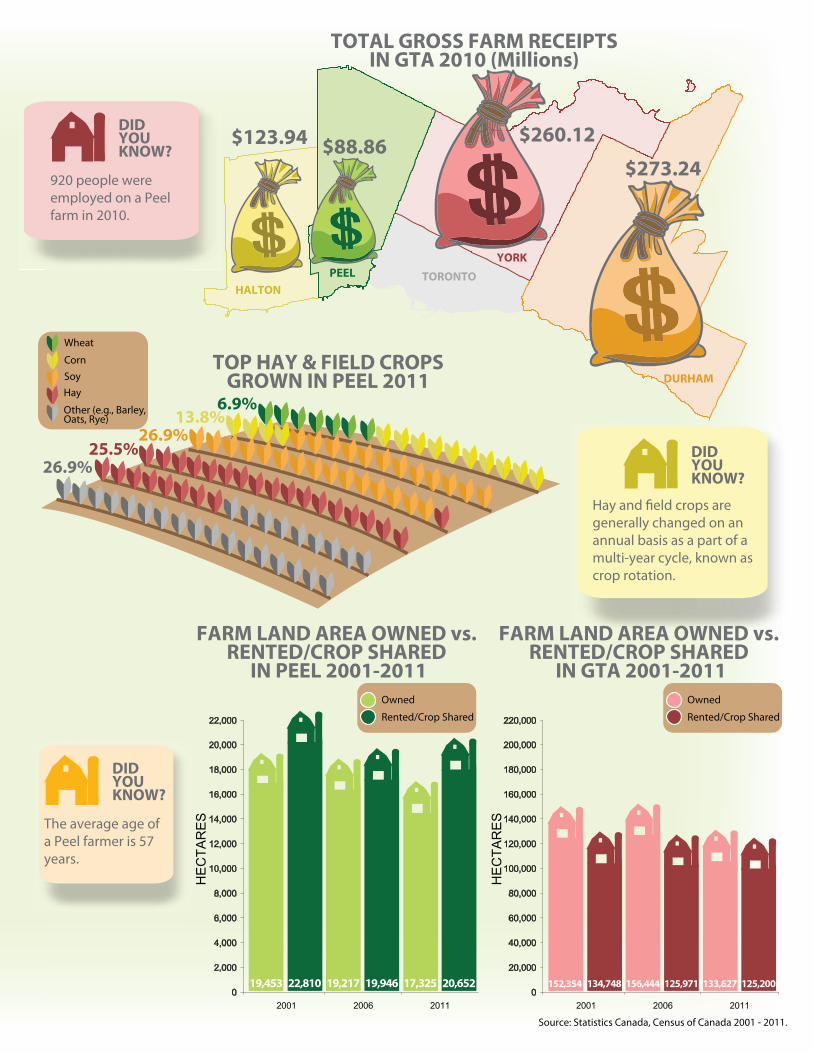
Peel Region farms produced $88.86 million in Gross Farm Receipts in 2010…
Peel Region farmers were stewards of 37,977 hectares of agricultural land in 2011…
There were 440 census farms and 660 farm operators in Peel Region in 2011…
www.peeldatacentre.ca
Since 2006,oilseed andgrain farms
have risen by
44.0%
Source: Statistics Canada, Census of Canada 2001 - 2011.
This bulletin summarizes the 2011 Census of Agriculture Farm and Food Operator Data release for Peel Region and the Greater Toronto Area This bulletin summarizes the 2011 Census of Agriculture Farm and Food Operator Data release for Peel Region and the Greater Toronto Area (GTA). Peel Region has a diverse agricultural industry that provides a wide range of locally grown product. Livestock is Peel Region’s largest agricultural sector with beef, dairy and the equine industry accounting for 31.4% of what is found on Peel Region farms. Another 24.6% of Peel Region’s farms produce oilseed and grain crops. Peel also enjoys a variety of fresh �owers, maple syrup, honey,
Aug
ust 2
013
Source: Statistics Canada, Census of Canada 2001 - 2011.
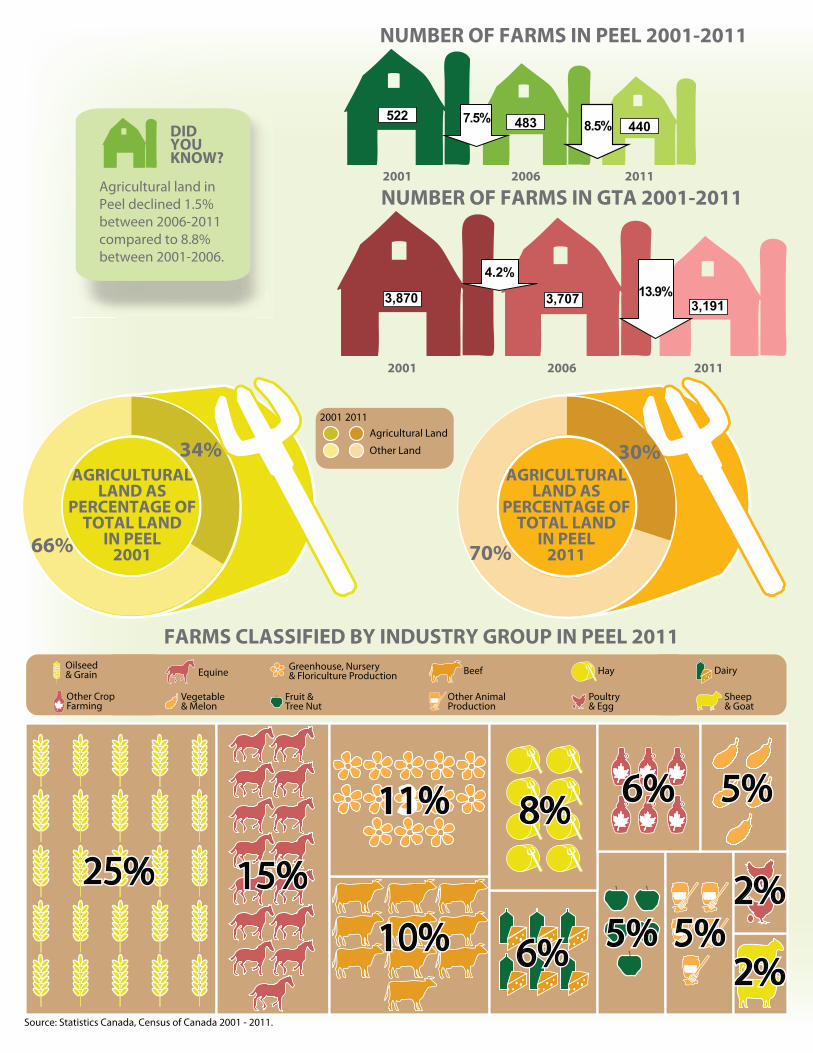
4.2%13.9%3,870 3,707 3,191
NUMBER OF FARMS IN GTA 2001-2011
2001 2006 2011
7.5% 8.5%
NUMBER OF FARMS IN PEEL 2001-2011
2001 2006 2011
522 483 440
FARMS CLASSIFIED BY INDUSTRY GROUP IN PEEL 2011
25% 2%
2%
5%6%
5%5%6%
8%
10%
13%
15%25% 2%
2%
5%6%
5%5%6%
8%
10%
11%
15%
Hay
Poultry & Egg
Dairy
Sheep& Goat
Equine
Vegetable& Melon
Greenhouse, Nursery& Floriculture Production
Fruit &Tree Nut
Beef
Other AnimalProduction
Oilseed & Grain
Other CropFarming
Agricultural land in Peel declined 1.5% between 2006-2011 compared to 8.8% between 2001-2006.
DIDYOUKNOW?
AGRICULTURALLAND AS
PERCENTAGE OFTOTAL LAND
IN PEEL2011
30%
70%
AGRICULTURALLAND AS
PERCENTAGE OFTOTAL LAND
IN PEEL2001
34%
66%
Agricultural Land2011
Other Land
2001
Source: Statistics Canada, Census of Canada 2001 - 2011.
6.9%13.8%
26.9%25.5%
26.9%
Hay
Wheat
CornSoy
Other (e.g., Barley, Oats, Rye)
TOP HAY & FIELD CROPSGROWN IN PEEL 2011
920 people were employed on a Peel farm in 2010.
DIDYOUKNOW?
Hay and �eld crops are generally changed on an annual basis as a part of a multi-year cycle, known as crop rotation.
DIDYOUKNOW?
The average age of a Peel farmer is 57 years.
DIDYOUKNOW?
0
2,000
4,000
6,000
8,000
10,000
12,000
14,000
16,000
18,000
20,000
22,000
2001 2006 2011
19,453 22,810 19,217
HE
CTA
RE
S
17,32519,946 20,652
Owned
Rented/Crop Shared
HE
CTA
RE
S
0
20,000
40,000
60,000
80,000
100,000
120,000
140,000
160,000
180,000
200,000
220,000
2001 2006 2011
152,354 134,748 156,444 133,627125,971 125,200
Owned
Rented/Crop Shared
FARM LAND AREA OWNED vs. RENTED/CROP SHARED
IN PEEL 2001-2011
FARM LAND AREA OWNED vs. RENTED/CROP SHARED
IN GTA 2001-2011
TORONTO
YORKPEEL
HALTON
DURHAM
TOTAL GROSS FARM RECEIPTSIN GTA 2010 (Millions)
$273.24$123.94 $88.86 $260.12
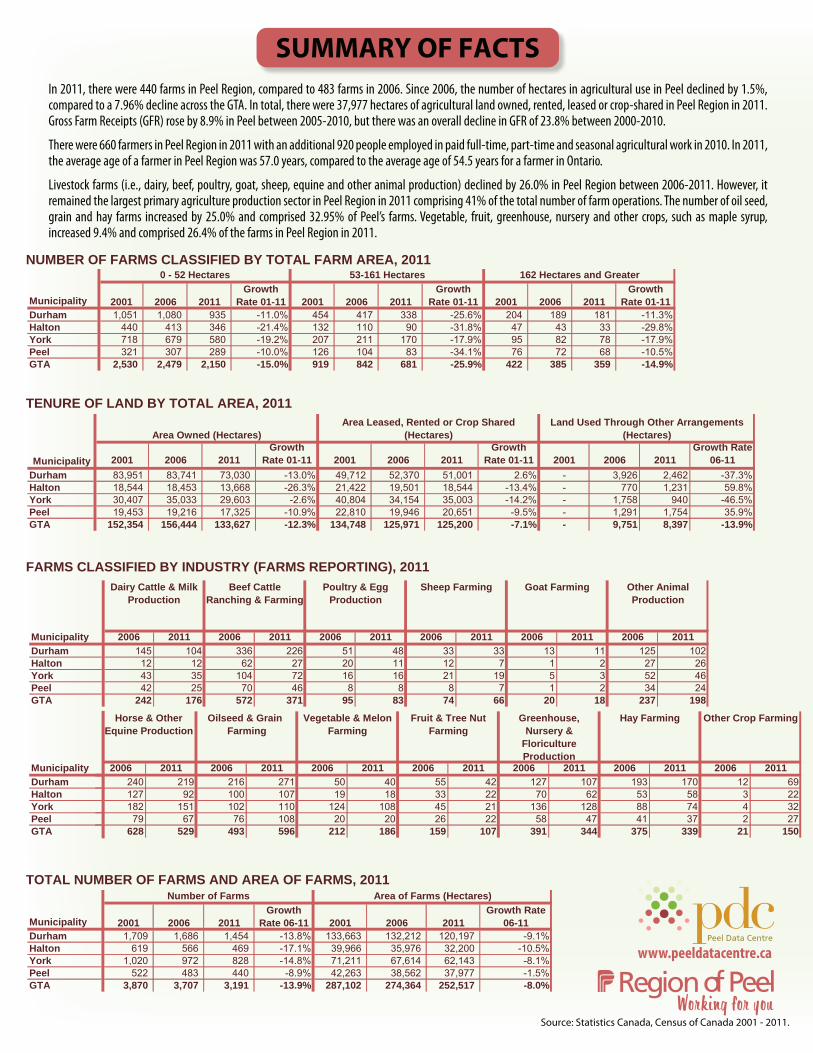
In 2011, there were 440 farms in Peel Region, compared to 483 farms in 2006. Since 2006, the number of hectares in agricultural use in Peel declined by 1.5%, compared to a 7.96% decline across the GTA. In total, there were 37,977 hectares of agricultural land owned, rented, leased or crop-shared in Peel Region in 2011. Gross Farm Receipts (GFR) rose by 8.9% in Peel between 2005-2010, but there was an overall decline in GFR of 23.8% between 2000-2010.
There were 660 farmers in Peel Region in 2011 with an additional 920 people employed in paid full-time, part-time and seasonal agricultural work in 2010. In 2011, the average age of a farmer in Peel Region was 57.0 years, compared to the average age of 54.5 years for a farmer in Ontario.
Livestock farms (i.e., dairy, beef, poultry, goat, sheep, equine and other animal production) declined by 26.0% in Peel Region between 2006-2011. However, it remained the largest primary agriculture production sector in Peel Region in 2011 comprising 41% of the total number of farm operations. The number of oil seed, grain and hay farms increased by 25.0% and comprised 32.95% of Peel’s farms. Vegetable, fruit, greenhouse, nursery and other crops, such as maple syrup, increased 9.4% and comprised 26.4% of the farms in Peel Region in 2011.
www.peeldatacentre.ca
Source: Statistics Canada, Census of Canada 2001 - 2011.
SUMMARY OF FACTS
NUMBER OF FARMS CLASSIFIED BY TOTAL FARM AREA, 2011
DurhamHaltonYorkPeelGTA
Municipality 2006 2011 2006 2011 2006 2011 2006 2011 2006 2011 2006 2011 2006 2011240 219 216 271 50 40 55 42 127 107 193 170 12 69127 92 100 107 19 18 33 22 70 62 53 58 3 22182 151 102 110 124 108 45 21 136 128 88 74 4 3279 67 76 108 20 20 26 22 58 47 41 37 2 27
628 529 493 596 212 186 159 107 391 344 375 339 21 150
Hay Farming Other Crop FarmingOilseed & Grain Farming
Vegetable & Melon Farming
Fruit & Tree Nut Farming
Greenhouse, Nursery &
Floriculture Production
Horse & Other Equine Production
2006 2011 2006 2011 2006 2011 2006 2011 2006 2011 2006 2011Durham 145 104 336 226 51 48 33 33 13 11 125 102Halton 12 12 62 27 20 11 12 7 1 2 27 26York 43 35 104 72 16 16 21 19 5 3 52 46Peel 42 25 70 46 8 8 8 7 1 2 34 24GTA 242 176 572 371 95 83 74 66 20 18 237 198
Municipality
Dairy Cattle & Milk Production
Beef Cattle Ranching & Farming
Poultry & Egg Production
Sheep Farming Goat Farming Other Animal Production
FARMS CLASSIFIED BY INDUSTRY (FARMS REPORTING), 2011
TOTAL NUMBER OF FARMS AND AREA OF FARMS, 2011
TENURE OF LAND BY TOTAL AREA, 2011
Durham 1,051 1,080 935 -11.0% 454 417 338 -25.6% 204 189 181 -11.3%Halton 440 413 346 -21.4% 132 110 90 -31.8% 47 43 33 -29.8%York 718 679 580 -19.2% 207 211 170 -17.9% 95 82 78 -17.9%Peel 321 307 289 -10.0% 126 104 83 -34.1% 76 72 68 -10.5%GTA 2,530 2,479 2,150 -15.0% 919 842 681 -25.9% 422 385 359 -14.9%
2011Growth
Rate 01-112011Growth
Rate 01-11 2001 2006Municipality
0 - 52 Hectares 53-161 Hectares 162 Hectares and Greater
2001 2006 2011Growth
Rate 01-11 2001 2006
2001 2006 2011Growth
Rate 01-11 2001 2006 2011Growth
Rate 01-11 2001 2006 2011Growth Rate
06-11Durham 83,951 83,741 73,030 -13.0% 49,712 52,370 51,001 2.6% - 3,926 2,462 -37.3%Halton 18,544 18,453 13,668 -26.3% 21,422 19,501 18,544 -13.4% - 770 1,231 59.8%York 30,407 35,033 29,603 -2.6% 40,804 34,154 35,003 -14.2% - 1,758 940 -46.5%Peel 19,453 19,216 17,325 -10.9% 22,810 19,946 20,651 -9.5% - 1,291 1,754 35.9%GTA 152,354 156,444 133,627 -12.3% 134,748 125,971 125,200 -7.1% - 9,751 8,397 -13.9%
Land Used Through Other Arrangements (Hectares)
Municipality
Area Owned (Hectares)Area Leased, Rented or Crop Shared
(Hectares)
Durham 1,709 1,686 1,454 -13.8% 133,663 132,212 120,197 -9.1%Halton 619 566 469 -17.1% 39,966 35,976 32,200 -10.5%York 1,020 972 828 -14.8% 71,211 67,614 62,143 -8.1%Peel 522 483 440 -8.9% 42,263 38,562 37,977 -1.5%GTA 3,870 3,707 3,191 -13.9% 287,102 274,364 252,517 -8.0%
Growth Rate 06-11Municipality
Number of Farms Area of Farms (Hectares)
2001 2006 2011Growth
Rate 06-11 2001 2006 2011
Related Documents