Alpine climate during the Holocene: a comparison between records of glaciers, lake sediments and solar activity SAMUEL U. NUSSBAUMER, 1,2,3 * FRIEDHELM STEINHILBER, 4 ** MATHIAS TRACHSEL, 1,2,5 *** PETRA BREITENMOSER, 1,2 JU ¨ RG BEER, 4 ALEX BLASS, 4,6 MARTIN GROSJEAN, 1,2 ALBERT HAFNER, 7 HANSPETER HOLZHAUSER, 2 HEINZ WANNER 1,2 and HEINZ J. ZUMBU ¨ HL 1,2 1 Institute of Geography, University of Bern, Bern, Switzerland 2 Oeschger Centre for Climate Change Research, University of Bern, Bern, Switzerland 3 Department of Geography, University of Zurich, Zu ¨ rich, Switzerland 4 Swiss Federal Institute of Aquatic Science and Technology, Surface Waters, Du ¨ bendorf, Switzerland 5 Bjerknes Centre for Climate Research, Bergen, Norway 6 Colenco Power Engineering, Wasserbau und Umwelt, Baden, Switzerland 7 Archa ¨ologischer Dienst des Kantons Bern, Bern, Switzerland Received 9 July 2010; Revised 1 February 2011; Accepted 2 February 2011 ABSTRACT: The European Alps are very sensitive and vulnerable to climate change. Recent improvements in Alpine glacier length records and climate reconstructions from annually laminated sediments of Alpine Lake Silvaplana give the opportunity to investigate the relationship between these two data sets of Alpine climate. Two different time frames are considered: the last 500–1000 years as well as the last 7400 years. First, we found good agreement between the two different climate archives during the past millennium: mass accumulation rates and biogenic silica concentration are largely in phase with the glacier length changes of Mer de Glace and Unterer Grindelwaldgletscher, and with the records of glacier length of Grosser Aletschgletscher and Gornergletscher. Secondly, the records are compared with temporally highly resolved data of solar activity. The Sun has had a major impact on the Alpine climate variations in the long term, i.e. several centuries to millennia. Solar activity varies with the Hallstatt periodicity of about 2000 years. Hallstatt minima are identified around 500, 2500 and 5000 a. Around these times grand solar minima (such as the Maunder Minimum) occurred in clusters coinciding with colder Alpine climate expressed by glacier advances. During the Hallstatt maxima around 0, 2000 and 4500 a, the Alpine glaciers generally retreated, indicating a warmer climate. This is supported by archaeological findings at Schnidejoch, a transalpine pass in Switzerland that was only accessible when glaciers had retreated. On shorter timescales, however, the influence of the Sun cannot be as easily detected in Alpine climate change, indicating that in addition to solar forcing, volcanic influence and internal climate variations have played an important role. Copyright # 2011 John Wiley & Sons, Ltd. KEYWORDS: Alpine climate; glacier fluctuations; Holocene; European Alps; lake sediments; solar activity. Introduction Improved understanding of long-term, natural climate varia- bility on different spatial and temporal scales is crucial to put the recent climate change in a longer-term context (e.g. Jones and Mann, 2004; Osborn and Briffa, 2006). For example, it is important to know whether comparably warm periods occurred earlier during the Holocene and what was forcing these changes (see Wanner et al., 2008, for a comprehensive overview of different archives and forcing factors). Because glaciers are considered important climate indicators (Lemke et al., 2007) understanding of past and present glacier variations is a key task for evaluating current climate change. According to Denton and Karle ´n (1973), the Holocene experienced alternating intervals with differing intensity of glacier expansion and recession, the strongest advances occurring around 200–330, 2800 and 5300 cal a BP in North America and northern Europe. Other strong glacier advances possibly occurred around 1400 and 3800 cal a BP (Wanner et al., 2008). Past treeline data from the eastern Alps, as well as radiocarbon and dendrochronologically dated wood fragments from glacier forelands in the Swiss and Austrian Alps, point to persistent periods during the Holocene during which glaciers were even smaller than during the late 20th century (Ivy-Ochs et al., 2009). Other archives such as pollen and plant macrofossils (e.g. Bjune and Birks, 2008) and lake sediments (e.g. Nesje, 2009) also reveal decadal- to centennial-scale climate variations during the Holocene. The question remains whether these climate variations have been triggered by solar variability, volcanic activity or internal variability of the climate system (Bond et al., 2001; Wanner et al., 2008). Here we investigate whether the influence of solar activity was a determining forcing factor on regional climate. Among the different archives reflecting past climate variations, glacier records and lake sediments from the Alps have proven potential; Alpine glaciers are highly sensitive indicators of climate changes and their fluctuations directly reflect the climatic conditions during the Holocene (Holzhauser, 2007). Lake sediments, on the other hand, are valuable palaeoclimate archives, but they are underrepresented in the data series used for quantitative regional, global or inter-hemispherical com- parisons, and for quantitative, annually resolved multi-proxy climate reconstructions (Grosjean et al., 2009). The climate of the Earth is determined to a large extent by the radiative energy it receives from the Sun and its latitudinal distribution (Beer et al., 2008; Gray et al., 2010). Due to orbital forcing, the latitudinal distribution of solar energy has varied on long timescales, i.e. on several 10,000 years (known as Milankovitch cycles; Laskar et al., 2004). It is widely accepted that changes in orbital forcing have been responsible for the regular changes between glacials and interglacials (e.g. Jansen et al., 2007; Clark et al., 2009). Compared with the timescales of the orbital forcing, the variation of energy emitted by the Sun takes place on shorter JOURNAL OF QUATERNARY SCIENCE (2011) 26(7) 703–713 ISSN 0267-8179. DOI: 10.1002/jqs.1495 Copyright ß 2011 John Wiley & Sons, Ltd. *Correspondence: S. U. Nussbaumer, 3 Department of Geography, as above. E-mail: [email protected] **Correspondence: F. Steinhilber, as above. E-mail: [email protected] ***Correspondence: M. Trachsel, 5 Bjerknes Centre for Climate Research, as above. E-mail: [email protected]

Welcome message from author
This document is posted to help you gain knowledge. Please leave a comment to let me know what you think about it! Share it to your friends and learn new things together.
Transcript
Alpine climate during the Holocene: a comparisonbetween records of glaciers, lake sediments and solaractivity
SAMUEL U. NUSSBAUMER,1,2,3* FRIEDHELM STEINHILBER,4** MATHIAS TRACHSEL,1,2,5*** PETRA BREITENMOSER,1,2
JURG BEER,4 ALEX BLASS,4,6 MARTIN GROSJEAN,1,2 ALBERT HAFNER,7 HANSPETER HOLZHAUSER,2
HEINZ WANNER1,2 and HEINZ J. ZUMBUHL1,21Institute of Geography, University of Bern, Bern, Switzerland2Oeschger Centre for Climate Change Research, University of Bern, Bern, Switzerland3Department of Geography, University of Zurich, Zurich, Switzerland4Swiss Federal Institute of Aquatic Science and Technology, Surface Waters, Dubendorf, Switzerland5Bjerknes Centre for Climate Research, Bergen, Norway6Colenco Power Engineering, Wasserbau und Umwelt, Baden, Switzerland7Archaologischer Dienst des Kantons Bern, Bern, Switzerland
Received 9 July 2010; Revised 1 February 2011; Accepted 2 February 2011
ABSTRACT: The European Alps are very sensitive and vulnerable to climate change. Recent improvements in Alpine glacier lengthrecords and climate reconstructions from annually laminated sediments of Alpine Lake Silvaplana give the opportunity to investigatethe relationship between these two data sets of Alpine climate. Two different time frames are considered: the last 500–1000 years aswell as the last 7400 years. First, we found good agreement between the two different climate archives during the past millennium:mass accumulation rates and biogenic silica concentration are largely in phase with the glacier length changes of Mer de Glace andUnterer Grindelwaldgletscher, and with the records of glacier length of Grosser Aletschgletscher and Gornergletscher. Secondly, therecords are compared with temporally highly resolved data of solar activity. The Sun has had a major impact on the Alpine climatevariations in the long term, i.e. several centuries to millennia. Solar activity varies with the Hallstatt periodicity of about 2000 years.Hallstatt minima are identified around 500, 2500 and 5000 a. Around these times grand solar minima (such as the MaunderMinimum) occurred in clusters coinciding with colder Alpine climate expressed by glacier advances. During the Hallstattmaxima around 0, 2000 and 4500 a, the Alpine glaciers generally retreated, indicating a warmer climate. This is supported byarchaeological findings at Schnidejoch, a transalpine pass in Switzerland that was only accessible when glaciers had retreated. Onshorter timescales, however, the influence of the Sun cannot be as easily detected in Alpine climate change, indicating that in additionto solar forcing, volcanic influence and internal climate variations have played an important role. Copyright # 2011 John Wiley &Sons, Ltd.
KEYWORDS: Alpine climate; glacier fluctuations; Holocene; European Alps; lake sediments; solar activity.
Introduction
Improved understanding of long-term, natural climate varia-bility on different spatial and temporal scales is crucial to putthe recent climate change in a longer-term context (e.g. Jonesand Mann, 2004; Osborn and Briffa, 2006). For example, it isimportant to know whether comparably warm periodsoccurred earlier during the Holocene and what was forcingthese changes (see Wanner et al., 2008, for a comprehensiveoverview of different archives and forcing factors).Because glaciers are considered important climate indicators
(Lemke et al., 2007) understanding of past and present glaciervariations is a key task for evaluating current climate change.According to Denton and Karlen (1973), the Holoceneexperienced alternating intervals with differing intensity ofglacier expansion and recession, the strongest advancesoccurring around 200–330, 2800 and 5300 cal a BP in NorthAmerica and northern Europe. Other strong glacier advancespossibly occurred around 1400 and 3800 cal a BP (Wanneret al., 2008). Past treeline data from the eastern Alps, as well asradiocarbon and dendrochronologically dated wood fragmentsfrom glacier forelands in the Swiss and Austrian Alps, pointto persistent periods during the Holocene during whichglaciers were even smaller than during the late 20th century
(Ivy-Ochs et al., 2009). Other archives such as pollen and plantmacrofossils (e.g. Bjune and Birks, 2008) and lake sediments(e.g. Nesje, 2009) also reveal decadal- to centennial-scaleclimate variations during the Holocene.The question remains whether these climate variations have
been triggered by solar variability, volcanic activity or internalvariability of the climate system (Bond et al., 2001; Wanneret al., 2008). Here we investigate whether the influence of solaractivity was a determining forcing factor on regional climate.Among the different archives reflecting past climate variations,glacier records and lake sediments from the Alps have provenpotential; Alpine glaciers are highly sensitive indicators ofclimate changes and their fluctuations directly reflect theclimatic conditions during the Holocene (Holzhauser, 2007).Lake sediments, on the other hand, are valuable palaeoclimatearchives, but they are underrepresented in the data series usedfor quantitative regional, global or inter-hemispherical com-parisons, and for quantitative, annually resolved multi-proxyclimate reconstructions (Grosjean et al., 2009).The climate of the Earth is determined to a large extent by the
radiative energy it receives from the Sun and its latitudinaldistribution (Beer et al., 2008; Gray et al., 2010). Due to orbitalforcing, the latitudinal distribution of solar energy has varied onlong timescales, i.e. on several 10,000 years (known asMilankovitch cycles; Laskar et al., 2004). It is widely acceptedthat changes in orbital forcing have been responsible for theregular changes between glacials and interglacials (e.g. Jansenet al., 2007; Clark et al., 2009).Compared with the timescales of the orbital forcing, the
variation of energy emitted by the Sun takes place on shorter
JOURNAL OF QUATERNARY SCIENCE (2011) 26(7) 703–713 ISSN 0267-8179. DOI: 10.1002/jqs.1495
Copyright � 2011 John Wiley & Sons, Ltd.
*Correspondence: S. U. Nussbaumer, 3Department of Geography, as above.E-mail: [email protected]**Correspondence: F. Steinhilber, as above.E-mail: [email protected]***Correspondence: M. Trachsel, 5Bjerknes Centre for Climate Research, as above.E-mail: [email protected]
timescales, i.e. years to millennia. The measure describing theamount of incoming solar electromagnetic energy at the meanSun–Earth distance is called total solar irradiance (TSI). Theaverage solar activity during the past 50 years has been high(high TSI values). In the past, however, TSI has been very lowduring some periods, called grand solar minima. The influenceof the Sun on the Earth’s climate shows up in several climatereconstructions from all over the world on different timescales(e.g. Magny, 1993; van Geel et al., 2000; Bond et al., 2001;Wang et al., 2005a; Eichler et al., 2009; Nicolussi et al., 2009) aswell as in modelling studies (e.g. Cubasch and Voss, 2000;Renssen et al., 2005;Wagner et al., 2007; Spangehl et al., 2010).One example is the Little Ice Age (LIA), a period with
generally cold climate conditions, lasting from the Late MiddleAges until the mid-19th century in the Alpine region (Grove,2004). This time period coincides with a cluster of grand solarminima. One of those grand solar minima is the well-knownMaunder Minimum in the years 1645–1715 (Eddy, 1976).Compared with themost recent 50 years, solar activity was verylow during the Maunder Minimum, characterized by an almostcomplete absence in sunspots, and lower TSI values (Wanget al., 2005b; Krivova et al., 2007; Steinhilber et al., 2009).Two time frames are considered within this study: the last
500–1000 years and the last 7400 years. Hence, different typesof climate archives are used, with the quality and temporalresolution of the data varying. Information and methodologicalconsiderations on the corresponding archives and climateindicators are given in the next section.
Data and methods
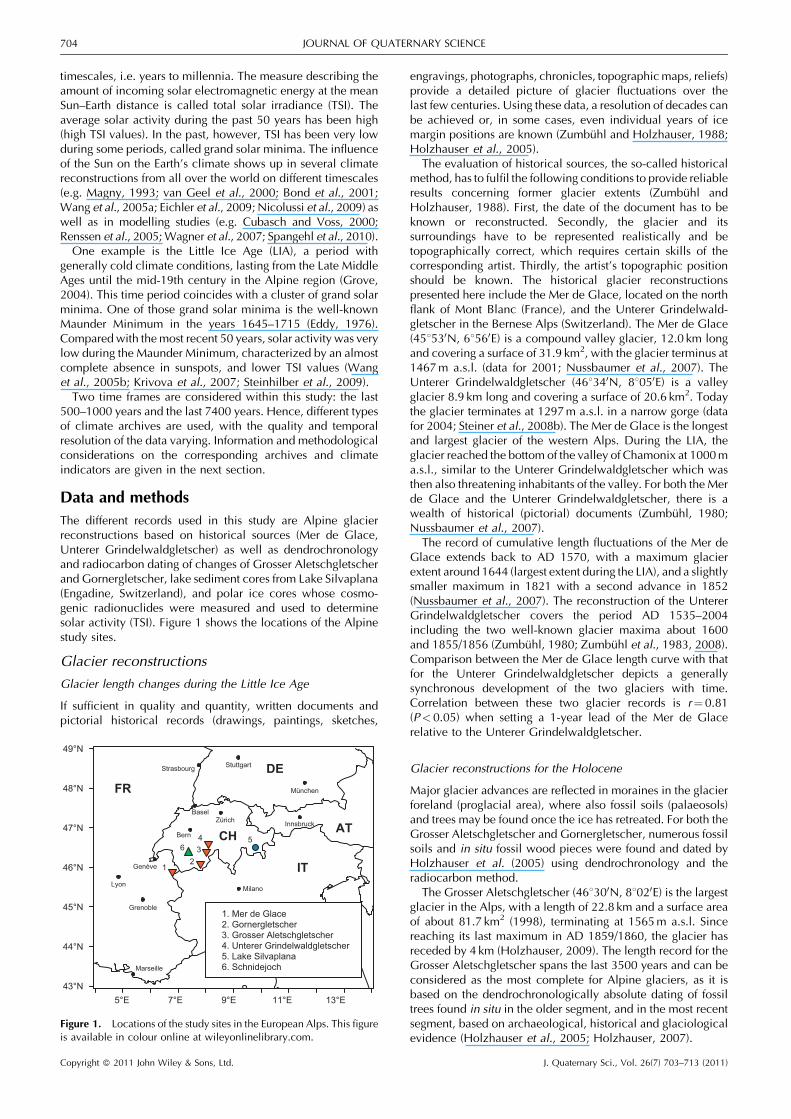
The different records used in this study are Alpine glacierreconstructions based on historical sources (Mer de Glace,Unterer Grindelwaldgletscher) as well as dendrochronologyand radiocarbon dating of changes of Grosser Aletschgletscherand Gornergletscher, lake sediment cores from Lake Silvaplana(Engadine, Switzerland), and polar ice cores whose cosmo-genic radionuclides were measured and used to determinesolar activity (TSI). Figure 1 shows the locations of the Alpinestudy sites.
Glacier reconstructions
Glacier length changes during the Little Ice Age
If sufficient in quality and quantity, written documents andpictorial historical records (drawings, paintings, sketches,
engravings, photographs, chronicles, topographicmaps, reliefs)provide a detailed picture of glacier fluctuations over thelast few centuries. Using these data, a resolution of decades canbe achieved or, in some cases, even individual years of icemargin positions are known (Zumbuhl and Holzhauser, 1988;Holzhauser et al., 2005).
The evaluation of historical sources, the so-called historicalmethod, has to fulfil the following conditions to provide reliableresults concerning former glacier extents (Zumbuhl andHolzhauser, 1988). First, the date of the document has to beknown or reconstructed. Secondly, the glacier and itssurroundings have to be represented realistically and betopographically correct, which requires certain skills of thecorresponding artist. Thirdly, the artist’s topographic positionshould be known. The historical glacier reconstructionspresented here include the Mer de Glace, located on the northflank of Mont Blanc (France), and the Unterer Grindelwald-gletscher in the Bernese Alps (Switzerland). The Mer de Glace(458530N, 68560E) is a compound valley glacier, 12.0 km longand covering a surface of 31.9 km2, with the glacier terminus at1467m a.s.l. (data for 2001; Nussbaumer et al., 2007). TheUnterer Grindelwaldgletscher (468340N, 88050E) is a valleyglacier 8.9 km long and covering a surface of 20.6 km2. Todaythe glacier terminates at 1297m a.s.l. in a narrow gorge (datafor 2004; Steiner et al., 2008b). The Mer de Glace is the longestand largest glacier of the western Alps. During the LIA, theglacier reached the bottom of the valley of Chamonix at 1000ma.s.l., similar to the Unterer Grindelwaldgletscher which wasthen also threatening inhabitants of the valley. For both the Merde Glace and the Unterer Grindelwaldgletscher, there is awealth of historical (pictorial) documents (Zumbuhl, 1980;Nussbaumer et al., 2007).
The record of cumulative length fluctuations of the Mer deGlace extends back to AD 1570, with a maximum glacierextent around 1644 (largest extent during the LIA), and a slightlysmaller maximum in 1821 with a second advance in 1852(Nussbaumer et al., 2007). The reconstruction of the UntererGrindelwaldgletscher covers the period AD 1535–2004including the two well-known glacier maxima about 1600and 1855/1856 (Zumbuhl, 1980; Zumbuhl et al., 1983, 2008).Comparison between the Mer de Glace length curve with thatfor the Unterer Grindelwaldgletscher depicts a generallysynchronous development of the two glaciers with time.Correlation between these two glacier records is r¼ 0.81(P< 0.05) when setting a 1-year lead of the Mer de Glacerelative to the Unterer Grindelwaldgletscher.
Glacier reconstructions for the Holocene
Major glacier advances are reflected in moraines in the glacierforeland (proglacial area), where also fossil soils (palaeosols)and trees may be found once the ice has retreated. For both theGrosser Aletschgletscher and Gornergletscher, numerous fossilsoils and in situ fossil wood pieces were found and dated byHolzhauser et al. (2005) using dendrochronology and theradiocarbon method.
The Grosser Aletschgletscher (468300N, 88020E) is the largestglacier in the Alps, with a length of 22.8 km and a surface areaof about 81.7 km2 (1998), terminating at 1565m a.s.l. Sincereaching its last maximum in AD 1859/1860, the glacier hasreceded by 4 km (Holzhauser, 2009). The length record for theGrosser Aletschgletscher spans the last 3500 years and can beconsidered as the most complete for Alpine glaciers, as it isbased on the dendrochronologically absolute dating of fossiltrees found in situ in the older segment, and in the most recentsegment, based on archaeological, historical and glaciologicalevidence (Holzhauser et al., 2005; Holzhauser, 2007).
5°E 7°E 9°E 11°E 13°E43°N
44°N
45°N
46°N
47°N
48°N
49°N
12
34 5
6
Strasbourg
Basel
Bern
Zürich
Genève
Lyon
Grenoble
Marseille
Genova
Milano
Innsbruck
München
Stuttgart
FR
CH
IT
AT
DE
1. Mer de Glace2. Gornergletscher3. Grosser Aletschgletscher4. Unterer Grindelwaldgletscher5. Lake Silvaplana6. Schnidejoch
Figure 1. Locations of the study sites in the European Alps. This figureis available in colour online at wileyonlinelibrary.com.
Copyright � 2011 John Wiley & Sons, Ltd. J. Quaternary Sci., Vol. 26(7) 703–713 (2011)
704 JOURNAL OF QUATERNARY SCIENCE
Gornergletscher (458580N, 78480E), the second largest glacierin the Alps, covers a surface of about 50 km2 and has a length of12.3 km, with the tongue at 2240m a.s.l. (Holzhauser, 2010).The glacier reached its maximum extension in AD 1859 as thethird of three peaks during the LIA, similar to GrosserAletschgletscher. The glacier’s history is very well documentedby written and pictorial documents, but in particular also bydendrochronological dating of fossil trees from the glacierforeland (Holzhauser et al., 2005; Holzhauser, 2007, 2010).A third glacier curve spanning the last 7400 years is based on
findings from dendrochronology and radiocarbon dating fromdifferent glacier forelands in the Swiss Alps (Holzhauser, 2007).Note that these three long-term glacier reconstructions have alower temporal resolution (decadal to centennial scale) thanthe curves solely based on historical documents for the Mer deGlace and Unterer Grindelwaldgletscher.
Lake Silvaplana
Sediment analysis
Biogenic silica and mass accumulation records from theannually laminated, proglacial Lake Silvaplana (468270N,98480E; 1791m a.s.l.) are available back to the year AD1177 (Trachsel et al., 2010). The chronologies rely on 210Pb,137Cs and on varve counts corroborated by known flood events(Caviezel, 2007).The annual sediment mass accumulation rate (MAR) was
calculated from varve thickness accounting for water andorganic matter content following Berner (1971) and Niessenet al. (1992). For further details see Blass et al. (2007b).Biogenic silica (bSi) concentration in the sediment wasdetermined using wet alkaline leaching (Mortlock and Froelich,1989) and inductively coupled plasma optical emissionspectrometry (ICP-OES). Data were corrected for lithogenicSi according to Ohlendorf and Sturm (2007). bSi is an indicatorof primary production (silicious algae) in the lake and can beinfluenced by both temperature and nutrient input. In LakeSilvaplana, nutrient level is stable prior to AD 1950 (Bigleret al., 2007).
Comparison with glacier records
Since changes in glacier extent only influence sedimentation onmulti-decadal timescales (e.g. Leonard, 1997) we applied a 50-year loess filter (locally weighted smooth regression) to theMAR prior to comparison. To compare the one-dimensionalchanges in glacier length with MAR influenced by the sub-glacial area (two-dimensional), we applied the square root tothe MAR signal. Fifty-year loess-filtered MAR and bSiconcentration were then compared with the glacier reconstruc-tions based on historical data from the western Alps (Zumbuhl,1980; Nussbaumer et al., 2007) back to AD 1535/1570. Notethat glacier length is an indirect, filtered and delayed responseto climate change (Oerlemans, 2001).For Lake Silvaplana a larger glacier extent in the catchment is
expected to result in increased MAR (Leemann and Niessen,1994; Ohlendorf et al., 1997; Blass et al., 2007b). In general,bSi concentration is expected to show a negative correlationwith glacier fluctuations because bSi is diluted (‘matrix effect’)by increased sedimentation during large glacier extents (e.g.Nesje et al., 2001). bSi concentration is heavily affected byhuman-induced eutrophication after 1950 (Blass et al., 2007a).We therefore restrict the comparison of bSi with glacier extentsto the period prior to 1950.Back to AD 1177 we compare the sediment-derived records
with the length reconstructions of two large Alpine glaciers(Grosser Aletschgletscher and Gornergletscher; Holzhauser
et al., 2005). As these two glaciers have an increased responsetime and smoothed fluctuations, we apply a 100-year loess filterto the sediment-derived data (MAR, bSi) prior to comparison.
Solar activity
The amount of incoming solar electromagnetic energymeasured at 1 astronomical unit (mean Sun–Earth distance)outside of the Earth’s atmosphere is termed TSI. We use thereconstruction of TSI mainly based on the cosmogenicradionuclide 10Be measured in the GRIP ice core, Greenland(Steinhilber et al., 2009). To understand how TSI has beendetermined we briefly give a summary of how TSI wasreconstructed.Cosmogenic radionuclides such as 10Be and 14C are
produced by nuclear reactions between cosmic ray particlesand atmospheric gases. Before the cosmic ray particles reachthe Earth’s atmosphere they are modulated by the variable solaractivity and the geomagnetic field. After their production in theatmosphere 10Be and 14C are transported to the ground wherethey can be measured in polar ice (10Be) and trees (14C). 10Be isalmost immediately (within a few years) transported to theground and therefore directly reflects production changes dueto solar and geomagnetic activity. In contrast to 10Be, 14Coxidizes to CO2 and is involved in the carbon cycle, includingexchanges between atmosphere, biosphere and the oceans.Thus, the 14C signal measured in tree rings is a damped andshifted signal, implying that neither the 14C signal nor thedetrended 14C signal can be directly used as a measure of solaractivity. Even if the effect of the carbon cycle is removed fromthe 14C signal the strong effect of the geomagnetic field has tobe removed.The geomagnetic field also has to be removed from 10Be.
Besides the geomagnetic and solar components climatic effectsare found in the 10Be signal. To remove this high-frequencyclimatic noise, a 40-year low-pass filter was applied. The 10Besignal has then been combined with a reconstruction of thegeomagnetic field intensity (Yang et al., 2000) and productioncalculations (Masarik and Beer, 1999), from which the strengthof the open solar magnetic field could be determined(Steinhilber et al., 2010). The open solar magnetic fieldcorrelates with TSI during the 11-year solar cycle minima(Frohlich, 2009), which enabled Steinhilber et al. (2009) toobtain TSI values from the 10Be record. The application of a 40-year low-pass filter implies that the reconstruction can be usedto study the solar–terrestrial relationship in the long term (multi-decadal and longer) but not in the short term (annual). Thereconstruction covers the past 9300 years and it is thereforewell suited to search for the solar fingerprint in the Alpineclimate reconstructions during the Holocene.Note that in the following text the term ‘solar activity’ is used
with the same meaning as the term ‘TSI’. Long-term changes inTSI and their influence on climate are then analysed for the last500 years and for the past 7400 years.
Records of glaciers, lake sediments andsolar activity during the last millennium
Results
We first compared the MAR from Lake Silvaplana with theglacier length record of nearby Tschierva glacier (Vadret daTschierva) available back to AD 1934, to examine if the glacierextent correlates with the MAR in a proglacial lake. In additionto the visual agreement (Fig. 2) we find a correlation of r¼ 0.68(P¼ 3� 10�4). MAR smoothed with a 50-year low-pass filter(loess) yielded the best optical and statistical (r¼ 0.97,P¼ 0.002) agreement between the two records. We therefore
Copyright � 2011 John Wiley & Sons, Ltd. J. Quaternary Sci., Vol. 26(7) 703–713 (2011)
ALPINE CLIMATE DURING THE HOLOCENE 705
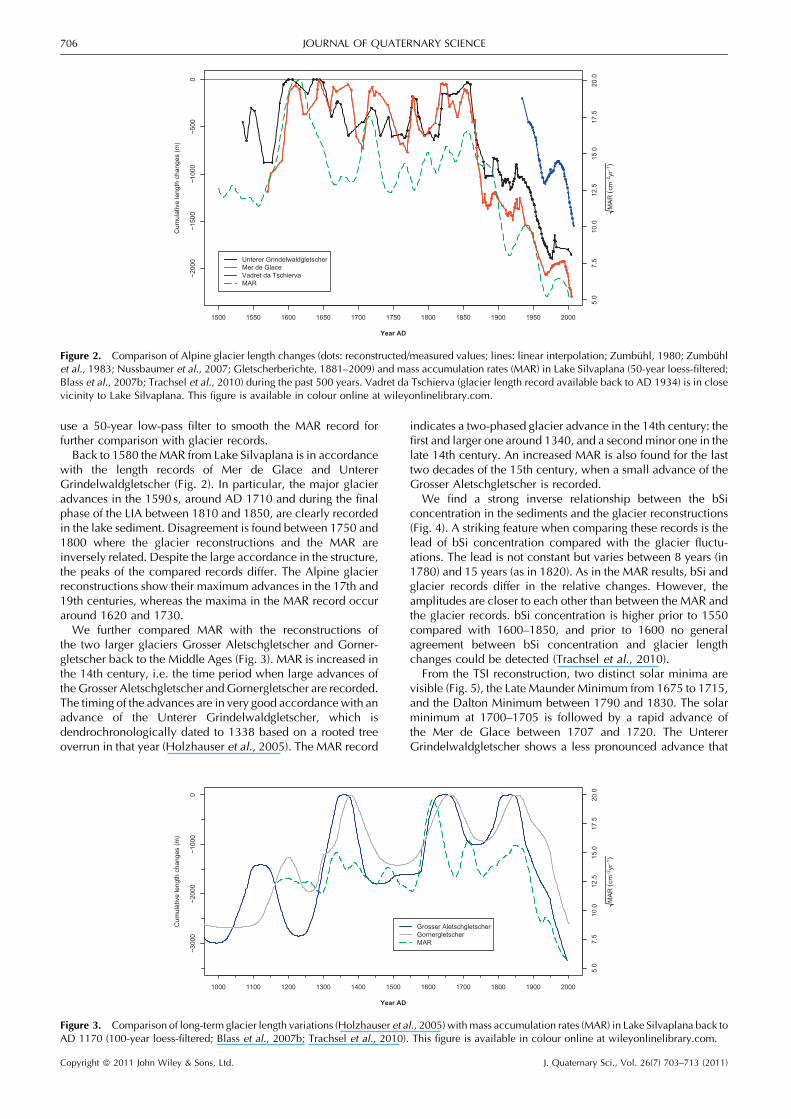
use a 50-year low-pass filter to smooth the MAR record forfurther comparison with glacier records.Back to 1580 the MAR from Lake Silvaplana is in accordance
with the length records of Mer de Glace and UntererGrindelwaldgletscher (Fig. 2). In particular, the major glacieradvances in the 1590 s, around AD 1710 and during the finalphase of the LIA between 1810 and 1850, are clearly recordedin the lake sediment. Disagreement is found between 1750 and1800 where the glacier reconstructions and the MAR areinversely related. Despite the large accordance in the structure,the peaks of the compared records differ. The Alpine glacierreconstructions show their maximum advances in the 17th and19th centuries, whereas the maxima in the MAR record occuraround 1620 and 1730.We further compared MAR with the reconstructions of
the two larger glaciers Grosser Aletschgletscher and Gorner-gletscher back to the Middle Ages (Fig. 3). MAR is increased inthe 14th century, i.e. the time period when large advances ofthe Grosser Aletschgletscher andGornergletscher are recorded.The timing of the advances are in very good accordancewith anadvance of the Unterer Grindelwaldgletscher, which isdendrochronologically dated to 1338 based on a rooted treeoverrun in that year (Holzhauser et al., 2005). The MAR record
indicates a two-phased glacier advance in the 14th century: thefirst and larger one around 1340, and a second minor one in thelate 14th century. An increased MAR is also found for the lasttwo decades of the 15th century, when a small advance of theGrosser Aletschgletscher is recorded.
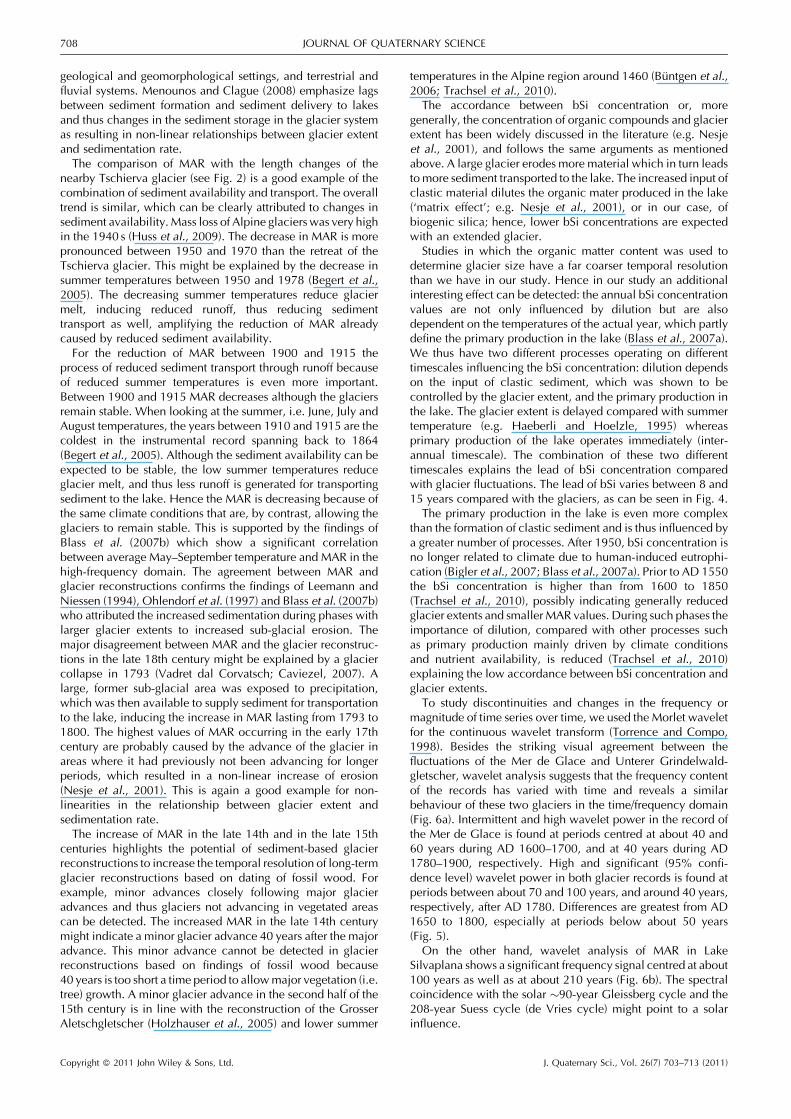
We find a strong inverse relationship between the bSiconcentration in the sediments and the glacier reconstructions(Fig. 4). A striking feature when comparing these records is thelead of bSi concentration compared with the glacier fluctu-ations. The lead is not constant but varies between 8 years (in1780) and 15 years (as in 1820). As in the MAR results, bSi andglacier records differ in the relative changes. However, theamplitudes are closer to each other than between the MAR andthe glacier records. bSi concentration is higher prior to 1550compared with 1600–1850, and prior to 1600 no generalagreement between bSi concentration and glacier lengthchanges could be detected (Trachsel et al., 2010).
From the TSI reconstruction, two distinct solar minima arevisible (Fig. 5), the Late Maunder Minimum from 1675 to 1715,and the Dalton Minimum between 1790 and 1830. The solarminimum at 1700–1705 is followed by a rapid advance ofthe Mer de Glace between 1707 and 1720. The UntererGrindelwaldgletscher shows a less pronounced advance that
−200
0−1
500
−100
0−5
000
Unterer GrindelwaldgletscherMer de GlaceVadret da TschiervaMAR
1500 1550 1600 1650 1700 1750 1800 1850 1900 1950 2000
5.0
7.5
10.0
12.5
15.0
17.5
20.0
Cum
ulat
ive
leng
th c
hang
es (m
)
Year AD
MA
R(c
m−2
yr−1)
Figure 2. Comparison of Alpine glacier length changes (dots: reconstructed/measured values; lines: linear interpolation; Zumbuhl, 1980; Zumbuhlet al., 1983; Nussbaumer et al., 2007; Gletscherberichte, 1881–2009) and mass accumulation rates (MAR) in Lake Silvaplana (50-year loess-filtered;Blass et al., 2007b; Trachsel et al., 2010) during the past 500 years. Vadret da Tschierva (glacier length record available back to AD 1934) is in closevicinity to Lake Silvaplana. This figure is available in colour online at wileyonlinelibrary.com.
−300
0−2
000
−100
00
Grosser AletschgletscherGornergletscherMAR
1000 1100 1200 1300 1400 1500 1600 1700 1800 1900 2000
5.0
7.5
10.0
12.5
15.0
17.5
20.0
Cum
ulat
ive
leng
th c
hang
es (m
)
Year AD
MA
R(c
m−2
yr−1)
Figure 3. Comparison of long-term glacier length variations (Holzhauser et al., 2005) withmass accumulation rates (MAR) in Lake Silvaplana back toAD 1170 (100-year loess-filtered; Blass et al., 2007b; Trachsel et al., 2010). This figure is available in colour online at wileyonlinelibrary.com.
Copyright � 2011 John Wiley & Sons, Ltd. J. Quaternary Sci., Vol. 26(7) 703–713 (2011)
706 JOURNAL OF QUATERNARY SCIENCE
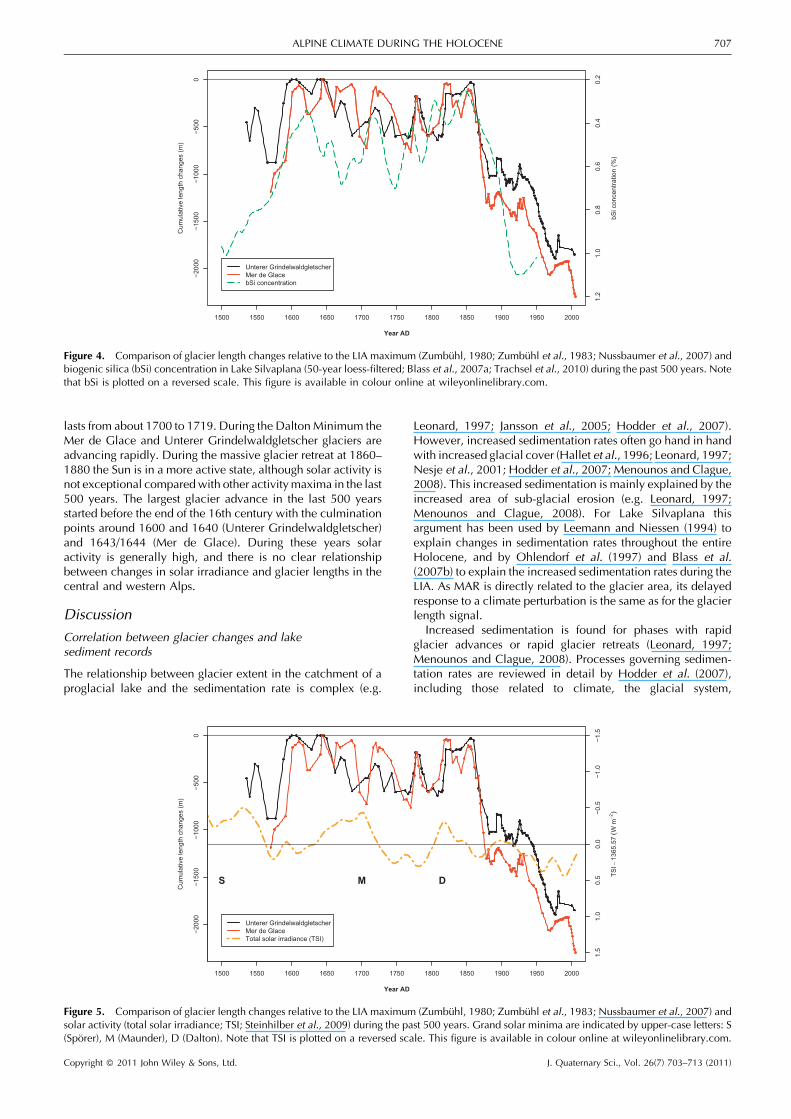
lasts from about 1700 to 1719. During the DaltonMinimum theMer de Glace and Unterer Grindelwaldgletscher glaciers areadvancing rapidly. During the massive glacier retreat at 1860–1880 the Sun is in a more active state, although solar activity isnot exceptional comparedwith other activitymaxima in the last500 years. The largest glacier advance in the last 500 yearsstarted before the end of the 16th century with the culminationpoints around 1600 and 1640 (Unterer Grindelwaldgletscher)and 1643/1644 (Mer de Glace). During these years solaractivity is generally high, and there is no clear relationshipbetween changes in solar irradiance and glacier lengths in thecentral and western Alps.
Discussion
Correlation between glacier changes and lakesediment records
The relationship between glacier extent in the catchment of aproglacial lake and the sedimentation rate is complex (e.g.
Leonard, 1997; Jansson et al., 2005; Hodder et al., 2007).However, increased sedimentation rates often go hand in handwith increased glacial cover (Hallet et al., 1996; Leonard, 1997;Nesje et al., 2001; Hodder et al., 2007; Menounos and Clague,2008). This increased sedimentation is mainly explained by theincreased area of sub-glacial erosion (e.g. Leonard, 1997;Menounos and Clague, 2008). For Lake Silvaplana thisargument has been used by Leemann and Niessen (1994) toexplain changes in sedimentation rates throughout the entireHolocene, and by Ohlendorf et al. (1997) and Blass et al.(2007b) to explain the increased sedimentation rates during theLIA. As MAR is directly related to the glacier area, its delayedresponse to a climate perturbation is the same as for the glacierlength signal.Increased sedimentation is found for phases with rapid
glacier advances or rapid glacier retreats (Leonard, 1997;Menounos and Clague, 2008). Processes governing sedimen-tation rates are reviewed in detail by Hodder et al. (2007),including those related to climate, the glacial system,
−200
0−1
500
−100
0−5
000
Unterer GrindelwaldgletscherMer de GlacebSi concentration
1500 1550 1600 1650 1700 1750 1800 1850 1900 1950 2000
1.2
1.0
0.8
0.6
0.4
0.2
Cum
ulat
ive
leng
th c
hang
es (m
)
Year AD
bSi c
once
ntra
tion
(%)
Figure 4. Comparison of glacier length changes relative to the LIA maximum (Zumbuhl, 1980; Zumbuhl et al., 1983; Nussbaumer et al., 2007) andbiogenic silica (bSi) concentration in Lake Silvaplana (50-year loess-filtered; Blass et al., 2007a; Trachsel et al., 2010) during the past 500 years. Notethat bSi is plotted on a reversed scale. This figure is available in colour online at wileyonlinelibrary.com.
Cum
ulat
ive
leng
th c
hang
es (m
)
1500 1550 1600 1650 1700 1750 1800 1850 1900 1950 2000
−200
0−1
500
−100
0−5
000
Unterer GrindelwaldgletscherMer de GlaceTotal solar irradiance (TSI)
TSI−
1365
.57(W
m−2)
Year AD
DMS
1.5
1.0
0.5
0.0
−0.5
−1.0
−1.5
Figure 5. Comparison of glacier length changes relative to the LIA maximum (Zumbuhl, 1980; Zumbuhl et al., 1983; Nussbaumer et al., 2007) andsolar activity (total solar irradiance; TSI; Steinhilber et al., 2009) during the past 500 years. Grand solar minima are indicated by upper-case letters: S(Sporer), M (Maunder), D (Dalton). Note that TSI is plotted on a reversed scale. This figure is available in colour online at wileyonlinelibrary.com.
Copyright � 2011 John Wiley & Sons, Ltd. J. Quaternary Sci., Vol. 26(7) 703–713 (2011)
ALPINE CLIMATE DURING THE HOLOCENE 707
geological and geomorphological settings, and terrestrial andfluvial systems. Menounos and Clague (2008) emphasize lagsbetween sediment formation and sediment delivery to lakesand thus changes in the sediment storage in the glacier systemas resulting in non-linear relationships between glacier extentand sedimentation rate.The comparison of MAR with the length changes of the
nearby Tschierva glacier (see Fig. 2) is a good example of thecombination of sediment availability and transport. The overalltrend is similar, which can be clearly attributed to changes insediment availability. Mass loss of Alpine glaciers was very highin the 1940 s (Huss et al., 2009). The decrease in MAR is morepronounced between 1950 and 1970 than the retreat of theTschierva glacier. This might be explained by the decrease insummer temperatures between 1950 and 1978 (Begert et al.,2005). The decreasing summer temperatures reduce glaciermelt, inducing reduced runoff, thus reducing sedimenttransport as well, amplifying the reduction of MAR alreadycaused by reduced sediment availability.For the reduction of MAR between 1900 and 1915 the
process of reduced sediment transport through runoff becauseof reduced summer temperatures is even more important.Between 1900 and 1915 MAR decreases although the glaciersremain stable. When looking at the summer, i.e. June, July andAugust temperatures, the years between 1910 and 1915 are thecoldest in the instrumental record spanning back to 1864(Begert et al., 2005). Although the sediment availability can beexpected to be stable, the low summer temperatures reduceglacier melt, and thus less runoff is generated for transportingsediment to the lake. Hence the MAR is decreasing because ofthe same climate conditions that are, by contrast, allowing theglaciers to remain stable. This is supported by the findings ofBlass et al. (2007b) which show a significant correlationbetween average May–September temperature and MAR in thehigh-frequency domain. The agreement between MAR andglacier reconstructions confirms the findings of Leemann andNiessen (1994), Ohlendorf et al. (1997) and Blass et al. (2007b)who attributed the increased sedimentation during phases withlarger glacier extents to increased sub-glacial erosion. Themajor disagreement between MAR and the glacier reconstruc-tions in the late 18th century might be explained by a glaciercollapse in 1793 (Vadret dal Corvatsch; Caviezel, 2007). Alarge, former sub-glacial area was exposed to precipitation,which was then available to supply sediment for transportationto the lake, inducing the increase in MAR lasting from 1793 to1800. The highest values of MAR occurring in the early 17thcentury are probably caused by the advance of the glacier inareas where it had previously not been advancing for longerperiods, which resulted in a non-linear increase of erosion(Nesje et al., 2001). This is again a good example for non-linearities in the relationship between glacier extent andsedimentation rate.The increase of MAR in the late 14th and in the late 15th
centuries highlights the potential of sediment-based glacierreconstructions to increase the temporal resolution of long-termglacier reconstructions based on dating of fossil wood. Forexample, minor advances closely following major glacieradvances and thus glaciers not advancing in vegetated areascan be detected. The increased MAR in the late 14th centurymight indicate a minor glacier advance 40 years after the majoradvance. This minor advance cannot be detected in glacierreconstructions based on findings of fossil wood because40 years is too short a time period to allowmajor vegetation (i.e.tree) growth. A minor glacier advance in the second half of the15th century is in line with the reconstruction of the GrosserAletschgletscher (Holzhauser et al., 2005) and lower summer
temperatures in the Alpine region around 1460 (Buntgen et al.,2006; Trachsel et al., 2010).
The accordance between bSi concentration or, moregenerally, the concentration of organic compounds and glacierextent has been widely discussed in the literature (e.g. Nesjeet al., 2001), and follows the same arguments as mentionedabove. A large glacier erodes more material which in turn leadsto more sediment transported to the lake. The increased input ofclastic material dilutes the organic mater produced in the lake(‘matrix effect’; e.g. Nesje et al., 2001), or in our case, ofbiogenic silica; hence, lower bSi concentrations are expectedwith an extended glacier.
Studies in which the organic matter content was used todetermine glacier size have a far coarser temporal resolutionthan we have in our study. Hence in our study an additionalinteresting effect can be detected: the annual bSi concentrationvalues are not only influenced by dilution but are alsodependent on the temperatures of the actual year, which partlydefine the primary production in the lake (Blass et al., 2007a).We thus have two different processes operating on differenttimescales influencing the bSi concentration: dilution dependson the input of clastic sediment, which was shown to becontrolled by the glacier extent, and the primary production inthe lake. The glacier extent is delayed compared with summertemperature (e.g. Haeberli and Hoelzle, 1995) whereasprimary production of the lake operates immediately (inter-annual timescale). The combination of these two differenttimescales explains the lead of bSi concentration comparedwith glacier fluctuations. The lead of bSi varies between 8 and15 years compared with the glaciers, as can be seen in Fig. 4.
The primary production in the lake is even more complexthan the formation of clastic sediment and is thus influenced bya greater number of processes. After 1950, bSi concentration isno longer related to climate due to human-induced eutrophi-cation (Bigler et al., 2007; Blass et al., 2007a). Prior to AD 1550the bSi concentration is higher than from 1600 to 1850(Trachsel et al., 2010), possibly indicating generally reducedglacier extents and smallerMAR values. During such phases theimportance of dilution, compared with other processes suchas primary production mainly driven by climate conditionsand nutrient availability, is reduced (Trachsel et al., 2010)explaining the low accordance between bSi concentration andglacier extents.
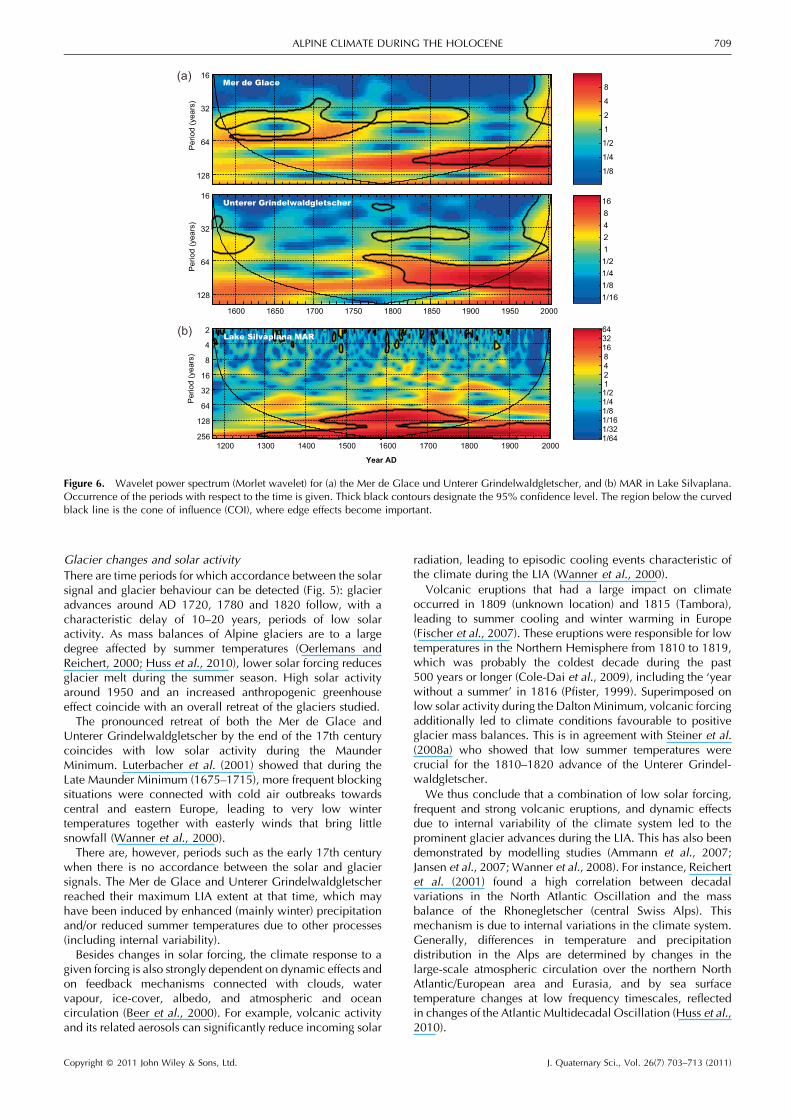
To study discontinuities and changes in the frequency ormagnitude of time series over time, we used the Morlet waveletfor the continuous wavelet transform (Torrence and Compo,1998). Besides the striking visual agreement between thefluctuations of the Mer de Glace and Unterer Grindelwald-gletscher, wavelet analysis suggests that the frequency contentof the records has varied with time and reveals a similarbehaviour of these two glaciers in the time/frequency domain(Fig. 6a). Intermittent and high wavelet power in the record ofthe Mer de Glace is found at periods centred at about 40 and60 years during AD 1600–1700, and at 40 years during AD1780–1900, respectively. High and significant (95% confi-dence level) wavelet power in both glacier records is found atperiods between about 70 and 100 years, and around 40 years,respectively, after AD 1780. Differences are greatest from AD1650 to 1800, especially at periods below about 50 years(Fig. 5).
On the other hand, wavelet analysis of MAR in LakeSilvaplana shows a significant frequency signal centred at about100 years as well as at about 210 years (Fig. 6b). The spectralcoincidence with the solar �90-year Gleissberg cycle and the208-year Suess cycle (de Vries cycle) might point to a solarinfluence.
Copyright � 2011 John Wiley & Sons, Ltd. J. Quaternary Sci., Vol. 26(7) 703–713 (2011)
708 JOURNAL OF QUATERNARY SCIENCE
Glacier changes and solar activity
There are time periods for which accordance between the solarsignal and glacier behaviour can be detected (Fig. 5): glacieradvances around AD 1720, 1780 and 1820 follow, with acharacteristic delay of 10–20 years, periods of low solaractivity. As mass balances of Alpine glaciers are to a largedegree affected by summer temperatures (Oerlemans andReichert, 2000; Huss et al., 2010), lower solar forcing reducesglacier melt during the summer season. High solar activityaround 1950 and an increased anthropogenic greenhouseeffect coincide with an overall retreat of the glaciers studied.The pronounced retreat of both the Mer de Glace and
Unterer Grindelwaldgletscher by the end of the 17th centurycoincides with low solar activity during the MaunderMinimum. Luterbacher et al. (2001) showed that during theLate Maunder Minimum (1675–1715), more frequent blockingsituations were connected with cold air outbreaks towardscentral and eastern Europe, leading to very low wintertemperatures together with easterly winds that bring littlesnowfall (Wanner et al., 2000).There are, however, periods such as the early 17th century
when there is no accordance between the solar and glaciersignals. The Mer de Glace and Unterer Grindelwaldgletscherreached their maximum LIA extent at that time, which mayhave been induced by enhanced (mainly winter) precipitationand/or reduced summer temperatures due to other processes(including internal variability).Besides changes in solar forcing, the climate response to a
given forcing is also strongly dependent on dynamic effects andon feedback mechanisms connected with clouds, watervapour, ice-cover, albedo, and atmospheric and oceancirculation (Beer et al., 2000). For example, volcanic activityand its related aerosols can significantly reduce incoming solar
radiation, leading to episodic cooling events characteristic ofthe climate during the LIA (Wanner et al., 2000).Volcanic eruptions that had a large impact on climate
occurred in 1809 (unknown location) and 1815 (Tambora),leading to summer cooling and winter warming in Europe(Fischer et al., 2007). These eruptions were responsible for lowtemperatures in the Northern Hemisphere from 1810 to 1819,which was probably the coldest decade during the past500 years or longer (Cole-Dai et al., 2009), including the ‘yearwithout a summer’ in 1816 (Pfister, 1999). Superimposed onlow solar activity during the DaltonMinimum, volcanic forcingadditionally led to climate conditions favourable to positiveglacier mass balances. This is in agreement with Steiner et al.(2008a) who showed that low summer temperatures werecrucial for the 1810–1820 advance of the Unterer Grindel-waldgletscher.We thus conclude that a combination of low solar forcing,
frequent and strong volcanic eruptions, and dynamic effectsdue to internal variability of the climate system led to theprominent glacier advances during the LIA. This has also beendemonstrated by modelling studies (Ammann et al., 2007;Jansen et al., 2007; Wanner et al., 2008). For instance, Reichertet al. (2001) found a high correlation between decadalvariations in the North Atlantic Oscillation and the massbalance of the Rhonegletscher (central Swiss Alps). Thismechanism is due to internal variations in the climate system.Generally, differences in temperature and precipitationdistribution in the Alps are determined by changes in thelarge-scale atmospheric circulation over the northern NorthAtlantic/European area and Eurasia, and by sea surfacetemperature changes at low frequency timescales, reflectedin changes of the Atlantic Multidecadal Oscillation (Huss et al.,2010).
Per
iod
(yea
rs)
16
32
64
128 1/8
1/4
1/2
1
2
4
8
Per
iod
(yea
rs)
1600 1650 1700 1750 1800 1850 1900 1950 2000
16
32
64
128 1/161/81/41/2 1 2 4 8 16
Year AD
Per
iod
(yea
rs)
1200 1300 1400 1500 1600 1700 1800 1900 2000
2
4
8
16
32
64
128
256 1/641/321/161/81/41/2 1 2 4 8 163264
Lake Silvaplana MAR
(a)
(b)
Mer de Glace
Unterer Grindelwaldgletscher
Figure 6. Wavelet power spectrum (Morlet wavelet) for (a) the Mer de Glace und Unterer Grindelwaldgletscher, and (b) MAR in Lake Silvaplana.Occurrence of the periods with respect to the time is given. Thick black contours designate the 95% confidence level. The region below the curvedblack line is the cone of influence (COI), where edge effects become important.
Copyright � 2011 John Wiley & Sons, Ltd. J. Quaternary Sci., Vol. 26(7) 703–713 (2011)
ALPINE CLIMATE DURING THE HOLOCENE 709
Solar activity and glaciers during theHolocene
Results
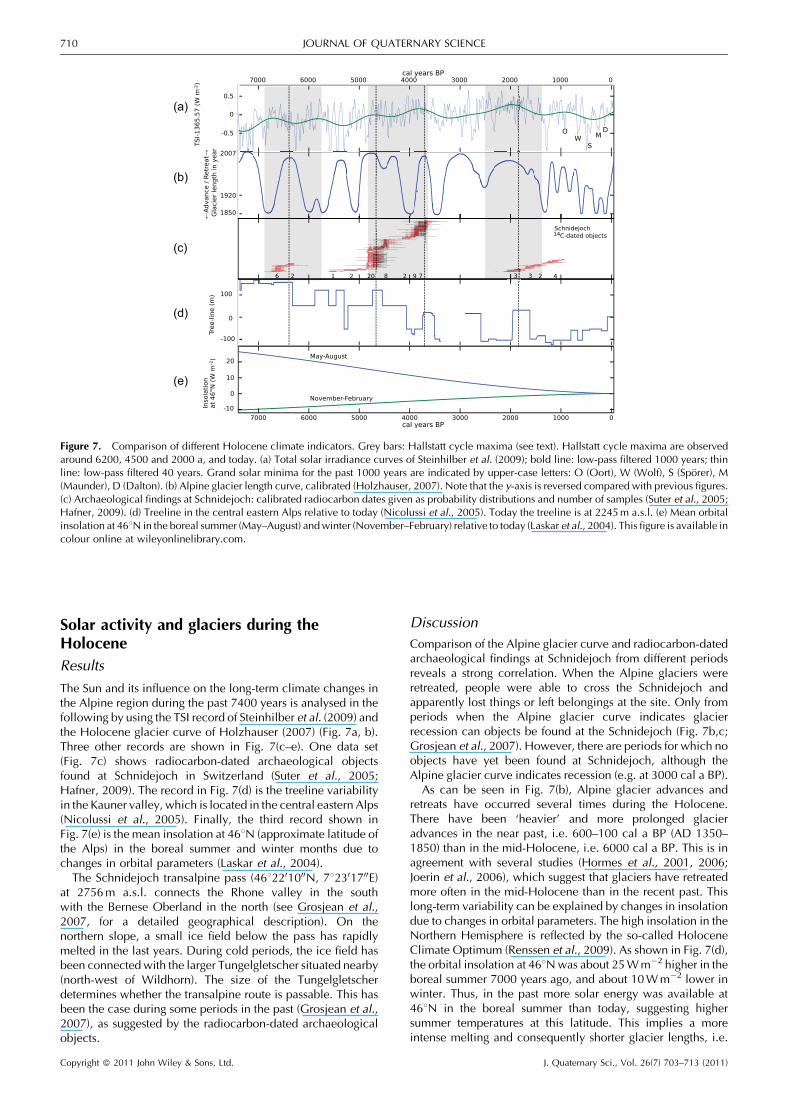
The Sun and its influence on the long-term climate changes inthe Alpine region during the past 7400 years is analysed in thefollowing by using the TSI record of Steinhilber et al. (2009) andthe Holocene glacier curve of Holzhauser (2007) (Fig. 7a, b).Three other records are shown in Fig. 7(c–e). One data set(Fig. 7c) shows radiocarbon-dated archaeological objectsfound at Schnidejoch in Switzerland (Suter et al., 2005;Hafner, 2009). The record in Fig. 7(d) is the treeline variabilityin the Kauner valley, which is located in the central eastern Alps(Nicolussi et al., 2005). Finally, the third record shown inFig. 7(e) is the mean insolation at 468N (approximate latitude ofthe Alps) in the boreal summer and winter months due tochanges in orbital parameters (Laskar et al., 2004).The Schnidejoch transalpine pass (4682201000N, 782301700E)
at 2756m a.s.l. connects the Rhone valley in the southwith the Bernese Oberland in the north (see Grosjean et al.,2007, for a detailed geographical description). On thenorthern slope, a small ice field below the pass has rapidlymelted in the last years. During cold periods, the ice field hasbeen connectedwith the larger Tungelgletscher situated nearby(north-west of Wildhorn). The size of the Tungelgletscherdetermines whether the transalpine route is passable. This hasbeen the case during some periods in the past (Grosjean et al.,2007), as suggested by the radiocarbon-dated archaeologicalobjects.
Discussion
Comparison of the Alpine glacier curve and radiocarbon-datedarchaeological findings at Schnidejoch from different periodsreveals a strong correlation. When the Alpine glaciers wereretreated, people were able to cross the Schnidejoch andapparently lost things or left belongings at the site. Only fromperiods when the Alpine glacier curve indicates glacierrecession can objects be found at the Schnidejoch (Fig. 7b,c;Grosjean et al., 2007). However, there are periods for which noobjects have yet been found at Schnidejoch, although theAlpine glacier curve indicates recession (e.g. at 3000 cal a BP).
As can be seen in Fig. 7(b), Alpine glacier advances andretreats have occurred several times during the Holocene.There have been ‘heavier’ and more prolonged glacieradvances in the near past, i.e. 600–100 cal a BP (AD 1350–1850) than in the mid-Holocene, i.e. 6000 cal a BP. This is inagreement with several studies (Hormes et al., 2001, 2006;Joerin et al., 2006), which suggest that glaciers have retreatedmore often in the mid-Holocene than in the recent past. Thislong-term variability can be explained by changes in insolationdue to changes in orbital parameters. The high insolation in theNorthern Hemisphere is reflected by the so-called HoloceneClimate Optimum (Renssen et al., 2009). As shown in Fig. 7(d),the orbital insolation at 468Nwas about 25Wm�2 higher in theboreal summer 7000 years ago, and about 10Wm�2 lower inwinter. Thus, in the past more solar energy was available at468N in the boreal summer than today, suggesting highersummer temperatures at this latitude. This implies a moreintense melting and consequently shorter glacier lengths, i.e.
(a)
(b)
(c)
(d)
(e)
Figure 7. Comparison of different Holocene climate indicators. Grey bars: Hallstatt cycle maxima (see text). Hallstatt cycle maxima are observedaround 6200, 4500 and 2000 a, and today. (a) Total solar irradiance curves of Steinhilber et al. (2009); bold line: low-pass filtered 1000 years; thinline: low-pass filtered 40 years. Grand solar minima for the past 1000 years are indicated by upper-case letters: O (Oort), W (Wolf), S (Sporer), M(Maunder), D (Dalton). (b) Alpine glacier length curve, calibrated (Holzhauser, 2007). Note that the y-axis is reversed compared with previous figures.(c) Archaeological findings at Schnidejoch: calibrated radiocarbon dates given as probability distributions and number of samples (Suter et al., 2005;Hafner, 2009). (d) Treeline in the central eastern Alps relative to today (Nicolussi et al., 2005). Today the treeline is at 2245m a.s.l. (e) Mean orbitalinsolation at 468N in the boreal summer (May–August) andwinter (November–February) relative to today (Laskar et al., 2004). This figure is available incolour online at wileyonlinelibrary.com.
Copyright � 2011 John Wiley & Sons, Ltd. J. Quaternary Sci., Vol. 26(7) 703–713 (2011)
710 JOURNAL OF QUATERNARY SCIENCE
more distinct glacier recessions. In addition to Alpine glaciersthe treeline of the Alpine region has been influenced by thechange in orbital insolation. The treeline has retreated in stepwith the summer insolation at 468N. The increase in winterinsolation is not reflected in the treeline record as the vegetationgrowth period is restricted to the warm season.Besides this long-term behaviour, shorter-term fluctuations
can be seen in the glacier length records, the Schnidejochfindings as well as in the treeline data. These are unlikely to bedue to the very smooth changes in orbital insolation. Thus,other mechanisms must be responsible for these shorter-termfluctuations, for example volcanic eruptions, changes in solaractivity such as TSI or internal variability.From the 1000-year low-pass filtered TSI curve (Fig. 7a), it
can be seen that TSI varies with a 2000- to 2400-year cycle, alsocalled the Hallstatt cycle (Damon and Sonett, 1991). Hallstattcycle maxima, marked with grey bars, are observed around6200, 4500 and 2000 a, and today. The minima in betweenare called Hallstatt cycle minima. The amplitude of TSIbetween Hallstatt minima and maxima is about 0.2Wm�2,which is about five times smaller than the amplitude of TSIobserved between the 11-year cycle minima and maxima.Although the Hallstatt cycle amplitude in TSI is only small,glacier recessions and advances occur more or less simul-taneously with the Hallstatt cycle maxima and minima.Agreement between the two is best for the most recent timesand worst at 7400 cal a BP.The thin line in Fig. 7(a) is the 40-year low-pass filtered TSI
of Steinhilber et al. (2009). Comparing this curve with the1000-year low-pass filtered TSI curves (bold line) shows thatgrand solar minima occurred more frequently during theHallstatt cycle minima than maxima. As can be seen from theTSI record, a typical grand solar minimum lasts several decadesand is characterized by a decrease in TSI of approximately1Wm�2 compared with the mean value of the most recent 30years. Hence, during a grand solar minimum the Sun emits lessenergy that can be received by the Earth, leading to a deficit inenergy. The longer a grand solar minimum lasts, the greater isthe deficit in energy. This deficit is even larger when severalgrand solar minima occur in a row with only little time inbetween, which occurred during the Hallstatt cycle minima.In summary, the climate and glacier response to changes in
TSI mainly depends on: (i) the amplitude of the change in TSI,and (ii) how long the period of changed TSI persists. The TSIrecord shows that during the Hallstatt cycle minima, bothconditions are fulfilled, and thus solar activity could leave its(solar) fingerprint on the Alpine climate. However, although thesolar imprint can be seen clearly in the Alpine climate onthe long-term 2000-year Hallstatt cycle, this does not imply thatthe Sun is the dominant forcing factor on shorter timescales. Forexample, the presently observed Alpine glacier length reces-sion is probably due to an enhanced greenhouse effect byanthropogenic greenhouse gas emissions, and not due tovolcanic and solar activity.
Conclusions and outlook
We have presented a new compilation of temporally highlyresolved data sets: the Mer de Glace and Unterer Grindel-waldgletscher are among the historically best-documentedglaciers in the world, and Lake Silvaplana has one of the best-studied sediment records and represents a situation whereglacier input is reflected in lake sediments. There is very goodagreement between the glacial signal extracted from LakeSilvaplana sediment records and the independently recon-structed glacier variations for the last millennium. Finally, therecent reconstruction of Holocene solar activity by Steinhilber
et al. (2009) allowed the assessment of solar imprint on theAlpine climate.The relationship between solar forcing and glacier variations is
clearly visible on the long-term, millennial-scale fluctuationduring the mid- to late Holocene. Alpine glacier advances in thelateHolocenewere stronger andmore prolonged due to reducedorbital insolation in the boreal summer (changed orbital forcingas an important background effect). On a short-term scale suchas during the LIA, the influence of solar activity is notunequivocal and other forcing factors have to be considered,i.e. volcanoes or internal variability, e.g. the influence of theNorth Atlantic Oscillation. Moreover, the behaviour of glaciersdepends on the sum of complex interactions due to climaticparameters (e.g. temperature, precipitation, solar radiation) butalso topographical conditions.There is need for high-resolution climate model runs using
TSI as input parameter to quantify its influence on climate. Thiswill reveal in more detail how summer and winter temperaturesin the Alpine regions have been influenced by changes in solarforcing over the Holocene.Regarding present climate change, it is also important to
discern between natural forcings such as solar and volcanic,and anthropogenic greenhouse gas forcing. It remains unclearwhether, without anthropogenic forcing, we would now befaced with a LIA-type climate due to orbital forcing.
Acknowledgements. This work was supported by the Swiss NationalScience Foundation through its National Centre of Competence inResearch on Climate (NCCR Climate) and the GLACIAS-project (grant200021-116354), and the EU FP6 project ‘Millennium’. We thankAndrew Mercer for proofreading of the English text, and to the anon-ymous reviewers for their valuable comments. Wavelet software wasprovided by C. Torrence and G. P. Compo, and is available at http://paos.colorado.edu/research/wavelets/. This is publication no. A352from the Bjerknes Centre for Climate Research.
Abbreviations. bSi, biogenic silica; LIA, Little Ice Age; MAR, sedimentmass accumulation rate; TSI, total solar irradiance.
ReferencesAmmann CM, Joos F, Schimel DS, et al. 2007. Solar influence on
climate during the past millennium: results from transient simulationswith the NCAR Climate System Model. Proceedings of the NationalAcademy of Sciences , 104: 3713–3718.
Beer J, Mende W, Stellmacher R. 2000. The role of the Sun in climateforcing. Quaternary Science Reviews, 19: 403–415.
Beer J, Abreu JA, Steinhilber F. 2008. Sun and planets from a climatepoint of view. Proceedings of the International Astronomical Union,4: 29–43.
Begert M, Schlegel T, Kirchhofer W. 2005. Homogeneous temperatureand precipitation series of Switzerland from 1864 to 2000. Inter-national Journal of Climatology, 25: 65–80.
Berner RA. 1971. Principles of Chemical Sedimentology. McGraw-HillBook Company: New York.
Bigler C, von Gunten L, Lotter AF, et al. 2007. Quantifying human-induced eutrophication in Swiss mountain lakes since AD 1800 usingdiatoms. The Holocene, 17: 1141–1154.
Bjune AE, Birks HJB. 2008. Holocene vegetation dynamics and inferredclimate changes at Svanavatnet, Mo i Rana, northern Norway.Boreas, 37: 146–156.
Blass A, Bigler C, Grosjean M, et al. 2007a. Decadal-scale autumntemperature reconstruction back to AD1580 inferred from the varvedsediments of Lake Silvaplana (southeastern Swiss Alps). QuaternaryResearch, 68: 184–195.
Blass A, Grosjean M, Troxler A, et al. 2007b. How stable are twentieth-century calibration models? A high-resolution summer temperaturereconstruction for the eastern Swiss Alps back to AD 1580 derivedfrom proglacial varved sediments. The Holocene, 17: 51–63.
Copyright � 2011 John Wiley & Sons, Ltd. J. Quaternary Sci., Vol. 26(7) 703–713 (2011)
ALPINE CLIMATE DURING THE HOLOCENE 711
Bond G, Kromer B, Beer J, et al. 2001. Persistent solar influence onNorth Atlantic climate during the Holocene. Science, 294: 2130–2136.
Buntgen U, Frank DC, Nievergelt D, et al. 2006. Summer temperaturevariations in the European Alps, A.D. 755-2004. Journal of Climate,19: 5606–5623.
Caviezel G. 2007. Hochwasser und ihre Bewaltigung anhand desBeispiels Oberengadin 1750-1900. Unpublizierte Lizentiatsarbeit,Universitat Bern.
Clark PU, Dyke AS, Shakun JD, et al. 2009. The Last Glacial Maximum.Science, 325: 710–714.
Cole-Dai J, Ferris D, Lanciki A, et al. 2009. Cold decade (AD 1810-1819) caused by Tambora (1815) and another (1809) stratosphericvolcanic eruption. Geophysical Research Letters, 36: L22703.
Cubasch U, Voss R. 2000. The influence of total solar irradiance onclimate. Space Science Reviews, 94: 185–198.
Damon PE, Sonett CP. 1991. Solar and terrestrial components of theatmospheric 14C variation spectrum. In The Sun in Time, edited bySonett CP, Giampapa MS, Matthews MS. University of Arizona:Tucson, AZ; pp. 360–388.
Denton GH, Karlen W. 1973. Holocene climatic variations – theirpattern and possible cause. Quaternary Research, 3: 155–174.
Eddy JA. 1976. The Maunder Minimum. Science, 192: 1189–1202.Eichler A, Olivier S, Henderson K, et al. 2009. Temperature response in
the Altai region lags solar forcing. Geophysical Research Letters, 36:L01808.
Fischer EM, Luterbacher J, Zorita E, et al. 2007. European climateresponse to tropical volcanic eruptions over the last half millennium.Geophysical Research Letters, 34: L05707.
Frohlich C. 2009. Evidence of a long-term trend in total solar irradiance.Astronomy and Astrophysics, 501: L27–L30.
Gletscherberichte. (1881-2009), Die Gletscher der Schweizer Alpen.Jahrbucher der Expertenkommission fur Kryospharenmessnetze derAkademie der Naturwissenschaften Schweiz (SCNAT). Versuchsan-stalt fur Wasserbau, Hydrologie und Glaziologie (VAW) der ETHZurich, No. 1-126, http://glaciology.ethz.ch/swiss-glaciers/
Gray LJ, Beer J, Geller M, et al. 2010. Solar influences on climate.Reviews of Geophysics, 48: RG4001.
Grosjean M, Suter PJ, Trachsel M, et al. 2007. Ice-borne prehistoricfinds in the Swiss Alps reflect Holocene glacier fluctuations. Journalof Quaternary Science, 22: 203–207.
GrosjeanM, vonGunten L, TrachselM, et al. 2009. Calibration-in-time:transforming biogeochemical lake sediment proxies into quantitativeclimate variables. PAGES News, 17: 108–110.
Grove JM. 2004. Little Ice Ages: Ancient and Modern, 2nd edn.Routledge: London.
Haeberli W, Hoelzle M. 1995. Application of inventory data forestimating characteristics of and regional climatic-change effectson mountain glaciers: a pilot study with the European Alps. Annalsof Glaciology, 21: 206–212.
Hafner A. 2009. Geschichte aus dem Eis – Archaologische Funde ausalpinen Gletschern und Eismulden.Mitteilungen der Naturforschen-den Gesellschaft in Bern, Neue Folge, 66: 159–171.
Hallet B, Hunter L, Bogen J. 1996. Rates of erosion and sedimentevacuation by glaciers: a review of field data and their implications.Global and Planetary Change, 12: 213–235.
Hodder KR, Gilbert R, Desloges JR. 2007. Glaciolacustrine varvedsediment as an alpine hydroclimatic proxy. Journal of Paleolimnol-ogy, 38: 365–394.
Holzhauser H. 2007. Holocene glacier fluctuations in the Swiss Alps. InEnvironnements et cultures a l’Age du Bronze en Europe occidentale,edited by Mordant C, Richard H, Magny M. Comite des travauxhistoriques et scientifiques (CTHS): Paris; pp. 29–43.
Holzhauser H. 2009. Die bewegte Vergangenheit des Grossen Aletsch-gletschers. In: Blatter aus der Walliser Geschichte, Band XLI.Geschichtsforschender Verein Oberwallis: Brig; pp. 47–102.
Holzhauser H. 2010. Zur Geschichte des Gornergletschers. Ein Puzzleaus historischen Dokumenten und fossilen Holzern aus demGletschervorfeld, Geographica Bernensia, G 84. GeographischesInstitut der Universitat Bern: Bern.
Holzhauser H, Magny M, Zumbuhl HJ. 2005. Glacier and lake-levelvariations in west-central Europe over the last 3500 years. TheHolocene, 15: 789–801.
Hormes A, Muller BU, Schluchter C. 2001. The Alps with little ice:evidence for eight Holocene phases of reduced glacier extent in theCentral Swiss Alps. The Holocene, 11: 255–265.
Hormes A, Beer J, Schluchter C. 2006. A geochronological approach tounderstanding the role of solar activity on Holocene glacier lengthvariability in the Swiss Alps. Geografiska Annaler, 88A: 281–294.
Huss M, Funk M, Ohmura A. 2009. Strong Alpine glacier melt in the1940s due to enhanced solar radiation. Geophysical ResearchLetters, 36: L23501.
Huss M, Hock R, Bauder R, et al. 2010. 100-year mass changes in theSwiss Alps linked to the Atlantic Multidecadal Oscillation. Geophy-sical Research Letters, 37: L10501.
Ivy-Ochs S, Kerschner H, Maisch M, et al. 2009. Latest Pleistocene andHolocene glacier variations in the European Alps. QuaternaryScience Reviews, 28: 2137–2149.
Jansen E, Overpeck J, Briffa KR, et al. 2007. Paleoclimate. In: ClimateChange 2007: the Physical Science Basis, Contribution of WorkingGroup I to the Fourth Assessment Report of the IntergovernmentalPanel on Climate Change [Solomon S, Qin D, Manning M, et al.(Eds.)]. Cambridge University Press: Cambridge; pp. 433–497.
Jansson P, Rosqvist G, Schneider T. 2005. Glacier fluctuations,suspended sediment flux and glacio-lacustrine sediments. Geogra-fiska Annaler, 87A: 37–50.
Joerin UE, Stocker TF, Schluchter C. 2006. Multicentury glacier fluctu-ations in the Swiss Alps during the Holocene. The Holocene, 16:697–704.
Jones PD, Mann ME. 2004. Climate over past millennia. Reviews ofGeophysics, 42: RG2002.
Krivova NA, Balmaceda L, Solanki SK. 2007. Reconstruction of solartotal irradiance since 1700 from the surface magnetic flux. Astron-omy and Astrophysics, 467: 335–346.
Laskar J, Robutel P, Joutel F, et al. 2004. A long-term numerical solutionfor the insolation quantities of the Earth.Astronomy andAstrophysics,428: 261–285.
Leemann A, Niessen F. 1994. Holocene glacial activity and climaticvariations in the Swiss Alps: reconstructing a continuous record fromproglacial lake sediments. The Holocene, 4: 259–268.
Lemke P, Ren J, Alley RB, et al. 2007. Observations: changes in snow,ice and frozen ground. In: Climate Change 2007: the PhysicalScience Basis, Contribution of Working Group I to the FourthAssessment Report of the Intergovernmental Panel on ClimateChange [Solomon S, Qin D, Manning M, et al. (Eds.)]. CambridgeUniversity Press: Cambridge; pp. 337–383.
Leonard EM. 1997. The relationship between glacial activity andsediment production: evidence from a 4450-year varve record ofneoglacial sedimentation in Hector Lake, Alberta, Canada. Journal ofPaleolimnology, 17: 319–330.
Luterbacher J, Rickli R, Xoplaki E, et al. 2001. The Late MaunderMinimum (1675-1715) – a key period for studying decadal scaleclimatic change in Europe. Climatic Change, 49: 441–462.
Magny M. 1993. Solar influences on Holocene climatic changesillustrated by correlations between past lake-level fluctuations andthe atmospheric 14C record. Quaternary Research, 40: 1–9.
Masarik J, Beer J. 1999. Simulation of particle fluxes and cosmogenicnuclide production in the Earth’s atmosphere. Journal of GeophysicalResearch, 104: 12,099–12,111.
Menounos B, Clague JJ. 2008. Reconstructing hydro-climatic eventsand glacier fluctuations over the past millennium from annuallylaminated sediments of Cheakamus Lake, southern Coast Mountains,British Columbia, Canada. Quaternary Science Reviews, 27: 701–713.
Mortlock RA, Froelich PN. 1989. A simple method for the rapiddetermination of biogenic opal in pelagic marine sediments. DeepSea Research Part A. Oceanographic Research Papers, 36: 1415–1426.
Nesje A. 2009. Latest Pleistocene and Holocene alpine glacier fluctu-ations in Scandinavia.Quaternary Science Reviews, 28: 2119–2136.
Nesje A, Matthews JA, Dahl SO, et al. 2001. Holocene glacier fluctu-ations of Flatebreen and winter-precipitation changes in the Joste-dalsbreen region, western Norway, based on glaciolacustrinesediment records. The Holocene, 11: 267–280.
Nicolussi K, Kaufmann M, Patzelt G, et al. 2005. Holocene tree-linevariability in the Kauner Valley, Central Eastern Alps, indicated by
Copyright � 2011 John Wiley & Sons, Ltd. J. Quaternary Sci., Vol. 26(7) 703–713 (2011)
712 JOURNAL OF QUATERNARY SCIENCE
dendrochronological analysis of living trees and subfossil logs.Vegetation History and Archaeobotany, 14: 221–234.
Nicolussi K, Kaufmann M, Melvin TM, et al. 2009. A 9111 year longconifer tree-ring chronology for the European Alps: a base forenvironmental and climatic investigations. The Holocene, 19:909–920.
Niessen F, Wick L, Bonani G, et al. 1992. Aquatic system response toclimatic and human changes: productivity, bottom water oxygenstatus, and sapropel formation in Lake Lugano over the last 10 000years. Aquatic Sciences, 54: 257–276.
Nussbaumer SU, Zumbuhl HJ, Steiner D. 2007. Fluctuations of the Merde Glace (Mont Blanc area, France) AD 1500-2050 : an interdisci-plinary approach using new historical data and neural networksimulations. Zeitschrift fur Gletscherkunde und Glazialgeologie,40: 1–183.
Oerlemans J. 2001. Glaciers and Climate Change. A.A. BalkemaPublishers: Lisse.
Oerlemans J, Reichert BK. 2000. Relating glacier mass balance tometeorological data by using a seasonal sensitivity characteristic.Journal of Glaciology, 46: 1–6.
Ohlendorf C, Sturm M. 2007. A modified method for biogenic silicadetermination. Journal of Paleolimnology, 39: 137–142.
Ohlendorf C, Niessen F, Weissert H. 1997. Glacial varve thickness and127 years of instrumental climate data: a comparison. ClimaticChange, 36: 391–411.
Osborn TJ, Briffa KR. 2006. The spatial extent of 20th-centurywarmth inthe context of the past 1200 years. Science, 311: 841–844.
Pfister C. 1999. Wetternachhersage. 500 Jahre Klimavariationen undNaturkatastrophen (1496-1995). Haupt: Bern.
Reichert BK, Bengtsson L, Oerlemans J. 2001. Midlatitude forcingmechanisms for glacier mass balance investigated using generalcirculation models. Journal of Climate, 14: 3767–3784.
Renssen H, Goosse H, Fichefet T, et al. 2005. Simulating the Holoceneclimate evolution at northern high latitudes using a coupled atmos-phere-sea ice-ocean-vegetation model. Climate Dynamics, 24: 23–43.
Renssen H, Seppa H, Heiri O, et al. 2009. The spatial and temporalcomplexity of the Holocene thermal maximum. Nature Geoscience,2: 411–414.
Spangehl T, Cubasch U, Raible CC, et al. 2010. Transient climatesimulations from the Maunder Minimum to present day: role of thestratosphere. Journal of Geophysical Research, 115: D00I10.
Steiner D, Pauling A, Nussbaumer SU, et al. 2008a. Sensitivity ofEuropean glaciers to precipitation and temperature – two casestudies. Climatic Change, 90: 413–441.
Steiner D, Zumbuhl HJ, Bauder A. 2008b. Two Alpine glaciers over thepast two centuries: a scientific view based on pictorial sources. In:Darkening Peaks: Glacier Retreat, Science, and Society, Orlove B,Wiegandt E, Luckman BH (Eds). University of California Press:Berkeley; pp. 83–99.
Steinhilber F, Beer J, Frohlich C. 2009. Total solar irradiance during theHolocene. Geophysical Research Letters, 36: L19704.
Steinhilber F, Abreu JA, Beer J, et al. 2010. The interplanetary magneticfield during the past 9300 years inferred from cosmogenic radio-nuclides. Journal of Geophysical Research, 115: A01104.
Suter PJ, Hafner A, Glauser K. 2005. Lenk-Schnidejoch. Funde aus demEis – ein vor- und fruhgeschichtlicher Passubergang. In: Archaologieim Kanton Bern, Band 6B: 499–522.
Torrence C, Compo GP. 1998. A practical guide to wavelet analysis.Bulletin of the American Meteorological Society, 79: 61–78.
Trachsel M, Grosjean M, Larocque-Tobler I, et al. 2010. Quantitativesummer temperature reconstruction derived from a combinedbiogenic Si and chironomid record from varved sediments of LakeSilvaplana (south-eastern Swiss Alps) back to AD 1177. QuaternaryScience Reviews, 29: 2719–2730.
van Geel B, Heusser CJ, Renssen H, et al. 2000. Climatic change inChile at around 2700 BP and global evidence for solar forcing: ahypothesis. The Holocene, 10: 659–664.
Wagner S, Widmann M, Jones J, et al. 2007. Transient simulations,empirical reconstructions and forcing mechanisms for the mid-Holocene hydrological climate in southern Patagonia. ClimateDynamics, 29: 333–355.
Wang Y, Cheng H, Edwards RL, et al. 2005a. The Holocene Asianmonsoon: links to solar changes and North Atlantic climate. Science,308: 854–857.
Wang Y-M, Lean JL, Sheeley NR Jr. 2005b. Modeling the Sun’smagnetic field and irradiance since 1713. The Astrophysical Journal,625: 522–538.
Wanner H, Holzhauser H, Pfister C, et al. 2000. Interannual to centuryscale climate variability in the European Alps. Erdkunde, 54: 62–69.
Wanner H, Beer J, Butikofer J, et al. 2008. Mid- to Late Holoceneclimate change: an overview. Quaternary Science Reviews, 27:1791–1828.
Yang S, Odah H, Shaw J. 2000. Variations in the geomagnetic dipolemoment over the last 12 000 years. Geophysical Journal Inter-national, 140: 158–162.
Zumbuhl HJ. 1980. Die Schwankungen der Grindelwaldgletscher inden historischen Bild- und Schriftquellen des 12. bis 19. Jahrhun-derts. Ein Beitrag zur Gletschergeschichte und Erforschung desAlpenraumes, Denkschriften der Schweizerischen NaturforschendenGesellschaft (SNG), Band 92. Birkhauser: Basel.
Zumbuhl HJ, Holzhauser H. 1988. Alpengletscher in der KleinenEiszeit. Sonderheft zum 125jahrigen Jubilaum des SAC. Die Alpen,64: 129–322.
Zumbuhl HJ, Messerli B, Pfister C. 1983. Die Kleine Eiszeit: Gletscher-geschichte im Spiegel der Kunst. Katalog zur Sonderausstellung desSchweizerischen Alpinen Museums Bern und des Gletschergarten-Museums Luzern vom 09.06.–14.08.1983 (Luzern), 24.08.–16.10.1983 (Bern).
Zumbuhl HJ, Steiner D, Nussbaumer SU. 2008. 19th century glacierrepresentations and fluctuations in the central and western EuropeanAlps: an interdisciplinary approach. Global and Planetary Change,60: 42–57.
Copyright � 2011 John Wiley & Sons, Ltd. J. Quaternary Sci., Vol. 26(7) 703–713 (2011)
ALPINE CLIMATE DURING THE HOLOCENE 713
Related Documents