2011-2012 WEF GLOBAL COMPETITIVENESS REPORT: GEORGIA FINAL Tuesday, July 03, 2012 This publication was produced for review by the United States Agency for International Development. It was prepared by Deloitte Consulting LLP.

Welcome message from author
This document is posted to help you gain knowledge. Please leave a comment to let me know what you think about it! Share it to your friends and learn new things together.
Transcript

2011-2012 WEF GLOBAL COMPETITIVENESS REPORT: GEORGIA FINAL
Tuesday, July 03, 2012
This publication was produced for review by the United States Agency for International Development. It was prepared by Deloitte Consulting LLP.

2011-2012 WEF GLOBAL COMPETITIVENESS REPORT: GEORGIA FINAL
USAID ECONOMIC PROSPERITY INITIATIVE (EPI)
CONTRACT NUMBER: AID-114-C-10-00004
DELOITTE CONSULTING LLP
USAID/CAUCASUS
TUESDAY, JULY 03, 2012
DISCLAIMER:
The author’s views expressed in this publication do not necessarily reflect the views of the United States Agency for International Development or the United States Government.
ECONOMIC PROSPERITY INITIATIVE (EPI) i
DATA
Author(s): Zaza Broladze, PMCG
Reviewed By: Tina Mendelson, EPI Chief of Party
Erekle Natadze, EPI PMP Manager
Name of Component: Crosscutting
Practice Area: WEF Global Competitiveness Report
Key Words: WEF, Global Competitiveness Report, GCI, Executive Opinion Survey
ECONOMIC PROSPERITY INITIATIVE (EPI) ii
ABSTRACT This report provides a brief analysis of Georgia’s competitiveness position as reported in the World Economic Forum (WEF) 2011-2012 Global Competitiveness Report (GCR). It compares the changes in the GCR Global Competitiveness Index (GCI) and overall country rankings between 2010 and 2011, provides possible rationale for the changes, and identifies key areas of weaknesses that Georgia needs to address in order to increase its competitiveness.

ECONOMIC PROSPERITY INITIATIVE (EPI) iii
ABBREVIATIONS
BRIC Brazil, Russia, India and China
EOS Executive Opinion Survey
GCI Global Competitiveness Index
GCR Global Competitiveness Report
WEF World Economic Forum

ECONOMIC PROSPERITY INITIATIVE (EPI) iv
CONTENTS BACKGROUND ......................................................................................................................... 1
GEORGIA IN 2011-2012 WEF GCR ......................................................................................... 4
AREAS OF GEORGIA’S IMPROVED COMPETITIVENESS ................................................................ 6
AREAS OF GEORGIA’S REDUCED COMPETITIVENESS ............................................................... 11
GEORGIA’S POSITION RELATIVE TO OTHER COUNTRIES ............................................................ 14
CONCLUDING REMARKS ......................................................................................................... 18
ANNEX A: GEORGIAN 2011-2012 AND 2010-2011 WEF GCR INDICATORS .............................. 19
TABLE OF TABLES Table 2: Georgia’s 2011-2012 GCI INDICATOR Ranks, 10th Percentile or Lower ................ 5
Table 1: Georgian WEF GCR 2010-2011 and GCR 2011-2012 Comparison, by Subindice and Pillar ............................................................................................................................... 6
Table 2: GCI Indicators with Improved Rank of 10 or Greater ............................................... 7
Table 3: GCI Indicators with Improved Score of .0.3 or More* ............................................... 7
Table 4: GCI Indicators With Decreased Rank of 10 or Greater .......................................... 11
Table 5. GCI Indicators with Decreased Score of 0.3 or More ............................................. 11
Table 6. Comparison of Rankings and Scores, WEF GCR 2011-2012 ................................ 14
TABLE OF FIGURES Figure 1: GCI Subindices and Pillars Taxonomy .................................................................. 1
Figure 2 : Subindex Weights, By Stage of Development ....................................................... 2
Figure 3: Percentage of Georgian EOS Respondents by Company Size .............................. 2
Figure 4: Respondants by Firm Size, Selected Countries ..................................................... 3

2011-2012 WEF GLOBAL COMPETITIVENESS REPORT: GEORGIA FINAL
ECONOMIC PROSPERITY INITIATIVE (EPI) 1
BACKGROUND The 2011-2012 World Economic Forum (WEF) Global Competitiveness Report (GCR) uses a Global Competitiveness Index (GCI) to assess the relative competitiveness of 142 countries. The 2010-2011 GCR assessed 139 countries. The GCI provides a weighted average of 113 indicators that affect national competitiveness. Data for approximately two-thirds of the variables come from the Executive Opinion Survey (EOS), a comprehensive annual survey conducted by the WEF in partnership with leading research institutes and business organizations in the countries covered by the report. Data for the other indicators are derived from publicly available sources such as The World Bank, The World Health Organization (WHO), and the United Nations Educational, Scientific, and Cultural Organization (UNESCO).
The GCI uses a 1-7 scale in which a higher numerical score indicates a higher degree of competitiveness. Country rankings accompany scores to indicate each country’s relative position. Annual changes in those rankings may be due to changes in the country’s scores or to changes in the scores of other countries. The GCI is derived from a combination of three subindices: Basic Requirements, Efficiency Enhancers, and Innovation and Sophistication Factors. Those subindices are derived from 12 pillars of competitiveness, which themselves are derived from numerous indicators.
FIGURE 1: GCI SUBINDICES AND PILLARS TAXONOMY
To assign a GCI to a given countries, they are grouped into the following stages of development based on their GDP per capita and the extent to which they are factor driven: Stage 1: Factor driven; Stage 2: Efficiency driven; and Stage 3: Innovation driven. Weights are assigned to each subindex according to the country’s stage of development, following the theory of stages of economic development, which emphasizes factors less and innovation more as economies develop. Georgia is classified as in transition from development Stage 1: Factor Driven to Stage 2: Efficiency Driven.
Basic Requirements
•Pillar 1: Institutions (21)
•Pillar 2: Infrastructure (9)
•Pillar 3: Macroecon. Environment (6)
•Pillar 4: Health and Primary Education (10)
Efficiency Enhancers
•Pillar 5: Higher Education and Training (8)
•Pillar 6: Goods and Market Efficiency (16)
•Pillar 7: Labor Market Efficiency (9)
•Pillar 8: Financial Market Development (9)
•Pillar 9: Technological Readiness (6)
•Pillar 10: Market Size (4)
Innovation and Sophistication Factors
•Pillar 11: Business Sophistication (9)
•Pillar 12: Innovation (7)

2011-2012 WEF GLOBAL COMPETITIVENESS REPORT: GEORGIA FINAL
ECONOMIC PROSPERITY INITIATIVE (EPI) 2
FIGURE 2 : SUBINDEX WEIGHTS, BY COUNTRY STAGE OF DEVELOPMENT
EXECUTIVE OPINION SURVEY (EOS) METHODOLOGY
The WEF EOS methodology requires at least 300 responses for the BRIC countries and the United States, and at least 80 responses for all other countries. In 2011-2012, 95 Georgia respondents participated in the EOS, compared to the median country response rate of 89. The vast majority of Georgia’s respondents (82%) were from companies with 100 employees or less. The remaining respondents came from companies with 101-500 employees (11%), and 501-5000 employees (6%). The relatively small proportion of responses from large companies reflects the relatively small share of total number of businesses in the Georgian economy, given the country’s current level of economic development and relatively small economy. Figure 3 below compares the percentage of Georgian EOS respondents by company size in 2011 and 2010.
FIGURE 3: PERCENTAGE OF GEORGIAN EOS RESPONDENTS BY COMPANY SIZE
60%
40%
20%
35%
50%
50%
5%
10%
30%
Stage 1:Factor driven
Stage 2:Efficiency driven
Stage 3:Innovation driven
Stage 1:Factor driven
Stage 2:Efficiency driven
Stage 3:Innovation driven
0
10
20
30
40
50
60
70
80
90
<101 101-500 501-1,000 5,001-20,000 >20,000
2011

2011-2012 WEF GLOBAL COMPETITIVENESS REPORT: GEORGIA FINAL
ECONOMIC PROSPERITY INITIATIVE (EPI) 3
The distribution of respondents per firm size in Georgia is similar to that of Azerbaijan, while Estonia, Armenia and Czech Republic reported a higher share of respondents from larger firms,
FIGURE 4: RESPONDANTS BY FIRM SIZE, SELECTED COUNTRIES
0% 20% 40% 60% 80% 100%
Czech Republic
Armenia
Estonia
Azerbaijan
Georgia
Share (%) of country sample
<101 employees 101-500 employees 501-5,000 employees

2011-2012 WEF GLOBAL COMPETITIVENESS REPORT: GEORGIA FINAL
ECONOMIC PROSPERITY INITIATIVE (EPI) 4
GEORGIA IN 2011-2012 WEF GCR Georgia ranked 88th in the 2011 GCI rankings, up from the 93rd place in 2010 – performing best in the Basic Requirements subindex, followed closely by the Efficiency Enhancers subindex.
While most of Georgia’s rank in individual pillars is close to its rank for that respective subindex, there are two notable outliners: Georgia ranked 32 in Labor Market Efficiency, and 137 in Pillar 3: Macroeconomic Environment.
WEF Indicators GCR 2011-2012
Rank Score
OVERALL GCI 88 4
Basic Requirements 86 4.3
1st pillar: Institutions 60 4 2nd pillar: Infrastructure 68 4
3rd pillar: Macroeconomic environment 137 3.7 4th pillar: Health and primary education 67 5.7 Efficiency enhancers 89 3.7
5th pillar: Higher education and training 88 3.9 6th pillar: Goods market efficiency 74 4.2 7th pillar: Labor market efficiency 32 4.7 8th pillar: Financial market development 99 3.7 9th pillar: Technological readiness 100 3.2 10th pillar: Market size 106 2.8 Innovation and Sophistication 117 3
11th pillar: Business sophistication 110 3.4 12th pillar: Innovation 118 2.6
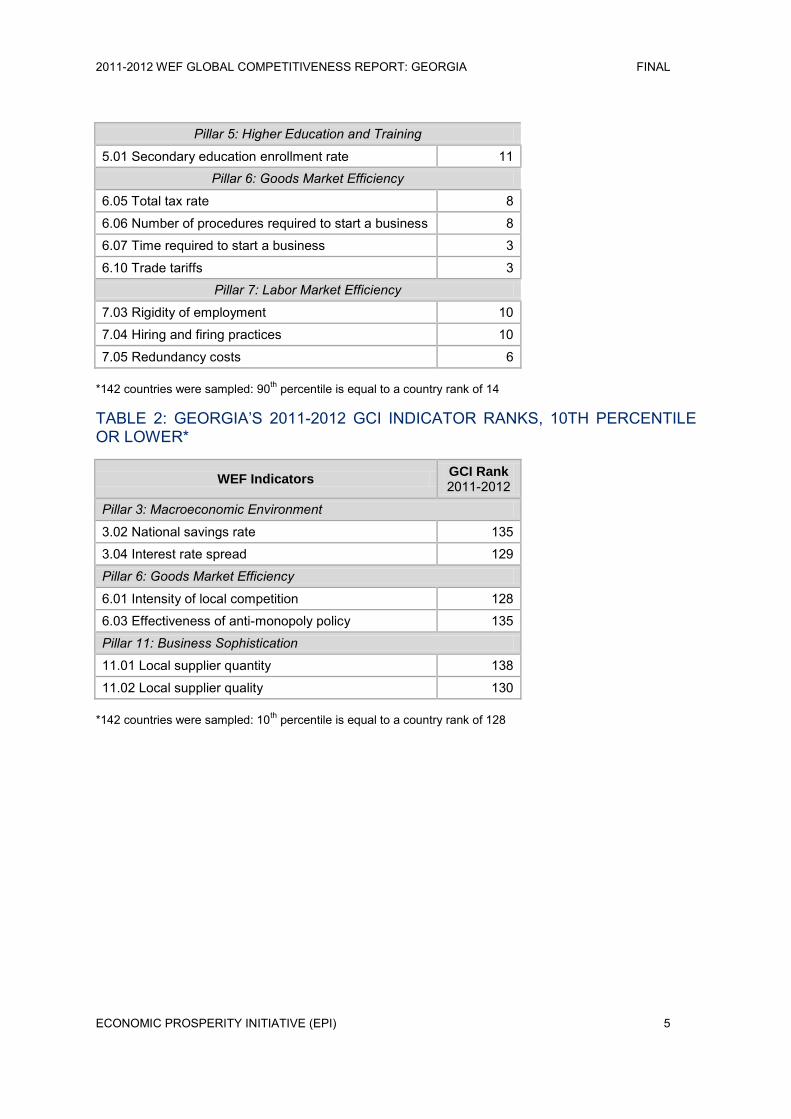
Drilling down into the indicators that are combined to determine pillar rank shows there are 11 indicators for which Georgia ranked in the top 10 percentile of country ranks (a rank of 14 or better), and 6 for which Georgia is in the bottom 10 percentile (a rank of 128 or worse).
TABLE 1: GEORGIA’S 2011-2012 GCI INDICATOR RANKS, 90TH PERCENTILE OR HIGHER
WEF Indicator GCR Rank 2011-2012
Pillar 1: Institutions
1.09 Burden of government regulation 7
1.21 Strength of investor protection 20
Pillar 4: Health and Primary Education
4.10 Primary education enrollment rate 3
2011-2012 WEF GLOBAL COMPETITIVENESS REPORT: GEORGIA FINAL
ECONOMIC PROSPERITY INITIATIVE (EPI) 5
Pillar 5: Higher Education and Training
5.01 Secondary education enrollment rate 11
Pillar 6: Goods Market Efficiency
6.05 Total tax rate 8
6.06 Number of procedures required to start a business 8
6.07 Time required to start a business 3
6.10 Trade tariffs 3
Pillar 7: Labor Market Efficiency
7.03 Rigidity of employment 10
7.04 Hiring and firing practices 10
7.05 Redundancy costs 6
*142 countries were sampled: 90th percentile is equal to a country rank of 14
TABLE 2: GEORGIA’S 2011-2012 GCI INDICATOR RANKS, 10TH PERCENTILE OR LOWER*
WEF Indicators GCI Rank 2011-2012
Pillar 3: Macroeconomic Environment
3.02 National savings rate 135
3.04 Interest rate spread 129
Pillar 6: Goods Market Efficiency
6.01 Intensity of local competition 128
6.03 Effectiveness of anti-monopoly policy 135
Pillar 11: Business Sophistication
11.01 Local supplier quantity 138
11.02 Local supplier quality 130
*142 countries were sampled: 10th percentile is equal to a country rank of 128

2011-2012 WEF GLOBAL COMPETITIVENESS REPORT: GEORGIA FINAL
ECONOMIC PROSPERITY INITIATIVE (EPI) 6
AREAS OF GEORGIA’S IMPROVED COMPETITIVENESS The 2011-2012 GCR revealed Georgia exhibited improvements in each of the three subindices: Basic Requirements, Efficiency Enhancers, and Innovation and Sophistication Factors. The most significant improvement was seen in the Basic Requirements subindex, which jumped in rank by 9 places. Of the 12 pillars, Pillar 1: Institutions, Pillar 4: Health and Primary Education, and Pillar 8: Financial Market Development.
TABLE 3: GEORGIAN WEF GCR 2010-2011 AND 2011-2012 COMPARISON, BY SUBINDEX AND PILLAR
WEF Indicator
GCR 2011-2012 GCR 2010-2011 Change
Rank (%ile)
Score Rank (%ile)
Score Rank (%ile)
Score
OVERALL GCI 88
th
(38) 4
93rd
(33)
3.9 5
(5) 0.1
Basic Requirements 86
th
(40) 4.3
95th
(32)
4.1 9
(8) 0.2
Pillar 1: Institutions 60th (58) 4 69th
(50) 3.9 9 (8) 0.1
Pillar 2: Infrastructure 68th (52) 4 73rd
(47) 3.8 5 (5) 0.2
Pillar 3: Macroeconomic Environment 137th (4) 3.7 130th
(6) 3.3 -7 (-2) 0.4
Pillar 4: Health and Primary Education 67th (53) 5.7 73rd
(47) 5.6 6 (6) 0.1
Efficiency Enhancers 89
th
(37) 3.7
94th
(32)
3.7 5
(5) 0
Pillar 5: Higher Education and Training 88th (38) 3.9 90th
(35) 3.7 2 (3) 0.2
Pillar 6: Goods Market Efficiency 74th (48) 4.2 64th
(54) 4.2 -10 (-6) 0
Pillar 7: Labor Market Efficiency 32nd (78) 4.7 31st
(78) 4.8 -1 (0) -0.1
Pillar 8: Financial Market Development 99th (31) 3.7 108th
(22) 3.6 9 (8) 0.1
Pillar 9: Technological Readiness 100th (30) 3.2 98th
(29) 3.1 -2 (1) 0.1
Pillar 10: Market Size 106th (26) 2.8 107th
(23) 2.8 1 (3) 0
Innovation and Sophistication 117
th
(18) 3
121st
(13)
2.9 4
(5) 0.1
Pillar 11: Business Sophistication 110th (23) 3.4 111th
(20) 3.3 1 (3) 0.1
Pillar 12: Innovation 118th (17) 2.6 125th
(10) 2.5 7 (7) 0.1

2011-2012 WEF GLOBAL COMPETITIVENESS REPORT: GEORGIA FINAL
ECONOMIC PROSPERITY INITIATIVE (EPI) 7
The indicators with the greatest improvement in rank and score are shown in the charts below.
TABLE 4: GCI INDICATORS WITH IMPROVED RANK OF 10 OR GREATER
WEF Indicators
GCR 2011-2012
GCR 2010-2011 Rank
Change Score
Change Rank Score Rank Score
Pillar 1: Institutions 1.04 Public Trust of Politicians 65 2.8 78 2.6 13 0.2 1.06 Judicial independence 91 3.2 104 2.9 13 0.3 1.07 Favoritism in decisions of government officials 54 3.2 68 3 14 0.2
1.17 Ethical behavior of firms 61 3.9 78 3.8 17 0.1 1.21 Strength of investor protection 20 6.7 33 6 13 0.7
Pillar 3: Macroeconomic environment 3.01 Government budget balance 87 -4.8 127 -9.4 40 4.6
Pillar 4: Health and Primary Education 4.10 Primary education enrollment rate 3 99.6 17 98.7 14 0.9
Pillar 5: Higher Education and Training 5.01 Secondary education enrollment rate 11 108.5 59 90 48 18.5 5.07 Local availability of research and training services 115 3.2 125 3 10 0.2
Pillar 6: Goods market efficiency 6.13 Burden of customs procedures 27 4.9 39 4.7 12 0.2
Pillar 8:Financial Market Development 8.02 Affordability of financial services 96 3.7 108 3.5 12 0.2 8.05 Venture capital availability 97 2.2 109 2.1 12 0.1 8.09 Legal rights index 39 7 60 6 21 1.0
Pillar 9: Technological Readiness 9.02 Firm-level technology absorption 115 4.1 125 4 10 0.1 9.06 Internet bandwidth 62 5.7 77 7.5 15 -1.8
Pillar 12: Innovation 12.05 Gov’t procurement of advanced tech products 76 3.5 102 3.2 26 0.3
TABLE 5: GCI INDICATORS WITH IMPROVED SCORE OF .0.3 OR MORE*
WEF Indicators
GCR 2011-2012
GCR 2010-2011 Rank
Change Score
Change Rank Score Rank Score
Pillar 1: Institutions 1.03 Diversion of public funds 39 4.5 46 4.1 7 0.4
1.05 Irregular payments and bribes 33 5.3 42 4.9 9 0.4
1.06 Judicial independence 91 3.2 104 2.9 13 0.3
1.16 Reliability of police services 42 5 45 4.7 3 0.3
1.21 Strength of investor protection 20 6.7 33 6 13 0.7
Pillar 2: Infrastructure

2011-2012 WEF GLOBAL COMPETITIVENESS REPORT: GEORGIA FINAL
ECONOMIC PROSPERITY INITIATIVE (EPI) 8
2.02 Quality of roads 57 4.2 65 3.9 8 0.3
2.03 Quality of railroad infrastructure 35 3.9 41 3.6 6 0.3
2.07 Quality of electricity supply 52 5.4 58 5.1 6 0.3
Pillar 5: Higher Education and Training 5.06 Internet access in schools 67 4.1 74 3.7 7 0.4
Pillar 9: Technological Readiness 9.05 Broadband Internet subscriptions 72 5.1 75 3.5 3 1.6
Pillar 12: Innovation 12.05 Gov’t procurement of advanced tech products 76 3.5 102 3.2 26 0.3
12.07 Utility patents per million population 65 0.5 72 0.2 7 0.3
*Only includes indicators collected through the EOS
BASIC REQUIREMENTS
Georgia made overall improvements in the Basic Requirements subindex, increasing in rank by 9 places, and in score by 0.2. The improvement is the result of gains in Pillar 1: Institutions, Pillar 2: Infrastructure and Pillar 4: Health and Primary Education, which helped counteract the fall in rank of Pillar 3: Macroeconomic Environment.
Pillar 1: Institutions Rank Change: 9; Score Change 0.1
Georgia’s improvement in this pillar is due to improved rank and score in the following sub-indicators:
1.03 Diversion of public funds (rank change: 7, score change 0.4)
1.04 Public Trust of Politicians (rank change: 13; score change: 0.2)
1.05 Irregular Payments and Bribes (rank change: 9; score change: 0.4)
1.06 Judicial Independence (rank change: 13; score change: 0.3)
1.07 Favoritism in Decisions of Government Officials (rank change: 14; score change: 0.2)
1.17 Ethical Behavior of Firms (rank change: 17; score change: 0.1)
There has been a perception change in this EOS-based indicator. The change in score for this variable is marginal, indicating that the change in rankings is largely due to changed perceptions, and subsequently ranks, in other countries.
1.21 Strength of Investor Protection (rank change: 13; score change: 0.7) Pillar 2: Infrastructure
Rank Change: 5; Score Change 0.2
Georgia’s improvement in this pillar is due largely to improved rank and score in the following sub-indicators:
2.01 Quality of Overall Infrastructure (rank change: 8, score change: 0.2)
2.02 Quality of Roads (rank change: 8, score change: 0.3)
2.03 Quality of Railroad Infrastructure (rank change: 6, score change: 0.3)

2011-2012 WEF GLOBAL COMPETITIVENESS REPORT: GEORGIA FINAL
ECONOMIC PROSPERITY INITIATIVE (EPI) 9
2.04 Quality of Port Infrastructure (rank change: 7, score change: 0.2)
2.07 Quality of Electricity Supply (rank change: 6, score change: 0.3) Pillar 3: Macroeconomic Environment
Rank Change: -7; Score Change 0.4
While Georgia showed an overall drop in rank in the third pillar, it is important to note the substantial increase in rank of indicator 3.01: Government budget balance. With an increased score of 4.6, Georgia’s rank in this indicator jumped by 40 places. In the previous year, the budget deficit was extremely high at - 9.4. and the improvement during 2010 resulted in an improved score - 4.8 and ranking of Georgia for this indicator.
Pillar 4: Health and Primary Education
Rank Change: 6; Score Change 0.1
Georgia’s improvement in this area is due to improved rank and score in education-related sub-indicators:
4.09 Quality of Primary Education (rank change: 6, score change: 0.2)
4.10 Primary Education Enrollment rate (rank change: 14, score change: 0.9)
EFFICIENCY ENHANCERS
Georgia’s rank in the Efficiency Enhancers subindex increased by 5 places, as well as 5 percentiles, though its score remained unchanged. The data indicate that the most influential factor within the Efficiency Enhancers subindex is Pillar 8: Financial Market Development, with Pillars 5: Higher Education and Training, and 10: Market Size also contributing to advances in the subindex.
Pillar 5: Higher Education and Training Rank Change: 2; Score Change 0.2
Though Georgia fell in rank by 16 places for indicator 5.02: Tertiary education enrollment rate, Georgia improved markedly in the following indicators:
5.01 Secondary education enrollment rate (rank change: 18.5; Score change: N/A - not on 7 point scale) The rank change is largely due to the change of school years from 11 to 12 for secondary education that occurred in 2009, as the 2011 GCI is based on 2009 data. However, the change in school years also resulted in a decline in the tertiary education enrolment rate.
5.06 Internet access in schools (rank change: 7; score change: 0.4)
5.07 Local availability of research and training services (rank change: 10; score change: 0.2)
Pillar 6: Goods Market Efficiency Rank Change: -10; Score Change 0
While Georgia’s rank in this Pillar declined, Indicator 6.13: Burden of custom procedures showed significant improvement, increasing in rank by 12 places and score by 0.2.
Pillar 8: Financial Market Development Rank Change: 9; Score Change 0.1

2011-2012 WEF GLOBAL COMPETITIVENESS REPORT: GEORGIA FINAL
ECONOMIC PROSPERITY INITIATIVE (EPI) 10
Georgia’s rank in Pillar 8 improved by 1 place, or 8 percentiles, and its score remained the same. Although the majority of the indicators in the eighth pillar still rank below Georgia’s overall rank, a positive change has been reported in eight of the nine financial market development indicators, especially the indicator that measures affordability of financial services, and availability of venture capital.
8.02 Affordability of financial services (rank change: 12, score change: 0.2)
8.05 Venture capital availability (rank change: 12, score change: 0.1)
8.09 Legal rights index (rank change: 64; score change: 21). This indicators comes from the World Bank Doing Business report, measuring the degree to which collateral and bankruptcy laws protect the rights of borrowers and lenders and thus facilitate lending. The improved rank reflects legislative changes made in previous years which were taken into account by the World Bank 2010 Doing Business report.
Pillar 9: Technological Readiness Rank Change: -2; Score Change 0.1
This pillar recorded no significant change overall, but the indicator 9.02: Firm-level technology absorption increased its rank by 10 places, with a score increase of 0.1. Indicator 9.06: Internet bandwidth also increased significantly in rank, by 15 places, but this is due to a WEF’s recent change in the measurement unit for the internet bandwidth variable, making changes in rank meaningless for this year’s report.
INNOVATION AND SOPHISTICATION
Georgia’s rank in the Innovation and Sophistication subindex increased by 4 places (5 percentiles), due to moderate progress in both indicators in the pillar.
Pillar 11: Business Sophistication Rank Change: 1; Score Change 0.1
While no significant change was recorded in Pillar 11, and the majority of the indicators recorded a slight decline in ranking. a significant increase was seen in indicator 11.04: nature of competitive advantage. (rank change: 9, score change: 0.2)
Pillar 12: Innovation Rank Change: 7; Score Change 0.1
All indicators of Pillar 12 demonstrated increased scores and rankings, most notably:
12.01 Capacity for innovation (rank change: 9, score change: 0.2)
12.05 Gov’t procurement of advanced tech products (rank change: 26, score change: 0.3) The investments that the Government of Georgia has made in technological solutions, such as e-governance, are demonstrated by the gains in government procurements of advanced technological products.

2011-2012 WEF GLOBAL COMPETITIVENESS REPORT: GEORGIA FINAL
ECONOMIC PROSPERITY INITIATIVE (EPI) 11
AREAS OF GEORGIA’S REDUCED COMPETITIVENESS While Georgian data sources are reporting an increase in the number of internet users, the WEF uses data from the International Telecommunications Union’s World Telecommunication/ICT Indicators 2011 report for the WEF GCR. The data on imports and exports as a percentage of GDP come from the World Trade Organization’s Statistics Database: Time Series on International Trade, referenced on July 4, 2011. Georgia needs to improve the timing and accuracy of supplying hard data to the WEF and work with those Georgian agencies that are providing such data on an annual basis. Using the latest data alone will improve Georgia’s rankings in some areas. There was discrepancy in indicators: 4.04 Tuberculosis incidence, 4.07 Infant mortality, 4.08 Life expectancy, 2.08 Fixed telephone lines and 2.09 Mobile telephone subscriptions.
The indicators with the greatest decrease in rank and score are indicated in the charts below.
TABLE 6: GCI INDICATORS WITH DECREASED RANK OF 10 OR GREATER
WEF Indicators
GCR 2011-2012
GCR 2010-2011 Rank
Change Score
Change Rank Score Rank Score
Pillar 3: Macroeconomic Environment
3.02 National savings rate 135 5.2 110 12.3 -25 -7.1
3.03 Inflation 115 7.1 47 1.7 -68 5.4
Pillar 4: Health and Primary Education
4.03 Business impact of tuberculosis 92 4.9 78 5.4 -14 -0.5
Pillar 5: Higher Education and Training 5.02 Tertiary education enrollment rate 82 25.5 66 34.3 -16 -8.8
Pillar 6: Goods Market Efficiency
6.04 Extent and effect of taxation 35 3.9 24 4.2 -11 -0.3 6.11 Prevalence of foreign ownership 110 4.1 89 4.5 -21 -0.4
Pillar 9: Technological Readiness
9.04 Internet users 85 27 73 30.5 -12 -3.5
TABLE 7. GCI INDICATORS WITH DECREASED SCORE OF 0.3 OR MORE
WEF Indicators
GCR 2011-2012
GCR 2010-2011 Rank
Change Score
Change Rank Score Rank Score
Pillar 1: Institutions
1.13 Business costs of terrorism 69 5.6 61 5.9 -8 -0.3 1.14 Business costs of crime and violence 49 5.2 41 5.5 -8 -0.3
2011-2012 WEF GLOBAL COMPETITIVENESS REPORT: GEORGIA FINAL
ECONOMIC PROSPERITY INITIATIVE (EPI) 12
Pillar 4: Health and Primary Education
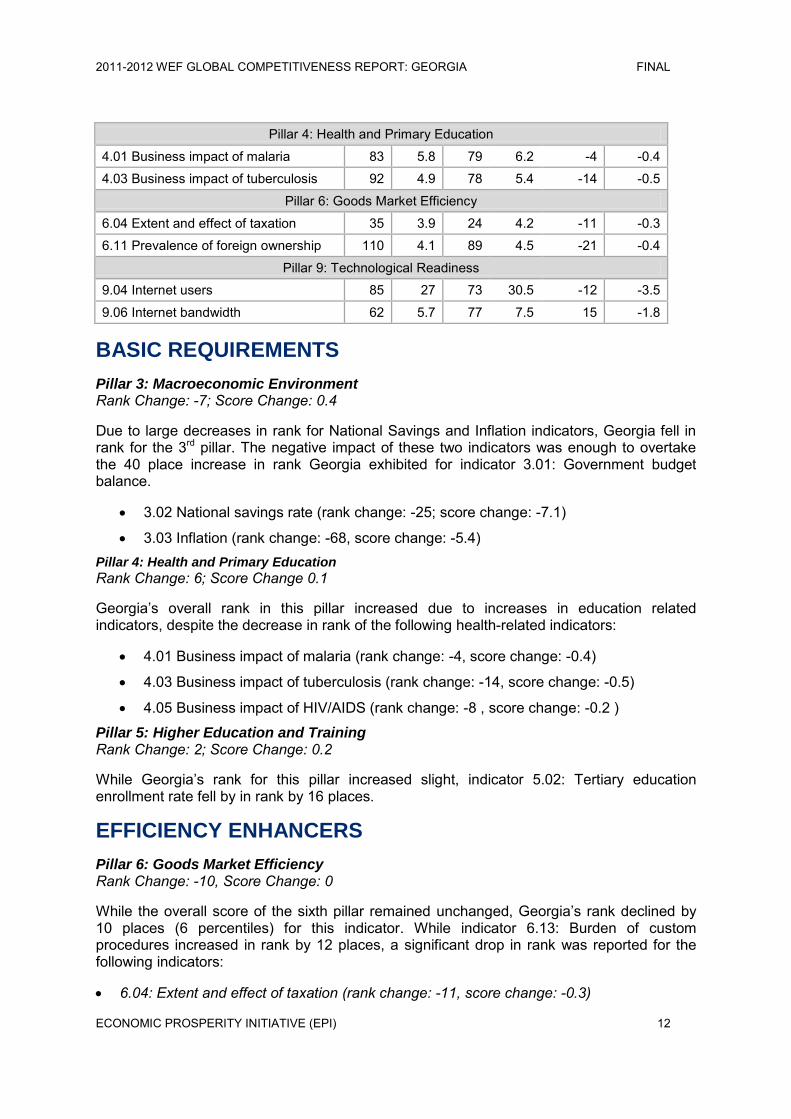
4.01 Business impact of malaria 83 5.8 79 6.2 -4 -0.4
4.03 Business impact of tuberculosis 92 4.9 78 5.4 -14 -0.5
Pillar 6: Goods Market Efficiency
6.04 Extent and effect of taxation 35 3.9 24 4.2 -11 -0.3
6.11 Prevalence of foreign ownership 110 4.1 89 4.5 -21 -0.4
Pillar 9: Technological Readiness
9.04 Internet users 85 27 73 30.5 -12 -3.5
9.06 Internet bandwidth 62 5.7 77 7.5 15 -1.8
BASIC REQUIREMENTS
Pillar 3: Macroeconomic Environment Rank Change: -7; Score Change: 0.4
Due to large decreases in rank for National Savings and Inflation indicators, Georgia fell in rank for the 3rd pillar. The negative impact of these two indicators was enough to overtake the 40 place increase in rank Georgia exhibited for indicator 3.01: Government budget balance.
3.02 National savings rate (rank change: -25; score change: -7.1)
3.03 Inflation (rank change: -68, score change: -5.4) Pillar 4: Health and Primary Education
Rank Change: 6; Score Change 0.1
Georgia’s overall rank in this pillar increased due to increases in education related indicators, despite the decrease in rank of the following health-related indicators:
4.01 Business impact of malaria (rank change: -4, score change: -0.4)
4.03 Business impact of tuberculosis (rank change: -14, score change: -0.5)
4.05 Business impact of HIV/AIDS (rank change: -8 , score change: -0.2 )
Pillar 5: Higher Education and Training Rank Change: 2; Score Change: 0.2
While Georgia’s rank for this pillar increased slight, indicator 5.02: Tertiary education enrollment rate fell by in rank by 16 places.
EFFICIENCY ENHANCERS
Pillar 6: Goods Market Efficiency Rank Change: -10, Score Change: 0
While the overall score of the sixth pillar remained unchanged, Georgia’s rank declined by 10 places (6 percentiles) for this indicator. While indicator 6.13: Burden of custom procedures increased in rank by 12 places, a significant drop in rank was reported for the following indicators:
6.04: Extent and effect of taxation (rank change: -11, score change: -0.3)

2011-2012 WEF GLOBAL COMPETITIVENESS REPORT: GEORGIA FINAL
ECONOMIC PROSPERITY INITIATIVE (EPI) 13
“What impact does the level of taxes in your country have on incentives to work or invest?” [1 = significantly limits incentives to work or invest; 7 = has no impact on incentives to work or invest]
Given the overall low level of taxes in Georgia (Georgia ranks 8th among 140 countries in terms of the lowest total tax level)., it would have been expected that the score would be higher given that low tax level do not limit incentives to work or invest. However, the score has been reduced by 0.3 (from 4.2 to 3.9), and the country ranking worsened by 11 places. This worsening of the perception is likely due to changes in tax levels effective as of January 2011, just before the EOS was conducted.
6.11: Prevalence of foreign ownership (rank change: -21, score change: -0.4) “How prevalent is foreign ownership of companies in your country?” [1 = very rare; 7 = highly prevalent] The score has been reduced by 0.4 (from 4.5 to 4.1), and the country ranking worsened by 21 places. The worsening may be attributed to a lower level of foreign investment in Georgia in comparison to pre-crisis years, or due to lower awareness of the selected group of respondents about firms’ with foreign ownership.

2011-2012 WEF GLOBAL COMPETITIVENESS REPORT: GEORGIA FINAL
ECONOMIC PROSPERITY INITIATIVE (EPI) 14
GEORGIA’S POSITION RELATIVE TO OTHER COUNTRIES Of Georgia’s 12 peer countries, it scores tenth highest in the GCI. Of the three GCI subindices, Georgia’s score relative to its peers is highest in the Basic Requirements subindex, followed by Efficiency Enhancers and then Innovation and Sophistication.
TABLE 8. COMPARISON OF RANKINGS AND SCORES, WEF GCR 2011-2012
Overall Index Basic Requirements Efficiency Enhancers Innovation and Sophistication
Country Rank Score Country Rank Score Country Rank Score Country Rank Score
1 Estonia 33 4.62 1 Estonia 27 5.41 1 Czech Republic 29 4.63 1 Czech
Republic 32 4.09
2 Czech Republic 38 4.52 2
Czech Rep. 45 4.9 2 Estonia 36 4.52 2 Estonia 37 3.98
3 Azerbaijan 55 4.31 3 Croatia 52 4.76 3 Turkey 52 4.22 3 Turkey 58 3.62 4 Turkey 59 4.28 4 Azerbaijan 59 4.68 4 Bulgaria 59 4.1 4 Azerbaijan 67 3.51 5 Bulgaria 74 4.16 5 Turkey 64 4.61 5 Romania 62 4.09 5 Croatia 82 3.37
6 Croatia 76 4.08 6 Macedonia, FYR 69 4.55 6 Croatia 72 4.01 6 Ukraine 93 3.29
7 Romania 77 4.08 7 Bulgaria 74 4.46 7 Ukraine 74 4 7 Bulgaria 96 3.24
8 Macedonia, FYR 79 4.05 8 Georgia 86 4.32 8 Azerbaijan 77 3.99 8 Romania 99 3.2
9 Ukraine 82 4 9 Romania 89 4.28 9 Macedonia, FYR 87 3.83 9 Macedonia,
FYR 104 3.14
10 Georgia 88 3.95 10 Serbia 88 4.28 10 Georgia 89 3.74 10 Armenia 110 3.09 11 Armenia 92 3.89 11 Armenia 94 4.24 11 Armenia 91 3.73 11 Georgia 117 3.01 12 Moldova 93 3.89 12 Ukraine 98 4.18 12 Serbia 90 3.73 12 Serbia 118 2.99 13 Serbia 95 3.88 13 Moldova 102 4.13 13 Moldova 103 3.62 13 Moldova 127 2.86

2011-2012 WEF GLOBAL COMPETITIVENESS REPORT: GEORGIA FINAL
ECONOMIC PROSPERITY INITIATIVE (EPI) 15
In the Basic Requirements subindex Georgia has the best position in the institutions pillar, 60th rank in the world and the second place among peer 12 countries. This position is conditioned by the following indicators: Burden of government regulation (world rank 7), Strength of investor protection (world rank 20), Irregular payments and bribes (world rank 33), Transparency of government policymaking (world rank 36), Diversion of public funds (world rank 39) and Reliability of police services (world rank 42).
In the same subindex, Georgia has the worst position in the Macroeconomic Environment, 137th rank in the world and the last, 13th place among peer countries. This undesirable position was caused by high inflation and government budget deficit in 2010. Also, interest rate spread increased in 2010 and reached to 15 percent point.
Pillar 1: Institutions Pillar 2: Infrastructure Pillar 3: Macroeconomic
Environment Pillar 4: Health and Primary
Education
Country Rank Score Country Rank Score Country Rank Score Country Rank Score
1 Estonia 29 4.99 1 Czech Republic 36 4.87 1 Azerbaijan 16 5.89 1 Estonia 26 6.26
2 Georgia 60 3.97 2 Croatia 39 4.73 2 Estonia 21 5.71 2 Croatia 48 5.96
3 Azerbaijan 68 3.84 3 Estonia 40 4.71 3 Macedonia, FYR 37 5.34 3
Czech Republic 51 5.91
4 Turkey 80 3.69 4 Turkey 51 4.39 4 Czech Republic 43 5.17 4 Serbia 52 5.82
5 Macedonia, FYR 81 3.68 5 Georgia 68 3.95 5 Bulgaria 46 5.13 5 Bulgaria 57 5.8
6 Czech Republic 84 3.65 6 Azerbaijan 73 3.87 6 Turkey 69 4.76 6 Romania 66 5.72
7 Armenia 83 3.65 7 Ukraine 71 3.87 7 Croatia 70 4.75 7 Georgia 67 5.7
8 Croatia 90 3.59 8 Armenia 77 3.75 8 Romania 87 4.52 8 Ukraine 74 5.64
9 Romania 99 3.49 9 Serbia 84 3.67 9 Serbia 91 4.48 9 Turkey 75 5.62
10 Moldova 106 3.38 10 Macedonia, FYR 86 3.66 10 Moldova 103 4.34 10
Macedonia, FYR 80 5.53
11 Bulgaria 110 3.32 11 Bulgaria 87 3.62 11 Ukraine 112 4.21 11 Moldova 86 5.46
12 Serbia 121 3.15 12 Romania 95 3.37 12 Armenia 114 4.19 12 Armenia 94 5.37
13 Ukraine 131 2.98 13 Moldova 96 3.32 13 Georgia 137 3.65 13 Azerbaijan 105 5.12

2011-2012 WEF GLOBAL COMPETITIVENESS REPORT: GEORGIA FINAL
ECONOMIC PROSPERITY INITIATIVE (EPI) 16
In the Efficiency Enhancers subindex Georgia has the best position in the Labor Market Efficiency pillar, 32th rank in the world and the third place among peer countries, which one is conditioned by the following indicators: Redundancy costs (world rank 6), Hiring and firing practices (world rank 10), Rigidity of employment index (world rank 10) and Flexibility of wage determination (world rank 34), but Brain drain (world rank 102) and Reliance on professional management (world rank 85) still stay a problematic issue.
In the same subindex, among peer 12 countries, Georgia has the worst position in the Higher Education and the Technological Readiness pillars. Quality of education system and Availability of research and training services indicators received low estimations – 3.0 and 3.2. The low rank in the Technological Readiness is conditioned by bad estimations in the availability of latest technologies and firm-level technology absorption.
Pillar 5: Higher Education and Training
Pillar 6: Goods Market Efficiency Pillar 7: Labor Market Efficiency Pillar 8: Financial Market
Development
Country Rank Score Country Rank Score Country Rank Score Country Rank Score
1 Estonia 23 5.15 1 Estonia 29 4.74 1 Azerbaijan 14 4.95 1 Estonia 41 4.51
2 Czech Republic 30 4.95 2
Czech Republic 36 4.58 2 Estonia 16 4.92 2
Czech Republic 53 4.31
3 Ukraine 51 4.58 3 Turkey 47 4.38 3 Georgia 32 4.74 3 Turkey 55 4.26
4 Romania 55 4.42 4 Macedonia, FYR 63 4.26 4 Armenia 34 4.71 4 Bulgaria 75 3.99
5 Croatia 56 4.41 5 Georgia 74 4.16 5 Czech Republic 42 4.62 5
Macedonia, FYR 82 3.94
6 Bulgaria 70 4.16 6 Azerbaijan 79 4.12 6 Bulgaria 56 4.49 6 Romania 84 3.91
7 Turkey 74 4.02 7 Bulgaria 86 4.08 7 Ukraine 61 4.44 7 Croatia 87 3.87
8 Azerbaijan 75 4.01 8 Romania 96 3.96 8 Macedonia, FYR 72 4.33 8 Azerbaijan 94 3.76
9 Armenia 76 4.01 9 Moldova 98 3.94 9 Moldova 75 4.31 9 Armenia 95 3.76
10 Macedonia, FYR 80 3.98 10 Armenia 108 3.88 10 Romania 92 4.1 10 Serbia 96 3.74
11 Serbia 81 3.98 11 Croatia 114 3.81 11 Serbia 112 3.94 11 Georgia 99 3.68
12 Moldova 83 3.93 12 Ukraine 129 3.58 12 Croatia 116 3.89 12 Moldova 105 3.6
13 Georgia 88 3.87 13 Serbia 132 3.49 13 Turkey 133 3.51 13 Ukraine 116 3.39

2011-2012 WEF GLOBAL COMPETITIVENESS REPORT: GEORGIA FINAL
ECONOMIC PROSPERITY INITIATIVE (EPI) 17
Pillar Financial Market Development stays one of the weak area in the Georgia’s competitiveness (99th rank in the world), but it is closed to neighbor countries positions, Armenia and Azerbaijan take 95th and 94th places. Georgia’s financial market main disadvantages are low availability of financing through local equity market (world rank 122), Venture capital availability (world rank 97) and Regulation of securities exchanges (world rank 122).
Innovation and Sophistication subindex is a weak area in Georgia’s competitiveness, Company spending on R&D (world rank 124), Quality of scientific research institutions (world rank 117), Availability of scientists and engineers (world rank 120) and University-industry collaboration in R&D (world rank 126) receives the low estimations.
Pillar 9: Technological Readiness Pillar 10: Market Size Pillar 11: Business Sophistication Pillar 12: Innovation
Country Rank Score Country Rank Score Country Rank Score Country Rank Score
1 Estonia 27 4.95 1 Turkey 17 5.19 1 Czech Republic 36 4.42 1 Estonia 30 3.81
2 Czech Republic 31 4.82 2 Ukraine 38 4.54 2 Estonia 53 4.16 2
Czech Republic 33 3.77
3 Croatia 38 4.5 3 Czech Republic 40 4.48 3 Turkey 58 4.09 3 Azerbaijan 60 3.2
4 Bulgaria 50 4.11 4 Romania 44 4.39 4 Azerbaijan 73 3.81 4 Turkey 69 3.15
5 Turkey 55 3.95 5 Bulgaria 64 3.8 5 Croatia 88 3.66 5 Ukraine 74 3.11
6 Romania 60 3.76 6 Serbia 70 3.61 6 Bulgaria 96 3.55 6 Croatia 76 3.09
7 Macedonia, FYR 67 3.67 7 Croatia 72 3.57 7 Romania 102 3.48 7 Bulgaria 93 2.94
8 Serbia 71 3.63 8 Azerbaijan 75 3.5 8 Ukraine 103 3.48 8 Romania 95 2.91
9 Azerbaijan 74 3.6 9 Estonia 100 2.89 9 Macedonia, FYR 105 3.47 9 Serbia 97 2.9
10 Moldova 78 3.52 10 Georgia 106 2.8 10 Armenia 107 3.43 10 Macedonia, FYR 105 2.81
11 Ukraine 82 3.47 11 Macedonia, FYR 107 2.79 11 Georgia 110 3.39 11 Armenia 112 2.74
12 Armenia 88 3.43 12 Armenia 115 2.57 12 Moldova 117 3.27 12 Georgia 118 2.62
13 Georgia 100 3.23 13 Moldova 122 2.43 13 Serbia 130 3.08 13 Moldova 128 2.44
2011-2012 WEF GLOBAL COMPETITIVENESS REPORT: GEORGIA FINAL
ECONOMIC PROSPERITY INITIATIVE (EPI) 18
CONCLUDING REMARKS While Georgia continues to show improvements in its competitiveness, there are still significant development areas that need to be addressed in order to allow Georgia to increase its competitiveness.
Georgia ranked 88th in the 2011 GCI rankings, up from the 93rd place in 2010. Georgia has performed best in the Basic Requirements subindex, followed closely by the Efficiency Enhancers subindex. While most of Georgia’s rank in individual pillars is close to its rank for that respective subindex, there are two notable outliers: Georgia ranked 32nd in Pillar 7: Labor Market Efficiency, and 137th in Pillar 3: Macroeconomic Environment.
Since the Georgian government already carried out macroeconomic stabilization policy, budget deficit has diminished in 2011 to 1 % of GDP, the national saving rate increased up to 10 % and the interest rate spread diminished to 10 %. All of these changes are anticipated to positively impact the overall score and associated ranking for the upcoming GCR.
For Georgia’s competitiveness, the main challenges include higher education system improvement and financial market development, with the latter significantly depending on the local equity market expansion.
According to the WEF’s methodology, it is anticipated that Georgia will be classified as an Efficiency Driven Economy in the WEF GCR 2012-2013. Therefore, Efficiency Enhancers and Innovation and Sophistication subindices will have more weight in the estimated overall Georgia’s competitiveness score and rank than it did for the this latest GCR. Technological readiness and innovation’s indicators will have a higher weight, and this may worsen the overall positions for Georgia given the country’s currently weaker performance (around 100th rank) in this pillar. Innovation improvement requires an increase in R&D, an increased capacity level of research institutions and tightening of the university-industry collaboration.
Georgia has the highest ranks in the primary education enrollment rate (rank 3), time required to start a business (rank 3), trade tariffs (3 rank), redundancy costs (rank 6) and burden of government regulation (rank 7). Georgia’s worst rankings include national savings rate (rank 135), interest rate spread (129), local supplier quantity (rank 138), local supplier quality (rank 130) and effectiveness of anti-monopoly policy (rank 135).
To ensure that the WEF EOS is an accurate representative of business opinions in Georgia, EPI is assisting Business Initiative for Reforms in Georgia (BIRG) with outreach efforts to increase awareness and knowledge about the importance of the WEF EOS. This assistance began earlier this year with a presentation on the WEF GCR 2011-2012 results at the annual American-Georgian Business Council Competitiveness Conference. EPI also works with BIRG to increase its sampling frame of businesses to ensure a more accurate representation of Georgian businesses.
EPI also assisted with the hard data analysis and improvement of linkages between Georgian national agencies (National Communications Commission and the Ministry of Health) to improve the accuracy and timeliness of data submission to relevant international agencies.

2011-2012 WEF GLOBAL COMPETITIVENESS REPORT: GEORGIA FINAL
ECONOMIC PROSPERITY INITIATIVE (EPI) 19
ANNEX A: GEORGIAN 2011-2012 AND 2010-2011 WEF GCR INDICATORS
WEF Indicators
GCR 2011-2012
GCR 2010-2011 Rank
Change Score
Change Rank Score Rank Score
OVERALL GCI 88 4 93 3.9 5 0.1
Basic Requirements 86 4.3 95 4.1 9 0.2
1st pillar: Institutions 60 4 69 3.9 9 0.1
101 Property rights 120 3.2 120 3.2 0 0 102 Intellectual property protection 105 2.8 97 2.9 -8 -0.1 103 Diversion of public funds 39 4.5 46 4.1 7 0.4 104 Public trust of politicians 65 2.8 78 2.6 13 0.2 105 Irregular payments and bribes 33 5.3 42 4.9 9 0.4 106 Judicial independence 91 3.2 104 2.9 13 0.3 107 Favoritism in decisions of government officials 54 3.2 68 3 14 0.2 108 Wastefulness of government spending 52 3.5 52 3.4 0 0.1 109 Burden of government regulation 7 4.5 4 4.6 -3 -0.1 110 Efficiency of legal framework in settling disputes 82 3.4 89 3.4 7 0 111 Efficiency of legal framework in challenging regulations 92 3.1 98 3.1 6 0 112 Transparency of government policymaking 36 4.8 33 4.9 -3 -0.1 113 Business costs of terrorism 69 5.6 61 5.9 -8 -0.3 114 Business costs of crime and violence 49 5.2 41 5.5 -8 -0.3 115 Organized crime 67 5.2 63 5.4 -4 -0.2 116 Reliability of police services 42 5 45 4.7 3 0.3 117 Ethical behavior of firms 61 3.9 78 3.8 17 0.1 118 Strength of auditing and reporting standards 88 4.3 92 4.3 4 0 119 Efficacy of corporate boards 116 4.1 109 4.1 -7 0 120 Protection of minority shareholders’ interests 119 3.5 122 3.5 3 0 121 Strength of investor protection 20 6.7 33 6 13 0.7 2nd pillar: Infrastructure 68 4 73 3.8 5 0.2
201 Quality of overall infrastructure 54 4.6 62 4.4 8 0.2 202 Quality of roads 57 4.2 65 3.9 8 0.3 203 Quality of railroad infrastructure 35 3.9 41 3.6 6 0.3 204 Quality of port infrastructure 68 4.2 75 4 7 0.2

2011-2012 WEF GLOBAL COMPETITIVENESS REPORT: GEORGIA FINAL
ECONOMIC PROSPERITY INITIATIVE (EPI) 20
WEF Indicators
GCR 2011-2012
GCR 2010-2011 Rank
Change Score
Change Rank Score Rank Score
205 Quality of air transport infrastructure 88 4.2 86 4.2 -2 0 206 Available airline seat kilometers 106 33.3 111 23.6 5 9.7 207 Quality of electricity supply 52 5.4 58 5.1 6 0.3 208 Fixed telephone lines 85 13.7 84 14.6 -1 -0.9 209 Mobile telephone subscriptions 104 73.4 103 66.6 -1 6.8 3rd pillar: Macroeconomic environment 137 3.7 130 3.3 -7 0.4
301 Government budget balance 87 -4.8 127 -9.4 40 4.6 302 National savings rate 135 5.2 110 12.3 -25 -7.1 303 Inflation 115 7.1 47 1.7 -68 5.4 304 Interest rate spread 129 15 128 15.2 -1 -0.2 305 Government debt 66 39.1 n/a 306 Country credit rating 97 35.2 104 30.9 7 4.3 4th pillar: Health and primary education 67 5.7 73 5.6 6 0.1
401 Business impact of malaria 83 5.8 79 6.2 -4 -0.4 402 Malaria incidence 75 1.9 76 1.9 1 0 403 Business impact of tuberculosis 92 4.9 78 5.4 -14 -0.5 404 Tuberculosis incidence 92 107 89 106.9 -3 0.1 405 Business impact of HIV/AIDS 78 5.1 70 5.3 -8 -0.2 406 HIV prevalence 21 0.1 22 0.1 1 0 407 Infant mortality 94 26 92 26.5 -2 -0.5 408 Life expectancy 87 71.7 86 71.5 -1 0.2 409 Quality of primary education 99 3.2 105 3 6 0.2 410 Primary education enrollment rate 3 99.6 17 98.7 14 0.9 Efficiency enhancers 89 3.7 94 3.7 5 0
5th pillar: Higher education and training 88 3.9 90 3.7 2 0.2
501 Secondary education enrollment rate 11 108.5 59 90 48 18.5 502 Tertiary education enrollment rate 82 25.5 66 34.3 -16 -8.8 503 Quality of the educational system 116 3 119 2.9 3 0.1 504 Quality of math and science education 100 3.4 104 3.2 4 0.2 505 Quality of management schools 115 3.4 116 3.4 1 0 506 Internet access in schools 67 4.1 74 3.7 7 0.4 507 Local availability of research and training services 115 3.2 125 3 10 0.2 508 Extent of staff training 106 3.5 108 3.4 2 0.1 6th pillar: Goods market efficiency 74 4.2 64 4.2 -10 0
601 Intensity of local competition 128 3.9 124 3.9 -4 0 602 Extent of market dominance 112 3.2 113 3.2 1 0

2011-2012 WEF GLOBAL COMPETITIVENESS REPORT: GEORGIA FINAL
ECONOMIC PROSPERITY INITIATIVE (EPI) 21
WEF Indicators
GCR 2011-2012
GCR 2010-2011 Rank
Change Score
Change Rank Score Rank Score
603 Effectiveness of anti-monopoly policy 135 2.9 135 2.8 0 0.1 604 Extent and effect of taxation 35 3.9 24 4.2 -11 -0.3 605 Total tax rate 8 15.3 7 15.3 -1 0 606 Number of procedures required to start a business 8 3 6 3 -2 0 607 Time required to start a business 3 3 3 3 0 0 608 Agricultural policy costs 115 3.3 114 3.5 -1 -0.2 609 Prevalence of trade barriers 37 4.9 33 5 -4 -0.1 610 Trade tariffs 3 0.7 3 0.7 0 0 611 Prevalence of foreign ownership 110 4.1 89 4.5 -21 -0.4 612 Business impact of rules on FDI 53 4.9 44 5 -9 -0.1 613 Burden of customs procedures 27 4.9 39 4.7 12 0.2 614 Import as percentage of GDP 52 52.2 43 55.1 -9 -2.9 615 Degree of customer orientation 118 3.9 127 3.7 9 0.2 616 Buyer sophistication 93 3.1 87 3.2 -6 -0.1 7th pillar: Labor market efficiency 32 4.7 31 4.8 -1 -0.1
701 Cooperation in labor-employer relations 76 4.2 77 4.2 1 0 702 Flexibility of wage determination 34 5.5 26 5.6 -8 -0.1 703 Rigidity of employment 10 7 10 7 0 0 704 Hiring and firing practices 10 5 9 5.2 -1 -0.2 705 Redundancy costs 6 4 6 4 0 0 706 Pay and productivity 57 4 59 4.1 2 -0.1 707 Reliance on professional management 85 3.9 88 4 3 -0.1 708 Brain drain 102 2.9 104 2.7 2 0.2 709 Female participation in labor force 75 0.76 81 0.75 6 0.01 8th pillar: Financial market development 99 3.7 108 3.6 9 0.1
801 Availability of financial services 107 3.9 106 3.9 -1 0 802 Affordability of financial services 96 3.7 108 3.5 12 0.2 803 Financing through local equity market 122 2.4 125 2.2 3 0.2 804 Ease of access to loans 79 2.7 83 2.5 4 0.2 805 Venture capital availability 97 2.2 109 2.1 12 0.1 806 Restriction on capital flows 40 5 807 Soundness of banks 104 4.6 109 4.5 5 0.1 808 Regulation of securities exchanges 122 3.3 124 3.1 2 0.2 809 Legal rights index 39 7 60 6 21 1 9th pillar: Technological readiness 100 3.2 98 3.1 -2 0.1
901 Availability of latest technologies 99 4.5 98 4.3 -1 0.2

2011-2012 WEF GLOBAL COMPETITIVENESS REPORT: GEORGIA FINAL
ECONOMIC PROSPERITY INITIATIVE (EPI) 22
WEF Indicators
GCR 2011-2012
GCR 2010-2011 Rank
Change Score
Change Rank Score Rank Score
902 Firm-level technology absorption 115 4.1 125 4 10 0.1 903 FDI and technology transfer 98 4.2 92 4.3 -6 -0.1 904 Internet users 85 27 73 30.5 -12 -3.5 905 Broadband Internet subscriptions 72 5.1 75 3.5 3 1.6 906 Internet bandwidth 62 5.7 77 7.5 15 -1.8 10th pillar: Market size 106 2.8 107 2.8 1 0
1001 Domestic market size index 102 2.7 102 2.7 0 0 1002 Foreign market size index 114 3.2 115 3.2 1 0 1003 GDP PPP 107 22.4 107 20.9 1 1.5 1004 Exports as percentage of GDP 100 26.3 94 27.3 1 -1 Innovation and Sophistication 117 3 121 2.9 4 0.1
11th pillar: Business sophistication 110 3.4 111 3.3 1 0.1
1101 Local supplier quantity 138 3.7 137 3.6 -1 0.1 1102 Local supplier quality 130 3.6 131 3.4 1 0.2 1103 State of cluster development 102 3 98 3 -4 0 1104 Nature of competitive advantage 73 3.3 82 3.1 9 0.2 1105 Value chain breadth 87 3.3 93 3.2 6 0.1 1106 Control of international distribution 95 3.8 88 3.8 -7 0 1107 Production process sophistication 110 3 116 2.9 6 0.1 1108 Extent of marketing 107 3.5 102 3.4 -5 0.1 1109 Willingness to delegate authority 116 3 115 3 -1 0 12th pillar: Innovation 118 2.6 125 2.5 7 0.1
1201 Capacity for innovation 103 2.6 112 2.4 9 0.2 1202 Quality of scientific research institutions 117 2.7 119 2.7 2 0 1203 Company spending on R&D 124 2.5 132 2.3 8 0.2 1204 University-industry collaboration in R&D 126 2.6 134 2.5 8 0.1 1205 Gov’t procurement of advanced tech products 76 3.5 102 3.2 26 0.3 1206 Availability of scientists and engineers 120 3.3 122 3.2 2 0.1 1207 Utility patents per million population 65 0.5 72 0.2 7 0.3

2011-2012 WEF GLOBAL COMPETITIVENESS REPORT: GEORGIA FINAL
USAID Economic Prosperity Initiative (EPI) 6 Samgebro St. Tbilisi, Georgia
Phone: +995 32 43 89 24/25/26
Fax: +995 32 43 89 27
Related Documents


