Kansas Turnpike Authority Financial Statements with Supplementary Information Years ended December 31, 2010 and 2009 with Independent Auditors’ Report

2010Financials
Mar 18, 2016
http://www.ksturnpike.com/assets/uploads/2010Financials.pdf
Welcome message from author
This document is posted to help you gain knowledge. Please leave a comment to let me know what you think about it! Share it to your friends and learn new things together.
Transcript
Kansas Turnpike AuthorityFinancial Statements
with Supplementary Information
Years ended December 31, 2010 and 2009with
Independent Auditors’ Report
Table of ContentsIndependent Auditors’ Report ................................................................................11
Management’s Discussion and Analysis ............................................................. 12-15
Basic Financial Statements:
Balance Sheets ........................................................................................... 16-17
Statements of Revenues, Expenses and Changes in Net Assets ..........................18
Statements of Cash Flows ................................................................................19
Notes to Financial Statements ..................................................................... 20-30
Required Supplementary Information ........................................................... 31
Supplementary Information:
Combining Balance Sheet ........................................................................... 32-33
Combining Statement of Revenues, Expenses and Changes in Net Assets ....... 34-35
Summary of Toll Revenue ................................................................................36
Statistical Data:
Operating Summaries – Vehicles, Mileage and Revenue .....................................37
ScheduleofServiceAreaTrafficandSales ........................................................38
Schedule of Activity by Interchange ...................................................................39
Schedule of Monthly Vehicles, Mileage and Toll Revenue ....................................39
SummaryofTurnpikeTraffic .............................................................................40
SummaryofAverageDailyTrafficBetweenInterchanges ....................................40
ThisisacopyoftheAuthority’sannualfinancialstatementsreproducedfromanelectronicfile. AnoriginalcopyofthisdocumentisavailableattheAuthority’soffice.
10
Independent Auditors’ ReportBoard of DirectorsKansas Turnpike Authority
We have audited the accompanying basic financial statements of the Kansas Turnpike Authority as of and for the years ended December 31, 2010 and 2009, as listed in the table of contents. These financial statements are the responsibility of the Turnpike’s management. Our responsibility is to express an opinion on these financial statements based on our audits.
We conducted our audits in accordance with auditing standards generally accepted in the United States of America. Those standards require that we plan and perform the audits to obtain reasonable assurance about whether the financial statements are free of material misstatement. An audit includes examining, on a test basis, evidence supporting the amounts and disclosures in the basic financial statements. An audit also includes assessing the accounting principles used and significant estimates made by management, as well as evaluating the overall basic financial statement presenta-tion. We believe that our audits provide a reasonable basis for our opinion.
As explained in Note 1, the Turnpike does not provide for recognition of depreciation on turnpike facilities; does not capitalize interest costs; capitalizes only the costs of improvements and replace-ments financed or expected to be financed in part by bond proceeds; and capitalizes bond issuance costs and related premiums and discounts as part of turnpike facilities without amortizing such costs (collectively, the “Exceptions”). These practices are not, in our opinion, in accordance with accounting principles generally accepted in the United States of America. The effects of these practices on the financial statements have not been determined.
In our opinion, except for the effects of the Exceptions as discussed in the preceding paragraph, the financial statements referred to above present fairly, in all material respects, the financial position of the Kansas Turnpike Authority as of December 31, 2010 and 2009, and its changes in financial position and its cash flows for the years then ended in conformity with accounting principles generally accepted in the United States of America.
The accompanying management’s discussion and analysis and required supplementary information as listed in the table of contents are not a required part of the basic financial statements but are supplementary information required by accounting principles accepted in the United States of America. We have applied certain limited procedures, which consisted principally of inquiries of management regarding the methods of measurement and presentation of the required supplemen-tary information. However, we did not audit the information and express no opinion on it.
Our audits were conducted for the purpose of forming an opinion on the Turnpike’s basic financial statements. The accompanying supplementary information as listed in the table of contents is presented for purposes of additional analysis and is not a required part of the basic financial statements. Such information has been subjected to the auditing procedures applied in the audits of the basic financial statements and, in our opinion, except for the effects of the accounting methods discussed in the third paragraph of our report on the basic financial statements, such information is fairly stated, in all material respects, in relation to the basic financial statements taken as a whole. The statistical data has not been subjected to the auditing procedures applied in the audits of the basic financial statements and, accordingly, we express no opinion thereon.
February 22, 2011Wichita, Kansas
11
Management’s Discussion and AnalysisOur discussion and analysis of The Kansas Turnpike Authority’s (KTA or Turnpike) financial performance provides an overview of the Turnpike’s financial activities for the fiscal year ended December 31, 2010. Please read it in conjunction with the Turnpike’s financial statements and associated footnotes.
Financial HighlightsThe Turnpike’s net assets increased in 2010 by approximately $17.0 million or 4.2% compared to 2009.•Operating income decreased by approximately $6.7 million or 20% in 2010 compared to 2009. By •excluding the cost of improvements, major repairs, and replacements from both years, operating income would have increased over $5.2 million (11%) in comparison to 2009.Long term debt decreased by approximately $5.5 million or 1.9% in 2010 compared to 2009. •$54 million of bonds originally issued in 2002 were refunded at lower interest rates, resulting in a present-value savings of $4.4 million.During 2010, the KTA’s bond rating was upgraded to “Aa3” by Moodys for bonds issued prior to •2009 and “AA-“ by Standard and Poors for all outstanding bond issues.
Using this Annual ReportThis discussion and analysis is intended to serve as an introduction to the KTA’s financial statements, which are comprised of the basic financial statements and the notes to the financial statements and supplemen-tary information presented. Since the KTA operates like a single enterprise fund, fund level financial state-ments are not shown.
The basic financial statements are designed to provide readers with a broad overview of the KTA’s finances, in a manner similar to a private-sector business. The Turnpike’s financial statements consist of three state-ments – balance sheet; statement of revenues, expenses and changes in net assets; and statement of cash flows. These statements provide information about the activities of the Turnpike, including resources held by the Turnpike but restricted for specific purposes by bond trust indentures. In addition to the basic financial statements, this report also contains other supplementary information concerning the Turnpike’s traffic and revenues by vehicle class, as required by bond trust indentures. Supplementary information also includes a Combining Balance Sheet, which reports the assets and liabilities of the KTA’s various funds.
The Balance Sheet and Statement of Revenues, Expenses, and Change in Net AssetsOne of the most important questions asked about the Turnpike’s finances is, “Is the Turnpike as a whole better or worse off as a result of the year’s activities?” The Balance Sheet and the Statement of Revenues, Expenses, and Changes in Net Assets report information about the Turnpike’s resources and its activities in a way that helps answer this question. These statements include all restricted and unrestricted assets and all liabilities using the accrual basis of accounting. All of the current year’s revenues and expenses are taken into account regardless of when cash is received or paid.
These two statements report the Turnpike’s net assets and changes in them. You can think of the Turn-pike’s net assets – the difference between assets and liabilities – as one way to measure the Turnpike’s financial health, or financial position. Over time, increases or decreases in the Turnpike’s net assets are one indicator of whether its financial health is improving or deteriorating. You will need to consider other nonfi-nancial factors, however, such as changes in the Turnpike’s customer base and measures of the quality of service it provides, as well as local economic factors to assess the overall health of the Turnpike.
The Statement of Cash FlowsThe final required statement is the Statement of Cash Flows. The statement reports cash receipts, cash payments, and net changes in cash resulting from operations, investing, and financing activities. It pro-vides answers to such questions as “Where did cash come from?”, “What was cash used for?”, and “What was the change in cash balance during the reporting period?”
12
Notes to the Financial StatementsThe notes provide additional information that is essential to a full understanding of the data provided in the basic financial statements.
Other InformationIn addition to the basic financial statements and accompanying notes, this report also presents certain supplemen-tary information concerning Turnpike traffic and revenues by vehicle class, as required by bond trust indentures.
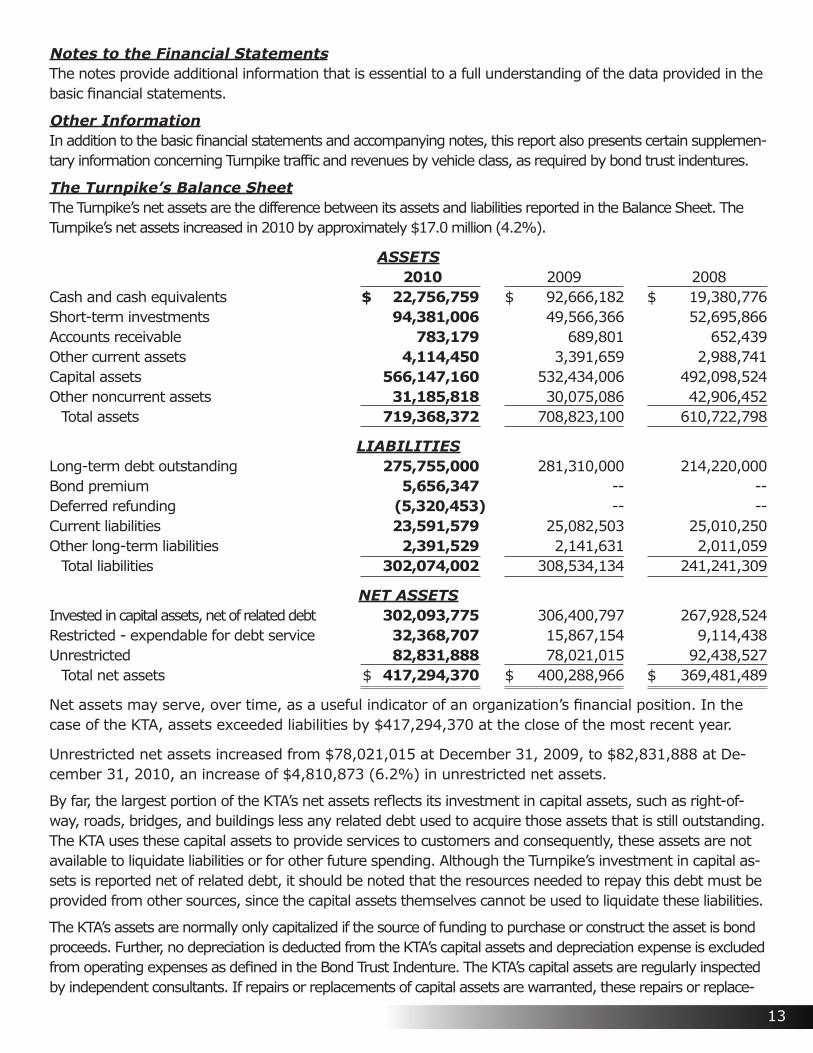
The Turnpike’s Balance SheetThe Turnpike’s net assets are the difference between its assets and liabilities reported in the Balance Sheet. The Turnpike’s net assets increased in 2010 by approximately $17.0 million (4.2%).
ASSETS 2010 2009 2008Cash and cash equivalents $ 22,756,759 $ 92,666,182 $ 19,380,776Short-term investments 94,381,006 49,566,366 52,695,866Accounts receivable 783,179 689,801 652,439Other current assets 4,114,450 3,391,659 2,988,741Capital assets 566,147,160 532,434,006 492,098,524Other noncurrent assets 31,185,818 30,075,086 42,906,452
Total assets 719,368,372 708,823,100 610,722,798
LIABILITIESLong-term debt outstanding 275,755,000 281,310,000 214,220,000Bond premium 5,656,347 -- --Deferred refunding (5,320,453) -- --Current liabilities 23,591,579 25,082,503 25,010,250Other long-term liabilities 2,391,529 2,141,631 2,011,059
Total liabilities 302,074,002 308,534,134 241,241,309
NET ASSETSInvested in capital assets, net of related debt 302,093,775 306,400,797 267,928,524Restricted - expendable for debt service 32,368,707 15,867,154 9,114,438Unrestricted 82,831,888 78,021,015 92,438,527
Total net assets $ 417,294,370 $ 400,288,966 $ 369,481,489
Net assets may serve, over time, as a useful indicator of an organization’s financial position. In the case of the KTA, assets exceeded liabilities by $417,294,370 at the close of the most recent year.
Unrestricted net assets increased from $78,021,015 at December 31, 2009, to $82,831,888 at De-cember 31, 2010, an increase of $4,810,873 (6.2%) in unrestricted net assets.
By far, the largest portion of the KTA’s net assets reflects its investment in capital assets, such as right-of-way, roads, bridges, and buildings less any related debt used to acquire those assets that is still outstanding. The KTA uses these capital assets to provide services to customers and consequently, these assets are not available to liquidate liabilities or for other future spending. Although the Turnpike’s investment in capital as-sets is reported net of related debt, it should be noted that the resources needed to repay this debt must be provided from other sources, since the capital assets themselves cannot be used to liquidate these liabilities.
The KTA’s assets are normally only capitalized if the source of funding to purchase or construct the asset is bond proceeds. Further, no depreciation is deducted from the KTA’s capital assets and depreciation expense is excluded from operating expenses as defined in the Bond Trust Indenture. The KTA’s capital assets are regularly inspected by independent consultants. If repairs or replacements of capital assets are warranted, these repairs or replace-
13
ments may be completed either with or without the use of bond proceeds. Further, as explained in Note 13 of the Financial Statements, as of the end of 2010, the KTA has committed to pay $27 million for construction projects.
Another noteworthy change in the Turnpike’s assets and liabilities is a decrease in the long-term debt outstanding. In November 2010, the KTA refinanced part of its bonds originally issued in 2002. The KTA was fortunate to be able to do this during one of the lowest interest rate environments of the past decade. Interest rates, as measured by the Bond Buyer 20 index, were higher over 99% of the time between 1987 and the date of the KTA’s 2010 bond pricing.
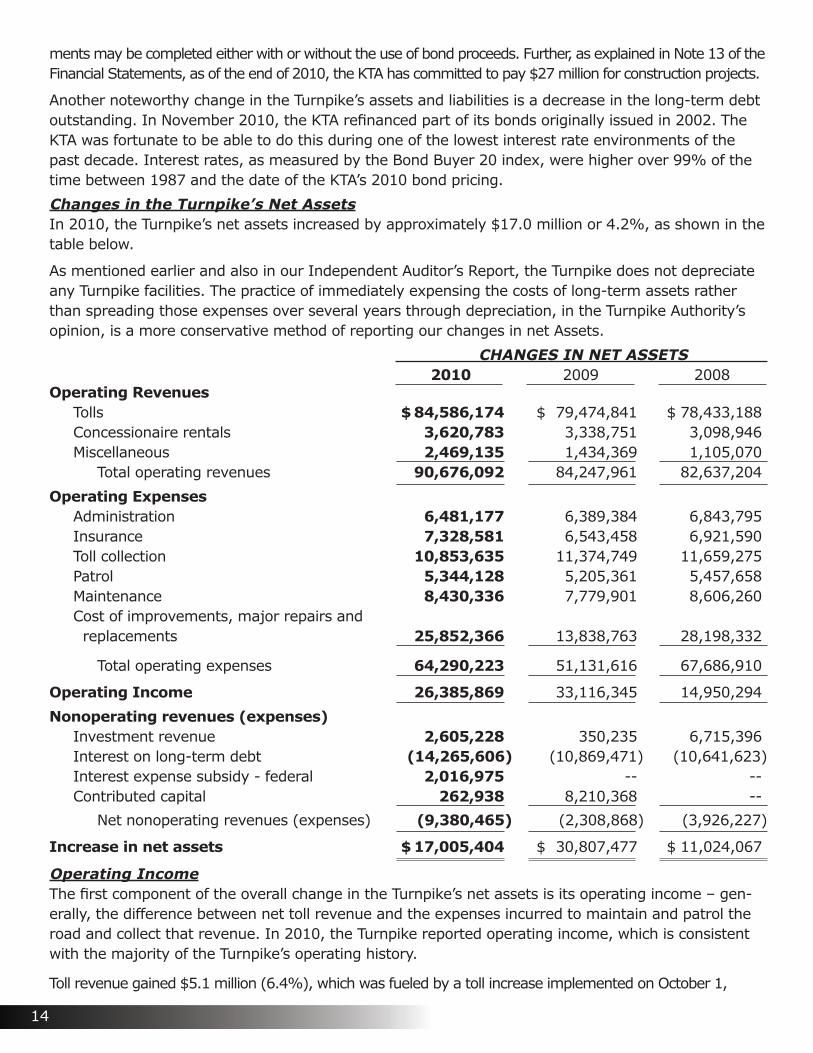
Changes in the Turnpike’s Net AssetsIn 2010, the Turnpike’s net assets increased by approximately $17.0 million or 4.2%, as shown in the table below.
As mentioned earlier and also in our Independent Auditor’s Report, the Turnpike does not depreciate any Turnpike facilities. The practice of immediately expensing the costs of long-term assets rather than spreading those expenses over several years through depreciation, in the Turnpike Authority’s opinion, is a more conservative method of reporting our changes in net Assets.
CHANGES IN NET ASSETS 2010 2009 2008Operating Revenues
Tolls $ 84,586,174 $ 79,474,841 $ 78,433,188Concessionaire rentals 3,620,783 3,338,751 3,098,946Miscellaneous 2,469,135 1,434,369 1,105,070
Total operating revenues 90,676,092 84,247,961 82,637,204
Operating ExpensesAdministration 6,481,177 6,389,384 6,843,795Insurance 7,328,581 6,543,458 6,921,590Toll collection 10,853,635 11,374,749 11,659,275Patrol 5,344,128 5,205,361 5,457,658Maintenance 8,430,336 7,779,901 8,606,260Cost of improvements, major repairs and replacements 25,852,366 13,838,763 28,198,332
Total operating expenses 64,290,223 51,131,616 67,686,910
Operating Income 26,385,869 33,116,345 14,950,294
Nonoperating revenues (expenses)Investment revenue 2,605,228 350,235 6,715,396Interest on long-term debt (14,265,606) (10,869,471) (10,641,623)Interest expense subsidy - federal 2,016,975 -- --Contributed capital 262,938 8,210,368 --
Net nonoperating revenues (expenses) (9,380,465) (2,308,868) (3,926,227)
Increase in net assets $ 17,005,404 $ 30,807,477 $ 11,024,067
Operating IncomeThe first component of the overall change in the Turnpike’s net assets is its operating income – gen-erally, the difference between net toll revenue and the expenses incurred to maintain and patrol the road and collect that revenue. In 2010, the Turnpike reported operating income, which is consistent with the majority of the Turnpike’s operating history.
Toll revenue gained $5.1 million (6.4%), which was fueled by a toll increase implemented on October 1,
14

2009. A major characteristic of the toll increase was the differentiation between K-TAG customers and cus-tomers who stop to pay at the toll booths. The toll for K-TAG customers did not change. In contrast, com-mercial non-K-TAG customers (class 5-9) experienced an approximate 5% increase in fares, and tolls were increased approximately 15% for non-K-TAG customers driving 2, 3, and 4 axle vehicles. The fare differential helped increase K-TAG transactions almost 10% in 2010 compared to 2009. Over 47% of vehicles traveling the Turnpike in 2010 used the K-TAG electronic toll collection system, up from 43% in 2009. The Turnpike’s utilization statistics indicate that overall traffic has increased slightly less than 1% in 2010 compared to 2009. The Turnpike’s Service Station and Restaurant rental revenue increased over 8% in 2010 compared to 2009.
Operating expenses listed in Note 2 of the Financial Statements were $1.1 million (3%) less than budgeted for 2010. Budgeted expenses include the costs of collecting tolls, and administering, insuring, maintain-ing and patrolling the Turnpike. The Turnpike continues to improve efficiency. As one example, after the opening of our first completely unattended toll plaza at the end of 2009, the KTA expanded the use of self-payment machines to a total of 15 toll lanes in 2010. This expansion included renovating two additional formerly-staffed plazas that now operate almost exclusively in unattended mode.
A second component of Operating Expenses is the cost of improvements, major repairs and replacements. Primarily, these expenses reflect purchases of assets and construction projects which have not been financed with bond proceeds. During 2010, the largest single replacement project expensed in this category, for ex-ample, was $12.2 million for replacement of pavement east of Lawrence, Kansas. The total cost of improve-ments, major repairs and replacements was $25.8 million in 2010, but only $13.8 million in 2009. Operating Income was $26.3 million in 2010, and $33.1 million in 2009 - a $6.7 million (20%) decrease. If the costs of improvements, major repairs and replacements were excluded from operating expenses, operating income would have been $52.2 million in 2010 versus $46.9 million in 2009 – over a $5.2 million (11%) increase.
Nonoperating Revenues and ExpensesNonoperating revenues and expenses consist primarily of interest revenue/expense and investment earnings. One new item in this category is the interest subsidy from the federal government. This represents a rebate to compensate for the additional interest paid by the KTA on the taxable Build America Bonds issued in 2009.
The Turnpike’s Cash FlowsChanges in the Turnpike’s operating cash flows are consistent with changes in operating income andnonoperating revenues and expenses, discussed earlier.
CAPITAL ASSET AND DEBT ADMINISTRATIONCapital AssetsAt the end of 2010, the Turnpike reported $566,147,160 invested in capital assets. The Turnpike invested approx-imately $33 million for replacement of the Kansas River Bridges and the nearby Lawrence interchanges in 2010.
DebtAt the end of 2010, the Turnpike had $286,560,000 of bonds outstanding. In November 2010, the Turnpike refunded a portion of bonds issued in 2002. In 2010, Moody’s Investor Service upgraded the rating of KTA bonds issued prior to 2009 at “Aa3”. In conjunction with the 2010 bond issue, Standard & Poors upgraded their rating of the Turnpike’s outstanding bonds to “AA-”. Because of the fortunate timing of the 2010 issue and the improved bond rating by Standard and Poors, the refunding resulted in a present-value savings of over $4.4 million.
Contacting the Turnpike’s Financial ManagementThis financial report is designed to provide our customers, suppliers, investors, and creditors with a general overview of the Turnpike’s finances and of the Turnpike’s accountability for the money it receives. If you have questions about this report or need additional financial informa-tion, contact the Turnpike’s Headquarters at 9401 E. Kellogg, Wichita, KS 67207.
15
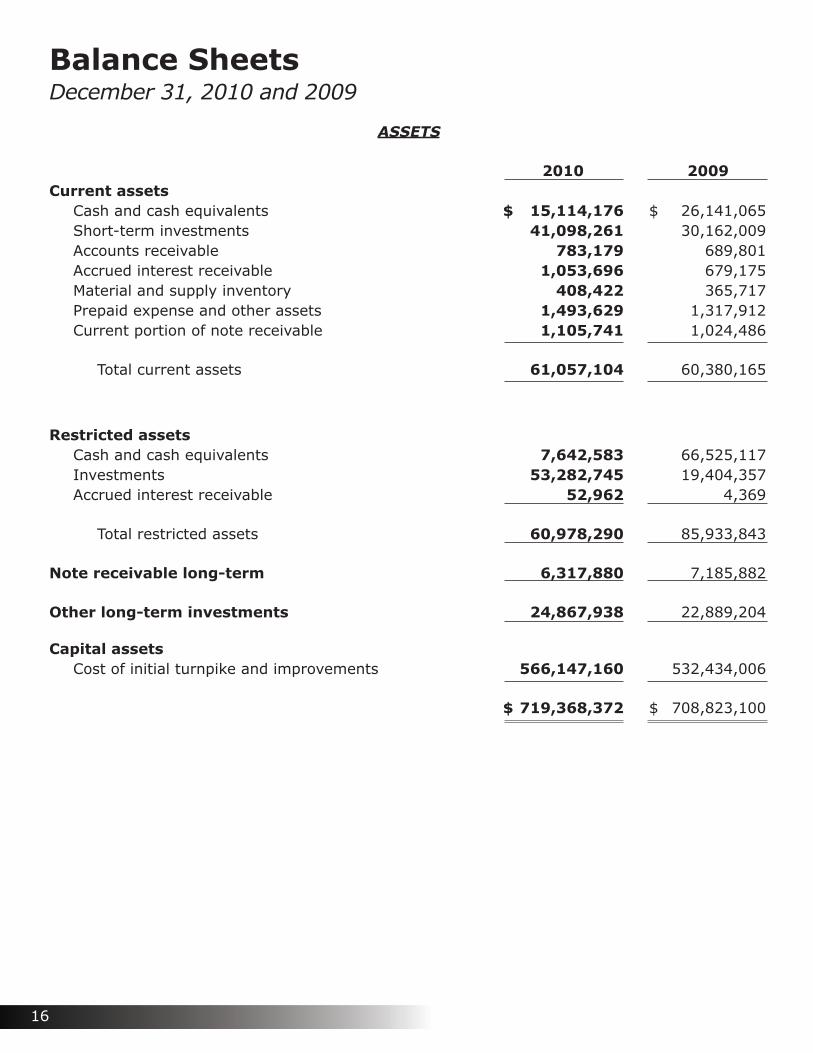
Balance SheetsDecember 31, 2010 and 2009
ASSETS
2010 2009Current assets
Cash and cash equivalents $ 15,114,176 $ 26,141,065Short-term investments 41,098,261 30,162,009Accounts receivable 783,179 689,801Accrued interest receivable 1,053,696 679,175Material and supply inventory 408,422 365,717Prepaid expense and other assets 1,493,629 1,317,912Current portion of note receivable 1,105,741 1,024,486
Total current assets 61,057,104 60,380,165
Restricted assetsCash and cash equivalents 7,642,583 66,525,117Investments 53,282,745 19,404,357Accrued interest receivable 52,962 4,369
Total restricted assets 60,978,290 85,933,843
Note receivable long-term 6,317,880 7,185,882
Other long-term investments 24,867,938 22,889,204
Capital assetsCost of initial turnpike and improvements 566,147,160 532,434,006
$ 719,368,372 $ 708,823,100
16
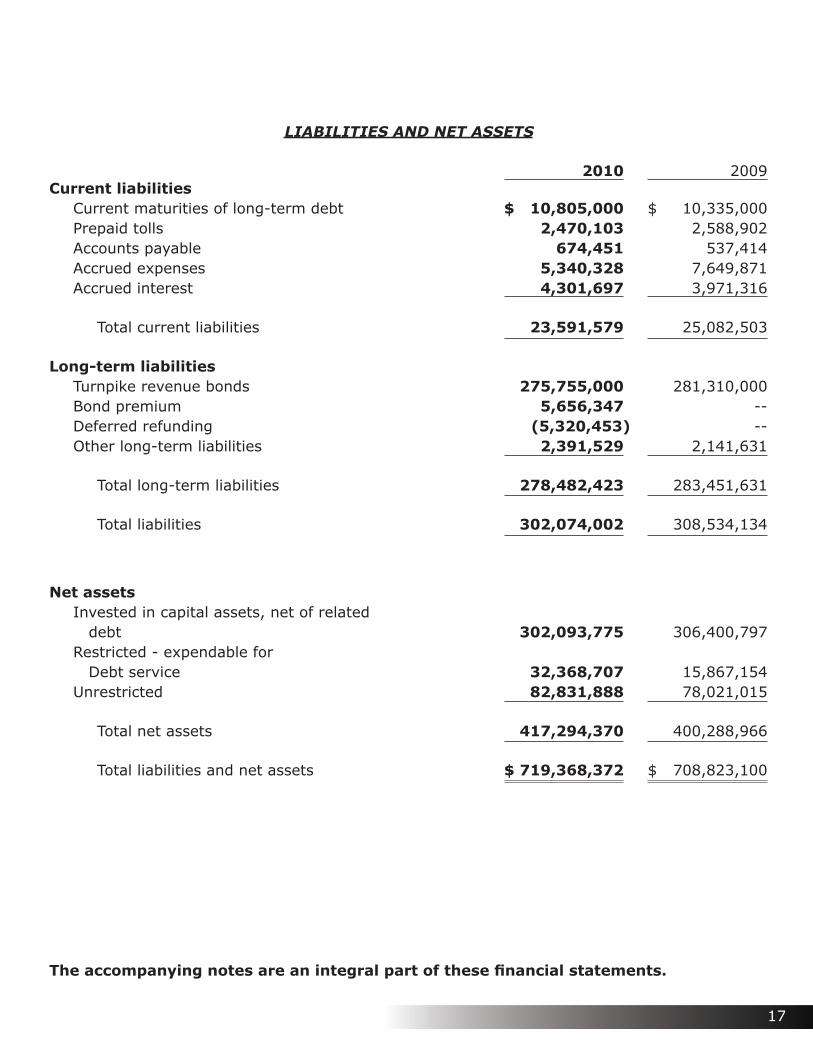
LIABILITIES AND NET ASSETS
2010 2009Current liabilities
Current maturities of long-term debt $ 10,805,000 $ 10,335,000Prepaid tolls 2,470,103 2,588,902Accounts payable 674,451 537,414Accrued expenses 5,340,328 7,649,871Accrued interest 4,301,697 3,971,316
Total current liabilities 23,591,579 25,082,503
Long-term liabilitiesTurnpike revenue bonds 275,755,000 281,310,000Bond premium 5,656,347 --Deferred refunding (5,320,453) --Other long-term liabilities 2,391,529 2,141,631
Total long-term liabilities 278,482,423 283,451,631
Total liabilities 302,074,002 308,534,134
Net assetsInvested in capital assets, net of related debt 302,093,775 306,400,797Restricted - expendable for Debt service 32,368,707 15,867,154Unrestricted 82,831,888 78,021,015
Total net assets 417,294,370 400,288,966
Total liabilities and net assets $ 719,368,372 $ 708,823,100
The accompanying notes are an integral part of these financial statements.
17
The accompanying notes are an integral part of these financial statements.
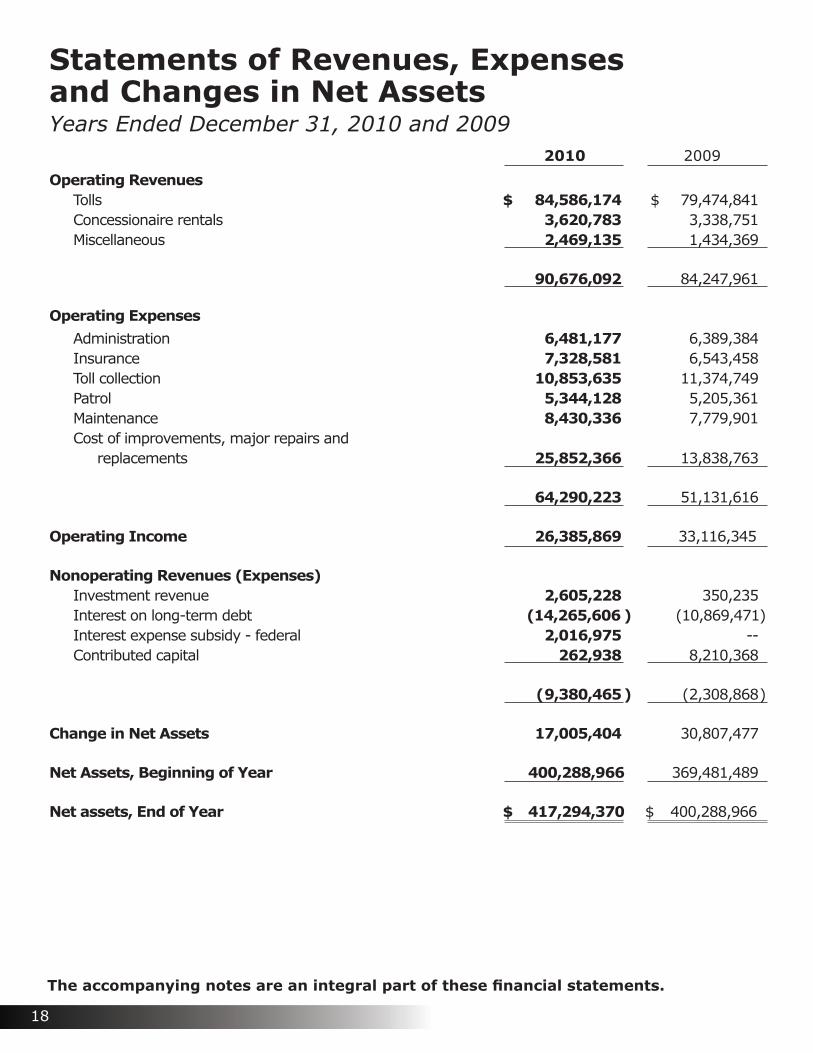
Statements of Revenues, Expenses and Changes in Net AssetsYears Ended December 31, 2010 and 2009 2010 2009
Operating RevenuesTolls $ 84,586,174 $ 79,474,841 Concessionaire rentals 3,620,783 3,338,751 Miscellaneous 2,469,135 1,434,369
90,676,092 84,247,961
Operating ExpensesAdministration 6,481,177 6,389,384 Insurance 7,328,581 6,543,458 Toll collection 10,853,635 11,374,749 Patrol 5,344,128 5,205,361 Maintenance 8,430,336 7,779,901 Cost of improvements, major repairs and
replacements 25,852,366 13,838,763
64,290,223 51,131,616
Operating Income 26,385,869 33,116,345
Nonoperating Revenues (Expenses)Investment revenue 2,605,228 350,235 Interest on long-term debt ( 14,265,606 ) ( 10,869,471 )Interest expense subsidy - federal 2,016,975 -- Contributed capital 262,938 8,210,368
( 9,380,465 ) ( 2,308,868 )
Change in Net Assets 17,005,404 30,807,477
Net Assets, Beginning of Year 400,288,966 369,481,489
Net assets, End of Year $ 417,294,370 $ 400,288,966
18

Statements of Cash FlowsYears Ended December 31, 2010 and 2009 2010 2009Operating Activities
Cash received from toll collections $ 84,368,256 $ 79,588,728Cash received from concessionaire rentals and miscellaneous 6,095,659 4,769,991
Cash paid to suppliers and employees ( 67,278,672 ) ( 52,420,809 )
Net cash flows from operating activities 23,185,243 31,937,910
Capital and Related Financing ActivitiesProceeds from issuance of long-term debt 59,445,000 77,425,000Proceeds from bond premium 5,656,347 --Interest subsidy – federal 2,016,975 --Interest paid ( 13,935,225 ) ( 10,274,023 )Retirement of long-term debt ( 69,850,453 ) ( 9,950,000 )Payments for capitalized costs (32,865,735 ) ( 40,001,575 )
Net cash flows from capital and related financing activities ( 49,533,091 ) 17,199,402
Investing ActivitiesProceeds from payment on note receivable 1,049,685 --Investment revenue realized 2,028,780 ( 265,642 )Proceeds from sale and maturities of investments 118,521,693 99,017,605Purchase of investments (165,161,733) (74,603,869)
Net cash flows from investing activities ( 43,561,575 ) 24,148,094
Change in Cash and Cash Equivalents ( 69,909,423 ) 73,285,406
Cash and Cash Equivalents, Beginning of Year 92,666,182 19,380,776
Cash and Cash Equivalents, End of Year $ 22,756,759 $ 92,666,182
Reconciliation of Net Operating Activities to NetCash Flows from Operating ActivitiesOperating income $ 26,385,869 $ 33,116,345Changes in operating assets and liabilities
Accounts receivable and prepaid tolls ( 212,177 ) 58,877Material and supply inventory ( 42,705 ) 67,435Accounts payable and accrued expenses ( 2,770,027 ) ( 1,207,769)Prepaid expenses and other assets ( 175,717 ) ( 96,978 )
Net cash flows from operating activities $ 23,185,243 $ 31,937,910
Noncash investing capital and financing activities:Note receivable in exchange for contributed capital assets $ 262,938 $ 8,210,368
19
The accompanying notes are an integral part of these financial statements.
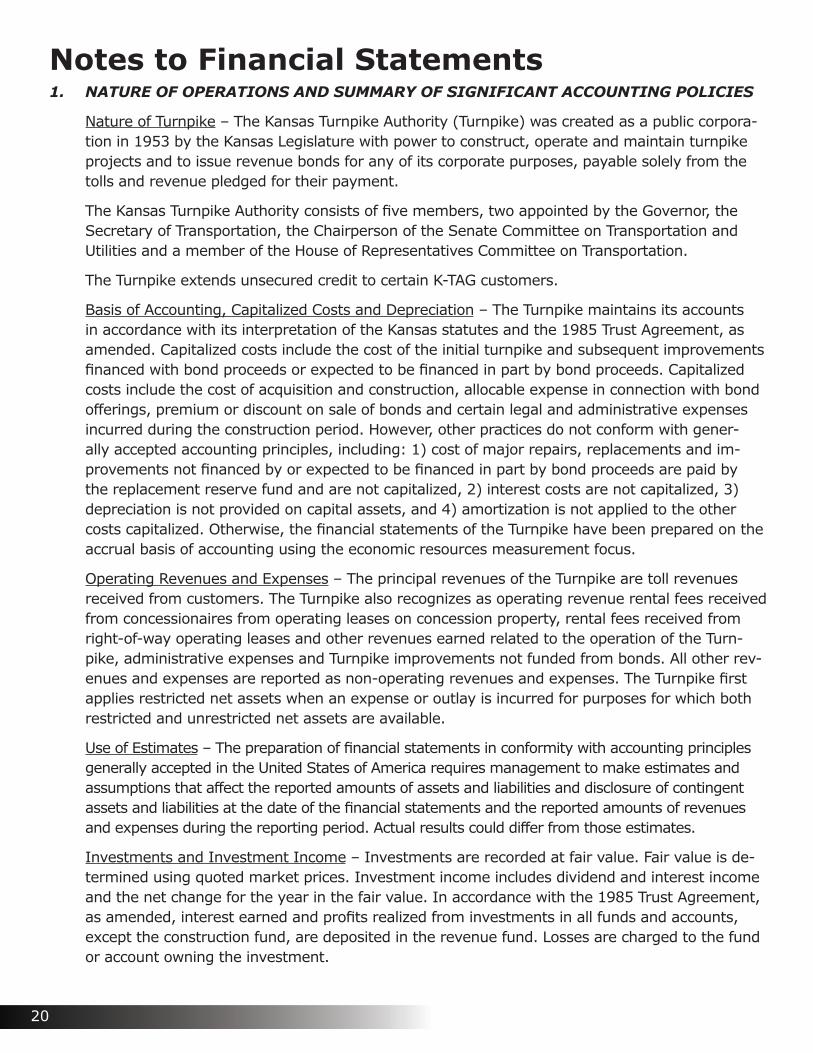
Notes to Financial Statements1. NATURE OF OPERATIONS AND SUMMARY OF SIGNIFICANT ACCOUNTING POLICIES
Nature of Turnpike – The Kansas Turnpike Authority (Turnpike) was created as a public corpora-tion in 1953 by the Kansas Legislature with power to construct, operate and maintain turnpike projects and to issue revenue bonds for any of its corporate purposes, payable solely from the tolls and revenue pledged for their payment.
The Kansas Turnpike Authority consists of five members, two appointed by the Governor, the Secretary of Transportation, the Chairperson of the Senate Committee on Transportation and Utilities and a member of the House of Representatives Committee on Transportation.
The Turnpike extends unsecured credit to certain K-TAG customers.
Basis of Accounting, Capitalized Costs and Depreciation – The Turnpike maintains its accounts in accordance with its interpretation of the Kansas statutes and the 1985 Trust Agreement, as amended. Capitalized costs include the cost of the initial turnpike and subsequent improvements financed with bond proceeds or expected to be financed in part by bond proceeds. Capitalized costs include the cost of acquisition and construction, allocable expense in connection with bond offerings, premium or discount on sale of bonds and certain legal and administrative expenses incurred during the construction period. However, other practices do not conform with gener-ally accepted accounting principles, including: 1) cost of major repairs, replacements and im-provements not financed by or expected to be financed in part by bond proceeds are paid by the replacement reserve fund and are not capitalized, 2) interest costs are not capitalized, 3) depreciation is not provided on capital assets, and 4) amortization is not applied to the other costs capitalized. Otherwise, the financial statements of the Turnpike have been prepared on the accrual basis of accounting using the economic resources measurement focus.
Operating Revenues and Expenses – The principal revenues of the Turnpike are toll revenues received from customers. The Turnpike also recognizes as operating revenue rental fees received from concessionaires from operating leases on concession property, rental fees received from right-of-way operating leases and other revenues earned related to the operation of the Turn-pike, administrative expenses and Turnpike improvements not funded from bonds. All other rev-enues and expenses are reported as non-operating revenues and expenses. The Turnpike first applies restricted net assets when an expense or outlay is incurred for purposes for which both restricted and unrestricted net assets are available.
Use of Estimates – The preparation of financial statements in conformity with accounting principles generally accepted in the United States of America requires management to make estimates and assumptions that affect the reported amounts of assets and liabilities and disclosure of contingent assets and liabilities at the date of the financial statements and the reported amounts of revenues and expenses during the reporting period. Actual results could differ from those estimates.
Investments and Investment Income – Investments are recorded at fair value. Fair value is de-termined using quoted market prices. Investment income includes dividend and interest income and the net change for the year in the fair value. In accordance with the 1985 Trust Agreement, as amended, interest earned and profits realized from investments in all funds and accounts, except the construction fund, are deposited in the revenue fund. Losses are charged to the fund or account owning the investment.
20
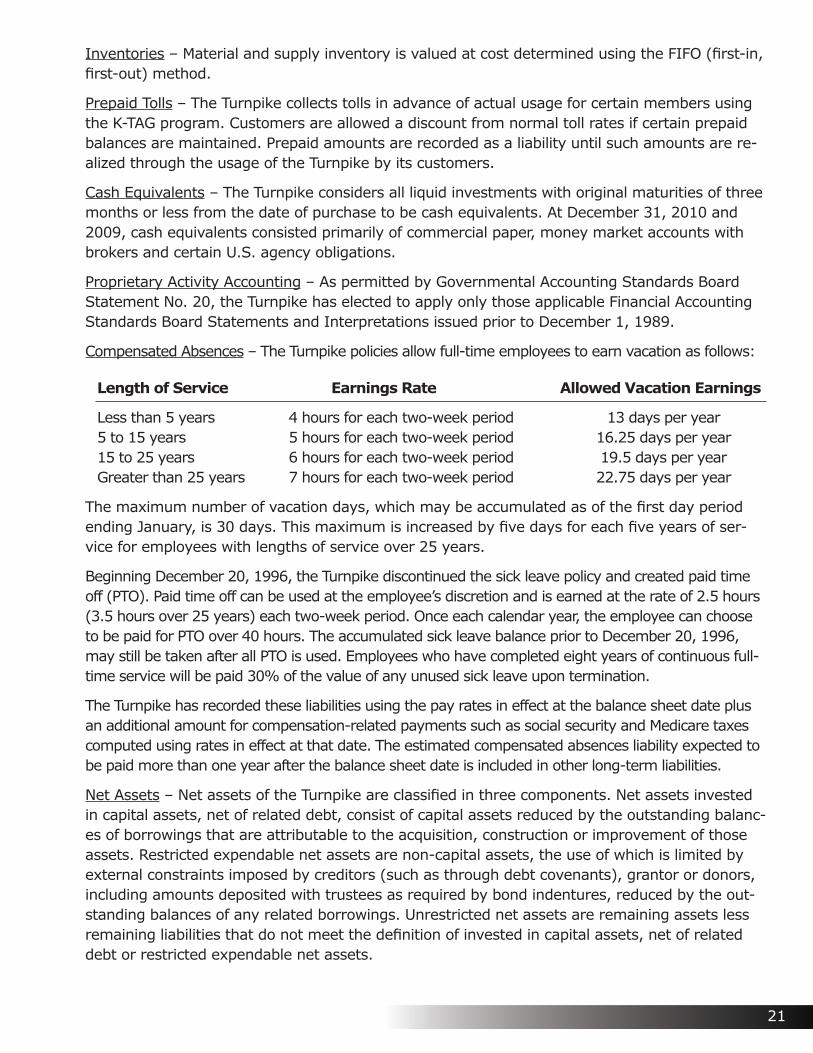
Inventories – Material and supply inventory is valued at cost determined using the FIFO (first-in, first-out) method.
Prepaid Tolls – The Turnpike collects tolls in advance of actual usage for certain members using the K-TAG program. Customers are allowed a discount from normal toll rates if certain prepaid balances are maintained. Prepaid amounts are recorded as a liability until such amounts are re-alized through the usage of the Turnpike by its customers.
Cash Equivalents – The Turnpike considers all liquid investments with original maturities of three months or less from the date of purchase to be cash equivalents. At December 31, 2010 and 2009, cash equivalents consisted primarily of commercial paper, money market accounts with brokers and certain U.S. agency obligations.
Proprietary Activity Accounting – As permitted by Governmental Accounting Standards Board Statement No. 20, the Turnpike has elected to apply only those applicable Financial Accounting Standards Board Statements and Interpretations issued prior to December 1, 1989.
Compensated Absences – The Turnpike policies allow full-time employees to earn vacation as follows:
Length of Service Earnings Rate Allowed Vacation Earnings
Less than 5 years 4 hours for each two-week period 13 days per year5 to 15 years 5 hours for each two-week period 16.25 days per year15 to 25 years 6 hours for each two-week period 19.5 days per yearGreater than 25 years 7 hours for each two-week period 22.75 days per year
The maximum number of vacation days, which may be accumulated as of the first day period ending January, is 30 days. This maximum is increased by five days for each five years of ser-vice for employees with lengths of service over 25 years.
Beginning December 20, 1996, the Turnpike discontinued the sick leave policy and created paid time off (PTO). Paid time off can be used at the employee’s discretion and is earned at the rate of 2.5 hours (3.5 hours over 25 years) each two-week period. Once each calendar year, the employee can choose to be paid for PTO over 40 hours. The accumulated sick leave balance prior to December 20, 1996, may still be taken after all PTO is used. Employees who have completed eight years of continuous full-time service will be paid 30% of the value of any unused sick leave upon termination.
The Turnpike has recorded these liabilities using the pay rates in effect at the balance sheet date plus an additional amount for compensation-related payments such as social security and Medicare taxes computed using rates in effect at that date. The estimated compensated absences liability expected to be paid more than one year after the balance sheet date is included in other long-term liabilities.
Net Assets – Net assets of the Turnpike are classified in three components. Net assets invested in capital assets, net of related debt, consist of capital assets reduced by the outstanding balanc-es of borrowings that are attributable to the acquisition, construction or improvement of those assets. Restricted expendable net assets are non-capital assets, the use of which is limited by external constraints imposed by creditors (such as through debt covenants), grantor or donors, including amounts deposited with trustees as required by bond indentures, reduced by the out-standing balances of any related borrowings. Unrestricted net assets are remaining assets less remaining liabilities that do not meet the definition of invested in capital assets, net of related debt or restricted expendable net assets.
21
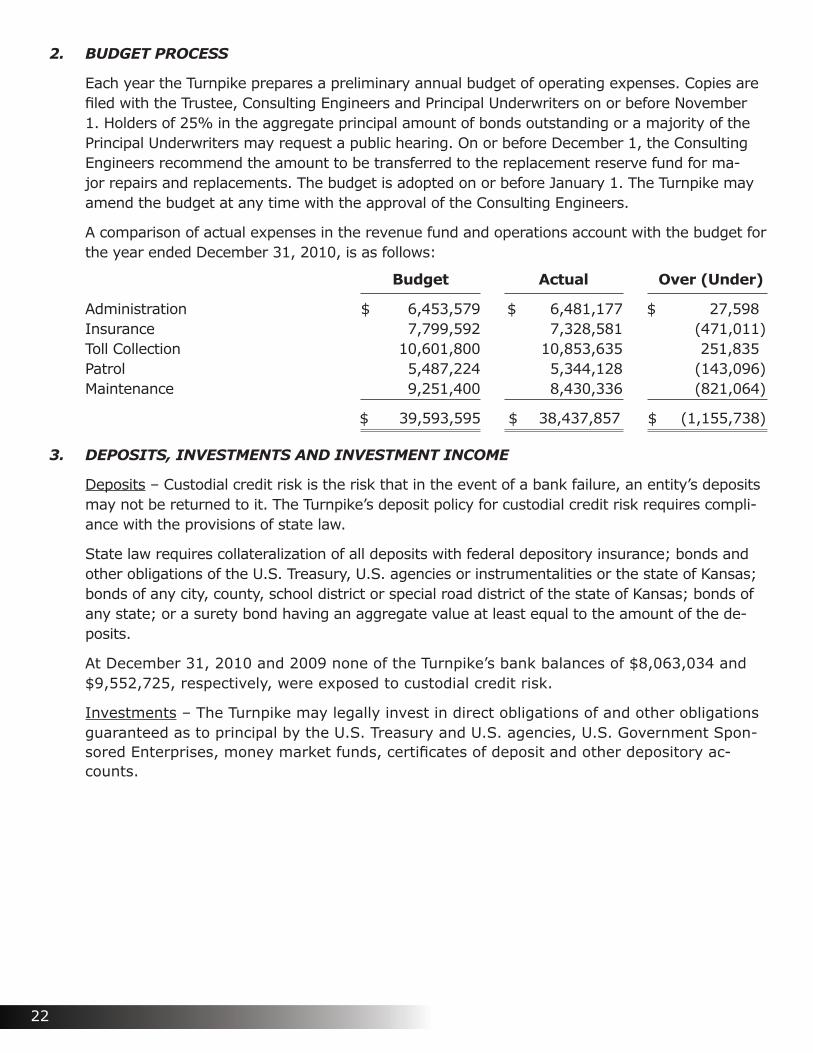
2. BUDGET PROCESS
Each year the Turnpike prepares a preliminary annual budget of operating expenses. Copies are filed with the Trustee, Consulting Engineers and Principal Underwriters on or before November 1. Holders of 25% in the aggregate principal amount of bonds outstanding or a majority of the Principal Underwriters may request a public hearing. On or before December 1, the Consulting Engineers recommend the amount to be transferred to the replacement reserve fund for ma-jor repairs and replacements. The budget is adopted on or before January 1. The Turnpike may amend the budget at any time with the approval of the Consulting Engineers.
A comparison of actual expenses in the revenue fund and operations account with the budget for the year ended December 31, 2010, is as follows:
Budget Actual Over (Under)
Administration $ 6,453,579 $ 6,481,177 $ 27,598Insurance 7,799,592 7,328,581 (471,011)Toll Collection 10,601,800 10,853,635 251,835Patrol 5,487,224 5,344,128 (143,096)Maintenance 9,251,400 8,430,336 (821,064)
$ 39,593,595 $ 38,437,857 $ (1,155,738)
3. DEPOSITS, INVESTMENTS AND INVESTMENT INCOME
Deposits – Custodial credit risk is the risk that in the event of a bank failure, an entity’s deposits may not be returned to it. The Turnpike’s deposit policy for custodial credit risk requires compli-ance with the provisions of state law.
State law requires collateralization of all deposits with federal depository insurance; bonds and other obligations of the U.S. Treasury, U.S. agencies or instrumentalities or the state of Kansas; bonds of any city, county, school district or special road district of the state of Kansas; bonds of any state; or a surety bond having an aggregate value at least equal to the amount of the de-posits.
At December 31, 2010 and 2009 none of the Turnpike’s bank balances of $8,063,034 and $9,552,725, respectively, were exposed to custodial credit risk.
Investments – The Turnpike may legally invest in direct obligations of and other obligations guaranteed as to principal by the U.S. Treasury and U.S. agencies, U.S. Government Spon-sored Enterprises, money market funds, certificates of deposit and other depository ac-counts.
22
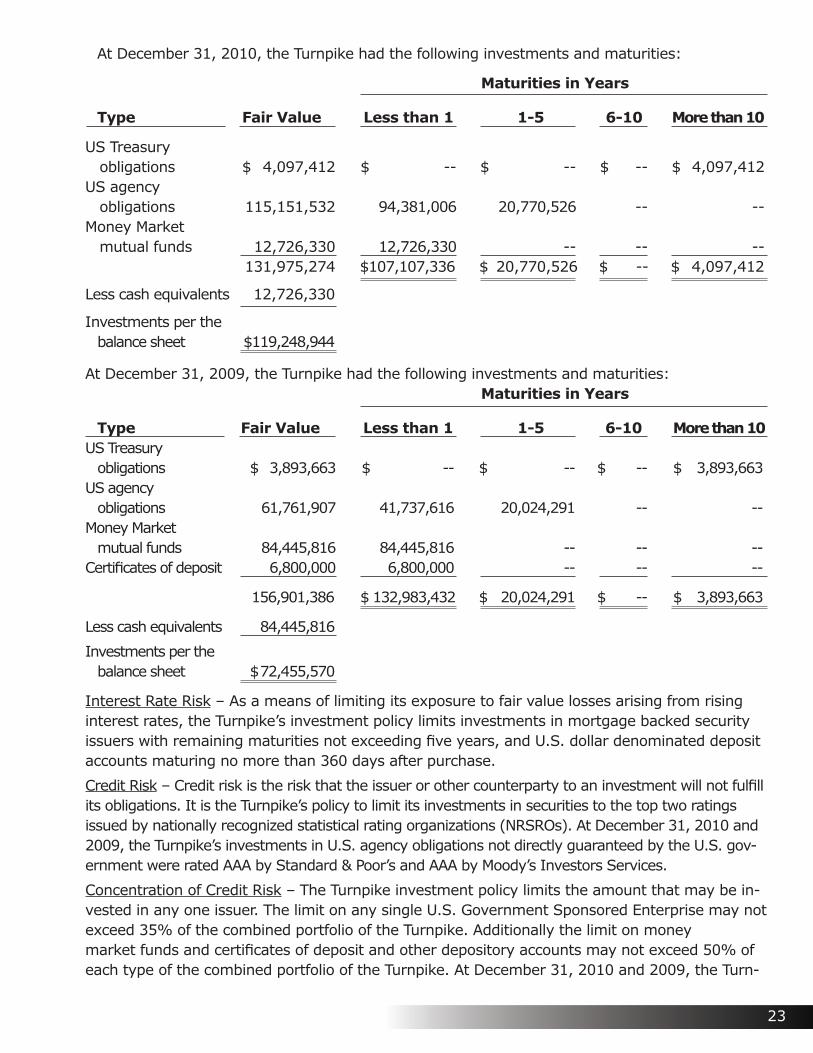
At December 31, 2010, the Turnpike had the following investments and maturities:
Maturities in Years
Type Fair Value Less than 1 1-5 6-10 More than 10
US Treasury obligations $ 4,097,412 $ -- $ -- $ -- $ 4,097,412US agency obligations 115,151,532 94,381,006 20,770,526 -- --Money Market mutual funds 12,726,330 12,726,330 -- -- -- 131,975,274 $ 107,107,336 $ 20,770,526 $ -- $ 4,097,412
Less cash equivalents 12,726,330
Investments per the balance sheet $ 119,248,944
At December 31, 2009, the Turnpike had the following investments and maturities: Maturities in Years
Type Fair Value Less than 1 1-5 6-10 More than 10US Treasury obligations $ 3,893,663 $ -- $ -- $ -- $ 3,893,663US agency obligations 61,761,907 41,737,616 20,024,291 -- --Money Market mutual funds 84,445,816 84,445,816 -- -- --Certificates of deposit 6,800,000 6,800,000 -- -- --
156,901,386 $ 132,983,432 $ 20,024,291 $ -- $ 3,893,663
Less cash equivalents 84,445,816
Investments per the balance sheet $ 72,455,570
Interest Rate Risk – As a means of limiting its exposure to fair value losses arising from rising interest rates, the Turnpike’s investment policy limits investments in mortgage backed security issuers with remaining maturities not exceeding five years, and U.S. dollar denominated deposit accounts maturing no more than 360 days after purchase.
Credit Risk – Credit risk is the risk that the issuer or other counterparty to an investment will not fulfill its obligations. It is the Turnpike’s policy to limit its investments in securities to the top two ratings issued by nationally recognized statistical rating organizations (NRSROs). At December 31, 2010 and 2009, the Turnpike’s investments in U.S. agency obligations not directly guaranteed by the U.S. gov-ernment were rated AAA by Standard & Poor’s and AAA by Moody’s Investors Services.
Concentration of Credit Risk – The Turnpike investment policy limits the amount that may be in-vested in any one issuer. The limit on any single U.S. Government Sponsored Enterprise may not exceed 35% of the combined portfolio of the Turnpike. Additionally the limit on money market funds and certificates of deposit and other depository accounts may not exceed 50% of each type of the combined portfolio of the Turnpike. At December 31, 2010 and 2009, the Turn-
23
pike’s investment in Federal Home Loan Mortgage Corporation constituted 32.20% and 9.66% of total investments and investments in Federal National Mortgage Association constituted 25.10% and 17.25%, respectively of its total investments.
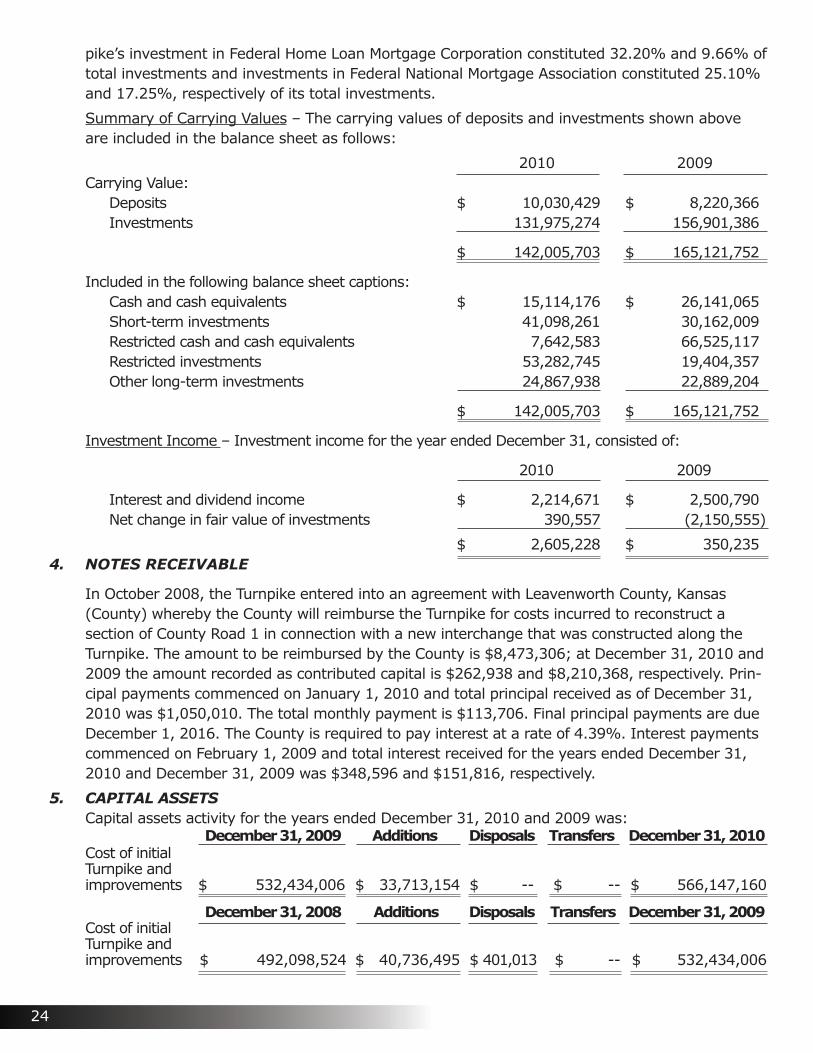
Summary of Carrying Values – The carrying values of deposits and investments shown above are included in the balance sheet as follows:
2010 2009Carrying Value:
Deposits $ 10,030,429 $ 8,220,366Investments 131,975,274 156,901,386
$ 142,005,703 $ 165,121,752
Included in the following balance sheet captions:Cash and cash equivalents $ 15,114,176 $ 26,141,065Short-term investments 41,098,261 30,162,009Restricted cash and cash equivalents 7,642,583 66,525,117Restricted investments 53,282,745 19,404,357Other long-term investments 24,867,938 22,889,204
$ 142,005,703 $ 165,121,752
Investment Income – Investment income for the year ended December 31, consisted of:
2010 2009
Interest and dividend income $ 2,214,671 $ 2,500,790Net change in fair value of investments 390,557 (2,150,555)
$ 2,605,228 $ 350,2354. NOTES RECEIVABLE
In October 2008, the Turnpike entered into an agreement with Leavenworth County, Kansas (County) whereby the County will reimburse the Turnpike for costs incurred to reconstruct a section of County Road 1 in connection with a new interchange that was constructed along the Turnpike. The amount to be reimbursed by the County is $8,473,306; at December 31, 2010 and 2009 the amount recorded as contributed capital is $262,938 and $8,210,368, respectively. Prin-cipal payments commenced on January 1, 2010 and total principal received as of December 31, 2010 was $1,050,010. The total monthly payment is $113,706. Final principal payments are due December 1, 2016. The County is required to pay interest at a rate of 4.39%. Interest payments commenced on February 1, 2009 and total interest received for the years ended December 31, 2010 and December 31, 2009 was $348,596 and $151,816, respectively.
5. CAPITAL ASSETSCapital assets activity for the years ended December 31, 2010 and 2009 was: December 31, 2009 Additions Disposals Transfers December 31, 2010Cost of initial Turnpike and improvements $ 532,434,006 $ 33,713,154 $ -- $ -- $ 566,147,160
December 31, 2008 Additions Disposals Transfers December 31, 2009Cost of initial Turnpike andimprovements $ 492,098,524 $ 40,736,495 $ 401,013 $ -- $ 532,434,006
24
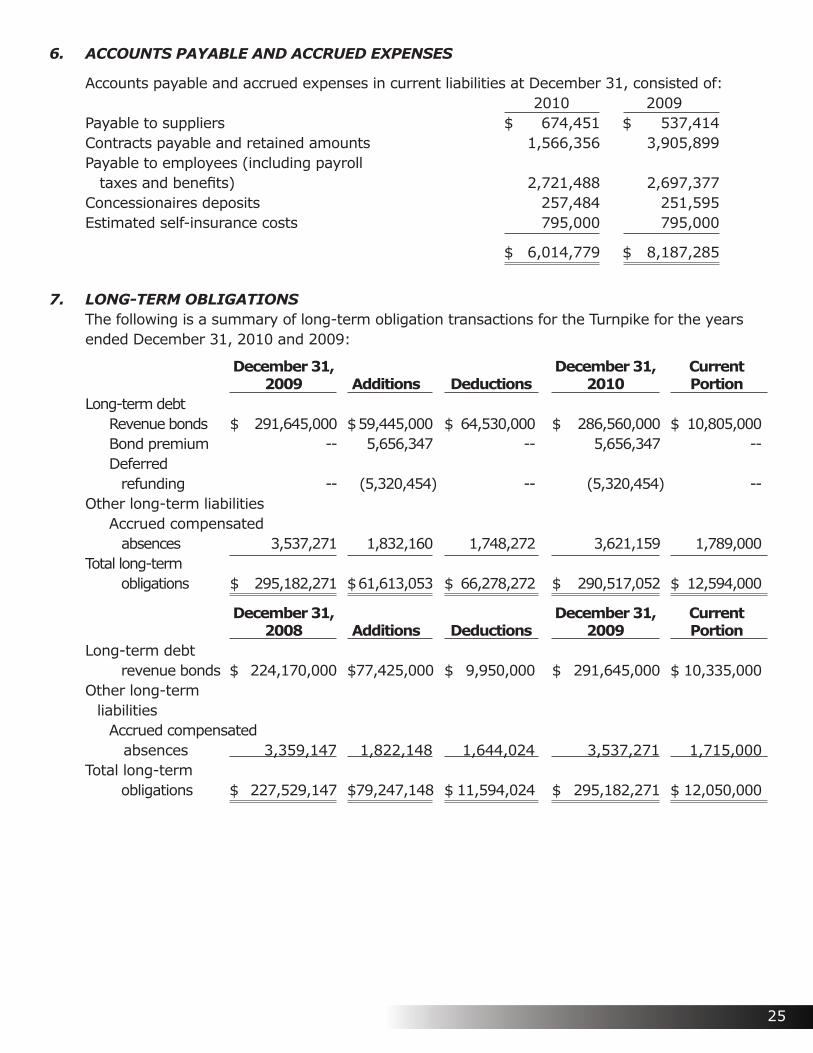
6. ACCOUNTS PAYABLE AND ACCRUED EXPENSES
Accounts payable and accrued expenses in current liabilities at December 31, consisted of: 2010 2009Payable to suppliers $ 674,451 $ 537,414Contracts payable and retained amounts 1,566,356 3,905,899Payable to employees (including payroll taxes and benefits) 2,721,488 2,697,377Concessionaires deposits 257,484 251,595Estimated self-insurance costs 795,000 795,000
$ 6,014,779 $ 8,187,285
7. LONG-TERM OBLIGATIONSThe following is a summary of long-term obligation transactions for the Turnpike for the years ended December 31, 2010 and 2009:
December 31, December 31, Current 2009 Additions Deductions 2010 Portion
Long-term debtRevenue bonds $ 291,645,000 $ 59,445,000 $ 64,530,000 $ 286,560,000 $ 10,805,000Bond premium -- 5,656,347 -- 5,656,347 --Deferred
refunding -- (5,320,454) -- (5,320,454) --Other long-term liabilities
Accrued compensated absences 3,537,271 1,832,160 1,748,272 3,621,159 1,789,000
Total long-termobligations $ 295,182,271 $ 61,613,053 $ 66,278,272 $ 290,517,052 $ 12,594,000
December 31, December 31, Current 2008 Additions Deductions 2009 Portion
Long-term debtrevenue bonds $ 224,170,000 $ 77,425,000 $ 9,950,000 $ 291,645,000 $ 10,335,000
Other long-termliabilities
Accrued compensated absences 3,359,147 1,822,148 1,644,024 3,537,271 1,715,000
Total long-termobligations $ 227,529,147 $ 79,247,148 $ 11,594,024 $ 295,182,271 $ 12,050,000
25
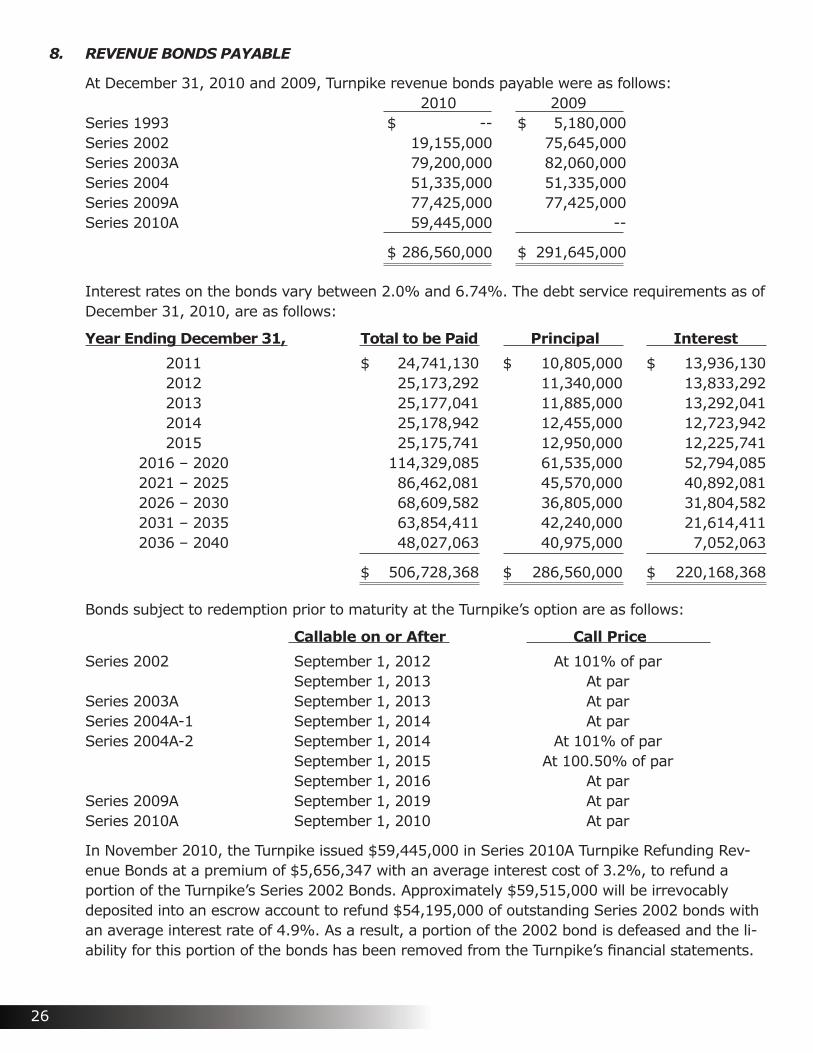
8. REVENUE BONDS PAYABLE
At December 31, 2010 and 2009, Turnpike revenue bonds payable were as follows: 2010 2009Series 1993 $ -- $ 5,180,000Series 2002 19,155,000 75,645,000Series 2003A 79,200,000 82,060,000Series 2004 51,335,000 51,335,000Series 2009A 77,425,000 77,425,000Series 2010A 59,445,000 --
$ 286,560,000 $ 291,645,000
Interest rates on the bonds vary between 2.0% and 6.74%. The debt service requirements as of December 31, 2010, are as follows:
Year Ending December 31, Total to be Paid Principal Interest
2011 $ 24,741,130 $ 10,805,000 $ 13,936,130 2012 25,173,292 11,340,000 13,833,292 2013 25,177,041 11,885,000 13,292,041 2014 25,178,942 12,455,000 12,723,942 2015 25,175,741 12,950,000 12,225,741 2016 – 2020 114,329,085 61,535,000 52,794,085 2021 – 2025 86,462,081 45,570,000 40,892,081 2026 – 2030 68,609,582 36,805,000 31,804,582 2031 – 2035 63,854,411 42,240,000 21,614,411 2036 – 2040 48,027,063 40,975,000 7,052,063
$ 506,728,368 $ 286,560,000 $ 220,168,368
Bonds subject to redemption prior to maturity at the Turnpike’s option are as follows:
Callable on or After Call Price
Series 2002 September 1, 2012 At 101% of par September 1, 2013 At parSeries 2003A September 1, 2013 At parSeries 2004A-1 September 1, 2014 At parSeries 2004A-2 September 1, 2014 At 101% of par September 1, 2015 At 100.50% of par September 1, 2016 At parSeries 2009A September 1, 2019 At parSeries 2010A September 1, 2010 At par
In November 2010, the Turnpike issued $59,445,000 in Series 2010A Turnpike Refunding Rev-enue Bonds at a premium of $5,656,347 with an average interest cost of 3.2%, to refund a portion of the Turnpike’s Series 2002 Bonds. Approximately $59,515,000 will be irrevocably deposited into an escrow account to refund $54,195,000 of outstanding Series 2002 bonds with an average interest rate of 4.9%. As a result, a portion of the 2002 bond is defeased and the li-ability for this portion of the bonds has been removed from the Turnpike’s financial statements.
26
The Turnpike refunded these bonds to reduce total debt payments over the next seventeen years by $8,116,193. The economic gain (difference between the present value of the old and new debt service payments) is $4,480,262.
The Series 2009 A bonds were issued as taxable Build America Bonds pursuant to the American Recovery and Reinvestment Act of 2009, which provides that 35% of the interest payments on those bonds will be paid to the Turnpike by the U.S. Treasury. For the year ended December 31, 2020, this subsidy was $2,016,975.
9. DEFINED BENEFIT PENSION PLAN
The Turnpike participates in the Kansas Public Employees Retirement System (KPERS) which is a cost-sharing multiple-employer defined benefit pension plan as provided by K.S.A. 74- 4901, et seq. and administered by the KPERS Board of Trustees. The plan provides retirement, life insur-ance, disability income and death benefits. Kansas law establishes and amends benefit provisions. KPERS issues a publicly available financial report that includes financial statements and required supplementary information. That report may be obtained by writing to KPERS at 611 South Kan-sas Avenue, Suite 100, Topeka, Kansas 66603-3869, or by calling KPERS at 1-888-275-5737.
Funding Policy. K.S.A. 74-4919 establishes the KPERS member-employee contribution rate at 4% of covered salary. The employer collects and remits member-employee contributions accord-ing to the provisions of section 414(h) of the Internal Revenue Code. State law provides that the employer contribution rate be determined annually based on the results of an annual actuarial valuation. KPERS is funded on an actuarial reserve bases. State law sets a limitation on annual increases in the contribution rates for KPERS employers. The employer contribution rates for KPERS for 2010, 2009, and 2008 were 6.14%, 5.54%, and 4.93%, respectively. The Turnpike’s contributions to KPERS for 2010, 2009, and 2008 were $1,155,843, $1,045,950, and $955,324, respectively, and were equal to the required contributions for each year.
10. OTHER POST EMPLOYMENT HEALTHCARE BENEFITS DESCRIPTION
The Turnpike offers medical and dental insurance to qualifying retirees and their dependents through a single-employer defined benefit healthcare plan. Qualifying retirees are those em-ployees who retire with at least 10 years of full-time employment with the Turnpike, and are eligible to receive pension benefits under the Kansas Public Employees’ Retirement System (KPERS). Retirees must pay COBRA rates to continue coverage, which extends until the individu-als become eligible for Medicare at age 65. Retirees that meet additional age and service criteria receive free coverage to Medicare eligibility age. In October 2008, the Turnpike started offering free insurance benefits to age 65 to those who retire prior to July 1, 2009 with at least 85 points under KPERS. The medical and dental benefits are provided through a self-insured arrangement, with the subsidy provided from general operating funds.
Funding Policy - The contribution requirements of employees and the Turnpike are established and may be amended by the Turnpike and its board of directors. The Turnpike’s funding policy is to pay premiums, claims and administrative costs as they come due. Turnpike retirees not meet-ing specified age and service criteria contribute 100% of the COBRA premium rate; otherwise, retirees pay $130 (for single coverage) or $260 (for family coverage) annually, and the Turnpike pays the remaining cost of coverage. For fiscal 2010 and 2009, the Turnpike paid $138,249 and $44,532, respectively, through their required COBRA contributions.
27
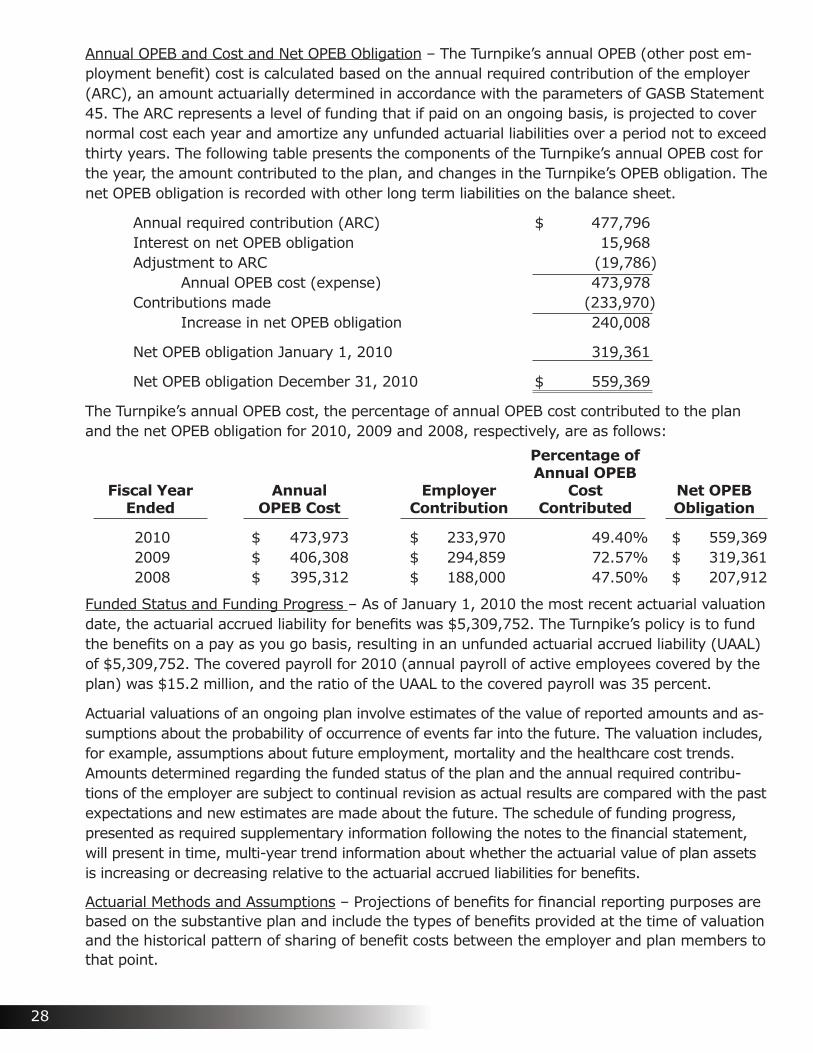
Annual OPEB and Cost and Net OPEB Obligation – The Turnpike’s annual OPEB (other post em-ployment benefit) cost is calculated based on the annual required contribution of the employer (ARC), an amount actuarially determined in accordance with the parameters of GASB Statement 45. The ARC represents a level of funding that if paid on an ongoing basis, is projected to cover normal cost each year and amortize any unfunded actuarial liabilities over a period not to exceed thirty years. The following table presents the components of the Turnpike’s annual OPEB cost for the year, the amount contributed to the plan, and changes in the Turnpike’s OPEB obligation. The net OPEB obligation is recorded with other long term liabilities on the balance sheet.
Annual required contribution (ARC) $ 477,796Interest on net OPEB obligation 15,968Adjustment to ARC (19,786)
Annual OPEB cost (expense) 473,978Contributions made (233,970)
Increase in net OPEB obligation 240,008
Net OPEB obligation January 1, 2010 319,361
Net OPEB obligation December 31, 2010 $ 559,369
The Turnpike’s annual OPEB cost, the percentage of annual OPEB cost contributed to the plan and the net OPEB obligation for 2010, 2009 and 2008, respectively, are as follows:
Percentage of Annual OPEB Fiscal Year Annual Employer Cost Net OPEB Ended OPEB Cost Contribution Contributed Obligation
2010 $ 473,973 $ 233,970 49.40% $ 559,369 2009 $ 406,308 $ 294,859 72.57% $ 319,361 2008 $ 395,312 $ 188,000 47.50% $ 207,912
Funded Status and Funding Progress – As of January 1, 2010 the most recent actuarial valuation date, the actuarial accrued liability for benefits was $5,309,752. The Turnpike’s policy is to fund the benefits on a pay as you go basis, resulting in an unfunded actuarial accrued liability (UAAL) of $5,309,752. The covered payroll for 2010 (annual payroll of active employees covered by the plan) was $15.2 million, and the ratio of the UAAL to the covered payroll was 35 percent.
Actuarial valuations of an ongoing plan involve estimates of the value of reported amounts and as-sumptions about the probability of occurrence of events far into the future. The valuation includes, for example, assumptions about future employment, mortality and the healthcare cost trends. Amounts determined regarding the funded status of the plan and the annual required contribu-tions of the employer are subject to continual revision as actual results are compared with the past expectations and new estimates are made about the future. The schedule of funding progress, presented as required supplementary information following the notes to the financial statement, will present in time, multi-year trend information about whether the actuarial value of plan assets is increasing or decreasing relative to the actuarial accrued liabilities for benefits.
Actuarial Methods and Assumptions – Projections of benefits for financial reporting purposes are based on the substantive plan and include the types of benefits provided at the time of valuation and the historical pattern of sharing of benefit costs between the employer and plan members to that point.
28
In the January 1, 2010 actuarial valuation, the entry age normal (level % of pay) method was applied. The actuarial assumptions included a 5 percent investment rate of return. The valua-tion assumed annual healthcare cost trend rates of five to eight and half percent in the first eight years and ultimate rate of five percent after eight years. The valuation followed generally ac-cepted actuarial methods and included tests as considered necessary to assure the accuracy of the results. The UAAL is being amortized on a level dollar basis and on a closed group basis over a period of 30 years, with the remaining amortization period of 28 years.
Plan Report – The plan does not issue a stand-alone audited GAAP-basis report.
11. RISK MANAGEMENT
The Turnpike is exposed to various risks of loss related to torts; theft of, damage to and destruc-tion of assets; business interruption; errors and omissions; employee injuries and illnesses; natural disasters; and employee health, dental and accident benefits. Commercial insurance coverage is purchased for claims arising from such matters other than those related to worker’s compensation and employee health benefits. Settled claims have not exceeded such commercial coverage during the past three years.
Liabilities include an accrual for claims that have been incurred but not reported. Claims liabili-ties are reevaluated periodically to take into consideration recently settled claims, frequency of claims and other economic and social factors.
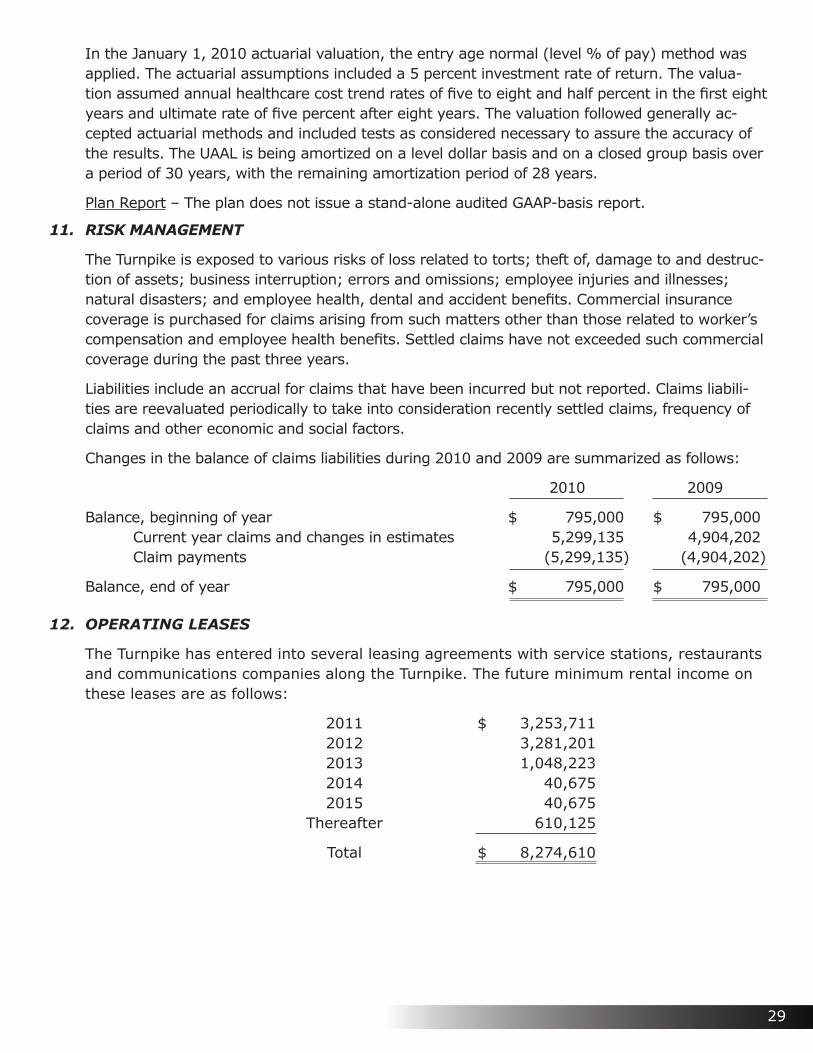
Changes in the balance of claims liabilities during 2010 and 2009 are summarized as follows:
2010 2009
Balance, beginning of year $ 795,000 $ 795,000Current year claims and changes in estimates 5,299,135 4,904,202Claim payments (5,299,135) (4,904,202)
Balance, end of year $ 795,000 $ 795,000
12. OPERATING LEASES
The Turnpike has entered into several leasing agreements with service stations, restaurants and communications companies along the Turnpike. The future minimum rental income on these leases are as follows:
2011 $ 3,253,711 2012 3,281,201 2013 1,048,223 2014 40,675 2015 40,675 Thereafter 610,125
Total $ 8,274,610
29
The leases generally have terms of five years, 10.5 years or 12 years. The five-year service sta-tion leases have no renewal options. The Emporia McDonald’s restaurant lease has up to three five-year renewal options. Both restaurant and service station leases with 10.5 years have no renewal options, and the 12-year leases have two five-year renewal options if mutually agreed upon by the Turnpike and lessee. All leases are anticipated to renew at the time of expiration or be leased to other parties. The Turnpike is reimbursed for all utility payments and the lessee is responsible for insurance expenses associated with the properties. In certain instances, the Turn-pike has agreed to have the lessee construct new buildings. If, at the conclusion of the lease, the lessee is not successful in the bidding for a new lease, the Turnpike is committed to reimburse the lessee for certain costs of construction, net of depreciation, of approximately $4,132,528. The service station and restaurant leases have base rents and contingent rental payments based on the gallons of gasoline sold, service station nonfuel sales or gross sales for the restaurant.
The lease agreements with communications companies are to operate communication systems within the Turnpike right-of-way. The leases generally have terms of five years or ten years. The five-year leases have anywhere from four to nine five-year renewal options. The Turnpike does not incur any significant costs associated with the maintenance of the communications systems and upon termination of the leases, the communication systems become the property of the Turnpike.
13. COMMITMENTS
The Turnpike has committed to construction contracts for turnpike repair and improvements val-ued at approximately $27 million at December 31, 2010.
14. PENDING GOVERNMENTAL ACCOUNTING STANDARDS
The effect on the Turnpike’s financial statements of the following statements issued, but not yet adopted, have not yet been determined.
GASB Statement No. 54, Fund Balance Reporting and Governmental Fund Type Definitions was issued in February 2009. This statement is intended to improve the usefulness of information provided to financial report users about fund balance by providing clearer, more structured fund balance classifications, and by clarifying the definitions of existing governmental fund types. GASB 54 establishes a hierarchy of fund balance classifications based primarily on the extent to which a government is bound to observe spending constraints imposed upon how resources re-ported in governmental funds may be used. Specifically, GASB 54 distinguishes fund balance be-tween amounts that are considered non-spendable and other amounts that are classified based on the relative strength of the constraints that control the purposes for which specific amounts can be spent. The provisions of this statement are effective for the Turnpike’s fiscal year ending December 31, 2011.
GASB Statement No. 60, Accounting and Financial Reporting for Service Concession Arrange-ments, was issued in November 2010. This statement is intended to improve financial reporting by addressing issues related to service concession arrangements, which are a type of public-pri-vate or public-public partnership. GASB 60 applies to those arrangements in which specific crite-ria determining whether a transferor (a government) has control over the facility are met. provi-sions of this statement are effective for the Turnpike’s fiscal year ending December 31, 2012.
30
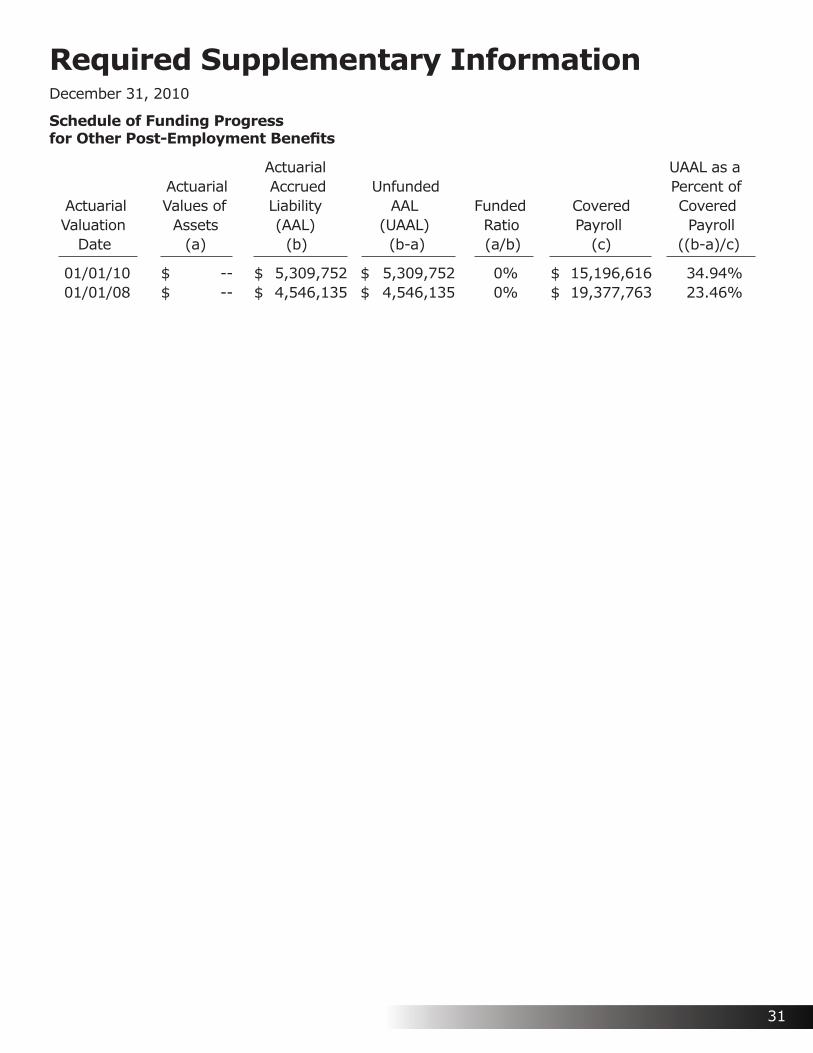
Required Supplementary InformationDecember 31, 2010
Schedule of Funding Progress for Other Post-Employment Benefits
Actuarial UAAL as a Actuarial Accrued Unfunded Percent of Actuarial Values of Liability AAL Funded Covered Covered Valuation Assets (AAL) (UAAL) Ratio Payroll Payroll Date (a) (b) (b-a) (a/b) (c) ((b-a)/c)
01/01/10 $ -- $ 5,309,752 $ 5,309,752 0% $ 15,196,616 34.94% 01/01/08 $ -- $ 4,546,135 $ 4,546,135 0% $ 19,377,763 23.46%
31
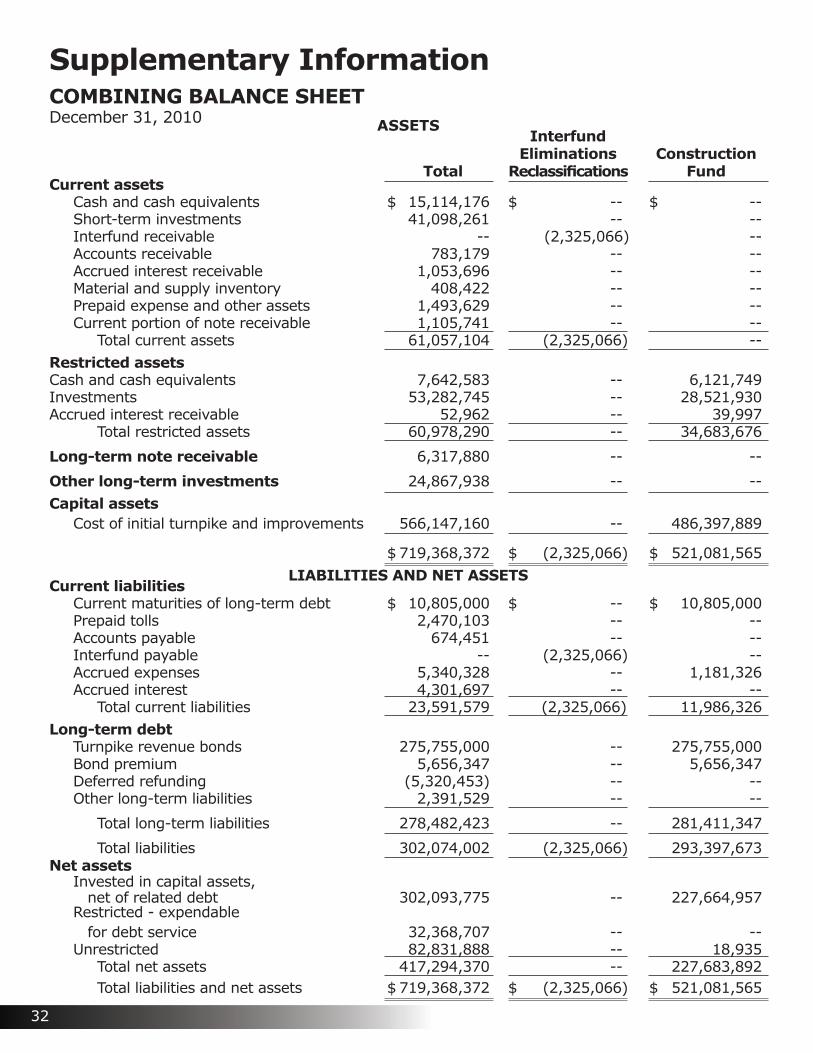
Supplementary InformationCOMBINING BALANCE SHEETDecember 31, 2010 ASSETS Interfund Eliminations Construction Total Reclassifications FundCurrent assets
Cash and cash equivalents $ 15,114,176 $ -- $ --Short-term investments 41,098,261 -- --Interfund receivable -- (2,325,066) --Accounts receivable 783,179 -- --Accrued interest receivable 1,053,696 -- --Material and supply inventory 408,422 -- --Prepaid expense and other assets 1,493,629 -- --Current portion of note receivable 1,105,741 -- --
Total current assets 61,057,104 (2,325,066) --Restricted assetsCash and cash equivalents 7,642,583 -- 6,121,749Investments 53,282,745 -- 28,521,930Accrued interest receivable 52,962 -- 39,997
Total restricted assets 60,978,290 -- 34,683,676
Long-term note receivable 6,317,880 -- --
Other long-term investments 24,867,938 -- --Capital assets
Cost of initial turnpike and improvements 566,147,160 -- 486,397,889
$ 719,368,372 $ (2,325,066) $ 521,081,565LIABILITIES AND NET ASSETS
Current liabilitiesCurrent maturities of long-term debt $ 10,805,000 $ -- $ 10,805,000Prepaid tolls 2,470,103 -- --Accounts payable 674,451 -- --Interfund payable -- (2,325,066) --Accrued expenses 5,340,328 -- 1,181,326Accrued interest 4,301,697 -- --
Total current liabilities 23,591,579 (2,325,066) 11,986,326Long-term debt
Turnpike revenue bonds 275,755,000 -- 275,755,000Bond premium 5,656,347 -- 5,656,347Deferred refunding (5,320,453) -- --Other long-term liabilities 2,391,529 -- --
Total long-term liabilities 278,482,423 -- 281,411,347
Total liabilities 302,074,002 (2,325,066) 293,397,673Net assets
Invested in capital assets, net of related debt 302,093,775 -- 227,664,957Restricted - expendable for debt service 32,368,707 -- --Unrestricted 82,831,888 -- 18,935
Total net assets 417,294,370 -- 227,683,892Total liabilities and net assets $ 719,368,372 $ (2,325,066) $ 521,081,565
32
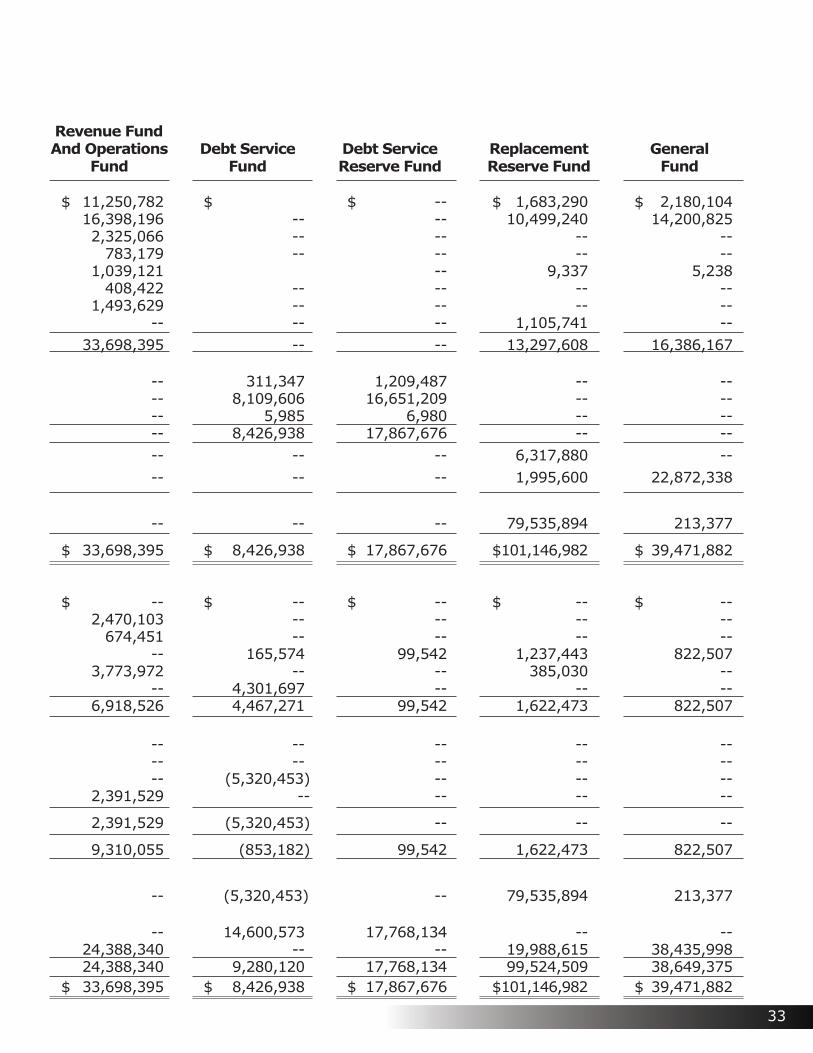
Revenue Fund And Operations Debt Service Debt Service Replacement General Fund Fund Reserve Fund Reserve Fund Fund
$ 11,250,782 $ $ -- $ 1,683,290 $ 2,180,104 16,398,196 -- -- 10,499,240 14,200,825 2,325,066 -- -- -- -- 783,179 -- -- -- -- 1,039,121 -- 9,337 5,238 408,422 -- -- -- -- 1,493,629 -- -- -- -- -- -- -- 1,105,741 -- 33,698,395 -- -- 13,297,608 16,386,167
-- 311,347 1,209,487 -- -- -- 8,109,606 16,651,209 -- -- -- 5,985 6,980 -- -- -- 8,426,938 17,867,676 -- -- -- -- -- 6,317,880 -- -- -- -- 1,995,600 22,872,338
-- -- -- 79,535,894 213,377
$ 33,698,395 $ 8,426,938 $ 17,867,676 $ 101,146,982 $ 39,471,882
$ -- $ -- $ -- $ -- $ -- 2,470,103 -- -- -- -- 674,451 -- -- -- -- -- 165,574 99,542 1,237,443 822,507 3,773,972 -- -- 385,030 -- -- 4,301,697 -- -- -- 6,918,526 4,467,271 99,542 1,622,473 822,507
-- -- -- -- -- -- -- -- -- -- -- (5,320,453) -- -- -- 2,391,529 -- -- -- --
2,391,529 (5,320,453) -- -- --
9,310,055 (853,182) 99,542 1,622,473 822,507
-- (5,320,453) -- 79,535,894 213,377
-- 14,600,573 17,768,134 -- -- 24,388,340 -- -- 19,988,615 38,435,998 24,388,340 9,280,120 17,768,134 99,524,509 38,649,375 $ 33,698,395 $ 8,426,938 $ 17,867,676 $ 101,146,982 $ 39,471,882
33
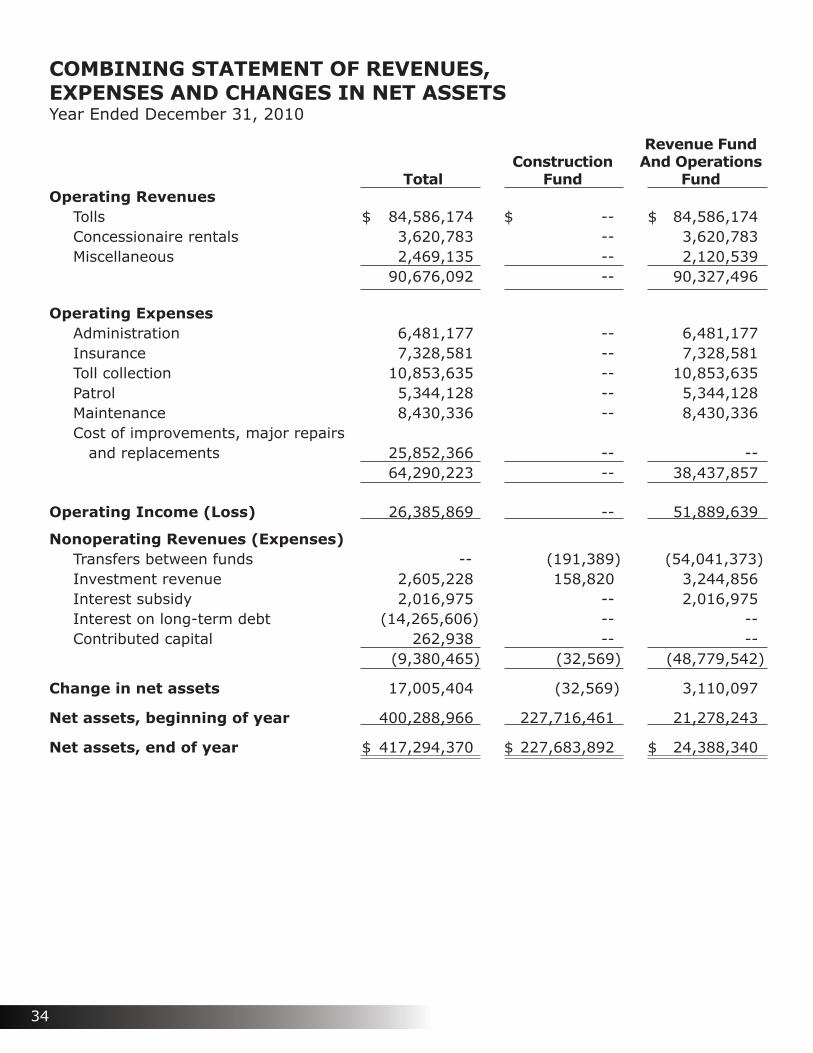
COMBINING STATEMENT OF REVENUES, EXPENSES AND CHANGES IN NET ASSETSYear Ended December 31, 2010
Revenue Fund Construction And Operations Total Fund FundOperating Revenues
Tolls $ 84,586,174 $ -- $ 84,586,174Concessionaire rentals 3,620,783 -- 3,620,783Miscellaneous 2,469,135 -- 2,120,539
90,676,092 -- 90,327,496
Operating ExpensesAdministration 6,481,177 -- 6,481,177Insurance 7,328,581 -- 7,328,581Toll collection 10,853,635 -- 10,853,635Patrol 5,344,128 -- 5,344,128Maintenance 8,430,336 -- 8,430,336Cost of improvements, major repairs and replacements 25,852,366 -- --
64,290,223 -- 38,437,857
Operating Income (Loss) 26,385,869 -- 51,889,639
Nonoperating Revenues (Expenses)Transfers between funds -- (191,389) (54,041,373)Investment revenue 2,605,228 158,820 3,244,856Interest subsidy 2,016,975 -- 2,016,975Interest on long-term debt (14,265,606) -- --Contributed capital 262,938 -- --
(9,380,465) (32,569) (48,779,542)
Change in net assets 17,005,404 (32,569) 3,110,097
Net assets, beginning of year 400,288,966 227,716,461 21,278,243
Net assets, end of year $ 417,294,370 $ 227,683,892 $ 24,388,340
34
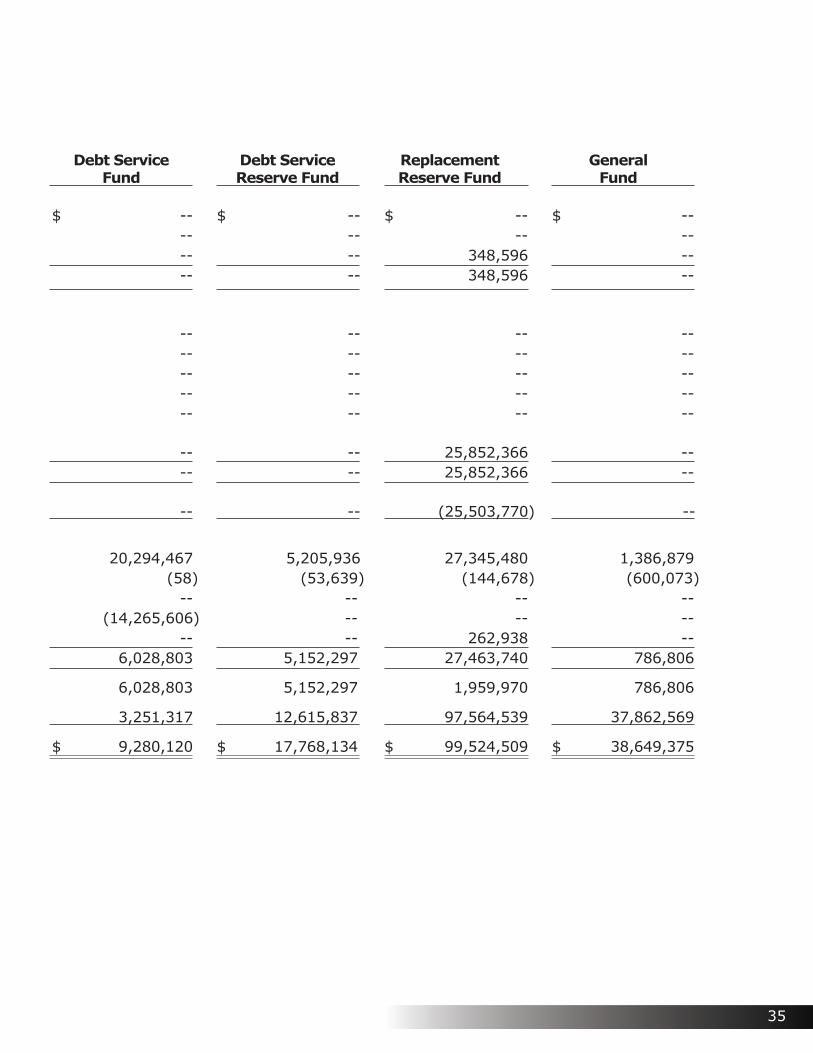
Debt Service Debt Service Replacement General Fund Reserve Fund Reserve Fund Fund
$ -- $ -- $ -- $ -- -- -- -- -- -- -- 348,596 -- -- -- 348,596 --
-- -- -- -- -- -- -- -- -- -- -- -- -- -- -- -- -- -- -- --
-- -- 25,852,366 -- -- -- 25,852,366 --
-- -- (25,503,770) --
20,294,467 5,205,936 27,345,480 1,386,879 (58) (53,639) (144,678) (600,073) -- -- -- -- (14,265,606) -- -- -- -- -- 262,938 -- 6,028,803 5,152,297 27,463,740 786,806
6,028,803 5,152,297 1,959,970 786,806
3,251,317 12,615,837 97,564,539 37,862,569
$ 9,280,120 $ 17,768,134 $ 99,524,509 $ 38,649,375
35
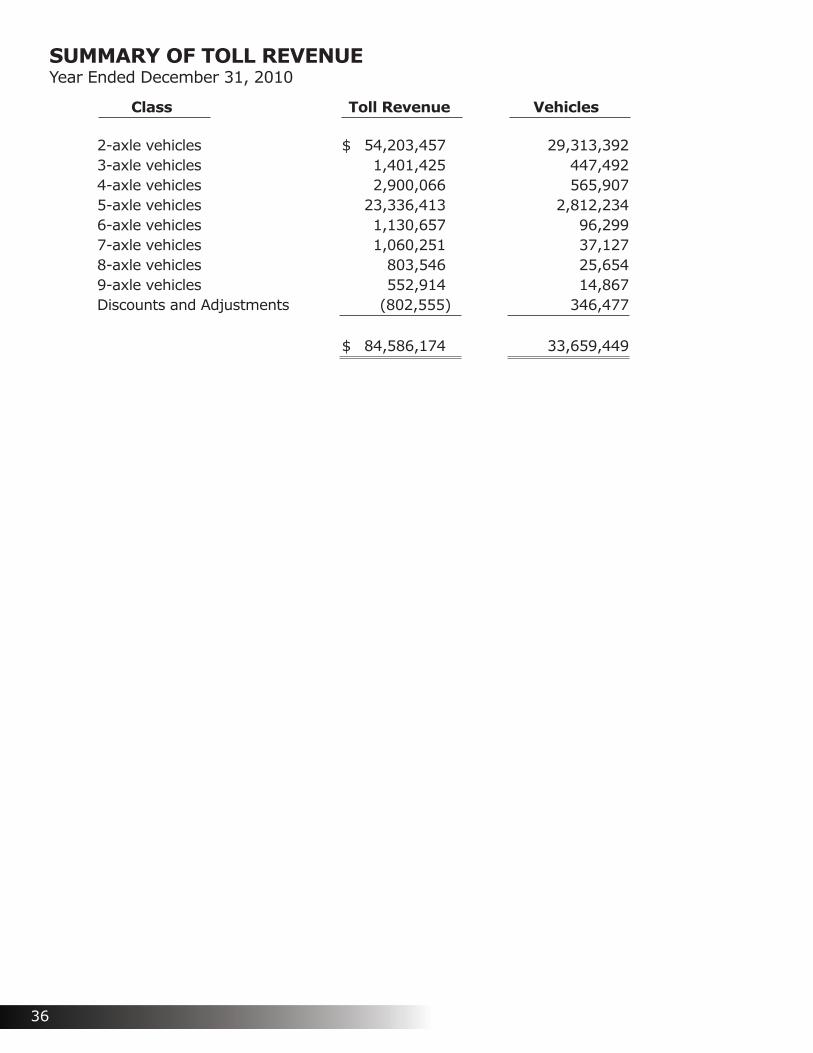
SUMMARY OF TOLL REVENUEYear Ended December 31, 2010
Class Toll Revenue Vehicles
2-axle vehicles $ 54,203,457 29,313,3923-axle vehicles 1,401,425 447,4924-axle vehicles 2,900,066 565,9075-axle vehicles 23,336,413 2,812,2346-axle vehicles 1,130,657 96,2997-axle vehicles 1,060,251 37,1278-axle vehicles 803,546 25,6549-axle vehicles 552,914 14,867Discounts and Adjustments (802,555) 346,477
$ 84,586,174 33,659,449
36
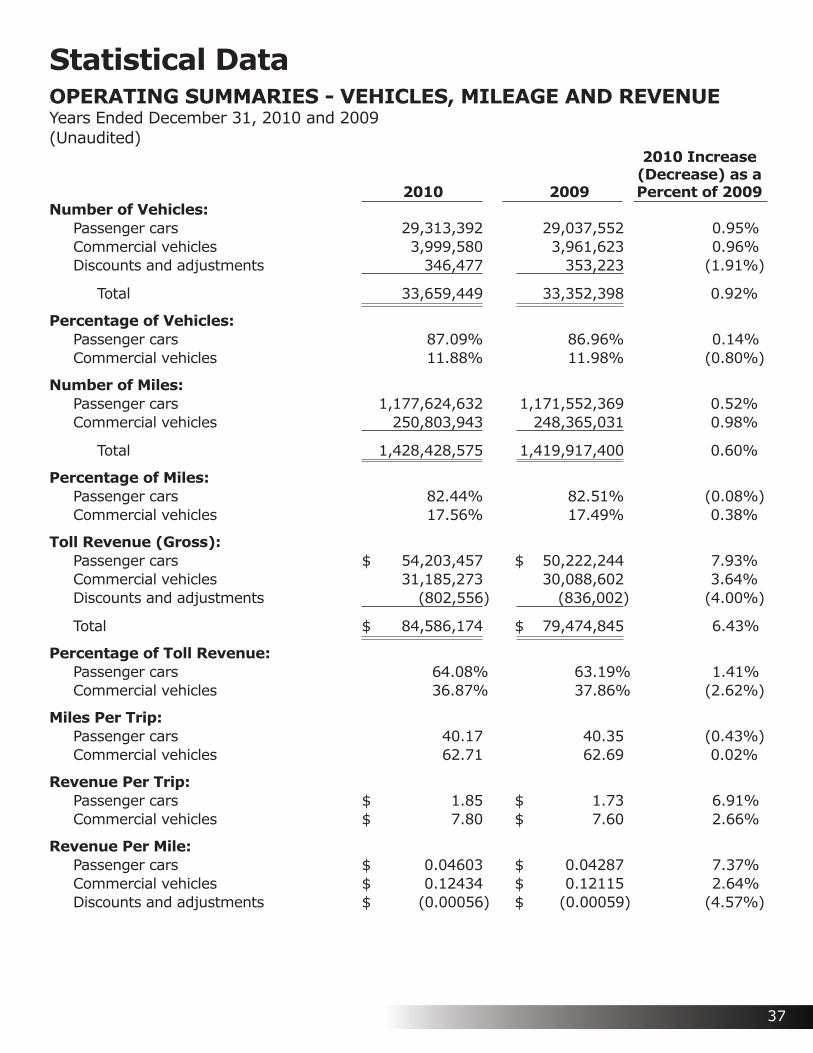
Statistical DataOPERATING SUMMARIES - VEHICLES, MILEAGE AND REVENUEYears Ended December 31, 2010 and 2009(Unaudited) 2010 Increase (Decrease) as a 2010 2009 Percent of 2009Number of Vehicles:
Passenger cars 29,313,392 29,037,552 0.95%Commercial vehicles 3,999,580 3,961,623 0.96%Discounts and adjustments 346,477 353,223 (1.91%)
Total 33,659,449 33,352,398 0.92%
Percentage of Vehicles:Passenger cars 87.09% 86.96% 0.14%Commercial vehicles 11.88% 11.98% (0.80%)
Number of Miles:Passenger cars 1,177,624,632 1,171,552,369 0.52%Commercial vehicles 250,803,943 248,365,031 0.98%
Total 1,428,428,575 1,419,917,400 0.60%
Percentage of Miles:Passenger cars 82.44% 82.51% (0.08%)Commercial vehicles 17.56% 17.49% 0.38%
Toll Revenue (Gross):Passenger cars $ 54,203,457 $ 50,222,244 7.93% Commercial vehicles 31,185,273 30,088,602 3.64%Discounts and adjustments (802,556) (836,002) (4.00%)
Total $ 84,586,174 $ 79,474,845 6.43%
Percentage of Toll Revenue: Passenger cars 64.08% 63.19% 1.41%Commercial vehicles 36.87% 37.86% (2.62%)
Miles Per Trip:Passenger cars 40.17 40.35 (0.43%)Commercial vehicles 62.71 62.69 0.02%
Revenue Per Trip:Passenger cars $ 1.85 $ 1.73 6.91%Commercial vehicles $ 7.80 $ 7.60 2.66%
Revenue Per Mile:Passenger cars $ 0.04603 $ 0.04287 7.37%Commercial vehicles $ 0.12434 $ 0.12115 2.64%Discounts and adjustments $ (0.00056) $ (0.00059) (4.57%)
37
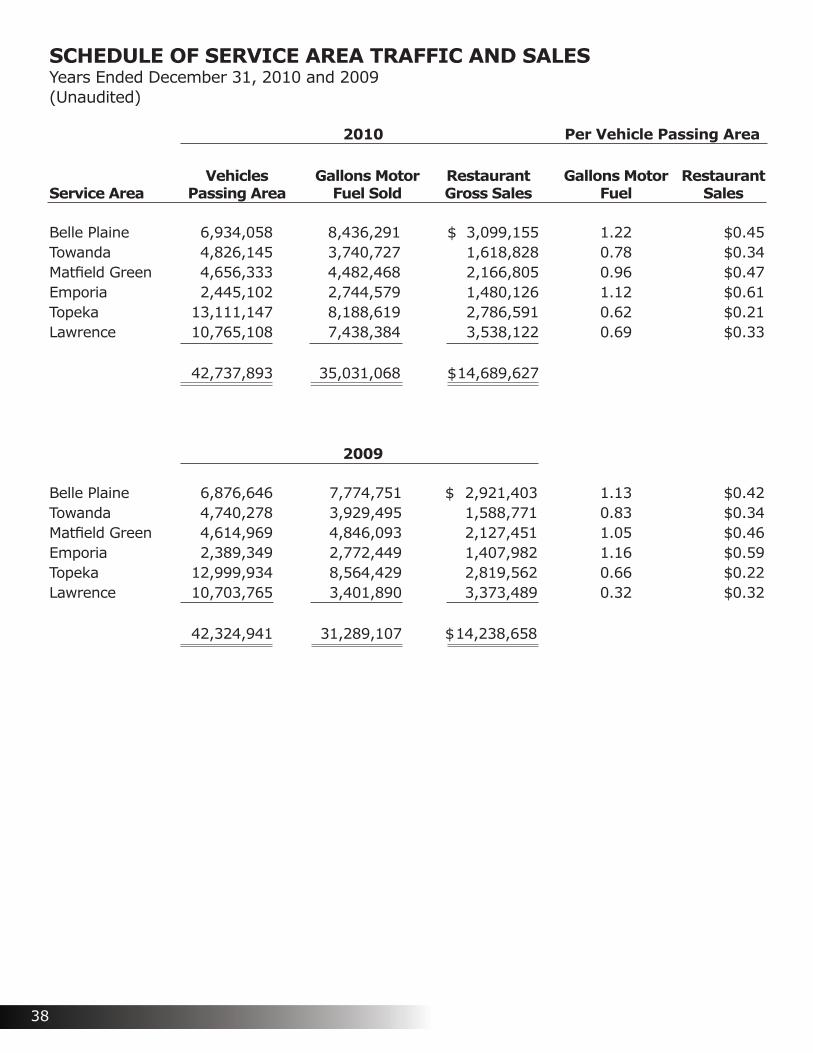
SCHEDULE OF SERVICE AREA TRAFFIC AND SALESYears Ended December 31, 2010 and 2009(Unaudited)
2010 Per Vehicle Passing Area
Vehicles Gallons Motor Restaurant Gallons Motor RestaurantService Area Passing Area Fuel Sold Gross Sales Fuel Sales
Belle Plaine 6,934,058 8,436,291 $ 3,099,155 1.22 $0.45Towanda 4,826,145 3,740,727 1,618,828 0.78 $0.34Matfield Green 4,656,333 4,482,468 2,166,805 0.96 $0.47Emporia 2,445,102 2,744,579 1,480,126 1.12 $0.61Topeka 13,111,147 8,188,619 2,786,591 0.62 $0.21Lawrence 10,765,108 7,438,384 3,538,122 0.69 $0.33
42,737,893 35,031,068 $ 14,689,627
2009
Belle Plaine 6,876,646 7,774,751 $ 2,921,403 1.13 $0.42Towanda 4,740,278 3,929,495 1,588,771 0.83 $0.34Matfield Green 4,614,969 4,846,093 2,127,451 1.05 $0.46Emporia 2,389,349 2,772,449 1,407,982 1.16 $0.59Topeka 12,999,934 8,564,429 2,819,562 0.66 $0.22Lawrence 10,703,765 3,401,890 3,373,489 0.32 $0.32
42,324,941 31,289,107 $ 14,238,658
38
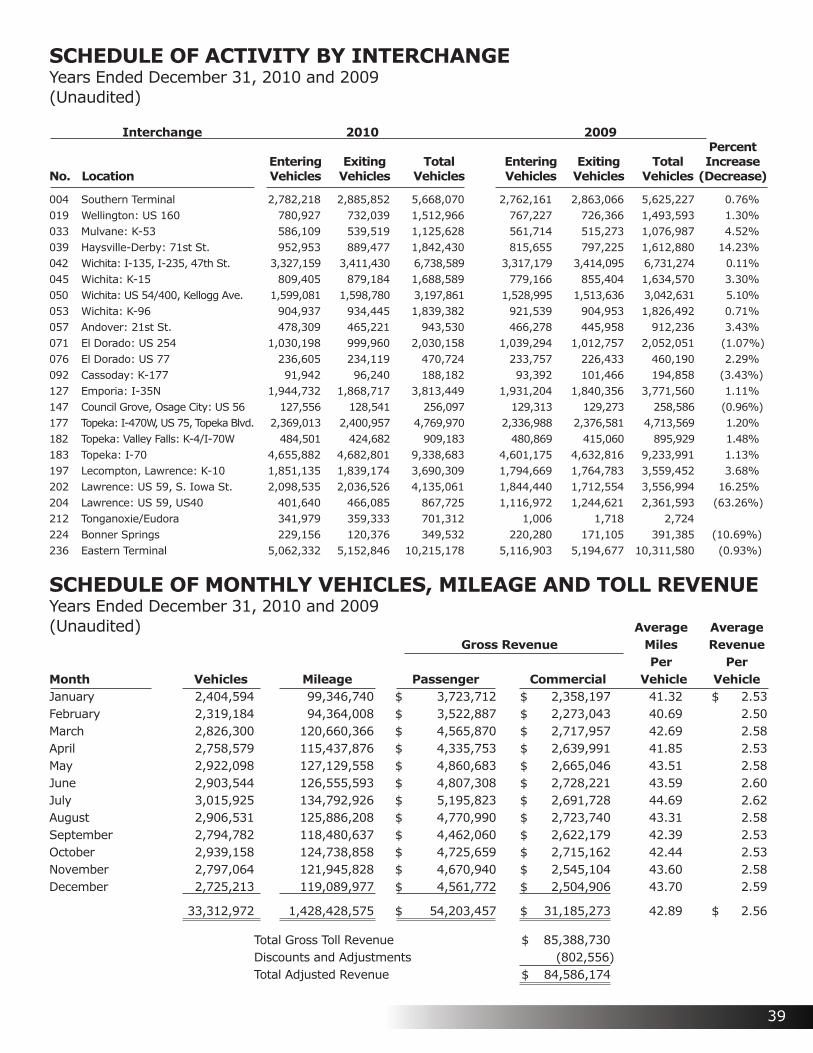
SCHEDULE OF ACTIVITY BY INTERCHANGEYears Ended December 31, 2010 and 2009(Unaudited)
Interchange 2010 2009 Percent Entering Exiting Total Entering Exiting Total IncreaseNo. Location Vehicles Vehicles Vehicles Vehicles Vehicles Vehicles (Decrease)
004 Southern Terminal 2,782,218 2,885,852 5,668,070 2,762,161 2,863,066 5,625,227 0.76%019 Wellington: US 160 780,927 732,039 1,512,966 767,227 726,366 1,493,593 1.30%033 Mulvane: K-53 586,109 539,519 1,125,628 561,714 515,273 1,076,987 4.52%039 Haysville-Derby: 71st St. 952,953 889,477 1,842,430 815,655 797,225 1,612,880 14.23%042 Wichita: I-135, I-235, 47th St. 3,327,159 3,411,430 6,738,589 3,317,179 3,414,095 6,731,274 0.11%045 Wichita: K-15 809,405 879,184 1,688,589 779,166 855,404 1,634,570 3.30%050 Wichita: US 54/400, Kellogg Ave. 1,599,081 1,598,780 3,197,861 1,528,995 1,513,636 3,042,631 5.10%053 Wichita: K-96 904,937 934,445 1,839,382 921,539 904,953 1,826,492 0.71%057 Andover: 21st St. 478,309 465,221 943,530 466,278 445,958 912,236 3.43%071 El Dorado: US 254 1,030,198 999,960 2,030,158 1,039,294 1,012,757 2,052,051 (1.07%)076 El Dorado: US 77 236,605 234,119 470,724 233,757 226,433 460,190 2.29%092 Cassoday: K-177 91,942 96,240 188,182 93,392 101,466 194,858 (3.43%)127 Emporia: I-35N 1,944,732 1,868,717 3,813,449 1,931,204 1,840,356 3,771,560 1.11%147 Council Grove, Osage City: US 56 127,556 128,541 256,097 129,313 129,273 258,586 (0.96%)177 Topeka: I-470W, US 75, Topeka Blvd. 2,369,013 2,400,957 4,769,970 2,336,988 2,376,581 4,713,569 1.20%182 Topeka: Valley Falls: K-4/I-70W 484,501 424,682 909,183 480,869 415,060 895,929 1.48%183 Topeka: I-70 4,655,882 4,682,801 9,338,683 4,601,175 4,632,816 9,233,991 1.13%197 Lecompton, Lawrence: K-10 1,851,135 1,839,174 3,690,309 1,794,669 1,764,783 3,559,452 3.68%202 Lawrence: US 59, S. Iowa St. 2,098,535 2,036,526 4,135,061 1,844,440 1,712,554 3,556,994 16.25%204 Lawrence: US 59, US40 401,640 466,085 867,725 1,116,972 1,244,621 2,361,593 (63.26%)212 Tonganoxie/Eudora 341,979 359,333 701,312 1,006 1,718 2,724224 Bonner Springs 229,156 120,376 349,532 220,280 171,105 391,385 (10.69%)236 Eastern Terminal 5,062,332 5,152,846 10,215,178 5,116,903 5,194,677 10,311,580 (0.93%)
SCHEDULE OF MONTHLY VEHICLES, MILEAGE AND TOLL REVENUEYears Ended December 31, 2010 and 2009(Unaudited) Average Average Gross Revenue Miles Revenue Per PerMonth Vehicles Mileage Passenger Commercial Vehicle VehicleJanuary 2,404,594 99,346,740 $ 3,723,712 $ 2,358,197 41.32 $ 2.53 February 2,319,184 94,364,008 $ 3,522,887 $ 2,273,043 40.69 2.50 March 2,826,300 120,660,366 $ 4,565,870 $ 2,717,957 42.69 2.58 April 2,758,579 115,437,876 $ 4,335,753 $ 2,639,991 41.85 2.53 May 2,922,098 127,129,558 $ 4,860,683 $ 2,665,046 43.51 2.58 June 2,903,544 126,555,593 $ 4,807,308 $ 2,728,221 43.59 2.60 July 3,015,925 134,792,926 $ 5,195,823 $ 2,691,728 44.69 2.62August 2,906,531 125,886,208 $ 4,770,990 $ 2,723,740 43.31 2.58September 2,794,782 118,480,637 $ 4,462,060 $ 2,622,179 42.39 2.53October 2,939,158 124,738,858 $ 4,725,659 $ 2,715,162 42.44 2.53November 2,797,064 121,945,828 $ 4,670,940 $ 2,545,104 43.60 2.58December 2,725,213 119,089,977 $ 4,561,772 $ 2,504,906 43.70 2.59
33,312,972 1,428,428,575 $ 54,203,457 $ 31,185,273 42.89 $ 2.56
Total Gross Toll Revenue $ 85,388,730 Discounts and Adjustments (802,556) Total Adjusted Revenue $ 84,586,174
39
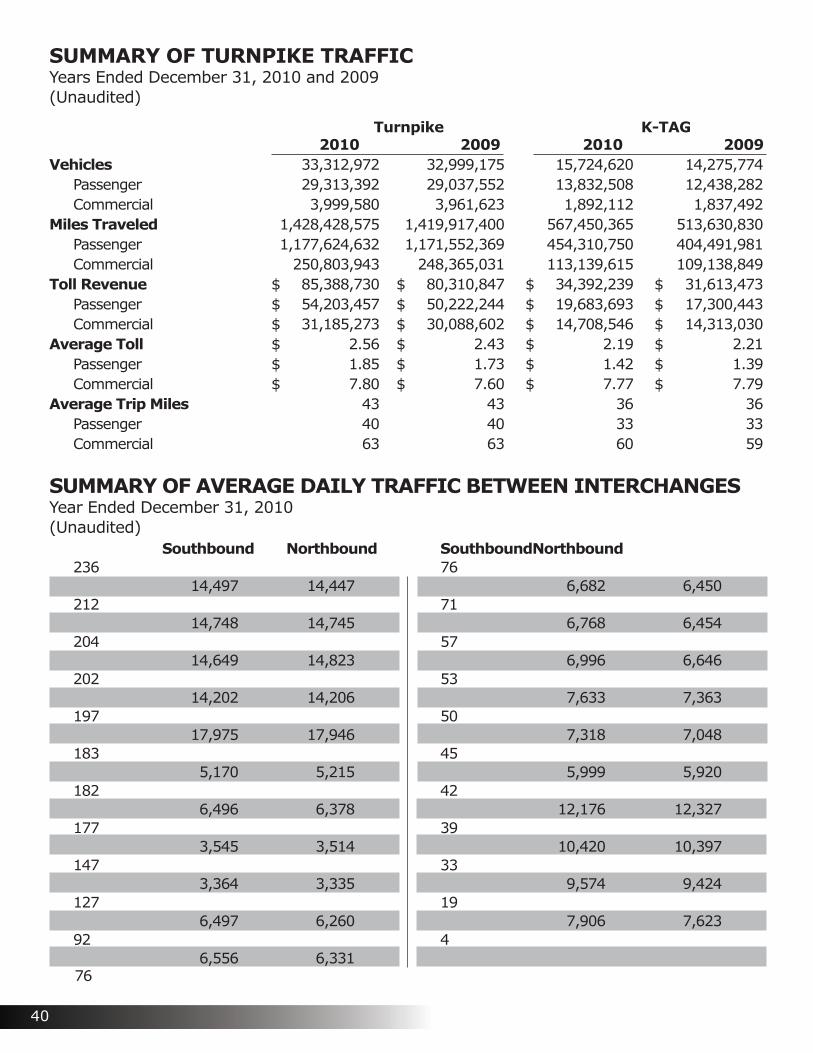
Southbound Northbound236 14,497 14,447212 14,748 14,745204 14,649 14,823202 14,202 14,206197 17,975 17,946183 5,170 5,215182 6,496 6,378177 3,545 3,514147 3,364 3,335127 6,497 6,26092 6,556 6,331 76
Southbound Northbound76 6,682 6,45071 6,768 6,45457 6,996 6,64653 7,633 7,36350 7,318 7,04845 5,999 5,92042 12,176 12,32739 10,420 10,39733 9,574 9,42419 7,906 7,6234
SUMMARY OF TURNPIKE TRAFFICYears Ended December 31, 2010 and 2009(Unaudited)
Turnpike K-TAG 2010 2009 2010 2009Vehicles 33,312,972 32,999,175 15,724,620 14,275,774
Passenger 29,313,392 29,037,552 13,832,508 12,438,282Commercial 3,999,580 3,961,623 1,892,112 1,837,492
Miles Traveled 1,428,428,575 1,419,917,400 567,450,365 513,630,830Passenger 1,177,624,632 1,171,552,369 454,310,750 404,491,981Commercial 250,803,943 248,365,031 113,139,615 109,138,849
Toll Revenue $ 85,388,730 $ 80,310,847 $ 34,392,239 $ 31,613,473Passenger $ 54,203,457 $ 50,222,244 $ 19,683,693 $ 17,300,443Commercial $ 31,185,273 $ 30,088,602 $ 14,708,546 $ 14,313,030
Average Toll $ 2.56 $ 2.43 $ 2.19 $ 2.21Passenger $ 1.85 $ 1.73 $ 1.42 $ 1.39Commercial $ 7.80 $ 7.60 $ 7.77 $ 7.79
Average Trip Miles 43 43 36 36Passenger 40 40 33 33Commercial 63 63 60 59
SUMMARY OF AVERAGE DAILY TRAFFIC BETWEEN INTERCHANGESYear Ended December 31, 2010(Unaudited)
40