EARNED SCHEDULE An emerging Earned Value technique January 2010 Authored by: Alex Davis Ministry Of Defence Land Equipment Programme, Project and Risk Manager Mick Higgins Eurocopter UK Puma HC Mk2 EVM & Risk Monitor and The APM Earned Value Management SIG Working Group

Welcome message from author
This document is posted to help you gain knowledge. Please leave a comment to let me know what you think about it! Share it to your friends and learn new things together.
Transcript

1
EARNED SCHEDULE
An emerging Earned Value technique
January 2010
Authored by:
Alex Davis Ministry Of Defence
Land Equipment Programme, Project and Risk Manager
Mick Higgins Eurocopter UK
Puma HC Mk2 EVM & Risk Monitor
and
The APM Earned Value Management SIG Working Group

2
Table of contents
PREFACE .............................................................................................................. 3
INTRODUCTION ................................................................................................... 4
APPLICABILITY ..................................................................................................... 5
BASIC REQUIREMENTS FOR EARNED SCHEDULE .................................................... 5
WHAT IS EARNED SCHEDULE? .............................................................................. 5
1.1 EARNED SCHEDULE PRINCIPLES ............................................................................ 5 1.2 EARNED SCHEDULE BENEFITS ............................................................................... 6 1.3 POINTS TO NOTE (WORDS OF WARNING) ................................................................. 7 1.4 UNDERSTANDING EARNED SCHEDULE .................................................................... 7
APPENDIX A – A REAL EXAMPLE .......................................................................... 10
APPENDIX B – ACCURACY OF THE EARNED SCHEDULE METHOD ......................... 20
APPENDIX C – SCHEDULE ADHERENCE ............................................................... 22
ANNEX C1 – SCHEDULE ADHERENCE AND THE ‘P’ FACTOR .................................. 23
APPENDIX D: EARNED SCHEDULE SOFTWARE APPLICATIONS .............................. 24
APPENDIX E: FUTURE WORK WITH EARNED SCHEDULE ....................................... 25
APPENDIX F: ABBREVIATIONS AND ACRONYMS .................................................. 25
APPENDIX G: EARNED SCHEDULE TERMINOLOGY ............................................... 27
FIGURES AND TABLES ........................................................................................ 28

3
Preface The main purpose of the APM's Specific Interest Groups (SIGS) is to act as a forum for discussion. These discussions are normally about how to turn the theory into practice through the development of tools and techniques. Occasionally the discussion turns to new emerging ideas or techniques that SIG members bring to their meetings to share and discuss. A case in point is Earned Schedule which has slowly emerged since 2000. Earned Schedule is a technique for calculating time-based estimates at completion using your existing EV data in a different way to those already defined in either the EV lexicon of Earned Value Management: APM Guidelines or the US ANSI 748 Earned Value Standard. The technique has largely been championed by Walt Lipke in the US and Kym Henderson in Australia. Prophets in their own lands are often damned and this was no exception. The UK offered a non-judgmental platform and interest has slowly but surely grown. The ES toolset has been made freely available at www.earnedschedule.com and used by several people in several organizations in several countries on several projects with encouraging results. So it could be a new additional tool. It might work - it might not. We need to find out by asking a larger community to try it out and to share their experience. We now need more evidence. We need to know if we have more than snake-oil or wishful thinking here. The APM EV SIG thinks that what has happened to date merits a further look, so that Earned Schedule can either be recommended for inclusion within the APM Body of Knowledge or not. The feedback provided will inform a review of evidence to date in late 2010. This booklet is the APM EV SIG's way of encapsulating current thoughts on this topic (Earned Schedule) in such a way that a common interpretation of ES can be agreed and evaluated meaningfully by the project management community. It is a pamphlet; neither a guideline nor a standard. A standard or guideline will only be recommended when more evidence is available to support the theory. So be critical in your use of this booklet and have your wits about you when assessing it. Record successes as well as failure and tell us about it. We will collate and report findings. It is just as important to share bad news as well as good. Steve Wake Chairman APM Earned Value Management Specific Interest Group

4
Introduction Earned Schedule (ES) is an additional calculation for use with Earned Value. It’s neither difficult nor time consuming. It’s not that new either, having been used informally since the early days of earned value1. The theory, technique and calculation has been formalised by Walt Lipke2. Kym Henderson validated the technique and extended its use to forecasting using current projects in the USA, Australia and the UK since 20033. The ES technique has also been validated by using data from projects already completed (and in some cases, cancelled) both in the public and private sectors. Research is still ongoing to validate the use of ES – the evidence suggests, so far, that this is better than ‘organic interpretation’ - also known as guesswork - but not necessarily better than using existing EV reporting techniques to their full potential. Both real and simulated data has shown the ES technique to be more accurate when compared to other predictive statistics4. It is, in essence, an extension to Earned Value and another project control technique to be used in conjunction with existing methodologies. The most important development in ES is its ability to more accurately determine the completion date for projects that are behind schedule (or will deliver later than planned.) ES uses EV performance data to generate the time-based information and as with EV, uses very similar calculations to predict future performance. Earned Schedule can be used to “drill-down” through the project’s Work Breakdown Structure (WBS), in much the same way as Earned Value, to identify where deficiencies or constraints may exist and where future rework may be needed, if current performance does not change.
1 ”The trouble with Earned Schedule", Measurable News, Fall 2008, Issue 4, pp28-30, Abba W 2 “Schedule is different, CrossTalk, December 2003: pp21-24., Lipke W 3 “Measuring the Accuracy of Earned Value/Earned Schedule Forecasting Predictors,” The Measurable News, Winter 2007-2008: 26-30 [Vanhoucke & Vandevoorde] 4 “A Simulation and Evaluation of Earned Value Metrics to Forecast Project Duration", Journal of Operations Research Society, October 2007, Vol 58: 1361-1374 [Vanhoucke & Vandevoorde]
5
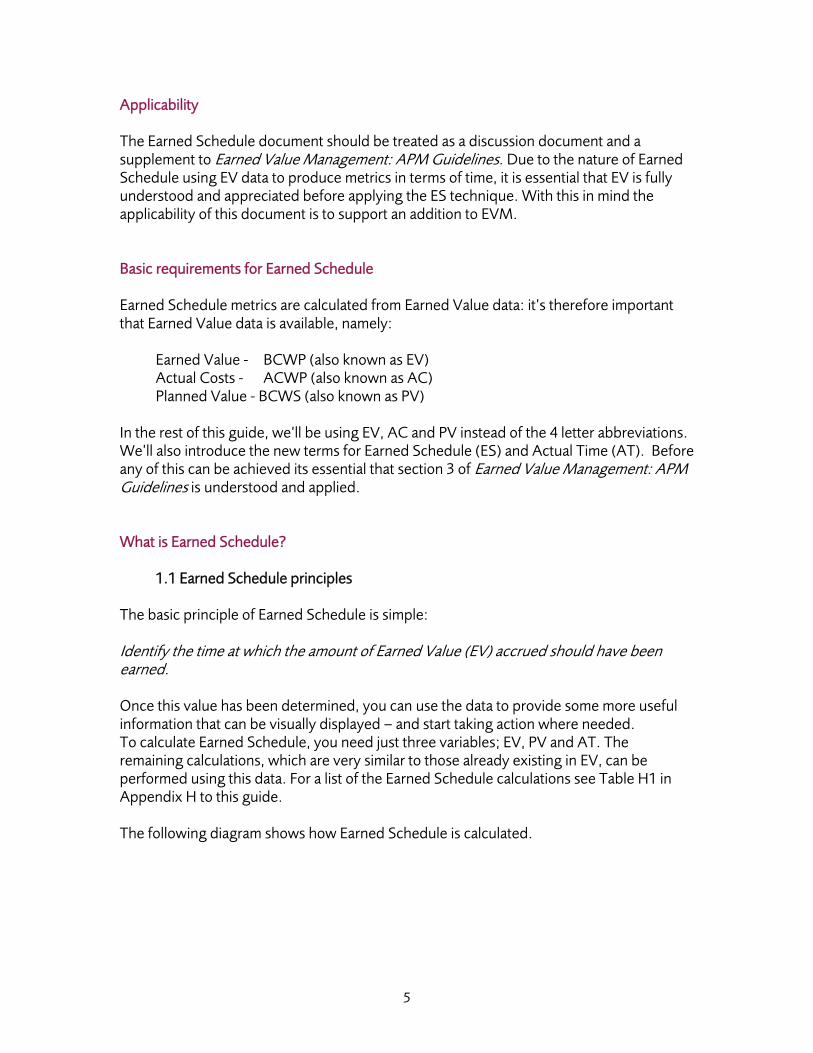
Applicability The Earned Schedule document should be treated as a discussion document and a supplement to Earned Value Management: APM Guidelines. Due to the nature of Earned Schedule using EV data to produce metrics in terms of time, it is essential that EV is fully understood and appreciated before applying the ES technique. With this in mind the applicability of this document is to support an addition to EVM. Basic requirements for Earned Schedule Earned Schedule metrics are calculated from Earned Value data: it’s therefore important that Earned Value data is available, namely:
Earned Value - BCWP (also known as EV) Actual Costs - ACWP (also known as AC) Planned Value - BCWS (also known as PV)
In the rest of this guide, we’ll be using EV, AC and PV instead of the 4 letter abbreviations. We’ll also introduce the new terms for Earned Schedule (ES) and Actual Time (AT). Before any of this can be achieved its essential that section 3 of Earned Value Management: APM Guidelines is understood and applied. What is Earned Schedule?
1.1 Earned Schedule principles The basic principle of Earned Schedule is simple: Identify the time at which the amount of Earned Value (EV) accrued should have been earned. Once this value has been determined, you can use the data to provide some more useful information that can be visually displayed – and start taking action where needed. To calculate Earned Schedule, you need just three variables; EV, PV and AT. The remaining calculations, which are very similar to those already existing in EV, can be performed using this data. For a list of the Earned Schedule calculations see Table H1 in Appendix H to this guide. The following diagram shows how Earned Schedule is calculated.
6
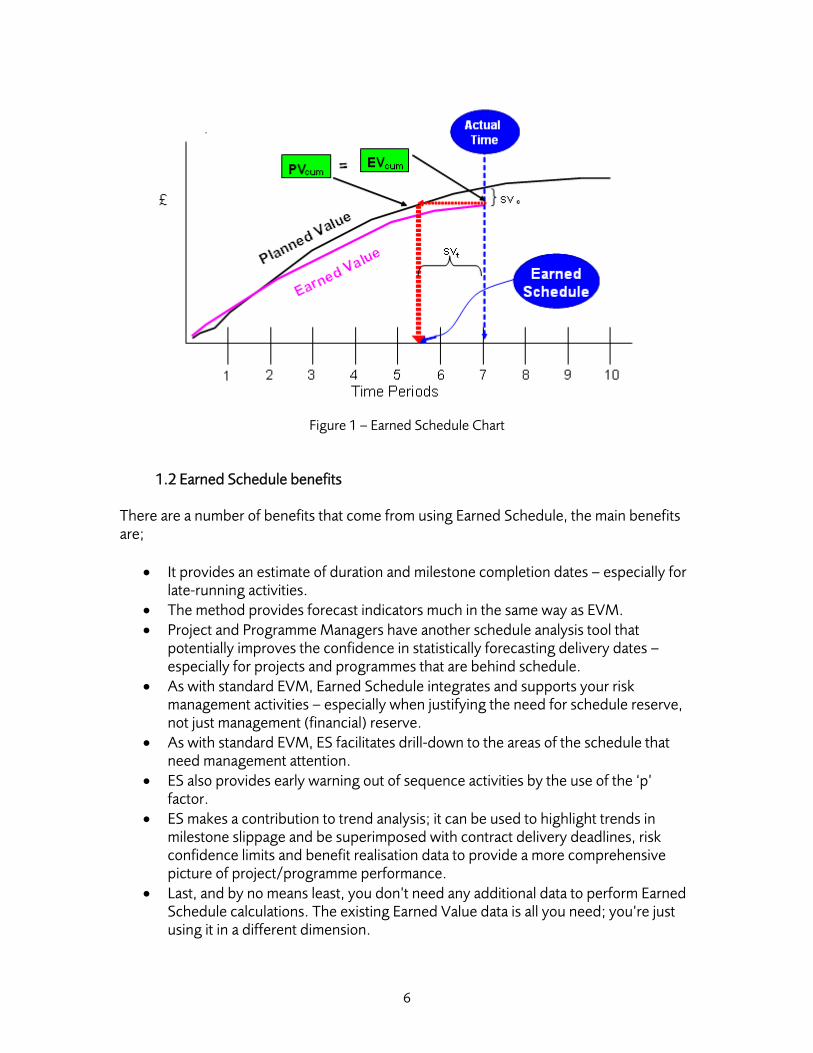
Figure 1 – Earned Schedule Chart
1.2 Earned Schedule benefits
There are a number of benefits that come from using Earned Schedule, the main benefits are;
• It provides an estimate of duration and milestone completion dates – especially for late-running activities.
• The method provides forecast indicators much in the same way as EVM. • Project and Programme Managers have another schedule analysis tool that
potentially improves the confidence in statistically forecasting delivery dates – especially for projects and programmes that are behind schedule.
• As with standard EVM, Earned Schedule integrates and supports your risk management activities – especially when justifying the need for schedule reserve, not just management (financial) reserve.
• As with standard EVM, ES facilitates drill-down to the areas of the schedule that need management attention.
• ES also provides early warning out of sequence activities by the use of the ‘p’ factor.
• ES makes a contribution to trend analysis; it can be used to highlight trends in milestone slippage and be superimposed with contract delivery deadlines, risk confidence limits and benefit realisation data to provide a more comprehensive picture of project/programme performance.
• Last, and by no means least, you don’t need any additional data to perform Earned Schedule calculations. The existing Earned Value data is all you need; you’re just using it in a different dimension.

7
1.3 Points to note (words of warning)
• Check input data is coming from a stable baseline and that the project is not mortgaging work (moving scope into the future).
• The project is not masking variances by making large changes and that all changes are authorised, plus the number & size of changes is small.
• Check that data at the Beginning Of Period (BOP) is the same as End Of Period (EOP). If not, check that changes have been authorised and are not amazingly large.
• Check that processes and procedures are still being adhered to. (Are you doing what you said you’d do?)
• Make sure that the output data has been verified and validated. If the application is bespoke or custom built, then you may need to spend more time checking and locking up/down all or part of the application to minimise errors.
• Also be aware of changing phases in a project lifecycle. Predictions based upon an “easy” phase may not carry forward into a “hard” phase.
• How the data is broken up may also impact the ability to forecast. • ES is not a replacement for existing Project Control methodologies; it is an
emerging extension of the existing EVM methodology and as such should be used in conjunction with other project performance indicators.
• Don’t ignore other techniques such as critical path analysis, Schedule Risk Analysis (SRA), Cost Risk Analysis (CRA) and cost-benefit analysis.
• Schedule Variance is still an important number and can still be used to predict completion dates and compare the results to the ES method – so don’t forget it.
• Remember: You should be looking for trends, not just numbers.
1.4 Understanding Earned Schedule The graph below shows at the end of the 7th time period (this is usually measured in either weeks or months) the cumulative amount of value earned (EVcum). The Earned Schedule value is calculated by projecting the EV curve (the horizontal dotted red line) until it meets the cumulative Planned Value (PVcum) curve. This is the point at which EV=PV, the time at which the EV amount should have been earned. By tracing this point on the PVcum curve to the x-axis (the vertical dotted red line) you determine the amount of time “earned” schedule. In the graph, this value is approximately 5.5 months.

8
Figure 2: Calculating Earned Schedule You may have noticed that this is a very approximate way of calculating our Earned Schedule. There is a formal method that can be used to calculate ES: ES = C + I where: ES = Earned Schedule C = number of complete time periods for which EVcum ≥ PVcum (BCWP ≥ BCWS) The way in which the number of complete time periods is calculated can be seen in Annex B and can be completed either manually or automatically – for example by use of a spreadsheet. And the increment I I = (EV – PVC) / (PVC+1 – PVC) With PV and EV keeping their original meanings Using our previous graph, you’ll see that if we use the equation above, we have 5 periods where our EV value is ≥ to PV. That leaves the calculation for the increment. Let’s zoom into the part of the graph near the top of the EV curve to see how the increment is calculated:

9
Figure 3: Calculating the increment I
You can see that the upper half of the fraction (known as the numerator) is shown on the left of the graph. Both terms of the numerator are taken from the two data points shown with the arrows (it’s also marked by the red dotted lines.) The bottom of the equation (the denominator) is shown on the right of the graph. In this case, the values for PVC+1 and PVC are represented as PV6 and PV5 respectively, the planned values for periods 5 and 6 (months or weeks – it doesn’t matter, as long as the values are used consistently throughout.) By dividing the left hand equation by that on the right, we end up with the increment value – this is expressed not in terms of money but time. In the graph, we don’t have actual values, but you can see that the fraction is approximately 0.5 months and is represented by the vertical green dotted arrow; take note the chart is not to scale. So from our ES equation, ES = C+I, we have the following: C = 5 (the complete number for periods where EV ≥ PV) And I = 0.5 Therefore ES = 5.5.

10
Now, compare this to the original graph. You’ll remember that the Actual Time (AT) was 7 periods. That means we should have done the equivalent of 7 months’ worth of work by now. Only 5.5 months has been completed. So, the project is 1.5 months behind schedule. Something needs to be done to bring the project back on track. Appendix B has a worked example to demonstrate how ES actually works. To reinforce the method, let’s use the ES=C+I equation with some of the data from Annex B. Let’s use the second data point, as shown in figure A3. We won’t use the first data point, as comparisons to zeros can be a little confusing. To calculate C we note that the value for EVcum second data point is 180. This is less than the PVcum, set at 200 for the second increment of time on this project. So, we can’t say that we’ve earned two period’s worth of effort. However, the EVcum value is greater than that for month 1 (105.) Time wise, we must have earned at least 1 period’s effort – but not enough to claim two periods. So, C=1 in this instance. To calculate the increment, we use I = (EV – PVC) / (PVC+1 – PVC) Using the values above and putting these directly into the equation and taking the numerator first; (EV – PVC) = 180-105 (EV – PVC) = 75 And the denominator is (PVC+1 – PVC) (PVC+1 – PVC)= 200-105 (PVC+1 – PVC)= 95 So the increment I = 75/95. I = 0.789 The total ES = C+I ES = 1+0.789 So ES =1.789 periods. It should be 2. Therefore, we are behind by 0.211 periods. Appendix A – A real example This example uses real data from a project. It has been sanitised to protect the project it was taken from and to allow you to understand how ES is calculated and explain some important differences between ES and EV on late-finish projects. If you would like a copy of the original ES calculator, you can download it from www.earnedschedule.com. The data used in this example is also available as part of the ES calculator available on the website. We’ll go through four complete calculations and then skip to the final data entry and project conclusion.
11
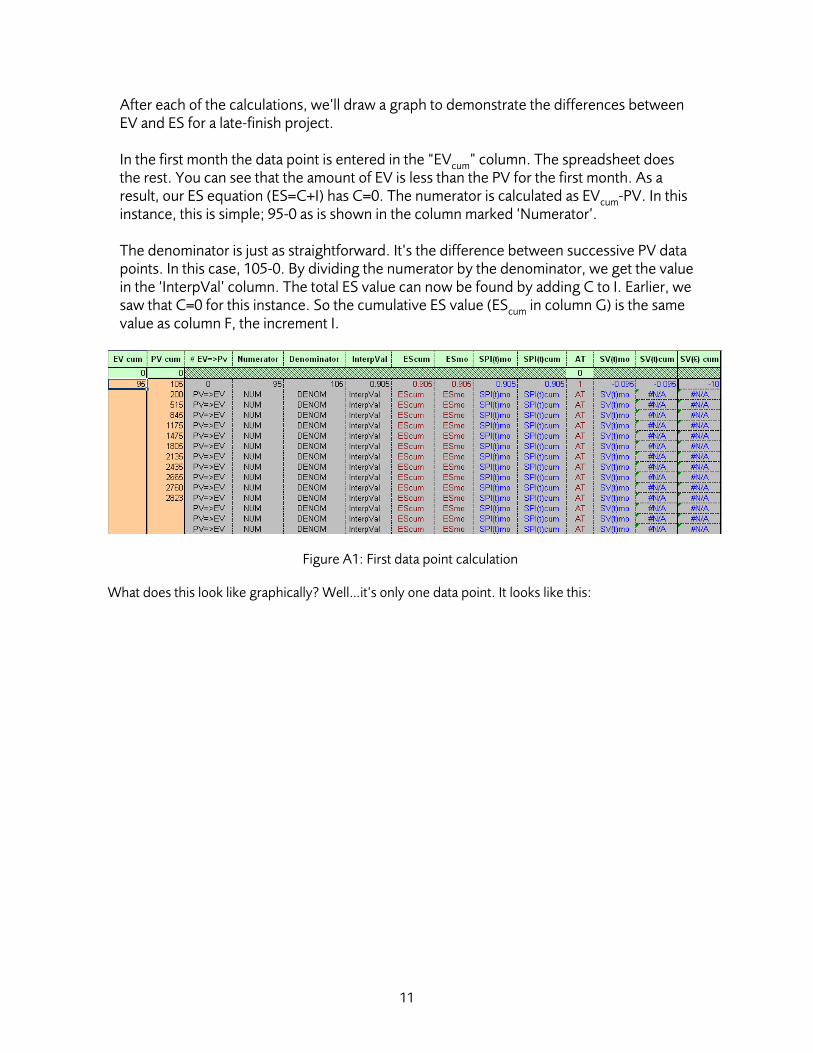
After each of the calculations, we’ll draw a graph to demonstrate the differences between EV and ES for a late-finish project. In the first month the data point is entered in the “EVcum” column. The spreadsheet does the rest. You can see that the amount of EV is less than the PV for the first month. As a result, our ES equation (ES=C+I) has C=0. The numerator is calculated as EVcum-PV. In this instance, this is simple; 95-0 as is shown in the column marked ‘Numerator’. The denominator is just as straightforward. It’s the difference between successive PV data points. In this case, 105-0. By dividing the numerator by the denominator, we get the value in the ‘InterpVal’ column. The total ES value can now be found by adding C to I. Earlier, we saw that C=0 for this instance. So the cumulative ES value (EScum in column G) is the same value as column F, the increment I.
Figure A1: First data point calculation
What does this look like graphically? Well…it’s only one data point. It looks like this:
12
Cost & Schedule Variances
-12
-10
-8
-6
-4
-2
0
Mon
ey (£
)
-2
0
2
4
6
8
10
12
141 2 3 4 5 6 7 8 9 10 11 12 13 14 15
Elapsed Time Periods
Tim
e
SV(£) cumtarget SVSV(t) cumIEAC(t)Delivery Date
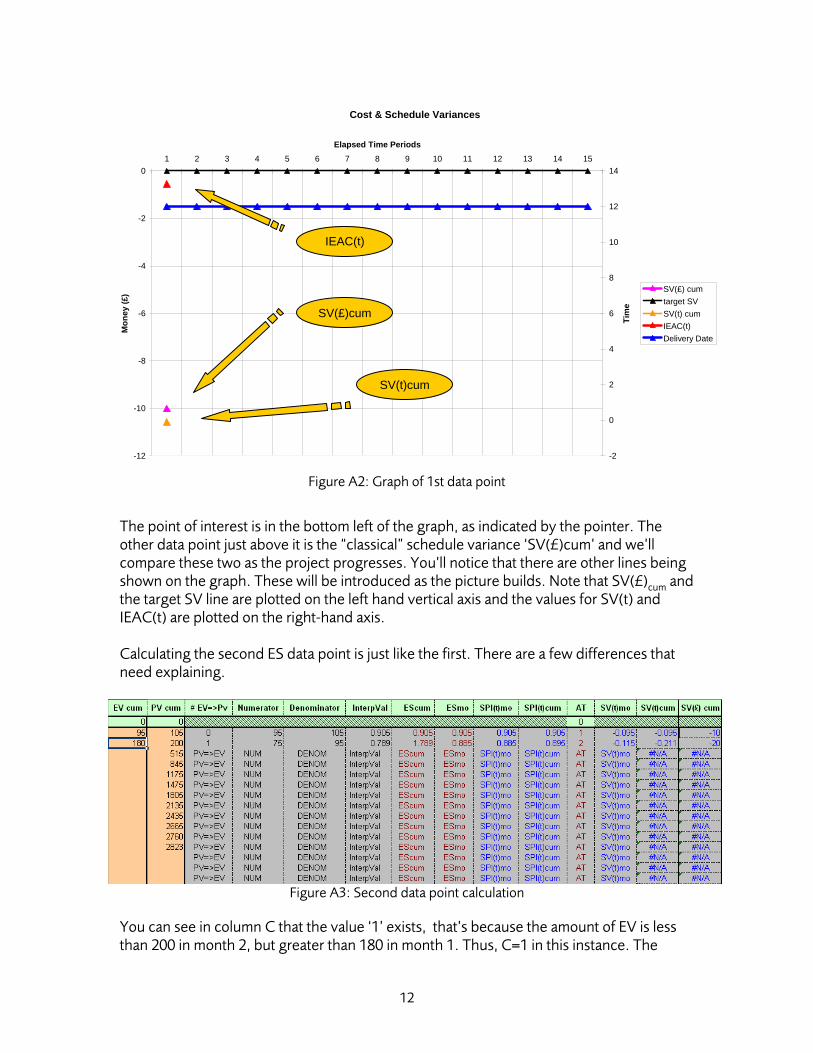
Figure A2: Graph of 1st data point
The point of interest is in the bottom left of the graph, as indicated by the pointer. The other data point just above it is the “classical” schedule variance ‘SV(£)cum’ and we’ll compare these two as the project progresses. You’ll notice that there are other lines being shown on the graph. These will be introduced as the picture builds. Note that SV(£)cum and the target SV line are plotted on the left hand vertical axis and the values for SV(t) and IEAC(t) are plotted on the right-hand axis. Calculating the second ES data point is just like the first. There are a few differences that need explaining.
Figure A3: Second data point calculation
You can see in column C that the value ‘1’ exists, that’s because the amount of EV is less than 200 in month 2, but greater than 180 in month 1. Thus, C=1 in this instance. The
IEAC(t)
SV(£)cum
SV(t)cum
13
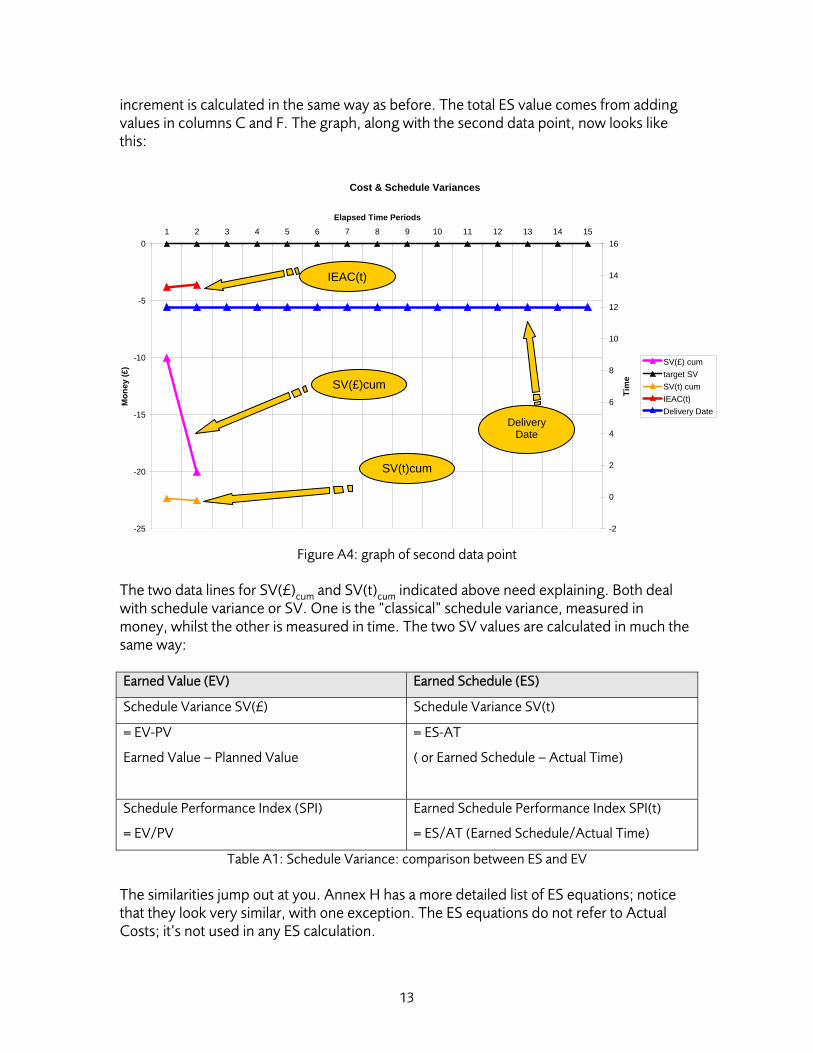
increment is calculated in the same way as before. The total ES value comes from adding values in columns C and F. The graph, along with the second data point, now looks like this:
Cost & Schedule Variances
-25
-20
-15
-10
-5
0
Mon
ey (£
)
-2
0
2
4
6
8
10
12
14
161 2 3 4 5 6 7 8 9 10 11 12 13 14 15
Elapsed Time Periods
Tim
e
SV(£) cumtarget SVSV(t) cumIEAC(t)Delivery Date
Figure A4: graph of second data point
The two data lines for SV(£)cum and SV(t)cum indicated above need explaining. Both deal with schedule variance or SV. One is the “classical” schedule variance, measured in money, whilst the other is measured in time. The two SV values are calculated in much the same way: Earned Value (EV) Earned Schedule (ES)
Schedule Variance SV(£) Schedule Variance SV(t)
= EV-PV
Earned Value – Planned Value
= ES-AT
( or Earned Schedule – Actual Time)
Schedule Performance Index (SPI)
= EV/PV
Earned Schedule Performance Index SPI(t)
= ES/AT (Earned Schedule/Actual Time)
Table A1: Schedule Variance: comparison between ES and EV
The similarities jump out at you. Annex H has a more detailed list of ES equations; notice that they look very similar, with one exception. The ES equations do not refer to Actual Costs; it’s not used in any ES calculation.
IEAC(t)
SV(£)cum
SV(t)cum
Delivery Date
14
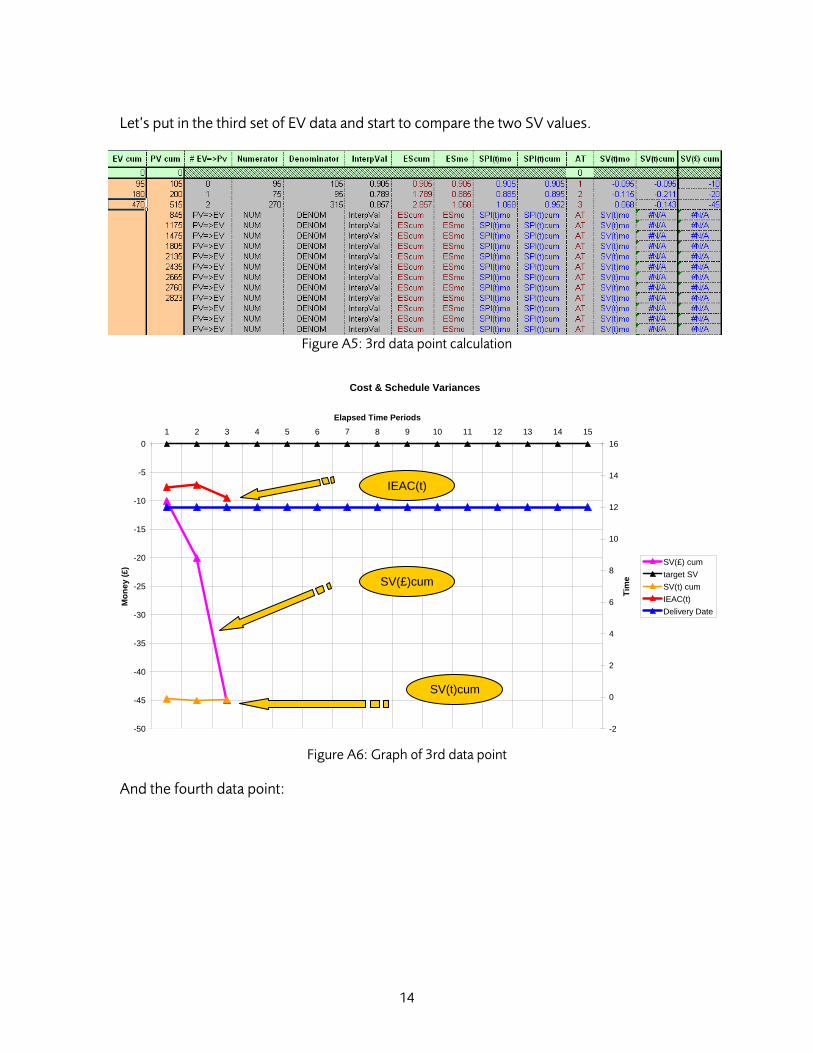
Let’s put in the third set of EV data and start to compare the two SV values.
Figure A5: 3rd data point calculation
Cost & Schedule Variances
-50
-45
-40
-35
-30
-25
-20
-15
-10
-5
0
Mon
ey (£
)
-2
0
2
4
6
8
10
12
14
161 2 3 4 5 6 7 8 9 10 11 12 13 14 15
Elapsed Time Periods
Tim
e
SV(£) cumtarget SVSV(t) cumIEAC(t)Delivery Date
Figure A6: Graph of 3rd data point
And the fourth data point:
IEAC(t)
SV(£)cum
SV(t)cum

15
Figure A7: 4th data point calculation
Cost & Schedule Variances
-80
-70
-60
-50
-40
-30
-20
-10
0
Mon
ey (£
)
-2
0
2
4
6
8
10
12
14
161 2 3 4 5 6 7 8 9 10 11 12 13 14 15
Elapsed Time Periods
Tim
e
SV(£) cumtarget SVSV(t) cumIEAC(t)Delivery Date
Figure A8: Graph of 4th data point
One other value that needs an explanation is the Independent Estimate At Completion date (time) (IEAC(t)). One of the most powerful attributes of Earned Value is its ability to predict a completion cost. Two important things to note:
• The prediction assumes that current performance does not change. Hence it’s an estimate, not set in stone. The statement concerning current performance means from the point in time when the data is captured to the end of the project.
• This prediction is no longer based on cost. It’s based on time. Focusing on the IEAC(t) line, you can already see that the predicted delivery date is later than the 12 months planned (the horizontal blue line). The project manager has to do something to ensure the project keeps to its original delivery date.
IEAC(t)
SV(£)cum
SV(t)cum
16
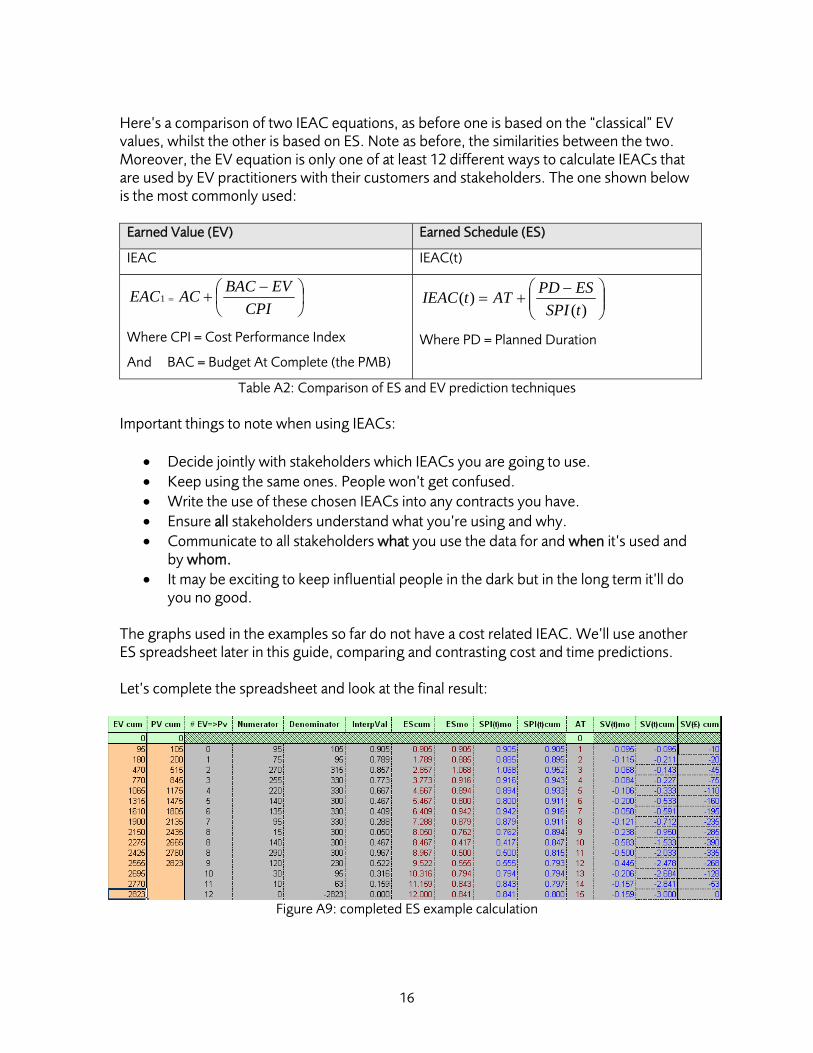
Here’s a comparison of two IEAC equations, as before one is based on the “classical” EV values, whilst the other is based on ES. Note as before, the similarities between the two. Moreover, the EV equation is only one of at least 12 different ways to calculate IEACs that are used by EV practitioners with their customers and stakeholders. The one shown below is the most commonly used:
Earned Value (EV) Earned Schedule (ES)
IEAC IEAC(t)
⎟⎠⎞
⎜⎝⎛ −
+=CPI
EVBACACEAC1
Where CPI = Cost Performance Index
And BAC = Budget At Complete (the PMB)
⎟⎟⎠
⎞⎜⎜⎝
⎛ −+=
)()(
tSPIESPDATtIEAC
Where PD = Planned Duration
Table A2: Comparison of ES and EV prediction techniques
Important things to note when using IEACs:
• Decide jointly with stakeholders which IEACs you are going to use. • Keep using the same ones. People won’t get confused. • Write the use of these chosen IEACs into any contracts you have. • Ensure all stakeholders understand what you’re using and why. • Communicate to all stakeholders what you use the data for and when it’s used and
by whom. • It may be exciting to keep influential people in the dark but in the long term it’ll do
you no good. The graphs used in the examples so far do not have a cost related IEAC. We’ll use another ES spreadsheet later in this guide, comparing and contrasting cost and time predictions. Let’s complete the spreadsheet and look at the final result:
Figure A9: completed ES example calculation

17
You’ll note that an extra 3 rows have been added, that’s because the project was running late. I’ll discuss some of the other figures after looking at the graph. This is where the biggest differences occur.
Cost & Schedule Variances
-450
-400
-350
-300
-250
-200
-150
-100
-50
0
Mon
ey (£
)
-4
-2
0
2
4
6
8
10
12
14
16
181 2 3 4 5 6 7 8 9 10 11 12 13 14 15
Elapsed Time Periods
Tim
e
SV(£) cumtarget SVSV(t) cumIEAC(t)Delivery Date
Figure A10: Graph of complete example calculation
The most important item to note here is the differences in the SV lines. The “classical” SV line (in the pink) shows a typical ‘v’ curve. It implies, because of the way in which it is calculated, that schedule variance is improving after month 10. It will slowly start to return to zero, as it charts the difference between EV and PV. Now look at the SV(t) line. Our Earned Schedule SV is telling us a completely different story. Reading form the right-hand vertical axis, it shows that the completion time of 12 periods is entirely inaccurate. At month 10, when the ES curve starts its upward climb, the new SV is telling us that the project is already some 2 months late. This is confirmed when you look at the red line. This is showing a completion time of approximately 14 periods. Seems reasonable, as 12 months (original duration) +2 months (project delay) =14 months. If the project performance doesn’t change – either better or worse- that’s when the project will deliver. In addition, you can see from the spreadsheet that at periods 12, we would have a singularity in the IEAC calculation (a divide by zero occurs) as the original duration and actual time are the same. By changing the duration from 12 to 15 periods (the final project duration) the sums still work properly. The graphs above show some of the EV data as variances and do not describe the entire EV and PV curves. The following graph shows these together in the ‘classical’ way. You can use this graph to manually estimate any delays to the project completion date. You
IEAC(t)
SV(£)cum
SV(t)cum
18
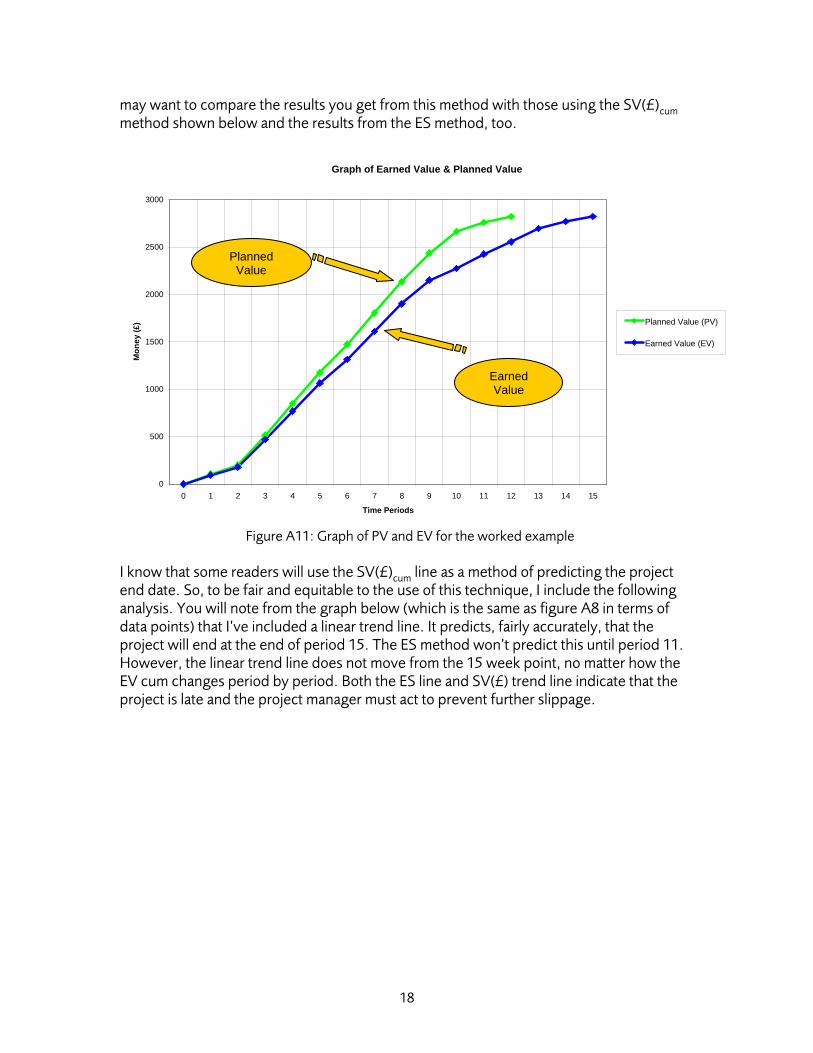
may want to compare the results you get from this method with those using the SV(£)cum method shown below and the results from the ES method, too.
Graph of Earned Value & Planned Value
0
500
1000
1500
2000
2500
3000
0 1 2 3 4 5 6 7 8 9 10 11 12 13 14 15
Time Periods
Mon
ey (£
) Planned Value (PV)
Earned Value (EV)
Figure A11: Graph of PV and EV for the worked example
I know that some readers will use the SV(£)cum line as a method of predicting the project end date. So, to be fair and equitable to the use of this technique, I include the following analysis. You will note from the graph below (which is the same as figure A8 in terms of data points) that I’ve included a linear trend line. It predicts, fairly accurately, that the project will end at the end of period 15. The ES method won’t predict this until period 11. However, the linear trend line does not move from the 15 week point, no matter how the EV cum changes period by period. Both the ES line and SV(£) trend line indicate that the project is late and the project manager must act to prevent further slippage.
Planned Value
Earned Value

19
Cost & Schedule Variances
-350
-300
-250
-200
-150
-100
-50
0
Mon
ey (£
)
-2
0
2
4
6
8
10
12
14
161 2 3 4 5 6 7 8 9 10 11 12 13 14 15
Elapsed Time Periods
Tim
e
SV(£) cumtarget SVSV(t) cumIEAC(t)Delivery DateLinear (SV(£) cum)
Figure A12: Graph of SV(£)cum showing linear trend line
One benefit that the ES method has over the SV(£)cum method, is the ability to calculate all ES data automatically from the existing EV data. The SV(£) trend line takes a long time to produce and needs care in its use and interpretation. To help demonstrate this, I add the following graph using the same data as above, but I’ve increased the number of time periods out to 20. You can see that, even though the data hasn’t changed, the SV(£) trend line seems to indicate that the project will finish at period 20. Two lessons from this:
• Check the validity of the data and the time periods being used. • Where possible, use more than one method to determine the same value or
criterion.
linear trend line

20
Cost & Schedule Variances
-450
-400
-350
-300
-250
-200
-150
-100
-50
0
Mon
ey (£
)
-2
0
2
4
6
8
10
12
14
161 2 3 4 5 6 7 8 9 10 11 12 13 14 15 16 17 18 19 20
Elapsed Time Periods
Tim
e
SV(£) cumtarget SVSV(t) cumIEAC(t)Delivery DateLinear (SV(£) cum)
Figure A13: Graph of SV(£)cum showing extended linear trend line
Appendix B – Accuracy of the Earned Schedule method As with any mathematical method, there are errors introduced when you use any form of linear interpolation. Quite rightly, both supporters and yet-to-be converts to the ES technique have questioned the technique, so here are the FAQs.
• The PV curve is an S-Curve. Does the linear interpolation introduce a large ES error?
• Is the ES error largest where the S-Curve is steepest? • What affects the accuracy of the ES calculation?
Good questions. But how do we answer them? The diagram below will help explain this.
linear trend line
21
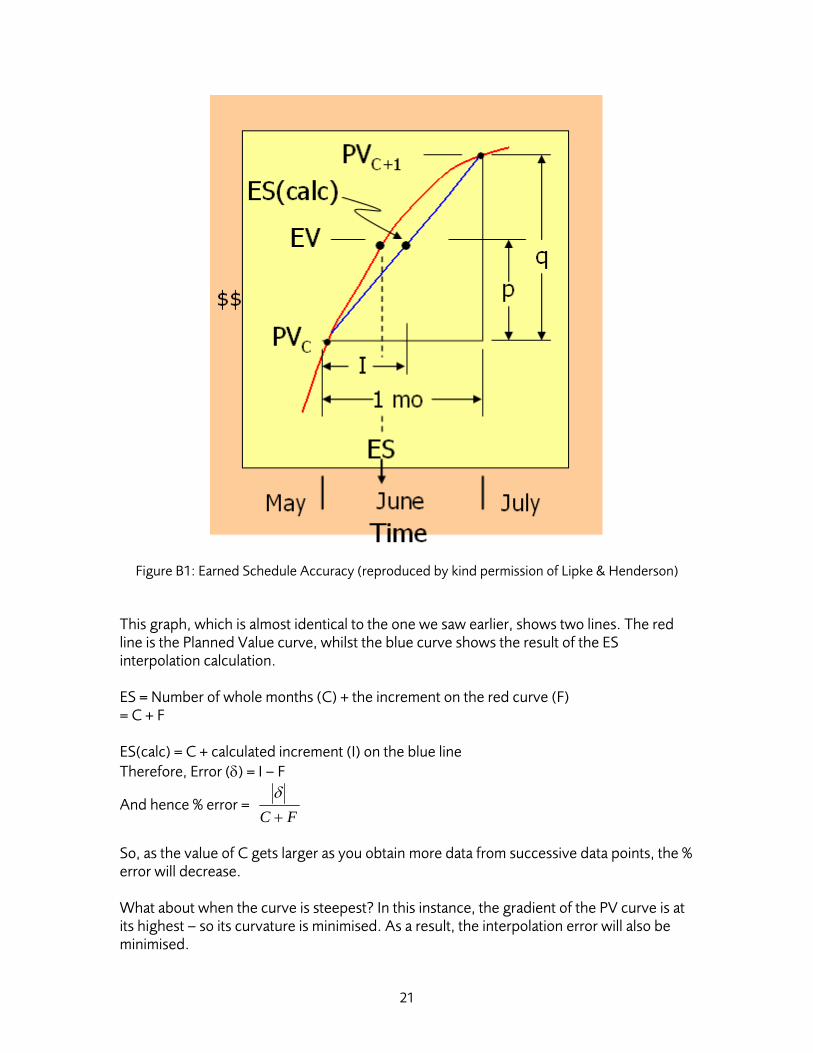
Figure B1: Earned Schedule Accuracy (reproduced by kind permission of Lipke & Henderson)
This graph, which is almost identical to the one we saw earlier, shows two lines. The red line is the Planned Value curve, whilst the blue curve shows the result of the ES interpolation calculation. ES = Number of whole months (C) + the increment on the red curve (F) = C + F ES(calc) = C + calculated increment (I) on the blue line Therefore, Error (δ) = I – F
And hence % error = FC +
δ
So, as the value of C gets larger as you obtain more data from successive data points, the % error will decrease. What about when the curve is steepest? In this instance, the gradient of the PV curve is at its highest – so its curvature is minimised. As a result, the interpolation error will also be minimised.
22
In summary:
• The bigger the value C becomes, the smaller the error becomes • The more data points you have, the more accurate the ES value is
Be careful how you interpret the ES results – best to wait until you have at least 4 time periods (weeks or months) of data for two reasons:
1. The ES interpolation errors are <3%5 2. The EV (and hence ES) data won’t have settled and you won’t be able to detect any
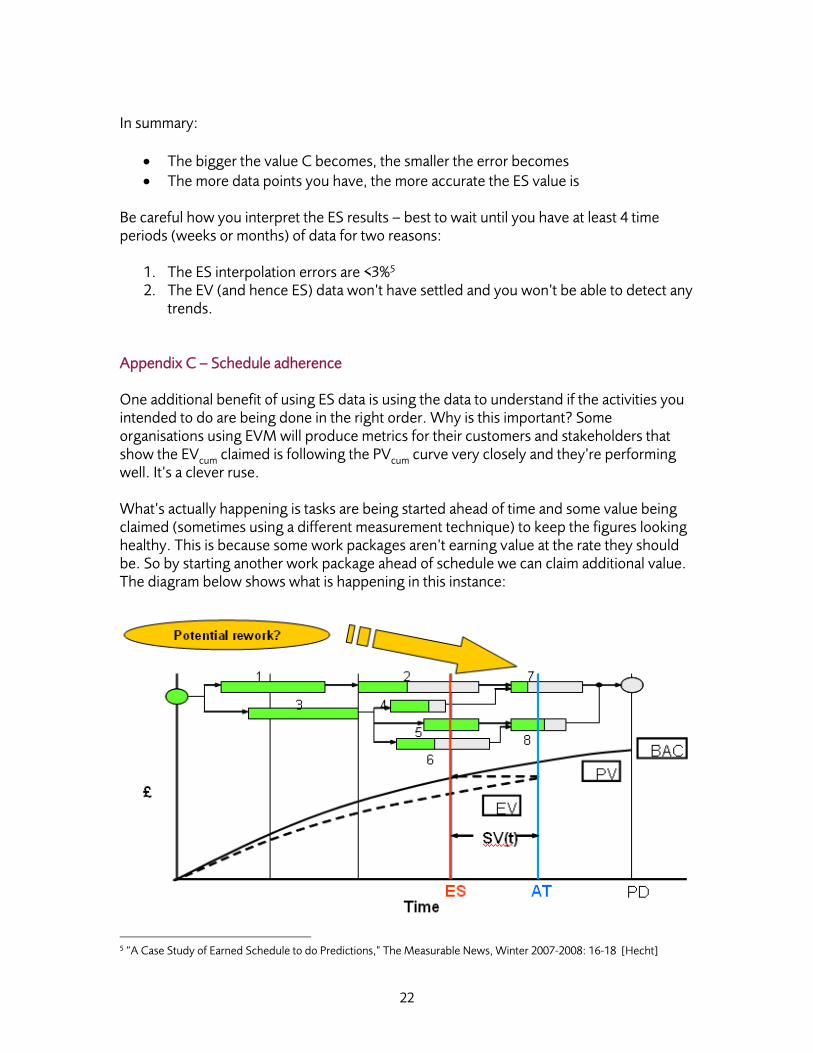
trends. Appendix C – Schedule adherence One additional benefit of using ES data is using the data to understand if the activities you intended to do are being done in the right order. Why is this important? Some organisations using EVM will produce metrics for their customers and stakeholders that show the EVcum claimed is following the PVcum curve very closely and they’re performing well. It’s a clever ruse. What’s actually happening is tasks are being started ahead of time and some value being claimed (sometimes using a different measurement technique) to keep the figures looking healthy. This is because some work packages aren’t earning value at the rate they should be. So by starting another work package ahead of schedule we can claim additional value. The diagram below shows what is happening in this instance:
5 “A Case Study of Earned Schedule to do Predictions,” The Measurable News, Winter 2007-2008: 16-18 [Hecht]
23
Figure C1: Schedule Adherence
Activity 7 has started before both activities 2 and 4 have completed. Assume that activity 2 deals with the design and production of a critical item (for example, an engine that needs to be integrated into a vehicle.) In addition, assume that activity 7 is the integration of that engine into the vehicle. What happens if the design of the engine needs to change (for whatever reason) before integration? There will be some rework needed on activity 7. As a result, the project will need to spend more time and money reworking documents, designs and components. Delivery will be later, not just because the original performance is less than planned, but because rework is now needed to correct the problems caused by work being started out-of-sequence. How can you forecast this? You can use ES data to inform you when rework is likely and how much rework is likely to be needed – as before – if current performance does not change. Annex C1 – Schedule adherence and the ‘p’ factor The schedule adherence factor described above is known as the ‘p’ factor. As with Schedule and Cost Performance Indices (SPI and CPI) the ‘p’ factor has a range. Take care; the ‘p’ factor can only range between 0 and 1. Unlike SPI and CPI it cannot exceed 1 at any time. It tells you what order the work is being done in – not how much is being done in a known time period. Described mathematically as a ratio: P = ΣEVj / ΣPVj PVj represents the Planned Value for a task associated with ES. The subscript j denoted the identity of the tasks from the schedule which comprises the planned achievement. The sum of all PVj is equal to the EV accrued at AT. EVj is the earned value for the ‘j’ tasks, limited by the value attributed to the planned tasks. Consequently the value ‘P’ represents the proportion of the EV accrued which exactly matches the planned schedule.
24
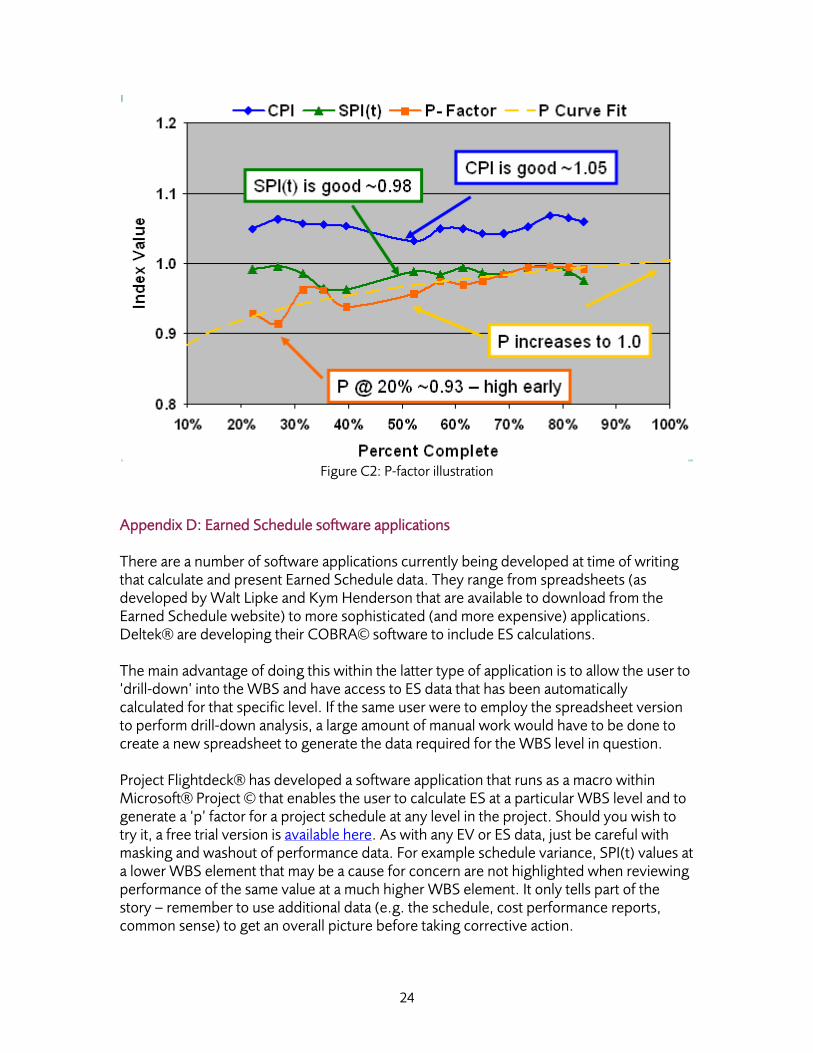
Figure C2: P-factor illustration
Appendix D: Earned Schedule software applications There are a number of software applications currently being developed at time of writing that calculate and present Earned Schedule data. They range from spreadsheets (as developed by Walt Lipke and Kym Henderson that are available to download from the Earned Schedule website) to more sophisticated (and more expensive) applications. Deltek® are developing their COBRA© software to include ES calculations. The main advantage of doing this within the latter type of application is to allow the user to ‘drill-down’ into the WBS and have access to ES data that has been automatically calculated for that specific level. If the same user were to employ the spreadsheet version to perform drill-down analysis, a large amount of manual work would have to be done to create a new spreadsheet to generate the data required for the WBS level in question. Project Flightdeck® has developed a software application that runs as a macro within Microsoft® Project © that enables the user to calculate ES at a particular WBS level and to generate a ‘p’ factor for a project schedule at any level in the project. Should you wish to try it, a free trial version is available here. As with any EV or ES data, just be careful with masking and washout of performance data. For example schedule variance, SPI(t) values at a lower WBS element that may be a cause for concern are not highlighted when reviewing performance of the same value at a much higher WBS element. It only tells part of the story – remember to use additional data (e.g. the schedule, cost performance reports, common sense) to get an overall picture before taking corrective action.
25
Appendix E: Future work with Earned Schedule As ES is a formal numerical technique, a number of research projects are ongoing that deal with the extension of ES into other areas of project controls and project management. Advances and extensions to ES are already being used in the defence and IT industries in the following areas:
• ES and Benefits Management • ES and confidence limits • Interfacing Earned Schedule with risk management • The use of ES in programme management
The next update to this document in 2010 may include reports on the results of these emerging techniques, with supporting data and analysis. The ES community relies on projects and their data to add to the growing archive of information that can be used to verify and validate developing ES techniques. If any readers wish to contribute project data, please contact either the EVM SIG chairman or you may contact ES practitioners through the earned schedule website – www.earnedschedule.com. Appendix F: Abbreviations and acronyms ACWP Actual Cost of Work Performed AC Actual Cost AT Actual Time BAC Budget At Completion BCWP Budgeted Cost of Work Performed BCWR Budgeted Cost of Work Remaining BCWS Budgeted Cost for Work Scheduled BOP Beginning Of Period CA Control Account, also known as Cost Account CAM Control Account Manager CBB Contract Budget Baseline CPI Cost Performance Index CPM Critical Path Method CPR Cost Performance Report CV Cost Variance CV% Cost Variance percentage CWBS Contract Work Breakdown Structure DB Distributed Budget EAC Estimate At Completion ED Estimated Duration EOP End Of Period ES Earned Schedule ETC Estimate To Completion

26
EV Earned Value EVA Earned Value Analysis EVM Earned Value Management EVMS Earned Value Management System EVT Earned Value Technique IBR Integrated Baseline Review IEAC Independent Estimate At Complete IEAC(t) Independent Estimate Completion Date (time) LoE Level of Effort LRE Latest Revised Estimate (same as EAC) MR Management Reserve OBS Organisation Breakdown Structure PD Planned Duration PF(t) Performance Factor (time) PMB Performance Measurement Baseline PMS Project Master Schedule PP Planning Package PV Planned Value RAM Responsibility Assignment Matrix RM Risk Management RN Risk Network SoR Statement of requirement SOW Statement Of Work SPI Schedule Performance Index SV Schedule Variance SV% Schedule Variance percentage TCPI To Complete Performance Index TSPI To Complete Performance Index (time) UB Undistributed Budget VAC Variance at Completion VAC% Variance at Completion percentage VAR Variance Analysis Report WBS Work Breakdown Structure WP Work Package
27
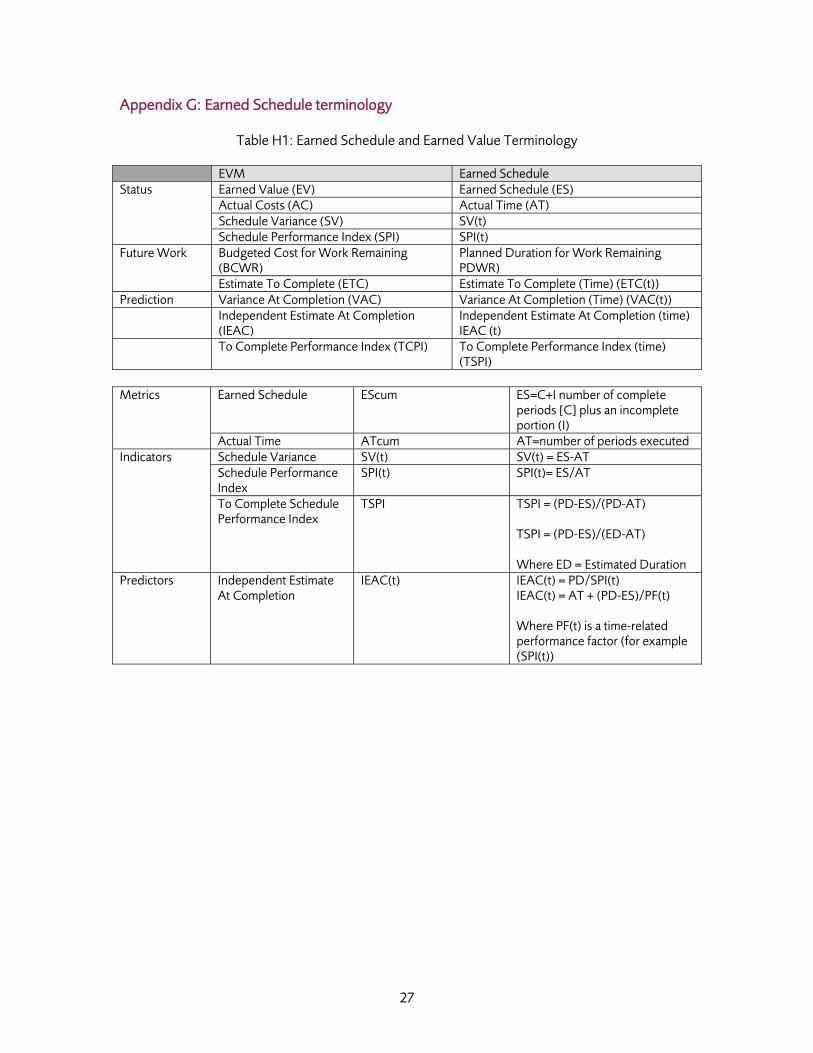
Appendix G: Earned Schedule terminology
Table H1: Earned Schedule and Earned Value Terminology
EVM Earned Schedule Status Earned Value (EV) Earned Schedule (ES)
Actual Costs (AC) Actual Time (AT) Schedule Variance (SV) SV(t) Schedule Performance Index (SPI) SPI(t)
Future Work Budgeted Cost for Work Remaining (BCWR)
Planned Duration for Work Remaining PDWR)
Estimate To Complete (ETC) Estimate To Complete (Time) (ETC(t)) Prediction Variance At Completion (VAC) Variance At Completion (Time) (VAC(t)) Independent Estimate At Completion
(IEAC) Independent Estimate At Completion (time) IEAC (t)
To Complete Performance Index (TCPI) To Complete Performance Index (time) (TSPI)
Metrics Earned Schedule EScum ES=C+I number of complete
periods [C] plus an incomplete portion (I)
Actual Time ATcum AT=number of periods executed Indicators Schedule Variance SV(t) SV(t) = ES-AT
Schedule Performance Index
SPI(t) SPI(t)= ES/AT
To Complete Schedule Performance Index
TSPI TSPI = (PD-ES)/(PD-AT) TSPI = (PD-ES)/(ED-AT) Where ED = Estimated Duration
Predictors Independent Estimate At Completion
IEAC(t) IEAC(t) = PD/SPI(t) IEAC(t) = AT + (PD-ES)/PF(t) Where PF(t) is a time-related performance factor (for example (SPI(t))

28
Figures and tables FIGURE 1 – EARNED SCHEDULE CHART ...................................................................................... 6 FIGURE 2: CALCULATING EARNED SCHEDULE .............................................................................. 8 FIGURE 3: CALCULATING THE INCREMENT I ................................................................................. 9 FIGURE A1: FIRST DATA POINT CALCULATION ............................................................................ 11 FIGURE A2: GRAPH OF 1ST DATA POINT ................................................................................... 12 FIGURE A3: SECOND DATA POINT CALCULATION ........................................................................ 12 FIGURE A4: GRAPH OF SECOND DATA POINT ............................................................................. 13 TABLE A1: SCHEDULE VARIANCE: COMPARISON BETWEEN ES AND EV ............................................ 13 FIGURE A5: 3RD DATA POINT CALCULATION ............................................................................. 14 FIGURE A6: GRAPH OF 3RD DATA POINT .................................................................................. 14 FIGURE A7: 4TH DATA POINT CALCULATION .............................................................................. 15 FIGURE A8: GRAPH OF 4TH DATA POINT .................................................................................. 15 FIGURE A9: COMPLETED ES EXAMPLE CALCULATION ................................................................... 16 FIGURE A10: GRAPH OF COMPLETE EXAMPLE CALCULATION ......................................................... 17 FIGURE A11: GRAPH OF PV AND EV FOR THE WORKED EXAMPLE ................................................... 18 FIGURE A12: GRAPH OF SV(£)CUM SHOWING LINEAR TREND LINE .................................................. 19 FIGURE A13: GRAPH OF SV(£)CUM SHOWING EXTENDED LINEAR TREND LINE ................................... 20 FIGURE B1: EARNED SCHEDULE ACCURACY .............................................................................. 21 FIGURE C1: SCHEDULE ADHERENCE ........................................................................................ 23 FIGURE C2: P-FACTOR ILLUSTRATION ...................................................................................... 24
TABLE A1: SCHEDULE VARIANCE: COMPARISON BETWEEN ES AND EV ............................................ 13 TABLE A2: COMPARISON OF ES AND EV PREDICTION TECHNIQUES ................................................. 16 TABLE H1: EARNED SCHEDULE AND EARNED VALUE TERMINOLOGY ............................................... 27
Related Documents


