2010 ANNUAL REPORT

Welcome message from author
This document is posted to help you gain knowledge. Please leave a comment to let me know what you think about it! Share it to your friends and learn new things together.
Transcript

2 0 1 0 A N N UA L R E P O RT
Magna International Inc.
337 Magna Drive, Aurora, Ontario, Canada L4G 7K1
Telephone: (905) 726-2462Fax: (905) 726-7164
Visit our website at: www.magna.com
Printed in Canada
Financial Highlights2010
Company Overview
Magna, the most diversified global automotive supplier, designs, develops and manufactures technologically advanced automotive systems, assemblies, modules and components, and engineers and assembles complete vehicles, primarily for sale to original equipment manufacturers of cars and light trucks.
Our capabilities include:
n interior systemsn seating systemsn closure systemsn body & chassis systemsn vision systemsn electronic systemsn exterior systemsn powertrain systemsn roof systemsn vehicle engineering & contract assemblyn hybrid & electric vehicles/systems
Magna has more than 96,000 employees in256 manufacturing operations and 82 productdevelopment, engineering and sales centres in26 countries.
The all-new Ford Focus Electric, jointly developed by Ford and Magna.
Sales(U.S.$ Billions)
30
25
20
15
10
5
001
08 09 10
08 09 10
08 09 10
02 03 04 05 06 07 08 09 10
1200
1000
800
600
400
200
0
(200)
(600)
(400)
Operating Income (Loss)(U.S.$ Millions)
Net Income (Loss)(U.S.$ Millions)
Diluted Earnings (Loss) Per Share(U.S.$)
1000
800
600
400
200
(200)
(400)
(600)
5.00
4.00
3.00
2.00
1.00
(1.00)
(2.00)
(3.00)
0
0

2010 Annual Report
Additional copies of this 2010 Annual Report or copies of our quarterly reports may be obtained from: The Secretary, Magna International Inc.,337 Magna Drive, Aurora, Ontario, Canada L4G 7K1 or www.magna.com. Copies of financial data and other publicly filed documents are available through
the internet on the Canadian Securities Administrators' System for Electronic Document Analysis and Retrieval (SEDAR) which can be accessed atwww.sedar.com and on the United States Securities and Exchange Commission's Electronic Data Gathering, Analysis and Retrieval System (EDGAR)
which can be accessed at www.sec.gov.
©Magna International Inc. 2011. Magna and the logo are registered trademarks of Magna International Inc.
The 2011 Annual Meeting of ShareholdersThe 2011 Annual Meeting of Shareholders will be held at Hilton Suites Toronto/Markham Conference Centre,
8500 Warden Avenue, Markham, Ontario, Canada on Wednesday, May 4, 2011 commencing at 10:00 a.m. (Toronto time)
Corporate Directory
Directors
Frank StronachChairman
Michael D. HarrisLead Director
J. Trevor Eyton
Lady Barbara Judge
Louis E. Lataif
Donald Resnick
Franz Vranitzky
Donald J. Walker
Lawrence D. Worrall
Corporate Office
Magna International Inc.337 Magna DriveAurora, OntarioCanada L4G 7K1Telephone: (905) 726-2462www.magna.com
Executive Officers
Frank StronachChairman of the Board
Donald J. WalkerChief Executive Officer
Vincent J. GalifiExecutive Vice-Presidentand Chief Financial Officer
Jeffrey O. PalmerExecutive Vice-President and Chief Legal Officer
Other Officers
Paul H. BrockVice-President and Treasurer
Gary M. CohnVice-President, Mergers and Acquisitions
Patrick McCannVice-President, Finance
Robert D. MerkleyVice-President, Internal Audit
Scott E. ParadiseVice-President, Marketing and New Business Development – The Americas
Günther ApfalterPresident, Magna Europe
Manfred EibeckExecutive Vice-President,Magna Europe and President, Magna Russia
Herbert H. DemelExecutive Vice-Presidentand President, Magna China, India, South East Asia,South America and Africa
Marc J. NeebExecutive Vice-President,Global Human Resources
Thomas A. SchultheissVice-President andGeneral Counsel – Europe
Bassem A. ShakeelVice-President and Secretary
Michael G.R. SinnaeveVice-President, Operational Improvement and Quality –The Americas
Riccardo C. TrecroceVice-President and General Counsel – North America
As a "foreign private issuer" listed on the New York Stock Exchange (NYSE), Magna is required to disclose the significant ways in which our corporate governance practices differ from those to be followed by U.S. domestic issuers under the NYSE listing standards. Please see the corporate governance section of our website (www.magna.com) for our Statement of Significant Corporate Governance Differences (NYSE). Additionally, please refer to the Management Information Circular/Proxy Statement for our 2011 Annual Meeting of Shareholders for a description of our corporate governance practices in comparison with the requirements and guidelines of the Canadian securities administrators.
Shareholders wishing to communicate with the non-management members of the Magna Board of Directors may do so by contacting the Lead Director through the office of Magna's Secretary at 337 Magna Drive, Aurora, Ontario, Canada L4G 7K1 (905) 726-7072.
Shareholders wishing to obtain a copy of Magna's Notice of Intention to Make a Normal Course Issuer Bid, referred to in Note 19 to the consolidated financial statements contained in this Annual Report may also do so by contacting Magna's Corporate Secretary.
Alon S. OssipExecutive Vice-President
James J. Tobin, Sr.Chief Marketing Officerand President, Magna Japan and Korea
Tom J. SkudutisChief Operating Officer, Exteriors, Interiors, Seating, Mirrors and Closures
Burkhard GöschelChief Technology Officer
Louis B. TonelliVice-President,Investor Relations
David M. WilliamsonVice-President, Taxation
Robert CecuttiController
Transfer Agent and Registrar
Computershare Trust Company of Canada 100 University Avenue, 9th FloorToronto, Ontario, Canada M5J 2Y1Telephone: 1-800-564-6253www.computershare.com
Computershare Trust Company N.A.250 Royall StreetCanton, MA, USA 02021Telephone: (781) 575-3120
Exchange Listings
Common SharesToronto Stock Exchange MGNew York Stock Exchange MGA
Magna's capabilities include:
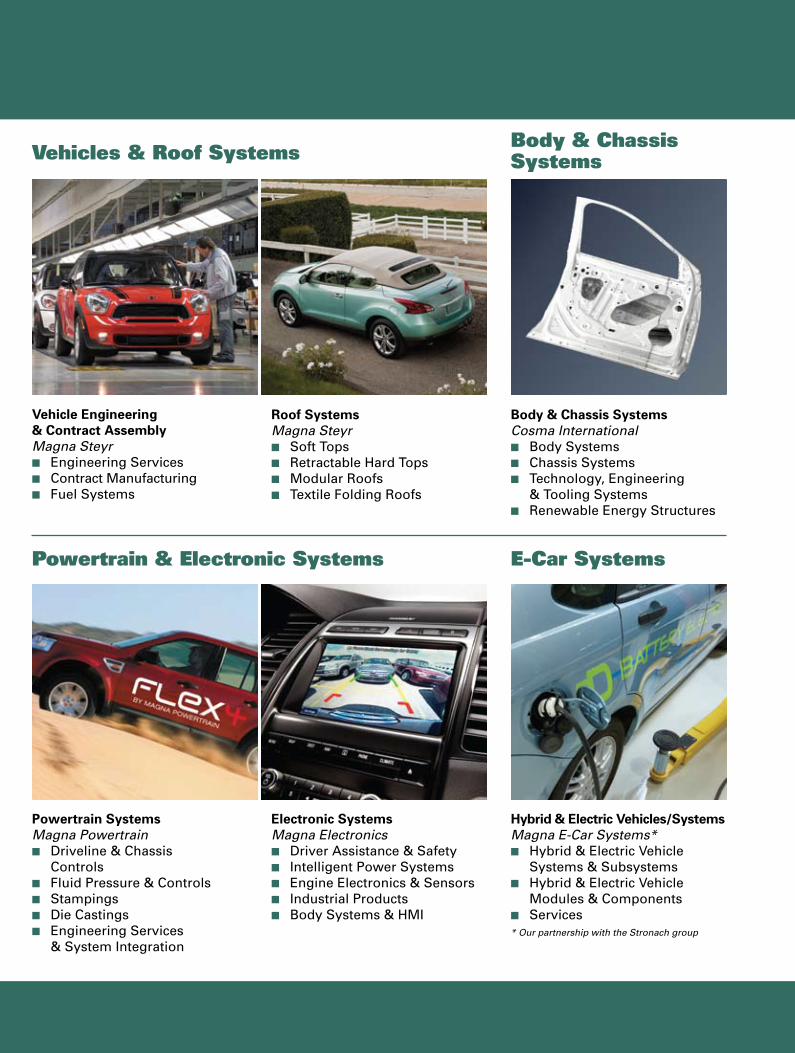
Vehicles & Roof Systems
Vehicle Engineering& Contract AssemblyMagna Steyrn Engineering Servicesn Contract Manufacturingn Fuel Systems
Powertrain SystemsMagna Powertrainn Driveline & Chassis Controlsn Fluid Pressure & Controlsn Stampingsn Die Castingsn Engineering Services & System Integration
Roof SystemsMagna Steyrn Soft Topsn Retractable Hard Topsn Modular Roofsn Textile Folding Roofs
Exterior SystemsMagna Exteriors & Interiorsn Front & Rear Fascia Systemsn Sealing Systemsn Exterior Trim & Lightingn Class A Composite Panelsn Modular Systemsn Engineered Glassn Structural Componentsn Under Hood & Underbody Componentsn Sheet Molding Compound Material
Interior SystemsMagna Exteriors & Interiorsn Sidewall & Trim Systemsn Cockpit Systemsn Cargo Management Systemsn Overhead Systemsn Carpet & Loadspace Systems
Seating SystemsMagna Seatingn Complete Seating Solutionsn Seat Structures & Mechanism Solutionsn Foam & Trim Solutions
Closure SystemsMagna Closuresn Door Modulesn Window Systemsn Power Closure Systemsn Latching Systemsn Handle Assembliesn Driver Controlsn Electronics
Vision SystemsMagna Mirrorsn Interior Mirrorsn Exterior Mirrorsn Actuatorsn Electronic Vision Systems
Body & ChassisSystems
Body & Chassis SystemsCosma Internationaln Body Systemsn Chassis Systemsn Technology, Engineering & Tooling Systemsn Renewable Energy Structures
Hybrid & Electric Vehicles/SystemsMagna E-Car Systems*n Hybrid & Electric Vehicle Systems & Subsystemsn Hybrid & Electric Vehicle Modules & Componentsn Services* Our partnership with the Stronach group
E-Car Systems
Electronic SystemsMagna Electronicsn Driver Assistance & Safetyn Intelligent Power Systemsn Engine Electronics & Sensorsn Industrial Productsn Body Systems & HMI
Powertrain & Electronic Systems
Exteriors & Interiors
2010 Annual Report
Additional copies of this 2010 Annual Report or copies of our quarterly reports may be obtained from: The Secretary, Magna International Inc.,337 Magna Drive, Aurora, Ontario, Canada L4G 7K1 or www.magna.com. Copies of financial data and other publicly filed documents are available through
the internet on the Canadian Securities Administrators' System for Electronic Document Analysis and Retrieval (SEDAR) which can be accessed atwww.sedar.com and on the United States Securities and Exchange Commission's Electronic Data Gathering, Analysis and Retrieval System (EDGAR)
which can be accessed at www.sec.gov.
©Magna International Inc. 2011. Magna and the logo are registered trademarks of Magna International Inc.
The 2011 Annual Meeting of ShareholdersThe 2011 Annual Meeting of Shareholders will be held at Hilton Suites Toronto/Markham Conference Centre,
8500 Warden Avenue, Markham, Ontario, Canada on Wednesday, May 4, 2011 commencing at 10:00 a.m. (Toronto time)
Corporate Directory
Directors
Frank StronachChairman
Michael D. HarrisLead Director
J. Trevor Eyton
Lady Barbara Judge
Louis E. Lataif
Donald Resnick
Franz Vranitzky
Donald J. Walker
Lawrence D. Worrall
Corporate Office
Magna International Inc.337 Magna DriveAurora, OntarioCanada L4G 7K1Telephone: (905) 726-2462www.magna.com
Executive Officers
Frank StronachChairman of the Board
Donald J. WalkerChief Executive Officer
Vincent J. GalifiExecutive Vice-Presidentand Chief Financial Officer
Jeffrey O. PalmerExecutive Vice-President and Chief Legal Officer
Other Officers
Paul H. BrockVice-President and Treasurer
Gary M. CohnVice-President, Mergers and Acquisitions
Patrick McCannVice-President, Finance
Robert D. MerkleyVice-President, Internal Audit
Scott E. ParadiseVice-President, Marketing and New Business Development – The Americas
Günther ApfalterPresident, Magna Europe
Manfred EibeckExecutive Vice-President,Magna Europe and President, Magna Russia
Herbert H. DemelExecutive Vice-Presidentand President, Magna China, India, South East Asia,South America and Africa
Marc J. NeebExecutive Vice-President,Global Human Resources
Thomas A. SchultheissVice-President andGeneral Counsel – Europe
Bassem A. ShakeelVice-President and Secretary
Michael G.R. SinnaeveVice-President, Operational Improvement and Quality –The Americas
Riccardo C. TrecroceVice-President and General Counsel – North America
As a "foreign private issuer" listed on the New York Stock Exchange (NYSE), Magna is required to disclose the significant ways in which our corporate governance practices differ from those to be followed by U.S. domestic issuers under the NYSE listing standards. Please see the corporate governance section of our website (www.magna.com) for our Statement of Significant Corporate Governance Differences (NYSE). Additionally, please refer to the Management Information Circular/Proxy Statement for our 2011 Annual Meeting of Shareholders for a description of our corporate governance practices in comparison with the requirements and guidelines of the Canadian securities administrators.
Shareholders wishing to communicate with the non-management members of the Magna Board of Directors may do so by contacting the Lead Director through the office of Magna's Secretary at 337 Magna Drive, Aurora, Ontario, Canada L4G 7K1 (905) 726-7072.
Shareholders wishing to obtain a copy of Magna's Notice of Intention to Make a Normal Course Issuer Bid, referred to in Note 19 to the consolidated financial statements contained in this Annual Report may also do so by contacting Magna's Corporate Secretary.
Alon S. OssipExecutive Vice-President
James J. Tobin, Sr.Chief Marketing Officerand President, Magna Japan and Korea
Tom J. SkudutisChief Operating Officer, Exteriors, Interiors, Seating, Mirrors and Closures
Burkhard GöschelChief Technology Officer
Louis B. TonelliVice-President,Investor Relations
David M. WilliamsonVice-President, Taxation
Robert CecuttiController
Transfer Agent and Registrar
Computershare Trust Company of Canada 100 University Avenue, 9th FloorToronto, Ontario, Canada M5J 2Y1Telephone: 1-800-564-6253www.computershare.com
Computershare Trust Company N.A.250 Royall StreetCanton, MA, USA 02021Telephone: (781) 575-3120
Exchange Listings
Common SharesToronto Stock Exchange MGNew York Stock Exchange MGA
Magna's capabilities include:
Vehicles & Roof Systems
Vehicle Engineering& Contract AssemblyMagna Steyrn Engineering Servicesn Contract Manufacturingn Fuel Systems
Powertrain SystemsMagna Powertrainn Driveline & Chassis Controlsn Fluid Pressure & Controlsn Stampingsn Die Castingsn Engineering Services & System Integration
Roof SystemsMagna Steyrn Soft Topsn Retractable Hard Topsn Modular Roofsn Textile Folding Roofs
Exterior SystemsMagna Exteriors & Interiorsn Front & Rear Fascia Systemsn Sealing Systemsn Exterior Trim & Lightingn Class A Composite Panelsn Modular Systemsn Engineered Glassn Structural Componentsn Under Hood & Underbody Componentsn Sheet Molding Compound Material
Interior SystemsMagna Exteriors & Interiorsn Sidewall & Trim Systemsn Cockpit Systemsn Cargo Management Systemsn Overhead Systemsn Carpet & Loadspace Systems
Seating SystemsMagna Seatingn Complete Seating Solutionsn Seat Structures & Mechanism Solutionsn Foam & Trim Solutions
Closure SystemsMagna Closuresn Door Modulesn Window Systemsn Power Closure Systemsn Latching Systemsn Handle Assembliesn Driver Controlsn Electronics
Vision SystemsMagna Mirrorsn Interior Mirrorsn Exterior Mirrorsn Actuatorsn Electronic Vision Systems
Body & ChassisSystems
Body & Chassis SystemsCosma Internationaln Body Systemsn Chassis Systemsn Technology, Engineering & Tooling Systemsn Renewable Energy Structures
Hybrid & Electric Vehicles/SystemsMagna E-Car Systems*n Hybrid & Electric Vehicle Systems & Subsystemsn Hybrid & Electric Vehicle Modules & Componentsn Services* Our partnership with the Stronach group
E-Car Systems
Electronic SystemsMagna Electronicsn Driver Assistance & Safetyn Intelligent Power Systemsn Engine Electronics & Sensorsn Industrial Productsn Body Systems & HMI
Powertrain & Electronic Systems
Exteriors & Interiors

Operating Principles
Magna's entrepreneurial corporate culture, highlighted in the principlesshown below, is one of the main reasons for Magna's success and our greatest competitive advantage.
Decentralized Operating StructureMagna's manufacturing divisions operate as independent profit centres aligned by geographic region in each of our product areas. This decentralized structure prevents bureaucracy and makes Magna more responsive to customer needs and changes within the global automotive industry, as well as within specific regions.
Employee InvolvementBy keeping operating units relatively small and flexible, Magna fosters greateremployee involvement and initiative. This environment also allows Magna torecognize and reward individuals' contributions and maintain open communication.
Entrepreneurial ManagersEntrepreneurial, hands-on managers with strong tooling, engineering and manufacturing backgrounds run Magna's divisions. Division managers are responsible for ensuring profitability, achieving customer satisfaction and upholding the principles of the Magna Employee's Charter.
Employee Profit Sharing and OwnershipThrough the Equity Participation and Profit Sharing Program, eligible employees receive ten percent of Magna's qualifying annual profits before tax. As part-owners working in an environment where productivity is rewarded, Magna employees are motivated to produce quality products at competitive prices.
Global Operations(As of December 2010)
Total Numberof Employees(As of December 2010)
North America: Canada
United States
Mexico
44 11
49 14
29 1
South America: Brazil
Argentina
5 2
4 1
Africa: South Africa 2
Europe: Austria
Belgium
Czech Republic
England
France
Germany
Hungary
Ireland
Italy
Poland
Russia
Slovak Republic
Spain
Sweden
Turkey
5
5 1
4 2
8 1
8 2
16 8
2
3 2
36 17
1
3
3
1
1
1 1
Asia Pacific: China
India
Japan
Korea
Thailand
15 7
5 4
4 2
2
1
4
1
Manufacturing Operations: 256
Product Development, Engineering and Sales Centres: 82
Asia Pacific –6,575
North America –50,875
Europe –36,150
South America –2,900
South Africa –100

Magna International Inc. 2010 Annual Report1
Frank StronachChairman of the Board
The Chairman's Message
Last year marked a major turning point for Magna and for me. After many decades as thefounder and controlling shareholder of Magna International, I accepted – and Magna'sClass A shareholders approved – a proposal that saw the Stronach Trust, Magna's controllingshareholder since 1978, relinquish voting control of Magna.
I have invested many years of hard work and energy into Magna, and my number onepriority has always been the growth and success of the Company. Today, Magna is biggerin size, stronger and healthier than it has ever been. The Company's proven operatingprinciples and unique culture are deeply rooted and the day-to-day management of thefirm is in good hands. It is therefore the right time for me to step down as Chairman,a position I have held for nearly 40 years. I will continue to be involved in an advisorycapacity with the Company, including with respect to the long-term strategic direction ofMagna, as well as in the management and operation of Magna E-Car Systems.
One of the factors influencing the decision to give up voting control of Magna was theincreasingly restrictive rules governing the management of companies. I believe regulatorshave put in place excessive rules that stifle the market's creative forces – namely,the innovative managers, entrepreneurs and inventors who are the engines of newwealth creation. We need to loosen the regulatory straightjacket and create a simpler,more clear-cut regulatory framework that allows business more room to innovate and expand.
Over the years, one of the achievements I am proud of is the strong management teamthat I cultivated. The key members of Magna's executive management are seasoned,widely respected within the automotive industry, and committed to the principles thathave made Magna a great company. I am confident this team will continue to managethe Company for the benefit of all stakeholders.
I firmly believe that Magna will continue to do well provided that the Company adheresto the operating principles and unique corporate culture that are the foundation of oursuccess. Furthermore, it is my opinion that the Company must continue to exercise cautionin regard to taking on debt. As for who should own Magna in the years ahead, I hope thatMagna will always have a significant Canadian shareholder base that includes institutionswith a stake in Canada. Furthermore, I believe Magna should remain a public company.A public company structure is the best way for employees to have equity participation –the main reason why I merged my privately-held auto parts firm with publicly-tradedMagna Electronics more than 40 years ago. Via stock ownership, employees not onlyshare in the profits, but also own a portion of the company they work for – one of thecornerstones of Magna's Fair Enterprise culture.

Magna International Inc. 2010 Annual Report2
Going forward, much of my time and energy will be focused on growing Magna E-Car Systems, a partnership betweenMagna and the Stronach group. Working together with Ford Motor Co., we will launch the all-new Ford Focus Electricwithin the next 12 months, one of the world's first all-electric vehicles. Magna E-Car Systems initiated the prototypefor the vehicle and has been closely collaborating with Ford ever since in preparing the vehicle for commercial production.Magna E-Car Systems recently opened a hybrid and electric vehicle system development centre and state-of-the-artbattery/materials testing facility that will focus on new electric vehicle designs, advanced battery systems – the "heart"of the electric vehicle – as well as hybrid and electric vehicle components and complete hybrid and electric vehiclesystems. This will allow Magna E-Car Systems to provide total electric vehicle capability and remain at the forefrontof the industry.
In closing, I wish to thank executive management for steering the Company through a very turbulent period. They madea lot of difficult decisions and took decisive action when needed, with the result that Magna is well positioned torebound strongly now that the automotive industry is recovering. In addition, I would like to thank our employees,who doubled their efforts during the past few years to help the Company make it through the most severe downturnour industry has ever experienced. On behalf of management, I also wish to thank Belinda Stronach, who servedMagna with great dedication and distinction during a career that spanned three decades, both as a member of theBoard of Directors, and as a senior executive, guiding Magna through some of the best years in its history. And I wishto thank Siegfried Wolf for his enormous contributions over the years. Sigi was instrumental in building Magna Europeinto one of the pillars of our Company. He expanded our customer base and manufacturing capability in one of theworld's most important automotive markets. On behalf of our Board, I also wish to acknowledge the valuablecontributions of Franz Vranitzky, one of Magna's longest-serving independent Directors, who will step down this year.Lastly, I wish to thank shareholders for their continued support through some trying times.
The Stronach story at Magna is far from finished. I am starting from the beginning all over again, returning to myroots as an entrepreneur, and I look forward to growing Magna E-Car Systems into a company that will play a leadingrole in shaping and building the cars of the future.
/s/ Frank Stronach
Frank StronachChairman of the Board
Magna International Inc. 2010 Annual Report3
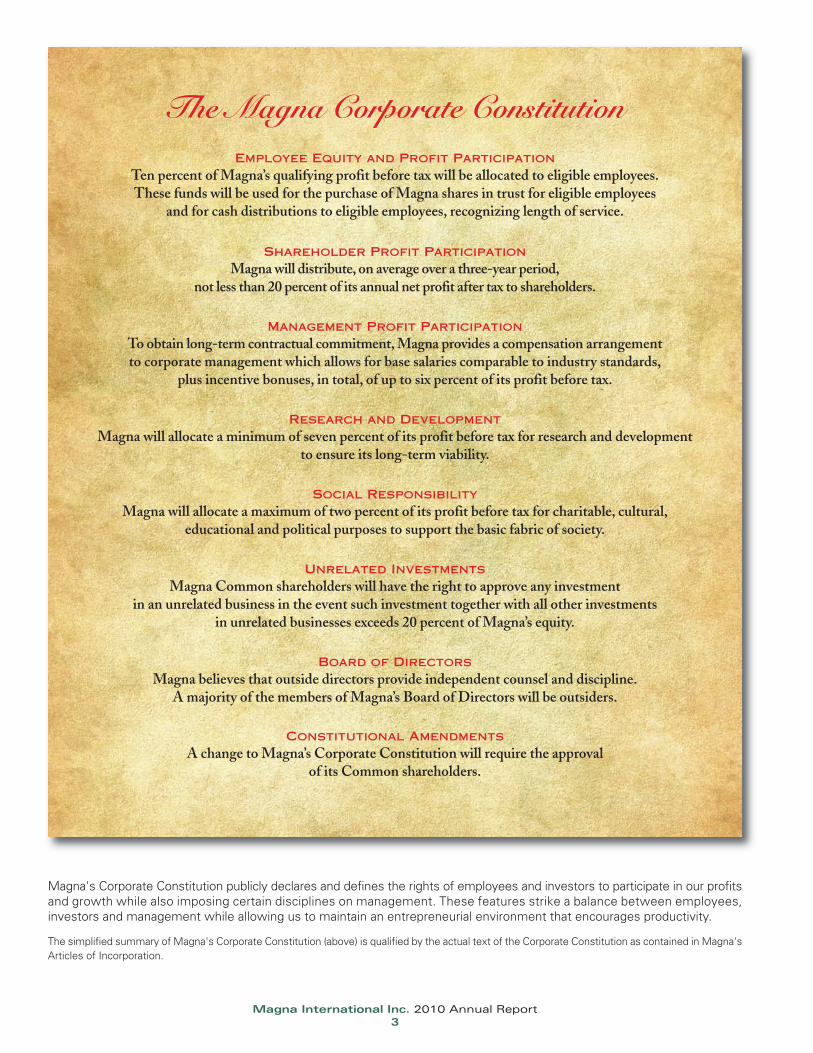
The Magna Corporate ConstitutionEmployee Equity and Profit Participation
Ten percent of Magna’s qualifying profit before tax will be allocated to eligible employees.These funds will be used for the purchase of Magna shares in trust for eligible employees
and for cash distributions to eligible employees, recognizing length of service.
Shareholder Profit ParticipationMagna will distribute, on average over a three-year period,
not less than 20 percent of its annual net profit after tax to shareholders.
Management Profit ParticipationTo obtain long-term contractual commitment, Magna provides a compensation arrangementto corporate management which allows for base salaries comparable to industry standards,
plus incentive bonuses, in total, of up to six percent of its profit before tax.
Research and DevelopmentMagna will allocate a minimum of seven percent of its profit before tax for research and development
to ensure its long-term viability.
Social ResponsibilityMagna will allocate a maximum of two percent of its profit before tax for charitable, cultural,
educational and political purposes to support the basic fabric of society.
Unrelated InvestmentsMagna Common shareholders will have the right to approve any investment
in an unrelated business in the event such investment together with all other investmentsin unrelated businesses exceeds 20 percent of Magna’s equity.
Board of DirectorsMagna believes that outside directors provide independent counsel and discipline.
A majority of the members of Magna’s Board of Directors will be outsiders.
Constitutional AmendmentsA change to Magna’s Corporate Constitution will require the approval
of its Common shareholders.
Magna's Corporate Constitution publicly declares and defines the rights of employees and investors to participate in our profitsand growth while also imposing certain disciplines on management. These features strike a balance between employees,investors and management while allowing us to maintain an entrepreneurial environment that encourages productivity.
The simplified summary of Magna's Corporate Constitution (above) is qualified by the actual text of the Corporate Constitution as contained in Magna'sArticles of Incorporation.

Magna International Inc. 2010 Annual Report4
The Magna Employee’s CharterMagna is committed to an operating philosophy which is based on fairness and concern for people.
This philosophy is part of Magna’s Fair Enterprise culture in which employees and management sharein the responsibility to ensure the success of the company. It includes these principles:
Job SecurityBeing competitive by making a better product for a better price is the best way to enhance job security.
Magna is committed to working together with you to help protect your job security.To assist you, Magna will provide:
• Job Counselling • Training • Employee Assistance Programs
A Safe and Healthful WorkplaceMagna strives to provide you with a working environment which is safe and healthful.
Fair TreatmentMagna offers equal opportunities based on an individual’s qualifications and performance,
free from discrimination or favouritism.
Competitive Wages and BenefitsMagna will provide you with information which will enable you to compare your total compensation,
including total wages and total benefits, with those earned by employees of your competitors,as well as with other plants in your community. If your total compensation is found not to be competitive,
then your wages will be adjusted.
Employee Equity and Profit ParticipationMagna believes that every employee should share in the financial success of the company.
Communication and InformationThrough regular monthly meetings between management and employees and through publications,Magna will provide you with information so that you will know what is going on in your company
and within the industry.
The HotlineShould you have a problem, or feel the above principles are not being met, we encourage you to call
the Hotline or use the self-addressed Hotline Envelopes to register your complaints. You do not haveto give your name, but if you do, it will be held in strict confidence. Hotline Investigators will answer
your call.The Hotline is committed to investigate and resolve all concerns or complaintsand must report the outcome to Magna’s Global Human Resources Department.
Employee Relations Advisory BoardThe Employee Relations Advisory Board is a group of people who have proven recognition and credibilityrelating to humanitarian and social issues.This Board will monitor, advise and ensure that Magna operates
within the spirit of the Magna Employee’s Charter and the principles of Magna’s Corporate Constitution.

Magna International Inc. 2010 Annual Report5
Management's Message to Shareholders
Magna entered 2011 riding a wave of momentum that started in 2010 and has continuedto build as the global automotive industry experiences a solid recovery in vehicle productionand sales. Despite recent world events, we are confident that 2011 will be another strongyear for our industry.
The past year also saw a landmark change in regard to our capital structure, with shareholdersvoting to eliminate the dual-class share capital structure that had been in place since thelate 1970s. We believe that the move to a single share structure has already unlockedsignificant share value for Magna shareholders and will continue to do so going forward.
Also in 2010, as a result of our continuing strong operating and cash flow performance,our Board of Directors reinstated our quarterly dividend and subsequently increased thedividend three times since its reinstatement. In late 2010, we completed a two-for-onestock split, which was implemented by way of a stock dividend. We also initiated a normalcourse issuer bid to purchase up to 8 million of our issued and outstanding Common Shares(adjusted for the stock split), in place primarily to offset the dilution related to the exerciseof stock options.
Since the elimination of our dual-class share structure, we have also implemented anumber of significant corporate governance initiatives, including the adoption of a majorityvoting policy beginning in 2012 and reconstitution of the Nominating Committee of ourBoard so that it is now comprised entirely of independent directors. Through the assistanceof an internationally recognized firm, we have also identified two additional independentdirectors who are being nominated for election.
We believe the change in our capital structure and the corporate governance initiativeswe have enacted establish a strong foundation for the Company's long-term success.
Operating Highlights
Our 2010 sales rose sharply – largely due to increases in North American and Europeanvehicle production volumes. Magna sales in 2010 were $24.1 billion, an increase of 39%compared to the previous year. Our Rest of World production sales surpassed the $1 billionlevel for the first time and continued to experience robust growth, up 53% compared tothe year before. Magna's average dollar content per vehicle also continued to climb inboth North America, where it rose 13% over the prior year, and in Europe, where it grewby 8% from 2009 levels.
We are in a strong financial position, with net cash of $2 billion and little debt. With a newcapital structure and a new global management structure in place, we believe we arenow well-positioned to capitalize on business opportunities that arise in the year ahead.
The following are some of the major operating highlights in 2010, including a number ofacquisitions and investments in new facilities that expand Magna's manufacturing footprintin several key emerging markets:
• We significantly expanded our presence in South America through acquisitionsand greenfield operations. Two of our operating units – Cosma International andMagna Seating – announced plans to build manufacturing facilities in the São Pauloarea to meet new customer requirements. We also acquired Brazilian automotiveseating supplier Resil Minas, the largest supplier of seat frames in South America.The new entity will operate under the name Magna Seating Brazil with fourmanufacturing facilities. The Resil Minas acquisition was followed by the acquisitionof Pabsa S.A., a vertically integrated supplier of complete seats, foam products,trim covers and seat structures based in Argentina. The new entity will operate asMagna Seating Argentina and includes three production facilities. These acquisitionsposition Magna as a leading supplier of automotive seating solutions in SouthAmerica.
Donald J. WalkerChief Executive Officer
Vincent J. GalifiExecutive Vice-Presidentand Chief Financial Officer

Magna International Inc. 2010 Annual Report6
• We acquired convertible system supplier Karmann Japan Co. Ltd. and combined the operation with MagnaSteyr's Car Top Systems operations in Japan.
• We announced the opening of three new facilities near St. Petersburg, Russia. Two of the new facilities operateas a joint venture between Cosma International and a Korean-based supplier, and will produce body, chassisand energy-management systems for OEM customers such as Hyundai, General Motors, Nissan andVolkswagen. The third facility produces exterior and interior components for OEM customers including Fordand Nissan.
• We were awarded significant new business. We received a contract from General Motors to supply theframe assembly for GM's next generation of full-size pickups and SUVs – the third generation of frames thatMagna has been awarded by GM for this particular platform. In addition, four of our operating units wereawarded major new business from Volkswagen Group of America. Magna is supplying a wide variety ofcomponents and systems on Volkswagen's new Passat, which is assembled in Chattanooga, Tennessee.
• We launched the new Dynamax™ All-Wheel-Drive (AWD) system through a joint venture with a Korean-basedsupplier. The AWD system features an intelligent control unit that continuously monitors driving conditionsand anticipates AWD system requirements. The new Kia Sportage is the first of several vehicles planned tofeature the Dynamax™ AWD system.
• Our operating units and manufacturing divisions won a number of major customer awards. Cosma International,our body and chassis systems unit, received the General Motors 2009 Supplier of the Year award for significantcontributions to GM's global product and performance achievements. This was the 11th time Cosma haswon the award. Three Magna divisions won Ford's World Excellence Awards, the company's highest supplierrecognition. Our divisions also received supplier performance awards from American Honda Motor Co.,Toyota Motor Engineering & Manufacturing North America, Inc. and Toyota Motor Europe, as well as anExcellent Technology Award from Toyota.
• Magna Seating received an Innovation Award in the environmental category from the Society of PlasticsEngineers (SPE) Automotive Division for a new technology that converts polyurethane foam scrap intorenewed polyol. This groundbreaking innovation has its first commercial automotive application in the seatsof the 2011 Jeep® Grand Cherokee.
Going Forward
Given the solid recovery of global vehicle sales and production during the past several quarters, we are confident thatMagna will post strong results again in 2011. We remain focused on continuing to implement our global growth strategy,which includes further expansion in high-growth and developing markets, primarily in China, South America, Russiaand India, in order to be well positioned to support our customers' global platforms and to capitalize on significantvehicle production growth in these markets. We will also continue to diversify our customer base and invest in product,process and material innovations to fuel new business.
We also remain focused on increasing our profitability in Europe, through a combination of launching new programsand facilities, improving certain underperforming operations and increasing the competitiveness of our manufacturingfootprint in Europe.
In addition, we will continue to grow our business in non-traditional areas by leveraging our manufacturing capacityand know-how to service customers in other industries, including heavy truck, consumer durables and alternative energy.
In closing, we wish to thank our stakeholders and customers for their ongoing support during a milestone year forMagna. We believe Magna is on the road to becoming one of the world's foremost automotive parts suppliers.We have all of the right ingredients, including an entrepreneurial corporate culture, a strong balance sheet, a solidglobal footprint and the most diverse capabilities of any supplier in the world. As we continue to grow globally,we will continue to implement the principles contained in our Corporate Constitution and our Employee's Charter.Our ability to attract and develop the best people, the result of our entrepreneurial culture, is what makes Magnastrong. Our focus on innovation, together with best-in-class manufacturing and program management, ensures thatwe will remain a globally competitive, world-class partner for our customers.
/s/ Donald J. Walker /s/ Vincent J. Galifi
Donald J. Walker Vincent J. GalifiChief Executive Officer Executive Vice-President
and Chief Financial Officer

Magna International Inc. 2010 Annual Report – MD&A7
Magna International Inc.Financial Review and Other Information
2010Management's Discussion and Analysis of Results of Operations
and Financial Position 8
Management's Responsibility for Financial Reporting 41
Independent Auditors' Report of Registered Public Accounting Firm 42
Independent Auditors' Report on Internal Controls Under Standardsof the Public Company Accounting Oversight Board (United States) 43
Consolidated Statements of Income (Loss)and Comprehensive Income (Loss) 44
Consolidated Statements of Retained Earnings 45
Consolidated Statements of Cash Flows 45
Consolidated Balance Sheets 46
Notes to the Consolidated Financial Statements 47
Supplementary Financial and Share Information 86
Corporate Directory Inside BackCover

Magna International Inc. 2010 Annual Report – MD&A8
All amounts in this Management's Discussion and Analysis of Results of Operations and Financial Position ("MD&A") are in U.S.dollars and all tabular amounts are in millions of U.S. dollars, except per share figures and average dollar content per vehicle, whichare in U.S. dollars, unless otherwise noted. When we use the terms "we", "us", "our" or "Magna", we are referring to MagnaInternational Inc. and its subsidiaries and jointly controlled entities, unless the context otherwise requires.
This MD&A should be read in conjunction with the audited consolidated financial statements for the year ended December 31, 2010which are prepared in accordance with Canadian generally accepted accounting principles ("GAAP") as well as the "Forward-LookingStatements" on page 39.
This MD&A has been prepared as at March 16, 2011.
OVERVIEW
We are the most diversified global automotive supplier. We design, develop and manufacture technologically advanced automotivesystems, assemblies, modules and components, and engineer and assemble complete vehicles, primarily for sale to originalequipment manufacturers ("OEMs") of cars and light trucks. Our capabilities include the design, engineering, testing and manufactureof automotive interior systems; seating systems; closure systems; body and chassis systems; vision systems; electronic systems;exterior systems; powertrain systems; roof systems; hybrid and electric vehicles/systems; as well as complete vehicle engineeringand assembly. We follow a corporate policy of functional and operational decentralization, pursuant to which we conduct ouroperations through divisions, each of which is an autonomous business unit operating within pre-determined guidelines. As atDecember 31, 2010, we had 256 manufacturing operations and 82 product development, engineering and sales centres in 26countries.
HIGHLIGHTS
Operations
2010 was a year of significant change for both the automotive industry and Magna. North American light vehicle production increased39% in 2010, compared to the historically low level of production experienced in 2009. The key reason for this increase in NorthAmerican light vehicle production was the improvement in North American auto sales.
In Western Europe, light vehicle production increased 12% in 2010, compared to 2009. The increased production in 2010 reflectedrelatively strong vehicle sales in certain European countries, as well as increased exports of European-built vehicles into other marketsduring 2010, particularly China.
Our 2010 total sales increased 39% over 2009, with North American, European and Rest of World production sales, as well ascomplete vehicle assembly sales, and tooling and other sales all posting increases over 2009. Rest of World production sales exceededthe $1 billion mark for the first time, increasing 53% in 2010 to $1.031 billion, compared to $676 million in 2009. Operating incomefor 2010 increased $1.7 billion to $1.2 billion, compared to an operating loss of $511 million for 2009. Diluted earnings per share for2010 increased $6.39 to $4.18, compared to a diluted loss per share of $2.21 for 2009. Cash flow from operations for 2010 increased$1.3 billion to $1.87 billion, compared to $527 million for 2009.
Our 2010 financial results reflect, among other things:
• the improved level of light vehicle production in North America and Western Europe;• the benefits of our efforts over the last few years to restructure, right-size and otherwise reduce costs across the organization;
and• the benefit of our efforts to improve underperforming operations around the world.
Plan of Arrangement
On August 31, 2010, following approval by our Class A Subordinate Voting and Class B Shareholders, we completed a court-approvedplan of arrangement (the "Arrangement") in which our dual-class share structure was collapsed. In addition, the transaction: (i) set atermination date and declining fee schedule for the consulting, business development and business services contracts Magna hasin place with our Chairman, Frank Stronach, and his affiliated entities; and (ii) established a partnership with the Stronach group topursue opportunities in the vehicle electrification business.
MAGNA INTERNATIONAL INC.Management's Discussion and Analysis of Results of Operations andFinancial Position

Magna International Inc. 2010 Annual Report – MD&A9
[a] Capital Transaction
We purchased for cancellation all 1,453,658 outstanding Class B Shares (restated to reflect the stock split discussed below),which were held indirectly by the Stronach group, for $300 million in cash and 18.0 million newly issued Class A SubordinateVoting Shares (restated to reflect the stock split discussed below). The newly issued shares held indirectly by the Stronach grouprepresented an equal equity ownership and voting interest of 7.4% as of August 31, 2010.
In addition, Magna's Articles were amended to remove the Class B Shares from the authorized capital and to make non-substantive consequential changes, including renaming the Class A Subordinate Voting Shares as Common Shares andeliminating provisions which no longer apply due to the elimination of the Class B Shares.
[b] Vehicle Electrification Partnership
The partnership, Magna E-Car Systems ("E-Car"), involves the engineering, development and integration of electric vehicles ofany type, the development, testing and manufacturing of batteries and battery packs for hybrid and electric vehicles and allancillary activities in connection with electric vehicle technologies. Our original investment in the partnership included the assetsof our recently established E-Car Systems vehicle electrification and battery business unit, certain other vehicle electrificationassets, and $145 million in cash. On August 31, 2010, the Stronach group invested $80 million in cash for a 27% equity interestin the partnership, reducing our equity interest to 73%. The partnership is controlled by the Stronach group.
Stock Split
On November 24, 2010, we completed a two-for-one stock split, which was implemented by way of a stock dividend. In connectionwith the stock split, all equity-based compensation plans or arrangements were adjusted to reflect the issuance of additional CommonShares.
Accordingly, all of our issued and outstanding Common Shares and our former Class A Subordinate Voting and Class B shares,including the shares issued in connection with the Arrangement, as well as incentive stock options, and stock appreciation rights("SARs") have been restated for all periods presented to reflect the stock split. In addition, earnings (loss) per Common Share or ClassB Share, cash dividends paid per Common Share or Class B Share, weighted average exercise price for stock options and the weightedaverage fair value of options granted or modified have been restated for all periods presented to reflect the stock split.
Dividends
Due to continuing strong operating and cash flow performance, on February 23, 2011 our Board declared a dividend of U.S. $0.25per share in respect of the fourth quarter of 2010, representing an increase of 39% over the third quarter of 2010 dividend and thethird consecutive dividend increase since the reintroduction of the dividend in the first quarter of 2010.
Normal Course Issuer Bid
On November 4, 2010, our Board of Directors approved a normal course issuer bid to purchase up to 8.0 million of our issued andoutstanding Common Shares (adjusted to reflect the stock split), representing approximately 3.3% of our outstanding CommonShares. The primary purposes of the normal course issuer bid are purchases for cancellation to offset potential dilution resulting fromthe exercise of stock options and/or to fund our restricted stock unit program and our obligations to our deferred profit sharing plans.The normal course issuer bid will terminate in November 2011.
Governance
Since the elimination of our dual-class share structure effective August 31, 2010, we have implemented a number of significantcorporate governance initiatives, including the:
• adoption of a majority voting policy;• reconstitution of the Nominating Committee of our Board of Directors as a fully independent Committee; and• initiation of a search for additional independent directors with the assistance of an internationally recognized firm.
Acquisitions
Consistent with our strategy to expand in new regions, in December 2010, we acquired seating companies in Brazil and Argentina.Combined 2010 sales in the two seating companies amounted to $260 million. Also during December 2010, we acquired Erhard &Söhne GmbH, a manufacturer of fuel tanks.

Magna International Inc. 2010 Annual Report – MD&A10
Going Forward
Following a strong rebound in 2010, we expect global light vehicle production to grow further in 2011, provided that overall economicconditions continue to improve. In North America, light vehicle production should experience strong growth in 2011, althoughproduction remains well off peak levels. In Western Europe, we expect light vehicle production to be approximately level with 2010.
Our strategy includes:
• continued expansion in high growth and developing markets;• increased investment in innovation to remain at the forefront of the automotive industry;• further diversification of sales by customer, by region and by vehicle segment; and• continued support of our existing customers globally.
We expect this strategy to be implemented both through organic growth as well as targeted acquisitions.
FINANCIAL RESULTS SUMMARY
During 2010, we posted sales of $24.1 billion, an increase of 39% from 2009. This higher sales level was a result of increases in ourNorth American, European and Rest of World production sales, complete vehicle assembly sales and tooling, engineering and othersales. Comparing 2010 to 2009:
• North American vehicle production increased by 39% and average dollar content per vehicle increased 13%;• European vehicle production increased 12% and average dollar content per vehicle increased 8%;• Complete vehicle assembly sales increased 23% to $2.2 billion, as complete vehicle assembly volumes increased 52%;• Rest of World production sales increased 53% to $1.0 billion from $0.7 billion; and• Tooling, engineering and other sales increased 26% to $2.0 billion from $1.6 billion.
During 2010, we earned operating income of $1.2 billion compared to an operating loss of $0.5 billion for 2009. Excluding the unusualitems recorded in 2010 and 2009, as discussed in the "Unusual Items" section, the $1.6 billion increase in operating income wassubstantially due to increased margins earned on higher sales as a result of significantly higher vehicle production volumes. In addition,operating income was positively impacted by:
• lower restructuring and downsizing costs and the benefit of prior year restructuring and downsizing activities;• a $32 million recovery, during 2010, of receivables that were fully provided for in 2009;• favourable settlement of certain commercial items;• the write-off of uncollectable pre-production costs incurred related to the cancellation of assembly programs in 2009;• higher equity income;• due diligence costs incurred in 2009 associated with our planned investment in Opel, which terminated during 2009;• the $20 million benefit related to the recovery of previously expensed engineering and design costs;• higher interest income;• incremental margin earned on acquisitions completed during or subsequent to 2009, including Cadence Innovation s.r.o.
("Cadence");• lower costs incurred related to launches at our Complete Vehicle Assembly operations; and• productivity and efficiency improvements at certain facilities.
These factors were partially offset by:
• higher incentive compensation;• higher costs related to launches at our components business;• operational inefficiencies and other costs at certain facilities, in particular at certain exteriors and interiors systems facilities in Europe;• employee profit sharing, as no profit sharing was recorded in 2009;• increased commodity costs;• a $20 million stock-based compensation charge as a result of modifying option agreements with three departing executives and
a related $9 million contract termination payment;• increased stock-based compensation;• a $9 million favourable revaluation of our investment in asset-backed commercial paper ("ABCP") in 2009; and• net customer price concessions subsequent to 2009.
During 2010, net income increased $1.5 billion to $1.0 billion compared to net loss of $0.5 billion for 2009. Excluding the unusual itemsrecorded in 2010 and 2009, as discussed in the "Unusual Items" section, net income for 2010 increased $1.3 billion. The increase innet income was a result of the increase in operating income and minority interest recovery, partially offset by higher income taxes.

Magna International Inc. 2010 Annual Report – MD&A11
During 2010, our diluted earnings per share increased by $6.39 to $4.18 compared to loss per share of $2.21 for 2009. Excluding theunusual items recorded in 2010 and 2009, as discussed in the "Unusual Items" section, diluted earnings per share for 2010 increasedby $5.66. The increase in diluted earnings per share is as a result of the increase in net income partially offset by an increase in theweighted average number of diluted shares outstanding during 2010. The increase in the weighted average number of diluted sharesoutstanding was primarily due to the net issue of shares during 2010 related primarily to the Arrangement and an increase in thenumber of diluted shares associated with stock options and restricted stock partially offset by the effect of the repurchase andcancellation of Common Shares pursuant to our normal course issuer bid.
UNUSUAL ITEMS
During the three months and year ended December 31, 2010 and 2009, we recorded certain unusual items as follows:
2010 2009Diluted Diluted
Operating Net Earnings Operating Net EarningsIncome Income per Share Income Income per Share
Fourth QuarterImpairment charges (1) $ (23) $ (21) $ (0.09) $ (108) $ (106) $ (0.47)Restructuring charges (1) (8) (6) (0.02) (20) (20) (0.09)Sale of facility (2) – – – (8) (8) (0.04)
Total fourth quarter unusual items (31) (27) (0.11) (136) (134) (0.60)
Second QuarterImpairment charges (1) – – – (75) (75) (0.34)Restructuring charges (1) (24) (21) (0.09) (6) (6) (0.03)Curtailment gain (3) – – – 26 20 0.09
Total second quarter unusual items (24) (21) (0.09) (55) (61) (0.28)
First QuarterSale of facility (2) 14 14 0.06 – – –
Total first quarter unusual items 14 14 0.06 – – –
Total full year unusual items $ (41) $ (34) $ (0.15) $ (191) $ (195) $ (0.88)
(1) Restructuring and Impairment Charges
During 2010 and 2009, we recorded long-lived asset and goodwill impairment charges as follows:
2010 2009Operating Net Operating Net
Income Income Income Income
Fourth QuarterNorth America $ 7 $ 5 $ 38 $ 36Europe 16 16 70 70
Total fourth quarter impairment charges 23 21 108 106
Second QuarterNorth America – – 75 75
Total second quarter impairment charges – – 75 75
Total full year impairment charges $ 23 $ 21 $ 183 $ 181
[a] For the year ended December 31, 2010
(i) Long-lived Assets
In conjunction with our annual business planning cycle, during the fourth quarter of 2010, we completed our annualgoodwill impairment and long-lived asset analysis and recorded long-lived asset impairment charges of $23 million.
In North America, we recorded charges of $7 million related to fixed assets at a die casting facility in Canada and inGermany, we recorded long-lived asset impairment charges of $16 million related to an interiors systems facility.

Magna International Inc. 2010 Annual Report – MD&A12
(ii) Restructuring Costs
During 2010, we recorded restructuring and rationalization costs of $29 million in cost of goods sold and $3 million inselling, general and administrative expense related to the planned closure of a powertrain systems facility and twobody & chassis systems facilities in North America.
[b] For the year ended December 31, 2009
(i) Goodwill
In conjunction with our annual business planning cycle, during the fourth quarter of 2009 we determined that our CarTop Systems ("CTS") North America reporting unit could potentially be impaired, primarily as a result of: (i) a dramaticreduction in the market for soft tops, hard tops and modular retractable hard tops; and (ii) historical losses that areprojected to continue throughout our business planning period. Based on the reporting unit's discounted forecast cashflows, we recorded a $25 million goodwill impairment charge.
In addition, during the second quarter of 2009, after failing to reach a favourable labour agreement at a powertrainsystems facility in Syracuse, New York, we decided to wind down these operations. Given the significance of thefacility's cash flows in relation to the reporting unit, management determined that it was more likely than not thatgoodwill at the Powertrain North America reporting unit could potentially be impaired. Therefore, we recorded a $75 milliongoodwill impairment charge.
The goodwill impairment charges were calculated by determining the implied fair value of goodwill in the same manneras if we had acquired the Powertrain and CTS reporting units as at June 30, 2009 and December 31, 2009, respectively.
(ii) Long-lived Assets
During the fourth quarter of 2009, we recorded long-lived asset impairment charges of $83 million.
In North America, we recorded charges of $13 million related to fixed assets at a die casting facility in Canada and ananticipated under recovery of capitalized tooling costs at a stamping facility in the United States due to significantly lowervolumes on certain SUV programs.
In Europe, we recorded long-lived asset impairment charges of $70 million related to our CTS and exterior systemsoperations in Germany.
At our CTS operations, long-lived asset impairment charges of $59 million were recorded related to fixed and intangibleassets. The impairment charge was calculated based on CTS' discounted forecast cashflows and was necessaryprimarily as a result of: (i) a dramatic reduction in the market for soft tops, hard tops and modular retractable hard tops;and (ii) historical losses that are projected to continue throughout our business planning period.
At our interiors and exteriors operations, we recorded an $11 million asset impairment charge related to specific under-utilized assets in Germany.
(iii) Restructuring Costs
During 2009, we recorded restructuring and rationalization costs of $23 million in cost of goods sold and $3 million inselling, general and administrative expense. During the second quarter, we recorded restructuring costs of $6 millionrelated to the planned closure of a powertrain systems facility in Syracuse, New York and during the fourth quarter werecorded severance and other termination benefits related to the closure of powertrain and interior systems facilitiesin Germany. Substantially all of the $26 million will be paid subsequent to 2009.
In addition, during 2009, we incurred costs related to downsizing various operations in our traditional markets.
(2) Sale of Facilities
During 2010, we sold our interest in an electronics systems joint venture in China and realized a $14 million gain.
During 2009, we entered into an agreement to sell an engineering centre in Europe and, as a result, incurred a loss on dispositionof the facility of $8 million.

Magna International Inc. 2010 Annual Report – MD&A13
(3) Curtailment Gain
During the second quarter of 2009, we amended our Retiree Premium Reimbursement Plan in Canada and the United States,such that most employees retiring on or after August 1, 2009 would no longer participate in the plan. The amendment reducedservice costs and retirement medical benefit expense in 2009 and future years. As a result of amending the plan, a curtailmentgain of $26 million was recorded in cost of goods sold in the second quarter of 2009.
INDUSTRY TRENDS AND RISKS
A number of general trends which have been impacting the automotive industry and our business in recent years are expected tocontinue, including the following:
• the exertion of pricing pressure by OEMs;
• government incentives and consumer demand for, and industry focus on, more fuel-efficient and environmentally-friendly vehicleswith alternative-energy fuel systems and additional safety features;
• governmental regulation of fuel economy and emissions, vehicle recyclability and vehicle safety;
• the long-term growth of the automotive industry in China, India, Brazil, Russia and other developing markets, including acceleratedmigration of component and vehicle design, development, engineering and manufacturing to certain of these markets;
• the growth of the A to D vehicle segments (micro to mid-size cars), particularly in developing markets;
• the consolidation of vehicle platforms; and
• the growth of cooperative alliances and arrangements among competing automotive OEMs, including shared purchasing ofcomponents; joint engine, powertrain and/or platform development; engine, powertrain and platform sharing; and joint vehiclehybridization and electrification initiatives.
The following are some of the more significant risks that could affect our ability to achieve our desired results:
• The global automotive industry is cyclical and is sensitive to changes in economic and political conditions, including interestrates, energy prices and international conflicts. While the global automotive industry appears to be recovering from the severeeconomic downturn which began in the second half of 2008, the strength and speed of the recovery, as well as its consistencyacross geographic markets remains uncertain. This uncertainty creates planning risks for us. Additionally, as a result ofrestructuring actions taken by OEMs and suppliers during the recent downturn, automotive production levels are more closelyaligned with actual automotive sales levels and, accordingly, may be more sensitive to overall economic conditions than in theyears prior to 2008. A significant decline in production volumes from current levels could have a material adverse effect on ourprofitability. As a result of the restructuring actions taken by suppliers during the recent economic downturn, there is a risk thatsome suppliers may not have adequate capacity to timely accommodate increases in demand for their parts which result froma significant, rapid increase in production volumes. Such a failure by a supplier could lead to occasional components shortagesor production disruptions, which could have an adverse effect on our operations and profitability.
• The short-term viability of several of our OEM customers appears to have improved as a result of restructuring actions in the pastfew years, as well as direct government financial intervention in the automotive industry in 2008 and 2009. However, there canbe no assurance that these restructuring actions will be successful in ensuring their long-term viability, nor can there be anyassurance that government financial assistance will be made available at levels necessary to prevent OEM failures in the future.The bankruptcy of any of our major customers could have a material adverse effect on our profitability and financial condition.
• We rely on a number of suppliers to supply us with a wide range of components required in connection with our business. Whilethe automotive supply base appears to have stabilized following the economic downturn which commenced in the second halfof 2008, the financial health of automotive suppliers was impacted by economic conditions, production volume cuts, intensepricing pressures and other factors. The insolvency or bankruptcy of a supplier could disrupt the supply of components to us orour customers, potentially causing the temporary shut-down of our or our customers' production lines. Any prolonged disruptionin the supply of critical components to us or our customers, the inability to re-source or in-source production of a criticalcomponent from a financially distressed automotive components sub-supplier, or any temporary shut-down of one of ourproduction lines or the production lines of one of our customers, could have a material adverse effect on our profitability.Additionally, the insolvency, bankruptcy or financial restructuring of any of our critical suppliers could result in us incurringunrecoverable costs related to the financial work-out of such suppliers and/or increased exposure for product liability, warrantyor recall costs relating to the components supplied by such suppliers to the extent such supplier is not able to assumeresponsibility for such amounts, which could have an adverse effect on our profitability.

Magna International Inc. 2010 Annual Report – MD&A14
• The automotive parts supply industry is highly competitive. As a result of our diversified automotive business, we face a numberof competitors possessing varying degrees of financial and operational strength in each of our product and service capabilities.Some of our competitors have a substantially greater market share than we have in certain product areas and are dominant insome of the markets in which we do business. In addition, restructuring actions taken by some of our competitors have providedthem with improved financial and operational flexibility and could increase their competitive threat to our business. Failure tosuccessfully compete with our existing competitors or with any new competitors could have an adverse effect on our operationsand profitability.
• We are dependent on the outsourcing of components, modules and assemblies, as well as complete vehicles, by OEMs. The extentof OEM outsourcing is influenced by a number of factors, including: relative cost, quality and timeliness of production by suppliersas compared to OEMs; capacity utilization; OEMs’ perceptions regarding the strategic importance of certain components/modulesto them; labour relations among OEMs, their employees and unions; and other considerations. As a result of lower cost structuresdue to recent restructuring actions, some OEMs may in-source production which had previously been outsourced. Outsourcingof complete vehicle assembly is particularly dependent on the degree of unutilized capacity at the OEMs' own assembly facilities,in addition to the foregoing factors. A reduction in outsourcing by OEMs, or the loss of any material production or assemblyprograms coupled with the failure to secure alternative programs with sufficient volumes and margins, could have a materialadverse effect on our profitability.
• We continue to invest in technology and innovation which we believe will be critical to our long-term growth. Our ability toanticipate changes in technology and to successfully develop and introduce new and enhanced products and/or manufacturingprocesses on a timely basis will be a significant factor in our ability to remain competitive. If there is a shift away from the useof technologies in which we are investing, our costs may not be fully recovered. We may be placed at a competitive disadvantageif other technologies in which our investment is not as great, or our expertise is not as developed, emerge as the industry-leading technologies. This could have a material adverse effect on our profitability and financial condition.
• As part of our strategy of continuously seeking to optimize our global manufacturing footprint, we may further rationalize someof our production facilities. In the course of such rationalization, we may incur further restructuring, downsizing and/or othersignificant non-recurring costs related to plant closings, relocations and employee severance costs. Restructuring costs may begreater in certain jurisdictions than others as a result of the size and scope of the restructuring, differences in laws, and otherfactors. Such costs could have an adverse effect on our short-term profitability. In addition, we are working to turn aroundfinancially underperforming divisions; however, there is no guarantee that we will be successful in doing so with respect tosome or all such divisions.
• We recorded significant impairment charges related to goodwill, long-lived assets and future tax assets in recent years and maycontinue to do so in the future. The bankruptcy of a significant customer or the early termination, loss, renegotiation of the termsof, or delay in the implementation of, any significant production contract could be indicators of impairment. In addition, to theextent that forward-looking assumptions regarding: the impact of improvement plans on current operations; in-sourcing andother new business opportunities; program price and cost assumptions on current and future business; the timing of newprogram launches; and forecast production volumes; are not met, any resulting impairment loss could have a material adverseeffect on our profitability.
• Although we supply parts to all of the leading OEMs, a significant majority of our sales are to six such customers. While we havediversified our customer base somewhat in recent years and continue to attempt to further diversify, particularly to increase ourbusiness with Asian-based OEMs, there is no assurance we will be successful. Our inability to successfully grow our sales tonon-traditional customers could have a material adverse effect on our profitability.
• While we supply parts for a wide variety of vehicles produced globally, we do not supply parts for all vehicles produced, nor isthe number or value of parts evenly distributed among the vehicles for which we do supply parts. Shifts in market shares amongvehicles or vehicle segments, particularly shifts away from vehicles on which we have significant content and shifts away fromvehicle segments in which our sales may be more heavily concentrated, or the early termination, loss, renegotiation of the termsof, or delay in the implementation of, any significant production or assembly contract could have a material adverse effect on ourprofitability.
• Many of our customers have sought, and will likely continue to seek to take advantage of lower operating costs and/or otheradvantages in China, India, Brazil, Russia and other developing markets. While we continue to expand our manufacturing footprintwith a view to taking advantage of manufacturing opportunities in these markets, we cannot guarantee that we will be able tofully realize such opportunities. Additionally, the establishment of manufacturing operations in new markets carries its own risks,including those relating to political and economic instability; trade, customs and tax risks; currency exchange rates; currencycontrols; limitations on the repatriation of funds; insufficient infrastructure; and other risks associated with conducting businessinternationally. The inability to quickly adjust our manufacturing footprint to take advantage of manufacturing opportunities inthese markets could harm our ability to compete with other suppliers operating in or from such markets, which could have anadverse effect on our profitability.

Magna International Inc. 2010 Annual Report – MD&A15
• Prices for certain key raw materials and commodities used in our parts, particularly resin and other oil-based items, have beenescalating and may continue to do so. To the extent we are unable to mitigate commodity price increases through hedgingstrategies, by engineering products with reduced commodity content, by passing commodity price increases to our customersor otherwise, such additional commodity costs could have a material adverse effect on our profitability.
• We currently have a global credit facility with a syndicate of lenders that is set to mature in July 2012. While we intend to seeka renewal of the credit facility prior to its maturity, the terms of any renewal are subject to a number of factors, including prevailingeconomic, financial and industry conditions. There is no guarantee that we will be successful in negotiating terms, includingcost of borrowing and restrictive covenants, which are as favourable as those in our current credit facility. In addition, there canbe no assurance that the aggregate borrowing limit under any renewed credit facility will be sufficient to meet our liquidityrequirements and, as a result, we may be required to seek other sources of capital, which may be more costly, which could havean adverse effect on our financial condition.
• The failure of any major financial institutions in the future could lead to significant disruptions in capital and credit markets andcould adversely affect our and our customers' ability to access needed liquidity for working capital. In addition, in the event of afailure of a financial institution - in which we invest our cash reserves; that is a counterparty in a derivatives transaction (primarilycurrency and commodities hedges) with us; or that is a lender to us - we face the risk that our cash reserves and amounts owingto us pursuant to derivative transactions may not be fully recoverable, or the amount of credit available to us may be significantlyreduced. All of these risks could have an adverse effect on our financial condition.
• Europe is currently in the midst of a "sovereign debt" crisis as a result of widespread concern about the ability of several Europeangovernments to repay its outstanding indebtedness. The crisis has necessitated comprehensive financial rescue packages in anattempt to avert more serious financial turmoil. Despite the financial rescue efforts to date, additional actions may be requiredin the short-term and considerable uncertainty remains with respect to the economic condition of several European countries.A deepening of the sovereign debt crisis in Europe or a spread of the crisis beyond Europe could undermine credit markets, equityand bond markets, and consumer confidence, which in turn could have negative consequences for the global economy. In suchcircumstances, many of the risks faced by the automotive industry and our business could intensify, which could have a materialadverse effect on our operations, financial condition and profitability.
• Although our financial results are reported in U.S. dollars, a significant portion of our sales and operating costs are realized inCanadian dollars, euros, British pounds and other currencies. Our profitability is affected by movements of the U.S. dollar againstthe Canadian dollar, the euro, the British pound and other currencies in which we generate revenues and incur expenses.However, as a result of hedging programs employed by us, foreign currency transactions are not fully impacted by movementsin exchange rates. We record foreign currency transactions at the hedged rate where applicable. Despite these measures,significant long-term fluctuations in relative currency values, in particular a significant change in the relative values of the U.S.dollar, Canadian dollar, euro or British pound, could have an adverse effect on our profitability and financial condition and anysustained change in such relative currency values could adversely impact our competitiveness in certain geographic regions.
• We have completed a number of acquisitions and may continue to do so in the future. In those product areas in which we haveidentified acquisitions as a key aspect of our business strategy, we may not be able to identify suitable acquisition targets orsuccessfully acquire any suitable targets which we identify. Additionally, we may not be able to successfully integrate or achieveanticipated synergies from those acquisitions which we do complete and such failure could have a material adverse effect onour profitability.
• We face significant pricing pressure, as well as pressure to absorb costs related to product design, engineering and tooling, aswell as other items previously paid for directly by OEMs. The continuation or intensification of these pricing pressures andpressure to absorb costs could have an adverse effect on our profitability.
• Our customers continue to demand that we bear the cost of the repair and replacement of defective products which are eithercovered under their warranty or are the subject of a recall by them. Warranty provisions are established based on our bestestimate of the amounts necessary to settle existing or probable claims on product defect issues. Recall costs are costs incurredwhen government regulators and/or our customers decide to recall a product due to a known or suspected performance issueand we are required to participate either voluntarily or involuntarily. Currently, under most customer agreements, we only accountfor existing or probable warranty claims. Under certain complete vehicle engineering and assembly contracts, we record anestimate of future warranty-related costs based on the terms of the specific customer agreements and the specific customer'swarranty experience. While we possess considerable historical warranty and recall data and experience with respect to theproducts we currently produce, we have little or no warranty and recall data which allows us to establish accurate estimates of,or provisions for, future warranty or recall costs relating to new products, assembly programs or technologies being brought intoproduction. The obligation to repair or replace such products could have a material adverse effect on our profitability and financialcondition.
Magna International Inc. 2010 Annual Report – MD&A16
• Our vehicle electrification business is currently conducted through a partnership, E-Car, which is indirectly controlled by theStronach group as a result of its right to appoint three of the five members of the management committee through which thebusiness and affairs of the partnership are managed and controlled. Subject to our veto rights in respect of certain fundamentalchanges and specified business decisions, the Stronach group is able to cause E-Car to effect transactions without our consent.In addition, E-Car has an unrestricted right to compete with us, now or in the future, in the design, engineering, manufacture orsale of electric or hybrid-electric vehicle components. Despite the Stronach group's control of E-Car, our customers may continueto look to us for resolution of financial, operational, quality or warranty issues relating to programs for which E-Car is responsible.
• We have no obligation to make additional investments in E-Car under the terms of the E-Car partnership agreement. However,there is no assurance that the initial capital contributions made by us and the Stronach group to E-Car will be sufficient to fundits ongoing operations. Subject to approval by the unconflicted members of our Board (which excludes Mr. Stronach, who wouldhave a conflict of interest), we may or may not choose to make further investments in E-Car. That determination will be basedon what will best serve Magna's long-term business. Our ability to recover our initial investment or any potential subsequentinvestment(s) in E-Car is subject to a number of risks and uncertainties, including E-Car's ability to successfully introduce andcommercially provide its products and services. The failure to recover our investment in E-Car could adversely affect Magna'sprofitability.
• We continue to pursue opportunities in areas that are complementary to our existing automotive design, engineering andmanufacturing capabilities, such as structural elements and panels for solar panels, stamped components for consumer durables,including household appliances, and various components for heavy trucks, all in order to more efficiently use our capital assets,technological know-how and manufacturing capacity. Many of these "non-automotive" industries are subject to some of thesame types of risks as our automotive business, including: sensitivity to economic conditions, cyclicality and technology risks.We also face a diverse number of competitors possessing varying degrees of financial and operational strength and experiencein their industry. Failure to successfully compete in these and other non-automotive businesses could have an adverse effect onour operations and profitability.
• From time to time, we may become liable for legal, contractual and other claims by various parties, including customers, suppliers,former employees, class action plaintiffs and others. On an ongoing basis, we attempt to assess the likelihood of any adversejudgments or outcomes to these claims, although it is difficult to predict final outcomes with any degree of certainty. At this time,we do not believe that any of the claims to which we are party will have a material adverse effect on our financial position;however, we cannot provide any assurance to this effect.
RESULTS OF OPERATIONS
Average Foreign Exchange
For the three months For the yearended December 31, ended December 31,
2010 2009 Change 2010 2009 Change
1 Canadian dollar equals U.S. dollars 0.988 0.948 + 4% 0.971 0.882 + 10%1 euro equals U.S. dollars 1.361 1.477 - 8% 1.328 1.395 - 5%1 British pound equals U.S. dollars 1.582 1.635 - 3% 1.547 1.565 - 1%
The preceding table reflects the average foreign exchange rates between the most common currencies in which we conduct businessand our U.S. dollar reporting currency. The significant changes in these foreign exchange rates for the three months and year endedDecember 31, 2010 impacted the reported U.S. dollar amounts of our sales, expenses and income.
The results of operations whose functional currency is not the U.S. dollar are translated into U.S. dollars using the average exchangerates in the table above for the relevant period. Throughout this MD&A, reference is made to the impact of translation of foreignoperations on reported U.S. dollar amounts where relevant.
Our results can also be affected by the impact of movements in exchange rates on foreign currency transactions (such as raw materialpurchases or sales denominated in foreign currencies). However, as a result of hedging programs employed by us, foreign currencytransactions in the current period have not been fully impacted by movements in exchange rates. We record foreign currencytransactions at the hedged rate where applicable.
Finally, holding gains and losses on foreign currency denominated monetary items, which are recorded in selling, general andadministrative expenses, impact reported results.

Magna International Inc. 2010 Annual Report – MD&A17
RESULTS OF OPERATIONS – FOR THE YEAR ENDED DECEMBER 31, 2010
Sales
2010 2009 Change
Vehicle Production Volumes (millions of units)North America 11.954 8.621 + 39%Europe 13.304 11.835 + 12%
Average Dollar Content Per VehicleNorth America $ 988 $ 872 + 13%Europe $ 536 $ 495 + 8%
SalesExternal Production
North America $ 11,816 $ 7,515 + 57%Europe 7,136 5,857 + 22%Rest of World 1,031 676 + 53%
Complete Vehicle Assembly 2,163 1,764 + 23%Tooling, Engineering and Other 1,956 1,555 + 26%
Total Sales $ 24,102 $ 17,367 + 39%
External Production Sales - North America
External production sales in North America increased 57% or $4.3 billion to $11.8 billion for 2010 compared to $7.5 billion for 2009.This increase in production sales reflects a 39% increase in North American vehicle production volumes combined with a 13%increase in our North American average dollar content per vehicle.
Our average dollar content per vehicle grew by 13% or $116 to $988 for 2010 compared to $872 for 2009, primarily as a result of:
• the launch of new programs during or subsequent to 2009, including the:• Chevrolet Equinox and GMC Terrain;• Jeep Grand Cherokee;• Ford Fiesta;• Chevrolet Cruze; and• Cadillac SRX;
• favourable production (relative to industry volumes) and/or content on certain programs, including the:• Dodge Grand Caravan, Chrysler Town & Country and Volkswagen Routan;• GM full-sized pickups and SUVs;• Chevrolet Traverse, GMC Acadia and Buick Enclave; and• Jeep Wrangler;
• an increase in reported U.S. dollar sales due to the strengthening of the Canadian dollar against the U.S. dollar; and• the acquisition of several facilities from Meridian Automotive Systems Inc. ("Meridian") in the third quarter of 2009.
These factors were partially offset by:
• programs that ended production during or subsequent to 2009, including the Pontiac, Saturn and Mercury brands;• unfavourable production (relative to industry volumes) and/or content on certain programs, including the Ford Escape and Mazda
Tribute; and• net customer price concessions subsequent to 2009.

Magna International Inc. 2010 Annual Report – MD&A18
External Production Sales - Europe
External production sales in Europe increased 22% or $1.28 billion to $7.14 billion for 2010 compared to $5.86 billion for 2009. This increasein production sales reflects an 8% increase in our European average dollar content per vehicle combined with a 12% increase inEuropean vehicle production volumes.
Our average dollar content per vehicle grew by 8% or $41 to $536 for 2010 compared to $495 for 2009, primarily as a result of:
• the launch of new programs during or subsequent to 2009, including the:• MINI Countryman;• Mercedes-Benz SLS;• Peugeot RCZ;• Porsche Panamera; and• Porsche Cayenne and Volkswagen Touareg;
• favourable production (relative to industry volumes) and/or content on certain programs; and• acquisitions completed during or subsequent to 2009, including Cadence.
These factors were partially offset by:
• a decrease in reported U.S. dollar sales due to the weakening of the euro and British pound, each against the U.S. dollar;• unfavourable production (relative to industry volumes) and/or content on certain programs;• programs that ended production during or subsequent to 2009, including the BMW X3; and• net customer price concessions subsequent to 2009.
External Production Sales - Rest of World
External production sales in Rest of World increased 53% or $355 million to $1.03 billion for 2010 compared to $0.68 billion for 2009,primarily as a result of:
• increased production and/or content on certain programs in China and Korea;• the acquisition of a Japanese roof systems facility in the first quarter of 2010;• the launch of new programs during or subsequent to 2009 in China and Korea;• an increase in reported U.S. dollar sales as a result of the strengthening of the Brazilian real and Korean Won, both against the
U.S. dollar; and• production related to the launch of new facilities in Korea and India.
These factors were partially offset by:
• the sale of our interest in an electronics systems joint venture in China in the first quarter of 2010; and• net customer price concessions subsequent to 2009.
Complete Vehicle Assembly Sales
The terms of our various vehicle assembly contracts differ with respect to the ownership of components and supplies related to theassembly process and the method of determining the selling price to the OEM customer. Under certain contracts we are acting asprincipal, and purchased components and systems in assembled vehicles are included in our inventory and cost of sales. These costsare reflected on a full-cost basis in the selling price of the final assembled vehicle to the OEM customer. Other contracts provide thatthird-party components and systems are held on consignment by us, and the selling price to the OEM customer reflects a value-addedassembly fee only.
Production levels of the various vehicles assembled by us have an impact on the level of our sales and profitability. In addition, therelative proportion of programs accounted for on a full-cost basis and programs accounted for on a value-added basis also impactsour level of sales and operating margin percentage, but may not necessarily affect our overall level of profitability. Assuming nochange in total vehicles assembled, a relative increase in the assembly of vehicles accounted for on a full-cost basis has the effectof increasing the level of total sales, however, because purchased components are included in cost of sales, profitability as apercentage of total sales is reduced. Conversely, a relative increase in the assembly of vehicles accounted for on a value-added basishas the effect of reducing the level of total sales and increasing profitability as a percentage of total sales.

Magna International Inc. 2010 Annual Report – MD&A19
2010 2009 Change
Complete Vehicle Assembly Sales $ 2,163 $ 1,764 + 23%
Complete Vehicle Assembly Volumes (Units)Full-Costed:
BMW X3, MINI Countryman, Peugeot RCZ,Mercedes-Benz G-Class, Aston Martin Rapide andSaab 93 Convertible 80,686 51,244
Value-Added:Chrysler 300, Jeep Grand Cherokee and Jeep Commander 5,497 5,376
86,183 56,620 + 52%
Complete vehicle assembly sales increased 23% or $0.4 billion to $2.2 billion for 2010 compared to $1.8 billion for 2009, whileassembly volumes increased 52% or 29,563 units.
The increase in complete vehicle assembly sales is primarily as a result of:
• the launch of new assembly programs during or subsequent to 2009, including the:• MINI Countryman;• Peugeot RCZ; and• Aston Martin Rapide; and
• an increase in assembly volumes for the Mercedes-Benz G-Class.
These factors were partially offset by the end of production on certain assembly programs at our Magna Steyr facility, including the:
• BMW X3 in the third quarter of 2010;• Saab 93 Convertible in the fourth quarter of 2009; and• Chrysler 300 and Jeep Grand Cherokee in the second quarter of 2010.
In addition, complete vehicle assembly sales were negatively impacted by a decrease in reported U.S. dollar sales due to theweakening of the euro against the U.S. dollar.
Tooling, Engineering and Other
Tooling, engineering and other sales increased 26% or $0.4 billion to $2.0 billion for 2010 compared to $1.6 billion for 2009.
In 2010, the major programs for which we recorded tooling, engineering and other sales were the:
• MINI Cooper and Countryman;• BMW X3;• Mercedes-Benz M-Class;• Ford Fiesta;• Jeep Grand Cherokee;• Volkswagen Touareg;• Chrysler 300C, Dodge Charger and Challenger;• Chevrolet Silverado and GMC Sierra;• Porsche Cayenne; and• Peugeot RCZ.
In 2009, the major programs for which we recorded tooling, engineering and other sales were the:
• MINI Cooper, Clubman and Crossman;• Chevrolet Silverado and GMC Sierra;• Porsche Panamera;• Opel/Vauxhall Astra;• Audi Q5;• BMW X3;• Porsche Boxster and Cayman;• Porsche Cayenne;• Mercedes-Benz M-Class;• Peugeot RCZ;• Cadillac SRX and Saab 9-4X;• Ford F-Series; and• Mercedes-Benz C-Class.
In addition, tooling, engineering and other sales decreased as a result of the weakening of the euro against the U.S. dollar.

Magna International Inc. 2010 Annual Report – MD&A20
Gross Margin
Gross margin increased $1.5 billion to $3.2 billion for 2010 compared to $1.7 billion for 2009 and gross margin as a percentage oftotal sales increased to 13.2% for 2010 compared to 9.6% for 2009. The unusual items discussed in the "Unusual Items" sectionnegatively impacted gross margin as a percentage of total sales in 2010 by 0.1%. Excluding unusual items, gross margin as apercentage of total sales increased 3.7% substantially due to increased gross margin earned as a result of significantly higher vehicleproduction volumes. In addition, gross margin as a percentage of total sales was positively impacted by:
• lower restructuring and downsizing costs and the benefit of prior year restructuring and downsizing activities;• productivity and efficiency improvements at certain facilities;• acquisitions completed during or subsequent to 2009;• favourable settlement of certain commercial items;• the write-off of uncollectable pre-production costs incurred related to the cancellation of assembly programs in 2009;• the $20 million benefit related to the recovery of previously expensed engineering and design costs; and• lower costs incurred related to launches at our Complete Vehicle Assembly operations.
These factors were partially offset by:
• higher costs incurred related to launches at our components business;• operational inefficiencies and other costs at certain facilities, in particular at certain exteriors and interiors systems facilities in Europe;• employee profit sharing, as no profit sharing was recorded in 2009;• increased commodity costs;• higher development and launch costs in E-Car;• an increase in complete vehicle assembly sales which have a lower gross margin than our consolidated average;• an increase in tooling sales that earn low or no margins; and• net customer price concessions subsequent to 2009.
Depreciation and Amortization
Depreciation and amortization costs decreased 10% or $76 million to $661 million for 2010 compared to $737 million for 2009. The decreasein depreciation and amortization was primarily as a result of:
• the impairment of certain assets during or subsequent to 2009;• lower capital spending in recent years; and• the disposition of certain facilities subsequent to 2009.
These factors were partially offset by an increase in reported U.S. dollar depreciation and amortization due to the strengthening ofthe Canadian dollar against the U.S. dollar.
Selling, General and Administrative ("SG&A")
SG&A expense as a percentage of sales was 5.6% for 2010, compared to 7.3% for 2009. The unusual items discussed in the "UnusualItems" section negatively impacted SG&A as a percentage of total sales by 0.1% in 2009. Excluding these unusual items, SG&A asa percentage of total sales decreased 1.6%.
SG&A expense increased $79 million to $1.34 billion for 2010 compared to $1.26 billion for 2009. Excluding the unusual itemsrecorded in 2010 and 2009 (as discussed in the "Unusual Items" section), SG&A expenses increased by $101 million primarily as aresult of:
• higher incentive compensation;• a $20 million stock-based compensation charge as a result of modifying option agreements with three departing executives and
a related $9 million contract termination payment;• higher stock-based compensation;• a $9 million favourable revaluation of our investment in ABCP in 2009;• an increase in reported U.S. dollar SG&A due to the strengthening of the Canadian dollar against the U.S. dollar; and• higher costs to support the increased sales level.
These factors were partially offset by:
• a $32 million recovery, during 2010, of receivables that were fully provided for in 2009;• lower restructuring and downsizing costs;• due diligence costs incurred in 2009 associated with our planned investment in Opel, which terminated during 2009;• loss on disposal of assets in 2009;• net gain on disposal of assets; and• the closure or disposition of certain facilities during or subsequent to 2009.

Magna International Inc. 2010 Annual Report – MD&A21
Impairment Charges
Impairment charges decreased $160 million to $23 million for 2010 compared to $183 million for 2009 as discussed in the "UnusualItems" section.
Earnings before Interest and Taxes ("EBIT") (1)
External Sales EBIT2010 2009 Change 2010 2009 Change
North America $ 12,597 $ 8,140 $ 4,457 $ 1,085 $ (72) $ 1,157Europe 10,327 8,461 1,866 102 (394) 496Rest of World 1,097 735 362 92 43 49E-Car Systems 18 12 6 (89) (41) (48)Corporate and Other 63 19 44 (3) (40) 37Total $ 24,102 $ 17,367 $ 6,735 $ 1,187 $ (504) $ 1,691
Included in EBIT for years ended December 31, 2010 and 2009 were the following unusual items, which have been discussed in the"Unusual Items" section above.
2010 2009
North AmericaImpairment charges $ (7) $ (113)Restructuring charges (32) (6)Curtailment gain – 26
(39) (93)Europe
Impairment charges (16) (70)Restructuring charges – (20)Sale of facility – (8)
(16) (98)Rest of World
Sale of facility 14 –$ (41) $ (191)
North America
EBIT in North America increased $1.2 billion to $1.1 billion for 2010 compared to a loss of $0.1 billion for 2009. Excluding the NorthAmerican unusual items discussed in the "Unusual Items" section, the $1.1 billion increase in EBIT was substantially due to increasedmargins earned on higher sales as a result of higher vehicle production volumes. In addition, EBIT was positively impacted by:
• lower restructuring and downsizing costs and the benefit of prior year restructuring and downsizing activities;• productivity and efficiency improvements at certain facilities;• lower warranty costs;• the launch of new facilities;• a $6 million recovery, during 2010, of receivables that were fully provided for in 2009; and• a gain on sale of an investment.
These factors were partially offset by:
• higher costs incurred related to launches;• higher affiliation fees paid to Corporate;• higher incentive compensation;• employee profit sharing, as no profit sharing was recorded in 2009;• increased commodity costs;• operational inefficiencies and other costs at certain facilities; and• net customer price concessions subsequent to 2009.
(1) EBIT is defined as income (loss) from operations before income taxes and minority interest as presented on our auditedconsolidated financial statements before net interest (income) expense.
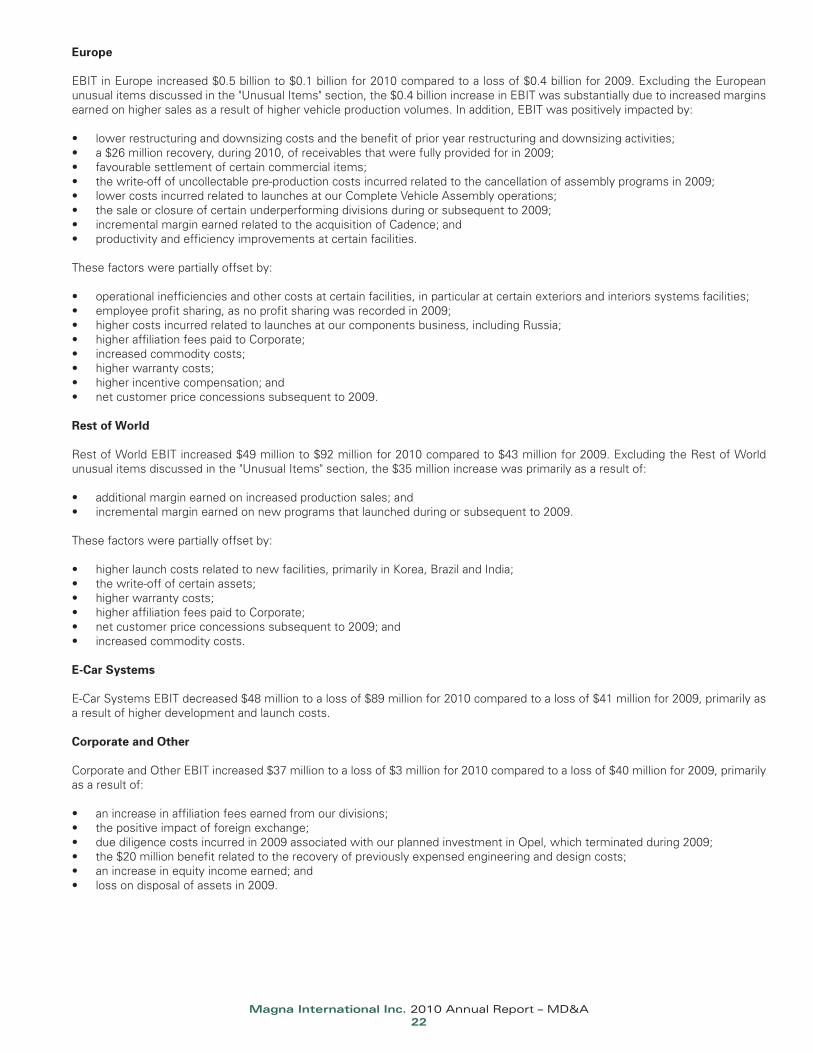
Magna International Inc. 2010 Annual Report – MD&A22
Europe
EBIT in Europe increased $0.5 billion to $0.1 billion for 2010 compared to a loss of $0.4 billion for 2009. Excluding the Europeanunusual items discussed in the "Unusual Items" section, the $0.4 billion increase in EBIT was substantially due to increased marginsearned on higher sales as a result of higher vehicle production volumes. In addition, EBIT was positively impacted by:
• lower restructuring and downsizing costs and the benefit of prior year restructuring and downsizing activities;• a $26 million recovery, during 2010, of receivables that were fully provided for in 2009;• favourable settlement of certain commercial items;• the write-off of uncollectable pre-production costs incurred related to the cancellation of assembly programs in 2009;• lower costs incurred related to launches at our Complete Vehicle Assembly operations;• the sale or closure of certain underperforming divisions during or subsequent to 2009;• incremental margin earned related to the acquisition of Cadence; and• productivity and efficiency improvements at certain facilities.
These factors were partially offset by:
• operational inefficiencies and other costs at certain facilities, in particular at certain exteriors and interiors systems facilities;• employee profit sharing, as no profit sharing was recorded in 2009;• higher costs incurred related to launches at our components business, including Russia;• higher affiliation fees paid to Corporate;• increased commodity costs;• higher warranty costs;• higher incentive compensation; and• net customer price concessions subsequent to 2009.
Rest of World
Rest of World EBIT increased $49 million to $92 million for 2010 compared to $43 million for 2009. Excluding the Rest of Worldunusual items discussed in the "Unusual Items" section, the $35 million increase was primarily as a result of:
• additional margin earned on increased production sales; and• incremental margin earned on new programs that launched during or subsequent to 2009.
These factors were partially offset by:
• higher launch costs related to new facilities, primarily in Korea, Brazil and India;• the write-off of certain assets;• higher warranty costs;• higher affiliation fees paid to Corporate;• net customer price concessions subsequent to 2009; and• increased commodity costs.
E-Car Systems
E-Car Systems EBIT decreased $48 million to a loss of $89 million for 2010 compared to a loss of $41 million for 2009, primarily asa result of higher development and launch costs.
Corporate and Other
Corporate and Other EBIT increased $37 million to a loss of $3 million for 2010 compared to a loss of $40 million for 2009, primarilyas a result of:
• an increase in affiliation fees earned from our divisions;• the positive impact of foreign exchange;• due diligence costs incurred in 2009 associated with our planned investment in Opel, which terminated during 2009;• the $20 million benefit related to the recovery of previously expensed engineering and design costs;• an increase in equity income earned; and• loss on disposal of assets in 2009.

Magna International Inc. 2010 Annual Report – MD&A23
These factors were partially offset by:
• higher incentive compensation;• a $20 million stock-based compensation charge as a result of modifying option agreements with three departing executives and
a related $9 million contract termination payment;• higher stock-based compensation;• a $9 million favourable revaluation of our investment in ABCP in 2009; and• loss on disposal of assets.
Interest (Income) Expense, net
During 2010, we recorded net interest income of $10 million compared to $7 million of net interest expense for 2009. The $17 millionincrease in net interest income is as a result of:
• a reduction in interest expense due to the repayment of our 7.08% Subordinated Debentures and our 6.5% ConvertibleSubordinated Debentures during 2009;
• an increase in interest income earned.
Operating Income
Operating income increased $1.7 billion to income of $1.2 billion for 2010 compared to a loss of $0.5 billion for 2009. Excluding theunusual items discussed in the "Unusual items" section, operating income for 2010 increased $1.6 billion. The increase in operatingincome is the result of the increases in EBIT (excluding unusual items) and net interest income, both as discussed above.
Income Taxes
Our effective income tax rate on operating income (excluding equity income) was 20.3% for 2010 compared to a recovery of 3.5%for 2009. In 2010 and 2009, income tax rates were impacted by the items discussed in the unusual items section. Excluding theunusual items, our effective income tax rate was 20.2% for 2010 compared to a recovery of 6.7% for 2009. Our income tax rate for2010 reflected more traditional rates as a result of our return to profitability in most jurisdictions. In addition, our effective income taxrate for 2010 was favourably impacted by the utilization of losses previously not benefited, mainly in the United States.
Minority Interest
During 2010, we recorded $12 million of minority interest recovery with respect to the loss incurred by our E-Car Systems partnership.
Net Income
Net income increased $1.5 billion to $1.0 billion for 2010 compared to a loss of $0.5 billion for 2009. Excluding the unusual itemsdiscussed in the "Unusual items" section, net income increased $1.3 billion. The increase in net income is the result of the increasein operating income and minority interest recovery partially offset by higher income taxes, as discussed above.
Earnings (Loss) per Share (restated)
2010 2009 Change
Earnings (loss) per Common Share or Class B ShareBasic $ 4.23 $ (2.21) $ 6.44Diluted $ 4.18 $ (2.21) $ 6.39
Average number of Common Shares and Class B Sharesoutstanding (millions)
Basic 230.0 223.6 + 3%Diluted 233.0 223.6 + 4%
Diluted earnings per share increased $6.39 to $4.18 for 2010 compared to a loss of $2.21 for 2009. Excluding the unusual itemsdiscussed in the "Unusual items" section, diluted earnings per share increased $5.66 from 2009 as a result of the increase in netincome (excluding unusual items), described above, partially offset by an increase in the weighted average number of diluted sharesoutstanding during the year.
The increase in the weighted average number of diluted shares outstanding was primarily due to the net issue of shares during 2010related to the Arrangement and an increase in the number of diluted shares associated with stock options and restricted stock partiallyoffset by the effect of the repurchase and cancellation of Common Shares in 2010 pursuant to our normal course issuer bid.

Magna International Inc. 2010 Annual Report – MD&A24
FINANCIAL CONDITION, LIQUIDITY AND CAPITAL RESOURCES
Cash Flow from Operations
2010 2009 Change
Net income (loss) $ 973 $ (493)Items not involving current cash flows 722 1,114
1,695 621 $ 1,074Changes in non-cash operating assets and liabilities 177 (94)Cash provided from operating activities $ 1,872 $ 527 $ 1,345
Cash flow from operations before changes in non-cash operating assets and liabilities increased $1.1 billion to $1.7 billion for 2010compared to $0.6 billion for 2009. The increase in cash flow from operations was due to a $1.5 billion increase in net income, asdiscussed above, partially offset by a $0.4 billion decrease in items not involving current cash flows. Items not involving current cashflows are comprised of the following:
2010 2009 Change
Depreciation and amortization $ 661 $ 737 $ (76)Amortization of other assets included in cost of goods sold 69 83 (14)Long-lived asset impairments 23 183 (160)Amortization of employee wage buydown 19 27 (8)Other non-cash charges 7 61 (54)Future income taxes and non-cash portion of current taxes (12) 56 (68)Minority interest (12) – (12)Equity income (33) (7) (26)Curtailment gain – (26) 26Items not involving current cash flows $ 722 $ 1,114 $ (392)
The decrease in items not involving current cash flows was primarily as a result of a $160 million decrease in long-lived assetimpairments (as discussed above), a $76 million decrease in depreciation and amortization (as discussed above), a $68 million decreasein future income taxes and non-cash portion of current taxes and a $54 million decrease in other non-cash charges. The decrease inother non-cash charges includes both the previously discussed settlement of commercial items and the sale of facilities.
Cash provided from non-cash operating assets and liabilities amounted to $177 million for 2010 compared to cash invested of $94 millionfor 2009. The change in non-cash operating assets and liabilities is comprised of the following sources (and uses) of cash:
2010 2009
Accounts receivable $ (611) $ (40)Inventories (178) 17Prepaid expenses and other (10) 6Accounts payable 579 241Accrued salaries and wages 97 (92)Other accrued liabilities 83 (108)Income taxes payable 221 (104)Deferred revenue (4) (14)Changes in non-cash operating assets and liabilities $ 177 $ (94)
The increases in accounts receivable, inventories and accounts payable in 2010 was primarily due to the increase in productionactivities at the end of 2010 compared to the end of 2009, including the launch of new programs which includes complete vehicleassembly of the Peugeot RCZ in the fourth quarter of 2009 and the Aston Martin Rapide in the first quarter of 2010. The increase inincome taxes payable was primarily due to a higher income tax provision, resulting from increased earnings, offset by current yeartax payments and receipt of tax refunds for prior years.

Magna International Inc. 2010 Annual Report – MD&A25
Capital and Investment Spending
2010 2009 Change
Fixed asset additions $ (784) $ (629)Investments and other assets (141) (227)Fixed assets, investments and other assets additions (925) (856)Purchase of subsidiaries (106) (50)Proceeds from disposition 287 30Cash used for investing activities $ (744) $ (876) $ 132
Fixed and other assets additions
In 2010, we invested $784 million in fixed assets. While investments were made to refurbish or replace assets consumed in thenormal course of business and for productivity improvements, a large portion of the investment in 2010 was for manufacturingequipment for programs that will be launching subsequent to 2010. Consistent with our strategy to expand in developing markets,approximately 19% (2009 - 18%) of this investment was in Russia, China, Brazil and India.
In 2010, we invested $137 million in other assets related primarily to fully reimbursable tooling costs and planning and engineeringcosts for programs that will be launching subsequent to 2010. The tooling costs were incurred primarily at our body & chassis systemsoperations in North America.
Purchase of subsidiaries
During 2010, we invested $106 million to purchase subsidiaries, including the acquisition of:
• Resil Minas, a supplier of seat frames and stampings. The acquired business is primarily located in Brazil with sales to variouscustomers, including Fiat, Ford, General Motors, Volkswagen, IVECO and PSA;
• Pabsa S.A., a supplier of complete seats, foam products, trim covers and seat structures. The acquired business has threeproduction facilities in Argentina; and
• Erhard & Söhne GmbH, a manufacturer of fuel tanks for commercial vehicles and other specialty tanks. The acquired businessis located in Germany and has sales to various customers including MAN, Daimler and Scania.
During 2009, we invested $50 million to purchase subsidiaries, including the acquisition of:
• Cadence, a manufacturer of exterior and interior systems. The acquired business is primarily located in the Czech Republic withsales to various customers, including Skoda; and
• several facilities from Meridian. The facilities are located in the United States and Mexico and manufacture composites forvarious customers.
Proceeds from disposition
Proceeds from disposition in 2010 were $287 million which included:
• normal course reimbursement received in respect of planning and engineering costs that were capitalized in prior periods;• normal course fixed and other asset disposals;• a cash payment received on the sale of a long-term receivable related to fully reimbursable capitalized pre-production costs;• the cash proceeds received on the sale of an electronics facility;• a cash payment received on the sale of a long-term engineering receivable;• gain on sale of investment; and• a cash payment received with respect to our investment in ABCP.

Magna International Inc. 2010 Annual Report – MD&A26
Financing
2010 2009 Change
Decrease in bank indebtedness $ (4) $ (853)Repayments of debt (67) (296)Issues of debt 22 5Repurchase of Class B Shares (300) –Repurchase of Common Shares (23) –Issue of general partnership units by subsidiary 80 –Issues of Common Shares 49 2Settlement of stock options (12) –Settlement of stock appreciation rights – (1)Cash dividends paid (100) (21)Cash used for financing activities $ (355) $ (1,164) $ 809
During 2010, we repaid $64 million of debt assumed on the acquisition of Cadence.
In connection with the Arrangement, during 2010, we paid $300 million in cash in connection with the purchase for cancellation ofall 1,453,658 (restated to reflect the stock split) outstanding Class B Shares. In addition, the Stronach group invested $80 million inE-Car.
Due to continuing strong operating and cash flow performance, on February 23, 2011 our Board declared a dividend of U.S. $0.25per share in respect of the fourth quarter of 2010, representing an increase of 39% over the third quarter of 2010 dividend and thethird consecutive dividend increase since the reintroduction of the dividend in the first quarter of 2010.
Financing Resources
As at As atDecember 31, December 31,
2010 2009 Change
LiabilitiesBank indebtedness $ 26 $ 48Long-term debt due within one year 25 16Long-term debt 46 115
97 179Minority interest 74 –Shareholders' equity 8,065 7,360Total capitalization $ 8,236 $ 7,539 $ 697
Total capitalization increased by $0.7 billion to $8.2 billion at December 31, 2010 compared to $7.5 billion at December 31, 2009. Theincrease in capitalization was a result of a $0.7 billion increase in shareholders' equity and a $0.1 billion increase in minority interestpartially offset by a $0.1 billion decrease in liabilities.
The increase in shareholders' equity was primarily as a result of:
• net income earned during 2010;• net unrealized gains on cash flow hedges, and the reclassification of net gains on cash flow hedges from accumulated other
comprehensive income to net income;• Common Shares issued on the exercise of stock options; and• an increase in contributed surplus related to stock-based compensation expense.
These factors were partially offset by:
• the repurchase of Class B Shares in connection with the Arrangement;• dividends paid during 2010; and• the purchase for cancellation of Common Shares in connection with our normal course issuer bid.
The increase in minority interest was as a result of the formation of E-Car.
The decrease in liabilities is primarily as a result of the repayment in 2010 of debt assumed on the acquisition of Cadence.

Magna International Inc. 2010 Annual Report – MD&A27
Cash Resources
During 2010, our cash resources increased by $0.8 billion to $2.1 billion primarily as a result of the cash provided from operatingactivities partially offset by cash used for investing activities and financing activities (including cash used for the Arrangement), asdiscussed above. In addition to our cash resources, we had term and operating lines of credit totalling $2.0 billion of which $1.9 billionwas unused and available.
Maximum Number of Shares Issuable
The following table presents the maximum number of shares that would be outstanding if all of the outstanding options at March 14,2011 were exercised:
Common Shares 242,771,789Stock options (i) 10,065,577
252,837,366
(i) Options to purchase Common Shares are exercisable by the holder in accordance with the vesting provisions and upon paymentof the exercise price as may be determined from time to time pursuant to our stock option plans.
On November 9, 2010, the Toronto Stock Exchange ("TSX") accepted our Notice of Intention to Make a Normal Course Issuer Bidrelating to the purchase of up to 8,000,000 Magna Common Shares (the "Bid"), representing 3.3% of our issued and outstandingCommon Shares. The Bid commenced on November 11, 2010 and will terminate no later than November 10, 2011. All purchases ofCommon Shares are made at the market price at the time of purchase in accordance with the rules and policies of the TSX. Purchasesmay also be made on the NYSE in compliance with Rule 10b-18 under the U.S. Securities Exchange Act of 1934.
Contractual Obligations and Off-Balance Sheet Financing
A purchase obligation is defined as an agreement to purchase goods or services that is enforceable and legally binding on us and thatspecifies all significant terms, including: fixed or minimum quantities to be purchased; fixed, minimum or variable price provisions;and the approximate timing of the transaction. Consistent with our customer obligations, substantially all of our purchases are madeunder purchase orders with our suppliers which are requirements based and accordingly do not specify minimum quantities. Otherlong-term liabilities are defined as long-term liabilities that are recorded on our consolidated balance sheet. Based on this definition,the following table includes only those contracts which include fixed or minimum obligations.
At December 31, 2010, we had contractual obligations requiring annual payments as follows:
2011 2012-2013 2014-2015 Thereafter Total
Operating leases with:MI Developments Inc. ("MID") $ 172 $ 339 $ 316 $ 452 $ 1,279Third parties 123 179 105 79 486
Long-term debt 25 17 10 19 71Unconditional Purchase Obligations:
Materials and Services 2,243 129 41 13 2,426Capital 283 60 – – 343
Total contractual obligations $ 2,846 $ 724 $ 472 $ 563 $ 4,605
Our unfunded obligations with respect to employee future benefit plans, which have been actuarially determined, were $306 millionat December 31, 2010. These obligations are as follows:
Termination andPension Retirement Long ServiceLiability Liability Arrangements Total
Projected benefit obligation $ 332 $ 43 $ 243 $ 618Less plan assets (253) – – (253)Unfunded amount 79 43 243 365Unrecognized past service costs and actuarial gains (losses) (40) 22 (41) (59)Amount recognized in other long-term liabilities $ 39 $ 65 $ 202 $ 306
Our off-balance sheet financing arrangements are limited to operating lease contracts.

Magna International Inc. 2010 Annual Report – MD&A28
The majority of our facilities are subject to operating leases with MID or with third parties. Operating lease payments in 2010 forfacilities leased from MID and third parties were $172 million and $132 million, respectively. Operating lease commitments in 2011for facilities leased from MID and third parties are expected to be $172 million and $123 million, respectively. Our existing leases withMID generally provide for periodic rent escalations based either on fixed-rate step increases, or on the basis of a consumer price indexadjustment (subject to certain caps).
We also have operating lease commitments for equipment. These leases are generally of shorter duration. Operating lease paymentsfor equipment were $46 million for 2010, and are expected to be $40 million in 2011.
Although our consolidated contractual annual lease commitments decline year by year, we expect that existing leases will either berenewed or replaced, or alternatively, we will incur capital expenditures to acquire equivalent capacity.
Foreign Currency Activities
Our North American operations negotiate sales contracts with OEMs for payment in both U.S. and Canadian dollars. Materials andequipment are purchased in various currencies depending upon competitive factors, including relative currency values. The NorthAmerican operations use labour and materials which are paid for in both U.S. and Canadian dollars. Our Mexican operations generallyuse the U.S. dollar as the functional currency.
Our European operations negotiate sales contracts with OEMs for payment principally in euros and British pounds. The Europeanoperations' material, equipment and labour are paid for principally in euros and British pounds.
We employ hedging programs, primarily through the use of foreign exchange forward contracts, in an effort to manage our foreignexchange exposure, which arises when manufacturing facilities have committed to the delivery of products for which the sellingprice has been quoted in foreign currencies. These commitments represent our contractual obligations to deliver products over theduration of the product programs, which can last a number of years. The amount and timing of the forward contracts will be dependentupon a number of factors, including anticipated production delivery schedules and anticipated production costs, which may be paidin the foreign currency. In addition, we enter into foreign exchange contracts to manage foreign exchange exposure with respect tointernal funding arrangements. Despite these measures, significant long-term fluctuations in relative currency values, in particular asignificant change in the relative values of the U.S. dollar, Canadian dollar, euro or British pound, could have an adverse effect on ourprofitability and financial condition (as discussed throughout this MD&A).
RELATED PARTIES
Mr. Frank Stronach, together with three other members of the Stronach family, are trustees and members of the class of potentialbeneficiaries of the Stronach Trust. Prior to the completion of the Arrangement, the Stronach Trust indirectly controlled Magna throughthe right to direct the votes attaching to 100% of Magna's Class B Shares. In addition, the Stronach Trust controls MID and controlledMagna Entertainment Corp. ("MEC") prior to its bankruptcy, through the right to direct the votes attaching to approximately 66% ofMID's Class B Shares. In the normal course of business, Magna leases various land and buildings from MID under operating leaseagreements, which are effected on normal commercial terms. The leases are measured at the exchange amount, which is the amountof consideration established and agreed to by the related parties. Lease expense related to MID for 2010 was $172 million (2009 -$149 million). Included in accounts payable are trade amounts owing to MID and its subsidiaries of $1.6 million (2009 - $0.5 million).Included in accounts receivable are amounts owed from MEC of $nil (2009 - $1.1 million).
We have agreements with affiliates of the Chairman of the Board for the provision of business development and consulting services.In addition, we have an agreement with the Chairman of the Board for the provision of business development and other services.The cost of these agreements is measured at the exchange amount. In addition, the Arrangement set a termination date and decliningfee schedule for the consulting, business development and business services contracts. The aggregate amount expensed underthese agreements with respect to the year ended December 31, 2010 was $41 million (2009 - $nil).
During 2010, we sold an office building located in Vienna, Austria to our former Co-Chief Executive Officer for $11.5 million (€8.4million).
During 2009, we purchased approximately 100 acres of real estate located in Oberwaltersdorf, Austria from MEC for $6.0 million (€4.6million).
During 2008, we purchased 225 acres of real estate located in Austria from MEC for $29 million (€20 million).
These transactions were reviewed by the Corporate Governance and Compensation Committee and approved by the independentmembers of Magna's Board of Directors following the unanimous recommendation of the Corporate Governance and CompensationCommittee.
During the year ended December 31, 2010, trusts, which exist to make orderly purchases of our shares for employees either fortransfer to the Employee Equity and Profit Participation Program or to recipients of either bonuses or rights to purchase such sharesfrom the trusts, borrowed up to $31 million (2009 - $30 million) from us to facilitate the purchase of Common Shares. At December 31,2010, the trusts' indebtedness to Magna was $31 million (2009 - $19 million).

Magna International Inc. 2010 Annual Report – MD&A29
CRITICAL ACCOUNTING POLICIES
Our discussion and analysis of our results of operations and financial position is based upon our 2010 audited consolidated financialstatements, which have been prepared in accordance with Canadian GAAP. The preparation of the audited consolidated financialstatements requires management to make estimates and judgments that affect the reported amounts of assets, liabilities, revenuesand expenses, and the related disclosure of contingent assets and liabilities. We base our estimates on historical experience andvarious other assumptions that we believe to be reasonable in the circumstances, the results of which form the basis for makingjudgments about the carrying value of assets and liabilities. We evaluate our estimates on an ongoing basis, however, actual resultsmay differ from these estimates under different assumptions or conditions.
We believe the following critical accounting policies affect the more significant judgments and estimates used in the preparation ofour audited consolidated financial statements. Management has discussed the development and selection of the following criticalaccounting policies with the Audit Committee of the Board of Directors and the Audit Committee has reviewed our disclosure relatingto critical accounting policies in this MD&A.
Revenue Recognition
[a] Separately Priced Tooling and Engineering Service Contracts
With respect to our contracts with OEMs for particular vehicle programs, we perform multiple revenue-generating activities.The most common arrangement is where, in addition to contracting for the production and sale of parts, we also have a separatelypriced contract with the OEM for related tooling. Under these arrangements, we either construct the tools at our in-house toolshops or contract with third party tooling vendors to construct and supply tooling to be used by us in the production of parts forthe OEM. On completion of the tooling build, and upon acceptance of the tooling by the OEM, we sell the separately pricedtooling to the OEM pursuant to a separate tooling purchase order.
In certain cases, such multiple element arrangements also include providing separately priced engineering services in additionto tooling and subsequent assembly or production activities. On completion, and upon acceptance by the OEM, we generallysell the separately priced engineering services to the OEM prior to the commencement of subsequent assembly or productionactivities.
During 2004, we adopted CICA Emerging Issues Committee Abstract No. 142, "Revenue Arrangements with MultipleDeliverables" ("EIC-142") prospectively for new revenue arrangements with multiple deliverables entered into by us on or afterJanuary 1, 2004. Under EIC-142, separately priced tooling and engineering services are accounted for as a separate revenueelement only in circumstances where the tooling and engineering has value to the customer on a standalone basis and there isobjective and reliable evidence of the fair value of the subsequent parts production or vehicle assembly. Based on the typicalterms and process for the negotiation of separately priced tooling contracts, substantially all such tooling contracts are accountedfor as separate revenue elements. However, because of the unique contracts related to multiple element arrangements involvingengineering and subsequent assembly or production activities, all significant arrangements are evaluated in order to determinewhether the engineering component of the arrangement qualifies as a separate revenue element. If the engineering componentis not considered to be a separate revenue element, revenues and costs of sales on such activities are deferred and amortizedon a gross basis over the subsequent assembly or production program.
Revenues from significant engineering services and tooling contracts that qualify as separate revenue elements are recognizedon a percentage of completion basis. The percentage of completion method recognizes revenue and cost of sales over the termof the contract based on estimates of the state of completion, total contract revenue and total contract costs. Under suchcontracts, the related receivables could be paid in full upon completion of the contract, in instalments or in fixed amounts pervehicle based on forecasted production volumes. In the event that actual production volumes are less than those forecasted, areimbursement for any shortfall will be made either annually or at the end of the program life.
Tooling and engineering contract prices are generally fixed; however, price changes, change orders and program cancellationsmay affect the ultimate amount of revenue recorded with respect to a contract. Contract costs are estimated at the time ofsigning the contract and are reviewed at each reporting date. Adjustments to the original estimates of total contract costs areoften required as work progresses under the contract and as experience is gained, even though the scope of the work underthe contract may not change. When the current estimates of total contract revenue and total contract costs indicate a loss, aprovision for the entire loss on the contract is made. Factors that are considered in arriving at the forecasted loss on a contractinclude, amongst others, cost over-runs, non-reimbursable costs, change orders and potential price changes.
For U.S. GAAP purposes, we adopted EITF 00-21, "Accounting for Revenue Arrangements With Multiple Deliverables"prospectively for new revenue arrangements with multiple deliverables entered into by us on or after January 1, 2004, whichharmonized our Canadian and U.S. GAAP reporting for such arrangements. For separately priced in-house tooling and engineeringservices contracts provided in conjunction with subsequent production or assembly services entered into prior to January 1,2004, the revenues and costs of sales on such activities continue to be deferred and amortized on a gross basis over theremaining life of the production or assembly program for U.S. GAAP purposes.


Magna International Inc. 2010 Annual Report – MD&A31
Product liability provisions are established based on our best estimate of the amounts necessary to settle existing claims on productdefault issues. Recall costs are costs incurred when government regulators and/or our customers decide to recall a product due toa known or suspected performance issue, and we are required to participate either voluntarily or involuntarily. Costs typically includethe cost of the product being replaced, the customer's cost of the recall and labour to remove and replace the defective part. Whena decision to recall a product has been made or is probable, our estimated cost of the recall is recorded as a charge to income in thatperiod. In making this estimate, judgment is required as to the number of units that may be returned as a result of the recall, the totalcost of the recall campaign, the ultimate negotiated sharing of the cost between us, the customer and, in some cases a supplier.
Future Income Tax Assets
At December 31, 2010 we had recorded future tax assets (net of related valuation allowances) in respect of loss carryforwards andother deductible temporary differences of $42 million and $108 million, respectively. The future tax assets in respect of losscarryforwards relate primarily to Mexican and Canadian subsidiaries.
On a quarterly basis, we evaluate the realizability of future tax assets by assessing our valuation allowance and by adjusting theamount of such allowance as necessary. We have, and we continue to use tax planning strategies to realize future tax assets in orderto avoid the potential loss of benefits.
Accounting standards require that we assess whether valuation allowances should be established against our future income taxassets based on consideration of all available evidence using a "more likely than not" standard. The factors we use to assess thelikelihood of realization are our history of losses, our forecasts of future taxable income and tax planning strategies that could beimplemented to realize the future tax assets.
At December 31, 2010, we had gross income tax loss carryforwards of approximately $1.5 billion, which relate primarily to operationsin the United States, the United Kingdom, Belgium, Germany, Austria, Spain and China. The tax benefits of these losses have notbeen recognized in our consolidated financial statements. Of the total losses, $734 million expire between 2011 and 2030 while theremainder have no expiry date.
Given our improved financial results in the United States in 2010 and assuming that the overall economic conditions continue toimprove in that jurisdiction in 2011, the Company expects to reverse a portion of its valuation allowance against its future tax assetsin the United States during 2011. The reversal, if any, will not affect our consolidated cash flows, as our tax payments continue tobenefit from the utilization of loss carryforwards.
Employee Benefit Plans
The determination of the obligation and expense for defined benefit pension, termination and long service arrangements and otherpost retirement benefits, such as retiree healthcare and medical benefits, is dependent on the selection of certain assumptions usedby actuaries in calculating such amounts. Those assumptions include, among others, the discount rate, expected long-term rate ofreturn on plan assets and rates of increase in compensation costs. Actual results that differ from the assumptions used areaccumulated and amortized over future periods and therefore, impact the recognized expense and recorded obligation in futureperiods. Significant changes in assumptions or significant plan amendments could materially affect our future employee benefitobligations and future expense.
During the second quarter of 2009, we amended our Retiree Premium Reimbursement Plan in Canada and the United States, suchthat most employees retiring on or after August 1, 2009 will no longer participate in the plan. The amendment will reduce servicecosts and retirement medical benefit expense in 2009 and future years. As a result of amending the plan, a curtailment gain of $26 millionwas recorded in cost of goods sold in the second quarter of 2009.
At December 31, 2010, we had unrecognized past service costs and actuarial experience losses of $59 million that will be amortizedto future employee benefit expense over the expected average remaining service life of employees.
FUTURE CHANGES IN ACCOUNTING POLICIES
Adoption of United States Generally Accepted Accounting Principles
In February 2008, the Canadian Accounting Standards Board confirmed the transition from Canadian GAAP to International FinancialReporting Standards ("IFRS") for all publicly accountable entities no later than fiscal years commencing on or after January 1, 2011.As a result, we undertook a detailed review of the implications of having to report under IFRS and also examined the alternativeavailable to us, as a Foreign Private Issuer in the United States, of filing its primary financial statements in Canada using U.S. GAAP,as permitted by the Canadian Securities Administrators' National Instrument 51-102, "Continuous Disclosure Obligations".
In carrying out this evaluation, we considered many factors, including, but not limited to (i) the changes in accounting policies thatwould be required and the resulting impact on our reported results and key performance indicators, (ii) the reporting standardsexpected to be used by many of our industry comparables, and (iii) the financial reporting needs of our market participants, includingshareholders, lenders, rating agencies and market analysts.

As a result of this analysis, we have determined that we will adopt U.S. GAAP as our primary basis of financial reporting with our firstreporting period beginning after January 1, 2011 on a retrospective basis. The adoption of U.S. GAAP is not anticipated to have amaterial change on our accounting policies or financial results, except for the reporting differences disclosed in note 28 of our 2010consolidated financial statements.
Multiple-Deliverable Revenue Arrangements
In October 2009, the FASB issued Accounting Standards Update ("ASU") 2009-13, "Revenue Recognition (Topic 605) - Multiple-Deliverable Revenue Arrangements". This ASU eliminates the requirement that undelivered elements must have objective and reliableevidence of fair value before a company can recognize the portion of the consideration that is attributable to items that already havebeen delivered. This may allow some companies to recognize revenue on transactions that involve multiple-deliverables earlier thanunder the current requirements. For us, this ASU is effective for revenue arrangements entered into or materially modified on or afterJanuary 1, 2011. This change is not expected to have any material impact on the consolidated financial statements.
Other
In October 2008, the CICA issued Handbook Sections 1582, "Business Combinations" ("CICA 1582"), 1601 "Consolidated FinancialStatements" ("CICA 1601"), and 1602 "Non-controlling Interests" ("CICA 1602"). CICA 1582 establishes standards for the measurementof a business combination and the recognition and measurement of assets acquired and liabilities assumed, CICA 1601 carriesforward the existing Canadian guidance on aspects of the preparation of consolidated financial statements subsequent to acquisitionother than non-controlling interests, and CICA 1602 establishes guidance for the treatment of non-controlling interests subsequentto acquisition through a business combination. These new standards would be effective for us in the first quarter of 2011 with earlieradoption permitted. As at December 31, 2010, these new standards have not been adopted by us.
COMMITMENTS AND CONTINGENCIES
From time to time, we may be contingently liable for litigation and other claims.
Refer to note 26 of our 2010 audited consolidated financial statements, which describes these claims.
For a discussion of risk factors relating to legal and other claims against us, refer to "Item 3. Description of the Business - Risk Factors"in our Annual Information Form and Annual Report on Form 40-F, each in respect of the year ended December 31, 2010.
CONTROLS AND PROCEDURES
Disclosure Controls and Procedures
Disclosure controls and procedures are designed to provide reasonable, but not absolute, assurance that material information requiredto be publicly disclosed by a public company is communicated in a timely manner to senior management to enable them to maketimely decisions regarding public disclosure of such information. We have conducted an evaluation of our disclosure controls andprocedures as of December 31, 2010 under the supervision, and with the participation of, our Chief Executive Officer and our ChiefFinancial Officer. Based on this evaluation, our Chief Executive Officer and our Chief Financial Officer have concluded that ourdisclosure controls and procedures (as this term is defined in the rules adopted by Canadian securities regulatory authorities and theUnited States Securities and Exchange Commission) are effective in providing reasonable assurance that material information relatingto Magna is made known to them and information required to be disclosed by us is recorded, processed, summarized and reportedwithin the time periods specified under applicable law.
Management's Annual Report on Internal Control over Financial Reporting
Internal control over financial reporting is a process designed to provide reasonable, but not absolute, assurance regarding the reliabilityof financial reporting and preparation of financial statements for external purposes in accordance with generally accepted accountingprinciples. Our management is responsible for establishing and maintaining adequate internal control over financial reporting. Due toits inherent limitations, internal control over financial reporting may not prevent or detect misstatements on a timely basis. Additionally,projections of any evaluation of the effectiveness of internal control over financial reporting to future periods are subject to the riskthat the controls may become inadequate because of changes in conditions, or that the degree of compliance with the policies orprocedures may deteriorate. Our management used the Committee of Sponsoring Organizations of the Treadway Commission(COSO) framework to evaluate the effectiveness of internal control over financial reporting. Our Chief Executive Officer and our ChiefFinancial Officer have assessed the effectiveness of our internal control over financial reporting and concluded that, as at December 31,2010, such internal control over financial reporting is effective and that there were no material weaknesses. Our independent auditor,Ernst & Young LLP, has also issued a report on our consolidated financial statements and internal controls. This report precedes ouraudited consolidated financial statements for the year ended December 31, 2010.
Changes in Internal Controls over Financial Reporting
There have been no changes in our internal controls over financial reporting that occurred during 2010 that have materially affected,or are reasonably likely to materially affect, our internal control over financial reporting.
Magna International Inc. 2010 Annual Report – MD&A32

Magna International Inc. 2010 Annual Report – MD&A33
SELECTED ANNUAL CONSOLIDATED FINANCIAL DATA
The following selected consolidated financial data has been derived from, and should be read in conjunction with the accompanyingaudited consolidated financial statements for the year ended December 31, 2010.
2010 2009 2008
Income Statement Data
Vehicle Production Volumes (millions of units)North America 11.954 8.621 12.622Europe 13.304 11.835 14.596
Average Dollar Content Per VehicleNorth America $ 988 $ 872 $ 867Europe $ 536 $ 495 $ 486
SalesExternal Production
North America $ 11,816 $ 7,515 $ 10,938Europe 7,136 5,857 7,089Rest of World 1,031 676 515
Complete Vehicle Assembly 2,163 1,764 3,306Tooling, Engineering and Other 1,956 1,555 1,856
Total sales $ 24,102 $ 17,367 $ 23,704
Net income (loss) $ 973 $ (493) $ 71
Earnings (loss) per Common Share or Class B Share (restated)Basic $ 4.23 $ (2.21) $ 0.32Diluted $ 4.18 $ (2.21) $ 0.31
Cash dividends paid per Common Shareor Class B Share (restated) $ 0.42 $ 0.09 $ 0.63
Financial Position Data
Cash and cash equivalents $ 2,105 $ 1,334 $ 2,757Working capital $ 2,614 $ 2,004 $ 2,258Total assets $ 13,898 $ 12,303 $ 13,189
Financing ResourcesLiabilities
Bank indebtedness $ 26 $ 48 $ 909Long-term debt due within one year 25 16 157Long-term debt 46 115 143
97 179 1,209Minority interest 74 – –Shareholders' equity 8,065 7,360 7,363
Total capitalization $ 8,236 $ 7,539 $ 8,572
Changes from 2009 to 2010 are explained in "Results of Operations - For the Year Ended December 31, 2010" section above.

2009 COMPARED TO 2008
SALES
External Production Sales - North America
External production sales in North America decreased 31% or $3.4 billion to $7.5 billion for the year ended December 31, 2009compared to $10.9 billion for the year ended December 31, 2008. This decrease in production sales reflects a 32% decrease in NorthAmerican vehicle production volumes partially offset by a 1% increase in our North American average dollar content per vehicle.More importantly, during 2009 our largest customers in North America continued to reduce vehicle production volumes comparedto 2008. While North American vehicle production volumes declined 32% in 2009 compared to 2008, Chrysler and GM vehicleproduction declined 48% and 44%, respectively. On a positive note, Ford's vehicle production decline was only 16%.
Our average dollar content per vehicle grew by 1% or $5 to $872 for the year ended December 31, 2009 compared to $867 for theyear ended December 31, 2008, primarily as a result of:
• the launch of new programs during or subsequent to 2008, including the:• Ford F-Series and Lincoln Mark LT;• Chevrolet Traverse;• Chevrolet Equinox and GMC Terrain; and• Chevrolet Camaro;
• favourable production (relative to industry volumes) and/or increased content on certain programs, including the:• Ford Escape, Mercury Mariner and Mazda Tribute; and• Ford Fusion, Mercury Milan and Lincoln MKZ;
• acquisitions completed during or subsequent to 2008, including:• a substantial portion of Plastech Engineered Products Inc.'s exteriors business ("Plastech");• Meridian; and• a stamping and sub-assembly facility in Alabama from Ogihara America Corporation ("Ogihara"); and
• takeover business that launched during or subsequent to 2008.
These factors were partially offset by:
• unfavourable production (relative to industry volumes) and/or lower content on certain programs, including the:• Chevrolet Cobalt;• Dodge Grand Caravan, Chrysler Town & Country and Volkswagen Routan;• Chrysler 300 and 300C and Dodge Charger; and• Buick Enclave and GMC Acadia;
• programs that ended production during or subsequent to 2008, including the:• Saturn Vue, Aura and Outlook;• Chevrolet Trailblazer and GMC Envoy; and• Pontiac G5, G6, Solstice, Sky and GT;
• a decrease in reported U.S. dollar sales due to the weakening of the Canadian dollar against the U.S. dollar; and• customer price concessions during or subsequent to 2008.
External Production Sales - Europe
External production sales in Europe decreased 17% or $1.2 billion to $5.9 billion for the year ended December 31, 2009 comparedto $7.1 billion for the year ended December 31, 2008. This decrease in production sales reflects a 19% decrease in European vehicleproduction volumes partially offset by a 2% increase in our European average dollar content per vehicle.
Our average dollar content per vehicle increased by 2% or $9 to $495 for the year ended December 31, 2009 compared to $486 forthe year ended December 31, 2008, primarily as a result of:
• the launch of new programs during or subsequent to 2008, including the:• Audi Q5;• Volkswagen Golf;• Porsche Panamera;• Opel/Vauxhall Insignia;• BMW One/Cooper Convertible; and• Volkswagen A5 Cabrio and Sportback; and
• acquisitions completed during or subsequent to 2008, including Cadence.
Magna International Inc. 2010 Annual Report – MD&A34

Magna International Inc. 2010 Annual Report – MD&A35
These factors were partially offset by:
• unfavourable production (relative to industry volumes) and/or lower content on certain programs, including the:• Mercedes-Benz C-Class;• Porsche Cayenne and Volkswagen Touareg;• Volkswagen Transporter;• BMW X3;• Ford Transit;• Opel/Vauxhall Vivaro, Nissan Primastar and Renault Trafic;• Opel Astra;• Audi Q7; and• Honda Civic;
• a decrease in reported U.S. dollar sales due to the weakening of the euro and British pound, each against the U.S. dollar;• the sale of certain facilities during or subsequent to 2008; and• customer price concessions during or subsequent to 2008.
External Production Sales - Rest of World
External production sales in Rest of World increased 31% or $161 million to $676 million for the year ended December 31, 2009compared to $515 million for the year ended December 31, 2008, primarily as a result of:
• increased production and/or content on certain programs in China and Brazil;• the launch of new programs during or subsequent to 2008 in China and Japan; and• an increase in reported U.S. dollar sales as a result of the strengthening of the Chinese Renminbi against the U.S. dollar.
These factors were partially offset by:
• a decrease in reported U.S. dollar sales as a result of the weakening of the Brazilian real, Korean Won and South African Rand,each against the U.S. dollar; and
• decreased production and/or content on certain programs, particularly in South Africa.
Complete Vehicle Assembly Sales
Complete vehicle assembly sales decreased 47% or $1.5 billion to $1.8 billion for the year ended December 31, 2009 compared to$3.3 billion for the year ended December 31, 2008 while assembly volumes decreased 55% or 68,816 units. The decrease in completevehicle assembly volumes is due to a combination of general economic conditions as discussed previously; the natural decline involumes as certain models that we assembled in 2008 approach their scheduled end of production; and a decrease in reported U.S.dollar sales due to the weakening of the euro against the U.S. dollar. Partially offsetting these decreases was the launch in the fourthquarter of 2009 of the Peugeot RCZ.
Tooling, Engineering and Other
Tooling, engineering and other sales decreased 16% or $0.3 billion to $1.6 billion for the year ended December 31, 2009 comparedto $1.9 billion for the year ended December 31, 2008.
In the year ended December 31, 2009, the major programs for which we recorded tooling, engineering and other sales were the:
• MINI Cooper, Clubman and Crossman;• Chevrolet Silverado and GMC Sierra;• Porsche Panamera;• Opel/Vauxhall Astra;• Audi Q5;• BMW X3;• Porsche Boxster and Cayman;• Porsche Cayenne;• Mercedes-Benz M-Class;• Peugeot RCZ;• Cadillac SRX and Saab 9-4X;• Ford F-Series; and• Mercedes-Benz C-Class.

Unusual Items
During 2009 and 2008, we recorded certain unusual items as follows:
2009 2008Diluted Diluted
Operating Net Earnings Operating Net EarningsIncome Income per Share Income Income per Share
Impairment charges (1) $ (183) $ (181) $ (0.81) $ (283) $ (246) $ (1.08)Restructuring charges (1) (26) (26) (0.12) (84) (60) (0.26)Sale of facilities (8) (8) (0.04) – – –Curtailment gain 26 20 0.09 – – –Foreign currency gain – – – 116 116 0.51Valuation allowance on future tax assets (2) – – – – (123) (0.54)Total unusual items $ (191) $ (195) $ (0.88) $ (251) $ (313) $ (1.37)
The unusual items for 2009 have been discussed in the "Unusual Items" section above. During 2008, unusual items were as follows:
(1) Restructuring and Impairment Charges
Long-lived Assets
As a result of the significant and accelerated declines in vehicle production volumes, primarily in North America, we reviewedgoodwill and long-lived assets for impairment during the third quarter of 2008. Based on this analysis, during 2008 we recordedlong-lived asset impairment charges of $283 million related primarily to our powertrain, and interior and exterior systemsoperations in the United States and Canada.
At our powertrain operations, particularly at a facility in Syracuse, New York, asset impairment charges of $189 million wererecorded primarily as a result of: (i) a dramatic market shift away from truck programs, in particular four wheel drive pick-uptrucks and SUVs; (ii) excess die-casting, machining and assembly capacity; and (iii) historical losses that were projected tocontinue throughout our business planning period.
At our interiors and exteriors operations, we recorded $74 million of asset impairment charges primarily as a result of: (i) significantlylower volumes on certain pick-up truck and SUV programs; (ii) the loss of certain replacement business; (iii) capacity utilizationthat is not sufficient to support the existing overhead structure; and (iv) historical losses that were projected to continuethroughout our business planning period.
Additionally, in North America we recorded asset impairment charges of $12 million related to dedicated assets at a chassissystems facility in Canada and a seating systems facility in the United States. In Europe, we recorded an $8 million assetimpairment related to specific assets at an interior systems facility in the United Kingdom and specific assets at a powertrainsystems facility in Austria.
Restructuring Charges
During 2008, we recorded restructuring and rationalization costs in North America of $79 million in cost of goods sold and $5 millionin selling, general and administrative expense. These restructuring and rationalization costs were primarily recorded during thefourth quarter of 2008 and relate to: (i) the consolidation of interiors and exteriors operations in Canada and the United States;(ii) the closure of a seating systems facility in St. Louis, Missouri; (iii) the consolidation of closure systems operations in Canada;and (iv) the consolidation of our powertrain die casting operations in Canada and the United States.
(2) Income Taxes
During the third quarter of 2008, we recorded a $123 million charge to establish valuation allowances against all of our future taxassets in the United States.
The valuation allowances were required in the United States based on historical consolidated losses at our U.S. operations, thatwere expected to continue in the near-term, the accelerated deterioration of near-term automotive market conditions in theUnited States and the significant and inherent uncertainty as to the timing of when we would be able to generate the necessarylevel of earnings to recover these future tax assets.
Magna International Inc. 2010 Annual Report – MD&A36
Magna International Inc. 2010 Annual Report – MD&A37
Gross Margin
Gross margin decreased $1.0 billion to $1.7 billion for 2009 compared to $2.7 billion for 2008 while gross margin as a percentage oftotal sales decreased to 9.6% for 2009 compared to 11.5% for 2008. The unusual items discussed above negatively impacted grossmargin as a percentage of total sales in 2008 by 0.3%. Excluding unusual items, gross margin as a percentage of total sales decreasedby 2.2%. Gross margin as a percentage of total sales was negatively impacted by:
• lower gross margin earned due to the significant decline in vehicle production volumes;• downsizing and other restructuring activities that have not been included in unusual items (as discussed above);• costs incurred in preparation for upcoming launches primarily in Europe;• electric vehicle development costs;• operational inefficiencies and other costs at certain facilities;• a favourable revaluation of warranty accruals during 2008;• the write-off of uncollectable pre-production costs incurred related to the cancellation of an assembly program in 2009;• costs incurred to develop and grow our electronics capabilities;• additional supplier insolvency costs;• increased commodity costs; and• net customer price concessions subsequent to 2008.
These factors were partially offset by:
• the benefit of restructuring and downsizing activities and cost saving initiatives (including employee reductions, short work weekschedules and benefit plan changes) undertaken during or subsequent to 2008;
• productivity and efficiency improvements at certain facilities;• a decrease in complete vehicle assembly sales which have a lower gross margin than our consolidated average;• no employee profit sharing for 2009;• accelerated amortization of deferred wage buydown assets at a powertrain systems facility in the United States during 2008;
and• the decrease in tooling and other sales that earn low or no margins.
Depreciation and Amortization
Depreciation and amortization costs decreased 16% or $136 million to $737 million for 2009 compared to $873 million for 2008. The decreasein depreciation and amortization was primarily as a result of:
• the impairment of certain assets during 2008, in particular at a powertrain systems facility in the United States and certaininteriors and exteriors systems facilities in North America;
• the sale or disposition of certain facilities during or subsequent to 2008; and• a decrease in reported U.S. dollar depreciation and amortization due to the weakening of the Canadian dollar and euro, each
against the U.S. dollar.
These factors were partially offset by acquisitions and capital spending during or subsequent to 2008.
Selling, General and Administrative
SG&A expense as a percentage of sales was 7.3% for 2009, compared to 5.6% for 2008. The unusual items discussed in the "UnusualItems" section negatively impacted SG&A as a percentage of total sales in 2009 by 0.1% and positively impacted SG&A as apercentage of total sales in 2008 by 0.4%. Excluding these unusual items, SG&A as a percentage of total sales increased 1.2%.
SG&A expense decreased 4% or $58 million to $1.26 billion for 2009 compared to $1.32 billion for 2008. Excluding the unusual itemsrecorded in 2009 and 2008 (as discussed above), SG&A expenses decreased by $180 million primarily as a result of:
• cost saving initiatives, including reduced discretionary spending, employee reductions, reduced bonuses, voluntary wage reductionsand benefit plan changes;
• reduced spending at certain facilities as a result of restructuring and downsizing activities that were initiated during or subsequentto 2008;
• in 2009, a $9 million favourable adjustment (2008 - $41 million impairment) of our investment in ABCP;• a decrease in reported U.S. dollar SG&A expense due to the weakening of the Canadian dollar and euro, each against the U.S.
dollar; and• the sale or disposition of certain facilities during or subsequent to 2008.

These factors were partially offset by:
• downsizing and other restructuring activities that have not been included in unusual items (as discussed above);• accounts receivable valuation allowances recorded in 2009;• a favourable settlement on research and development incentives during 2008;• due diligence costs associated with our planned investment in Opel, which terminated during 2009;• acquisitions completed during or subsequent to 2008, including Cadence; and• other losses on disposal of assets.
Net Income (Loss)
Net income decreased $564 million to a net loss of $493 million for 2009 compared to net income of $71 million for 2008. Excluding theunusual items discussed above, net income decreased $682 million. This decrease in net income is the result of the decrease inoperating income partially offset by lower income taxes, both as discussed above.
Earnings (Loss) per Share (restated)
Diluted earnings per share decreased $2.52 to a loss of $2.21 for 2009 compared to earnings of $0.31 for 2008. Excluding the unusualitems, discussed above, diluted earnings per share decreased $3.02 from 2008 as a result of a decrease in net income (excludingunusual items) described above and a decrease in the weighted average number of diluted shares outstanding during 2009.
The decrease in the weighted average number of diluted shares outstanding was primarily due to the effect of the repurchase andcancellation of Common Shares in 2008 pursuant to our normal course issuer bid and a decrease in the number of diluted sharesassociated with restricted stock and stock options since such shares were anti-dilutive in 2009.
Financing Resources
Total capitalization decreased by $1.03 billion to $7.54 billion at December 31, 2009 compared to $8.57 billion at December 31, 2008.The decrease in capitalization was a result of a $1.03 billion decrease in liabilities.
The decrease in liabilities is primarily as a result of a $767 million repayment on our outstanding lines of credit in the first quarter of2009, the repayment of our 7.08% Subordinated Debentures during the third quarter of 2009 and the repayment of our 6.5%Convertible Subordinated Debentures during the fourth quarter of 2009. These decreases were partially offset by debt assumed onthe acquisition of Cadence.
The decrease in shareholders' equity was primarily as a result of:
• the net loss incurred during 2009; and• dividends paid during the first quarter of 2009.
These factors were partially offset by:
• a $407 million increase in accumulated net unrealized gains on translation of our net investment in foreign operations, primarilyas a result of the strengthening of the Canadian dollar, euro and British pound, each against the U.S. dollar between December 31,2008 and December 31, 2009; and
• net unrealized gains on cash flow hedges and the reclassification of net losses on cash flow hedges from accumulated othercomprehensive income to net loss.
Cash Resources
During 2009, our cash resources decreased by $1.4 billion to $1.3 billion primarily as a result of the net repayment of $0.9 billion onour outstanding lines of credit, cash used in investing activities, the repayment of our 7.08% Subordinated Debentures and therepayment of our 6.5% Convertible Subordinate Debentures, all as discussed previously. In addition to our cash resources, we hadterm and operating lines of credit totalling $2.1 billion. The unused and available portion of our lines of credit increased $0.9 billion to$1.9 billion during 2009 due to the net repayment on our operating lines.
In addition, at December 31, 2009 we held Canadian third party ABCP with a face value of Cdn$134 million and a carrying value ofCdn$88 million, which was based on a valuation technique that estimates the fair value based on relevant current market indices forinstruments of comparable credit quality, term and structure ("current market indices").
During 2009, we recorded a $9 million increase in the carrying value of our investment in ABCP due to a tightening of the spreadbetween the anticipated return on the restructured notes and the current market indices.
Magna International Inc. 2010 Annual Report – MD&A38

Magna International Inc. 2010 Annual Report – MD&A39
RESULTS OF OPERATIONS – FOR THE THREE MONTHS ENDED DECEMBER 31, 2010
The discussion of our results of operations for the three months ended December 31, 2010 contained in the MD&A attached to ourpress release dated February 23, 2011, as filed via the Canadian Securities Administrators' System for Electronic Document Analysisand Retrieval (SEDAR) (www.sedar.com), is incorporated by reference herein.
SELECTED QUARTERLY CONSOLIDATED FINANCIAL DATA
The following selected consolidated financial data has been prepared in accordance with Canadian GAAP.
For the three month periods endedMar 31, Jun 30, Sep 30, Dec 31,
2010 2010 2010 2010
Sales $ 5,512 $ 6,050 $ 5,942 $ 6,598
Net income $ 223 $ 293 $ 241 $ 216
Earnings per Common Share or Class B Share (restated)Basic $ 1.00 $ 1.31 $ 1.04 $ 0.90Diluted $ 0.99 $ 1.29 $ 1.03 $ 0.88
For the three month periods endedMar 31, Jun 30, Sep 30, Dec 31,
2009 2009 2009 2009
Sales $ 3,574 $ 3,705 $ 4,669 $ 5,419
Net income (loss) $ (200) $ (205) $ 51 $ (139)
Earnings (loss) per Common Share or Class B Share (restated)Basic $ (0.90) $ (0.91) $ 0.22 $ (0.62)Diluted $ (0.90) $ (0.91) $ 0.22 $ (0.62)
In general, sales increased from 2009 to 2010 as a result of a recovery in vehicle production during 2010, compared to the historicallylow level of production in 2009. The third quarter of 2010 is generally affected by the normal seasonal effects of lower vehicle productionvolumes as a result of OEM summer shutdowns.
Included in the quarterly net income are the following unusual items that have been discussed above:
For the three month periods endedMar 31, Jun 30, Sep 30, Dec 31,
2010 2010 2010 2010
Impairment charges $ – $ – $ – $ (21)Restructuring charges – (21) – (6)Sale of facility 14 – – –
$ 14 $ (21) $ – $ (27)
For the three month periods endedMar 31, Jun 30, Sep 30, Dec 31,
2009 2009 2009 2009
Impairment charges $ – $ (75) $ – $ (106)Restructuring charges – (6) – (20)Curtailment gain – 20 – –Sale of facility – – – (8)
$ – $ (61) $ – $ (134)
For more information regarding our quarter over quarter results, please refer to our first, second and third quarter 2010 quarterlyreports which are available through the internet on the Canadian Securities Administrators' System for Electronic Document Analysisand Retrieval (SEDAR) which can be accessed at www.sedar.com.

Magna International Inc. 2010 Annual Report – MD&A40
FORWARD-LOOKING STATEMENTS
The previous discussion contains statements that constitute "forward-looking statements" within the meaning of applicable securitieslegislation, including, but not limited to, statements relating to: future purchases of our Common Shares pursuant to our normalcourse issuer bid and any resultant offsetting of dilution; expected North American, European and global light vehicle production;implementation of our strategy, including through organic growth and targeted acquisitions; and renewal of our current credit facility.The forward-looking information in this MD&A is presented for the purpose of providing information about management's currentexpectations and plans and such information may not be appropriate for other purposes. Forward-looking statements may includefinancial and other projections, as well as statements regarding our future plans, objectives or economic performance, or theassumptions underlying any of the foregoing, and other statements that are not recitations of historical fact. We use words such as"may", "would", "could", "should", "will", "likely", "expect", "anticipate", "believe", "intend", "plan", "forecast", "outlook", "project", "estimate"and similar expressions suggesting future outcomes or events to identify forward-looking statements. Any such forward-lookingstatements are based on information currently available to us, and are based on assumptions and analyses made by us in light of ourexperience and our perception of historical trends, current conditions and expected future developments, as well as other factors webelieve are appropriate in the circumstances. However, whether actual results and developments will conform with our expectationsand predictions is subject to a number of risks, assumptions and uncertainties, many of which are beyond our control, and the effectsof which can be difficult to predict, including, without limitation: the potential for a slower than anticipated economic recovery or adeterioration of economic conditions; a significant decline in production volumes from current levels and sales levels which are belowforecast levels; the inability of suppliers to timely accommodate significant, rapid increases in production volumes; our dependenceon outsourcing by our customers; the termination or non renewal by our customers of any material contracts; our ability to identifyand successfully exploit shifts in technology; restructuring, downsizing and/or other significant non-recurring costs; impairmentcharges; our ability to successfully grow our sales to non-traditional customers; unfavourable product or customer mix; risks ofconducting business in foreign countries, including China, India, Brazil, Russia and other developing markets; our ability to quickly shiftour manufacturing footprint to take advantage of lower cost manufacturing opportunities; our ability to secure sufficient amounts ofcapital to meet our liquidity requirements on favourable terms, disruptions in the capital and credit markets; the deteriorating economiccondition of several European governments and the potential adverse effect on the global economy; fluctuations in relative currencyvalues; exposure to escalating commodities prices; our ability to successfully identify, complete and integrate acquisitions; pricingpressures, including our ability to offset price concessions demanded by our customers; warranty and recall costs; the financialcondition and credit worthiness of some of our OEM customers, including the potential that such customers may not make, or mayseek to delay or reduce, payments owed to us; the financial condition of some of our suppliers and the risk of their insolvency,bankruptcy or financial restructuring; the highly competitive nature of the automotive parts supply business; product liability claimsin excess of our insurance coverage; changes in our mix of earnings between jurisdictions with lower tax rates and those with highertax rates, as well as our ability to fully benefit tax losses; other potential tax exposures; legal claims against us; work stoppages andlabour relations disputes; changes in laws and governmental regulations; costs associated with compliance with environmental lawsand regulations; risks associated with our pursuit of opportunities in complementary "non-automotive" businesses; risks associatedwith our partnership, Magna E-Car Systems, with the Stronach group to continue to pursue opportunities in the vehicle electrificationbusiness; and other factors set out in our Annual Information Form filed with securities commissions in Canada and our annual reporton Form 40-F filed with the United States Securities and Exchange Commission, and subsequent filings, including, without limitation,factors set out in our Management Information Circular/Proxy Statement, dated May 31, 2010 under the heading "Risks Relating tothe Vehicle Electrification Joint Venture" and "Risks to Magna of the E-Car Business". In evaluating forward-looking statements, wecaution readers not to place undue reliance on any forward-looking statements and readers should specifically consider the variousfactors which could cause actual events or results to differ materially from those indicated by such forward-looking statements.Unless otherwise required by applicable securities laws, we do not intend, nor do we undertake any obligation, to update or reviseany forward-looking statements to reflect subsequent information, events, results or circumstances or otherwise.

Magna's management is responsible for the preparation and presentation of the consolidated financial statements and all theinformation in the accompanying Management's Discussion and Analysis of Results of Operations and Financial Position ("MD&A").The consolidated financial statements were prepared by management in accordance with Canadian generally accepted accountingprinciples.
Where alternative accounting methods exist, management has selected those it considered to be most appropriate in thecircumstances. Financial statements include certain amounts based on estimates and judgments. Management has determined suchamounts on a reasonable basis designed to ensure that the consolidated financial statements are presented fairly, in all materialrespects. Financial information presented in the accompanying MD&A has been prepared by management to ensure consistency withthat in the consolidated financial statements. The consolidated financial statements have been reviewed by the Audit Committee,audited by the independent auditors and approved by the Board of Directors of the Company.
Management is responsible for the development and maintenance of systems of internal accounting and administrative cost controlsof high quality, consistent with reasonable cost. Such systems are designed to provide reasonable assurance that financial informationis accurate, relevant and reliable, and that the Company's activities are appropriately accounted for and assets are adequatelysafeguarded. In compliance with U.S. Securities and Exchange Commission ("SEC") requirements and Section 404 of the U.S.Sarbanes-Oxley Act ("SOX"), management has determined that as at December 31, 2010 internal control over financial reporting is,in all material respects, effective. The Company's Chief Executive Officer and Chief Financial Officer, in compliance with Section 302of SOX, provide a certification related to the Company's annual disclosure document in the U.S. (Form 40-F) to the SEC. Accordingto Multilateral Instrument 52-109, the same certification is provided to the Canadian Securities Administrators.
The Company's Audit Committee is appointed by its Board of Directors annually and is comprised solely of independent directors.The Audit Committee meets regularly with management, as well as with the independent auditors, to satisfy itself that each isproperly discharging its responsibilities, to review the consolidated financial statements and the independent auditors' report and todiscuss significant financial reporting issues and auditing matters. The Audit Committee reports its findings to the Board of Directorsfor consideration when approving the consolidated financial statements for issuance to the shareholders.
The consolidated financial statements and the effectiveness of internal control over financial reporting have been audited by Ernst &Young LLP, the independent auditors, in accordance with Canadian generally accepted auditing standards and the standards of thePublic Company Accounting Oversight Board (United States) on behalf of the shareholders. The Independent Auditors' Reports onthe consolidated financial statements and internal controls outline the nature of their examinations and their opinions. The independentauditors have full and unrestricted access to the Audit Committee.
/s/ Donald J. Walker /s/ Vincent J. Galifi
Donald J. Walker Vincent J. GalifiChief Executive Officer Executive Vice-President
and Chief Financial Officer
Toronto, Canada,March 16, 2011
Magna International Inc. 2010 Annual Report – Financial Statements41
MAGNA INTERNATIONAL INC.Management's Responsibility for Financial Reporting

Magna International Inc. 2010 Annual Report – Financial Statements42
To the Shareholders ofMagna International Inc.
We have audited the accompanying consolidated financial statements of Magna International Inc. (the "Company"), which comprisethe consolidated balance sheets as at December 31, 2010 and 2009, and the consolidated statements of income (loss) andcomprehensive income (loss), retained earnings and cash flows for each of the years in the three-year period ended December 31,2010, and a summary of significant accounting policies and other explanatory information.
Management's responsibility for the consolidated financial statements
Management is responsible for the preparation and fair presentation of these consolidated financial statements in accordance withCanadian generally accepted accounting principles, and for such internal control as management determines is necessary to enablethe preparation of consolidated financial statements that are free from material misstatement, whether due to fraud or error.
Auditors' responsibility
Our responsibility is to express an opinion on these consolidated financial statements based on our audits. We conducted our auditsin accordance with Canadian generally accepted auditing standards and the standards of the Public Company Accounting OversightBoard (United States). Those standards require that we comply with ethical requirements and plan and perform the audit to obtainreasonable assurance about whether the consolidated financial statements are free from material misstatement.
An audit involves performing procedures to obtain audit evidence about the amounts and disclosures in the consolidated financialstatements. The procedures selected depend on the auditors' judgment, including the assessment of the risks of materialmisstatement of the consolidated financial statements, whether due to fraud or error. In making those risk assessments, the auditorsconsider internal control relevant to the entity's preparation and fair presentation of the consolidated financial statements in order todesign audit procedures that are appropriate in the circumstances. An audit also includes examining, on a test basis, evidencesupporting the amounts and disclosures in the consolidated financial statements, evaluating the appropriateness of accounting policiesused and the reasonableness of accounting estimates made by management, as well as evaluating the overall presentation of theconsolidated financial statements.
We believe that the audit evidence we have obtained in our audits is sufficient and appropriate to provide a basis for our audit opinion.
Opinion
In our opinion, the consolidated financial statements present fairly, in all material respects, the financial position of the Company asat December 31, 2010 and 2009, and the results of its operations and its cash flows for each of the years in the three-year periodended December 31, 2010 in accordance with Canadian generally accepted accounting principles.
Other matter
We have also audited, in accordance with the standards of the Public Company Accounting Oversight Board (United States), theCompany's internal control over financial reporting as of December 31, 2010, based on the criteria established in Internal Control -Integrated Framework issued by the Committee of Sponsoring Organizations of the Treadway Commission and our report datedMarch 16, 2011 expressed an unqualified opinion on the Company's internal control over financial reporting.
/s/ Ernst & Young LLP
Chartered AccountantsLicensed Public AccountantsMarch 16, 2011Toronto, Canada
Independent Auditors' Report of Registered Public Accounting Firm
Magna International Inc. 2010 Annual Report – Financial Statements43
To the Shareholders ofMagna International Inc.
We have audited Magna International Inc.'s (the "Company") internal control over financial reporting as at December 31, 2010, basedon criteria established in Internal Control - Integrated Framework issued by the Committee of Sponsoring Organizations of theTreadway Commission (the "COSO" criteria). The Company's management is responsible for maintaining effective internal control overfinancial reporting and for its assessment of the effectiveness of internal control over financial reporting included in the accompanyingManagement's Responsibility for Financial Reporting. Our responsibility is to express an opinion on the effectiveness of theCompany's internal control over financial reporting based on our audit.
We conducted our audit in accordance with the standards of the Public Company Accounting Oversight Board (United States). Those standardsrequire that we plan and perform the audit to obtain reasonable assurance about whether effective internal control over financialreporting was maintained in all material respects. Our audit included obtaining an understanding of internal control over financialreporting, assessing the risk that a material weakness exists, testing and evaluating the design and operating effectiveness of internalcontrol based on the assessed risk, and performing such other procedures as we considered necessary in the circumstances. Webelieve that our audit provides a reasonable basis for our opinion.
A company's internal control over financial reporting is a process designed to provide reasonable assurance regarding the reliabilityof financial reporting and the preparation of financial statements for external purposes in accordance with generally acceptedaccounting principles. A company's internal control over financial reporting includes those policies and procedures that (1) pertain tothe maintenance of records that, in reasonable detail, accurately and fairly reflect the transactions and dispositions of the assets ofthe company; (2) provide reasonable assurance that transactions are recorded as necessary to permit preparation of financialstatements in accordance with generally accepted accounting principles, and that receipts and expenditures of the company arebeing made only in accordance with authorizations of management and directors of the company; and (3) provide reasonableassurance regarding prevention or timely detection of unauthorized acquisition, use, or disposition of the company's assets thatcould have a material effect on the financial statements.
Because of its inherent limitations, internal control over financial reporting may not prevent or detect misstatements. Also, projectionsof any evaluation of effectiveness to future periods are subject to the risk that controls may become inadequate because of changesin conditions, or that the degree of compliance with the policies or procedures may deteriorate.
In our opinion, the Company maintained, in all material respects, effective internal control over financial reporting as at December 31,2010, based on the COSO criteria.
We also have audited, in accordance with Canadian generally accepted auditing standards and the standards of the Public CompanyAccounting Oversight Board (United States), the consolidated balance sheets of the Company as at December 31, 2010 and 2009,and the consolidated statements of income (loss) and comprehensive income (loss), retained earnings and cash flows for each of theyears in the three-year period ended December 31, 2010 and our report dated March 16, 2011 expressed an unqualified opinionthereon.
/s/ Ernst & Young LLP
Chartered AccountantsLicensed Public AccountantsMarch 16, 2011Toronto, Canada
Independent Auditors' Report on Internal Controls Under Standardsof the Public Company Accounting Oversight Board (United States)

Magna International Inc. 2010 Annual Report – Financial Statements44
Years ended December 31,
Note 2010 2009 2008
Sales $ 24,102 $ 17,367 $ 23,704
Costs and expensesCost of goods sold 5, 17 20,924 15,697 20,982Depreciation and amortization 661 737 873Selling, general and administrative 5, 10, 18, 21 1,340 1,261 1,319Interest (income) expense, net 16 (10) 7 (62)Equity income (33) (7) (19)Impairment charges 5 23 183 283
Income (loss) from operations before income taxesand minority interest 1,197 (511) 328
Income taxes 13 236 (18) 257Minority interest (12) – –Net income (loss) 973 (493) 71Other comprehensive income (loss): 21
Net realized and unrealized gains (losses) on translationof net investment in foreign operations 18 407 (881)
Repurchase of shares 19 (3) – (32)Net unrealized gains (losses) on cash flow hedges 81 41 (102)Reclassification of net (gains) losses on cash flow hedges
to net income (loss) (28) 59 (1)Net unrealized gains on available-for-sale investments 11 – –
Comprehensive income (loss) $ 1,052 $ 14 $ (945)
Earnings (loss) per Common Share or Class B Share[restated - note 3] 6
Basic $ 4.23 $ (2.21) $ 0.32Diluted $ 4.18 $ (2.21) $ 0.31
Cash dividends paid per Common Share or Class B Share[restated - note 3] $ 0.42 $ 0.09 $ 0.63
Average number of Common Shares and Class B Sharesoutstanding during the year [in millions][restated - note 3]: 6
Basic 230.0 223.6 225.6Diluted 233.0 223.6 227.8
See accompanying notes
MAGNA INTERNATIONAL INC.Consolidated Statements of Income (Loss)and Comprehensive Income (Loss)
[U.S. dollars in millions, except per share figures]

Magna International Inc. 2010 Annual Report – Financial Statements45
Years ended December 31,
Note 2010 2009 2008
Retained earnings, beginning of year $ 2,843 $ 3,357 $ 3,526Net income (loss) 973 (493) 71Dividends on Common Shares and Class B Shares (102) (21) (142)Repurchase of Class B Shares 4, 19 (976) – –Repurchase of Common Shares 19 (13) – (98)Retained earnings, end of year $ 2,725 $ 2,843 $ 3,357
See accompanying notes
MAGNA INTERNATIONAL INC.Consolidated Statements of Retained Earnings
[U.S. dollars in millions]
Years ended December 31,
Note 2010 2009 2008
OPERATING ACTIVITIESNet income (loss) $ 973 $ (493) $ 71Items not involving current cash flows 7 722 1,114 1,258
1,695 621 1,329Changes in non-cash operating assets and liabilities 7 177 (94) (275)Cash provided from operating activities 1,872 527 1,054
INVESTMENT ACTIVITIESFixed asset additions (784) (629) (739)Purchase of subsidiaries 8 (106) (50) (158)Increase in investments and other assets (141) (227) (231)Proceeds from disposition 287 30 65Cash used for investment activities (744) (876) (1,063)
FINANCING ACTIVITIES(Decrease) increase in bank indebtedness (4) (853) 827Repayments of debt 16 (67) (296) (354)Issues of debt 16 22 5 3Issue of general partnership units by subsidiary 4 80 – –Issues of Common Shares 19 49 2 –Settlement of stock appreciation rights 18 – (1) –Settlement of stock options 18 (12) – –Repurchase of Common Shares 19 (23) – (247)Repurchase of Class B Shares 4, 19 (300) – –Dividends (100) (21) (140)Cash (used for) provided from financing activities (355) (1,164) 89
Effect of exchange rate changes on cash and cash equivalents (2) 90 (277)
Net increase (decrease) in cash and cash equivalents during the year 771 (1,423) (197)Cash and cash equivalents, beginning of year 1,334 2,757 2,954Cash and cash equivalents, end of year $ 2,105 $ 1,334 $ 2,757
See accompanying notes
MAGNA INTERNATIONAL INC.Consolidated Statements of Cash Flows
[U.S. dollars in millions]

As at December 31,
Note 2010 2009
ASSETSCurrent assetsCash and cash equivalents 7 $ 2,105 $ 1,334Accounts receivable 3,645 3,062Inventories 9 1,896 1,721Income taxes receivable 13 – 50Prepaid expenses and other 168 136
7,814 6,303
Investments 10, 17 277 238Fixed assets, net 5, 11 3,889 3,811Goodwill 5, 12 1,188 1,132Future tax assets 13 150 168Other assets 5, 14 580 651
$ 13,898 $ 12,303
LIABILITIES AND SHAREHOLDERS' EQUITYCurrent liabilitiesBank indebtedness 16 $ 26 $ 48Accounts payable 3,586 3,001Accrued salaries and wages 462 372Other accrued liabilities 15 909 862Income taxes payable 192 –Long-term debt due within one year 16 25 16
5,200 4,299
Deferred revenue 15 19Long-term debt 16 46 115Other long-term liabilities 17 367 369Future tax liabilities 13 131 141
5,759 4,943
Minority interest 74 –
Shareholders' equityCapital stock 3, 19
Common Shares[issued: 242,564,616; 2009 - 223,866,062] [restated - note 3] 4,335 3,613
Class B Shares[convertible into Common Shares][issued: nil; December 31, 2009 - 1,453,658] [restated - note 3] – –
Contributed surplus 20 85 63Retained earnings 19 2,725 2,843Accumulated other comprehensive income 21 920 841
8,065 7,360$ 13,898 $ 12,303
Commitments and contingencies [notes 16, 23 and 26]
See accompanying notes
On behalf of the Board: /s/ Donald Resnick /s/ Frank Stronach
Donald Resnick Frank StronachDirector Chairman of the Board
Magna International Inc. 2010 Annual Report – Financial Statements46
MAGNA INTERNATIONAL INC.Consolidated Balance Sheets
[U.S. dollars in millions]

Magna International Inc. 2010 Annual Report – Financial Statements47
1. SIGNIFICANT ACCOUNTING POLICIES
Magna International Inc. designs, develops and manufactures automotive systems, assemblies, modules and components,and engineers and assembles complete vehicles, primarily for sale to original equipment manufacturers ["OEMs"] of cars andlight trucks in North America, Europe, Asia, South America and Africa.
Basis of presentation
The consolidated financial statements have been prepared in U.S. dollars following Canadian generally accepted accountingprinciples ["Canadian GAAP"]. These principles are also in conformity, in all material respects, with United States generallyaccepted accounting principles ["U.S. GAAP"], except as described in note 28 to the consolidated financial statements.
Principles of consolidation
The consolidated financial statements include the accounts of Magna International Inc. and its subsidiaries [collectively "Magna"or the "Company"], some of which have a minority interest. The Company also consolidates variable interest entities in whichthe Company is designated as the primary beneficiary in accordance with Accounting Guideline ["AcG"] AcG-15, "Consolidationof Variable Interest Entities". The Company accounts for its interests in jointly controlled entities using the proportionateconsolidation method. All significant intercompany balances and transactions have been eliminated.
Financial instruments
The Company classifies all of its financial assets and financial liabilities as held-for-trading, held-to-maturity investments, loansand receivables, available-for-sale financial assets, or other financial liabilities. Held-for-trading financial instruments, whichinclude cash and cash equivalents and the Company's investment in asset-backed commercial paper ["ABCP"] are measuredat fair value and all gains and losses are included in net income (loss) in the period in which they arise. Held-to-maturityinvestments, which include long-term interest bearing government securities held to partially fund certain Austrian lump sumtermination and long service payment arrangements, are recorded at amortized cost using the effective interest method.Loans and receivables, which include accounts receivable, long-term receivables and accounts payable, are recorded atamortized cost using the effective interest method. Available-for-sale financial instruments are recorded at cost and aresubsequently measured at fair value with all revaluation gains and losses included in other comprehensive income.
Foreign currency translation
The Company operates globally, which gives rise to a risk that its earnings and cash flows may be adversely impacted byfluctuations in foreign exchange rates.
Assets and liabilities of the Company's operations having a functional currency other than the U.S. dollar are translated intoU.S. dollars using the exchange rate in effect at year end, and revenues and expenses are translated at the average rate duringthe year. Exchange gains or losses on translation of the Company's net investment in these operations are included incomprehensive income (loss) and are deferred in accumulated other comprehensive income. Foreign exchange gains or losseson non-U.S. dollar debt that was designated as a hedge of the Company's net investment in these operations are also recordedin accumulated other comprehensive income. The appropriate amounts of exchange gains or losses in accumulated othercomprehensive income are reflected in income when there is a reduction, as a result of capital transactions, in the Company'snet investment in the operations that gave rise to such exchange gains and losses.
Foreign exchange gains and losses on transactions occurring in a currency other than an operation's functional currency arereflected in income, except for gains and losses on foreign exchange contracts used to hedge specific future commitmentsin foreign currencies and on intercompany balances which are designated as long-term investments. In particular, the Companyuses foreign exchange forward contracts for the sole purpose of hedging certain of the Company's future committed Canadiandollar, U.S. dollar and euro ["€"] outflows and inflows. All derivative instruments, including foreign exchange contracts, arerecorded on the consolidated balance sheet at fair value. The fair values of derivatives are recorded in other assets or otherliabilities. To the extent that cash flow hedges are effective, the change in their fair value is recorded in other comprehensiveincome (loss); any ineffective portion is recorded in net income (loss). Amounts accumulated in other comprehensive income(loss) are reclassified to net income (loss) in the period in which the hedged item affects net income (loss).
If the Company's foreign exchange forward contracts ceased to be effective as hedges, for example, if projected foreign cashinflows or outflows declined significantly, gains or losses pertaining to the portion of the hedging transactions in excess ofprojected foreign currency denominated cash flows would be recognized in income at the time this condition was identified.
MAGNA INTERNATIONAL INC.Notes to the Consolidated Financial Statements
[All amounts in U.S. dollars and all tabular amounts in millions, except per share figures, unless otherwise noted]
Magna International Inc. 2010 Annual Report – Financial Statements48
Cash and cash equivalents
Cash and cash equivalents include cash on account, demand deposits and short-term investments with remaining maturitiesof less than three months at acquisition.
Inventories
Production inventories and tooling inventories manufactured in-house are valued at the lower of cost and net realizable value,with cost being determined substantially on a first-in, first-out basis. Cost includes the cost of materials plus direct labourapplied to the product and the applicable share of manufacturing overhead.
Outsourced tooling inventories are valued at the lower of subcontracted costs and net realizable value.
Investments
The Company accounts for its investments in which it has significant influence on the equity basis. Investments also includethe Company's investment in ABCP, public company shares and long-term interest bearing government securities held topartially fund certain Austrian lump sum termination and long service payment arrangements pursuant to local tax laws.
Long-lived assets
Fixed assets are recorded at historical cost. Depreciation is provided on a straight-line basis over the estimated useful lives offixed assets at annual rates of 2½% to 5% for buildings, 7% to 10% for general purpose equipment and 10% to 30% forspecial purpose equipment.
Definite-lived intangible assets, which have arisen principally through acquisitions, are amortized on a straight-line basis overtheir estimated useful lives, typically over periods not exceeding five years.
The Company assesses fixed and other long-lived assets [excluding goodwill] for recoverability whenever indicators ofimpairment exist. If the carrying value of the asset exceeds the estimated undiscounted cash flows from the use of the asset,then an impairment loss is recognized to write the asset down to fair value. The fair value of the long-lived assets is generallydetermined using estimated discounted future cash flows.
Goodwill
Goodwill represents the excess of the cost of an acquired enterprise over the fair value of the identifiable assets acquired andliabilities assumed less any subsequent writedowns for impairment. Goodwill is subject to an annual impairment test. Goodwillimpairment is evaluated between annual tests upon the occurrence of certain events or circumstances. Goodwill impairmentis assessed based on a comparison of the fair value of a reporting unit to the underlying carrying value of the reporting unit'snet assets, including goodwill. When the carrying amount of the reporting unit exceeds its fair value, the fair value of thereporting unit's goodwill is compared with its carrying amount to measure the amount of impairment, if any. The fair value ofgoodwill is determined using the estimated discounted future cash flows of the reporting unit.
Other assets
Other assets include the long-term portion of certain receivables, which represent the recognized sales value of tooling anddesign and engineering services provided to customers under certain long-term contracts. The receivables will be paid in fullupon completion of the contracts or in instalments based on forecasted production volumes. In the event that actual productionvolumes are less than those forecasted, a reimbursement for any shortfall will be made.
Preproduction costs related to long-term supply agreements
Pre-operating costs incurred in establishing new facilities that require substantial time to reach commercial production capabilityare expensed as incurred.
Costs incurred [net of customer subsidies] related to design and engineering, which are paid for as part of subsequentproduction piece price amounts, are expensed as incurred unless a contractual guarantee for reimbursement exists.
Costs incurred [net of customer subsidies] related to design and development costs for moulds, dies and other tools that theCompany does not own [and that will be used in, and paid for as part of the piece price amount for, subsequent production]are expensed as incurred unless the supply agreement provides a contractual guarantee for reimbursement or the non-cancellable right to use the moulds, dies and other tools during the supply agreement.
Costs deferred in the above circumstances are included in other assets and amortized on a units-of-production basis to costof goods sold over the anticipated term of the supply agreement.

Magna International Inc. 2010 Annual Report – Financial Statements49
Warranty
The Company records product warranty liabilities based on its individual customer agreements. Under most customeragreements, the Company only accounts for existing or probable claims on product default issues when amounts related tosuch issues are probable and reasonably estimable. Under certain complete vehicle engineering and assembly contracts, theCompany records an estimate of future warranty-related costs based on the terms of the specific customer agreements andthe specific customer's warranty experience.
Product liability provisions are established based on the Company's best estimate of the amounts necessary to settle existingclaims on product default issues. Recall costs are costs incurred when government regulators and/or the customer decidesto recall a product due to a known or suspected performance issue, and the Company is required to participate, eithervoluntarily or involuntarily. Costs typically include the cost of the product being replaced, the customer's cost of the recall andlabour to remove and replace the defective part. When a decision to recall a product has been made or is probable, theCompany's estimated cost of the recall is recorded as a charge to income in that period. In making this estimate, judgmentis required as to the number of units that may be returned as a result of the recall, the total cost of the recall campaign andthe ultimate negotiated sharing of the cost between the Company, the customer and, in some cases, a supplier to theCompany.
Employee future benefit plans
The cost of providing benefits through defined benefit pensions, lump sum termination and long service paymentarrangements, and post-retirement benefits other than pensions is actuarially determined and recognized in income using theprojected benefit method pro-rated on service and management's best estimate of expected plan investment performance,salary escalation, retirement ages of employees and, with respect to medical benefits, expected health care costs. Differencesarising from plan amendments, changes in assumptions and experience gains and losses that are greater than 10% of thegreater of the accrued benefit obligation at the beginning of the year and the fair value, or market related value, of plan assetsat the beginning of the year, are recognized in income over the expected average remaining service life of employees. Gainsrelated to plan curtailments are recognized when the event giving rise to the curtailment has occurred. Plan assets are valuedat fair value. The cost of providing benefits through defined contribution pension plans is charged to income in the period inrespect of which contributions become payable.
Asset retirement obligation
The Company recognizes its obligation to restore leased premises at the end of the lease by recording at lease inception theestimated fair value of this obligation as other long-term liabilities with a corresponding amount recognized as fixed assets.The fixed asset amount is amortized over the period from lease inception to the time the Company expects to vacate thepremises, resulting in both depreciation and interest charges. The estimated fair value of the obligation is assessed for changesin the expected timing and extent of expenditures with changes related to the time value of money recorded as interestexpense.
Revenue recognition
Revenue from the sale of manufactured products is recognized when the price is fixed or determinable, collectability isreasonably assured and upon shipment to [or receipt by customers, depending on contractual terms], and acceptance by,customers.
Separately priced tooling and engineering services are accounted for as a separate revenue element only in circumstanceswhere the tooling and engineering has value to the customer on a standalone basis and there is objective and reliable evidenceof the fair value of the subsequent parts production or vehicle assembly. Revenues from significant engineering services andtooling contracts that qualify as separate revenue elements are recognized on a percentage of completion basis. Percentage-of-completion is generally determined based on the proportion of accumulated expenditures to date as compared to totalanticipated expenditures.
Revenue and cost of goods sold, including amounts from separately priced engineering and tooling contracts, are presentedon a gross basis in the consolidated statements of income (loss) and comprehensive income (loss) when the Company isacting as principal and is subject to significant risks and rewards in connection with the process of bringing the product to itsfinal state and in the post-sale dealings with its customers. Otherwise, components of revenues and related costs arepresented on a net basis. With respect to vehicle assembly sales, where Magna is acting as principal with respect to purchasedcomponents and systems, the selling price to the customer includes the costs of such inputs. These programs are accountedfor on a full-cost basis under which sales and cost of goods sold include these input costs. Where third-party components andsystems are held on consignment by the Company, the selling price to the customer reflects a value-added assembly feeonly and, accordingly, the costs of such consignment inputs are not included in sales and cost of goods sold.

Magna International Inc. 2010 Annual Report – Financial Statements50
Government financing
The Company makes periodic applications for financial assistance under available government assistance programs in thevarious jurisdictions that the Company operates. Grants and tax credits relating to capital expenditures are reflected as areduction of the cost of the related assets. Grants and tax credits relating to current operating expenditures are generallyrecorded as a reduction of the related expense at the time the eligible expenses are incurred. In the case of certain foreignsubsidiaries, the Company receives tax super allowances, the benefits of which are recorded as a reduction of income taxexpense. The Company also receives loans which are recorded as liabilities in amounts equal to the cash received.
Research and development
Research costs are expensed as incurred and development costs which meet certain criteria where future benefit is reasonablycertain are deferred to the extent of their estimated recovery. As at December 31, 2010 and 2009, no development costs weredeferred.
Income taxes
The Company uses the liability method of tax allocation to account for income taxes. Under the liability method of tax allocation,future tax assets and liabilities are determined based on differences between the financial reporting and tax bases of assetsand liabilities and are measured using the substantively enacted tax rates and laws that will be in effect when the differencesare expected to reverse.
No future tax liability is recorded for taxes on undistributed earnings and translation adjustments of foreign subsidiaries. Theseitems are either considered to be reinvested for the foreseeable future or if they are available for repatriation, are not subjectto further tax on remittance in the current circumstances. Taxes will be recorded on such foreign undistributed earnings andtranslation adjustments when it becomes apparent that such earnings will be distributed in the foreseeable future and will incurfurther significant tax on remittance.
Stock-based compensation
Compensation expense is recognized for stock options based upon the fair value of the options at the grant or modificationdate. The fair value of the options is recognized over the vesting period of the options as compensation expense in selling,general and administrative expense with a corresponding increase to contributed surplus.
The fair value of stock options is estimated at the grant or modification date using the Black-Scholes option pricing model. Thismodel requires the input of a number of assumptions, including expected dividend yields, expected stock price volatility,expected time until exercise and risk-free interest rates. Although the assumptions used reflect management's best estimates,they involve inherent uncertainties based on market conditions generally outside the Company's control. If other assumptionsare used, stock-based compensation expense could be significantly impacted.
As stock options are exercised, the proceeds received on exercise, in addition to the portion of the contributed surplus balancerelated to those stock options, is credited to Common Shares and contributed surplus is reduced accordingly.
The Company's restricted stock plans and restricted share unit plans are measured at fair value at the date of grant ormodification and amortized to compensation expense from the effective date of the grant to the final vesting date in selling,general and administrative expense with a corresponding increase to contributed surplus. As restricted stock or restrictedshare units are released under the plans, the portion of the contributed surplus balance relating to the restricted stock orrestricted share units is credited to Common Shares and released from contributed surplus.
Comprehensive income (loss)
Other comprehensive income (loss) includes unrealized gains and losses on translation of the Company's net investment inself sustaining foreign operations, the change in fair value of available-for-sale investments, net of taxes and to the extent thatcash flow hedges are effective, the change in their fair value, net of income taxes. Other comprehensive income (loss) ispresented below net income (loss) on the consolidated statements of income (loss) and comprehensive income (loss).Comprehensive income (loss) is composed of net income (loss) and other comprehensive income (loss).
Accumulated other comprehensive income is a separate component of shareholders' equity which includes the accumulatedbalances of all components of other comprehensive income (loss) which are recognized in comprehensive income (loss) butexcluded from net income (loss).

Magna International Inc. 2010 Annual Report – Financial Statements51
Earnings (loss) per Common Share or Class B Share
Basic earnings (loss) per Common Share or Class B Share are calculated on net income (loss) using the weighted averagenumber of Common Shares and Class B Shares outstanding during the year.
Diluted earnings (loss) per Common Share or Class B Share are calculated on the weighted average number of CommonShares and Class B Shares including an adjustment for stock options outstanding using the treasury stock method.
Common Shares that have not been released under the Company's restricted stock plan or are being held in trust for purposesof the Company's restricted stock unit program have been excluded from the calculation of basic earnings (loss) per share buthave been included in the calculation of diluted earnings (loss) per share.
Use of estimates
The preparation of the consolidated financial statements in conformity with Canadian GAAP requires management to makeestimates and assumptions that affect the amounts reported and disclosed in the consolidated financial statements andaccompanying notes. Actual results could differ from those estimates.
2. FUTURE ACCOUNTING STANDARDS
Adoption of United States Generally Accepted Accounting Principles
In February 2008, the Canadian Accounting Standards Board confirmed the transition from Canadian GAAP to InternationalFinancial Reporting Standards ["IFRS"] for all publicly accountable entities no later than fiscal years commencing on or afterJanuary 1, 2011. As a result, management undertook a detailed review of the implications of Magna having to report underIFRS and also examined the alternative available to the Company, as a Foreign Private Issuer in the United States, of filing itsprimary financial statements in Canada using U.S. GAAP, as permitted by the Canadian Securities Administrators' NationalInstrument 51-102, "Continuous Disclosure Obligations".
In carrying out this evaluation, management considered many factors, including, but not limited to (i) the changes in accountingpolicies that would be required and the resulting impact on the Company's reported results and key performance indicators,(ii) the reporting standards expected to be used by many of the Company's industry comparables, and (iii) the financial reportingneeds of the Company's market participants, including shareholders, lenders, rating agencies and market analysts.
As a result of this analysis, management has determined that Magna will adopt U.S. GAAP as its primary basis of financialreporting with our first reporting period beginning after January 1, 2011 on a retrospective basis. The adoption of U.S. GAAPis not anticipated to have a material change on the Company's accounting policies or financial results, except for the reportingdifferences disclosed in note 28 to the consolidated financial statements.
Multiple-Deliverable Revenue Arrangements
In October 2009, the FASB issued Accounting Standards Update ["ASU"] 2009-13, "Revenue Recognition [Topic 605] - Multiple-Deliverable Revenue Arrangements". This ASU eliminates the requirement that undelivered elements must have objective andreliable evidence of fair value before a company can recognize the portion of the consideration that is attributable to items thatalready have been delivered. This may allow some companies to recognize revenue on transactions that involve multiple-deliverables earlier than under the current requirements. For Magna, this ASU is effective for revenue arrangements enteredinto or materially modified on or after January 1, 2011. This change is not expected to have any material impact on theconsolidated financial statements.
Other
In October 2008, the CICA issued Handbook Sections 1582, "Business Combinations" ["CICA 1582"], 1601 "ConsolidatedFinancial Statements" ["CICA 1601"], and 1602 "Non-controlling Interests" ["CICA 1602"]. CICA 1582 establishes standards forthe measurement of a business combination and the recognition and measurement of assets acquired and liabilities assumed,CICA 1601 carries forward the existing Canadian guidance on aspects of the preparation of consolidated financial statementssubsequent to acquisition other than non-controlling interests, and CICA 1602 establishes guidance for the treatment of non-controlling interests subsequent to acquisition through a business combination. These new standards would be effective forMagna in the first quarter of 2011 with earlier adoption permitted. As at December 31, 2010, these new standards have notbeen adopted by the Company.
Magna International Inc. 2010 Annual Report – Financial Statements52
3. STOCK SPLIT
On November 24, 2010, the Company completed a two-for-one stock split, which was implemented by way of a stock dividend,whereby shareholders received an additional Common Share for each Common Share held. All equity-based compensationplans or arrangements were adjusted to reflect the issuance of additional Common Shares.
Accordingly, all of the Company's issued and outstanding Class A Subordinate Voting, Common and Class B shares, includingthose issued in relation to the Arrangement [note 4], incentive stock options, and stock appreciation rights ["SARs"] have beenrestated for all periods presented to reflect the stock split. In addition, earnings (loss) per Common Share or Class B Share,Cash dividends paid per Common Share or Class B Share, weighted average number of Common Shares or Class B Sharesoutstanding, weighted average exercise price for stock options and the weighted average fair value of options granted ormodified have been restated for all periods presented to reflect the stock split.
4. PLAN OF ARRANGEMENT
On August 31, 2010, following approval by the Class A Subordinate Voting and Class B Shareholders, the Company completeda court-approved plan of arrangement [the "Arrangement"] in which the Company's dual-class share structure was collapsed.In addition, the transaction: (i) set a termination date and declining fee schedule for the consulting, business development andbusiness services contracts Magna has in place with its Chairman, Frank Stronach and his affiliated entities; and (ii) establisheda partnership with the Stronach group to pursue opportunities in the vehicle electrification business.
[a] Capital Transaction
The Company purchased for cancellation all 1,453,658 outstanding Class B Shares [restated to reflect the stock split],which were held indirectly by the Stronach group, for $300 million in cash and 18.0 million newly issued Class ASubordinate Voting Shares [restated to reflect the stock split]. The newly issued shares held indirectly by the Stronachgroup represented an equal equity ownership and voting interest of 7.4% as of August 31, 2010. The costs related to theArrangement were $10 million, net of tax.
In addition, Magna's Articles were amended to remove the Class B Shares from the authorized capital and to make non-substantive consequential changes, including renaming the Class A Subordinate Voting Shares as Common Shares andeliminating provisions which no longer apply due to the elimination of the Class B Shares.
[b] Vehicle Electrification Partnership
The partnership, Magna E-Car Systems ["E-Car"], involves the engineering, development and integration of electric vehiclesof any type, the development, testing and manufacturing of batteries and battery packs for hybrid and electric vehiclesand all ancillary activities in connection with electric vehicle technologies. Magna's original investment in the partnershipincluded the assets of the Company's recently established E-Car Systems vehicle electrification and battery businessunit, certain other vehicle electrification assets, and $145 million in cash. On August 31, 2010, the Stronach group invested$80 million in cash for a 27% equity interest in the partnership, reducing Magna's equity interest to 73%. For accountingpurposes, the partnership is a variable interest entity. Although voting control of the partnership is held by the Stronachgroup, Magna is considered the primary beneficiary; and as a result, continues to consolidate the partnership.
The impact of the Arrangement on the August 31, 2010 consolidated balance sheet was as follows [restated to reflectthe stock split]:
Class A StronachSubordinate Class B GroupVoting Share Share Investment Net
Issuance Repurchase in E-Car Impact
Number of shares issued (repurchased) 18,000,000 (1,453,658) – 16,546,342
Cash received (paid) (10) (300) 80 (230)
Increase in minority interest – – 80 80
Increase in capital stock 666 – – 666Decrease in retained earnings (676) (300) – (976)Decrease in shareholders' equity (10) (300) – (310)

Magna International Inc. 2010 Annual Report – Financial Statements53
5. RESTRUCTURING AND IMPAIRMENT CHARGES
The Company completes its annual goodwill and long-lived asset impairment analyses in the fourth quarter of each year inconjunction with its annual business planning cycle. Based on this analysis and consideration of other indicators of impairment,the Company recorded goodwill and long-lived asset impairment charges as follows:
2010 2009 2008
North America [a]Long-lived assets $ 7 $ 13 $ 275Goodwill – 100 –
7 113 275
Europe [b]Long-lived assets 16 70 8
$ 23 $ 183 $ 283
[a] North America
For the year ended December 31, 2010
During the fourth quarter of 2010, the Company recorded long-lived asset impairment charges of $7 million [$5 millionafter tax] related to a die casting facility in Canada.
In addition, during 2010, the Company recorded restructuring and rationalization costs of $29 million [$24 million after tax]in costs of goods sold and $3 million [$3 million after tax] in selling, general and administrative expense related to theplanned closure of a powertrain systems facility and two body & chassis systems facilities in the United States,substantially all of which will be paid subsequent to 2010.
For the year ended December 31, 2009
In conjunction with its annual business planning cycle, during the fourth quarter of 2009, the Company determined thatits Car Top Systems ["CTS"] North America reporting unit could potentially be impaired, primarily as a result of: (i) a dramaticreduction in the market for soft tops, hard tops and modular retractable hard tops; and (ii) historical losses that wereprojected to continue throughout the Company's business planning period. Based on the reporting unit's discountedforecast cash flows, the Company recorded a $25 million goodwill impairment charge.
In addition, during the second quarter of 2009, after failing to reach a favourable labour agreement at a powertrain facilityin Syracuse, New York, the Company decided to wind down these operations. Given the significance of the facility's cashflows in relation to the reporting unit, management determined that it was more likely than not that goodwill at itsPowertrain North America reporting unit could potentially be impaired. Therefore, the Company recorded a $75 milliongoodwill impairment charge.
The goodwill impairment charges were calculated by determining the implied fair value of goodwill in the same manneras if it had acquired the Powertrain and CTS reporting units as at June 30, 2009 and December 31, 2009, respectively.
During the fourth quarter of 2009, the Company recorded long-lived asset impairment charges of $13 million [$11 millionafter tax] related to fixed assets at a die casting facility in Canada and an anticipated under recovery of capitalized toolingcosts at a stamping facility in the United States due to significantly lower volumes on certain SUV programs.
During the second quarter of 2009, the Company recorded restructuring costs of $6 million in cost of goods sold [$6million after tax] related to the planned closure of a powertrain facility in Syracuse, New York, substantially all of whichremains to be paid subsequent to 2010.
For the year ended December 31, 2008
During 2008, the Company recorded long-lived asset impairment charges of $275 million [$238 million after tax], relatedprimarily to its powertrain and interior and exterior systems operations in the United States and Canada.
At the Company's powertrain operations, particularly at a facility in Syracuse, New York, asset impairment charges of$189 million [$169 million after tax] were recorded primarily as a result of: (i) a dramatic market shift away from truckprograms, in particular four wheel drive pick-up trucks and SUVs; (ii) excess die-casting, machining and assembly capacity;and (iii) historical losses that were projected to continue throughout the Company's business planning period.

Magna International Inc. 2010 Annual Report – Financial Statements54
At its interiors and exteriors operations, the Company recorded $74 million [$61 million after tax] of asset impairmentcharges primarily as a result of: (i) significantly lower volumes on certain pick-up truck and SUV programs; (ii) the loss ofcertain replacement business; and (iii) historical losses that were projected to continue throughout the Company'sbusiness planning period.
In addition, the Company recorded asset impairment charges of $12 million [$8 million after tax] related to dedicatedassets at a chassis systems facility in Canada and a seating systems facility in the United States.
During 2008, the Company recorded restructuring and rationalization costs of $79 million in cost of goods sold and $5million in selling, general and administrative expense [$60 million after tax] related to the above long-lived assetimpairments and other restructuring activities. Substantially all of the $84 million was paid during 2009.
[b] Europe
For the year ended December 31, 2010
During the fourth quarter of 2010, the Company recorded long-lived asset impairment charges of $16 million [$16 millionafter tax] related to an interiors systems facility in Germany.
For the year ended December 31, 2009
During 2009, the Company recorded long-lived asset impairment charges of $70 million [$70 million after tax] related toits CTS and exterior systems operations in Germany.
At the Company's CTS operations, long-lived asset impairment charges of $59 million [$59 million after tax] were recordedrelated to fixed and intangible assets. The impairment charge was calculated based on CTS' discounted forecast cashflows and was necessary primarily as a result of: (i) a dramatic reduction in the market for soft tops, hard tops and modularretractable hard tops; and (ii) historical losses that were projected to continue throughout the Company's business planningperiod.
At its exteriors operations, the Company recorded an $11 million [$11 million after tax] asset impairment charge relatedto specific under-utilized assets in Germany.
During 2009, the Company recorded restructuring and rationalization costs of $17 million in cost of goods sold and $3million in selling, general and administrative expense [$20 million after tax]. The charges consist primarily of severanceand other termination benefits related to the closure of powertrain and interior systems facilities in Germany, substantiallyall of which was paid in 2010.
For the year ended December 31, 2008
During 2008, the Company recorded an $8 million [$8 million after tax] asset impairment related to the disposal of specificassets at an interior systems facility in the United Kingdom and specific assets at a powertrain facility in Austria.

Magna International Inc. 2010 Annual Report – Financial Statements55
6. EARNINGS (LOSS) PER SHARE
Earnings (loss) per share are computed as follows [restated to reflect the stock split [note 3]]:
2010 2009 2008
Basic earnings (loss) per Common or Class B Share:
Net income (loss) $ 973 $ (493) $ 71
Average number of Common and Class B Sharesoutstanding during the year 230.0 223.6 225.6
Basic earnings (loss) per Common or Class B Share $ 4.23 $ (2.21) $ 0.32
Diluted earnings (loss) per Common or Class B Share [a], [b]:
Net income (loss) $ 973 $ (493) $ 71
Average number of Common and Class B Sharesoutstanding during the year 230.0 223.6 225.6
AdjustmentsStock options and restricted stock [c] 3.0 – 2.2
233.0 223.6 227.8
Diluted earnings (loss) per Common or Class B Share $ 4.18 $ (2.21) $ 0.31
[a] Diluted earnings (loss) per Common or Class B Share exclude Common Shares issuable, only at the Company's option,to settle €100 million of 7.08% Subordinated Debentures which matured during 2009 and were settled with cash.
[b] During 2008, diluted earnings per Common or Class B Share excluded 1.1 million Common Shares issuable to settleCdn$100 million of 6.5% Convertible Subordinated Debentures as the conversion of the debentures would have an anti-dilutive impact to earnings per share. These debentures were redeemed for cash on December 27, 2009.
[c] Diluted earnings (loss) per Common or Class B Share exclude 3.9 million [2009 - 5.2 million; 2008 - 4.1 million] CommonShares issuable under the Company's Incentive Stock Option Plan because these options were not "in-the-money".
7. DETAILS OF CONSOLIDATED STATEMENTS OF CASH FLOWS
[a] Cash and cash equivalents consist of:
2010 2009
Bank term deposits, bankers acceptances and government paper $ 1,565 $ 852Cash 316 417Cash in joint ventures and partnerships 224 65
$ 2,105 $ 1,334

Magna International Inc. 2010 Annual Report – Financial Statements56
[b] Items not involving current cash flows:
2010 2009 2008
Depreciation and amortization $ 661 $ 737 $ 873Amortization of other assets included in cost of goods sold 69 83 78Goodwill and long-lived asset impairments [note 5] 23 183 283Amortization of employee wage buydown [note 14] 19 27 62Other non-cash charges 7 61 105Valuation allowance established against
future tax assets [note 13] – – 123Reclassification of gain on translation of net investment
in foreign operations from accumulatedother comprehensive income [note 21] – – (116)
Curtailment gain [note 17] – (26) –Future income taxes (12) 56 (131)Minority interest (12) – –Equity income (33) (7) (19)
$ 722 $ 1,114 $ 1,258
[c] Changes in non-cash operating assets and liabilities:
2010 2009 2008
Accounts receivable $ (611) $ (40) $ 826Inventories (178) 17 (124)Prepaid expenses and other [note 14] (10) 6 (70)Accounts payable 579 241 (475)Accrued salaries and wages 97 (92) (98)Other accrued liabilities 83 (108) (76)Income taxes payable/receivable 221 (104) (232)Deferred revenue (4) (14) (26)
$ 177 $ (94) $ (275)
8. BUSINESS ACQUISITIONS
Acquisitions in the year ended December 31, 2010
In December 2010, Magna completed the following acquisitions:
[a] Resil Minas, a supplier of seat frames and stampings. The acquired business is primarily located in Brazil with sales tovarious customers, including Fiat, Ford, General Motors, Volkswagen, IVECO and PSA.
[b] Pabsa S.A., a supplier of complete seats, foam products, trim covers and seat structures. The acquired business hasthree production facilities in Argentina.
[c] Erhard & Söhne GmbH, a manufacturer of fuel tanks for commercial vehicles and other specialty tanks. The acquiredbusiness is located in Germany and has sales to various customers including MAN, Daimler and Scania.
The total consideration for these acquisitions and certain other acquisitions was $120 million, consisting of $106 million paidin cash (net of cash acquired) and $14 million of assumed debt.
The net effect of the acquisitions on the Company's 2010 consolidated balance sheet was a decrease in non-cash workingcapital of $45 million, and increases in fixed assets of $69 million, goodwill of $68 million, future tax assets of $4 million, otherassets of $40 million, other long-term liabilities of $5 million, future tax liabilities of $8 million and minority interest of $3 million.
The purchase price allocations for these acquisitions are preliminary and adjustments to the allocations may occur as a resultof obtaining more information regarding asset valuations.
Acquisitions in the year ended December 31, 2009
On May 11, 2009, Magna acquired Cadence Innovation s.r.o., a manufacturer of exterior and interior systems. The acquiredbusiness is primarily located in the Czech Republic with sales to various customers, including Skoda.

Magna International Inc. 2010 Annual Report – Financial Statements57
On June 1, 2009, Magna acquired several facilities from Meridian Automotive Systems Inc. The facilities are located in theUnited States and Mexico and manufacture composites for various customers.
The total consideration for these acquisitions and certain other acquisitions was $136 million, consisting of $50 million paid incash and $86 million of assumed debt.
The net effect of the acquisitions on the Company's 2009 consolidated balance sheet was a decrease in non-cash workingcapital of $3 million, and increases in fixed assets of $116 million, goodwill of $8 million, other assets of $4 million and futuretax liabilities of $7 million.
Acquisitions in the year ended December 31, 2008
On May 30, 2008, Magna acquired a facility from Ogihara America Corporation. The facility in Alabama manufactures majorexterior and structural welded assemblies for sales to various customers, including Mercedes-Benz.
On June 16, 2008, Magna was the successful bidder to acquire a substantial portion of the exteriors business and relatedassets from Plastech Engineered Products Inc., in a Chapter 11 sale out of bankruptcy. The acquired business supplies partsto various customers, including Chrysler, Ford and General Motors, in the United States and Canada.
On October 3, 2008, Magna acquired BluWav Systems LLC, a developer and supplier of electric and energy managementsystems for hybrid electric vehicles, plug-in hybrid vehicles and battery electric vehicles.
On October 31, 2008, Magna acquired Technoplast, a supplier of plastic exterior and interior components. Technoplast islocated in Nizhny Novgorod, Russia and supplies the GAZ Group with components for several programs.
The total consideration for these and certain other acquisitions was $177 million, consisting of $158 million paid in cash and$19 million of assumed debt.
The net effect of the acquisitions on the Company's 2008 consolidated balance sheet was increases in non-cash workingcapital of $23 million, fixed assets of $80 million, goodwill of $27 million, other assets of $50 million and future tax liabilities of$3 million.
Pro forma impact [unaudited]
If the acquisitions completed during 2010 and 2009 occurred on January 1, 2009, the Company's pro forma consolidated salesfor the year ended December 31, 2010 would have been $24 billion [2009 - $18 billion] and the unaudited pro formaconsolidated net income would have been $970 million [2009 - net loss $548 million].
9. INVENTORIES
Inventories consist of:
2010 2009
Raw materials and supplies $ 756 $ 586Work-in-process 209 176Finished goods 252 219Tooling and engineering 679 740
$ 1,896 $ 1,721
Tooling and engineering inventory represents costs incurred on separately priced tooling and engineering services contractsin excess of billed and unbilled amounts included in accounts receivable.

Magna International Inc. 2010 Annual Report – Financial Statements58
10. INVESTMENTS
At December 31, 2010, the Company held Canadian third party ABCP with a face value of Cdn$127 million. These investmentsdid not settle at the scheduled maturity during the third quarter of 2007 due to ABCP market liquidity issues, and as a resultthe Company reclassified its ABCP to long-term investments from cash and cash equivalents.
On January 16, 2009, a restructuring plan was finalized and new restructuring Notes [the "Notes"] were issued in exchangefor existing investments. The Notes issued included: (i) notes in a Master Trust (MAV2 - A Notes), which are rated A by DBRSwith a face amount value of Cdn$102 million; (ii) subordinate notes (MAV2 - B and C Notes) which are unrated with a faceamount value of Cdn$9 million; and (iii) various tracking notes which were issued in exchange for assets deemed ineligible forinclusion in the Master Trust with a face amount value of Cdn$23 million. The criteria for eligibility into the Master Trust includedcredit quality, an expected return of the assets and arrangements with individual asset providers. The performance of thetracking notes is tied directly to actual performance of the specific assets.
The following is a continuity of the Company's investment in ABCP:
2010 2009 2008
Balance, beginning of year $ 85 $ 65 $ 121Valuation adjustment (impairment) [i] – 9 (41)Cash receipts (5) – –Foreign exchange and other 4 11 (15)
$ 84 $ 85 $ 65
[i] The carrying value of this investment was based on a valuation technique estimating the fair value from the perspectiveof a market participant. For the year ended December 31, 2009, the Company recorded a $9 million increase in the carryingvalue of its investment in ABCP in selling, general and administrative expense, due to a reduction of the spread betweenthe anticipated return on the restructured notes and current market indices. For the year ended December 31, 2008, theCompany recorded a $41 million impairment charge in selling, general and administrative expense and $5 million of interestincome on these investments.
11. FIXED ASSETS
Fixed assets consist of:
2010 2009
CostLand $ 226 $ 233Buildings 1,169 1,078Machinery and equipment 9,042 8,718
10,437 10,029Accumulated depreciation
Buildings (434) (404)Machinery and equipment (6,114) (5,814)
$ 3,889 $ 3,811
Included in the cost of fixed assets above are construction in progress expenditures of $465 million [2009 - $523 million] thathave not been depreciated.

Magna International Inc. 2010 Annual Report – Financial Statements59
12. GOODWILL
The following is a continuity of the Company's goodwill by segment:
CorporateNorth Rest of and
America Europe World Other Total
Balance, December 31, 2008 $ 675 $ 409 $ 75 $ 1 $ 1,160Acquisitions [note 8] 6 – 2 – 8Impairments [note 5] (100) – – – (100)Foreign exchange and other 53 12 (1) – 64Balance, December 31, 2009 634 421 76 1 1,132Acquisitions [note 8] – 1 67 – 68Disposals (9) – (5) – (14)Foreign exchange and other 21 (21) 2 – 2Balance, December 31, 2010 $ 646 $ 401 $ 140 $ 1 $ 1,188
13. INCOME TAXES
[a] The provision for income taxes differs from the expense that would be obtained by applying the Canadian statutory incometax rate as a result of the following:
2010 2009 2008
Canadian statutory income tax rate (recovery) 31.0% (33.0)% 33.5%Manufacturing and processing profits deduction (0.6) (0.1) (1.2)Foreign rate differentials (4.3) (4.6) (22.1)Losses not benefited 3.5 26.8 30.3Utilization of losses previously not benefited (9.3) (0.6) (1.0)Earnings of equity investees (0.9) (0.4) (2.0)Goodwill write-off – 6.8 –Valuation allowance on future tax assets [i] (0.3) – 37.5Other 0.6 1.6 3.3Effective income tax rate 19.7% (3.5)% 78.3%
[i] Accounting standards require that the Company assess whether valuation allowances should be established againstits future income tax assets based on the consideration of all available evidence using a "more likely than not" standard.The factors the Company uses to assess the likelihood of realization are its forecast of future taxable income and taxplanning strategies that could be implemented to realize the future tax assets. On a quarterly basis, the Companyevaluates the realizability of future tax assets by assessing its valuation allowance and adjusting the amount of suchallowance as necessary.
During 2008, the Company recorded a $123 million charge to establish valuation allowances against its remainingfuture tax assets in the United States. The Company determined that valuation allowances were required in theUnited States based on: (i) historical consolidated losses at its operations in the United States that are expected tocontinue in the near-term; (ii) the accelerated deterioration of near-term automotive market conditions in the UnitedStates; and (iii) significant and inherent uncertainty as to the timing of when the Company would be able to generatethe necessary level of earnings to recover these future tax assets.
Given the Company's improved financial results in the United States in 2010 and provided that overall economicconditions continue to improve in 2011, the Company expects to reverse a portion of its valuation allowance againstits future tax assets in the United States during 2011. The reversal, if recorded, (i) will result in a decrease in oureffective tax rate in 2011 and a return to a more normalized rate in 2012; and (ii) will not affect our tax payments whichshould remain lower during the period in which these losses are utilized.

Magna International Inc. 2010 Annual Report – Financial Statements60
[b] The details of income (loss) before income taxes by jurisdiction are as follows:
2010 2009 2008
Canadian $ 509 $ 47 $ 200Foreign 688 (558) 128
$ 1,197 $ (511) $ 328
[c] The details of the income tax provision (recovery) are as follows:
2010 2009 2008
CurrentCanadian federal taxes $ 54 $ (33) $ 101Provincial taxes 31 (20) 57Foreign taxes 162 58 107
247 5 265
FutureCanadian federal taxes 7 20 (38)Provincial taxes 5 7 (24)Foreign taxes (23) (50) 54
(11) (23) (8)$ 236 $ (18) $ 257
[d] Future income taxes have been provided on temporary differences, which consist of the following:
2010 2009 2008
Book amortization (in excess of) less than tax amortization $ (20) $ (9) $ 11Tax depreciation less than book depreciation (12) (8) (46)Net tax losses utilized (benefited) 48 (23) (69)Change in valuation allowance on future tax assets (3) – 123Liabilities currently not deductible for tax (27) 4 (32)Reduction in enacted tax rates (2) – –Other 5 13 5
$ (11) $ (23) $ (8)
[e] Future tax assets and liabilities consist of the following temporary differences:
2010 2009
AssetsTax benefit of loss carryforwards
Pre-acquisition $ 49 $ 57Post-acquisition 450 596
Other liabilities 163 128Tax credits carryforward 87 69Unrealized loss on cash flow hedges 7 11Other 44 77
800 938Valuation allowance against tax benefit of loss carryforwards
Pre-acquisition (44) (50)Post-acquisition (413) (535)
Other valuation allowance (193) (185)$ 150 $ 168
LiabilitiesTax depreciation in excess of book depreciation $ 86 $ 104Other assets book value in excess of tax value 22 24Unrealized gain on cash flow hedges 23 13
131 141Net future tax assets $ 19 $ 27

Magna International Inc. 2010 Annual Report – Financial Statements61
[f] Income taxes paid in cash [net of refunds] were $6 million for the year ended December 31, 2010 [2009 - $16 million;2008 - $437 million].
[g] At December 31, 2010, the Company had gross income tax loss carryforwards of $1.5 billion which relate to certainforeign subsidiaries, including $118 million of losses obtained on acquisitions, the tax benefits of which have not beenrecognized in the consolidated financial statements. Of the total losses, $734 million expire between 2011 and 2030 whilethe remainder have no expiry date.
14. OTHER ASSETS
Other assets consist of:
2010 2009
Preproduction costs related to long-term supply agreementswith contractual guarantee for reimbursement $ 329 $ 433
Long-term receivables 77 50Patents and licenses, net 34 20Employee wage buydown, net [a] 6 25Other, net [note 8] 134 123
$ 580 $ 651
[a] Under the terms of a collective bargaining agreement, employees agreed to accept lump-sum cash payments in returnfor lower wages and benefits over the four-year term of the union contract at a powertrain facility. Given that the Companywill benefit from these lump-sum payments over the term of the union contract, the committed amounts were capitalizedin other assets. The capitalized amounts are being amortized over the term of the collective bargaining agreement basedon estimated employment levels.
15. WARRANTY
The following is a continuity of the Company's warranty accruals:
2010 2009 2008
Balance, beginning of year $ 75 $ 75 $ 103Expense (income), net 33 31 (2)Settlements (37) (35) (23)Foreign exchange and other (2) 4 (3)
$ 69 $ 75 $ 75
16. DEBT AND COMMITMENTS
[a] The Company's long-term debt, which is substantially uncollateralized, consists of the following:
2010 2009
Bank term debt at a weighted average interest rateof approximately 10.7% [2009 - 3.4%],denominated primarily in euros $ 13 $ 67
Government loans at a weighted average interest rateof approximately 2.0% [2009 - 2.3%], denominated primarily in euros 14 20
Other 44 4471 131
Less due within one year 25 16$ 46 $ 115

Magna International Inc. 2010 Annual Report – Financial Statements62
[b] Future principal repayments on long-term debt are estimated to be as follows:
2011 $ 252012 112013 62014 72015 3Thereafter 19
$ 71
[c] On October 12, 2005, the Company entered into a $2.0 billion five-year revolving term facility, of which $1.9 billion wasunused and available at year end. In July 2007, the facility was extended to July 31, 2012. The facility has a North Americantranche of $1.57 billion, a European tranche of €300 million and an Asian tranche of $50 million.
Under the terms of the Company's operating and term credit agreements, it is permitted to make use of banker'sacceptances and commercial paper to borrow at effective interest rates which are, from time to time, lower than thosecharged under the bank lines of credit.
[d] Interest (income) expense, net includes:
2010 2009 2008
Interest expenseCurrent $ 9 $ 11 $ 19Long-term 3 16 32
12 27 51Interest income (22) (20) (113)Interest (income) expense, net $ (10) $ 7 $ (62)
[e] Interest paid in cash was $12 million for the year ended December 31, 2010 [2009 - $27 million; 2008 - $43 million].
[f] At December 31, 2010, the Company had commitments under operating leases with MI Developments Inc. ["MID"] [note 25]and third parties requiring annual rental payments as follows:
ThirdMID parties Total
2011 $ 172 $ 123 $ 2952012 171 99 2702013 168 80 2482014 159 62 2212015 157 43 200Thereafter 452 79 531
$ 1,279 $ 486 $ 1,765
For the year ended December 31, 2010, operating lease expense was $304 million [2009 - $280 million; 2008 - $296 million],of which $172 million related to MID [2009 - $149 million; 2008 - $156 million].
[g] During 2003, one of the Company's German subsidiaries entered into an operating lease for a facility constructed at a costof approximately $12 million. The lessor in this arrangement leased the assets from a partnership that is substantiallydebt financed, which is owned directly and indirectly by the lessor. Although the Company's German subsidiary hasoptions to acquire either the facility under lease or the partnership, the Company's obligations under this arrangement arelimited to those in its operating lease agreement. Although this arrangement qualifies as a variable interest entity, theCompany has concluded that it is not the primary beneficiary under the agreement and has, therefore, not consolidatedthe entity.

Magna International Inc. 2010 Annual Report – Financial Statements63
17. OTHER LONG-TERM LIABILITIES
Other long-term liabilities consist of:
2010 2009 2008
Defined benefit pension plans and other [a] $ 39 $ 35 $ 29Termination and long service arrangements [b] 202 194 184Retirement medical benefits plans [c] 65 66 85
306 295 298Asset retirement obligation 43 42 36Long-term portion of fair value of hedges 18 32 89
$ 367 $ 369 $ 423
[a] Defined benefit pension plans
The Company sponsors a number of defined benefit pension plans and similar arrangements for its employees. All pensionplans are funded to at least the minimum legal funding requirements, while European defined benefit pension plans areunfunded.
The weighted average significant actuarial assumptions adopted in measuring the Company's obligations and costs areas follows:
2010 2009 2008
Projected benefit obligationDiscount rate 5.5% 5.8% 6.3%Rate of compensation increase 2.6% 3.6% 3.6%
Net periodic benefit costDiscount rate 5.9% 6.3% 6.4%Rate of compensation increase 3.5% 3.6% 3.7%Expected return on plan assets 7.7% 7.4% 7.8%
Information about the Company's defined benefit pension plans is as follows:
2010 2009 2008
Projected benefit obligationBeginning of year $ 310 $ 254 $ 305Current service cost 11 9 19Interest cost 18 16 16Actuarial (gains) losses and changes in actuarial assumptions (5) 32 (16)Benefits paid (17) (14) (10)Special termination benefit 8 – –Acquisition 5 – –Divestitures – – (8)Settlement – – (35)Currency translation 2 13 (17)
End of year $ 332 $ 310 $ 254
Plan assets at fair valueBeginning of year $ 218 $ 176 $ 279Return on plan assets 25 37 (54)Employer contributions 21 13 17Benefits paid (15) (13) (10)Divestiture – – (7)Settlement – (5) (35)Currency translation 4 10 (14)
End of year $ 253 $ 218 $ 176
Unfunded amount $ 79 $ 92 $ 78Unrecognized actuarial losses (40) (57) (49)Net amount recognized in the consolidated balance sheets $ 39 $ 35 $ 29

Magna International Inc. 2010 Annual Report – Financial Statements64
2010 2009 2008
Net periodic benefit costCurrent service cost $ 11 $ 9 $ 19Interest cost 18 16 16Return on plan assets (17) (14) (19)Actuarial losses (gains) 2 2 (1)Special termination benefit 8 – –Curtailment gain – – (2)
Net periodic benefit cost $ 22 $ 13 $ 13
[b] Termination and long service arrangements
Pursuant to labour laws and national labour agreements in certain European countries and Mexico, the Company isobligated to provide lump sum termination payments to employees on retirement or involuntary termination, and longservice payments contingent upon persons reaching a predefined number of years of service.
All lump sum termination and long service payment arrangements are unfunded. However, pursuant to local tax laws,Austrian subsidiaries hold long-term government securities in connection with their unfunded obligations. Such assetsamounted to $5 million at December 31, 2010 [2009 - $7 million] and are included in investments on the Company'sconsolidated balance sheets.
The weighted average significant actuarial assumptions adopted in measuring the Company's projected termination andlong service benefit obligations and net periodic benefit cost are as follows:
2010 2009 2008
Discount rate 4.9% 6.2% 6.2%Rate of compensation increase 3.9% 4.1% 3.9%
Information about the Company's termination and long service arrangements is as follows:
2010 2009 2008
Projected benefit obligationBeginning of year $ 210 $ 208 $ 211Current service cost 13 13 17Interest cost 11 12 10Actuarial losses (gains) and changes in actuarial assumptions 33 (4) 11Benefits paid (12) (25) (27)Currency translation (12) 6 (14)
End of year $ 243 $ 210 $ 208
Unfunded amount $ 243 $ 210 $ 208Unrecognized actuarial losses (41) (16) (24)Net amount recognized in the consolidated balance sheets $ 202 $ 194 $ 184
Net periodic benefit costCurrent service cost $ 13 $ 13 $ 17Interest cost 11 12 10Actuarial losses 1 1 –
Net periodic benefit cost $ 25 $ 26 $ 27
[c] Retirement medical benefits plans
Historically, the Company sponsored a retirement medical benefits plan that covered eligible employees and retirees.Retirees age 60 or older with 10 or more years of service were eligible for benefits, and existing retirees as at August 1,2000 that met the above criteria were also eligible for benefits. Benefits were capped based on years of service. During2009, the Company amended these plans such that substantially all employees retiring on or after August 1, 2009 will nolonger participate in the plan and a curtailment gain was recorded during 2009.
In addition, the Company sponsors a number of retirement medical plans which were assumed on certain acquisitions inprior years. These plans are frozen to new employees and incur no current service costs.

Magna International Inc. 2010 Annual Report – Financial Statements65
The weighted average discount rates used in measuring the Company's projected retirement medical benefit obligationsand net periodic benefit cost are as follows:
2010 2009 2008
Retirement medical benefit obligations 5.4% 5.7% 6.3%Net periodic benefit cost 5.7% 6.0% 6.3%Health care cost inflation 9.2% 9.3% 9.3%
Information about the Company's retirement medical benefits plans is as follows:
2010 2009 2008
Projected benefit obligationBeginning of year $ 43 $ 73 $ 79Current service cost – 1 4Interest cost 2 3 5Actuarial losses (gains) and changes in actuarial assumptions 1 3 (7)Benefits paid (3) (3) (2)Curtailment – (36) –Currency translation – 2 (6)
End of year $ 43 $ 43 $ 73
Unfunded amount $ 43 $ 43 $ 73Unrecognized past service obligation 4 3 (9)Unrecognized actuarial gains 18 20 21Net amount recognized in the consolidated balance sheets $ 65 $ 66 $ 85
Net periodic benefit costCurrent service cost $ – $ 1 $ 4Interest cost 2 3 5Actuarial (gains) losses (1) 2 (2)Curtailment gain – (26) –Past service cost amortization – – 1
Net periodic benefit cost $ 1 $ (20) $ 8
The effect of a one-percentage point increase or decrease in health care trend rates would not have a significant impacton the Company's income.
[d] Future benefit payments
TerminationDefined and long Retirementbenefit service medical
pension plans arrangements benefits plans Total
Expected employer contributions - 2011 $ 10 $ 8 $ 2 $ 20
Expected benefit payments:2011 $ 10 $ 8 $ 2 $ 202012 12 9 2 232013 12 10 2 242014 13 14 3 302015 13 15 3 31Thereafter 81 100 12 193
$ 141 $ 156 $ 24 $ 321

Magna International Inc. 2010 Annual Report – Financial Statements66
[e] Plan assets
The asset allocation of the Company's defined benefit pension plans at December 31, 2010 and 2009, and the targetallocation for 2011 is as follows:
2011 2010 2009
Equity securities 50-75% 50% 65%Fixed income securities 5-45% 21% 33%Cash and cash equivalents 0-40% 29% 2%
100% 100% 100%
The expected rate of return on plan assets was determined by considering the Company's current investment mix, thehistoric performance of these investment categories and expected future performance of these investment categories.
18. STOCK-BASED COMPENSATION
[a] Incentive Stock Option Plan
The Company currently has two incentive stock option plans in effect: (a) the 2009 Stock Option Plan, which was adoptedby our shareholders on May 6, 2010; and (b) the Amended and Restated Incentive Stock Option Plan (the "1987 StockOption Plan"), which was adopted by shareholders on December 10, 1987, and subsequently amended on May 18, 2000and May 10, 2007.
Upon adoption of the 2009 Plan, new grants under the 1987 Plan were frozen, but all outstanding options were permittedto continue to vest and be exercisable in accordance with their terms.
2009 Stock Option Plan
Under the 2009 Stock Option Plan, the Company may grant options to purchase Common Shares to full-time employees,outside directors or consultants of the Company and its subsidiaries. The maximum number of shares that can be reservedfor issuance under the option plan is 16,000,000 shares. The number of shares available to be granted at December 31,2010 was 9,659,000 [2009 - n/a]. All options granted are for terms of up to seven years from the grant date. Optionsissued under the 2009 Option Plan to employees and consultants generally vest as to one-third on each of the first threeanniversaries of the date of grant. Options issued to outside directors vest on the first anniversary of the date of grant.All options allow the holder to purchase Common Shares at a price equal to or greater than the closing market price ofsuch shares on the date prior to the date of the grant.
1987 Stock Option Plan
Under the 1987 Stock Option Plan, the Company granted options to purchase Common Shares to full-time employees,outside directors or consultants of the Company. The number of shares available to be granted at December 31, 2010 was230,824 [2009 - 62,824]. All options granted are for terms of up to seven years from the grant date except for the optionsgranted prior to December 2003, which were generally for terms of up to 10 years from the grant date. Only optionsgranted during 2009 remain unvested. Such options vest 33% on the first and second anniversaries of the date of grantand 34% on the third anniversary. All options allow the holder to purchase Common Shares at a price equal to or greaterthan the closing market price of such shares on the date prior to the date of the grant or modification.

Magna International Inc. 2010 Annual Report – Financial Statements67
The following is a continuity schedule of options outstanding [number of options in the table below are expressed inwhole numbers and the entire table has been restated to reflect the stock split [note 3]]:
Options outstandingWeighted
average NumberNumber exercise of options
of options price exercisable
Outstanding at December 31, 2007 5,884,406 Cdn$41.33 5,825,754Granted 20,000 27.57 –Exercised (3,226) 27.50 (3,226)Cancelled (408,890) 45.18 (408,890)Vested – – 34,652Outstanding at December 31, 2008 5,492,290 Cdn$41.01 5,448,290Granted 2,150,000 16.55 –Exercised [i] (93,578) 31.51 (93,578)Cancelled [i] (398,168) 32.36 (378,168)Vested – – 12,000Outstanding at December 31, 2009 7,150,544 Cdn$34.26 4,988,544Granted 6,341,000 34.04 –Exercised (1,504,616) 34.31 (1,504,616)Cancelled [ii] (844,478) 33.04 (844,478)Vested – – 722,666Outstanding at December 31, 2010 11,142,450 Cdn$34.22 3,362,116
The total intrinsic value of options exercised during 2010 was $14 million [2009 - $nil; 2008 - $nil].
[i] On August 12, 2009, following approval by the Company's Corporate Governance and Compensation Committeeand in accordance with the Amended and Restated Incentive Stock Option Plan, the Company granted stockappreciation rights ["SARs"] to certain executives in respect of 383,400 previously granted and unexercised stockoptions.
On August 14, 2009, 332,822 SARs were exercised and an equal number of previously granted and unexercisedstock options were surrendered and cancelled. On exercise of the SARs, the executives received, in aggregate, cashof $1 million, representing an amount equal to the difference between the aggregate fair market value of the sharescovered by the surrendered options and the aggregate exercise price of such surrendered options. Fair market valuewas determined based on the weighted average closing price of the Company's Common Shares on the NYSE forthe five consecutive trading days ending on the trading day immediately prior to the date of exercise.
In addition, during the third quarter of 2009, 50,578 SARs were cancelled upon exercise of the corresponding numberof options.
[ii] On November 8, 2010, options to acquire 386,666 Common Shares were surrendered for cancellation in exchangefor payment of the in-the-money value of such options on such date. The aggregate in-the-money value of the optionssurrendered was $8 million and was charged to contributed surplus.
On August 19, 2010, options to acquire 243,000 Common Shares were surrendered for cancellation in exchange forpayment of the in-the-money value of such options on such date. The aggregate in-the-money value of the optionssurrendered was $4 million and was charged to contributed surplus.

Magna International Inc. 2010 Annual Report – Financial Statements68
At December 31, 2010, the outstanding options consist of [number of options in the table below are expressed in wholenumbers and have been restated to reflect the stock split [note 3]]:
Options outstandingRemaining Number
Number contractual of optionsof options life [years] exercisable
$15 to $20 1,796,670 5.2 363,336$20 to $25 – – –$25 to $30 5,384,700 5.8 334,700$30 to $35 54,016 1.5 54,016$35 to $40 81,320 6.0 9,320$40 to $45 327,778 1.8 325,778$45 to $50 2,225,000 1.0 2,223,000$50 to $55 1,241,000 6.9 20,000Over $55 31,966 1.5 31,966
11,142,450 3,362,116Weighted average exercise price Cdn$34.22 Cdn$42.06Aggregate intrinsic value at December 31, 2010 $ 197 $ 33
The weighted average assumptions used in measuring the fair value of stock options granted or modified and thecompensation expense recorded in selling, general and administrative expenses are as follows:
2010 2009 2008
Risk-free interest rate 2.26% 1.66% 2.71%Expected dividend yield 2.00% 2.05% 2.02%Expected volatility 35% 31% 27%Expected time until exercise 4 years 4 years 4 years
Weighted average fair value of options grantedor modified in year (Cdn$) [restated - note 3] $ 10.00 $ 3.60 $ 5.38
Compensation expense recorded in selling,general and administrative expense [iii] $ 43 $ 4 $ –
[iii] During 2010, option agreements with three departing executives were modified resulting in a one-time charge tocompensation expense of $20 million. These charges represent the fair value of the options at the date of modificationnet of originally measured compensation cost which has been reversed.
[b] Long-term retention program
The Company awarded certain executives an entitlement to Common Shares in the form of restricted stock. Such sharesbecome available to the executives, subject to acceleration on death or disability, after an approximate four-year holdingperiod, provided certain conditions are met, and are to be released in equal amounts over a 10-year period, subject toforfeiture under certain circumstances. The stock that has not been released to the executives is reflected as a reductionin the stated value of the Company's Common Shares.
Information about the Company's long-term retention program is as follows:
2010 2009 2008
Common Shares awarded and not released [restated - note 3] 1,182,736 1,371,978 1,561,218
Reduction in stated value of Common Shares $ 39 $ 45 $ 51
Compensation expense recorded in selling,general and administrative expense $ 7 $ 8 $ 12
Unamortized compensation expense recordedas a reduction of shareholders' equity $ 23 $ 30 $ 36

Magna International Inc. 2010 Annual Report – Financial Statements69
[c] Restricted stock unit program
In a number of different circumstances, the Company awarded restricted stock units ["RSUs"] to certain executives andother employees as part of the Company's compensation program. These RSUs are notional units, each of which isequivalent to one Magna Common Share. In most cases, the RSUs are redeemable solely at the Company's option, eitherby delivery of the specified number of Common Shares or the cash value on the redemption date [based on the 20-dayweighted average trading price]. Redemption of the RSUs generally occurs on December 15 of the second year after thedate of grant, subject to earlier redemption or cancellation in specified circumstances. In some cases, RSUs are subjectto vesting and other conditions and quarterly dividend equivalents are paid to the grantees.
19. CAPITAL STOCK
[a] At December 31, 2010, the Company's authorized, issued and outstanding capital stock is as follows:
Preference shares - issuable in series -
The Company's authorized capital stock includes 99,760,000 preference shares, issuable in series. None of these sharesare currently issued or outstanding.
Common Shares and Class B Shares -
In accordance with the Arrangement [note 4], Magna's Articles were amended to remove the Class B Shares from theauthorized capital and to make non-substantive consequential changes to its Articles, including renaming the Class ASubordinate Voting Shares as Common Shares and eliminating provisions which no longer apply due to the elimination ofthe Class B Shares.
Common Shares without par value [unlimited amount authorized] have the following attributes:
[i] Each share is entitled to one vote per share at all meetings of shareholders.[ii] Each share shall participate equally as to dividends.
[b] On November 9, 2010, the TSX accepted the Company's Notice of Intention to Make a Normal Course Issuer Bid relatingto the purchase for cancellation to offset dilution resulting from the exercise of stock options, as well as purchases to fundthe Company's restricted stock unit program and/or the Company's obligations to its deferred profit sharing plans, of upto 8,000,000 Magna Common Shares [the "Bid"], representing 3.3% of the Company's issued and outstanding CommonShares. The Bid commenced on November 11, 2010 and will terminate no later than November 10, 2011. All purchasesof Common Shares are made at the market price at the time of purchase in accordance with the rules and policies of theTSX. Purchases may also be made on the NYSE in compliance with Rule 10b-18 under the U.S. Securities Exchange Actof 1934.
The Company previously had normal course issuer bids in place from November 10, 2007 to November 11, 2008 and fromNovember 12, 2008 to November 11, 2009.

Magna International Inc. 2010 Annual Report – Financial Statements70
[c] Changes in capital stock consist of the following [number of shares in the following table are expressed in whole numbersand have been restated to reflect the stock split [note 3]]:
Common Class BNumber of Stated Number of Stated
shares value shares value
Issued and outstanding at December 31, 2007 230,688,368 $ 3,708 1,453,658 $ –Release of restricted stock – 10Issued under the RSU programs [i] – 5Issued under the DRIP [ii] 55,984 2Issued under the Incentive Stock Option Plan 3,226 –Repurchase for restricted stock
and RSU programs [i] – (2)Repurchased – (4)Repurchase and cancellation under
normal course issuer bid [iii] (6,989,460) (114)Issued and outstanding at December 31, 2008 223,758,118 3,605 1,453,658 –Release of restricted stock – 6Issued under the DRIP [ii] 14,366 –Issued under the Incentive Stock Option Plan 93,578 2Issued and outstanding at December 31, 2009 223,866,062 3,613 1,453,658 –Repurchase and cancellation under
the Arrangement [note 4] – – (1,453,658)Issued under the Arrangement [note 4] 18,000,000 676Costs of the Arrangement [note 4] – (10)Release of restricted stock – 6Issued under the Incentive Stock Option Plan 1,504,616 59Issued under the DRIP [ii] 38,458 2Repurchase and cancellation (391,020) (3)Repurchase and cancellation under
normal course issuer bid [iii] (453,500) (8)Issued and outstanding at December 31, 2010 242,564,616 $ 4,335 – $ –
[i] During 2008, the Company purchased 65,304 Magna Common Shares for aggregate cash consideration of $2 million.A portion of these shares were awarded to certain executives under the restricted stock program and a portion ofthese shares are being held in trust for purposes of the Company's RSU program and are reflected as a reduction inthe stated value of the Company's Common Shares. During 2008, the Company issued 99,208 Magna CommonShares from the trust to settle amounts owing under the Company's RSU program.
[ii] The Company has a Dividend Reinvestment Plan ["DRIP"] whereby shareholders have the option to receive theirdividends in the form of Common Shares in lieu of cash.
[iii] During 2010, the Company purchased for cancellation 453,500 [2008 - 6,989,460] Common Shares under a normalcourse issuer bid for cash consideration of $23 million [2008 - $245 million]. The excess of cash paid over the bookvalue of the Common Shares repurchased of $13 million [2008 - $98 million] was charged to retained earnings.
[d] The following table presents the maximum number of shares that would be outstanding if all the dilutive instrumentsoutstanding at March 14, 2011 were exercised or converted:
Common Shares 242,771,789Stock options [note 18] 10,065,577
252,837,366

Magna International Inc. 2010 Annual Report – Financial Statements71
20. CONTRIBUTED SURPLUS
Contributed surplus consists primarily of accumulated stock option compensation expense less the fair value of options at thegrant date that have been exercised and credited to Common Shares and the accumulated restricted stock compensationexpense. The following is a continuity schedule of contributed surplus:
2010 2009 2008
Balance, beginning of year $ 63 $ 67 $ 58Stock-based compensation expense [note 18] 51 10 19Exercise of options (11) – –Release of restricted stock (6) (6) (10)In-the-money value of surrendered options [note 18] (12) – –Redemption of restricted stock units – (7) –Exercise of stock appreciation rights [note 18] – (1) –
$ 85 $ 63 $ 67
21. ACCUMULATED OTHER COMPREHENSIVE INCOME
The following is a continuity schedule of accumulated other comprehensive income:
2010 2009 2008
Accumulated net unrealized gains on translationof net investment in foreign operations
Balance, beginning of year $ 854 $ 447 $ 1,360Net unrealized gains (losses) on translation
of net investment in foreign operations 18 407 (765)Reclassification of gain on translation of net investment
in foreign operations to net income [a] – – (116)Repurchase of shares [note 19] (3) – (32)Balance, end of year 869 854 447
Accumulated net unrealized gains (losses)on cash flow hedges [b]
Balance, beginning of year (13) (113) (10)Net unrealized gains (losses) on cash flow hedges 81 41 (102)Reclassification of net (gains) losses on cash flow hedges
to net income (loss) (28) 59 (1)Balance, end of year 40 (13) (113)
Accumulated net unrealized gainon available-for-sale investments
Balance, beginning of year – – –Net unrealized gain on investments 11 – –Balance, end of year 11 – –
Total accumulated other comprehensive income [c] $ 920 $ 841 $ 334
[a] In the normal course of business, the Company reviews its cash investment strategies, including where such funds areinvested. As a result of these reviews, during 2008, the Company repatriated funds from Europe and as a result recordedforeign currency gains in selling, general and administrative expense of $116 million.
[b] The amount of income tax (obligation) benefit that has been netted in the amounts above is as follows:
2010 2009 2008
Balance, beginning of year $ (2) $ 48 $ 4Net unrealized (gains) losses on cash flow hedges (23) (27) 42Reclassification of net (losses) gains on cash flow hedges
to net income (loss) 8 (23) 2Balance, end of year $ (17) $ (2) $ 48
[c] The amount of other comprehensive income that is expected to be reclassified to net income during 2011 is $35 million[net of income tax of $10 million].

Magna International Inc. 2010 Annual Report – Financial Statements72
22. CAPITAL DISCLOSURES
The Company manages capital in order to ensure it has adequate borrowing capacity and financial structure to allow financialflexibility and to provide an adequate return to shareholders. In order to maintain or adjust the capital structure, the Companymay adjust the amount of dividends paid to shareholders, issue new shares, purchase shares for cancellation or increase ordecrease the amount of debt outstanding.
The Company monitors capital using the ratio of debt to total capitalization. Debt includes bank indebtedness and long-termdebt as shown in the consolidated balance sheets. Total capitalization includes debt, minority interest and all components ofshareholders' equity.
The Company's capitalization and debt to total capitalization is as follows:
2010 2009
LiabilitiesBank indebtedness $ 26 $ 48Long-term debt due within one year 25 16Long-term debt 46 115
97 179Minority interest 74 –Shareholders' equity 8,065 7,360Total capitalization $ 8,236 $ 7,539
Debt to total capitalization 1.2% 2.4%
23. FINANCIAL INSTRUMENTS
[a] Foreign exchange contracts
At December 31, 2010, the Company had outstanding foreign exchange forward contracts representing commitments tobuy and sell various foreign currencies. Significant commitments are as follows:
For Canadian dollars For U.S. dollarsU.S. Weighted Weighted Weighted
Buy dollar average Euro average Peso average(Sell) amount rate amount rate amount rate2011 171 1.0282 15 1.3326 1,518 0.07362011 (461) 1.0462 (68) 1.4314 (180) 0.08092012 41 1.0551 9 1.3703 1,194 0.07082012 (162) 1.0579 (31) 1.5366 – –2013 34 1.0649 3 1.3771 349 0.07192013 (94) 1.0588 (12) 1.4276 – –2014 14 1.0698 1 1.3767 – –
(457) (83) 2,881
For eurosU.S. Weighted Weighted Czech Weighted Polish Weighted
Buy dollar average GBP average Koruna average Zlotys average(Sell) amount rate amount rate amount rate amount rate2011 130 0.7480 7 1.1760 91 0.0390 40 0.23832011 (92) 0.7357 (58) 1.2327 (1,864) 0.0381 (130) 0.24432012 42 0.7632 3 1.0992 – – 25 0.23142012 (13) 0.7133 (37) 1.2011 (1,599) 0.0386 (92) 0.23892013 20 0.7615 1 1.1447 – – – –2013 (10) 0.7208 (21) 1.1861 (686) 0.0396 (14) 0.23522014 (8) 0.7460 – – – – (4) 0.2248
69 (105) (4,058) (175)
Based on forward foreign exchange rates as at December 31, 2010 for contracts with similar remaining terms to maturity,the gains and losses relating to the Company's foreign exchange forward contracts recognized in other comprehensiveincome are approximately $98 million and $30 million, respectively [note 21].
The Company does not enter into foreign exchange forward contracts for speculative purposes.

Magna International Inc. 2010 Annual Report – Financial Statements73
[b] Natural gas swap contracts
The Company uses natural gas swap contracts to manage the cash flow risk of a portion of its forecasted natural gaspurchases in Canada and the United States over the period to December 2014. Swaps outstanding at December 31, 2010have a total volume of 2.4 million Gigajoule ["GJ"] with a fixed price range of between $5.99 per GJ and $8.51 per GJ forCanada and a total volume of 1.8 million MMBTU ["Million British Thermal Units"] with a fixed price range of between $6.25per MMBTU and $8.32 per MMBTU for the United States. The unrealized losses on these natural gas swap contracts atDecember 31, 2010 were $11 million and are recognized in other comprehensive income [note 21].
The Company does not enter into natural gas swap contracts for speculative purposes.
[c] Financial assets and liabilities
The Company's financial assets and liabilities consist of the following:
2010 2009
Held-for-tradingCash and cash equivalents $ 2,105 $ 1,334Investment in ABCP [note 10] 84 85
$ 2,189 $ 1,419
Held-to-maturity investmentsSeverance investments $ 5 $ 7
Available-for-sale investmentsEquity investments $ 19 $ 5
Loans and receivablesAccounts receivable $ 3,645 $ 3,062Long-term receivables included in other assets [note 14] 77 50
$ 3,722 $ 3,112
Other financial liabilitiesBank indebtedness $ 26 $ 48Long-term debt (including portion due within one year) 71 131Accounts payable 3,586 3,001
$ 3,683 $ 3,180
Derivatives designated as effective hedges, measured at fair valueForeign currency contracts
Prepaid expenses $ 58 $ 49Other assets 40 14Other accrued liabilities (17) (42)Other long-term liabilities (13) (29)
68 (8)Natural gas contracts
Other accrued liabilities (6) (5)Other long-term liabilities (5) (3)
(11) (8)$ 57 $ (16)
[d] Fair value
The Company determined the estimated fair values of its financial instruments based on valuation methodologies itbelieves are appropriate; however, considerable judgment is required to develop these estimates. Accordingly, theseestimated fair values are not necessarily indicative of the amounts the Company could realize in a current market exchange.The estimated fair value amounts can be materially affected by the use of different assumptions or methodologies. The methodsand assumptions used to estimate the fair value of financial instruments are described below:
Cash and cash equivalents, accounts receivable, bank indebtedness and accounts payable.
Due to the short period to maturity of the instruments, the carrying values as presented in the consolidated balance sheetsare reasonable estimates of fair values.

Magna International Inc. 2010 Annual Report – Financial Statements74
Investments
At December 31, 2010, the Company held Canadian third party asset-backed commercial paper ["ABCP"] with a face valueof Cdn$127 million [December 31, 2009 - Cdn$134 million]. The carrying value and estimated fair value of this investmentwas Cdn$84 million [December 31, 2009 - Cdn$88 million]. As fair value information is not readily determinable for theCompany's investment in ABCP, the fair value was based on a valuation technique estimating the fair value from theperspective of a market participant [note 10].
At December 31, 2010, the Company held available-for-sale equity investments in publicly traded companies. The carryingvalue and fair value of these investments was $19 million, which was based on the closing share prices of theseinvestments on December 31, 2010.
Term debt
The Company's term debt includes $25 million due within one year. Due to the short period to maturity of this debt, thecarrying value as presented in the consolidated balance sheets is a reasonable estimate of its fair value. The fair value ofthe Company's long-term debt, based on current rates for debt with similar terms and maturities, is not materially differentfrom its carrying value.
[e] Credit risk
The Company's financial assets that are exposed to credit risk consist primarily of cash and cash equivalents, accountsreceivable, long-term receivables, held-to-maturity investments and foreign exchange forward contracts with positive fairvalues.
Cash and cash equivalents, which consist of short-term investments, are only invested in governments, bank termdeposits and bank commercial paper with an investment grade credit rating. Credit risk is further reduced by limiting theamount which is invested in certain governments or any major financial institution.
The Company's held-for-trading investments include an investment in ABCP [note 10]. Given the continuing uncertaintiesregarding the value of the underlying assets, the amount and timing of cash flows and the risk of collateral calls in the eventthat spreads widened considerably, the Company could be exposed to further losses on its investment.
The Company is also exposed to credit risk from the potential default by any of its counterparties on its derivativeinstruments. The Company mitigates this credit risk by dealing with counterparties who are major financial institutions thatthe Company anticipates will satisfy their obligations under the contracts.
In the normal course of business, the Company is exposed to credit risk from its customers, substantially all of which arein the automotive industry and are subject to credit risks associated with the automotive industry. For the year endedDecember 31, 2010, sales to the Company's six largest customers [including the Detroit 3] represented 81% of theCompany's total sales; and substantially all of its sales are to customers in which the Company has ongoing contractualrelationships.
[f] Currency risk
The Company is exposed to fluctuations in foreign exchange rates when manufacturing facilities have committed to thedelivery of products for which the selling price has been quoted in currencies other than the facilities' functional currency,or when materials and equipment are purchased in currencies other than the facilities' functional currency. In an effort tomanage this net foreign exchange exposure, the Company employs hedging programs, primarily through the use offoreign exchange forward contracts [note 23[a]].
As at December 31, 2010, the net foreign exchange exposure was not material.
[g] Interest rate risk
The Company is not exposed to significant interest rate risk due to the short-term maturity of its monetary current assetsand current liabilities. In particular, the amount of interest income earned on cash and cash equivalents is impacted moreby investment decisions made and the demands to have available cash on hand, than by movements in interest rates overa given period.
In addition, the Company is not exposed to interest rate risk on its long-term debt instruments as the interest rates onthese instruments are fixed.

Magna International Inc. 2010 Annual Report – Financial Statements75
24. INTERESTS IN JOINTLY CONTROLLED ENTITIES
The following is the Company's combined proportionate share of the major components of the financial statements of thejointly controlled entities in which the Company has an interest [before eliminations]:
Balance Sheets2010 2009
Current assets $ 269 $ 216
Long-term assets $ 68 $ 73
Current liabilities $ 132 $ 99
Long-term liabilities $ 50 $ 39
Statements of Income2010 2009 2008
Sales $ 709 $ 578 $ 757Cost of goods sold, expenses and income taxes 558 473 618Net income $ 151 $ 105 $ 139
Statements of Cash Flows2010 2009 2008
Cash provided from (used for):Operating activities $ 165 $ 117 $ 134
Investment activities $ (7) $ (17) $ (7)
Financing activities $ (133) $ (110) $ (126)
The Company's share of equity in the jointly controlled entities includes undistributed earnings of $102 million [2009 - $104 million].
25. TRANSACTIONS WITH RELATED PARTIES
Mr. Frank Stronach, together with three other members of the Stronach family, are trustees and members of the class ofpotential beneficiaries of the Stronach Trust. Prior to the completion of the Arrangement [note 4], the Stronach Trust indirectlycontrolled Magna through the right to direct the votes attaching to 100% of Magna's Class B Shares. In addition, the StronachTrust controls MID and controlled Magna Entertainment Corp. ["MEC"] prior to its bankruptcy, through the right to direct thevotes attaching to approximately 66% of MID's Class B Shares. In the normal course of business, Magna leases various landand buildings from MID under operating lease agreements, which are effected on normal commercial terms [note 16]. The leasesare measured at the exchange amount, which is the amount of consideration established and agreed to by the related parties.Lease expense related to MID for 2010 was $172 million [2009 - $149 million; 2008 - $156 million]. Included in accountspayable are trade amounts owing to MID and its subsidiaries of $1.6 million [2009 - $0.5 million]. Included in accounts receivableare amounts owed from MEC of $nil [2009 - $1.1 million].
The Company has agreements with affiliates of the Chairman of the Board for the provision of business development andconsulting services. In addition, the Company has an agreement with the Chairman of the Board for the provision of businessdevelopment and other services. The cost of these agreements is measured at the exchange amount. In addition, theArrangement set a termination date and declining fee schedule for the consulting, business development and business servicescontracts. The aggregate amount expensed under these agreements with respect to the year ended December 31, 2010 was$41 million [2009 - $nil; 2008 - $10 million].
During 2010, the Company sold an office building located in Vienna, Austria to the Company's former Co-Chief ExecutiveOfficer for $11.5 million [€8.4 million].
During 2009, the Company purchased approximately 100 acres of real estate located in Oberwaltersdorf, Austria from MECfor $6.0 million [€4.6 million].
During 2008, the Company purchased 225 acres of real estate located in Austria from MEC for $29 million [€20 million].
Magna International Inc. 2010 Annual Report – Financial Statements76
These transactions were reviewed by the Corporate Governance and Compensation Committee and approved by theindependent members of Magna's Board of Directors following the unanimous recommendation of the Corporate Governanceand Compensation Committee.
During the year ended December 31, 2010, trusts, which exist to make orderly purchases of the Company's shares foremployees either for transfer to the Employee Equity and Profit Participation Program or to recipients of either bonuses or rightsto purchase such shares from the trusts, borrowed up to $31 million [2009 - $30 million; 2008 - $35 million] from the Companyto facilitate the purchase of Common Shares. At December 31, 2010, the trusts' indebtedness to the Company was $31 million[2009 - $19 million].
26. CONTINGENCIES
[a] In the ordinary course of business activities, the Company may be contingently liable for litigation and claims withcustomers, suppliers, former employees and other parties. In addition, the Company may be, or could become, liable toincur environmental remediation costs to bring environmental contamination levels back within acceptable legal limits. On anongoing basis, the Company assesses the likelihood of any adverse judgments or outcomes to these matters as well aspotential ranges of probable costs and losses.
A determination of the provision required, if any, for these contingencies is made after analysis of each individual issue.The required provision may change in the future due to new developments in each matter or changes in approach suchas a change in settlement strategy in dealing with these matters.
[i] In November 1997, the Company and two of its subsidiaries were sued by KS Centoco Ltd., an Ontario-based steeringwheel manufacturer in which the Company has a 23% equity interest, and by Centoco Holdings Limited, the ownerof the remaining 77% equity interest in KS Centoco Ltd. In March 1999, the plaintiffs were granted leave to makesubstantial amendments to the original statement of claim in order to add several new defendants and claim additionalremedies, and in February 2006, the plaintiffs further amended their claim to add an additional remedy. The amendedstatement of claim alleges, among other things:
• breach of fiduciary duty by the Company and two of its subsidiaries;
• breach by the Company of its binding letter of intent with KS Centoco Ltd., including its covenant not to haveany interest, directly or indirectly, in any entity that carries on the airbag business in North America, other thanthrough MST Automotive Inc., a company to be 77% owned by Magna and 23% owned by Centoco HoldingsLimited;
• the plaintiff's exclusive entitlement to certain airbag technologies in North America pursuant to an exclusivelicence agreement, together with an accounting of all revenues and profits resulting from the alleged use by theCompany, TRW Inc. ["TRW"] and other unrelated third party automotive supplier defendants of such technologyin North America;
• a conspiracy by the Company, TRW and others to deprive KS Centoco Ltd. of the benefits of such airbagtechnology in North America and to cause Centoco Holdings Limited to sell to TRW its interest in KS CentocoLtd. in conjunction with the Company's sale to TRW of its interest in MST Automotive GmbH and TEMIC Bayern-Chemie Airbag GmbH; and
• oppression by the defendants.
The plaintiffs are seeking, amongst other things, damages of approximately Cdn$3.5 billion. The Company has filedan Amended Statement of Defence and Counterclaim. Document production, completion of undertakings andexaminations for discovery are substantially complete, although limited additional examinations for discovery mayoccur. The trial is not expected to commence until late 2011, at the earliest. The Company believes it has validdefences to the plaintiff's claims and therefore intends to continue to vigorously defend this case. At this time,notwithstanding the amount of time which has transpired since the claim was filed, these legal proceedings remainat an early stage and, accordingly, it is not possible to predict their outcome.
[b] In certain circumstances, the Company is at risk for warranty costs including product liability and recall costs. Due to thenature of the costs, the Company makes its best estimate of the expected future costs [note 15], however, the ultimateamount of such costs could be materially different. The Company continues to experience increased customer pressureto assume greater warranty responsibility. Currently, under most customer agreements, the Company only accounts forexisting or probable claims. Under certain complete vehicle engineering and assembly contracts, the Company recordsan estimate of future warranty-related costs based on the terms of the specific customer agreements, and the specificcustomer's warranty experience.

Magna International Inc. 2010 Annual Report – Financial Statements77
27. SEGMENTED INFORMATION
[a] Magna, a diversified global automotive supplier, follows a corporate policy of functional and operational decentralization.It conducts its operations through divisions, which function as autonomous business units. As at December 31, 2010,Magna had 256 manufacturing operations and 82 product development, engineering and sales centres in 26 countries.Magna designs, develops and manufactures technologically advanced automotive systems, assemblies, modules andcomponents, and engineers and assembles complete vehicles, primarily for sale to OEMs of cars and light trucks in NorthAmerica, Europe and Rest of World [primarily Asia, South America and Africa]. The Company's capabilities include thedesign, engineering, testing and manufacture of automotive interior systems; seating systems; closure systems; body andchassis systems; vision systems; electronic systems; exterior systems; powertrain systems; roof systems; hybrid andelectric vehicles/systems as well as complete vehicle engineering and assembly.
Magna's success is directly dependent upon the levels of North American and European [and currently to a lesser extenton Rest of World] car and light truck production by its customers. OEM production volumes in each of North America andEurope may be impacted by a number of geographic factors, including general economic conditions, interest rates,consumer credit availability, fuel prices and availability, infrastructure, legislative changes, environmental emission andsafety issues, and labour and/or trade relations.
Given the differences between the regions in which the Company operates, Magna's operations are segmented on ageographic basis between North America, Europe and Rest of World. We maintain management teams in each of theCompany's two primary markets, North America and Europe. The role of the North American and European managementteams is to manage Magna's interests to ensure a coordinated effort across the Company's different product capabilities.In addition to maintaining key customer, supplier and government contacts in their respective markets, the regionalmanagement teams centrally manage key aspects of the Company's operations while permitting the divisions enoughflexibility through Magna's decentralized structure to foster an entrepreneurial environment.
In conjunction with the completion of the Arrangement, the Company's E-Car Systems partnership is managed separatelyfrom the Company's other operations. Consistent with the above, the Company's internal financial reporting has beenrevised to separately segment key internal operating performance measures between North America, Europe, Rest ofWorld and E-Car Systems for purposes of presentation to the chief operating decision maker to assist in the assessmentof operating performance, the allocation of resources, and the long-term strategic direction and future global growth ofthe Company. The Company's reporting to Magna's Corporate Executive Team, Board of Directors and shareholders hasalso been revised accordingly.
The accounting policies of each segment are the same as those set out under "Significant Accounting Policies" [note 1]and intersegment sales and transfers are accounted for at fair market value.
The following table shows certain information with respect to segment disclosures:
2010Depreciation Fixed Fixed
Total External and asset assets,sales sales amortization EBIT[i] Goodwill additions net
North AmericaCanada $ 5,486 $ 5,053 $ 133 $ 652United States 5,831 5,350 129 667Mexico 2,351 2,194 49 367Eliminations (911) – – –
North America 12,757 12,597 $ 360 $ 1,085 $ 646 311 1,686Europe
Euroland [ii] 8,389 8,219 180 999Great Britain 813 813 5 58Other European countries 1,395 1,295 131 479Eliminations (140) – – –
Europe 10,457 10,327 241 102 401 316 1,536Rest of World 1,185 1,097 31 92 140 51 239E-Car 20 18 4 (89) – 47 76Corporate and Other [iii], [iv] (317) 63 25 (3) 1 59 352Total reportable segments $24,102 $24,102 $ 661 $ 1,187 $ 1,188 $ 784 3,889Current assets 7,814Investments, goodwill
and other assets 2,195Consolidated total assets $13,898
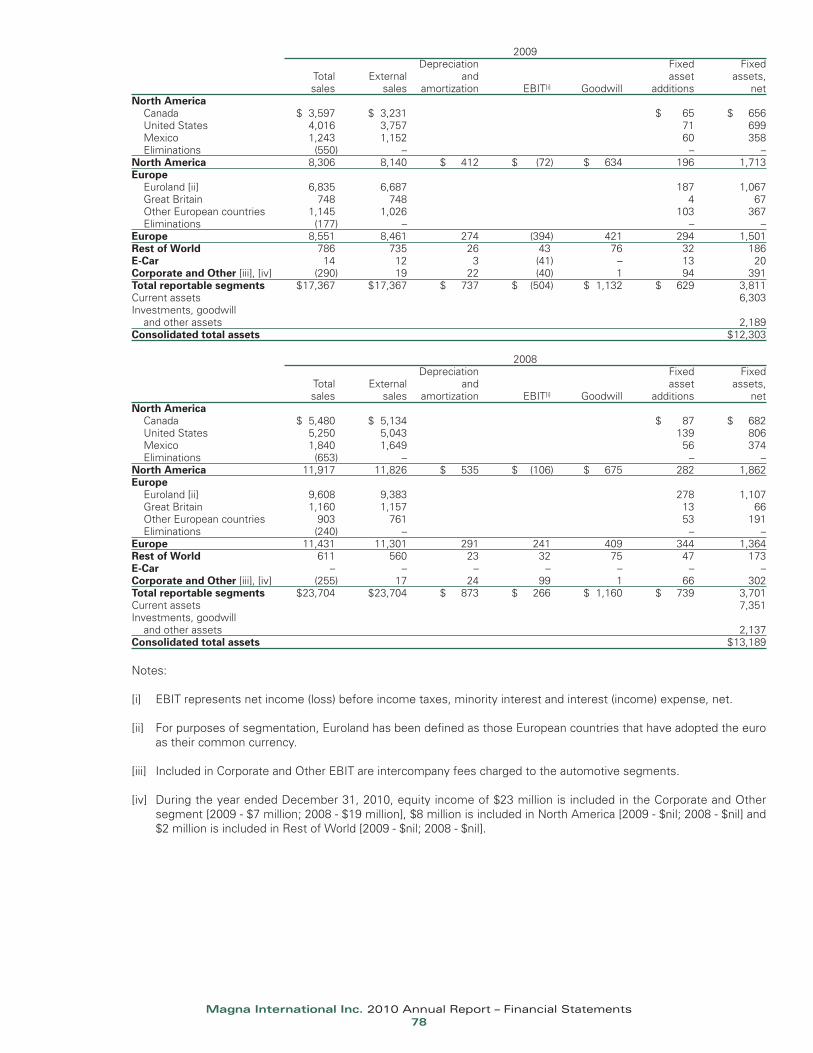
Magna International Inc. 2010 Annual Report – Financial Statements78
2009Depreciation Fixed Fixed
Total External and asset assets,sales sales amortization EBIT[i] Goodwill additions net
North AmericaCanada $ 3,597 $ 3,231 $ 65 $ 656United States 4,016 3,757 71 699Mexico 1,243 1,152 60 358Eliminations (550) – – –
North America 8,306 8,140 $ 412 $ (72) $ 634 196 1,713Europe
Euroland [ii] 6,835 6,687 187 1,067Great Britain 748 748 4 67Other European countries 1,145 1,026 103 367Eliminations (177) – – –
Europe 8,551 8,461 274 (394) 421 294 1,501Rest of World 786 735 26 43 76 32 186E-Car 14 12 3 (41) – 13 20Corporate and Other [iii], [iv] (290) 19 22 (40) 1 94 391Total reportable segments $17,367 $17,367 $ 737 $ (504) $ 1,132 $ 629 3,811Current assets 6,303Investments, goodwill
and other assets 2,189Consolidated total assets $12,303
2008Depreciation Fixed Fixed
Total External and asset assets,sales sales amortization EBIT[i] Goodwill additions net
North AmericaCanada $ 5,480 $ 5,134 $ 87 $ 682United States 5,250 5,043 139 806Mexico 1,840 1,649 56 374Eliminations (653) – – –
North America 11,917 11,826 $ 535 $ (106) $ 675 282 1,862Europe
Euroland [ii] 9,608 9,383 278 1,107Great Britain 1,160 1,157 13 66Other European countries 903 761 53 191Eliminations (240) – – –
Europe 11,431 11,301 291 241 409 344 1,364Rest of World 611 560 23 32 75 47 173E-Car – – – – – – –Corporate and Other [iii], [iv] (255) 17 24 99 1 66 302Total reportable segments $23,704 $23,704 $ 873 $ 266 $ 1,160 $ 739 3,701Current assets 7,351Investments, goodwill
and other assets 2,137Consolidated total assets $13,189
Notes:
[i] EBIT represents net income (loss) before income taxes, minority interest and interest (income) expense, net.
[ii] For purposes of segmentation, Euroland has been defined as those European countries that have adopted the euroas their common currency.
[iii] Included in Corporate and Other EBIT are intercompany fees charged to the automotive segments.
[iv] During the year ended December 31, 2010, equity income of $23 million is included in the Corporate and Othersegment [2009 - $7 million; 2008 - $19 million], $8 million is included in North America [2009 - $nil; 2008 - $nil] and$2 million is included in Rest of World [2009 - $nil; 2008 - $nil].

Magna International Inc. 2010 Annual Report – Financial Statements79
[b] The following table aggregates external revenues by customer as follows:
2010 2009 2008
General Motors $ 4,835 $ 3,209 $ 5,008Ford Motor Company 3,409 2,564 3,286Fiat / Chrysler Group 3,127 1,842 3,164BMW 3,029 2,763 4,442Volkswagen 2,725 2,139 1,899Daimler AG 2,271 1,792 2,335Other 4,706 3,058 3,570
$ 24,102 $ 17,367 $ 23,704
[c] The following table summarizes external revenues generated by automotive products and services:
2010 2009 2008
Exterior and interior systems $ 8,912 $ 6,092 $ 7,974Body systems and chassis systems 4,798 3,376 4,618Powertrain systems 3,630 2,560 3,361Complete vehicle assembly 2,163 1,764 3,306Tooling, engineering and other 1,956 1,555 1,856Vision and electronic systems 1,593 1,238 1,476E-Car systems 10 1 –Closure systems 1,040 781 1,113
$ 24,102 $ 17,367 $ 23,704
28. UNITED STATES GENERALLY ACCEPTED ACCOUNTING PRINCIPLES
The Company's accounting policies as reflected in these consolidated financial statements do not materially differ from U.S.GAAP except for:
[a] Principles of consolidation
The Company has certain interests in jointly controlled entities that have been proportionately consolidated in theCompany's financial statements [note 24]. For U.S. GAAP, these interests would be accounted for by the equity method.
As more fully described in note 4, the Company has a 73% equity interest in E-Car, but does not control the partnership.For accounting purposes, the partnership is a variable interest entity. Under Canadian GAAP, Magna is considered theprimary beneficiary and as a result must consolidate the partnership. Under U.S. GAAP, Accounting Standards Codification810, "Consolidation" ["ASC 810"] the Company is not the primary beneficiary of E-Car and therefore would not consolidatethe partnership. Under U.S. GAAP, the Company's interest in E-Car is accounted for using the equity method.
The use of the equity method of accounting for the above entities under U.S. GAAP as opposed to consolidation orproportionate consolidation under Canadian GAAP has no impact on the Company's net income, earnings per share, andshareholders' equity.
In addition, as a result of deconsolidating the E-Car partnership in accordance with ASC 810, the Company recorded itsinvestment in the E-Car partnership at its fair value on August 31, 2010 and recognized a $16 million gain in income.
[b] Financial instruments
Prior to redemption, the Company's subordinated debentures were recorded in part as debt and in part as shareholders'equity. Under U.S. GAAP, the subordinated debentures would be recorded entirely as debt.
[c] In-house tooling and engineering
For U.S. GAAP purposes, in-house engineering service and tooling contracts entered into prior to January 1, 2004, providedin conjunction with subsequent assembly or production activities, were regarded as a single arrangement. The revenueand the related cost of goods sold for these activities are recognized over the estimated life of the assembly or productionarrangement.

Magna International Inc. 2010 Annual Report – Financial Statements80
[d] Stock-based compensation
Under U.S. GAAP rules contained in Accounting Standards Codification 718, "Compensation - Stock Compensation" ["ASC718"] the Company is required to measure and record compensation expense for stock options and other share-basedpayments based on the instruments' fair value on the grant date. The standard requires the cost of awards to berecognized in the consolidated statement of income (loss) and comprehensive income (loss) over the vesting period. Inaddition, forfeitures are required to be estimated on the grant date.
The Company had prospectively adopted the new Canadian GAAP recommendations related to stock-based compensationfor all options granted to employees on or after January 1, 2003. The Canadian GAAP recommendations were substantiallyharmonized with the U.S. GAAP rules contained in ASC 718, which were also adopted by the Company prospectively forall options granted on or after January 1, 2003.
For options granted prior to January 1, 2003, the Company measures compensation cost prior to January 1, 2006 underU.S. GAAP using the intrinsic value-based method of accounting as prescribed by APB Opinion No. 25, "Accounting forStock Issued to Employees" for awards granted to employees and the fair value-based method of accounting as prescribedby ASC 718 for awards granted to non-employees. The same treatment is applicable under Canadian GAAP but only foroptions granted between January 1, 2002 and December 31, 2002.
Under U.S. GAAP, the Company's restricted stock plans and restricted share unit plans granted on or after January 1,2006 are amortized to compensation expense over the substantive vesting period. The substantive vesting period for theCompany's restricted stock plans is the 4 year holding period, whereas under Canadian GAAP, the Company's restrictedstock plans are amortized to compensation expense from the date of grant to the end of the four-year holding period andthe 10 year release period.
[e] Cumulative translation adjustment
Under U.S. GAAP, Accounting Standards Codification 830, "Foreign Currency Matters" ["ASC 830"], the Company wouldonly realize a gain or loss on the portion of the currency translation adjustment included as a separate component of thenet investment in a foreign operation upon a sale or complete, or substantially complete, liquidation of the relatedinvestment. Under ASC 830, no gains or losses are recognized as a result of capital transactions, including the paymentof dividends. Under Canadian GAAP, the Company is required to recognize a gain or loss equal to the appropriate portionof the cumulative translation adjustment account when there is a reduction in the Company's net investment in a foreignsubsidiary resulting from capital transactions.
[f] Accounting for uncertain tax positions
For U.S. GAAP purposes, the Company applies Accounting Standards Codification 740, "Income Taxes" ["ASC 740"] whichclarifies the accounting for income taxes by prescribing a "more likely than not" minimum recognition threshold a taxposition is required to meet before being recognized in the financial statements, and clearly scopes income taxes out ofAccounting Standards Codification 450, "Contingencies" ["ASC 450"]. ASC 740 also provides guidance on derecognition,measurement, classification, interest and penalties, and disclosure. For Canadian GAAP purposes, the Company continuesto use a policy consistent with the ASC 450 approach to accounting for uncertain tax positions.
Under ASC 740, uncertain tax positions for which the timing of their resolution is not expected in the current year shouldbe recognized as long-term liabilities.
[g] Derivative instruments
The Company reviewed its other commercial contracts outstanding as at December 31, 2010, 2009 and 2008 in relationto Accounting Standards Codification 815, "Derivatives and Hedging" ["ASC 815"] and determined that there are noembedded derivatives as defined therein.
[h] Pensions and post retirement benefits
Under U.S. GAAP, Accounting Standards Codification 715, "Compensation - Retirement Benefits" ["ASC 715"] the Company isrequired to recognize the funded status of each defined benefit post employment plan on the balance sheet. The aggregatedunder funded plans are recognized as either a current liability or a non-current liability. The current liability is the amountby which the actuarial present value of benefits included in the benefit obligation in the next 12 months exceeds the fairvalue of plan assets, determined on a plan-by-plan basis.

Magna International Inc. 2010 Annual Report – Financial Statements81
[i] Change in reporting currency
Effective December 31, 1998, the Company changed its reporting currency to the U.S. dollar. Under Canadian GAAP, theCompany's consolidated financial statements for all periods presented through December 31, 1998 were translated fromCanadian dollars to U.S. dollars using the exchange rate in effect at December 31, 1998, whereas for U.S. GAAP, thecurrent rate method under ASC 830 was used.
[j] Related party transactions
For U.S. GAAP purposes, transfers of assets between entities under common control should be valued at historical costor market, if lower. The difference between the carrying amount of the assets received and the consideration paid onacquisitions from MEC [note 25] is treated as a reduction in capital.
[k] Business Combinations
On January 1, 2009, the Company adopted the new accounting principles for business combinations in AccountingStandards Codification 805 "Business Combinations" ["ASC 805"]. The principles change how an acquirer recognizes andmeasures assets acquired, liabilities assumed, non-controlling interest and goodwill in a business combination. Keychanges include: (i) recognition of transaction costs in current period earnings; (ii) recognition of the estimated fair valueof all contingent consideration at the acquisition date and an adjustment to fair value at each reporting date with an offsetto current period earnings; (iii) adjustments to deferred tax asset valuation allowances and income tax uncertaintiesrecorded at the acquisition date to be recognized in current period earnings; (iv) acquisition method accounting is appliedon the date that control is obtained in step acquisitions; and (v) re-measurement of previously acquired non-controllingequity investments at fair value as at the acquisition date with an offset to current period earnings; and (vi) any excess offair value of acquired net assets over the acquisition consideration results in a bargain purchase.
[l] The following tables present net income (loss) following U.S. GAAP:
2010In-house Uncertain Business
Canadian tooling and tax combi- Consoli- U.S.GAAP engineering positions nations dations Other GAAP
Sales $24,102 $ 61 $ – $ – $ (721) $ – $23,442
Costs and expensesCost of goods sold 20,924 49 – – (520) 9 20,462Depreciation and amortization 661 – – 8 (12) (1) 656Selling, general and administrative 1,340 – – – (59) (15) 1,266Interest (income) expense, net (10) – – – (1) – (11)Equity income (33) – – – (118) – (151)Impairment charges 23 – – – – – 23
Income (loss) from operationsbefore income taxes 1,197 12 – (8) (11) 7 1,197
Income taxes 236 – (9) (1) (23) (9) 194Minority interest (12) – – – 12 – –Net income (loss) 973 12 9 (7) – 16 1,003Other comprehensive income (loss):
Net realized and unrealized gains (losses)on translation of net investment inforeign operations 18 – – (1) – 3 20
Repurchase of shares (3) – – – – – (3)Net unrealized gains (losses)
on cash flow hedges 81 – – – – – 81Net unrealized gains on
available-for-sale investments 11 – – – – – 11Reclassifcation of net (gains) losses on
cash flow hedges to net income (loss) (28) – – – – – (28)Pension and post retirement benefits – – – – – (14) (14)
Comprehensive income (loss) $ 1,052 $ 12 $ 9 $ (8) $ – $ 5 $ 1,070

2009In-house Uncertain Business
Canadian tooling and tax combi- Consoli- U.S.GAAP engineering positions nations dations Other GAAP
Sales $17,367 $ 87 $ – $ – $ (578) $ – $16,876
Costs and expensesCost of goods sold 15,697 72 – – (396) 7 15,380Depreciation and amortization 737 – – 4 (14) (2) 725Selling, general and administrative 1,261 – – (34) (53) (4) 1,170Interest (income) expense, net 7 – – – – – 7Equity income (7) – – – (105) – (112)Impairment charges 183 – – – – – 183
Income (loss) from operationsbefore income taxes (511) 15 – 30 (10) (1) (477)
Income taxes (18) 6 – (1) (10) (1) (24)Minority interest – – – – – – –Net income (loss) (493) 9 – 31 – – (453)Other comprehensive income (loss):
Net realized and unrealized gains (losses)on translation of net investment inforeign operations 407 (7) – 1 – (1) 400
Repurchase of shares – – – – – – –Net unrealized gains (losses)
on cash flow hedges 41 – – – – – 41Net unrealized gains on
available-for-sale investments – – – – – – –Reclassifcation of net (gains) losses on
cash flow hedges to net income (loss) 59 – – – – – 59Pension and post retirement benefits – – – – – 15 15
Comprehensive income (loss) $ 14 $ 2 $ – $ 32 $ – $ 14 $ 62
2008In-house Uncertain Cumulative
Canadian tooling and tax translation Consoli- U.S.GAAP engineering positions adjustment dations Other GAAP
Sales $23,704 $ 82 $ – $ – $ (758) $ – $23,028
Costs and expensesCost of goods sold 20,982 76 – – (554) 58 20,562Depreciation and amortization 873 – – – (14) (1) 858Selling, general and administrative 1,319 – – 116 (38) – 1,397Interest (income) expense, net (62) – – – – – (62)Equity income (19) – – – (139) – (158)Impairment charges 283 – – – – – 283
Income (loss) from operationsbefore income taxes 328 6 – (116) (13) (57) 148
Income taxes 257 1 2 – (13) (58) 189Minority interest – – – – – – –Net income (loss) 71 5 (2) (116) – 1 (41)Other comprehensive income (loss):
Net realized and unrealized gains (losses)on translation of net investment inforeign operations (881) – – 116 – 2 (763)
Repurchase of shares (32) – – – – – (32)Net unrealized gains (losses)
on cash flow hedges (102) – – – – – (102)Net unrealized gains on
available-for-sale investments – – – – – – –Reclassifcation of net (gains) losses on
cash flow hedges to net income (loss) (1) – – – – – (1)Pension and post retirement benefits – – – – – (57) (57)
Comprehensive income (loss) $ (945) $ 5 $ (2) $ – $ – $ (54) $ (996)
Magna International Inc. 2010 Annual Report – Financial Statements82

Magna International Inc. 2010 Annual Report – Financial Statements83
[m] The following table presents earnings (loss) per share information [restated to reflect the stock split [note 3]] following U.S.GAAP:
2010 2009 2008
Earnings (loss) per Common or Class B Share under U.S. GAAP:Basic $ 4.36 $ (2.03) $ (0.18)Diluted $ 4.30 $ (2.03) $ (0.18)
Earnings (loss) per share data were computed as follows:
Basic earnings (loss) per Common or Class B Share:
Net (loss) income under U.S. GAAP $ 1,003 $ (453) $ (41)
Average number of Common and Class B Sharesoutstanding during the year 230.0 223.6 225.6
Basic earnings (loss) per Common or Class B Share $ 4.36 $ (2.03) $ (0.18)
Diluted earnings (loss) per Common or Class B Share:
Net income (loss) under U.S. GAAP $ 1,003 $ (453) $ (41)
Average number of Common and Class B Sharesoutstanding during the year 230.0 223.6 225.6
Adjustment for stock options 3.0 – –233.0 223.6 225.6
Diluted earnings (loss) per Common or Class B Share $ 4.30 $ (2.03) $ (0.18)
[n] The following tables present cash flows following U.S. GAAP:
2010Canadian U.S.
GAAP Consolidations GAAP
Cash from operating activities $ 1,872 $ (103) $ 1,769
Cash used for investment activities (744) 106 (638)
Cash used for financing activities (355) (160) (515)
Effect of exchange rate changes on cash and cash equivalents (2) (2) (4)
Net increase in cash and cash equivalents during the year 771 (159) 612Cash and cash equivalents, beginning of year 1,334 (65) 1,269Cash and cash equivalents, end of year $ 2,105 $ (224) $ 1,881
2009Canadian U.S.
GAAP Consolidations GAAP
Cash from operating activities $ 527 $ (12) $ 515
Cash used for investment activities (876) 17 (859)
Cash used for financing activities (1,164) 7 (1,157)
Effect of exchange rate changes on cash and cash equivalents 90 (7) 83
Net decrease in cash and cash equivalents during the year (1,423) 5 (1,418)Cash and cash equivalents, beginning of year 2,757 (70) 2,687Cash and cash equivalents, end of year $ 1,334 $ (65) $ 1,269

2008Canadian U.S.
GAAP Consolidations GAAP
Cash from operating activities $ 1,054 $ (2) $ 1,052
Cash used for investment activities (1,063) 7 (1,056)
Cash provided from financing activities 89 (5) 84
Effect of exchange rate changes on cash and cash equivalents (277) 8 (269)
Net decrease in cash and cash equivalents during the year (197) 8 (189)Cash and cash equivalents, beginning of year 2,954 (78) 2,876Cash and cash equivalents, end of year $ 2,757 $ (70) $ 2,687
[o] The following tables indicate the significant items in the consolidated balance sheets that would have been affected hadthe consolidated financial statements been prepared under U.S. GAAP:
2010Pensions
In-house Uncertain and postCanadian tooling and tax retirement Consoli- U.S.
GAAP engineering positions benefits dations Other GAAP
ASSETSCurrent assetsCash and cash equivalents $ 2,105 $ – $ – $ – $ (224) $ – $ 1,881Accounts receivable 3,645 – – – (117) – 3,528Inventories 1,896 – – – (74) – 1,822Income taxes receivable – – – – – – –Prepaid expenses and other 168 – – – (6) – 162
7,814 – – – (421) – 7,393
Investments 277 – – – 282 16 575Fixed assets, net 3,889 – – – (141) (6) 3,742Goodwill 1,188 – – – – 6 1,194Future tax assets 150 – (4) 2 – – 148Other assets 580 – – 22 30 – 632
$13,898 $ – $ (4) $ 24 $ (250) $ 16 $13,684
LIABILITIES AND EQUITYCurrent liabilitiesBank indebtedness $ 26 $ – $ – $ – $ (6) $ – $ 20Accounts payable 3,586 – – – (107) – 3,479Accrued salaries and wages 462 – – – (17) – 445Other accrued liabilities 909 1 – 8 (20) – 898Income taxes payable 192 – (129) – (8) – 55Long-term debt due within one year 25 – – – (6) – 19
5,200 1 (129) 8 (164) – 4,916
Deferred revenue 15 – – – – – 15Long-term debt 46 – – – (5) – 41Other long-term liabilities 367 – 116 73 (4) – 552Future tax liabilities 131 – – 5 (6) 4 134
5,759 1 (13) 86 (179) 4 5,658
Minority interest 74 – – – (71) (3) –
Shareholders' equityCommon Shares 4,335 – – – – 165 4,500Contributed surplus 85 – – – – (29) 56Retained earnings 2,725 7 9 (4) – (22) 2,715Accumulated other comprehensive income 920 (8) – (58) – (102) 752
8,065 (1) 9 (62) – 12 8,023Non-controlling interest – – – – – 3 3
8,065 (1) 9 (62) – 15 8,026$13,898 $ – $ (4) $ 24 $ (250) $ 16 $13,684
Magna International Inc. 2010 Annual Report – Financial Statements84

Magna International Inc. 2010 Annual Report – Financial Statements85
2009Pensions
In-house Uncertain and postCanadian tooling and tax retirement Consoli- U.S.
GAAP engineering positions benefits dations Other GAAP
ASSETSCurrent assetsCash and cash equivalents $ 1,334 $ – $ – $ – $ (65) $ – $ 1,269Accounts receivable 3,062 – – – (79) – 2,983Inventories 1,721 – – – (56) – 1,665Income taxes receivable 50 – 125 – 4 – 179Prepaid expenses and other 136 – – – (4) – 132
6,303 – 125 – (200) – 6,228
Investments 238 – – – 145 – 383Fixed assets, net 3,811 – – – (69) (1) 3,741Goodwill 1,132 – – – – 6 1,138Future tax assets 168 – (3) 6 – – 171Other assets 651 – – 23 32 – 706
$12,303 $ – $ 122 $ 29 $ (92) $ 5 $12,367
LIABILITIES AND EQUITYCurrent liabilitiesBank indebtedness $ 48 $ – $ – $ – $ (3) $ – $ 45Accounts payable 3,001 – – – (56) – 2,945Accrued salaries and wages 372 – – – (11) – 361Other accrued liabilities 862 13 – 6 (14) – 867Income taxes payable – – – – – – –Long-term debt due within one year 16 – – – (2) – 14
4,299 13 – 6 (86) – 4,232
Deferred revenue 19 – – – – – 19Long-term debt 115 – – – (5) – 110Other long-term liabilities 369 – 122 67 (1) – 557Future tax liabilities 141 – – 4 – 5 150
4,943 13 122 77 (92) 5 5,068
Minority interest – – – – – – –
Shareholders' equityCommon Shares 3,613 – – – – 166 3,779Contributed surplus 63 – – – – (31) 32Retained earnings 2,843 (5) – (4) – (31) 2,803Accumulated other comprehensive income 841 (8) – (44) – (104) 685
7,360 (13) – (48) – – 7,299Non-controlling interest – – – – – – –
7,360 (13) – (48) – – 7,299$12,303 $ – $ 122 $ 29 $ (92) $ 5 $12,367
29. SUBSEQUENT EVENTS
On February 8, 2011, the majority shareholder of a company in which Magna has a 40% equity interest, exercised its optionto purchase Magna's equity interest. During 2010, Magna recorded equity income of $23 million from this investment and asat December 31, 2010 the carrying value of Magna's 40% investment was $125 million. Proceeds from disposition areprojected to exceed Magna's carrying value and closing of the transaction is expected to occur during the first half of 2011.
30. COMPARATIVE FIGURES
Certain of the comparative figures have been reclassified to conform to the current year's method of presentation.

Magna International Inc. 2010 Annual Report – Financial Statements86
FINANCIAL SUMMARY
(U.S. dollars in millions, except per share figures)(unaudited)
Years ended December 31,
2010 2009 2008 2007 2006 2005 2004 2003 2002 2001
Total sales 24,102 17,367 23,704 26,067 24,180 22,811 20,653 15,345 12,422 10,507
Depreciation and amortization 661 737 873 872 790 711 598 506 423 399
Net income (loss) from continuing operations 973 (493) 71 663 528 639 676 567 556 511
Net income (loss) 973 (493) 71 663 528 639 676 500 540 515
Diluted earnings (loss) per Share
from continuing operations (restated) 4.18 (2.21) 0.31 2.93 2.39 2.95 3.48 2.95 3.12 3.03
Diluted earnings (loss) per Share (restated) 4.18 (2.21) 0.31 2.93 2.39 2.95 3.48 2.60 3.03 3.05
Average number of shares outstanding (restated) 230.0 223.6 225.6 222.8 217.2 213.4 193.4 191.8 177.4 160.2
Cash dividends paid per share (restated) 0.42 0.09 0.63 0.58 0.76 0.76 0.74 0.68 0.68 0.68
Cash flow from operations 1,872 527 1,054 1,593 1,596 1,698 1,381 1,184 1,404 934
Capital expenditures 784 629 739 741 793 848 859 801 833 486
Working capital 2,614 2,004 2,258 3,112 2,277 2,215 2,183 1,937 1,433 1,314
Fixed assets, net 3,889 3,811 3,701 4,307 4,114 4,124 3,967 3,313 3,676 3,020
Total assets 13,898 12,303 13,189 15,343 13,154 12,321 11,615 9,871 8,910 6,939
Long-term debt 46 115 143 337 605 700 984 766 608 945
Shareholders' equity 8,065 7,360 7,363 8,642 7,157 6,565 5,335 4,533 5,095 3,829
Long-term debt to equity ratio 0.01:1 0.02:1 0.02:1 0.04:1 0.08:1 0.11:1 0.18:1 0.17:1 0.12:1 0.25:1
MAGNA INTERNATIONAL INC.Supplementary Financial and Share Information

Magna International Inc. 2010 Annual Report – Financial Statements87
Share Information
The Common Shares are listed and traded in Canada on the Toronto Stock Exchange ("TSX") and in the United States on the New YorkStock Exchange ("NYSE"). As of February 28, 2011, there were 1,693 registered holders of Common Shares.
Distribution of Shares held by Registered ShareholdersCommon
Canada 84.8%United States 14.8%Other 0.4%
Dividends
Dividends for 2010 on Magna's Common Shares [formerly Class A Subordinate Voting Shares] were paid on each of June 15,September 15 and December 15, 2010, at the rate of US$0.18, US$0.30 and US$0.18 [post-stock split]. Dividends for 2010 onMagna's Class B Shares were paid on June 15, 2010 only, at the rate of US$0.18. Magna's Class B Shares were cancelled onAugust 31, 2010, and were therefore not eligible for any further dividends. Magna's dividends have been designated as "eligible dividends"for purposes of subsection 89(1) of the Income Tax Act (Canada) and, accordingly, are eligible for an enhanced tax credit. Additionaldetails are found on Magna's website (www.magna.com), under "Investors - Dividends & Interest".
Price Range of Shares
The following table sets forth, for the years indicated, the high and low sale prices and volumes of Common Shares traded in eachcase as reported by the TSX and NYSE, respectively.
Common Shares (TSX) (Cdn$)Year ended December 31, 2010 Year ended December 31, 2009
Quarter Volume High Low Volume High Low1st 38,306,240 32.42 26.55 40,554,134 21.16 12.722nd 54,752,790 39.41 31.23 46,892,510 24.69 16.243rd 41,300,522 44.97 32.75 38,452,210 27.63 21.844th 32,649,723 53.88 41.49 38,348,792 27.33 21.02
Common Shares (NYSE) (U.S.$)Year ended December 31, 2010 Year ended December 31, 2009
Quarter Volume High Low Volume High Low1st 80,628,814 31.82 25.58 130,770,298 17.92 9.822nd 126,099,390 38.23 30.84 144,994,694 21.25 12.813rd 89,129,494 43.11 30.98 96,810,818 25.98 20.044th 65,690,113 52.98 40.52 91,780,676 25.98 19.50
Magna's Common Shares began trading on a 2-for-1 split basis on November 12, 2010 on the TSX and on November 26, 2010 onthe NYSE.
All numbers have been restated to reflect trading prices and volumes, as if the stock split applied for the entire years 2009 and 2010.

2010 Annual Report
Additional copies of this 2010 Annual Report or copies of our quarterly reports may be obtained from: The Secretary, Magna International Inc.,337 Magna Drive, Aurora, Ontario, Canada L4G 7K1 or www.magna.com. Copies of financial data and other publicly filed documents are available through
the internet on the Canadian Securities Administrators' System for Electronic Document Analysis and Retrieval (SEDAR) which can be accessed atwww.sedar.com and on the United States Securities and Exchange Commission's Electronic Data Gathering, Analysis and Retrieval System (EDGAR)
which can be accessed at www.sec.gov.
©Magna International Inc. 2011. Magna and the logo are registered trademarks of Magna International Inc.
The 2011 Annual Meeting of ShareholdersThe 2011 Annual Meeting of Shareholders will be held at Hilton Suites Toronto/Markham Conference Centre,
8500 Warden Avenue, Markham, Ontario, Canada on Wednesday, May 4, 2011 commencing at 10:00 a.m. (Toronto time)
Corporate Directory
Directors
Frank StronachChairman
Michael D. HarrisLead Director
J. Trevor Eyton
Lady Barbara Judge
Louis E. Lataif
Donald Resnick
Franz Vranitzky
Donald J. Walker
Lawrence D. Worrall
Corporate Office
Magna International Inc.337 Magna DriveAurora, OntarioCanada L4G 7K1Telephone: (905) 726-2462www.magna.com
Executive Officers
Frank StronachChairman of the Board
Donald J. WalkerChief Executive Officer
Vincent J. GalifiExecutive Vice-Presidentand Chief Financial Officer
Jeffrey O. PalmerExecutive Vice-President and Chief Legal Officer
Other Officers
Paul H. BrockVice-President and Treasurer
Gary M. CohnVice-President, Mergers and Acquisitions
Patrick McCannVice-President, Finance
Robert D. MerkleyVice-President, Internal Audit
Scott E. ParadiseVice-President, Marketing and New Business Development – The Americas
Günther ApfalterPresident, Magna Europe
Manfred EibeckExecutive Vice-President,Magna Europe and President, Magna Russia
Herbert H. DemelExecutive Vice-Presidentand President, Magna China, India, South East Asia,South America and Africa
Marc J. NeebExecutive Vice-President,Global Human Resources
Thomas A. SchultheissVice-President andGeneral Counsel – Europe
Bassem A. ShakeelVice-President and Secretary
Michael G.R. SinnaeveVice-President, Operational Improvement and Quality –The Americas
Riccardo C. TrecroceVice-President and General Counsel – North America
As a "foreign private issuer" listed on the New York Stock Exchange (NYSE), Magna is required to disclose the significant ways in which our corporate governance practices differ from those to be followed by U.S. domestic issuers under the NYSE listing standards. Please see the corporate governance section of our website (www.magna.com) for our Statement of Significant Corporate Governance Differences (NYSE). Additionally, please refer to the Management Information Circular/Proxy Statement for our 2011 Annual Meeting of Shareholders for a description of our corporate governance practices in comparison with the requirements and guidelines of the Canadian securities administrators.
Shareholders wishing to communicate with the non-management members of the Magna Board of Directors may do so by contacting the Lead Director through the office of Magna's Secretary at 337 Magna Drive, Aurora, Ontario, Canada L4G 7K1 (905) 726-7072.
Shareholders wishing to obtain a copy of Magna's Notice of Intention to Make a Normal Course Issuer Bid, referred to in Note 19 to the consolidated financial statements contained in this Annual Report may also do so by contacting Magna's Corporate Secretary.
Alon S. OssipExecutive Vice-President
James J. Tobin, Sr.Chief Marketing Officerand President, Magna Japan and Korea
Tom J. SkudutisChief Operating Officer, Exteriors, Interiors, Seating, Mirrors and Closures
Burkhard GöschelChief Technology Officer
Louis B. TonelliVice-President,Investor Relations
David M. WilliamsonVice-President, Taxation
Robert CecuttiController
Transfer Agent and Registrar
Computershare Trust Company of Canada 100 University Avenue, 9th FloorToronto, Ontario, Canada M5J 2Y1Telephone: 1-800-564-6253www.computershare.com
Computershare Trust Company N.A.250 Royall StreetCanton, MA, USA 02021Telephone: (781) 575-3120
Exchange Listings
Common SharesToronto Stock Exchange MGNew York Stock Exchange MGA
Magna's capabilities include:
Vehicles & Roof Systems
Vehicle Engineering& Contract AssemblyMagna Steyrn Engineering Servicesn Contract Manufacturingn Fuel Systems
Powertrain SystemsMagna Powertrainn Driveline & Chassis Controlsn Fluid Pressure & Controlsn Stampingsn Die Castingsn Engineering Services & System Integration
Roof SystemsMagna Steyrn Soft Topsn Retractable Hard Topsn Modular Roofsn Textile Folding Roofs
Exterior SystemsMagna Exteriors & Interiorsn Front & Rear Fascia Systemsn Sealing Systemsn Exterior Trim & Lightingn Class A Composite Panelsn Modular Systemsn Engineered Glassn Structural Componentsn Under Hood & Underbody Componentsn Sheet Molding Compound Material
Interior SystemsMagna Exteriors & Interiorsn Sidewall & Trim Systemsn Cockpit Systemsn Cargo Management Systemsn Overhead Systemsn Carpet & Loadspace Systems
Seating SystemsMagna Seatingn Complete Seating Solutionsn Seat Structures & Mechanism Solutionsn Foam & Trim Solutions
Closure SystemsMagna Closuresn Door Modulesn Window Systemsn Power Closure Systemsn Latching Systemsn Handle Assembliesn Driver Controlsn Electronics
Vision SystemsMagna Mirrorsn Interior Mirrorsn Exterior Mirrorsn Actuatorsn Electronic Vision Systems
Body & ChassisSystems
Body & Chassis SystemsCosma Internationaln Body Systemsn Chassis Systemsn Technology, Engineering & Tooling Systemsn Renewable Energy Structures
Hybrid & Electric Vehicles/SystemsMagna E-Car Systems*n Hybrid & Electric Vehicle Systems & Subsystemsn Hybrid & Electric Vehicle Modules & Componentsn Services* Our partnership with the Stronach group
E-Car Systems
Electronic SystemsMagna Electronicsn Driver Assistance & Safetyn Intelligent Power Systemsn Engine Electronics & Sensorsn Industrial Productsn Body Systems & HMI
Powertrain & Electronic Systems
Exteriors & Interiors

2 0 1 0 A N N UA L R E P O RT
Magna International Inc.
337 Magna Drive, Aurora, Ontario, Canada L4G 7K1
Telephone: (905) 726-2462Fax: (905) 726-7164
Visit our website at: www.magna.com
Printed in Canada
Financial Highlights2010
Company Overview
Magna, the most diversified global automotive supplier, designs, develops and manufactures technologically advanced automotive systems, assemblies, modules and components, and engineers and assembles complete vehicles, primarily for sale to original equipment manufacturers of cars and light trucks.
Our capabilities include:
n interior systemsn seating systemsn closure systemsn body & chassis systemsn vision systemsn electronic systemsn exterior systemsn powertrain systemsn roof systemsn vehicle engineering & contract assemblyn hybrid & electric vehicles/systems
Magna has more than 96,000 employees in256 manufacturing operations and 82 productdevelopment, engineering and sales centres in26 countries.
The all-new Ford Focus Electric, jointly developed by Ford and Magna.
Sales(U.S.$ Billions)
30
25
20
15
10
5
001
08 09 10
08 09 10
08 09 10
02 03 04 05 06 07 08 09 10
1200
1000
800
600
400
200
0
(200)
(600)
(400)
Operating Income (Loss)(U.S.$ Millions)
Net Income (Loss)(U.S.$ Millions)
Diluted Earnings (Loss) Per Share(U.S.$)
1000
800
600
400
200
(200)
(400)
(600)
5.00
4.00
3.00
2.00
1.00
(1.00)
(2.00)
(3.00)
0
0
Related Documents


