Investor trip 2010 India India Neeraj Swaroop Regional CEO, India & South Asia Leading the way Leading the way in Asia, Africa and the Middle East

Welcome message from author
This document is posted to help you gain knowledge. Please leave a comment to let me know what you think about it! Share it to your friends and learn new things together.
Transcript
Investor trip 2010
IndiaIndia
Neeraj Swaroop Regional CEO, India & South Asiag ,
Leading the way Leading the way in Asia, Africa and the Middle East
Forward looking statements This presentation contains or incorporates by reference ‘forward-looking statements’ regarding the belief or current expectations of Standard Chartered, the Directors and other members of its senior management about the Group’s businesses and the transactions described in this presentation. Generally, words such as ‘‘may’’, ‘‘could’’, ‘‘will’’,‘‘expect’’, ‘‘intend’’, ‘‘estimate’’, ‘‘anticipate’’, ‘‘believe’’, ‘‘plan’’, ‘‘seek’’, ‘‘continue’’ or similar expressions identify forward-lookingg statements. These forward-looking statements are not guarantees of future performance. Rather, they are based on current views and assumptions and involve known and unknown risks, uncertainties and other factors, many of which are outside the control of the Company and/or its Group and are difficult to predict, that may cause actual results to differ materially from any future results or developments expressed or implied from the forward-looking statements. Such risks and uncertainties changges in the credit qqualityy and the recoverabilityy of loans and amounts due from counterpparties;; changges in the Groupp’s financial models incorporating assumptions, judgments and estimates which may change over time; risks relating to capital, capital management and liquidity; risks arising out of legal and regulatory matters, investigations and proceedings;operational risks inherent in the Group’s business; risks arising out of the Group’s holding company structure; risks associated with the recruitment, retention and development of senior management and other skilled personnel; risks associated with business expansion and engaging in acquisitions; global macroeconomic risks; risks arising out of the di i f th G s operatitions, ththe llocations off itits busiinesses andd ththe llegall, politiliticall andd economic enviironment indispersion of the Group’’ ti b i t i such jurisdictions; competition; risks associated with the UK Banking Act 2009 and other similar legislation or regulations; changes in the credit ratings or outlook for the Group; market, interest rate, commodity prices, equity price and other market risk; foreign exchange risk; financial market volatility; systemic risk in the banking industry and amongst other financial institutions or corporate borrowers; cross-border country risk; risks arising from operating in markets with less developed judicial and dispute resolution systems; risks arising out of regional hostilities terrorist attacks social unrestdeveloped judicial and dispute resolution systems; risks arising out of regional hostilities, terrorist attacks, social unrest or natural disasters and failure to generate sufficient level of profits and cash flows to pay future dividends. Any forward-looking statement contained in this presentation based on past or current trends and/or activities of Standard Chartered should not be taken as a representation that such trends or activities will continue in the future. No statement in this presentation is intended to be a profit forecast or to imply that the earnings of the Company for the current year or futurefuture yearsyears willwill necessarilynecessarily matchmatch oror exceed theexceed the historicalhistorical oror publishedpublished earningsearnings ofof thethe CompanyCompany. Each forward-lookingEach forward lookingstatement speaks only as of the date of the particular statement. Standard Chartered expressly disclaims any obligation or undertaking to release publicly any updates or revisions to any forward-looking statements contained herein to reflect any change in Standard Chartered’s expectations with regard thereto or any change in events, conditions or circumstances on which any such statement is based. The securities referred to in this presentation have not been and will not be registered under the U S Securities Act of The securities referred to in this presentation have not been and will not be registered under the U.S. Securities Act of 1933 (the “U.S. Securities Act”) and may not be offered, sold or transferred within the United States except pursuant to an exemption from, or in a transaction not subject to, the registration requirements of the U.S. Securities Act.No public offering of the Placing Shares will be made in the United States.
2
Agenda
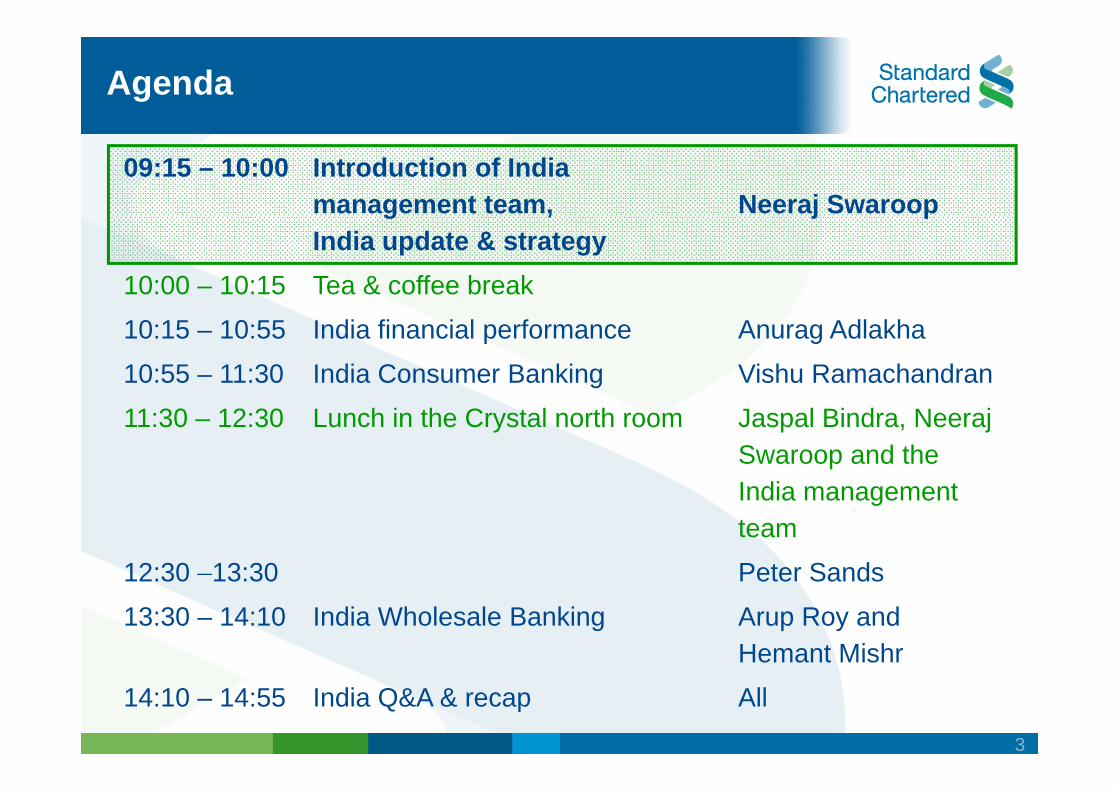
09:15 – 10:00 Introduction of India management team, Neeraj Swaroopg , India update & strategy
j p
10:00 – 10:15 Tea & coffee break
10:15 – 10:55 India financial performance Anurag Adlakha
10:55 – 11:30 India Consumer Banking Vishu Ramachandran
11:30 – 12:30 Lunch in the Crystal north room Jaspal Bindra, Neeraj Swaroop and the I di tIndia management team
12:30 –13:30 Peter Sands 12:30 13:30 Peter Sands
13:30 – 14:10 India Wholesale Banking Arup Roy and Hemant Mishr
14:10 – 14:55 India Q&A & recap All
3

Key messages
Long-term prospects for India remain intact SCB in an advantaged position to capture this growth SCB in an advantaged position to capture this growth WB and CB executing well to strategy F hi ll iti d t hi it i tiFranchise well-positioned to achieve its aspirations
4
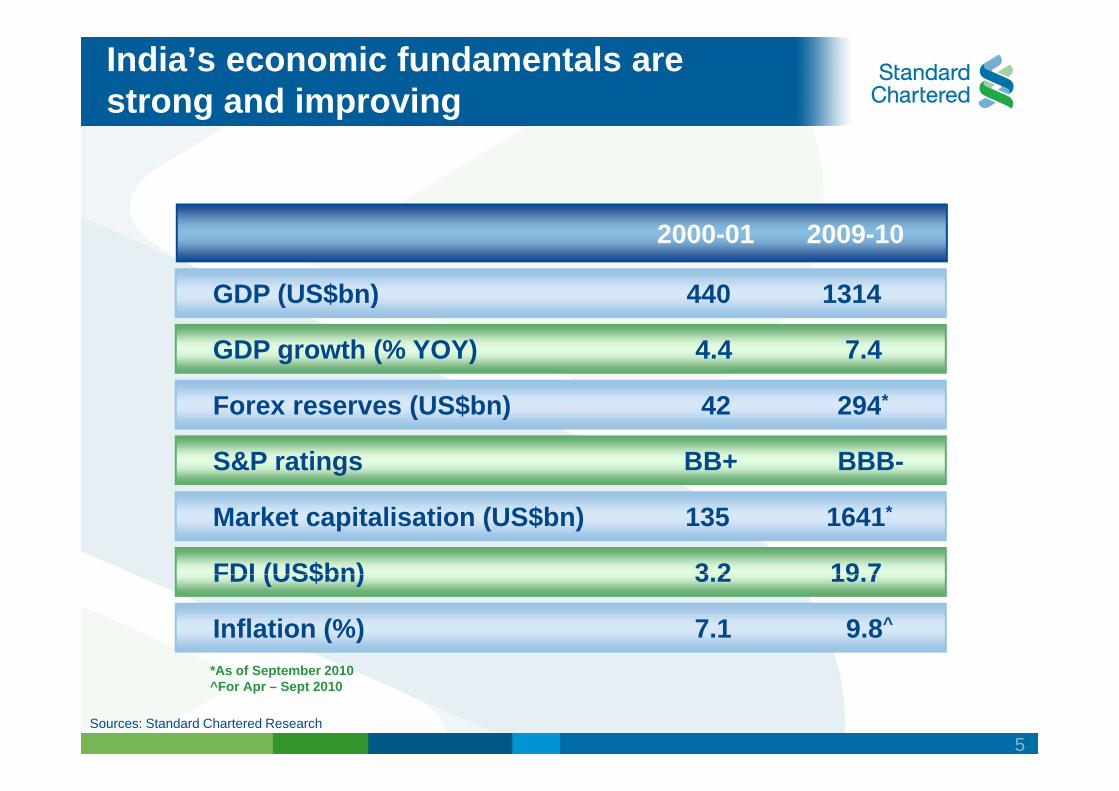
India’s economic fundamentals are strong and improving
GDP (US$bn) 440 1314
2000-01 2009-10
( )
GDP growth (% YOY) 4.4 7.4
F (US$b ) 42 294* Forex reserves (US$bn) 42 294*
S&P ratings BB+ BBB-
Market capitalisation (US$bn) 135 1641*
FDI (US$bn) 3 2 19 7FDI (US$bn) 3.2 19.7
Inflation (%) 7.1 9.8^
*As of September 2010 ^For Apr – Sept 2010
Sources: Standard Chartered Research
5
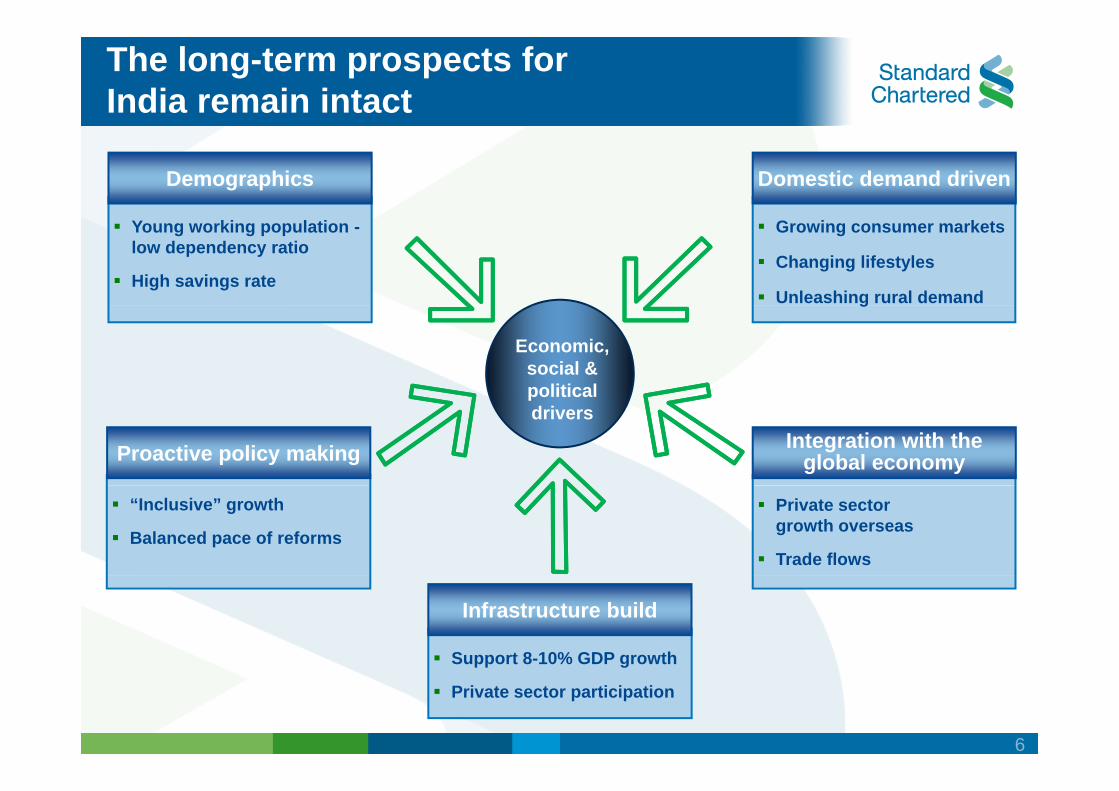
The long-term prospects for India remain intact
Demographics Domestic demand driven
Young working population -low dependency ratio
High savings rate
Growing consumer markets
Changing lifestyles
Unleashing rural demand
Economic, social & political
g
political drivers
Proactive policy making Integration with the global economy
“Inclusive” growth
Balanced pace of reforms
Private sector growth overseas
Trade flows
Support 8-10% GDP growth
Infrastructure build
pp g
Private sector participation
6
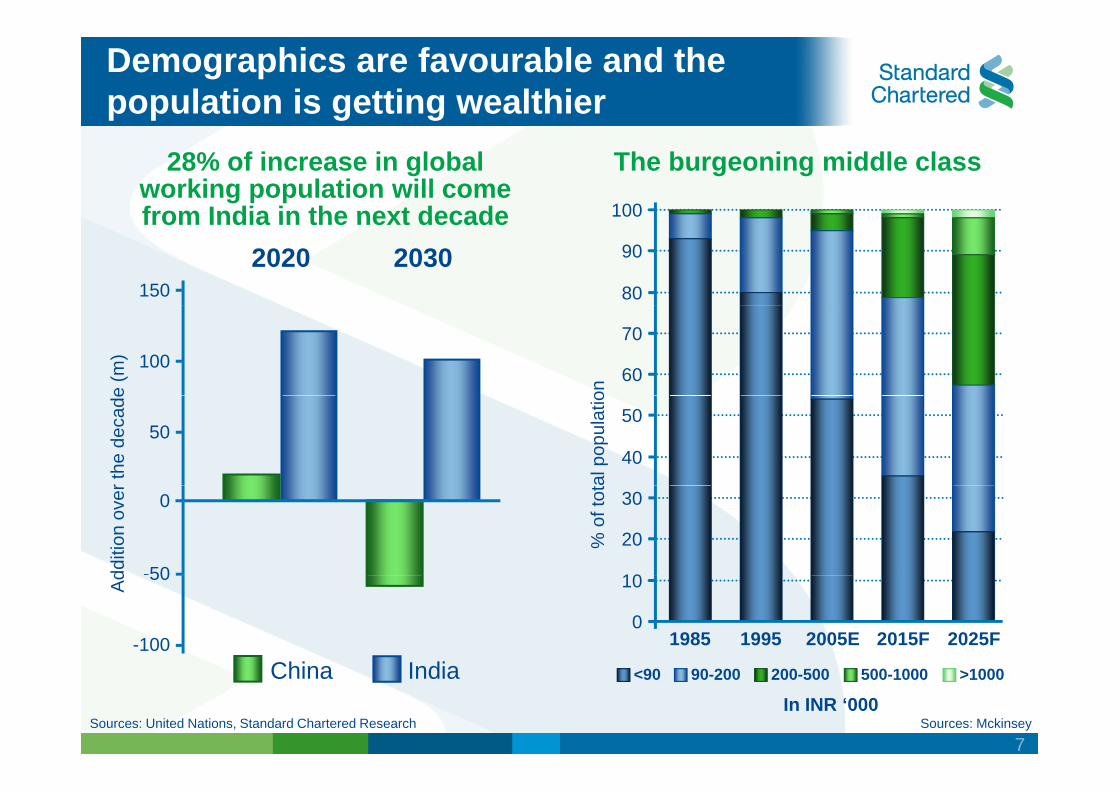
Demographics are favourable and the population is getting wealthier
28% of increase in global The burgeoning middle class working population will come
100from India in the next decade
China India <90 90-200 200-500 500-1000 >1000
In INR ‘000
from India in the next decade
150 80
90
100
2020 2030
e (m
) 100
on
60
70
r the
dec
ade
Ad
50
al p
opul
atio
40
50
dditi
on o
ver
-50
0
% o
f tot
10
20
30
Chi I di
50
0
10
1985 1995 2005E 2015F 2025F
Sources: United Nations, Standard Chartered Research Sources: Mckinsey
-100
7
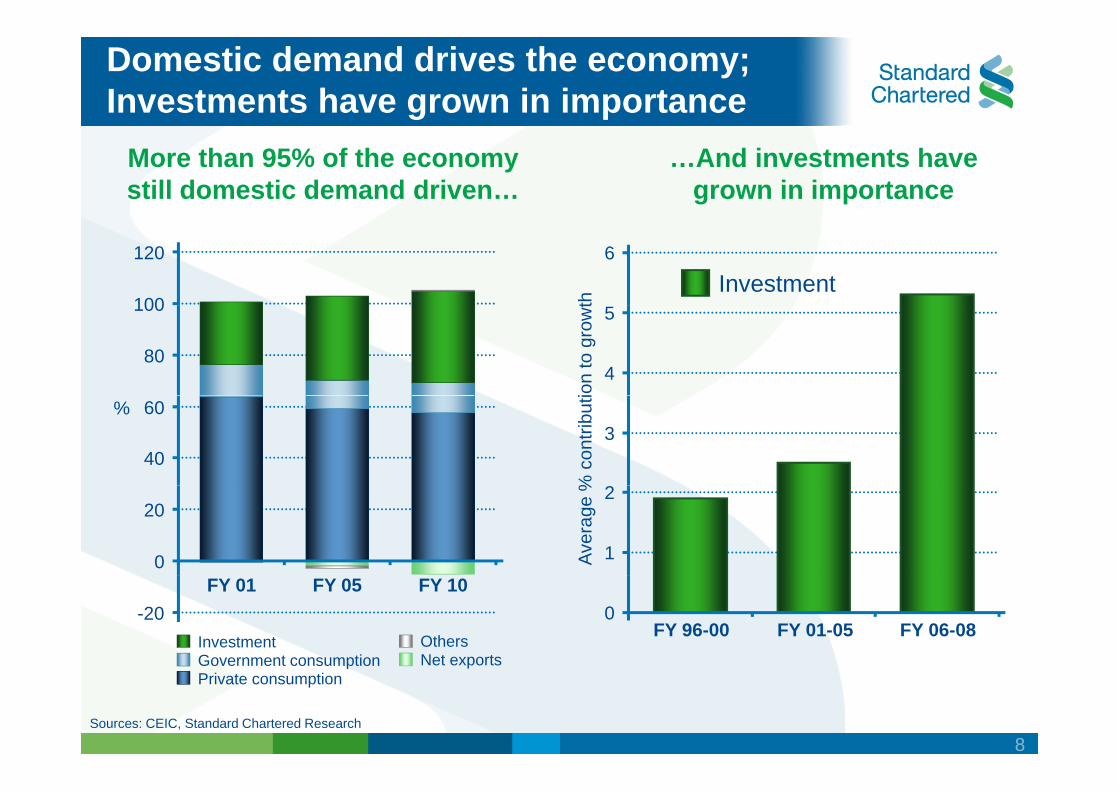
Domestic demand drives the economy; Investments have grown in importance
More than 95% of the economy …And investments have still domestic demand driven… grown in importance
120 6
Investment 100100 5
80 4
% 60 3
40
2 20
0 1
FY 01 FY 05 FY 10 -20 0
Investment Others FY 96-00 FY 01-05 FY 06-08 Government consumption Government consumption Net exports Net exports Private consumption
Sources: CEIC, Standard Chartered Research
Aver
age
%% c
ontri
butiio
n to
gro
wtth
8

Proactive policy making is providing a stable platform for growth
Rapid growth in liberalised sectors Impact of liberalisation Growth of the private sector
Auto 100
US$bnCapital inflows Taking the ‘global’ view Consistent and unidirectional reforms
Telecom IT/ITES Auto
75
25
50 Examples
De-licensing of auto sector (1993)
1991 0
25
2009
Mobile telephony licenses (1995) Setting up of software parks withvarious tax incentives (1991)
1991 2009
Progressive reforms will boost growth in other sectors of the economy as well
Source: Standard Chartered Research
9
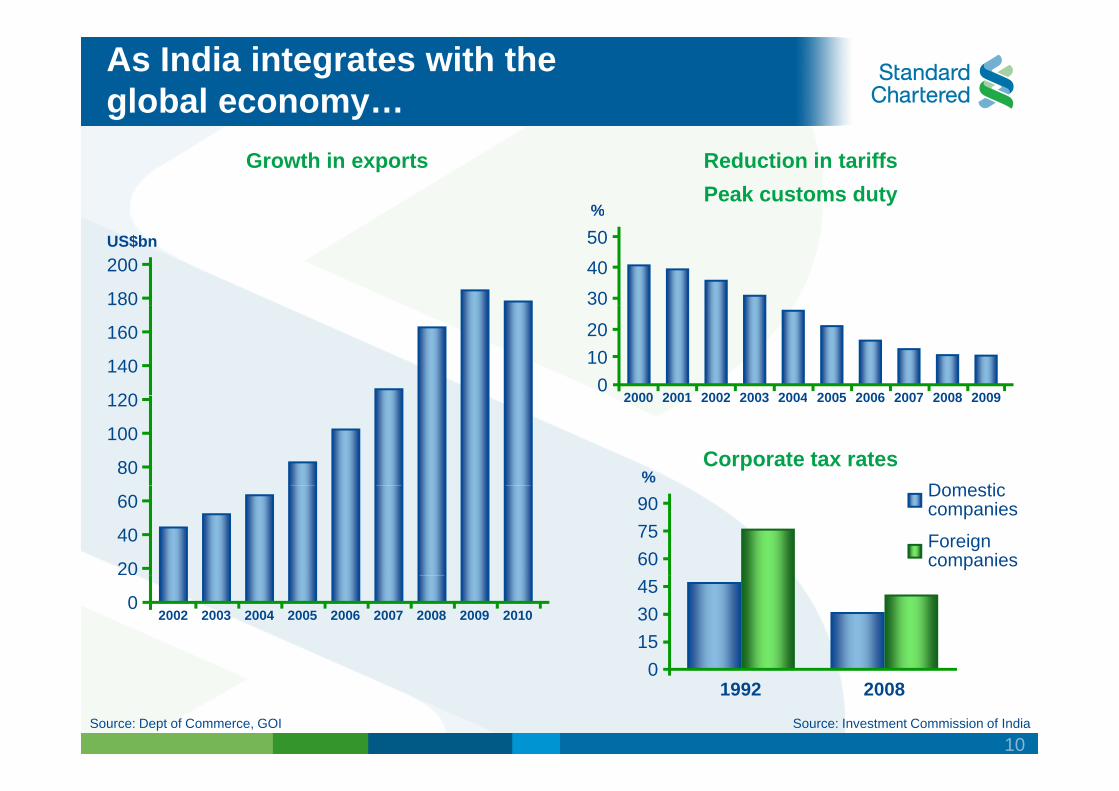
As India integrates with the global economy…
Growth in exports Reduction in tariffs
% Peak customs duty
US$bn
180
200
30 40 50
120
140
160
0 10 20
2000 2001 2002 2003 2004 2005 2006 2007 2008 2009
Corporate tax rates %80
100
120
D ti
2000 2001 2002 2003 2004 2005 2006 2007 2008 2009
20
40
60
60 75 90
Domestic companies
Foreigncompanies
0 2002 2003 2004 2005 2006 2007 2008 2009 2010
0 15 30 45
Source: Dept of Commerce, GOI Source: Investment Commission of India
0 1992 2008
10
-
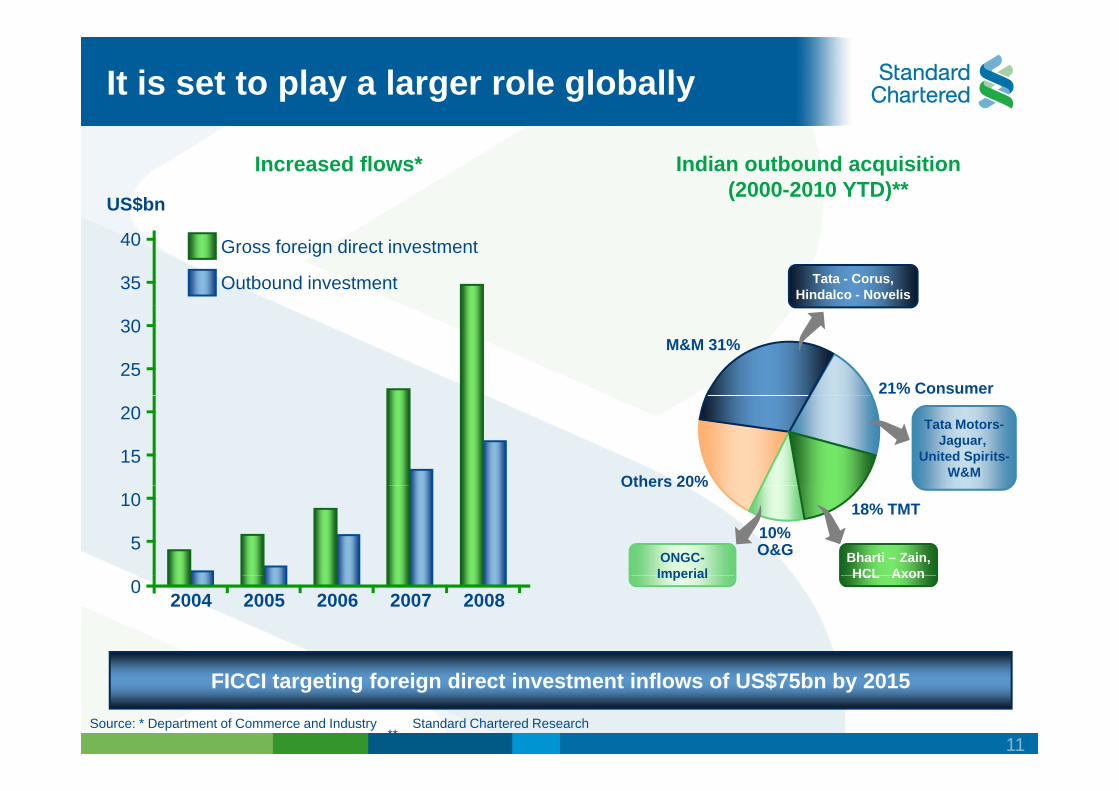
It is set to play a larger role globally
US$bn
Increased flows* Indian outbound acquisition (2000-2010 YTD)**
35
40 Gross foreign direct investment
Outbound investment Tata - Corus, Hindalco - Novelis
25
30
21% Consumer
M&M 31%
15
20 Tata Motors-
Jaguar, United Spirits-
W&MOthers 20%
5
10
Bharti – Zain, HCL Axon
ONGC-Imperial
Others 20%
18% TMT
O&G 10%
2004 2005 2006 2007 20080
HCL AxonImperial
FICCI targeting foreign direct investment inflows of US$75bn by 2015
Source: * Department of Commerce and Industry **
Standard Chartered Research
11
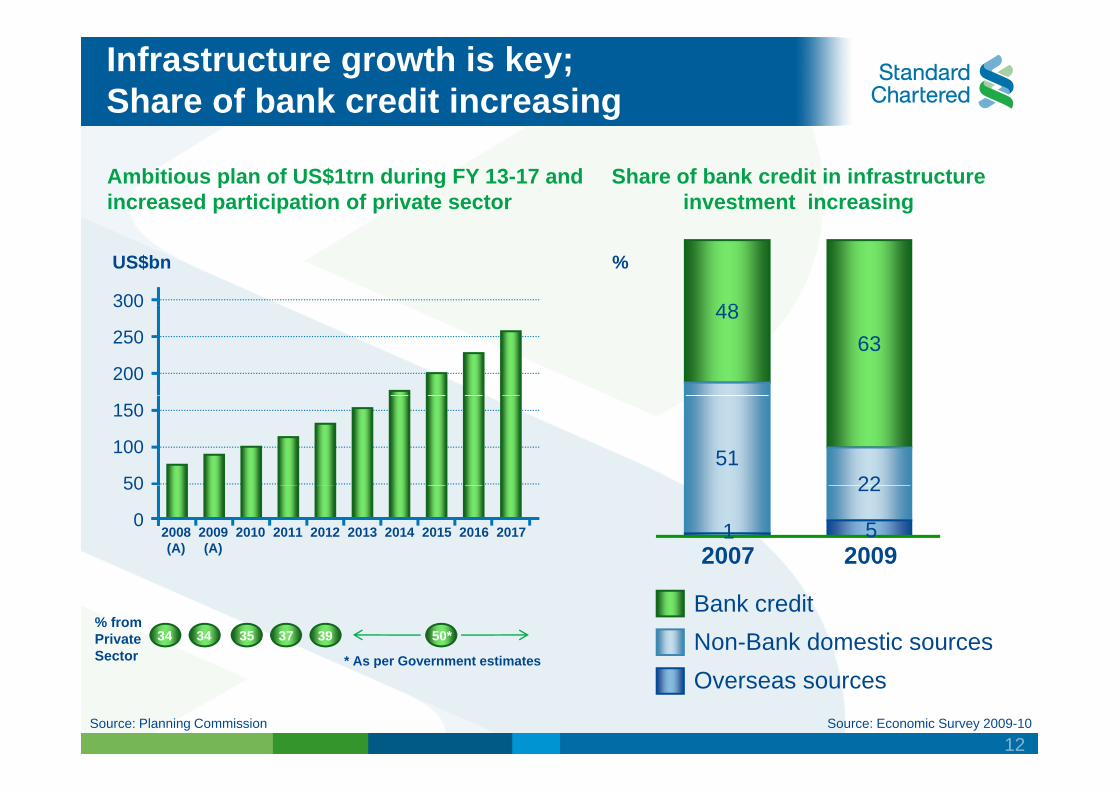
Infrastructure growth is key; Share of bank credit increasing
Ambitious plan of US$1trn during FY 13-17 and increased participation of private sector
Share of bank credit in infrastructure investment increasing
48
%US$bn
300 48 63
200
250
300
51 2250
100
150
22 0
50
2008 (A)
2009 (A)
2010 2011 2012 2013 2014 2015 2016 2017 1 5 2007 2009
% from Private Sector
34 34 35 37 39 50*
* As per Government estimates
Bank credit Non-Bank domestic sources
Source: Economic Survey 2009-10
As per Government estimates
Source: Planning Commission
Overseas sources
12
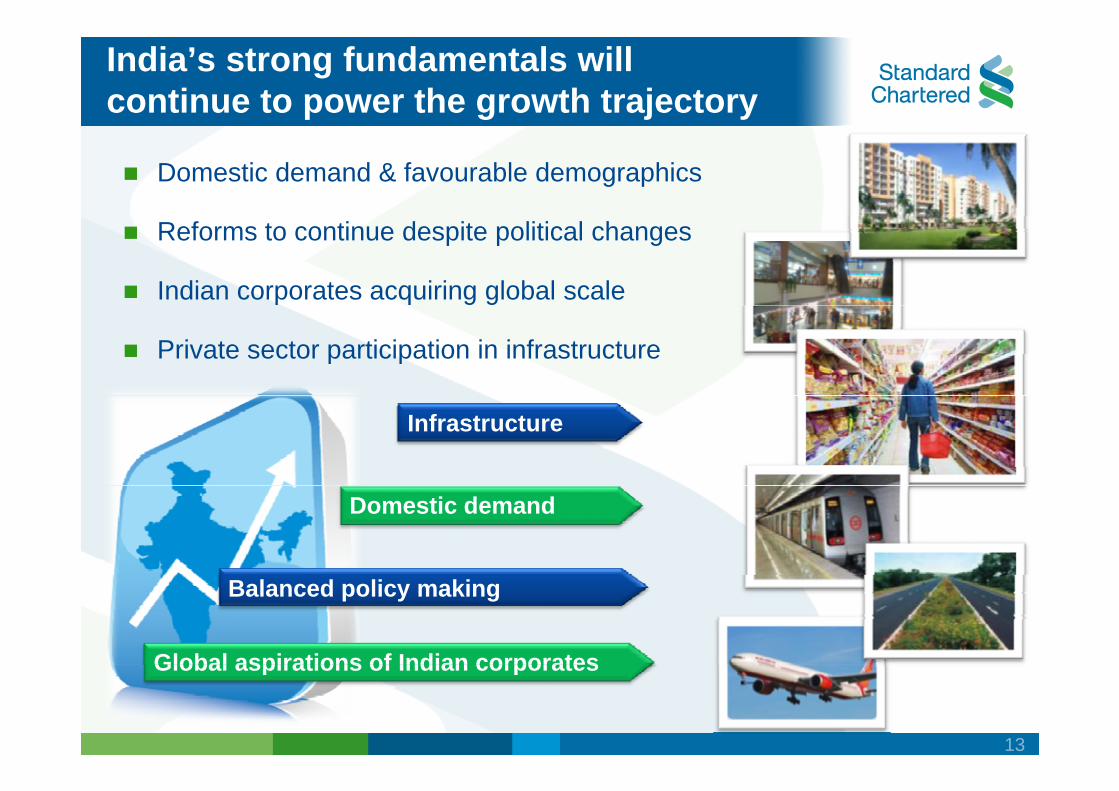
India’s strong fundamentals will continue to power the growth trajectory
Domestic demand & favourable demographics
Reforms to continue despite political changes
Indian corporates acquiring global scale
Private sector participation in infrastructure
Infrastructure
Domestic demand
Balanced policy making
Global aspirations of Indian corporatesGlobal aspirations of Indian corporates
13
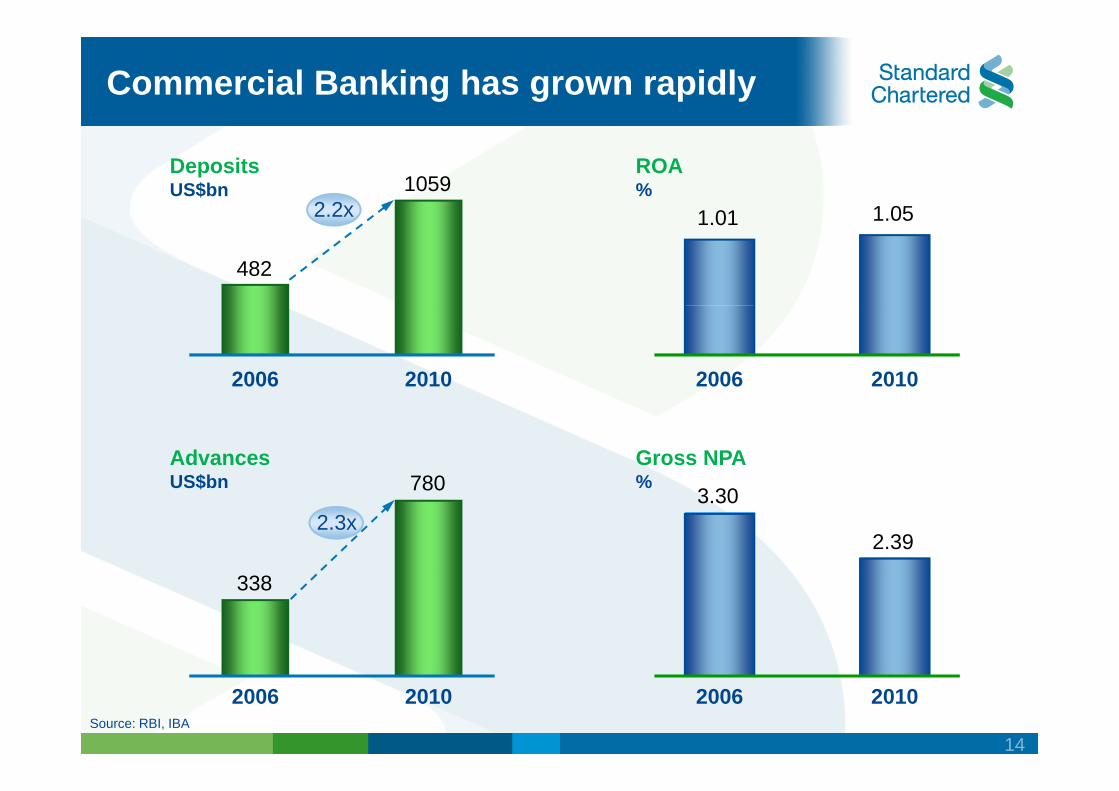
Commercial Banking has grown rapidly
ROA %
1 01 1 05
Deposits US$bn
2.2x 1059
1.01 1.052.2x
482
2006 20102006 2010
Gross NPA %
Advances US$bn 780 %
3.30
2.39
US$bn
2.3x
780
338338
2006 20102006 2010 Source: RBI, IBA
14
y
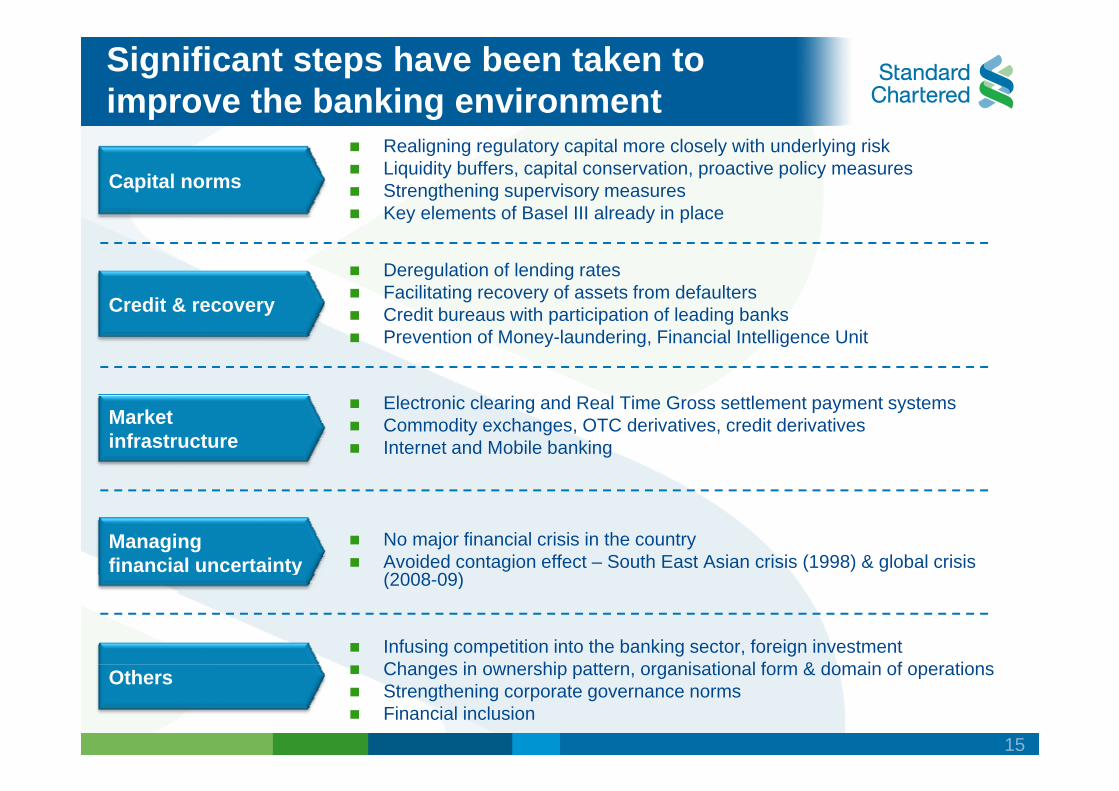
Significant steps have been taken to improve the banking environment
Realigning regulatory capital more closely with underlying risk Liquidity buffers, capital conservation, proactive policy measures Strengthening supervisory measures Key elements of Basel III already in place
Electronic clearing and Real Time Gross settlement payment systems Commodity exchanges, OTC derivatives, credit derivatives Internet and Mobile banking
Credit & recovery
Key elements of Basel III already in place
Deregulation of lending rates Facilitating recovery of assets from defaulters Credit & recovery Credit bureaus with participation of leading banks Prevention of Money-laundering, Financial Intelligence Unit
G Market infrastructure
No major financial crisis in the country Avoided contagion effect – South East Asian crisis (1998) & global crisis
Capital norms
Managing financial uncertainty
(2008 09)(2008-09)
Infusing competition into the banking sector, foreign investment Ch i hi tt i ti l f & d i f ti Others Changes in ownership pattern, organisational form & domain of operations Strengthening corporate governance norms Financial inclusion
15
corridors &
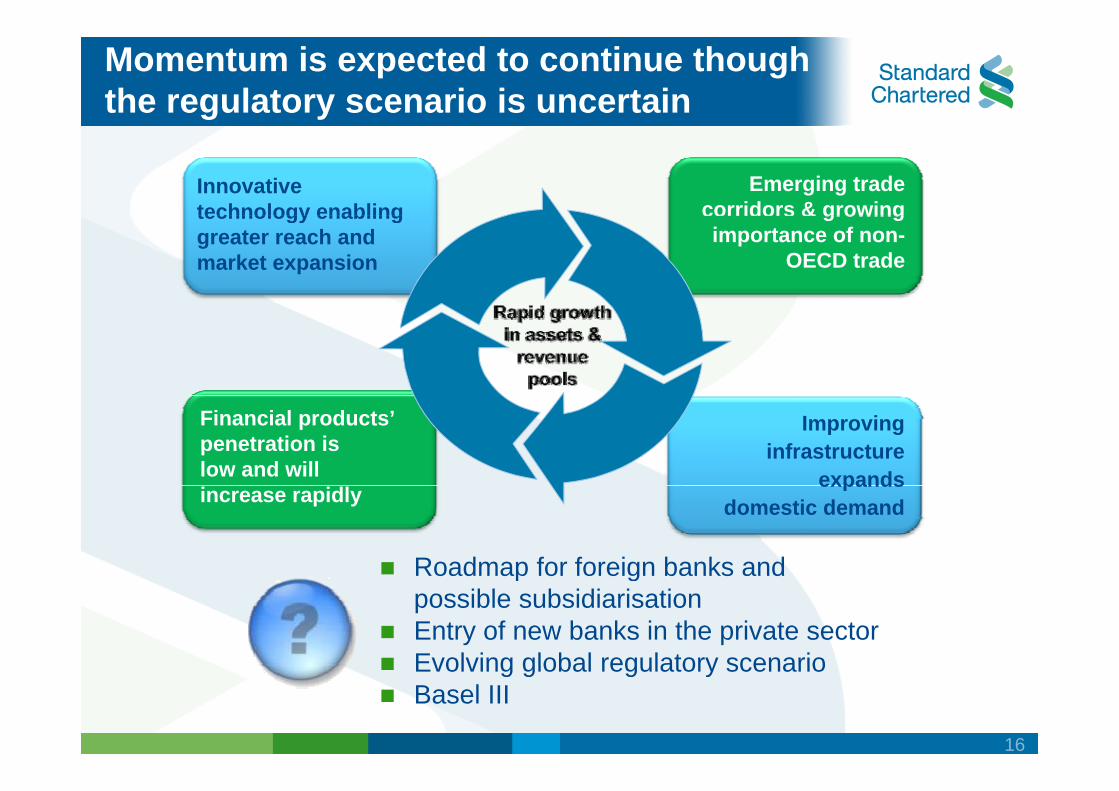
Momentum is expected to continue though the regulatory scenario is uncertain
Innovative technology enabling
Emerging trade corridors & growing technology enabling
greater reach and market expansion
growing importance of non-
OECD trade
Improving infrastructure
expands
Financial products’ penetration is low and will expands
domestic demandincrease rapidly
Roadmap for foreign banks andRoadmap for foreign banks and possible subsidiarisation Entry of new banks in the private sector Evolving global regulatory scenarioEvolving global regulatory scenario Basel III
16
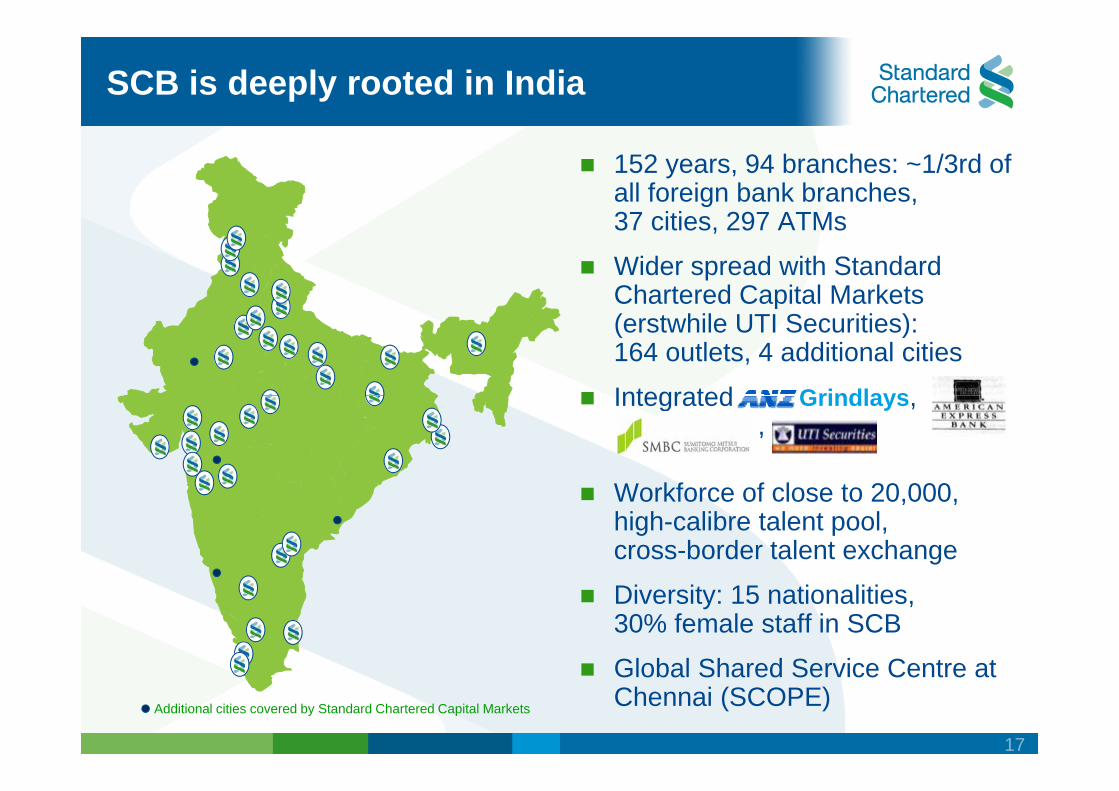
SCB is deeply rooted in India
152 years, 94 branches: ~1/3rd of all foreign bank branches,37 iti 297 ATM37 cities, 297 ATMs
Wider spread with StandardChartered Capital Marketsp(erstwhile UTI Securities):164 outlets, 4 additional cities
Integrated GrindlaysIntegrated Grindlays, ,
W kf f l t 20 000Workforce of close to 20,000, high-calibre talent pool,cross-border talent exchange
Diversity: 15 nationalities,30% female staff in SCB
Global Shared Service Centre atGlobal Shared Service Centre at Chennai (SCOPE)Additional cities covered by Standard Chartered Capital Markets
17
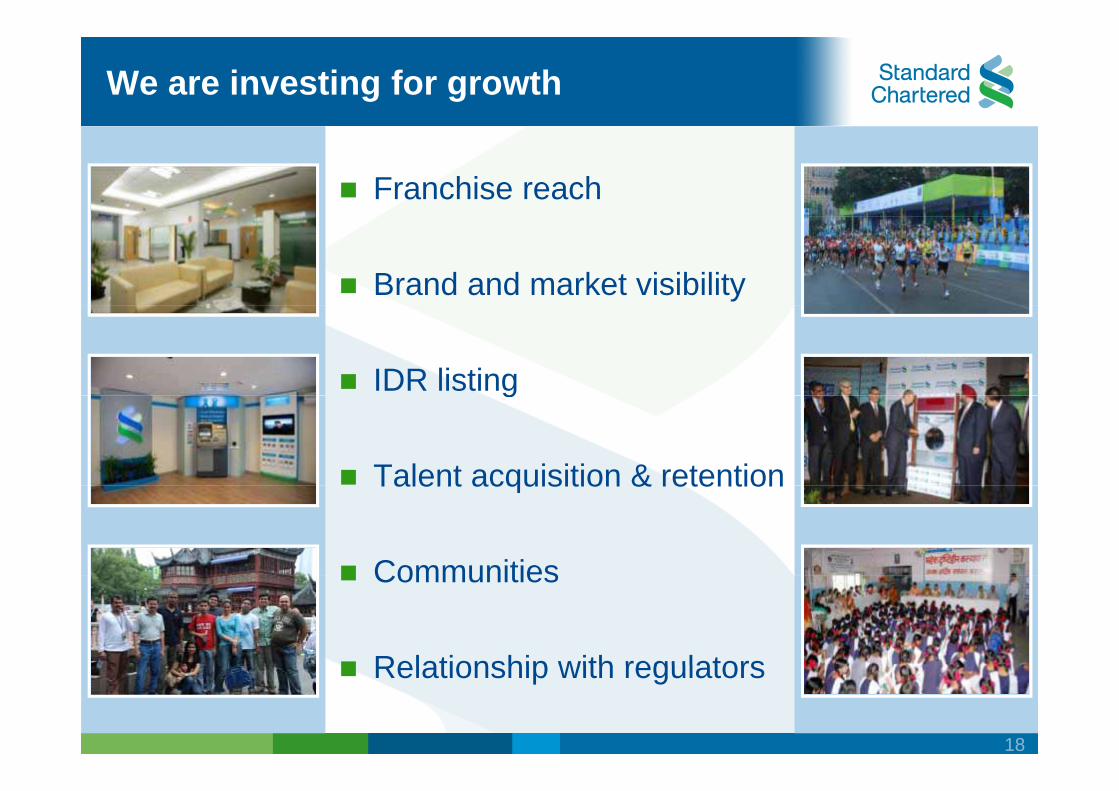
We are investing for growth
Franchise reach
Brand and market visibility
IDR listingg
Talent acquisition & retention Talent acquisition & retention
CommunitiesCommunities
Relationship with regulators Relationship with regulators
18
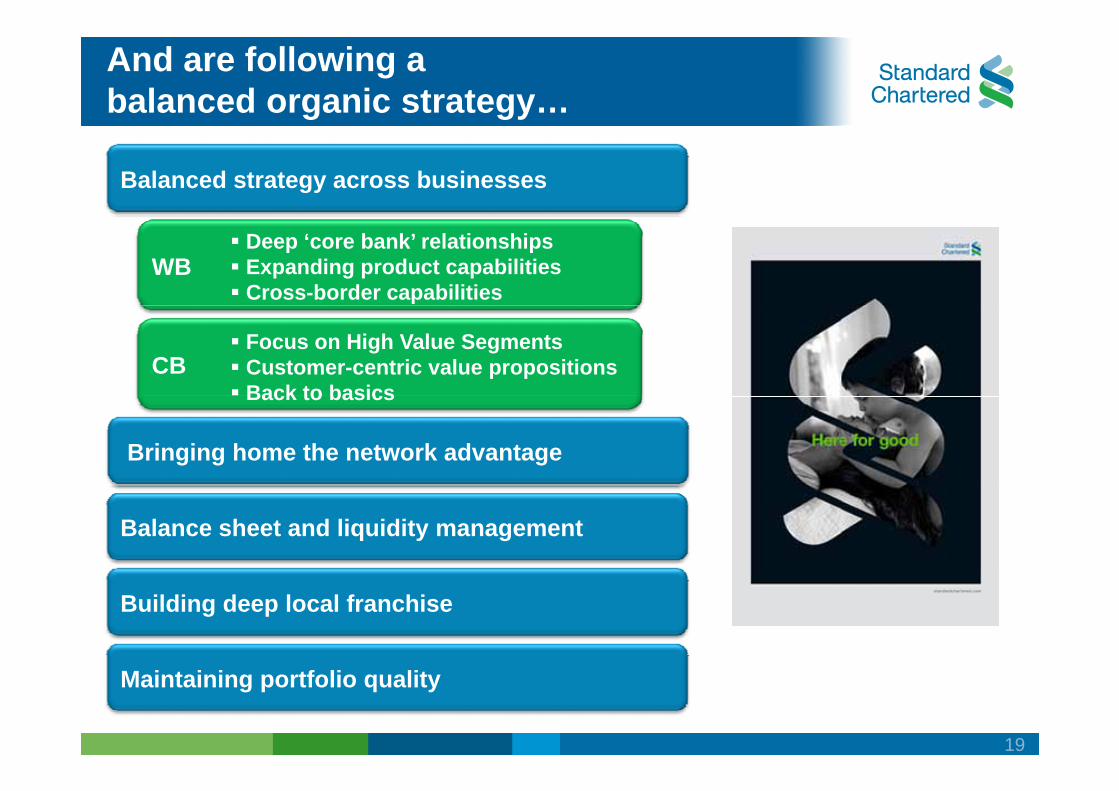
And are following a balanced organic strategy…
Balanced strategy across businesses
WB Deep ‘core bank’ relationships Expanding product capabilities Cross-border capabilities
CB Focus on High Value Segments Customer-centric value propositions Back to basicsBack to basics
Bringing home the network advantage
Balance sheet and liquidity management
Building deep local franchise
Maintaining portfolio quality
19
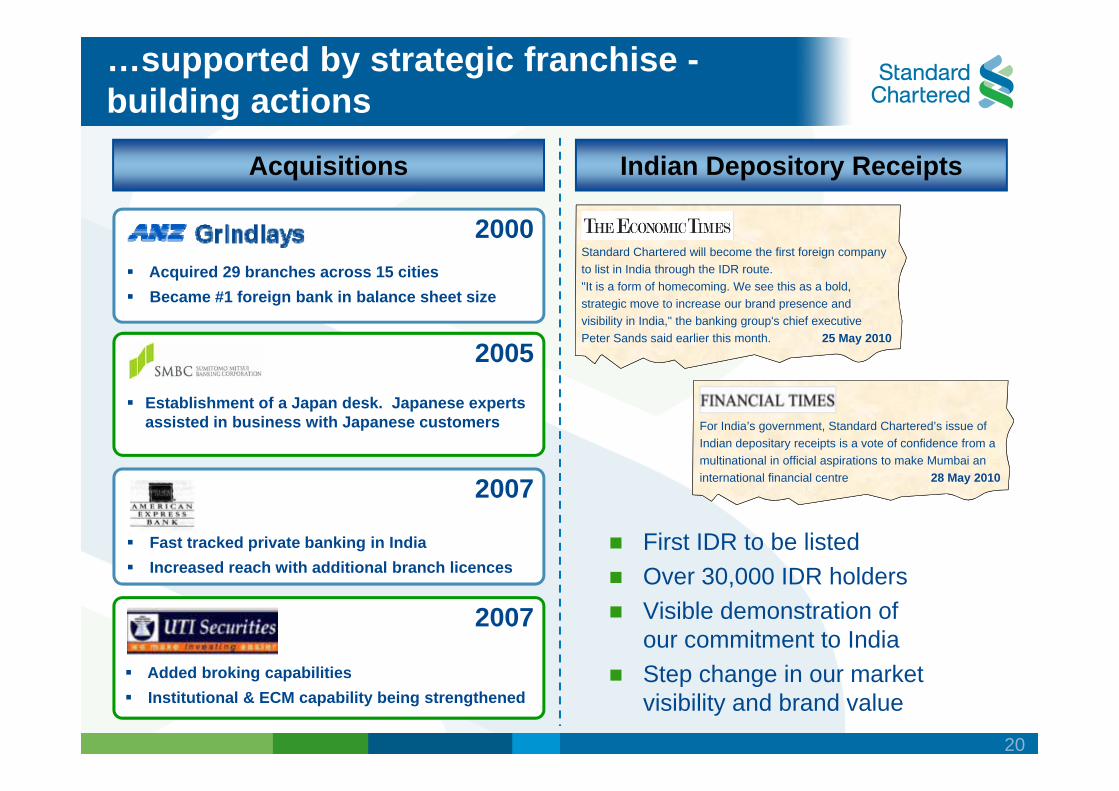
…supported by strategic franchise -building actions
Acquisitions Indian Depository Receipts
Acquired 29 branches across 15 cities Became #1 foreign bank in balance sheet size
2000 Standard Chartered will become the first foreign company to list in India through the IDR route. "It is a form of homecoming. We see this as a bold, strategic move to increase our brand presence and
2005
strategic move to increase our brand presence and visibility in India," the banking group's chief executive Peter Sands said earlier this month. 25 May 2010
Establishment of a Japan desk. Japanese experts assisted in business with Japanese customers
2007
For India’s government, Standard Chartered’s issue of Indian depositary receipts is a vote of confidence from a multinational in official aspirations to make Mumbai an international financial centre 28 May 2010
Fast tracked private banking in India Increased reach with additional branch licences
2007
First IDR to be listed Over 30 000 IDR holders
2007 Over 30,000 IDR holders Visible demonstration of our commitment to India S h i k Added broking capabilities
Institutional & ECM capability being strengthened Step change in our market visibility and brand value
20
P bli
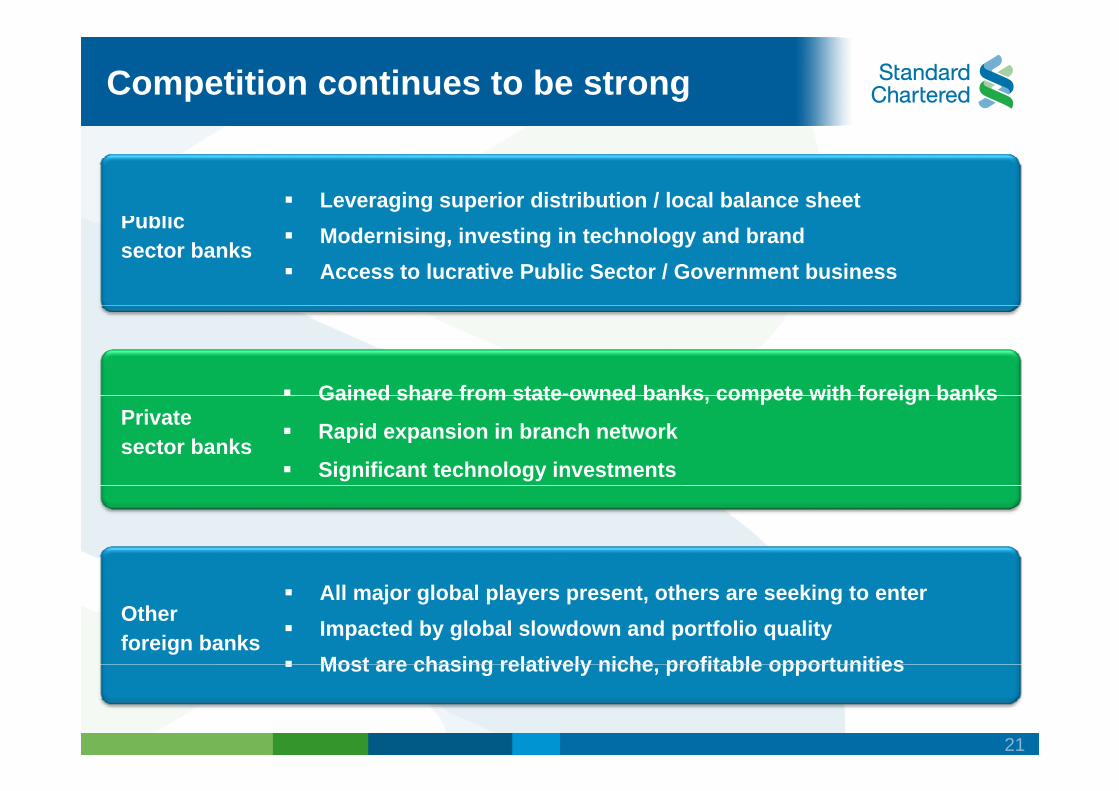
Competition continues to be strong
Leveraging superior distribution / local balance sheet Modernising, investing in technology and brand Access to lucrative Public Sector / Government business
Public sector banks
Gained share from state-owned banks compete with foreign banks Gained share from state owned banks, compete with foreign banks
Rapid expansion in branch network
Significant technology investments
Private sector banks
All major global players present, others are seeking to enterOther
Impacted by global slowdown and portfolio quality foreign banks Most are chasing relatively niche profitable opportunitiesMost are chasing relatively niche, profitable opportunities
21

d l b dd d i
But we remain in an advantaged position
Versus other foreign banks Versus local banksVersus other foreign banks Versus local banks
Longer presence in India, International network deeply embedded in local franchise Wider customer base
Product range / Innovation Global expertise tomanage risk/ model risk
Better distribution network Onshore client base in Wealth Management,
behaviour
Private Banking Comprehensiveproduct offerings
Underpinned by people processes and governanceUnderpinned by people, processes and governance
22
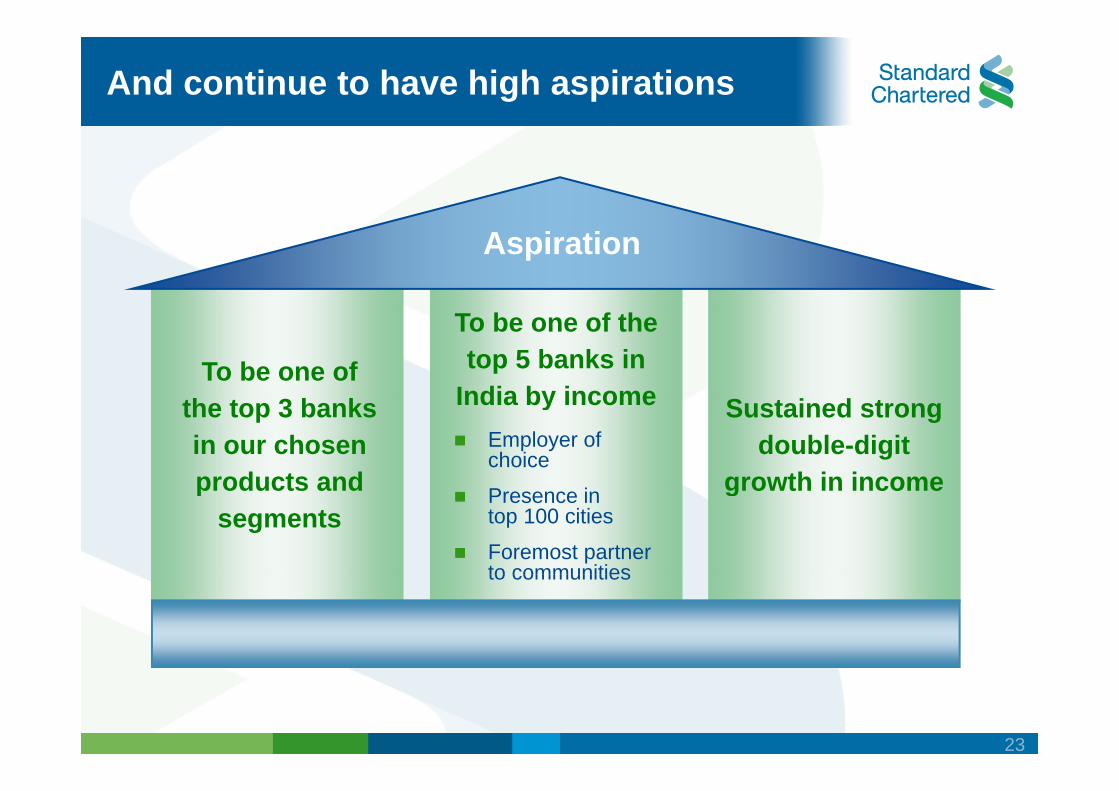
And continue to have high aspirations
Aspiration
To be one of
To be one of the top 5 banks in
India by income the top 3 banks in our chosen products and
Sustained strong double-digit
growth in income
India by income Employer ofchoice
products and segments
growth in incomePresence in top 100 cities
Foremost partner to communitiesto communities
23
Summary
Long-term prospects for India remain intact SCB in an advantaged position to capture this growth SCB in an advantaged position to capture this growth WB and CB executing well to strategy F hi ll iti d t hi it i tiFranchise well-positioned to achieve its aspirations
24

Q & AQ & A
25
India financial performance
Anurag Adlakha Chief Financial Officer, India and South Asia,
Leading the wayLeading the way in Asia, Africa and the Middle East
Key messages
Sustained growth over the yearsg y
Robust business model
Continue to invest with confidence
Disciplined focus on balance sheet managementDisciplined focus on balance sheet management
27
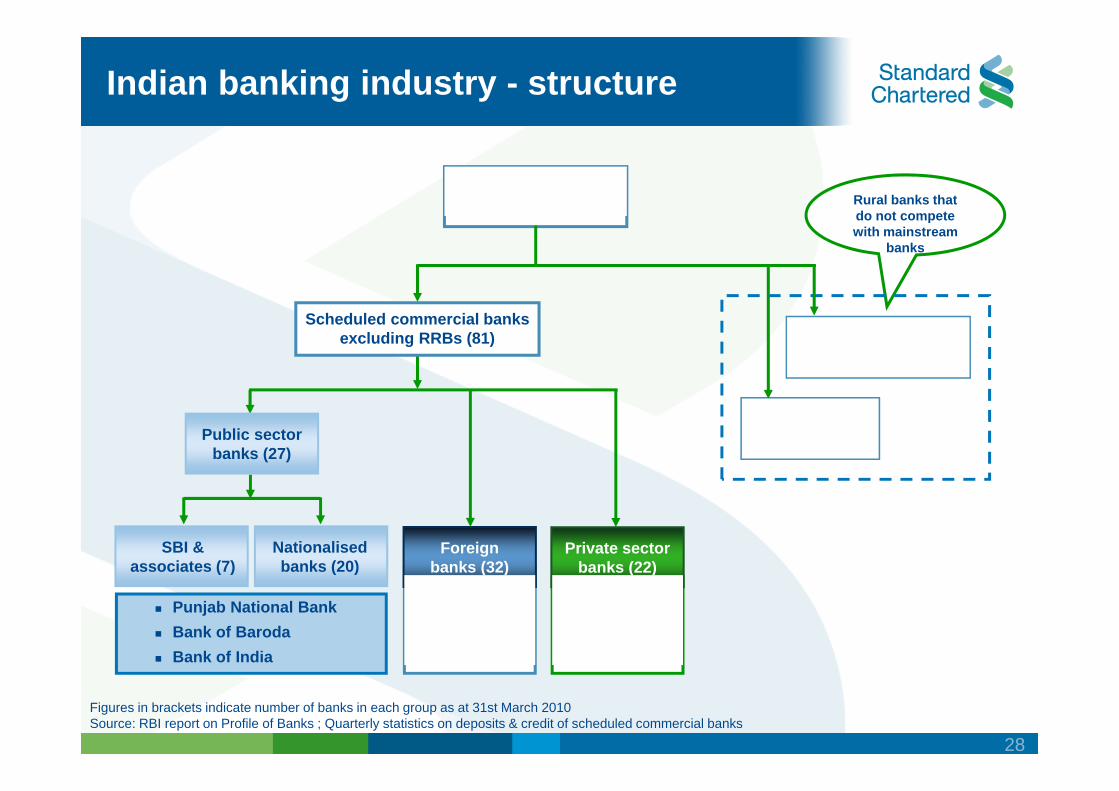
Indian banking industry - structure
Rural banks that do not compete
Commercial banks in India (168) do not compete
with mainstream banks
Non scheduled commercial banks (4)
Scheduled commercial banks excluding RRBs (81)
Regional rural banks (83)Public sector
banks (27)
Foreign banks (32)
SBI & associates (7)
Nationalised banks (20)
Private sector banks (22)
SCB Citi HSBC
ICICI Bank HDFC Bank Axis
Punjab National Bank Bank of Baroda Bank of India
( ) ( )
Figures in brackets indicate number of banks in each group as at 31st March 2010 Source: RBI report on Profile of Banks ; Quarterly statistics on deposits & credit of scheduled commercial banks
28
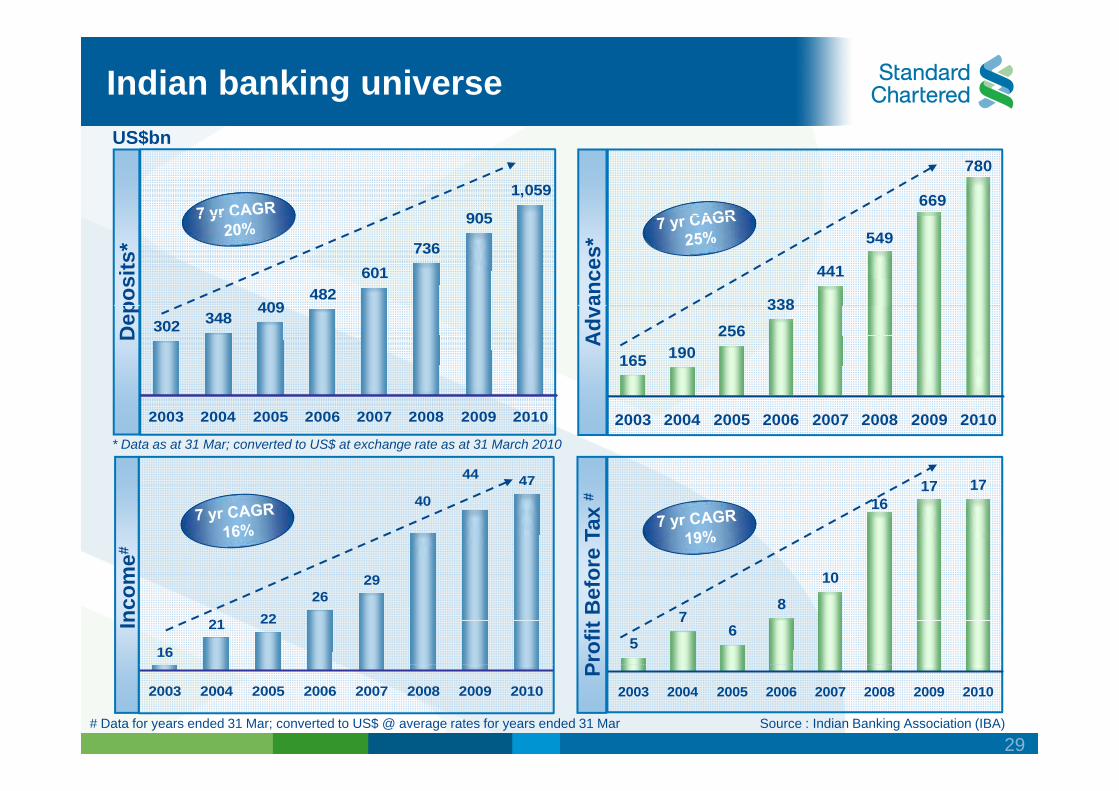
Indian banking universe
780
669 905
1,059
US$bn
338
441
549
409 482
601 736
905
posi
ts*
ance
s*
165 190 256
338 302 348
409
Dep
Adv
2003 2004 2005 2006 2007 2008 2009 20102003 2004 2005 2006 2007 2008 2009 2010
* Data as at 31 Mar; converted to US$ at exchange rate as at 31 March 2010
4744 1717
29
40
10
17 16
17
me #
ore
Tax
#
16
21 22 26
29
5
7 6
8
10
Inco
m
Prof
it B
efo
2003 2004 2005 2006 2007 2008 2009 2010 2003 2004 2005 2006 2007 2008 2009 2010
P
# Data for years ended 31 Mar; converted to US$ @ average rates for years ended 31 Mar Source : Indian Banking Association (IBA)
29
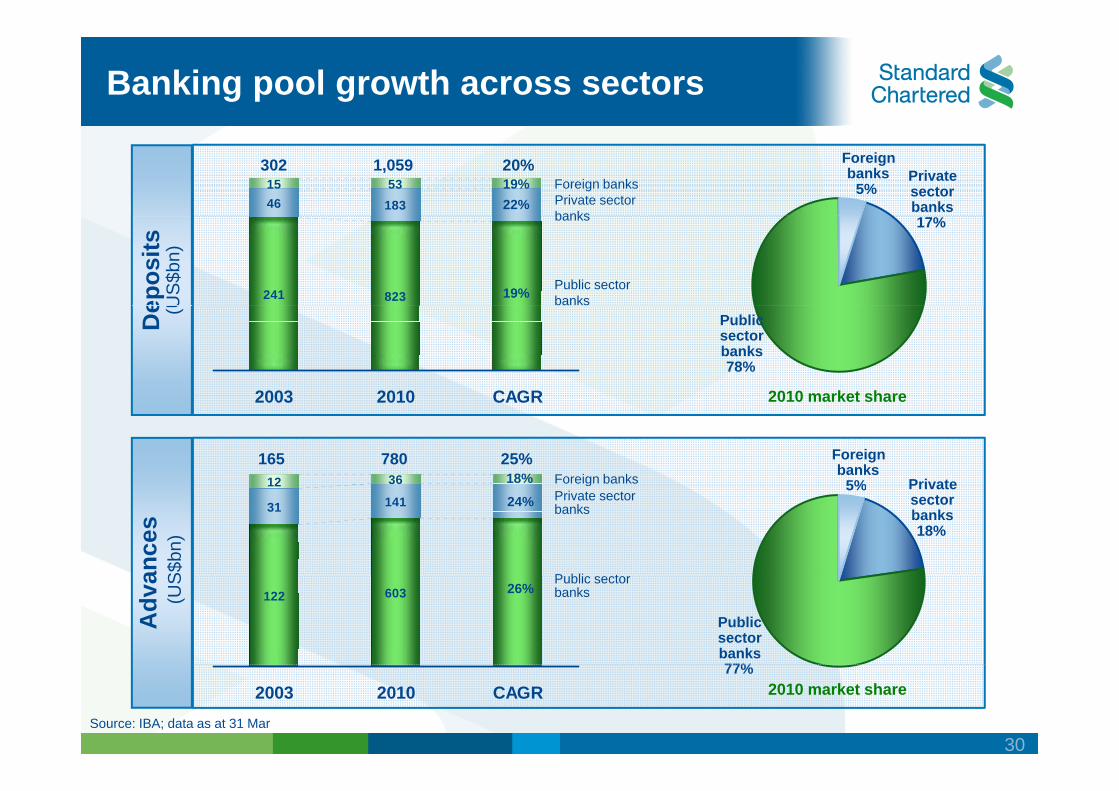
Banking pool growth across sectors
46 183 15 53 Foreign banks
Private sector banks
302 1,059 20% 19% 22%
Foreignbanks
5% Private sector banks
241 823
banks
Public sector banks 19% ep
osits
US
$bn)
17%
2003 2010 CAGR
De (U
2010 market share
Public sector banks 78%
2003 2010 CAGR
12 36 Foreign banks 165 780 25%
18%
2010 market share
Foreignbanks
5% Private 31 141 12 g
Private sector banks
P bli t
24%
ance
s S$
bn)
5% Private sector banks 18%
122 603 Public sector banks 26%
Adv
a (U
S
Public sector banks 77%
2003 2010 CAGR Source: IBA; data as at 31 Mar
2010 market share 77%
30
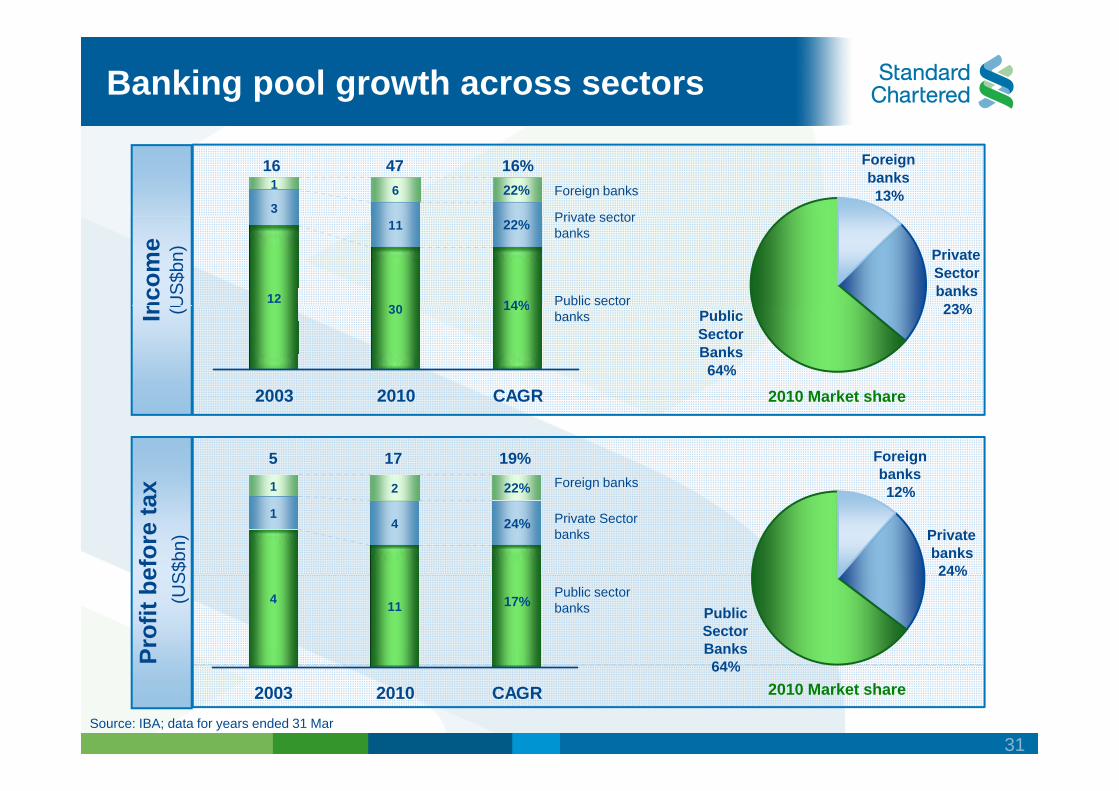
Banking pool growth across sectors
3
1 6 Foreign banks
Private sector
16 47 16% 22%
Foreign banks 13%
12 30
11 Private sector banks
Public sector
22%
14%ncom
eU
S$b
n) Private Sector banks 23%30
2003 2010 CAGR
banks 14% In (U
2010 Market share
23%Public Sector Banks 64%
2003 2010 CAGR
1 2 Foreign banks
5 17 19%
22%x
2010 Market share
Foreign banks
1 4
1 2 Foreign banks
Private Sector banks
22%
24%
efor
e ta
x S$
bn) Private
banks 24%
12%
4 11 Public sector banks 17%
Prof
it be
(U
S 24%
Public Sector Banks 64%
2003 2010 CAGR Source: IBA; data for years ended 31 Mar
2010 Market share 64%
31
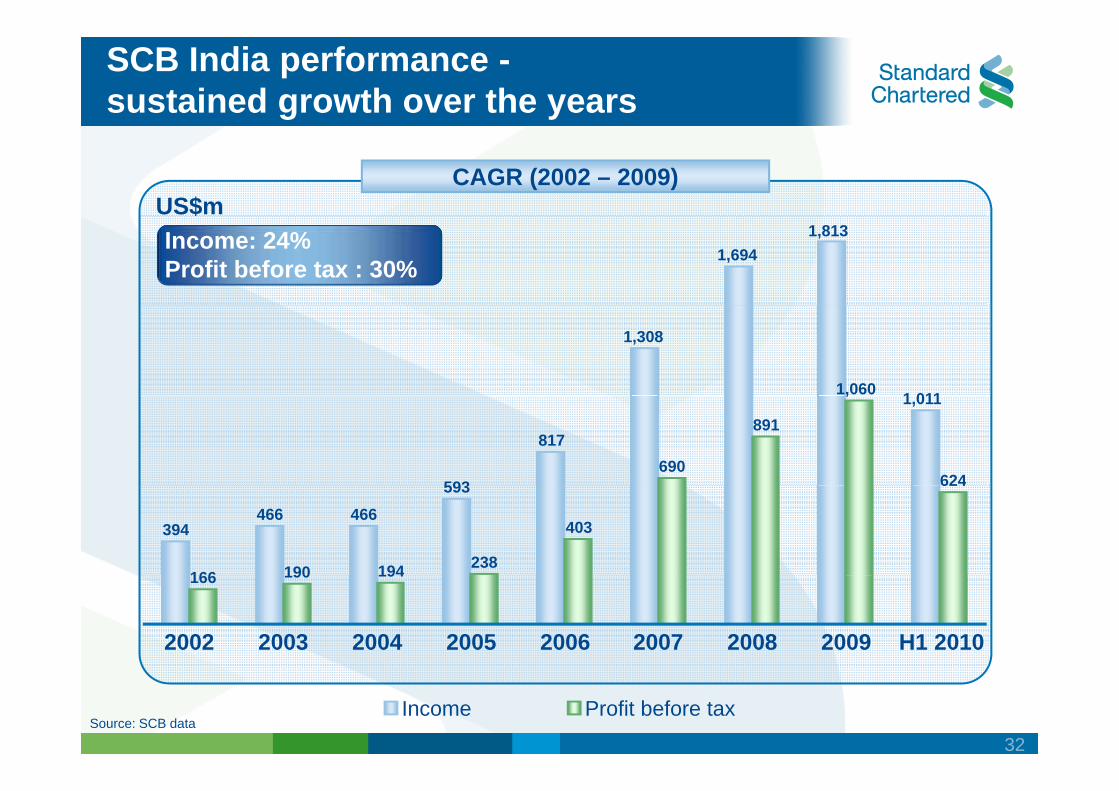
SCB India performance -sustained growth over the years
CAGR (2002 – 2009) US$m Income: 24% Profit before tax : 30%
1,694 1,813
1,308
1 011 1,060
593
817
1,011
690
891
,
624
394 466 466
593
166 190 194 238
403
624
166 190 194
2002 2003 2004 2005 2006 2007 2008 2009 H1 2010
Source: SCB data Income Profit before tax
32
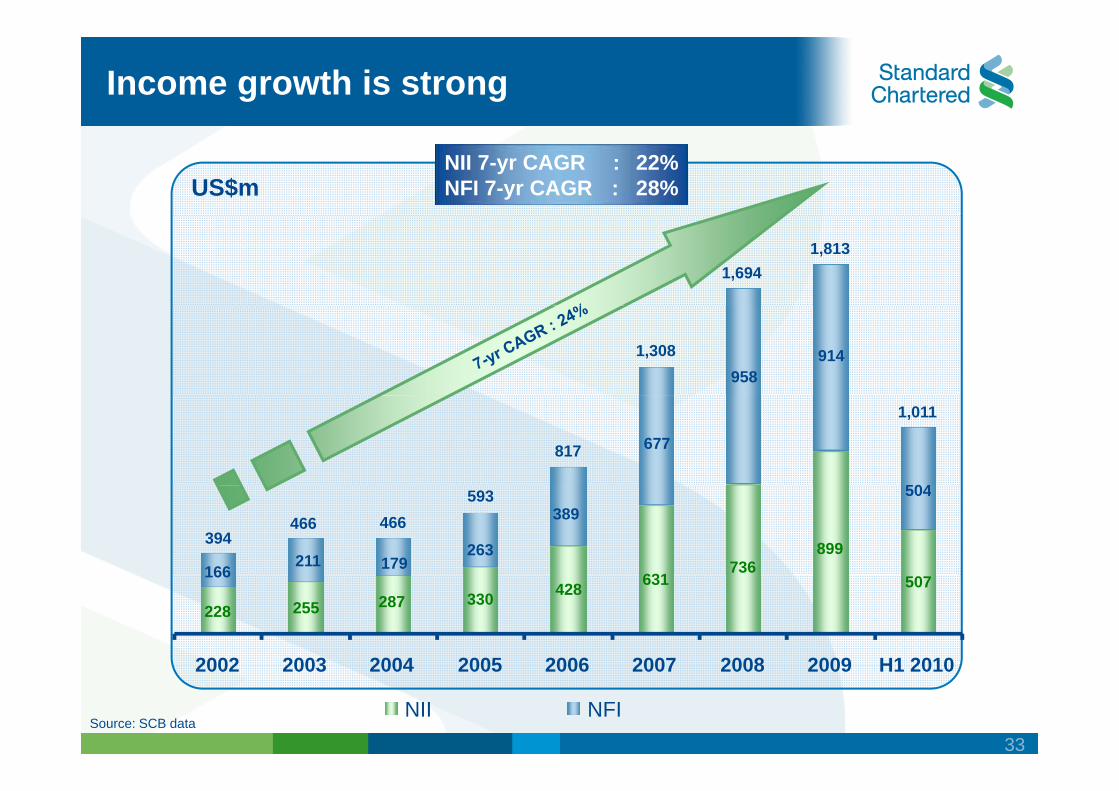
Income growth is strong
US$m NII 7-yr CAGR : 22% NFI 7-yr CAGR : 28%
1,694 1,813
958 9141,308
677
504
817
1,011
899
631 736179166
211 263
389 504
394 466 466
593
507 287228 255 330 428 631166
2002 2003 2004 2005 2006 2007 2008 2009 H1 20102002 2003 2004 2005 2006 2007 2008 2009 H1 2010
NII NFI Source: SCB data
33
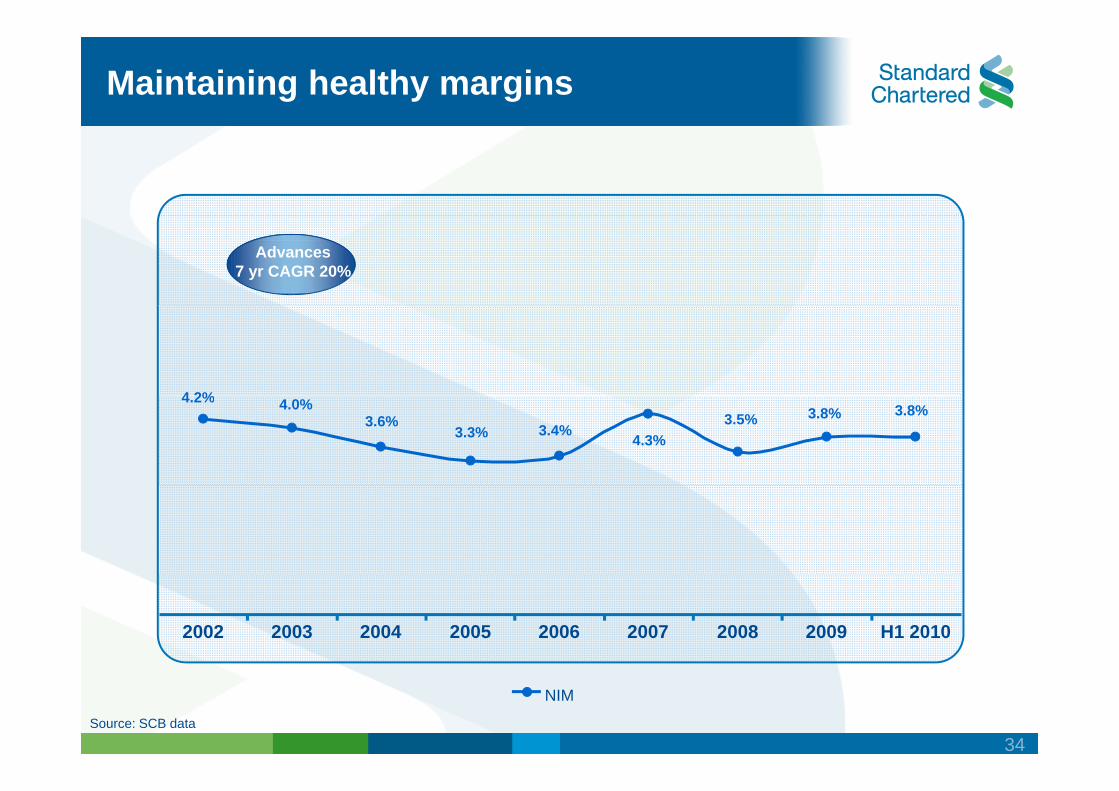
Maintaining healthy margins
Advances 7 yr CAGR 20%
4 2% 3.5%
4.3%3.4%3.3%
4.0%4.2% 3.6% 3.8% 3.8%
2002 2003 2004 2005 2006 2007 2008 2009 H1 2010
Source: SCB data
NIM
34
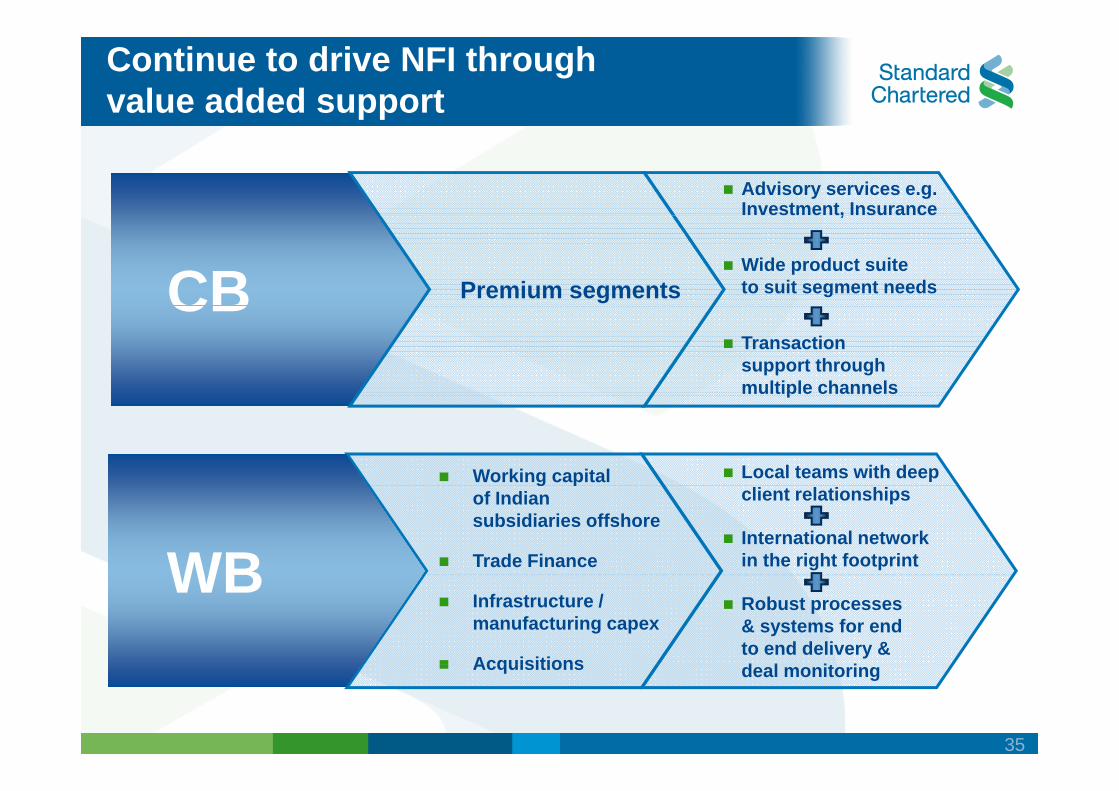
Continue to drive NFI through value added support
Advisory services e.g. Investment, Insurance
CB Premium segments
,
Wide product suite to suit segment needs CB Transaction support through multiple channelsp
Working capital Local teams with deep g p of Indian subsidiaries offshore
Trade Finance
client relationships
International network in the right footprintWB
Infrastructure / manufacturing capex
Acquisitions
Robust processes & systems for end to end delivery & d l i i
WB Acquisitions deal monitoring
35

Strong growth in income and return
WB income growth and return on RWA(H1 08 - H1 10)
Change inreturn on RWA WB income growth (CAGR %)
1.7x24%Transaction Banking (Trade)
2 3x 20%Financial
g ( )
2.3x20%Markets
1.2x39%Corporate Finance
Source: SCB data
36
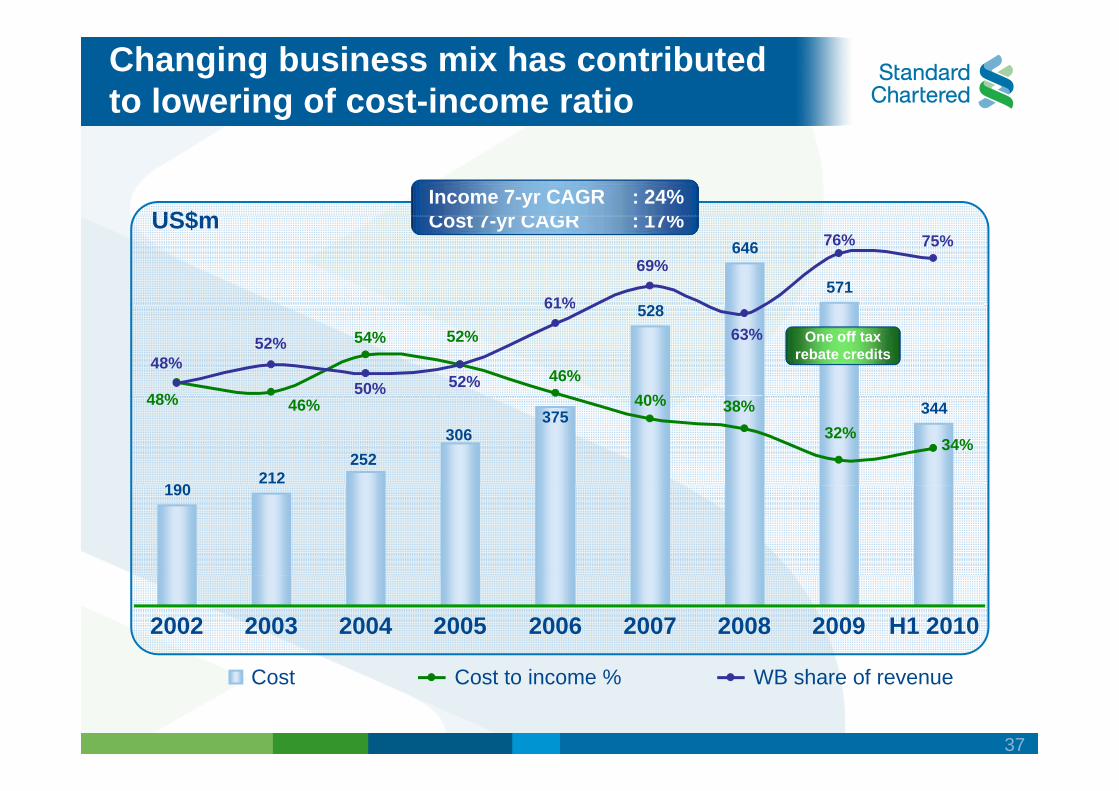
C t 7 CAGR 17%
Changing business mix has contributed to lowering of cost-income ratio
US$m Income 7-yr CAGR : 24%
US$m Cost 7-yr CAGR : 17%
528
646
571 61%
69% 76% 75%
528
40% 46%
52%
48%
54% 48%
52%
50% 52%
61%
63% One off tax rebate credits
190 212
344375
252 306
38%40%46%48%
32% 34%
190
2002 2003 2004 2005 2006 2007 2008 2009 H1 2010
Cost Cost to income % WB share of revenue
37
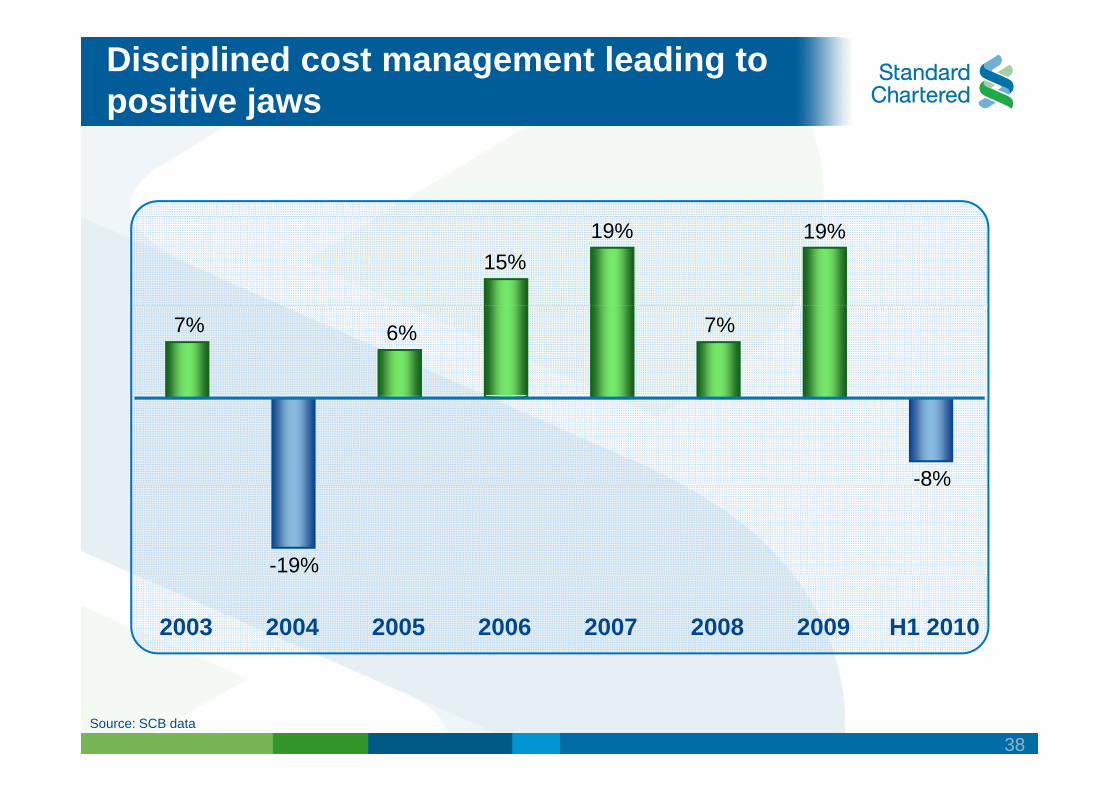
Disciplined cost management leading to positive jaws
15% 19%19%
7% 6% 7%
-8%
-19%
8%
2003 2004 2005 2006 2007 2008 2009 H1 2010
Source: SCB data
38
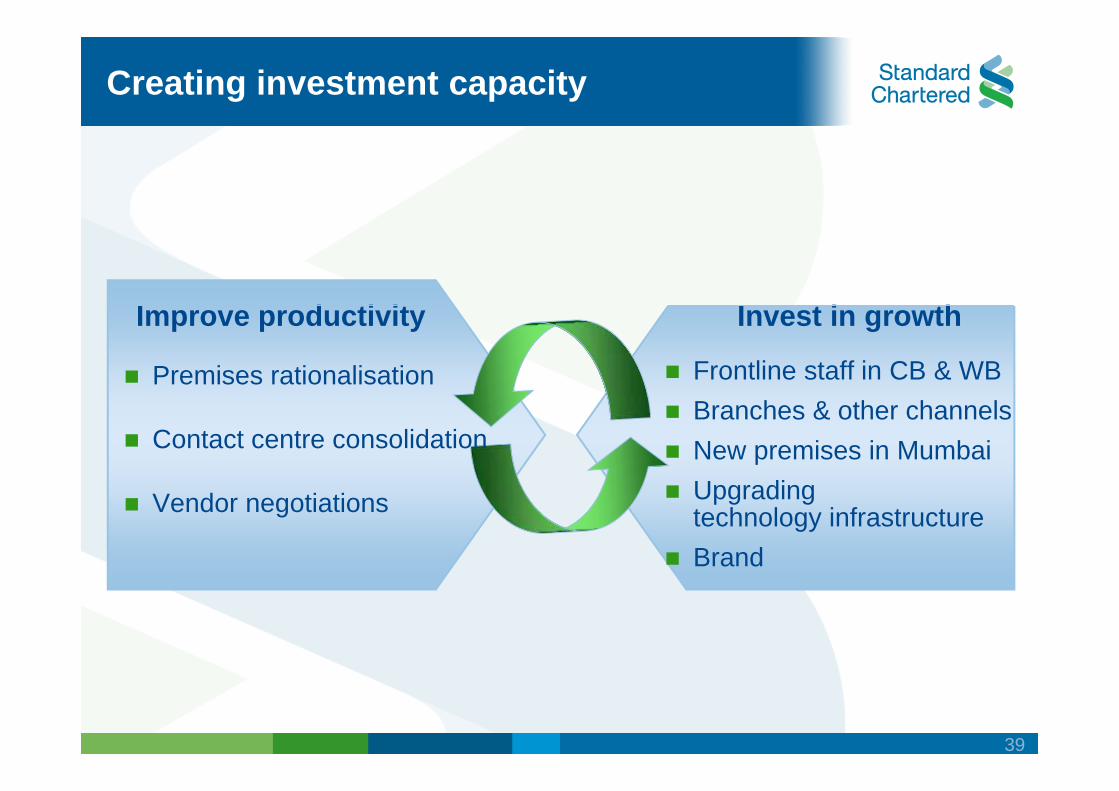
Creating investment capacity
I d i i I i h
Premises rationalisation Frontline staff in CB & WB
Improve productivity Invest in growth
Contact centre consolidation Branches & other channels New premises in Mumbai Upgrading Vendor negotiations Upgrading technology infrastructure Brand
39
Credit environment is improving
Outlook for credit quality in 2010-11 is positivequa y pos
Earnings growth momentum for corporates is robust, outbound M&A activity expected to increase
Credit bureau reports indicate stabilisation of market Credit bureau reports indicate stabilisation of market performance with personal loans, credit cards & mortgages delinquencies showing improvement org g q g p stabilisation since March 2010
Potential global credit events related to sovereign debt, inflation and exchange rate volatility can impact credit qualityvolatility can impact credit quality
40
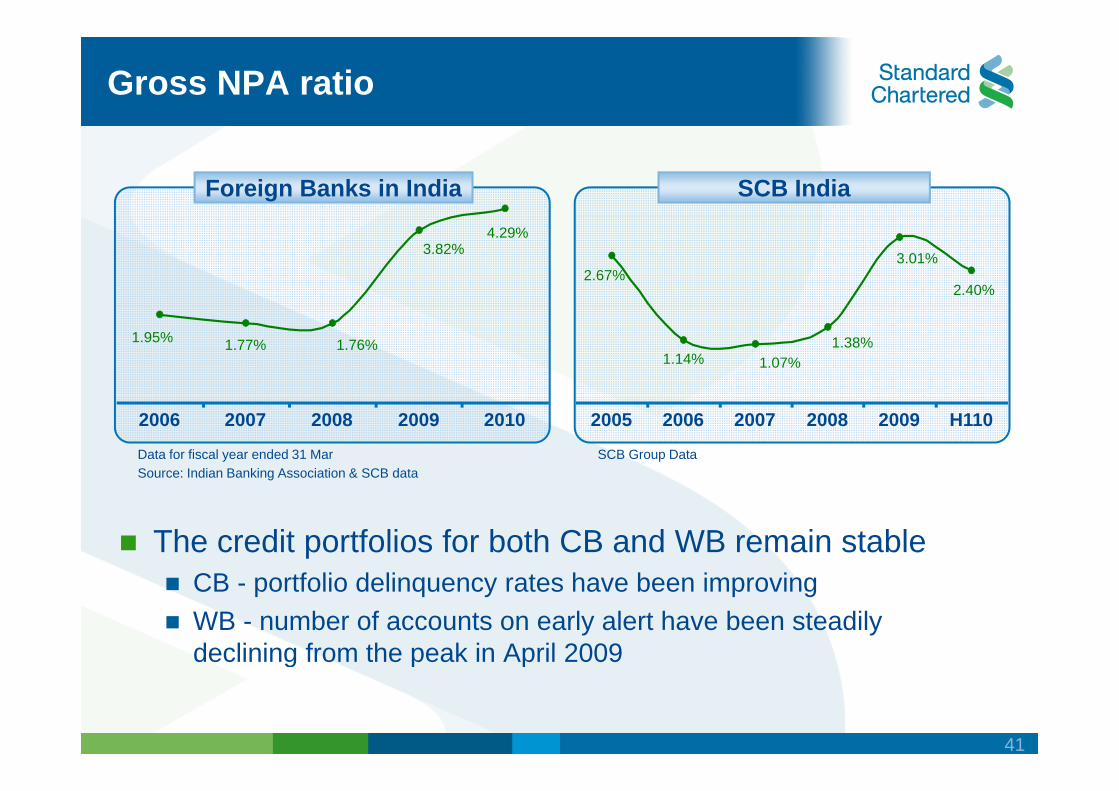
Gross NPA ratio
Foreign Banks in India SCB India 4.29%
3.82%
2.40%
3.01% 2.67%
1.77%1.95% 1.76% 1.14% 1.07%
1.38%
2006 2007 2008 2009 2010 2005 2006 2007 2008 2009 H110
Data for fiscal year ended 31 Mar SCB Group Data Source: Indian Banking Association & SCB data
The credit portfolios for both CB and WB remain stable CB tf li d li t h b i iCB - portfolio delinquency rates have been improving WB - number of accounts on early alert have been steadily declining from the peak in April 2009g p p
41
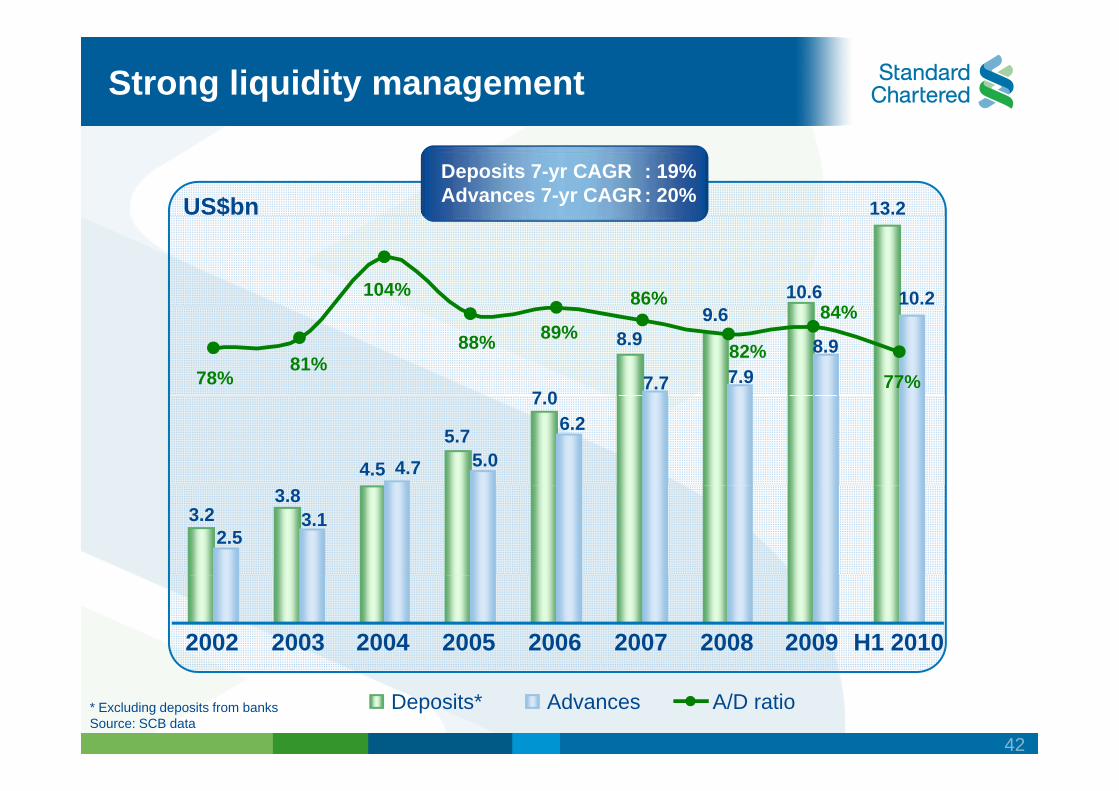
Strong liquidity management
US$bn Deposits 7-yr CAGR : 19% Advances 7-yr CAGR : 20% 13.2
10.6 10.2104% 86% 84%
7 0
8.9 9.6
7.9 8.9
7.7 77%
88%
78% 81%
89% 82%
84%
4.5
5.7
7.0 6.2
4.7 5.0
3.2 3.8
3.1 2.5
2002 2003 2004 2005 2006 2007 2008 2009 H1 2010
* Excluding deposits from banks Source: SCB data
Deposits* Advances A/D ratio
42
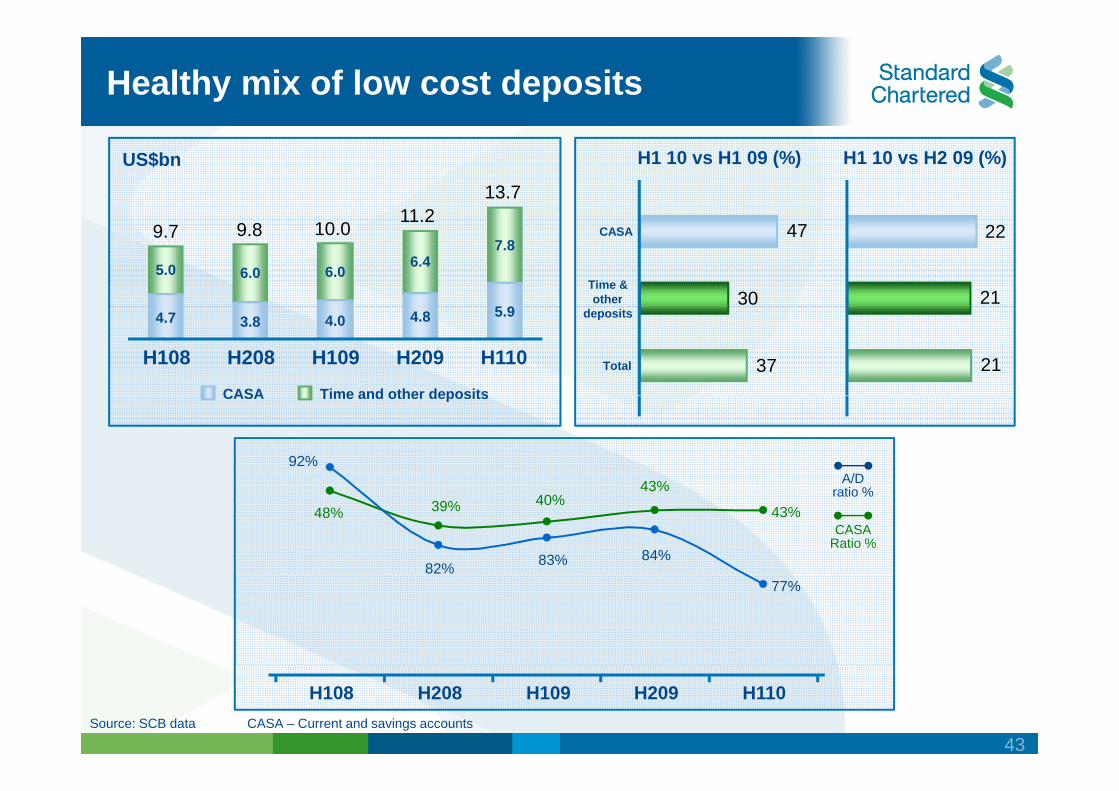
Healthy mix of low cost deposits
H1 10 vs H1 09 (%) H1 10 vs H2 09 (%) US$bn
11 2 13.7
2130
2247CASA 9.7 9.8 10.0 11.2
Time & other
5.0 6.0 6.0 6.4
7.8
2137Total
deposits 4.7 3.8 4.0 5.94.8
H108 H208 H109 H209 H110
CASA Time and other deposits
A/D43%
92%
CASA Time and other deposits
CASA Ratio %
ratio % 43%
43% 40%39%48%
82% 83% 84%
77%
CASA – Current and savings accounts Source: SCB data
H108 H208 H109 H209 H110
43

Capital and Liquidity - the RBI context
Foreign banks subsidiarisationg Currently foreign bank branches are required to maintain local capital Have to observe Single Borrower and Group Borrower norms of 15% and 40% respectively of capital funds Liquidity governed through limits on call / money market,Liquidity governed through / money market, interbank and overseas borrowing
RBI’ ti d d li ti t ith tiRBI’s conservative and gradualistic stance, with proactive policy responses, ensured stability through the crisis
Some key elements of the Basel III proposals already in place in India
44
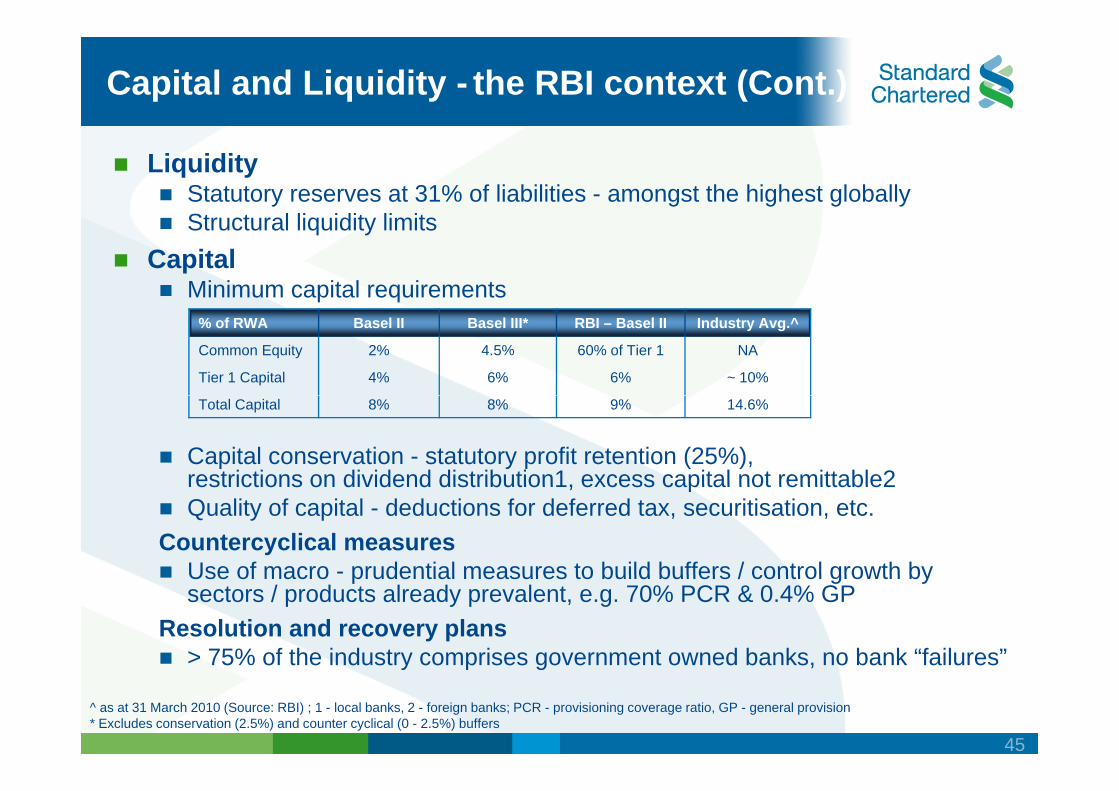
Capital and Liquidity - the RBI context (Cont.)
Liquidity Statutory reserves at 31% of liabilities - amongst the highest globally StStructturall liliquiditidity lilimitits
Capital Minimum capital requirements
% of RWA
Common Equity
Tier 1 Capital
Total Capital
Basel II
2%
4%
8%
Basel III*
4.5%
6%
8%
RBI – Basel II
60% of Tier 1
6%
9%
Industry Avg.^
NA
~ 10%
14.6%
Capital conservation - statutory profit retention (25%), restrictions on dividend distribution1, excess capital not remittable2 restrictions on dividend distribution1, excess capital not remittable2 Quality of capital - deductions for deferred tax, securitisation, etc.
Countercyclical measures Use of macro - prudentialprudential measuresmeasures toto build buffers /build buffers / controlcontrol growth bygrowth byUse of macro sectors / products already prevalent, e.g. 70% PCR & 0.4% GP
Resolution and recovery plans > 75% of the industrythe comprises government owned banks,owned banks, no bank “failuresfailures”75% of industry comprises government no bank
^ as at 31 March 2010 (Source: RBI) ; 1 - local banks, 2 - foreign banks; PCR - provisioning coverage ratio, GP - general provision * Excludes conservation (2.5%) and counter cyclical (0 - 2.5%) buffers
45

Summary
Banking sector is tracking well on the back ofg g robust economic growth
SCB India has performed strongly over the years
Indian corporates have increasing global aspirations which we are well placed to support
We continue to invest in the India franchise
Ongoing focus on risk management, liquidity and costs
46

Q & AQ & A
47

Consumer Banking
IndiaIndia
Vishu Ramachandran Regional Head of Consumer Banking,g g,
South Asia, Middle East & Africa
Leading the way Leading the way in Asia, Africa and the Middle East
Key messages
Focused on markets and segmentsgwhere we can create advantage
Tough but timely decisions have enabled solid,broad-based performance
CB transformation delivering strong results; test bed for innovation within CBtest bed for innovation within CB
Dealing with new realitiesDealing with new realities
Confident of doubling income in three to five yearsConfident of doubling income in three to five years
49
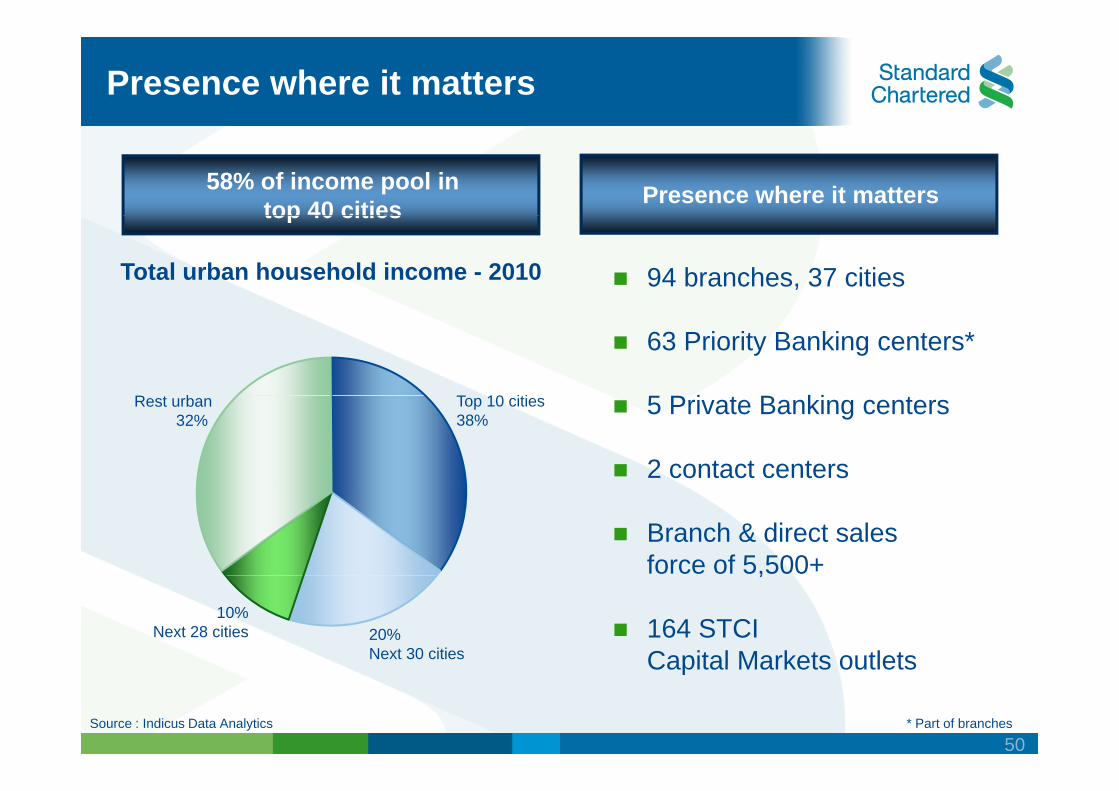
Presence where it matters
58% of income pool in top 40 cities Presence where it matters
94 branches, 37 cities
top 40 cities
Total urban household income - 2010
63 Priority Banking centers*
5 P i B ki T 10 itiR t b 5 Private Banking centers
2 contact centers
Top 10 cities 38%
Rest urban 32%
Branch & direct sales force of 5,500+,
164 STCI Capital Markets outlets
10% Next 28 cities 20%
Next 30 cities Capital Markets outlets
Source : Indicus Data Analytics * Part of branches
50

O ti i hi f t i t
The ‘focused’ participation model
11.2
k(U
S$) 58% of the annual HH income
60% of the annual HH savings
Establish leadership in HVS: Retail Affluent, SME, NRI 1
2k
> 1
d in
com
e
60% of the Retail Affluent HHs
Make mass market profitable2
4.4
-11.
ou
seho
ld
3
< 4.
4kA
nnua
l ho Optimise geographic footprint3
Rest of urban India
Next 30 cities
Top 10 cities
A
Significantly improve expense productivity4
Source : Indicus Data Analytics
51
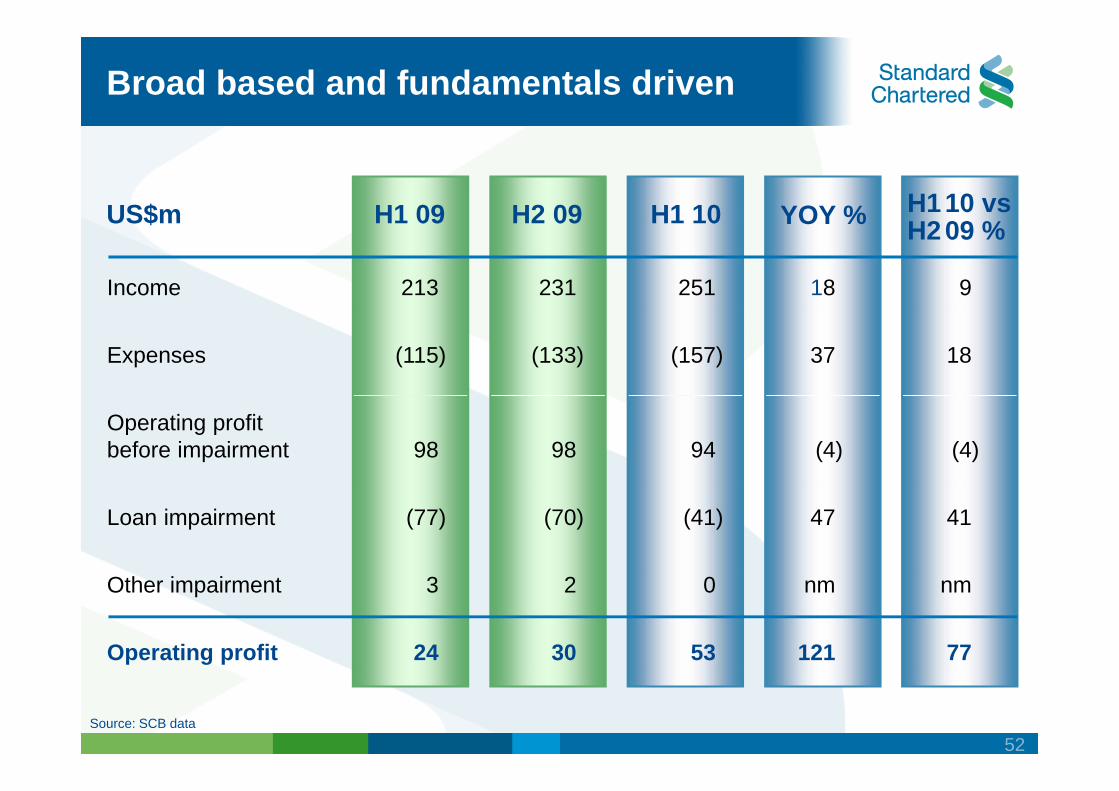
Broad based and fundamentals driven
US$m H2 09 H1 10H1 09 YOY % H1 10 vs
Income 231
US$m H2 09 H1 10
213
H1 09
18
YOY %
251
H2 09 %
9
Expenses (133)(115) 37(157) 18
Operating profit before impairment 9898 (4)94 (4)
Loan impairment (70)(77) 47(41) 41
Other impairment
Operating profit
2
30
3
24
nm
121
0
53
nm
77
Source: SCB data
52
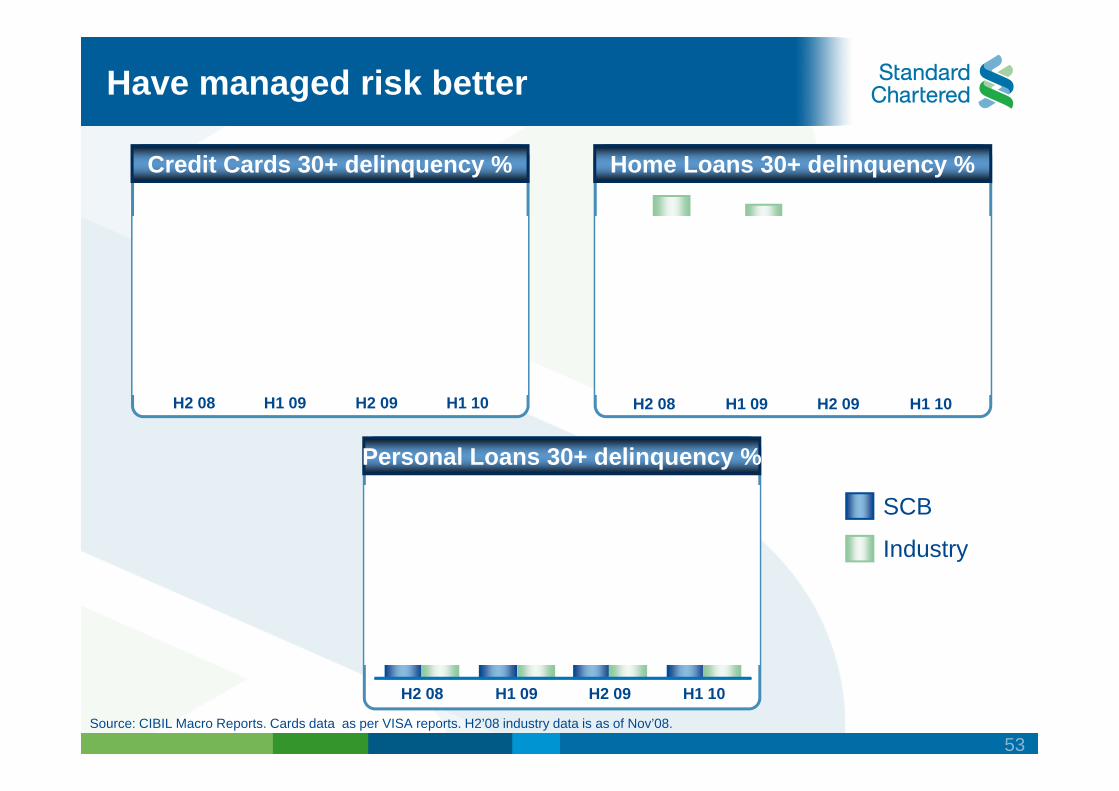
Have managed risk better
Home Loans 30+ delinquency %Credit Cards 30+ delinquency %
H2 08 H1 09 H2 09 H1 10 H2 08 H1 09 H2 09 H1 10
Personal Loans 30+ delinquency %
SCB
Industry
Source: CIBIL Macro Reports. Cards data as per VISA reports. H2’08 industry data is as of Nov’08.
H2 08 H1 09 H2 09 H1 10
53
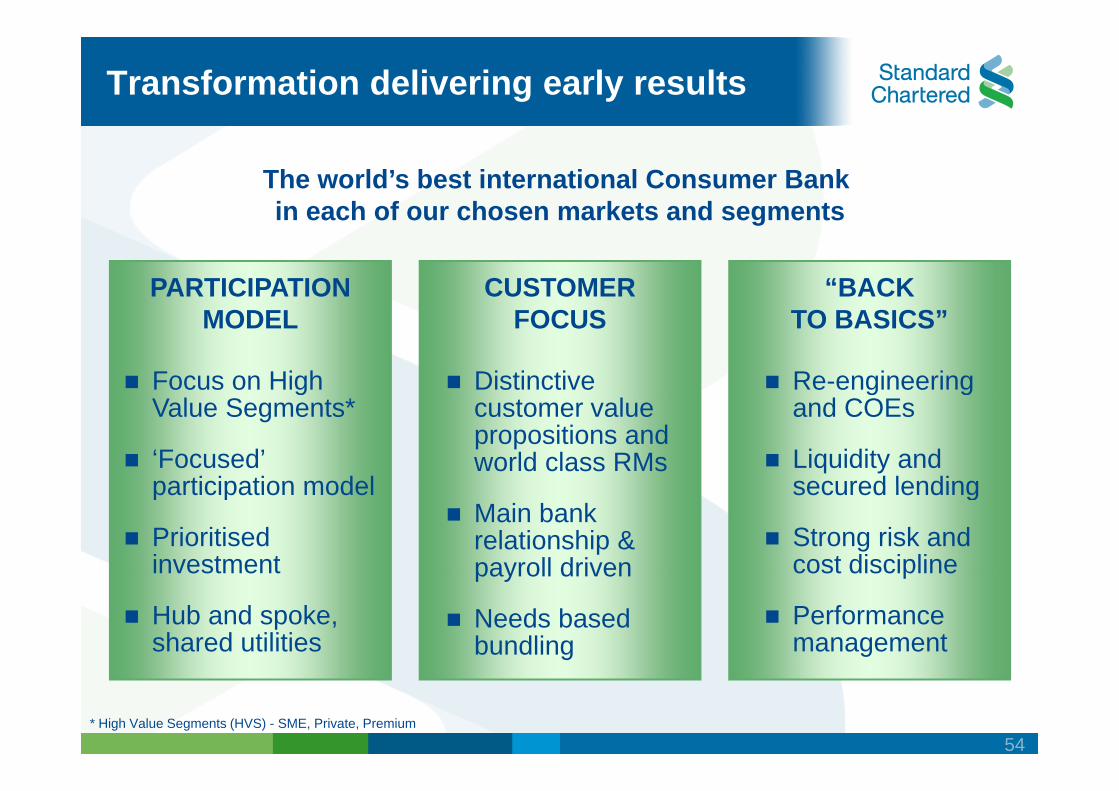
Transformation delivering early results
The world’s best international Consumer Bank in each of our chosen markets and segmentsin each of our chosen markets and segments
CUSTOMER “BACKPARTICIPATION FOCUS
Distinctive
TO BASICS”
Re-engineering
MODEL
Focus on High customer value propositions andworld class RMs
and COEs
Liquidity andsecured lending
Value Segments*
‘Focused’ participation model
Main bank relationship &payroll driven
secured lending
Strong risk andcost discipline
participation model
Prioritised investment payroll driven
Needs based bundling
p
Performance management
Hub and spoke,shared utilities
* High Value Segments (HVS) - SME, Private, Premium
54
Differentiated proposition for chosen segments
Private Bank SME Banking
Priority Banking Preferred Banking
55
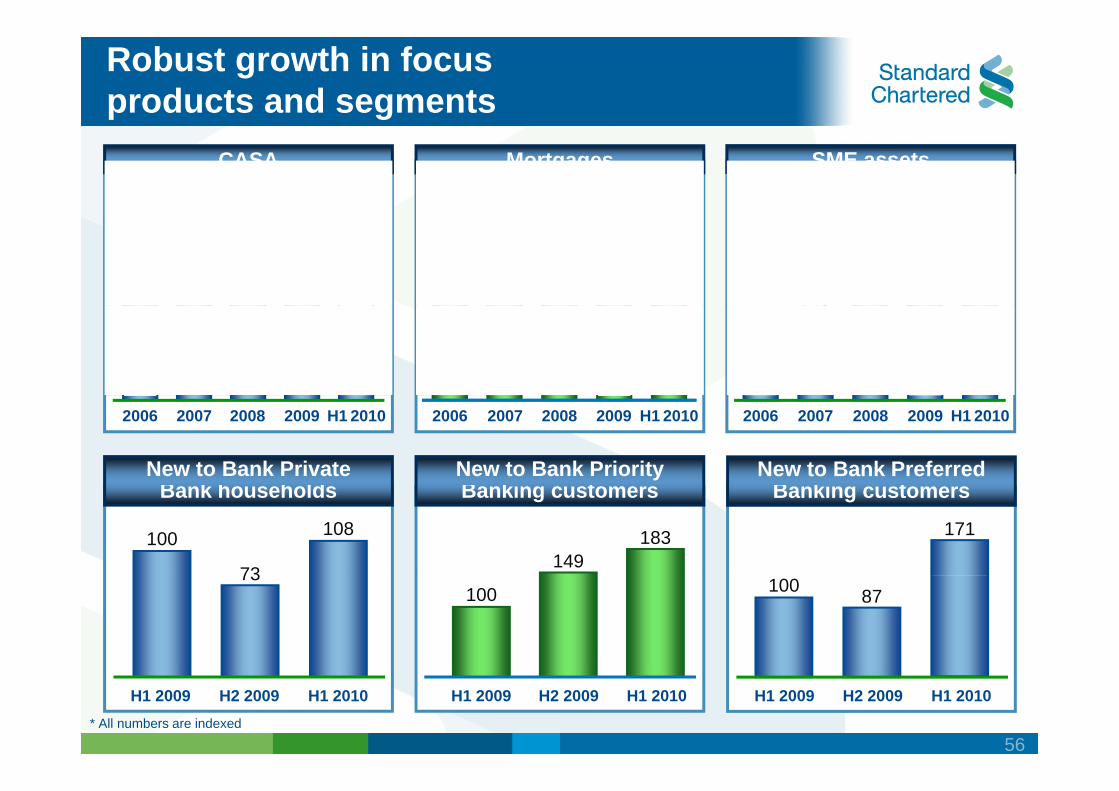
Robust growth in focus products and segments
156 345 157
CASA Mortgages SME assets
100 98 106
136
142
265 306
100 112 113
147 157
100 142
B k h h ld B ki t B ki t
2006 2007 2008 2009 H1 2010 2006 2007 2008 2009 H1 2010 2006 2007 2008 2009 H1 2010
New to Bank Private New to Bank Priority New to Bank Preferred
171
149 183100
73
108
Bank households Banking customers Banking customers
100 87100 73
* All numbers are indexed
H1 2009 H2 2009 H1 2010H1 2009 H2 2009 H1 2010H1 2009 H2 2009 H1 2010
56
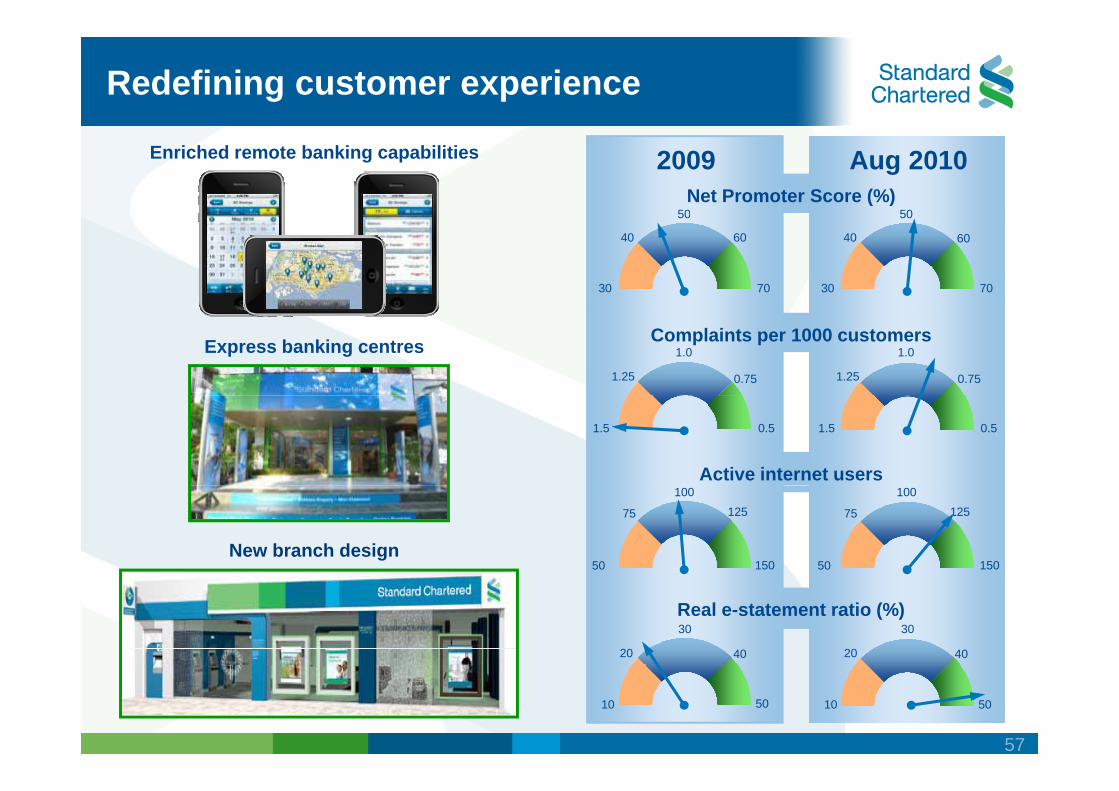
Redefining customer experience
Enriched remote banking capabilities
5050
2009 Aug 2010 Net Promoter Score (%)
30
40 60
70
50
30
40 60
70
50
Express banking centres 1.25 0.75
1.0
1.25 0.75
1.0Complaints per 1000 customers
1.5 0.5 1.5 0.5
Active internet users
New branch design 50
75 125
150
100
50
75 125
150
100
20 40
30
20 40
30 Real e-statement ratio (%)
10 5010 50
57
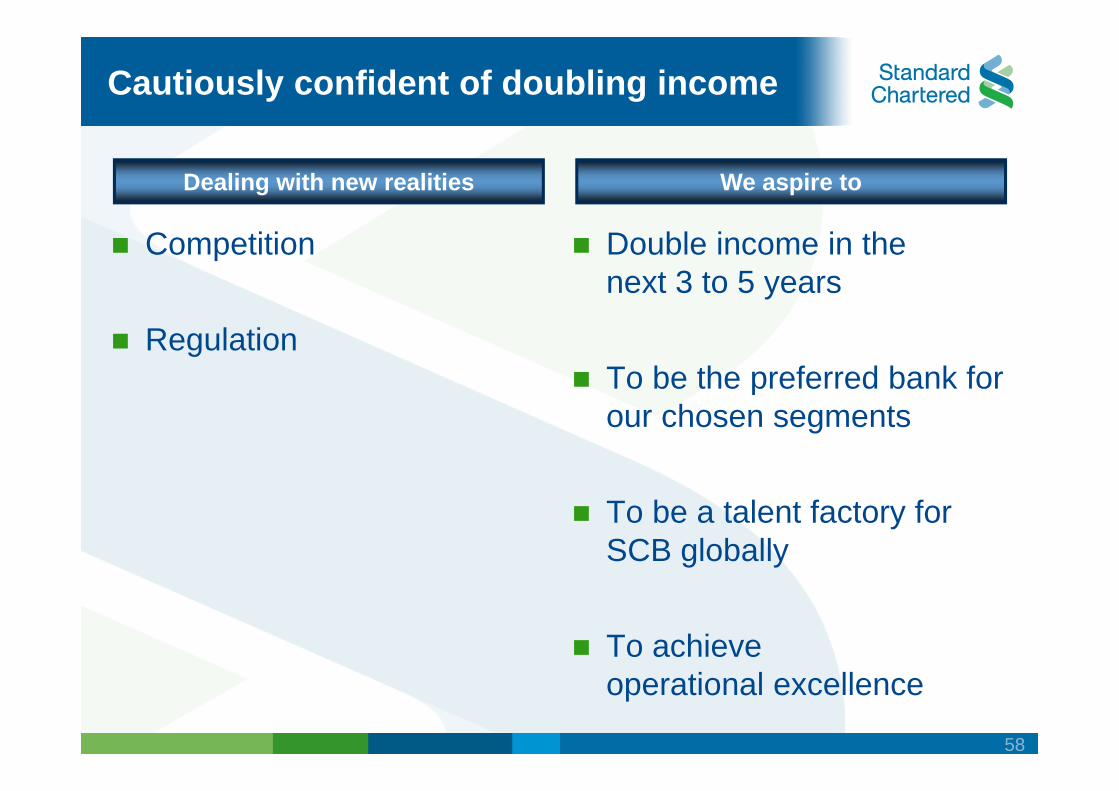
Cautiously confident of doubling income
Dealing with new realities We aspire to
Double income in the next 3 to 5 years
Competition
To be the preferred bank for Regulation
our chosen segments
To be a talent factory for SCB globally
To achieve operational excellence
58
Summary
Right place, right timeg p ace, g
“Focused” strategy yielding strong results
Dealing with new realities g
Cautiously confident
59

Q & AQ & A
60
Wholesale Banking
IndiaIndia
Arup Roy Head, OCC India
Hemant Mishr Head of Global Markets, India & South Asia ,
Leading the way Leading the way in Asia, Africa and the Middle East
Key messages
Consistent strategy well executed
Delivering superior performance
Well positioned to capture growth opportunitiesWell positioned to capture growth opportunities
62
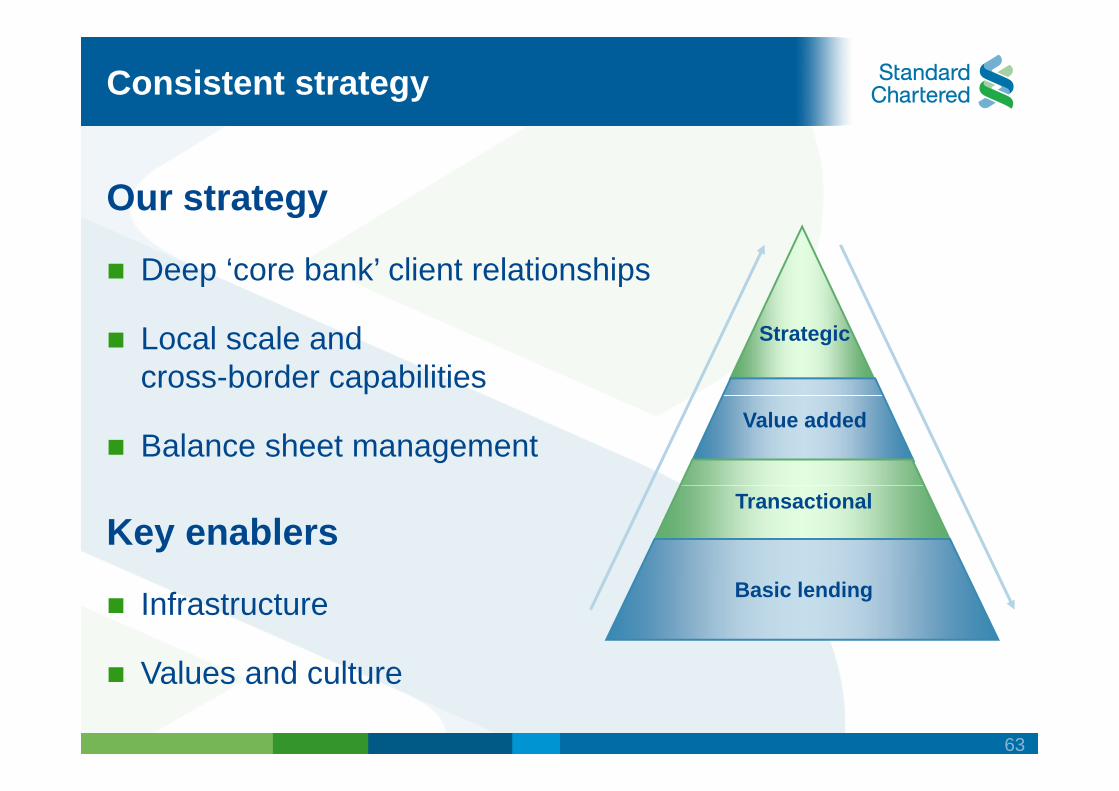
Consistent strategy
Our strategygy
Deep ‘core bank’ client relationships
StrategicLocal scale and cross-border capabilities
Value added Balance sheet management
Transactional Key enablers
Basic lendingInfrastructure
V l d lt Values and culture
63
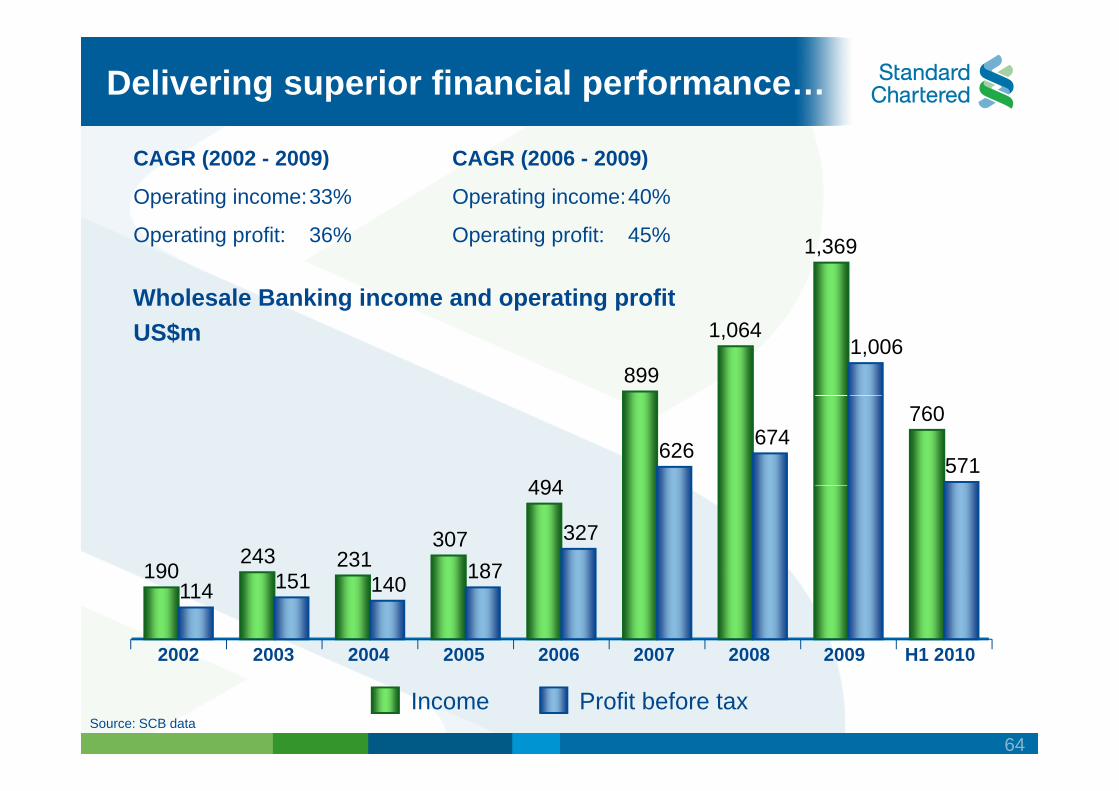
Delivering superior financial performance…
CAGR (2002 - 2009)
Operating income:33%
CAGR (2006 - 2009)
Operating income:40%
Operating profit: 36% Operating profit: 45%
Wholesale Banking income and operating profit
1,369
g ope g p US$m
899
1,064 1,006
494
760
626 674 571
190 243 231
307
494
151 187
327
2002 2003 2004 2005 2006 2007 2008 2009 H1 2010
190 114 151 140 187
Source: SCB data Income Profit before tax
64
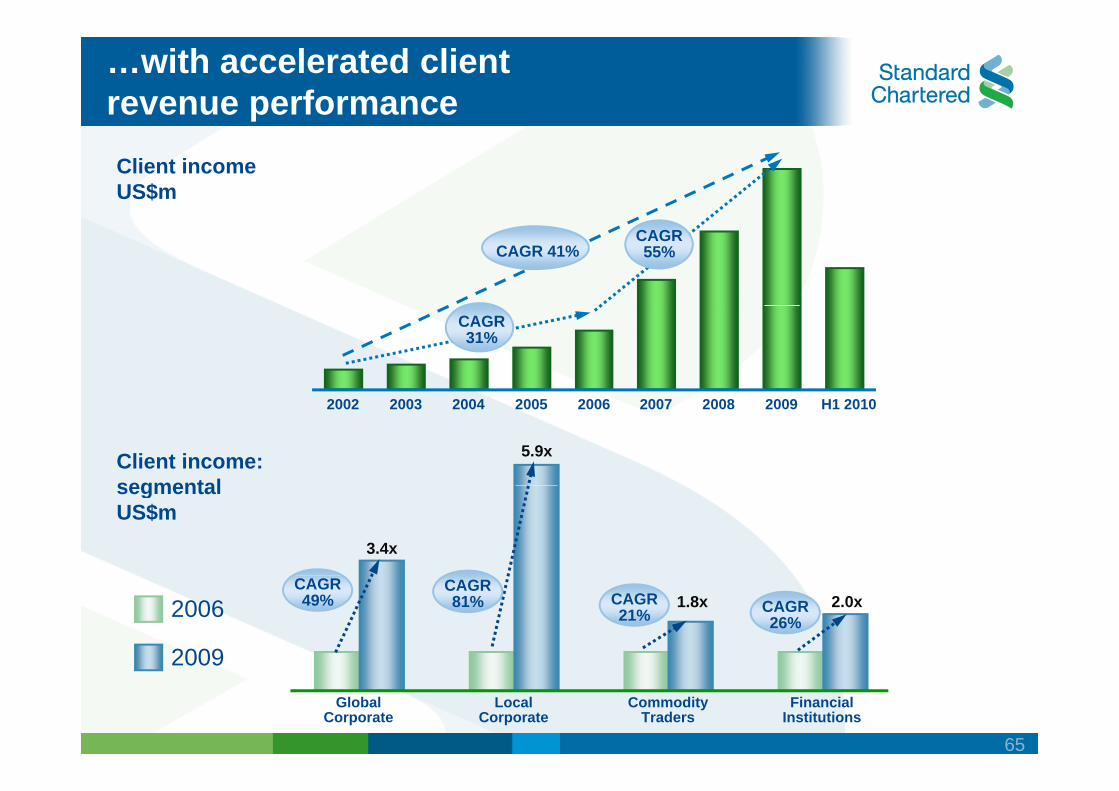
…with accelerated client revenue performance Client income US$m
CAGR 41% CAGR 55%
CAGR 31%
5.9x
2002 2003 2004 2005 2006 2007 2008 2009 H1 2010
Client income: segmental
3.4x
segmental US$m
1.8x 2.0x2006
2009
CAGR 26%
CAGR 21%
CAGR 81%
CAGR 49%
Global Corporate
Local Corporate
CommodityTraders
Financial Institutions
2009
65

Growth across client segments…
Global Corporate Local Corporate
+ 49% CAGR growth + 81% CAGR growth+ 49% CAGR growth
Trade corridors
+ 81% CAGR growth
Infrastructure financing
Investments flows New names & cross Sell
Commodity Traders Financial Institutions
+ 26% CAGR growth
Banks, NBFI, Insurance
+ 21% CAGR growth
Specialist industry expertise Banks, NBFI, Insurance Companies, Mutual Funds
FX C h & T d Fl
Specialist industry expertise
Collateral management FX, Cash & Trade Flows
CAGR is for 2006 vs. 2009
66
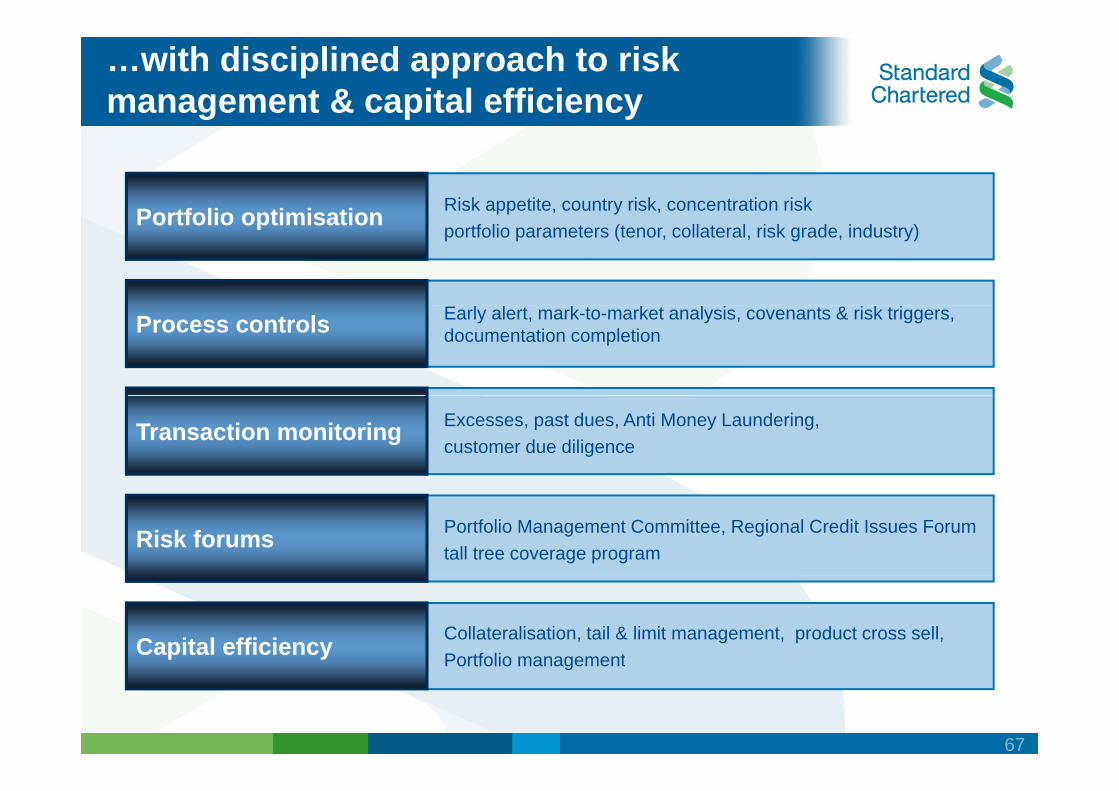
…with disciplined approach to risk management & capital efficiency
Portfolio optimisation Risk appetite, country risk, concentration risk Portfolio optimisation portfolio parameters (tenor, collateral, risk grade, industry)
Process controls Early alert, mark-to-market analysis, covenants & risk triggers, documentation completion
Transaction monitoring Excesses, past dues, Anti Money Laundering, customer due diligence
Risk forums Portfolio Management Committee, Regional Credit Issues Forum tall tree coverage program
Capital efficiency Collateralisation, tail & limit management, product cross sell, Portfolio managementPortfolio management
67
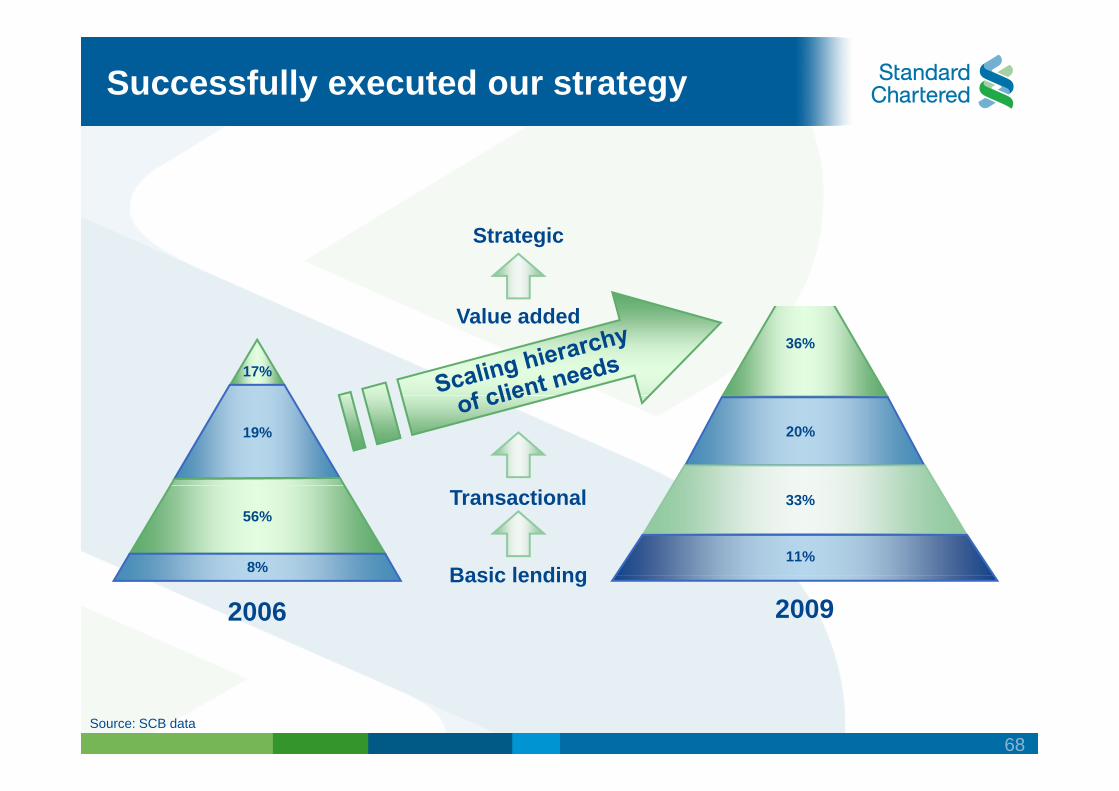
Successfully executed our strategy
Strategic
36% Value added
17%
20%19%
11%
33%Transactional
Basic lending 8%
56%
Basic lending 20092006
Source: SCB data
68
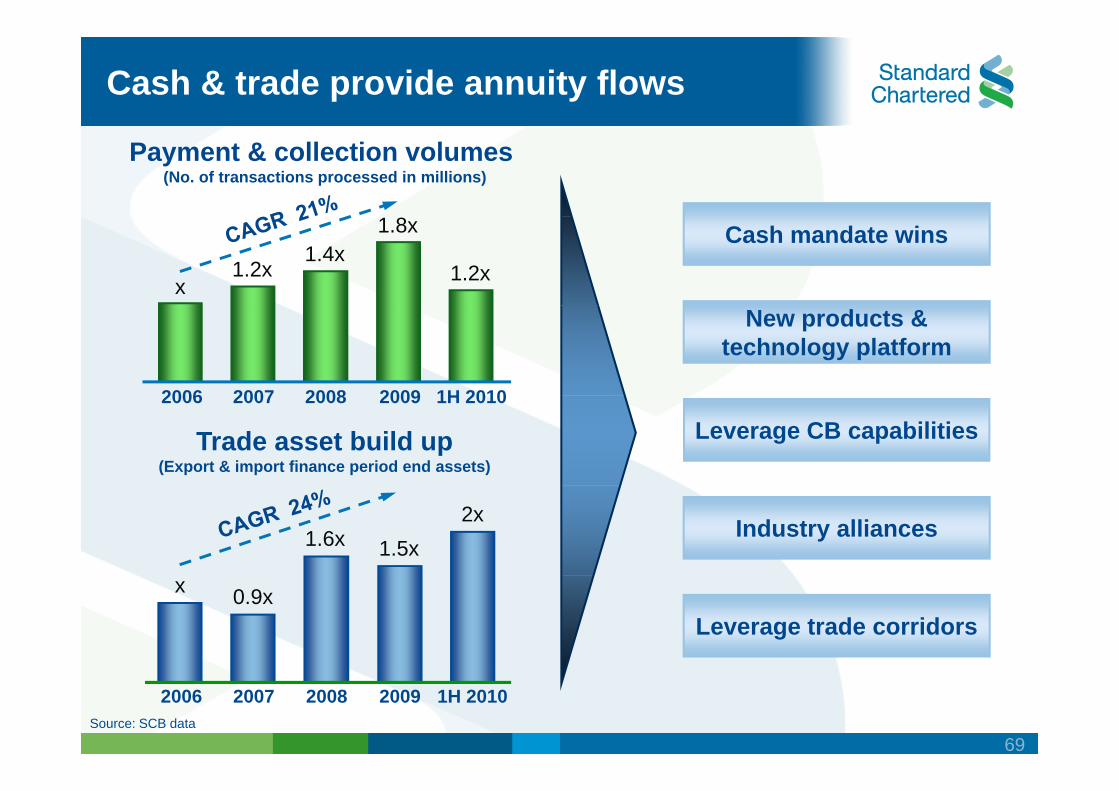
Cash & trade provide annuity flows
Payment & collection volumes (No. of transactions processed in millions)
Cash mandate wins 1.2x x
1.2x 1.4x
1.8x
New products & technology platform
2007 2008 20092006 1H 2010
Leverage CB capabilities Trade asset build up(Export & import finance period end assets)
2007 2008 20092006 1H 2010
Industry alliances2x 1.6x 1.5x
Leverage trade corridors
x 0.9x
2007 2008 2009 1H 20102006
69 Source: SCB data
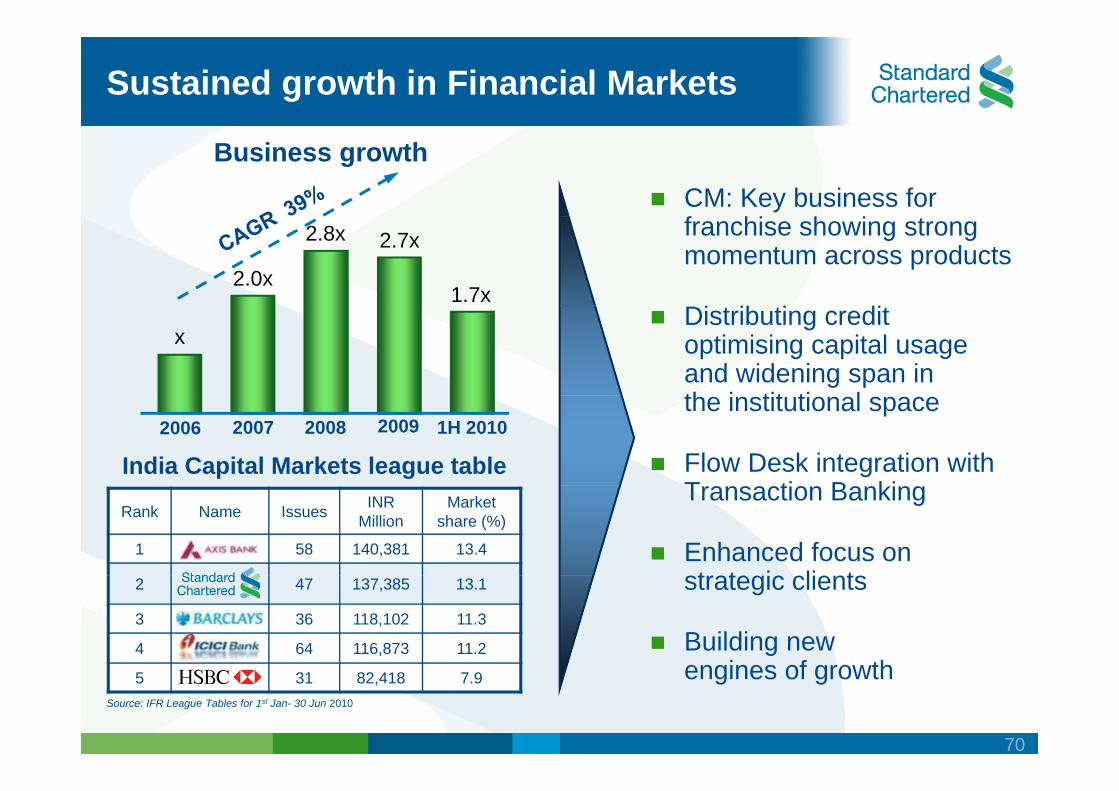
Sustained growth in Financial Markets
Business growth CM: Key business for franchise showing strong momentum across products
Di ib i di 2.0x
2.8x 2.7x
1.7x Distributing credit optimising capital usageand widening span inth i tit ti l
x
India Capital Markets league table
the institutional space
Flow Desk integration withT ti B ki
2007 2008 2009 1H 20102006
Rank Name Issues INR Million
Market share (%)
1 58 140,381 13.4
Transaction Banking
Enhanced focus on t t i li t2 47 137,385 13.1
3 36 118,102 11.3
4 64 116,873 11.2
strategic clients
Building newi f th 5 31 82,418 7.9
Source: IFR League Tables for 1st Jan- 30 Jun 2010
engines of growth
70
mm
x
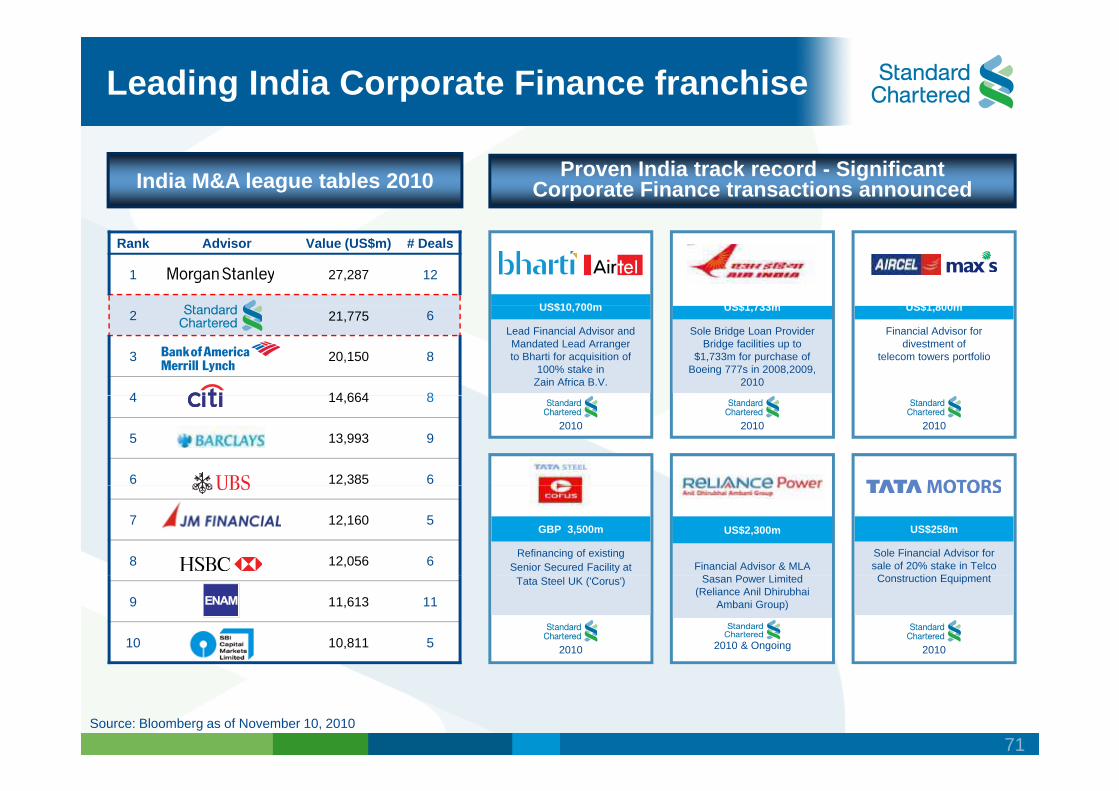
Leading India Corporate Finance franchise
Proven India track record - SignificantCorporate Finance transactions announced India M&A league tables 2010
US$10 700m US$1 800 US$1 733
Rank Advisor Value (US$m) # Deals
1 27,287 12
2 21,775 6 Sole Bridge Loan Provider
Bridge facilities up to $1,733m for purchase of
Boeing 777s in 2008,2009, 2010
US$1,733m
2010
US$1,800m
Financial Advisor for divestment of
telecom towers portfolio3 20,150 8
4 14 664 84 14,664 8
5 13,993 9
6 12,385 6,
7 12,160 5
8 12,056 6
9 11,613 11
10 10,811 5
2010
Lead Financial Advisor and Mandated Lead Arranger to Bharti for acquisition of
100% stake in Zain Africa B.V.
US$10,700m
2010
Sole Financial Advisor for sale of 20% stake in Telco C i E i
US$258m
Refinancing of existing Senior Secured Facility at
GBP 3,500m
Financial Advisor & MLA S P Li i d
US$2,300m
Construction Equipment
2010
Tata Steel UK ('Corus')
2010
Sasan Power Limited (Reliance Anil Dhirubhai
Ambani Group)
2010 & Ongoing
Source: Bloomberg as of November 10, 2010
71
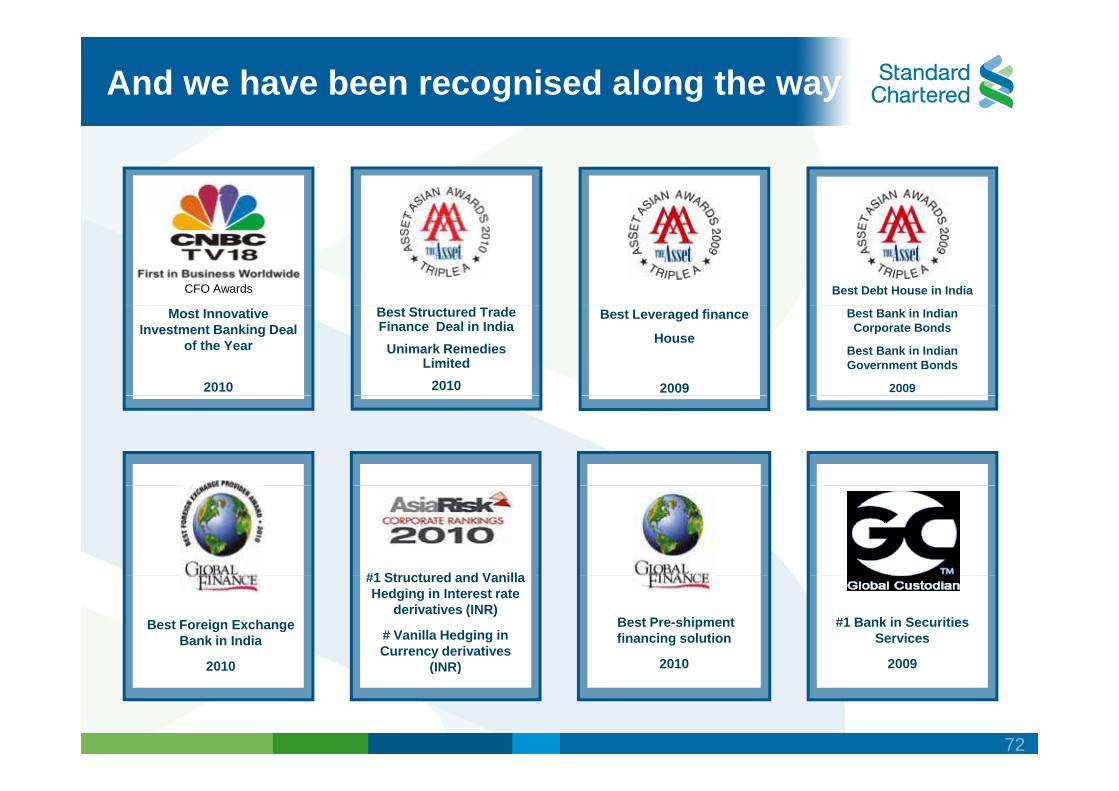
And we have been recognised along the way
CFO Awards Best Debt House in India
Most Innovative Investment Banking Deal
of the Year
2010
Best Structured Trade Finance Deal in India
Unimark Remedies Limited
2010
Best Bank in Indian Corporate Bonds
Best Bank in Indian Government Bonds
2009
Best Leveraged finance
House
2009
#1 Str ct red and Vanilla
Best Foreign Exchange Bank in India
2010
#1 Structured and Vanilla Hedging in Interest rate
derivatives (INR)
# Vanilla Hedging in Currency derivatives
(INR)
#1 Bank in Securities Services
2009
Best Pre-shipment financing solution
2010 2010 (INR) 2009 2010
72
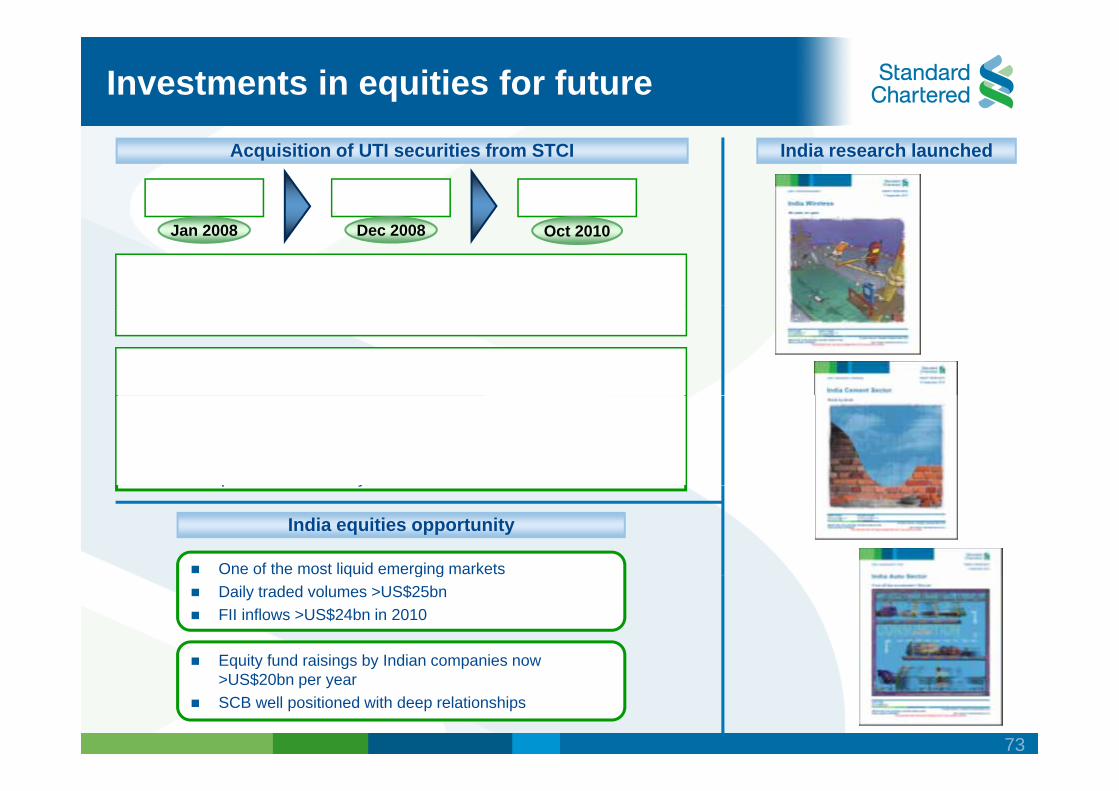
Investments in equities for future
49% 74.9% 100% Acquisition of UTI securities from STCI India research launched
Jan 2008 Dec 2008 Oct 2010
34 branches, 130 franchisees, 3000+ sub brokers Brokerage services to retail and institutional clients. ECM capabilities
Leverage SCB / Cazenove client base to market India products Sales & trading
Leverage SCB client base and network
Equity issuance Research
India-dedicated sales already present in Mumbai, Singapore, London Tier-1 equities house in 3-5 yearsq y
One of the most liquid emerging markets
India equities opportunity
q g g Daily traded volumes >US$25bn FII inflows >US$24bn in 2010
Equity fund raisings by Indian companies nowEquity fund raisings by Indian companies now >US$20bn per year SCB well positioned with deep relationships
73
Key challenges
Increased competition from private sector and foreign banks
Margin compression in transactional & flow business
Changing regulatory landscape
74
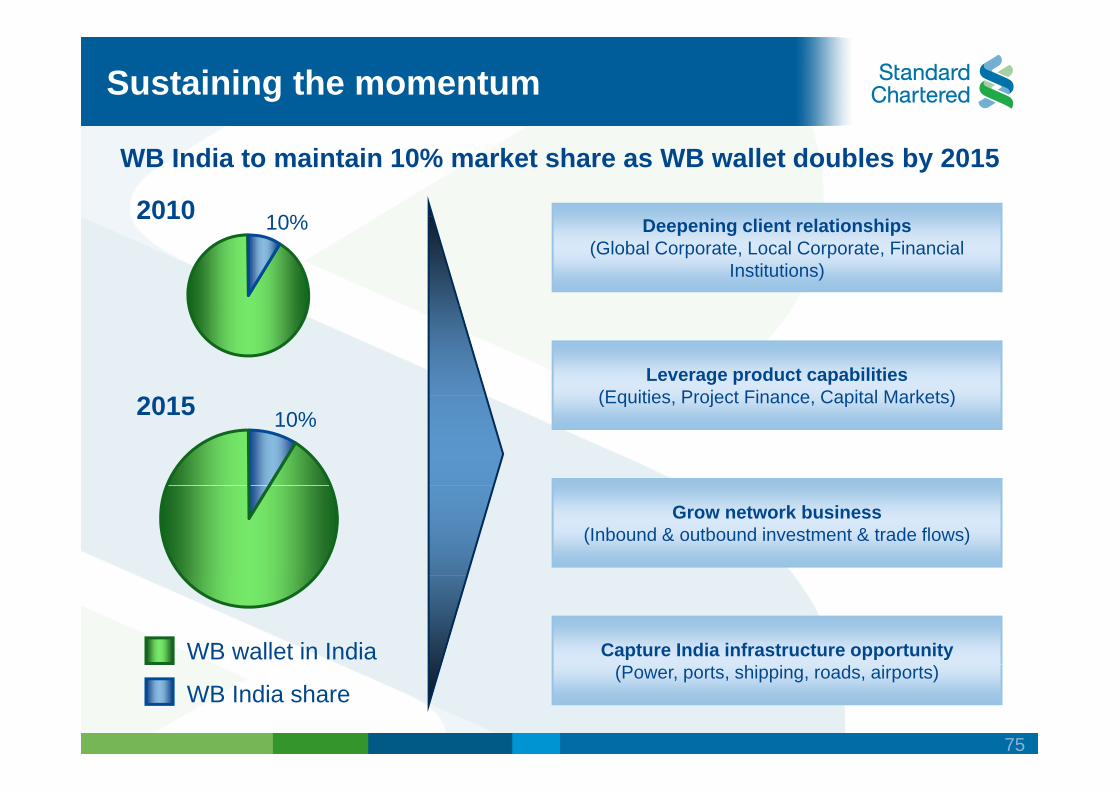
Sustaining the momentum
2010
WB India to maintain 10% market share as WB wallet doubles by 2015
10% 2010 Deepening client relationships
(Global Corporate, Local Corporate, Financial Institutions)
10%
Leverage product capabilities (Equities Project Finance Capital Markets) 2015 (Equities, Project Finance, Capital Markets)
10%
Grow network business (Inbound & outbound investment & trade flows)
WB wallet in India Capture India infrastructure opportunity
WB India share (Power, ports, shipping, roads, airports)
75

Summary
Clear and consistent strategy
S i bl h d &Sustainable growth across products & segments with deepening client relationships
Well positioned to capture growth potential
76

Q & AQ & A
77
Related Documents