1 2010 Connecticut Deer Program Summary Bureau of Natural Resources / Wildlife Division Department of Energy and Environmental Protection 79 Elm Street, Hartford, CT 06106-5127 860-424-3011 www.ct.gov/deep Department of Energy and Environmental Protection Daniel C. Esty, Commissioner Susan Frechette, Deputy Commissioner Bureau of Natural Resources William Hyatt, Bureau Chief Wildlife Division Rick Jacobson, Director Prepared by Andrew M. LaBonte, Deer Program Biologist Howard J. Kilpatrick, Deer/Turkey Program Biologist Winnie Reid, Administrative Professional Photo by Paul J. Fusco The Department of Energy and Environmental Protection (DEEP) is an affirmative action/equal opportunity employer and service provider. In conformance with the Americans with Disabilities Act, the DEEP makes every effort to provide equally effective services for persons with disabilities. Individuals with disabilities who need this information in an alternative format, to allow them to benefit and/or participate in the agency’s programs and services, should call 860-424-3035 or E-mail the ADA Coordinator, at [email protected] . Persons who are hearing impaired should call the State of Connecticut relay number 711. This publication is 75 percent funded by Federal Aid in Wildlife Restoration, the Pittman-Robertson (P-R) Program, which provides funding through an excise tax on the sale of sporting firearms, ammunition and archery equipment. The Connecticut DEEP Wildlife Division matches the remaining 25 percent of the funding.

Welcome message from author
This document is posted to help you gain knowledge. Please leave a comment to let me know what you think about it! Share it to your friends and learn new things together.
Transcript
1
2010 Connecticut Deer Program Summary
Bureau of Natural Resources / Wildlife Division Department of Energy and Environmental Protection
79 Elm Street, Hartford, CT 06106-5127 860-424-3011 www.ct.gov/deep
Department of Energy and Environmental Protection
Daniel C. Esty, Commissioner Susan Frechette, Deputy Commissioner
Bureau of Natural Resources William Hyatt, Bureau Chief
Wildlife Division Rick Jacobson, Director
Prepared by
Andrew M. LaBonte, Deer Program Biologist Howard J. Kilpatrick, Deer/Turkey Program Biologist
Winnie Reid, Administrative Professional
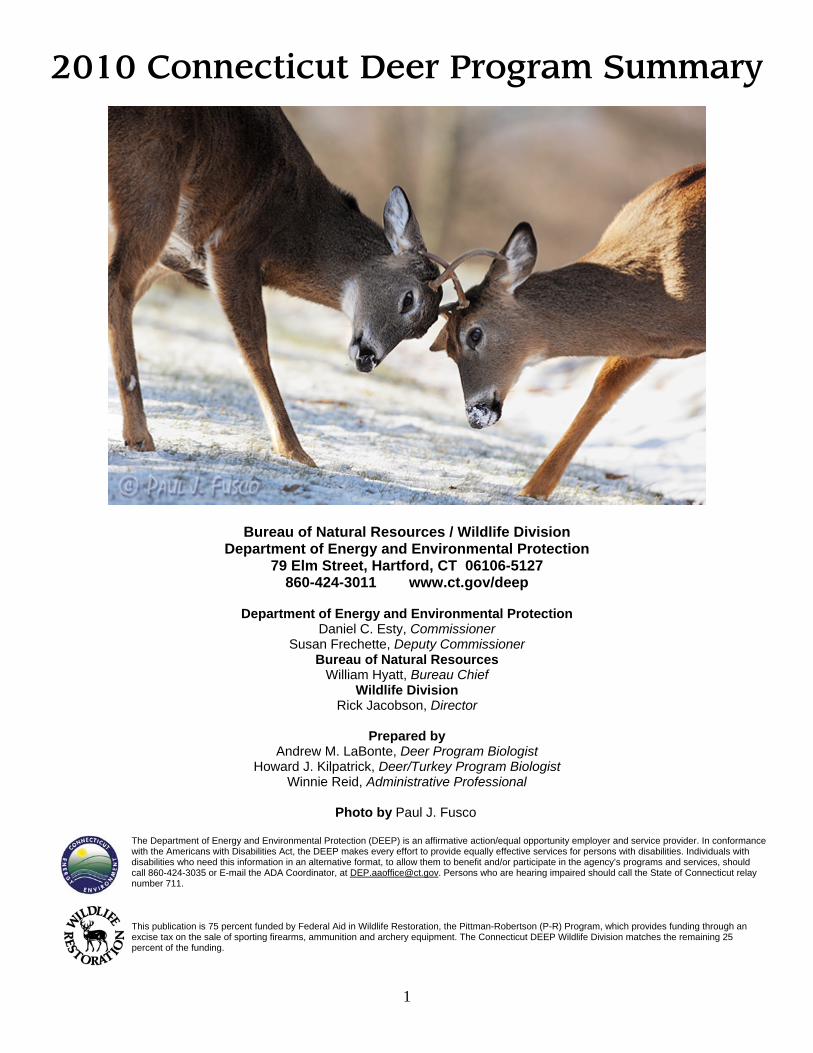
Photo by Paul J. Fusco
The Department of Energy and Environmental Protection (DEEP) is an affirmative action/equal opportunity employer and service provider. In conformance with the Americans with Disabilities Act, the DEEP makes every effort to provide equally effective services for persons with disabilities. Individuals with disabilities who need this information in an alternative format, to allow them to benefit and/or participate in the agency’s programs and services, should call 860-424-3035 or E-mail the ADA Coordinator, at [email protected]. Persons who are hearing impaired should call the State of Connecticut relay number 711. This publication is 75 percent funded by Federal Aid in Wildlife Restoration, the Pittman-Robertson (P-R) Program, which provides funding through an excise tax on the sale of sporting firearms, ammunition and archery equipment. The Connecticut DEEP Wildlife Division matches the remaining 25 percent of the funding.
2
Table of Contents Introduction .................................................................................................................................................................... 4
Hunter Notes .................................................................................................................................................................. 4
Regulated Deer Harvest ................................................................................................................................................. 5
Permit Allocation ........................................................................................................................................................... 6
Hunter Success ............................................................................................................................................................... 7
Archery Statistics ........................................................................................................................................................... 8
Connecticut Deer Management Zones ........................................................................................................................... 8
Insight into Deer Hunter Success Rates by Zone ......................................................................................................... 11
Fall Acorn Crop ........................................................................................................................................................... 13
Private Land Deer Harvest ........................................................................................................................................... 14
Herd Health .................................................................................................................................................................. 14
Deer Weights ............................................................................................................................................................... 14
Antler Points ................................................................................................................................................................ 16
Deer Harvest Sex Ratios .............................................................................................................................................. 17
Replacement Tags ........................................................................................................................................................ 17
January Hunter Survey ................................................................................................................................................. 19
Deer Hunter Expenditures, Effort, and Venison Calculations .................................................................................... 19
2010 Subscription Rates for State Land Lottery Permits ............................................................................................. 19
Moose Sightings .......................................................................................................................................................... 19
Controlled Deer Hunts ................................................................................................................................................. 21
Crop Damage Permits .................................................................................................................................................. 22
Non-hunting Deer Mortality ........................................................................................................................................ 22
Disease Testing of White-tailed Deer .......................................................................................................................... 23
Conclusion ................................................................................................................................................................... 23
Appendix 1 ................................................................................................................................................................... 24
Appendix 2 ................................................................................................................................................................... 28
Appendix 3 ................................................................................................................................................................... 28
Appendix 4 ................................................................................................................................................................... 29
Appendix 5 ................................................................................................................................................................... 29
Appendix 6 ................................................................................................................................................................... 30
Appendix 7 ................................................................................................................................................................... 30
3
List of Tables
Table 1. Deer harvested during Connecticut's regulated hunting seasons, 2009-2010.
Table 2. Change in reported harvest totals for the archery, muzzleloader, and shotgun/rifle seasons, using the old (2008) and new
(2009-2010) reporting system by zone.
Table 3. Deer hunting permits issued in Connecticut for all regulated hunting seasons, 2008-2010.
Table 4. Deer hunter success rates (%) in Connecticut, 2009-2010.
Table 5. Zonal hunter numbers, harvest, and success rates for private land during the 2010 shotgun/rifle hunting season.
Table 6. Zonal comparisons in private land shotgun/rifle harvest, hunter distributions, and success rates, 2008-2010.
Table 7. Zonal comparisons of archery season success rates, 2010.
Table 8. Private land deer harvest for all seasons (excluding landowner) in each of Connecticut's deer management zones, 2000-
2010.
Table 9. Average antler beam diameter (mm) of yearling males in each of Connecticut's deer management zones, 1999-2010.
Table 10. Average dressed weights (lbs.) of male deer harvested and brought to check stations during the first four days of the
shotgun/rifle hunting season, 2008-2010.
Table 11. Sex ratios and antlered to antlerless ratios of deer harvested in 2010.
Table 12. Sex ratios (male:female) of deer harvested during Connecticut's regulated hunting seasons, 2007-2010.
Table 13. Deer lottery selection results by Deer Lottery Hunting Area (DLHA), 2007-2010.
List of Figures Figure 1. Total deer permit issuance in Connecticut, 1975-2010.
Figure 2. Connecticut's deer management zones, 2010.
Figure 3. Perception of zonal deer population trends (average rank) by Connecticut's deer hunters, 2008-2010.
Figure 4. Trends in Connecticut deer population growth in deer management zones 1-6 from 1995 to 2010.
Figure 5. Trends in Connecticut deer population growth in deer management zones 7-12 from 1995 to 2010.
Figure 6. Private land shotgun/rifle deer harvest in deer management zones 4A and 4B, 1996-2010.
Figure 7. Perception of acorn crops (average rank) by Connecticut's deer hunters, 2007-2010.
Figure 8. Relationship between private land shotgun/rifle hunter success rates and fall acorn productivity, 1993-2010.
Figure 9. Number of antler points on yearling males harvested during the shotgun/rifle deer season, 2010.
Figure 10. Percent of all antlered bucks harvested by point category during the shotgun/rifle deer season, 2007-2010.
Figure 11. Comparisons of trends in roadkills and the antlered and antlerless deer harvests during the archery deer season in deer
management zone 11, 1995-2010.
Figure 12. Sex ratios of harvested deer from deer management zone 11 after implementation of the archery antlerless replacement tag
program, 1994-2010.
Figure 13. Moose sightings reported on deer hunter surveys, 1996-2010.
Figure 14. Crop damage harvest by month, 2010.
4
Introduction This booklet is the 30th in a series since the passage of the White-tailed Deer Management Act of 1974 reporting on the status of the white-tailed deer resource in Connecticut. It summarizes white-tailed deer information for 2010, including changes in deer management regulations and reporting requirements, harvest statistics, research activities, and population dynamics of Connecticut's deer population. Connecticut's Deer Management Program goals are: 1) to maintain the population at levels compatible with available habitat and land uses, and 2) to allow for a sustained yield of deer for use by Connecticut hunters. The program has focused on stabilizing or reducing deer population growth for the best long-term interest of the deer resource, native plant and animal communities, and the public. Regulated deer hunting has proven to be an ecologically sound, socially beneficial, and fiscally responsible method of managing deer populations. Deer Program efforts have focused on increasing harvest of antlerless deer, coordinating controlled hunts for overabundant deer herds, assisting communities and large landowners with deer management issues, and research and management of urban deer populations. Pursuant to the goal of reducing overabundant deer populations, aggressive management strategies have been implemented in areas with high deer densities. Strategies include the issuance of free replacement antlerless tags (1995), changes in state law to allow hunting over bait (2003), extending the archery season to include the month of January (2003), implementation of sharp-shooting programs (2003), development of an earn-a-buck program (2005), increased bag limits in specific deer management zones (2009), and allowing the use of crossbows during January (2010). The replacement antlerless tag program, which was initiated in 1995, allows hunters in deer management zones (DMZs) 11 and 12 to harvest additional antlerless deer, with the goal of increasing the harvest of does. In 2003, hunting over bait was permitted in zones 11 and 12 during all seasons on private land. Use of bait in areas where hunter access to private land is limited will increase hunter opportunity and success. Starting in 2005, hunters could earn a free either-sex tag for harvesting a buck after harvesting 3 antlerless deer during the same season. In 2009, hunters were issued 1 additional antlerless tag in DMZ 7 and 2 additional antlerless tags in DMZs 11 and 12 with their shotgun/rifle and muzzleloader permits. In 2010, hunters were allowed to use crossbows in January. In developed areas where firearms hunting is not feasible, the DEEP encourages the use of bowhunting as a management tool. Communities experiencing deer overpopulation problems may choose to initiate controlled hunts or, under special conditions, may be eligible to implement sharp-shooting programs. In recent years, town governments have been taking a more active role in initiating local deer management programs. In 2004, representatives of 10 towns in Fairfield County formed a Regional Deer Management Working Group called the Fairfield County Municipal Deer Management Alliance (www.deeralliance.com). Currently, 18 of 23 Fairfield County towns have joined the Alliance. The Alliance assists towns in establishing deer committees, shares knowledge and experience about managing urban deer with other towns, provides input on urban deer problems so as to influence wildlife policy decision makers, increases public awareness, and provides input for developing long-term solutions to control deer overabundance in southwestern Connecticut. Residents of the town of Redding developed a Web site (http://besaferedding.org) to facilitate a process whereby willing landowners are matched up with hunters that are committed to removing deer from private land at no cost to the landowner. The mission is to get Redding residents to work together for the purpose of reducing tick-related diseases and deer-vehicle accidents that result from deer overabundance and reducing deer impacts to the forest understory to facilitate the return of native bird and wildlife species. At the request of the town, Redding and the Wildlife Division initiated a special research project in March 2011 to help develop a town-wide management plan. Hunter Notes In 2010, use of revolvers for deer hunting was authorized during the landowner and 3-week shotgun/rifle deer seasons on private land (>10 acres). Private land shotgun/rifle hunters hunting in DMZ 7 were given 1 additional antlerless tag, and hunters hunting in DMZs 11 and 12 were given 2 additional antlerless tags when they purchased their permits to encourage harvesting of female deer. Other programmatic changes include streamlining of the state land deer lottery system. Be sure to check the DEEP Web site at www.ct.gov/deep/hunting for more details. Information on dates and locations of hunter education courses can be obtained by calling the DEEP Wildlife Division’s Franklin office (860-642-7239) or Sessions Woods office (860-675-8130), or on the DEEP Web site. Regulations were enacted in October 2005 prohibiting hunters from transporting into Connecticut any deer or elk carcasses or part thereof from any state where chronic wasting disease (CWD) has been documented unless de-boned. Specific wording of the regulation (www.ct.gov/dep/lib/dep/regulations/26/26-55-4.pdf) and an updated list of states where CWD has been documented can be found on the DEEP Web site at www.ct.gov/deep/hunting. Licenses and permits to fish, hunt, and trap in Connecticut can now be purchased on-line by going to Connecticut's new Online Sportsmen Licensing System (www.ct.gov/deep/sportsmenlicensing).
5
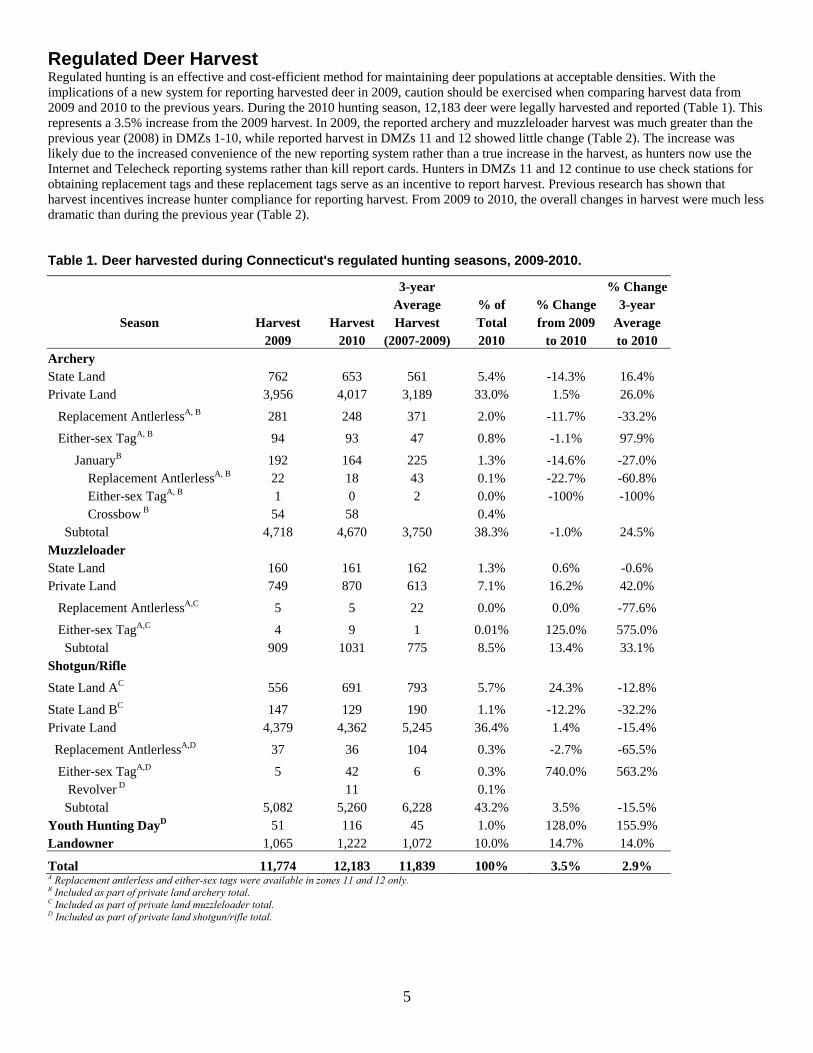
Regulated Deer Harvest Regulated hunting is an effective and cost-efficient method for maintaining deer populations at acceptable densities. With the implications of a new system for reporting harvested deer in 2009, caution should be exercised when comparing harvest data from 2009 and 2010 to the previous years. During the 2010 hunting season, 12,183 deer were legally harvested and reported (Table 1). This represents a 3.5% increase from the 2009 harvest. In 2009, the reported archery and muzzleloader harvest was much greater than the previous year (2008) in DMZs 1-10, while reported harvest in DMZs 11 and 12 showed little change (Table 2). The increase was likely due to the increased convenience of the new reporting system rather than a true increase in the harvest, as hunters now use the Internet and Telecheck reporting systems rather than kill report cards. Hunters in DMZs 11 and 12 continue to use check stations for obtaining replacement tags and these replacement tags serve as an incentive to report harvest. Previous research has shown that harvest incentives increase hunter compliance for reporting harvest. From 2009 to 2010, the overall changes in harvest were much less dramatic than during the previous year (Table 2). Table 1. Deer harvested during Connecticut's regulated hunting seasons, 2009-2010.
3-year % Change Average % of % Change 3-year
Season Harvest Harvest Harvest Total from 2009 Average 2009 2010 (2007-2009) 2010 to 2010 to 2010 Archery State Land 762 653 561 5.4% -14.3% 16.4% Private Land 3,956 4,017 3,189 33.0% 1.5% 26.0%
Replacement AntlerlessA, B 281 248 371 2.0% -11.7% -33.2%
Either-sex TagA, B 94 93 47 0.8% -1.1% 97.9%
JanuaryB 192 164 225 1.3% -14.6% -27.0% Replacement AntlerlessA, B 22 18 43 0.1% -22.7% -60.8% Either-sex TagA, B 1 0 2 0.0% -100% -100% Crossbow B 54 58 0.4% Subtotal 4,718 4,670 3,750 38.3% -1.0% 24.5% Muzzleloader State Land 160 161 162 1.3% 0.6% -0.6% Private Land 749 870 613 7.1% 16.2% 42.0%
Replacement AntlerlessA,C 5 5 22 0.0% 0.0% -77.6%
Either-sex TagA,C 4 9 1 0.01% 125.0% 575.0% Subtotal 909 1031 775 8.5% 13.4% 33.1% Shotgun/Rifle
State Land AC 556 691 793 5.7% 24.3% -12.8%
State Land BC 147 129 190 1.1% -12.2% -32.2% Private Land 4,379 4,362 5,245 36.4% 1.4% -15.4%
Replacement AntlerlessA,D 37 36 104 0.3% -2.7% -65.5%
Either-sex TagA,D 5 42 6 0.3% 740.0% 563.2% Revolver D 11 0.1% Subtotal 5,082 5,260 6,228 43.2% 3.5% -15.5% Youth Hunting DayD 51 116 45 1.0% 128.0% 155.9% Landowner 1,065 1,222 1,072 10.0% 14.7% 14.0%
Total 11,774 12,183 11,839 100% 3.5% 2.9% A Replacement antlerless and either-sex tags were available in zones 11 and 12 only. B Included as part of private land archery total. C Included as part of private land muzzleloader total. D Included as part of private land shotgun/rifle total.
6
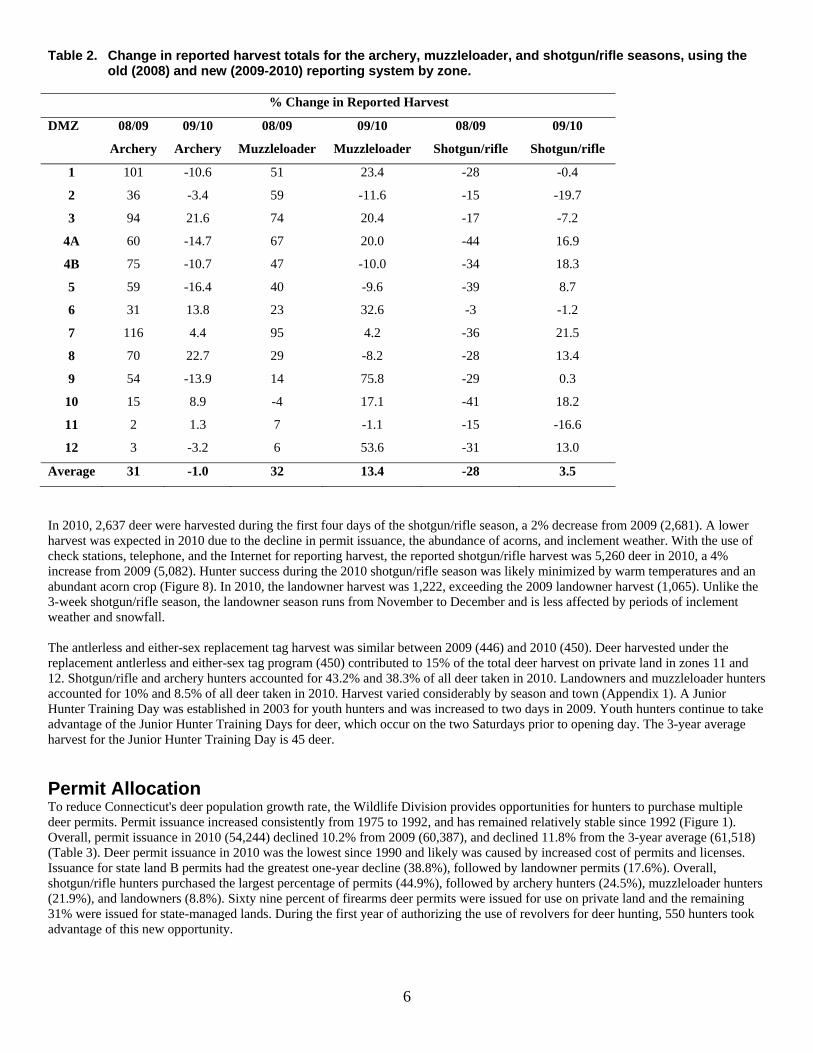
Table 2. Change in reported harvest totals for the archery, muzzleloader, and shotgun/rifle seasons, using the old (2008) and new (2009-2010) reporting system by zone.
% Change in Reported Harvest
DMZ 08/09
Archery
09/10
Archery
08/09
Muzzleloader
09/10
Muzzleloader
08/09
Shotgun/rifle
09/10
Shotgun/rifle
1 101 -10.6 51 23.4 -28 -0.4
2 36 -3.4 59 -11.6 -15 -19.7
3 94 21.6 74 20.4 -17 -7.2
4A 60 -14.7 67 20.0 -44 16.9
4B 75 -10.7 47 -10.0 -34 18.3
5 59 -16.4 40 -9.6 -39 8.7
6 31 13.8 23 32.6 -3 -1.2
7 116 4.4 95 4.2 -36 21.5
8 70 22.7 29 -8.2 -28 13.4
9 54 -13.9 14 75.8 -29 0.3
10 15 8.9 -4 17.1 -41 18.2
11 2 1.3 7 -1.1 -15 -16.6
12 3 -3.2 6 53.6 -31 13.0
Average 31 -1.0 32 13.4 -28 3.5
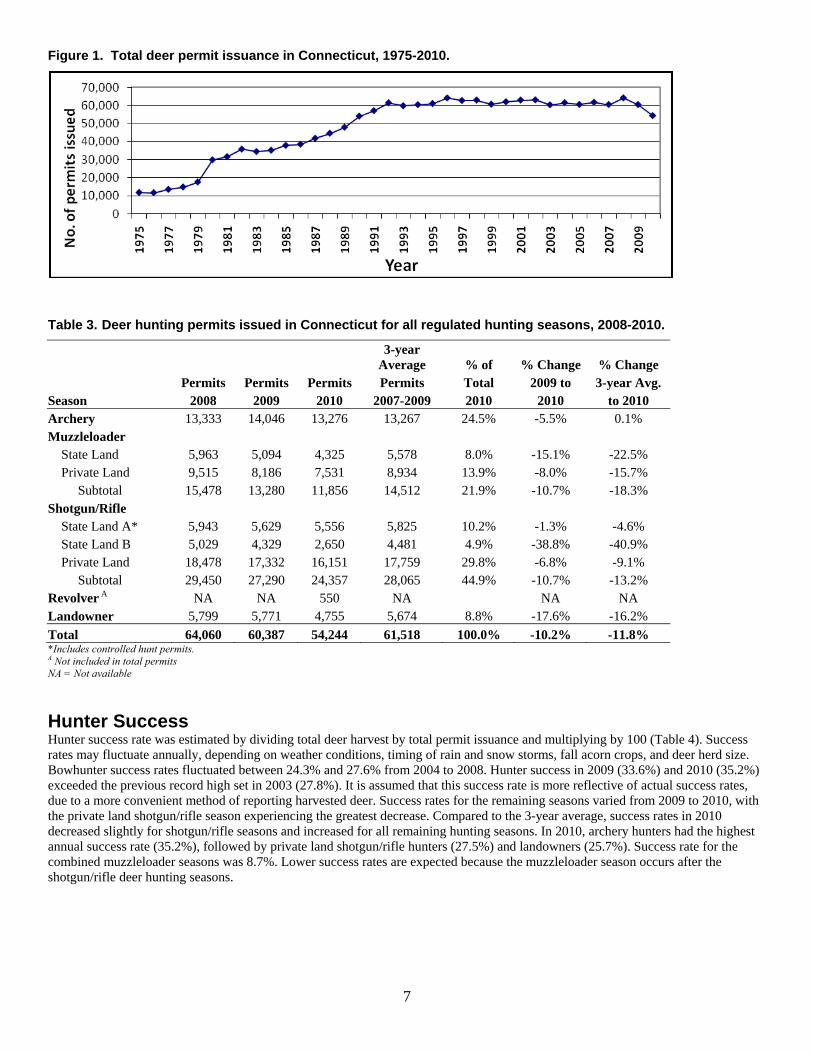
In 2010, 2,637 deer were harvested during the first four days of the shotgun/rifle season, a 2% decrease from 2009 (2,681). A lower harvest was expected in 2010 due to the decline in permit issuance, the abundance of acorns, and inclement weather. With the use of check stations, telephone, and the Internet for reporting harvest, the reported shotgun/rifle harvest was 5,260 deer in 2010, a 4% increase from 2009 (5,082). Hunter success during the 2010 shotgun/rifle season was likely minimized by warm temperatures and an abundant acorn crop (Figure 8). In 2010, the landowner harvest was 1,222, exceeding the 2009 landowner harvest (1,065). Unlike the 3-week shotgun/rifle season, the landowner season runs from November to December and is less affected by periods of inclement weather and snowfall. The antlerless and either-sex replacement tag harvest was similar between 2009 (446) and 2010 (450). Deer harvested under the replacement antlerless and either-sex tag program (450) contributed to 15% of the total deer harvest on private land in zones 11 and 12. Shotgun/rifle and archery hunters accounted for 43.2% and 38.3% of all deer taken in 2010. Landowners and muzzleloader hunters accounted for 10% and 8.5% of all deer taken in 2010. Harvest varied considerably by season and town (Appendix 1). A Junior Hunter Training Day was established in 2003 for youth hunters and was increased to two days in 2009. Youth hunters continue to take advantage of the Junior Hunter Training Days for deer, which occur on the two Saturdays prior to opening day. The 3-year average harvest for the Junior Hunter Training Day is 45 deer. Permit Allocation To reduce Connecticut's deer population growth rate, the Wildlife Division provides opportunities for hunters to purchase multiple deer permits. Permit issuance increased consistently from 1975 to 1992, and has remained relatively stable since 1992 (Figure 1). Overall, permit issuance in 2010 (54,244) declined 10.2% from 2009 (60,387), and declined 11.8% from the 3-year average (61,518) (Table 3). Deer permit issuance in 2010 was the lowest since 1990 and likely was caused by increased cost of permits and licenses. Issuance for state land B permits had the greatest one-year decline (38.8%), followed by landowner permits (17.6%). Overall, shotgun/rifle hunters purchased the largest percentage of permits (44.9%), followed by archery hunters (24.5%), muzzleloader hunters (21.9%), and landowners (8.8%). Sixty nine percent of firearms deer permits were issued for use on private land and the remaining 31% were issued for state-managed lands. During the first year of authorizing the use of revolvers for deer hunting, 550 hunters took advantage of this new opportunity.
7
Figure 1. Total deer permit issuance in Connecticut, 1975-2010.
Table 3. Deer hunting permits issued in Connecticut for all regulated hunting seasons, 2008-2010.
3-year
Average % of % Change % Change Permits Permits Permits Permits Total 2009 to 3-year Avg. Season 2008 2009 2010 2007-2009 2010 2010 to 2010 Archery 13,333 14,046 13,276 13,267 24.5% -5.5% 0.1% Muzzleloader State Land 5,963 5,094 4,325 5,578 8.0% -15.1% -22.5% Private Land 9,515 8,186 7,531 8,934 13.9% -8.0% -15.7% Subtotal 15,478 13,280 11,856 14,512 21.9% -10.7% -18.3% Shotgun/Rifle State Land A* 5,943 5,629 5,556 5,825 10.2% -1.3% -4.6% State Land B 5,029 4,329 2,650 4,481 4.9% -38.8% -40.9% Private Land 18,478 17,332 16,151 17,759 29.8% -6.8% -9.1% Subtotal 29,450 27,290 24,357 28,065 44.9% -10.7% -13.2% Revolver A NA NA 550 NA NA NA Landowner 5,799 5,771 4,755 5,674 8.8% -17.6% -16.2% Total 64,060 60,387 54,244 61,518 100.0% -10.2% -11.8% *Includes controlled hunt permits. A Not included in total permits NA = Not available Hunter Success Hunter success rate was estimated by dividing total deer harvest by total permit issuance and multiplying by 100 (Table 4). Success rates may fluctuate annually, depending on weather conditions, timing of rain and snow storms, fall acorn crops, and deer herd size. Bowhunter success rates fluctuated between 24.3% and 27.6% from 2004 to 2008. Hunter success in 2009 (33.6%) and 2010 (35.2%) exceeded the previous record high set in 2003 (27.8%). It is assumed that this success rate is more reflective of actual success rates, due to a more convenient method of reporting harvested deer. Success rates for the remaining seasons varied from 2009 to 2010, with the private land shotgun/rifle season experiencing the greatest decrease. Compared to the 3-year average, success rates in 2010 decreased slightly for shotgun/rifle seasons and increased for all remaining hunting seasons. In 2010, archery hunters had the highest annual success rate (35.2%), followed by private land shotgun/rifle hunters (27.5%) and landowners (25.7%). Success rate for the combined muzzleloader seasons was 8.7%. Lower success rates are expected because the muzzleloader season occurs after the shotgun/rifle deer hunting seasons.
8
Table 4. Deer hunter success rates (%) in Connecticut, 2009-2010.
3-year Avg. Difference Differencefrom 3-year
Avg. Success Rate from Season 2009 2010 (2007-2009) 2009 Archery
CombinedA 33.6% 35.2% 28.3% 1.6% 6.8% Muzzleloader State Land 3.1% 3.7% 2.9% 0.6% 0.8% Private Land 9.1% 11.6% 6.9% 2.5% 4.7% Combined 6.8% 8.7% 5.4% 1.9% 3.3% Shotgun/Rifle State Land A 9.9% 12.4% 13.5% 2.5% -1.0% State Land B 3.4% 4.9% 4.2% 1.5% 0.6% Private Land 25.0% 27.5% 28.9% 2.5% -1.4% Combined 18.6% 21.6% 21.9% 3.0% -0.3% Landowner 18.5% 25.7% 18.8% 7.2% 6.9%
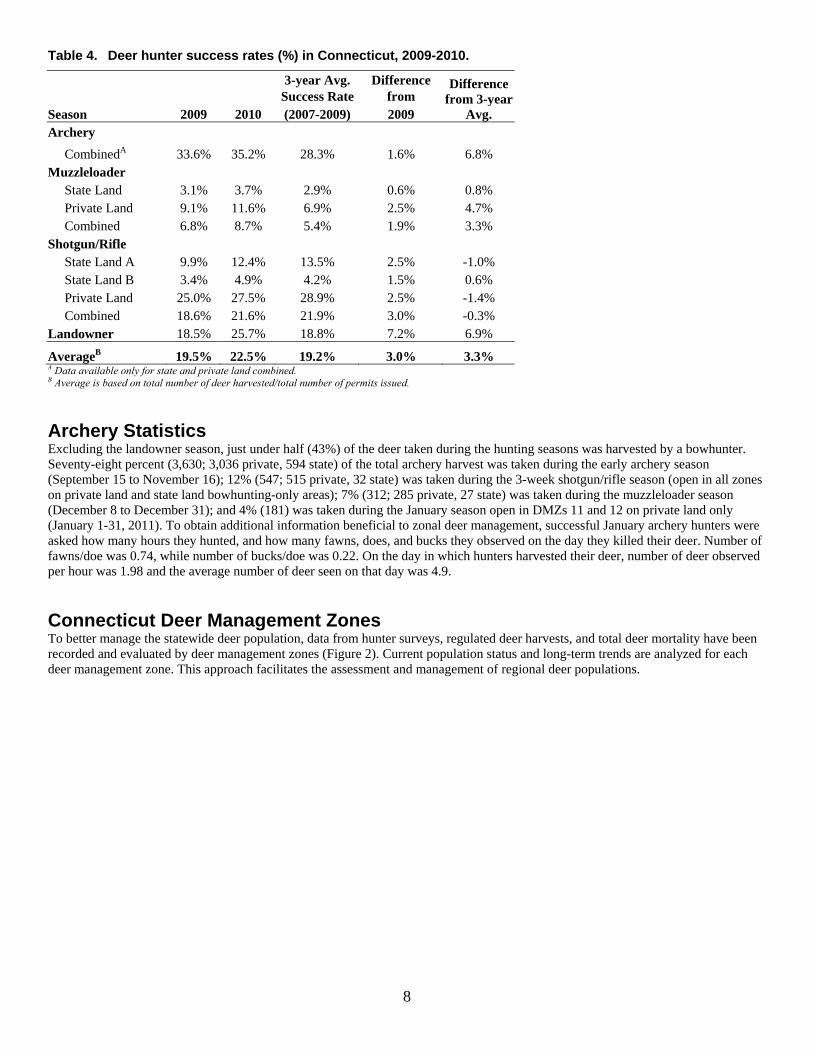
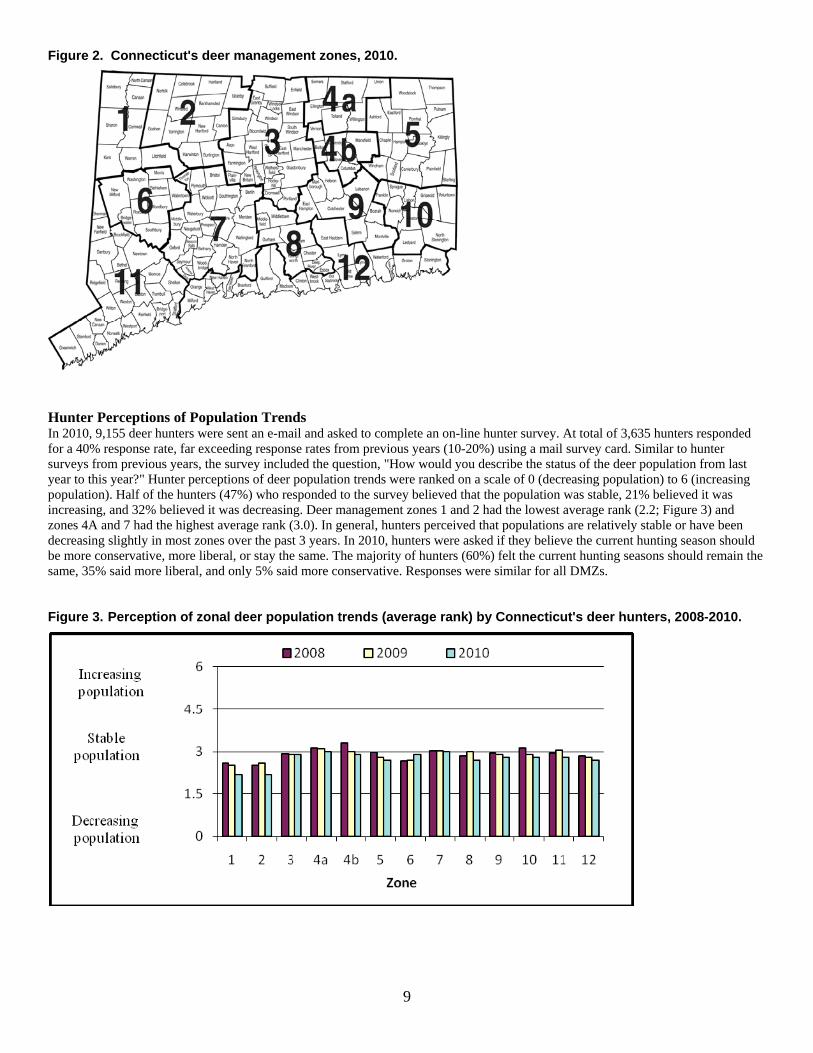
AverageB 19.5% 22.5% 19.2% 3.0% 3.3% A Data available only for state and private land combined. B Average is based on total number of deer harvested/total number of permits issued. Archery Statistics Excluding the landowner season, just under half (43%) of the deer taken during the hunting seasons was harvested by a bowhunter. Seventy-eight percent (3,630; 3,036 private, 594 state) of the total archery harvest was taken during the early archery season (September 15 to November 16); 12% (547; 515 private, 32 state) was taken during the 3-week shotgun/rifle season (open in all zones on private land and state land bowhunting-only areas); 7% (312; 285 private, 27 state) was taken during the muzzleloader season (December 8 to December 31); and 4% (181) was taken during the January season open in DMZs 11 and 12 on private land only (January 1-31, 2011). To obtain additional information beneficial to zonal deer management, successful January archery hunters were asked how many hours they hunted, and how many fawns, does, and bucks they observed on the day they killed their deer. Number of fawns/doe was 0.74, while number of bucks/doe was 0.22. On the day in which hunters harvested their deer, number of deer observed per hour was 1.98 and the average number of deer seen on that day was 4.9. Connecticut Deer Management Zones To better manage the statewide deer population, data from hunter surveys, regulated deer harvests, and total deer mortality have been recorded and evaluated by deer management zones (Figure 2). Current population status and long-term trends are analyzed for each deer management zone. This approach facilitates the assessment and management of regional deer populations.
9
Figure 2. Connecticut's deer management zones, 2010.
Hunter Perceptions of Population Trends In 2010, 9,155 deer hunters were sent an e-mail and asked to complete an on-line hunter survey. At total of 3,635 hunters responded for a 40% response rate, far exceeding response rates from previous years (10-20%) using a mail survey card. Similar to hunter surveys from previous years, the survey included the question, "How would you describe the status of the deer population from last year to this year?" Hunter perceptions of deer population trends were ranked on a scale of 0 (decreasing population) to 6 (increasing population). Half of the hunters (47%) who responded to the survey believed that the population was stable, 21% believed it was increasing, and 32% believed it was decreasing. Deer management zones 1 and 2 had the lowest average rank (2.2; Figure 3) and zones 4A and 7 had the highest average rank (3.0). In general, hunters perceived that populations are relatively stable or have been decreasing slightly in most zones over the past 3 years. In 2010, hunters were asked if they believe the current hunting season should be more conservative, more liberal, or stay the same. The majority of hunters (60%) felt the current hunting seasons should remain the same, 35% said more liberal, and only 5% said more conservative. Responses were similar for all DMZs. Figure 3. Perception of zonal deer population trends (average rank) by Connecticut's deer hunters, 2008-2010.
10
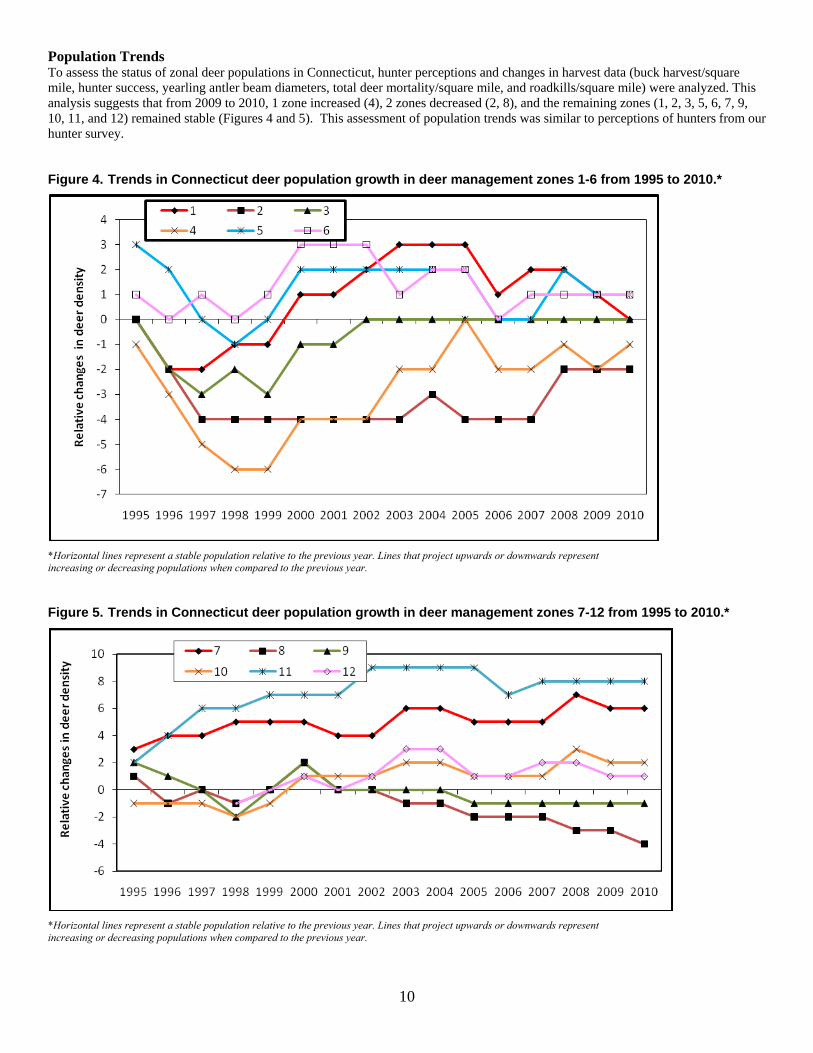
Population Trends To assess the status of zonal deer populations in Connecticut, hunter perceptions and changes in harvest data (buck harvest/square mile, hunter success, yearling antler beam diameters, total deer mortality/square mile, and roadkills/square mile) were analyzed. This analysis suggests that from 2009 to 2010, 1 zone increased (4), 2 zones decreased (2, 8), and the remaining zones (1, 2, 3, 5, 6, 7, 9, 10, 11, and 12) remained stable (Figures 4 and 5). This assessment of population trends was similar to perceptions of hunters from our hunter survey. Figure 4. Trends in Connecticut deer population growth in deer management zones 1-6 from 1995 to 2010.*
*Horizontal lines represent a stable population relative to the previous year. Lines that project upwards or downwards represent increasing or decreasing populations when compared to the previous year. Figure 5. Trends in Connecticut deer population growth in deer management zones 7-12 from 1995 to 2010.*
*Horizontal lines represent a stable population relative to the previous year. Lines that project upwards or downwards represent increasing or decreasing populations when compared to the previous year.
11
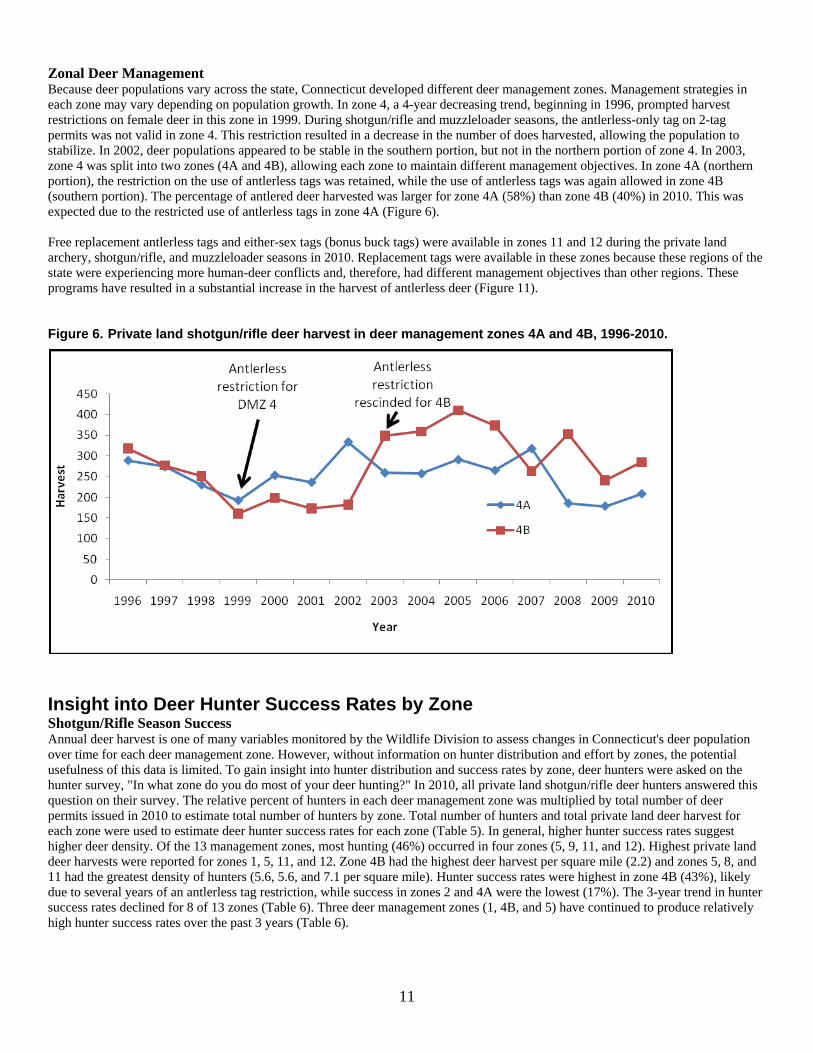
Zonal Deer Management Because deer populations vary across the state, Connecticut developed different deer management zones. Management strategies in each zone may vary depending on population growth. In zone 4, a 4-year decreasing trend, beginning in 1996, prompted harvest restrictions on female deer in this zone in 1999. During shotgun/rifle and muzzleloader seasons, the antlerless-only tag on 2-tag permits was not valid in zone 4. This restriction resulted in a decrease in the number of does harvested, allowing the population to stabilize. In 2002, deer populations appeared to be stable in the southern portion, but not in the northern portion of zone 4. In 2003, zone 4 was split into two zones (4A and 4B), allowing each zone to maintain different management objectives. In zone 4A (northern portion), the restriction on the use of antlerless tags was retained, while the use of antlerless tags was again allowed in zone 4B (southern portion). The percentage of antlered deer harvested was larger for zone 4A (58%) than zone 4B (40%) in 2010. This was expected due to the restricted use of antlerless tags in zone 4A (Figure 6). Free replacement antlerless tags and either-sex tags (bonus buck tags) were available in zones 11 and 12 during the private land archery, shotgun/rifle, and muzzleloader seasons in 2010. Replacement tags were available in these zones because these regions of the state were experiencing more human-deer conflicts and, therefore, had different management objectives than other regions. These programs have resulted in a substantial increase in the harvest of antlerless deer (Figure 11). Figure 6. Private land shotgun/rifle deer harvest in deer management zones 4A and 4B, 1996-2010.
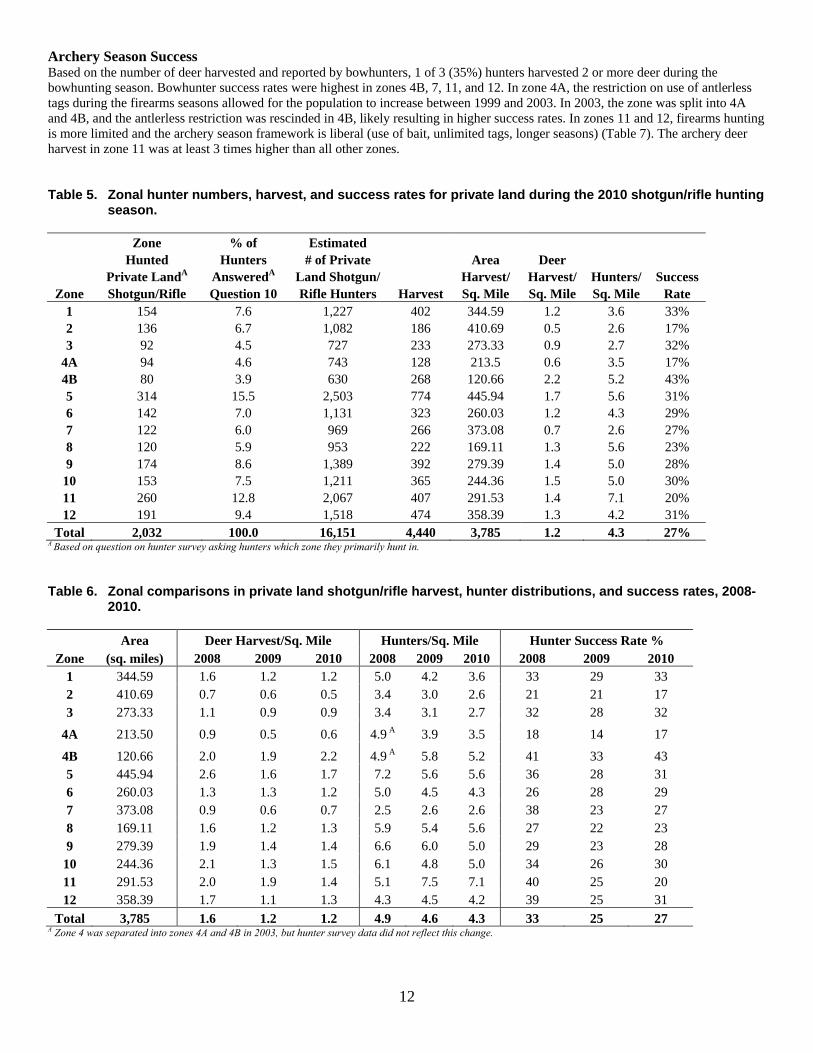
Insight into Deer Hunter Success Rates by Zone Shotgun/Rifle Season Success Annual deer harvest is one of many variables monitored by the Wildlife Division to assess changes in Connecticut's deer population over time for each deer management zone. However, without information on hunter distribution and effort by zones, the potential usefulness of this data is limited. To gain insight into hunter distribution and success rates by zone, deer hunters were asked on the hunter survey, "In what zone do you do most of your deer hunting?" In 2010, all private land shotgun/rifle deer hunters answered this question on their survey. The relative percent of hunters in each deer management zone was multiplied by total number of deer permits issued in 2010 to estimate total number of hunters by zone. Total number of hunters and total private land deer harvest for each zone were used to estimate deer hunter success rates for each zone (Table 5). In general, higher hunter success rates suggest higher deer density. Of the 13 management zones, most hunting (46%) occurred in four zones (5, 9, 11, and 12). Highest private land deer harvests were reported for zones 1, 5, 11, and 12. Zone 4B had the highest deer harvest per square mile (2.2) and zones 5, 8, and 11 had the greatest density of hunters (5.6, 5.6, and 7.1 per square mile). Hunter success rates were highest in zone 4B (43%), likely due to several years of an antlerless tag restriction, while success in zones 2 and 4A were the lowest (17%). The 3-year trend in hunter success rates declined for 8 of 13 zones (Table 6). Three deer management zones (1, 4B, and 5) have continued to produce relatively high hunter success rates over the past 3 years (Table 6).
12
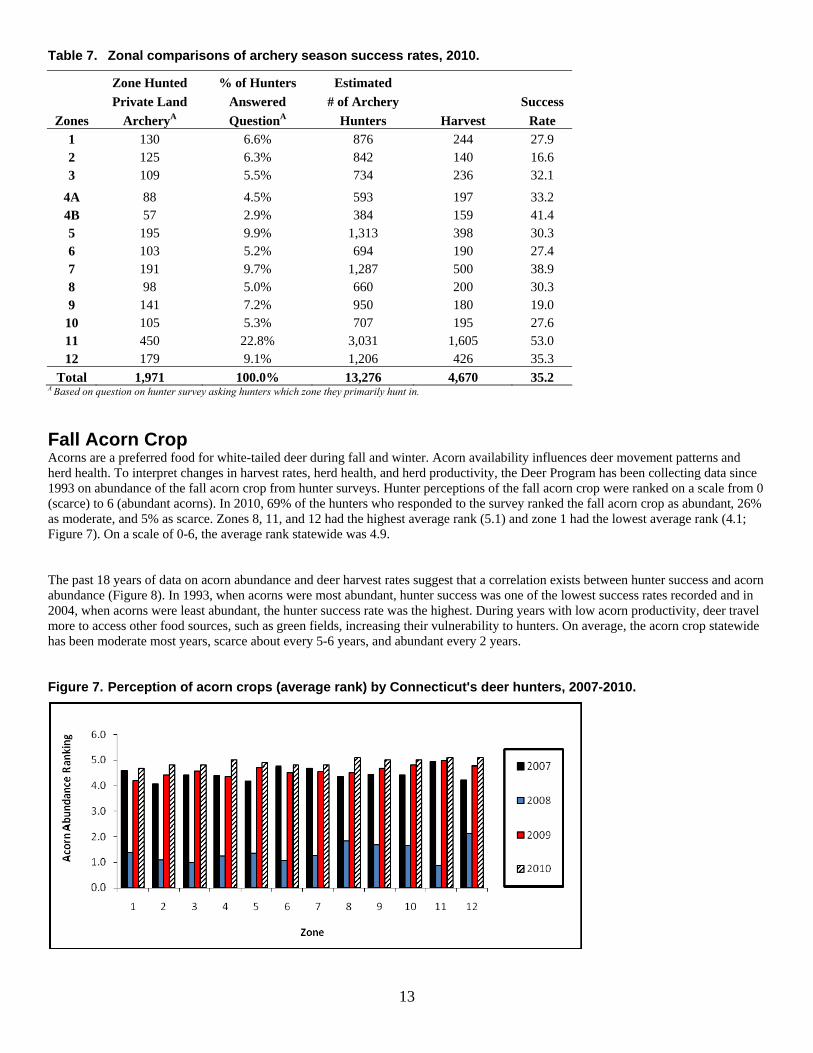
Archery Season Success Based on the number of deer harvested and reported by bowhunters, 1 of 3 (35%) hunters harvested 2 or more deer during the bowhunting season. Bowhunter success rates were highest in zones 4B, 7, 11, and 12. In zone 4A, the restriction on use of antlerless tags during the firearms seasons allowed for the population to increase between 1999 and 2003. In 2003, the zone was split into 4A and 4B, and the antlerless restriction was rescinded in 4B, likely resulting in higher success rates. In zones 11 and 12, firearms hunting is more limited and the archery season framework is liberal (use of bait, unlimited tags, longer seasons) (Table 7). The archery deer harvest in zone 11 was at least 3 times higher than all other zones. Table 5. Zonal hunter numbers, harvest, and success rates for private land during the 2010 shotgun/rifle hunting
season.
Zone % of Estimated Hunted Hunters # of Private Area Deer
Private LandA AnsweredA Land Shotgun/ Harvest/ Harvest/ Hunters/ Success Zone Shotgun/Rifle Question 10 Rifle Hunters Harvest Sq. Mile Sq. Mile Sq. Mile Rate
1 154 7.6 1,227 402 344.59 1.2 3.6 33% 2 136 6.7 1,082 186 410.69 0.5 2.6 17% 3 92 4.5 727 233 273.33 0.9 2.7 32%
4A 94 4.6 743 128 213.5 0.6 3.5 17% 4B 80 3.9 630 268 120.66 2.2 5.2 43% 5 314 15.5 2,503 774 445.94 1.7 5.6 31% 6 142 7.0 1,131 323 260.03 1.2 4.3 29% 7 122 6.0 969 266 373.08 0.7 2.6 27% 8 120 5.9 953 222 169.11 1.3 5.6 23% 9 174 8.6 1,389 392 279.39 1.4 5.0 28%
10 153 7.5 1,211 365 244.36 1.5 5.0 30% 11 260 12.8 2,067 407 291.53 1.4 7.1 20% 12 191 9.4 1,518 474 358.39 1.3 4.2 31%
Total 2,032 100.0 16,151 4,440 3,785 1.2 4.3 27% A Based on question on hunter survey asking hunters which zone they primarily hunt in. Table 6. Zonal comparisons in private land shotgun/rifle harvest, hunter distributions, and success rates, 2008-
2010.
Area Deer Harvest/Sq. Mile Hunters/Sq. Mile Hunter Success Rate % Zone (sq. miles) 2008 2009 2010 2008 2009 2010 2008 2009 2010
1 344.59 1.6 1.2 1.2 5.0 4.2 3.6 33 29 33 2 410.69 0.7 0.6 0.5 3.4 3.0 2.6 21 21 17 3 273.33 1.1 0.9 0.9 3.4 3.1 2.7 32 28 32
4A 213.50 0.9 0.5 0.6 4.9 A 3.9 3.5 18 14 17
4B 120.66 2.0 1.9 2.2 4.9 A 5.8 5.2 41 33 43 5 445.94 2.6 1.6 1.7 7.2 5.6 5.6 36 28 31 6 260.03 1.3 1.3 1.2 5.0 4.5 4.3 26 28 29 7 373.08 0.9 0.6 0.7 2.5 2.6 2.6 38 23 27 8 169.11 1.6 1.2 1.3 5.9 5.4 5.6 27 22 23 9 279.39 1.9 1.4 1.4 6.6 6.0 5.0 29 23 28
10 244.36 2.1 1.3 1.5 6.1 4.8 5.0 34 26 30 11 291.53 2.0 1.9 1.4 5.1 7.5 7.1 40 25 20 12 358.39 1.7 1.1 1.3 4.3 4.5 4.2 39 25 31
Total 3,785 1.6 1.2 1.2 4.9 4.6 4.3 33 25 27 A Zone 4 was separated into zones 4A and 4B in 2003, but hunter survey data did not reflect this change.
13
Table 7. Zonal comparisons of archery season success rates, 2010.
Zone Hunted % of Hunters Estimated Private Land Answered # of Archery Success
Zones ArcheryA QuestionA Hunters Harvest Rate 1 130 6.6% 876 244 27.9 2 125 6.3% 842 140 16.6 3 109 5.5% 734 236 32.1
4A 88 4.5% 593 197 33.2 4B 57 2.9% 384 159 41.4 5 195 9.9% 1,313 398 30.3 6 103 5.2% 694 190 27.4 7 191 9.7% 1,287 500 38.9 8 98 5.0% 660 200 30.3 9 141 7.2% 950 180 19.0
10 105 5.3% 707 195 27.6 11 450 22.8% 3,031 1,605 53.0 12 179 9.1% 1,206 426 35.3
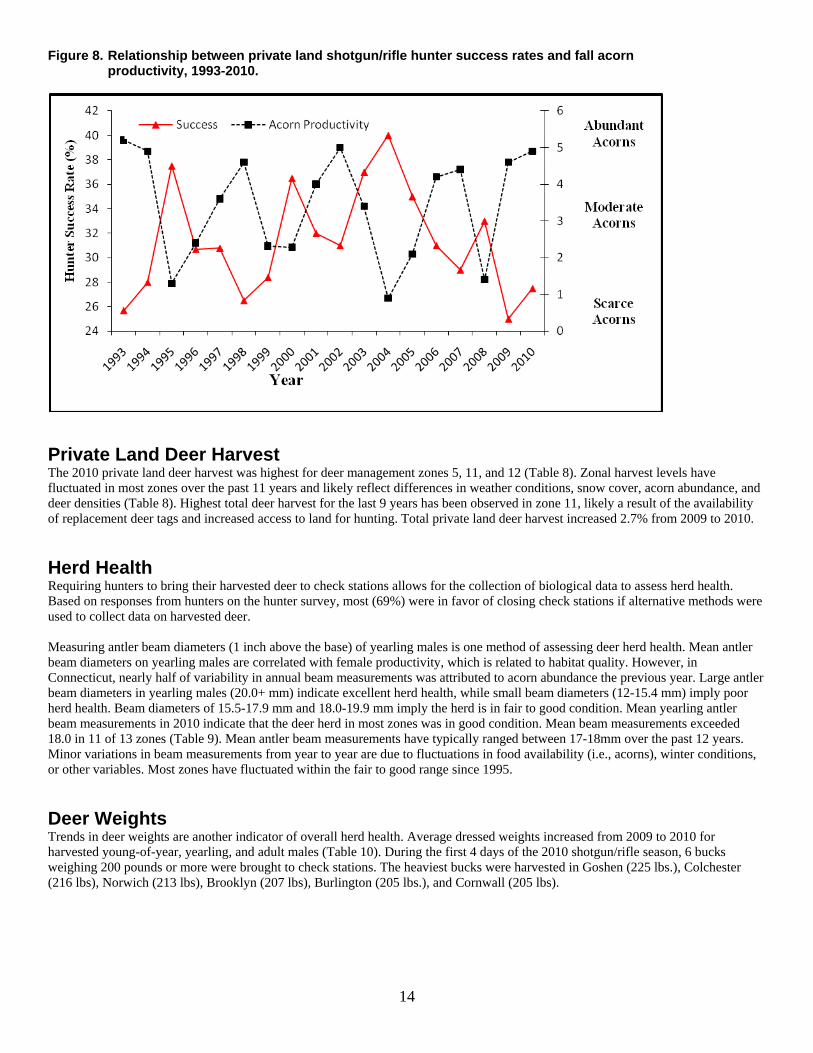
Total 1,971 100.0% 13,276 4,670 35.2 A Based on question on hunter survey asking hunters which zone they primarily hunt in. Fall Acorn Crop Acorns are a preferred food for white-tailed deer during fall and winter. Acorn availability influences deer movement patterns and herd health. To interpret changes in harvest rates, herd health, and herd productivity, the Deer Program has been collecting data since 1993 on abundance of the fall acorn crop from hunter surveys. Hunter perceptions of the fall acorn crop were ranked on a scale from 0 (scarce) to 6 (abundant acorns). In 2010, 69% of the hunters who responded to the survey ranked the fall acorn crop as abundant, 26% as moderate, and 5% as scarce. Zones 8, 11, and 12 had the highest average rank (5.1) and zone 1 had the lowest average rank (4.1; Figure 7). On a scale of 0-6, the average rank statewide was 4.9. The past 18 years of data on acorn abundance and deer harvest rates suggest that a correlation exists between hunter success and acorn abundance (Figure 8). In 1993, when acorns were most abundant, hunter success was one of the lowest success rates recorded and in 2004, when acorns were least abundant, the hunter success rate was the highest. During years with low acorn productivity, deer travel more to access other food sources, such as green fields, increasing their vulnerability to hunters. On average, the acorn crop statewide has been moderate most years, scarce about every 5-6 years, and abundant every 2 years. Figure 7. Perception of acorn crops (average rank) by Connecticut's deer hunters, 2007-2010.
14
Figure 8. Relationship between private land shotgun/rifle hunter success rates and fall acorn productivity, 1993-2010.
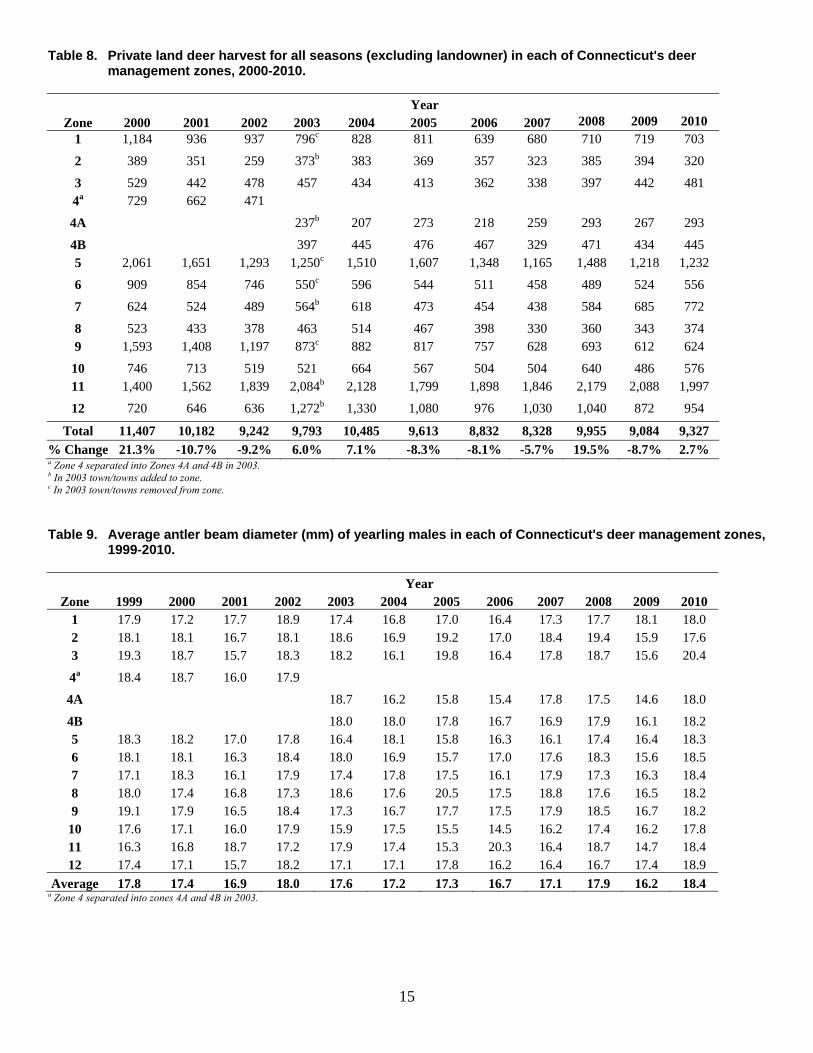
Private Land Deer Harvest The 2010 private land deer harvest was highest for deer management zones 5, 11, and 12 (Table 8). Zonal harvest levels have fluctuated in most zones over the past 11 years and likely reflect differences in weather conditions, snow cover, acorn abundance, and deer densities (Table 8). Highest total deer harvest for the last 9 years has been observed in zone 11, likely a result of the availability of replacement deer tags and increased access to land for hunting. Total private land deer harvest increased 2.7% from 2009 to 2010. Herd Health Requiring hunters to bring their harvested deer to check stations allows for the collection of biological data to assess herd health. Based on responses from hunters on the hunter survey, most (69%) were in favor of closing check stations if alternative methods were used to collect data on harvested deer. Measuring antler beam diameters (1 inch above the base) of yearling males is one method of assessing deer herd health. Mean antler beam diameters on yearling males are correlated with female productivity, which is related to habitat quality. However, in Connecticut, nearly half of variability in annual beam measurements was attributed to acorn abundance the previous year. Large antler beam diameters in yearling males (20.0+ mm) indicate excellent herd health, while small beam diameters (12-15.4 mm) imply poor herd health. Beam diameters of 15.5-17.9 mm and 18.0-19.9 mm imply the herd is in fair to good condition. Mean yearling antler beam measurements in 2010 indicate that the deer herd in most zones was in good condition. Mean beam measurements exceeded 18.0 in 11 of 13 zones (Table 9). Mean antler beam measurements have typically ranged between 17-18mm over the past 12 years. Minor variations in beam measurements from year to year are due to fluctuations in food availability (i.e., acorns), winter conditions, or other variables. Most zones have fluctuated within the fair to good range since 1995. Deer Weights Trends in deer weights are another indicator of overall herd health. Average dressed weights increased from 2009 to 2010 for harvested young-of-year, yearling, and adult males (Table 10). During the first 4 days of the 2010 shotgun/rifle season, 6 bucks weighing 200 pounds or more were brought to check stations. The heaviest bucks were harvested in Goshen (225 lbs.), Colchester (216 lbs), Norwich (213 lbs), Brooklyn (207 lbs), Burlington (205 lbs.), and Cornwall (205 lbs).
15
Table 8. Private land deer harvest for all seasons (excluding landowner) in each of Connecticut's deer management zones, 2000-2010.
Year
Zone 2000 2001 2002 2003 2004 2005 2006 2007 2008 2009 2010 1 1,184 936 937 796c 828 811 639 680 710 719 703
2 389 351 259 373b 383 369 357 323 385 394 320
3 529 442 478 457 434 413 362 338 397 442 481 4a 729 662 471
4A 237b 207 273 218 259 293 267 293
4B 397 445 476 467 329 471 434 445 5 2,061 1,651 1,293 1,250c 1,510 1,607 1,348 1,165 1,488 1,218 1,232
6 909 854 746 550c 596 544 511 458 489 524 556
7 624 524 489 564b 618 473 454 438 584 685 772
8 523 433 378 463 514 467 398 330 360 343 374 9 1,593 1,408 1,197 873c 882 817 757 628 693 612 624
10 746 713 519 521 664 567 504 504 640 486 576 11 1,400 1,562 1,839 2,084b 2,128 1,799 1,898 1,846 2,179 2,088 1,997
12 720 646 636 1,272b 1,330 1,080 976 1,030 1,040 872 954
Total 11,407 10,182 9,242 9,793 10,485 9,613 8,832 8,328 9,955 9,084 9,327 % Change 21.3% -10.7% -9.2% 6.0% 7.1% -8.3% -8.1% -5.7% 19.5% -8.7% 2.7% a Zone 4 separated into Zones 4A and 4B in 2003. b In 2003 town/towns added to zone. c In 2003 town/towns removed from zone. Table 9. Average antler beam diameter (mm) of yearling males in each of Connecticut's deer management zones,
1999-2010. Year
Zone 1999 2000 2001 2002 2003 2004 2005 2006 2007 2008 2009 2010 1 17.9 17.2 17.7 18.9 17.4 16.8 17.0 16.4 17.3 17.7 18.1 18.0 2 18.1 18.1 16.7 18.1 18.6 16.9 19.2 17.0 18.4 19.4 15.9 17.6 3 19.3 18.7 15.7 18.3 18.2 16.1 19.8 16.4 17.8 18.7 15.6 20.4
4a 18.4 18.7 16.0 17.9
4A 18.7 16.2 15.8 15.4 17.8 17.5 14.6 18.0
4B 18.0 18.0 17.8 16.7 16.9 17.9 16.1 18.2 5 18.3 18.2 17.0 17.8 16.4 18.1 15.8 16.3 16.1 17.4 16.4 18.3 6 18.1 18.1 16.3 18.4 18.0 16.9 15.7 17.0 17.6 18.3 15.6 18.5 7 17.1 18.3 16.1 17.9 17.4 17.8 17.5 16.1 17.9 17.3 16.3 18.4 8 18.0 17.4 16.8 17.3 18.6 17.6 20.5 17.5 18.8 17.6 16.5 18.2 9 19.1 17.9 16.5 18.4 17.3 16.7 17.7 17.5 17.9 18.5 16.7 18.2
10 17.6 17.1 16.0 17.9 15.9 17.5 15.5 14.5 16.2 17.4 16.2 17.8 11 16.3 16.8 18.7 17.2 17.9 17.4 15.3 20.3 16.4 18.7 14.7 18.4 12 17.4 17.1 15.7 18.2 17.1 17.1 17.8 16.2 16.4 16.7 17.4 18.9
Average 17.8 17.4 16.9 18.0 17.6 17.2 17.3 16.7 17.1 17.9 16.2 18.4 a Zone 4 separated into zones 4A and 4B in 2003.
16
Table 10. Average dressed weights (lbs.) of male deer harvested and brought to check stations during the first four days of the shotgun/rifle hunting season, 2008-2010.
Young-of-year Yearling Adult Zone 2008 2009 2010 2008 2009 2010 2008 2009 2010
1 64.3 ND ND 115.2 108.1 111.8 156.7 134.5 148.2 2 53.8 ND 71.9 121.6 105.3 110.3 150.2 177.2 157.1 3 61.4 ND 71.9 112.4 93.0 109.4 151.2 140.3 153.8
4A 48.0 ND ND 105.3 91.4 110.8 141.4 136.8 139.0 4B 60.1 62.0 73.1 108.1 96.6 107.4 145.7 134.0 136.2 5 61.9 63.4 69.8 106.4 97.1 112.9 140.7 135.7 143.4 6 70.0 ND 73.7 112.0 98.9 109.7 153.4 136.0 145.8 7 69.2 ND ND 113.2 102.4 111.8 151.3 139.6 133.2 8 59.4 60.5 63.7 104.9 99.0 107.9 143.6 138.7 145.4 9 64.8 63.8 72.1 111.2 98.1 109.0 162.3 138.3 140.9
10 67.0 69.7 73.0 113.5 106.8 107.2 146.1 139.6 142.7 11 62.7 59.3 67.6 105.2 92.9 105.3 147.8 131.0 138.9 12 56.4 66.9 71.4 105.6 95.7 113.6 140.1 136.7 144.6
Average 61.5 63.6 70.8 110.4 98.9 109.8 148.5 139.9 143.8 ND = ≤ 5 deer recorded
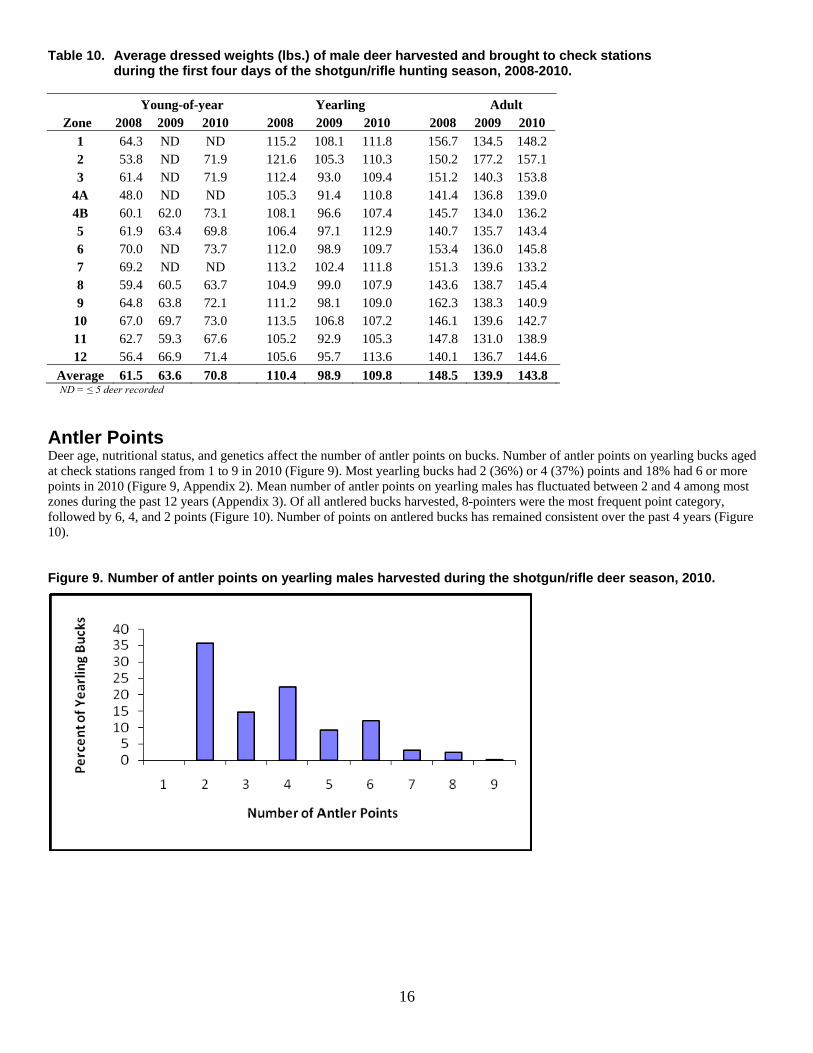
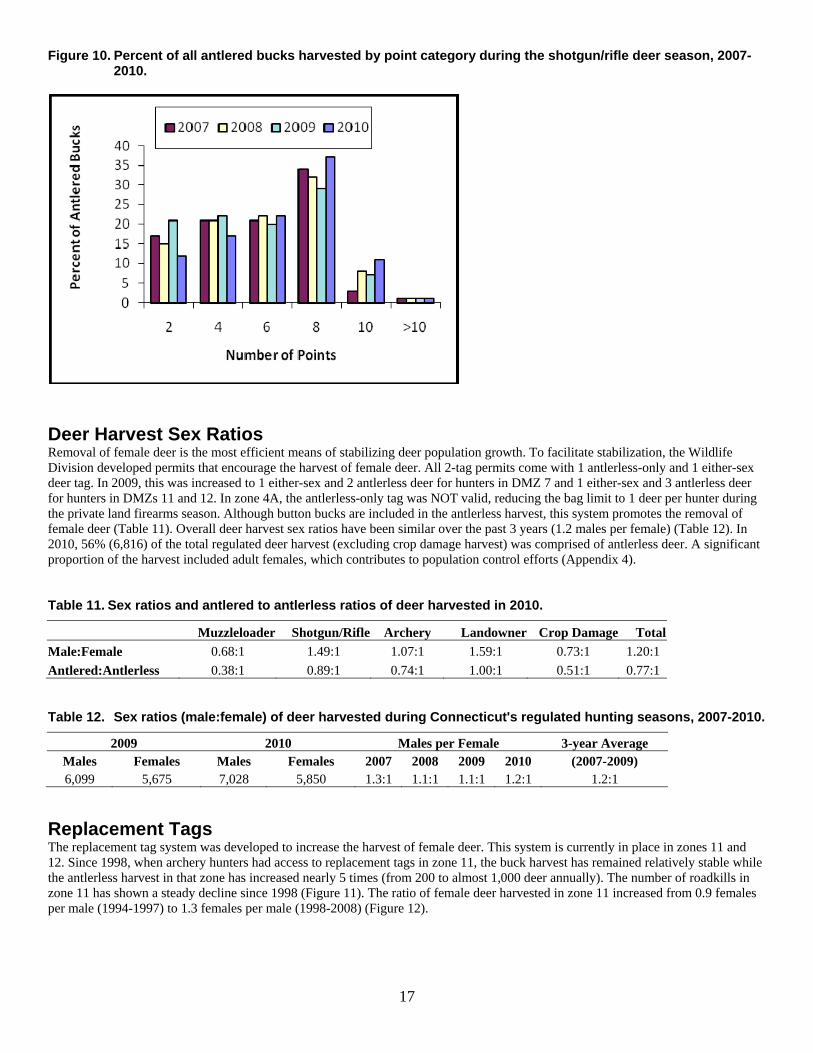
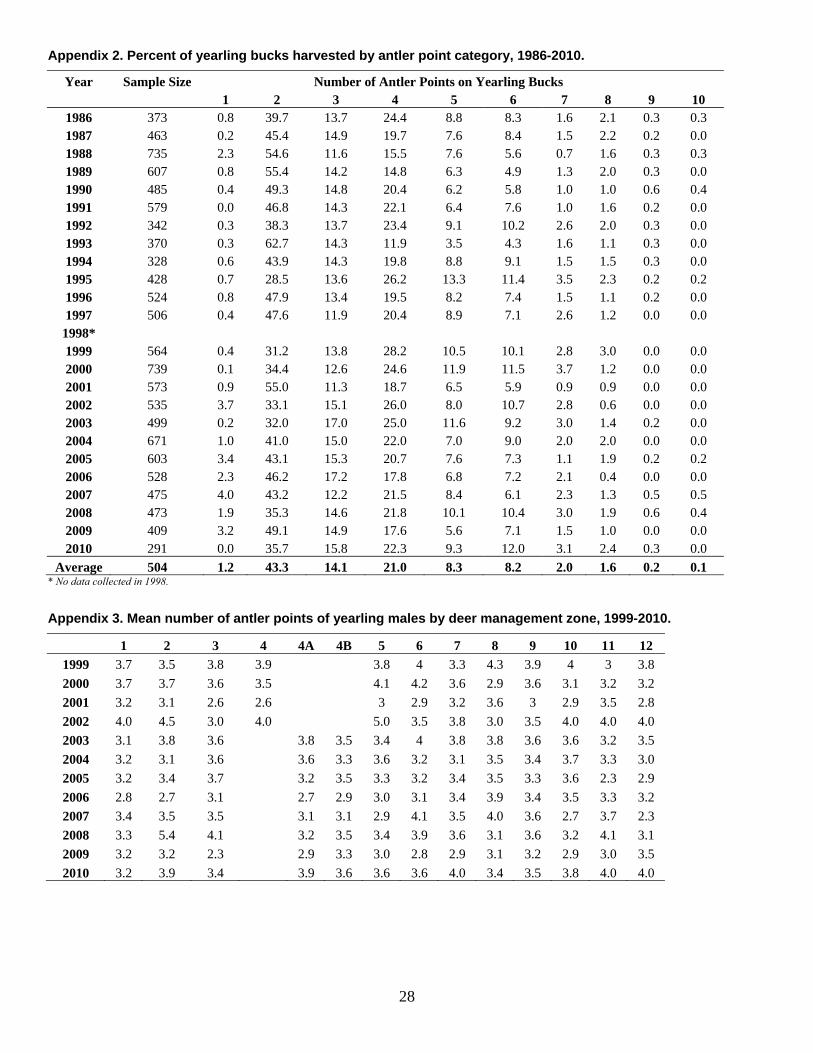
Antler Points Deer age, nutritional status, and genetics affect the number of antler points on bucks. Number of antler points on yearling bucks aged at check stations ranged from 1 to 9 in 2010 (Figure 9). Most yearling bucks had 2 (36%) or 4 (37%) points and 18% had 6 or more points in 2010 (Figure 9, Appendix 2). Mean number of antler points on yearling males has fluctuated between 2 and 4 among most zones during the past 12 years (Appendix 3). Of all antlered bucks harvested, 8-pointers were the most frequent point category, followed by 6, 4, and 2 points (Figure 10). Number of points on antlered bucks has remained consistent over the past 4 years (Figure 10). Figure 9. Number of antler points on yearling males harvested during the shotgun/rifle deer season, 2010.
17
Figure 10. Percent of all antlered bucks harvested by point category during the shotgun/rifle deer season, 2007-2010.
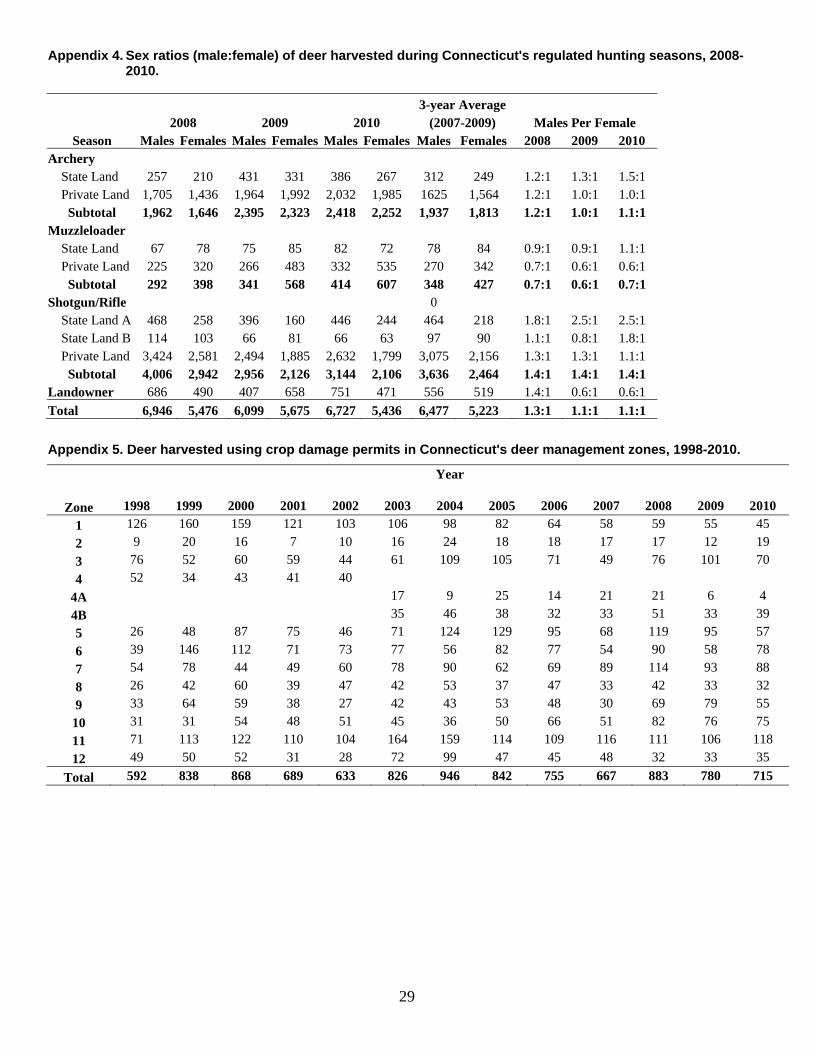
Deer Harvest Sex Ratios Removal of female deer is the most efficient means of stabilizing deer population growth. To facilitate stabilization, the Wildlife Division developed permits that encourage the harvest of female deer. All 2-tag permits come with 1 antlerless-only and 1 either-sex deer tag. In 2009, this was increased to 1 either-sex and 2 antlerless deer for hunters in DMZ 7 and 1 either-sex and 3 antlerless deer for hunters in DMZs 11 and 12. In zone 4A, the antlerless-only tag was NOT valid, reducing the bag limit to 1 deer per hunter during the private land firearms season. Although button bucks are included in the antlerless harvest, this system promotes the removal of female deer (Table 11). Overall deer harvest sex ratios have been similar over the past 3 years (1.2 males per female) (Table 12). In 2010, 56% (6,816) of the total regulated deer harvest (excluding crop damage harvest) was comprised of antlerless deer. A significant proportion of the harvest included adult females, which contributes to population control efforts (Appendix 4). Table 11. Sex ratios and antlered to antlerless ratios of deer harvested in 2010.
Muzzleloader Shotgun/Rifle Archery Landowner Crop Damage TotalMale:Female 0.68:1 1.49:1 1.07:1 1.59:1 0.73:1 1.20:1 Antlered:Antlerless 0.38:1 0.89:1 0.74:1 1.00:1 0.51:1 0.77:1 Table 12. Sex ratios (male:female) of deer harvested during Connecticut's regulated hunting seasons, 2007-2010.
2009 2010 Males per Female 3-year Average Males Females Males Females 2007 2008 2009 2010 (2007-2009) 6,099 5,675 7,028 5,850 1.3:1 1.1:1 1.1:1 1.2:1 1.2:1
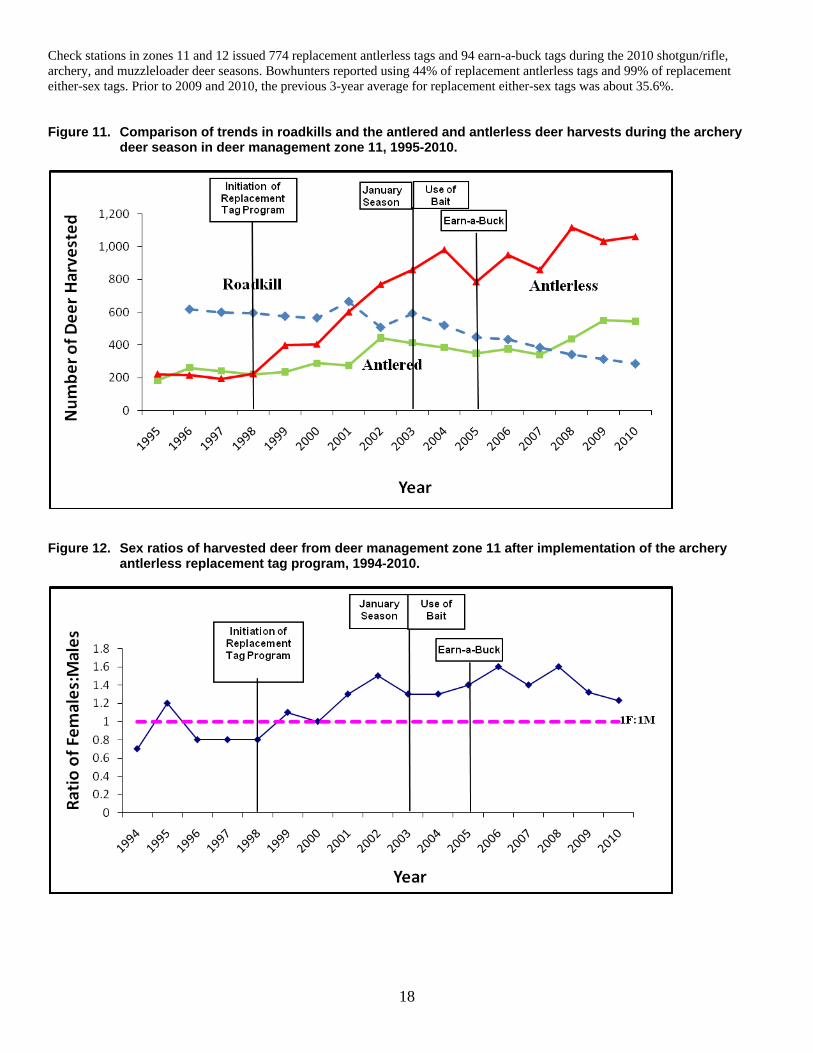
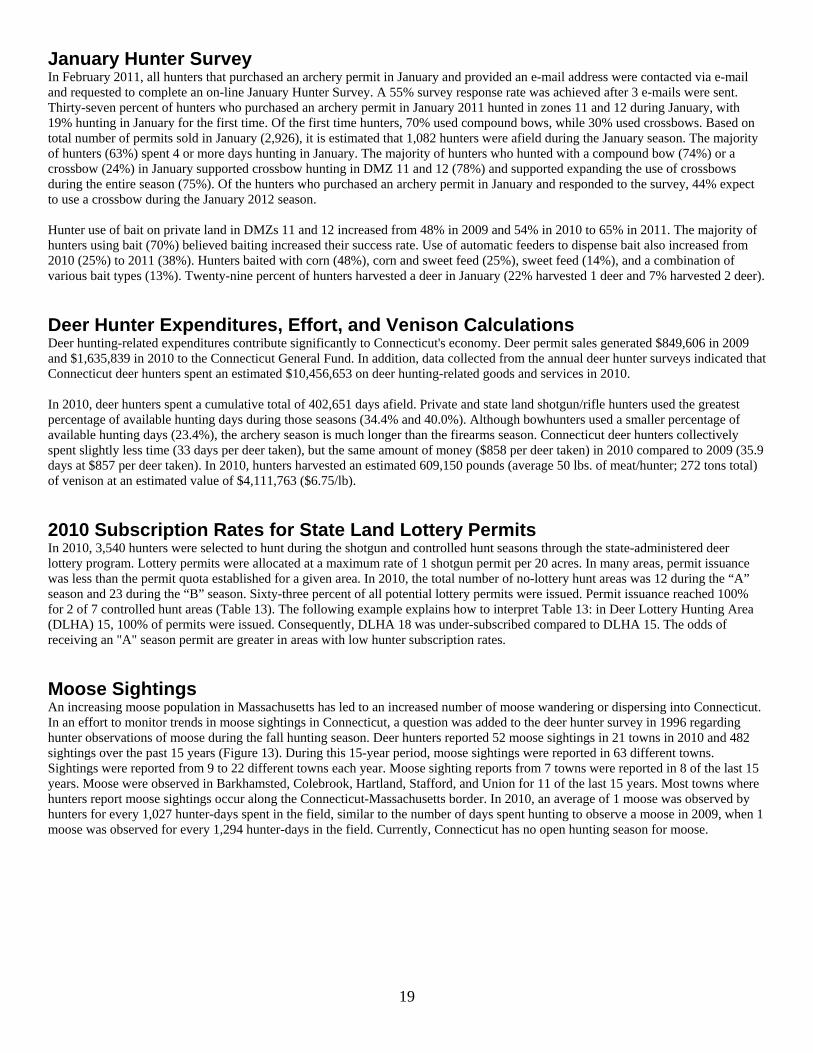
Replacement Tags The replacement tag system was developed to increase the harvest of female deer. This system is currently in place in zones 11 and 12. Since 1998, when archery hunters had access to replacement tags in zone 11, the buck harvest has remained relatively stable while the antlerless harvest in that zone has increased nearly 5 times (from 200 to almost 1,000 deer annually). The number of roadkills in zone 11 has shown a steady decline since 1998 (Figure 11). The ratio of female deer harvested in zone 11 increased from 0.9 females per male (1994-1997) to 1.3 females per male (1998-2008) (Figure 12).
18
Check stations in zones 11 and 12 issued 774 replacement antlerless tags and 94 earn-a-buck tags during the 2010 shotgun/rifle, archery, and muzzleloader deer seasons. Bowhunters reported using 44% of replacement antlerless tags and 99% of replacement either-sex tags. Prior to 2009 and 2010, the previous 3-year average for replacement either-sex tags was about 35.6%. Figure 11. Comparison of trends in roadkills and the antlered and antlerless deer harvests during the archery
deer season in deer management zone 11, 1995-2010.
Figure 12. Sex ratios of harvested deer from deer management zone 11 after implementation of the archery
antlerless replacement tag program, 1994-2010.
19
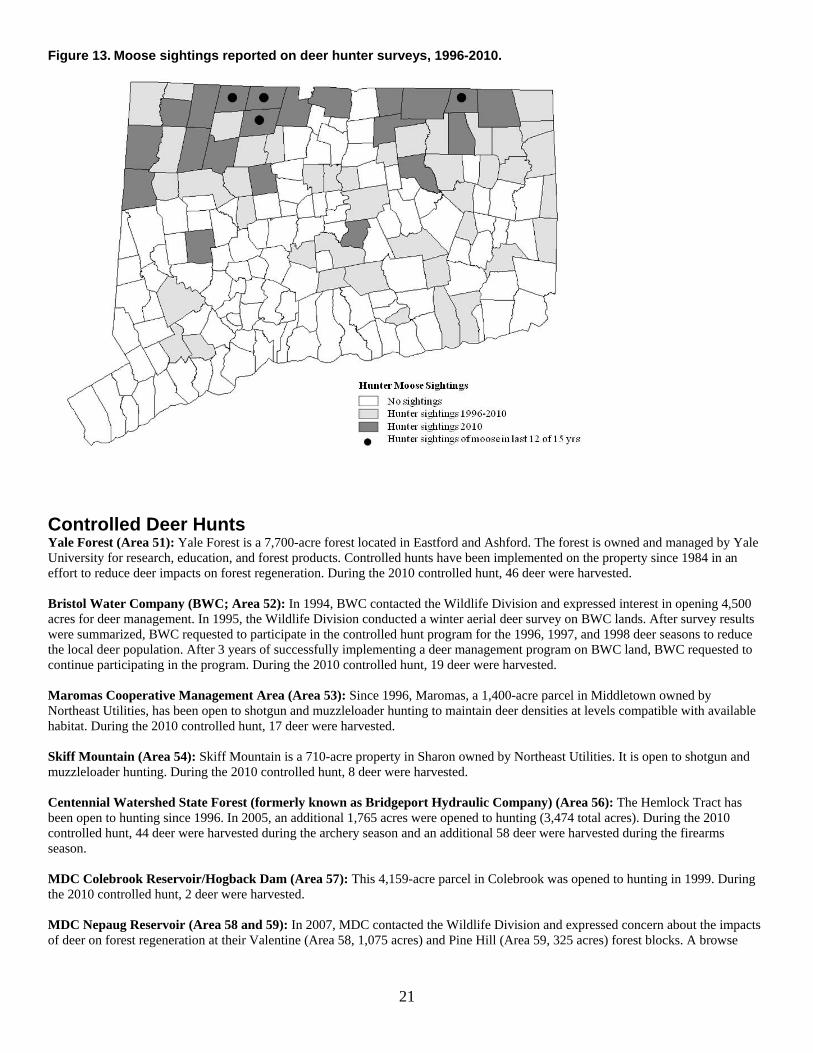
January Hunter Survey In February 2011, all hunters that purchased an archery permit in January and provided an e-mail address were contacted via e-mail and requested to complete an on-line January Hunter Survey. A 55% survey response rate was achieved after 3 e-mails were sent. Thirty-seven percent of hunters who purchased an archery permit in January 2011 hunted in zones 11 and 12 during January, with 19% hunting in January for the first time. Of the first time hunters, 70% used compound bows, while 30% used crossbows. Based on total number of permits sold in January (2,926), it is estimated that 1,082 hunters were afield during the January season. The majority of hunters (63%) spent 4 or more days hunting in January. The majority of hunters who hunted with a compound bow (74%) or a crossbow (24%) in January supported crossbow hunting in DMZ 11 and 12 (78%) and supported expanding the use of crossbows during the entire season (75%). Of the hunters who purchased an archery permit in January and responded to the survey, 44% expect to use a crossbow during the January 2012 season. Hunter use of bait on private land in DMZs 11 and 12 increased from 48% in 2009 and 54% in 2010 to 65% in 2011. The majority of hunters using bait (70%) believed baiting increased their success rate. Use of automatic feeders to dispense bait also increased from 2010 (25%) to 2011 (38%). Hunters baited with corn (48%), corn and sweet feed (25%), sweet feed (14%), and a combination of various bait types (13%). Twenty-nine percent of hunters harvested a deer in January (22% harvested 1 deer and 7% harvested 2 deer). Deer Hunter Expenditures, Effort, and Venison Calculations Deer hunting-related expenditures contribute significantly to Connecticut's economy. Deer permit sales generated $849,606 in 2009 and $1,635,839 in 2010 to the Connecticut General Fund. In addition, data collected from the annual deer hunter surveys indicated that Connecticut deer hunters spent an estimated $10,456,653 on deer hunting-related goods and services in 2010. In 2010, deer hunters spent a cumulative total of 402,651 days afield. Private and state land shotgun/rifle hunters used the greatest percentage of available hunting days during those seasons (34.4% and 40.0%). Although bowhunters used a smaller percentage of available hunting days (23.4%), the archery season is much longer than the firearms season. Connecticut deer hunters collectively spent slightly less time (33 days per deer taken), but the same amount of money ($858 per deer taken) in 2010 compared to 2009 (35.9 days at $857 per deer taken). In 2010, hunters harvested an estimated 609,150 pounds (average 50 lbs. of meat/hunter; 272 tons total) of venison at an estimated value of $4,111,763 ($6.75/lb). 2010 Subscription Rates for State Land Lottery Permits In 2010, 3,540 hunters were selected to hunt during the shotgun and controlled hunt seasons through the state-administered deer lottery program. Lottery permits were allocated at a maximum rate of 1 shotgun permit per 20 acres. In many areas, permit issuance was less than the permit quota established for a given area. In 2010, the total number of no-lottery hunt areas was 12 during the “A” season and 23 during the “B” season. Sixty-three percent of all potential lottery permits were issued. Permit issuance reached 100% for 2 of 7 controlled hunt areas (Table 13). The following example explains how to interpret Table 13: in Deer Lottery Hunting Area (DLHA) 15, 100% of permits were issued. Consequently, DLHA 18 was under-subscribed compared to DLHA 15. The odds of receiving an "A" season permit are greater in areas with low hunter subscription rates. Moose Sightings An increasing moose population in Massachusetts has led to an increased number of moose wandering or dispersing into Connecticut. In an effort to monitor trends in moose sightings in Connecticut, a question was added to the deer hunter survey in 1996 regarding hunter observations of moose during the fall hunting season. Deer hunters reported 52 moose sightings in 21 towns in 2010 and 482 sightings over the past 15 years (Figure 13). During this 15-year period, moose sightings were reported in 63 different towns. Sightings were reported from 9 to 22 different towns each year. Moose sighting reports from 7 towns were reported in 8 of the last 15 years. Moose were observed in Barkhamsted, Colebrook, Hartland, Stafford, and Union for 11 of the last 15 years. Most towns where hunters report moose sightings occur along the Connecticut-Massachusetts border. In 2010, an average of 1 moose was observed by hunters for every 1,027 hunter-days spent in the field, similar to the number of days spent hunting to observe a moose in 2009, when 1 moose was observed for every 1,294 hunter-days in the field. Currently, Connecticut has no open hunting season for moose.
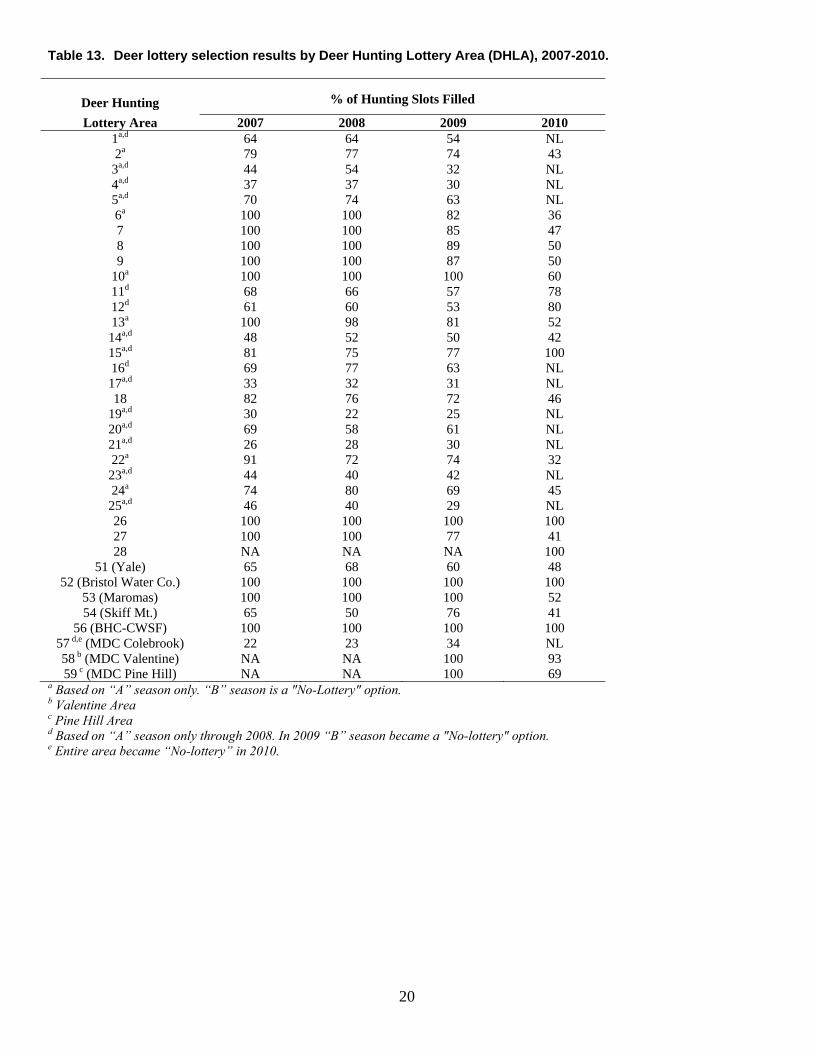
20
Table 13. Deer lottery selection results by Deer Hunting Lottery Area (DHLA), 2007-2010.
Deer Hunting
% of Hunting Slots Filled
Lottery Area 2007 2008 2009 2010 1a,d 64 64 54 NL 2a 79 77 74 43 3a,d 44 54 32 NL 4a,d 37 37 30 NL 5a,d 70 74 63 NL 6a 100 100 82 36 7 100 100 85 47 8 100 100 89 50 9 100 100 87 50
10a 100 100 100 60 11d 68 66 57 78 12d 61 60 53 80 13a 100 98 81 52 14a,d 48 52 50 42 15a,d 81 75 77 100 16d 69 77 63 NL 17a,d 33 32 31 NL 18 82 76 72 46
19a,d 30 22 25 NL 20a,d 69 58 61 NL 21a,d 26 28 30 NL 22a 91 72 74 32 23a,d 44 40 42 NL 24a 74 80 69 45 25a,d 46 40 29 NL 26 100 100 100 100 27 100 100 77 41 28 NA NA NA 100
51 (Yale) 65 68 60 48 52 (Bristol Water Co.) 100 100 100 100
53 (Maromas) 100 100 100 52 54 (Skiff Mt.) 65 50 76 41
56 (BHC-CWSF) 100 100 100 100 57 d,e (MDC Colebrook) 22 23 34 NL 58 b (MDC Valentine) NA NA 100 93 59 c (MDC Pine Hill) NA NA 100 69
a Based on “A” season only. “B” season is a "No-Lottery" option. b Valentine Area c Pine Hill Area d Based on “A” season only through 2008. In 2009 “B” season became a "No-lottery" option. e Entire area became “No-lottery” in 2010.
21
Figure 13. Moose sightings reported on deer hunter surveys, 1996-2010.
Controlled Deer Hunts Yale Forest (Area 51): Yale Forest is a 7,700-acre forest located in Eastford and Ashford. The forest is owned and managed by Yale University for research, education, and forest products. Controlled hunts have been implemented on the property since 1984 in an effort to reduce deer impacts on forest regeneration. During the 2010 controlled hunt, 46 deer were harvested. Bristol Water Company (BWC; Area 52): In 1994, BWC contacted the Wildlife Division and expressed interest in opening 4,500 acres for deer management. In 1995, the Wildlife Division conducted a winter aerial deer survey on BWC lands. After survey results were summarized, BWC requested to participate in the controlled hunt program for the 1996, 1997, and 1998 deer seasons to reduce the local deer population. After 3 years of successfully implementing a deer management program on BWC land, BWC requested to continue participating in the program. During the 2010 controlled hunt, 19 deer were harvested. Maromas Cooperative Management Area (Area 53): Since 1996, Maromas, a 1,400-acre parcel in Middletown owned by Northeast Utilities, has been open to shotgun and muzzleloader hunting to maintain deer densities at levels compatible with available habitat. During the 2010 controlled hunt, 17 deer were harvested. Skiff Mountain (Area 54): Skiff Mountain is a 710-acre property in Sharon owned by Northeast Utilities. It is open to shotgun and muzzleloader hunting. During the 2010 controlled hunt, 8 deer were harvested. Centennial Watershed State Forest (formerly known as Bridgeport Hydraulic Company) (Area 56): The Hemlock Tract has been open to hunting since 1996. In 2005, an additional 1,765 acres were opened to hunting (3,474 total acres). During the 2010 controlled hunt, 44 deer were harvested during the archery season and an additional 58 deer were harvested during the firearms season. MDC Colebrook Reservoir/Hogback Dam (Area 57): This 4,159-acre parcel in Colebrook was opened to hunting in 1999. During the 2010 controlled hunt, 2 deer were harvested. MDC Nepaug Reservoir (Area 58 and 59): In 2007, MDC contacted the Wildlife Division and expressed concern about the impacts of deer on forest regeneration at their Valentine (Area 58, 1,075 acres) and Pine Hill (Area 59, 325 acres) forest blocks. A browse
22
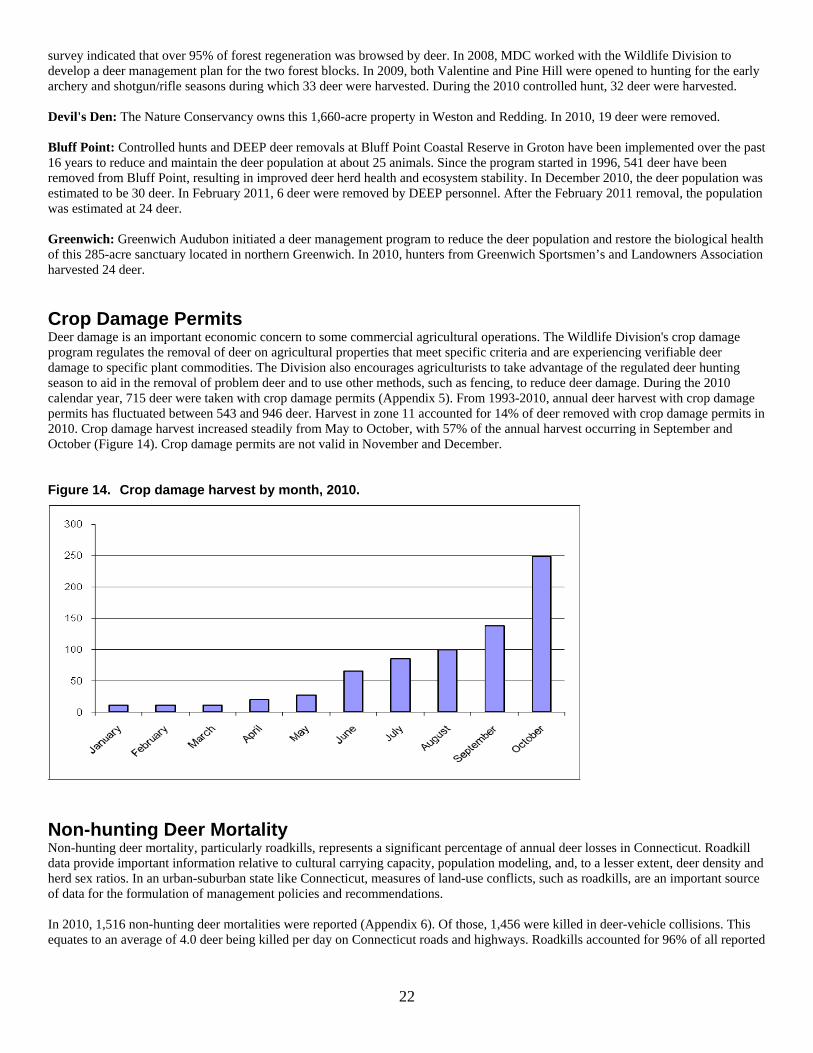
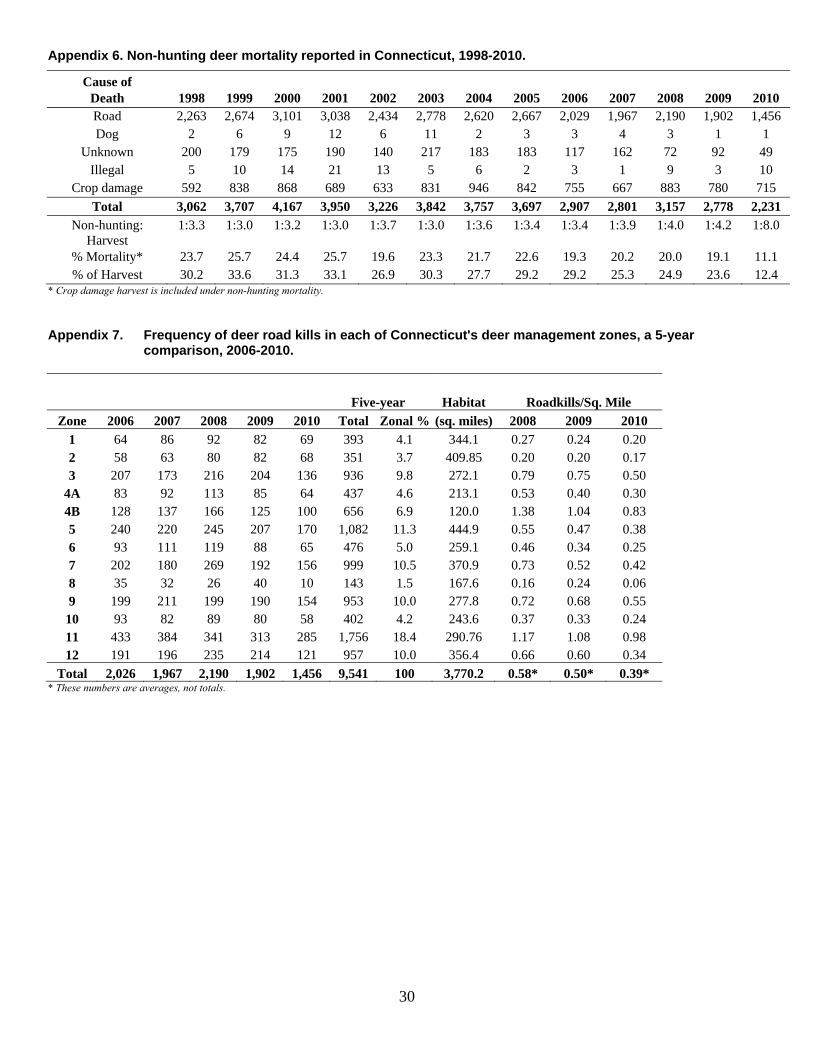
survey indicated that over 95% of forest regeneration was browsed by deer. In 2008, MDC worked with the Wildlife Division to develop a deer management plan for the two forest blocks. In 2009, both Valentine and Pine Hill were opened to hunting for the early archery and shotgun/rifle seasons during which 33 deer were harvested. During the 2010 controlled hunt, 32 deer were harvested. Devil's Den: The Nature Conservancy owns this 1,660-acre property in Weston and Redding. In 2010, 19 deer were removed. Bluff Point: Controlled hunts and DEEP deer removals at Bluff Point Coastal Reserve in Groton have been implemented over the past 16 years to reduce and maintain the deer population at about 25 animals. Since the program started in 1996, 541 deer have been removed from Bluff Point, resulting in improved deer herd health and ecosystem stability. In December 2010, the deer population was estimated to be 30 deer. In February 2011, 6 deer were removed by DEEP personnel. After the February 2011 removal, the population was estimated at 24 deer. Greenwich: Greenwich Audubon initiated a deer management program to reduce the deer population and restore the biological health of this 285-acre sanctuary located in northern Greenwich. In 2010, hunters from Greenwich Sportsmen’s and Landowners Association harvested 24 deer. Crop Damage Permits Deer damage is an important economic concern to some commercial agricultural operations. The Wildlife Division's crop damage program regulates the removal of deer on agricultural properties that meet specific criteria and are experiencing verifiable deer damage to specific plant commodities. The Division also encourages agriculturists to take advantage of the regulated deer hunting season to aid in the removal of problem deer and to use other methods, such as fencing, to reduce deer damage. During the 2010 calendar year, 715 deer were taken with crop damage permits (Appendix 5). From 1993-2010, annual deer harvest with crop damage permits has fluctuated between 543 and 946 deer. Harvest in zone 11 accounted for 14% of deer removed with crop damage permits in 2010. Crop damage harvest increased steadily from May to October, with 57% of the annual harvest occurring in September and October (Figure 14). Crop damage permits are not valid in November and December. Figure 14. Crop damage harvest by month, 2010.
Non-hunting Deer Mortality Non-hunting deer mortality, particularly roadkills, represents a significant percentage of annual deer losses in Connecticut. Roadkill data provide important information relative to cultural carrying capacity, population modeling, and, to a lesser extent, deer density and herd sex ratios. In an urban-suburban state like Connecticut, measures of land-use conflicts, such as roadkills, are an important source of data for the formulation of management policies and recommendations. In 2010, 1,516 non-hunting deer mortalities were reported (Appendix 6). Of those, 1,456 were killed in deer-vehicle collisions. This equates to an average of 4.0 deer being killed per day on Connecticut roads and highways. Roadkills accounted for 96% of all reported
23
non-hunting mortality (excluding crop damage) in 2010. Based on a 2-year study (2000-2001), for every 1 deer killed by a vehicle and reported to the Wildlife Division, 5 additional deer are killed by vehicles and not reported. Based on this correction factor, it is estimated that the actual number of roadkills in 2010 was 8,736. Nearly 20% (285) of all reported roadkilled deer in Connecticut occurred in deer management zone 11 (Fairfield County, Figure 2) in 2010 (Appendix 7). The number of roadkills in DMZ 11 has shown a steady decline since the implementation of the replacement tag program, extension of the archery season, and the legalization of baiting (Figure 11). Non-hunting mortality comprised 11.1% of the total reported deer mortality in Connecticut, including crop damage harvest (Appendix 6). Disease Testing of White-tailed Deer Over the past 8 years, the Wildlife Division has focused much effort on conducting surveillance for chronic wasting disease (CWD) in deer. CWD is one of a group of diseases called transmissible spongiform encephalopathies (TSE), or prion diseases, that are inevitably fatal to members of the deer family. CWD is closely related to, but different from, other TSEs in other species, such as scrapie in sheep. CWD was first recognized as a disease in 1967 in captive mule deer at a wildlife research facility in Fort Collins, Colorado. The disease was first diagnosed in free-ranging elk, mule deer, and white-tailed deer in Colorado and Wyoming in 1981, 1985, and 1990, respectively. To date, CWD has been diagnosed in captive cervid facilities in Alberta, Colorado, Kansas, Michigan, Minnesota, Missouri, Montana, Nebraska, New York, Oklahoma, Saskatchewan, South Dakota, and Wisconsin and in free-ranging cervids in Alberta, Colorado, Kansas, Illinois, Maryland, Minnesota, Nebraska, New Mexico, New York, North Dakota, South Dakota, Saskatchewan, Utah, Virginia, West Virginia, Wisconsin, and Wyoming. In 2002, concerns about CWD entering Connecticut prompted the enactment of emergency regulations restricting the movement of live animals into the state. In 2003, the DEEP began its first intensive CWD surveillance program. From 2003 to 2009, a total of 3,759 samples have been collected from hunter harvested and roadkilled deer and tested at either the University of Connecticut’s Department of Pathobiology and Veterinary Science or the Wisconsin Veterinary Diagnostic Laboratory, and all tested negative for CWD. In 2010 an additional 615 samples were tested, 284 from high-risk areas along the New York border and 331 from the remainder of the state. All samples were negative for CWD. The DEEP will continue to monitor for CWD as long as funding is available. Conclusion Over the past 30 years, deer population size, human land-use practices, and public attitudes toward wildlife have changed considerably. Today, hunters may legally take up to 14 deer per year if they participate in all hunting seasons and additional deer may be taken in 2 of the 13 deer management zones. Historically, permit issuance has increased consistently from 11,710 in 1975 to 61,333 in 1992. Since 1992, permit issuance has remained relatively stable, fluctuating between 60,316 and 64,032. In 2008, permit issuance increased to its highest point in history. The cause for this increase is unknown, but may be attributed to the poor economy, where harvesting one’s own food may be a desirable means of obtaining quality protein. In 2009, permit issuance declined slightly, likely due to the increased cost of permits. In 2010, permit issuance declined again to levels similar to those 20 years ago. Over the last 10 years, harvest in most deer management zones has remained relatively stable. However, with increased opportunities and incentives to harvest deer in urban deer management zones 11 and 12, the harvest has more than doubled, while roadkills have been exhibiting a steady downward trend. Increased harvest efforts appear to have stabilized deer populations in many areas of the state. The Wildlife Division continues to conduct research and evaluate the effectiveness of methods to control deer populations, particularly in urban-suburban landscapes. The Division initiated several long-term urban deer studies in residential communities in recent years. Reports summarizing findings from these studies are available to communities interested in managing deer in more developed areas of the state, such as Fairfield County. To obtain copies of these reports, check the DEEP Web site (www.ct.gov/deep) or contact the Wildlife Division’s Deer Program via e-mail at [email protected] or call 860-642-7239. The Wildlife Division will continue to provide technical assistance on deer control options to interested communities. Future management efforts will continue to focus on deer population stabilization. In areas with overabundant deer populations, landowners will be encouraged to use hunting, where possible, as a management tool. A booklet on Managing Urban Deer in Connecticut is available from Wildlife Division offices or on-line (www.ct.gov/dep/lib/dep/wildlife/pdf_files/game/urbandeer07.pdf) to assist communities in developing effective deer management programs. An Evaluation of Deer Management Options was made available in 2009 by the Northeast Deer Technical Committee and can be found on the DEEP Web site (www.ct.gov/dep/lib/dep/wildlife/pdf_files/game/deeroptions.pdf).
24
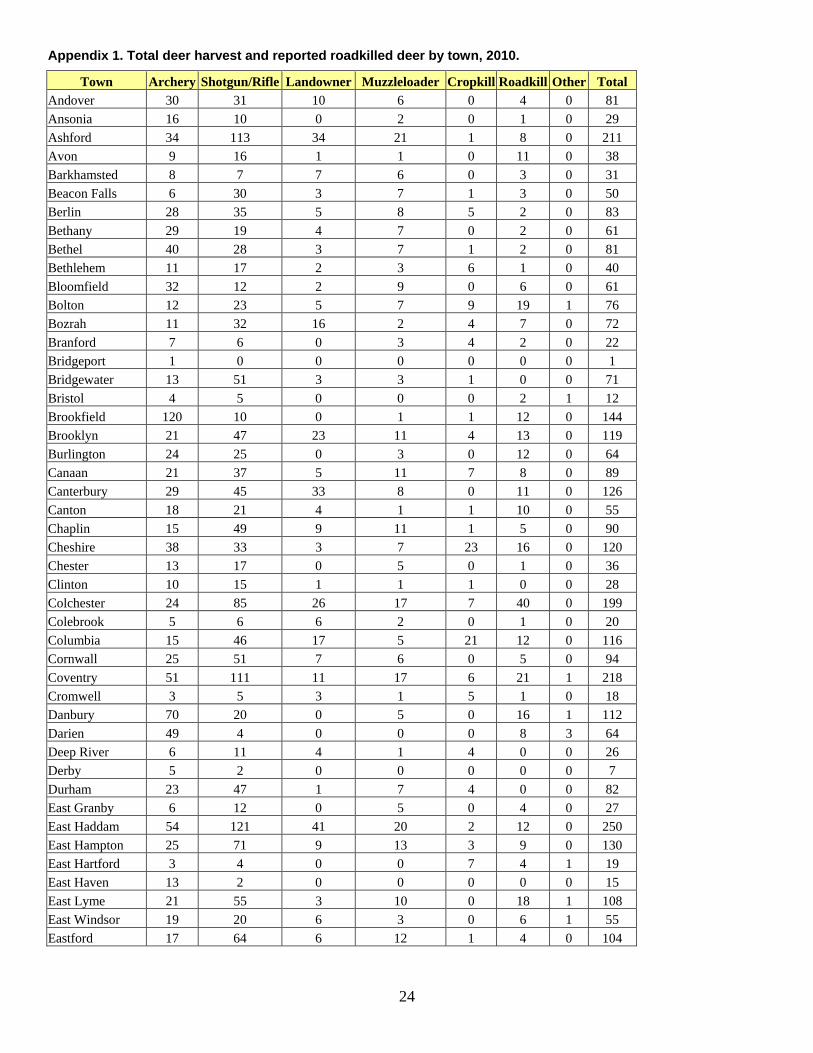
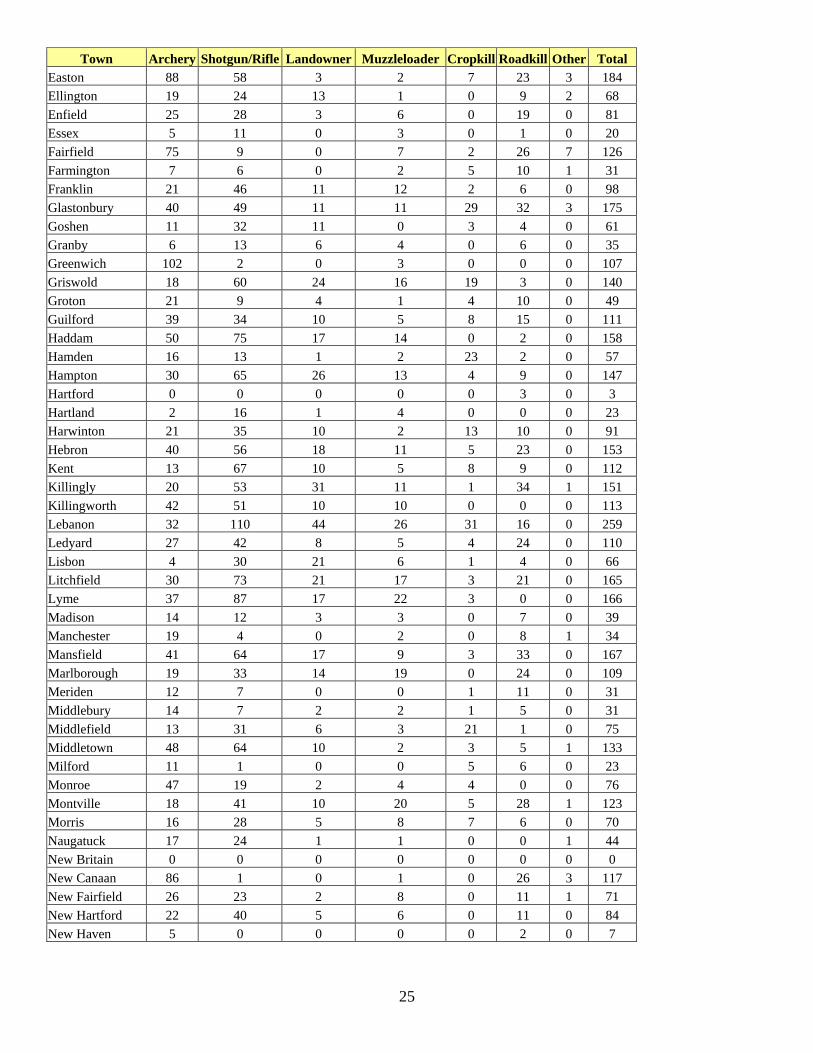
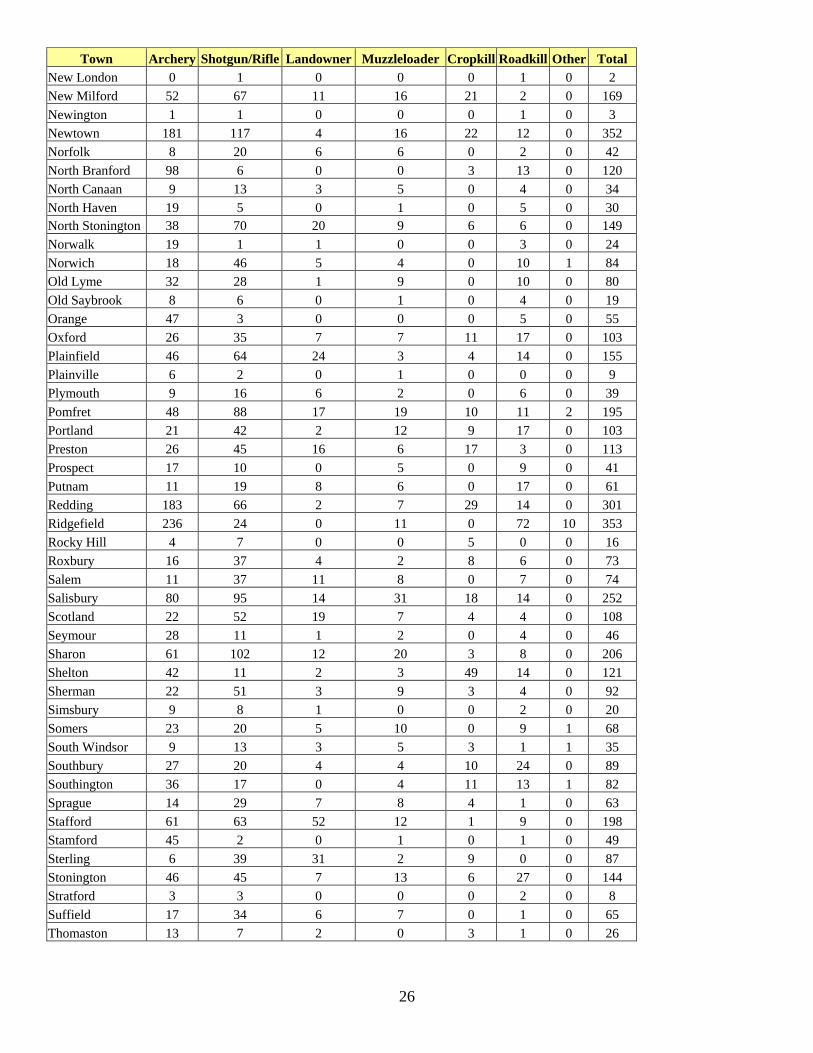
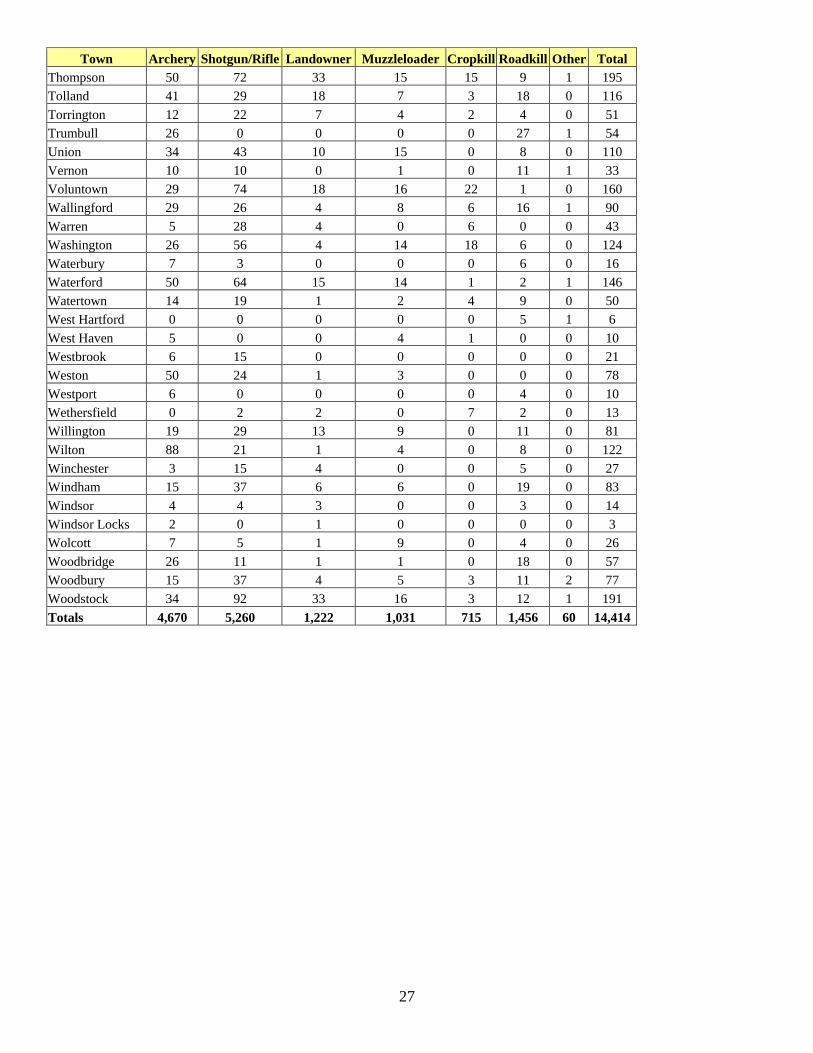
Appendix 1. Total deer harvest and reported roadkilled deer by town, 2010.
Town Archery Shotgun/Rifle Landowner Muzzleloader Cropkill Roadkill Other Total Andover 30 31 10 6 0 4 0 81 Ansonia 16 10 0 2 0 1 0 29 Ashford 34 113 34 21 1 8 0 211 Avon 9 16 1 1 0 11 0 38 Barkhamsted 8 7 7 6 0 3 0 31 Beacon Falls 6 30 3 7 1 3 0 50 Berlin 28 35 5 8 5 2 0 83 Bethany 29 19 4 7 0 2 0 61 Bethel 40 28 3 7 1 2 0 81 Bethlehem 11 17 2 3 6 1 0 40 Bloomfield 32 12 2 9 0 6 0 61 Bolton 12 23 5 7 9 19 1 76 Bozrah 11 32 16 2 4 7 0 72 Branford 7 6 0 3 4 2 0 22 Bridgeport 1 0 0 0 0 0 0 1 Bridgewater 13 51 3 3 1 0 0 71 Bristol 4 5 0 0 0 2 1 12 Brookfield 120 10 0 1 1 12 0 144 Brooklyn 21 47 23 11 4 13 0 119 Burlington 24 25 0 3 0 12 0 64 Canaan 21 37 5 11 7 8 0 89 Canterbury 29 45 33 8 0 11 0 126 Canton 18 21 4 1 1 10 0 55 Chaplin 15 49 9 11 1 5 0 90 Cheshire 38 33 3 7 23 16 0 120 Chester 13 17 0 5 0 1 0 36 Clinton 10 15 1 1 1 0 0 28 Colchester 24 85 26 17 7 40 0 199 Colebrook 5 6 6 2 0 1 0 20 Columbia 15 46 17 5 21 12 0 116 Cornwall 25 51 7 6 0 5 0 94 Coventry 51 111 11 17 6 21 1 218 Cromwell 3 5 3 1 5 1 0 18 Danbury 70 20 0 5 0 16 1 112 Darien 49 4 0 0 0 8 3 64 Deep River 6 11 4 1 4 0 0 26 Derby 5 2 0 0 0 0 0 7 Durham 23 47 1 7 4 0 0 82 East Granby 6 12 0 5 0 4 0 27 East Haddam 54 121 41 20 2 12 0 250 East Hampton 25 71 9 13 3 9 0 130 East Hartford 3 4 0 0 7 4 1 19 East Haven 13 2 0 0 0 0 0 15 East Lyme 21 55 3 10 0 18 1 108 East Windsor 19 20 6 3 0 6 1 55 Eastford 17 64 6 12 1 4 0 104
25
Town Archery Shotgun/Rifle Landowner Muzzleloader Cropkill Roadkill Other Total Easton 88 58 3 2 7 23 3 184 Ellington 19 24 13 1 0 9 2 68 Enfield 25 28 3 6 0 19 0 81 Essex 5 11 0 3 0 1 0 20 Fairfield 75 9 0 7 2 26 7 126 Farmington 7 6 0 2 5 10 1 31 Franklin 21 46 11 12 2 6 0 98 Glastonbury 40 49 11 11 29 32 3 175 Goshen 11 32 11 0 3 4 0 61 Granby 6 13 6 4 0 6 0 35 Greenwich 102 2 0 3 0 0 0 107 Griswold 18 60 24 16 19 3 0 140 Groton 21 9 4 1 4 10 0 49 Guilford 39 34 10 5 8 15 0 111 Haddam 50 75 17 14 0 2 0 158 Hamden 16 13 1 2 23 2 0 57 Hampton 30 65 26 13 4 9 0 147 Hartford 0 0 0 0 0 3 0 3 Hartland 2 16 1 4 0 0 0 23 Harwinton 21 35 10 2 13 10 0 91 Hebron 40 56 18 11 5 23 0 153 Kent 13 67 10 5 8 9 0 112 Killingly 20 53 31 11 1 34 1 151 Killingworth 42 51 10 10 0 0 0 113 Lebanon 32 110 44 26 31 16 0 259 Ledyard 27 42 8 5 4 24 0 110 Lisbon 4 30 21 6 1 4 0 66 Litchfield 30 73 21 17 3 21 0 165 Lyme 37 87 17 22 3 0 0 166 Madison 14 12 3 3 0 7 0 39 Manchester 19 4 0 2 0 8 1 34 Mansfield 41 64 17 9 3 33 0 167 Marlborough 19 33 14 19 0 24 0 109 Meriden 12 7 0 0 1 11 0 31 Middlebury 14 7 2 2 1 5 0 31 Middlefield 13 31 6 3 21 1 0 75 Middletown 48 64 10 2 3 5 1 133 Milford 11 1 0 0 5 6 0 23 Monroe 47 19 2 4 4 0 0 76 Montville 18 41 10 20 5 28 1 123 Morris 16 28 5 8 7 6 0 70 Naugatuck 17 24 1 1 0 0 1 44 New Britain 0 0 0 0 0 0 0 0 New Canaan 86 1 0 1 0 26 3 117 New Fairfield 26 23 2 8 0 11 1 71 New Hartford 22 40 5 6 0 11 0 84 New Haven 5 0 0 0 0 2 0 7
26
Town Archery Shotgun/Rifle Landowner Muzzleloader Cropkill Roadkill Other Total New London 0 1 0 0 0 1 0 2 New Milford 52 67 11 16 21 2 0 169 Newington 1 1 0 0 0 1 0 3 Newtown 181 117 4 16 22 12 0 352 Norfolk 8 20 6 6 0 2 0 42 North Branford 98 6 0 0 3 13 0 120 North Canaan 9 13 3 5 0 4 0 34 North Haven 19 5 0 1 0 5 0 30 North Stonington 38 70 20 9 6 6 0 149 Norwalk 19 1 1 0 0 3 0 24 Norwich 18 46 5 4 0 10 1 84 Old Lyme 32 28 1 9 0 10 0 80 Old Saybrook 8 6 0 1 0 4 0 19 Orange 47 3 0 0 0 5 0 55 Oxford 26 35 7 7 11 17 0 103 Plainfield 46 64 24 3 4 14 0 155 Plainville 6 2 0 1 0 0 0 9 Plymouth 9 16 6 2 0 6 0 39 Pomfret 48 88 17 19 10 11 2 195 Portland 21 42 2 12 9 17 0 103 Preston 26 45 16 6 17 3 0 113 Prospect 17 10 0 5 0 9 0 41 Putnam 11 19 8 6 0 17 0 61 Redding 183 66 2 7 29 14 0 301 Ridgefield 236 24 0 11 0 72 10 353 Rocky Hill 4 7 0 0 5 0 0 16 Roxbury 16 37 4 2 8 6 0 73 Salem 11 37 11 8 0 7 0 74 Salisbury 80 95 14 31 18 14 0 252 Scotland 22 52 19 7 4 4 0 108 Seymour 28 11 1 2 0 4 0 46 Sharon 61 102 12 20 3 8 0 206 Shelton 42 11 2 3 49 14 0 121 Sherman 22 51 3 9 3 4 0 92 Simsbury 9 8 1 0 0 2 0 20 Somers 23 20 5 10 0 9 1 68 South Windsor 9 13 3 5 3 1 1 35 Southbury 27 20 4 4 10 24 0 89 Southington 36 17 0 4 11 13 1 82 Sprague 14 29 7 8 4 1 0 63 Stafford 61 63 52 12 1 9 0 198 Stamford 45 2 0 1 0 1 0 49 Sterling 6 39 31 2 9 0 0 87 Stonington 46 45 7 13 6 27 0 144 Stratford 3 3 0 0 0 2 0 8 Suffield 17 34 6 7 0 1 0 65 Thomaston 13 7 2 0 3 1 0 26
27
Town Archery Shotgun/Rifle Landowner Muzzleloader Cropkill Roadkill Other Total Thompson 50 72 33 15 15 9 1 195 Tolland 41 29 18 7 3 18 0 116 Torrington 12 22 7 4 2 4 0 51 Trumbull 26 0 0 0 0 27 1 54 Union 34 43 10 15 0 8 0 110 Vernon 10 10 0 1 0 11 1 33 Voluntown 29 74 18 16 22 1 0 160 Wallingford 29 26 4 8 6 16 1 90 Warren 5 28 4 0 6 0 0 43 Washington 26 56 4 14 18 6 0 124 Waterbury 7 3 0 0 0 6 0 16 Waterford 50 64 15 14 1 2 1 146 Watertown 14 19 1 2 4 9 0 50 West Hartford 0 0 0 0 0 5 1 6 West Haven 5 0 0 4 1 0 0 10 Westbrook 6 15 0 0 0 0 0 21 Weston 50 24 1 3 0 0 0 78 Westport 6 0 0 0 0 4 0 10 Wethersfield 0 2 2 0 7 2 0 13 Willington 19 29 13 9 0 11 0 81 Wilton 88 21 1 4 0 8 0 122 Winchester 3 15 4 0 0 5 0 27 Windham 15 37 6 6 0 19 0 83 Windsor 4 4 3 0 0 3 0 14 Windsor Locks 2 0 1 0 0 0 0 3 Wolcott 7 5 1 9 0 4 0 26 Woodbridge 26 11 1 1 0 18 0 57 Woodbury 15 37 4 5 3 11 2 77 Woodstock 34 92 33 16 3 12 1 191 Totals 4,670 5,260 1,222 1,031 715 1,456 60 14,414
28
Appendix 2. Percent of yearling bucks harvested by antler point category, 1986-2010.
Year Sample Size Number of Antler Points on Yearling Bucks 1 2 3 4 5 6 7 8 9 10
1986 373 0.8 39.7 13.7 24.4 8.8 8.3 1.6 2.1 0.3 0.3 1987 463 0.2 45.4 14.9 19.7 7.6 8.4 1.5 2.2 0.2 0.0 1988 735 2.3 54.6 11.6 15.5 7.6 5.6 0.7 1.6 0.3 0.3 1989 607 0.8 55.4 14.2 14.8 6.3 4.9 1.3 2.0 0.3 0.0 1990 485 0.4 49.3 14.8 20.4 6.2 5.8 1.0 1.0 0.6 0.4 1991 579 0.0 46.8 14.3 22.1 6.4 7.6 1.0 1.6 0.2 0.0 1992 342 0.3 38.3 13.7 23.4 9.1 10.2 2.6 2.0 0.3 0.0 1993 370 0.3 62.7 14.3 11.9 3.5 4.3 1.6 1.1 0.3 0.0 1994 328 0.6 43.9 14.3 19.8 8.8 9.1 1.5 1.5 0.3 0.0 1995 428 0.7 28.5 13.6 26.2 13.3 11.4 3.5 2.3 0.2 0.2 1996 524 0.8 47.9 13.4 19.5 8.2 7.4 1.5 1.1 0.2 0.0 1997 506 0.4 47.6 11.9 20.4 8.9 7.1 2.6 1.2 0.0 0.0
1998* 1999 564 0.4 31.2 13.8 28.2 10.5 10.1 2.8 3.0 0.0 0.0 2000 739 0.1 34.4 12.6 24.6 11.9 11.5 3.7 1.2 0.0 0.0 2001 573 0.9 55.0 11.3 18.7 6.5 5.9 0.9 0.9 0.0 0.0 2002 535 3.7 33.1 15.1 26.0 8.0 10.7 2.8 0.6 0.0 0.0 2003 499 0.2 32.0 17.0 25.0 11.6 9.2 3.0 1.4 0.2 0.0 2004 671 1.0 41.0 15.0 22.0 7.0 9.0 2.0 2.0 0.0 0.0 2005 603 3.4 43.1 15.3 20.7 7.6 7.3 1.1 1.9 0.2 0.2 2006 528 2.3 46.2 17.2 17.8 6.8 7.2 2.1 0.4 0.0 0.0 2007 475 4.0 43.2 12.2 21.5 8.4 6.1 2.3 1.3 0.5 0.5 2008 473 1.9 35.3 14.6 21.8 10.1 10.4 3.0 1.9 0.6 0.4 2009 409 3.2 49.1 14.9 17.6 5.6 7.1 1.5 1.0 0.0 0.0 2010 291 0.0 35.7 15.8 22.3 9.3 12.0 3.1 2.4 0.3 0.0
Average 504 1.2 43.3 14.1 21.0 8.3 8.2 2.0 1.6 0.2 0.1 * No data collected in 1998.
Appendix 3. Mean number of antler points of yearling males by deer management zone, 1999-2010.
1 2 3 4 4A 4B 5 6 7 8 9 10 11 12 1999 3.7 3.5 3.8 3.9 3.8 4 3.3 4.3 3.9 4 3 3.8 2000 3.7 3.7 3.6 3.5 4.1 4.2 3.6 2.9 3.6 3.1 3.2 3.2 2001 3.2 3.1 2.6 2.6 3 2.9 3.2 3.6 3 2.9 3.5 2.8 2002 4.0 4.5 3.0 4.0 5.0 3.5 3.8 3.0 3.5 4.0 4.0 4.0 2003 3.1 3.8 3.6 3.8 3.5 3.4 4 3.8 3.8 3.6 3.6 3.2 3.5 2004 3.2 3.1 3.6 3.6 3.3 3.6 3.2 3.1 3.5 3.4 3.7 3.3 3.0 2005 3.2 3.4 3.7 3.2 3.5 3.3 3.2 3.4 3.5 3.3 3.6 2.3 2.9 2006 2.8 2.7 3.1 2.7 2.9 3.0 3.1 3.4 3.9 3.4 3.5 3.3 3.2 2007 3.4 3.5 3.5 3.1 3.1 2.9 4.1 3.5 4.0 3.6 2.7 3.7 2.3 2008 3.3 5.4 4.1 3.2 3.5 3.4 3.9 3.6 3.1 3.6 3.2 4.1 3.1 2009 3.2 3.2 2.3 2.9 3.3 3.0 2.8 2.9 3.1 3.2 2.9 3.0 3.5 2010 3.2 3.9 3.4 3.9 3.6 3.6 3.6 4.0 3.4 3.5 3.8 4.0 4.0
29
Appendix 4. Sex ratios (male:female) of deer harvested during Connecticut's regulated hunting seasons, 2008-2010.
3-year Average
2008 2009 2010 (2007-2009) Males Per Female Season Males Females Males Females Males Females Males Females 2008 2009 2010
Archery State Land 257 210 431 331 386 267 312 249 1.2:1 1.3:1 1.5:1 Private Land 1,705 1,436 1,964 1,992 2,032 1,985 1625 1,564 1.2:1 1.0:1 1.0:1 Subtotal 1,962 1,646 2,395 2,323 2,418 2,252 1,937 1,813 1.2:1 1.0:1 1.1:1 Muzzleloader State Land 67 78 75 85 82 72 78 84 0.9:1 0.9:1 1.1:1 Private Land 225 320 266 483 332 535 270 342 0.7:1 0.6:1 0.6:1 Subtotal 292 398 341 568 414 607 348 427 0.7:1 0.6:1 0.7:1 Shotgun/Rifle 0 State Land A 468 258 396 160 446 244 464 218 1.8:1 2.5:1 2.5:1 State Land B 114 103 66 81 66 63 97 90 1.1:1 0.8:1 1.8:1 Private Land 3,424 2,581 2,494 1,885 2,632 1,799 3,075 2,156 1.3:1 1.3:1 1.1:1 Subtotal 4,006 2,942 2,956 2,126 3,144 2,106 3,636 2,464 1.4:1 1.4:1 1.4:1 Landowner 686 490 407 658 751 471 556 519 1.4:1 0.6:1 0.6:1 Total 6,946 5,476 6,099 5,675 6,727 5,436 6,477 5,223 1.3:1 1.1:1 1.1:1
Appendix 5. Deer harvested using crop damage permits in Connecticut's deer management zones, 1998-2010.
Year
Zone 1998 1999 2000 2001 2002 2003 2004 2005 2006 2007 2008 2009 2010 1 126 160 159 121 103 106 98 82 64 58 59 55 45 2 9 20 16 7 10 16 24 18 18 17 17 12 19 3 76 52 60 59 44 61 109 105 71 49 76 101 70 4 52 34 43 41 40
4A 17 9 25 14 21 21 6 4 4B 35 46 38 32 33 51 33 39 5 26 48 87 75 46 71 124 129 95 68 119 95 57 6 39 146 112 71 73 77 56 82 77 54 90 58 78 7 54 78 44 49 60 78 90 62 69 89 114 93 88 8 26 42 60 39 47 42 53 37 47 33 42 33 32 9 33 64 59 38 27 42 43 53 48 30 69 79 55
10 31 31 54 48 51 45 36 50 66 51 82 76 75 11 71 113 122 110 104 164 159 114 109 116 111 106 118 12 49 50 52 31 28 72 99 47 45 48 32 33 35
Total 592 838 868 689 633 826 946 842 755 667 883 780 715
30
Appendix 6. Non-hunting deer mortality reported in Connecticut, 1998-2010.
Cause of Death 1998 1999 2000 2001 2002 2003 2004 2005 2006 2007 2008 2009 2010 Road 2,263 2,674 3,101 3,038 2,434 2,778 2,620 2,667 2,029 1,967 2,190 1,902 1,456 Dog 2 6 9 12 6 11 2 3 3 4 3 1 1
Unknown 200 179 175 190 140 217 183 183 117 162 72 92 49 Illegal 5 10 14 21 13 5 6 2 3 1 9 3 10
Crop damage 592 838 868 689 633 831 946 842 755 667 883 780 715 Total 3,062 3,707 4,167 3,950 3,226 3,842 3,757 3,697 2,907 2,801 3,157 2,778 2,231
Non-hunting: Harvest
1:3.3 1:3.0 1:3.2 1:3.0 1:3.7 1:3.0 1:3.6 1:3.4 1:3.4 1:3.9 1:4.0 1:4.2 1:8.0
% Mortality* 23.7 25.7 24.4 25.7 19.6 23.3 21.7 22.6 19.3 20.2 20.0 19.1 11.1 % of Harvest 30.2 33.6 31.3 33.1 26.9 30.3 27.7 29.2 29.2 25.3 24.9 23.6 12.4
* Crop damage harvest is included under non-hunting mortality. Appendix 7. Frequency of deer road kills in each of Connecticut's deer management zones, a 5-year
comparison, 2006-2010.
Roadkills/Sq. Mile Five-year Habitat
Zone 2006 2007 2008 2009 2010 Total Zonal % (sq. miles) 2008 2009 2010 1 64 86 92 82 69 393 4.1 344.1 0.27 0.24 0.20 2 58 63 80 82 68 351 3.7 409.85 0.20 0.20 0.17 3 207 173 216 204 136 936 9.8 272.1 0.79 0.75 0.50
4A 83 92 113 85 64 437 4.6 213.1 0.53 0.40 0.30 4B 128 137 166 125 100 656 6.9 120.0 1.38 1.04 0.83 5 240 220 245 207 170 1,082 11.3 444.9 0.55 0.47 0.38 6 93 111 119 88 65 476 5.0 259.1 0.46 0.34 0.25 7 202 180 269 192 156 999 10.5 370.9 0.73 0.52 0.42 8 35 32 26 40 10 143 1.5 167.6 0.16 0.24 0.06 9 199 211 199 190 154 953 10.0 277.8 0.72 0.68 0.55
10 93 82 89 80 58 402 4.2 243.6 0.37 0.33 0.24 11 433 384 341 313 285 1,756 18.4 290.76 1.17 1.08 0.98 12 191 196 235 214 121 957 10.0 356.4 0.66 0.60 0.34
Total 2,026 1,967 2,190 1,902 1,456 9,541 100 3,770.2 0.58* 0.50* 0.39* * These numbers are averages, not totals.
Related Documents