LICENTIATE THESIS Blast Furnace Coke Properties and the Influence on Off-gas Dust Maria Lundgren

2010 Blast Furnace Coke Properties and the Influence on Off-gas Dust - Licentiate Thesis
Dec 24, 2015
Coke properties and its effect
Welcome message from author
This document is posted to help you gain knowledge. Please leave a comment to let me know what you think about it! Share it to your friends and learn new things together.
Transcript
LICENTIATE T H E S I S
Department of Chemical Engineering and GeosciencesDivision of Extractive Metallurgy
Blast Furnace Coke Properties and the Influence on Off-gas Dust
Maria Lundgren
ISSN: 1402-1757 ISBN 978-91-7439-102-2
Luleå University of Technology 2010
Maria Lundgren B
last Furnace Coke Properties and the Influence on O
ff-gas Dust
ISSN: 1402-1757 ISBN 978-91-7439-XXX-X Se i listan och fyll i siffror där kryssen är

Blast Furnace Coke Properties and the Influence on Off-gas Dust
Maria Lundgren
Licentiate Thesis
Luleå University of Technology Department of Chemical Engineering and Geosciences
Division of Extractive Metallurgy SE-97187 Luleå
Sweden
2010

Printed by Universitetstryckeriet, Luleå 2010
ISSN: 1402-1757 ISBN 978-91-7439-102-2
Luleå 2010
www.ltu.se
I
ABSTRACT
In blast furnace ironmaking, efforts are made to decrease the coke consumption mainly by increasing the pulverized coal injection rate. This will cause changes in in-furnace reduction conditions, burden distribution and demands on raw material strength, etc. In order to maintain stable operation and minimize material losses through the off-gas, it is important to understand fines generation and behaviour in the blast furnace.
The strength and reactivity of coke at high temperature, measured by the Coke Strength after Reaction (CSR) and Coke Reactivity Index (CRI), have been studied. Mechanisms of disintegration were evaluated using basket samples charged into the LKAB Experimental Blast Furnace (EBF) prior to quenching and dissection. Coke charged into basket samples was analysed with CSR/CRI tests and compared with treated coke from the blast furnace. Results from tumbling tests, chemical analyses of coarse and fine material, as well as Light Optical Microscope (LOM) studies of original and treated coke have been combined and evaluated. The results indicate a correlation between the ash composition and CSR values. Differences in the texture of the coke were determined with LOM, and a change in the coke texture during the CSR/CRI test conditions was found. The results suggest that the main reaction between coke and CO2 during the solution loss reaction took place in isotropic areas, which was especially pronounced in coke with a low CSR. Signs of degradation were apparent throughout the coke pieces that have undergone CSR/CRI testing, but were less observable in coke reacted in the blast furnace. The results indicate that the solution loss reaction was generally limited by the chemical reaction rate in the CSR/CRI test, while in the blast furnace the reaction was limited by the diffusion rate. Coke degradation was therefore mostly restricted to the coke surface in the blast furnace.
At a later EBF campaign, off-gas dust was sampled during operation with different iron-bearing materials. EBF process data were used to evaluate the relationship between off-gas dust amounts and furnace conditions. Characterization was focused on fines from coke and coal. The graphitization degree (Lc value) of coke
II
taken out of the EBF shaft and coke in flue dust was determined in order to trace the fines generation position. The results showed that flue dust, mainly <0.5 mm, was mechanically formed and created in the same manner for all investigated samples. Carbon-containing particles dominated in the fractions >0.075 mm and consisted mainly of coke particles originating from the shaft. Solution loss in the shaft had a negligible effect on coke degradation in the EBF and the coke particles which ended up in the flue dust were mainly derived from abrasion at low temperatures. Sludge consisted mainly of chemically formed spherical particles <1 m formed in the blast furnace high-temperature area and then precipitated from the ascending gas as the temperature decreased. The amount of alkali and SiO2 in sludge increased with higher pulverized coal injection rates and flame temperatures, which confirmed that submicron spherical particles in sludge originated from the high-temperature area around the raceway. Theoretical critical particle diameters of materials, which could be blown out with the off-gas, were estimated. Flow conditions in the top of the shaft as well as the properties of fine particles in terms of size and density are important when outflow of mechanical dust, such as flue dust, is concerned. Low off-gas temperatures, and thus lower off-gas velocities, are favourable for low flue dust amounts expelled from the blast furnace.
III
LIST OF PAPERS
This thesis is based on the following papers, which are given in Appendices I-III:
I. Maria Lundgren, Lena Sundqvist Ökvist and Bo Björkman: Coke Reactivity under Blast Furnace Conditions and in the CSR/CRI Test, Steel Research International, Vol. 80, No. 6, 2009, pages 396-401.
Co-authors have contributed in a supervisory capacity.
II. Ulrika Leimalm, Maria Lundgren, Lena Sundqvist Ökvist and Bo Björkman: Off-gas Dust in an Experimental Blast Furnace Part 1: Characterization of Flue Dust, Sludge and Shaft Fines, Submitted to ISIJ International.
M. Lundgren has in collaboration with U. Leimalm planned and carried out the experiments related to the EBF trial test. M. Lundgren has focused on the evaluation of results related to the carbon-containing materials. Other co-authors have contributed in a supervisory capacity.
III. Maria Lundgren, Ulrika Leimalm, Gunilla Hyllander, Lena Sundqvist Ökvist and Bo Björkman: Off-gas Dust in an Experimental Blast Furnace Part 2: Relation to Furnace Conditions, Submitted to ISIJ International.
M. Lundgren has in collaboration with U. Leimalm planned and carried out the experiments related to the EBF trial test. M. Lundgren has focused on the evaluation of results related to the carbon-containing materials and paid less attention to the iron-bearing materials. G. Hyllander contributed specific knowledge about the EBF process. Other co-authors have contributed in a supervisory capacity.

IV
V
ACKNOWLEDGEMENTS
First of all, I would like to express my gratitude to my supervisors, Professor Bo Björkman and Dr. Lena Sundqvist Ökvist, for all help and guidance during this work.
Financial support from the Swedish Energy Agency, SSAB in Luleå and Stiftelsen Axel Ax:son Johnsons Forskningsfond is gratefully acknowledged.
Thanks to all members of the Swedish Steel Producers’ Association (Jernkontoret) projects JK21057, Förbättrad hållfasthet hos koks vid höga temperaturer, and JK 21064, Minsta möjliga koksförbrukning i masugn, for discussions and valuable feedback. Special thanks go out to Dan Hedkvist and Per Lagerwall, SSAB, for guidance during the JK-project and to Gunilla Hyllander, LKAB, as co-author in Appendix III.
Special thanks to SSAB and LKAB for providing material, analyses, assistance during sampling etc. Your help and involvement is much appreciated. The personnel at SSAB in Luleå during my work at Koksverket and Råjärn are acknowledged. Thanks to LKAB for the excellent opportunity to carry out tests in the Experimental Blast Furnace.
Further thanks to friends and colleagues, former and present, at the department of Chemical Engineering and Geosciences at LTU, and especially at the Division of Extractive Metallurgy. I can’t name you all, you know who you are! Special thanks to Ulrika Leimalm for fruitful collaboration which in the end gave us the nickname “the owls”, I can’t imagine why!
Last, but not least, thanks to Mats for the support and help you have given me during this time. To my family and friends, thanks!

VI
VII
CONTENTS
1 INTRODUCTION...................................................................................................... 1 1.1 COKE ................................................................................................................. 1
1.1.1 Coke-making process..................................................................................... 2 1.2 OVERVIEW OF THE BLAST FURNACE PROCESS...................................... 3
1.2.1 Physical and temperature zones and some blast furnace reactions............... 4 1.2.2 Behaviour of alkali silicates in the blast furnace........................................... 7 1.2.3 Coke graphitization and Lc measurements..................................................... 8
1.3 COKE DEGRADATION ................................................................................. 10 1.3.1 Before charging and in the upper shaft ....................................................... 10 1.3.2 In the lower shaft down to the high-temperature zone................................. 11 1.3.3 In the high-temperature zone ....................................................................... 12 1.3.4 Influences on coke degradation with pulverized coal injection ................... 13
1.4 LOSSES TO OFF-GAS DUST ......................................................................... 14 2 AIM AND SCOPE.................................................................................................... 15 3 METHODS AND MATERIALS............................................................................. 17
3.1 CSR/CRI TEST ................................................................................................ 17 3.2 THE EXPERIMENTAL BLAST FURNACE .................................................. 18
3.2.1 EBF basket samples ..................................................................................... 18 3.2.2 EBF trial ...................................................................................................... 20
3.3 ANALYSIS METHODS .................................................................................. 22 4 RESULTS ................................................................................................................. 23
4.1 CSR/CRI TESTS AND EBF BASKET SAMPLES.......................................... 23 4.1.1 Coke ash composition .................................................................................. 23 4.1.2 Coke graphitization...................................................................................... 24 4.1.3 Solution loss................................................................................................. 25
4.2 EBF TRIAL ...................................................................................................... 28 4.2.1 Off-gas dust.................................................................................................. 28 4.2.2 Upper and lower shaft probe position ......................................................... 37
5 DISCUSSION ........................................................................................................... 40 6 CONCLUSIONS ...................................................................................................... 47 7 FUTURE WORK ..................................................................................................... 50 8 REFERENCES......................................................................................................... 51

1
1 INTRODUCTION
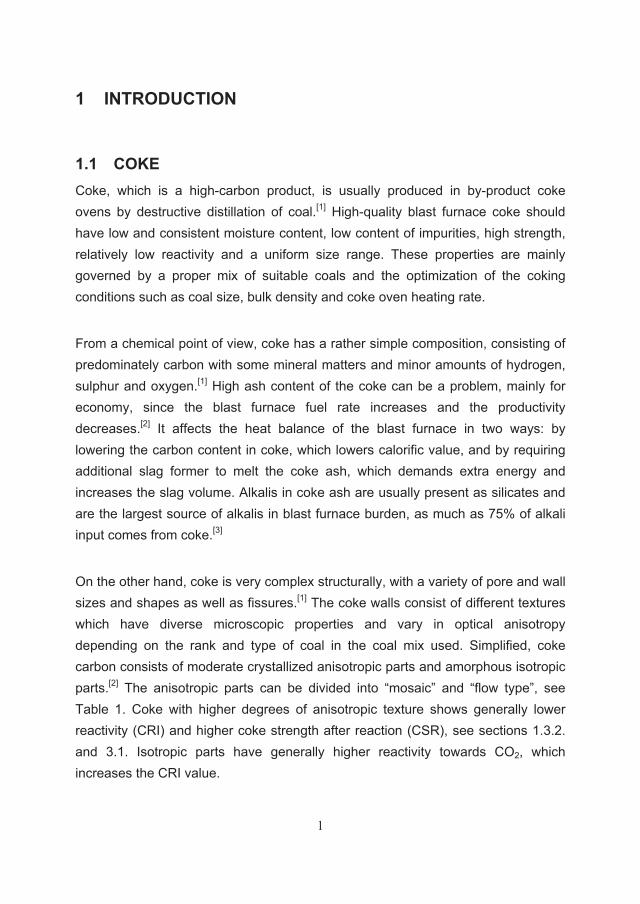
1.1 COKE Coke, which is a high-carbon product, is usually produced in by-product coke ovens by destructive distillation of coal.[1] High-quality blast furnace coke should have low and consistent moisture content, low content of impurities, high strength, relatively low reactivity and a uniform size range. These properties are mainly governed by a proper mix of suitable coals and the optimization of the coking conditions such as coal size, bulk density and coke oven heating rate.
From a chemical point of view, coke has a rather simple composition, consisting of predominately carbon with some mineral matters and minor amounts of hydrogen, sulphur and oxygen.[1] High ash content of the coke can be a problem, mainly for economy, since the blast furnace fuel rate increases and the productivity decreases.[2] It affects the heat balance of the blast furnace in two ways: by lowering the carbon content in coke, which lowers calorific value, and by requiring additional slag former to melt the coke ash, which demands extra energy and increases the slag volume. Alkalis in coke ash are usually present as silicates and are the largest source of alkalis in blast furnace burden, as much as 75% of alkali input comes from coke.[3]
On the other hand, coke is very complex structurally, with a variety of pore and wall sizes and shapes as well as fissures.[1] The coke walls consist of different textures which have diverse microscopic properties and vary in optical anisotropy depending on the rank and type of coal in the coal mix used. Simplified, coke carbon consists of moderate crystallized anisotropic parts and amorphous isotropic parts.[2] The anisotropic parts can be divided into “mosaic” and “flow type”, see Table 1. Coke with higher degrees of anisotropic texture shows generally lower reactivity (CRI) and higher coke strength after reaction (CSR), see sections 1.3.2. and 3.1. Isotropic parts have generally higher reactivity towards CO2, which increases the CRI value.
2
Table 1. Relationship between carbon texture and coke properties.[2] Coal Mechanical Resistance to Resistance to
texture Strength CO2 attack Alkali attack Isotropic Weak Weak Strong Mosaic Medium Strong Medium
Flow-type Strong Medium Weak
1.1.1 Coke-making process
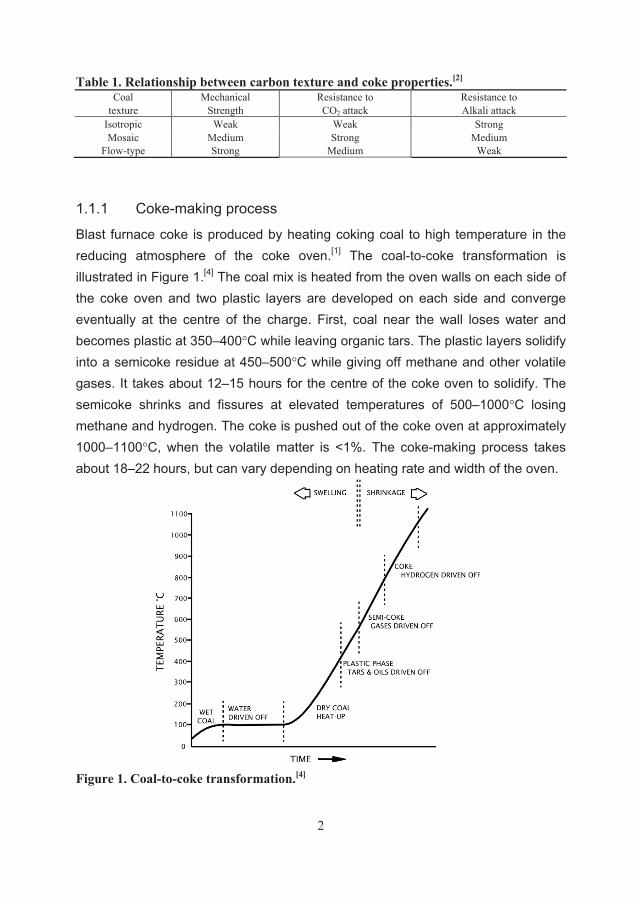
Blast furnace coke is produced by heating coking coal to high temperature in the reducing atmosphere of the coke oven.[1] The coal-to-coke transformation is illustrated in Figure 1.[4] The coal mix is heated from the oven walls on each side of the coke oven and two plastic layers are developed on each side and converge eventually at the centre of the charge. First, coal near the wall loses water and becomes plastic at 350–400°C while leaving organic tars. The plastic layers solidify into a semicoke residue at 450–500°C while giving off methane and other volatile gases. It takes about 12–15 hours for the centre of the coke oven to solidify. The semicoke shrinks and fissures at elevated temperatures of 500–1000°C losing methane and hydrogen. The coke is pushed out of the coke oven at approximately 1000–1100°C, when the volatile matter is <1%. The coke-making process takes about 18–22 hours, but can vary depending on heating rate and width of the oven.
Figure 1. Coal-to-coke transformation.[4]
3
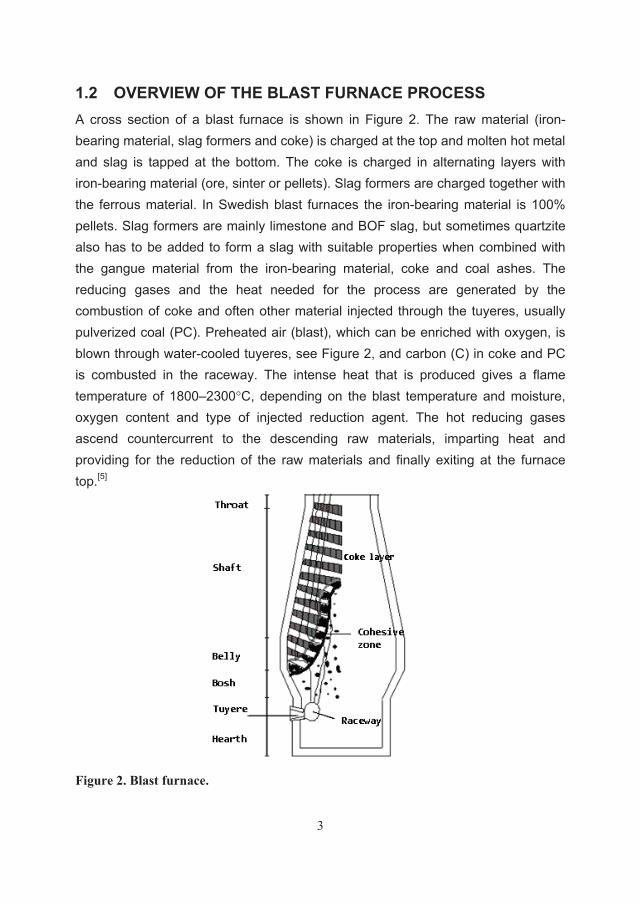
1.2 OVERVIEW OF THE BLAST FURNACE PROCESS A cross section of a blast furnace is shown in Figure 2. The raw material (iron-bearing material, slag formers and coke) is charged at the top and molten hot metal and slag is tapped at the bottom. The coke is charged in alternating layers with iron-bearing material (ore, sinter or pellets). Slag formers are charged together with the ferrous material. In Swedish blast furnaces the iron-bearing material is 100% pellets. Slag formers are mainly limestone and BOF slag, but sometimes quartzite also has to be added to form a slag with suitable properties when combined with the gangue material from the iron-bearing material, coke and coal ashes. The reducing gases and the heat needed for the process are generated by the combustion of coke and often other material injected through the tuyeres, usually pulverized coal (PC). Preheated air (blast), which can be enriched with oxygen, is blown through water-cooled tuyeres, see Figure 2, and carbon (C) in coke and PC is combusted in the raceway. The intense heat that is produced gives a flame temperature of 1800–2300°C, depending on the blast temperature and moisture, oxygen content and type of injected reduction agent. The hot reducing gases ascend countercurrent to the descending raw materials, imparting heat and providing for the reduction of the raw materials and finally exiting at the furnace top.[5]
Figure 2. Blast furnace.
4
1.2.1 Physical and temperature zones and some blast furnace reactions
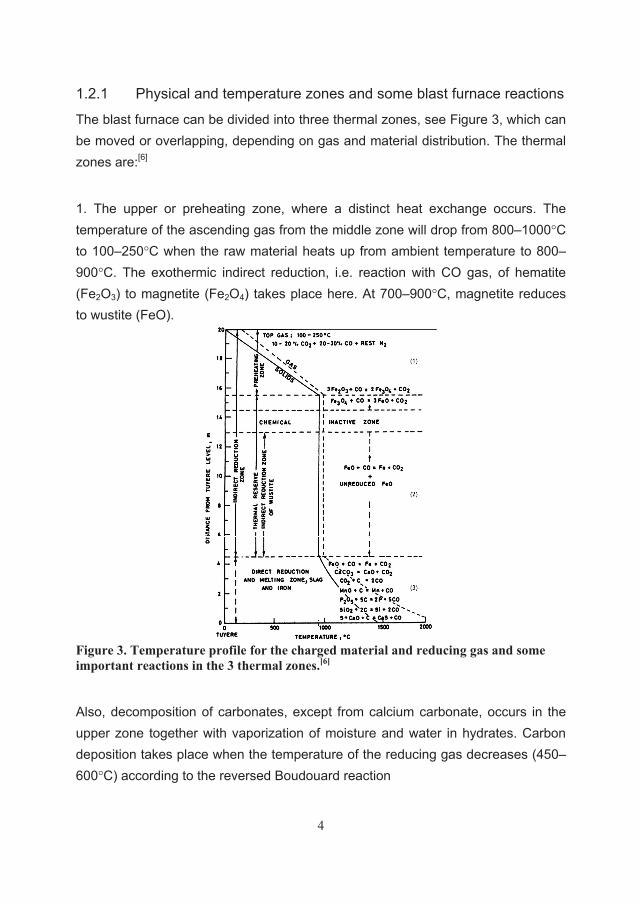
The blast furnace can be divided into three thermal zones, see Figure 3, which can be moved or overlapping, depending on gas and material distribution. The thermal zones are:[6]
1. The upper or preheating zone, where a distinct heat exchange occurs. The temperature of the ascending gas from the middle zone will drop from 800–1000°C to 100–250°C when the raw material heats up from ambient temperature to 800–900°C. The exothermic indirect reduction, i.e. reaction with CO gas, of hematite (Fe2O3) to magnetite (Fe2O4) takes place here. At 700–900°C, magnetite reduces to wustite (FeO).
Figure 3. Temperature profile for the charged material and reducing gas and some important reactions in the 3 thermal zones.[6]
Also, decomposition of carbonates, except from calcium carbonate, occurs in the upper zone together with vaporization of moisture and water in hydrates. Carbon deposition takes place when the temperature of the reducing gas decreases (450–600°C) according to the reversed Boudouard reaction
5
2 CO (g) C + CO2 (g) (1)
The coke in the physical, so-called lumpy zone, which extends from stock line down to the cohesive zone[5], is relatively inert in the upper, preheating zone.[7] The coke is heated up, loses moisture and most of its volatile matter.
2. In the middle zone, or the thermal reserve zone, the thermal balance of the gas is approximately the same as the charged material and virtually no heat exchange occurs.[6] It takes up about 50% of the blast furnace height and is important, as indirect reduction of wustite to metallic iron occurs at temperatures around 800–1000°C. The temperature is linked to the first carbon gasification reaction, i.e. the endothermic Boudouard reaction or solution loss reaction
C + CO2 (g) 2 CO (g) (2)
which starts to occur in the thermal reserve zone as the threshold temperature is about 950–960°C.[7],[8] Solution loss can also occur with H2O gas and produce H2
and CO gas.
The water-gas shift reaction, where hydrogen gas is generated, is another important reaction.[6] This reaction can also take place in the upper zone
CO (g) + H2O (g) CO2 (g) + H2 (g) (3)
Hydrogen gas, which is a more effective reductant than CO, comes from moist blast air, volatile matter in PC and steam, which can be used as blast additive.
3. In the lower zone, or melting zone, the temperature of the molten materials reaches 1400–1450°C and the ascending gas is lowered from the flame temperature of 1800–2300°C down to 800–1000°C, reaching the thermal reserve zone. Strongly endothermic reactions take place and the area is also called the direct reduction zone, since oxide material reacts directly with C and forms CO gas. Examples of these reactions are listed in Figure 3. The zone reaches from the bottom of the hearth and up above tuyere level. Remaining wustite reacts with C
FeO + C Fe + CO (g) (4)
6
Calcination of limestone also takes place here according to
CaCO3 CaO + CO2 (g) (5)
The calcination also depends on pressure, which means that some calcination of limestone can occur in the thermal reserve zone.
In the cohesive zone of the blast furnace, see Figure 2, the ore has softened and the coke layers provide permeable “coke windows” for passing of the gas.[5] Below the cohesive zone the reduced ore starts to melt and drips down. The active coke zone, bounded by the cohesive zone, raceway and deadman, consists of loosely packed coke feeding the raceway or moves towards the deadman. Droplets of iron and slag descend towards the hearth. The raceway is a semi-void region with rapidly moving coke being combusted – the periphery is determined by the energy of momentum of the blast.
In the raceway, C in coke is combusted together with C [6] from injected material such as oil or PC
C + O2 (air) (g) + N2 (g) CO2 (g) + N2 (g) (6)
N2 is inert but carries heat which is released during the ascending of the gas. O2 is consumed and CO2, which is unstable at temperatures above 1000°C in the presence of carbon, reacts further in the raceway with C in char (unburned injected PC which has undergone pyrolysis) or coke, and CO gas is formed by the endothermic Boudoard, or solution loss, reaction (2).
Carbonization of iron occurs mainly in the melting zone, where iron droplets are wetting the coke and in the hearth where the final carbonization takes place according to [6]
3 Fe + C Fe3C (7)
The last physical zone of the blast furnace is the stagnant coke zone (hearth and deadman), which is an area of densely packed coke where iron and slag drip down and collects in the hearth.[5] The deadman is the central zone of coke not directly
7
feeding coke to the raceway and the remaining boundaries are the underside of the raceway and the furnace walls.
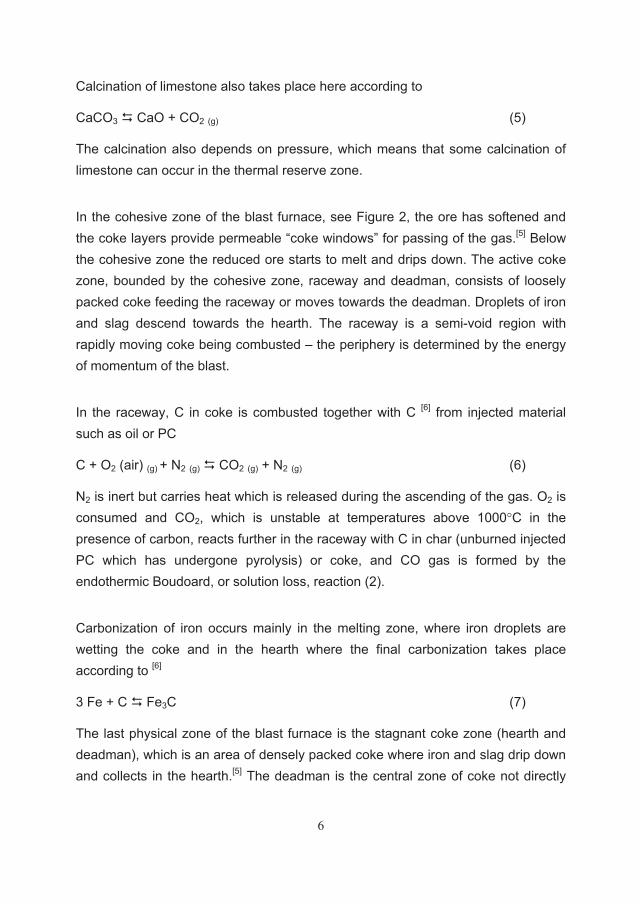
1.2.2 Behaviour of alkali silicates in the blast furnace
Alkali input, see Figure 4, to the blast furnace is as complex silicates in the iron-bearing material, coke and slag-forming material.[9],[10] Alkali is detrimental to the blast furnace operation, as it catalyzes the solution loss reaction (2) and decreases the coke strength in the lower part of the blast furnace. Alkali condenses on the lining, forming scaffolds, which affects the burden decent and reduces the lining life, since it attacks the Al2O3-SiO2 refractory.[3] Alkali leaves the furnace by slag, as off-gas dust and some is absorbed by refractory lining.[10] The rest of the alkali is circulated within the furnace. The alkali leaving with the slag is preferable, since all other routes cause problems in varying ways. This recirculation of alkali results in an increase of alkali concentration in the lower part of the furnace. The alkali silicates do not decompose until reaching the high-temperature area, producing alkali vapour, mostly potassium.[10] The gas leaving the tuyere zone can react with K vapour and form KCN vapour, which condenses below 1625°C. In the upper part of the shaft; K and KCN are oxidized to K2CO3, which is a solid below 1000°C.
Figure 4. Alkali behaviour in the blast furnace. Solid lines=solids, Broken lines=gas flows and cross-hatched areas=scaffolds.[9]
8
In addition, SiO gas is produced when alkali silicates in coke are degassed [2]
SiO2 (coke ash) + C SiO (g) + CO (g) (8)
or
SiO2 (coke ash) + CO (g) SiO (g) + CO2 (g) (9)
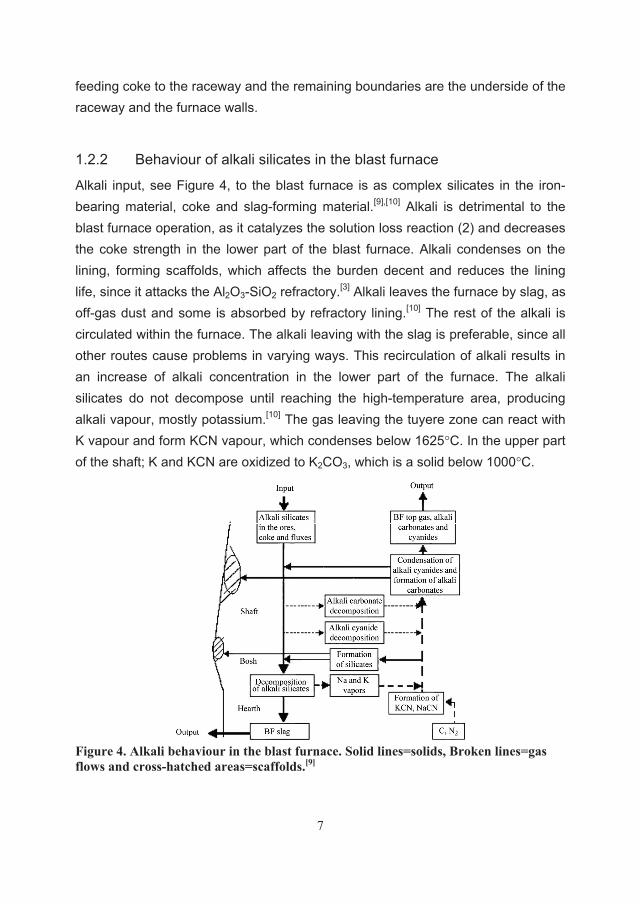
Turkdogan et al.[11] concluded that SiO gas is generated by combustion of coke in the raceway. The results showed that equilibrium phases for coke Si in the raceway are SiC and SiO gas. Si in molten iron tends to increase with higher PCI operation.[12] In Figure 5 some transfer routes and inputs of Si to the liquid iron are shown. Even though the input of Si is higher from iron ore, earlier studies have shown that the SiO gas generation is much higher from SiO2 in coke than from SiO2 from slag. Different studies have shown as much as 10 to 40 times larger SiO generation from coke ash. Matsui et al.[12] studied the SiO gas generation from pulverized coal char samples and the reaction rate was deduced. It was concluded that the reaction rate of PC char is 3 times as much as that of coke, due to the larger surface area of char.
Figure 5. Route of Si and input to the liquid iron at PCR of 200kg/tHM.[12]
1.2.3 Coke graphitization and Lc measurements
A way to investigate which temperature coal or coke has been subjected to in the blast furnace is the degree of graphitization. Normally, coke, coal and char are relatively amorphous, non-graphitic sources of carbon. A higher degree of carbonization during coking produces a more crystal coke structure i.e. higher
9
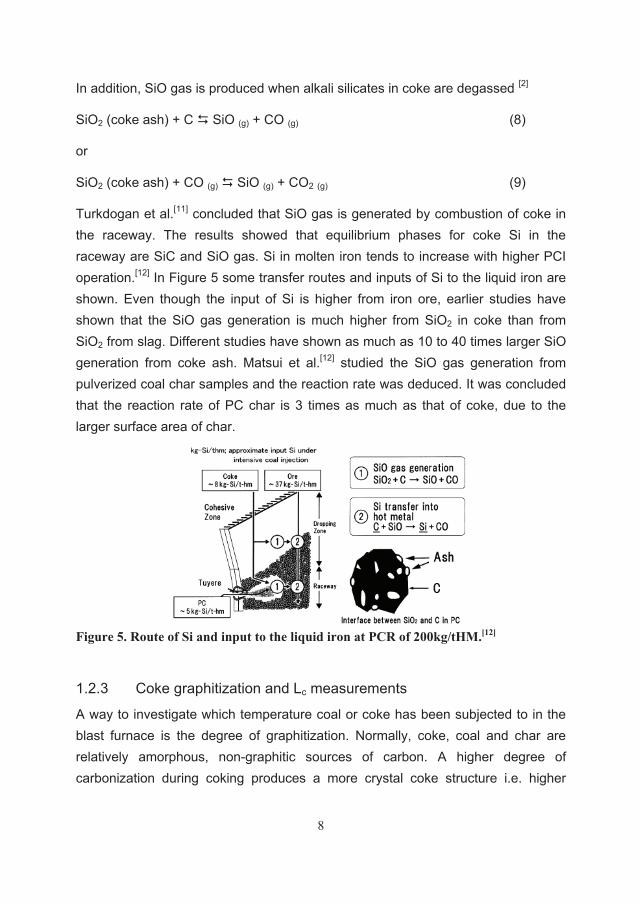
graphitization degree. The graphite structure is shown in Figure 6 [13] and consists of large sections of ordered carbon known as crystallites.[14] The highly ordered graphite structure can be described on the basis of the parameters Lc and La, which define the level of crystallinity. Lc represents the average height of the crystallite and La is the average length. Lc of graphite can be in the order of 100–300 Å.[14] Crystalline carbon in coal and coke can be considered to have a graphite type of structure, where the aromatic structures can align in a similar manner as graphite layers. The crystallites are less ordered over a shorter distance; about 2–30 Å.
Figure 6. Crystal structure of graphite.[13]
Lc is calculated using Scherrer’s equation on X-Ray diffraction (XRD) measurements at the 002 carbon peak[13],[14],[15][16]
θβλ
cos89.0=cL (10)
where is the wavelength of the X-ray source, is the Full Width at Half Maximum (FWHM) of the 002 carbon peak and is the position of the 002 carbon peak. A sharper 002 peak gives a higher Lc value and represents a higher degree of ordering in the carbon structure, and therefore a higher graphitization degree.
10
1.3 COKE DEGRADATION
1.3.1 Before charging and in the upper shaft
One of the most important parameters for good permeability in the blast furnace is coke size distribution.[3] Large coke particles in a narrow size range give the best permeability. Also, if the mean size of charged coke is large, the mean size at tuyere level is also relatively large due to better resistance to degradation by solution loss with a smaller specific surface area. However, in a blast furnace operated with 100% pellets the coke size must be chosen to avoid pellets mixing in the coke layers. Coke degradation before charging, i.e. from the stock house to the stock line in the blast furnace is caused by shattering.[8] The coke suffers mechanical breakage under transport from the coking plant to the stock house and when charged to the blast furnace. The number and height of the drops contributes to stabilizing the coke, i.e. fissures in coke will cause breakage into smaller coke particles. In the blast furnace shaft down to the area of the thermal reserve zone, the coke degradation is mainly caused by abrasion.
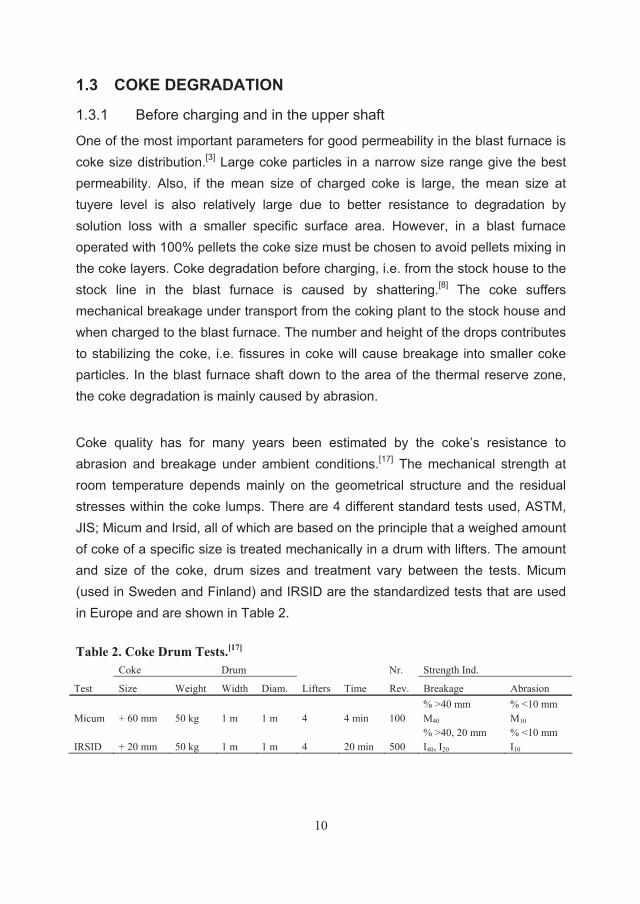
Coke quality has for many years been estimated by the coke’s resistance to abrasion and breakage under ambient conditions.[17] The mechanical strength at room temperature depends mainly on the geometrical structure and the residual stresses within the coke lumps. There are 4 different standard tests used, ASTM, JIS; Micum and Irsid, all of which are based on the principle that a weighed amount of coke of a specific size is treated mechanically in a drum with lifters. The amount and size of the coke, drum sizes and treatment vary between the tests. Micum (used in Sweden and Finland) and IRSID are the standardized tests that are used in Europe and are shown in Table 2.
Table 2. Coke Drum Tests.[17] Coke Drum Nr. Strength Ind.
Test Size Weight Width Diam. Lifters Time Rev. Breakage Abrasion
Micum + 60 mm 50 kg 1 m 1 m 4 4 min 100 % >40 mm M40
% <10 mm M10
IRSID + 20 mm 50 kg 1 m 1 m 4 20 min 500 % >40, 20 mm I40, I20
% <10 mm I10
11
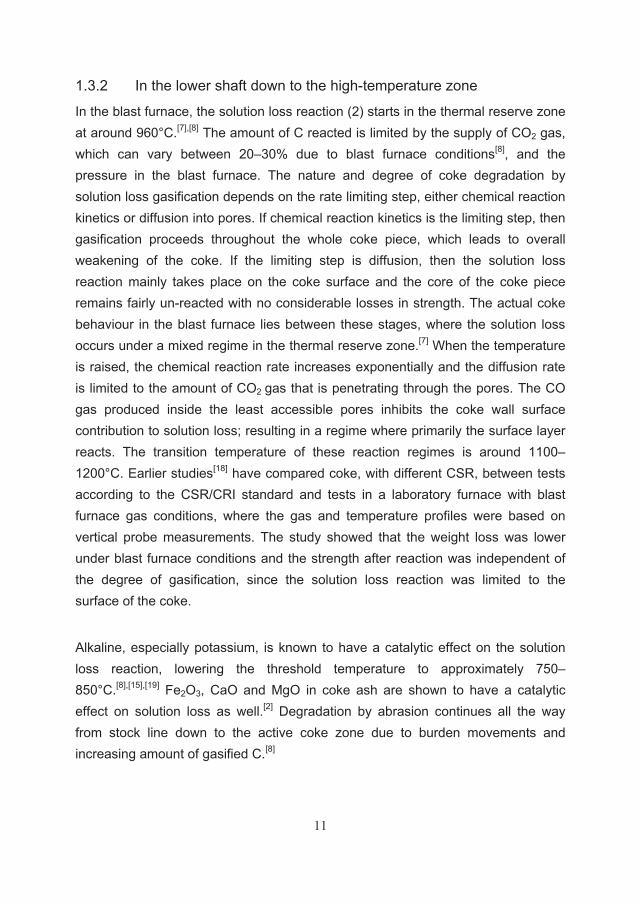
1.3.2 In the lower shaft down to the high-temperature zone
In the blast furnace, the solution loss reaction (2) starts in the thermal reserve zone at around 960°C.[7],[8] The amount of C reacted is limited by the supply of CO2 gas, which can vary between 20–30% due to blast furnace conditions[8], and the pressure in the blast furnace. The nature and degree of coke degradation by solution loss gasification depends on the rate limiting step, either chemical reaction kinetics or diffusion into pores. If chemical reaction kinetics is the limiting step, then gasification proceeds throughout the whole coke piece, which leads to overall weakening of the coke. If the limiting step is diffusion, then the solution loss reaction mainly takes place on the coke surface and the core of the coke piece remains fairly un-reacted with no considerable losses in strength. The actual coke behaviour in the blast furnace lies between these stages, where the solution loss occurs under a mixed regime in the thermal reserve zone.[7] When the temperature is raised, the chemical reaction rate increases exponentially and the diffusion rate is limited to the amount of CO2 gas that is penetrating through the pores. The CO gas produced inside the least accessible pores inhibits the coke wall surface contribution to solution loss; resulting in a regime where primarily the surface layer reacts. The transition temperature of these reaction regimes is around 1100–1200°C. Earlier studies[18] have compared coke, with different CSR, between tests according to the CSR/CRI standard and tests in a laboratory furnace with blast furnace gas conditions, where the gas and temperature profiles were based on vertical probe measurements. The study showed that the weight loss was lower under blast furnace conditions and the strength after reaction was independent of the degree of gasification, since the solution loss reaction was limited to the surface of the coke.
Alkaline, especially potassium, is known to have a catalytic effect on the solution loss reaction, lowering the threshold temperature to approximately 750–850°C.[8],[15],[19] Fe2O3, CaO and MgO in coke ash are shown to have a catalytic effect on solution loss as well.[2] Degradation by abrasion continues all the way from stock line down to the active coke zone due to burden movements and increasing amount of gasified C.[8]
12
The most widespread test for characterizing coke degradation potential in a blast furnace is the Nippon Steel Corporation (NSC) CSR/CRI test. This is a standardized test to determine the coke reactivity according to the endothermic solution loss reaction and the coke mechanical strength after reaction. CSR stands for Coke Strength after Reaction and CRI for Coke Reactivity Index. The test procedure is described in section 3.1.
1.3.3 In the high-temperature zone
At the blast furnace bosh to tuyere level, coke is exposed to alkali and liquid attack below the cohesive zone.[8] Alkali metal vapour reacts with coke ash to form silicate compounds. The liquid attack means the carbon in coke is reduced by the direct reduction reactions, the carbonization of liquid iron and ash reactions with slag, which makes the coke more porous. Graphitization of the coke takes place in the high-temperature zone, which reduces the abrasion resistance. Graphitization is catalysed by iron, and FeS in coke is believed to be more catalytic than metallic iron.
In the raceway, coke fines are produced by mechanical impact of rotating coke, thermal stress, combustion and solution loss reactions.[20] Fines originating from pulverized coal injection (PCI) consist of unburned char and soot.[20],[21] When PC is injected through the tuyeres, the coal particles will undergo rapid heating, release of volatile matter, gas phase combustion, char combustion and gasification. Coal devolatilization releases tar, which is believed to be a source of forming soot particles by direct dehydrogenation.[21] With increased pulverized coal injection rate (PCR) the combustion efficiency of PC decreases due to limited supply of oxygen, causing an outflow of char and soot from the raceway. Transmission electron microscopy studies showed that soot was observed as a submicron, spherical and carbon-rich particle and char particles appeared as porous, carbon-rich particles.[22] Primary soot particle diameters generated from coal were in the size range of 25–60 nm. Soot particles underwent agglomeration and were later fused into chains as large as 800 nm. Char particle sizes ranged from several microns up to the same diameter as the original PC particles.[23] Since the solution loss reaction promotes
13
char consumption, most of the char is consumed in the blast furnace.[20] Therefore, coke fines generated in the blast furnace at higher PCR may not be totally consumed when there is decreased combustion efficiency of PC at high injection rates.
1.3.4 Influences on coke degradation with pulverized coal injection
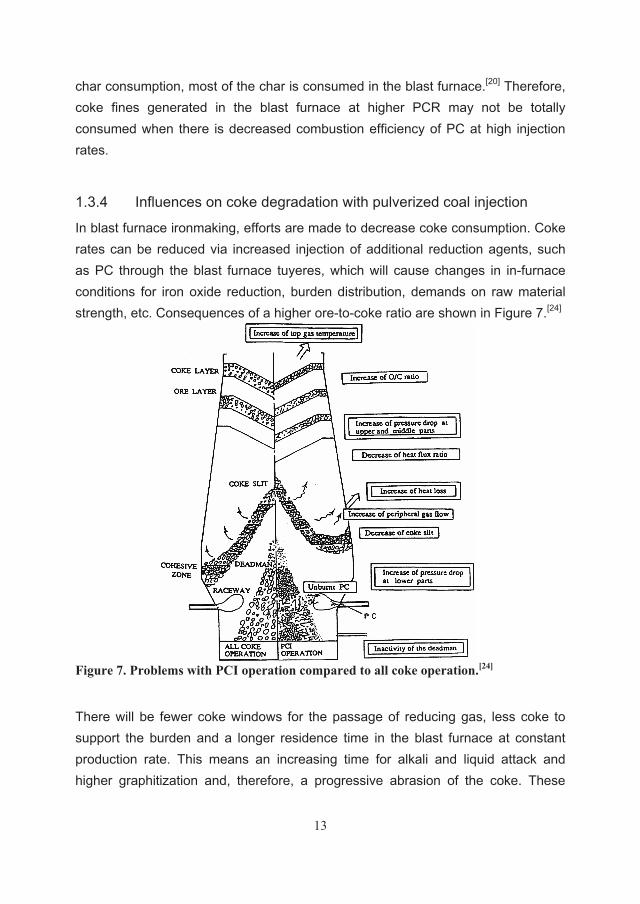
In blast furnace ironmaking, efforts are made to decrease coke consumption. Coke rates can be reduced via increased injection of additional reduction agents, such as PC through the blast furnace tuyeres, which will cause changes in in-furnace conditions for iron oxide reduction, burden distribution, demands on raw material strength, etc. Consequences of a higher ore-to-coke ratio are shown in Figure 7.[24]
Figure 7. Problems with PCI operation compared to all coke operation.[24]
There will be fewer coke windows for the passage of reducing gas, less coke to support the burden and a longer residence time in the blast furnace at constant production rate. This means an increasing time for alkali and liquid attack and higher graphitization and, therefore, a progressive abrasion of the coke. These
14
conditions are known to promote coke degradation and increase fines generation in the blast furnace. The amount of coke combusted in the raceway decreases, since nearly all oxygen is consumed by PC, which is described in 1.3.3. Coke fines are thereby accumulated in the deadman, reducing the permeability in the lower part of the blast furnace. PCI will also increase the gas volume and the kinetic energy, which promotes to coke fragmentation and abrasion of coke particles.
1.4 LOSSES TO OFF-GAS DUST Studies of flue dust from the top of the blast furnace have shown that the major components are iron oxides and coke fines.[25] The finest fractions of off-gas dust were observed to contain char particles and soot from coal injection.[21] Fe content in flue dust ranges from 20–40 wt.% and C content is observed between 30–50 wt.%.[25],[26],[27] Si, Ca, Mg and other minor elemental oxides are present in lesser amounts. Characterization of flue dust from an Egyptian iron and steel company showed that about 74 wt.% of the material was below a particle size of 210 m.[28] Chemical analysis showed that carbon was found in the coarser sizes above 210
m and iron in the finer sizes below 210 m. Determination of particle size of flue dust from an Iranian blast furnace showed that almost all of the material was in the size range <210 m.[29]
Studies by Wu et al.[30],[31] showed that increasing PCR causes an increase in losses of carbonaceous material as coke and unconsumed coal leave the blast furnace through the off-gas dust. The mass fraction of unconsumed coal in the blast furnace off-gas dust at a PCR of 170 kg/tHM was nearly 0, suggesting that produced char is consumed in the blast furnace. At PCR higher than 190 kg/tHM, the carbon mass fraction in sludge exceeds the amounts present in dust. With rising PCR, the percentage of coke in the dust decreases at the same time as the percentage of unconsumed coal increases. Unconsumed PC is mostly concentrated in sludge at high PCR. The results showed that parts of the generated dust originated from the raceway area as unconsumed coal and from the shaft as coke particles.
15
2 AIM AND SCOPE
The CSR/CRI test, as compared to the blast furnace, provides a more reactive environment, and therefore it is important to study the differences between coke behaviour in a real blast furnace environment and in the CSR/CRI test. The aim of this work is to study the high-temperature strength of coke by comparing cokes with different CSR values treated in the CSR/CRI test and under actual conditions in the blast furnace. The LKAB Experimental Blast Furnace (EBF) provides an excellent opportunity to study coke behaviour in the blast furnace. In addition, fines accumulation in the shaft decreases permeability and changes the gas flow, which possibly affects generation of dust. In order to maintain stable operation, but also to decrease material losses through off-gas, it is of interest to study fines generation and behaviour in the blast furnace. Off-gas dust generated in the EBF was sampled during operation with different iron-bearing materials. In this part of the work, characterization was focused on generation of fines from coke and coal. The knowledge from the initial study of coke behaviour in the EBF, such as high-temperature strength, graphitization and gasification characteristics, was used in the subsequent study. The accessibility to process data along with shaft material and off-gas dust provided opportunities to evaluate correlations between dust formation and furnace conditions.
16
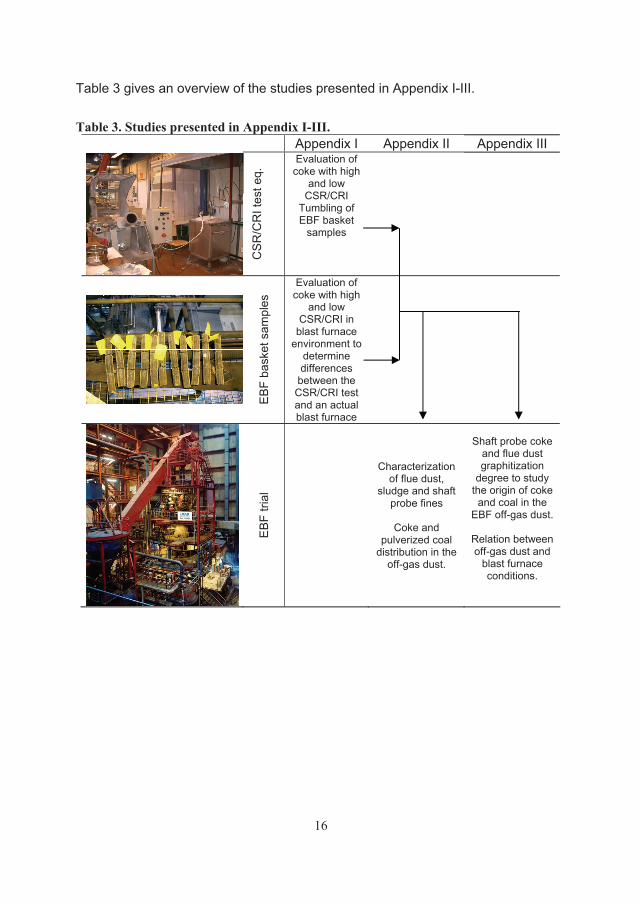
Table 3 gives an overview of the studies presented in Appendix I-III.
Table 3. Studies presented in Appendix I-III.
Appendix I Appendix II Appendix III
CS
R/C
RI t
est e
q.
Evaluation of coke with high
and low CSR/CRI
Tumbling of EBF basket
samples
EB
F ba
sket
sam
ples
Evaluation of coke with high
and low CSR/CRI in
blast furnace environment to
determine differences
between the CSR/CRI test and an actual blast furnace
EB
F tri
al
Characterization of flue dust,
sludge and shaft probe fines
Coke and
pulverized coal distribution in the
off-gas dust.
Shaft probe coke and flue dust graphitization
degree to study the origin of coke
and coal in the EBF off-gas dust.
Relation between off-gas dust and
blast furnace conditions.
17
3 METHODS AND MATERIALS
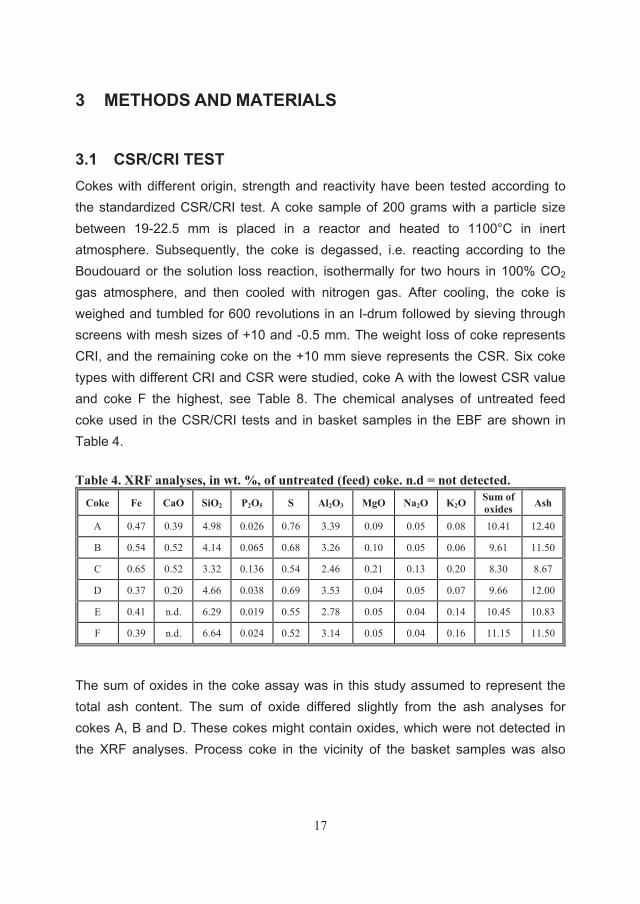
3.1 CSR/CRI TEST Cokes with different origin, strength and reactivity have been tested according to the standardized CSR/CRI test. A coke sample of 200 grams with a particle size between 19-22.5 mm is placed in a reactor and heated to 1100°C in inert atmosphere. Subsequently, the coke is degassed, i.e. reacting according to the Boudouard or the solution loss reaction, isothermally for two hours in 100% CO2
gas atmosphere, and then cooled with nitrogen gas. After cooling, the coke is weighed and tumbled for 600 revolutions in an I-drum followed by sieving through screens with mesh sizes of +10 and -0.5 mm. The weight loss of coke represents CRI, and the remaining coke on the +10 mm sieve represents the CSR. Six coke types with different CRI and CSR were studied, coke A with the lowest CSR value and coke F the highest, see Table 8. The chemical analyses of untreated feed coke used in the CSR/CRI tests and in basket samples in the EBF are shown in Table 4.
Table 4. XRF analyses, in wt. %, of untreated (feed) coke. n.d = not detected.
Coke Fe CaO SiO2 P2O5 S Al2O3 MgO Na2O K2O Sum of oxides Ash
A 0.47 0.39 4.98 0.026 0.76 3.39 0.09 0.05 0.08 10.41 12.40
B 0.54 0.52 4.14 0.065 0.68 3.26 0.10 0.05 0.06 9.61 11.50
C 0.65 0.52 3.32 0.136 0.54 2.46 0.21 0.13 0.20 8.30 8.67
D 0.37 0.20 4.66 0.038 0.69 3.53 0.04 0.05 0.07 9.66 12.00
E 0.41 n.d. 6.29 0.019 0.55 2.78 0.05 0.04 0.14 10.45 10.83
F 0.39 n.d. 6.64 0.024 0.52 3.14 0.05 0.04 0.16 11.15 11.50
The sum of oxides in the coke assay was in this study assumed to represent the total ash content. The sum of oxide differed slightly from the ash analyses for cokes A, B and D. These cokes might contain oxides, which were not detected in the XRF analyses. Process coke in the vicinity of the basket samples was also
18
collected and analysed. The coke had high CSR and low CRI and was production coke (10–30 mm) from SSAB in Luleå.
3.2 THE EXPERIMENTAL BLAST FURNACE The EBF at the LKAB ironmaking research centre has a working volume of 8.2 m3
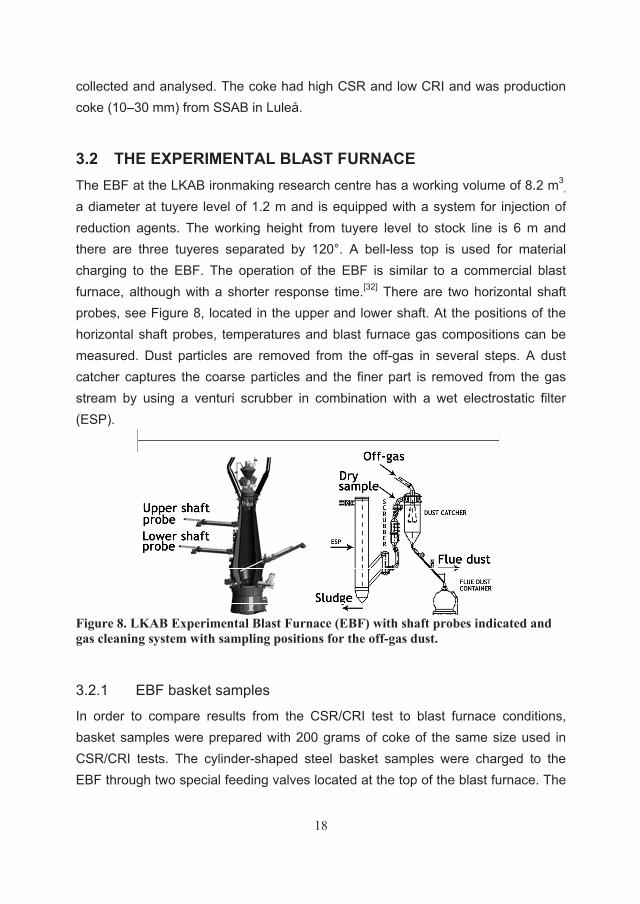
, a diameter at tuyere level of 1.2 m and is equipped with a system for injection of reduction agents. The working height from tuyere level to stock line is 6 m and there are three tuyeres separated by 120°. A bell-less top is used for material charging to the EBF. The operation of the EBF is similar to a commercial blast furnace, although with a shorter response time.[32] There are two horizontal shaft probes, see Figure 8, located in the upper and lower shaft. At the positions of the horizontal shaft probes, temperatures and blast furnace gas compositions can be measured. Dust particles are removed from the off-gas in several steps. A dust catcher captures the coarse particles and the finer part is removed from the gas stream by using a venturi scrubber in combination with a wet electrostatic filter (ESP).
Figure 8. LKAB Experimental Blast Furnace (EBF) with shaft probes indicated and gas cleaning system with sampling positions for the off-gas dust.
3.2.1 EBF basket samples
In order to compare results from the CSR/CRI test to blast furnace conditions, basket samples were prepared with 200 grams of coke of the same size used in CSR/CRI tests. The cylinder-shaped steel basket samples were charged to the EBF through two special feeding valves located at the top of the blast furnace. The
19
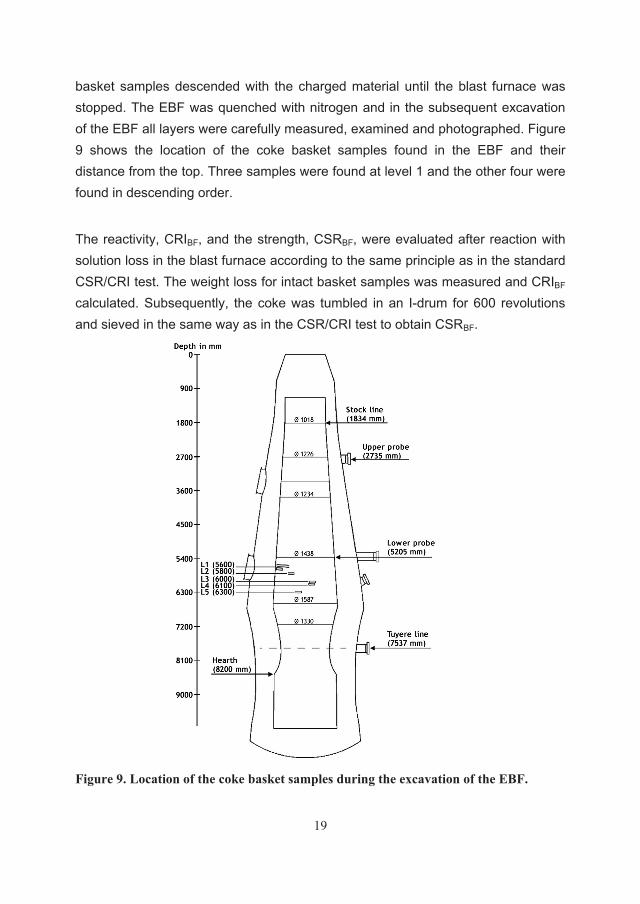
basket samples descended with the charged material until the blast furnace was stopped. The EBF was quenched with nitrogen and in the subsequent excavation of the EBF all layers were carefully measured, examined and photographed. Figure 9 shows the location of the coke basket samples found in the EBF and their distance from the top. Three samples were found at level 1 and the other four were found in descending order.
The reactivity, CRIBF, and the strength, CSRBF, were evaluated after reaction with solution loss in the blast furnace according to the same principle as in the standard CSR/CRI test. The weight loss for intact basket samples was measured and CRIBF calculated. Subsequently, the coke was tumbled in an I-drum for 600 revolutions and sieved in the same way as in the CSR/CRI test to obtain CSRBF.
Figure 9. Location of the coke basket samples during the excavation of the EBF.
20
3.2.2 EBF trial
Sampling of in-burden material and off-gas particles was carried out simultaneously during 8 test periods. Two types of commercial blast furnace pellets, olivine and acid pellets, and sinter were used as iron-bearing material. Coke with high CSR and low CRI in a 15–30 mm size fraction were, together with pulverized injection coal, used as reduction agents during the EBF campaign. The PC contained 21 wt.% volatile matters. BOF slag, quartzite and limestone in size fractions 10–20 mm were used as slag formers to obtain desired slag basicity and slag volume.
Coarse particles from the off-gas, termed flue dust, were sampled after the dust catcher and samples of fine parts, termed sludge, were collected after the wet gas cleaning steps. Sampling positions for the off-gas dust are shown in Figure 8. Flue dust was collected when sampling with the shaft probes was completed. Within that time span, the numbers of coke and iron-bearing material dumps were approximately the same. The flue dust was dry-sieved using 1, 0.5, 0.25, 0.125, 0.075, 0.063 and 0.045 mm squared sieves. Sludge was taken out in conjunction with the flue dust sampling, and then filtered and dried.
The material taken out with the horizontal shaft probes was divided into sub-samples. It was assumed that the sub-sample with the highest number was taken closest to the near wall. Generally, 3–4 sub-samples were generated for each in-burden horizontal probe during the investigated test periods.
3.2.2.1 Process data
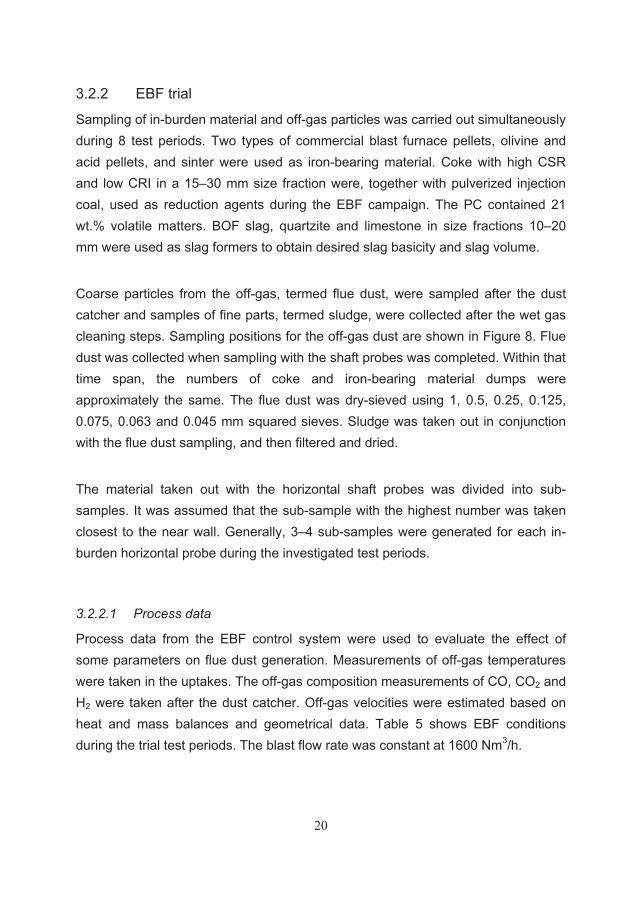
Process data from the EBF control system were used to evaluate the effect of some parameters on flue dust generation. Measurements of off-gas temperatures were taken in the uptakes. The off-gas composition measurements of CO, CO2 and H2 were taken after the dust catcher. Off-gas velocities were estimated based on heat and mass balances and geometrical data. Table 5 shows EBF conditions during the trial test periods. The blast flow rate was constant at 1600 Nm3/h.
21
Table 5. Overview of test conditions in EBF during a time period of 4 hours prior to off-gas dust and in-burden material sampling. Materials sampled in test periods 1, 3, 5 and 7 were analysed in more detail.
Test period
Iron-bearing material
PCR (kg/tHM)
Flame temp. (ºC)
Fuel rate (kg/tHM)
Limestone (kg/tHM)
Quartzite(kg/tHM)
BOF slag (kg/tHM)
Prod. rate (t/h)
Slag (kg/tHM)
Hot metal temp. (ºC)
1 156 2208 527 42 26 48 1.55 151 1454
2 152 2219 522 42 26 48 1.51 151 1437 3 147 2219 520 42 26 51 1.63 162 1417
4
Olivine pellets
153 2085 521 42 26 51 1.58 157 1426
5
70% acid
pellets &
139 2247 533 1.59 117 1445
6 30% sinter 133 2248 526 1.60 118 1442
7
30% acid
pellets &
136 2252 526 43 1.56 220 1432
8 70% sinter 133 2256 519 43 1.56 218 1442
3.2.2.2 Estimation of critical particle diameter
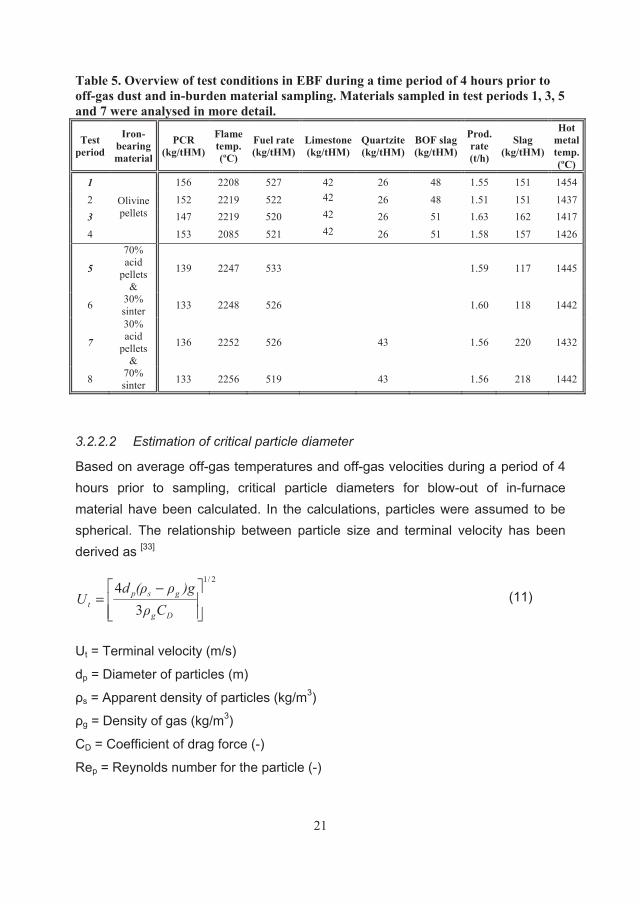
Based on average off-gas temperatures and off-gas velocities during a period of 4 hours prior to sampling, critical particle diameters for blow-out of in-furnace material have been calculated. In the calculations, particles were assumed to be spherical. The relationship between particle size and terminal velocity has been derived as [33]
2/1
34 −
=Dg
gspt C
)g(dU (11)
Ut = Terminal velocity (m/s)
dp = Diameter of particles (m)
s = Apparent density of particles (kg/m3)
g = Density of gas (kg/m3)
CD = Coefficient of drag force (-)
Rep = Reynolds number for the particle (-)
22
CD=24/Rep (Rep<0.4) (12)
CD=10/Rep1/2 0.4<Rep<500) (13)
CD=0.43 (500<Rep<200000) (14)
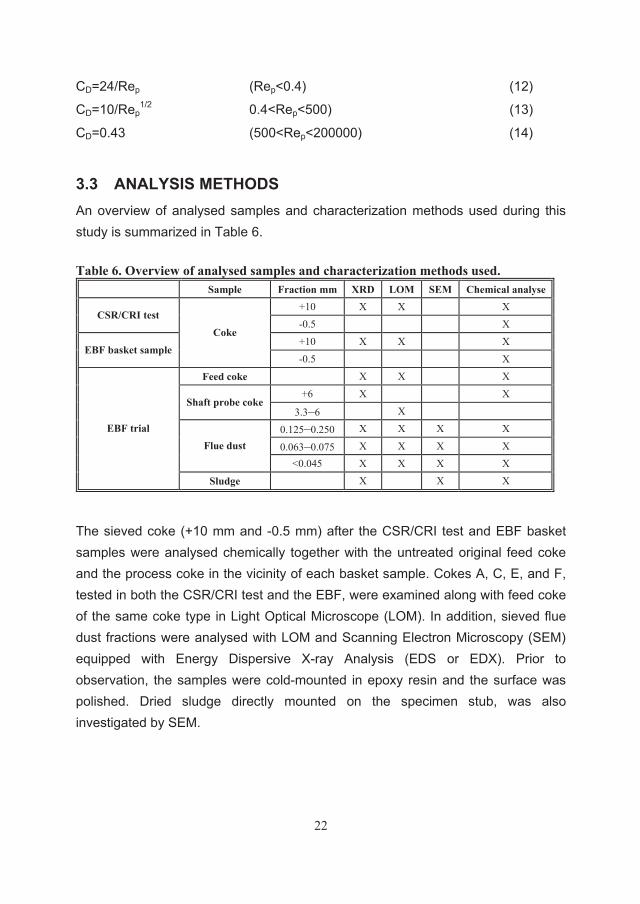
3.3 ANALYSIS METHODS An overview of analysed samples and characterization methods used during this study is summarized in Table 6.
Table 6. Overview of analysed samples and characterization methods used.
Sample Fraction mm XRD LOM SEM Chemical analyse +10 X X X
CSR/CRI test -0.5 X
+10 X X X EBF basket sample
Coke
-0.5 X
Feed coke X X X
+6 X X Shaft probe coke
3.3–6 X
0.125–0.250 X X X X
0.063–0.075 X X X X Flue dust
<0.045 X X X X
EBF trial
Sludge X X X
The sieved coke (+10 mm and -0.5 mm) after the CSR/CRI test and EBF basket samples were analysed chemically together with the untreated original feed coke and the process coke in the vicinity of each basket sample. Cokes A, C, E, and F, tested in both the CSR/CRI test and the EBF, were examined along with feed coke of the same coke type in Light Optical Microscope (LOM). In addition, sieved flue dust fractions were analysed with LOM and Scanning Electron Microscopy (SEM) equipped with Energy Dispersive X-ray Analysis (EDS or EDX). Prior to observation, the samples were cold-mounted in epoxy resin and the surface was polished. Dried sludge directly mounted on the specimen stub, was also investigated by SEM.
23
XRD was used to evaluate the graphitization degree, represented by the calculated Lc value, see section 1.2.3. The samples were ground to powder and XRD patterns were obtained using a Cupper K radiation X-ray source. The samples were scanned between 2 15–35º with a step size of 0.05 degrees and a scanning of 8 seconds for each step. A different evaluation was applied when calculating the Lc values in the EBF trial, which corrected for the SiO2 peak contribution. XRD analysis was also carried out on flue dust fractions and sludge. The ground flue dust were scanned between 2 10–90 with a step size of 0.020º. Sludge samples were scanned with an increased step time.
4 RESULTS
4.1 CSR/CRI TESTS AND EBF BASKET SAMPLES
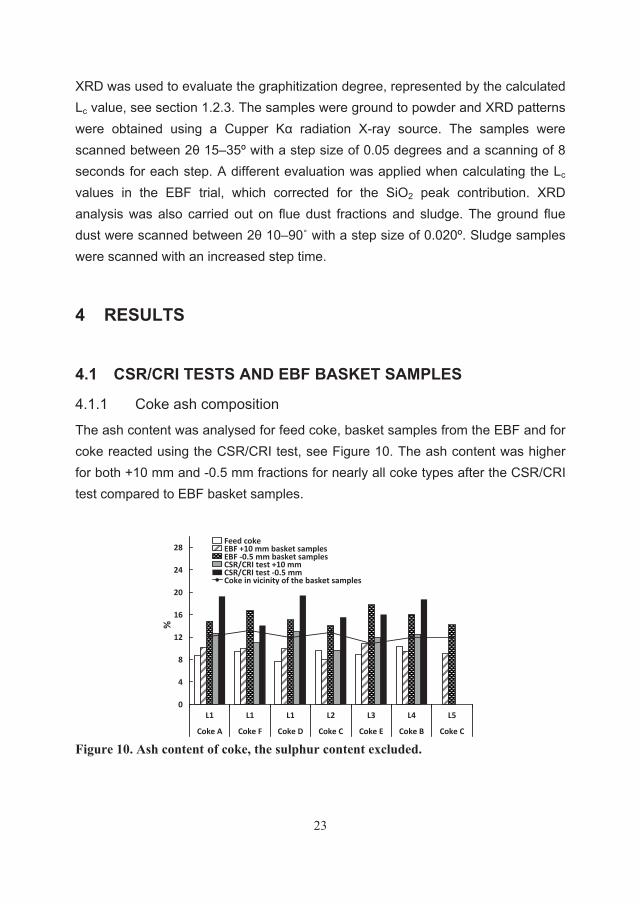
4.1.1 Coke ash composition
The ash content was analysed for feed coke, basket samples from the EBF and for coke reacted using the CSR/CRI test, see Figure 10. The ash content was higher for both +10 mm and -0.5 mm fractions for nearly all coke types after the CSR/CRI test compared to EBF basket samples.
0
4
8
12
16
20
24
28
L1 L1 L1 L2 L3 L4 L5
Coke A Coke F Coke D Coke C Coke E Coke B Coke C
%
Feed cokeEBF +10 mm basket samplesEBF -0.5 mm basket samplesCSR/CRI test +10 mmCSR/CRI test -0.5 mmCoke in vicinity of the basket samples
Figure 10. Ash content of coke, the sulphur content excluded.
24
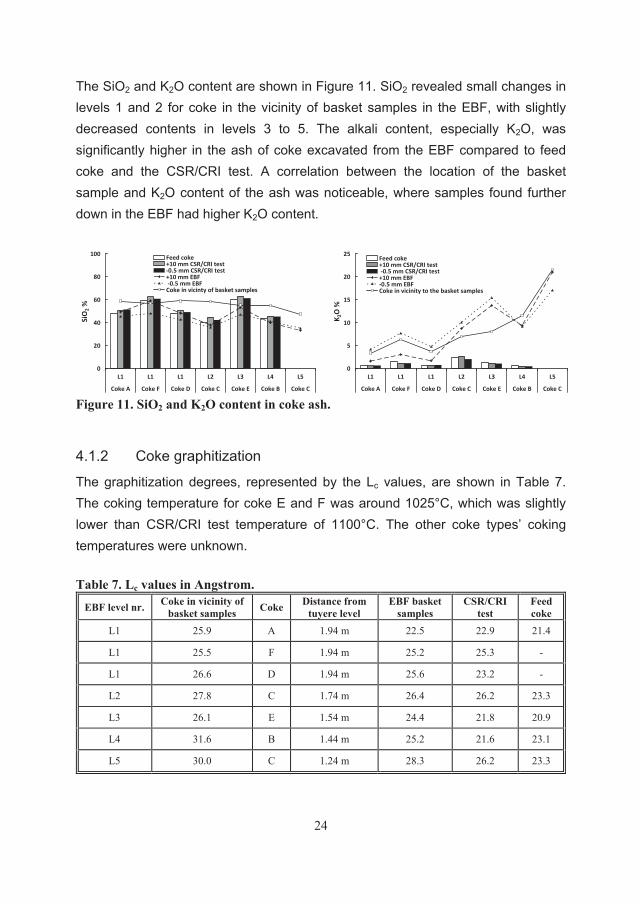
The SiO2 and K2O content are shown in Figure 11. SiO2 revealed small changes in levels 1 and 2 for coke in the vicinity of basket samples in the EBF, with slightly decreased contents in levels 3 to 5. The alkali content, especially K2O, was significantly higher in the ash of coke excavated from the EBF compared to feed coke and the CSR/CRI test. A correlation between the location of the basket sample and K2O content of the ash was noticeable, where samples found further down in the EBF had higher K2O content.
0
20
40
60
80
100
L1 L1 L1 L2 L3 L4 L5
Coke A Coke F Coke D Coke C Coke E Coke B Coke C
SiO
2 %
Feed coke+10 mm CSR/CRI test-0.5 mm CSR/CRI test+10 mm EBF -0.5 mm EBFCoke in vicinty of basket samples
0
5
10
15
20
25
L1 L1 L1 L2 L3 L4 L5
Coke A Coke F Coke D Coke C Coke E Coke B Coke C
K 2O
%
Feed coke+10 mm CSR/CRI test -0.5 mm CSR/CRI test+10 mm EBF-0.5 mm EBFCoke in vicinity to the basket samples
Figure 11. SiO2 and K2O content in coke ash.
4.1.2 Coke graphitization
The graphitization degrees, represented by the Lc values, are shown in Table 7. The coking temperature for coke E and F was around 1025°C, which was slightly lower than CSR/CRI test temperature of 1100°C. The other coke types’ coking temperatures were unknown.
Table 7. Lc values in Angstrom.
EBF level nr. Coke in vicinity of basket samples Coke Distance from
tuyere level EBF basket
samples CSR/CRI
test Feed coke
L1 25.9 A 1.94 m 22.5 22.9 21.4
L1 25.5 F 1.94 m 25.2 25.3 -
L1 26.6 D 1.94 m 25.6 23.2 -
L2 27.8 C 1.74 m 26.4 26.2 23.3
L3 26.1 E 1.54 m 24.4 21.8 20.9
L4 31.6 B 1.44 m 25.2 21.6 23.1
L5 30.0 C 1.24 m 28.3 26.2 23.3
25
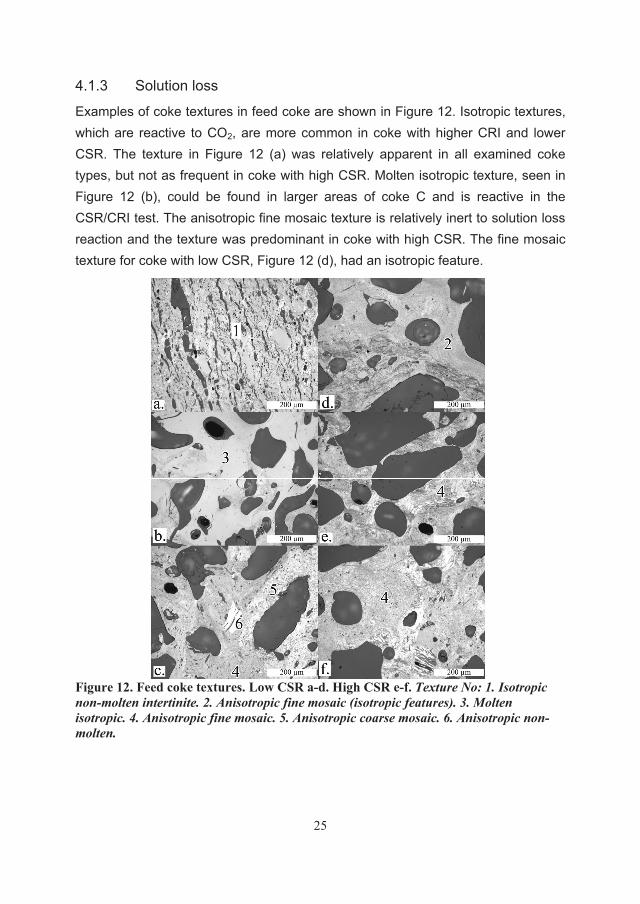
4.1.3 Solution loss
Examples of coke textures in feed coke are shown in Figure 12. Isotropic textures, which are reactive to CO2, are more common in coke with higher CRI and lower CSR. The texture in Figure 12 (a) was relatively apparent in all examined coke types, but not as frequent in coke with high CSR. Molten isotropic texture, seen in Figure 12 (b), could be found in larger areas of coke C and is reactive in the CSR/CRI test. The anisotropic fine mosaic texture is relatively inert to solution loss reaction and the texture was predominant in coke with high CSR. The fine mosaic texture for coke with low CSR, Figure 12 (d), had an isotropic feature.
Figure 12. Feed coke textures. Low CSR a-d. High CSR e-f. Texture No: 1. Isotropic non-molten intertinite. 2. Anisotropic fine mosaic (isotropic features). 3. Molten isotropic. 4. Anisotropic fine mosaic. 5. Anisotropic coarse mosaic. 6. Anisotropic non-molten.
26
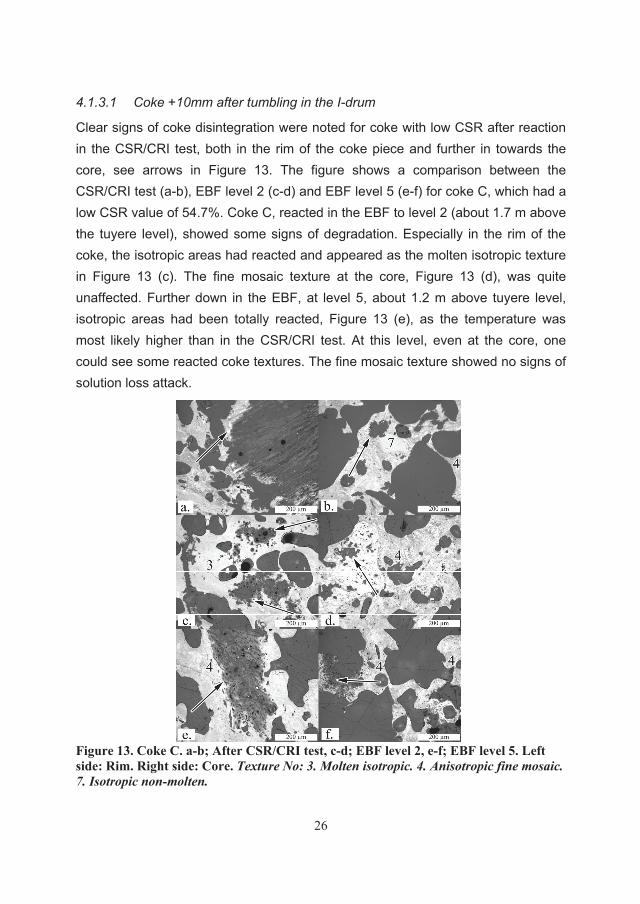
4.1.3.1 Coke +10mm after tumbling in the I-drum
Clear signs of coke disintegration were noted for coke with low CSR after reaction in the CSR/CRI test, both in the rim of the coke piece and further in towards the core, see arrows in Figure 13. The figure shows a comparison between the CSR/CRI test (a-b), EBF level 2 (c-d) and EBF level 5 (e-f) for coke C, which had a low CSR value of 54.7%. Coke C, reacted in the EBF to level 2 (about 1.7 m above the tuyere level), showed some signs of degradation. Especially in the rim of the coke, the isotropic areas had reacted and appeared as the molten isotropic texture in Figure 13 (c). The fine mosaic texture at the core, Figure 13 (d), was quite unaffected. Further down in the EBF, at level 5, about 1.2 m above tuyere level, isotropic areas had been totally reacted, Figure 13 (e), as the temperature was most likely higher than in the CSR/CRI test. At this level, even at the core, one could see some reacted coke textures. The fine mosaic texture showed no signs of solution loss attack.
Figure 13. Coke C. a-b; After CSR/CRI test, c-d; EBF level 2, e-f; EBF level 5. Left side: Rim. Right side: Core. Texture No: 3. Molten isotropic. 4. Anisotropic fine mosaic. 7. Isotropic non-molten.
27
The high CSR coke showed smaller differences between reaction both in the CSR/CRI test and in the blast furnace when compared to low CSR coke. However, isotropic areas in coke F, which had a high CSR value of 70.3%, showed signs of reaction, both in the CSR/CRI test and for coke from the EBF at level 1.
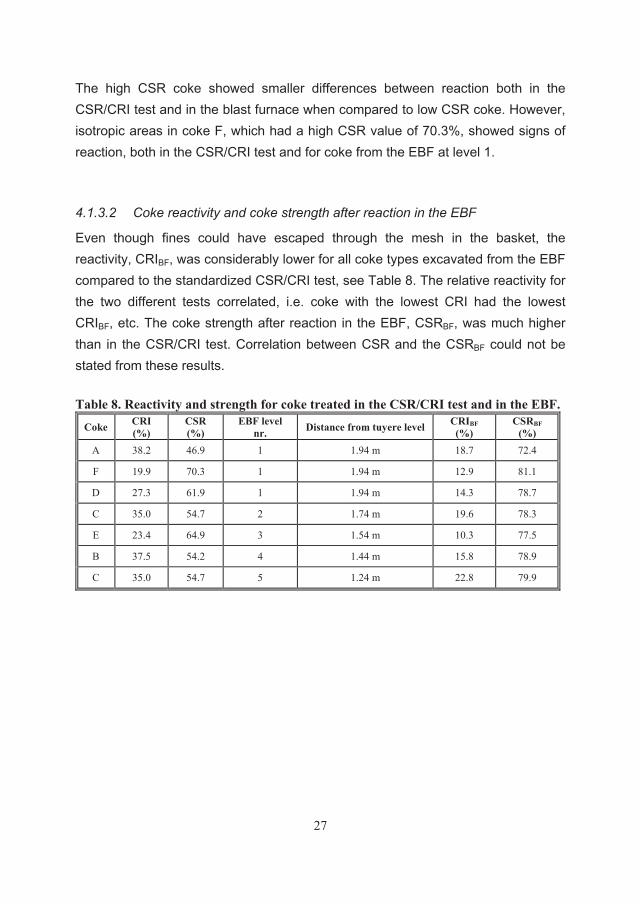
4.1.3.2 Coke reactivity and coke strength after reaction in the EBF
Even though fines could have escaped through the mesh in the basket, the reactivity, CRIBF, was considerably lower for all coke types excavated from the EBF compared to the standardized CSR/CRI test, see Table 8. The relative reactivity for the two different tests correlated, i.e. coke with the lowest CRI had the lowest CRIBF, etc. The coke strength after reaction in the EBF, CSRBF, was much higher than in the CSR/CRI test. Correlation between CSR and the CSRBF could not be stated from these results.
Table 8. Reactivity and strength for coke treated in the CSR/CRI test and in the EBF.
Coke CRI (%)
CSR (%)
EBF level nr. Distance from tuyere level CRIBF
(%) CSRBF
(%)
A 38.2 46.9 1 1.94 m 18.7 72.4
F 19.9 70.3 1 1.94 m 12.9 81.1
D 27.3 61.9 1 1.94 m 14.3 78.7
C 35.0 54.7 2 1.74 m 19.6 78.3
E 23.4 64.9 3 1.54 m 10.3 77.5
B 37.5 54.2 4 1.44 m 15.8 78.9
C 35.0 54.7 5 1.24 m 22.8 79.9
28
4.2 EBF TRIAL
4.2.1 Off-gas dust
4.2.1.1 Off-gas dust characterization
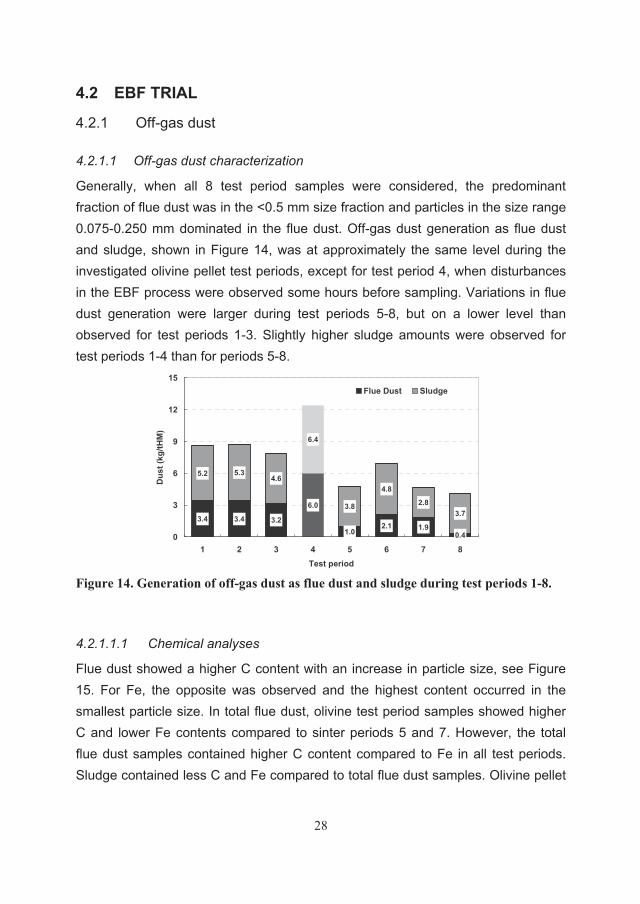
Generally, when all 8 test period samples were considered, the predominant fraction of flue dust was in the <0.5 mm size fraction and particles in the size range 0.075-0.250 mm dominated in the flue dust. Off-gas dust generation as flue dust and sludge, shown in Figure 14, was at approximately the same level during the investigated olivine pellet test periods, except for test period 4, when disturbances in the EBF process were observed some hours before sampling. Variations in flue dust generation were larger during test periods 5-8, but on a lower level than observed for test periods 1-3. Slightly higher sludge amounts were observed for test periods 1-4 than for periods 5-8.
3.4 3.4 3.2
6.0
1.02.1 1.9
0.4
5.2 5.34.6
6.4
3.73.8
4.8
2.8
0
3
6
9
12
15
1 2 3 4 5 6 7 8Test period
Dus
t (kg
/tHM
)
Flue Dust Sludge
Figure 14. Generation of off-gas dust as flue dust and sludge during test periods 1-8.
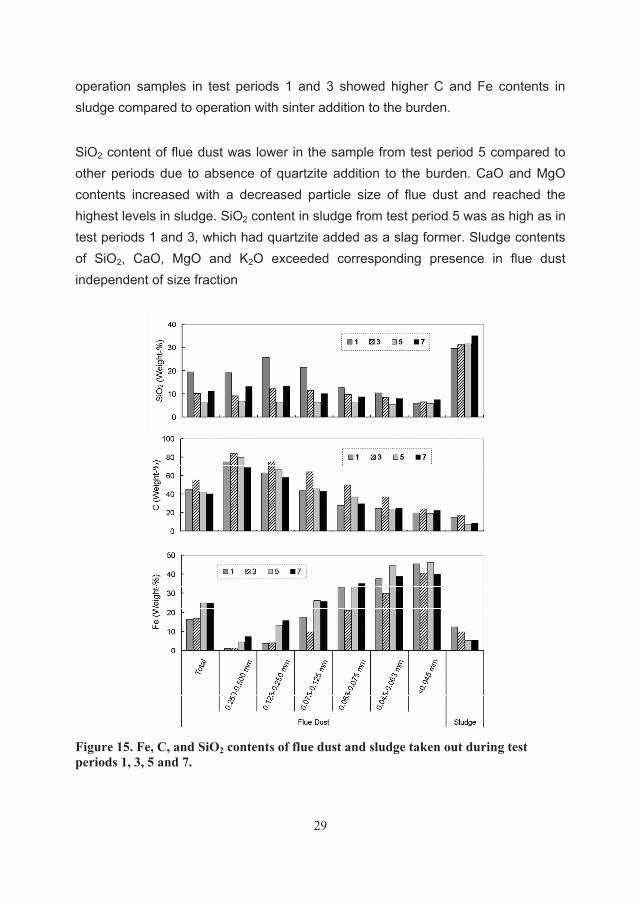
4.2.1.1.1 Chemical analyses
Flue dust showed a higher C content with an increase in particle size, see Figure 15. For Fe, the opposite was observed and the highest content occurred in the smallest particle size. In total flue dust, olivine test period samples showed higher C and lower Fe contents compared to sinter periods 5 and 7. However, the total flue dust samples contained higher C content compared to Fe in all test periods. Sludge contained less C and Fe compared to total flue dust samples. Olivine pellet
29
operation samples in test periods 1 and 3 showed higher C and Fe contents in sludge compared to operation with sinter addition to the burden.
SiO2 content of flue dust was lower in the sample from test period 5 compared to other periods due to absence of quartzite addition to the burden. CaO and MgO contents increased with a decreased particle size of flue dust and reached the highest levels in sludge. SiO2 content in sludge from test period 5 was as high as in test periods 1 and 3, which had quartzite added as a slag former. Sludge contents of SiO2, CaO, MgO and K2O exceeded corresponding presence in flue dust independent of size fraction
Figure 15. Fe, C, and SiO2 contents of flue dust and sludge taken out during test periods 1, 3, 5 and 7.
30
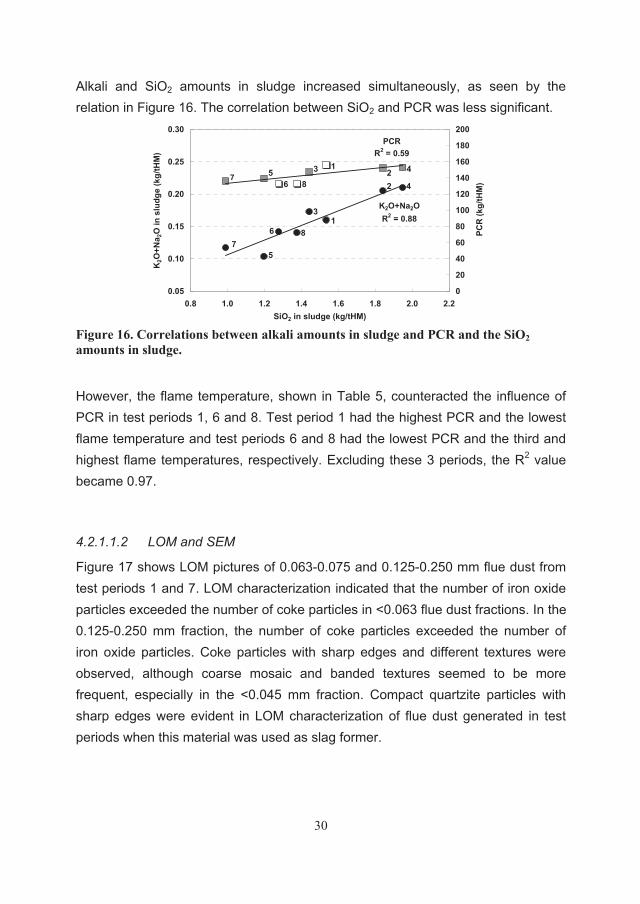
Alkali and SiO2 amounts in sludge increased simultaneously, as seen by the relation in Figure 16. The correlation between SiO2 and PCR was less significant.
K2O+Na2OR2 = 0.88
PCRR2 = 0.59
0.05
0.10
0.15
0.20
0.25
0.30
0.8 1.0 1.2 1.4 1.6 1.8 2.0 2.2SiO2 in sludge (kg/tHM)
K2O
+Na 2
O in
slu
dge
(kg/
tHM
)
0
20
40
60
80
100
120
140
160
180
200
PCR
(kg/
tHM
)7
7
5
5
6
6
8
8
3
3
1
1
22
4
4
Figure 16. Correlations between alkali amounts in sludge and PCR and the SiO2 amounts in sludge.
However, the flame temperature, shown in Table 5, counteracted the influence of PCR in test periods 1, 6 and 8. Test period 1 had the highest PCR and the lowest flame temperature and test periods 6 and 8 had the lowest PCR and the third and highest flame temperatures, respectively. Excluding these 3 periods, the R2 value became 0.97.
4.2.1.1.2 LOM and SEM
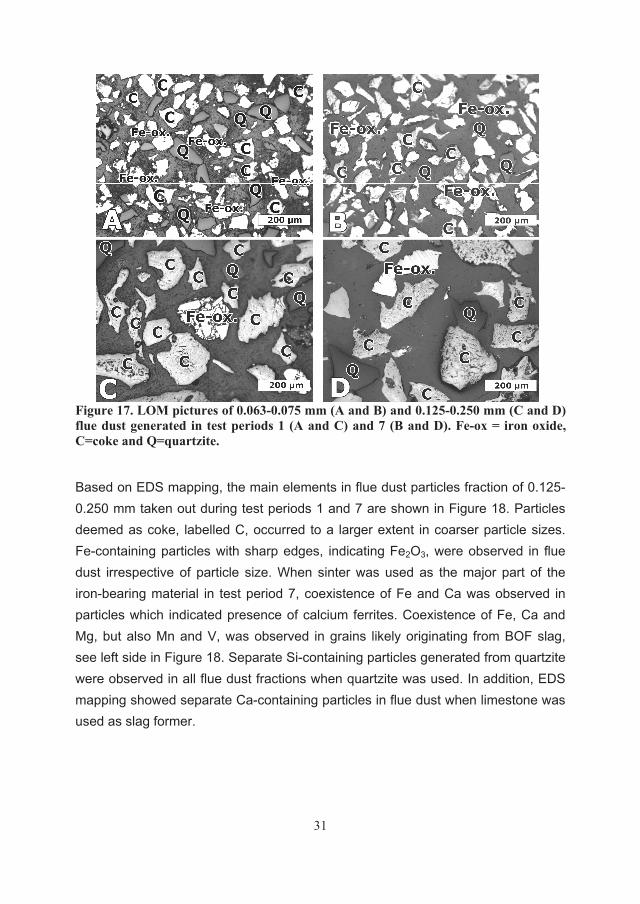
Figure 17 shows LOM pictures of 0.063-0.075 and 0.125-0.250 mm flue dust from test periods 1 and 7. LOM characterization indicated that the number of iron oxide particles exceeded the number of coke particles in <0.063 flue dust fractions. In the 0.125-0.250 mm fraction, the number of coke particles exceeded the number of iron oxide particles. Coke particles with sharp edges and different textures were observed, although coarse mosaic and banded textures seemed to be more frequent, especially in the <0.045 mm fraction. Compact quartzite particles with sharp edges were evident in LOM characterization of flue dust generated in test periods when this material was used as slag former.
31
Figure 17. LOM pictures of 0.063-0.075 mm (A and B) and 0.125-0.250 mm (C and D) flue dust generated in test periods 1 (A and C) and 7 (B and D). Fe-ox = iron oxide, C=coke and Q=quartzite.
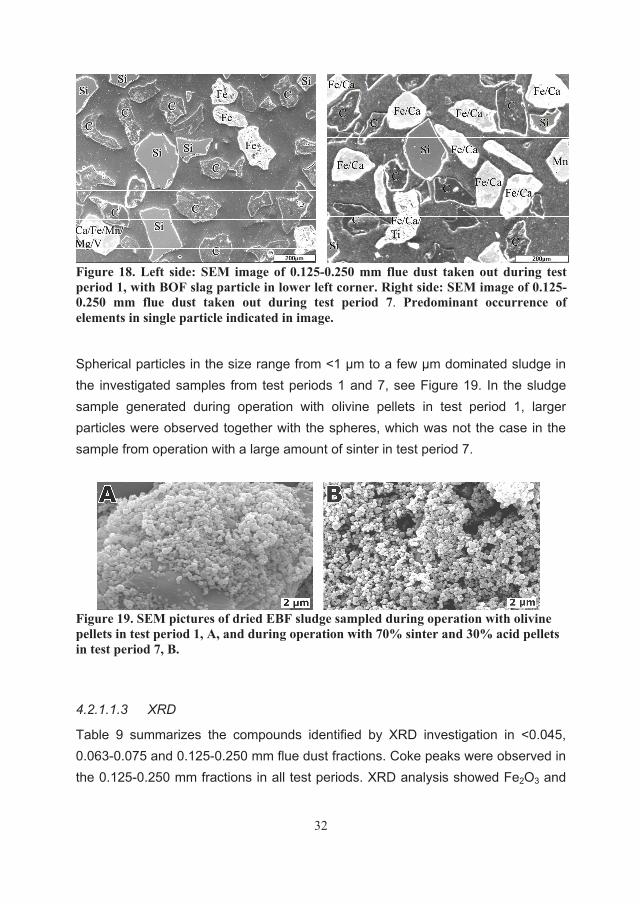
Based on EDS mapping, the main elements in flue dust particles fraction of 0.125-0.250 mm taken out during test periods 1 and 7 are shown in Figure 18. Particles deemed as coke, labelled C, occurred to a larger extent in coarser particle sizes. Fe-containing particles with sharp edges, indicating Fe2O3, were observed in flue dust irrespective of particle size. When sinter was used as the major part of the iron-bearing material in test period 7, coexistence of Fe and Ca was observed in particles which indicated presence of calcium ferrites. Coexistence of Fe, Ca and Mg, but also Mn and V, was observed in grains likely originating from BOF slag, see left side in Figure 18. Separate Si-containing particles generated from quartzite were observed in all flue dust fractions when quartzite was used. In addition, EDS mapping showed separate Ca-containing particles in flue dust when limestone was used as slag former.
32
Figure 18. Left side: SEM image of 0.125-0.250 mm flue dust taken out during test period 1, with BOF slag particle in lower left corner. Right side: SEM image of 0.125-0.250 mm flue dust taken out during test period 7. Predominant occurrence of elements in single particle indicated in image.
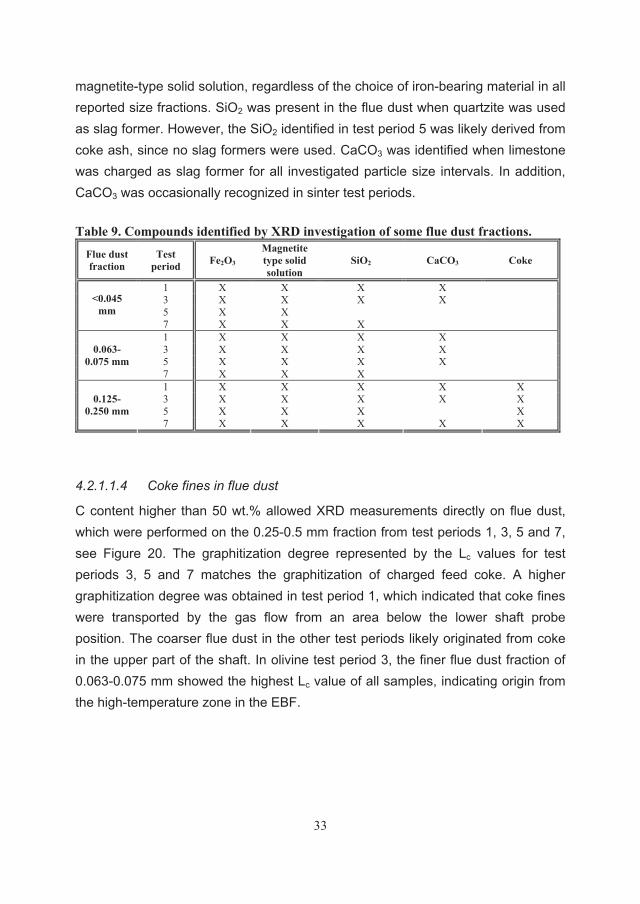
Spherical particles in the size range from <1 m to a few m dominated sludge in the investigated samples from test periods 1 and 7, see Figure 19. In the sludge sample generated during operation with olivine pellets in test period 1, larger particles were observed together with the spheres, which was not the case in the sample from operation with a large amount of sinter in test period 7.
Figure 19. SEM pictures of dried EBF sludge sampled during operation with olivine pellets in test period 1, A, and during operation with 70% sinter and 30% acid pellets in test period 7, B.
4.2.1.1.3 XRD
Table 9 summarizes the compounds identified by XRD investigation in <0.045, 0.063-0.075 and 0.125-0.250 mm flue dust fractions. Coke peaks were observed in the 0.125-0.250 mm fractions in all test periods. XRD analysis showed Fe2O3 and
33
magnetite-type solid solution, regardless of the choice of iron-bearing material in all reported size fractions. SiO2 was present in the flue dust when quartzite was used as slag former. However, the SiO2 identified in test period 5 was likely derived from coke ash, since no slag formers were used. CaCO3 was identified when limestone was charged as slag former for all investigated particle size intervals. In addition, CaCO3 was occasionally recognized in sinter test periods.
Table 9. Compounds identified by XRD investigation of some flue dust fractions.
Flue dust fraction
Test period Fe2O3
Magnetite type solid solution
SiO2 CaCO3 Coke
1 X X X X 3 X X X X 5 X X
<0.045 mm
7 X X X 1 X X X X 3 X X X X 5 X X X X
0.063-0.075 mm
7 X X X 1 X X X X X 3 X X X X X 5 X X X X
0.125-0.250 mm
7 X X X X X
4.2.1.1.4 Coke fines in flue dust
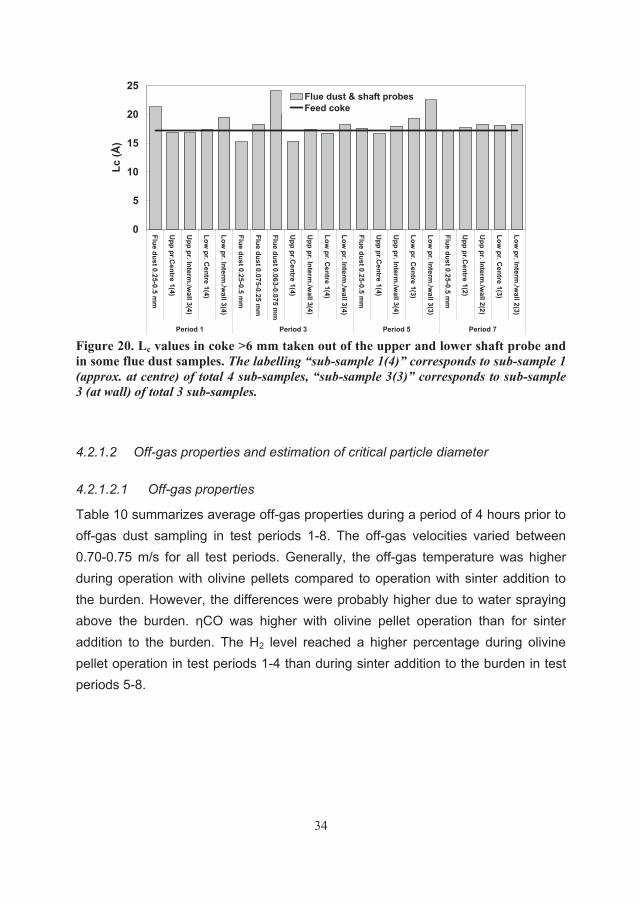
C content higher than 50 wt.% allowed XRD measurements directly on flue dust, which were performed on the 0.25-0.5 mm fraction from test periods 1, 3, 5 and 7, see Figure 20. The graphitization degree represented by the Lc values for test periods 3, 5 and 7 matches the graphitization of charged feed coke. A higher graphitization degree was obtained in test period 1, which indicated that coke fines were transported by the gas flow from an area below the lower shaft probe position. The coarser flue dust in the other test periods likely originated from coke in the upper part of the shaft. In olivine test period 3, the finer flue dust fraction of 0.063-0.075 mm showed the highest Lc value of all samples, indicating origin from the high-temperature zone in the EBF.
34
0
5
10
15
20
25
Flue dust 0.25-0.5 mm
Upp pr.C
entre 1(4)
Upp pr. Interm
./wall 3(4)
Low pr. C
entre 1(4)
Low pr. Interm
./wall 3(4)
Flue dust 0.25-0.5 mm
Flue dust 0.075-0.25 mm
Flue dust 0.063-0.075 mm
Upp pr.C
entre 1(4)
Upp pr. Interm
./wall 3(4)
Low pr. C
entre 1(4)
Low pr. Interm
./wall 3(4)
Flue dust 0.25-0.5 mm
Upp pr.C
entre 1(4)
Upp pr. Interm
./wall 3(4)
Low pr. C
entre 1(3)
Low pr. Interm
./wall 3(3)
Flue dust 0.25-0.5 mm
Upp pr.C
entre 1(2)
Upp pr. Interm
./wall 2(2)
Low pr. C
entre 1(3)
Low pr. Interm
./wall 2(3)
Period 1 Period 3 Period 5 Period 7
Lc (Å
)Flue dust & shaft probesFeed coke
Figure 20. Lc values in coke >6 mm taken out of the upper and lower shaft probe and in some flue dust samples. The labelling “sub-sample 1(4)” corresponds to sub-sample 1 (approx. at centre) of total 4 sub-samples, “sub-sample 3(3)” corresponds to sub-sample 3 (at wall) of total 3 sub-samples.
4.2.1.2 Off-gas properties and estimation of critical particle diameter
4.2.1.2.1 Off-gas properties
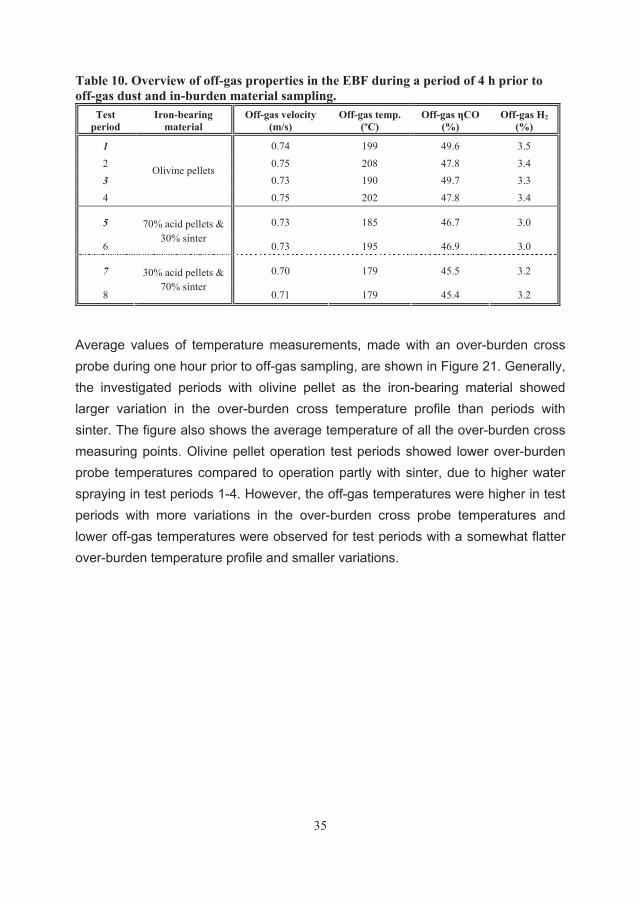
Table 10 summarizes average off-gas properties during a period of 4 hours prior to off-gas dust sampling in test periods 1-8. The off-gas velocities varied between 0.70-0.75 m/s for all test periods. Generally, the off-gas temperature was higher during operation with olivine pellets compared to operation with sinter addition to the burden. However, the differences were probably higher due to water spraying above the burden. CO was higher with olivine pellet operation than for sinter addition to the burden. The H2 level reached a higher percentage during olivine pellet operation in test periods 1-4 than during sinter addition to the burden in test periods 5-8.
35
Table 10. Overview of off-gas properties in the EBF during a period of 4 h prior to off-gas dust and in-burden material sampling.
Test period
Iron-bearing material
Off-gas velocity (m/s)
Off-gas temp. (ºC)
Off-gas CO (%)
Off-gas H2 (%)
1 0.74 199 49.6 3.5 2 0.75 208 47.8 3.4 3 0.73 190 49.7 3.3 4
Olivine pellets
0.75 202 47.8 3.4
5 0.73 185 46.7 3.0
6
70% acid pellets & 30% sinter
0.73 195 46.9 3.0
7 0.70 179 45.5 3.2
8
30% acid pellets & 70% sinter
0.71 179 45.4 3.2
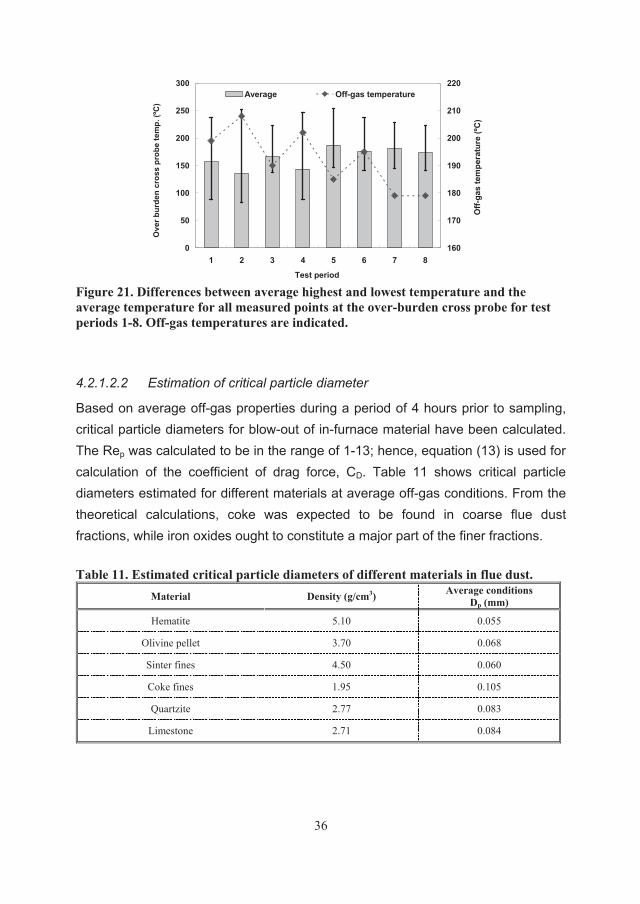
Average values of temperature measurements, made with an over-burden cross probe during one hour prior to off-gas sampling, are shown in Figure 21. Generally, the investigated periods with olivine pellet as the iron-bearing material showed larger variation in the over-burden cross temperature profile than periods with sinter. The figure also shows the average temperature of all the over-burden cross measuring points. Olivine pellet operation test periods showed lower over-burden probe temperatures compared to operation partly with sinter, due to higher water spraying in test periods 1-4. However, the off-gas temperatures were higher in test periods with more variations in the over-burden cross probe temperatures and lower off-gas temperatures were observed for test periods with a somewhat flatter over-burden temperature profile and smaller variations.
36
0
50
100
150
200
250
300
1 2 3 4 5 6 7 8
Test period
Ove
r bur
den
cros
s pr
obe
tem
p. (º
C)
160
170
180
190
200
210
220
Off-
gas
tem
pera
ture
(ºC
)
Average Off-gas temperature
Figure 21. Differences between average highest and lowest temperature and the average temperature for all measured points at the over-burden cross probe for test periods 1-8. Off-gas temperatures are indicated.
4.2.1.2.2 Estimation of critical particle diameter
Based on average off-gas properties during a period of 4 hours prior to sampling, critical particle diameters for blow-out of in-furnace material have been calculated. The Rep was calculated to be in the range of 1-13; hence, equation (13) is used for calculation of the coefficient of drag force, CD. Table 11 shows critical particle diameters estimated for different materials at average off-gas conditions. From the theoretical calculations, coke was expected to be found in coarse flue dust fractions, while iron oxides ought to constitute a major part of the finer fractions.
Table 11. Estimated critical particle diameters of different materials in flue dust.
Material Density (g/cm3) Average conditions Dp (mm)
Hematite 5.10 0.055
Olivine pellet 3.70 0.068
Sinter fines 4.50 0.060
Coke fines 1.95 0.105
Quartzite 2.77 0.083
Limestone 2.71 0.084
37
4.2.2 Upper and lower shaft probe position
4.2.2.1 EBF conditions
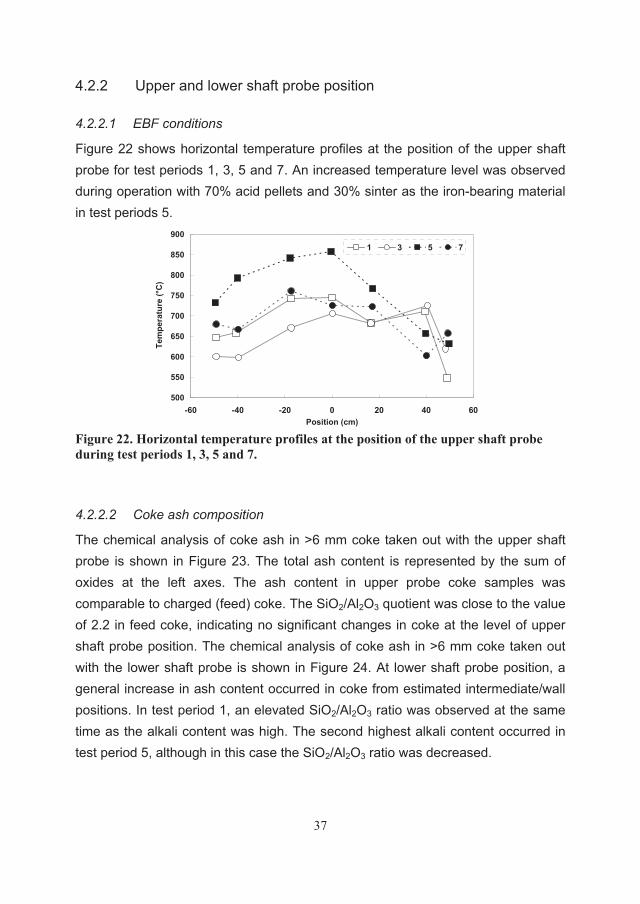
Figure 22 shows horizontal temperature profiles at the position of the upper shaft probe for test periods 1, 3, 5 and 7. An increased temperature level was observed during operation with 70% acid pellets and 30% sinter as the iron-bearing material in test periods 5.
500
550
600
650
700
750
800
850
900
-60 -40 -20 0 20 40 60Position (cm)
Tem
pera
ture
(°C
)
1 3 5 7
Figure 22. Horizontal temperature profiles at the position of the upper shaft probe during test periods 1, 3, 5 and 7.
4.2.2.2 Coke ash composition
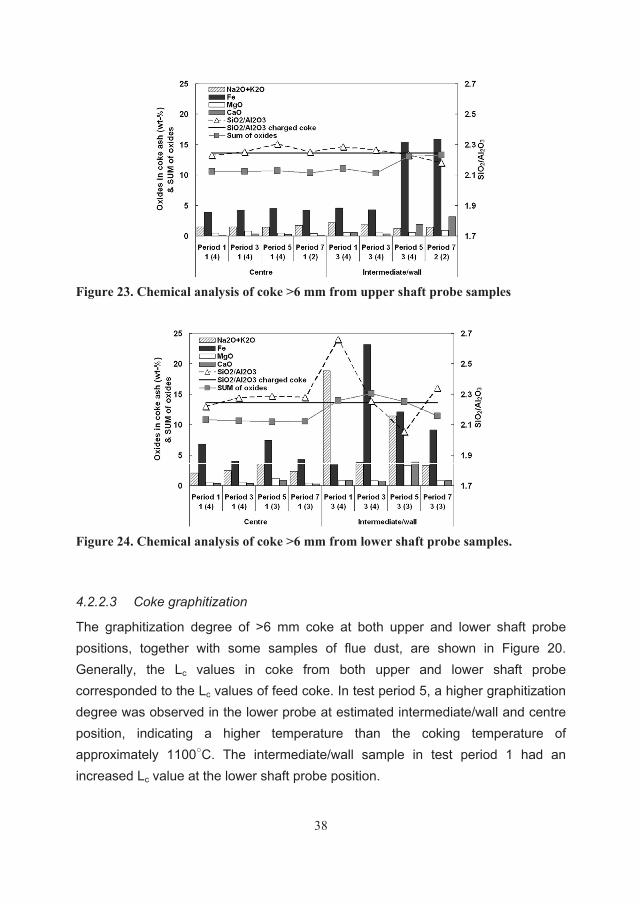
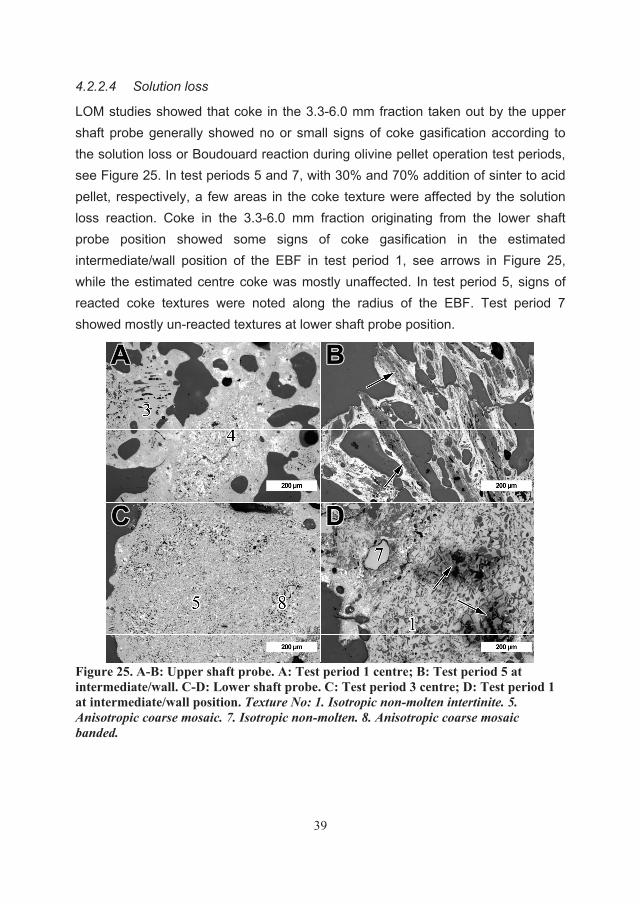
The chemical analysis of coke ash in >6 mm coke taken out with the upper shaft probe is shown in Figure 23. The total ash content is represented by the sum of oxides at the left axes. The ash content in upper probe coke samples was comparable to charged (feed) coke. The SiO2/Al2O3 quotient was close to the value of 2.2 in feed coke, indicating no significant changes in coke at the level of upper shaft probe position. The chemical analysis of coke ash in >6 mm coke taken out with the lower shaft probe is shown in Figure 24. At lower shaft probe position, a general increase in ash content occurred in coke from estimated intermediate/wall positions. In test period 1, an elevated SiO2/Al2O3 ratio was observed at the same time as the alkali content was high. The second highest alkali content occurred in test period 5, although in this case the SiO2/Al2O3 ratio was decreased.
38
Figure 23. Chemical analysis of coke >6 mm from upper shaft probe samples
Figure 24. Chemical analysis of coke >6 mm from lower shaft probe samples.
4.2.2.3 Coke graphitization
The graphitization degree of >6 mm coke at both upper and lower shaft probe positions, together with some samples of flue dust, are shown in Figure 20. Generally, the Lc values in coke from both upper and lower shaft probe corresponded to the Lc values of feed coke. In test period 5, a higher graphitization degree was observed in the lower probe at estimated intermediate/wall and centre position, indicating a higher temperature than the coking temperature of approximately 1100 C. The intermediate/wall sample in test period 1 had an increased Lc value at the lower shaft probe position.
39
4.2.2.4 Solution loss
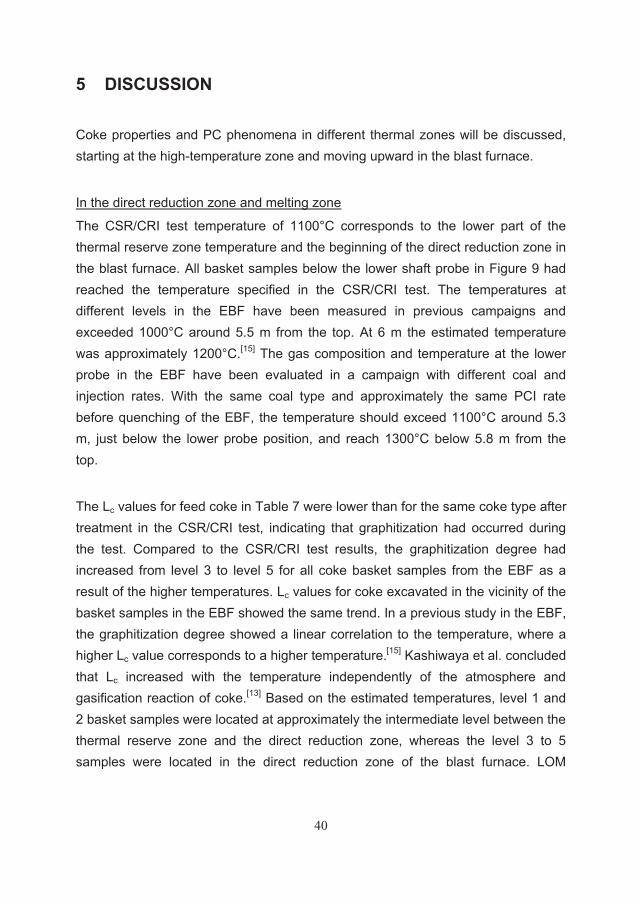
LOM studies showed that coke in the 3.3-6.0 mm fraction taken out by the upper shaft probe generally showed no or small signs of coke gasification according to the solution loss or Boudouard reaction during olivine pellet operation test periods, see Figure 25. In test periods 5 and 7, with 30% and 70% addition of sinter to acid pellet, respectively, a few areas in the coke texture were affected by the solution loss reaction. Coke in the 3.3-6.0 mm fraction originating from the lower shaft probe position showed some signs of coke gasification in the estimated intermediate/wall position of the EBF in test period 1, see arrows in Figure 25, while the estimated centre coke was mostly unaffected. In test period 5, signs of reacted coke textures were noted along the radius of the EBF. Test period 7 showed mostly un-reacted textures at lower shaft probe position.
Figure 25. A-B: Upper shaft probe. A: Test period 1 centre; B: Test period 5 at intermediate/wall. C-D: Lower shaft probe. C: Test period 3 centre; D: Test period 1 at intermediate/wall position. Texture No: 1. Isotropic non-molten intertinite. 5. Anisotropic coarse mosaic. 7. Isotropic non-molten. 8. Anisotropic coarse mosaic banded.
40
5 DISCUSSION
Coke properties and PC phenomena in different thermal zones will be discussed, starting at the high-temperature zone and moving upward in the blast furnace.
In the direct reduction zone and melting zone
The CSR/CRI test temperature of 1100°C corresponds to the lower part of the thermal reserve zone temperature and the beginning of the direct reduction zone in the blast furnace. All basket samples below the lower shaft probe in Figure 9 had reached the temperature specified in the CSR/CRI test. The temperatures at different levels in the EBF have been measured in previous campaigns and exceeded 1000°C around 5.5 m from the top. At 6 m the estimated temperature was approximately 1200°C.[15] The gas composition and temperature at the lower probe in the EBF have been evaluated in a campaign with different coal and injection rates. With the same coal type and approximately the same PCI rate before quenching of the EBF, the temperature should exceed 1100°C around 5.3 m, just below the lower probe position, and reach 1300°C below 5.8 m from the top.
The Lc values for feed coke in Table 7 were lower than for the same coke type after treatment in the CSR/CRI test, indicating that graphitization had occurred during the test. Compared to the CSR/CRI test results, the graphitization degree had increased from level 3 to level 5 for all coke basket samples from the EBF as a result of the higher temperatures. Lc values for coke excavated in the vicinity of the basket samples in the EBF showed the same trend. In a previous study in the EBF, the graphitization degree showed a linear correlation to the temperature, where a higher Lc value corresponds to a higher temperature.[15] Kashiwaya et al. concluded that Lc increased with the temperature independently of the atmosphere and gasification reaction of coke.[13] Based on the estimated temperatures, level 1 and 2 basket samples were located at approximately the intermediate level between the thermal reserve zone and the direct reduction zone, whereas the level 3 to 5 samples were located in the direct reduction zone of the blast furnace. LOM
41
studies of coke type C, see Figure 13, confirmed this with larger isotropic areas which have been reacted by the solution loss reaction at level 5 compared to level 2. Since the solution loss reaction is endothermic, the reaction rate is increased by higher temperatures.
The chemical analyses showed that feed coke with low CSR had a higher content of CaO, MgO and Fe and coke with high CSR had higher content of silica. The SiO2 content revealed small changes in levels 1 and 2 for coke in the vicinity of basket samples in the EBF, see Figure 11. At the higher temperature levels, 3 to 5, the SiO2 content had decreased somewhat, indicating losses of Si. Since silicates in coke ash start to react, forming SiO gas, at higher temperatures then assumed at these levels of the EBF, the lower SiO2 content can be explained by dilution with other compounds which have increased contents. The alkali content was considerably higher in coke samples from the EBF compared to feed coke and coke from the CSR/CRI test. Samples found further down in the EBF had higher K2O content and correlated to the excavated levels in agreement with previous studies in the EBF.[15] The elevated contents are a result of recirculation of alkali in the blast furnace atmosphere.[3],[15]
The major difference between the CSR/CRI test gas conditions and the blast furnace gas atmosphere is the CO2 gas content, which is 100% in the CSR/CRI test and considerably lower in the blast furnace. In an earlier trial in the EBF the CO2 content was as low as 5% in the temperature region of 1100°C. This, in addition to higher pressure in the blast furnace, slows down the reaction rate of solution loss. On the other hand, the blast furnace atmosphere contains other gaseous elements like H2/H2O, which also contribute to solution loss (C+H2O CO+H2), and recirculation of alkali, which catalyses the solution loss reaction. The LOM study confirmed that the CSR/CRI test atmosphere was more aggressive towards coke degradation by solution loss reaction than the blast furnace atmosphere. The degradation proceeded throughout the whole coke piece in the test, while coke from the EBF primarily showed signs of solution loss gasification in the outer layer of the coke piece, which was in agreement with other studies.[18] LOM studies also showed that isotropic areas in the coke texture
42
participated to a higher degree in the solution loss reaction and these areas were more distinct in coke with low CSR. In addition, the tumbled coke ash content was higher for both +10 mm and -0.5 mm fractions for nearly all coke types after the CSR/CRI test compared to EBF basket samples, which indicates that the solution loss reaction was less favoured in the blast furnace conditions, see Figure 10.
Additionally, the reactivity of coke basket samples, CRIBF, were noticeably lower for all coke types found in the EBF compared to the same type in the CSR/CRI test, see Table 8. The coke strength after reaction in the EBF, CSRBF, was higher than in the CSR/CRI test. According to coke type C, both the CRIBF and the CSRBF were increased closer to tuyere level. This may be a result of an elevated temperature further down in the EBF, and the solution loss reaction regime could have shifted from a mixed regime towards a more diffusion-limited regime. This leads to degradation on the coke surface and the inner coke matrix is rather unaffected by the solution loss reaction. The increased graphitization could also have contributed to a higher CRIBF value due to the fact that the coke had been degraded by abrasion, leaving smaller coke pieces to be weighed after reaction in the EBF.
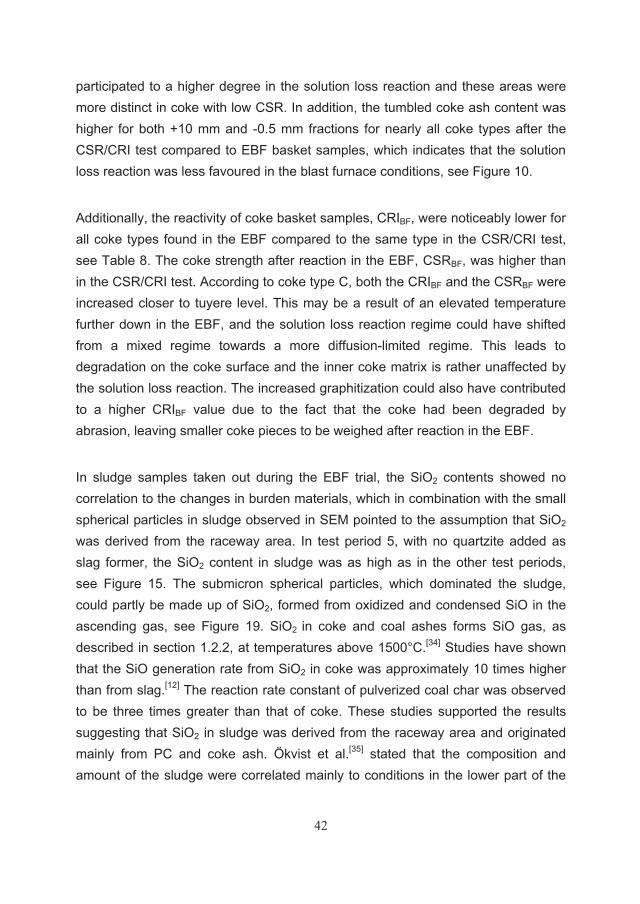
In sludge samples taken out during the EBF trial, the SiO2 contents showed no correlation to the changes in burden materials, which in combination with the small spherical particles in sludge observed in SEM pointed to the assumption that SiO2 was derived from the raceway area. In test period 5, with no quartzite added as slag former, the SiO2 content in sludge was as high as in the other test periods, see Figure 15. The submicron spherical particles, which dominated the sludge, could partly be made up of SiO2, formed from oxidized and condensed SiO in the ascending gas, see Figure 19. SiO2 in coke and coal ashes forms SiO gas, as described in section 1.2.2, at temperatures above 1500°C.[34] Studies have shown that the SiO generation rate from SiO2 in coke was approximately 10 times higher than from slag.[12] The reaction rate constant of pulverized coal char was observed to be three times greater than that of coke. These studies supported the results suggesting that SiO2 in sludge was derived from the raceway area and originated mainly from PC and coke ash. Ökvist et al.[35] stated that the composition and amount of the sludge were correlated mainly to conditions in the lower part of the
43
blast furnace. Correlation between alkali and SiO2 content in sludge indicated that conditions resulting in an increase in SiO gas generation in the raceway area also increased the reduction and vaporization of K and Na, which are a part of silicates in coke and coal. Similar correlation was observed in the present investigation, see Figure 16. The amounts in kg/tHM of sludge were slightly higher during sampling in olivine pellet periods compared to sinter periods, see Figure 14. The PCR was also higher during olivine pellet operation, see Table 5, and a correlation between the amount of SiO2 in the sludge and PCR was observed, supporting the hypothesis that the spherical particles in sludge originated from the high-temperature area around the raceway. Differences in the flame temperature counteracted the effect on SiO2 content and PCR in three test periods. High flame temperatures increase the amount of SiO gas that is produced in the raceway area, and although the PCR was lower, the amount of SiO2 in sludge was quite high. In test period 1, the PCR was high but a lower content of SiO2 was noted due to a lower flame temperature.
Sludge samples taken out in test periods 1 and 3 showed higher C content compared to samples from operation with sinter addition to the burden, see Figure 15. The higher C content could be explained by the higher PCR. It is known that higher PCR increases the outflow of char, soot and ash from raceway.[20] Studies on soot in combustion systems showed that soot formed submicron spherical particles in the size range of 20-60 nm.[22] Carbon could also have been formed in the reversed Boudouard reaction (1), and therefore contributed to the carbon content in sludge and shaft fines. The carbon deposition takes place in the upper part of the blast furnace and is most pronounced at 500-550°C.[6] At least some of the submicron spherical particles precipitated from the gas were carbon-containing particles likely to origin from carbon deposit reactions or soot, which indicated formation in the shaft or further down in the raceway area of the blast furnace.
In the thermal reserve zone
Based on results in the EBF, the thermal reserve zone is located approximately around the level of the lower shaft probe. The height and extension of the zone varies with process conditions. Most of the coke weakening by the solution loss reaction takes place in the melting zone but the threshold temperature of around
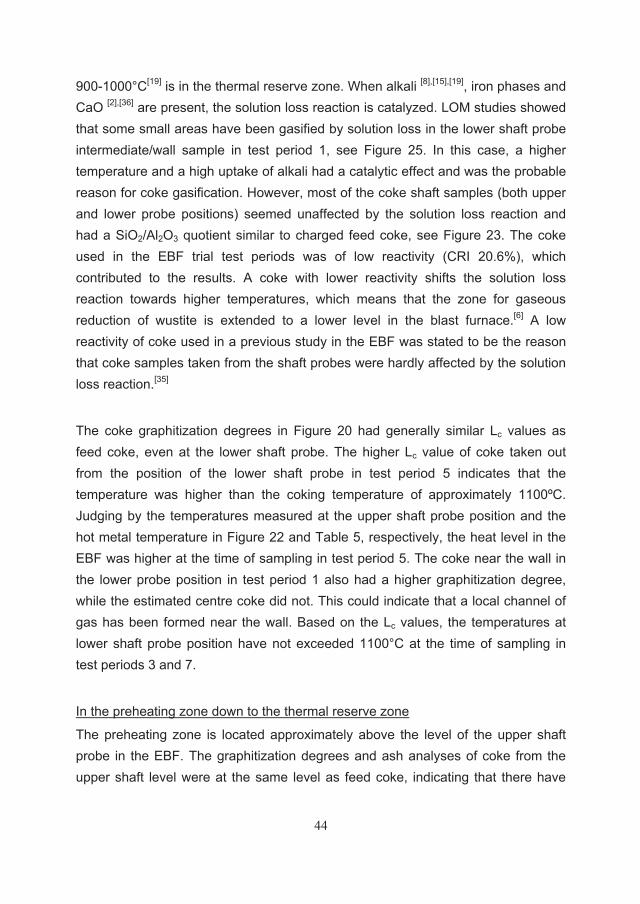
44
900-1000°C[19] is in the thermal reserve zone. When alkali [8],[15],[19], iron phases and CaO [2],[36] are present, the solution loss reaction is catalyzed. LOM studies showed that some small areas have been gasified by solution loss in the lower shaft probe intermediate/wall sample in test period 1, see Figure 25. In this case, a higher temperature and a high uptake of alkali had a catalytic effect and was the probable reason for coke gasification. However, most of the coke shaft samples (both upper and lower probe positions) seemed unaffected by the solution loss reaction and had a SiO2/Al2O3 quotient similar to charged feed coke, see Figure 23. The coke used in the EBF trial test periods was of low reactivity (CRI 20.6%), which contributed to the results. A coke with lower reactivity shifts the solution loss reaction towards higher temperatures, which means that the zone for gaseous reduction of wustite is extended to a lower level in the blast furnace.[6] A low reactivity of coke used in a previous study in the EBF was stated to be the reason that coke samples taken from the shaft probes were hardly affected by the solution loss reaction.[35]
The coke graphitization degrees in Figure 20 had generally similar Lc values as feed coke, even at the lower shaft probe. The higher Lc value of coke taken out from the position of the lower shaft probe in test period 5 indicates that the temperature was higher than the coking temperature of approximately 1100ºC. Judging by the temperatures measured at the upper shaft probe position and the hot metal temperature in Figure 22 and Table 5, respectively, the heat level in the EBF was higher at the time of sampling in test period 5. The coke near the wall in the lower probe position in test period 1 also had a higher graphitization degree, while the estimated centre coke did not. This could indicate that a local channel of gas has been formed near the wall. Based on the Lc values, the temperatures at lower shaft probe position have not exceeded 1100°C at the time of sampling in test periods 3 and 7.
In the preheating zone down to the thermal reserve zone
The preheating zone is located approximately above the level of the upper shaft probe in the EBF. The graphitization degrees and ash analyses of coke from the upper shaft level were at the same level as feed coke, indicating that there have
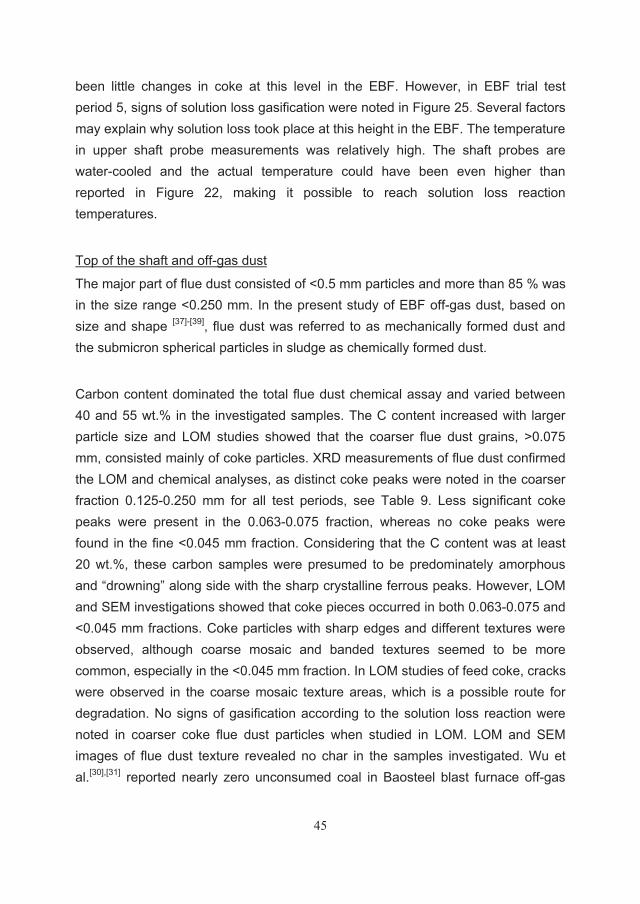
45
been little changes in coke at this level in the EBF. However, in EBF trial test period 5, signs of solution loss gasification were noted in Figure 25. Several factors may explain why solution loss took place at this height in the EBF. The temperature in upper shaft probe measurements was relatively high. The shaft probes are water-cooled and the actual temperature could have been even higher than reported in Figure 22, making it possible to reach solution loss reaction temperatures.
Top of the shaft and off-gas dust
The major part of flue dust consisted of <0.5 mm particles and more than 85 % was in the size range <0.250 mm. In the present study of EBF off-gas dust, based on size and shape [37]-[39], flue dust was referred to as mechanically formed dust and the submicron spherical particles in sludge as chemically formed dust.
Carbon content dominated the total flue dust chemical assay and varied between 40 and 55 wt.% in the investigated samples. The C content increased with larger particle size and LOM studies showed that the coarser flue dust grains, >0.075 mm, consisted mainly of coke particles. XRD measurements of flue dust confirmed the LOM and chemical analyses, as distinct coke peaks were noted in the coarser fraction 0.125-0.250 mm for all test periods, see Table 9. Less significant coke peaks were present in the 0.063-0.075 fraction, whereas no coke peaks were found in the fine <0.045 mm fraction. Considering that the C content was at least 20 wt.%, these carbon samples were presumed to be predominately amorphous and “drowning” along side with the sharp crystalline ferrous peaks. However, LOM and SEM investigations showed that coke pieces occurred in both 0.063-0.075 and <0.045 mm fractions. Coke particles with sharp edges and different textures were observed, although coarse mosaic and banded textures seemed to be more common, especially in the <0.045 mm fraction. In LOM studies of feed coke, cracks were observed in the coarse mosaic texture areas, which is a possible route for degradation. No signs of gasification according to the solution loss reaction were noted in coarser coke flue dust particles when studied in LOM. LOM and SEM images of flue dust texture revealed no char in the samples investigated. Wu et al.[30],[31] reported nearly zero unconsumed coal in Baosteel blast furnace off-gas
46
dust at a PCR of 170 kg/tHM. The PCR in the EBF was in the range of 133-156 kg/tHM and it was likely that most of the char produced was consumed in the blast furnace. The oxy coal lance used at the EBF contributes to good combustion conditions, which reduce char formation.
It can be concluded that solution loss in the shaft down to the lower probe position has a modest effect on coke degradation, and the coke particles which end up in the flue dust were most likely derived from coke abrasion. Further down in the EBF, in the high-temperature melting zone, solution loss, chemical attack by direct reduction and coke graphitization, together with abrasion, are sources of coke disintegration. The graphitization of coke particles in flue dust samples shown in Figure 20 indicated that finer coke particles could be transported by the gas from the shaft level below the lower zone position and over the top, while coarser particles in flue dust generally were derived from the upper shaft. The Lc value of coarse flue dust in test period 1 was elevated, which could indicate a local channel of gas with higher gas velocity which allowed coarser particles from lower part of the EBF to leave the furnace. The average gas velocity was higher in test period 1 compared to test periods 3, 5 and 7. Graphitization studies of coke in dust particles from three blast furnaces have shown that the origin of coke particles is in the upper part (lumpy and thermal reserve zone <1200°C) of one blast furnace and in the middle zone, including cohesive zone (1200-1400°C), for the other two.[16] The origin of coke in dust from the upper part was ascribed to insufficient coke strength at lower temperatures, while in the other two cases it was attributed to coke properties at higher temperature, such as coke graphitization. In the present study, coarser coke particles in flue dust were mostly derived from the upper part due to abrasion at low-temperatures. However, finer coke particles, as shown in Figure 20, may possibly be derived from abrasion by coke degradation due to solution loss and coke graphitization at a position below the lower shaft probe in the EBF.
Based on average off-gas properties, the critical diameters of particles that could leave the EBF and end up in the generated flue dust were estimated and presented in Table 11. The calculations showed that the magnitude of critical particle diameters were in the size range of the actual flue dust particles. Due to
47
differences in density, the critical diameters for unreduced iron-bearing materials were smaller compared to coke particles. In the actual furnace, variations in off-gas properties such as temperature, composition and velocity occurred, which affected the flue dust amounts.
Formation of channels in the shaft will increase the gas flow in a particular area, and an increased gas velocity would make it possible for particles of a larger size than the critical diameters to leave the furnace and end up in the flue dust. An indication of a local channel with increased gas velocity occurred during sampling in test period 1 when coke in the flue dust fraction 0.25-0.5 mm showed elevated graphitization degree, indicating an origin below the lower shaft probe in the EBF. Water was sprayed above the burden surface when the off-gas temperature exceeded 290°C. When vaporized, the added water could increase the off-gas volume as much as approximately 20%. Thus, the off-gas velocity increased and larger particles could be carried out by the off-gas. Prior to water spraying above the burden, higher off-gas temperatures were attained, which also facilitated outflow of larger particles. Fluctuations in the average over-burden temperatures during test periods 1, 2 and 4, see Figure 21, support the hypothesis that some channels could have occurred during these tests periods, but they could also be a result of the water spraying to cool down the top gas. According to the calculations of the coefficient of drag force, CD, a higher drag force is obtained at increased off-gas temperatures. A lower Rep value will increase CD and the critical particle diameters of material that can leave the EBF with the off-gas. In the present investigation, the highest amounts of flue dust were observed at the highest off-gas temperatures.
6 CONCLUSIONS
In order to investigate coke degradation by solution loss, coke of different properties in terms of reactivity, strength after reaction, chemical composition and carbon structure has been tested in laboratory and in the LKAB Experimental Blast Furnace (EBF). A characterization of off-gas dust generated in the EBF during
48
operation with different iron-bearing burden has been carried out. Off-gas dust, as flue dust and fine particles in sludge, were sampled and characterized. In addition, relations between process conditions and dust generation have been investigated based on process data and material properties. The following conclusions have been made:
No correlation was found between coke strength for coke reacted in the CSR/CRI test and in the EBF. The coke strength was considerably higher in coke from the blast furnace, regardless of the original CSR value, when compared to the CSR/CRI test. Low CSR coke types had coke strength similar to high CSR coke in the EBF.
Feed coke with high CSR had a higher SiO2 content and coke with low CSR had a higher content of Fe, CaO and MgO. The oxide content was generally higher for coke reacted in the CSR/CRI test compared to coke samples from the EBF, due to a higher degree of gasification in the CSR/CRI test atmosphere. Since the EBF atmosphere includes gaseous components such as recirculated alkali, the alkali content in blast furnace coke increased as the coke descended in the shaft.
Solution loss reaction occurred throughout the coke piece during CSR/CRI testing, while in the blast furnace the reaction tended to occur at the coke surface. Subsequently, the reaction rate in the CSR/CRI test atmosphere was limited by chemical reaction kinetics, while in the blast furnace the limiting factor was mainly diffusion.
Coke particles in flue dust originated from the shaft. Carbon-containing particles dominated in the fractions >0.075 mm. Fe-containing particles in flue dust, as Fe2O3, originated from the top of the shaft. Fe-containing particles made up the major part of the fractions <0.063 mm. The predominant amount of flue dust was observed in the <0.5 mm size fraction. Flue dust was mechanically formed and created in the same manner during all test periods with different iron-bearing material investigated in the present study. Solution loss in the shaft down to the
49
lower probe position in the EBF has a minor effect on coke degradation and the coke particles which ended up in the flue dust were mainly derived from abrasion at low temperatures. However, investigations of the coke graphitization degree in flue dust showed that coke particles <0.075 mm could be transported from the shaft level below the lower probe position, particularly if channels occurred, and exit the furnace with the off-gas.
Sludge was mainly made up of chemically formed spherical particles <1 m precipitated from the ascending gas as the temperature decreased. SiO2 and MgO were derived from the high-temperature area of the EBF, ending up as spherical particles in sludge. The amount of alkali and SiO2 in sludge increased with higher PCR and flame temperature, which confirmed that submicron spherical particles in sludge originated from the high-temperature area around raceway.
Flow conditions in the top of the shaft, as well as the properties of fine particles in terms of size and density, are important when outflow of mechanical dust, such as flue dust, is concerned. Based on off-gas properties such as temperature, composition and velocity, it is possible to estimate particle sizes of materials of different densities in flue dust. Theoretical analysis shows that off-gas velocities have the greatest impact on flue dust amount in off-gas. Low off-gas temperatures, and thus lower off-gas velocities, are favourable for low flue dust amounts expelled from the blast furnace.
The coke graphitization degree increased with higher temperatures when descending to lower parts of the blast furnace. The temperature in the position below the lower shaft probe of the EBF was higher than the CSR/CRI test temperature of 1100°C based on the thermal history of coke determined by XRD.
Isotropic areas in the coke texture participated to a higher degree in the solution loss reaction. These areas were more distinct in coke with low CSR.
50
7 FUTURE WORK
The coke in the EBF shaft was quite inert at least down to the level of the lower shaft probe. In order to study coke degradation further, and to get an understanding of coke in the high-temperature zone of the blast furnace, future work should be concentrated on studies of coke taken out of the raceway and hearth area. The EBF is ideal in such studies, since it is excavated after most campaigns.
Studies of off-gas dust taken out of a full-scale industrial blast furnace, together with actual process conditions in comparison with the results in the EBF, will increase the knowledge of off-gas dust characteristics.
Coke in flue dust was generally derived from the upper part of the shaft. Further work should include studies of coke with different Micum values and their effect on the flue dust generation. In addition, studies of the affect of different iron-bearers on coke abrasion could be done.
The gas flow in the top of the blast furnace had a strong effect on off-gas dust generation. An even gas flow without channelling is preferable in order to have low emissions of dust. Different charging patterns and/or addition of other material in the pellet burden influence the gas flow and therefore the off-gas dust. Addition of small coke into the pellet layer could be one way to study this phenomenon. Also, a high ratio of nut coke in the pellet layers may influence the burden movements.
51
8 REFERENCES [1] Gray, R.J. and Devanney, K.F., “Coke Carbon Forms: Microscopic Classification and Industrial Applications”, International Journal of Coal Geology, Vol. 6, No. 3, 1986, pages 277-297. [2] Cheng, A., “Coke Quality Requirements for Blast Furnaces, Part III”, Iron and Steelmaker, Vol. 28, No. 3, March 2001, pages 39-40. [3] Cheng, A., “Coke Quality Requirements for Blast Furnaces, Part IV”, Iron and Steelmaker, Vol. 28, No. 4, April 2001, pages 26-29. [4] Price, J., Gransden, J. and Hampel, K., “Microscopy, Chemistry and Rheology-tools to Determine Coal and Coke Characteristics”, 3rd McMaster Cokemaking Course, Volume 1, Lecture No. 3, McMaster University, Hamilton, Ontario, Canada, May 2003. [5] Cheng, A., “Coke Quality Requirements for Blast Furnaces, Part I“, Iron and Steelmaker, Vol. 28, No. 1, January 2001, pages 30-32. [6] Biswas, A. K., “Principles of Blast Furnace Ironmaking: Theory and Practice”, 1985, Cootha Publishing House, Brisbane, Australia, ISBN 0-949917-00-1, ISBN 0-949917-08-7. [7] Loison, R., Foch, P. and Boyer, A:, “Coke Quality and Production”, Second edition 1989, Butterworths Borough Green, Sevenoaks Kent TN15 8PH, England, ISBN 0-408-02870-X. [8] Cheng, A:, “Coke Quality Requirements for Blast Furnaces, Part VIII”, Iron and Steelmaker, Vol.28, No. 8, August 2001, pages 78-81. [9] Yang, J.D., McLean, A. and Sommerville, I.D., “The Correlation of Alkali Capacity With Optical Basicity of Blast Furnace Slags”, Iron and Steelmaker, Vol. 27, No. 10, October 2000, pages 103-111. [10] Abraham, K.P. and Staffansson, L.I., “The Alkali Problem in the Blast Furnace”, Scandinavian Journal of Metallurgy, Vol. 4, No. 5,1975, pages 193-204. [11] Turkdogan, E.T., Kor, G.J.W. and Fruehan, R.J., “Studies of Blast-furnace Reactions”, Ironmaking and Steelmaking, Vol. 7, No 6, 1980, pages 268-280.
52
[12] Matsui, Y., Mori, S. and Noma, F., “Kinetics of Silicon Transfer from Pulverized Coal Injected into Blast Furnace under Intensive Coal Injection”, ISIJ International, Vol. 43, No. 7, 2003, pages 997-1002. [13] Kashiwaya, Y. and Ishii, K., “Kinetic Analysis of Coke Gasification on Non-crystal/Crystal Ratio of Carbon”, ISIJ International, Vol.31, No. 5, 1991, pages 440-448. [14] Sahajwalla, V., McCarthy, F., Cham S.T., Hart, J., Sakurovs, R. and Saha-Chaudhury, N., “Influence of Carbonaceous Materials on Carburisation of Liquid Iron”, International BF Lower Zone Symposium, Wollongong 2002- Preprint, pages 12-4. [15] Hilding, T., Gupta, S., Sahajwalla, V., Björkman, B., Wikström, J-O., “Degradation Behaviour of a High CSR Coke in an Experimental Blast Furnace: Effect of Carbon Structure and Alkali Reactions”, ISIJ International, Vol.45, No. 7, 2005, pages 1041-1050. [16] Gupta, S., Sahajwalla, V., Burgo, J., Chaubal, P. and Youmans, T., “Carbon Structure of Coke at High Temperatures and its Influence on Coke Fines in Blast Furnace Dust”, Metallurgical and Materials Transactions B; Process Metallurgy and Materials Processing Science, Vol. 36, No. 3, 2005, pages 385-394. [17] Cheng, A., “Coke Quality Requirements for Blast Furnaces, Part V”, Iron and Steelmaker, Vol. 28, No. 5, May 2001, pages 59-61. [18] Van der Velden, B., Trouw, J., Chaigneau, R. and Van der Berg, J., “Coke Reactivity under Simulated Blast Furnace Conditions”, ISS 58th Ironmaking & 82nd Steelmaking Conference, Chicago, 21-24 Mars 1999, pages 275-285. [19] Forsberg, S., “Chemical and Physical Effects of Alkali on Blast Furnace Coke”, Proceedings of the 1st International Cokemaking Congress, Essen, 1987, C6.1. [20] Ishii, K., “Advanced Pulverized Coal Injection Technology of Blast Furnace Operation”, Elsevier Science Ltd, Oxford, 2000, ISBN 0-08-043651-X. [21] Pipatmanomai, S., Herod, A.A., Morgan, T.J., Paterson, N., Dugwell, D.R. and Kandiyoti, R., “The Fate of Volatiles from Injectant coals and Soot Formation in Blast Furnaces”, Energy & Fuels, Vol.18, 2004, pages 68-76.
53
[22] Ma, J., Fletcher, T.H. and Webb, B.W., “Thermophoretic Sampling of Coal-Derived Soot Particles during Devolatilization”, Energy & Fuels, Vol. 9, No.5, 1995, pages 802-808. [23] Veranth, J.M., Fletcher, T.H., Pershing, D.W. and Sarofim, A.F., “Measurements of Soot and Char in Pulverized Coal Fly Ash”, Fuel, Vol. 79, No. 9, 2000, pages 1067-1075. [24] Cheng, A. “Coke Quality Requirements for Blast Furnaces, Part X”, Iron and Steelmaker, Vol. 28, No. 10, October 2001, pages 18+20+22. [25] Das, B., Prakash, S., Reddy, P. S. R. and Misra, V. N., “An Overview of Utilization of Slag and Sludge from Steel Industries”, Resources, Conservation & Recycling, Vol. 50, No. 1, 2007, pages 40-57. [26] Robinson, R., “High Temperature Properties of By-product Cold Bonded Pellets Containing Blast Furnace Flue Dust”, Thermochimica Acta, Vol. 432, No. 1, 2005, pages 112-123. [27] Sikström, P. and. Ökvist, L. S., “Recycling of Flue dust into the Blast Furnace”, TMS Conference Proceedings, Luleå, Sweden, 2002. [28] Yehia, A. and El-Raheim, F.H., “Recovery and Utilization of Iron and Carbon Values from Blast Furnace Flue Dust”, Mineral Processing and Extractive Metallurgy, Vol. 114, No. 4, 2005, pages C207-C211. [29] Asadi Zeydabadi, B., Mowla, D., Shariat, M.H. and Fathi Kalajahi, J., “Zinc Recovery from Blast Furnace Flue Dust”, Hydrometallurgy, Vol. 47, No. 1, 1997, pages 113-125. [30] Wu, K., Chen, H., Xu, W., He, H., Zhou, X. and Fei, S., “Ratio between Unconsumed Coal and Coke Particle in BF Dust”, Steel Research International, Vol. 79, No. 12, 2008, pages 899-903. [31] Wu, K., Pan, W., Xu, W., Yin, X., Zhang, J. and Wu, W., “Research on Utilization Factor of Injected Pulverized Coal into BF at Large PCI Rate”, Steel Research International, Vol. 79, No. 12, 2008, pages 904.-907 [32] Hallin, M., “Ten Years of Experimental Blast Furnace Research”, Scanmet III 3rd International Conference on Process Development in Iron and steelmaking, Vol. 1, Luleå, 2008, pages 273-282.
54
[33] Ichida, M., Nakayama, T., Tamura, K., Shiota, H., Araki, K. and Sugisaki, Y., “Behaviour of Fines in the Blast Furnace”, ISIJ International, Vol. 32, No. 4, 1992, pages 505-513. [34] The Iron and Steel Institute of Japan: “Blast Furnace Phenomena and Modelling”, Elsevier Applied Science Publishers Ltd, Essex, 1987, ISBN 1 85166 057 7, page 556. [35] Ökvist, L. S., Jansson, B. and Hahlin, P., “Effect of Coal Properties, Injection Rate and O2 Addition on BF Conditions”, Proceedings of the 4th International Congress on the Science and Technology of Ironmaking, The Iron and Steel Institute of Japan, Osaka, 26-30 Nov. 2006, pages 327-330. [36] Nomura, S., Naito, M. and Yamaguchi, K., “The Characteristics of Catalyst-coated Highly Reactive Coke”, ISIJ International, Vol. 47. No. 6, 2007, pages 831-839. [37] Samuelsson, C. and Björkman, B., “Dust Forming Mechanisms in the Gas Cleaning System after the Copper Converting Process: (I). Sampling and Characterisation”, Scandinavian Journal of Metallurgy, Vol. 27, No. 2, 1998, pages 54-63. [38] Nedar, L., “Dust Formation in a BOF Converter”, Steel Research International, Vol. 67, No. 8, 1996, pages 320-327. [39] Ohno, T., Ono, H. and Okajima, M., “Experimental Results on Dust Formation by Small Melting Furnace (study on mechanism of dust formation in converter-1)”, Transactions of the Iron and Steel Institute of Japan, Vol. 26, No. 10, 1986, page b312.

Related Documents


![TOP GAS RECYCLE BLAST FURNACE …...1980s in 12 campaigns by RPA Toulachermet [24] in Russia at blast furnace No. 2 (Volume: 1033 m³). In this all-coke blast furnace concept, hot](https://static.cupdf.com/doc/110x72/5e6d35c47d175e6b1021e25f/top-gas-recycle-blast-furnace-1980s-in-12-campaigns-by-rpa-toulachermet-24.jpg)

![Blast Furnace Coke Properties and - LKAB · Coke, which is a high-carbon product, is usually produced in by-product coke ovens by destructive distillation of coal.[1] High-quality](https://static.cupdf.com/doc/110x72/5f2901368bd1db039b5d608d/blast-furnace-coke-properties-and-lkab-coke-which-is-a-high-carbon-product-is.jpg)


